produced by - institutional investor · ashland (ash) submitted july 2013 and ; won grand prize as...
TRANSCRIPT

Produced by
Institutional Investor and SumZero are not registered investment advisors or broker-dealers, and are not licensed nor qualified to provide investment advice. There is no requirement that any of the Information Providers presented here be registered investment advisors or broker-dealers. Nothing published or made available by or through Institutional Investor and SumZero should be considered personalized investment advice, investment services or a solicitation to BUY, SELL, or HOLD any securities or other investments mentioned by Institutional Investor, SumZero or the Information Providers. Nev-er invest based purely on our publication or information, which is provided on an “as is” basis without representations. Past performance is not indicative of future results. YOU SHOULD VERIFY ALL CLAIMS, DO YOUR OWN DUE DILIGENCE AND/OR SEEK YOUR OWN PROFESSIONAL ADVISOR AND CONSIDER THE INVESTMENT OBJECTIVES AND RISKS AND YOUR OWN NEEDS AND GOALS BEFORE INVESTING IN ANY SECURITIES MENTIONED. INVESTMENT DOES NOT GUARANTEE A POSITIVE RETURN AS STOCKS ARE SUBJECT TO MARKET RISKS, INCLUDING THE POTENTIAL LOSS OF PRINCIPAL. You further acknowledge that Institutional Investor, SumZero, the Information Providers or their respective affiliates, employers, employees, officers, members, managers and directors, may or may not hold positions in one or more of the securities in the Information and may trade at any time, without notification to you, based on the information they are providing and will not necessarily disclose this information, nor the time the positions in the securities were acquired. You confirm that you have read and understand, and agree to, this full disclaimer and terms of use and that neither Institutional Investor, SumZero nor any of the Information Providers presented here are in any way responsible for any investment losses you may incur under any circumstances.
On Tuesday, November 12, 2013, Institutional Investor and SumZero, the world’s largest online membership community of buy-side investment professionals, hosted an idea competition at Columbia University Business School’s Uris Hall Auditorium.
Nineteen emerging managers were selected from within the SumZero community on the basis of strong performance and high-quality peer reviews. Each manager gave a three minute pitch on their best idea to an audience of analysts and investors who rated their pitch for validity of the thesis, strength of the argument, feasibility of the trade and originality.
We invite you to view these ideas and register to download each presenter’s bio and full pitch paper. If you’re a professional investment officer or analyst, we invite you to register to vote for the winning idea.

Favorite Investment Book:Inside The Investor’s Brain By Richard L. Peterson
Favorite Quote/Author: “Each day you haven’t spent preparing is a day you’ve handed to the competition” —Uncited
Most Attractive Area of the Market Right Now:We are bottoms up, fundamental investors
Least Attractive Area of the Market Right Now:We are bottoms up, fundamental investors
Personal Investing Style:Long-term, highly idiosyncratic asymmetric opportunties
Areas of Personal Expertise:Equities and credit
Languages Spoken:English
Daniel W. Lawrence Elmrox Investment Group
Age: 32 Title: Managing Partner & Founder Location: New York
Education (Undergrad/Grad/Certifications): B.S. Commerce, University of Virginia
Bio: Daniel was most recently a managing director and co-founder of talara capital management, a long/short equity partnership (2009 –2013). Previously, daniel was a senior analyst at citadel investment group. His primary responsibilities were to conduct fundamental research and analyze a range of value, high yield, and distressed investments in various sectors, including consumer, materials, financials and technology. Daniel invested in both the equity and debt of publicly traded businesses (2005-2009). Prior to citadel, daniel was an investment banking analyst at merrill lynch in new york within the global multi-industry group. (2002-2005). Daniel earned a b.S. In commerce from the mcintire school of com-merce at the university of virginia (2002). He has since been a guest finance lecturer at the university and participates in the galant center for entrepreneurship. Daniel has served on the board of directors of sus since 2009. He is also a former coach for the iona preparatory school speech & debate team, where he coached several national champions. His per-sonal interests include crossfit, american history and u.S. Foreign policy, cinema and great oratory.
Firm Strategy: eig seeks to generate “alpha” focusing on fundamental characteristics of companies through a combina-tion of intensive research, deep diligence and strategic thinking designed to identify financial instruments with asymmet-ric risk/reward profiles over varying investment horizons. Elmrox pursues an intensive “private equity-like” research pro-cess that involves in-depth primary research through extensive diligence. This process emphasizes long-term structural business characteristics of companies rather than short-term data points and market “noise.” The typical characteristics of companies that are expected to comprise the fund’s “long” portfolio include, but are not limited to, some or all of the following: sustainable business models with competitive barriers; predictable and repeatable revenue streams with high returns on invested capital; management teams and culture focused on innovation and on having the best people; high quality boards with significant equity ownership stakes; asset and operational transformations not fully perceived; mis-understood balance sheets; growth companies with long-term earnings prospects and attractive reinvestment econom-ics; significant change in capital allocation policies that are shareholder friendly; downside protection from asset value, private market value and/or sustainable cash flow; and significant variant views between market estimates and eig’s own estimates.
Past Ideas Submitted on SumZero:Ashland (ash) submitted july 2013 and ; won grand prize as best stock idea for 2013 value investing challenge at value investing congress in september 2013
AUM: N/A Firm Focus: Global Fund Disclaimer: Please see section 6 of appendix.
Fund Description:Eig seeks to generate “alpha” focusing on fundamental characteristics of companies through a combination of inten-sive research, deep diligence and strategic thinking designed to identify financial instruments with asymmetric risk/reward profiles over varying investment horizons. Elmrox pursues an intensive “private equity-like” research process that involves in-depth primary research through extensive diligence. This process emphasizes long-term structural business characteristics of companies rather than short-term data points and market “noise.” The typical characteristics of companies that are expected to comprise the fund’s “long” portfolio include, but are not limited to, some or all of the following: sustainable business models with competitive barriers; predictable and repeatable revenue streams with high returns on invested capital; management teams and culture focused on innovation and on having the best people; high quality boards with significant equity ownership stakes; asset and operational transformations not fully perceived; mis-understood balance sheets; growth companies with long-term earnings prospects and attractive reinvestment econom-ics; significant change in capital allocation policies that are shareholder friendly; downside protection from asset value, private market value and/or sustainable cash flow; and significant variant views between market estimates and eig’s own estimates.

Interxion Holding NV
Elmrox Investment Group
”Secular Growth on Sale”
November 2013
Daniel W. Lawrence
© 2013 Elmrox Investment Group LLC. All rights reserved
Jim Huseby 813-‐644-‐9399
Disclaimer The analyses and conclusions of Elmrox Investment Group LLC (”Elmrox”) contained in this presentation are based on publicly available information. Elmrox recognizes that there may be conOidential information in the possession of the companies discussed in the presentation that could lead these companies to disagree with Elmrox’s conclusions. This presentation is for general informational purposes only, is not complete and does not constitute an agreement, offer, a solicitation of an offer, or any advice or recommendation to enter into or conclude any transaction or conOirmation thereof (whether on the terms shown herein or otherwise). This presentation should not be construed as legal, tax, investment, Oinancial or other advice. It does not have regard to the speciOic investment objective, Oinancial situation, suitability, or the particular need of any speciOic person who may receive this presentation, and should not be taken as advice on the merits of any investment decision. The views expressed in this presentation represent the opinions of Elmrox, and are based on publicly available information with respect to Interxion Holding NV (the "Issuer") and the other companies referred to herein. Certain Oinancial information and data used herein have been derived or obtained from Oilings made with the Securities and Exchange Commission ("SEC") or other regulatory authorities and from other third party reports. The analyses provided may include certain statements, estimates and projections prepared with respect to, among other things, the historical and anticipated operating performance of the companies, access to capital markets and the values of assets and liabilities. Such statements, estimates, and projections reOlect various assumptions by Elmrox concerning anticipated results that are inherently subject to signiOicant economic, competitive, and other uncertainties and contingencies and have been included solely for illustrative purposes. No representations, express or implied, are made as to the accuracy or completeness of such statements, estimates or projections or with respect to any other materials herein. Actual results may vary materially from the estimates and projected results contained herein. Accordingly, no party should purchase or sell securities on the basis of the information contained in this presentation. Elmrox expressly disclaims liability on account of any party’s reliance on the information contained herein with respect to any such purchases or sales. Elmrox has not sought or obtained consent from any third party to use any statements or information indicated herein as having been obtained or derived from statements made or published by third parties. Any such statements or information should not be viewed as indicating the support of such third party for the views expressed herein. Elmrox does not endorse third-‐party estimates or research which are used in this presentation solely for illustrative purposes. No warranty is made that data or information, whether derived or obtained from Oilings made with the SEC or any other regulatory agency or from any third party, are accurate. Elmrox hereby disclaims any duty to provide any updates or changes to the analyses contained here. Neither Elmrox nor any of its afOiliates shall be responsible or have any liability for any misinformation contained in any third party, SEC or other regulatory Oiling or third party report. There is no assurance or guarantee with respect to the prices at which any securities of the Issuer will trade, and such securities may not trade at prices that may be implied herein. The estimates, projections, pro forma information and potential impact of the opportunities identiOied by Elmrox herein are based on assumptions that Elmrox believes to be reasonable as of the date of this presentation, but there can be no assurance or guarantee that actual results or performance of the Issuer will not differ, and such differences may be material. This presentation does not recommend the purchase or sale of any security. Elmrox reserves the right to change any of its opinions expressed herein at any time as it deems appropriate. Elmrox disclaims any obligation to update the data, information or opinions contained in this presentation.
1

Underappreciated Secular Grower in Europe with Wide Moats; Leading Market Position in Industry with Strong Fundamentals -‐ BeneOiciary of powerful mega-‐trends: accelerating demand of cloud computing, increased content consumption via mobility, ongoing shift to online video and and other drivers of network trafOic
-‐ Scale: Largest Pan-‐European footprint in industry with 34 data centers in 13 cities across 11 European countries
-‐ Predictable model with > 90% recurring revenues; low churn (<1%) -‐ Focused on high growth customer segments (e.g., media, enterprises)
Competitive Advantages & Value Proposition Are Not Appreciated -‐ Entry barriers misunderstood: wide moats in Europe vs N. America -‐ Pan-‐European scale would take 10-‐15 years for new entrant to build -‐ Highly valuable customer “communities of interest” very difOicult to replicate creating signiOicant network effect and high switching costs
Valuation Does Not ReVlect Predictable Steady State Free Cash Flow (“SSFCF)” and Long-‐Term Secular Growth Opportunities -‐ US listing for European Oirm causes investors to overlook story -‐ Concerns related to Baker Capital’s 30% ownership are priced in
Disciplined & Proven Management Team -‐ Strong and consistent track record of thoughtful and patient capital allocation; target 30% to 40% IRR on each new data center
Strong Balance Sheet & Cash Flow = Value Creation Optionality -‐ Organic + inorganic opportunities; potential share repurchases -‐ Cash Olow could support considerably higher leverage
Unique and Highly Valuable Asset Base Creates Margin of Safety -‐ INXN footprint nearly impossible to replicate = high strategic value -‐ Global and European data center industry is ripe for consolidation
Big 4 vs. ROE
Situation Overview Current Price: $22.46 (10/31/13) Market Cap: $1.5bn Enterprise Value:$1.9bn
Thesis
Business Overview
N.B.: Financials LTM as of June 30, 2013. Enterprise value calculated using stock price as of October 31, 2013. Valuation multiples calculated using consensus sell side estimates as of October 31, 2013. Steady state free cash Olow (SSFCF) deOined as : (EBITDA – maintenance capex – cash interest – cash taxes) / (equity market capitalization).
Interxion (the “Company”) is a Leader in Data Centers in Europe -‐ Provides cloud-‐ and carrier-‐neutral colocation data center services -‐ Serves range of customers through unique “communities of interest” -‐ LTM Revenues 6/30/2013: €294mm -‐ LTM EBITDA 6/30/2013: €124mm (42% LTM EBITDA Margin)
Attractive Valuation Multiples Given Growth Rate (FYE 12/31/14E) -‐ 13x steady state free cash Olow (SSFCF) -‐ 9x EV / EBITDA -‐ Trades at discount to similar SSFCF businesses and below competitively disadvantaged North American data centers Oirms
42% 42% 42% 41% 41% 41% 40% 39% 40% 42% 40%
(Contribution %) Big 4 vs. ROE Revenue Contribution(1)
Big 4 ROE
58% 56% 55% 59% 59% 58% 57% 61% 56% 57% 58%
42% 44% 45% 41% 41% 42% 43% 39% 44% 43% 42%
(Contribution %) Big 4 vs. ROE Adj. EBITDA Contribution(1)
(1) Big 4 represents the Netherlands, UK, France and Germany. ROE represents Rest of Europe (Austria, Belgium, Denmark, Ireland, Spain, Sweden, Switzerland). Adj. EBITDA contribution based on costs allocated to the segments and excludes costs associated to corporate and other.
Business Overview
2

Variant Perception
• Consensus does not appreciate the structural barriers colocation providers in Europe beneOit from • Market concerns comparing worsening competitive environment in North America to Europe are misplaced • DeOlationary price competition concerns in Europe are exaggerated (this is an issue speciOic to North America) • Deceleration of global data center growth rates are short-‐term in nature relative to long-‐term secular trends • Market especially underappreciates INXN’s unique access to scarce physical Oiber placements • Investors often confuse data centers like INXN with managed service providers (managed services are INXN customers; colocation companies like INXN are beneOiciaries of heightened competition in managed services)
• Recurring revenue should re-‐accelerate in 2014 as utilization rate from recent expansion ramps • Consensus does not assume likely expansion into high growth and under-‐supplied markets (LatAm / Eastern Europe) • Long-‐term operating leverage in business model underestimated by market • Cash Olow generation improvement potential misunderstood • Valuation does not reOlect strong and recurring steady state cash Olow • Low leverage on balance sheet = potential for additional shareholder value creation • Shareholder concerns related to Baker Capital’s ownership stake and Board seats already priced in • High strategic value / replacement value create margin of safety
Underappreciated Secular Grower With Strategic Asset Value
Moats + Recurring Cash Flow Model + Disciplined Management = Good Business
3

Illustrative Potential Returns
Strategic Asset Value + Variant Perception = Asymmetric Return ProVile
15
25
35
45
55
65
INXN Current Price
Conservative Replacement Value (Facilities Only)
LBO / Private Market Value
Standalone INXN Sold to Strategic
Recurring Monthly Revenue (RMR)
Steady State Free Cash Flow (SSFCF)
REIT Conversion
$25-‐$32
$31 -‐$47
$34-‐$60
$34-‐$52
$12 -‐ $23
$28-‐$52
$26 -‐$54
$22.46
% Upside: 11% to 42% 24% to 131% 51% to 131% 38% to 109% 15% to 140% 51% to 167%
Attractive Multiple of Steady State Free Cash Flow (SSFCF) + Long Term Secular Growth Opportunities = Attractive Entry Point
4

Company Overview
Investment Merits
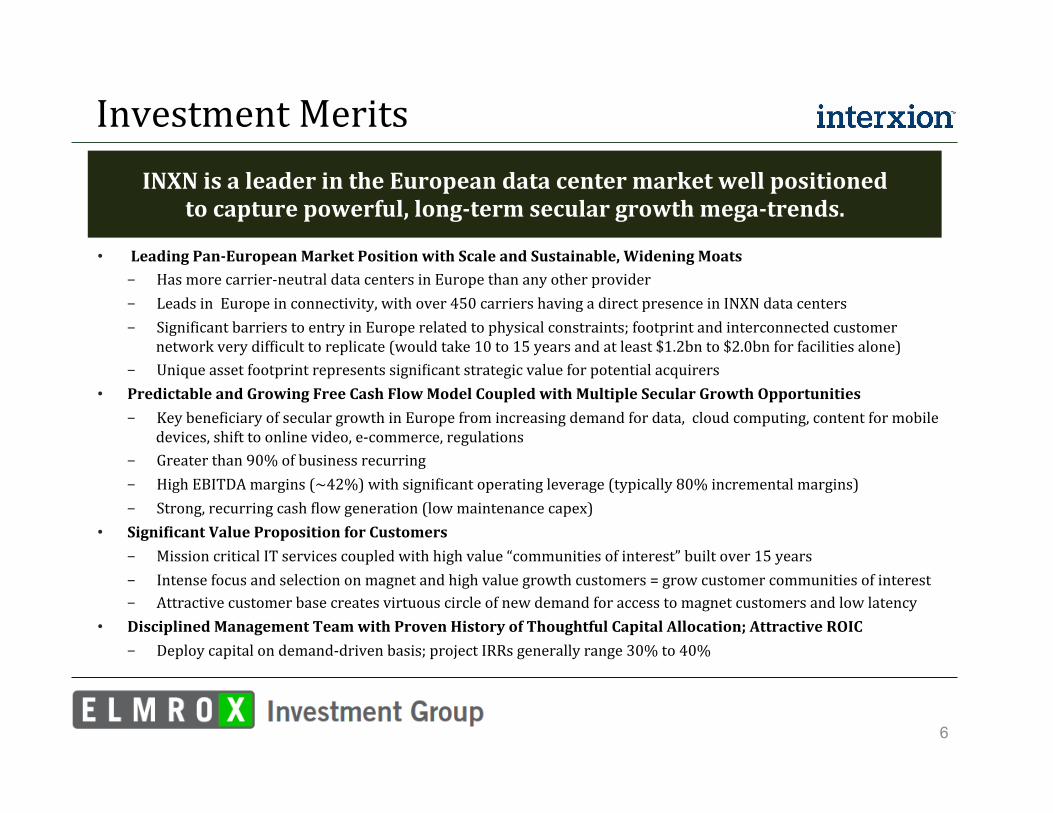
• Leading Pan-‐European Market Position with Scale and Sustainable, Widening Moats - Has more carrier-‐neutral data centers in Europe than any other provider - Leads in Europe in connectivity, with over 450 carriers having a direct presence in INXN data centers - SigniOicant barriers to entry in Europe related to physical constraints; footprint and interconnected customer
network very difOicult to replicate (would take 10 to 15 years and at least $1.2bn to $2.0bn for facilities alone) - Unique asset footprint represents signiOicant strategic value for potential acquirers
• Predictable and Growing Free Cash Flow Model Coupled with Multiple Secular Growth Opportunities - Key beneOiciary of secular growth in Europe from increasing demand for data, cloud computing, content for mobile
devices, shift to online video, e-‐commerce, regulations - Greater than 90% of business recurring - High EBITDA margins (~42%) with signiOicant operating leverage (typically 80% incremental margins) - Strong, recurring cash Olow generation (low maintenance capex)
• SigniVicant Value Proposition for Customers - Mission critical IT services coupled with high value “communities of interest” built over 15 years - Intense focus and selection on magnet and high value growth customers = grow customer communities of interest - Attractive customer base creates virtuous circle of new demand for access to magnet customers and low latency
• Disciplined Management Team with Proven History of Thoughtful Capital Allocation; Attractive ROIC - Deploy capital on demand-‐driven basis; project IRRs generally range 30% to 40%
INXN is a leader in the European data center market well positioned to capture powerful, long-‐term secular growth mega-‐trends.
6

Overview of Interxion
Leading Pan-‐European Data Center Provider with Wide Moats
Sales by Geography
Customer Concentration
Adj. EBITDA by Geography
Other 67%
Top 2-‐10 Customers 19%
Top 11-‐20 Customers 10%
Top Customer 4%
Source: Company data. (1) Big 4 represents the Netherlands, UK, France and Germany. ROE represents Rest of Europe (Austria, Belgium, Denmark, Ireland, Spain, Sweden, Switzerland). Adj. EBITDA contribution based on costs allocated to the segments and excludes costs associated to corporate and other.
NYSE Ticker Symbol Total Employees Total Data Centers # of Customers INXN ~400 34 > 1,300
Largest Footprint of any European Player Covering ~75% of GDP
LTM 6/30/13 Sales: €294mm
LTM 6/30/13 Adj. EBITDA: €124mm
58% 58% 58% 59% 59% 59% 60% 61% 60% 58% 60%
42% 42% 42% 41% 41% 41% 40% 39% 40% 42% 40%
(Contribution %) Big 4 vs. ROE Revenue Contribution(1)
58% 56% 55% 59% 59% 58% 57% 61% 56% 57% 58%
42% 44% 45% 41% 41% 42% 43% 39% 44% 43% 42%
(Contribution %) Big 4 vs. ROE Adj. EBITDA Contribution(1)
7

• Typical Customer Functions:
- Servers and storage equipment that run application software and process and store data and content
- A simple cage or rack of equipment - A room housing a few or many cabinets, depending on the scale of the customer’s operation
• A data center space will typically have a raised Oloor with cabling ducts running underneath to feed power to the cabinets and carry the cables that connect the cabinets together
• The environment is generally controlled in terms of temperature & humidity both to ensure the performance and the operational integrity of the systems within
• Facilities usually include power supplies and access to signiOicant external sources of power, backup power, chillers, Oire and water detection systems, cabling, and security controls
What is a Data Center?
A data center is a dedicated space that houses technology infrastructure.
Sources: Company data and company website.
8

Types of Data Centers
Data centers can be in-‐house, located in a company’s own facility, or outsourced with equipment being colocated at a third-‐party site.
A colocation provider (like INXN) versus wholesaler is a critical distinction.
Sources: Company website and Focus Telecom’s “Colocation and Managed Hosting Report”. (1) 451 Research’s North American Multi-‐Tenant data center Supply Emerging Major Markets 2012” report.
Colocation / Retail Colocation
• Provides customers physical space for a customer’s internet-‐ focused technology infrastructure
• Provides power and cooling necessary to maintain infrastructure at high levels of performance and without interruption
• Given the proprietary nature of colocation activities, provides security, both at the facility level and within the facility at the suite, cage, or cabinet level.
• Sold on the basis of individual racks, cabinets, or cages; usually range 500 to 5,000 square feet
Wholesale Providers
• Provides leasable large space to large enterprises and commercial colocation providers
• Customers engineer their own data centers within facilities
• Large enterprises share cost of the land and the facility shell, power, and external security
• Facilities typically are large buildings (at 100,000 square feet plus) that are divided into private pods or cells; frequently are located near large cities
• Usually sold in pods or cells (empty rooms); typically range from 10,000 to 50,000 square feet
• Colocation data center is different from wholesale in that colocation customers do not provide their own infrastructure beyond servers, storage, and switch gear
• “best way to think of wholesale data centers is ‘data center space for rent.’… similar to leasing an ofOice or warehouse where the landlord provides facility maintenance”(1)
• Colocations have high value customer communities/ecosystems
• Given the large space requirements geography is often a barrier/hindrance for wholesalers to enter certain markets especially Europe
Differences
9

Carrier-‐neutral data center: • Is independent of the companies colocating in the data center (does not compete with them in any way) • Offers no packaged services and customers are free to contract directly with the internet providers of their choice • Result: wide range of connectivity and communication providers are attracted into INXN facilities; creates widest
choice of Oixed and mobile carriers, ISPs, Internet exchanges, content distribution networks (CDNs) and others, all competing to deliver the best connectivity performance, service and price for their applications and content
Cloud-‐neutral data center: • Is independent of any hardware or software vendors and IT service providers, traditional or cloud-‐based • As a result of not competing with cloud service providers, these Oirms are attracted to INXN’s wide range of
connectivity providers that its hosts • Result: INXN data centers are home to a wide range of IT service providers, including: public and private cloud
platform providers, system integrators, managed hosting providers, software-‐as-‐a-‐service providers, providers of data and information services to speciOic industries, and providers of IT security, business continuity and consultancy services
Combined result: INXN’s data centers effectively constitute a marketplace within a highly connected environment. Providers within INXN data centers competing for customer business and give customers the choice and Olexibility to choose the right service providers at the right price. Since customers are all in the same place, each one can interconnect quickly and easily with low-‐latency Cross Connects that improve the speed, Olexibility, cost reduction
Types of Data Centers (cont’d)
What is a carrier-‐neutral data center and a cloud-‐neutral data center?
Sources: Company data and company website.
Interxion is carrier-‐neutral and cloud-‐neutral.
10

• Connectivity and communities of interest
• Cost efOiciencies, lowers latency and augments performance
- Third party data centers allow a Oirm to pay for the space it needs and scale only as required. The costs of security and data center technology are shared with other colocation partners, while costs are further reduced by innovations in efOiciency, such as advanced power management.
• 24 hour monitoring and maintenance by highly trained technicians
• Wide range of power management
• Cost effective cooling; Oire detection & suppression
• Multiple layers of security to protect customer data
• Additional services including systems monitoring, systems management, engineering support services, data back-‐up and storage
Why Outsource to a Data Center?
Carrier-‐neutral data centers give customers access to wide range of connectivity providers; the customer selects the right connectivity for
multiple carriers to build in redundancy, ensure resilience, reduce costs.
Source: Company data.
A neutral data center is independent of any network, hardware or software vendor and attracts customers wanting access to this ecosystem.
11

Why Invest in Data Centers?
• Demand driven by long-‐term, secular mega-‐trends in early innings
• Consistent, predictable revenues and cash Olow
• Strong, sustainable margins with high incremental margins ~80% (depending on facility)
• SigniOicant hurdles for new entrants
• High value proposition with Olywheel of network effects that is difOicult to displace
Secular Growth
Barrier to Entry
Network Effects
Switching Costs
• Demand for data • Cloud computing • Mobile content • Shift to online video • E-‐Commerce • Social • Regulatory Driven • Software as Service (SaaS) • Hosting
• Highly specialized expertise required
• Specialized sites required (prime locations, power, Oiber connectivity)
• SigniOicant costs for development (land, base building, infrastructure)
• Communities of interest attract and retain customers
• Customer ecosystems attracts other customers wanting access to this cultivated community of media and content providers, enterprises, carriers, et all in one place
• Communities of interest take many years to build
• Magnetic customers cannot be re-‐created
• Proximity to business partners difOicult to replicate
Powerful Secular Growth Drivers
12

Why Invest in European Data Centers?
The European data center market has sustainable moats that insulate existing players like INXN from the increasing competitive forces that threaten the North American market.
Sources: BroadGroup “Western European data centre research” 2012, Tier 1 Research, Multi-‐Tenant data center Global Providers 2012. Cisco VNI Report, 2013, Cisco GCI Report, 2012.
European data center market has unique and signiVicant barriers to entry = no new Pan-‐European entry in the last 10 years.
Key Differentiators Europe North America Total Fixed Internet Users in 2016 319 million 269 million Mobile Connected Devices vs. Total Network Devices in 2016 39% 28% Mobile Data TrafOic in 2016 2.4EB 2.0EB Growth in Internet TrafOic (‘11-‐’16 CAGR) 27% 22% Cloud TrafOic Growth (‘11-‐’16 CAGR) 44% 34%
• Limited availability of prime space, limited access to signiOicant power sources, and limited access to critical underground telco Oiber connections have and continue to protect European market
• North American dynamics have led to intensifying competition: availability of space and power, new entrants, extra capacity, pricing pressure and augmented competition from wholesalers
13

Europe’s Moats Much Stronger Than U.S.
(1) Kelly Morgan, Research Manager, Multi-‐Tenant Datacenters on February 20, 2013. (2) 451 Research’s “Multi-‐Tenant data center Supply Europe and Asia-‐PaciOic Top Markets 2012” Report.
84% 72%
16% 28%
0% 10% 20% 30% 40% 50% 60% 70% 80% 90% 100%
2011 2015E
3,459 4,068
4,808
5,690
6,717
-‐
1,000
2,000
3,000
4,000
5,000
6,000
7,000
8,000
2010 2011 2012 2013 2014
CAGR 29%
European Outsourcing Opportunity
EMEA Multi-‐Tenant Data Center Revenue
User Owned Third Party
($ in M)
In Europe “Vinding a suitable site is hard, then convincing the local power company to provide enough power for a small town is a challenge. Getting all the requisite permits can take years. This is before taking into account the
difViculty convincing carriers to connect to the facility.” (1)
“It is unlikely that larger American-‐style data centers will become the norm [in Europe] due to localized space and power constraints.” (2)
14

Barriers to Entry are Highest in Europe
• Cloud computing market is highly fragmented and localized creating signiOicantly higher barriers to entry than U.S. - The absence of a single European hosting market contributes to this situation: each European country has its
own – often highly fragmented – market. Despite similar customer requirements, there are signiOicant local differences, including market size, cultural background and IT buying behavior
- The fragmented European market is characterized by a large number of players relative to market size, mostly with a relatively low number of customers
- Addressing the cloud opportunity requires hosters to make a signiOicant investment in technology and service innovation, but not many companies have been able to do so over the past few years
“Barriers to entry…as high in our business as it's always been. I don't see any new entrants. We're not seeing the wholesale guys nipping at our
heels on the retail side like they are in the United states.”(1)
Source: Netcraft Active Domains, August 2012. Netcraft IP Addresses, August 2012. (1) Vice Chairman, Chief Executive OfOicer and President, David C. Ruberg, on September 12, 2013 earnings call.
246 215
102 138
253
145
83 110
63 74 84 45 56 62 75
49 40 64
-‐
50
100
150
200
250
300
Germany UK Poland France Netherlands Russia Italy Spain Turkey Sweden Switzerland Romania Czech Republic
Denmark Belgium Ukraine Ireland Austria
European Hosting Market: Market Share and Size by Country
# of Hosting Provisions
Market Share 28% 13% 9% 5% 3% 2% 2% 1% 1% 10% 8% 3% 2% 2% 2% 1% 1% 1%
15

Europe Should Remain Tight Given Moats
The carrier-‐neutral colocation market in Europe remains constrained.
(1) Based on company Oilings and websites of Interxion, Tel;ecity and Equinix. Equinix EMEA cabinet equivalents assumed to be equal to 2.5 net square meters per cabinet. (2) European weighted average utilization rate is calculated as year-‐end revenue generating space as a percentage of total year-‐end equipped space for the aggregate Oigure of Interxion, Telecity and Equinix EMEA. (3) The Jones Long LaSalle Data Centre Barometer, Spring 2013, Issue 10.
• Major players remain disciplined
- Introductions of new supply largely demand driven (including INXN)
• Utilization remains tight in high 70s / low 80s
“The prevailing view amongst our IT service providers, hosting and colocation operators [in Europe] is one of rising demand against a diminishing supply.”(3)
75% 79%
75%
50%
60%
70%
80%
90%
2010 2011 2012
European Avg. Carrier and Cloud Neutral Colocation % Utilization(1)(2)
25 18
37 13%
8%
15%
-‐2%
3%
8%
13%
18%
1
11
21
31
41
2010 2011 2012
(‘000 m2)
European Carrier and Cloud Neutral Colocation Additional Supply(1)
New Supply % of Equipped Space As of 2Q 2013
Supply 667,818 sq. m.
Availability 102,232 sq. m.
Vacancy Rate 15.31%
Colocation Take-‐up: Quarterly 6,300 sq. m.
Colocation Take-‐up: Annual YTD 15,095 sq. m
16

Bolstered by Continued Strong Demand
European carrier neutral colocation market opportunity is signiVicant.
Sources: BroadGroup “Western European data centre research” 2012, Tier1 Research, Multi-‐Tenant data center Global Providers 2012, Cisco VNI Report, 2013, Cisco GCI Report, 2012.
Key Differentiators Provide Long-‐Term Upside Relative to North America
Europe North America
Broadband Subscribers 130 million 93 million
Smart Phones 201 million 109 million
Growth in Internet TrafVic 2009-‐20014E CAGR 35% 30%
€ 922
€ 2,245
€ -‐
€ 500
€ 1,000
€ 1,500
€ 2,000
€ 2,500
2009 2014E
(€ in millions)
European Demand for Carrier-‐Neutral Colocation
CAGR +19%
European Outsourcing Opportunity
European Demand for Carrier-‐Neutral Colocation
In-‐House 88%
Top 2-‐10 Customers 19%
Carrier Neutral Colocation
3%
Breakdown of Average Data Center Capacity by Type
17

Long Term Demand in Europe
Western Europe data center market has strong long-‐term demand trends.
Source: BroadGroup.
-‐
200
400
600
800
1,000
1,200
2011 2012 2013 2014 2015 2016
M2 (thousands)
Carrier Neutral Colocation
Carrier Owned Wholesale Managed Services
18

• INXN’s data centers have become critical exchange points for Internet and data trafOic in across Europe as well as a gateway into and out of Europe
• INXN’s exchange points attract enterprises, media and content providers, IT services providers and other groups wanting to access these diverse networks and other enterprises in a single location versus connecting these parties in multiple locations
• This high level of connectivity fosters the development of value-‐added communities of interest within each customer segments
• These communities of interest create virtuous circle by then attracting additional carriers and customers which makes them increasingly more valuable
Location & Scale in Europe Matters
Data centers located near key business hubs, interconnection points of telecom Viber routes, and power sources provide customers with
high levels of connectivity and the requisite power to meet their needs.
“Barrier to entry… if you want to build a carrier-‐rich data center environment, it's almost impossible to replicate. If you've got a 10-‐year roadmap, then maybe. And the reason for that is because between '97 and 2002, the carriers in Europe built their network and their network backbones into data centers, like Interxion, and they're not going to be doing it again in a hurry. That's the fundamental basis of the moat that is around our business.”(1)
``
(1) Vice Chairman, Chief Executive OfOicer and President, David C. Ruberg, on May 8, 2013 earnings call.
19

Interxion History
“Our aspirations are to be a global company, not just European-‐based… when we realize that goal, our choice
to list in the United States would prove to be a wise one.”(1)
1998: Company founded
2001: Fully operational footprint of 20 facilities
2006: 1,000 customers 2009: 5 new builds
2011: IPO on NYSE under symbol “INXN”
EBITDA Margins:
2006 17.8%
2008 34.9%
2011 40.0%
2007 28.8%
2009 36.5%
2010 38.0%
LTM(2)
42.2% Recurring Sales %: 87% 93%
(1) Vice Chairman, Chief Executive OfOicer and President, David C. Ruberg, on September 12, 2013. (2) Last twelve months (LTM) as of June 30, 2013.
90% 92% 94% 93%
2008: €90mm expansion
2007: €50mm expansion
2013: Largest footprint in Europe: 34 data centers in 11 countries
2012: Baker Capital distributes 10mm shares
2012 41.5% 94% 94%
20

Drivers
Levered to some of the world’s most powerful secular growth trends.
Cloud Computing
Mobility
Content Demand
Regulatory
• Enterprise Private Clouds
• Public Cloud Infrastructures
• Private Clouds • Hybrid Clouds • Personal Cloud adoption in infancy - 12x increase by
2017 (Dropbox, Google Drive, Amazon Cloud)
General Demand
• Smartphones - SigniOicant
ongoing growth in mobile data
• Mobile Business - Connect workers
to corporate assets
- Software as Services (Saas)
• Social
• Digital Video - Shift to online
video consumption ramping fast
• E-‐Commerce • Social Networking • Photos - Accelerating
growth and in early innings
• Digital Sound - Emerging demand
• Basel III - Pressure on banks
to increase amount of stored data and the duration they store it for
• Disaster Recovery - Movement
towards speciOied distances for DR sites
• Big Data: - Emerging
• US Expansion to EUR - US businesses
pushing for European colocation
• Shift Towards Outsourcing - Intermediaries
• World Becoming More IT Dependent - Government
“Our ability to consistently drive the top line, even in an uncertain macroeconomic and broader business environment, demonstrates the strong secular trends underpinning the carrier-‐neutral colocation business in Europe, the demand for high-‐quality services like
Interxion's and most importantly, our ability to execute on our strategies.”(1)
(1) Vice Chairman, Chief Executive OfOicer and President, David C. Ruberg, on February 29, 2013 earnings call.
21

Competitive Advantages & Moats
SigniVicant barriers to entry exist in the European data center market.
ü Largest pan-‐European footprint
ü Hosts 19 of Europe’s internet exchanges
ü Premium location spaces
ü Unique access to mission critical power sources
Leading Economies of Scale
High Switching Costs
High Barriers to Entry
ü Communities of interest cannot be replicated
ü Carrier-‐ and cloud-‐ neutrality
ü Magnetic customers cannot be re-‐created
ü Proximity to business partners difOicult to replicate
ü Scarcity of adequate locations
ü Long lead time to build carrier critical mass (10 to 15 years)
ü Design and permitting expertise
ü No new Pan-‐European entry in the last 10 years in data centers
In Europe “Vinding a suitable site is hard, then convincing the local power company to provide enough power for a small town is a challenge.
Getting all the requisite permits can take years. This is before taking into account the difViculty convincing carriers to connect to the facility.” (1)
(1) Kelly Morgan,451 Research Manager, Multi-‐Tenant Data Centers on February 20, 2013.
22

Leading Pan-‐European Scale
INXN is in the most countries with the most carriers.
11
7
5 2
-‐ 2 4 6 8 10 12
(# of Countries)
% European GDP Coverage(
75% 69% 56% 28%
450
234 200 175
-‐ 100 200 300 400 500 (# of Carriers)
# of Internet Exchanges
19 13 7 11
85.0
64.2 52.2
64.0
-‐ 20.0 40.0 60.0 80.0 100.0 (‘000 Sqm)
28 26 24
7 -‐ 5 10 15 20 25 30
European Country Presence and GDP Coverage Access to Carriers & Internet Exchanges
Equipped Space Number of European Data Centers
Sources: Company Oilings, company website and Wall Street research, Eurostat.
23

Unique Footprint Creates Scarcity Value
INXN has unique access to expensive underground Viber networks that took many years and hundreds of millions of euros to build.
Largest Pan-‐European footprint of any data center Virm.
Amsterdam & Hilversum
London
Dublin
Brussels
Paris
Madrid
Stockholm
Copenhagen
Dusseldorf
Frankfurt
Vienna
Zurich
24

Highly Predictable Business
Greater Than 90% of Revenues Are Recurring with Churn < 1%.
€ 31.10 € 33.30 € 35.70 € 38.10
€ 40.40 € 42.50 € 43.70 € 45.10 € 47.80
€ 50.40 € 54.60 € 55.60 € 57.90
€ 60.00 € 62.00 € 64.40 € 65.80 € 68.00
€ 70.40 € 72.90 € 74.40 € 76.50
€ -‐
€ 20.00
€ 40.00
€ 60.00
€ 80.00
1Q'08 2Q'08 3Q'08 4Q'08 1Q'09 2Q'09 3Q'09 4Q'09 1Q'10 2Q'10 3Q'10 4Q'10 1Q'11 2Q'11 3Q'11 4Q'11 1Q'12 2Q'12 3Q'12 4Q'12 1Q'13 2Q'13
(€ in M)
CAGR(1) 19% Revenue by Quarter
New Supply % of Equipped Space
€ 10.30 € 11.90 € 12.90 € 13.10 € 14.10
€ 15.70 € 16.00 € 16.90 € 17.40 € 19.60 € 20.80 € 21.40
€ 22.20 € 23.30 € 25.00
€ 27.10 € 27.30 € 27.80 € 28.70 € 31.20 € 31.70 € 32.70
€ -‐
€ 10.00
€ 20.00
€ 30.00
€ 40.00
1Q'08 2Q'08 3Q'08 4Q'08 1Q'09 2Q'09 3Q'09 4Q'09 1Q'10 2Q'10 3Q'10 4Q'10 1Q'11 2Q'11 3Q'11 4Q'11 1Q'12 2Q'12 3Q'12 4Q'12 1Q'13 2Q'13
(€ in M)
CAGR(1) 25%
Adjusted EBITDA by Quarter
39% 13% 40% 32% 28% 18% 19% 23% 19% 16% 14% 14% 13% 13% 13% 39% 30% 22% 18% 25% 21% 13% 60% 62% 59% 58% 59% 59% 60% 58% 60% 62% 61% 62% 62% 63% 63% 58% 58% 59% 60% 60% 60% 59%
33% 41% 36% 34% 37% 37% 39% 38% 39% 42% 42% 41% 43% 43% 43% 36% 35% 37% 36% 38% 38% 40% Adjusted EBITDA
Margin(3)
Y/Y Growth
Big 4 %(2)
(1) CAGR calculated as of 2Q’13 vs. 1Q’08. (2) Big 4 % deOined as percentage of total revenue from France, Germany, Netherlands, and U.K. reporting segment. (3) Adjusted EBITDA margin calculated as Adjusted EBITDA divided by Revenue.
25

Value Proposition
INXN is able to charge premium rates by focusing on:
Connectivity
Community
Coverage
• Hosts 19 Internet exchanges (points of connection to exchange network trafOic)
• 450+ carrier-‐customers provide choice of connectivity partners
• Footprint across 13 cities and 11 countries
• Access to 90 million broadband subscribers and 75%+ EU GDP
• 1,300+ customers across a range of key sectors
• Manages physical connections between customers
• Magnet customers draw business partners to INXN data centers
26

Value Proposition (cont’d)
INXN’s carrier neutral colocation services creates signiVicant value.
• Customers save on the cost of: - Constructing a data center - 24/7 maintenance - Telecommunication required to access multiple
networks - Connections to other participants in the communities of
interest • Engenders Vlexible and scalable offering tailored to
each customer’s unique needs - Delivers better performance from lower network
latency - Improves customer service
Value Creation
Communities of Interest + Largest Pan-‐European Footprint + Carrier Neutrality + Cloud Neutrality = Strong Value Proposition for Customers
27

Value Proposition (cont’d)
Since INXN has spent over 10 years building a high quality and diverse customer base, it can introduce new customers
to a large, varied and highly interactive community.
INXN is focused on delivering value to its customers by building communities of interest to enable revenue growth and by being responsive to the needs of its customers.
• Develops Communities of Interest (or “hubs”) - All INXN data centers are located in near-‐city center locations giving customers direct and low-‐latency access to Europe’s leading business and residential centers
- Locations in Frankfurt, Vienna and Stockholm provide access to carriers serving Central & Eastern Europe as well as the Far East, and act as perfect gateways to these regions
• Carrier Neutrality - Remaining neutral across carriers, different cloud solutions and platforms, allows INXN to offer customers a wide choice of connectivity providers and cloud platforms to give the Olexibility, performance and cost efOiciencies
- Neutrality creates access to over 450 carriers and ISPs across Europe; INXN hosts 19 Internet exchanges (more than any other European data center provider), which means a customer can reach over 90 million broadband subscribers and around 76% of the European GDP
• Connectivity - Exceptional choice of connectivity partners and suppliers under one roof - Assistance when negotiating leased lines, IP transit and peering
28
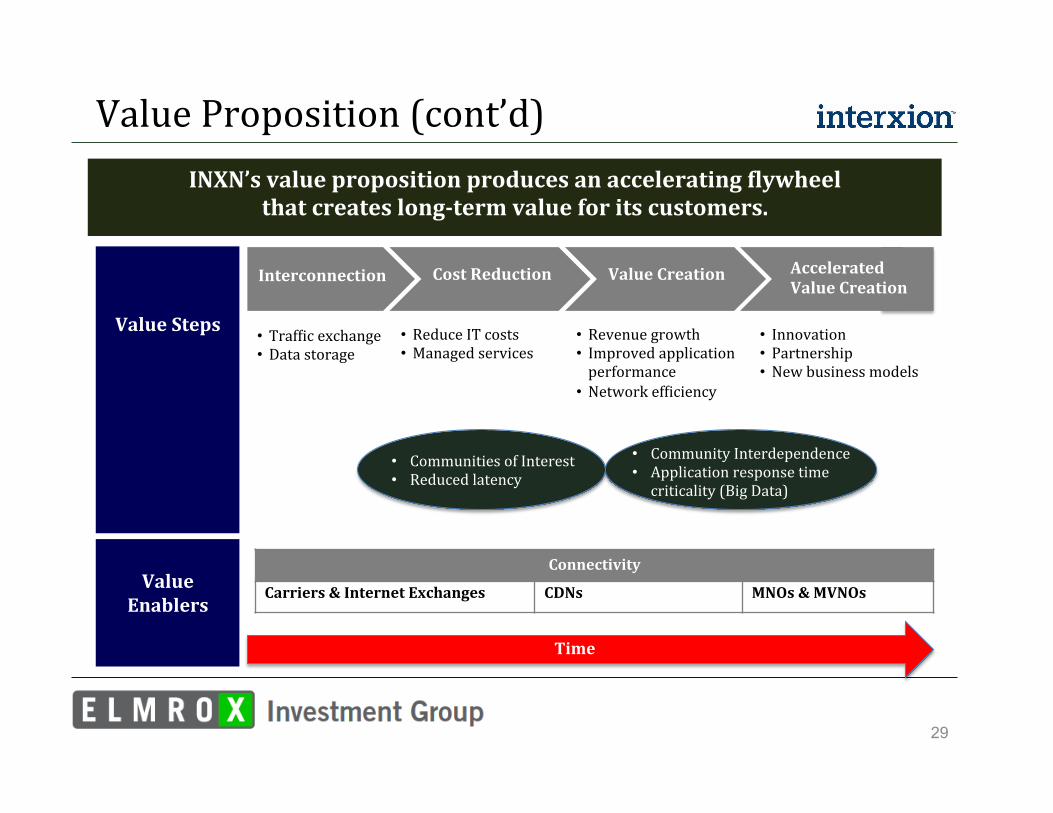
Value Proposition (cont’d) INXN’s value proposition produces an accelerating Vlywheel
that creates long-‐term value for its customers.
Value Steps
Interconnection Accelerated Value Creation
Value Creation Cost Reduction
Value
Enablers
• TrafOic exchange • Data storage
• Reduce IT costs • Managed services
• Revenue growth • Improved application performance
• Network efOiciency
• Innovation • Partnership • New business models
Time
Connectivity
Carriers & Internet Exchanges CDNs MNOs & MVNOs
• Communities of Interest • Reduced latency
• Community Interdependence • Application response time criticality (Big Data)
29

Neutrality as Value Creator
IT Buyers & Users
Corporate Enterprises Public Entities Communities
Community Services
Financial Trading Hubs Digital Media Hubs
Cloud Hubs Content Hubs
Online Gaming & Gambling
Connectivity Services
Internet Exchanges International Carriers
Telco’s Internet Service Providers
Mobile Operators
IT Services
Managed Service Providers System Integrators Cloud Providers Hosting Services
Content Distributors While Labeling Services
Connect Transact
Integrate Optimize
The Neutral Data Center
Traditional Private Cloud Public Cloud Hybrid Cloud Community Cloud
Neutrality Creates SigniVicant Value for Customers = Home of Suppliers, Buyers, IT Services Hubs and Ecosystems
30

High Quality and Growing Customer Base
INXN’s customer base is in high-‐growth markets including Vinancial services, cloud and managed services providers, digital media and carriers.
10% 9% 11% 23% 34%
4% 14% 4% 46% 5%
Interxion’s Target
Segments
Digital Media & CDNs
Financial Services
Managed Service Providers
Enterprises
Network Providers
% Monthly Recurring Revenue
Growth Rate
31

Driven by “Communities of Interest”
INXN’s carrier-‐neutrality and cloud-‐neutrality leads to the creation of “communities of interest” within its data centers. The
data center acts as a marketplace for companies to Vind one another.
ü INXN host communities of customers from across digital media value chain within its data centers to help digital media customers achieve the highest pan-‐European performance and reach
ü Provides ideal environment for effective content aggregation, exchange, storage, management and distribution and opportunity to interconnect with a growing community of content owners
Finance Hubs
Cloud Hubs
ü In the main European Oinancial centers, INXN hosts close-‐knit Oinancial services communities including exchanges, clearing houses, commercial and investment banks, brokers, proprietary trading Oirms, insurance Oirms and key industry vendors
ü Offer sub-‐millisecond, low-‐latency access to a wide range of execution venues and real-‐time data feeds
ü Bring together a wide range of hosters, infrastructure providers, hyper scale platforms, software providers and networks
ü Offer fast and easy interconnection to other cloud providers and to wide choice of carriers and ISPs within INXN data centers
ü Based around major business and consumer centers for fast access to local markets
Communities of interest bring together companies operating in same sector; they beneVit from fast and low-‐cost interconnectivity and establish valuable business relationships.
Sources: Company data and company website.
Content Hubs
• INXN has thriving and growing communities for the Oinance, digital media and cloud sectors within its data centers across Europe. These industry players colocate their infrastructure to form a hub all in close proximity to a wide range of carriers, ISPs and other connectivity providers
32

Community Focus Drives Customer Value “Magnet” companies are a community catalyst and proximity to business partners is highly valued by customers = attracts other high growth companies with robust low latency connectivity needs
Communities of interest bring together companies operating in the same sector so that they can beneVit from fast and low-‐cost
interconnectivity and establish valuable business relationships.
Interxion Focuses on Communities of Interest to Drive Customer Value and Stickiness
Segment, Customer & Application Focused
Disciplined Approach to Identifying
Target Segments
Build Communities of Interest in Target
Segments
• High growth • Need robust connectivity • BeneOit from communities of interest
• Value proximity to business partners
• Rely on real time applications
• Have Pan-‐European / global footprint
• Win magnetic companies • Magnetic companies are a catalyst for communities
• Win other community member companies
Value Creation
1
1
2
3
In Addition to Providing Premium Colocation Services, Connectivity & Coverage…
…Interxion Targets Magnetics Because They Attract Community Members…
…Interxion Fosters Communities of Interest That Add Value to Members
Financial Hub Community -‐ London
1
3 2
33

Community of Interest Draws Customers
INXN’s communities of interest represent signiVicant competitive advantages with network effects and high switch costs for existing customers.
Platform Providers
Public Infrastructure Platform as a Service
Enabling the ecosystem …
IP
CDN’s
Mobile
Direct Connect
Internet Exchanges
CarrierEthernet
Platform Providers
Public Infrastructure Platform as a
Service
Global Outsourcers
Multi-TennantPrivate Cloud
SaaS Providers
Vertically Integrated public cloud
Cloud Enablers
Orchestration and Virtualisation
Hosting Providers
DNS, Web hosting, Email, and Backup
SystemsIntegrators
Professional and Managed Services
Cloud Providers
Public Cloud
Enterprises
Enterprise IT Departments
Test Labs
Global Outsourcers
Multi-‐Tennant Private Cloud
Enabling the ecosystem …
IP
CDN’s
Mobile
Direct Connect
Internet Exchanges
CarrierEthernet
Platform Providers
Public Infrastructure Platform as a
Service
Global Outsourcers
Multi-TennantPrivate Cloud
SaaS Providers
Vertically Integrated public cloud
Cloud Enablers
Orchestration and Virtualisation
Hosting Providers
DNS, Web hosting, Email, and Backup
SystemsIntegrators
Professional and Managed Services
Cloud Providers
Public Cloud
Enterprises
Enterprise IT Departments
Test Labs
SaaS Providers
Vertically Integrated Public Cloud
Enabling the ecosystem …
IP
CDN’s
Mobile
Direct Connect
Internet Exchanges
CarrierEthernet
Platform Providers
Public Infrastructure Platform as a
Service
Global Outsourcers
Multi-TennantPrivate Cloud
SaaS Providers
Vertically Integrated public cloud
Cloud Enablers
Orchestration and Virtualisation
Hosting Providers
DNS, Web hosting, Email, and Backup
SystemsIntegrators
Professional and Managed Services
Cloud Providers
Public Cloud
Enterprises
Enterprise IT Departments
Test Labs
Cloud Enablers
Orchestration and Virtualization
Enabling the ecosystem …
IP
CDN’s
Mobile
Direct Connect
Internet Exchanges
CarrierEthernet
Platform Providers
Public Infrastructure Platform as a
Service
Global Outsourcers
Multi-TennantPrivate Cloud
SaaS Providers
Vertically Integrated public cloud
Cloud Enablers
Orchestration and Virtualisation
Hosting Providers
DNS, Web hosting, Email, and Backup
SystemsIntegrators
Professional and Managed Services
Cloud Providers
Public Cloud
Enterprises
Enterprise IT Departments
Test Labs
Cloud Providers
Public Cloud
Enabling the ecosystem …
IP
CDN’s
Mobile
Direct Connect
Internet Exchanges
CarrierEthernet
Platform Providers
Public Infrastructure Platform as a
Service
Global Outsourcers
Multi-TennantPrivate Cloud
SaaS Providers
Vertically Integrated public cloud
Cloud Enablers
Orchestration and Virtualisation
Hosting Providers
DNS, Web hosting, Email, and Backup
SystemsIntegrators
Professional and Managed Services
Cloud Providers
Public Cloud
Enterprises
Enterprise IT Departments
Test Labs
Enterprises
Enterprise IT Departments
Enabling the ecosystem …
IP
CDN’s
Mobile
Direct Connect
Internet Exchanges
CarrierEthernet
Platform Providers
Public Infrastructure Platform as a
Service
Global Outsourcers
Multi-TennantPrivate Cloud
SaaS Providers
Vertically Integrated public cloud
Cloud Enablers
Orchestration and Virtualisation
Hosting Providers
DNS, Web hosting, Email, and Backup
SystemsIntegrators
Professional and Managed Services
Cloud Providers
Public Cloud
Enterprises
Enterprise IT Departments
Test Labs
System Integrators
Professional and Managed Services
Enabling the ecosystem …
IP
CDN’s
Mobile
Direct Connect
Internet Exchanges
CarrierEthernet
Platform Providers
Public Infrastructure Platform as a
Service
Global Outsourcers
Multi-TennantPrivate Cloud
SaaS Providers
Vertically Integrated public cloud
Cloud Enablers
Orchestration and Virtualisation
Hosting Providers
DNS, Web hosting, Email, and Backup
SystemsIntegrators
Professional and Managed Services
Cloud Providers
Public Cloud
Enterprises
Enterprise IT Departments
Test Labs
Hosting Providers
DNS, Web hosting, Email and Backup
Enabling the ecosystem …
IP
CDN’s
Mobile
Direct Connect
Internet Exchanges
CarrierEthernet
Platform Providers
Public Infrastructure Platform as a
Service
Global Outsourcers
Multi-TennantPrivate Cloud
SaaS Providers
Vertically Integrated public cloud
Cloud Enablers
Orchestration and Virtualisation
Hosting Providers
DNS, Web hosting, Email, and Backup
SystemsIntegrators
Professional and Managed Services
Cloud Providers
Public Cloud
Enterprises
Enterprise IT Departments
Test Labs
IP
Internet Exchanges
Mobile
Carrier Ethernet
Direct Connect CDNs
Enabling the ecosystem …
IP
CDN’s
Mobile
Direct Connect
Internet Exchanges
CarrierEthernet
Platform Providers
Public Infrastructure Platform as a
Service
Global Outsourcers
Multi-TennantPrivate Cloud
SaaS Providers
Vertically Integrated public cloud
Cloud Enablers
Orchestration and Virtualisation
Hosting Providers
DNS, Web hosting, Email, and Backup
SystemsIntegrators
Professional and Managed Services
Cloud Providers
Public Cloud
Enterprises
Enterprise IT Departments
Test Labs
Enabling the ecosystem …
IP
CDN’s
Mobile
Direct Connect
Internet Exchanges
CarrierEthernet
Platform Providers
Public Infrastructure Platform as a
Service
Global Outsourcers
Multi-TennantPrivate Cloud
SaaS Providers
Vertically Integrated public cloud
Cloud Enablers
Orchestration and Virtualisation
Hosting Providers
DNS, Web hosting, Email, and Backup
SystemsIntegrators
Professional and Managed Services
Cloud Providers
Public Cloud
Enterprises
Enterprise IT Departments
Test LabsSource: Company data.
Enabling the ecosystem …
IP
CDN’s
Mobile
Direct Connect
Internet Exchanges
CarrierEthernet
Platform Providers
Public Infrastructure Platform as a
Service
Global Outsourcers
Multi-TennantPrivate Cloud
SaaS Providers
Vertically Integrated public cloud
Cloud Enablers
Orchestration and Virtualisation
Hosting Providers
DNS, Web hosting, Email, and Backup
SystemsIntegrators
Professional and Managed Services
Cloud Providers
Public Cloud
Enterprises
Enterprise IT Departments
Test Labs
34

Resulting in Low Customer Churn
Customer churns runs less than 1% given the strong value proposition.
Customer Concentration
Other 67%
Top 2-‐10 Customers 19%
Top 11-‐20 Customers 10%
Top Customer 4%
Source: Company data.
Sector-‐speciVic companies derive beneVit from being colocated close to one another as it provides them with the opportunity to connect and transact with other community members and customers.
Top Customer 4% 9 10
Top 2-‐10 Customers 19% ~6 ~11
Top 11-‐20 Customers 10% ~4 ~7
% of Recurring Revenue
Number of Countries
Number of Data
Centers
Customers
35

Products & Services Overview
• Highly Secure, Best-‐in-‐Class Facilities: Multi-‐level physical security including 24x7 onsite security, surveillance cameras, locked cabinets and private suites. Advanced Data Center infrastructure with multiple layers of redundancy for power, cooling and Oire-‐suppression
• Flexibility to Build Customized Solutions: Ensures that every customer's precise needs are met and their expectations are exceeded
• Market Leading Service Levels: Interxion sets rigorous Service Level Agreements for all its services, designed to offer cost-‐effective, Olexible ICT infrastructure
• Unrivalled Access & Connectivity: Hosts nineteen of Europe's Internet Exchanges, offering outstanding peering opportunities. Unprecedented connections with wide access to Internet Service Providers; hosts the largest number of peering partners across Europe
• Local Market Expertise & Strong Customer Service Team: Each data center is fully staffed with trained professionals who know the local regulations and are Oluent in the local language. Data centers are also supported by a central European Customer Service Center with a multilingual team offering technical assistance to customers 24 hours a day
• Full Support Services: Equipment housing, engineering, maintenance, connectivity solutions and a range of monitoring services provide customers with solutions to better manage ICT and internet infrastructures
Highly Valuable, Mission Critical Services for Customers
34 Data Centers in 13 Cities Across 11 European Countries
36

Products & Services Overview (cont’d)
Equipment Housing Connectivity Security & Backup Monitoring • Choice of suite, cage, or cabinet space, with three service levels:
• Basic: One power feed per cabinet, 99.9% availability of power
• Standard: Two separate power feeds to each cabinet, 99.9% availability of power
• Advanced: Two separate power feeds from separate distribution networks,99.9% availability of power
Service Center • Offers connection services to Interxion customers within its sites through a variety of services, including: - Metropolitan Connect: private ethernet connections in the metropolitan area
- IP Transit - Interxion Exchanges: ability to exchange trafOic with all other participants
• Remotely managed Oirewall service delivering cost-‐effective protection without requiring an in-‐house solution
• 24x7 monitoring generates immediate alerts and response for potential threats or service outages
• Easy to use, reliable pay-‐as-‐you-‐grow, backup and restore service using a secure interface through the internet
• Agentless technology to create successful backups of standard Oile systems, Customer is completely in control of the data
• Interxion provides round-‐the-‐clock monitoring and support to customers systems located in its Europe-‐side locations
• Based on the level of services, Interxion can monitor and maintain applications, operating systems and hardware itself
• Interxion’s state-‐of-‐the-‐art monitoring and management center (ESC) is located in London, staffed 24 hours per day, 7 days per week, by multilingual staff
• The ESC connects to all Interxion sites and is responsible for commissioning maintenance and security operations for hosted clients
• Colocation contracts with customers are typically for three to Oive years, but can last up to 10 years. Contracts usually include price escalators that adjust for inOlation
• Typically 60-‐70% of new bookings in any given year are generated from existing customers
“Our strategy of building resilient communities of interest…we do so by focusing our sales and marketing efforts against speciVic target market segments.”(1)
“We are able to attract magnet customers and their communities of interest members because of the value they receive from our
leadership and connectivity and customer service.(1) (1) Vice Chairman, Chief Executive OfOicer and President, David C. Ruberg, on May 8, 2013 earnings call.
37

Cost Structure
Fixed Cost Model + Strong Revenue Growth = Growing EBITDA Margins
Fixed Cost Model
Other, 30% Personnel, 28%
Property, 20% Power, 22%
Operating Expense Breakdown(1) Fixed / Semi-‐Fixed
Source: Company data. (1) CFO Josh Josh, August 7, 2013 earnings call. (2) Vice Chairman, Chief Executive OfOicer and President, David C. Ruberg, August 7, 2013.
• All power costs are recovered from customers • Once a data center is established, rental and
most staff costs are Oixed / semi-‐Oixed leading to increase in incremental proOit
• SG&A as % of sales should decline in 2014 and 2015 as the utilization rate recent capacity expansions increases
• “We plan, as we've done for the last 6 years, to grow our adjusted EBITDA margins somewhere between 100 and 150 to 200 basis points each year.”(1)
“There's a world of difference between the wholesalers and retailers. Wholesalers don't care who comes into their data centers. We're really picky about it…. our focus on communities of interest, which we are geared throughout the company to make sure that we have a consistent
population that has the potential to interconnect and create value over time.” (2)
38

SigniOicant Operating Leverage
Incremental Margins Generally ~80%
A visible path to 50% plus EBITDA margins from ~42% in 2013.
Multiple Drivers to Deliver Revenue & Margin Growth
• Favorable industry fundamentals
• Attractive supply/demand dynamics
• New customer acquisition in target, growing segments
• Favorable contracts enabling increased revenue per Sqm
• Disciplined expansion 15% 13% 12% 11% 11%
20% 19% 18% 17% 17%
13% 16% 14% 14% 15%
18% 16% 18% 17% 15%
2008 2009 2010 2011 2012
Other
Energy
Personnel
Property
Adj. EBITDA Margin 35% 42% 37% 38% 40%
Adjusted EBITDA Margin Expands by 660 Basis Points
39

Strong Balance Sheet & Liquidity
SigniVicant Balance Sheet Capacity for Shareholder Value Creation
(€ in millions) Actuals Jun 30, 2013
As Adjusted* Jun 30, 2013
Actuals Dec.31, 2012
Cash & Cash Equivalents 59.8 89.2 68.7
Total Borrowings(1)(2) 302.8 363.1 286.8
Shareholders Equity 390.3 367.1 375.6
Total Capitalization 693.1 730.2 662.4
Total Borrowings / Total Capitalization 43.7% 49.7% 43.3%
Gross Leverage Ratio(3) 2.5x 3.0x 2.5x
Net Leverage Ratio(4) 2.0x 2.3x 1.9x
• ReOinanced bonds with €325 million 6.0% Senior Secured Notes due 2020
• Solid cash position and substantial additional liquidity from undrawn €100 million Revolving Credit Facility
• New €6 million mortgage on recently purchased property in Amsterdam
• SigniOicant room under covenant (maximum leverage ratio of 4.0x)
* As adjusted Oigures represent June 30, 2013 balance sheet adjusted for reOinancing completed on July 3, 2013: the purchase of the 9.5% Senior Secured Notes due 2017 Oinanced by the issue of the 6.0% Senior Secured Notes due 2020 and the new €100 million revolving credit facility (which remained undrawn), the net cash proceeds excluding payment of interest up to redemption date to the 9.5% Senior Secured Notes holders and the after tax impact of the one-‐off Oinancial charges (1) Total Borrowings = 9.50% Senior Secured Notes due 2017 including premium on additional issue and are shown after deducting underwriting discounts and commissions, offering fees and expenses + Mortgages + Financial Leases + Other
Borrowings – Revolving credit facility deferred Oinancing costs. (2) Total Borrowings “As adjusted” = 6.0 % Senior Secured Notes due 2020 and are shown after deducting underwriting discounts and commissions, offering fees and expenses + Mortgages + Financial Leases + Other Borrowings” – €100 million
Revolving credit facility deferred Oinancing costs. (3) Gross Leverage Ratio = (9.50% Senior Secured Notes due 2017 at face value + Mortgages + Financial Leases + Other Borrowings) / Last Twelve Months Adjusted EBITDA. (6.0% Senior Secured Notes due 2020 for the “As adjusted” Oigures. (4) Net Leverage Ratio = (9.50% Senior Secured Notes due 2017 at face value + Mortgages + Financial Leases + Other Borrowings – Cash & Equivalents) / Last Twelve Months Adjusted EBITDA . (6.0% Senior Secured Notes due 2020 for the “As
adjusted” Oigures).
40

Predictable & Growing Free Cash Flow
“We are focused on creating shareholder value and that translates into sustainable cash per share growing over the next 3 to 5 years.”(1)
(1) Vice Chairman, Chief Executive OfOicer and President, David C. Ruberg, on September 12, 2013. (2) 26 data centers in operation as of December 31, 2009: VIE1, BRU1, CPH1, PAR1, PAR2, PAR3, PAR4, PAR5, PAR6, DUS1, FRA1, FRA2, FRA3, FRA4, FRA5, DUB1, AMS1, AMS2, AMS3, AMS4, AMS5, HIL1, MAD1, STO1, ZUR1, AND LON1.
Maintenance capex low at low single digits % of sales.
(13)
Cumulative Data Centre Investment
Revenue Gross ProOit (56% Margin)
Maintenance Capex Annual Cash return
(€ in millions)
24%
FY 2009 Returns
517 264
173 165 (8)
Cumulative Data Centre Investment
Revenue Gross ProOit (66% Margin)
Maintenance Capex Annual Cash return
32%
2Q 2013 LTM Returns
Case Study: How Cash Generation Improves as Data Centers Mature(2)
(€ in millions)
• 26 total data centers in operation • 54,800 sqm of equipped space • 70% utilization • 24% annual cash return • Same group as at end 2009 • 60,700 sqm of equipped space after phased expansions
• 81% utilization • 32% annual cash return
41

Attractive Cash Returns
35% Annual Cash Return on Original Data Center Investment
N.B.: “Full” data centers deOined as those at 85% or greater utilization. Data center gross Oixed asset cost (Gross PP&E) at historic exchange rates.
€ 100
€ 60 € 40 € 35
Original Data Center Investment
Annual Recurring Revenue Gross ProOit (65% Gross Margin)
Annual Cash Return
(€ in millions)
35%
FY 2009 Returns
% of Original Data Center Investment
40% 60% 100%
42

Illustrative Revenue Ramp of Expansion Revenue grows over time as energy consumption increases.
Source: Company presentation.
Three Components • Space (sqm billed in advance) • Power Reservation (Cooling Capacity) (MW billed in advance) • Energy Consumption (KWh billed in arrears) Deployment Maturation & Revenue Development Occurs Over Multiple Quarters • Mix initially tilted toward space • As contracted space Oills, energy consumption increases, requiring greater cooling capacity
• Over time, power reservation and energy consumption become a larger share
Applies to Both Customers and Data Centers
43

Capital Allocation
“The target…generate returns 30% to 40% on capital that you invest.”(1)
• New projects have highly attractive return proOiles: management typically will only do deals with a minimum 30% IRR generally over 10 years
• Management focus on reinvesting cash Olow into the business for growth
“For the next couple of years, the best return of the capital that we currently have…is to build data centers or to buy an opportunity.”(1)
(1) Vice Chairman, Chief Executive OfOicer and President, David C. Ruberg, on September 12, 2013.
Expansion Strategy
• Disciplined approach to expansion - Sized to existing customer demand - Based on target IRR
• Low execution risk - Uniform design - Campus-‐oriented - Phase build and capex deployment
44

Long-‐Term, Disciplined Growth Mindset
“Interxion looks to deploy its capital on a demand-‐driven basis.”(1)
Market Project Project
CapEx (€m)
Equipped Space (sqm)
Initial Customer Availability Project Opened
Frankfurt FRA 7: New Build 21 1,500 1,500 1Q 2012
Stockholm STO 1: Phase 4 Expansion 5 500 500 2Q 2012
Paris PAR 7: Phase 1 New Build 70 4,700 4,700 2Q 2012
Amsterdam AMS 6: New Build 60 4,400 4,400 3Q 2012
London LON 2: New Build 38 1,500 1,500 3Q 2012
Madrid MAD 2: Phase 1 New Build 10 800 800 4Q 2012
Frankfurt FRA 6: Phase 3 Expansion 5 600 600 1Q 2013
Copenhagen CPH 1: Expansion 2 300 300 2Q 2013
Stockholm STO 2: Phase 1 New Build 11 500 500 2Q 2013
Vienna VIE 1: Phase 4 Expansion 1 400 400 3Q 2013
Zurich ZUR 1: Phase 4 Expansion 4 500 -‐-‐ 4Q 2013
Stockholm STO 2: Phase 2 Expansion 6 500 -‐-‐ 1Q 2014
Frankfurt FRA 8: Phase 1 & 2 New Build 30 1,800 -‐-‐ H1 2014
Source: Company data. (1) Vice Chairman, Chief Executive OfOicer and President, David C. Ruberg, on May 8, 2013 earnings call.
45

Intense Focus on New Customers
“Ecosystems such as Interxion's are increasingly important to Vinancial service providers looking to expand… allow them to connect with current
and potential customers, secure a variety of services to meet the requirements and growing demands of customers.”(1)
(1) 451 Research Market Insight on August 4, 2013.
Strategic long-‐term focus on cloud deployments.
• Public Cloud Services - Growing demand from customers that want public cloud services but remain reticent due to concerns
around network performance and security
- Digital media companies, online gaming companies, system integrators are key players
• Hybrid Cloud - Primary future demand driver of enterprise use of direct connections to third-‐party cloud providers
• Enterprise Customers - INXN’s DirectConnect program with Amazon could augment its proOile with enterprise customers
- Such new business would further diversify an already variegated customer base
46

Big Geographic Growth Opportunities
SigniVicant runway to expand given growth opportunities in Eastern Europe, Latin America, the Middle East, and Asia.
Latin America has been traditionally underserved and offer signiVicant opportunities especially if the tax regime in Brazil becomes favorable. Multi-‐tenant data center capacity remains tight across the continent at
more than 80% utilization in the top markets in Latin America.
• We believe that Interxion is extremely well positioned to expand beyond its core European footprint into adjacent markets and new geographies
• Cash Olow generation should accelerate in 2014 and 2015 as recent expansion opportunties ramp towards full utilization. This increased cash Olow can fund geographic expansion
• INXN also has ample balance sheet capacity for acquisitions with room to 4.0x covenants
• Markets outside of Europe and North America are highly fragmented
• Eastern Europe is rapidly growing and is a natural extension of INXN’s current western European footprint
47

Valuation & Financials

We Believe INXN is Undervalued
• Predictable, recurring business model
• Consistent and growing cash Olows
• SigniOicant competitive advantages and moats relative to North America data center market
• Long runway of secular growth opportunities in early innings of adoption (cloud, digital media, big data, etcetera)
• BeneOits of growth capex
• Likely growth expansion into new markets either organically and/or inorganically
• Low balance sheet leverage relative to trading multiples of other recurring, high cash Olow stream businesses
• Recovery on European economy
• Strategic value of the business
We believe Interxion is undervalued with long-‐term upside from secular growth opportunities. At current prices, a long-‐term shareholder
pays ~13x consensus FYE 12/31/14E SSFCF, which does not account for:
49

Why This Opportunity Exists
• Overlooked because is European domiciled Oirm with U.S. stock listing
• Overcapacity and pricing concerns in North American market have incorrectly been applied to European data center market
• Investors overlooking INXN’s steady-‐state free cash Olow because it is masked by signiOicant growth capital expenditures
• Misguided concerns over weak macroeconomic environment in Europe affecting INXN demand
• 30% private equity ownership creates overhang / valuation discount
• Misplaced concerns that Europe-‐only footprint is a growth headwind
• Mixed sell side coverage: some U.S., some Europe
Market incorrectly places concerns over competitive issues speciVic to the North American data center market onto INXN.
50

Why are INXN Shares Attractive?
• Overcapacity and pricing risk
• Provider of commoditized wholesale data
• Builds speculative capacity
• Capital intensive real estate Oirm beholden to cap markets
• Data centers do not generate cash Olow
• Baker Capital’s 30% ownership creates overhang
The Bear’s Concerns
Elmrox View
• Overcapacity concerns are misplaced and speciOic to North America, which is structurally a different market from Europe. The competitive moats in Europe are much strong than in NA.
• INXN is not a wholesale data center (commodity) provider. INXN is only in the colocation business. INXN has built highly valuable communities of interest over 15 years that attract customers.
• INXN’s management has long track record of demand-‐driven capex . Moreover, the European market has become rational since the overbuild of the late 1990s. Prohibitive barriers to new entry in Europe preclude spec building.
• INXN’s owns little real estate. Most of its facilities are under long-‐term lease agreements that typically range 10 to 15 years in duration. Organic cash Olow generation supports growth capex.
• INXN has a strong and growing free cash Olow generation proOile underpinned by signiOicant secular growth opportunties, high EBITDA margins and low maintenance capex. Consensus overlooks INXN’s steady state free cash Olow (SSFCF) because it is masked by demand driven growth capex
• Baker’s ownership stake has been well known since INXN’s IPO in 2011 and is priced in
51

Multiple Ways to Create Value
Strategic Asset Value + Organic Growth
• Europe Adjacencies • LatAm, Middle East, Asia
Shareholder Value Creation
New Markets
Balance Sheet
REIT Conversion
• Acquisitions • Buybacks
• Likely does not convert until 2015/2016 given NOLs
• Given growth, should trade at premium to most
Operating Leverage
• Management goal ~100bps to 150bps improvement per year
• Path to 50% EBITDA margins
52

Replacement Value
A traditional replacement value analysis is insufOicient because it excludes:
• Complicated, underground installed Oiber network needed for data centers to function
• Specialized access to signiOicant and limited external power sources
• Customer interconnections (communities built over 10 to 15 years that cannot be replicated)
• Magnet customers that were cultivated and that draw additional customers to INXN
• Pan-‐European connections (among INXN data centers in different countries)
• Networking equipment for “peering”
• Permits in land constrained European markets
Replicating INXN’s scale and communities of interest would likely take 10 to 15 years and cost in excess of INXN’s current enterprise value of $1.9bn.
European telcos invested hundreds of millions of euros in Viber in the ground and networking equipment in the 1990s connecting to Virms like INXN. It is unlikely that this Viber network capex will be spent again. As such it is difVicult to place a value on
this critical, installed underground network as it cannot be replicated.
53
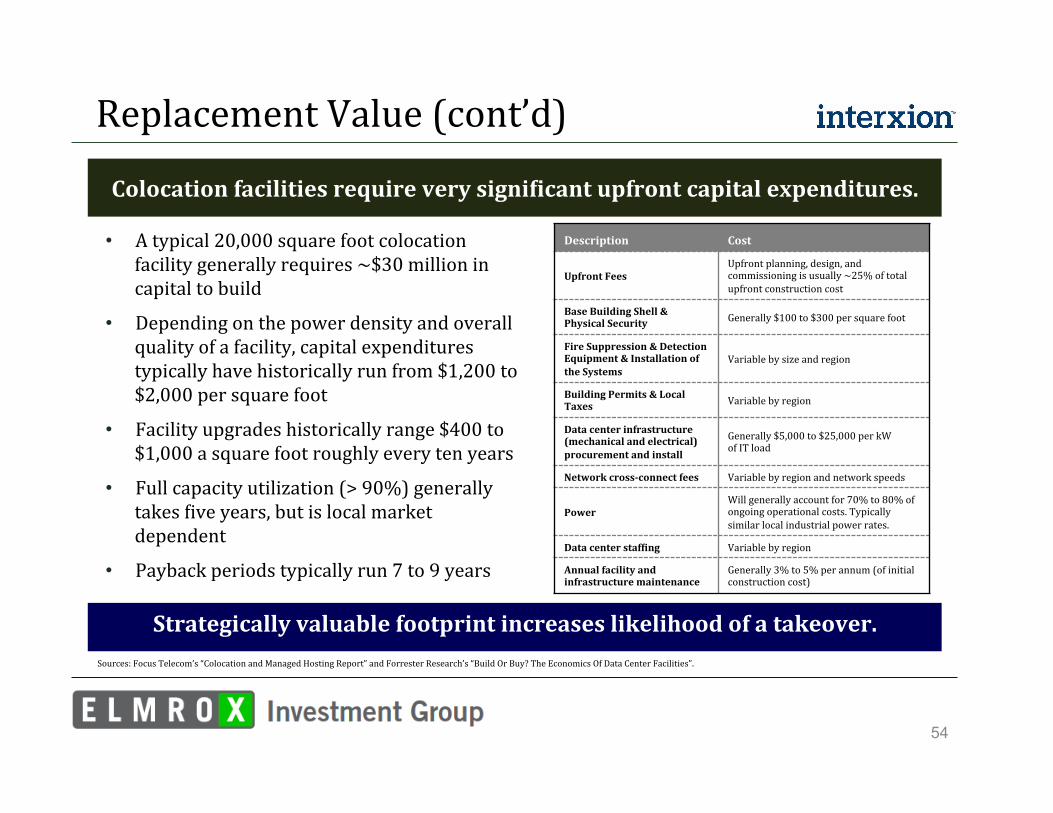
Replacement Value (cont’d)
Colocation facilities require very signiVicant upfront capital expenditures.
Strategically valuable footprint increases likelihood of a takeover.
• A typical 20,000 square foot colocation facility generally requires ~$30 million in capital to build
• Depending on the power density and overall quality of a facility, capital expenditures typically have historically run from $1,200 to $2,000 per square foot
• Facility upgrades historically range $400 to $1,000 a square foot roughly every ten years
• Full capacity utilization (> 90%) generally takes Oive years, but is local market dependent
• Payback periods typically run 7 to 9 years
Description Cost
Upfront Fees Upfront planning, design, and commissioning is usually ~25% of total upfront construction cost
Base Building Shell & Physical Security Generally $100 to $300 per square foot
Fire Suppression & Detection Equipment & Installation of the Systems
Variable by size and region
Building Permits & Local Taxes Variable by region
Data center infrastructure (mechanical and electrical) procurement and install
Generally $5,000 to $25,000 per kW of IT load
Network cross-‐connect fees Variable by region and network speeds
Power Will generally account for 70% to 80% of ongoing operational costs. Typically similar local industrial power rates.
Data center stafVing Variable by region
Annual facility and infrastructure maintenance
Generally 3% to 5% per annum (of initial construction cost)
Sources: Focus Telecom’s “Colocation and Managed Hosting Report” and Forrester Research’s “Build Or Buy? The Economics Of Data Center Facilities”.
54

Replacement Value (cont’d)
Tangible Replacement
Value
Replacement value creates downside protection and margin of safety.
Intangible
Replacem
ent
Value
Underground Fiber Network
Proximity to Internet Exchange Points
Access to Magnet Customers
Entire Communities of Interest
Access to Pan-‐European Footprint
Colocation Facilities Replacement Value
Power Access
Interxion
Replacement Value
55

Illustrative EBITDA Standalone Valuation
Given its secular growth runway, moats, high EBITDA margin, cash Vlow generation, and predictable model, we believe INXN should trade inline with similar competitively advantaged growth companies. Such businesses trade at least between 10x to 14x ntm EBITDA.
N.B.: EBITDA multiple in INXN Potential Standalone Valuation table conservatively assumes the low-‐end of competitively advantaged growth companies EBITDA multiple range of 10x-‐14x. This analysis conservatively assumes no additional share repurchases and no dividends. Assumes growth capex of $97mm.
!INXN!Potential!Standalone!Valuation
Low HighINXN+EBITDA+(FYE+12/31/15E) $225 $275EBITDA+Multiple 10.0x 10.0xImplied!Firm!Value $2,250 $2,750Less:+Net+Debt (365) (365)Plus:+2H2013+&+2014E+FCF 69 69Implied+Equity+Value 1,954 2,454INXN+Shares 69 69Implied!Equity!Value!per!Share $28 $36Current+Price $22 $22%+from+current 26% 58%
56

Illustrative Steady State Free Cash Flow
Given multiple paths for secular growth and the related growth capex, the market overlooks INXN’s strong steady state free cash Vlow (SSFCF).
Unlike most other steady state free cash Vlow (SSFCF) valued businesses such as alarm companies, INXN has a much higher organic growth rate.
• We believe steady state free cash Olow (SSFCF) multiples are more appropriate for valuation because this approach normalizes for growth capex, which is likely to continue through back half the decade
• INXN generates a stable and growing stream of cash Olows from a highly recurring customer base. The stability of these cash Olows is similar to utilities, MLPs, REITs, and alarm monitoring Oirms
• Given the recurring and subscription nature of INXN’s cash Olow streams, its business model is most comparable to alarm monitoring Oirms (INXN has scant, public comparables in Europe and North American data centers are competitively disadvantaged to European Oirms)
• Consensus values alarm monitoring businesses on SSFCF because similar to INXN, alarm companies are: - Highly recurring revenue businesses (>90%) - Provide services that are highly valuable/mission critical to customers - Recession resistant - Produce predictable cash Olow streams - Have low maintenance capex - Able to incur high degrees of leverage on the balance sheet
57

Illustrative SSFCF Valuation
In the private and public market, similar recurring cash Vlow stream businesses such as INXN’s tend to trade for 15x to 22x SSFCF or higher.
When compared to alarm companies, we believe INXN should trade at SSCF multiples that are a premium to alarm companies (which tend to trade at least 15x SSFCF in the public market) because: • INXN has a signiOicantly higher organic growth rate
- INXN organic growth 10% plus versus low single digits for alarm companies - INXN has secular growth versus cyclical growth (housing turnover) for alarm companies
• INXN has much lower churn - INXN churn <1% vs mid-‐teens % versus customer churn for alarm companies like ADT
• INXN spends little capital on marketing to garner new customers versus heavy marketing spend of alarm companies (INXN’s communities of interest draw customers without marketing)
• Competitive environment for INXN is much more rational versus the hyper competitive alarm industry (alarm monitoring is commodity-‐like product vs INXN’s unique and rare communities of interests)
• Barriers to entry are much high in European data centers than alarm monitoring • INXN carries signiOicantly lower leverage on the balance sheet than ADT, Monotronics (Ascent), Protection
One, Vivent, and Securitas
Given the organic growth proVile and competitive advantages, we believe INXN should trade at least inline with alarm companies, MLPs and REITs
that have similar high visibility on cash Vlow growth.
58

Illustrative SSFCF Valuation (cont’d) INXN’s recurring cash Vlow streams are akin to predictable cash Vlows
generating businesses like alarm companies, MLPs, and REITs. Given the lack of appropriate European comps, INXN should be compared to alarm Virms because they have very similar cash Vlow stream characteristics.
If management stopped all growth capex and facilities ran at a conservative 75% utilization rate, INXN should generate approximately $1.44 to $2.40 per share of steady state cash Vlow in FYE 12/31/2015.
• We prefer to use steady state free cash Olow (SSFCF), which assumes a no growth scenario, to improve the comparability between companies with similar business models and cash Olow streams, but different growth rates and competitive positions
• Steady state free cash Olow (SSFCF) streams are effectively the same as adjusted funds from operations (“AFFO”) used in the REIT space
Steady'State'Free'Cash'Flow
Low Mid HighEquipped/Square/Meters/(12/31/15E) 90,500 90,500 90,500Utilization/Rate 75% 75% 75%Revenue/Generating/Space 67,875 67,875 67,875Monthly'RR'/'Square'Meter $580 $640 $700Recurring/Revenue/(mm) $472 $521 $570Less:/COGS/($250/Per/Sq/Meter) (204) (204) (204)Gross/Profit $269 $318 $367Less:/Sales/&/Marketing/($30mm/TTM) (20) (20) (20)Less:/General/&/Admin/($50mm/TTM) (50) (50) (50)No>Growth'EBITDA $199 $248 $297Less:/MCX/($240/Per/Sq/Meter) (22) (22) (22)Less:/Interest (30) (30) (30)Less:/Taxes/(32.2%/Dutch/Rate) (47) (63) (79)Recurring/FCF $100 $133 $166Interxion/Shares 69 69 69Steady'State'Free'Cash'Flow'Per'Share $1.44 $1.92 $2.40Implied/INXN/Share/Price/at/15x/SSFCF $22 $29 $36Implied/INXN/Share/Price/at/22x/SSFCF $32 $42 $53
59

Opportunity for Multiple Expansion
Predictable businesses with wide moats, sustainable margins and growing cash Vlow streams tend to trade on considerably higher ntm SSFCF multiples.
Multiple Expansion
N.B.: Multiples based on sell side estimates and share prices as of October 31, 2013. Implied INXN share price assumes midpoint of FY12/31/2015E EBITDA $225mm to $275mm range, which should generate approximately $134mm steady state free cash Olow (SSFCF). This analysis conservatively assumes 75% utilization rate and excludes cumulative cash Olow generation in 2H2013 to YE2015.
We believe the market is offering investors a leading secular grower for attractive
multiples of steady state free cash Vlow (SSFCF).
INXN
Alarm
Monitoring MLPs REITs Staples
13x 15x – 35x 12x -‐ 22x 15x – 22x 15x –20x
Implied INXN Price (vs $22.46 current)
$29 -‐ $68 $24 -‐ $43 $29 -‐ $43 $29 -‐ $39
Levered Steady Steady Free Cash Flow / AFFO Multiples
60

Baker Overhang Creates Opportunity
• Baker Capital, a New York based private equity Oirm, invested ~$145MM in Interxion between January 2000 and February 2006, and remains INXN’s largest shareholder
• Notably, Baker did not sell shares in Interxion’s 2011 initial public offering of $13.00 per share as a primary reason of the IPO was to raise capital to fund growth plans
• Following the IPO, Baker entered into a Shareholder Rights Agreement where it retained the right to designate the majority of the members of the Board, including the right to nominate the Chairman
• Baker currently owns ~30% of common shares outstanding following a distribution to its LPs in 2012
• We expect Baker’s ownership to continue declining as the investment horizon matures from its 1997 vintage fund
We believe INXN’s valuation discount already reVlects long-‐held market concerns that INXN’s top shareholder will exit its position over time.
With its Board seats and former afViliate as CEO, Baker Capital effectively controls INXN.
61

Baker Capital’s Conundrum
• The valuation discount created by concerns over Baker Capital exiting its position has made the stock highly attractive on a long-‐term basis
• If INXN’s SSFCF multiple continues to languish and given that Baker controls the Board, we would not be surprised to see a more balanced approach to capital allocation split between share repurchases buybacks and growth capex and/or M&A
• INXN could fund share repurchases from organic cash Olow or from incremental leverage given highly favorable credit markets and its under-‐levered balance sheet
• Once Baker’s ownership threshold falls below the trigger that allows it to nominate the majority to the Board, we foresee an increased likelihood of a takeover given the aforementioned Investment Merits and INXN’s strategic value
Given INXN’s low and attractive relative SSFCF valuation: Grow organically, grow inorganically, repurchase shares or all three?
Whichever path(s) is taken, we are happy because all lead to long-‐term shareholder value creation.
62

Other Value Creation Considerations… M&A, Dividends, Share Repurchases, and a REIT?
“Concept of a REIT is just another avenue to trying to improve and create shareholder value….in Europe, REITs aren't as prevalent as in the U.S.,
but it’s certainly an opportunity, an option, for companies like Interxion.”(1)
• Given the highly fragmented nature of the industry and the strong demand backdrop, INXN is well positioned to consolidate the colocation industry on standalone basis given its cash Olow and balance sheet capacity
• Given INXN’s growth runway, high EBITDA margins, low maintenance capex, and recurring free cash Olow, we believe the business could sustain considerably higher leverage levels - Per our earlier discussion of levered cash Olow streams, alarm monitoring businesses which have lower
growth proOiles typically have 3x to 6x levered capital structures - We see a lower likelihood of incremental leverage incurred near-‐term at INXN until the overall valuation
multiple expands (which would lead to lower debt costs) and the NOLs are exhausted (tax shield from debt makes more sense at that point)
• We view a dividend initiation or special dividend as less likely given the growth opportunities • More likely is a capital allocation shift towards some share repurchases given the valuation discount
• The potential for conversion to a REIT structure exists following the exhaustion of NOLs in 2015/2016 and assuming some structuring considerations. A REIT structure would likely attract new investors given its unique business model. We believe an INXN REIT would garner a premium multiple relative to: - wider REIT industry, which is subject to more cyclical property markets versus secular demand for INXN)
- to North American data center REITs, which are competitively disadvantaged relative to INXN
(1) Chief Financial OfOicer, Josh Joshi on September 13, 2013.
63

Attractive Leveraged Buyout Candidate
High Free Cash Flow Characteristics
Sustainable Margins and Pricing Power
SigniVicant Competitive
Advantages (Barrier to Entry, Switching Costs, Patents)
Global Footprint and Scale
Organic Growth Opportunities especially in
Developing Markets
Potential for SigniVicant Margin Expansion from Operating Leverage
Margin of Safety: Replacement Value/Strategic Asset Value
Synergy Potential with Existing Private Equity Owned Data
Center Firms
Industry Consolidation May Be Executed Better in Private Market
Attractive LBO Target
Low Cyclicality of Business
Strong Recurring Free Cash Flow + Secular Growth = Attractive Private Equity Returns
We believe a Vinancial sponsor could pay up to $32 per share while meeting typical returns hurdles. Given the recurring model and cash Vlow, INXN could support substantial leverage.
64

Conclusion
Predictable, secular grower with strong cash Vlows that trade at substantial discount to levered cash Vlow streams of similar, but slower growth businesses. SigniVicant organic and inorganic opportunities for meaningful shareholder value creation. Strategic asset base
and private market value provides margin of safety and limits downside risk.
Interxion is a Good Business • Market leader in European data centers with signiOicant competitive advantages • Secular growth opportunities with multiple long-‐term drivers • Predictable business with high recurring revenues and high EBITDA margins • Strong balance sheet • Experienced and disciplined management focused on long-‐term shareholder value creation Shares are Undervalued • Concerns over increased competition in Europe are misplaced (issue speciOic to North American market) • Valuation does not reOlect the predictability and high recurring cash Olow of the business • Estimates do no account for likely expansion into new markets (Latin America / Eastern Europe / Asia) Additional Value Creation Opportunities Exist • Organic & inorganic expansion • Share repurchases and potential REIT conversion (longer-‐term) • Attractive acquisition candidate Low Relative SSFCF Valuation and Strategic Value Creates Margin of Safety
65

Illustrative Potential Returns
Strategic Asset Value + Variant Perception = Asymmetric Return ProVile
15
25
35
45
55
65
INXN Current Price
Conservative Replacement Value (Facilities Only)
LBO / Private Market Value
Standalone INXN Sold to Strategic
Recurring Monthly Revenue (RMR)
Steady State Free Cash Flow (SSFCF)
REIT Conversion
$25-‐$32
$31 -‐$47
$34-‐$60
$34-‐$52
$12 -‐ $23
$28-‐$52
$26 -‐$54
$22.46
% Upside: 11% to 42% 24% to 131% 51% to 131% 38% to 109% 15% to 140% 51% to 167%
Attractive Multiple of Steady State Free Cash Flow (SSFCF) + Long Term Secular Growth Opportunities = Attractive Entry Point
66

Industry Overview
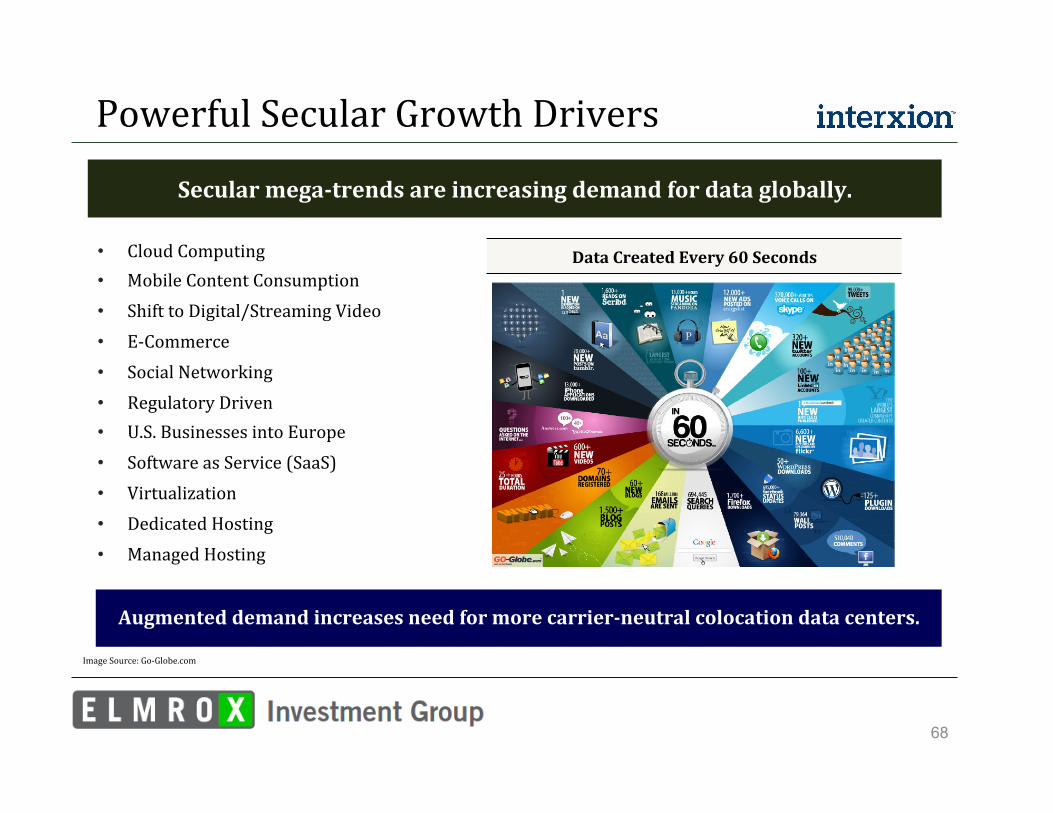
Powerful Secular Growth Drivers
• Cloud Computing • Mobile Content Consumption • Shift to Digital/Streaming Video • E-‐Commerce • Social Networking • Regulatory Driven • U.S. Businesses into Europe • Software as Service (SaaS) • Virtualization • Dedicated Hosting • Managed Hosting
Secular mega-‐trends are increasing demand for data globally.
Augmented demand increases need for more carrier-‐neutral colocation data centers.
Data Created Every 60 Seconds
Image Source: Go-‐Globe.com
68

Strong Industry Fundamentals
Global secular growth trends drive stable, sustained demand.
Source: Cisco Visual Networking Index, 2012. Cisco Global Index 2012. (1) Exabyte equals 1018 bytes. (2) Workload deOined as the amount of processing a server undertakes to execute an application and support a number of users interacting with the application.
• Consumerization: 70% of
Internet users are expected to have 5 or more mobile devices over the next 3-‐5 years
• Global middle class growth: global Internet users will more than double by 2015
• Cloud: share of IT spend is expected to grow from 2% to 20% by 2015
• Big Data: 90% of the world’s data has been generated in the last two years
10,423
45,280
2011 2016E
CAGR 34%
IP TrafVic (PB per month)(1)
30%
62%
2011 2016E
CAGR 16%
Cloud Data Center Workload % of Total Data Center Workload(2)
2011 2016E
CAGR 29%
Internet TrafVic Growth IP TrafVic (EB per month)(1)
3.6
10.3
Consumer Business
69

Secular Growth From Cloud Computing
Source: The Evolution of the European Hosting Market whitepaper.
Secular shift to the cloud is in early innings = signiVicant increase in demand for carrier neutral data centers with scale such as Interxion.
$3,078 $3,257
$3,490
$3,787
$4,177
$1,700 $3,000
$4,800
$7,100
$9,700
$-‐
$5,000
$10,000
$15,000
$20,000
$25,000
$30,000
$35,000
$40,000
2010 2011 2012 2013 2014
($ in M)
CAGR 42% CAGR 6% CAGR 17%
Global Hosting vs. Cloud Market
Managed Hosting Dedicated Hosting Cloud Computing
70

Secular Growth From the Cloud (cont’d)
• The global cloud market today is dominated by the U.S. accounting for ~63% of global cloud revenues versus ~23% in Europe as of 2012(2)
• Only ~5% of cloud vendors are European compared to ~90% from the U.S. (2)
• Long-‐Term Cloud Demand Trends(3): - Global cloud IP trafOic will increase nearly 4.5-‐fold
over the next 5 years. Overall, cloud IP trafOic will grow at a CAGR of 35% from 2012 to 2017
- Global cloud IP trafOic will account for more than two-‐thirds of total data center trafOic by 2017
- 12x fold increase in personal cloud services by 2017 (Dropbox, Google Drive, Amazon Cloud, et al)
(1) The Evolution of the European Hosting Market whitepaper. (2) 451 Research. (3) Cisco Global Cloud Index Whitepaper October 2013. (4) Gartner.
“The data center supports the whole ediVice of cloud computing: determining availability, performance and commercial Vlexibility.”(1)
Aggregate Peak European IXP TrafVic
Source: Euro-‐IX
Cloud computing’s share of IT spend is expected to grow from 2% to 20% by 2015.(4)
71
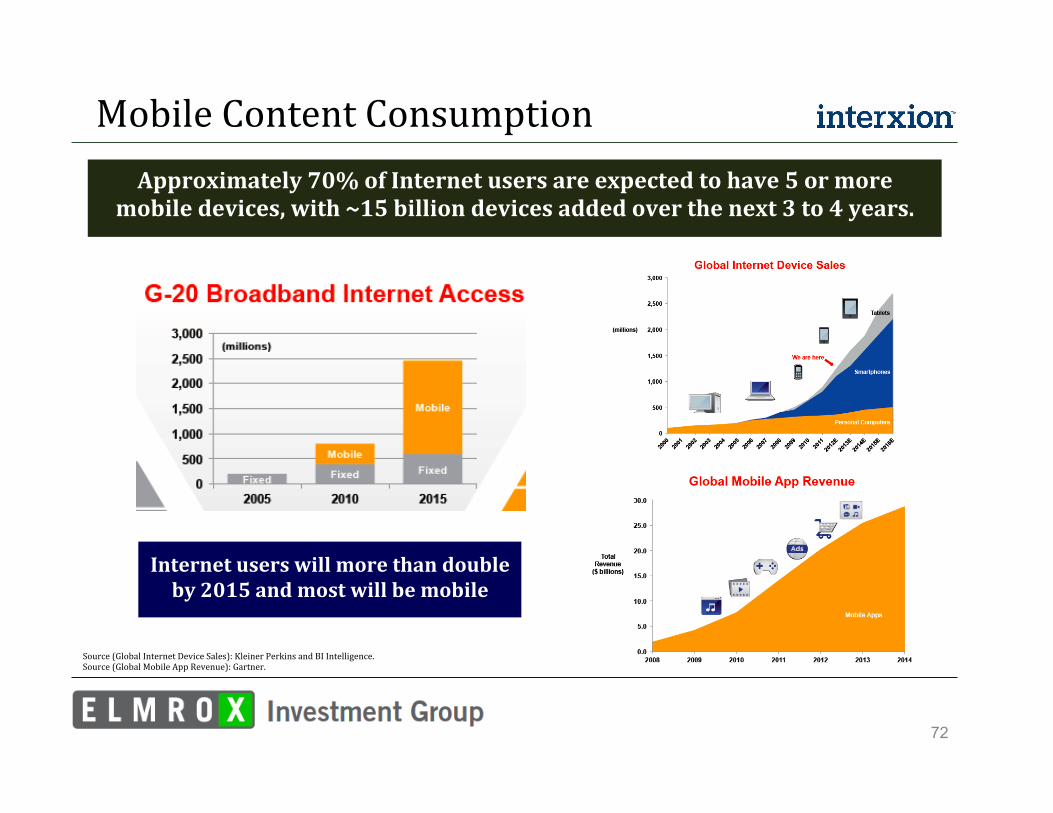
Mobile Content Consumption
Approximately 70% of Internet users are expected to have 5 or more mobile devices, with ~15 billion devices added over the next 3 to 4 years.
Source (Global Internet Device Sales): Kleiner Perkins and BI Intelligence. Source (Global Mobile App Revenue): Gartner.
Internet users will more than double by 2015 and most will be mobile
72

Big Data is Emerging Opportunity
-‐
50
100
150
200
250
300
350
400
2011 2012 2013 2014 2015 2016
(Bandwidth Tbps)
Estimated Growth in International Bandwidth Demand by Application Type
Source: Company data.
International Bandwidth Required for non-‐Big Data TrafVic (Tbps)
International Bandwidth Required for Big Data (Tbps)
Total International Bandwidth Supply (Tbps)
73

Big Data is Emerging Opportunity (cont’d)
-‐
10.00
20.00
30.00
40.00
50.00
60.00
2011 2012 2013 2014 2015 2016
(Data Center Space in million sqm)
Estimated Data Center Space Supply versus Demand with Big Data
Source: Company data
Non Big Data Space Requirement
Big Data DC Space Requirement
DC Space Supply (million sqm)
74

Big Data is Emerging Opportunity (cont’d)
-‐
100
200
300
400
500
600
700
800
2011 2012 2013 2014 2015 2016
(Data Center Power in billion kWh)
Estimated Data Center Power Supply vs. Demand with Big Data
Source: Company data
Non Big Data Power Requirement
Big Data DC Power Requirement
DC Power Supply
75

Making the Internet Work - The Internet is an aggregation of separately managed networks
- The infrastructures of these networks must physically connect in order to communicate
- Late 1990s: networks “Oibered” into access points to establish physical points for exchanging or “peering” data
Industry History
The evolution of carrier neutral colocation data centers.
Colocation Virms are positioned to beneVit from the secular growth in network trafVic.
Colocation Emerges - Modern colocation began as carrier-‐neutral points of connection for network peering
- As internet network trafOic grew, the colocation model emerged
- Enterprises began colocating servers, storage arrays and networking gear in Oiber-‐laden data centers to support mission critical, low-‐latency applications
Traditional Drivers for Data Center Outsourcing: - Corporate expansion or contraction - Changes in available IT budgets - Changing power demands and/or costs - Legislation or regulatory changes
Sources: Company data and Jones Lang LaSalle.
Industry History from Piper 2011 initiation - During the Internet/Telecom boom (1998 to 2001), there was signiOicant investment in data
- center facilities in Europe to meet expected growth in demand. This demand was expected
- to be driven largely by emerging Internet-‐based companies that would eventually need to
- expand their IT infrastructure. In many cases, these companies purchased enough space to
- ensure they had sufOicient capacity for the next several years. When the growth of many of
- these Internet-‐based companies fell well short of expectations, the data center operators
- experienced considerable churn and the industry was left with material oversupply. Since
- that time, industry capacity has been rationalized through bankruptcies and consolidation.
- Today, there are four primary network-‐neutral colocation data center operators in Europe
- and several smaller, location-‐speciOic players. In Exhibit 2, we show the top multi-‐tenant
- data center players, including non-‐network neutral operators, in Europe, the Middle East
- and Africa (EMEA), by revenue. As opposed to the late 1990s and early 2000s, demand is
- now largely driven by established companies. Additionally, data center operators build to
- meet the short-‐to-‐intermediate needs of their customers, not what they expect Oive years
- from now. Interxion typically establishes a base of customers before it commits to building
- a new data center facility. Furthermore, it usually enters into contracts for utilization of 20
- -‐ 25% of the new space on day 1 – a point at which the company typically reaches breakeven
- on an operating basis.
76
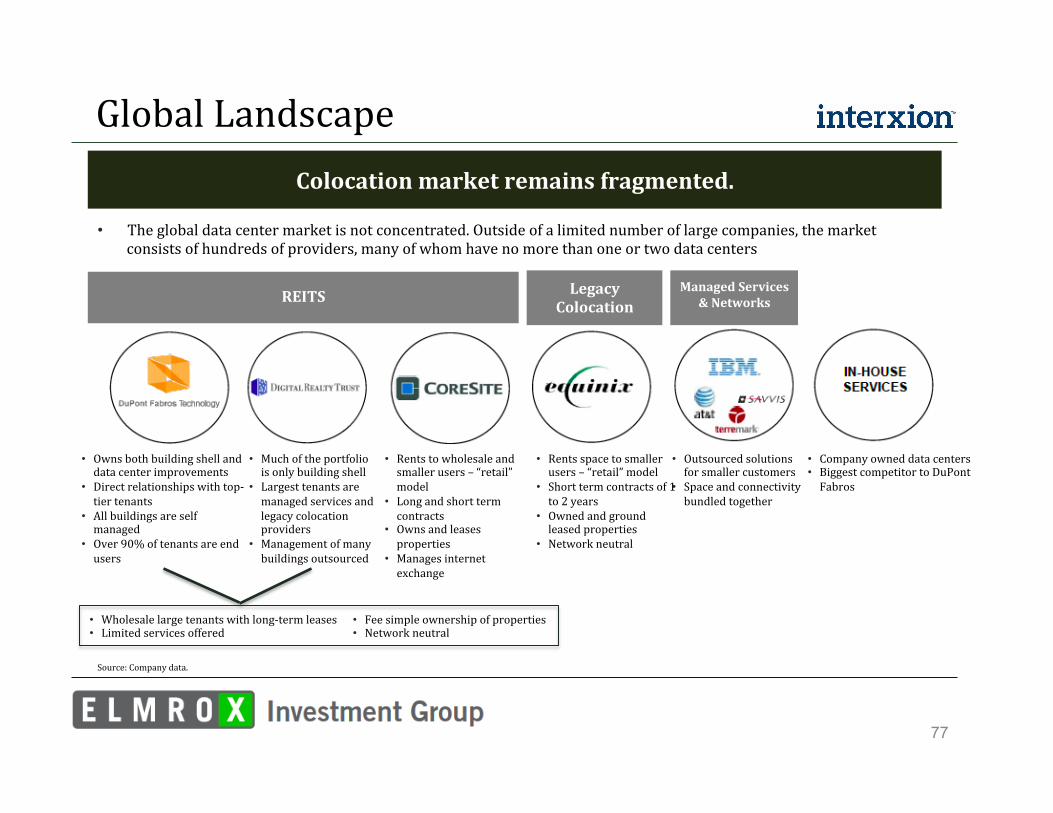
Global Landscape
Colocation market remains fragmented.
Source: Company data.
• The global data center market is not concentrated. Outside of a limited number of large companies, the market consists of hundreds of providers, many of whom have no more than one or two data centers
REITS
Legacy Colocation
Managed Services & Networks
• Owns both building shell and data center improvements
• Direct relationships with top-‐tier tenants
• All buildings are self managed
• Over 90% of tenants are end users
• Outsourced solutions for smaller customers
• Space and connectivity bundled together
• Company owned data centers • Biggest competitor to DuPont Fabros
• Rents to wholesale and smaller users – “retail” model
• Long and short term contracts
• Owns and leases properties
• Manages internet exchange
• Rents space to smaller users – “retail” model
• Short term contracts of 1 to 2 years
• Owned and ground leased properties
• Network neutral
• Much of the portfolio is only building shell
• Largest tenants are managed services and legacy colocation providers
• Management of many buildings outsourced
• Wholesale large tenants with long-‐term leases • Limited services offered
• Fee simple ownership of properties • Network neutral
77

European Competitive Landscape
There have been no Pan-‐European data center entrants in the last decade given the high barriers to entry in Europe.
Source: Company data.
• Colocation is often confused with wholesalers, and managed service providers
• Unlike the wholesale data center and managed service industries which have become increasingly competitive, the European colocation market has remained static
In-‐House
Wholesale
Network Operated
Managed Services / Cloud
Carrier & Cloud Neutral
Increasing Value Creation Through Community and Connectivity
Recent Entrants (since 2009)
Recent Entrants (since 2009)
Cost / Property Play Increasing Value Creation Through
Connectivity and Community
Various Data Centers Real Estate Network Solutions IT Solutions
Key
Operators
Focus
78

North America: Burgeoning Short Case
Consensus seems enamored with the secular demand trends yet overlooks the growing risks of oversupply in North America.
The North American data center market is much more commodity-‐like than Europe because the European market has physical constraints to capacity growth that make it challenging for new entrants especially wholesalers.
• We are increasingly concerned that the oversupplied wholesale market will lead wholesalers to encroach further on the U.S. colocation/retail market, which could damage pricing power
• U.S. wholesalers lease space directly to colocation companies such as Equinix (growing threat of wholesale disintermediation)
- Barriers to entry are much lower in North America relative to Europe given access to space, power, and Oiber networks
- Competition moving downstream
• While long investors in North American data centers have an afOinity for the well-‐known demand case, consensus seems to forgotten that given the low barriers to entry in North America that data center capacity is a commodity and the supply side is equally important
• We see a growing potential for wholesalers to disrupt the colocation market in North America
79
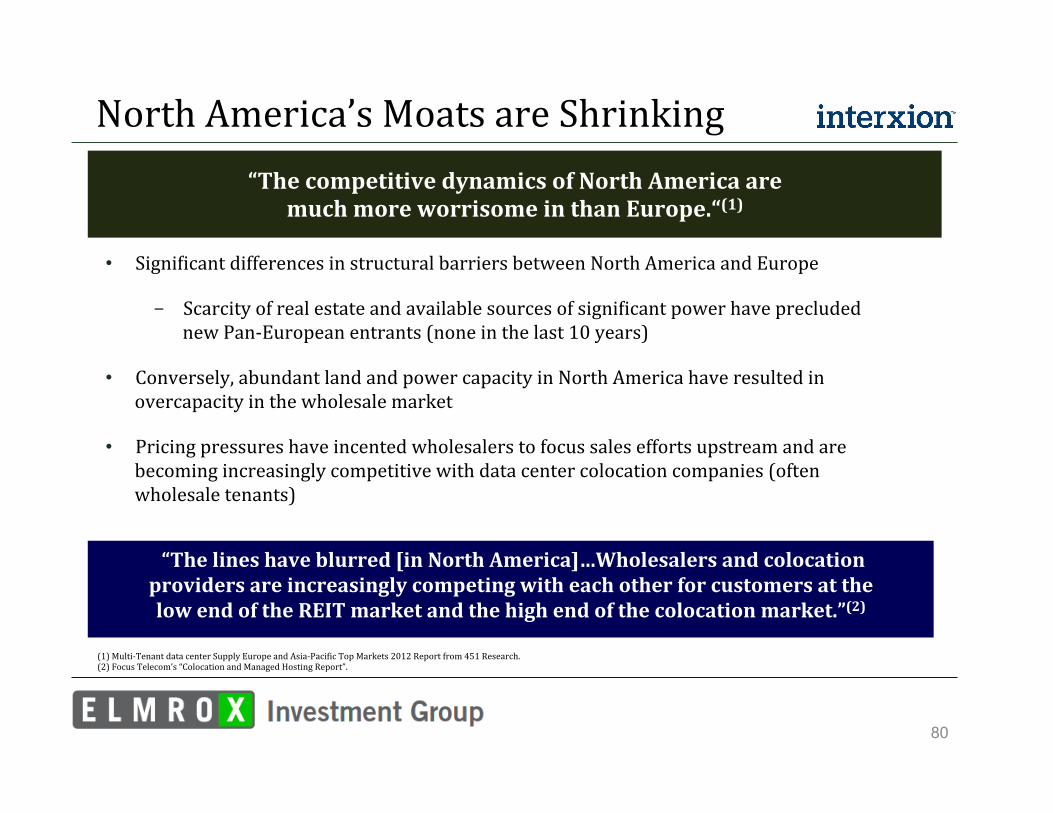
North America’s Moats are Shrinking
“The competitive dynamics of North America are much more worrisome in than Europe.“(1)
(1) Multi-‐Tenant data center Supply Europe and Asia-‐PaciOic Top Markets 2012 Report from 451 Research. (2) Focus Telecom’s “Colocation and Managed Hosting Report”.
“The lines have blurred [in North America]…Wholesalers and colocation providers are increasingly competing with each other for customers at the low end of the REIT market and the high end of the colocation market.”(2)
• SigniOicant differences in structural barriers between North America and Europe
- Scarcity of real estate and available sources of signiOicant power have precluded new Pan-‐European entrants (none in the last 10 years)
• Conversely, abundant land and power capacity in North America have resulted in overcapacity in the wholesale market
• Pricing pressures have incented wholesalers to focus sales efforts upstream and are becoming increasingly competitive with data center colocation companies (often wholesale tenants)
80

Overcapacity = Growing NA Pricing Risk
We are increasingly concerned that wholesale providers and large colocation providers will increasingly chase the same customers in North America.
(1) Avison Young Data Center Practice – Data Center Report October 2013.
• As major colocation data center cities have run out of adequate space, second and third tier markets have become increasingly attractive for capacity expansion because these cities have:
- Lower power costs
- Cheaper labor
- More available space and lower land/real estate prices
- Generally better tax regimes
- Disaster recovery sites: increasingly Oinancial institutions are placing their backup facilities at signiOicantly far distances from major cities
“Commoditization of wholesale product will drive down pricing; smaller tenants growing will also impact colocation companies adversely. Data center operators
providing solely wholesale or colocation only are a thing of the past.”(1)
81

Appendix: Management, Board & Governance

Executive OfOicers David Ruberg, Chief Executive OfGicer Mr. Ruberg joined Interxion as President and Chief Executive OfOicer in November 2007 and became Vice-‐Chairman of our Board of Directors when it became a one-‐tier board in 2011. He served as Chairman of Interxion’s Supervisory Board from 2002 to 2007 and on the Management Board from 2007 until the conversion into a one-‐tier board. From January 2002 until October 2007 he was afOiliated with Baker Capital, a private equity Oirm. From April 1993 until October 2001 he was Chairman, President and CEO of Intermedia Communications, a NASDAQ listed broadband communications services provider, as well as Chairman of its majority-‐owned subsidiary, Digex, Inc., a NASDAQ-‐listed managed web hosting company. He began his career as a scientist at AT&T Bell Labs, contributing to the development of operating systems. Mr. Ruberg serves on the boards of Adaptix, Inc., Broadview Networks, Interxion and QSC AG. He holds a Bachelors degree from Middlebury College and a Masters of Computer and Communication Sciences from the University of Michigan. Josh Joshi, Chief Financial OfGicer Before joining Interxion in 2007, Josh worked as a CFO in the e-‐commerce, network and infrastructure business for nearly a decade, including roles at two companies that are publicly traded on the London Stock Exchange – Leisure and Gaming plc and TeleCity plc. He was also one of the founders of the private equity-‐backed Storm Telecommunications Ltd. Josh has been a Oinance professional for seventeen years overall, having trained as a chartered accountant. Jaap Camman, Senior Vice President Legal Mr. Camman oined Interxion in 1999 from the Dutch government, where his roles included Deputy Head of the Insurance Division with the Netherlands Ministry of Finance. He qualiOied in law at Utrecht University. Jaap Camman provides a strategic direction in Oinance across the Interxion group, he draws on his extensive experience in corporate Oinancing, restructuring and business design. Kevin Dean, Chief Marketing OfGicer Mr. Dean joined in December 2009 from Colt Telecom where he held senior marketing roles for six years. Before that he was at Cable & Wireless, where he worked in a number of sales and marketing roles including Vice President, Marketing. Mr. Dean spent ten years in the IT industry prior to moving into communications, giving him a unique perspective on the emerging cloud computing market. He has an MBA from the Open Business School, a qualiOication in management consultancy from the Henley Management College and a degree in Applied Physics. He is a fellow of the Chartered Institute of Marketing. In driving our segment-‐focused business development, Kevin draws on his successful track record in developing and marketing services for data, voice, managed services, colocation and hosting in the global marketplace
Source: Company website.
83

Board of Directors
Baker Capital retains right to nominate majority to Board.
Source: Company website.
John C. Baker Mr. Baker founded Baker Capital in 1995 and also serves as its Chairman and Partner. Mr. Baker has more than 30 years of experience in the private equity industry, leading investments in the technology, telecom and Oinancial service industries. From 1981 to 1995, he was employed by Patricof & Co. Ventures, Inc., and served as Senior Vice President. Previously, he worked at Apax Partners, Inc., on investments in technology, telecom and Oinancial services industries including FORE Systems, Intermedia/Digex, Cadence, Resource Bancshares and Symbolics. He serves on the Boards of Digi TV Plus Oy, Wine.com, Voltaire, Ltd., Digi TV, Offermatica, and VeriOied Identity Pass. He has been the Chairman of Interxion Holding NV since January 2011, a Director of Intermedia Communications Inc. since February 1988, a Director of Xpedite Systems Inc. since June 1992, Member of Supervisory Board at QSC AG since May 31, 2012, and as a Director of FORE Systems, Inc. since December 1992. Additionally, he serves on the National Advisory Board of Youth, I.N.C. He is a graduate of Harvard College and Harvard Business School. Cees van Luijk Since 2003 Mr. van Luijk has been Chairman and co-‐managing partner of Capital-‐C Ventures, a Benelux-‐focused technology venture capital Oirm. Cees was the CEO of Getronics between 1999 and 2001 and before that a member of the Global Leadership Team at PricewaterhouseCoopers. Cees is a CertiOied Public Accountant in The Netherlands and holds a Masters Degree in Business Economics from the Erasmus University Rotterdam David Lister Mr. Lister was appointed Global Chief Information OfOicer at National Grid in March 2009. He is also a Director of National Grid's subsidiary, Utility Metering Services Limited. Before joining National Grid, David held CIO positions at a number of leading international companies, including Royal Bank of Scotland, Reuters, Boots, Glaxo Wellcome and Guinness plc. Prior to these assignments, he held a series of increasingly senior IT positions across a range of industries, including chemicals, construction and electronics as well as time in management consultancy with Coopers & Lybrand. He was a Non-‐Executive Director of IXEurope a UK-‐based colocation provider which was acquired by Equinix in 2007. David is a member of several IT consultative boards including eSkills, the Skills Sector Council for Business and Information Technology in the UK. Before entering industry, David studied architecture at the University of Edinburgh. Jean F.H.P. Mandeville From October 2008 to December 2010, Mr. Mandeville served as Chief Financial OfOicer and board member of MACH S.à.r.l. He was an Executive Vice President and Chief Financial OfOicer of Global Crossing Holdings Ltd/Global Crossing Ltd. from February 2005 to September 2008. Jean joined Global Crossing in February 2005, where he was responsible for all of its Oinancial operations. He served as Chief Financial OfOicer of Singapore Technologies Telemedia Pte. Ltd/ST Telemedia from July 2002 to January 2005. He was a Senior Consultant with Coopers & Lybrand, Belgium from 1989 to 1992. He graduated from the University Saint-‐Ignatius Antwerp with a Masters in Applied Economics in 1982 and a Special Degree in Sea Law in 1985.
84
Board of Directors (cont’d)
Source: Company website.
Robert M. Manning Mr. Manning is a general partner with Baker Capital. He was CFO of Intermedia Communications, Inc., an integrated communications service provider, from 1996 to 2001 and a director of its majority-‐owned subsidiary Digex, Inc., a provider of complex, managed, web hosting services, from 1998 to 2001. Prior to Intermedia, Robert was a founding executive of DMX, Inc., the Oirst satellite-‐ and cable-‐delivered digital radio network -‐ from 1990 to 1996. Before that, Robert worked as an investment banker to the cable television and communications industries. He serves on the boards of Broadview, Inc., PlusTV, Wine.com (Chairman) and Adaptix (Chairman). Previously, Mr. Manning served on the boards of Digex, Inc., Canal + Nordic, Adaptix, Inc. (Chairman), Broadview Networks, DigiTV Plus, Turin Networks and DMX-‐Europe. Mr. Manning also serves on the Board of Advisors of the Maritime Aquarium at Norwalk, Connecticut. Mr. Manning is a graduate of Williams College Michael Massert Mr. Massert is a former managing partner of PricewaterhouseCoopers (PWC) in Belgium where he held various positions in the Oield of audit, specialising in technology and FMCG companies and the public sector. From 1988 to 1996, he also assumed HR responsibilities for PWC Belgium. In 1997, he set up the Corporate Finance department of PWC Belgium, specialising in M&A, valuations and corporate restructuring. From 2003 to 2011, he was a director and the chairman of the audit committee of Millicom International Cellular S.A., a mobile telephone operator in emerging countries, listed on the NASDAQ and Stockholm stock exchanges. He is a former member of the Board of the Belgian Institute of Statutory Auditors. Michel is currently a professor at Solvay Brussels School of Economics and Management in Brussels, Belgium where he lectures on accounting, risk management and corporate governance. David Ruberg Mr. Ruberg joined Interxion as President and Chief Executive OfOicer in November 2007 and became Vice-‐Chairman of our Board of Directors when it became a one-‐tier board in 2011. He served as Chairman of Interxion’s Supervisory Board from 2002 to 2007 and on the Management Board from 2007 until the conversion into a one-‐tier board. From January 2002 until October 2007 he was afOiliated with Baker Capital, a private equity Oirm. From April 1993 until October 2001 he was Chairman, President and CEO of Intermedia Communications, a NASDAQ listed broadband communications services provider, as well as Chairman of its majority-‐owned subsidiary, Digex, Inc., a NASDAQ-‐listed managed web hosting company. He began his career as a scientist at AT&T Bell Labs, contributing to the development of operating systems. Mr. Ruberg serves on the boards of Adaptix, Inc., Broadview Networks, Interxion and QSC AG. He holds a Bachelors degree from Middlebury College and a Masters of Computer and Communication Sciences from the University of Michigan.
85

Shareholder Rights Agreement
Source: Company website.
Entered into with Baker Capital following IPO in 2011
As long as Baker Capital or its afOiliates continue to be the owner of shares representing:
• More than 25% of outstanding ordinary shares, Baker Capital will have the right to designate for nomination a majority of the members of the board of directors, including the right to nominate the chairman
• Less than or equal to 25% but more than 15% of the outstanding ordinary shares, Baker Capital will have the right to designate for nomination three of the seven members of the Board, at least one of whom shall satisfy the criteria for independent directors
• Less than or equal to 15% but more than 10% of the outstanding ordinary shares, Baker Capital will have the right to designate for nomination two of the seven members of the Board, none of whom shall be required to be independent
• Less than or equal to 10% but more than 5% of the outstanding ordinary shares, Baker Capital will have the right to designate for nomination one of the seven members of Board, who shall not be required to be independent
86

Appendix: Elmrox Investment Group

Biography Daniel W. Lawrence, Managing Partner & Founder Daniel was most recently a Managing Director and co-‐founder of Talara Capital Management, a long/short equity partnership where he focused on the consumer, energy, materials, industrials, and transportation industries. (2009 –2013) Previously, Daniel was a Senior Analyst at Citadel Investment Group. His primary responsibilities were to conduct fundamental research and analyze a range of value, high yield, and distressed investments in various sectors, including consumer, materials, Oinancials and technology. Daniel invested in both the equity and debt of publicly traded businesses as well as structured private transactions (2005-‐2009). Prior to Citadel, Daniel was an investment banking Analyst at Merrill Lynch in New York within the Global Multi-‐Industry Group where he advised industrial corporations on mergers and acquisitions and corporate Oinance transactions. Prior to that, Daniel was an Analyst in Equity Derivatives (2002-‐2005). Daniel earned a B.S. in Commerce from the McIntire School of Commerce at the University of Virginia (2002). He has since been a guest Oinance lecturer at the University and participates in the Galant Center for Entrepreneurship. Daniel has served on the Board of Directors of SUS since 2009, a non-‐proOit organization that focuses on a range of challenges including AIDS, mental illness, developmental disability, and homelessness, particularly U.S. Veterans in New York City. Daniel founded Elmrox Media LLC in 2009 and remains the Oirm’s Principal Owner. Elmrox is a global media company whose goal is to become a premier content brand for 18 to 34 year olds in the United States over the next ten years. He is also a former coach for the Iona Preparatory School Speech & Debate Team, where he coached several national champions. His personal interests include CrossOit, American history and U.S. foreign policy, cinema and great oratory.
88