producer driven solutions
TRANSCRIPT
1
Smart Ag
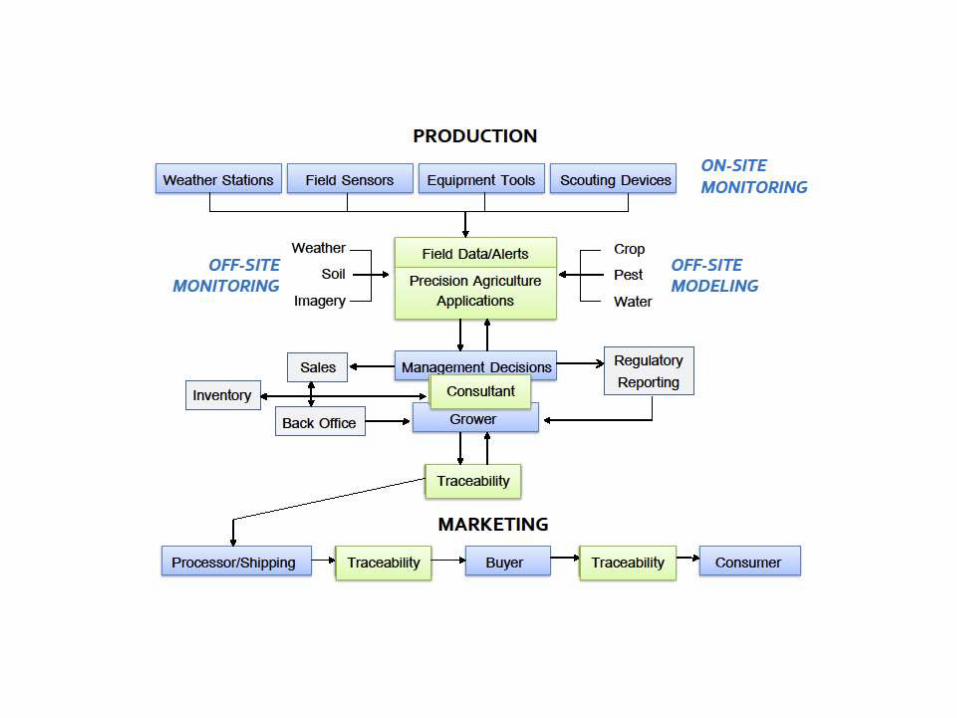
Grower
Weather Stations Field Sensors Equipment Tools Scouting Devices
Field Data/AlertsPrecision Agriculture
Applications
ON-SITEMONITORING
PRODUCTION
MARKETING
Management DecisionsConsultant
Sales
Back OfficeInventory
RegulatoryReporting
Traceability
Processor/Shipping Buyer ConsumerTraceability
OFF-SITEMODELING
WeatherSoil
Imagery
CropPestWater
OFF-SITEMONITORING
Traceability

Producer-Driven Outcomes Using innovation to reduce water consumption and preserve production
Producer-Driven
Outcomes
Innovative ways to increase production
and reduce water consumption

PRECISION AGRICULTUREUsing technology to manage variability within fields to optimize profits, resources and sustainability.

A Change in Focus
• From increasing
yields on every
acre of a field
to….
• Maximizing
production on
acres with the
most potential

Step 1: Map out the field
• Identify soils
with similar
capabilities
Each color represents a different
type of soil.
SOURCE: NRCS Soil Survey.

Step 1: Map out the field
• Precision Soil
Testing uses
EC (Electrical
Conductivity) to
measure water
holding capacity
of different soils. SOURCE: CropMetrics.

Step 1: Map out the field
• Precision Maps:
EC mapping
using GPS
technology
provides more
detailed soil
maps.
NRCS Soil map
EC Soil map

Step 1: Map out the field
• Elevation maps
provide useful
information on
slope
Red = Lower Elevation Blue = Higher Elevation
EC Soil map

Step 2: Management Zones
• Similar soils are
grouped into
management zones
for site specific
management of:
EC Soil map
Fertilizer Mix
• Fertilizer

Step 2: Management Zones
• Soil and elevation
maps determine
management zones
for site specific
management of:
EC Soil map Elevation
• Seeding rate
Seeding Rate

Step 2: Management Zones
• EC or water holding
capacity of the
different soils
determines variable
rate irrigation plan
using:
EC Soil map
Speed Control
• Speed Control
Zone Control
• Zone Control
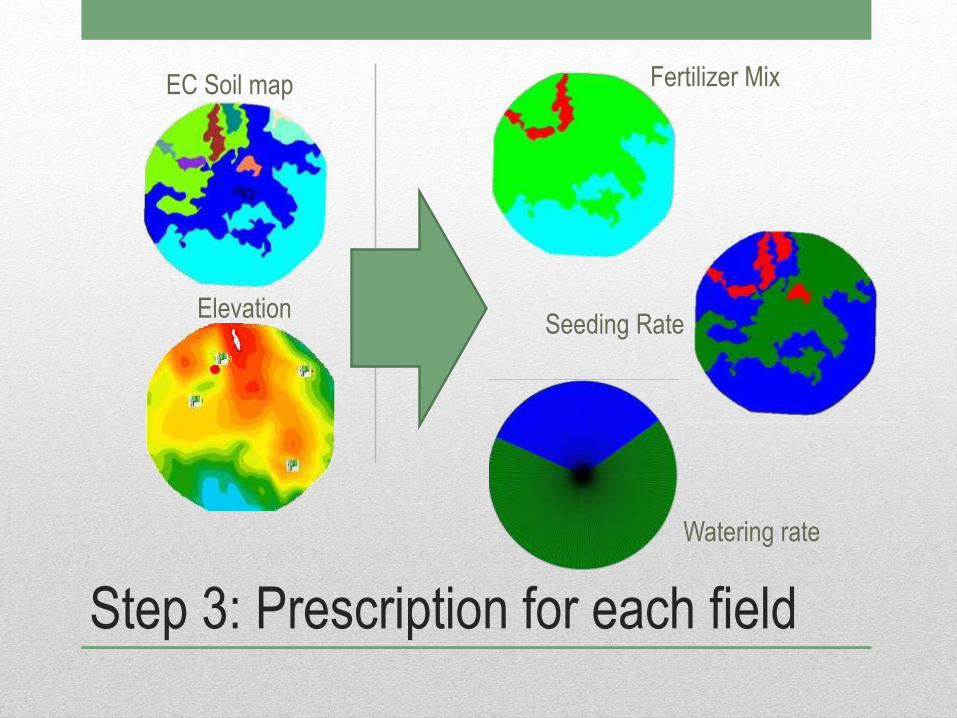
Step 3: Prescription for each field
EC Soil map
Elevation
Fertilizer Mix
Seeding Rate
Watering rate
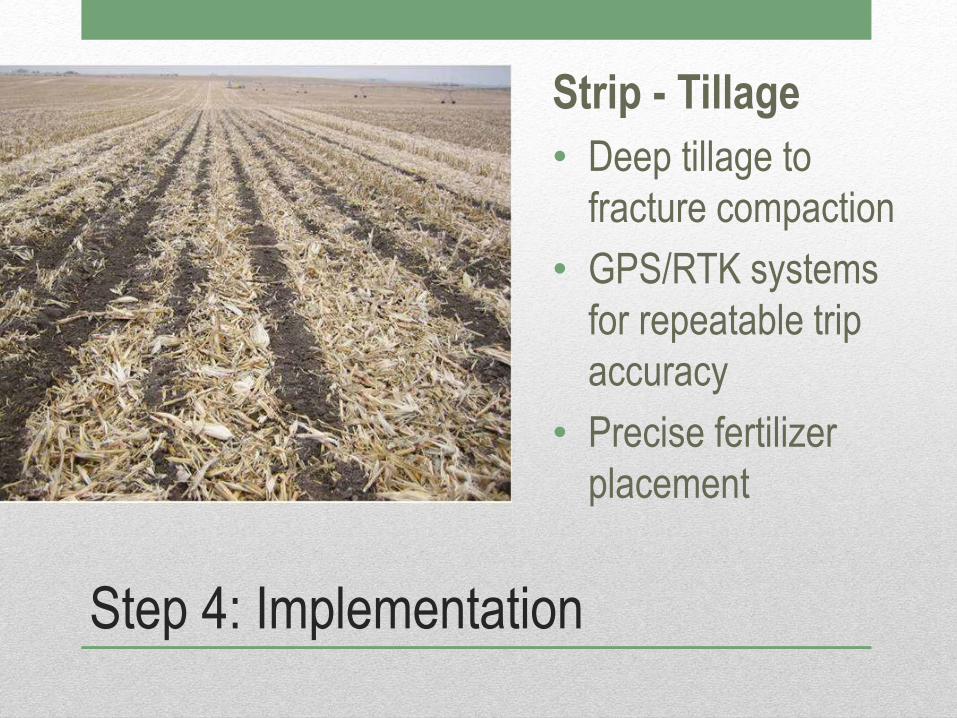
Step 4: Implementation
Strip - Tillage
• Deep tillage to
fracture compaction
• GPS/RTK systems
for repeatable trip
accuracy
• Precise fertilizer
placement
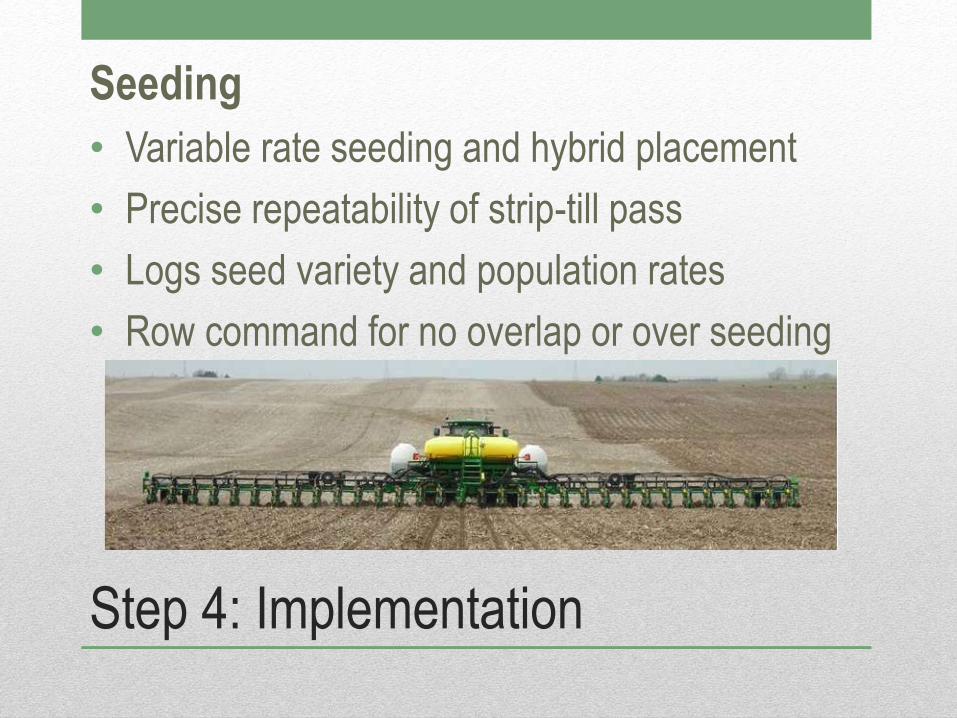
Step 4: Implementation
Seeding
• Variable rate seeding and hybrid placement
• Precise repeatability of strip-till pass
• Logs seed variety and population rates
• Row command for no overlap or over seeding

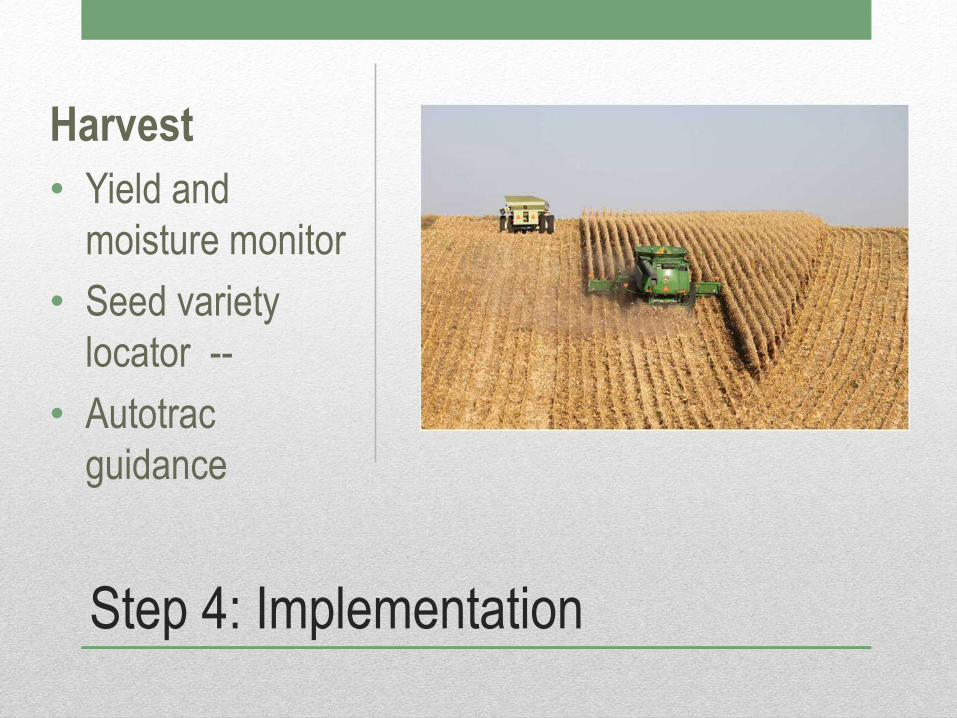
Step 4: Implementation
Herbicide
• Swath control
• Rate control
• Site specific chemicals
Step 4: Implementation
Harvest
• Yield and
moisture monitor
• Seed variety
locator --
• Autotrac
guidance

Step 5: Analyzing the Results
Historical Corn Yields:
2009 2010 2011
Bu.
250+
230
210
190
170
150
130
110
90
70
50
<50

WATER SAVINGSPrecision agriculture can help you save water and reduce energy costs
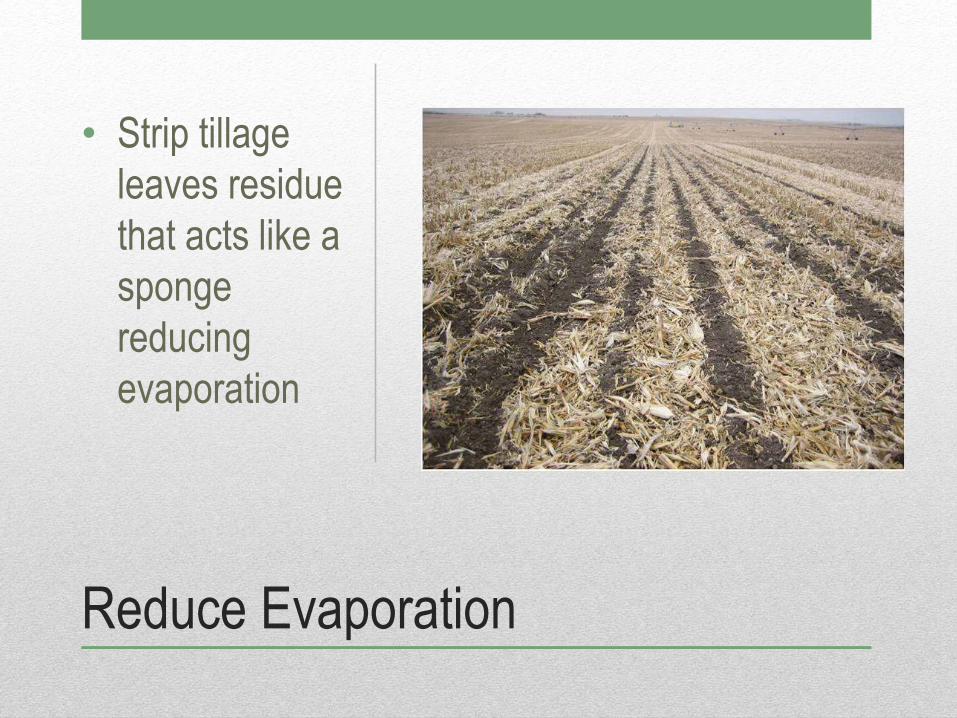
Reduce Evaporation
• Strip tillage
leaves residue
that acts like a
sponge
reducing
evaporation

Reduce Evaporation
• Sub-surface
drip irrigation
delivers water
and nutrients
directly to the
root zone
Reduce Water Pumped
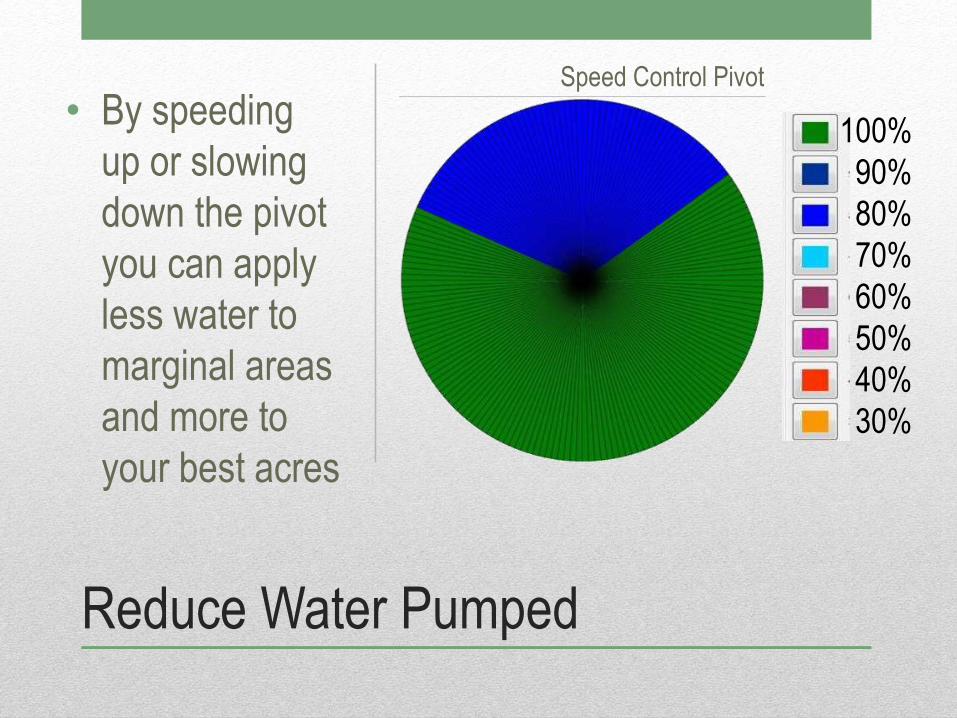
• By speeding
up or slowing
down the pivot
you can apply
less water to
marginal areas
and more to
your best acres
100%
90%
80%
70%
60%
50%
40%
30%
Speed Control Pivot

Reduce Water Pumped
• Pivot nozzles use GPS mapping to adjust amount of water applied on certain soils or for particular seed varieties
100%
90%
80%
70%
60%
50%
40%
30%
Zone Control Pivot
Reduce Water Pumped
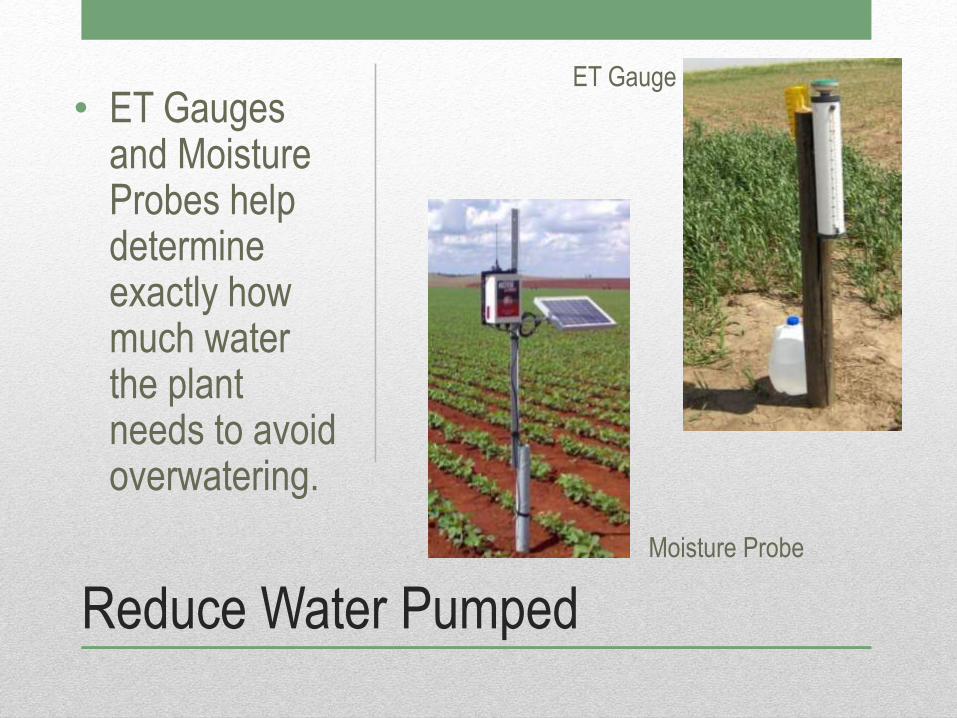
• ET Gauges and Moisture Probes help determine exactly how much water the plant needs to avoid overwatering.
ET Gauge
Moisture Probe

Integrate and evaluate traditional mechanical meters and ultrasonic flow meters and power line carrier (PLC) through power districts
Traditional Comparisions

Field
152 A
255 A
76 A
135 A
128 A
130 A
NRD
MRNRD
MRNRD
MRNRD
MRNRD
URNRD
URNRD
2008
11.1
8.1
7.5
11.0
9.4
10.45
2009
10.3
10.7
4.8
1.3
4.76
4.52
2010
11.7
11.1
8.9
2.7
12.96
9.49
2011
7.8
7.1
7.3
10.0
10.07
7.01
Crop
Black
Black
Black
Corn
Corn
Corn
2011
7.58
7.09
6.78
10.71
8.75
6.54
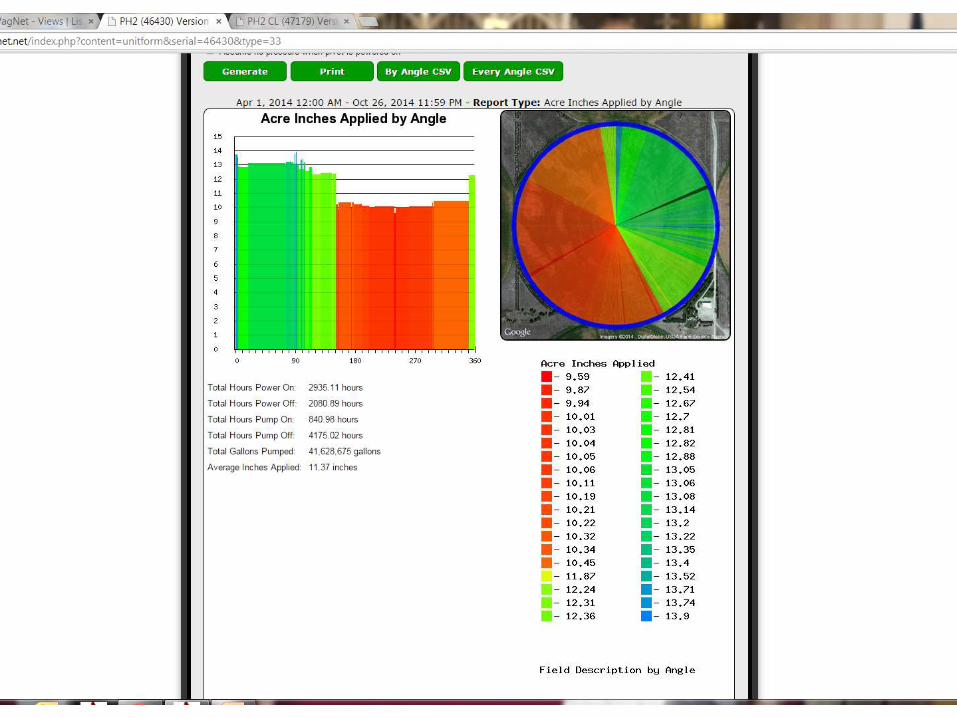
Acre Inches Pumped Flow Meter
Water Use Per Year
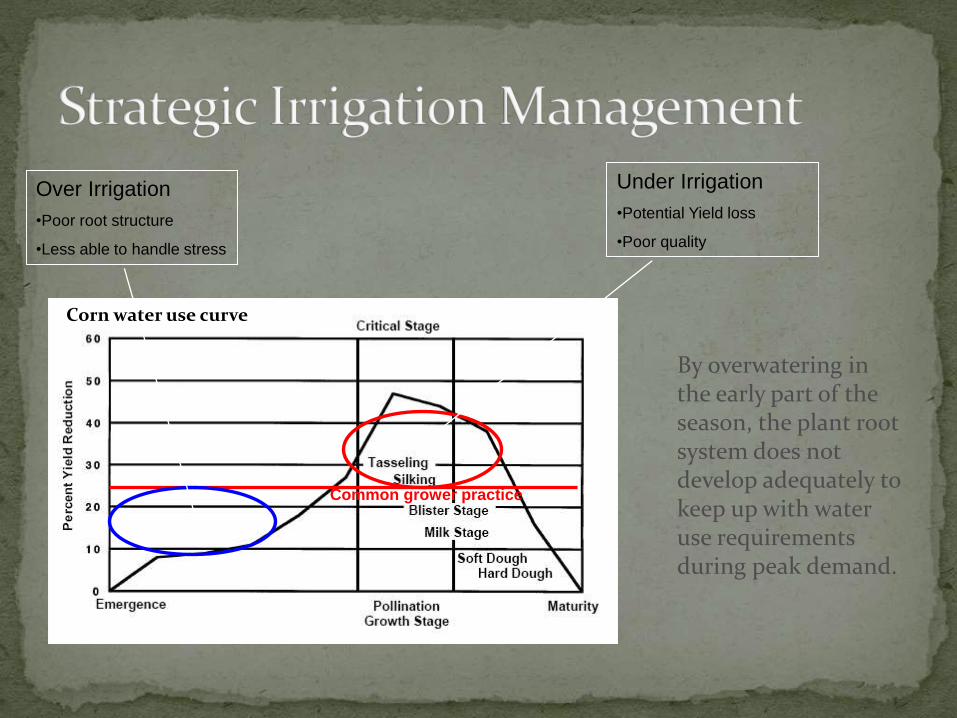
Over Irrigation
•Poor root structure
•Less able to handle stress
Under Irrigation
•Potential Yield loss
•Poor quality
Common grower practice
Corn water use curve
By overwatering in the early part of the season, the plant root system does not develop adequately to keep up with water use requirements during peak demand.

Reduce Water Pumped
• Opportunity to save water and build stronger roots
Save
Water


Reduce Water Pumped
FULL
REFILL
• Tendency to keep fields too wet

NE-Roric Paulman-PH 5-Corn•Season started out with full moisture profile due to early rains.• Water uptake only down to 12” on July 14.•40” deep rain on Aug 9-10 filled profile. •Frequent irrigations, mostly to 4-8”, kept up with crop demand, but did not allow deep root activity. Could have saved 2-3 irrigations in July. Slow pivot down & less frequently.•Subsurface moisture was not well utilized .•Possible leaching of nutrients from Aug 10 rain.

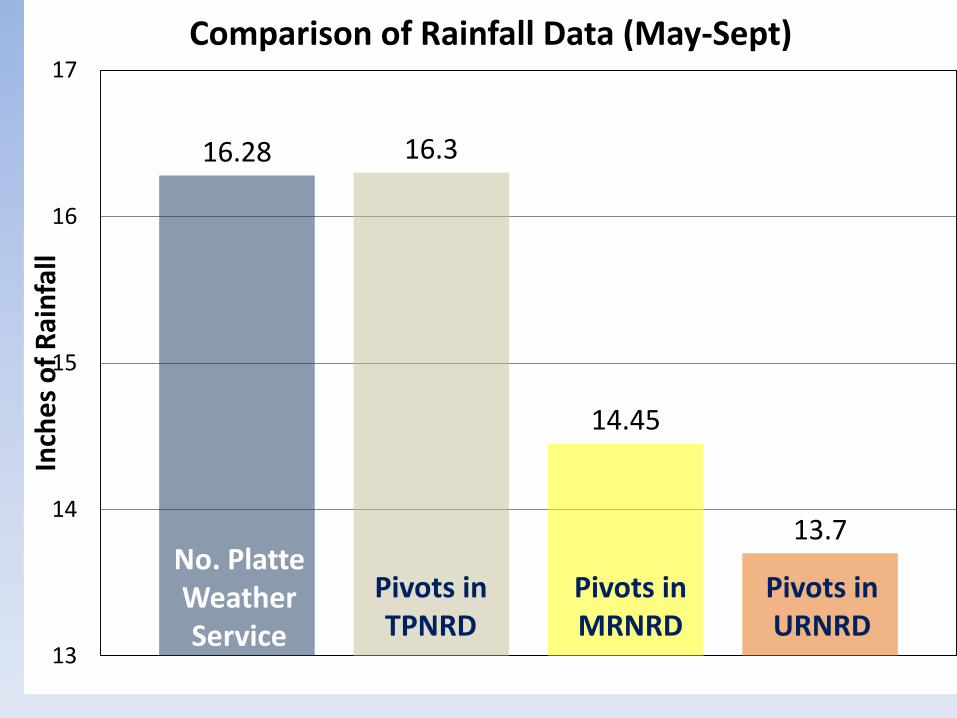
16.28 16.3
14.45
13.7
13
14
15
16
17In
che
s o
f R
ain
fall
Comparison of Rainfall Data (May-Sept)
No. Platte Weather Service
Pivots in TPNRD
Pivots in MRNRD
Pivots in URNRD
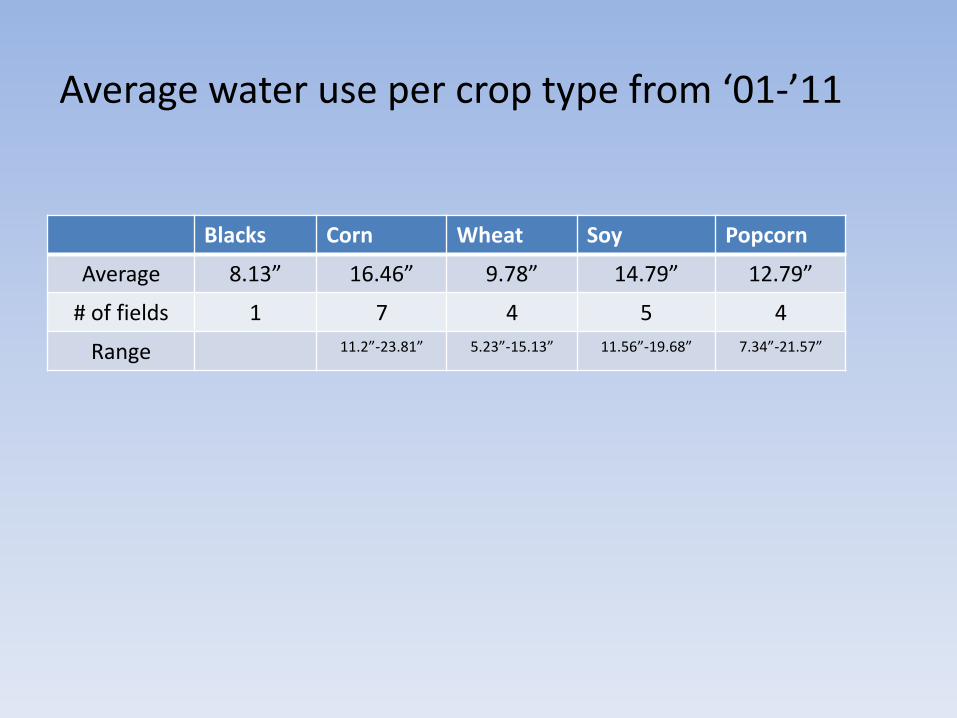
Average water use per crop type from ‘01-’11
Blacks Corn Wheat Soy Popcorn
Average 8.13” 16.46” 9.78” 14.79” 12.79”
# of fields 1 7 4 5 4
Range 11.2”-23.81” 5.23”-15.13” 11.56”-19.68” 7.34”-21.57”
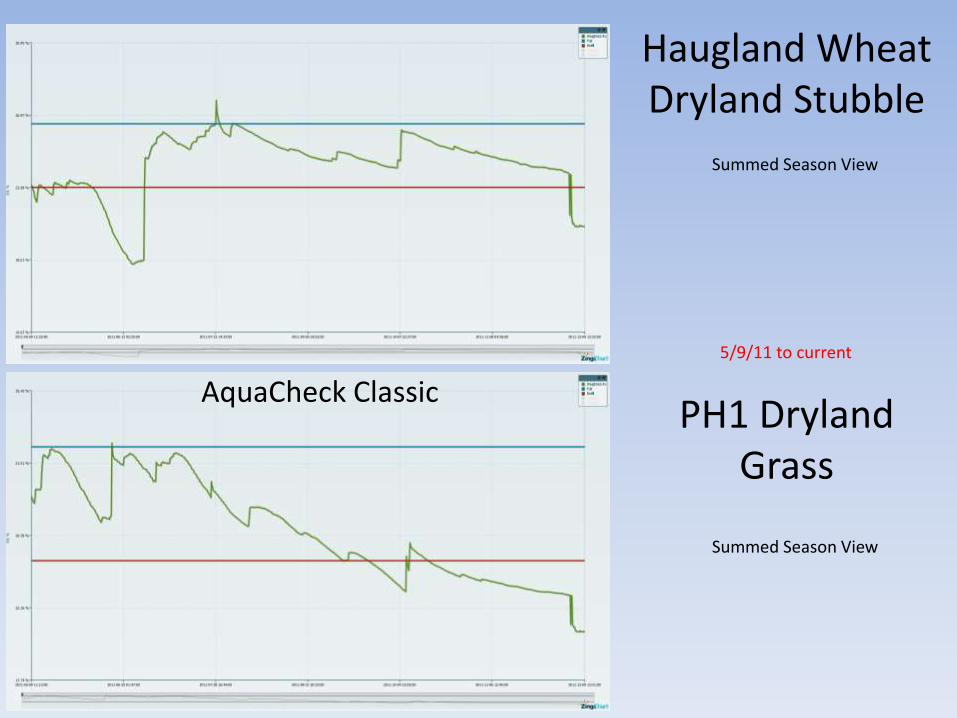
Haugland WheatDryland Stubble
Summed Season View
AquaCheck Classic
Summed Season View
PH1 DrylandGrass
5/9/11 to current

WATER FOR THE FUTURENot only can we save on water costs –
We can build a legacy of water for future generations

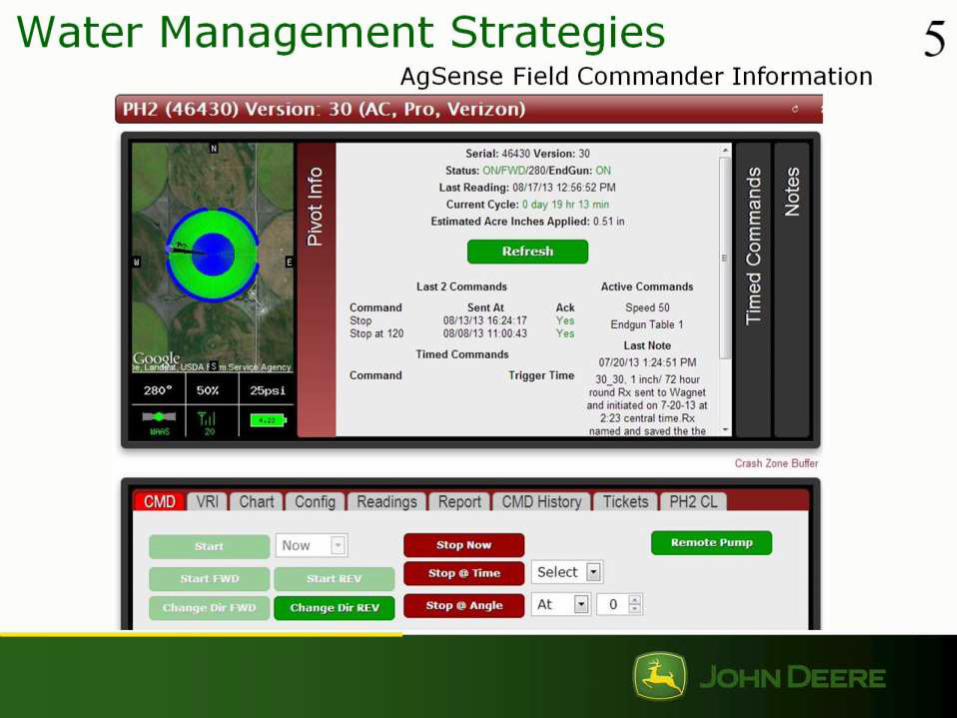
2013 Water for Generations“Real Time” Demonstration Project
Testing technologies that
offer real time data on:
• Water the crop is using
• Water being pumped
• Water in soil profile
Weather Stations –Tracking precipitation, relative
humidity, temperature, wind
Moisture ProbesReal time reporting of
moisture levels and
movement of water in the soil.
Pumping DataContinuous pumping data on pivots with
flow meters or calculated with pressure
transducers and ultrasonic flow meters.
Compare to power company readings.
Remote Pivot ControllersTransmit real time data to phone,
computer, iPad for 24-7 access
Soil SamplesTrack nitrogen
movement and how
roots use water in soil
Satellite imageryMatch images with
tissue samples.
Possibilities
for watershed
management.

2013 Water for Generations30/30 Grower Behavior Study
This study gives growers an opportunity to
experience how variable rate irrigation can be used
to reduce overwatering and energy costs.
Equip pivot with variable
speed controlTo apply different rates of water
– slow over light soils, faster
over heavy soils.
Map water holding capacityEM mapping of soil densities.
30/30 irrigation prescriptionFlat rate irrigation on grower sectors.
Variable rate prescription on study sectors.
Apply 10% less water in study sectors.
Live data to
growers
Virtual Optimizer
website
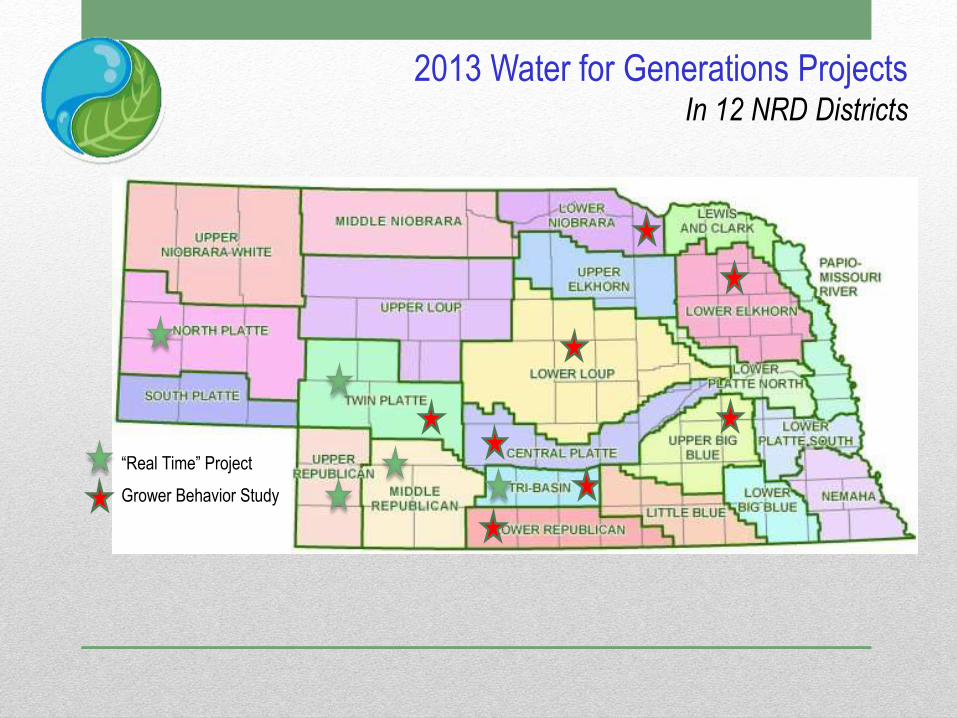
2013 Water for Generations ProjectsIn 12 NRD Districts
“Real Time” Project
Grower Behavior Study

www.nebraskawaterbalance.com

Nebraska Water
Water for Generations Partners

Questions?