producivity trends in natral resources indusries in canada · 2004-03-02 · productivity trends in...
TRANSCRIPT
111 Sparks Street, Suite 500 Ottawa, Ontario K1P 5B5
Tel: 613-233-8891 – Fax: 613-233-8250 [email protected]
Productivity Trends
in Natural Resources Industries in Canada
Final Report: February 7, 2003 CSLS Research Report 2003-01
Report prepared by The Centre for the Study of Living Standards
for Natural Resources Canada
2
Table of Contents Executive Summary .............................................................................................. 5
I. Introduction ...................................................................................................... 11
II. Setting the Context for Understanding Natural Resource Productivity Trends ..................................................................................................... 13
A. Why Productivity Growth Is Important .................................................. 13 B. Conceptual Issues.................................................................................... 14 1) Partial versus total factor productivity.......................................... 14 2) Output per worker versus output per hour................................... 15 3) Productivity levels versus growth rates ........................................ 16 4) Cyclical behaviour of productivity ............................................... 17 C. Data Sources ........................................................................................... 17 D. Importance of the Natural Resource Sector ............................................ 18
III. Drivers of Productivity Growth in the Natural Resources Sector................. 19
A. Measurement Problems........................................................................... 19 B. Compositional Shifts in Labour Output.................................................. 20 C. Capital intensity of Production ............................................................... 20 D. Factor Prices............................................................................................ 23 E. Educational Attainment .......................................................................... 23 F. Innovation and Technological Progress.................................................. 24 G Output Prices........................................................................................... 26 H. Capacity Utilization ................................................................................ 27 I. Size Distribution of Plants and Economies of Scale............................... 28 J. Unionization............................................................................................ 29 K. Workplace Safety.................................................................................... 30 L. Regulation............................................................................................... 31 M. Quality of Natural Resources.................................................................. 31 N. Foreign Direct Investment ...................................................................... 32
IV. Productivity Trends and Determinants in Canadian Natural Resource Industries................................................................................. 32
A. Overview of Productivity Trends............................................................ 33 B. All Industries........................................................................................... 34 C. Energy Sector.......................................................................................... 35 1) Energy aggregate .......................................................................... 35 2) Crude petroleum and natural gas industries ................................. 36 3) Refined petroleum and coal products ........................................... 37 4) Pipeline transport.......................................................................... 38 5) Electric power systems ................................................................. 38 6) Natural gas distribution ................................................................ 39 7) Service industries incidental to mineral extraction....................... 40 D. Mining..................................................................................................... 40 1) Total mining ................................................................................. 41 2) Metal mines .................................................................................. 42
3
3) Gold mines.................................................................................... 42 4) Iron mines ..................................................................................... 42 5) Non-metallic mines....................................................................... 43 6) Salt mines ..................................................................................... 43 7) Coal mines .................................................................................... 44 E. Manufacturing Industries Processing Mineral Products ......................... 44 1) Primary metals.............................................................................. 45 2) Non-metallic mineral products ..................................................... 45 3) Fabricated metals.......................................................................... 46 4) Motor vehicle parts....................................................................... 47 5) Total manufacturing ..................................................................... 47 F. Forest Sector ........................................................................................... 48 1) Forest sector aggregate ................................................................. 49 2) Forestry and logging..................................................................... 50 3) Wood products.............................................................................. 54 4) Paper products .............................................................................. 57
V. Productivity Performance of Canadian Natural Resources Industries from an International Perspective .......................................... 61
A. Comparison of Canada-US Productivity Levels in Natural Resource Industries ............................................................................ 61
B. Comparison of Canada-US Productivity Growth in Natural Resources Processing Manufacturing Industries ................................................. 62
C. International Perspectives on Natural Resources Productivity Growth.. 63 1) Groningen estimates ..................................................................... 63 2) Statistics Finland estimates........................................................... 64
VI. Research Findings, Agenda for Further Research and Conclusion .............. 66 A. Research Findings................................................................................... 66
1) General findings........................................................... 66 2) Industry specific observations....................................... 68
B. Agenda for Further Productivity Research ............................................. 69 C. Conclusion .............................................................................................. 71 References........................................................................................................... 72 Appendix 1: Comparison of SIC and NAICS Employment and Output Estimates........... 74 List of Exhibits.................................................................................................... 79 Exhibits ......................................................................................................... 80 List of Tables ...................................................................................................... 97 Tables............................................................................................................ 100 List of Charts....................................................................................................... 98 Charts ............................................................................................................ 111 List of Appendix Tables...................................................................................... 142 List of Appendix Charts...................................................................................... 155 Note: Appendix Tables and Charts are posted at www.csls.ca under Reports.

4
5
Productivity Trends in Natural Resource Industries
in Canada
EXECUTIVE SUMMARY Productivity is the key factor behind growth in living standards. The natural resources
sector, broadly defined, accounted for 13.0 per cent of Canada’s GDP and 6.3 per cent of employment in 2000. It supports economic activity outside major urban centres and is also responsible for a large share of Canadian exports.. The long-term health of the sector is dependent on its strong productivity performance. The objective of this report is to provide an overview of the evolution of productivity in the natural resources industries in Canada over the last 40 years.
This report presents data and discusses trends in labour and total factor productivity for
natural resources industries in Canada over the 1961-2000 period. It also examines the major determinants of these trends. Industries covered by the report are: the energy industries, including crude petroleum and natural gas extraction, refined petroleum and coal products, pipeline transport, and gas distribution systems; forest sector industries, including forestry and logging, wood products and paper products; mining; and manufacturing industries involved with the processing of mineral products, including primary metals, non-metallic mineral products, metal fabrication, and motor vehicle parts. Where available, Statistics Canada has been the source of the data used. As no estimates of total factor productivity for these industries were available from Statistics Canada when the report was written, the Centre for the Study of Living Standards (CSLS) has produced these series.
The study uses a simple neoclassical growth accounting approach to decompose labour
productivity growth into total factor productivity growth and increases in the capital intensity of production, or capital-labour ratio. Labour productivity is defined as the real output per unit of labour input. Capital productivity is defined as real output per unit of capital input. Total factor productivity growth is calculated as the difference between the growth rate of real output and that of total inputs, where the growth of capital and labour are weighted by their respective income shares in value added, to construct an index of total inputs.
The report is divided into five main sections. The first sets the context for the discussion of productivity trends and determinants in the natural resource sector by: examining why productivity growth is crucial for the economy and society; reviewing key conceptual issues essential for an understanding of productivity; discussing data sources; and the importance of the natural resource sector for the Canadian economy.
The second section discusses the various drivers of productivity growh, with particular
reference to natural resource industries. Factors reviewed are: measurement problems, compositional shifts, capital intensity of production, factor prices, educational attainment, innovation and technological progress, output prices, capacity utilization, size of distribution plants and economies of scale, unionization, workplace safety, regulation, quality of natural resources, and foreign direct investment. Data on trends in these factors in Canadian natural
6
resource industries are presented. The third section presents productivity trends in the energy sector, the forest products
sector, and in mining and related mineral processing industries. It focuses on both long-term developments defined as the 1961-2000 period and more recent developments, defined as the 1989-2000 period. This section also identifies the most important productivity trends in each industry and offers an explanation of these developments where possible.
The fourth section provides an international perspective on productivity developments in
Canadian natural resource industries, comparing Canada-US productivity levels and growth rates as well as growth rates within selected OECD countries. The fifth and final section summarizes the main findings and outlines areas for further research.
The research findings of the report are highlighted below.
• A first key finding is that natural resources industries tend to have above average labour
productivity levels and in some cases extremely above average levels. In 2000, only two of 20 natural resource industries (wood products and asbestos mining) had a level of output per hour below the all-industries average. The average labour productivity level of all natural resource industries was almost twice the all-industry average and the average productivity level of the primary natural resources industries was almost three times the all-industries average. The above average capital intensity of production in natural resource industries as well as high wages account for these high labour productivity levels.
• A second key finding is that both labour and total factor productivity (TFP) growth in
natural resource industries has tended to be above the all-industries average. In the 1961-2000 period, 15 of the 17 natural resource industries experienced faster labour productivity growth than the all-industries average and 12 experienced faster TFP growth. In the more recent 1989-2000 period, again the vast majority of natural resource industries experienced above average labour productivity growth (13 out of 17) and TFP growth (11 out of 17 industries). The ability of firms to substitute capital for labour in the production processes of natural resources industries accounts for the superior productivity performance of the sector.
• Labour productivity levels measured in physical terms were higher in Canada than in the
United States for four of five natural resource extractive industries for which comparable data are available: gold, iron ore, uranium, and oil and gas. In terms of manufacturing industries processing natural resources, Canada had lower levels of labour and total factor productivity than the United States in 1995 in four of six industries. Output per hour in Canada exceeded that of the United States in petroleum refining (122 per cent) and lumber and wood (104 per cent), but was below that of the United States in primary metals (94 per cent), stone, clay and glass (77 per cent), paper (71 per cent), and fabricated metals (64 per cent).
• Data from Statistics Finland indicate that the Finnish paper and wood products sectors
have greatly outperformed both their Canadian and US counterparts in terms of labour
7
and total factor productivity growth since 1975 and in the 1990s. • The highly productive nature of natural resource industries and their above average
productivity growth means that the natural resource sector contributes disproportionately to the economy. For this reason, the expansion of the natural resource sector is highly desirable, but it is constrained by both supply-side and demand-side factors. The sector’s above average productivity growth also means that the sector does not directly generate large numbers of jobs and experiences a long-term decline in its share of total employment. However, the indirect or spinoff employment created from natural resources activities can be substantial.
• Natural resource industries experience large cyclical fluctuations in both output and
productivity. For example, the weak demand conditions in the early 1990s resulted in a cyclical downturn in productivity in many natural resource industries. The return to robust demand growth in the second half of the decade lead to a cyclical rebound in productivity growth.
• By far, the worst period for productivity growth in the last 40 years was the 1973-81
period when output per hour fell 5.17 per cent per year in the energy sector and 2.67 per cent per year in the mining sector. This negative productivity growth was explained by the large increases in both energy and mineral prices after 1973. It lead to the rapid growth of labour and capital inputs for exploration activities which, while having long-term positive effects on productivity growth in the short to medium terms, can reduce measured productivity.
• A key development in the 1990s was the weakness of investment and hence capital stock
growth in the natural resource industries. Over the 1989-2000 period, the capital stock fell at a 3.69 per cent average annual rate in the mining sector, 1.47 per cent in the forest sector and advanced at only a weak 1.55 per cent in the energy sector. As much technological change is embodied in the capital stock, this weakness in capital accumulation may have had negative consequences for productivity growth in the natural resource industries.
• The above average productivity growth in natural resource industries over the 1976-2000
period has reflected the increased qualifications of the workforce. The proportion of workers in natural resources industries with post-secondary education has increased from less than 15 per cent in 1976 (the earliest year for which data are available on educational attainment from the Labour Force Survey) to over 40 per cent by 2000.
• Two factors which appear not to have contributed significantly to productivity growth in
natural resources industries include capacity utilization (which had no over all trend in this period), and composition shifts in employment within sectors. Measurement problems also appear to not be particularly important in the sector.
• The net impact on productivity growth in natural resource industries from government
regulation, unionization, workplace safety, economies of scale and foreign direct investment is not known with any degree of certainty, but appears to be relatively small.
8
Key industry specific research findings are highlighted below.
• The one natural resource industry that experienced extremely poor labour productivity
growth over the 1961-2000 period was petroleum and natural gas extraction. This development is relatively simple to explain. The very large increase in oil prices after 1973 made profitable the exploitation of less productive deposits and intensified exploration activity, with a negative effect on productivity growth in the 1970s and 1980s.
• The motor vehicle parts industry enjoyed extremely robust productivity growth over the
1961-2000 period, with output per hour increasing 6-fold and almost equal gains in total factor productivity.
• The natural resource industry with the most impressive productivity performance over the
1961-2000 period was coal mines. Output per hour increased 14-fold over the 39 year period. Total factor productivity gains were almost equally impressive. The shift from underground to open pit mining operations accounts for much of this development.
• A key development in the 1990s has been the deterioration of the labour productivity
performance of the logging and forestry and wood products industries. Increased prices for wood products may account for some of this development as firms can profitably use less productive resources, lowering average productivity.
• In contrast to developments in the logging and forestry and wood products industries, the
productivity performance of the paper products industry in the 1990s has improved significantly. The factors behind this situation are poorly understood.
The report also identifies a number of priorities for further research, as outlined below.
• A first priority is to document the current knowledge base of our understanding of productivity trends and drivers in the energy and mining and related mineral processing industries through a survey of the productivity literature for these sectors published in Canada and other countries.
• As the characteristics and nature of certain natural resource industries vary greatly by
region and province, a second priority is the development of a data set of reliable estimates of productivity trends for natural resource industries at the provincial level.
• As long-run productivity growth is largely driven by technological innovations, a third
priority is to identify and document the key innovations and technological developments that have increased productivity growth in recent decades and to estimate the impact of these innovations on productivity. Probably the most effective manner to accomplish this is through interviews with industry experts.
• A fourth research priority is the analysis of the impact of public policy on past and future
9
productivity trends in natural resources industries in Canada. Public policy areas that are particularly relevant for the productivity performance of natural resource industries include tax policy, trade policy, education and training policy, infrastructure policy, and environmental regulation policy.
• A fifth research priority is the integration of sustainable development objectives into
productivity analysis of the natural resource industries. This involves the development of productivity measures in the natural resources industries that take account of externalities, such as carbon dioxide emissions, air pollution, water pollution, and tailings which are negative for the economy and society.
Conclusions The key conclusion of the report is that most natural resources industries have
outperformed the all-industries average in terms of both labour productivity and total factor productivity since 1961. This is not a surprising result. Natural resource industries, like most goods-producing industries, have the potential for gains in labour productivity through mechanization and the associated substitution of capital for labour. This potential productivity growth may be less in certain service activities, particularly personal and business services where personal relationships between service provider and purchaser are important. These industries experience low trend productivity growth, and result in industries with more potential for productivity advance posting above average productivity gains.
The productivity picture in the Canadian natural resources sector is not entirely rosy. The
forestry and logging and wood products sector experienced negative labour productivity growth in the 1990s and a number of mining industries have experienced below average labour productivity growth. Labour productivity levels in four of six manufacturing industries that process natural resources have labour productivty levels below their US counterparts. The Canadian wood and paper products industries have been greatly outperformed by their Finnish counterpart in terms of productivity growth in the 1990s.

10
11
Trends in Productivity in Natural Resource Industries in Canada1
I. Introduction Productivity is the key factor behind the growth in living standards. Without increases in
the amount each worker is able to produce, there would be no increase in the real wages and incomes of Canadians. Future increases in our living standards are thus dependent on productivity gains (Sharpe, 2002a). Productivity growth is also important for keeping unit cost increases low and maintaining the competitiveness of Canadian products on world markets.
The natural resources sector, broadly defined, accounted for 13.0 per cent of Canada’s
GDP and nearly 6.3 per cent of employment in 2000. It is also responsible for a large share of Canadian exports and supports economic activity outside major urban centres. The long-term health of the sector is dependent on its strong productivity performance. The objective of this report is to provide an overview of the evolution of productivity in the natural resources industries in Canada over the last 40 years.
This report presents data and discusses trends in labour and total factor productivity for
natural resources industries in Canada over the 1961-2000 period. It also examines the drivers or determinants of these trends. Industries covered are: the energy sector or industries, including crude petroleum and natural gas extraction, refined petroleum and coal products, pipeline transport, and gas distribution systems; forest sector industries,2 including forestry and logging, wood products and paper products; and mining and manufacturing industries involved with the processing of mineral products, including primary metals, non-metallic mineral products, metal fabrication, and motor vehicle parts. It should be noted that the report does not, unfortunately, examine productivity trends in the earth science industry. As noted by the Earth Sciences Branch of Natural Resources Canada, NAICS/SIC codes do not capture the earth science activity (geoscience and geomatics industries) as a separate industry and consequently traditional productivity analysis of the sector is not possible.3 1 The Centre for the Study of Living Standards would like to thank a number of Natural Resource Canada officials who have provided comments on the interim report, and Tim Norris in particular for coordinating the project. The report was written by Andrew Sharpe with research assistance from Olivier Guilbaud, Kirsten Robertson and Jeremy Smith. This report is supplemented by a comprehensive set of appendix tables (247 tables) providing information on natural resource industries in Canada over the 1961-2000 period. The tables are posted at www.csls.ca under Reports. 2 The discussion of productivity trends in the forest products sector draws on two recent reports that the Centre for the Study of Living Standards did for the Forest Products Association of Canada (CSLS, 2002a and 2002b). 3 In some areas of earth science activity, NAICS codes exist, but surveys are not being carried out to put data behind them. In other areas, some of the earth science industry activity is captured, but as part of a larger definition, (e.g. 51121, Software Publishers: includes firms developing and /or publishing GIS, CAD or remote sensing software) and the earth sciences activity cannot be readily separated out after the fact. Furthermore, the value of analysing the earth science industries in terms of traditional productivity measures is debatable. The final product from the earth science industries is knowledge and the value of knowledge is difficult to measure in terms of "tons of product per man-hour" or "units of production per dollar invested". The value of knowledge lies in the decisions that are made based on the knowledge and the subsequent tradition of informed decision making that we will hopefully pass to future generations. The methodology for identifying and measuring the value of better decisions (and attributing
12
This report provides estimates of labour productivity (output per hour), capital
productivity, and total factor productivity on the basis of the 1980 Standard Industrial Classification (SIC) for a large number of natural resource industries for Canada for the 1961-2000 period and cyclically neutral sub-periods. Where available, Statistics Canada has been the source of the data used. As no estimates of total factor productivity for these industries are currently available from Statistics Canada, the Centre for the Study of Living Standards (CSLS) has produced these series.
The study uses a simple neoclassical growth accounting approach to decompose labour
productivity growth into total factor productivity growth and increases in the capital intensity of production, or capital-labour ratio. Labour productivity is defined as the real output per unit of labour input. Capital productivity is defined as real output per unit of capital input. Total factor productivity growth is calculated as the difference between the growth rate of real output and that of total inputs where the growth of capital and labour are weighted by their respective income shares in value added to construct an index of total inputs. The latter measure of productivity is a residual or catch-all concept that encompasses all influences on labour productivity growth except capital deepening. From the point of view of raising wages and living standards, labour productivity is the more relevant concept of productivity. From the point of view of efficiency in the use of resources, total factor productivity is more relevant. The report is divided into five main sections (excluding the introduction).
• The first section sets the context for the discussion of productivity trends and determinants in the natural resource sector by examining why productivity growth is crucial for the economy and society, reviewing key conceptual issues essential for an understanding of productivity, discussing data sources, and the importance of the natural resource sector for the Canadian economy.
• The second section discusses the various drivers of productivity growth, with
particular reference to natural resource industries. Factors reviewed are measurement problems, capital intensity of production, educational attainment, technological progress, compositional shifts, output prices, capacity utilization, regulation, quality of natural resources, economies of scale, unionization, workplace safety, and foreign direct investment. Data on trends in these factors in Canadian natural resource industries are presented.
• The third section presents productivity trends in the energy sector, the forest products
sector, and in mining and related mineral processing industries. It focuses on both long-term developments defined as the 1961-2000 period and more recent developments, defined as the 1989-2000 period. This section also identifies the most important productivity trends in each industry and offers an explanation of these developments where possible.
them to one single knowledge factor or apportioning them to a list of knowledge factors) is not well developed as far as we are aware.
13
• The fourth section provides an international perspective on productivity developments in Canadian natural resource industries, comparing Canada-US productivity levels and growth rates as well as growth rates within selected OECD countries.
• The fifth and final section summarizes the main findings and outlines areas for future
research. II. Setting the Context for Understanding Natural Resource Productivity
Trends
A. Why Productivity Growth is Important
Productivity is the relationship between the output of goods and services and the inputs of
resources, human and non-human used in the production process, with the relationship usually expressed in ratio form. Both outputs and inputs are measured in physical volumes and thus are unaffected by price changes. Multiplying quantities of the various outputs and inputs by the price each has commanded in a base year yields the comparable or constant price values that can be added up to provide measures of aggregate output and input.4 The ratios may relate to the national economy, to an industry, to a firm or even to a plant. Output growth that exceeds growth in measured inputs, that is to say an increase in the ratio of output to inputs, is what analysts mean when they say productivity is increasing.
Productivity growth is the most important source of long-term economic growth. From
1946 to 2000 real GDP per hour growth – the productivity of labour – accounted for 65 per cent of real GDP output growth in the business sector in Canada, with growth in total hours worked – an input which itself was growing rapidly – accounting for the remaining 35 per cent (Sharpe, 2002a).
Over the long term, increased productivity is the only way to increase the standard of
living of Canadians, defined as real GDP per capita. Per capita income growth can come from increases in the employment-total population ratio, reflecting increased labour force participation, lower unemployment or a larger share of population of working age, or from improved terms of trade. But these sources of income growth are unsustainable in the long run as they have upper bounds (except possibly for the terms of trade). Productivity growth, on the other hand, is not constrained by the size of the population or other factors and its growth, at least in principle, is sustainable through technological advance.
Thus, trends in productivity are the key determinant of long-run trends in both absolute
and relative living standards. The fall-off in real income growth in Canada and other developed economies since 1973 is a direct result of slower productivity growth. The decline in Canada’s 4 It should be noted that with the recent adoption by Statistics Canada of chain-Fisher indexes, the components of real GDP no longer add up exactly to real GDP.
14
living standards in the 1990s, relative to those in the United States, is largely attributable to our weaker labour productivity growth. Slower increases in the amount of output each worker produces means that there is slower growth in the output or income that can be shared among the total population.
The magnitude of the productivity growth estimates that economists debate, almost
always below three percent for the aggregate economy, may seem small or even trivial to non-economists. But small differences matter and the implications for society between a 1 and 3 per cent trend productivity growth rate are huge. Based on the mathematical rule of 72, a one per cent productivity growth scenario means that it will take 72 years or three generations for real output and hence income per worker to double. In contrast, under a 3 per cent productivity scenario it would take only 24 years or one generation for real income to double. Even moving from a 1 to 2 per cent trend productivity growth world, a distinct possibility discussed later in the paper, cuts in half (to 36 years) the time needed to double living standards.
There is, of course, much more to life than productivity and the real income growth it
generates, as even economists realize. The economic well-being and quality of life of the population, much broader concepts than GDP per capita, are determined by many factors, of which productivity is only one. A focus on productivity by no means indicates that economists consider these other determinants of well-being and quality of life unimportant. Economists study productivity because it is key to real income growth and important for improving economic well-being and quality of life, or at least its material aspects. They also believe that a better understanding of productivity trends and determinants can lead to the development of public policies and private sector actions that can improve productivity performance. B. Conceptual Issues Related to Productivity
This section reviews four key productivity concepts needed for an understanding of the
productivity debate.5
1) Partial versus total factor productivity A fundamental distinction is made between partial and total productivity measures. The
former relate output to only one input, more often labour and capital, although intermediate goods or raw materials also regularly figure in some compilation of inputs, even though it is recognized that other inputs contributed to output. Labour productivity is the best known partial productivity measure. The latter relate output to a combination of inputs, such as capital and labour. These measures are known as total factor or multifactor productivity and represent the growth in output not accounted for by input growth.
The most readily available and widely used measure of productivity is labour
productivity, the ratio of output to some measure of labour input (employment or hours). This term sometimes creates confusion as it may seem to imply that the level of labour productivity or the rate of growth of labour productivity is attributable solely to the effects of labour. In fact, labour productivity reflects the influence of all factors that affect productivity, including capital 5 This section draws on Sharpe (2002b).
15
accumulation, technical change, and the organization of production. While the intensity of labour effort is obviously a factor that does affect labour productivity, it is generally significantly less important than the amount of capital a worker has to work with or the level of production technology.
The concept of total or multi-factor productivity has been developed to measure the
contribution of all factors of production to productivity growth. The rates of growth of all inputs are weighted to give one growth rate for the combined inputs. Total factor productivity growth is defined as the growth rate of output minus the growth rate of the combined inputs (just as labour productivity growth equals output growth minus labour input growth). As the growth rate of the capital stock is generally greater than that of employment (and hence the capital/labour ratio is rising), the growth rate of total factor productivity (using labour and capital as inputs) is generally less than the growth rate of labour productivity. This situation arises from the fact that the growth rate of the combined inputs of capital and labour exceeds that of labour alone.
A key issue in total factor productivity measurement is the weighting of these inputs.
Under competitive conditions, the current dollar income share of the factor of production – labour income for hours worked and interest, gross capital income (profits, and depreciation) for the capital stock – is normally considered the relative contribution of the factor to output and consequently used to weight the factor to produce an index of total input, or the growth rate of the index. When markets are not competitive, as in the case of monopolies, the weighting issue is much more complex.
The meaning of total factor productivity is also controversial. Some economists interpret
it as a measure of overall technical change, others as a measure of disembodied technological change, that is technical change that is not embodied in new machinery and equipment, and still others argue that TFP is in no way a measure of technological change (Lispey and Carlaw, 2000).
It is incorrect to say that total factor productivity is a superior or preferred measure of
productivity compared to labour productivity as the two concepts serve different purposes. For those interested in how efficiently all factors of production are used in the production process, total factor productivity is the relevant productivity measure since it takes account of the productivity of factors of production other than labour, such as capital, intermediate goods, and energy. For those interested in the potential of the economy to raise the standard of living, labour productivity is the relevant productivity measure. It tells us how much output or income is produced by each worker and when combined with the total number of workers, how much total income there is to be distributed among the population. 2) Output per worker versus output per hour
Labour input can be measured either in terms of the average annual number of workers or
in terms of the number of total hours worked in a year. This second measure is the more appropriate concept of labour productivity since it represents a more precise measure of labour input than persons employed. It is always important to specify which concept of labour productivity is being used. The growth rates of output per worker and output per hour may differ when there is a change in the hours worked over time. Indeed, historically the large fall in

16
average working time has meant that output per hour has grown significantly faster than output per worker.
Equally, international productivity comparison may differ greatly when annual hours
worked vary across countries. The greater annual hours put in by American workers compared to those in many European countries means that productivity measures based on output per worker portray U.S. productivity levels in a much more favourable light than measures based on the more relevant output per hour. For example on an output per person employed basis, in 2001 Norway’s GDP per person employed was 81.5 per cent of that in the United States, but on an output per hour basis it was 110.6 per cent, a 29.1 percentage point difference. The Netherlands also had a very large difference between the two productivity measures – 28.4 points from 73.4 per cent of the US level for output per person employed to 101.8 per cent per hour worked.
3) Productivity levels versus growth rates
A second important distinction is that between productivity levels and growth rates. The
former refers to the output per unit of input at a given point in time. For example, in 2000 the level or value of output per hour in the business sector in Canada was $29.14, expressed in constant 1992 prices. The latter represents the percentage change in output per hour levels, expressed in constant prices, between two points in time. An example would be the 13.6 per cent increase in labour productivity between 1989 and 2000, when the level of output per hour was $25.65. One often hears the complaint that Canada’s productivity is poor. This could be referring to a situation of a low aggregate productivity level or a low productivity growth rate, or both. It is important that commentators specify whether they are referring to levels or growth rates as the implications of the two situations can differ significantly.
International comparison of productivity levels requires that levels expressed in a
domestic currency be converted into a common currency. This conversion can be done with either market exchange rates or exchange rates based on purchasing power parities (PPPs), that is the exchange rate that equalizes the price of a basket of goods and services between two countries. For accurate productivity level comparisons, it is imperative that PPPs be used, although the development of reliable PPPs is a complex task, particularly at the industry level.6 The existence of a range of PPPs produced by different agencies and researchers means that there is a range for relative international productivity level estimates.
6 The construction of PPPs requires comparisons of prices across countries. Internationally consistent surveys on the prices of goods and services in expenditure categories have been carried out by the OECD on a regular basis, so estimates of PPPs for GDP and consumer expenditure are available. However, there are no surveys of product prices as estimates of PPPs for industry output are much harder to compile.
17
4) Cyclical behaviour of productivity The short- to medium- term movement of productivity is determined by two influences –
an underlying productivity trend and a cyclical component. Over the long term, the cyclical component is offsetting, with cyclical upturns canceling out cyclical downturns so that actual productivity growth tends to converge on trend growth. Actual productivity growth between cyclical output peaks provides an approximation of trend productivity, although average capacity utilization over the cycle and differences in capacity utilization at the peaks may also influence the trend.
The short-term behavior of labour productivity is explained by lags in the adjustment of
labour input to changes in output. If labour input adjusted simultaneously to changes in output, productivity growth would always be at trend. Lags in the adjustment of labour input, both employment and total hours worked, are due to a number of factors, including firms' unfulfilled expectations concerning demand conditions, the existence of overhead labour which is relatively invariant to output levels, and a tendency for firms to hoard skilled labour in downturns in order not to lose their investment.
For the reasons outlined above, the rate of change in output per worker tends to move in a
procyclical pattern, declining below trend in downturns and rising above trend in recoveries. The rate of change in output per hour shows a slightly more dampened procyclical movement, as it is easier to adjust average weekly hours through short-time or overtime than it is to adjust employment levels. Total factor productivity, which includes the capital stock as well as labour as an input, exhibits even greater procyclical variation in movement than output per worker because of the fixity of the capital input.
Two implications arise from this cyclical behaviour of productivity. First, one should not
extrapolate long-term productivity trends from short-term developments. With the Canadian economy in 2001 entering a period of weak growth due to falling aggregate demand, slower productivity growth can be expected for cyclical reasons. This does not mean that long-term productivity growth has necessarily deteriorated as any productivity shortfall now can be recovered later in the cycle. Second, to minimize the impact of cyclical influences on productivity, growth rates should be calculated at comparable points of the cycle, preferably on a peak-to-peak basis.
C. Data Sources
This study will largely rely on the estimates of real output (value added), employment,
hours, and output per hour produced by Statistics Canada as part of its Aggregate Productivity Measures (APM) program. Estimates for this series are available at the national level only, from 1961 to 1997 or 2000, depending on the sector and are largely consistent with the 1980 Standard Industrial Classification (SIC). A Laspeyres fixed weights price index was used by Statistics Canada to calculate output estimates in constant dollars for all series. For industries where the series ends in 1997, estimates for the 1998-2000 period have been made for output from output growth rates from the Industry Division’s National Accounts series and for labour input from the Labour Force Survey.
18
The APM series do not include estimates on the capital stock nor, at this time, estimates of total factor productivity based on value-added. This study has used capital stock estimates produced by the Capital Stock Division of Statistics Canada based on the perpetual inventory method. They are expressed in 1992 dollars, based on 1980 SIC and available from 1961 to 1999 at the national level. The series was extended to 2000 based on the growth rate of the 1989-1999 sub-period. The series is based on end year net stock Laspeyres estimates, using a geometric depreciation assumption.
Total factor productivity (TFP) growth is the difference between output growth and a
weighted average of input growth (labour and capital) where the weights are the cost shares of the inputs in value added. The Centre for the Study of Living Standards has calculated the TFP estimates presented in this report from the indexes of real output and total hours worked produced in the APM series, indexes of capital stock from the Capital Stock Division of Statistics Canada and the average share of labour compensation in value added over the 1961-2000 period which is used to weight hours growth and unity minus the labour compensation share to weight capital stock growth. This series runs from 1961 to 2000 and is only available at the national level.
D. Importance of the Natural Resource Sector in 2000
Exhibit 1 provides estimates of value added (output)7 and employment in natural resource
industries in Canada in 2000, and value added and employment shares represented by these industries in the total economy. A number of observations can be made.
• The total natural resource sector, broadly defined to include metal fabricating but
excluding motor vehicle parts, produced nearly $100 billion (1992 dollars) in output (value added) and employed nearly one millon persons (953 thousand) in 2000.
• The natural resource sector in 2000 accounted for 13.0 per cent of total economy
GDP, but only 6.3 per cent of total employment. The much greater importance of value added is largely explained by the energy sector, which accounted for 6.6 per cent of value added, but only 1.2 per cent of employment.
• In terms of the three major natural resources sectors of energy, forest products, and
mining and mineral-related manufacturing industries, the energy sector was the most important in terms of output, accounting for 6.6 per cent of GDP. It was followed by mining and mineral-related manufacturing industries (3.9 per cent) and forest products (2.5 per cent)
• In terms of employment, mining and mineral-related manufacturing industries was
the most important natural resource sector, acounting for 2.8 per cent of total economy employment. It was followed by the forest sector (2.2 per cent) and energy (1.2 per cent).
• The primary industries component of the natural resource sector, defined to include
7 Throughout this report the terms value added and output will be used interchangeably.
19
only crude petroleum and natural gas extraction, services incidental to mineral extraction, mining, quarry and sandpits industries and logging and forestry, represented 4.3 per cent of total economy GDP and 1.4 per cent of total economy employment in 2000. It accounted for about one third (33.0 per cent) of the value added in the natural resource sector and about one fifth (22.2 per cent) of the employment. The crude petroleum and natural gas extraction industry accounted for over half of the value added in the primary industry component of the natural resource sector.
III. Drivers of Productivity
Productivity growth is determined by a large number of factors or drivers (Harris, 2002
and Sharpe, 2002b). This section provides a brief discussion of the most important determinants of productivity growth, examines trends in these variables in natural resource industries in Canada over the 1961-2000 period and in the 1990s, and comments on the general relevance of these factors to explain productivity trends in the natural resources industries. Then in the next section, these factors are used where appropriate to explain productivity trends in specific natural resource industries. The 14 factors discussed are: measurement problems; compositional shifts in labour input; capital intensity of production; factor prices; educational attainment; innovation and technological progress; output prices; capacity utilization; size distribution of plants and economies of scale; unionization; workplace safety; regulation; quality of resources; and foreign direct investment.
A. Measurement Problems
Before beginning the discussion of trends in productivity growth and the drivers of this growth, it is important to at least mention the issue of productivity measurement. If Statistics Canada is not capturing the true productivity trends because of mismeaurement of real output or labour or capital input, then attempts to explain these trends are for nought. Indeed, the reliability of measured productivity trends are extremely dependent on the availability of high quality data, including the estimates on current dollar output, price deflators, capital stock, and hours worked.
Fortunately, it appears that measurement problems are less severe in natural resource
industries than in other sectors, such as services sectors where there is no marketed output or the definition of output is problematic, or high-tech goods-producing sectors where the introduction of new products and large quality improvements in existing products make the estimation of price indexes and, hence constant price output estimates, difficult. In natural resources industries, by contrast, the output produced by an industry has a physical dimension than can be expressed in real units of output (i.e., tons of coal) or be readily calculated from current dollar output data and relatively reliable price indices.
For this reason, it will be assumed throughout this report that Statistics Canada estimates
of real output, labour input, and capital stock for natural resource industries are reliable and that the resulting productivity estimates are capturing true productivity levels and trends. It should be mentioned however that Natural Resources Canada officials have noted that Statistics Canada
20
estimates of logging output prior to 1990 may not accurately reflect “true output values” as they were derived from inferred product values and not reported timber harvests. No attempt has been made to adjust output estimates to correct this measurement problem.
B. Compositional Shifts in Labour Input
The level of labour productivity in a sector is a weighted average of the productivity
levels in the sub-industries that comprise the sector, with shares of labour input (generally total hours worked) used to weight the levels. The growth rate of labour productivity is the change in the level of labour productivity over time. If a below-average productivity level sub-industry sees its share of labour input rise as a consequence of an above average growth rate for labour input, the sector’s labour productivity level and growth rate will be lower than would have been the case if the sub-industry’s share had been constant. Conversely, if an above-average productivity level sub-industry sees its share of labour input rise as a consequence of an above average growth rate for labour input, the sector’s labour productivity level and growth rate will be higher than would have been the case if the sub-industry’s share had been constant.
The impact of compositional labour input shifts have been calculated for mining and four
natural resource processing manufacturing industries: primary metals, non-metallic mineral products, wood products, and paper products. The results are discussed in the next section under each sector. In general, it was found that compositional shifts within these industries had little impact on the industry’s labour productivity growth over the 1961-2000 period. This situation reflected two factors. First, labour productivity levels for sub-industries within an industry were comparable. Industry reallocations of labour have no compositional effect on productivity levels if productivity level differences between sub-industries are small. Second, the relative importance of the industries that experienced large increases in their labour input shares were small so reallocation of labour had little effect on the industry’s labour productivity growth even if there were significant differences in labour productivty levels between sub-industries. C. Capital Intensity of Production
The capital intensity of production is defined as the amount of capital stock with which
each worker works. As noted earlier in the report, labour productivity can be decomposed into total factor productivity growth and changes in the capital-labour ratio by basic growth accounting techniques. In a neoclassical framework, total factor productivity growth is the difference between output growth and a weighted average of input (labour and capital) growth where the weights are the income shares. Thus labour productivity growth can be decomposed into the contribution from additional capital deepening (increases in the capital-labour ratio) and other factors, which fall under the concept of total factor productivity. Growth in total factor productivity is equal to labour productivity growth minus the rate of growth of the capital-labour ratio, weighted by the share of capital in total income.
Thus, if capital-labour ratio growth is positive, labour productivity growth will exceed
total factor productivity growth while if capital-labour growth is negative, total factor productivity growth will exceed labour productivity growth. Only if capital-labour ratio growth is zero will total factor productivity growth equal labour productivity growth
21
Exhibit 10 presents estimates of the contribution of changes in capital intensity to labour productivity growth (and the contribution of total factor productivity which with changes in capital intensity must sum to unity) in Canadian natural resource industries for the 1961-2000 period. Exhibit 11 presents estimates for the 1989-2000 period. A number of observations can be made.
• For all industries, increased capital intensity accounted for less than one-fifth of the
1.79 per cent average annual rate of increase in output per hour over the 1961-2000 period, while total factor productivity growth accounted for the remaining four-fifths (1.49 per cent).
• The contribution of increased capital intensity to labour productivity growth in
natural resources industries over the 1961-2000 period ranged widely. In 11 industries the contribution exceeded the all industries relative contribution of 17 per cent and in eight industries the contribution was less than 17 per cent.
• Increased capital intensity made the largest relative contribution to labour
productivity growth over the 1961-2000 period in gold mines (109.0 per cent), followed by gas distribution systems (67.5 per cent), mining (51.3 per cent), paper products (49.1 per cent), iron mines (38.2 per cent), and the energy sector (37.8 per cent). Changes in the capital intensity made a negative contribution to labour productivity growth (that is, the capital-labour ratio fell in absolute terms) in pipeline transport (-27.5 per cent), logging and forestry (-7.2 per cent), salt mines (-8.1 per cent), and crude petroleum and natural gas (-1.6 per cent).
• For all industries, increased capital intensity did not contribute to the increase in
output per hour over the 1989-2000 period, while total factor productivity growth accounted for all of it.
• The contribution of increased capital intensity to labour productivity growth in
natural resources industries over the 1989-2000 period again ranged widely. In eight industries the contribution was positive while in 11 industries the contribution was negative.
• Increased capital intensity made the largest positive relative contribution to labour
productivity growth over the 1989-2000 period in iron mines (137.3 per cent), followed by gas distribution systems (116.1 per cent), crude petroleum and natural gas (103.5 per cent), pipeline transport (93.8 per cent), and the energy sector (53.8 per cent). Changes in the capital intensity made the largest negative contribution to labour productivity growth (that is, the capital-labour ratio fell in absolute terms) in salt mines (-503.2 per cent), mining (-102.4 per cent), forest products (-79.2 per cent), logging and forestry (-95.6 per cent), wood products (-52.7 per cent), and coal mines (-42.6 per cent).
22
Economic theory suggests a range of potential explanations for different trends observed in the evolution of the capital-labour ratios in natural resource industries.8 No single theory is regarded as being the “best” single explanation. However, it is useful to list the alternatives. Different explanations carry potentially quite different policy implications, as well as influencing the interpretation one gives to the historical productivity statistics.
• The simplest textbook answer, which relies on the Solow neoclassical growth model, is that TFP growth differs by industry. A slower rate of TFP growth in certain industries induces a slower pace of investment. Note that by this explanation the accounting decomposition of labour productivity growth into changes in capital intensity and total factor productivity is misleading, since virtually all productivity growth is ultimately attributable to differences in TFP growth.
• The factor cost hypothesis. Changes in relative factor prices affect factor proportions.
The relative prices of labour and capital inputs influence the investment and hiring decisions of firms. An increase in the price of labour relative to capital, all other things constant, leads employers to substitute capital for labour in production, although this adjustment is by no means instantaneous and can be subject to long lags. Therefore, a declining growth rate of the price of capital relative to labour affects the pace at which capital is substituted for labour. Since Canadian natural resource industries to a large degree face similar factor prices and changes in those prices, this explanation applies more to overall trends in labour productivity in natural resource industries rather than inter-industry differences in productivity growth.
• Structural adjustment theories. Natural resources industries experience different
shocks, which can result in different adjustment paths. For example, falling prices for certain commodities may result in the industry contracting and the adjustment process may led to a bias against new capital investment, explaining the slower growth in capital intensity in these industries.
• Macroeconomic factors. These explanations focus on the aggregate demand impact of
differences in fiscal, monetary and political events. Canada experienced weak aggregate demand growth for much of the 1990s, especially during the early years of the decade with tight monetary and fiscal policy. This development may have weakened investment growth and the rate of increase of the capital-labour ratio.
• A range of supply-side explanations for differential rates of capital formation across
natural resource industries or secular effects affecting trends in all industries. These supply-side factors include tax regimes, rate of unionization, regulation, terms of trade, and more favourable opportunities for foreign direct investment elsewhere. Each of these factors, by reducing expected future profitability, may lead to lower rates of investment.
8 For discussion of this issue, see Bernstein, Harris and Sharpe (2002).
23
D. Factor Prices As noted above, trends in the capital-labour ratio are affected by trends in the relative
price of the factors of production, labour and capital. An increase in the relative price of labour, everything else equal, will lead to substitution of capital for labour and an increase in the capital-labour ratio. Thus labour productivity growth may be affected by the rate at which labour compensation increases because of the latter’s effect on capital-labour substitution. If wages tend to grow fast, there will be an incentive for plant managers to substitute machinery for labour, everything else being constant.
Exhibit 4 presents data on wage levels, defined in terms of nominal hourly labour
compensation, in Canadian natural resource industries in 1997 and growth rates over the 1961-97 and 1989-97 period. A number of observations can be made.
• Average wages in natural resource industries tend to be well above average. Wages
were the highest in the energy sector at 174.6 per cent of the all industries average, followed by 167.0 per cent in primary metals, 143.3 per cent in mining, 130.9 per cent in forest products, 122.7 per cent in motor vehicle parts, 109.1 per cent in non-metallic mineral products, and 100.9 per cent in metal fabricating.
• Within the mining sector, wage levels ranged from 168.8 per cent of the all industries
average in iron mines to 123.6 per cent in other non-metal mines. Within forestry products, wages ranged from 162.5 per cent of the all industries average in paper products to 105.3 per cent in wood products.
• Nominal or money wage growth exceeded the all industries average of 6.8 per cent
per year in less than half the natural resouce industries over the 1961-97 period. It increased at a 7.3 per cent average annual rate in mining and forest products, 7.1 per cent average annual rate in the energy sector, 7.0 per cent in primary metals, 6.7 per cent in non-metallic mineral products, 6.4 per cent in motor vehicle parts, and 6.1 per cent in metal fabricating.
• In the 1990s (1989-97), nominal wage growth exceeded the all industries annual
average of 2.8 per cent in most natural resource industries. It increased at a 3.9 per cent average annual rate in the the energy sector, followed by 3.7 per cent in forest products, 3.5 per cent in motor vehicle parts, 3.3 per cent in metal fabricating and primary metals, 3.0 per cent in non-metallic mineral products, and 2.9 per cent in mining.
E. Educational Attainment
The skills of the workforce and its acquisition of new ones affect labour productivity
levels and growth. Higher levels of workforce literacy and numeracy are needed to operate increasingly sophisticated machinery and equipment. Everything else equal, labour productivity will grow with skill acquisition. A proxy for skill level is educational attainment.
24
Exhibit 3 provides estimates on the average years of educational attainment in natural resource industries in Canada in 2001 and growth rates for the 1976-2001 and 1989-2001 periods based on data from the Labour Force Survey. A number of observations can be made.
• The average level of formal educational attainment in Canadian natural resource
industries in 2001 at 12.90 years was 4.2 per cent below the all industries average. Over the 1976-2001 period the rate of increase in average educational attainment in natural resource industries at 0.56 per cent per year was slightly above the all industries average of 0.50 per cent. This meant that the gap in the level of educational attainment between natural resources industries and all industries only fell 1.4 points from 1976 to 2001.
• The energy sector is the only natural resource sector where the educational attainment
of the workforce is above average (105.2 per cent of the all industries average). The average level of educational attainment is particularly low in non-metallic mineral products (92.7 per cent), wood products (90.1), non-metallic mineral mining and quarrying (88.9 per cent), and logging and forestry (87.4 per cent).
• Over the 1976-2001 period, the rate of advance in average educational attainment was
strongest in motor vehicle parts (0.69 per cent per year), followed by primary metals (0.66 per cent), and mining (0.61 per cent). It was by far weakest in crude petroleum and natural gas (0.17 per cent). From 1989 to 2001, growth in educational attainment was most rapid in mining, and the four- mineral-related manufacturing processing industries, and weakest in a number of energy industries (pipeline transport, refined petroleum and coal products, crude petroleum and natural gas extraction) and wood products and paper products.
F. Innovation and Technological Progress
Technological progress is the principal determinant of productivity growth over time but
unfortunately, it is very difficult to measure. Technological progress is often proxied by trends in certain inputs to the innovation process such as research and development expenditures (R&D) and patents. Technological advances can be classfied into two basic types: those that are industry-specific designed for use in one industry and those that are general purpose in nature as they can be applied and used in all industries. Examples of the latter include the internal combustion engine, electricity, and the computer chip. Productivity advance in natural resource industries is affected by both types of technologies.
Technological improvements are embedded in new capital goods. In particular, during
periods of relatively rapid technological change a faster rate of investment per unit of labour translates into a faster rate of labour productivity growth. Indeed, some economists, such as Richard Lipsey (Lispey and Carlaw, 2000) argue that the embodied nature of technological change means that it is difficult if not impossible to separate the impact of technological change and increases in the capital-labour ratio on labour productivity growth through the growth accounting assumptions.
Exhibit 12, taken from Holbrook (2002), shows the ratio of R&D to output or GDP in
25
1990, 1995, and 2000 in eight natural resources industries and motor vehicles. A number of observations follow.
• Total R&D spending in Canada was 1.81 per cent of GDP in 2000. All natural
resources industries had lower R&D/GDP ratios. This should not necessarily be seen as a concern for two reasons. First, the technological advances that natural resource industries incorporate into their production processes are generally developed in other sectors (equipment producers and government and university laboratories in Canada and other countries). Second, it is the pace at which natural resource industries adopt new technologies, not the rate at which they undertake their own R&D, that determines productivity growth.
• In 2000, among Canadian natural resource industries, the R&D/GDP ratio was
highest in primary metals (1.56 per cent of GDP), followed by paper manufacturing (1.10 per cent), fabricated metals (0.54 per cent), oil and gas (0.50 per cent), electric power generation (0.47 per cent), wood products (0.33 per cent), forestry and logging (0.26 per cent), and mining (0.22 per cent).
• Total R&D spending in Canada increased from 1.67 per cent of GDP in 1993 to 1.81
per cent in 2000. But only three of eight natural resources industries experienced an upward trend in their R&D/GDP ratios between 1990 and 2000 and the increases averaged only 0.08 percentage points. In contrast, the average decline in the R&D/GDP ratio for the five industries experiencing decreases was a very large 0.84 points.
A key feature of R&D is that R&D performers cannot capture all the benefits from their
own R&D investment (Bernstein, 2000). This characteristic results in “spillovers”, as the beneficiaries of R&D investment extend far beyond R&D performers. R&D spillovers help to diffuse technological advances and thereby fuel productivity growth. Moreover, the beneficiaries of R&D are not constrained within national boundaries. International R&D spillovers imply that a country’s productivity growth no longer depends solely on its own R&D, but also on the R&D activities of other nations. In particular, in the Canadian case, R&D spillovers from the US are an important source of productivity gains in Canada. The rapid growth in the R&D in US manufacturing in the 1995-98 period (unfortunately the data only extends to 1998) suggest that Canadian firms in all sectors have been benefiting from increased R&D spillovers in recent years.
The role of technological change in explaining productivity advance in the natural
resource industries is complex and still poorly understood. While natural resources industries continuously upgrade their operations with the latest technology, it is, in particular, difficult to ascertain whether the pace of technological change is accelerating or decelerating. As noted in Simpson (1999:viii):
“The causes and patterns of technological advance vary considerably from sector to sector, and overall productivity trends in the sectors reflect a mosaic of positive and negative influences of which specific technological
26
advances are only one part. Facile generalizatons about how technological innovations works, and how it contributes to economic advance in the face of natural resource scarcity, are not in order.”
In relation to the importance of embodied technological change for productivity growth,
one development to be noted in the 1990s has been the fall-off of investment in most natural resource industries. While the total economy capital stock advanced at an average annual rate of 1.25 per cent from 1989 to 2000, capital stock growth has been negative in seven natural resource industries: mining (-3.69 per cent), refined petroleum and coal products (-3.39 per cent), logging and forestry (-2.07 per cent), paper products (-1.91 per cent), non-metallic mineral products (-0.76 per cent per year), primary metals (-0.51 per cent), and fabricated metals (-0.22 per cent). Declining employment in all these sectors has meant that the capital-labour ratio did not fall by as much as the decline in the capital stock. It is interesting to observe that despite these declines in investment, most of these industries experienced above average productivity growth.
G. Output Prices
The impact of output prices on productivity is theoretically ambiguous. Under certain
conditions and in certain industries, the relationship between output prices and productivity may be positive, in other settings and industries it can be negative. First, the negative relationship. As the price of output increases, it can become profitable to use less productive resources such as low grade ore deposits to increase production. Since the marginal product is falling, average product will start to decrease at some point. As a consequence, a strong rise in the price of output can lead to a decrease in productivity of inputs used in the production of that output. The opposite may occur if prices decline.
Second, the positive relatonship. Higher prices can make operations more profitable if
costs are constant. This can lead to production increases and, through economies of scale, productivity gains. Lower prices can have the opposite effect though shorter production runs and decreasing returns. The negative effect of output price changes on productivity is generally found in increasing costs in natural resource extractive industries while the positive effect is more common in constant costs in manufacturing industries that process natural resources.
Exhibit 5 provides data on the prices of the output of natural resource industries, as
represented by the value added deflator for the industry (current dollar GDP divided by constant dollar GDP) for the 1961-97 period and four sub-periods (1961-73, 1973-81, 1981-89, and 1989-97). A number of observations can be made.
• All natural resource sectors except forest products experienced a slower rate of
increase in their output prices than the average rate of increase for all industries over the 1961-97 period (5.0 per cent per year). This meant that the relative price of the output of these industries declined. The lowest rate of increase in output prices was experienced by motor vehicle parts (2.7 per cent per year), followed by mining (4.3 per cent), primary metals (4.7 per cent), non-metallic mineral products (4.9 per cent), metal fabricating (5.0 per cent), and energy (5.5 per cent). The price of forest products output advanced at a 5.7 per cent average annual rate over the period.
27
• Within certain of the major natural resource sectors, there were diverse trends. For
example, in the energy sector the price of the output of the crude petroleum and natural gas industry increased at a well above average 7.6 per cent average annual rate over the 1961-97 period, while that of pipeline transport advanced only 2.6 per cent. Within mining, there has been even greater variation. Gold prices rose a strong 8.0 per cent per year while salt prices increased only 2.5 per cent, closely followed by a 2.7 per cent increase in iron ore prices and a 2.8 per cent rise in coal prices.
• In the 1990s (1989-97), output prices increased at a rate above the all industries average (1.8 per cent per year) in forest products (4.1 per cent), energy (2.8 per cent) and metal fabricating (3.0 per cent). Below average rates of increase were recorded in mining (-2.4 per cent), motor vehicle parts (-0.2 per cent), and non-metallic mineral products (1.3 per cent).
• Again within certain major natural resource industries, there were diverse price
trends. For example, in forest products, paper products prices were basically stagnant (0.2 per cent per year) while prices advanced a strong 6.6 per cent per year in logging and foresty and an even stronger 7.4 per cent in wood products. In the energy sector, price increases ranged from a 19.57 per cent average annual increase in refined petroleum and coal products to a 0.2 per cent rise in pipeline transport. All mining industries experienced below average increases in output prices with the exception of salt mines.
H. Capacity Utilization
The capacity utilization rate is the proportion of capital stock that is used in the
production process. Capacity utilization varies over the business cycle, falling as output falls and rising as output rises because the size of the capital stock does not vary greatly in the short to medium term.
Capacity utilization is an indicator of the intensity of demand pressures. In the short to
medium term, high rates of capacity utilization tend to be associated with high rates of productivity growth because overhead costs are spread over a greater quantity of output and employers do not have time to adjust employment levels to higher output. Low levels of capacity utilization, on the other hand, are associated with slower productivity growth or even productivity declines because of lags in the adjustment of employment to changes in output. Overall, during longer periods, particularly over complete business cycles, firms can adjust employment to desired output levels and the influence of capacity utilization on productivity is believed to be less. However, there still may be a long-term effect of capacity utilization on productivity growth. This is because business cycles vary in the intensity of demand, defined both as differences in capacity utilization at cyclical peaks and in terms of average capacity utilization over the cycle.
Statistics Canada produces estimates of the rate of capacity utilization, based on estimates
of potential output derived from the size of the capital stock and the minimum capital-output ratio and actual output, for a number of natural resource industries in Canada for the 1962-2000
28
period. Exhibit 6 shows these estimates for the first year of the series and subsequent cyclical peak years for the total economy (which may differ from industry-specific peaks), namely 1973, 1981, 1989, and 2000. A number of observations can be made.
• For non-farm goods-producing industries, the broadest industry aggregate published,
the rate of capacity utilization rose from 81.8 per cent in 1962 to 86.2 per cent in 1973, then fell to 81.3 per cent in 1981, rising to 84.4 per cent in 1989 and 85.5 per cent in 2000. This implies that the intensity of demand or the pressure on capacity was much less in 1962 and at the 1981 cyclical peak than at the other cyclical peaks. The comparability of rates of capacity utilization in 1989 and 2000 (84.4 per cent and 85.5 per cent respectively) may imply that differences in the intensity of demand between the 1989 cyclical peak and the most recent peak are not likely to account for productivity developments in the 1990s, at least at the aggregate level.
• Between 1962 and 2000, for the 11 natural resource industries for which official
capacity utilization rates are available, capacity utilization was higher in six industries and lower in five industries. The largest increase was recorded in refined petroleum and coal products, up 15.9 points from 76.8 per cent to 92.7 per cent, followed by metal fabricating (13.5 points), primary metals (9.2 points), wood products (8.3 points), paper products (4.7 points), and electric power systems (2.3 points). In contrast, capacity utilization was down 14.2 points in crude petroleum and natural gas, followed by a decline of 6.3 points in mines, quarrying and oil wells, 5.9 points in gas distribution systems, 4.2 points in logging and forestry, and 0.2 points in non-metallic mineral products.
• Between 1989 and 2000, seven of 11 natural resource industries for which capacity
utilization estimates are available experienced increased rates of capacity utilization and four lower rates. The largest increase was in refined petroleum and coal products (7.5 points), followed by wood products (7.2 points), paper products (4.8 points), electric power systems (3.0 points), metal fabrication (2.6 points), primary metals (1.9 points), and logging and forestry (1.5 points). The largest decline in capacity utilization was in crude petroleum and natural gas (16.7 per cent), followed by gas distribution systems (11.0 per cent), mines, quarrying and oil wells (10.2 per cent), and non-metallic mineral products (2.1 per cent).
• There seems to be no strong long-run positive or negative relationship between
changes in capacity utilization and labour productivity. I. Size Distribution of Plants and Economies of Scale
It is well documented that small firms and establishments have lower productivity levels
than large firms. For example, a study by Baldwin, Jarmin, and Tang (2002: Table 2) found that for Canadian manufacturing the productivity level of small plants (100 or less employees) in 1997 was 67.2 percent of the overall average, down from 81.9 per cent in 1973. This positive relationship between plant size and productivity levels may be linked to economies of scale and increasing returns.
Consequently, productivity trends in natural resource industries could be affected by
29
changes in the size distribution of firms and establishments as there are large numbers of small and medium-sized enterprises in certain industries. An increased share of an industry’s employment in small establishments would have a downward effect on the overall productivity level of the industry while a movement away from employment in small plants would boost productivity through a composition effect. Indeed, the growth in the employment share of small plants in Canadian manufacturing from 28.6 per cent of total manufacturing employment to 37.3 per cent in 1997 reduced labour productivity growth in manufacturing by 7.1 per cent over the 1973-97 period or 0.3 per cent per year.9
Statistics Canada collects data on the number of establishments or plants and the number of employees through the annual census of manufacturers. These data show that the number of establishments in total manufacturing increased in the 1970s and 1980s (23 per cent between 1971 and 1989), but declined in the 1990s (down 24 per cent between 1989 and 1999). This overall trend manifested itself for five of the six natural resource processing manufacturing industries (petroleum and coal products was the exception), as shown in Exhibit 9. The largest decline in the number of establishments in the 1990s among the five industries was in wood products, down by 1,236 establishments or 37 per cent.
Trends in average plant size are determined by trends in the nunber of plants and total
employment. For the overall manufacturing sector, average plant size was stable in the 1970s and 1980s, but increased in the 1990s, reflecting the large fall in the number of plants and relatively stable employment. In contrast, over the 1970-89 period, the average number of employees per establishment fell in five of six natural resource processing manufacturing industries (wood products was the exception). This downward trend continued in the 1989-1999 period in three natural resource processing manufacturing industries, but was halted in non-metallic mineral products and reversed in metal fabrication.
It has been the wood products industry that has experienced the most dramatic increase in
its plant size among natural resource processing manufacturing industries over the last three decades. Average establishment size in this industry more than doubled from the low level of 26 in 1970 (one half the average for all manufacturing industries) to 37 in 1989, and to 62 in 1999.
J. Unionization
Unionization can have both positive and negative effects on labour productivity. On one
hand, it may reduce the flexibility with which managers are able to allocate workers to different tasks, inhibiting productivity growth. On the other hand, the presence of labour unions can lead to improved working conditions and higher job satisfaction which in turn lead to lower turnover and higher labour productivity growth. Equally, unions can raise wages, giving employers more incentive to substitute capital for labour and raising labour productivity.
Unionization rates are available from Statistics Canada’s CALURA data base for the
9 This estimate was calculated by multiplying the 1973 employment shares for small, medium and large firms (28.6 per cent, 39.4 per cent, and 32.0 per cent respectively) by the 1997 productivity relatives for small, medium and large firms (76.2 per cent. 103.8 per cent, and 146.9 per cent respectively) and comparing the result with the benchmark results for 1997 which is the product of the 1997 employment shares by plant size (37.3 per cent, 39.8 per cent and 22.9 per cent respectively) and 1997 productivity relative levels.
30
1976-1995 period and are given in Exbihit 8 for 1976 (the earliest year the time series is available), 1989, and 1995 (the most recent year this time series is available).10 A number of observartions can be made.
• Unionization rates in five of eight natural resource industries for which data are
available were above the all industries average of 28.2 per cent in 1995. The highest unionization rate was recorded in primary metals (58.6 per cent), followed by paper products (54.0 per cent), logging and forestry (43.1 per cent), non-metallic mineral products (42.2 per cent), and petroleum and coal products (39.2 per cent). The unionization rates were below average in metal fabrication (24.0 per cent), wood products (24.6 per cent), and mines, quarries and oil wells (24.7 per cent).
• In contrast to the overall stability of the unionization rate for all industries between
1976 and 1995 (and between 1976 and 1989 and 1989 and 1995), there was a strong downward trend in the unionization rate in almost all natural resource industries (for the 1976-95 period, the exception was petroleum and coal products). The largest fall was in wood products (26.9 points), followed by mines, quarries and oil wells (19.6 points), metal fabrication (10.8 points), paper products (9.3 points), non-metallic mineral roducts (4.9 points), primary metals (4.6 points), and logging and forestry (3.7 points).
K. Workplace Safety
The relationship between labour productivity and workplace safety is ambiguous.
Workplace safety regulations impose a constraint on labour use and so, a decline in workplace injuries could be associated with a decrease in labour productivity. But on the other hand, a safer work environment may limit absenteeism and therefore reduce production bottlenecks that reduce labour productivity, leading to labour productivity growth.
The Association of Workers Compensation Boards of Canada collects statistics by
industry on the number of injuries and fatalities occuring in Canadian workplaces. Exhibit 7 presents these statistics for the natural resource industries for which they are available, expressed as the proportion of workers injured and incidence of fatalities per 100,000 workers. A number of observations can be made.
• For all industries, the incidence of injuries was almost cut in half in the 1990s, falling
from 4.7 per cent in 1989 to 2.5 per cent in 1999. The incidence of fatalities, on the other hand, was unchanged, at 5.7 per cent in 1993 and 5.6 per cent in 1999.
• In 1999, the injury rate in the energy sector and in all energy industries was below the
all industries average. In contrast, the injury rate in all other natural resource industries was above the all industries average, and was particularly high in wood products (8.0 per cent) and logging and forestry (7.0 per cent). The fatality rate was above the all industries average in the late 1990s in the vast majority of natural resource industries and was particularly high in other non-metal mines except coal
10 Data from the Labour Force Survey are available from 1998 on, but must be obtained through a special run.
31
and in logging and forestry. • Almost all natural resources industries for which data are available followed the all
industries trend of falling injury rates in the 1990s (the exception was pipeline transport which already had a very low injury rate). On the other hand, the fatality rate increased in 10 of the 14 natural resources industries for which data are available in the 1990s.
L. Regulation
Government regulations can have both positive and negative effects on productivity
growth. For example, government regulations that restrict certain types of logging practices for safety or environmental reasons, or that require stringent controls on air and water emissions from paper plants, can increase operating and capital costs and thereby reduce labour, capital, and total factor productivity. Alternatively, government regulations can force firms to take actions they would not normally take. These actions may have unexpected positive consequence for productivity and competitiveness, particularly if other countries eventually adopt the same regulations, giving the early adopter an advantage. Of course, the evaluation of the effectiveness of government regulation must go beyond the impact of the regulations on productivity, and factor in the societal benefits of less pollution and other non-economic benefits.
It is very difficult to develop quanitative estimates of the number of regulations, or the
burden of regulations over time. Anecdotal evidence suggests that increased regulations, particularly in the environmental area, have impeded productivity growth in certain natural resource industries, but is is difficult to substantiate these claims with conclusive quantitative evidence.
M. Quality of Natural Resources
The quality of natural resources can have a major effect on productivity. Firms exploiting
high quality, easily accessible natural resources that generate large economic rents will have higher productivity levels that firms exploiting poor quality resources. A depletion of natural resources over time, everything else being equal, will lead to slower productivity growth or even falls in productivity levels. More inputs are needed to obtain a given output. The reliance on less accessible timber stocks, for example, can raise the cost in terms of labour and capital of producing a given quantity of wood, decreasing productivity.
Two opposing influences on productivity trends in natural resource industries exist.
Decreasing returns caused by resource depletion, everything else equal, reduces productivity. Technological advances which lead to lower production costs and the discovery of new resources increases productivity. The relative importance of these two forces and their net effect on productivity will vary over time and space.
Unfortunately, it is very difficult to obtain data on trends in the average quality of natural
resources in Canada.
32
N. Foreign Direct Investment It is often argued that foreign direct investments can improve productivity because
foreign firms will modernize the existing production facilities, and import new and better machinery or production methods. However most direct foreign investment into Canada now takes the form of acquistions of existing operations, not contruction of new facilities (greenfield investment) so the scope for productivity gains may be less than commonly believed. III. Productivity Trends and Determinants in Canadian Natural
Resource Industries This section discusses productivity trends and determinants in natural resources
industries. Based on the tables drawn from the large data base developed for this project, it presents estimates of growth rates for output, total hours worked, capital stock, labour productivity (real value added per hour worked), capital stock per hour, and total factor productivity for the 1961-2000 period and cyclically neutral (peak-to-peak) subperiods (1961-73, 1973-81, 1981-89, and 1989-2000). A particular focus is given to whether labour productvity growth accelerated or decelerated in the 1990s relative to the 1961-89 period and the relative impact of changes in total factor productivity and the capital-labour ratio on the change in labour productivity. This section of the report has greatly benefited from the insights into productivity developments provided by Natural Resources Canada industry specialists.
This section is divided into five parts. • The first part provides a general overview of productivity trends in natural resource
industries in Canada. • The second part looks at productivity trends at the total economy level to establish a
benchmark for the evaluation of the productivity performance of natural resources industries.
• The third part examines productivity trends in the energy sector, including the energy
aggregate, crude petroleum and natural gas, refined petroleum and coal products, pipeline transport, electric power systems, and natural gas distribution. In this and following parts key productivity developments are highlighted and explanations advanced.
• The fourth part looks at productivity trends in mining. Mining industries covered are
gold mines, iron mines, salt mines, and coal mines.
• The fifth part looks at productivity trends in manufacturing industries which process mineral products, namely primary metals, fabricated metals, non-metallic mineral products, and motor vehicle parts. This last industry is not a natural resource related industry, but is of interest to Natural Resources Canada.
33
• The sixth and final part examines productivity trends and determinants in the forest
products sector, which includes logging and forestry, wood products, and paper products.
The discussion in each section provides a brief overview of the provincial distribution of
value added and employment in the industry in 2001. These shares are based on the North American Industrial Classification System (NAICS), as estimates for 2001 are only available on this basis. Productivity growth rates up to 2000 have been based on the 1980 Standard Industrial Classification (SIC) basis. Appendix 1 compares NAICS and SIC estimates of employment and output in 2000 for natural resource industries and describes the differences in the industry definitions.
A. Overview of Productivity Trends
Exhibit 2 provides estimates of labour productivity levels, expressed in terms of real
output per hour worked ($1992), for Canadian natural resource industries in 2000 and gives the labour productivity level as a percentage of the all industries average. A number of observations can be made.
• The average labour productivity of natural resource industries is almost double that of
the all industries average (193.8 per cent) due to high relative labour productvity levels in mining (202.7 per cent) and especially energy (518.4 per cent). The average labour productivity level is only slightly above the all industries average in metal fabricating (102.1 per cent) and forest products (103.6 per cent) and still well below the natural resource average level in non-metallic mineral products (123.5 per cent of the all industries average), primary metals (138.9 per cent), and motor vehicle parts (175.6 per cent). The high capital intensity of production of the mining and energy sectors explains much of the high relative labour productivity levels.
• Within the energy aggregate relative labour productivity levels ranged greatly, from
1112.8 per cent of the all industries average in crude petroleum and natural gas to 130.8 per cent in services incidental to mineral extraction. Pipeline transport and electric power systems have very high relative labour productivity levels, 785.2 per cent and 575.0 per cent respectively.
• Within mining, relative labour productivity levels ranged from 300.1 per cent of the
all industries average in coal to 93.8 per cent in asbestos. • The range for relative labour productivity levels in the forest products sector was
much more limited than in the energy and mining sectors, from a high of 136.8 per cent of the all industries average in paper products to a low of 76.6 per cent in wood products. The wood products industry was the only one with asbestos mining out of 22 natural resource industries (including industry aggregates) in 2000 to have a labour productivity level below the all industries average.
Chart 1 and Exhibit 10 provide estimates of growth rates for value added per hour
34
worked for 17 Canadian natural resource industries and the all industries average for the 1961-2000 period. The most striking observation is that 15 of the 17 natural resource industries experienced faster labour productivity growth than the all industries average (1.79 per cent per year). Four industries enjoyed productivity growth at more that double the average rate (more than 4 per cent): salt mining, refined petroleum and coal products, motor vehicle parts, and coal mining. The only two industries whose labour productivity growth did not exceed the all industries average were gold mining and crude petroleum and natural gas industries. This latter industry experienced negative productivity growth.
Chart 2 and Exhibit 10 provide estimates of growth rates for total factor productivity for
17 Canadian natural resource industries and the all industries average for the 1961-2000 period. Again, one is struck by the large number of industries that exceeded the all industries average of 1.49 per cent per year – 12 of 17 industries. Five industries enjoyed productivity growth at more that double the average rate (more than 4 per cent), the same four industries that exceeded double the all industries average for labour productivity growth (salt mining, refined petroleum and coal products, motor vehicle parts, and coal mining) and pipeline transport. The five industries whose labour productivity growth did not excced the all industries average were the mining aggregate, paper products, gas distribution systems, gold mining, and crude petroleum and natural gas industries. These last two industries experienced negative total factor productivity growth over the 1961-2000 period.
Chart 3 and Exhibit 11 provide estimates of growth rates for value added per hour
worked for 17 Canadian natural resource industries and the all industries average for the 1989-2000 period. As in the 1961-2000 period, the vast majority of industries (13 of 17) experienced faster labour productivity growth than the all industries average (1.07 per cent per year). Three industries enjoyed labour productivity growth of more than 4 per cent per year (crude petroleum and natural gas, motor vehicle parts, and coal mining). It is interesting to note crude petroleum and natural gas had the worst labour productivity performance over the 1961-2000 period so its strong productivity growth rate in the 1990s represents a major turnaround from the 1961-89 period. The four industries whose labour productivity growth did not excced the all industries average were salt mining, iron mining, forestry and logging, and wood products. These latter two industries had negative labour productivity growth.
Chart 4 and Exhibit 11 provide estimates of growth rates for total factor productivity for
17 Canadian natural resource industries and the all industries average for the 1989-2000 period. Here only 11 of 17 natural resource industries exceeded the all industries average of 1.07 per cent per year. Two industries enjoyed labour productivity growth of more than 4 per cent per year (motor vehicle parts and coal mining). The six industries whose labour productivity growth did not exceed the all industries average were forestry and logging, pipeline transport, crude petroleum and natural gas, iron mining, wood products, and gas distribution systems. The latter four industries experienced negative total factor productivity growth over the 1989-2000 period.
B. All Industries
As the productivity performance of the industries examined in this study is compared to
the all industries average, a useful starting point or benchmark for the discussion is productivity trends in the total economy.

35
From 1961 to 2000, growth in output per hour in all industries, including the non-
business sector, was 1.79 per cent per year, with total factor productivity advancing 1.49 per cent (Table 1). Thus 83.2 per cent of labour productivity growth was accounted for by total factor productivity growth and 16.8 per cent by capital deepening, that is the increase in the capital-labour ratio. This latter contribution is approximated by the product of the growth in the capital-labour ratio and the sector's share of capital income in value added, i.e., 1.00 per cent times 0.29.
In the 1990s, labour productivity growth increased at a 1.07 per cent average annual rate,
with total factor productivity close behind at 1.07 per cent. Between 1961-89 and 1989-2000 labour productivity growth fell off 1.00 percentage points from 2.07 per cent. Total factor productivity decelerated 0.59 points, accounting for 59 per cent of the labour productivity slowdown. A fall of 1.38 points in capital-labour growth explains the remaining 41 per cent of the slowdown.
C. Energy Sector
1) Energy aggregate
The energy sector is comprised of a number of very diverse sectors involved with
extractive, processing and distributive activities. These sectors include crude petroleum and natural gas industries, refined petroleum and coal products industries, pipeline transport, gas distribution systems, and electric power systems. Charts 11 and 12 show trends in output per hour and total factor productivity respectively in the energy aggregate and all energy industries over the 1961-2000 period.
Labour productivity in the energy aggregate grew 1.88 per cent per year and slightly outperformed the all industries average (1.79 per cent) over the 1961-2000 period
(Table 2). Total factor productvity growth, on the other hand, advanced at a rate below that of the all industries average (1.17 per cent versus 1.49 per cent).
In the 1990s, labour producivity increased at a 2.34 per cent average annual rate, more
than double that of the total economy (1.07 per cent). Total factor productivty in the energy aggregate also exceeded that of the total economy, albeit very marginally (1.09 per cent versus 1.07 per cent).
Between the 1961-89 and 1989-2000 periods, output growth in the energy aggregate
decelerated significantly from 5.25 per cent per year to 2.32 per cent. All of this 2.93 percentage points slowdown was due to the fall in hours worked from average annual growth of 3.49 per cent to -0.02 per cent. Labour productivity growth actually accelerated 0.64 points from 1.70 per cent to 2.34 per cent. The pick-up in labour productivity growth was completely due to the acceleration of 0.94 points in growth in the capital-labour ratio (0.63 per cent to 1.57 per cent). Total factor productivity growth actually fell 0.11 points from 1.20 per cent to 1.09 per cent. The acceleration in capital deepening is accounted for not by growth in the capital stock, (it actually fell from 4.14 per cent per year to 1.55 per cent), but by the even greater fall in total hours worked (3.51 points).
36
The overall productivity performance of the energy aggregate has thus been relatively healthy from both a long-term and short-term perspective. However, because of the very heterogeneous nature of activites in the energy sector, the energy aggregate does not represent a particularly meaningful unit for productivity analysis. A more disaggregated approach to productivity trends in the energy sector is needed.
2) Crude petroleum and natural gas industries
The total value added in oil and gas extraction industries in Canada in 2001, based on the
NAICS definition of the sector, was $22.8 billion (1997 dollars), representing 2.4 per cent of total GDP. The industry was largely concentrated in Alberta, with 77 per cent of national output (Chart 5), followed by Saskatchewan (11 per cent), British Columbia (6 per cent), and Newfoundland (4 per cent, up from only 0.1 per cent in 1997). All other provinces accounted for only 2 per cent of output. In terms of contribution to the provincial economy, the industry was most important in Alberta (14.8 per cent of provincial GDP), followed by Saskatchewan (8.9 per cent), and Newfoundland (8.4 per cent). The provincial distribution of employment was similar to that of output, with Alberta dominating.11
The long term productivity performance of the crude petroleum and gas industries has
been very poor, with labour productivity falling 0.63 per cent per year between 1961 and 2000 and total factor productivity down 0.62 per cent (Table 3). This negative productivity growth was largely concentrated in the 1973-81 period when labour productivity fell a massive 12.01 per cent per year and total factor productivity declined 12.27 per cent. The key development in this period was the massive increase in oil and gas prices, which lead to the exploitation of lower quality deposits and an increased exploration effort, with a negative short-term effect on productivity.
Natural Resource Canada officials have also noted that the economic environmemnt also
may have played an important role in determining productivity developments. Energy price controls in the 1970s and the National Economic Policy in the 1980s generated an economic environment that might have had a significant negative impact on investment in the upstream oil and gas industry, reducing productivity growth.
In the 1990s, labour productivity growth in the sector has accelerated an extremely strong
9.18 points from -3.14 per cent per year in 1961-89 to 6.04 per cent in 1989-2000. This acceleration was almost completely accounted for by the turnaround in the rate of growth of the capital-labour ratio, from -2.61 per cent to 6.92 per cent, as total factor productivity improved only 0.57 points from -0.78 per cent per year to -0.21 per cent.
According to Natural Resource Canada officials, important technological developments
have been the key driver of the rebound in labour productivity growth in the crude petroleum and natural gas sector in the 1990s. These innovations include directional drilling technologies, enhanced recovery technologies, improved seismic methods and geo-modeling of reservoirs, and factors influencing diminishing returns in conventional operations such as fresh water 11 In 2001, Alberta accounted for 85 per cent of employment in the oil and gas extraction industry, followed by Saskatchewan (4 per cent), Ontario (3 per cent), British Columbia (3 per cent), Newfoundland (2 per cent) and others (2 per cent).
37
availability, increasing salt water/oil ratios, waste water disposal, and emergence of non-conventional technologies in heavy oil and oil sand operations.
The non-conventional crude oil production in the Athabaska tar sands, which accounts
for a growing share of the output of the sector, has in particular experienced rapid productivity growth. According to Syncrude CEO Eric Newell (Francis, 2002), the cost of producing a barrel of oil in 2002 had dropped to the $12-13 range, down from $25 in 1989. In real terms, this is equivalent to a drop in unit production costs of around two thirds.
Other factors behind the revival of productivity growth in the 1990s noted by Natural
Resource Canada officials were energy policy deregulation and the removal of sub-marginal properties from production by “Ceiling Tests” under Generally Accepted Accounting Principles. 3) Refined petroleum and coal products
The total value added in petroleum and coal products manufacturing in Canada in 2001
was $1.9 billion (1997 dollars), representing 0.21 per cent of total GDP. In contrast to oil and gas extraction, value added in refined petroleum and coal products was fairly widely distributed throughout the country. Alberta accounted for 29 per cent of employment, followed by Ontario (25 per cent), Quebec (16 per cent), British Columbia (9 per cent), Newfoundland (8 per cent), and other provinces (13 per cent). In terms of contribution to the provincial economy, the industry was most important in Newfoundland, accounting for 0.66 per cent of total employment. Ontario accounted for 42.6 per cent of national output (Chart 9). Confidentiality considerations prevent the release of output estimates for the other provinces.
Both labour and total factor productivity growth in the refined petroleum and coal
products industries exceeded the all industries average over the 1961-2000 period (Table 4). Labour productivity advanced at a 4.41 per cent average annual rate compared to the all industries average of 1.79 per cent and total factor productivity grew 4.33 per cent, also well above the all industries average of 1.49 per cent.
In the 1990s, productivity growth in the sector continued to outperform the national
average. Labour productivity grew at a 2.45 per cent average annual rate in 1989-2000 and total factor productivity 2.80 per cent, both above the all industries average of 1.07 per cent and 1.07 per cent respectively. This represented, however, a labour productivity growth slowdown of 2.74 percentage points from the 1961-89 period, with 2.41 points or 82 per cent of the slowdown from slower total factor productivity growth and 18 per cent from the falloff in capital deepening (1.45 per cent to -2.09 per cent).
There was a large falloff in the rate of growth of real output in the refined petroleum and
coal products in 1989-2000 relative to 1961-89 – 4.16 points from 5.25 per cent to 1.09 per cent. Growth in total hours worked fell only 1.39 points from 0.06 per cent to -1.33 per cent, with the labour productivity growth slowdown being the difference (-4.16 – (-1.39)=-2.74). The average annual rate of growth of the capital stock also fell precipitiously after 1989, 4.92 points from 1.53 per cent to -3.39 per cent.
Natural Resource Canada officials have noted that except for the Irving refinery in Saint
38
John, New Brunswick, there have been no new oil refineries built in Canada since 1975. This is reflected in the negative capital stock growth figures for the 1981-89 and 1989-2000 periods (-0.77 per cent per year and -3.39 per cent respectively). Despite this lack of new capital investment, labour productivity growth was strong, advancing 11.79 per cent per year in 1981-89 and 2.45 per cent in the 1990s. The restructuring and downsizing in the industry, particularly in the 1980s, appears to have produced a productivity dividend. A second explanation for the strong productivity growth may be that technological change in the industry is disembodied, that is, not embodied in new equipment.
4) Pipeline transport
The total value added of the pipeline transport in Canada in 2001 was $3.7 billion (1997
dollars), representing 0.39 percent of total GDP. The industry was largely concentrated in Alberta, with 38.3 per cent of national output (Chart 10), followed by Ontario (20.6 per cent), British Columbia (16.0 per cent), and Saskatchewan (13.8 per cent). All other provinces had less than 5 per cent. In terms of importance for the provincial economy, the industry was largest in Saskatchewan (1.80 per cent of provincial GDP), followed by Alberta (1.20 per cent). Estimates of employment by province for pipeline transport are not available from the Labour Force Survey except for Alberta, which accounted for 64 per cent of total employment.
Over the 1961-2000 period, both labour and total factor productivity growth in pipeline
transport exceeded the national average (Table 5). Labour productivity advanced at a 2.65 per cent average annual rate and total factor productivity 3.38 per cent, above the all industries growth rates of 1.79 per cent and 1.49 per cent respectively. The faster total factor productivity growth reflected a 0.80 per cent average annual fall in the capital-labour ratio.
In the 1990s, labour productivity growth in the sector continued to be above average at
3.41 per cent, compared to the all industries average of 1.07 per cent. Total factor productivity growth, however, at 0.21 per cent per year, was below the all industries average of 1.07 per cent. Strong growth in the capital-labour ratio (3.67 per cent per year), combined with a very high share of capital income in value added (an average 87 per cent over the 1961-2000 period) accounted for the large difference between labour and total factor productivity growth.
As was the case for crude petroleum and natural gas extraction and petroleum refining,
the 1973-81 period was the cyclically neutral period with the worst productivity performance for pipeline transport. Output per hour fell at an 11.44 per cent average annual rate during this period, and total factor productivity 3.29 per cent. As noted earlier, the energy price stock explains this development. Profitability may have increased, but productivity was negatively impacted.
5) Electric power systems
Total value added in the electric power generation, transmission, and distribution
industries in Canada in 2001 was $23.0 billion (1997 dollars), representing 2.45 percent of total GDP. The industry was widely distributed across the country (Chart 7), with Ontario having the largest share of national output at 37.0 per cent, followed by Quebec (31.2 per cent), Alberta (9.3 per cent), and British Columbia (7.85 per cent). All other provinces had less than 4 per cent. In
39
terms of importance for the provincial economy, the industry was largest in New Brunswick (4.22 per cent of provincial GDP), followed by Newfoundland (3.95 per cent), and Quebec (3.59 per cent). The provincial distribution of employment in this sector was similar to that of output, with Ontario most important, followed by Quebec and Alberta.
Over the 1961-2000 period, both labour and total factor prodctivity growth in electric
power systems outperformed the national average (Table 6). Labour productivity increased at a 2.49 per cent average annual rate and total factor productivity 1.68 per cent, compared to 1.79 per cent and 1.49 per cent for the all industries averages respectively. As in the other energy-related sectors, both labour and total factor productivity growth were very poor in the 1973-1981 period, improving thereafter.
In the 1990s, again both labour and total factor productivity in electric power systems
exceeded the all industries average of 1.07 per cent and 1.07 per cent. Labour productivity increased 1.68 per cent per year, down 1.13 points from 2.81 per cent in 1961-89 and total factor productivity 1.47 per cent, down from 1.76 per cent in 1961-89. Output growth fell 4.75 per cent per year between the 1961-89 and 1989-2000 periods (6.10 per cent to 1.35 per cent). The fall in the growth rate for total hours worked (3.52 points) accounted for about three quarters of the deceleration in output growth, with the fall in labour productivity growth the remaining quarter.
According to Natural Resources Canada officials, a key innovation in the electricity
sector in recent years has been the introduction of gas-fired turbines, which are much less capital intensive than traditional sources of electricity such as nuclear power and hydroelectric installations. The absolute decline in the capital stock in the sector in the second half of the 1990s (-2.21 per cent per year between 1995 and 2000) may be explained by this development as well as the falling capital-labour ratio (-1.35 per cent) and strong total factor productivity growth (3.10 per cent).
6) Natural gas distribution
The value added of natural gas distibution in Canada in 2001 was $3.0 billion (1997
dollars), representing 0.32 percent of total GDP. The output of the industry was largely concentrated in Ontario (Chart 8), the largest consumer because of its large population, with 48.1 per cent of national output, followed by Alberta (17.6 per cent), British Columbia (15.5 per cent) and Quebec (11.4 per cent). In terms of importance for the provincial economy, the industry was largest in Alberta (0.44 per cent of provincial GDP), followed by Saskatchewan (0.42 per cent), British Columbia (0.41 per cent), and Ontario (0.36 per cent). The provincial distribution of employment in this sector mirrored that of output, with Ontario most important, followed by Alberta and British Columbia.
Over the 1961-2000 period, labour productivity growth in natural gas distribution
advanced at 3.17 per cent per year, above the 1.79 per cent average for all industries (Table 7). Total factor productivity growth, on the other hand, rose at only a 1.03 per cent average annual rate, below the 1.49 per cent rate of increase for all industries. Strong increases in capital deepening (2.91 per cent per year) explain this divergence between labour and total factor productivity growth.
40
The 1961-73 period saw very robust labour and total factor productivity growth, while both the 1973-81 and 1981-89 periods experienced negative labour and total factor productivity growth, a phenomenon common to the other energy-related industries. Labour productivity growth in the 1990s at 2.73 per cent per year outperformed the all industries average (1.07 per cent). On the other hand, total factor productivity growth was very poor, at -0.44 per cent per year, due to very strong growth in the capital-labour ratio (4.40 per cent per year).
The growth rate for both labour and total factor productivity decelerated in the 1990s
relative to the 1961-89 period. Labour productivity growth fell 0.61 points from 3.34 per cent to 2.73 per cent while total factor productivity growth fell 2.06 points from 1.62 per cent to -0.44 per cent.
7) Service industries incidental to mineral extraction
Services industries incidental to mineral extraction is part of the mining, oil well and
quarrying aggregate. This sector supplies services to both the mining and the energy sectors. Unfortunately, the relative importance of the services provided to the two sectors cannot be determined from published data, but it is likely that the energy sector accounts for the lion’s share. A second data problem with this industry is the lack of data on the capital stock. For this reason, no estimates of total factor productivity can be calculated.
The value added of service industries incidental to mineral extraction in Canada in 2001
was $5.2 billion (1997 dollars), representing 0.56 percent of total GDP. Two thirds of output was concentrated in Alberta (Chart 6), because of the presense of the oil and gas industry in this province, followed by British Columbia (12 per cent), Ontario (4 per cent), Newfoundland (4 per cent) and Quebec (3 per cent).
Output per hour in this industry was $36.46 ($1992) in 2000, by far the lowest level of all
the industries in the energy sector at 130.8 per cent of the all industries average. Labour productivity growth was also very weak over the 1961-2000 period at only 0.23 per cent per year. Among the energy industries, only crude petroleum and natural gas fared worse. Productivity growth picked up to 1.54 per cent per year in the 1989-2000 period, but it was still the lowest among the energy industries. This difficulty in raising productivity in the service component of the energy sector is not surprising given the well known phenomenon of lagging services productivity.
D. Mining
This section discusses productivity trends and determinants in the mining sector and in
four specific mining industries for which capital stock data are available: gold mines, iron mines, salt mines and coal mines. Under the 1980 SIC, gold and iron mines are part of the larger industry called metal mines which also includes copper and copper-zinc mines, nickel-copper mines, silver-lead-zinc mines, molybdenum mines, uranium mines, and other metal mines. Under the 1980 SIC salt mines are part of the larger industry non-metal mines (except coal) that includes asbestos mines, the peat industry, gypsum mines, potash mines, and other non-metal mines (except coal). Diamond mines are also included in this last industry, but no data are yet available as there is currently only one operating mine. Confidentiality would prevent the release
41
of information. Under NAICS data only three mining industries are available: metal ore mining, non-metallic mining, and coal mining. Charts 16 and 17 show trends in output per hour and total factor productivity respectively in the mining sector aggregate and all mining industries over the 1961-2000 period.
1) Total mining
The total value added of the mining industries, based on NAICS in Canada in 2001 was
$8.8 billion (1997 dollars), representing 0.93 percent of total GDP.12 The industry was largely concentrated in Ontario, with 28.7 per cent of national output, followed by British Columbia (16.2 per cent), and Quebec (14.8 per cent). In terms of importance for the provincial economy, the industry was largest in British Columbia (1.25 per cent of provincial GDP).
Over the 1961-2000 period, labour productivity advanced at a 2.56 per cent average
annual rate in mining, somewhat above the all industries average of 1.79 per cent (Table 12). On the other hand, total factor productivity increased at only a 1.20 per cent rate, below the 1.49 per cent rate experienced by all industries.
Labour productivity growth in mining advanced at a strong 4.87 per cent average annual
rate from 1961 to 1973, then fell at a 2.67 per cent rate during 1973-81 only to rebound at a very strong 6.40 per cent from 1981 to 1989. The average annual TFP growth rates for the three respective cyclically neutral periods were 0.64 per cent, -4.20 per cent, and 5.89 per cent, in all periods lower than labour productivity growth because of increases in the capital-labor ratio.
In the 1990s, labour productivity growth in mining has decelerated significantly, while
total factor productivity growth has accelerated. After increasing at a 3.08 per cent rate in 1961-89, output per hour growth fell 1.84 percentage points to 1.24 per cent in 1989-2000. Total factor productivity growth, however, accelerated 1.82 points from 0.69 per cent to 2.51 per cent. This divergence between the two measures of productivity is explained by developments in the capital-labour ratio. The rate of growth of this variable fell off 5.94 points from 3.93 per cent to -2.01 per cent between 1961-1989 and 1989-2000.
According to Natural Resources Canada officials, one general factor that may account for
lower labour productivity growth in mining in the 1990s has been greater environmental regulation, which has significantly increased the cost of operating a mine. It was pointed out that the regulations are even more stringent in the United States and many predict that the US mining industry may eventually disappear because the cost of operation imposed by environmental regulation has become so much greater than in other jurisdictions.
As was the case for the energy aggregate and the forest sector aggregate, productivity
trends are driven by developments at the industry level. Consequently, discussion of the explanations of productivity developments in mining will be provided under the specific industries.
12 The value of production, measured in terms of gross output, is higher. According to Natural Resources Canada, the value of production in mining in 2001, expressed in current dollars, was $19.3 billion, consisting of $10.2 billion in metals, $7.6 billion in non-metals, and $1.5 billion in coal.
42
2) Metal mines Under the 1980 SIC, metal mines are defined to include gold and iron mines, for which
estimates of output, labour input and capital stock are separately available, and a large number of other metals, namely copper and copper-zinc mines, nickel-copper mines, silver-lead-zinc mines, molybdenum mines, uranium mines, and other metal mines for which there are no industry data.
The total value added of metal ore mines in Canada in 2001 was $5.0 billion (1997
dollars), representing 0.53 percent of total GDP. The industry was relatively widely dispersed, with Ontario accounting for 37 per cent of total output (Chart 14), followed by Quebec (19 per cent), British Columbia (13 per cent), and the other provinces accounting for 31 per cent. Employment by province follows roughly the same pattern. Ontario had 46 per cent of national employment in the sector, followed by Quebec (16 per cent), British Columbia (12 per cent), Manitoba (9 per cent), Newfoundland (7 per cent), and all other provinces (10 per cent). In terms of weight in the provincial economy, metal ore mines was most important in Newfoundland, accounting for 1.23 per cent of provincial employment, followed by Manitoba (0.56 per cent).
Data on productivity trends in metal mines are only available for gold mines and iron
mines, which represented 25 per cent and 13 per cent respectively of metal mines output in 2000.
3) Gold mines The value added of gold mines in 2000 was $1,041 million (1992 dollars) or 0.14 per cent
of GDP. Labour and total factor productivity growth rates for the 1961-2000 period (Table 13) were below the all industries average (1.22 per cent and -0.11 per cent respectively). This situation was reversed during the 1990s, with labour productivity growth at 1.56 per cent a year compared to 1.07 per cent for all industries and total factor productivity growth at 2.60 per cent a year compared to 1.07 per cent.
According to Natural Resource Canada officials, the key driving force behind
productivity trends in gold mines has been the price of gold. Increased gold prices make profitable low-quality mines and increase average costs, lowering productivity through a composition effect. They also induce more exploration activity, which has no short-term effect on output. Price decreases have the opposite effects. In the 1961-73 period, the price of gold increased 4.9 per cent per year in real terms (Exhibit 5), that is relative to the overall increase in prices, and labour productivity advanced 1.86 per cent per year. In the 1973-81 period, the real price of gold increased at an even faster 20.32 per cent annual rate and labour productivity fell 4.19 per cent per year. After 1981 the real price of gold declined sharply, dropping 8.8 per cent per year in 1981-89 and 2.7 per cent in 1989-2000, with output per hour rising a strong 5.44 per cent in the first period and 1.56 per cent in the second.
4) Iron mines
The value added of iron mines in 2000 was $545 million (1992 dollars) or 0.07 per cent
of GDP. Labour and total factor productivity growth rates (Table 14) for the 1961-2000 period, 3.53 per cent and 2.18 per cent per year respectively, were above the all industries average (1.79 per cent and 1.49 per cent respectively). This situation was reversed during the 1990s, with
43
labour productivity growth at 0.59 per cent a year compared to 1.07 per cent for all industries and total factor productivity growth at -0.22 per cent a year compared to 1.07 per cent.
The industry expanded rapidly in the 1961-73 period, with output growth at a 10.87 per
cent average annual rate. Since 1973 the industry was been in steady decline, with output falling 0.64 per cent per year in 1973-81, 2.99 per cent in 1981-89, and 0.54 per cent in 1989-2000. In the 1961-73 period, the rapid output created a favourable environment for productivity growth, with output per hour advancing a very robust 7.60 per cent per year and TFP growth 5.61 per cent. Employment fell drastically in the 1980s, with total hours worked falling 6.98 per cent per year from 1981 to 1989. This massive downsizing appears to have had a favourable impact on productivity, as output per hour advanced 4.29 per cent per year and TFP 2.77 per cent. The real price of iron ore also fell 5.4 per cent per year during this period. The more modest declines in output and the real price of output in the 1990s may account for the better productivity performance than experienced in the 1980s, but a performance still below that of the overall 1961-89 period and the all industries average for the 1989-2000 period.
5) Non-metallic mining
Non-metallic mines includes asbestos mines, the peat industry, gypsum mines, potash
mines, and other non-metal mines (except coal), as well as salt mines. The total value added of non-metallic mining in Canada in 2001 was $2.7 billion (1997 dollars), representing 0.29 percent of total GDP. The industry was relatively widely dispersed, with Ontario in 2001 accounting for 25 per cent of total output (Chart 15), followed by Quebec (13 per cent), Alberta (5 per cent), New Brunswick (5 per cent), Nova Scotia (4 per cent), and remaining provinces, largely Saskatchewan (48 per cent). In terms of the distribution of employment by province, Quebec accounted for 25 per cent, followed by Ontario (24 per cent), Saskatchewan (21 per cent), Alberta (8 per cent), Nova Scotia (7 per cent) and other provinces (15 per cent). In terms of weight in the provincial economy, non-metallic mining was by far most important in Saskatchewan, accounting for 0.85 per cent of provincial employment because of the presence of the potash industry in this province.
6) Salt mines
Unfortunately, productivity estimates are only available for one of the industries in non-
metallic mining that is for salt mines. The value added of salt mines in 2000 was $159 million (1992 dollars) or 0.02 per cent of GDP. Table 15 shows that labour and total factor productivity growth rates in salt mines were significantly above the all industries average in the 1961-2000 period. They grew 4.19 per cent and 4.53 per cent respectively. Labour productivity growth was slower than the all industries average during the 1990s, 0.31 per cent a year compared to 1.07 per cent. But total factor productivity growth exceeded the all industries average. It grew 1.87 per cent a year compared to 1.07 per cent.
The salt industry grew very rapidly in the 1961-89 period, with output increasing at a
7.09 per cent average annual rate. Increased demand for salt for use in the de-icing of streets and roads was a major factor behind this expansion. This rapid growth lead to investment in new mines, with very positive effects on productivity. Output per hour advanced a solid 5.76 per cent per year during these three decades. The growth in demand for salt leveled off in the 1990s, with
44
output advancing only 1.41 per cent per year. This relative stagnation resulted in much slower labour productivity growth.
7) Coal mining
The value added of coal mining in Canada in 2001 was $1.1 billion (1997 dollars),
representing 0.12 percent of total GDP. The output of the industry was largely concentrated in British Columbia (Chart 13), with 63 per cent of national output. Output estimates are not available for other provinces except Nova Scotia (5 per cent). British Columbia accounted for 36.3 per cent of total employment in coal mining in 1999 (less provincial breakdown is available for 2001), followed by Alberta (31.3 per cent), Saskatchewan (no estimate available for 1999, 19.5 per cent in 2001) and Nova Scotia (16.3 per cent).
Both labour and total factor productivity growth in coal mines have been well above
average (Table 16). Over the 1961-2000 period, labour productivity advanced at a very robust average annual rate of 6.96 per cent and total factor productivity 5.65 per cent. In the 1990s, the respective growth rates of labour and total factor productivity were 6.68 per cent and 9.53 per cent. Total hours worked in this sector, which largely reflects trends in employment, has been in continuous decline, with hours worked declining 6.32 per cent in the 1990s after rising 0.15 per cent per year over the 1961-89 period.
The productivity performance of the Canadian coal industry is very impressive, by far the
best among the natural resource industries. According to Natural Resource Canada officials, the very strong productivity growth largely reflects the movement from underground coal mining, as represented by Cape Breton mines, to surface or open pit mining, as represented by new mining operations in Western Canada. The amount of coal that a worker can produce is much greater in a surface coal-mine as such operations are much less expensive to operate. In the 1960s and 1970s there were large investments in coal mines in Western Canada. These investments embodied the latest in coal-mining technology and had a major positive impact on labour productivity. There has been much less investment since 1981, but the capital in place seems to have continued to produce very strong productivity gains.
E. Manufacturing Industries Processing Mineral Products
The natural resource sector not only includes activities associated with the extraction of
natural resources in the primary sector, but also activities associated with the processing of natural resources in the manufacturing sector. The two most important manufacturing industries that process and transform raw materials are primary metals and non-metallic mineral products. The metal fabricating industry uses semi-finished goods made from natural resources, although not as much to process them, but to transform them into finished products. The motor vehicle parts industry also uses processed intermediate goods such as sheet metal, but this sector is not traditionally considered part of the natural resource sector. It is included here because it is of interest to Natural Resources Canada.
45
1) Primary metals The value added produced by the primary metals sector in 2000 was $7,101 million
(1992 dollars) representing 0.93 per cent of GDP. The sector was concentrated in Ontario, with 54 per cent of employment in 2001 (Chart 21), followed by Quebec (32 per cent), British Columbia (5 per cent), and Alberta, Manitoba and remaining provinces all with 2 to 4 per cent.
The primary metals sector consists of a number of different industries. The two most
important industries are primary steel and non-ferrous metal smelting and refining, which in 1997 accounted for 38.0 per cent and 27.9 per cent respectively of output. Other industries (with output shares in brackets) were steel, pipe and tube industries (10.5 per cent), iron foundries (8.2 per cent), aluminum rolling, casting, extruding industries (5.2 per cent), copper and alloy rolling, casting and extruding (3.0 per cent), and other metal rolling, casting, etc. (6.6 per cent).
Charts 22 and 23 show trends in output per hour and total factor productivity respectively
in the primary metals industry and all sub-industries over the 1961-2000 period. Both labour and total factor productivity growth in primary metals exceeded the all industries average in both the 1961-2000 and 1989-2000 periods (Table 17). In the first period, output per hour advanced 2.56 per cent per year and total factor productivity growth 2.08 per cent. In the 1990s, the figures were even more impressive: 3.15 per cent and 2.97 per cent respectively. All major industries within the primary metal sector experienced above average labour productivity growth.
The strong productivity performance of the Canadian primary metals sector over the last
40 years and over the past decade reflects a number of influences. Possibly the most important have been the intense pressures the industry has faced to remain internationally cost competitive, which have spurred productivity gains. The US steel industry, for example, was not particularly successful in raising productivity and has consequently fared much worse than its Canadian counterpart over the last 20 years. The substantial investments made in the 1960s and 1970s, which modernized the sector, appear to have laid the basis for solid productivity growth. Compositional shifts in employment within the sector appear to have contributed little to the sector’s productivity growth.
2) Non-metallic mineral products
The total value added of non-metallic mineral production in Canada in 2001 was $4.6
billion (1997 dollars), representing 0.49 percent of total GDP. The industry includes hydraulic cement, concrete products, ready-mix concrete, glass products, clay products, abrasive industries, lime industries, and miscellaneous non-metallic mineral products (e.g. gypsum and potentially diamonds). Cement and concrete products accounted for about one half the value of output (47.8 per cent in 1997) while glass products accounted for around one quarter (23.1 per cent), and the remaining industries the remaining quarter.
The non-metallic mineral products industry was concentrated in Ontario, with this
province accounting for 49 per cent of output (Chart 18), followed by Quebec (23 per cent), Alberta (10 per cent), Nova Scotia (2 per cent), Manitoba (2 per cent), and remaining provinces (14 per cent). In terms of the distribution of employment by province, Ontario was again the dominant province (46 per cent of total employment in the sector), followed by Quebec (29 per

46
cent), Alberta (9 per cent), British Columbia (9 per cent), New Brunswick (2 per cent) and other provinces (5 per cent). In terms of weight in the provincial economy, non-metallic metal production was most important in Quebec, accounting for 0.49 per cent of provincial employment, although this was not much above the sector weight in national employment of 0.39 per cent.
Charts 19 and 20 show trends in output per hour and total factor productivity respectively
in the non-metallic mineral products industry and all sub-industries over the 1961-2000 period. Both labour and total factor productivity growth in non-metallic mineral products have exceeded the all industries average in the 1961-2000 and 1989-2000 periods (Table 19), as was the case in the two other mineral-related manufacturing sectors (primary metals and fabricated metals). Labour productivity growth rose at a 2.31 per cent average annual rate in the first period, with total factor productivity advancing 2.13 per cent compared to 1.79 per cent and 1.49 per cent respectively for the all industries average. In the 1990s, the respective productivity growth rates for the sector were 2.27 per cent and 1.95 per cent compared to 1.07 per cent and 1.07 per cent for the all industries average.
Output growth fell 2.46 points to 0.62 per cent per year in the 1990s from 3.08 per cent
per year in 1961-89. Almost all this decline was accounted for by a 2.34 point decrease in the growth rate of total hours worked, and very little by the 0.06 point slowdown in productivity growth.
Among the industries within the non-metallic mineral products sector, the glass industry
enjoyed the strongest productivity growth, with output per hour advancing 4.16 per cent from 1961 to 2000 and an even stronger 6.43 per cent in 1989-2000. Growth rates for labour productivity in the other industries were in the 1-2 per cent range over the 1961-2000 period. Compositional shifts in employment did not significantly contribute to productivity growth at the sectoral level.
The somewhat above average productivity performance of the non-metallic mineral
products sector likely reflects a pace of technological development in the sector slightly above the total economy average. The sector scored around the average in terms of other determinants of productivity growth such as trends in educational attainment, output prices, and capacity utilization.
3) Fabricated metals
The total value added of fabricated metals in Canada in 2000 was $10.9 billion (1992
dollars), representing 1.42 percent of total GDP. Under the 1980 SIC, the industry includes: power boiler and heat exchangers; fabricated structural metal products; ornamental and architectural metal products; stamped, pressed and coated metal products; wire and wire products; hardware, tool and cutlery products; heating equipment; and machine shops. As one sees, these industries are much more associated with the production of finished goods than the processing of raw materials.
The fabricated metals industry was concentrated in Ontario, with this province
accounting for 59 per cent of output in 1999 (Chart 24), followed by Quebec (20 per cent),
47
Alberta (8 per cent), British Columbia (7 per cent), Manitoba (3 per cent), and other provinces (3 per cent).
Productivity in fabricated metals manufacturing has outperformed the national average in
both the 1961-2000 and 1989-2000 periods (Table 18). Output per hour grew at a 2.01 per cent average annual rate from 1961 to 2000, with total factor productivity close behind at 1.99 per cent. In the 1990s, productivity growth rates were very similar at 2.13 per cent and 2.23 per cent respectively. All the decline of 1.68 points in output growth in the 1990s was thus accounted for by slower growth in total hours worked.
The above average productivity performance of fabricated metals, like that in the non-
metallic mineral products, likely reflects a pace of technological development in the sector slightly above the total economy average. The sector scored around the average in terms of other determinants of productivity growth such as trends in educational attainment, output prices, and capacity utilization.
4) Motor vehicle parts
The motor vehicle industry is part of the transportation equipment industry. The value
added of the industry in Canada in 2000 was $12.0 billion (1992 dollars), representing 1.56 per cent of total GDP (Table 17). The industry is largely concentrated in Ontario.
Of all the industries covered in this report, motor vehicle parts has experienced the
second best productivity performance after the coal industry. Over the 1961-2000 period, output per hour advanced at a very rapid 4.74 per cent and total factor productivity an equally impressive 4.47 per cent (Table 20). Labour productivity increased more than sixfold over the period. In the 1990s, labour productivity grew at a 4.44 per cent average annual rate and total factor productivity 4.86 per cent.
A key factor behind this robust productivity performance has been the very strong output
growth in the industry, an average 9.42 per cent per year since 1961 and 6.63 per cent since 1989. Starting from a very low base in the early 1960s, the industry has flourished in Canada because of excellent access and close proximity to the US market, as well as to US technologies, cost competitiveness based on the low value of the Canadian dollar during certain periods, particularly in the 1990s, moderate labour costs often in a non-unionized environment, and the emergence of innovative entrepreneurs such as Frank Stronach at Magna Corporation.
5) Total manufacturing
As the four industries discussed above are part of the manufacturing sector, general
analysis of productivity trends in this sector may apply. A key stylized fact has been the massive widening of the Canada-US manufacturing productivity gap. Indeed, since 1994, the Canadian manufacturing sector has experienced an unprecedented increase in its labour productivity gap with the United States, rising 17.3 points from 12.3 per cent to 29.6 per cent.
Bernstein, Harris and Sharpe (2002) have recently published in the International
Productivity Monitor a detailed analysis of this development. They conclude that the widening of
48
the gap reflected both an acceleration of productivity growth in the United States and a deceleration in Canada. Trends in the Canadian and US capital-labour ratios accounted for 30 per cent of the increase in the productivity gap. The deceleration in labour productivity growth in Canadian manufacturing was in part attributable to the fall in the capital-labour ratio, while this ratio increased in the United States, giving rise to accelerating labour productivity growth. The divergent trends in capital intensity are explained in part by trends in the price of labour and investment goods in Canada and the United States. The slower rate of increase in the price of labour in 1994-2000, relative to capital, compared to the first half of the decade, may explain why Canadian manufacturers hired such a large number of workers, which thereby reduced Canadian capital intensity. The rate of increase in the price of labour was also much slower in Canada than in the United States. Moreover, a smaller decline in the price of investment goods, linked to the depreciation of the Canadian dollar, led to a lower rate of capital stock growth, a decelerating capital intensity, and lower rate of labour productivity growth in Canada compared to the US.
Differences in Canadian and US manufacturing TFP growth rates contributed the
remaining 70 per cent of the labour productivity gap. The slower increase in investment per hour growth in Canadian manufacturing may have lead to less embodied technological change than took place in US manufacturing. Measurement problems, in particular the exclusion of temporary help supply workers from manufacturing employment in the United States, appear to account for around one eighth of the Canada-US productivity growth differential. A decline in technological spillovers to Canadian manufacturing arising from lower growth in US manufacturing R&D spending after 1996 may also explain slower Canadian labour productivity growth in Canada. Lastly, new economy developments in the US, as reflected in the sharp deceleration in semiconductor prices caused US manufacturing labour productivity growth to accelerate over the period 1994-2000.
F. Forest Sector
This section presents productivity trends and discusses productivity determinants in the
Canadian forest sector, looking at forestry and logging, wood products, and paper products. Data are only available from 1961 to 2000 so the analysis is confined to the 1961-2000 period. Within that period total economy cyclical peaks of 1973, 1981, 1989, and 2000, the most recent year for which data are available (which is also a cyclical peak) have been used to date subperiods. These years were also the years or very close to the years of peak activity in the three forest sector industries. The mid-point year 1995 has also been used to divide the 1990s into two sub-periods. Charts 30 and 31 show trends in output per hour and total factor productivity respectively in the forest sector aggregate and the three sub-sectors over the 1961-2000 period.
In the analysis of productivity growth, it is very important to focus on cyclically neutral
periods, defined on a peak-to-peak basis, to minimize the influence of short-run cyclical factors on productivity growth. Productivity is most usefully addresed as a long-run concept and it is best to attempt to abstract from the noise created by the business cycle. Let us take an example to illustrate this point. Assume that the forest sector industries experienced rapid productivity growth in the mid and late 1990s. It would be misleading to conclude however that the long-term or trend producitivity performance of the sector was robust. Productivity may have fallen sharply during the recessionary years of the early 1990s and the rapid productivity growth in subsequent
49
years could have been catch-up to regain the pre-recession output level. This is why productivity growth should be measured between cyclical peaks, or from a cyclical peak to the most recent year available when there is no recent peak.
Using material from a recent more detailed study on productivity trends in the Canadian
forest sector that the Centre for the Study of Living Standards (CSLS) conducted for the Forest Products Association of Canada (CSLS, 2002b), this section presents some data on trends in productivity by province. The purpose of examining these provincial productivity trends is to shed light on productivity developments in the 1990s. In the case of all three forest sector industries it was found that national trends did not obtain in all provinces. Natural Resource Canada officials have pointed out that the characteristics of forest sector industries (private/public forest ownership, markets, products produced, etc.)13 differ greatly by region and province. The finding of an inconsistency between national and regional productivity trends in all three forest industries supports this view. The notion of national forest sectors may be of limited use as a territorial unit for the anaysis of productivity trends in the forest sectors. Regional and provincial (or even intra-provincial in the case of the coastal and interior industries in British Columbia) analysis may be more meaningful.
1) Forest sector aggregate
The forest products aggregate consists of three sectors: forestry and logging in the
primary industries, and wood products and paper products, both part of the manufacturing sector. In 1999, more than 93 per cent of Canadian forest products were produced in five
provinces. In order of importance, the five provinces with their respective output shares in brackets were: British Columbia (31.4 per cent), Quebec (27.0 per cent), Ontario (23.1 per cent), Alberta (7.5 per cent), and New Brunswick (4.6 per cent). The shares in Quebec, New Brunswick and Alberta were up from their 1984 levels. Alberta’s share nearly doubled between 1984 and 1999. However, output shares declined in Ontario and British Columbia.
Economic activity in the forest products sector is more important in some provinces than in others. In British Columbia, New Brunswick and Quebec, the forest products sector aggregate share of provincial GDP is higher than the national average. In 1999, it was 6.1 per cent, 5.9 per cent and 3.1 per cent of provincial GDP respectively, compared to the 2.4 per cent national average
Quebec has the largest share of employment in the Canadian forest products sector
aggregate, with 32.1 per cent in 2001, based on the LFS-NAICS estimates (Table 19 and Chart 8). In second place is British Columbia, (24.7 per cent), closely followed by Ontario (24.1 per cent), with Alberta (5.9 per cent) and New Brunswick (5.0 per cent) ranking fourth and fifth respectively. These five provinces account for 92 per cent of the sector’s employment. During the 1987-2001 period, employment shares rose in Quebec and the Prairie provinces and declined in all other provinces. Employment in the forest products sector aggregate as a share of the 13 For example, British Columbia produces more softwood lumber products destined for the US market than other provinces and has suffered more from the Canada/US Softwood Lumber Agreement. The greater public ownership of forests in British Columbia than in say, New Brunswick, also has made the situation more serious in BC.
50
provincial total economy rose only in the three Prairie provinces between 1987 and 2001. The level of labour productivity in the forest products sector is a weighted average of
labour productivity levels in forestry and logging, wood products, and paper products where the weights are the total hours shares. Equally, the rate of growth of labour productivity in the forest products sector is the weighted average growth rate of the three components of the sector. Productivity levels and growth rates are affected by both within industry productivity trends and composition shifts in the relative importance of the three forest product industries.
Output per hour in the forest products sector increased at a 1.97 per cent average annual
rate over the 1961-2000 period (Table 11). As aggregate labour productivity grew at a slightly slower pace (1.79 per cent), the sector’s labour productivity, relative to that of the total economy, increased from 96.6 per cent in 1961 to 103.6 per cent in 2000.
It is interesting to note that over the 1961-2000 period annual labour productivity growth
in the forest products aggregate (1.97 per cent) was lower than in the three industries that make up the sector, logging and forestry (2.21 per cent), wood products (2.13 per cent), and paper products (2.12 per cent). This is explained by compositional shifts in employment shares. Employment in the low labour productivity level wood products sector increased from one third to one half of total forest products employment, putting downward pressure on the forest products sector’s productivity level and productivity growth rate.
Labour productivity grew at a 2.56 per cent average annual rate in 1961-73, fell to 1.85
per cent in 1973-81, rebounded to 2.87 per cent in 1981-89, and fell off again in the 1990s to 0.77 per cent. The much slower growth in the 1990s reflected the negative productivity growth in logging and forestry and wood products, which more than offset the acceleration of productivity growth in paper products. Productivity growth was similar in the first and second halves of the decade (0.88 per cent per year in 1989-1995 and 0.63 per cent in 1995-2000).
The TFP growth rate in the forest products sector is a weighted average of TFP growth in
forestry and logging, wood products, and paper products where the weights are the relative sizes of the sectors. TFP growth rates are affected by both within industry productivity trends and composition shifts in the relative importance of the three forest product industries. TFP for the forest products aggregate increased at a 1.30 per cent average annual rate over the 1961-2000 period, slightly below the rate of advance registered by the total economy (1.49 per cent). Because of composition shifts, this rate of increase was 0.4-0.8 percentage points slower than the TPF growth recorded in two of the three industries that make up the forest products sector.
As the three forest products sectors are relatively heterogeneous and have experienced
different productivity developments, it is more fruitful to analyze productivity developments at the level of the three industries rather than the sector aggregate.
2) Forestry and logging
More than half (58 per cent) of the output of the Canadian forestry and logging industry
was produced in British Columbia in 2001 (Chart 27). Quebec came in second with 16 per cent of the sector’s output, followed by Ontario, Alberta and New Brunswick with respective shares
51
of 10 per cent, 6 per cent, and 5 per cent. British Columbia has seen its share rise significantly, while Ontario saw its share decline by almost 50 per cent. Forestry and logging output as a share of provincial GDP was higher than the national average (0.61 per cent) in three provinces: Newfoundland, New Brunswick and British Columbia. The shares were 0.80 per cent, 1.53 per cent and 2.74 per cent respectively. The sector’s importance in provincial GDP in 1999 was down in all provinces from their 1984 levels, with the exception of Alberta.
Quebec and British Columbia accounted for more than two-thirds of employment in Canada’s forestry and logging sector in 2001, based on the LFS-NAICS estimates. Their respective shares were 36.0 per cent and 31.1 per cent. They were followed by Ontario, New Brunswick and Alberta, which respectively had 10.9 per cent, 7.0 per cent and 5.0 per cent of Canadian forestry and logging sector employment. In terms of contribution to provincial employment, the forestry and logging sector is most important in New Brunswick, accounting for 1.14 per cent of total employment in the province in 2001, compared to 0.36 per cent at the national level. Other provinces where forestry and logging makes an above average contribution to employment are Newfoundland (0.43 per cent), Nova Scotia (0.61 per cent), Quebec (0.56 per cent), and British Columbia (0.86 per cent).
Labour productivity as measured by value added per hour worked grew 2.21 per cent a
year on average in the forestry and logging sector between 1961 and 2000 (Table 8). Growth was faster than in the aggregate economy, where labour productivity grew 1.79 per cent per year on average. Labour productivity in the forestry and logging sector, as a proportion of total economy productivity, therefore grew over the period, going from 99.2 per cent in 1961 to 116.6 per cent in 2000.
Labour productivity in forestry and logging has exhibited two different trends, an
upward one from 1961 to 1989 and a downward one from 1989 to 2000. During the 1961-1973 period, labour productivity growth was rapid at 3.95 per cent per year on average, but only slightly above the average for the aggregate economy (3.42 per cent). Productivity growth decelerated to an average annual rate of increase of 1.83 per cent in the 1973-81 period and then picked up to a 3.41 per cent rate from 1981 to 1989. Natural Resource Canada officials have noted that technological innovations permitting the use of different tree species of different sizes may have contributed to the strong productivity growth in logging and forestry over the 1961-89 period.
From 1989 to 2000, labour productivity fell 0.23 per cent per year on average, the first
period during which aggregate economy productivity growth outstripped that in forestry and logging. The fall in productivity was concentrated in the first half of the decade (-2.03 per cent per year in 1989-95). The second half of the 1990s saw a very strong rebound in output per hour growth in forestry and logging (1.98 per cent per year from 1995 to 2000).
Total factor productivity (TFP), based on total hours worked as the labour input, has been
quite strong in the forestry and logging industry over the 1961-2000 period, advancing at a 2.37 per cent average annual rate, well above the 1.49 per cent rate of the aggregate economy. In the three cyclically-neutral periods up to 1989, TFP growth was strong, with average annual rates of 2.65 per cent in 1961-73, 1.51 per cent in 1973-81, and a very robust 5.53 per cent in 1981-89. In this third period, a large increase in output growth combined with a plummeting capital stock
52
produced a surge in TFP growth. TFP growth fell off sharply in the 1990s, increasing only 0.45 per cent between 1989 and 2000. The decline was concentrated in the first half of the decade (-1.95 per cent per year between 1989 and 1995), as TFP growth rebounded in the second half of the decade (3.39 per cent in 1995-2000).
Unfortunately, it appears to be not possible to obtain a breakdown of either employment
or output between the logging and forestry components of the logging and forestry industry. Such a breakdown would potentially be very useful in shedding light on the fall in labour productivity in the sector in the 1990s. The measurement of the output of forestry activities is much more difficult that of logging activities. Unlike the number of board feet of timber cut, there is no one physical output indicator in forestry, and labour input may be used as a proxy for output, giving a downward bias to productivity estimates. One hypothesis advanced by Natural Resources Canada officials to account for the poor productivity performance of the logging and forestry industry in the 1990s has been the introduction of sustainable forest management practices such as the BC Forest Practices Code. These practices, which can be labour intensive, may have no short-term or even medium term effect on forest sector output. Yet the labour and capital inputs needed to implement these practices are included in the calculation of the sector’s productivity.
Productivity trends by region or province may shed light on the negative national
productivity growth in the 1990s (CSLS, 2002b: Table 36). For the 1989-98 period (provincial estimates on a SIC basis are only available to 1998), while output per hour in Canada in logging and forestry fell 2.41 per cent per year, there were significant differences across provinces. All provinces to the east of Saskatchewan experienced negative productivity growth, while the three most westerly provinces experienced positive growth. The largest decline in output per hour was recorded in Nova Scotia (-12.2 per cent per year), followed by Manitoba (-9.1 per cent), Ontario (-5.9 per cent), Newfoundland (-5.4 per cent), New Brunswick (-5.0 per cent), and Quebec (-4.5 per cent). In contrast, output per hour advanced at a 7.5 per cent average annual rate in Saskatchewan, followed by 3.7 per cent in Alberta and 0.5 per cent in British Columbia. The same pattern characterized TFP growth by province. Saskastchewa and British Columbia enjoyed positive TFP growth while all other provinces (including Alberta) experienced a decline. The source of this regional productivity variation is unclear.
For the 1961-1997 period, the average annual growth rate of nominal compensation per
hour in logging and forestry was 7.25 per cent compared to 6.79 per cent for the total economy. There was relatively more incentive to substitute capital for labour in this sector compared to the economy in general yet the capital-labour ratio fell. Real value added per hour increased during the same period and did so at a faster pace than in the economy in general. During the more recent 1989-1997 period, nominal average hourly compensation grew much faster in the forestry and logging sector, 3.68 per cent a year on average, compared to 2.75 per cent in the economy in general. Yet the capital-labour ratio fell at an even greater rate. Moreover, the higher absolute level of hourly labour compensation in the sector, 137.0 per cent of the total economy in 2000 does represent an additional incentive to substitute capital for labour. Thus the falling capital-labour ratio cannot be explained by the falling price of labour, but must be linked to technological developments in the sector.
The rate of increase in the average years of educational attainment in forestry and logging
53
(Exhibit 3) was a dismal 0.03 per cent per year from 1976 to 1989 (data from the LFS are not available before 1976), well below the 0.53 per cent increase for all industries. The relative educational attainment of workers in this sector thus fell from 87.4 per cent of the all industries average in 1976 to 82.7 per cent in 1989. Despite this development, both labour and total factor productivity growth were well above the economy-wide average over the period. Human capital accumulation was not a source of productivity growth in this sector.
Equally, the fall-off in labour and total factor productivity growth in forestry and logging
after 1989 is not due to a slowdown in human capital accumulation. The rate of increase in the average years of educational attainment of workers in the sector actually picked up to 0.98 per cent per year between 1989 and 2001, slightly above the all industries average of 0.96 per cent.
It is unlikely that trends in unionization have had a major impact on productivity growth
in logging and forestry as the changes in the unionization rate in the sector have been relatively small. The proportion of unionized workers in total employees fell from 46.8 per cent in 1976 (the first year for which data are available) to 42.6 per cent in 1989, then rising slightly to 43.1 per cent in 1995.
It is equally unlikely that capacity utilization trends can shed light on productivity
developments. Between 1962 and 1989 the rate of capacity utilization fell from 90.5 per cent to 84.8 per cent, yet this was the period when productivity growth was very strong. From 1989 to 1990 capacity utilization increased from 84.8 per cent to 86.3 per cent. This development, in principle, should foster productivity growth. Yet labour productivity growth over the period was negative.
The incidence of workplace injuries decreased a significant 48 per cent in the forestry and
logging sector in Canada between 1984 and 1998, as it did in the economy as a whole, where the decrease was 41.5 per cent. The incidence of fatalities also fell. And yet, the number of injuries and fatalities as a percentage of all industries, which were 1.79 per cent and 4.44 per cent in 1998, remained well above the sector’s employment share (which was 0.52 per cent in 1998). This means there are relatively more injuries and fatalities in the forestry and logging industries than in the average industry. As the relative rate in injuries in the sector were relatively constant over the period, it is unlikely to account for the slowdown in productivity growth after 1989.
Between 1961 and 1989 the implicit price deflator for logging and forestry advanced at a
6.08 per cent average annual rate, almost identical to that of all industries (6.05 per cent). In contrast to this relative price stability, in the 1989-97 period the relative price of logging and forestry output increased 4.78 per cent per year based on nominal increases of 6.62 per cent in logging and forestry and 1.84 per cent for all industries. This development may have lead to the exploitation of higher cost, poor quality resources, with negative consequences for labour and total factor productivity.
Two variables for which data are not available, but which may account for the rapid
growth in the 1961-89 period and the deceleration after 1989 are innovation and regulation. One hypothesis to explain the productivity pattern may be that the pace of technological change in the sector, particularly change that is not embodied in the capital stock, was very rapid in the 1960s, 1970s, and 1980s, fostering strong productivity growth. But it fell off after 1989, producing
54
slower productivity growth. A detailed analysis of trends in technological innovation in the sector would be needed to prove or disprove this hypothesis.
A second hypothesis is that 1961-89 was a period of minimal regulation in the logging
and forestry sector, with little or no negative effects for productivity growth. The introduction of more regulations in the 1990s may then have impeded productivity growth, The measurement of the burden is difficult and controversial. More research is needed on this hypothesis before conclusions are drawn.
3) Wood products
The British Columbia wood products sector had the largest share of the national wood
products output, with 32 per cent in 1999 (Chart 28). It was followed by Quebec, Ontario, Alberta and New Brunswick, with shares of 29 per cent, 21 per cent, 9 per cent and 4 per cent respectively. The other provinces accounted for 5 per cent. The major structural shift over the period was the fall in British Columbia’s share, down 42.6 per cent. All other provinces experienced increases in their shares.
Quebec and British Columbia again accounted for more than 60 per cent of employment
in the Canadian wood products sector in 2001. The five most important provinces for wood product employment (share of national total in brackets) in 2001 were Quebec (32.0 per cent), British Columbia (30.1 per cent), Ontario (20.0 per cent), Alberta (7.0 per cent), and New Brunswick (4.3 per cent). Quebec saw its share advance 8.3 percentage points between 1987 and 2001, while British Columbia’s share declined 7.0 points.
Employment in the wood products sector as a share of total provincial employment was
above the national average (1.09 per cent) in 2001 in only three provinces: British Columbia (2.55 per cent), New Brunswick (2.09 per cent), and Quebec (1.51 per cent). In 2001, the shares of wood products employment in total provincial employment was up from the 1987 levels in all provinces except Prince Edward Island, New Brunswick and British Columbia.
Labour productivity in the wood products sector grew 2.13 per cent a year on average
between 1961 and 2000 (Table 9). Labour productivity growth in the aggregate economy was somewhat slower at 1.79 per cent per year on average over the same period. Labour productivity in the wood product sector, as a proportion of the total economy, thus increased from 67.2 per cent in 1961 to 76.6 per cent in 2000.
In the 1961-73 period, output per hour in wood products advanced at a 2.65 per cent
average annual rate. This growth rate then accelerated to 3.45 per cent in 1973-81 and an even stronger 3.78 per cent in 1981-89. Natural Resource Canada officials have noted that the expansion of oriented strand boards (OSB) and engineered wood products (EWP) may have boosted productivity in the wood products industry over the 1961-89 period.
The situation changed markedly in the 1990s, with labour productivity falling at a 0.55 per cent average annual rate between 1989 and 2000. Unlike forestry and logging that experienced a rebound in productivity growth in the second half of the 1990s, the productivity growth performance of wood products actually deteriorated, from -0.35 per cent per year in
55
1989-95 to -0.79 per cent in 1995-2000.
The Aggregate Productivity Measures series produced by Statistics Canada provides
indexes for output per hour growth for the 1961-97 period for five industries within the woods products sector (1997 shares of total hours worked in brackets): sawmill, planing mill, and shingle mill production industries (52 per cent); sash, door and other millwork industries (29 per cent); veneer and plywood industries (6 per cent); wooden box and coffin industries (3 per cent); and other wood industries (10 per cent). The major structural change in the wood products industries over the 1961-97 period was the increased importance, in terms of hours worked, of the sash, door and other millwork industry and decline in the sawmill, planing mill and shingle mill production industries. As the productivity levels of these industries are relatively similar, these shifts in labour input within the industry has minimal effects on the overall labour productivity growth of the sector.
Over the 1961-97 period, output per hour growth was strongest in the most important
wood products industry, sawmills, planing mills, and shingle mills at 3.13 per cent per year over the 1961-97 period, and relatively weak (0.99 per cent per year) in the second largest industry, namely sash, door and other millwork.
The situation reversed itself in the 1990s (1989-97) when productivity growth fell 1.13
per cent per year in sawmills, planing mills, and shingle mills, but rose 1.89 per cent in sash, door and other millwork. The negative labour producivity growth experienced by the wood products sector in the 1990s was experienced in three of the five industries, with output per hour falling in veneer and plywood industries (-0.45 per cent) and in wood box and coffin industries (-0.65 per cent). Output per hour rose at a 2.00 per cent rate in other wood industries.
Natural Resource Canada officials have noted that the clasification of the wood products
industry may be too broad for meaningful productivity analysis and that analysis at the level of the major components of the industry (sawmills, veeneer/plywood/EWRP, other wood products) may be more meaningful. Unfortunately, capital stock data are not publicly available at this level so one would be limited to analysis of labour productivity only.
The wood products sector experienced TFP growth of 1.73 per cent per year over the
1961-2000 period, above the all industries average of 1.49 per cent (Table 9). As in forestry and logging, TFP growth was strong up to the 1990s, advancing 1.39 per cent per year in 1961-73, 2.67 per cent in 1973-81, and 4.09 per cent in 1981-89. In contrast, TFP declined at a 0.26 per cent average annual rate in the 1990s, with all the fall taking place during the first half of the decade (-1.06 per cent per year in 1989-95 versus 0.70 per cent in 1995-2000).
As in logging and forestry, the key productivity development in the wood products sector
has been the deterioration of productivity performance in the 1990s. Output per hour declined at a 0.55 per cent average annual rate from 1989 to 2000 compared to an annual increase of 3.20 per cent from 1961 to 1989, a slowdown of 3.75 points. The slowdown in total factor productivity growth was responsible for about four-fifths of the labour productivity slowdown and the fall-off in growth of the capital-labour ratio the remaining fifth. Total factor productivity growth fell 2.78 points from 2.52 per cent per year in 1961-89 to -0.26 per cent in 1989-2000. Capital-labour ratio growth fell 4.17 points from 2.92 per cent in 1961-89 to –1.25 per cent in
56
1989-2000. The post-1989 labour productivity slowdown reflected a decline in output growth (2.76 points) that was not matched by a commensurate fall in labour input growth. Indeed, total hours growth actually accelerated 1.04 points to 2.25 per cent in 1989-2000 from 1.21 per cent in 1961-89.
Productivity trends by region or province may again shed light on the negative national
productivity growth in the 1990s (CSLS, 2002b: Table 37). For the 1989-98 period (provincial estimates on a SIC basis are only available to 1998), while output per hour in Canada in logging and forestry fell 1.88 per cent per year, there were significant differences across provinces. The three most westerly provinces, Ontario and Nova Scotia all experienced negative productivity growth, while the four other provinces (no data are available for Prince Edward Island) enjoyed positive productivity growth. The largest decline in output per hour was recorded in Nova Scotia (-7.7 per cent per year), followed by Alberta (-5.9 per cent), Ontario (-2.3 per cent), British Columbia (-2.3 per cent), and Saskatchewan (-2.1 per cent). In contrast, output per hour advanced at a 5.9 per cent average annual rate in Newfoundland, followed by 3.9 per cent in Manitoba, 0.9 per cent in New Brunswick, and 0.6 per cent in Quebec. The same pattern characterized TFP growth by province, with large declines in British Columbia, Alberta and Ontario and growth in Quebec. Data are not available for other provinces. Again, the source of this regional productivity variation is unclear and requires more research.
Compensation per hour worked in the wood products sector increased at a 8.21 per cent
average annual rate over the 1961-89 period, almost identical to that for all industries. In 1989-97, there was also little difference in compensation trends: 3.13 per cent in wood products versus 2.76 per cent in all industries. These trends cannot account for the falloff in capital deepening after 1989.
As noted, there has been no compositional shift effect on labour productivity over the
1961-1997 period in the wood products sector, according to the APM data. The weighted sum using the 1961 weights and the weighted sum using the yearly hour shares are almost identical, as are the average annual growth rates. The hours shares show that there has been a compositional shift between 1961 and 1997, that is labour shares have changed over the period, but it did not have an effect on labour productivity. Labour productivity levels in the wood products sector sub-industries have changed in such a way to cancel out the effect of the compositional shift.
The average educational attainment of workers in wood products increased at a 0.51 per
cent average annual rate over the 1976-89 period (Exhibit 3), almost identical to the economy-wide average (0.53 per cent). The average educational attainment in the sector remained stable at around 90 per cent of the all industries average. This trend is consistent with the rapid total factor productivity over the period.
The falloff in labour and total factor productivity growth in the 1990s does not appear to
be linked to any deterioration in human capital accumulation. The average years of educational attainment continued to increase at 0.47 per cent per year, down only slightly from that experienced in the pre-1990 period.
Large establishments tend to have higher productivity levels than smaller establishments
57
because of economics of scale and incresing returns. An increase in the average size of a plant over time in an industry often contributes to productivity growth. This seems not to have been the case in the wood products industry. The number of establishments fell by 37 per cent between 1989 and 1999 and the average number of employees per establishment rose from 37 to 62 (Exhibit 9). Yet both labour and total factor productivity declined.
The capacity utilization trends in the wood products sector cannot account for the
slowdown (Exbitit 6). Capacity utilization was 76.8 per cent in 1962 and 77.9 per cent in 1989, but rose to 85.1 per cent in 2000. Average capacity utilization was no lower in the 1989-2000 period than in 1961-1989.
Contrary to the forestry and logging sector, there was a definite downward trend in the
wood products sector’s unionization rate (Exhibit 8). It fell from 51.5 per cent in 1976 to 24.6 per cent in 1995, but almost all the decline had taken place by 1989 (25.6 per cent). One hypothesis might be that the falling unionization spurred productivity growth in the pre-1989 period by the elimination of productivity-reducing workplace regulations embedded in collective agreements, and that the end of the decline after 1989 saw the erosion of this source of productivity growth. However, this development is unlikely to account for a significant proportion of the slowdown.
The implicit price deflator for the wood products sector grew at a 5.23 per cent rate in the
1961-89 period, slightly below that of all industries (6.05 per cent). From 1989 to 1997, however, it was a different story. The deflator increased at a 7.42 per cent average annual rate, compared to only 1.84 per cent for all industries, a massive increase in the relative price of wood products. This may have led to the expansion of low productivity firms, with a negative effect on productivity through a composition effect. Indeed, Natural Resources Canada officials have identified this development as a likely explanation for the poor productivity performance of the wood products industry in the 1990s. The rate of growth of hours worked in the sector doubled between 1961-89 and 1989-2000.
4) Paper products
Ontario’s paper products sector accounted for around one third (35 per cent) of the output
in the Canadian paper products sector in 1999 (Chart 29). It was followed by Quebec, British Columbia, Alberta and New Brunswick, with respective shares of 30 per cent, 16 per cent, 7 per cent and 5 per cent. The shares were up from their 1984 level in New Brunswick and Alberta. This latter province in particular experienced more than a doubling of its share from 3.2 per cent in 1984. In contrast, shares declined between 1984 and 1999 in Quebec, British Columbia and, most importantly, in Ontario where it fell 4.3 percentage points from 38.2 per cent.
In terms of relative importance for the provincial economy, paper manufacturing was
most crucial in New Brunswick (2.46 per cent of provincial GDP compared to the national average of 0.92 per cent). It was also of above average importance in Nova Scotia, Quebec and British Columbia (1.46 per cent, 2.46 per cent, 1.34 per cent and 1.24 per cent of provincial GDP respectively).
Again two provinces dominate the paper products sector, but unlike the forestry and
58
logging and wood products sectors where British Columbia and Quebec dominate, it is Ontario and Quebec that accounted for two-thirds of national employment in this sector in 2001. The top five provinces, accounting for over 90 per cent of employment were (per cent of national paper products employment in brackets) Ontario (36.8 per cent), Quebec (30.4 per cent), British Columbia (13.6 per cent), New Brunswick (5.1 per cent), and Alberta (4.6 per cent). New Brunswick, Quebec and British Columbia saw their share decline between 1987 and 2001 while all other provinces saw their share rise during the same period.
The relative importance of the paper products sector for total employment was above the
national average of 0.73 per cent in 2001 in five provinces: New Brunswick (1.67 per cent of provincial employment), Newfoundland (0.99 per cent), Quebec (0.97 per cent), Nova Scotia (0.87 per cent), and British Columbia (0.77 per cent). Following the national trend, paper products sector employment as a proportion of total employment has been decreasing in all provinces during the 1987-2001 period except the Prairie provinces.
Labour productivity grew 2.12 per cent a year on average between 1961 and 2000 in the
paper products sector, based on the APM estimates (Table 10). Growth was slightly faster than in the aggregate economy (1.79 per cent). Thus labour productivity in the paper products sector, as a proportion of the total economy, grew from 120.6 per cent in 1961 to 136.8 per cent in 2000. It is interesting to note that paper products has by far the highest labour productivity levels of the three industries that make up the forest sector. In 2000, output per hour in this sector was 17 per cent higher than in forestry and logging and 79 per cent higher than in wood products.
Labour productivity in paper products advanced at a 1.90 per cent average annual rate
between 1961 and 1973, then fell to 0.92 per cent in 1973-81, before picking up to a 2.09 per cent rate in 1981-89 and an even stronger 3.27 per cent in 1989-2000. The acceleration in the 1990s is in sharp contrast to the productivity growth accelerations that hit forestry and logging and wood products. It is particularly interesting to note that it was the first half of the 1990s, when demand conditions were weak that productivity growth in paper products was especially strong (4.06 per cent per year in 1989-95 versus 2.32 per cent in 1995-2000).
The Aggregate Productivity Measures (APM) series produced by Statistics Canada
provides indexes for output per hour growth for the 1961-97 period for four industries within the paper products sector (1997 shares of total hours worked in brackets): pulp and paper industries (63 per cent); paper box and bag industries (21 per cent); other converted paper products industries (15 per cent); and asphalt roofing industry (1 per cent). In the three largest industries which comprise 99 per cent of the sector’s hours worked, output per hour growth was similar over the 1961-97 period in the 2.2-2.7 per cent range. These three industries have also all enjoyed productivity accelerations in the 1990s, suggesting all three industries are affected by common productivity drivers.
TFP in paper products grew at a 1.08 per cent average annual rate over the 1961-2000
period, below the total economy average of 1.49 per cent (Table 10). In stark contrast to forestry and logging and wood products, TFP growth in this sector was by far the strongest in the 1990s, advancing at a very robust 3.49 per cent average annual rate, above that experienced over the three previous business cycles (0.67 per cent in 1961-73, -0.11 per cent in 1973-81, and –0.34 per cent in 1981-89). TFP growth was strong during both the first half and the second half of the
59
1990s (3.50 per cent in 1989-95 and 3.48 per cent in 1995-2000). Thus, unlike the other two forest sectors, paper products experienced an acceleration of
both labour and total factor productivity growth in the 1990s. Growth in output per hour picked up 1.6 points from 1.67 per cent in 1961-89 to 3.27 per cent in 1989-2000 while total factor productivity accelerated an even stronger 3.34 points from 0.15 per cent to 3.49 per cent. Thus all the acceleration in labour productivity was due to the pick-up in total factor productivity as the growth in the capital-labour ratio fell a very large 5.02 points from 4.41 per cent to -0.61 per cent between periods. Again, unlike the other two forest sector industries, output growth in paper products did not fall off in the 1990s, but labour input and capital stock growth did, 1.75 points and 6.78 points respectively. The paper products sector enjoyed strong productivity gains despite substantial declines in the size of the capital stock. Natural Resources Canada officials have suggested that this result is not surprising. The retirement of older capital would lead to higher average capital productivity in the industry as the remaning capital would be more productive than the retired capital.
A provincial perspective on productivity trends is useful to ascertain if the very strong
productivity growth in paper products in the 1990s at the national level was found in all regions. As was the case with the trends in logging and forestry, this was not the case. For the 1989-98 period (provincial estimates on a SIC basis are only available to 1998), output per hour in Canada in paper products grew 3.31 per cent per year (CSLS, 2002b:Table 38). But there were significant differences across provinces. Two provinces had negative productivity growth, Manitoba at -2.3 per cent per year and British Columbia at -0.9 per cent. All other provinces has positive productivity growth, with Quebec and New Brunswick registering the most robust growth (7.8 and 7.1 per cent per year respectively). The same pattern characterized TFP growth by province, with a large decline in British Columbia and growth in Quebec. Data are not available for other provinces mentioned above. Again, the source of this regional productivity variation is unclear and requires more research.
Of all three forest products sectors, the paper products sector always had the highest
compensation per hour level (Exhibit 4). In 1997, the sector’s compensation per hour level accounted for 162.5 per cent of the level for total economy. Hourly compensation grew at an average annual rate of 8.29 per cent over the 1961-89 period, and 4.27 per cent during the 1989-1997 period. The average annual growth rate for labour compensation for total economy was 7.97 per cent in 1961-89, not much different from paper products. But after 1989 the rate was 2.75 per cent, so there was an industry specific incentive for plant managers to substitute capital for labour. Yet it appears to have had no effect as the capital-labour ratio fell in the 1990s.
The compositional shift has had almost no effect on labour productivity in the paper
products sector over the last forty years, according to APM data. Labour productivity calculated using the 1961 hour shares was slightly more than a dollar per hour above labour productivity calculated using the current hour shares. The hour shares have changed but so did the sub-industries labour productivity levels. Although there was some compositional shift, labour productivity at the wood products sector level was only slightly affected.
The average educational attainment of workers in paper products increased at a 0.59 per
cent average annual rate over the 1976-89 period, slightly above the economy-wide average
60
(0.53 per cent). The average educational attainment in the sector went from 95.5 per cent in 1976 to 96.3 per cent in 1989 of the all industries average. This trend is consistent with the rapid labour and total factor productivity growth over the period. The acceleration in labour and total factor productivity growth in paper products in the 1990s does not appear to be linked to any acceleration in human capital accumulation. In fact, the average years of educational attainment increased by 0.51 per cent per year, down slightly from that experienced in the pre-1990 period.
Trends in the paper products sector’s capacity utilization rate may account for some of
the post-1989 acceleration in productivity growth (Exhibit 6). The utilization rate was 88.0 per cent in 1962, a stable 87.9 per cent in 1989 and then rose to 92.7 per cent in 2000. These high rates of capacity utilization in the late 1990s may have given a cyclical boost to productivity growth.
The rate of unionization in paper products was relatively stable from 1976 to 1989, and
then fell to 54.0 per cent in 1995 (Exhibit 8). It may be possible that the post-1989 decline in the unionization rate contributed to productivity growth but any effect would likely be small.
The paper products sector implicit price index grew at a slightly higher pace than the
GDP implicit price index between 1961 and 1989: 6.73 per cent versus 6.05 per cent. (Exhibit 5). From 1989 to 1997 the situation has been reversed. The deflator for paper products has advanced at only a 0.15 per cent average annual rate compared to 1.84 per cent for the output of all industries and 6.62 per cent for logging and forestry and 7.42 per cent for wood products. In contrast to the situation in the two other forest product industries where the relative price of their products was increasing, that of paper products was falling, occasioning different behaviour. Instead of expanding marginal operations and decreasing productivity through a composition effect, firms in the paper products industry had an incentive to cut less productive and profitable operations. This increases productivity through a composition effect.
Natural Resource Canada officials have suggested that a shift by Canadian paper
producers since the early 1980s toward higher value paper products such as printing and writing paper has increased output and hence productivity growth.
Natural Resource Canada officials have noted that the classification of the paper products
industry may be too broad for meaningful productivity analysis and that analysis at the level of the major components of the industry (pulp, paper, paperboard) may be more meaningful. Unfortunately, capital stock data are not publicly available at this level so one would be limited to analysis of labour productivity.
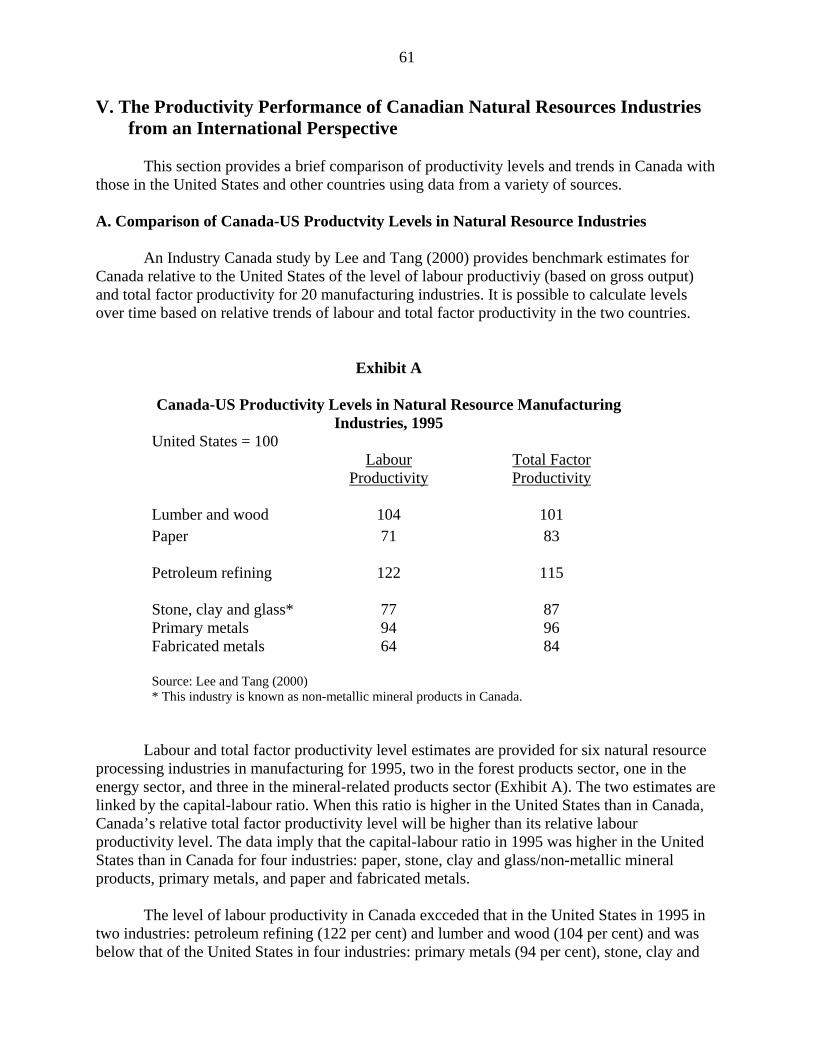
61
V. The Productivity Performance of Canadian Natural Resources Industries from an International Perspective
This section provides a brief comparison of productivity levels and trends in Canada with
those in the United States and other countries using data from a variety of sources.
A. Comparison of Canada-US Productvity Levels in Natural Resource Industries An Industry Canada study by Lee and Tang (2000) provides benchmark estimates for
Canada relative to the United States of the level of labour productiviy (based on gross output) and total factor productivity for 20 manufacturing industries. It is possible to calculate levels over time based on relative trends of labour and total factor productivity in the two countries.
Exhibit A
Canada-US Productivity Levels in Natural Resource Manufacturing Industries, 1995
United States = 100 Labour
Productivity Total Factor Productivity
Lumber and wood 104 101 Paper 71 83 Petroleum refining 122 115 Stone, clay and glass* 77 87 Primary metals 94 96 Fabricated metals 64 84 Source: Lee and Tang (2000) * This industry is known as non-metallic mineral products in Canada.
Labour and total factor productivity level estimates are provided for six natural resource
processing industries in manufacturing for 1995, two in the forest products sector, one in the energy sector, and three in the mineral-related products sector (Exhibit A). The two estimates are linked by the capital-labour ratio. When this ratio is higher in the United States than in Canada, Canada’s relative total factor productivity level will be higher than its relative labour productivity level. The data imply that the capital-labour ratio in 1995 was higher in the United States than in Canada for four industries: paper, stone, clay and glass/non-metallic mineral products, primary metals, and paper and fabricated metals.
The level of labour productivity in Canada excceded that in the United States in 1995 in
two industries: petroleum refining (122 per cent) and lumber and wood (104 per cent) and was below that of the United States in four industries: primary metals (94 per cent), stone, clay and

62
glass (77 per cent), paper (71 per cent), and fabricated metals (64 per cent). The level of total factor productivity in Canada exceeded the US level in the same two industries and was less in the same four industries.
The fact that two-thirds of Canada’s natural resources-related manufacturing industries
have lower productivity levels than their US counterparts should not be surprising given that it is widely recognized that Canada’s manufacturing sector has a productivity gap with the United States. According to estimates prepared by the Centre for the Study of Living Standards, in 1995 the level of output per hour in the overall Canadian manufacturing sector was 86 per cent of the US level while the level of total factor productivity was 93 per cent of the US level (Bernstein, Harris and Sharpe, 2002).
A document produced by Natural Resources Canada (2000) confirms the poor relative
labour productivity level of Canada’s paper industry and strong performance for the wood industry. It found that in 1997 a Canadian worker produced in one hour 0.20 tons of newsprint, while the US counterpart produced 0.28 tons, giving a productivity relative of 71 per cent, identical to the figure in Exhibit A. In contrast, a worker in 1997 produced in one hour 0.53 cubic metres of lumber in Canada, compared to 0.38 in the United States. Canada’s productivity level in this sector was thus 139 per cent of that in the United States, well above the relative of 104 per cent given in Exhibit A.
The Natural Resources Canada study also provided estimates of relative labour
productivity levels in physical terms for five industries or commodities: gold, iron ore, uranium, coal, and oil and gas. In four of the five cases Canada enjoyed higher productivity levels than its US counterpart, and for two industries the gap was in Canada’s favour by a wide margin. For example, in 1997 a worker in the uranium industry in Canada produced 7.2 kilograms of uranium per hour, compared to only 2.3 kilograms for the US counterpart, over three times as much. A Canadian worker in the oil and gas industry produced 100.8 barrels of oil and gas equivalent per hour, twice the 50.7 barrels produced in the United States. In terms of gold, a worker in Canada produced 0.33 troy ounces in one hour, compared to 0.29 in the United States, a 14 per cent advantage. For the iron ore industry, one hour of work in Canada produced 4.2 tons of iron ore, compared to 3.7 in the United States, representing again a 14 per cent higher productivity level in this country. Only in the coal industry was Canada less productive, producing 5.0 tons of coal per hour compared to 5.9 tons in the United States, a 15 per cent productivity gap.
B. Comparison of Canada-US Productvity Growth in Natural Resources Processing
Manufacturing Industries Exhibit B compares labour and total factor productivity growth rates for six natural
resources processing manufacturing industries in Canada and the United States in the 1990s. The labour productivity growth rates in the different industries were quite similar between the two countries. The only industry with negative labour productivity growth in either country was wood products. Canada enjoyed faster labour productivity growth in four of the six industries.
Total factor productivity growth rates were more dissimilar than labour productivity
growth rates between the two countries, with Canadian performance much better than US performance. Indeed, total factor productivity growth in all six industries was greater in Canada
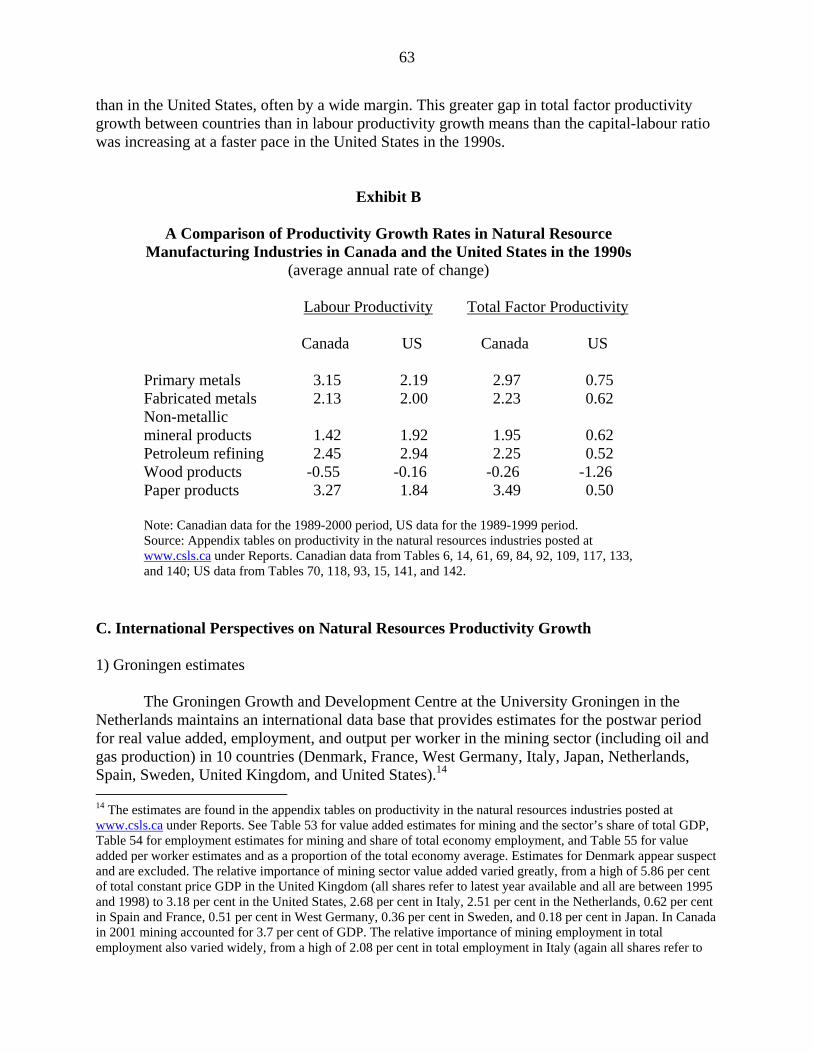
63
than in the United States, often by a wide margin. This greater gap in total factor productivity growth between countries than in labour productivity growth means than the capital-labour ratio was increasing at a faster pace in the United States in the 1990s.
Exhibit B
A Comparison of Productivity Growth Rates in Natural Resource Manufacturing Industries in Canada and the United States in the 1990s
(average annual rate of change) Labour Productivity Total Factor Productivity Canada US Canada US Primary metals 3.15 2.19 2.97 0.75 Fabricated metals 2.13 2.00 2.23 0.62 Non-metallic mineral products
1.42
1.92
1.95
0.62
Petroleum refining 2.45 2.94 2.25 0.52 Wood products -0.55 -0.16 -0.26 -1.26 Paper products 3.27 1.84 3.49 0.50 Note: Canadian data for the 1989-2000 period, US data for the 1989-1999 period. Source: Appendix tables on productivity in the natural resources industries posted at www.csls.ca under Reports. Canadian data from Tables 6, 14, 61, 69, 84, 92, 109, 117, 133, and 140; US data from Tables 70, 118, 93, 15, 141, and 142.
C. International Perspectives on Natural Resources Productivity Growth
1) Groningen estimates
The Groningen Growth and Development Centre at the University Groningen in the
Netherlands maintains an international data base that provides estimates for the postwar period for real value added, employment, and output per worker in the mining sector (including oil and gas production) in 10 countries (Denmark, France, West Germany, Italy, Japan, Netherlands, Spain, Sweden, United Kingdom, and United States).14 14 The estimates are found in the appendix tables on productivity in the natural resources industries posted at www.csls.ca under Reports. See Table 53 for value added estimates for mining and the sector’s share of total GDP, Table 54 for employment estimates for mining and share of total economy employment, and Table 55 for value added per worker estimates and as a proportion of the total economy average. Estimates for Denmark appear suspect and are excluded. The relative importance of mining sector value added varied greatly, from a high of 5.86 per cent of total constant price GDP in the United Kingdom (all shares refer to latest year available and all are between 1995 and 1998) to 3.18 per cent in the United States, 2.68 per cent in Italy, 2.51 per cent in the Netherlands, 0.62 per cent in Spain and France, 0.51 per cent in West Germany, 0.36 per cent in Sweden, and 0.18 per cent in Japan. In Canada in 2001 mining accounted for 3.7 per cent of GDP. The relative importance of mining employment in total employment also varied widely, from a high of 2.08 per cent in total employment in Italy (again all shares refer to
64
Real output per worker advanced at a 3.73 per cent average annual rate from 1981 to
1989 in mining, quarries and oil wells in Canada. The Gronginen data base shows that five of the nine countries for which estimates are available experienced faster output per worker growth over this period: United Kingdom (8.25 per cent), Spain (8.13 per cent), United States (5.73 per cent), Sweden (4.41 per cent), and Italy (3.80 per cent). The four other countries experienced slower productivity growth: France (2.11 per cent), Japan (1.25 per cent), West Germany (-0.44 per cent), and the Netherlands (-4.10 per cent). Canada’s labour productivity performance in the mining sector was thus about average in the 1980s by international standards.
But Canada’s relative productivity growth performance deteriorated in the 1990s. From
1989 to 2000 output per worker in mining, quarries and oil wells in Canada grew at a 3.24 per cent average annual rate. Seven of the nine countries for which data are available exceeded this growth rate, some by large margins. From 1989 to the most recent year for which data are available (1995 to 1998), output per worker advanced at a 17.80 per cent average annual rate in the United Kingdom, followed by 7.57 per cent in Spain, 6.30 per cent in France, 5.06 per cent in Sweden, 4.92 per cent in Japan, 4.10 per cent in the United States, and 3.75 per cent in West Germany. Only two countries fared worse than Canada in terms of labour productivity growth in the 1990s: Italy (2.77 per cent) and the Netherlands (2.19 per cent).
2) Statistics Finland productivity estimates
The Centre for the Study of Living Standards has obtained from Statistics Finland
estimates of labour and total factor productivity levels and growth rates for the wood products and paper products industries for the 1961-99 period.15 These estimates show much faster productivity growth rates in these two sectors than experienced in either Canada or the United States.
a) wood products
Labour productivity, defined as real value added per hour worked, grew much faster in
wood products in Finland than in North America during the 1975-99 period. The average annual growth rate in Finland’s wood products sector was 6.00 per cent while it was 2.19 per cent in Canada and 0.70 per cent in the United States. The 1990s have seen very poor labour productivity performance in wood products in both Canada and the United States, with negative growth in both countries over the 1989-1999 period. In contrast, Finland continued to enjoy very strong labour productivity growth at an average annual rate of 5.08 per cent.
A study by Industry Canada economists (Lee and Tang, 2000) found that in 1995
Canada’s labour productivity in wood products was 104 per cent of that in the United States. A Finnish study (Maliranta, 2000) found that in 1990 Finnish labour productivity was 90 per cent of that in the United States. These benchmark estimates have been combined with the labour latest year available) to 0.46 per cent in West Germany, 0.43 per cent in the United States, 0.39 in France, 0.30 in the United Kingdom, 0.28 per cent in Spain, 0.23 per cent in Sweden, 0.13 per cent in the Netherlands, and 0.11 per cent in Japan. In Canada in 2001 mining accounted for 1.0 per cent of total employment. Oil and gas production is defined as part of the mining sector and contributes the most to value added. 15 The estimates are found in (CSLS, 2002b: Tables 55-59).
65
productivity growth rates to produce relative labour productivity levels for Canada and the United States, Finland and the United States, and Finland and Canada for the 1975-1999 period.
Over the 1975-99 period, Canada and Finland both greatly improved their labour
productivity in the woods products sector relative to the United States. Canada’s relative labour productivity level increased from 73.5 per cent of the US level in 1975 to 104.4 per cent in 1999, peaking at 106.9 per cent in 1997, while that of Finland went from 45.7 per cent to 156.4 per cent. During the same period, Finland caught up and surpassed Canada. The Canadian labour productivity level fell from 160.9 per cent of the Finnish level in 1975 to 66.8 per cent in 1999.
Total factor productivity growth in the wood products sector was considerably faster in
Finland than in the United States and Canada over the 1975-99 period. It grew 4.97 per cent a year on average in Finland while it grew 2.35 per cent in Canada and 0.42 per cent in the United States. In the 1990s, total factor productivity growth was near zero in Canada and the United States, but was still robust in Finland.
Lee and Tang found that in 1995 Canada’s total factor productivity in wood products was
101 per cent of that in the United States. Maliranta, 2000 found that in 1990 Finnish total factor productivity was 75 per cent of that in the United States. These benchmark estimates have been combined with the total factor productivity growth rates to produce relative total factor productivity levels for Canada and the United States, Finland and the United States, and Finland and Canada for the 1975-99 period.
Over the 1975-99 period, Canada and Finland both greatly improved their total factor
productivity in the woods products sector relative to the United States, as had been the case with labour productivity. Canada’s relative total factor productivity level increased from 72 per cent of the US level in 1975 to 114 per cent in 1999, while that of Finland went from 47 per cent to 137 per cent. During the same period, Finland caught up and surpassed Canada. The Canadian total factor productivity level fell from 153 per cent of the Finnish level in 1975 to 83 per cent in 1999.
b) paper products
Labour productivity in the paper products sector grew much faster in Finland than in
North America during the 1975-1999 period, as was the case for the wood products. The average annual growth rate in Finland’s wood products sector was 6.74 per cent while it was 3.07 per cent in Canada and 2.14 per cent in the United States. The superior Finnish performance also occurred in the three sub-periods (1975-81, 1981-89, and 1989-99).
Lee and Tang found that in 1995 Canada’s labour productivity in paper products was 71
per cent of that in the United States. Maliranta found that in 1990 Finnish labour productivity was 127 per cent of that in the United States. These benchmark estimates have been combined with the labour productivity growth rates to produce relative labour productivity levels for Canada and the United States, Finland and the United States, and Finland and Canada for the 1975-1999 period.
Over the 1975-99 period, Canada and Finland both improved their labour productivity in
66
the paper products sector relative to the United States, although Finland’s performance was much better. Canada’s relative labour productivity level increased from 57.5 per cent of the US level in 1975 to 71.4 per cent in 1999, indicating that a 28.6 percentage point gap still existed between Canadian and US labour productivity levels in paper products. Finland’s level went from 63.3 per cent to 182.0 per cent of the US level, an incredible increase. Canada’s labour productivity level fell from 90.8 per cent of the Finnish level in 1975 to 39.2 per cent in 1999.
Total factor productivity growth in the paper products sector, as in the wood products
sector, was considerably faster in Finland than in the United States and Canada over the 1975-1999 period. It grew 5.30 per cent a year on average in Finland while it increased 2.08 per cent in Canada and only 0.31 per cent in the United States.
Lee and Tang found that in 1995 Canada’s total factor productivity in paper products was
83 per cent of that in the United States. Maliranta found that in 1990 Finnish labour productivity was 98 per cent of that in the United States. These benchmark estimates have been combined with the total factor productivity growth rates to produce relative total factor productivity levels for Canada and the United States, Finland and the United States, and Finland and Canada for the 1975-1999 period.
Over the 1975-99 period, Canada and Finland both improved their total factor
productivity in the paper products sector relative to the United States, as had been the case with labour productivity. Canada’s relative total factor productivity level increased from 61 per cent of the US level in 1975 to 89 per cent in 1999, while that of Finland went from 48.3 per cent to 149.5 per cent. During the same period, the Canadian total factor productivity level fell from 126 per cent of the Finnish level in 1975 to 60 per cent in 1999.
VI. Research Findings, Agenda for Further Research and Conclusion
A. Research Findings This section outlines the major research findings of the report. These finding are divided
into two main areas: general findings that pertain to all or most natural resources industries and industry-specfic findings. 1) General findings
• A first key finding is that natural resources industries tend to have above average
labour productivity levels and in some cases extremely above average levels. In 2000, only two of 20 natural resource industries (wood products and asbestos mining) had a level of output per hour below the all industries average. The average labour productivity level of all natural resource industries was almost twice the all industry average and the average productivity level of the primary natural resources industries was almost three times the all industries average. The above average capital intensity of production in natural resource industries as well as high wages account for these high labour productivity levels.
67
• A second key finding is that both labour and total factor productivity growth in
natural resource industries has tended to be above the all industries average. In the 1961-2000 period, 15 of the 17 natural resource industries experienced faster labour productivity growth than the all industries average and 12 experienced faster TFP growth. In the more recent 1989-2000 period, again the vast majority of natural resource industries (13 of 17) experienced above average labour productivity growth and TFP growth (11 out of 17 industries). The ability of firms to substitute capital for labour in the production processes of natural resources industries accounts for the superior productivity performance of the sector.
• From an international perspective, labour productivity levels measured in physical
terms were higher in Canada than in the United States for four of five natural resource extractive industries for which comparable data are available: gold, iron ore, uranium, and oil and gas. In terms of manufacturing industries processing natural resources, Canada had lower levels of labour and total factor productivity than the United States in 1995 in four of six industries. Output per hour in Canada exceeded that of the United States in petroleum refining (122 per cent) and lumber and wood (104 per cent), but was below that of the United States in primary metals (94 per cent), stone, clay and glass (77 per cent), paper (71 per cent), and fabricated metals (64 per cent).
• Data from Statistics Finland indicates that the Finnish paper and wood products
sectors have greatly outperformed both their Canadian and US counterparts in terms of labour and total factor productivity growth since 1975 and in the 1990s.
• The highly productive nature of natural resource industries and their above average
productivity growth means that the natural resource sector contributes disproportionately to the economy. For this reason, the expansion of the natural resource sector is highly desirable, but it is constrained by both supply-side and demand-side factors. The sector’s above average productivity growth also means that the sector does not directly generate large numbers of jobs and experiences a secular decline in its share of total employment. However, the indirect or spinoff employment created from natural resources activities, largely in the service sector, is substantial.
• Natural resource industries experience large cyclical fluctuations in both output and
productivity. For example, the weak demand conditions in the early 1990s resulted in a cyclical downturn in productivity in many natural resource industries. The return to robust demand growth in the second half of the decade lead to a cyclical rebound in productivity growth.
• By far the worst period for productivity growth in the last 40 years was the 1973-81
period when output per hour fell 5.17 per cent per year in the energy sector and 2.67 per cent per year in the mining sector. This development was explained by the large increases in both energy and mineral prices after 1973, which lead to the rapid growth of labour and capital inputs for exploration activities that have only long-term effects on output, and to a fall in output.
68
• A key development in the 1990s was the weakness of investment and hence capital stock growth in the natural resource industries. Over the 1989-2000 period, the capital stock fell at a 3.69 per cent average annual rate in the mining sector, 1.47 per cent in the forest sector and advanced at only a weak 1.55 per cent in the energy sector. As much technological change is embodied in the capital stock, this weakness in capital accumulation may have had negative consequences for productivity growth in the natural resource industries.
• The above average productivity growth in natural resource industries over the last
years has reflected the increased qualifications of the workforce. The proportion of workers in natural resources industries with post-secondary education has increased from less than 15 per cent in 1976 (the earliest year for which data are available on educational attainment from the Labour Force Survey) to over 40 per cent by 2000.
• Two factors which appear not to have contributed significantly to productivity growth
in natural resources industries include capacity utilization (which had no over all trend over the period), and composition shifts in employment within sectors. Measurement problems also appear to not be particularly important in the sector.
• The net impact on productivity growth in natural resource industries from
government regulation, unionization, workplace safety, economies of scale and foreign direct investment is not known with any degree of certainty, but appears to be relatively small.
2) Industry specific observations
In addition to the general observations of productivity developments in natural resource
industries noted above, a number of industry specific observations can be made. • The one natural resource industry that experienced extremely poor labour
productivity growth over the 1961-2000 period was petroleum and natural gas extraction. This development is relatively simple to explain. The very large increase in oil prices after 1973 made profitable the exploitation of less productive deposits and intensified exploration activity, with a negative effect on productivity growth in the 1970s and 1980s.
• The motor vehicle parts industry also enjoyed extremely robust productivity growth
over the 1961-2000 period, with output per hour increasing 6-fold and almost equal gains in total factor productivity.
• The natural resource industry with the most impressive productivity performance over
the 1961-2000 period was coal mines. Output per hour increased 14-fold over the 39 year period. Total factor productivity gains were almost equally impressive.
• A key development in the 1990s has been the deterioration of the labour productivity
performance of the logging and forestry and wood products industries. Increased prices for wood products may account for some of this development as firms can

69
profitably use less productive resources, lowering average productivity. • In contrast to developments in the logging and forestry and wood products industries,
the productivity performance of the paper products industry in the 1990s has improved significantly. The factors behind this situation are poorly understood.
B. Agenda for Further Productivity Research
The salient characteristic of this report is the breadth of coverage, not the depth of
analysis. Indeed, in one report it is not possible to provide a complete discussion of productivity trends and determinants in nearly 20 natural resource industries. There remains much to do to gain a better understanding of productivity trends in natural resource industries. This section sketches out an agenda for future productivity research which Natural Resources Canada and other departments and agencies may wish to consider implementing.
A first priority is to document the current knowledge base of our understanding of
productivity trends and drivers in the energy and mining and related mineral processing industries through a survey of the productivity literature for these sectors published in Canada and other countries. It is important to build on past research and not reinvent the wheel. A recent literature survey on productivity in the forest sector undertaken by the Centre for the Study of Living Standards (CSLS, 2002a) for the Forest Products Association of Canada has shown that there are relatively few productivity studies on the forest products industry in this country. It is nevertheless important to take these studies into account in the development of future research projects in the area.
The characteristics and nature of certain natural resource industries vary greatly by region
and province. Consequently, the region or province may be a more meaningful spatial unit for productivity analysis than the national level. For this reason, a second priority is the development of a data set of reliable estimates of productivity trends for natural resource industries at the provincial level. Estimates for the forest sector have been developed by the Centre for the Study of Living Standards as part of a report commissioned by the Forest Products Association of Canada. Comparable productivity estimates by province for the energy sector and mining and mineral processing manufacturing industries would be very useful.
Long-run productivity growth is largely driven by technological innovations. A third
priority is to identify and document the key innovations and technological developments that have increased productivity growth in recent decades and to estimate the impact of these innovations on productivity. Probably the most effective manner to accomplish this is through interviews with industry experts. Types of information that merits collection in such a survey include: whether the new technologies or innovations are embodied in capital goods and introduced through new investment, or disembodied and not dependent on investment; the source of the technology or innovation including whether developed within the firm or industry or by other industries such as the capital equipment producers in Canada or abroad, or by government or university research institutes in Canada or in other countries; and whether the technology or innovation is general in nature and applicable in all industries or is industry-specific in nature.
A fourth research priority is the analysis of the impact of public policy on past and future
70
productivity trends in natural resources industries in Canada. This is a complex area. Public policies impact productivity in many ways, either directly or indirectly. However, it is generally very difficult to isolate the impact of a specific policy on productivity performance from that of other influences. Public policy areas that are particularly relevant for the productivity performance of natural resource industries include tax policy, trade policy, education and training policy, infrastructure policy, and environmental regulation policy. Studies that focused on the productivity impact in natural resource industries from these specific policies would be very useful.
A fifth research priority is the integration of sustainable development concerns into
productivity analysis of natural resource industries. The production process in natural resource industries, in addition to producing raw materials, generates byproducts such as carbon dioxide emissions, air pollution, water pollution, and tailings which are negative for the economy and society. Some argue that government regulations and technological advances have reduced these externalities but that conventional output and productivity are not capturing this joint output of a cleaner environment. The development of productivity measures for natural resource industries that incorporate the externalities associated with raw material production, and changes in these externalities over time, is an important area for future research.
In addition to the research priorities outlined above, better data would improve
productivity analysis in natural resource industries. Specific data requirements include the following:
• micro-data sets on firms in the natural resource sector that permit analysis of the
process of productivity growth at the firm or establishment level over time and the identification of the characteristics of firms successful in attaining high productivity levels at a point in time and raising productivity over time;
• data on intermediate goods, including energy, raw materials, and purchased services; • data on the average characteristics of the forest resource stock that affect the
resources needed to harvest the stock (e.g. size of timber, accessibility) and on the average quality of sub-soil natural resources and the implications for resources use of changes in the average quality of these resources.
• data on the number of regulations that affect the natural resource sector and the
compliance costs; and • the identification of additional sources of productivity data in other countries which
would permit more detailed comparisons of international productivity performance in natural resource industries with Canadian performance.
In addition to the general research priorities and the data requirements noted above, a
number of specific research questions and topics can be identified. Some of these are outlined below.
• Further investigation and modeling of the factors behind total factor productivity,
71
including economies of scale and technical efficiencies; • Examination of the factors behind what appears to be the excellent productivity
performance in the forestry products sector of the Nordic countries; and • Analysis of the dynamics of changes in output prices on productivity in natural
resource industries, including effects on average quality of resources and explorartion activity.
C. Conclusion
This study has provided a comprehensive examination of productivity trends and
determinants in the natural resource industries in Canada over the past 39 years. The key conclusion is that most natural resources industries have outperformed the all industries average in terms of both labour productivity and total factor productivity since 1961. This is not a surprising result. Natural resource industries, like most goods-producing industries, have the potential for gains in labour productivity through mechanization and the associated substitution of capital for labour. This potential productivity growth may be less in certain service activities, particularly personal and business services where personal relationships between service provider and purchaser are important. These industries experience low trend productivity growth, and result in industries with more potential for productivity advance to post above average productivity gains.
The productivity picture in natural resources is not entirely rosy. The forestry and logging
and wood products sector experienced negative labour productivity growth in the 1990s and a number of mining industries have experienced below average labour productivity growth. Labour productivity levels in four of six manufacturing industries that process natural resources have labour productivity levels below their US counterparts. The Canadian wood and paper products industries have been greatly outperformed by their Finnish counterpart in terms of productivity growth in the 1990s.
This report has been more successful at identifying key productivity developments in the
Canadian natural resource sector that at providing conclusive explanations of these developments. In a way this is not surprising. Explaining productivity growth is a complex task. Indeed, after a quarter century the economics profession has still not furnished a definitive or even a consensus explanation of the post-1973 productivity slowdown that affected all developed economies. This difficulty does not of course mean that the task of explaining productivity growth should be abandoned, but rather that it should be pursued with more vigour.
72
References
Baldwin, John R., Ron S. Jarmin and Jianmin Tang (2002) “The Trend to Smaller Producers in Manufacturing: a Canada/US Comparison,” Economic Analysis Research Paper Series, Number 003, Statistics Canada, May. Bernstein, Jeffrey I (2000) “Is The Labor Productivity Gap With The United States Made In Canada?” Canadian Business Economics, Volume 8, Number 1, February, pp. 42-49. Bernstein, Jeffrey I., Richard G. Harris and Andrew Sharpe (2002) “The Widening Canada-US Productivity Gap in Manufacturing,” International Productivity Monitor, Number Five, Fall, pp. 3-23. Centre for the Study of Living Standards (2002a) “Productivity in the Forest Products Sector: a review of the Literature,” report prepared for the Forest Products Association of Canada, final version, July 16. Centre for the Study of Living Standards (2002b) “An Analysis of Productivity Trends in the Forest Products Sector in Canada,” report prepared for the Forest Products Association of Canada, draft, September 21. Dungan, Peter (1997) Rock Solid: The Impact of the Mining and Primary Metals Industries on the Canadian Economy (Toronto: University of Toronto Press). Forest Products Association of Canada (2002) Accelerating Forest Sector Renewal: Forest Sector Innovation Response, Consultation Draft, August 7. Francis, Diane (2002) “The sad reality of Syncrude,” Financial Post, November 9, FP1. Harris, Richard G. (2002) “Determinants of Canadian Productivity Growth: Issues and Prospects,” in Someshwar Rao and Andrew Sharpe (eds.) Productivity Issues in Canada (Calgary: University of Calgary Press). Holbrook, J. Adam (2002) “R&D Expenditures in the Natural Resources Sector”, report prepared for Natural Resource Canada, Centre for Policy Research on Science and Technology, Simon Fraser University. Lee, Frank and Jianmin Tang (2000) “An Assessment of Competitiveness and Productivity Levels: Canadaian and U.S. Manufacturing Industries,” paper presented at the Canada-US Manufacturing Productivity Gap Conference, Ottawa, Ontario, organized by the Centre for the Study of Living Standards, revised version, February. Lipsey, Richard G. and Kenneth Carlaw (2000) “What Does Total Factor Productivity Measure?” International Productivity Monitor, Number One, Fall, pp. 31-40. (posted at www.csls.ca) Maliranta, Mika (2000) “Technology, Productivity and Restructuring,” PhD thesis, University of
73
Helinski, Finland. National Research Council (1999) Nature’s Numbers: Expanding the National Accounts to Include the Environment (Washington, DC: Natinal Academy Press). Natural Resources Canada (1999) “Productivity Growth in the Natural Resources Sector,” mimeo., June 16 Natural Resources Canada (2000) “Productivity and the Natural Resources Sector in Canada,” Powerpoint presentation notes, April 10. Olewiler, Nancy, (2002) “Natural Capital, Sustainability and Productivity: An Exploration of the Linkages” in Andrew Sharpe, France St-Hilaire and Keith Banting (eds.) Review of Economic Performance and Social Progress, 2002: Towards a Social Understanding of Productivity (Ottawa: Centre for the Study of Living Standards and Montreal: Institute for Research on Public Policy). Parry, Ian W.H. (1999) “Productivity Trends in the Natural Resource Industries: A Cross-Cutting Analysis,” in David Simpson (ed.) Productivity in Natural Resource Industries: Improvement through Innovation (Washington, DC: Resources for the Future). Sedjo, Roger (1999) “Land Use Change and Innovation in U.S. Forestry,” in David Simpson (ed.) Productivity in Natural Resource Industries: Improvement through Innovation (Washington, DC: Resources for the Future). Sharpe, Andrew (2002a) “Raising Canadian Living Standards: A Framework for Analysis,” International Productivity Monitor, Number Five, Fall. pp. 3-18. Sharpe, Andrew (2002b) “Productivity Issues, Concepts and Prospects: An Overview,” in Andrew Sharpe, France St-Hilaire and Keith Banting (eds.) Review of Economic Performance and Social Progress, 2002: Towards a Social Understanding of Productivity (Ottawa: Centre for the Study of Living Standards and Montreal: Institute for Research on Public Policy). Simpson, David, ed. (1999) Productivity in Natural Resource Industries: Improvement through Innovation (Washington, DC: Resources for the Future). Stollery, Kenneth R. (1985) “Productivity Change in Canadian mining, 1957-1979”, Applied Economics, 17, pp. 543-558.
74
Appendix 1
Comparison on SIC and NAICS Output and Employment Estimates in Natural Resource Industries for Canada in 1998
The introduction of the North American Industry Classification System (NAICS) in the late
1990s to replace the 1980 Standard Industry Classification (SIC) was a major development in Canada’s statistical system. In particular, it broke the continuity of time series because of the change in industry definitions. This appendix compares output and employment estimates based on NAICS and the SIC for 1998 for natural resource industries.
Table A-1 Comparison Between the SIC and NAICS Classifications for GDP (in Millions of 1992 dollars) in the Energy Sector, Canada, 1998
Oil and
Gas Extract-
ion
Support Activities
for Mining &
Oil & Extraction
Electric Power
Generation
Natural Gas
Distribut-ion
Petroleum and Coal Products
Mfg.
Pipeline Trans-
portation
SIC (S) 16,305 2,677 19,715 2,406 1,051 3,553 NAICS (N) 16,673 3,089 20,844 n/a 1,647 3,679 (N-S) 368 412 1,129 n/a 596 126
(N/S)*100 102.3 115.4 105.7 n/a 156.7 103.5
Percent difference (N-S)/S 100 2.3 15.4 5.7 n/a 56.7 3.5 Source: CANSIM II Table 379-0023 for nominal NAICS GDP and Table 379-0017 for Constant 1997 dollar NAICS GDP, on November 25, 2002and Table 379-0004 for SIC Real GDP, on November 25, 2002
Table A-2 Comparison Between the SIC and NAICS Classifications for Employment (in thousands of workers) in the Energy Sector, Canada, 1998
Oil and Gas
Extract- ion
Support Activities
for Mining & Oil & Gas Extraction
Electric Power
Generat- ion
Natural Gas
distribut- ion
Petroleum & Coal
Products Mfg
Pipeline Trans-
portation
SIC (S) 42.7 50.8 94.7 18.4 18.2 6.1 NAICS (N) 55.4 49.7 90.3 19.6 18.7 4.9 (N-S) 12.7 -1.1 -4.4 1.2 0.5 -1.2
(N/S)*100 129.7 97.8 95.4 106.5 102.7 80.3
Percent difference (NS)/S*100 29.7 -2.2 -4.6 6.5 2.7 -19.7 Source: Unpublished Labour Force Survey data, Statistics Canada.
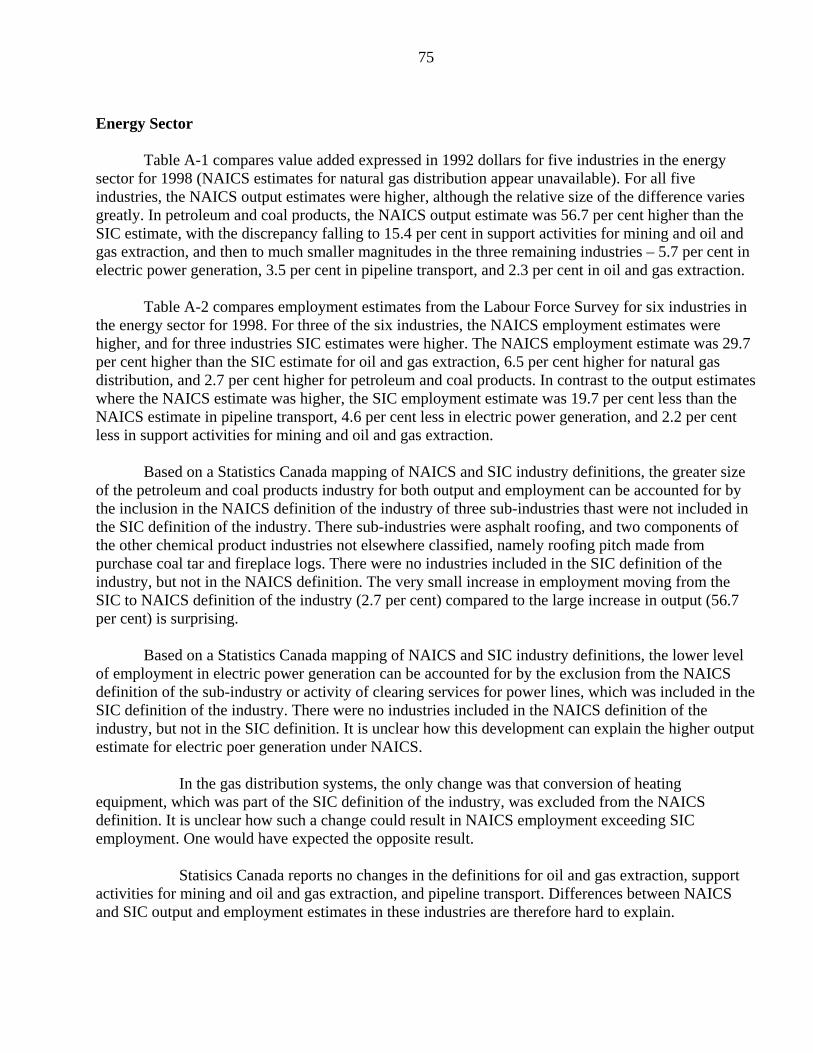
75
Energy Sector
Table A-1 compares value added expressed in 1992 dollars for five industries in the energy
sector for 1998 (NAICS estimates for natural gas distribution appear unavailable). For all five industries, the NAICS output estimates were higher, although the relative size of the difference varies greatly. In petroleum and coal products, the NAICS output estimate was 56.7 per cent higher than the SIC estimate, with the discrepancy falling to 15.4 per cent in support activities for mining and oil and gas extraction, and then to much smaller magnitudes in the three remaining industries – 5.7 per cent in electric power generation, 3.5 per cent in pipeline transport, and 2.3 per cent in oil and gas extraction.
Table A-2 compares employment estimates from the Labour Force Survey for six industries in
the energy sector for 1998. For three of the six industries, the NAICS employment estimates were higher, and for three industries SIC estimates were higher. The NAICS employment estimate was 29.7 per cent higher than the SIC estimate for oil and gas extraction, 6.5 per cent higher for natural gas distribution, and 2.7 per cent higher for petroleum and coal products. In contrast to the output estimates where the NAICS estimate was higher, the SIC employment estimate was 19.7 per cent less than the NAICS estimate in pipeline transport, 4.6 per cent less in electric power generation, and 2.2 per cent less in support activities for mining and oil and gas extraction.
Based on a Statistics Canada mapping of NAICS and SIC industry definitions, the greater size
of the petroleum and coal products industry for both output and employment can be accounted for by the inclusion in the NAICS definition of the industry of three sub-industries thast were not included in the SIC definition of the industry. There sub-industries were asphalt roofing, and two components of the other chemical product industries not elsewhere classified, namely roofing pitch made from purchase coal tar and fireplace logs. There were no industries included in the SIC definition of the industry, but not in the NAICS definition. The very small increase in employment moving from the SIC to NAICS definition of the industry (2.7 per cent) compared to the large increase in output (56.7 per cent) is surprising.
Based on a Statistics Canada mapping of NAICS and SIC industry definitions, the lower level
of employment in electric power generation can be accounted for by the exclusion from the NAICS definition of the sub-industry or activity of clearing services for power lines, which was included in the SIC definition of the industry. There were no industries included in the NAICS definition of the industry, but not in the SIC definition. It is unclear how this development can explain the higher output estimate for electric poer generation under NAICS.
In the gas distribution systems, the only change was that conversion of heating
equipment, which was part of the SIC definition of the industry, was excluded from the NAICS definition. It is unclear how such a change could result in NAICS employment exceeding SIC employment. One would have expected the opposite result.
Statisics Canada reports no changes in the definitions for oil and gas extraction, support
activities for mining and oil and gas extraction, and pipeline transport. Differences between NAICS and SIC output and employment estimates in these industries are therefore hard to explain.
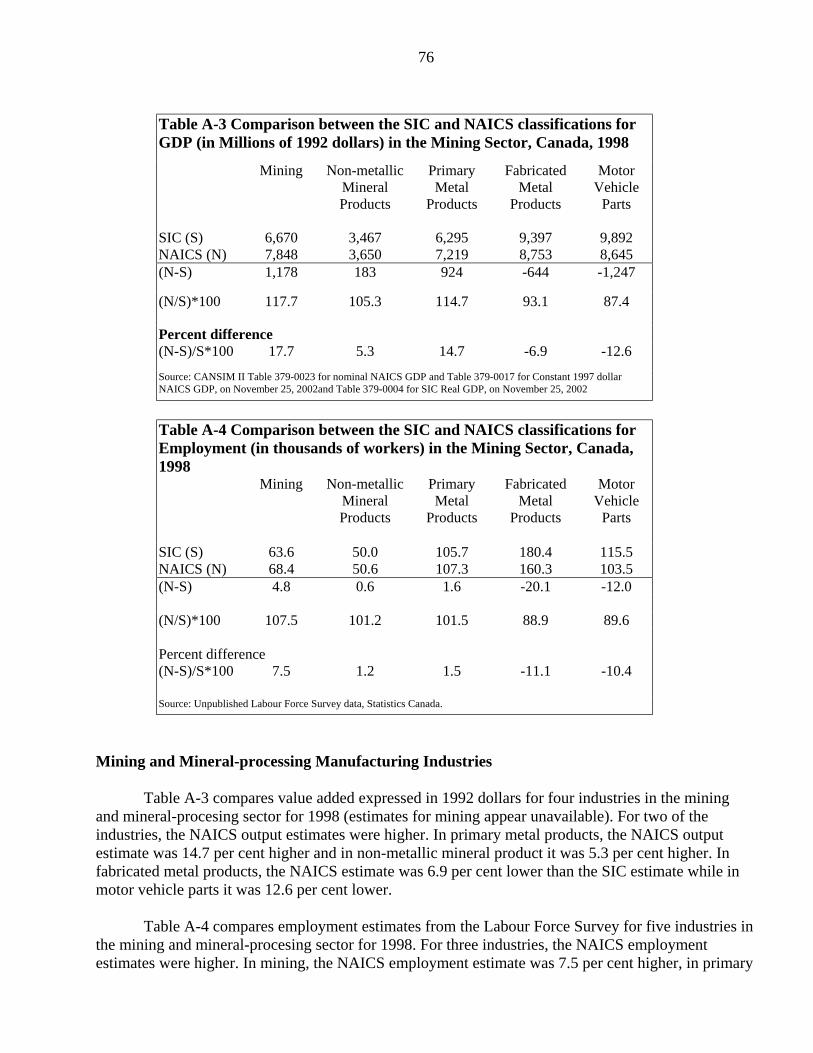
76
Table A-3 Comparison between the SIC and NAICS classifications for GDP (in Millions of 1992 dollars) in the Mining Sector, Canada, 1998
Mining Non-metallic Mineral Products
Primary Metal
Products
Fabricated Metal
Products
Motor Vehicle
Parts
SIC (S) 6,670 3,467 6,295 9,397 9,892 NAICS (N) 7,848 3,650 7,219 8,753 8,645 (N-S) 1,178 183 924 -644 -1,247
(N/S)*100 117.7 105.3 114.7 93.1 87.4
Percent difference (N-S)/S*100 17.7 5.3 14.7 -6.9 -12.6
Source: CANSIM II Table 379-0023 for nominal NAICS GDP and Table 379-0017 for Constant 1997 dollar NAICS GDP, on November 25, 2002and Table 379-0004 for SIC Real GDP, on November 25, 2002
Table A-4 Comparison between the SIC and NAICS classifications for Employment (in thousands of workers) in the Mining Sector, Canada, 1998
Mining Non-metallic Mineral Products
Primary Metal
Products
Fabricated Metal
Products
Motor Vehicle
Parts
SIC (S) 63.6 50.0 105.7 180.4 115.5 NAICS (N) 68.4 50.6 107.3 160.3 103.5 (N-S) 4.8 0.6 1.6 -20.1 -12.0
(N/S)*100 107.5 101.2 101.5 88.9 89.6
Percent difference (N-S)/S*100 7.5 1.2 1.5 -11.1 -10.4
Source: Unpublished Labour Force Survey data, Statistics Canada.
Mining and Mineral-processing Manufacturing Industries Table A-3 compares value added expressed in 1992 dollars for four industries in the mining
and mineral-procesing sector for 1998 (estimates for mining appear unavailable). For two of the industries, the NAICS output estimates were higher. In primary metal products, the NAICS output estimate was 14.7 per cent higher and in non-metallic mineral product it was 5.3 per cent higher. In fabricated metal products, the NAICS estimate was 6.9 per cent lower than the SIC estimate while in motor vehicle parts it was 12.6 per cent lower.
Table A-4 compares employment estimates from the Labour Force Survey for five industries in
the mining and mineral-procesing sector for 1998. For three industries, the NAICS employment estimates were higher. In mining, the NAICS employment estimate was 7.5 per cent higher, in primary
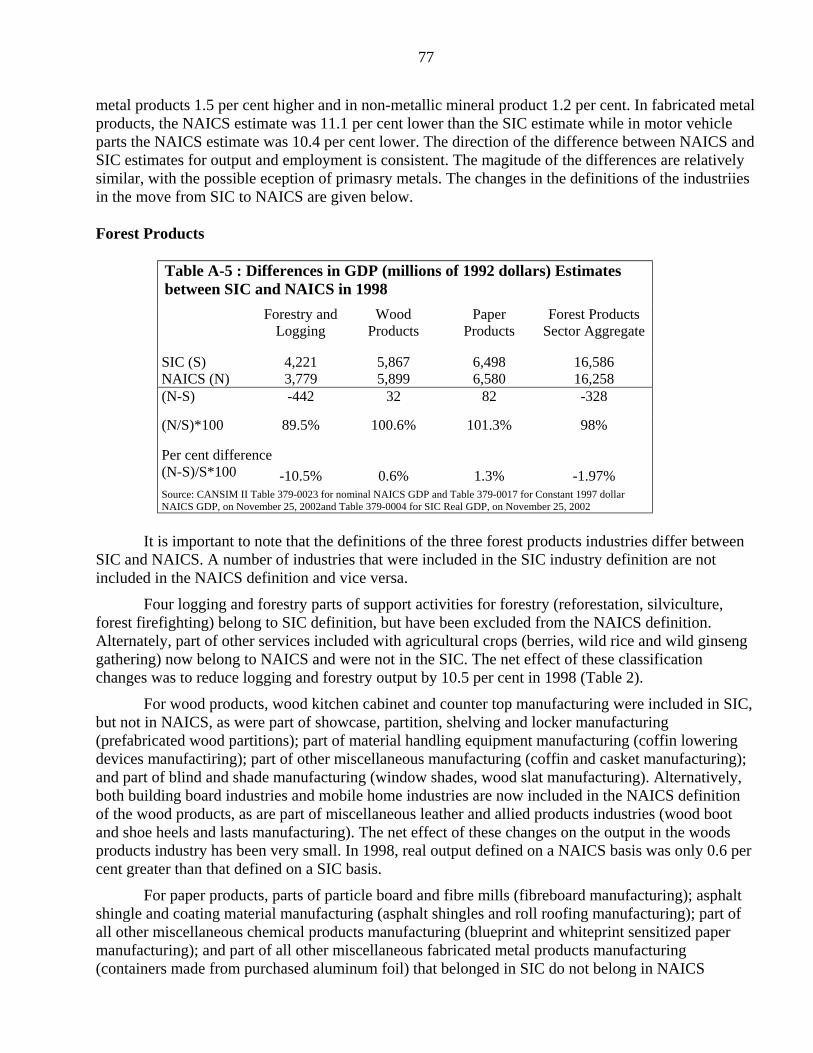
77
metal products 1.5 per cent higher and in non-metallic mineral product 1.2 per cent. In fabricated metal products, the NAICS estimate was 11.1 per cent lower than the SIC estimate while in motor vehicle parts the NAICS estimate was 10.4 per cent lower. The direction of the difference between NAICS and SIC estimates for output and employment is consistent. The magitude of the differences are relatively similar, with the possible eception of primasry metals. The changes in the definitions of the industriies in the move from SIC to NAICS are given below.
Forest Products
Table A-5 : Differences in GDP (millions of 1992 dollars) Estimates between SIC and NAICS in 1998 Forestry and
Logging Wood
Products Paper
Products Forest Products
Sector Aggregate
SIC (S) 4,221 5,867 6,498 16,586 NAICS (N) 3,779 5,899 6,580 16,258 (N-S) -442 32 82 -328
(N/S)*100 89.5% 100.6% 101.3% 98%
Per cent difference (N-S)/S*100 -10.5% 0.6% 1.3% -1.97% Source: CANSIM II Table 379-0023 for nominal NAICS GDP and Table 379-0017 for Constant 1997 dollar NAICS GDP, on November 25, 2002and Table 379-0004 for SIC Real GDP, on November 25, 2002
It is important to note that the definitions of the three forest products industries differ between
SIC and NAICS. A number of industries that were included in the SIC industry definition are not included in the NAICS definition and vice versa.
Four logging and forestry parts of support activities for forestry (reforestation, silviculture, forest firefighting) belong to SIC definition, but have been excluded from the NAICS definition. Alternately, part of other services included with agricultural crops (berries, wild rice and wild ginseng gathering) now belong to NAICS and were not in the SIC. The net effect of these classification changes was to reduce logging and forestry output by 10.5 per cent in 1998 (Table 2).
For wood products, wood kitchen cabinet and counter top manufacturing were included in SIC, but not in NAICS, as were part of showcase, partition, shelving and locker manufacturing (prefabricated wood partitions); part of material handling equipment manufacturing (coffin lowering devices manufactiring); part of other miscellaneous manufacturing (coffin and casket manufacturing); and part of blind and shade manufacturing (window shades, wood slat manufacturing). Alternatively, both building board industries and mobile home industries are now included in the NAICS definition of the wood products, as are part of miscellaneous leather and allied products industries (wood boot and shoe heels and lasts manufacturing). The net effect of these changes on the output in the woods products industry has been very small. In 1998, real output defined on a NAICS basis was only 0.6 per cent greater than that defined on a SIC basis.
For paper products, parts of particle board and fibre mills (fibreboard manufacturing); asphalt shingle and coating material manufacturing (asphalt shingles and roll roofing manufacturing); part of all other miscellaneous chemical products manufacturing (blueprint and whiteprint sensitized paper manufacturing); and part of all other miscellaneous fabricated metal products manufacturing (containers made from purchased aluminum foil) that belonged in SIC do not belong in NAICS
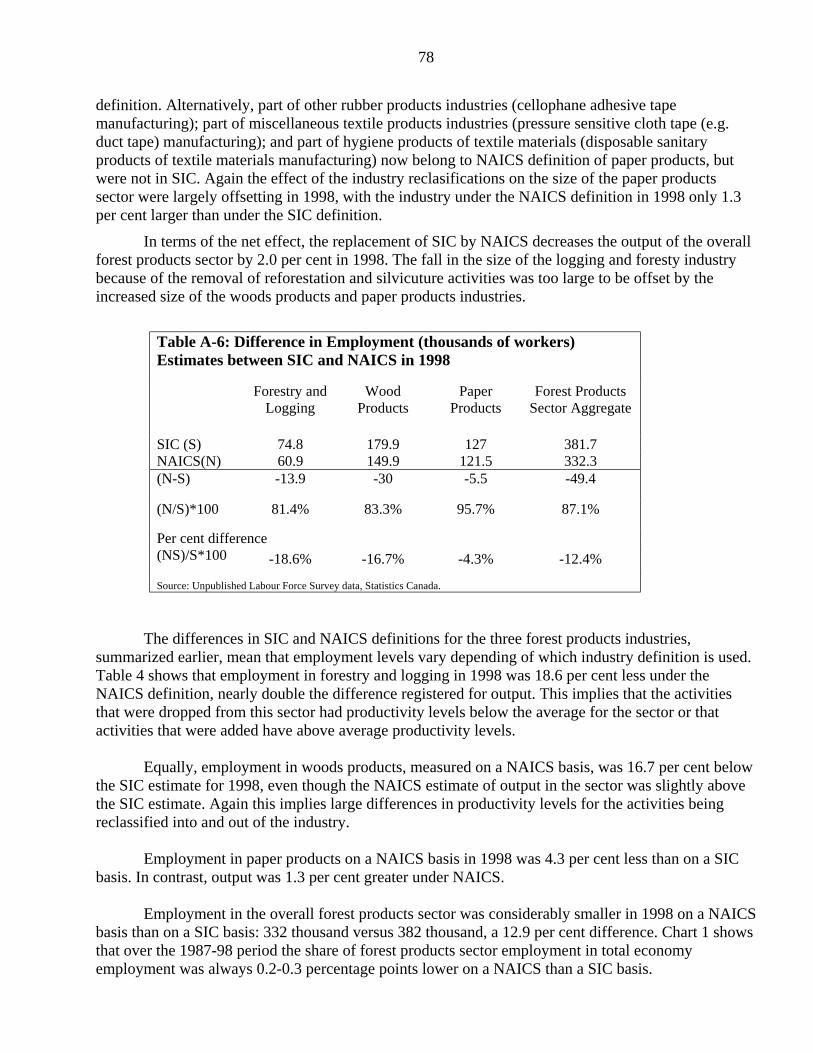
78
definition. Alternatively, part of other rubber products industries (cellophane adhesive tape manufacturing); part of miscellaneous textile products industries (pressure sensitive cloth tape (e.g. duct tape) manufacturing); and part of hygiene products of textile materials (disposable sanitary products of textile materials manufacturing) now belong to NAICS definition of paper products, but were not in SIC. Again the effect of the industry reclasifications on the size of the paper products sector were largely offsetting in 1998, with the industry under the NAICS definition in 1998 only 1.3 per cent larger than under the SIC definition.
In terms of the net effect, the replacement of SIC by NAICS decreases the output of the overall forest products sector by 2.0 per cent in 1998. The fall in the size of the logging and foresty industry because of the removal of reforestation and silvicuture activities was too large to be offset by the increased size of the woods products and paper products industries.
Table A-6: Difference in Employment (thousands of workers) Estimates between SIC and NAICS in 1998
Forestry and Logging
Wood Products
Paper Products
Forest Products Sector Aggregate
SIC (S) 74.8 179.9 127 381.7 NAICS(N) 60.9 149.9 121.5 332.3 (N-S) -13.9 -30 -5.5 -49.4
(N/S)*100 81.4% 83.3% 95.7% 87.1%
Per cent difference (NS)/S*100 -18.6% -16.7% -4.3% -12.4%
Source: Unpublished Labour Force Survey data, Statistics Canada.
The differences in SIC and NAICS definitions for the three forest products industries,
summarized earlier, mean that employment levels vary depending of which industry definition is used. Table 4 shows that employment in forestry and logging in 1998 was 18.6 per cent less under the NAICS definition, nearly double the difference registered for output. This implies that the activities that were dropped from this sector had productivity levels below the average for the sector or that activities that were added have above average productivity levels.
Equally, employment in woods products, measured on a NAICS basis, was 16.7 per cent below
the SIC estimate for 1998, even though the NAICS estimate of output in the sector was slightly above the SIC estimate. Again this implies large differences in productivity levels for the activities being reclassified into and out of the industry.
Employment in paper products on a NAICS basis in 1998 was 4.3 per cent less than on a SIC
basis. In contrast, output was 1.3 per cent greater under NAICS. Employment in the overall forest products sector was considerably smaller in 1998 on a NAICS
basis than on a SIC basis: 332 thousand versus 382 thousand, a 12.9 per cent difference. Chart 1 shows that over the 1987-98 period the share of forest products sector employment in total economy employment was always 0.2-0.3 percentage points lower on a NAICS than a SIC basis.
79
List of Exhibits Exhibit 1: The Importance of Natural Resource Industries in the Canadian Economy, 2000 Exhibit 2: Labour Productivity Levels in 2000 and Trends in Natural Resource Industries in the
Canadian Economy Exhibit 3: Levels and Trends in Educational Attainment in Natural Resources Industries in Canada Exhibit 4: Nominal Hourly Labour Compensation Levels in 1997and Trends in Natural Resource
Industries in the Canadian Economy Exhibit 5: Output Price (Deflator) Trends in Natural Resource Industries in the Canadian
Economy Exhibit 6: Capacity Utilization Trends in Natural Resource Industries in the Canadian Economy Exhibit 7: Injuries and Fatalities in Natural Resource Industries in the Canadian Economy Exhibit 8: Unionization Rates in Natural Resource Industries in the Canadian Economy Exhibit 9: Number of Establishments and Employees per Establishment in Natural Resource
Processing Manufacturing Industries, 1970, 1989 and 1999 Exhibit 10: Labour Productivity (LP) and Total Factor Productivity (TFP) Growth in Natural
Resource Industries in the Canadian Economy, 1961-2000 Exhibit 11: Labour Productivity (LP) and Total Factor Productivity (TFP) Growth in Natural
Resource Industries in the Canadian Economy, 1989-2000 Exhibit 12: R&D/GDP Ratios for Natural Resource Industries, 1990, 1995 and 2000

80
Exhibit 1
The Importance of Natural Resource Industries in the Canadian Economy, 2000
% of Total % of Total Output Employment Economy Economy Energy Aggregate $50,705 6.61 180,481 1.19 Crude petroleum and 16,990 2.22 26,625 0.18 natural gas Services incidental to 3,570 0.47 51,024 0.34 mineral extraction Refined petroleum and 1,374 0.18 11,961 0.08 coal products Pipeline transport 3,635 0.47 8,377 0.06 Electric power systems 22,266 2.90 73,058 0.48 Gas distribution systems 2,878 0.38 11,247 0.07 Mining and Mineral-Related Manufacturing Industries (excluding motor vehicle parts) 29,609 3.87 431,909 2.84 Mining 6,774 0.88 59,389 0.39 Gold mines 1,041 0.14 9,957 0.07 Other metal mines 2,562 0.33 21,665 0.14 Iron Mines 545 0.07 5,497 0.04 Asbestos na na 2,368 0.02 Other non-metal except coal 1,443 0.19 9,694 0.06 Salt mines 159 0.02 1,805 0.01 Coal mines 976 0.13 5,678 0.04 Primary metals 7,101 0.93 89,648 0.59
81
Non-metallic Mineral products 3,890 0.51 54,125 0.36 Metal fabricating 10,865 1.42 217,763 1.43 Motor Vehicle Parts 11,961 1.56 160,518 1.06 Quarry and Sand Pits 1,060 0.14 10,948 0.07 Forest Products 19,346 2.52 340,211 2.24 Logging and Forestry 4,538 0.59 63,878 0.42 Wood Products 7,090 0.92 168,107 1.11 Paper Products 7,765 1.01 107,252 0.71 Total Natural Resources 99,741 13.0 953,438 6.27 (excluding motor vehicle parts) Primary Natural Resource Industries** 32,932 4.30 211,900 1.39 Notes: Output refers to real value added and is expressed in millions of 1992 dollars. Asterisk refers to 1997 estimate. *value for 1997 ** defined to include crude petroleum and natural gas extraction, services incidental to mineral extraction, mining, quarry and sand pits, and logging and forestry. Source: Appendix Tables on productivity in the natural resources industries natural posted at www.csls.ca under Reports. Output: energy Table 1, mining Table 28, primary metals Table 56, non-metallic mineral products Table 79, metal fabricating, Table 104, motor vehicle parts 104, forest products Table 128; Employment: energy, Table 3, mining Table 30, primary metals Table 58, non-metallic mineral products Table 81, metal fabricating Table 106, motor vehicle parts Table 106, forest products Table 130.
82
Exhibit 2
Labour Productivity Levels and Trends in Natural Resource Industries in the Canadian Economy, 2000
Output per % of All Average Annual Rate of Change
Hour ($1992) Industries 1961-89 1989-00 1961-00
All Industries $27.88 100.0 2.07 1.07 1.79 Energy Aggregate 144.53 518.4 1.70 2.34 1.88 Crude petroleum and 310.23 1112.8 -3.14 6.04 -0.63 natural gas Services incidental to 36.46 130.8 -0.28 1.54 0.23 mineral extraction Refined petroleum and 55.20 198.0 5.19 2.45 4.41 coal products Pipeline transport 218.91 785.2 2.36 3.41 2.65 Electric power systems 160.31 575.0 2.81 1.68 2.49 Gas distribution systems 136.85 490.9 3.34 2.73 3.17 Mining 56.70 202.7 3.08 1.24 2.56 Gold mines 53.13 189.9 1.09 1.56 1.22 Other metal mines 58.44 208.9 1.63 0.30 1.25 Iron Mines 48.96 174.0 4.71 0.59 3.53 Asbestos 24.55* 93.8* 0.90 na na Other non-metal except coal 75.63 270.3 6.58 2.04 5.28 Salt mines 45.29 161.9 5.76 0.31 4.19 Coal mines 83.97 300.1 7.07 6.68 6.96 Primary metals 38.71 138.9 2.33 3.15 2.56 Non-metallic
83
Mineral products 34.42 123.5 2.33 1.42 2.07 Metal fabricating 28.47 102.1 1.96 2.13 2.01 Motor Vehicle Parts 48.94 175.6 4.86 4.44 4.74 Quarry and Sand Pits 51.96 185.7 3.34 2.27 3.04 Forest Products 28.88 103.6 2.45 0.77 1.97 Logging and Forestry 32.50 116.6 3.19 -0.23 2.21 Wood Products 21.35 76.6 3.20 -0.55 2.13 Paper Products 38.14 136.8 1.67 3.27 2.12 Total Natural Resources (excluding motor 54.02 193.8 2.86 1.85 2.57 vehicle parts) Primary Natural Resource Industries 76.21 273.3 2.85 2.13 2.65 *value for 1994. Note: Primary natural resource industries are defined to include crude petroleum and natural gas extraction, services incidental to mineral extraction, mining, quarry and sand pits, and logging and forestry. Source: Appendix Tables on productivity in the natural resources industries natural posted at www.csls.ca under Reports. Energy Table 6; mining Table 33; primary metals Table 61; non-metallic mineral products Table 84; metal fabricating, Table 109; motor vehicle parts 109, forest products Table 133.
84
Exhibit 3
Levels and Trends in Educational Attainment in Natural Resources Industries in Canada Average Years % of All average annual rate of change of Schooling Industries 1976-2001 1989-2001 in 2001 Average All Industries 13.47 100.0 0.50 0.96 Energy Aggregate 14.18 105.2 0.45 0.78 Crude Petroleum and Natural Gas 14.31 106.2 0.17 0.41 Services incidental to mineral extraction 12.85 95.4 0.67 0.55 Refined petroleum and coal products 13.72 101.9 0.18 0.36 Pipeline transport 14.00 103.9 0.62 0.00 Electric power systems 14.19 105.4 0.55 1.01 Gas distribution systems 14.09 104.6 0.45 0.77 Mining 12.80 95.0 0.61 1.13 Metal Ore mines 13.03 96.7 0.62 1.38 Non-metallic mineral mining and quarrying 11.98 88.9 0.52 1.30 Coal mines 12.50* 93.8* 0.65* 1.87* Primary metals 12.91 95.8 0.66 1.17 Non-metallic Mineral products 12.49 92.7 0.54 1.22 Metal fabricating 12.90 95.7 0.57 1.31 Motor Vehicle Parts 12.73 94.5 0.69 1.30 Forest Products*** 12.48 92.7 0.52 0.58

85
Logging and Forestry 11.77 87.4 0.48 0.98 Wood Products 12.14 90.1 0.49 0.47 Paper Products 13.04 96.8 0.55 0.51 Total Natural Resources (excluding motor vehicle parts)*** 12.90 95.8 0.56 0.89 Primary Natural Resource Industries*** 12.81 95.1 0.61 0.88 *value for 1997 or to 1997. *** calculated from NAICS 2001 employment shares derived from Tables 160-162. Note: Primary natural resource industries are defined to include crude petroleum and natural gas extraction, services incidental to mineral extraction, mining, and logging and forestry. Source: Appendix Tables on productivity in the natural resources industries natural posted at www.csls.ca under Reports. Energy Tables 18-23, 44; mining Tables 45-49; primary metals Table 74; non-metallic mineral products Table 97; metal fabricating, Table 121; motor vehicle parts 122, forest products Tables 149-151.
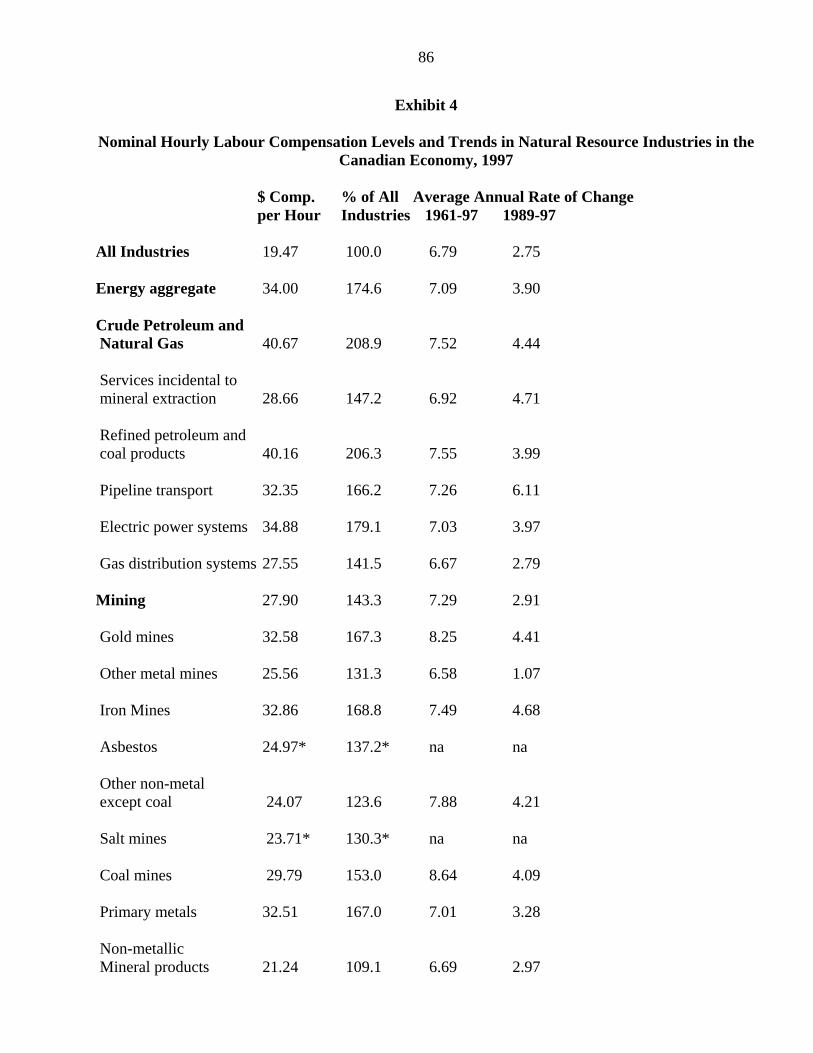
86
Exhibit 4 Nominal Hourly Labour Compensation Levels and Trends in Natural Resource Industries in the
Canadian Economy, 1997 $ Comp. % of All Average Annual Rate of Change per Hour Industries 1961-97 1989-97 All Industries 19.47 100.0 6.79 2.75 Energy aggregate 34.00 174.6 7.09 3.90 Crude Petroleum and Natural Gas 40.67 208.9 7.52 4.44 Services incidental to mineral extraction 28.66 147.2 6.92 4.71 Refined petroleum and coal products 40.16 206.3 7.55 3.99 Pipeline transport 32.35 166.2 7.26 6.11 Electric power systems 34.88 179.1 7.03 3.97 Gas distribution systems 27.55 141.5 6.67 2.79 Mining 27.90 143.3 7.29 2.91 Gold mines 32.58 167.3 8.25 4.41 Other metal mines 25.56 131.3 6.58 1.07 Iron Mines 32.86 168.8 7.49 4.68 Asbestos 24.97* 137.2* na na Other non-metal except coal 24.07 123.6 7.88 4.21 Salt mines 23.71* 130.3* na na Coal mines 29.79 153.0 8.64 4.09 Primary metals 32.51 167.0 7.01 3.28 Non-metallic Mineral products 21.24 109.1 6.69 2.97
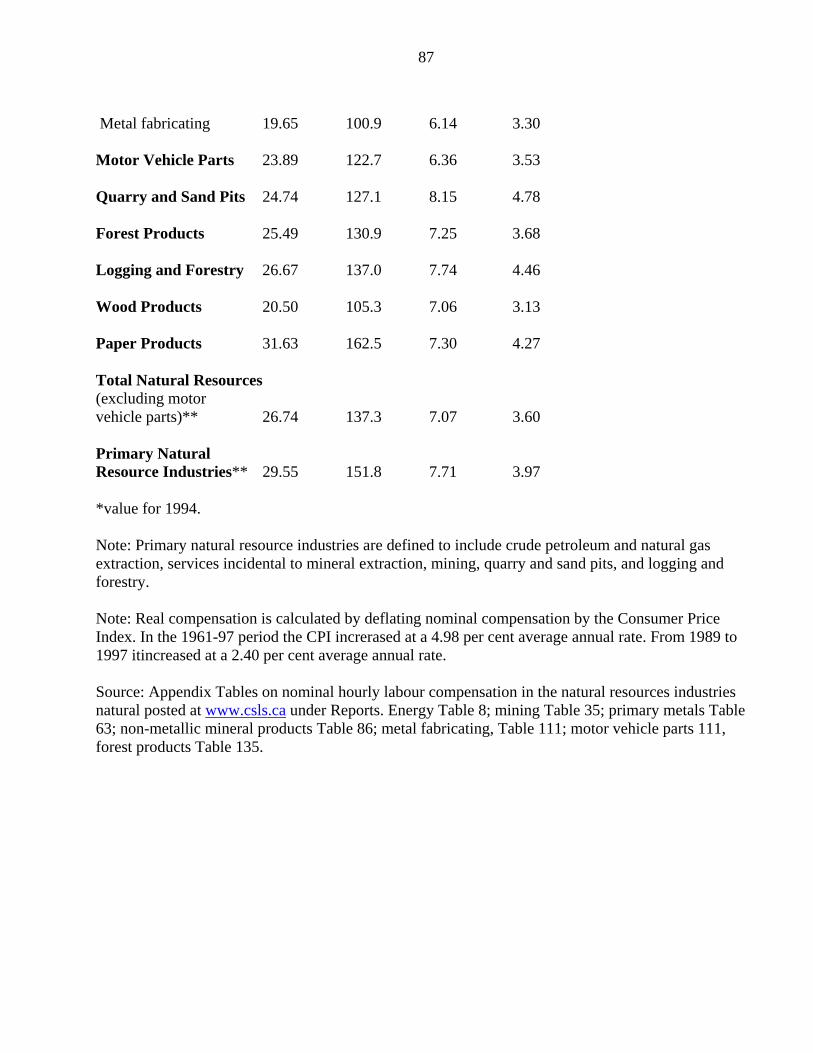
87
Metal fabricating 19.65 100.9 6.14 3.30 Motor Vehicle Parts 23.89 122.7 6.36 3.53 Quarry and Sand Pits 24.74 127.1 8.15 4.78 Forest Products 25.49 130.9 7.25 3.68 Logging and Forestry 26.67 137.0 7.74 4.46 Wood Products 20.50 105.3 7.06 3.13 Paper Products 31.63 162.5 7.30 4.27 Total Natural Resources (excluding motor vehicle parts)** 26.74 137.3 7.07 3.60 Primary Natural Resource Industries** 29.55 151.8 7.71 3.97 *value for 1994. Note: Primary natural resource industries are defined to include crude petroleum and natural gas extraction, services incidental to mineral extraction, mining, quarry and sand pits, and logging and forestry. Note: Real compensation is calculated by deflating nominal compensation by the Consumer Price Index. In the 1961-97 period the CPI increrased at a 4.98 per cent average annual rate. From 1989 to 1997 itincreased at a 2.40 per cent average annual rate. Source: Appendix Tables on nominal hourly labour compensation in the natural resources industries natural posted at www.csls.ca under Reports. Energy Table 8; mining Table 35; primary metals Table 63; non-metallic mineral products Table 86; metal fabricating, Table 111; motor vehicle parts 111, forest products Table 135.
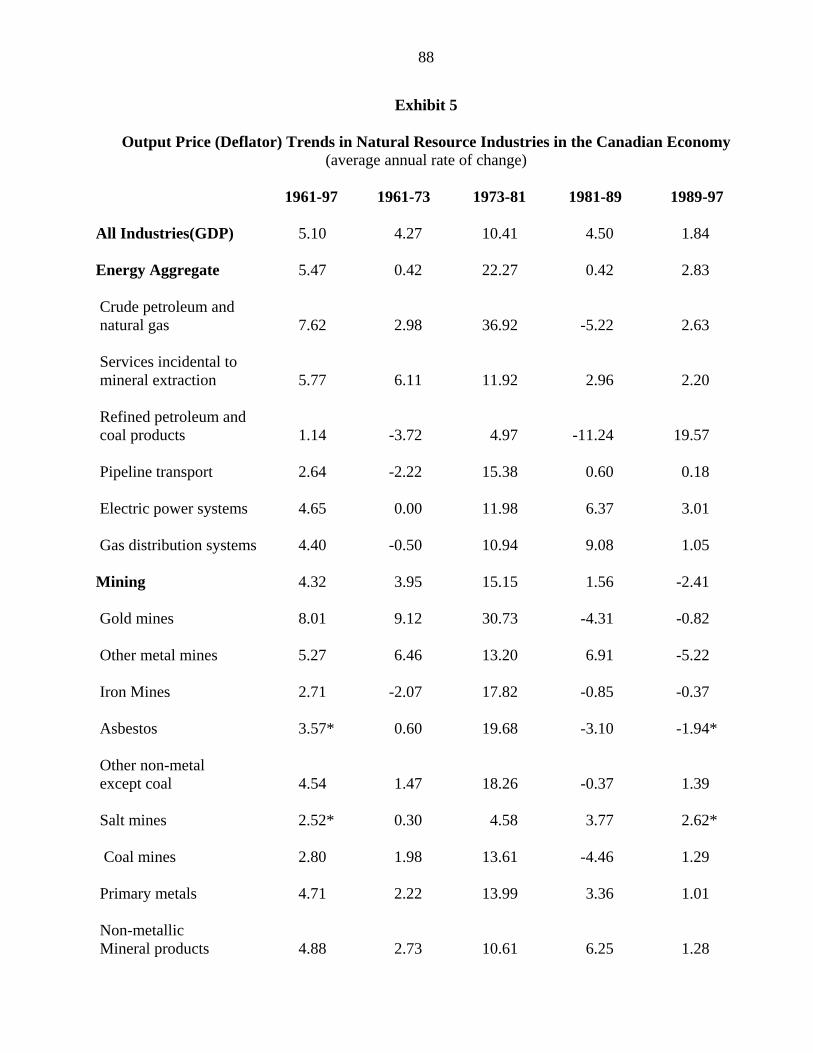
88
Exhibit 5
Output Price (Deflator) Trends in Natural Resource Industries in the Canadian Economy (average annual rate of change)
1961-97 1961-73 1973-81 1981-89 1989-97 All Industries(GDP) 5.10 4.27 10.41 4.50 1.84 Energy Aggregate 5.47 0.42 22.27 0.42 2.83 Crude petroleum and natural gas 7.62 2.98 36.92 -5.22 2.63 Services incidental to mineral extraction 5.77 6.11 11.92 2.96 2.20 Refined petroleum and coal products 1.14 -3.72 4.97 -11.24 19.57 Pipeline transport 2.64 -2.22 15.38 0.60 0.18 Electric power systems 4.65 0.00 11.98 6.37 3.01 Gas distribution systems 4.40 -0.50 10.94 9.08 1.05 Mining 4.32 3.95 15.15 1.56 -2.41 Gold mines 8.01 9.12 30.73 -4.31 -0.82 Other metal mines 5.27 6.46 13.20 6.91 -5.22 Iron Mines 2.71 -2.07 17.82 -0.85 -0.37 Asbestos 3.57* 0.60 19.68 -3.10 -1.94* Other non-metal except coal 4.54 1.47 18.26 -0.37 1.39 Salt mines 2.52* 0.30 4.58 3.77 2.62* Coal mines 2.80 1.98 13.61 -4.46 1.29 Primary metals 4.71 2.22 13.99 3.36 1.01 Non-metallic Mineral products 4.88 2.73 10.61 6.25 1.28
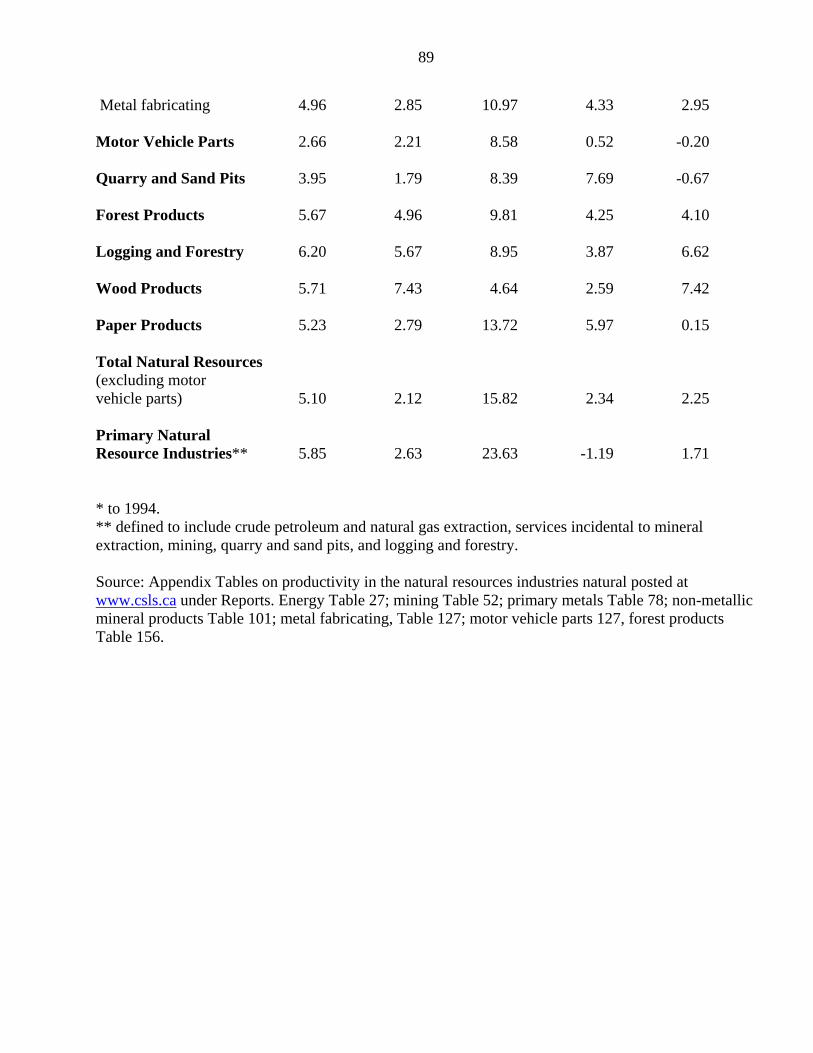
89
Metal fabricating 4.96 2.85 10.97 4.33 2.95 Motor Vehicle Parts 2.66 2.21 8.58 0.52 -0.20 Quarry and Sand Pits 3.95 1.79 8.39 7.69 -0.67 Forest Products 5.67 4.96 9.81 4.25 4.10 Logging and Forestry 6.20 5.67 8.95 3.87 6.62 Wood Products 5.71 7.43 4.64 2.59 7.42 Paper Products 5.23 2.79 13.72 5.97 0.15 Total Natural Resources (excluding motor vehicle parts) 5.10 2.12 15.82 2.34 2.25 Primary Natural Resource Industries** 5.85 2.63 23.63 -1.19 1.71 * to 1994. ** defined to include crude petroleum and natural gas extraction, services incidental to mineral extraction, mining, quarry and sand pits, and logging and forestry. Source: Appendix Tables on productivity in the natural resources industries natural posted at www.csls.ca under Reports. Energy Table 27; mining Table 52; primary metals Table 78; non-metallic mineral products Table 101; metal fabricating, Table 127; motor vehicle parts 127, forest products Table 156.

90
Exhibit 6
Capacity Utilization Trends in Natural Resource Industries in the Canadian Economy (per cent)
1962 1973 1981 1989 2000 Total Non-farm Goods Producing Industries 81.8 86.2 81.3 84.4 85.5 Energy Aggregate na na na na na Crude petroleum and 83.8 90.2 80.5 86.3 69.6 natural gas Refined petroleum and coal products 76.8 85.9 82.7 85.2 92.7 Pipeline transport na na na na na Electric power systems 84.4 87.8 84.6 83.7 86.7 Gas distribution systems 84.7 86.6 78.9 89.8 78.8 Mining* 82.9 90.2 79.1 86.8 76.6 Primary metals 81.2 91.0 86.9 88.5 90.4 Non-metallic Mineral products 81.4 86.9 66.4 83.3 81.2 Metal fabricating 70.5 88.0 82.3 81.4 84.0 Forest Products na na na na na Logging and Forestry 90.5 87.8 67.9 84.8 86.3 Wood Products 76.8 86.7 75.5 77.9 85.1 Paper Products 88.0 87.8 89.5 87.9 92.7 Source: Appendix Tables on productivity in the natural resources industries natural posted at www.csls.ca under Reports. Energy Table 16; mining Table 43; primary metals Table 72; non-metallic mineral products Table 95; metal fabricating, Table 119; forest products Table 147.
91
Exhibit 7
Injuries and Fatalities in Natural Resource Industries in the Canadian Economy
Injuries (per cent) Fatalities (per 100,000 workers) 1989 1999 1993 1999
All Industries 4.7 2.6 5.7 5.6 Energy Aggregate 3.6 1.3 1.5(1995) 2.6 (1998) Crude petroleum and natural gas 1.3 0.2 8.6(1995) 15.6 (1998) Services incidental to mineral extraction 7.7 1.0 43.1 (1995) 24.4 (1997) Refined petroleum and coal products 2.1 1.0 15.4 (1994) 28.8 Pipeline transport 0.5 0.8 n/a n/a Electric power systems 3.7 1.0 13.5 19.0 Gas distribution systems 3.0 0.9 n/a n/a Mining 8.8 2.7 161.4 115.9 Other non-metal except coal 16.3 5.3 (1997) 101.7 (1994) 296.5 (1997) Coal mines 8.8 4.6 (1997) 6.7 (1994) 4.2 (1997) Quarry and sand pits 9.3 5.9 n/a n/a Motor Vehicle Parts 7.3 3.4 2.2 3.4 Forest Products 10.1 6.1 (1998) 19.5 13.1 (1998) Logging and Forestry 11.1 7.0 (1998) 75.8 33.4 (1998) Wood Products 14.3 8.0 (1998) 8.0 8.9 (1998) Paper Products 5.7 2.8 (1998) 3.1 7.1 (1998) Source: Appendix Tables on productivity in the natural resources industries natural posted at www.csls.ca under Reports. Energy Table 24; mining Table 50; non-metallic mineral products Table 98; motor vehicle parts 123, forest products Table 152.
92
Exhibit 8
Unionization Rates in Natural Resource Industries in the Canadian Economy (per cent)
1976 1989 1995
All Industries 27.7 28.7 28.2 Mines, Quarries and Oil Wells 44.3 32.6 24.7 Petroleum and Coal products 20.0 40.7 39.2 Primary Metals 63.2 59.1 58.6 Metal Fabrication 34.8 27.2 24.0 Non-metallic Mineral Products 47.1 41.8 42.2 Motor Vehicle Parts na na na Forest Products 55.9 44.4 39.6 Logging and Forestry 46.8 42.6 43.1 Wood Products 51.5 25.6 24.6 Paper Products 63.3 62.7 54.0 Source: Appendix Tables on productivity in the natural resources industries natural posted at www.csls.ca under Reports.

93
Exhibit 9
Number of Establishments and Employees per Establishment in Natural Resource Processing Manufacturing Industries, 1970, 1989 and 1999
Number of Establishments Employees Per Establishment 1970 1989 1999 1970 1989 2000 Manufacturing 31,908* 39,150 29,822 51* 50 64 Petroleum and Coal Products 94 163 204 166 98 63 Primary Metals 407 523 478 286 203 196 Metal Fabrication 4,067 5,269 4,283 35 30 39 Non-metallic Mineral Products 1,280 1,688 1.354 39 34 34 Wood Products 3,330 3,380 2,144 26 37 62 Paper Products 635 746 663 191 161 156 * 1971 Source: manufacturing, Table 1 in Manufacturing industries of Canada: national and provincial areas, 1999, Statistics Canada, cat. 31-203, June 2002; Appendix Tables on productivity in the natural resources industries natural posted at www.csls.ca under Reports. Refined petroleum, Table 25; primary metal, Table 76; metal fabrication, Table 124; non-metallic mineral products, Table 99; wood products, Table 153, and paper products, Table 154.

94
Exhibit 10
Labour Productivity (LP) and Total Factor Productivity (TFP) Growth in Natural Resource Industries in the Canadian Economy, 1961-2000
(average annual rate of change) Output Capital-hours TFP TFP Cont. Capital Intensity per hour ratio to LP (%) Cont.to LP (%)
All Industries(GDP) 1.79 1.00 1.49 83.2 16.8
Energy Aggregate 1.88 0.89 1.17 62.2 37.8
Crude petroleum
and natural gas -0.63 -0.02 -0.62 101.6 -1.6
Refined petroleum and 4.41 0.45 4.33 98.2 1.8
coal products
Pipeline transport 2.65 -0.80 3.38 127.5 -27.5
Electric power systems 2.49 1.09 1.68 67.5 32.5
Gas distribution systems 3.17 2.91 1.03 32.5 67.5
Mining 2.56 2.22 1.20 46.9 53.1
Gold mines 1.22 2.68 -0.11 -9.0 109.0
Iron Mines 3.53 2.82 2.18 61.8 38.2
Salt mines 4.19 -0.57 4.53 108.1 -8.1
Coal mines 6.96 2.59 5.65 81.2 18.8
Primary metals 2.56 1.83 2.08 81.3 18.7
Non-metallic
Mineral products 2.31 0.49 2.13 92.2 7.8
Metal fabricating 2.01 0.09 1.99 99.0 1.0
Motor Vehicle Parts 4.74 0.77 4.47 94.3 5.7
Forest Products 1.97 2.16 1.30 66.0 34.0
Logging and Forestry 2.21 -0.48 2.37 107.2 -7.2
Wood Products 2.13 1.73 1.73 81.2 18.8
Paper Products 2.12 2.97 1.08 50.9 49.1
Source: Tables 1-20.
95
Exhibit 11
Labour Productivity (LP) and Total Factor Productivity (TFP) Growth in Natural Resource Industries in the Canadian Economy, 1989-2000
(average annual rate of change) Output Capital-hours TFP TFP Cont. Capital Intensity per Hour Ratio to LP (%) Cont.to LP (%) All Industries(GDP) 1.07 0.01 1.07 100.0 0.00
Energy Aggregate 2.34 1.57 1.09 46.6 53.4
Crude petroleum and natural gas 6.04 6.92 -0.21 -3.5 103.5
Refined petroleum and coal products 2.45 -2.09 2.80 114.3 -14.3
Pipeline transport 3.41 3.67 0.21 6.2 93.8
Electric power systems 1.68 0.27 1.47 87.5 12.5
Gas distribution systems 2.73 4.40 -0.44 -16.1 116.1
Mining 1.24 -2.01 2.51 202.4 -102.4
Gold mines 1.56 -2.02 2.60 166.7 -66.7
Iron Mines 0.59 1.73 -0.22 -37.3 137.3
Salt mines 0.31 -2.67 1.87 603.2 -503.2
Coal mines 6.68 -5.36 9.53 142.6 -42.6
Primary metals 3.15 0.65 2.97 94.3 5.7
Non-metallic Mineral products 2.27 0.86 1.95 85.9 14.1
Metal fabricating 2.13 -0.35 2.23 104.7 -4.7
Motor vehicle parts 4.44 -1.20 4.86 109.5 -9.5
Forest Products 0.77 -1.94 1.38 179.2 -79.2
Logging and forestry -0.23 -2.02 0.45 195.6 -95.6
Wood products -0.55 -1.25 -0.26 152.7 -52.7
Paper products 3.27 -0.61 3.49 106.7 -6.7
Source: Tables 1-20.
96
Exhibit 12
R&D/GDP Ratios for Natural Resource Industries, 1990, 1995 and 2000 1990 1995 2000 Electric power generation 1.16 1.06 0.47 Oil and gas 0.45 0.68 0.50 Mining 0.66 1.06 0.22 Primary metals 3.45 2.69 1.56 Fabricated metals 0.47 1.34 0.54 Forestry and logging 0.16 0.23 0.26 Wood products 0.76 0.60 0.33 Paper mfg 1.85 2.11 1.10 Motor vehicles 0.69 1.36 1.89 Source: Holbrook (2002)
97
List of Tables for the Natural Resources Productivity Project 1. Total Economy Table 1: Average Annual Growth Rates in All Industries 2. Energy Sector Industries Table 2: Average Annual Growth Rates in the Energy Aggregate Sector Table 3: Average Annual Growth Rates in the Crude Petroleum and Natural Gas Industries Table 4: Average Annual Growth Rates in the Refined Petroleum and Coal Products Industries Table 5: Average Annual Growth Rates in the Pipeline Transport Industries Table 6: Average Annual Growth Rates in the Electric Power System Industries Table 7: Average Annual Growth Rates in the Gas Distribution Systems Industry 3. Forest Products Industries Table 8: Average Annual Growth Rates in the Forestry and Logging Sector Table 9: Average Annual Growth Rates in the Wood Products Sector Table 10: Average Annual Growth Rates in the Paper Products Sector Table 11: Average Annual Growth Rates in the Forest Products Sector Aggregate 4. Mining Sector Industries Table 12: Average Annual Growth Rates in the Mining Sector Table 13: Average Annual Growth Rates in Gold Mines Table 14: Average Annual Growth Rates in Iron Mines Table 15: Average Annual Growth Rates in Salt Mines Table 16: Average Annual Growth Rates in Coal Mines 5. Mineral Products Transformation Industries Table 17: Average Annual Growth Rates in the Primary Metals Sector Table 18: Average Annual Growth Rates in the Fabricated Metals Sector Table 19: Average Annual Growth Rates in the Non- Metallic Minerals Sector Table 20: Average Annual Growth Rates in the Motor Vehicles Parts and Accessories Sector
98
List of Charts for the Natural Resources Productivity Project 1.Productivity Growth Rates Chart 1: Value Added per Hour Worked Average Annual Growth Rates in Natural Resources
Industries, 1961-2000. Chart 2: Value Added per Hour Worked Average Annual Growth Rates in Natural Resources
Industries, 1989-2000. Chart 3: Total Factor Productivity Average Annual Growth Rates in Natural Resources Industries,
1961-2000. Chart 4: Total Factor Productivity Average Annual Growth Rates in Natural Resources Industries,
1989-2000. 2. Energy Sector Chart 5: Provincial GDP Shares of the Canadian Oil and Gas Extraction Industry [211], NAICS
based, 2001. Chart 6: Provincial GDP Shares of the Canadian Support Activities for Mining and Oil and Gas
extraction Industry [2131], NAICS based, 2001. Chart 7: Provincial GDP Shares of the Canadian Electric power Generation Industry [2211],
NAICS based, 2001. Chart 8: Provincial GDP Shares of the Canadian Natural GAS Distribution Industry [2212],
NAICS based, 2001. Chart 9: Provincial GDP Shares of the Canadian Petroleum and Coal Products Manufacturing
Industry [324], NAICS based, 2001. Chart 10: Provincial GDP Shares of the Canadian Pipeline Transportation Industry [486], NAICS
based, 2001. Chart 11: Indexes of Real Value Added per Hour worked (1961=100) in Energy Industries, 1961-
2000 Chart 12: Total Factor Productivity Indexes for the Energy Sector, 1961-2000 3. Mining Sector Chart 13: Provincial GDP Shares of the Canadian Coal Mining Industry [2121], NAICS based,
2001. Chart 14: Provincial GDP Shares of the Canadian Metal Ore Mining Industry [2122], NAICS
based, 2001. Chart 15: Provincial GDP Shares of the Canadian Non-metallic Mining Industry [2123], NAICS
based, 2001. Chart 16: Indexes of Real Value Added per Hour Worked (1961=100) in Mining Industry, 1961-
2000 Chart 17: Index of Total Factor Productivity in Mining Sector, 1961-2000 4. Non Metallic Mineral Products Sector Chart 18: Provincial GDP Shares of the Canadian Non-metallic Mineral Production [327], NAICS
based, 2001. Chart 19: Indexes of Real Value Added per Hour Worked (1961=1.000) in Non-metallic Mineral
Products Industries, 1961-2000 Chart 20: Indexes of Total Factor Productivity (1961=1.000) in Non-metallic Mineral Products
Industries, 1961-2000
99
5. Primary Metal Products Sector Chart 21: Provincial GDP Shares of the Canadian Primary Metal Products Industry [29], SIC based,
1999 Chart 22: Indexes of Real Value added per Hour Worked (1961=1.000) in Primary Metal
Industries, 1961-1997 Chart 23: Indexes of Total Factor Productivity (1961=1.000) in Primary Metal Industries, 1961-
2000 6. Fabricated Metal Products Chart 24: Provincial GDP Shares of the Canadian Fabricated Metal Products Industries [30], SIC
based, 1999 Chart 25: Indexes of Value Added per Hour Worked in Primary Metal Industries, Fabricated Metal
Products Industries, Non-metallic Mineral Products Indutries, and Mining Industries, 1961-2000
Chart 26: Total Factor Productivity Indexes in Primary Metal Industries, Fabricated Metal Products Industries, Non-metallic Mineral Products Industries, and Mining Industries, 1961-2000
7. Forest Products Sector Chart 27: Provincial GDP Shares of the Canadian Forestry and Logging Industry [113], NAICS
based, 2001. Chart 28: Provincial GDP Shares of the Canadian Wood Products Industry [25], SIC based, 1999 Chart 29: Provincial GDP Shares of the Canadian Paper and Allied Products Industry [27], SIC
based, 1999 Chart 30: Real Value Added per Hour Worked Index for the Forest Sectors, SIC-based, Canada,
1961-2000 Chart 31: Total Factor Productivity Indexes in the Forest Sectors, Canada, SIC based, 1961-2000
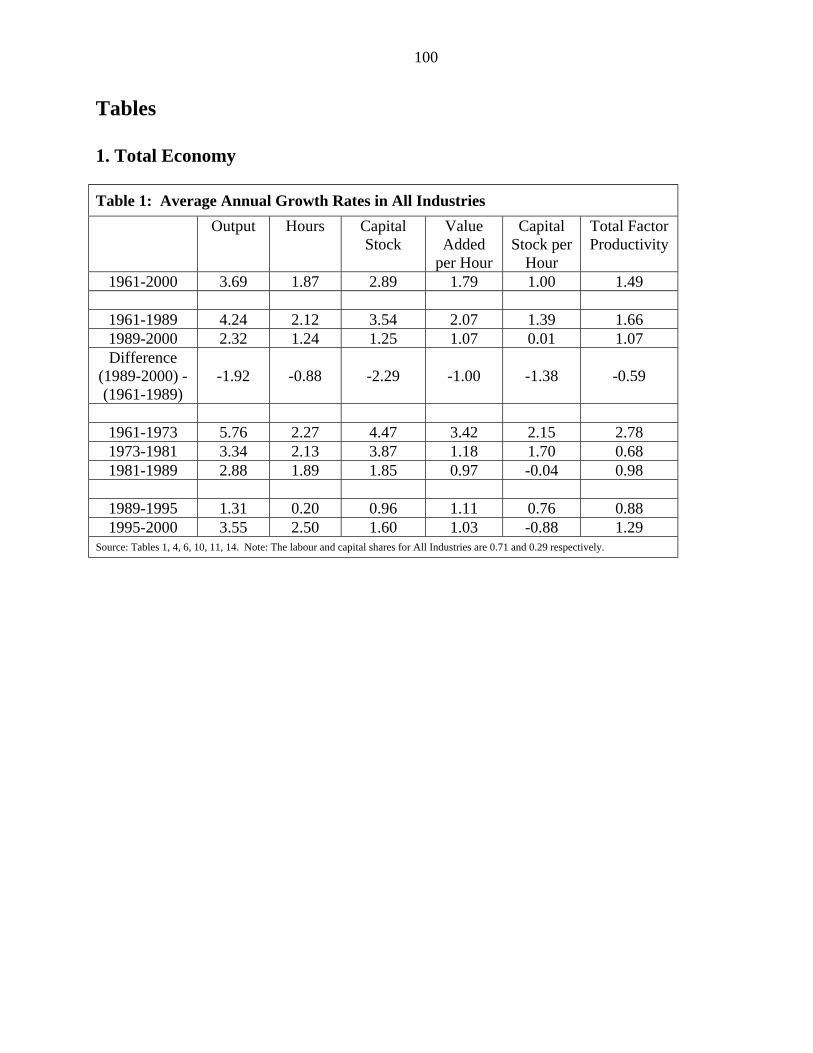
100
Tables 1. Total Economy Table 1: Average Annual Growth Rates in All Industries
Output Hours Capital Stock
Value Added
per Hour
Capital Stock per
Hour
Total Factor Productivity
1961-2000 3.69 1.87 2.89 1.79 1.00 1.49
1961-1989 4.24 2.12 3.54 2.07 1.39 1.66 1989-2000 2.32 1.24 1.25 1.07 0.01 1.07 Difference
(1989-2000) -(1961-1989)
-1.92 -0.88 -2.29 -1.00 -1.38 -0.59
1961-1973 5.76 2.27 4.47 3.42 2.15 2.78 1973-1981 3.34 2.13 3.87 1.18 1.70 0.68 1981-1989 2.88 1.89 1.85 0.97 -0.04 0.98
1989-1995 1.31 0.20 0.96 1.11 0.76 0.88 1995-2000 3.55 2.50 1.60 1.03 -0.88 1.29
Source: Tables 1, 4, 6, 10, 11, 14. Note: The labour and capital shares for All Industries are 0.71 and 0.29 respectively.
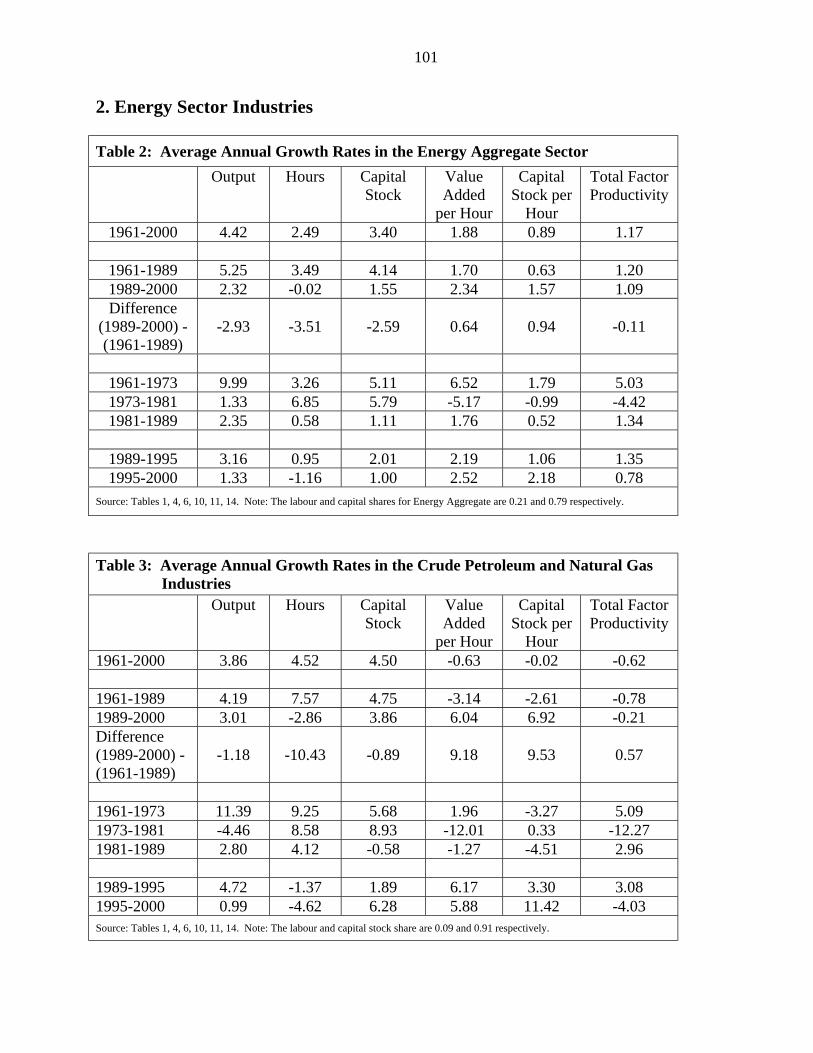
101
2. Energy Sector Industries
Table 2: Average Annual Growth Rates in the Energy Aggregate Sector Output Hours Capital
Stock Value Added
per Hour
Capital Stock per
Hour
Total Factor Productivity
1961-2000 4.42 2.49 3.40 1.88 0.89 1.17
1961-1989 5.25 3.49 4.14 1.70 0.63 1.20 1989-2000 2.32 -0.02 1.55 2.34 1.57 1.09 Difference
(1989-2000) -(1961-1989)
-2.93 -3.51 -2.59 0.64 0.94 -0.11
1961-1973 9.99 3.26 5.11 6.52 1.79 5.03 1973-1981 1.33 6.85 5.79 -5.17 -0.99 -4.42 1981-1989 2.35 0.58 1.11 1.76 0.52 1.34
1989-1995 3.16 0.95 2.01 2.19 1.06 1.35 1995-2000 1.33 -1.16 1.00 2.52 2.18 0.78
Source: Tables 1, 4, 6, 10, 11, 14. Note: The labour and capital shares for Energy Aggregate are 0.21 and 0.79 respectively.
Table 3: Average Annual Growth Rates in the Crude Petroleum and Natural Gas
Industries Output Hours Capital
Stock Value Added
per Hour
Capital Stock per
Hour
Total Factor Productivity
1961-2000 3.86 4.52 4.50 -0.63 -0.02 -0.62 1961-1989 4.19 7.57 4.75 -3.14 -2.61 -0.78 1989-2000 3.01 -2.86 3.86 6.04 6.92 -0.21 Difference (1989-2000) -(1961-1989)
-1.18 -10.43 -0.89 9.18 9.53 0.57
1961-1973 11.39 9.25 5.68 1.96 -3.27 5.09 1973-1981 -4.46 8.58 8.93 -12.01 0.33 -12.27 1981-1989 2.80 4.12 -0.58 -1.27 -4.51 2.96 1989-1995 4.72 -1.37 1.89 6.17 3.30 3.08 1995-2000 0.99 -4.62 6.28 5.88 11.42 -4.03 Source: Tables 1, 4, 6, 10, 11, 14. Note: The labour and capital stock share are 0.09 and 0.91 respectively.
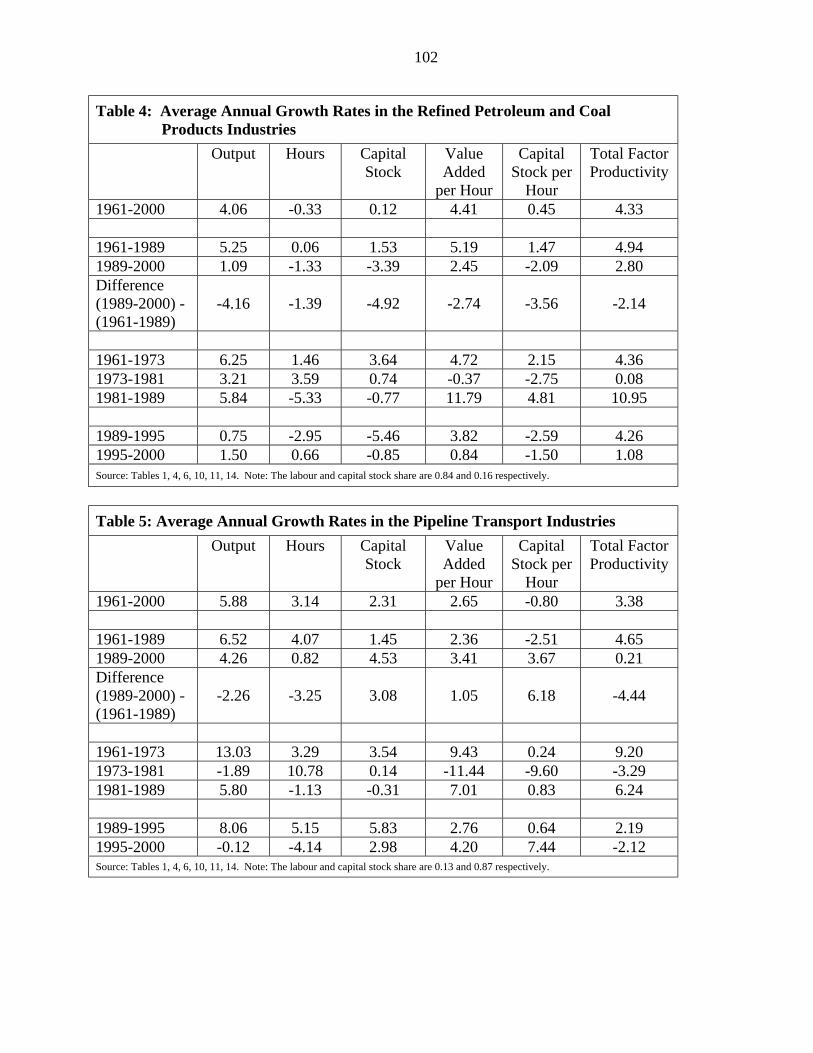
102
Table 4: Average Annual Growth Rates in the Refined Petroleum and Coal Products Industries
Output Hours Capital Stock
Value Added
per Hour
Capital Stock per
Hour
Total Factor Productivity
1961-2000 4.06 -0.33 0.12 4.41 0.45 4.33 1961-1989 5.25 0.06 1.53 5.19 1.47 4.94 1989-2000 1.09 -1.33 -3.39 2.45 -2.09 2.80 Difference (1989-2000) -(1961-1989)
-4.16 -1.39 -4.92 -2.74 -3.56 -2.14
1961-1973 6.25 1.46 3.64 4.72 2.15 4.36 1973-1981 3.21 3.59 0.74 -0.37 -2.75 0.08 1981-1989 5.84 -5.33 -0.77 11.79 4.81 10.95 1989-1995 0.75 -2.95 -5.46 3.82 -2.59 4.26 1995-2000 1.50 0.66 -0.85 0.84 -1.50 1.08 Source: Tables 1, 4, 6, 10, 11, 14. Note: The labour and capital stock share are 0.84 and 0.16 respectively.
Table 5: Average Annual Growth Rates in the Pipeline Transport Industries Output Hours Capital
Stock Value Added
per Hour
Capital Stock per
Hour
Total Factor Productivity
1961-2000 5.88 3.14 2.31 2.65 -0.80 3.38 1961-1989 6.52 4.07 1.45 2.36 -2.51 4.65 1989-2000 4.26 0.82 4.53 3.41 3.67 0.21 Difference (1989-2000) -(1961-1989)
-2.26 -3.25 3.08 1.05 6.18 -4.44
1961-1973 13.03 3.29 3.54 9.43 0.24 9.20 1973-1981 -1.89 10.78 0.14 -11.44 -9.60 -3.29 1981-1989 5.80 -1.13 -0.31 7.01 0.83 6.24 1989-1995 8.06 5.15 5.83 2.76 0.64 2.19 1995-2000 -0.12 -4.14 2.98 4.20 7.44 -2.12 Source: Tables 1, 4, 6, 10, 11, 14. Note: The labour and capital stock share are 0.13 and 0.87 respectively.
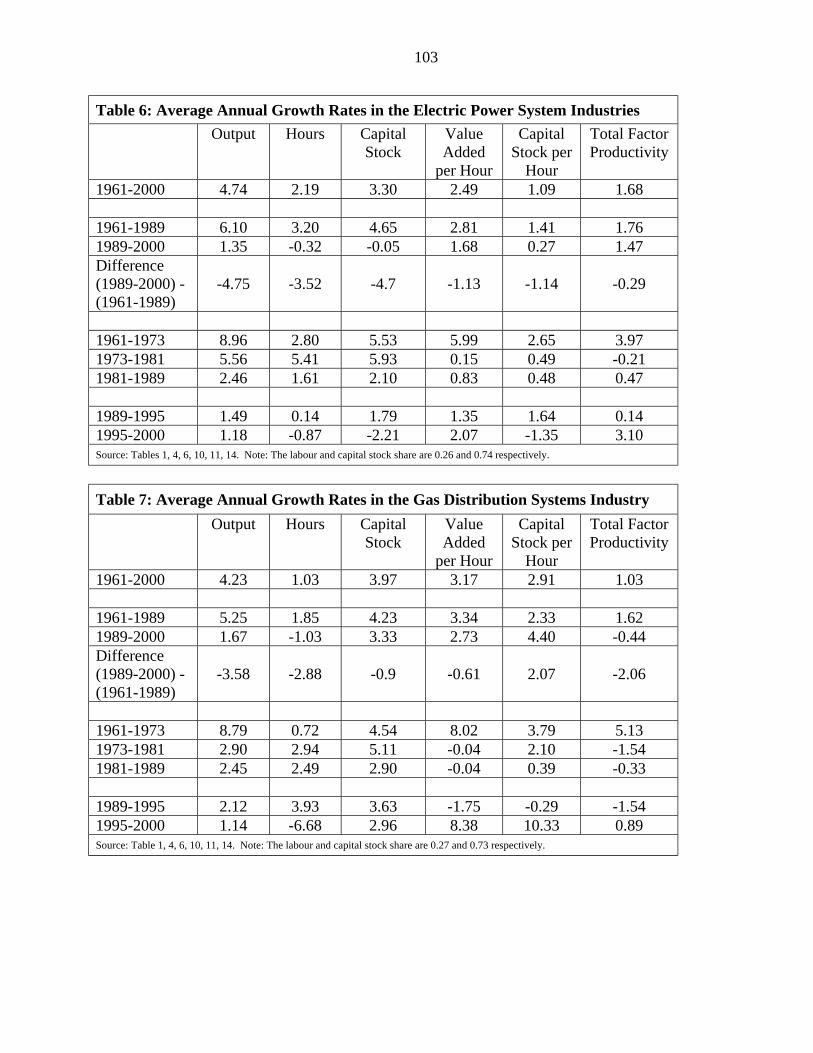
103
Table 6: Average Annual Growth Rates in the Electric Power System Industries Output Hours Capital
Stock Value Added
per Hour
Capital Stock per
Hour
Total Factor Productivity
1961-2000 4.74 2.19 3.30 2.49 1.09 1.68 1961-1989 6.10 3.20 4.65 2.81 1.41 1.76 1989-2000 1.35 -0.32 -0.05 1.68 0.27 1.47 Difference (1989-2000) -(1961-1989)
-4.75 -3.52 -4.7 -1.13 -1.14 -0.29
1961-1973 8.96 2.80 5.53 5.99 2.65 3.97 1973-1981 5.56 5.41 5.93 0.15 0.49 -0.21 1981-1989 2.46 1.61 2.10 0.83 0.48 0.47 1989-1995 1.49 0.14 1.79 1.35 1.64 0.14 1995-2000 1.18 -0.87 -2.21 2.07 -1.35 3.10 Source: Tables 1, 4, 6, 10, 11, 14. Note: The labour and capital stock share are 0.26 and 0.74 respectively.
Table 7: Average Annual Growth Rates in the Gas Distribution Systems Industry Output Hours Capital
Stock Value Added
per Hour
Capital Stock per
Hour
Total Factor Productivity
1961-2000 4.23 1.03 3.97 3.17 2.91 1.03 1961-1989 5.25 1.85 4.23 3.34 2.33 1.62 1989-2000 1.67 -1.03 3.33 2.73 4.40 -0.44 Difference (1989-2000) -(1961-1989)
-3.58 -2.88 -0.9 -0.61 2.07 -2.06
1961-1973 8.79 0.72 4.54 8.02 3.79 5.13 1973-1981 2.90 2.94 5.11 -0.04 2.10 -1.54 1981-1989 2.45 2.49 2.90 -0.04 0.39 -0.33 1989-1995 2.12 3.93 3.63 -1.75 -0.29 -1.54 1995-2000 1.14 -6.68 2.96 8.38 10.33 0.89 Source: Table 1, 4, 6, 10, 11, 14. Note: The labour and capital stock share are 0.27 and 0.73 respectively.
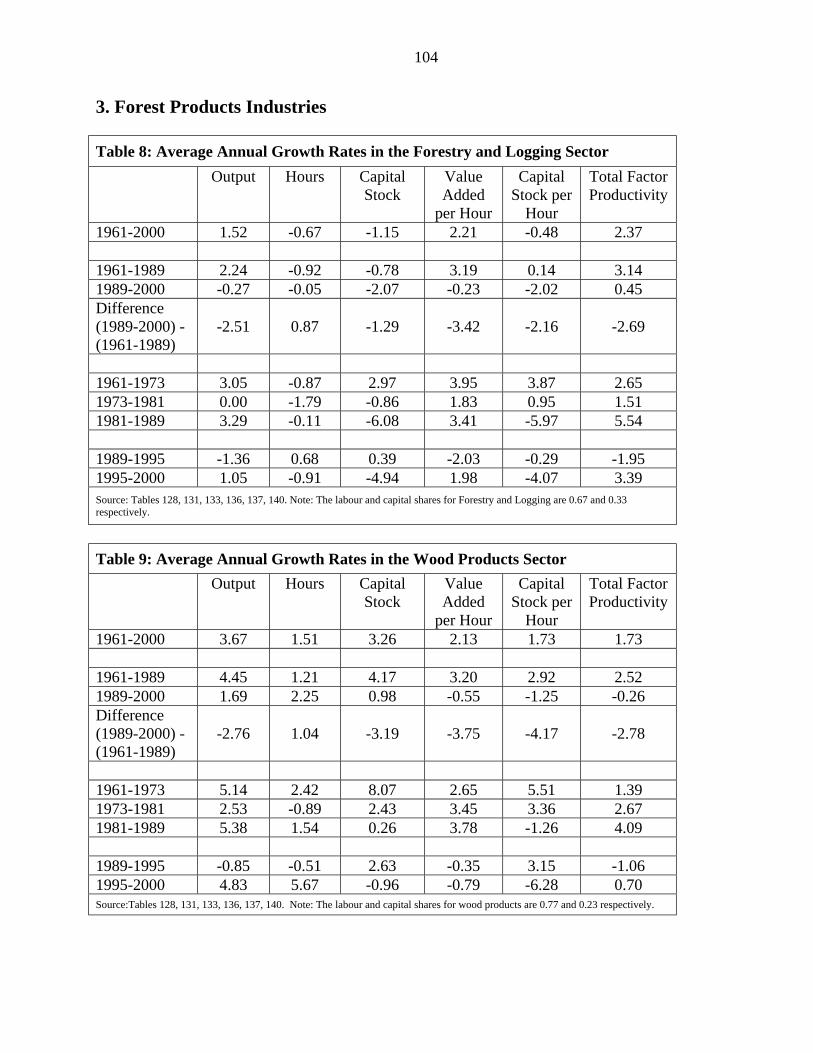
104
3. Forest Products Industries Table 8: Average Annual Growth Rates in the Forestry and Logging Sector Output Hours Capital
Stock Value Added
per Hour
Capital Stock per
Hour
Total Factor Productivity
1961-2000 1.52 -0.67 -1.15 2.21 -0.48 2.37 1961-1989 2.24 -0.92 -0.78 3.19 0.14 3.14 1989-2000 -0.27 -0.05 -2.07 -0.23 -2.02 0.45 Difference (1989-2000) -(1961-1989)
-2.51 0.87 -1.29 -3.42 -2.16 -2.69
1961-1973 3.05 -0.87 2.97 3.95 3.87 2.65 1973-1981 0.00 -1.79 -0.86 1.83 0.95 1.51 1981-1989 3.29 -0.11 -6.08 3.41 -5.97 5.54
1989-1995 -1.36 0.68 0.39 -2.03 -0.29 -1.95 1995-2000 1.05 -0.91 -4.94 1.98 -4.07 3.39 Source: Tables 128, 131, 133, 136, 137, 140. Note: The labour and capital shares for Forestry and Logging are 0.67 and 0.33 respectively.
Table 9: Average Annual Growth Rates in the Wood Products Sector Output Hours Capital
Stock Value Added
per Hour
Capital Stock per
Hour
Total Factor Productivity
1961-2000 3.67 1.51 3.26 2.13 1.73 1.73 1961-1989 4.45 1.21 4.17 3.20 2.92 2.52 1989-2000 1.69 2.25 0.98 -0.55 -1.25 -0.26 Difference (1989-2000) -(1961-1989)
-2.76 1.04 -3.19 -3.75 -4.17 -2.78
1961-1973 5.14 2.42 8.07 2.65 5.51 1.39 1973-1981 2.53 -0.89 2.43 3.45 3.36 2.67 1981-1989 5.38 1.54 0.26 3.78 -1.26 4.09
1989-1995 -0.85 -0.51 2.63 -0.35 3.15 -1.06 1995-2000 4.83 5.67 -0.96 -0.79 -6.28 0.70 Source:Tables 128, 131, 133, 136, 137, 140. Note: The labour and capital shares for wood products are 0.77 and 0.23 respectively.
105
Table 10: Average Annual Growth Rates in the Paper Products Sector Output Hours Capital
Stock Value Added
per Hour
Capital Stock per
Hour
Total Factor Productivity
1961-2000 2.06 -0.05 2.91 2.12 2.97 1.08 1961-1989 2.12 0.44 4.87 1.67 4.41 0.15 1989-2000 1.92 -1.31 -1.91 3.27 -0.61 3.49 Difference (1989-2000) -(1961-1989)
-0.2 -1.75 -6.78 1.6 -5.02 3.34
1961-1973 3.77 1.84 5.43 1.90 3.52 0.67 1973-1981 0.37 -0.55 2.41 0.92 2.98 -0.11 1981-1989 1.43 -0.64 6.52 2.09 7.21 -0.37
1989-1995 1.81 -2.16 -0.63 4.06 1.56 3.50 1995-2000 2.04 -0.27 -3.42 2.32 -3.15 3.48 Source: Tables 128, 131, 133, 136, 137, 140. Note: The labour and capital shares for paper products are 0.65 and 0.35 respectively.
Table 11: Average Annual Growth Rates in the Forest Products Sector Aggregate Output Hours Capital
Stock Value
Added per Hour
Capital Stock per
Hour
Total Factor Productivity
1961-2000 2.37 0.39 2.56 1.97 2.16 1.30 1961-1989 2.81 0.36 4.19 2.45 3.82 1.26 1989-2000 1.25 0.48 -1.47 0.77 -1.94 1.38 Difference (1989-2000) -(1961-1989)
-1.56 0.12 -5.66 -1.68 -5.76 0.04
1961-1973 3.87 1.28 5.46 2.56 4.10 1.28 1973-1981 0.86 -0.97 2.02 1.85 3.02 0.91 1981-1989 3.21 0.32 4.50 2.87 4.16 1.58
1989-1995 0.05 -0.83 -0.10 0.88 0.73 0.66 1995-2000 2.71 2.07 -3.08 0.63 -5.05 2.26 Source: Tables 128, 131, 133, 136, 137, 140. Note: The labour and capital shares for the forest products aggregate are 0.69 and 0.31 respectively.
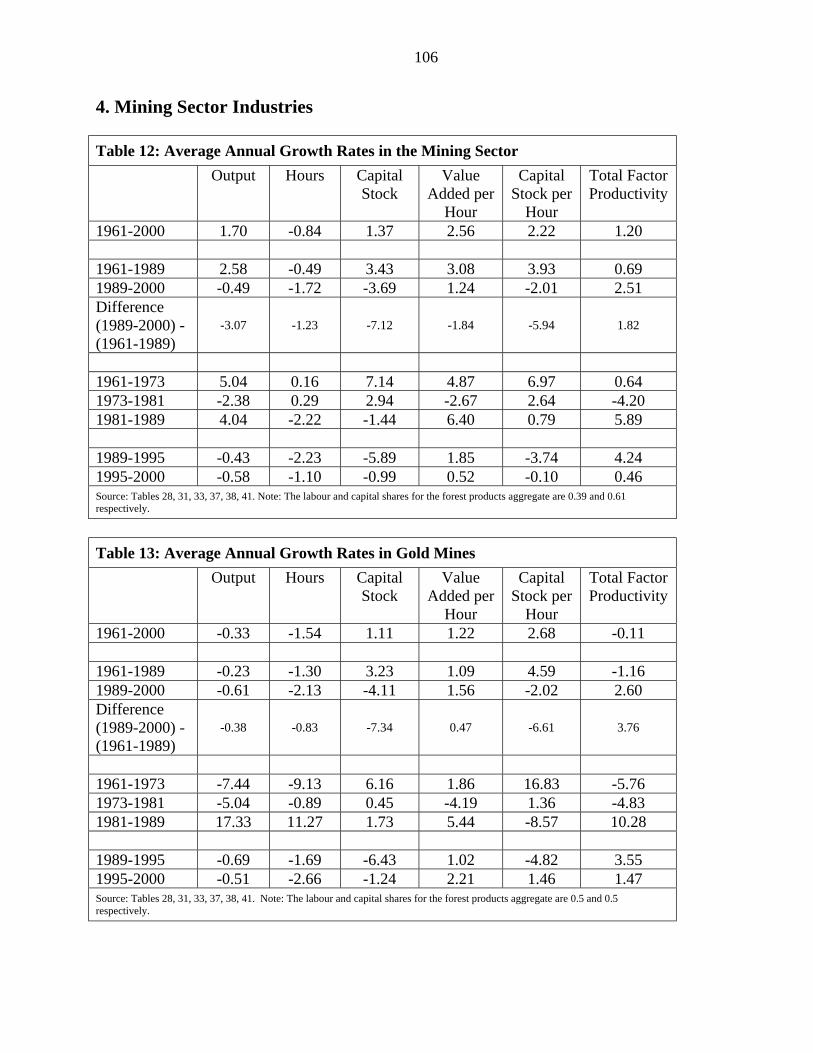
106
4. Mining Sector Industries Table 12: Average Annual Growth Rates in the Mining Sector Output Hours Capital
Stock Value
Added per Hour
Capital Stock per
Hour
Total Factor Productivity
1961-2000 1.70 -0.84 1.37 2.56 2.22 1.20 1961-1989 2.58 -0.49 3.43 3.08 3.93 0.69 1989-2000 -0.49 -1.72 -3.69 1.24 -2.01 2.51 Difference (1989-2000) -(1961-1989)
-3.07 -1.23 -7.12 -1.84 -5.94 1.82
1961-1973 5.04 0.16 7.14 4.87 6.97 0.64 1973-1981 -2.38 0.29 2.94 -2.67 2.64 -4.20 1981-1989 4.04 -2.22 -1.44 6.40 0.79 5.89
1989-1995 -0.43 -2.23 -5.89 1.85 -3.74 4.24 1995-2000 -0.58 -1.10 -0.99 0.52 -0.10 0.46 Source: Tables 28, 31, 33, 37, 38, 41. Note: The labour and capital shares for the forest products aggregate are 0.39 and 0.61 respectively.
Table 13: Average Annual Growth Rates in Gold Mines Output Hours Capital
Stock Value
Added per Hour
Capital Stock per
Hour
Total Factor Productivity
1961-2000 -0.33 -1.54 1.11 1.22 2.68 -0.11 1961-1989 -0.23 -1.30 3.23 1.09 4.59 -1.16 1989-2000 -0.61 -2.13 -4.11 1.56 -2.02 2.60 Difference (1989-2000) -(1961-1989)
-0.38 -0.83 -7.34 0.47 -6.61 3.76
1961-1973 -7.44 -9.13 6.16 1.86 16.83 -5.76 1973-1981 -5.04 -0.89 0.45 -4.19 1.36 -4.83 1981-1989 17.33 11.27 1.73 5.44 -8.57 10.28
1989-1995 -0.69 -1.69 -6.43 1.02 -4.82 3.55 1995-2000 -0.51 -2.66 -1.24 2.21 1.46 1.47 Source: Tables 28, 31, 33, 37, 38, 41. Note: The labour and capital shares for the forest products aggregate are 0.5 and 0.5 respectively.
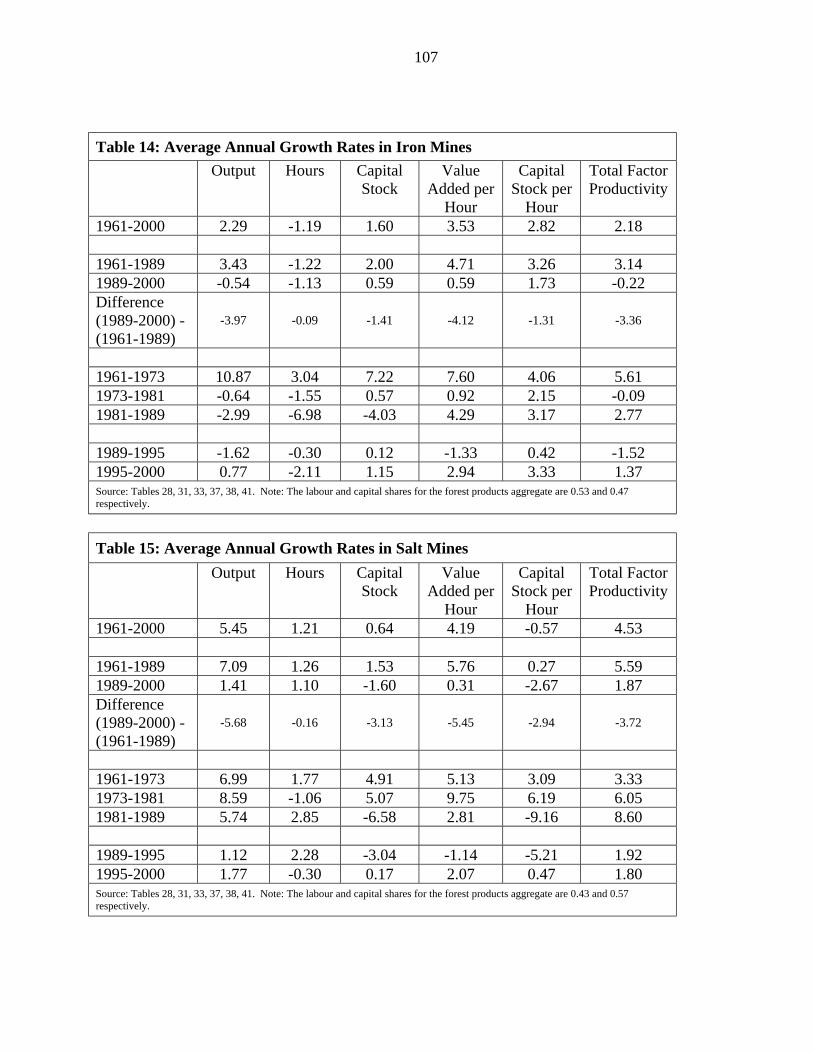
107
Table 14: Average Annual Growth Rates in Iron Mines Output Hours Capital
Stock Value
Added per Hour
Capital Stock per
Hour
Total Factor Productivity
1961-2000 2.29 -1.19 1.60 3.53 2.82 2.18 1961-1989 3.43 -1.22 2.00 4.71 3.26 3.14 1989-2000 -0.54 -1.13 0.59 0.59 1.73 -0.22 Difference (1989-2000) -(1961-1989)
-3.97 -0.09 -1.41 -4.12 -1.31 -3.36
1961-1973 10.87 3.04 7.22 7.60 4.06 5.61 1973-1981 -0.64 -1.55 0.57 0.92 2.15 -0.09 1981-1989 -2.99 -6.98 -4.03 4.29 3.17 2.77
1989-1995 -1.62 -0.30 0.12 -1.33 0.42 -1.52 1995-2000 0.77 -2.11 1.15 2.94 3.33 1.37 Source: Tables 28, 31, 33, 37, 38, 41. Note: The labour and capital shares for the forest products aggregate are 0.53 and 0.47 respectively.
Table 15: Average Annual Growth Rates in Salt Mines Output Hours Capital
Stock Value
Added per Hour
Capital Stock per
Hour
Total Factor Productivity
1961-2000 5.45 1.21 0.64 4.19 -0.57 4.53 1961-1989 7.09 1.26 1.53 5.76 0.27 5.59 1989-2000 1.41 1.10 -1.60 0.31 -2.67 1.87 Difference (1989-2000) -(1961-1989)
-5.68 -0.16 -3.13 -5.45 -2.94 -3.72
1961-1973 6.99 1.77 4.91 5.13 3.09 3.33 1973-1981 8.59 -1.06 5.07 9.75 6.19 6.05 1981-1989 5.74 2.85 -6.58 2.81 -9.16 8.60
1989-1995 1.12 2.28 -3.04 -1.14 -5.21 1.92 1995-2000 1.77 -0.30 0.17 2.07 0.47 1.80 Source: Tables 28, 31, 33, 37, 38, 41. Note: The labour and capital shares for the forest products aggregate are 0.43 and 0.57 respectively.
108
Table 16: Average Annual Growth Rates in Coal Mines Output Hours Capital
Stock Value
Added per Hour
Capital Stock per
Hour
Total Factor Productivity
1961-2000 5.12 -1.72 0.83 6.96 2.59 5.65 1961-1989 7.23 0.15 6.05 7.07 5.89 4.17 1989-2000 -0.06 -6.32 -11.33 6.68 -5.36 9.53 Difference (1989-2000) -(1961-1989)
-7.29 -6.47 -17.38 -0.39 -11.25 5.36
1961-1973 5.62 -3.35 12.17 9.29 16.06 1.75 1973-1981 6.96 5.16 6.14 1.71 0.93 1.26 1981-1989 9.97 0.62 -2.58 9.30 -3.17 11.01
1989-1995 1.04 -1.30 -10.93 2.38 -9.75 7.54 1995-2000 -1.37 -12.00 -11.82 12.08 0.20 11.97 Source: Tables 28, 31, 33, 37, 38, 41. Note: The labour and capital shares for the forest products aggregate are 0.52 and 0.48 respectively.
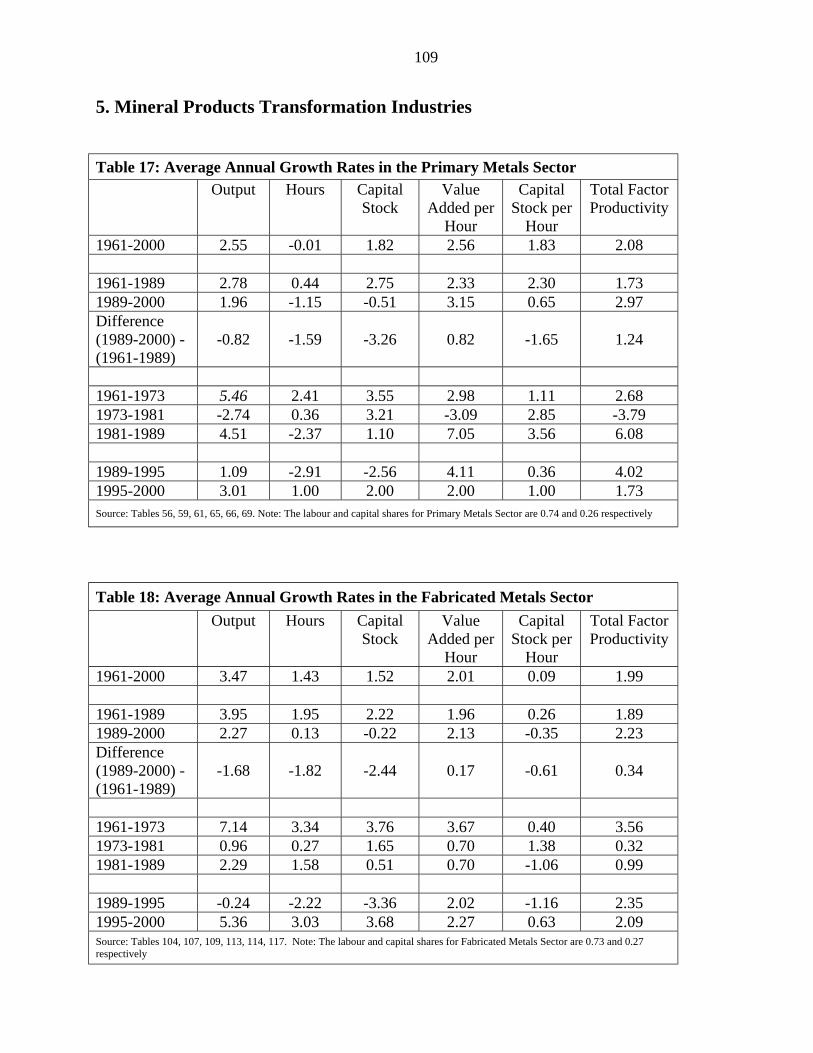
109
5. Mineral Products Transformation Industries Table 17: Average Annual Growth Rates in the Primary Metals Sector Output Hours Capital
Stock Value
Added per Hour
Capital Stock per
Hour
Total Factor Productivity
1961-2000 2.55 -0.01 1.82 2.56 1.83 2.08 1961-1989 2.78 0.44 2.75 2.33 2.30 1.73 1989-2000 1.96 -1.15 -0.51 3.15 0.65 2.97 Difference (1989-2000) -(1961-1989)
-0.82 -1.59 -3.26 0.82 -1.65 1.24
1961-1973 5.46 2.41 3.55 2.98 1.11 2.68 1973-1981 -2.74 0.36 3.21 -3.09 2.85 -3.79 1981-1989 4.51 -2.37 1.10 7.05 3.56 6.08 1989-1995 1.09 -2.91 -2.56 4.11 0.36 4.02 1995-2000 3.01 1.00 2.00 2.00 1.00 1.73 Source: Tables 56, 59, 61, 65, 66, 69. Note: The labour and capital shares for Primary Metals Sector are 0.74 and 0.26 respectively
Table 18: Average Annual Growth Rates in the Fabricated Metals Sector Output Hours Capital
Stock Value
Added per Hour
Capital Stock per
Hour
Total Factor Productivity
1961-2000 3.47 1.43 1.52 2.01 0.09 1.99 1961-1989 3.95 1.95 2.22 1.96 0.26 1.89 1989-2000 2.27 0.13 -0.22 2.13 -0.35 2.23 Difference (1989-2000) -(1961-1989)
-1.68 -1.82 -2.44 0.17 -0.61 0.34
1961-1973 7.14 3.34 3.76 3.67 0.40 3.56 1973-1981 0.96 0.27 1.65 0.70 1.38 0.32 1981-1989 2.29 1.58 0.51 0.70 -1.06 0.99 1989-1995 -0.24 -2.22 -3.36 2.02 -1.16 2.35 1995-2000 5.36 3.03 3.68 2.27 0.63 2.09 Source: Tables 104, 107, 109, 113, 114, 117. Note: The labour and capital shares for Fabricated Metals Sector are 0.73 and 0.27 respectively
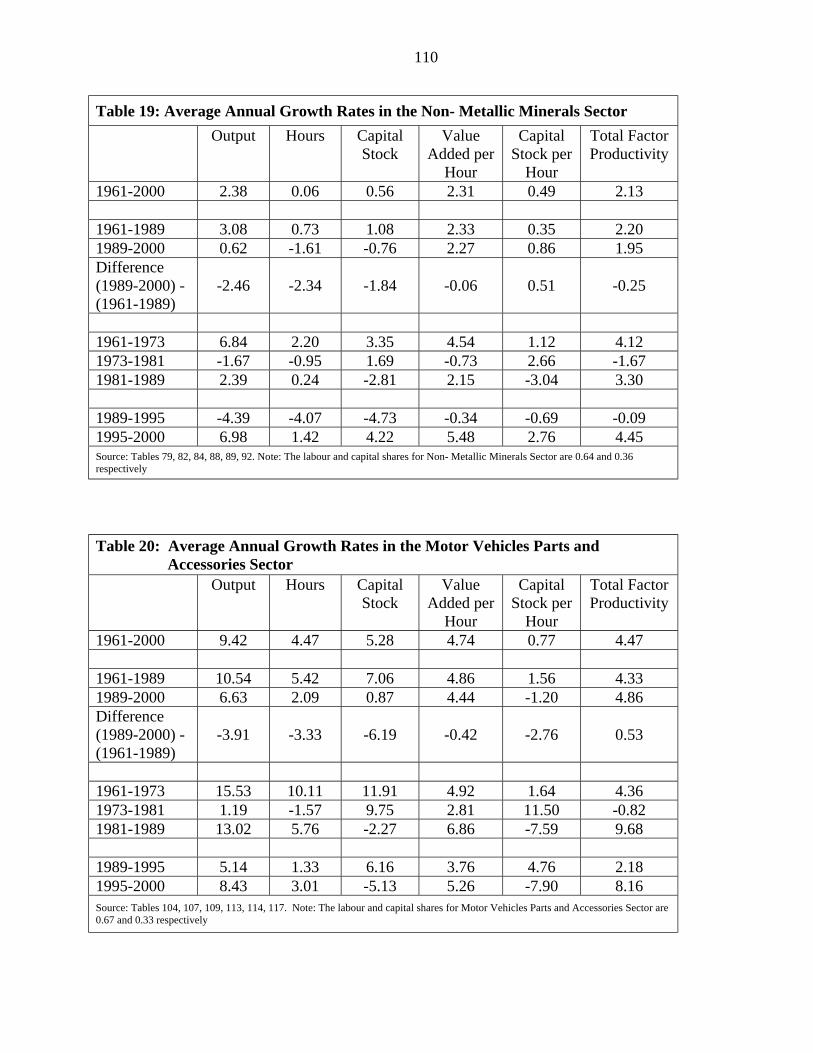
110
Table 19: Average Annual Growth Rates in the Non- Metallic Minerals Sector Output Hours Capital
Stock Value
Added per Hour
Capital Stock per
Hour
Total Factor Productivity
1961-2000 2.38 0.06 0.56 2.31 0.49 2.13 1961-1989 3.08 0.73 1.08 2.33 0.35 2.20 1989-2000 0.62 -1.61 -0.76 2.27 0.86 1.95 Difference (1989-2000) -(1961-1989)
-2.46 -2.34 -1.84 -0.06 0.51 -0.25
1961-1973 6.84 2.20 3.35 4.54 1.12 4.12 1973-1981 -1.67 -0.95 1.69 -0.73 2.66 -1.67 1981-1989 2.39 0.24 -2.81 2.15 -3.04 3.30 1989-1995 -4.39 -4.07 -4.73 -0.34 -0.69 -0.09 1995-2000 6.98 1.42 4.22 5.48 2.76 4.45 Source: Tables 79, 82, 84, 88, 89, 92. Note: The labour and capital shares for Non- Metallic Minerals Sector are 0.64 and 0.36 respectively
Table 20: Average Annual Growth Rates in the Motor Vehicles Parts and
Accessories Sector Output Hours Capital
Stock Value
Added per Hour
Capital Stock per
Hour
Total Factor Productivity
1961-2000 9.42 4.47 5.28 4.74 0.77 4.47 1961-1989 10.54 5.42 7.06 4.86 1.56 4.33 1989-2000 6.63 2.09 0.87 4.44 -1.20 4.86 Difference (1989-2000) -(1961-1989)
-3.91 -3.33 -6.19 -0.42 -2.76 0.53
1961-1973 15.53 10.11 11.91 4.92 1.64 4.36 1973-1981 1.19 -1.57 9.75 2.81 11.50 -0.82 1981-1989 13.02 5.76 -2.27 6.86 -7.59 9.68 1989-1995 5.14 1.33 6.16 3.76 4.76 2.18 1995-2000 8.43 3.01 -5.13 5.26 -7.90 8.16 Source: Tables 104, 107, 109, 113, 114, 117. Note: The labour and capital shares for Motor Vehicles Parts and Accessories Sector are 0.67 and 0.33 respectively
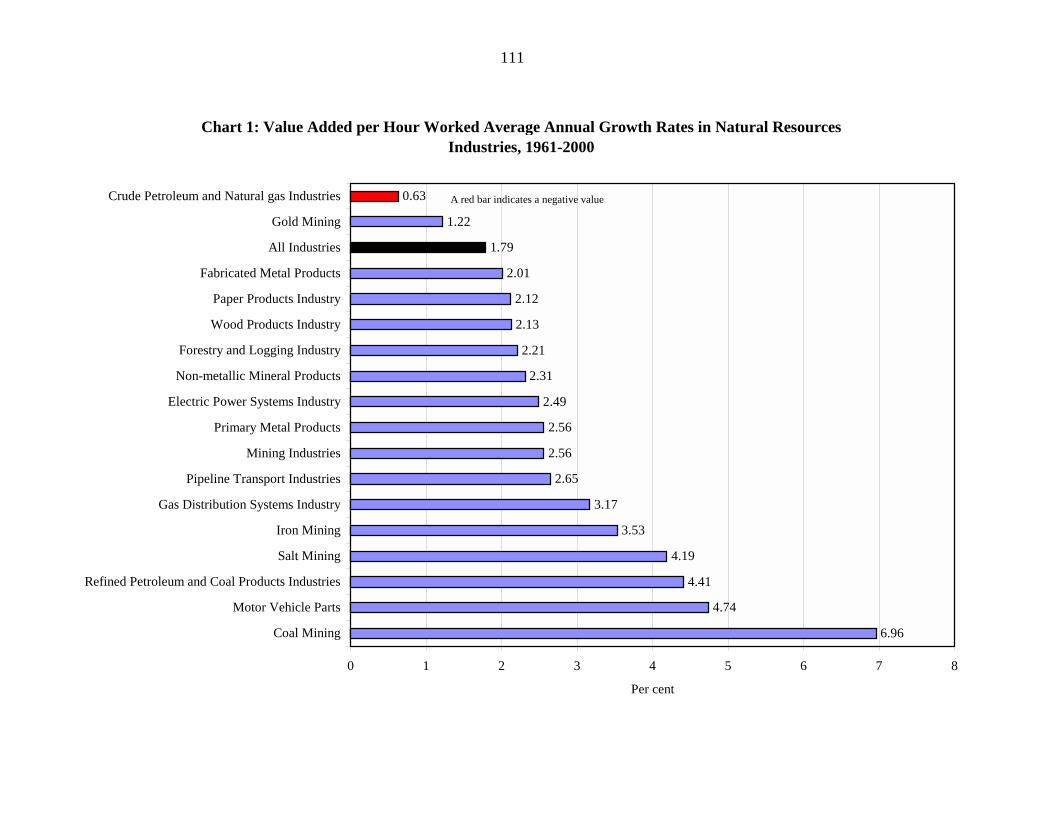
111
Chart 1: Value Added per Hour Worked Average Annual Growth Rates in Natural Resources Industries, 1961-2000
6.96
4.74
4.41
4.19
3.53
3.17
2.65
2.56
2.56
2.49
2.31
2.21
2.13
2.12
2.01
1.79
1.22
0.63
0 1 2 3 4 5 6 7 8
Coal Mining
Motor Vehicle Parts
Refined Petroleum and Coal Products Industries
Salt Mining
Iron Mining
Gas Distribution Systems Industry
Pipeline Transport Industries
Mining Industries
Primary Metal Products
Electric Power Systems Industry
Non-metallic Mineral Products
Forestry and Logging Industry
Wood Products Industry
Paper Products Industry
Fabricated Metal Products
All Industries
Gold Mining
Crude Petroleum and Natural gas Industries
Per cent
A red bar indicates a negative value

112
Chart 2: Total Factor Productivity Average Annual Growth Rates in Natural Resources Industries, 1961-2000
5.65
4.53
4.47
4.33
3.38
2.37
2.18
2.13
2.08
1.99
1.73
1.68
1.49
1.2
1.08
1.03
0.11
0.62
0 1 2 3 4 5 6
Coal Mining
Salt Mining
Motor Vehicle Parts
Refined Petroleum and Coal Products Industries
Pipeline Transport Industries
Forestry and Logging Industry
Iron Mining
Non-metallic Mineral Products
Primary Metal Products
Fabricated Metal Products
Wood Products Industry
Electric Power Systems Industry
All Industries
Mining Industries
Paper Products Industry
Gas Distribution Systems Industry
Gold Mining
Crude Petroleum and Natural gas Industries
Per cent
A red bar indicates a negative value
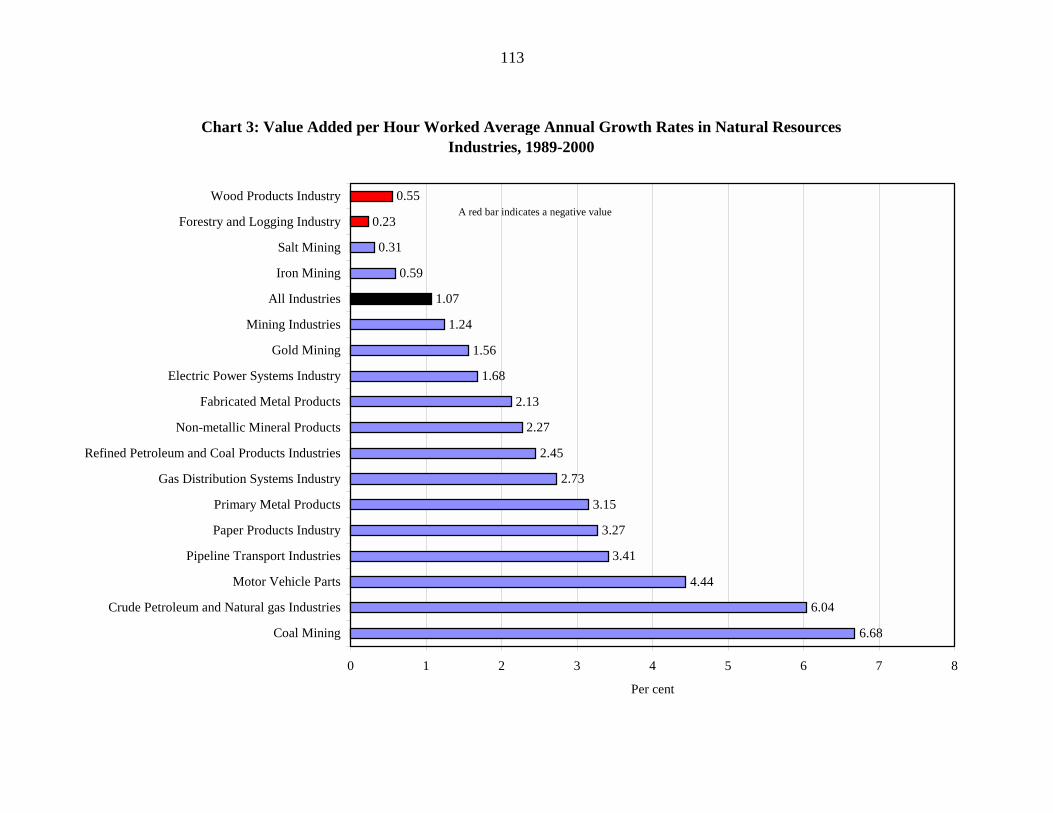
113
Chart 3: Value Added per Hour Worked Average Annual Growth Rates in Natural Resources Industries, 1989-2000
6.68
6.04
4.44
3.41
3.27
3.15
2.73
2.45
2.27
2.13
1.68
1.56
1.24
1.07
0.59
0.31
0.23
0.55
0 1 2 3 4 5 6 7 8
Coal Mining
Crude Petroleum and Natural gas Industries
Motor Vehicle Parts
Pipeline Transport Industries
Paper Products Industry
Primary Metal Products
Gas Distribution Systems Industry
Refined Petroleum and Coal Products Industries
Non-metallic Mineral Products
Fabricated Metal Products
Electric Power Systems Industry
Gold Mining
Mining Industries
All Industries
Iron Mining
Salt Mining
Forestry and Logging Industry
Wood Products Industry
Per cent
A red bar indicates a negative value
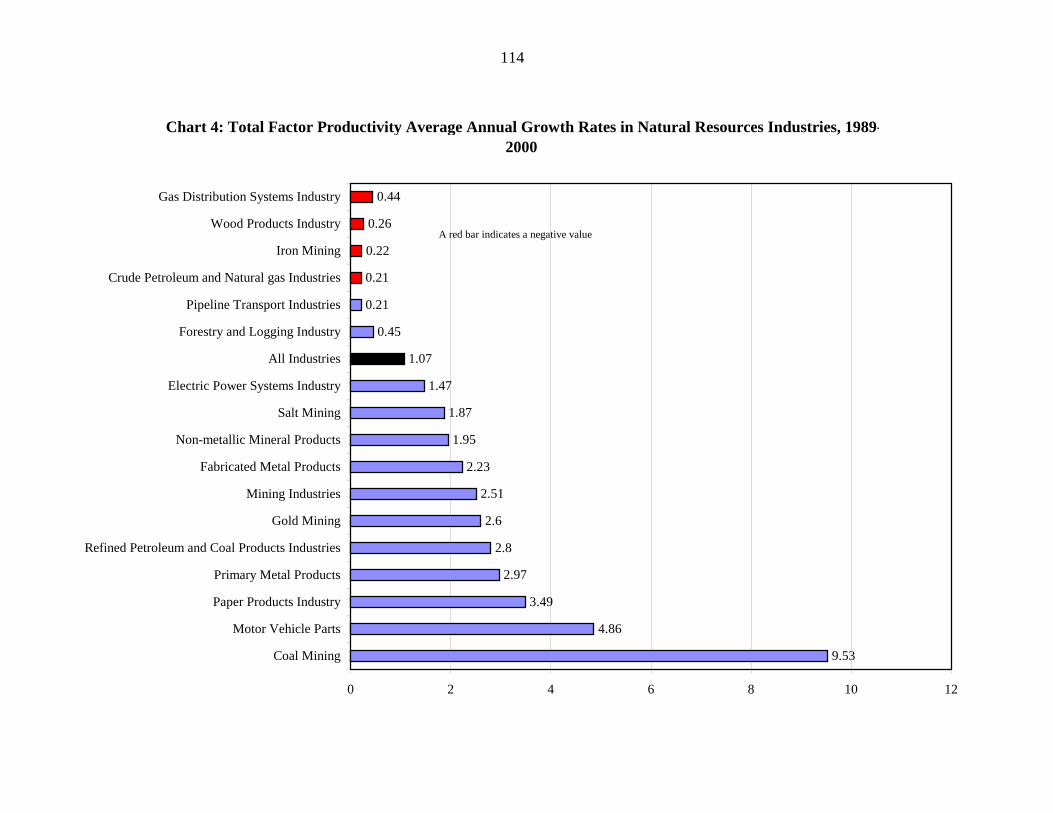
114
Chart 4: Total Factor Productivity Average Annual Growth Rates in Natural Resources Industries, 1989-2000
9.53
4.86
3.49
2.97
2.8
2.6
2.51
2.23
1.95
1.87
1.47
1.07
0.45
0.21
0.21
0.22
0.26
0.44
0 2 4 6 8 10 12
Coal Mining
Motor Vehicle Parts
Paper Products Industry
Primary Metal Products
Refined Petroleum and Coal Products Industries
Gold Mining
Mining Industries
Fabricated Metal Products
Non-metallic Mineral Products
Salt Mining
Electric Power Systems Industry
All Industries
Forestry and Logging Industry
Pipeline Transport Industries
Crude Petroleum and Natural gas Industries
Iron Mining
Wood Products Industry
Gas Distribution Systems Industry
A red bar indicates a negative value
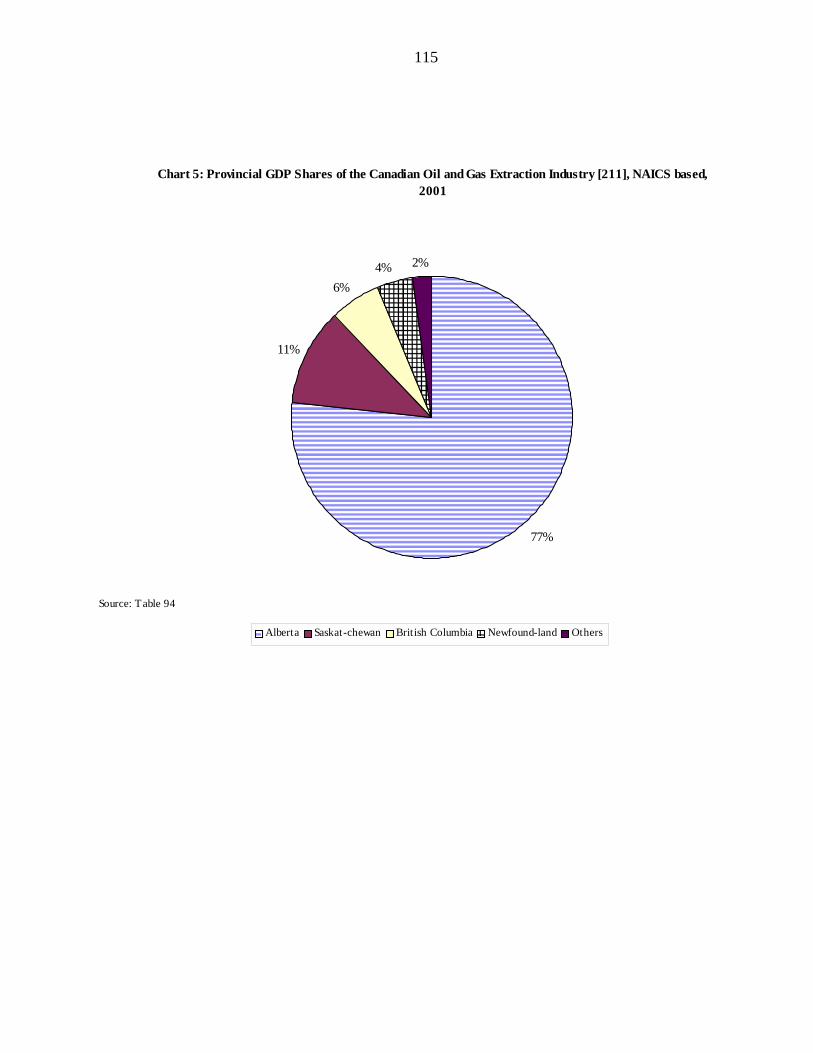
115
���������������������������������������������������������������������������������������������������������������������������������������������������������������������������������������������������������������������������������������������������������������������������������������������������������������������������������������������������������������������������������������������������������������������������������������������������������������������������������������������������������������������������������������������������������������������������������������������������������������������������������������������������������������������������������������������������������������������������������������������������������������������������������������������������������������������������������������������������������������������������������������������������������������������������������������������������������������������������������������������������������������������������������������������������������������������������������������������������������������������������������������������������������������������������������������������������������������������������������������������������������������������������������������������������������������������������������������������������������������������������������������������������������������������������������������������������������������������������������������������������������������������������������������������������������������������������������������������������������������������������������������������������������������������������������������������������������������������������������������������������������������������������������������������������������������������������������������������������������������������������������������������������������������������������������������������������������������������������������������������������������������������������������������������������������������������������������������������������������������������������������������������������������������������������������������������
��������������������������������������������������������������������������������������������������������������������������������������������������������������������������������������������������������������������������������������
Chart 5: Provincial GDP Shares of the Canadian Oil and Gas Extraction Industry [211], NAICS based, 2001
77%
11%
6%4% 2%
���Alberta Saskat-chewan British Columbia
���Others
Source: Table 94
Newfound-land
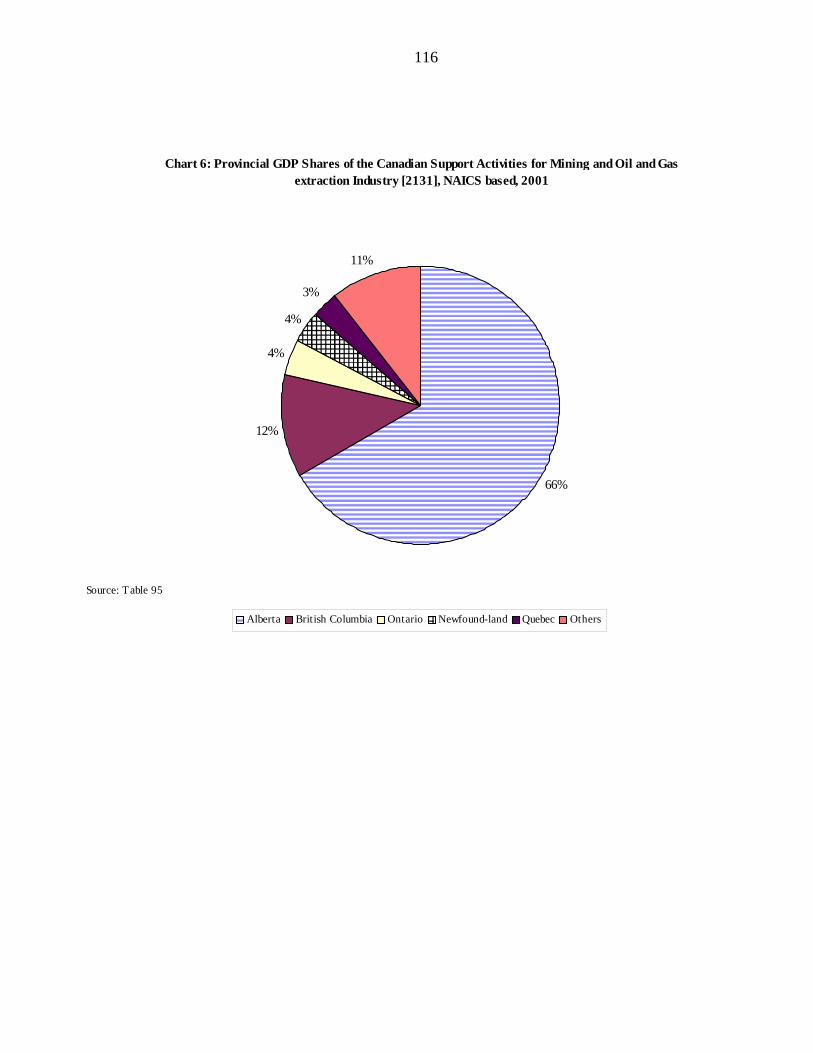
116
�������������������������������������������������������������������������������������������������������������������������������������������������������������������������������������������������������������������������������������������������������������������������������������������������������������������������������������������������������������������������������������������������������������������������������������������������������������������������������������������������������������������������������������������������������������������������������������������������������������������������������������������������������������������������������������������������������������������������������������������������������������������������������������������������������������������������������������������������������������������������������������������������������������������������������������������������������������������������������������������������������������������������������������������������������������������������������������������������������������������������������������������������������������������������������������������������������������������������������������������������������������������������������������������������������������������������������������������������������������������������������������������������������������������������������������������������������������������������������������������������������������������������������������������������������������������������������������������������������������������������������������������������������������������������������������������������������������������������������������������������������������������������������������������������������������������������������������������������������������������������������������������������������������������������������������������������������������������������������������������������������������������������������������
�������������������������������������������������������������������������������������������������������������������������������������������������������������������������������������������������������������������������������������������������������������������������������������������������������������������������������������������������������
Chart 6: Provincial GDP Shares of the Canadian Support Activities for Mining and Oil and Gas extraction Industry [2131], NAICS based, 2001
66%
12%
4%
4%
3%
11%
����Alberta British Columbia Ontario
����Quebec Others
Source: Table 95
Newfound-land
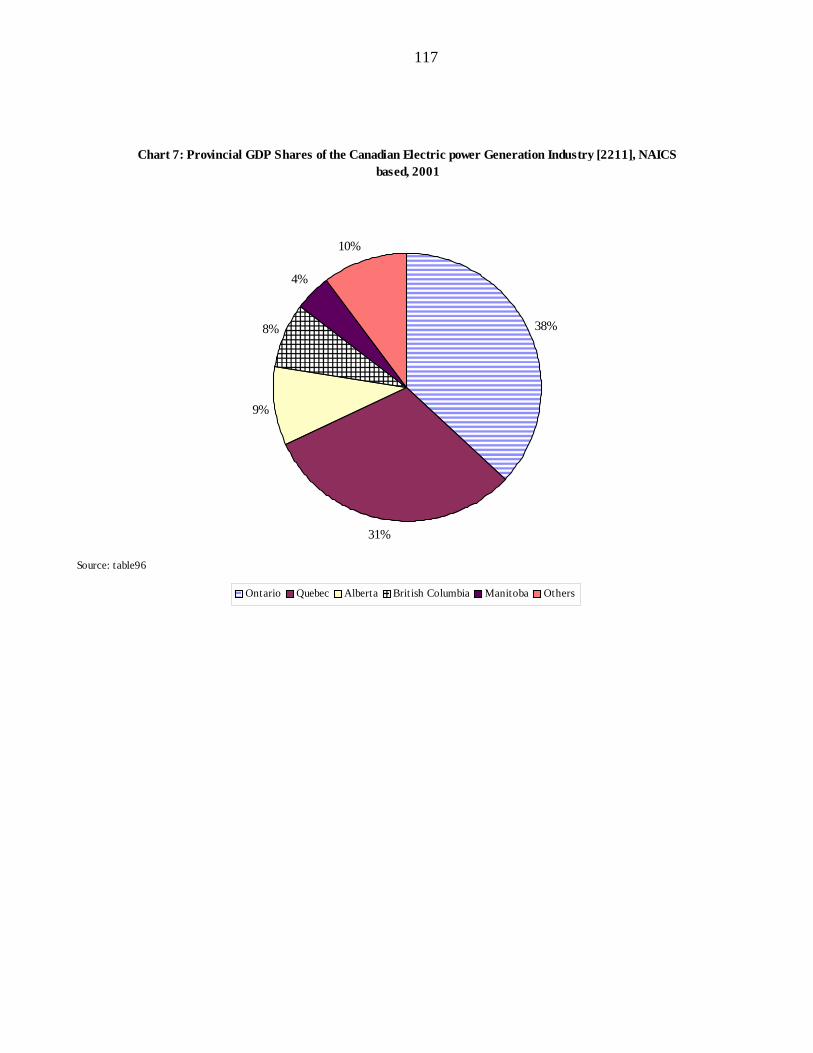
117
������������������������������������������������������������������������������������������������������������������������������������������������������������������������������������������������������������������������������������������������������������������������������������������������������������������������������������������������������������������������������������������������������������������������������������������������������������������������������������������������������������������������������������������������������������������������������������������������������������������������������������������������������������������������������������������������������������������������������������������������������������������������������������������������������������������������������������������������������������������������������������������������
������������������������������������������������������������������������������������������������������������������������������������������������������������������������������������������������������������������������������������������������������������������������������������������������������������������������������
Chart 7: Provincial GDP Shares of the Canadian Electric power Generation Industry [2211], NAICS based, 2001
38%
31%
9%
8%
4%
10%
������ Ontario Quebec Alberta
������ Manitoba Others
Source: table96
British Columbia

118
��������������������������������������������������������������������������������������������������������������������������������������������������������������������������������������������������������������������������������������������������������������������������������������������������������������������������������������������������������������������������������������������������������������������������������������������������������������������������������������������������������������������������������������������������������������������������������������������������������������������������������������������������������������������������������������������������������������������������������������������������������������������������������������������������������������������������������������������������������������������������������������������������������������������������������������������������������������������������������������������������������������������������������������������������������������������������������������������������������
������������������������������������������������������������������������������������������������������������������������������������������������������������������������������������������������������������������������������������������������������������������������������������������������������������������������������������������������������������������������������������������������������������������������������������������������������������������������������������
Chart 8: Provincial GDP Shares of the Canadian Natural GAS Distribution Industry [2212], NAICS based, 2001
48%
18%
16%
11%
4% 3%
���Ontario Alberta British Columbia
���Saskat-chewan Others
Source: Table 97
Quebec
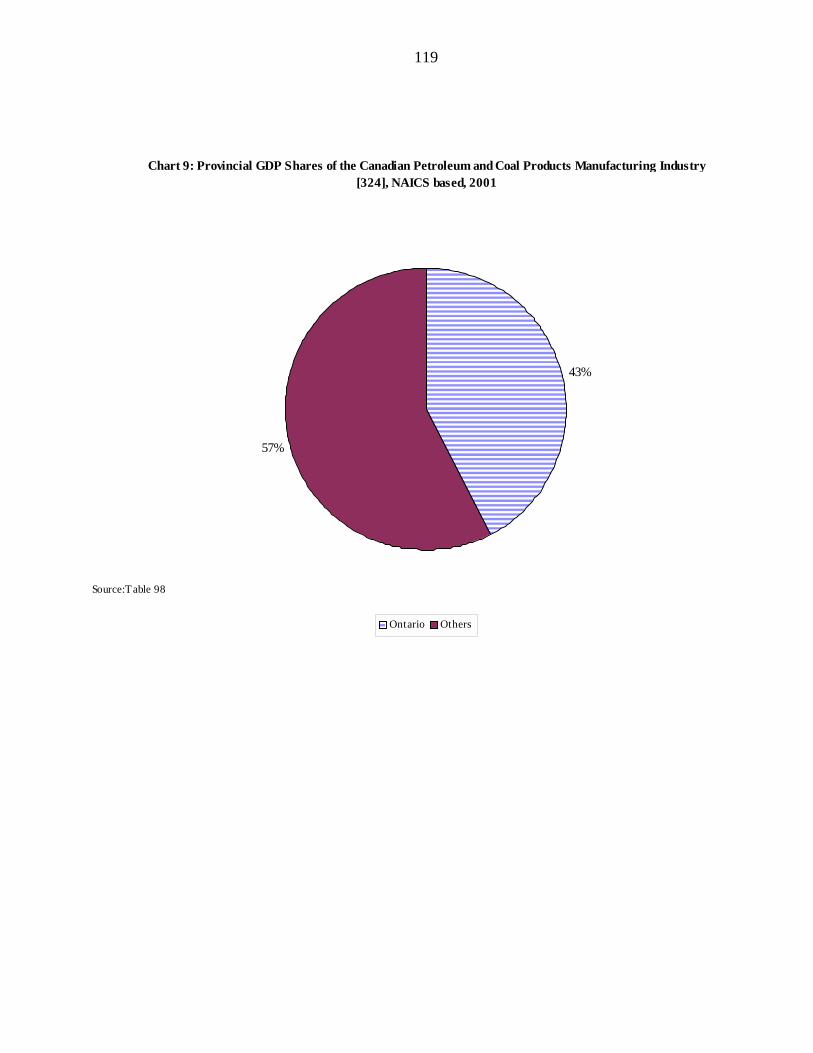
119
��������������������������������������������������������������������������������������������������������������������������������������������������������������������������������������������������������������������������������������������������������������������������������������������������������������������������������������������������������������������������������������������������������������������������������������������������������������������������������������������������������������������������������������������������������������������������������������������������������������������������������������������������������������������������������������������������������������������������������������������������������������������������������������������������������������������������������������������������������������������������������������������������������������������������������������������������������������������������������������������������������������������������������������������������������������������������������������������������������
Chart 9: Provincial GDP Shares of the Canadian Petroleum and Coal Products Manufacturing Industry [324], NAICS based, 2001
43%
57%
������ Ontario Others
Source:Table 98
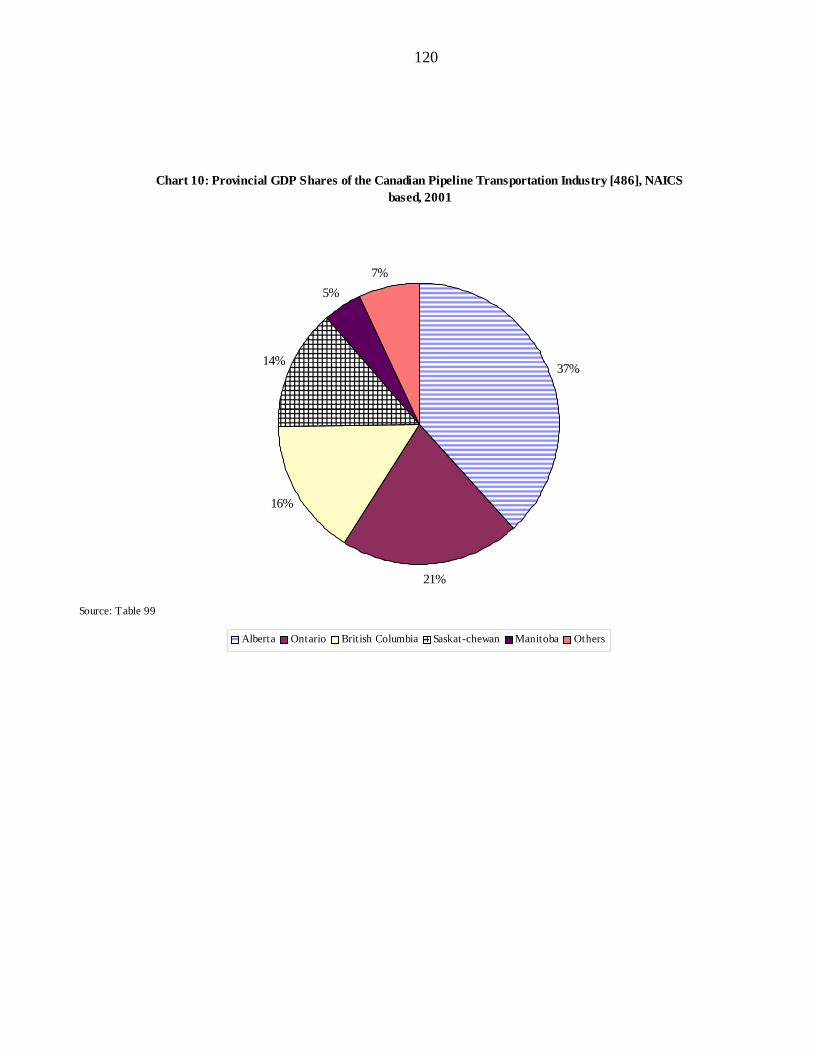
120
����������������������������������������������������������������������������������������������������������������������������������������������������������������������������������������������������������������������������������������������������������������������������������������������������������������������������������������������������������������������������������������������������������������������������������������������������������������������������������������������������������������������������������������������������������������������������������������������������������������������������������������������������������������������������������������������������������������������������������������������������������������������������������������������������������������������������������������������������������������������������������������������������������������������������������������������������������������������������������������
������������������������������������������������������������������������������������������������������������������������������������������������������������������������������������������������������������������������������������������������������������������������������������������������������������������������������������������������������������������������������������������������������������������������������������������������������������������������������������������������������������������������
Chart 10: Provincial GDP Shares of the Canadian Pipeline Transportation Industry [486], NAICS based, 2001
37%
21%
16%
14%
5%7%
�������� Alberta Ontario British Columbia
�������� Manitoba Others
Source: Table 99
Saskat-chewan
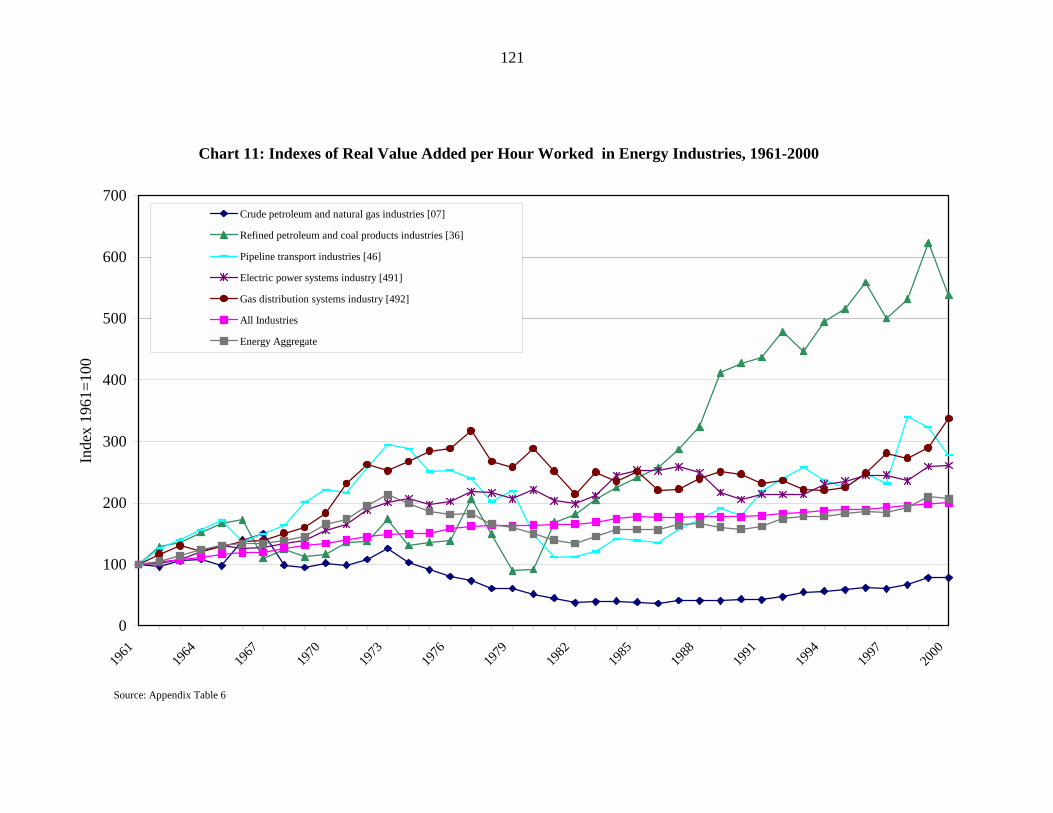
121
Chart 11: Indexes of Real Value Added per Hour Worked in Energy Industries, 1961-2000
0
100
200
300
400
500
600
700
1961
1964
1967
1970
1973
1976
1979
1982
1985
1988
1991
1994
1997
2000
Inde
x 19
61=1
00
Crude petroleum and natural gas industries [07]
Refined petroleum and coal products industries [36]
Pipeline transport industries [46]
Electric power systems industry [491]
Gas distribution systems industry [492]
All Industries
Energy Aggregate
Source: Appendix Table 6
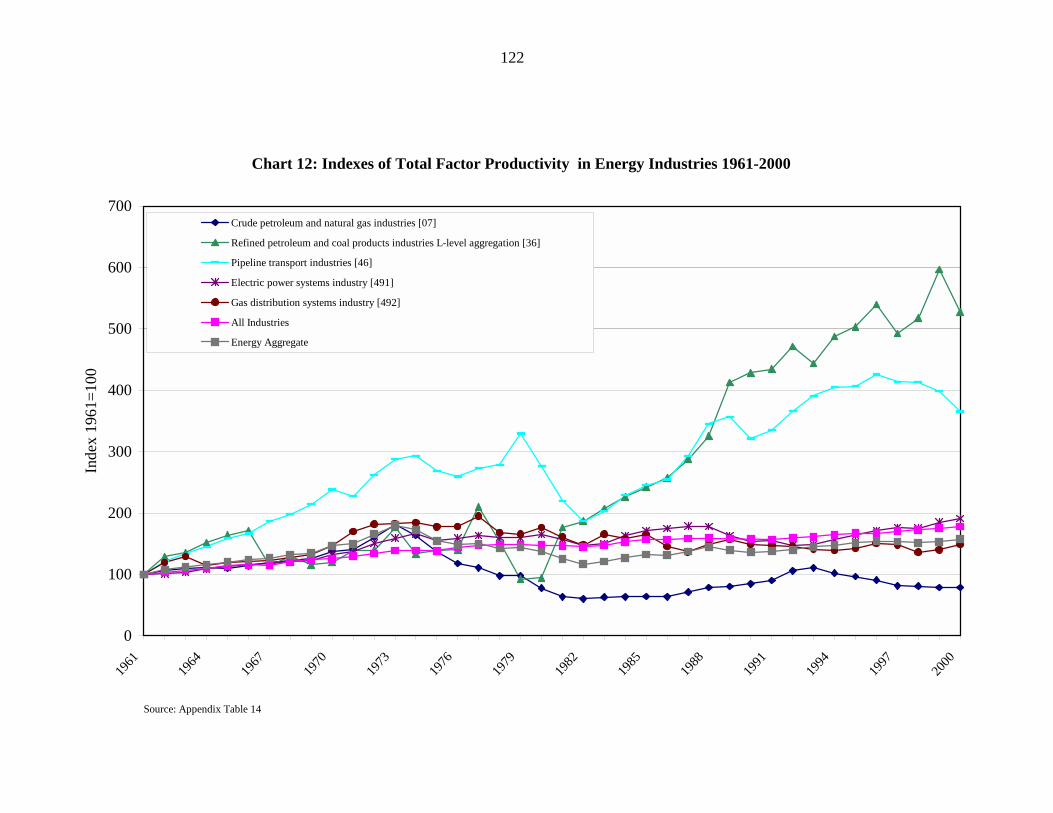
122
Chart 12: Indexes of Total Factor Productivity in Energy Industries 1961-2000
0
100
200
300
400
500
600
700
1961
1964
1967
1970
1973
1976
1979
1982
1985
1988
1991
1994
1997
2000
Inde
x 19
61=1
00
Crude petroleum and natural gas industries [07]
Refined petroleum and coal products industries L-level aggregation [36]
Pipeline transport industries [46]
Electric power systems industry [491]
Gas distribution systems industry [492]
All Industries
Energy Aggregate
Source: Appendix Table 14
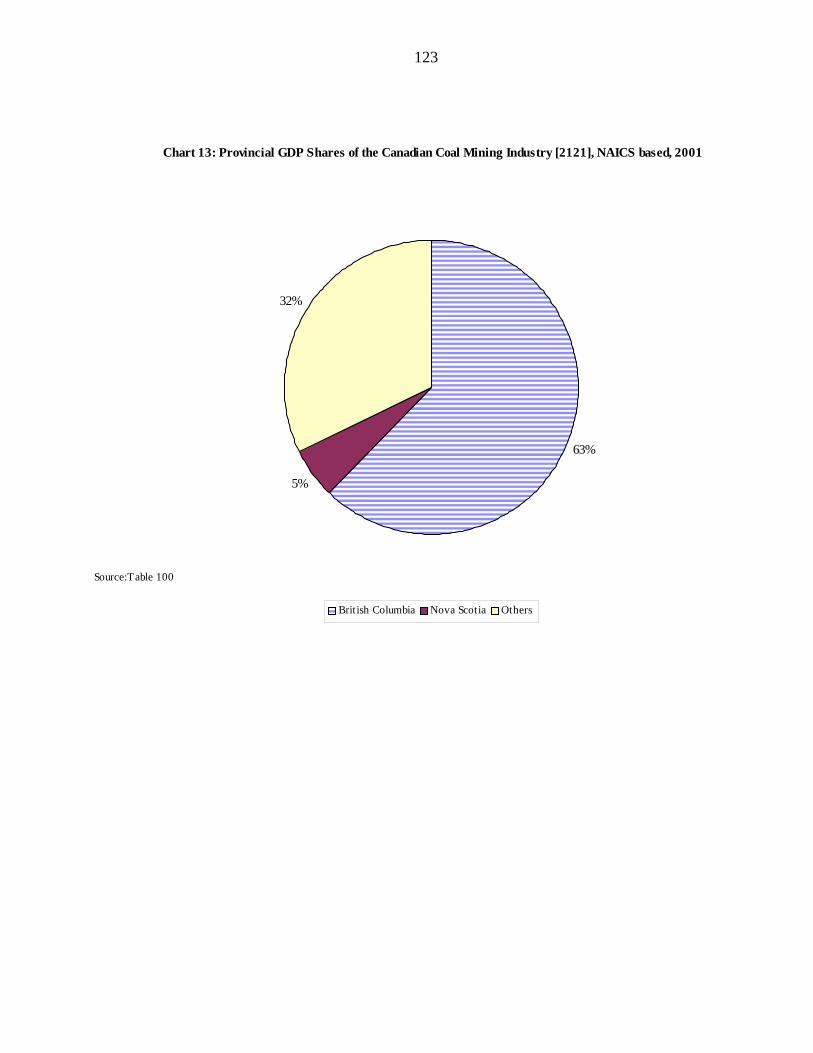
123
������������������������������������������������������������������������������������������������������������������������������������������������������������������������������������������������������������������������������������������������������������������������������������������������������������������������������������������������������������������������������������������������������������������������������������������������������������������������������������������������������������������������������������������������������������������������������������������������������������������������������������������������������������������������������������������������������������������������������������������������������������������������������������������������������������������������������������������������������������������������������������������������������������������������������������������������������������������������������������������������������������������������������������������������������������������������������������������������������������������������������������������������������������������������������������������������������������������������������������������������������������������������������������������������������������������������������������������������������������������������������������������������������������������������������������������������������������������������������������������������������������������������������������������������������������������������������������������������������������������������������������������������������������������������������������������������������������������������������������������������������������������������������������������������������������������������������������������������������������������������������������������������������������������������������������������������������������������������������������������������������������������������������������������������������������������������������������������������������������������������������������������
Chart 13: Provincial GDP Shares of the Canadian Coal Mining Industry [2121], NAICS based, 2001
63%
5%
32%
������ British Columbia Nova Scotia Others
Source:Table 100
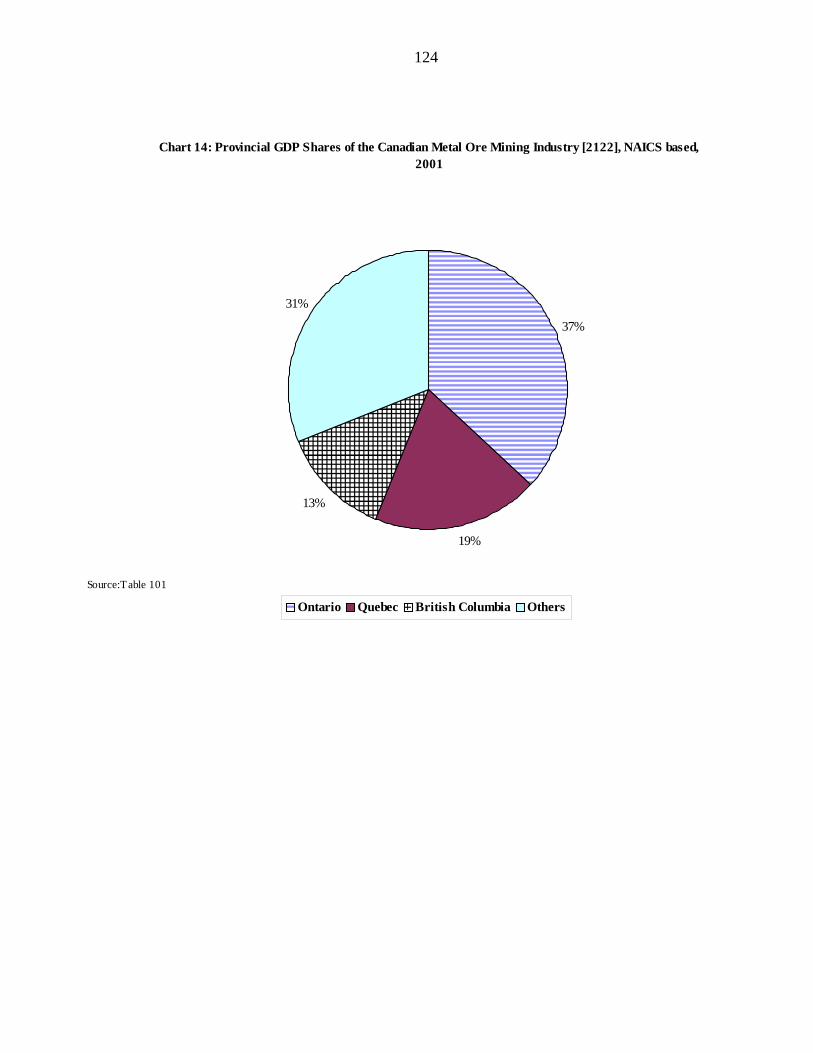
124
��������������������������������������������������������������������������������������������������������������������������������������������������������������������������������������������������������������������������������������������������������������������������������������������������������������������������������������������������������������������������������������������������������������������������������������������������������������������������������������������������������������������������������������������������������������������������������������������������������������������������������������������������������������������������������������������������������������������������������������������������������������������������������������������������������������������������������������������������������������������������������������������������������������������������������
����������������������������������������������������������������������������������������������������������������������������������������������������������������������������������������������������������������������������������������������������������������������������������������������������������������������������������������������������������������������������������������������������������������������������������������������������������������������������������������������������������������������������������������
Chart 14: Provincial GDP Shares of the Canadian Metal Ore Mining Industry [2122], NAICS based, 2001
37%
19%
13%
31%
������ Ontario Quebec
�������� Others
Source:Table 101
British Columbia

125
����������������������������������������������������������������������������������������������������������������������������������������������������������������������������������������������������������������������������������������������������������������������������������������������������������������������������������������������������������������������������������������������������������������������������������������������������������������������������������������������������������������������������������������������������������������������������������������������������������������������������������������������������������������������������������������������������������������������������������������������������������������������������������������������������������������������
Chart 15: Provincial GDP Shares of the Canadian Non-metallic Mining Industry [2123], NAICS based, 2001
25%
13%
5%5%4%
48%
����Ontario Quebec Alberta
����Nova Scotia Others
Source:Table102
New Brunswick
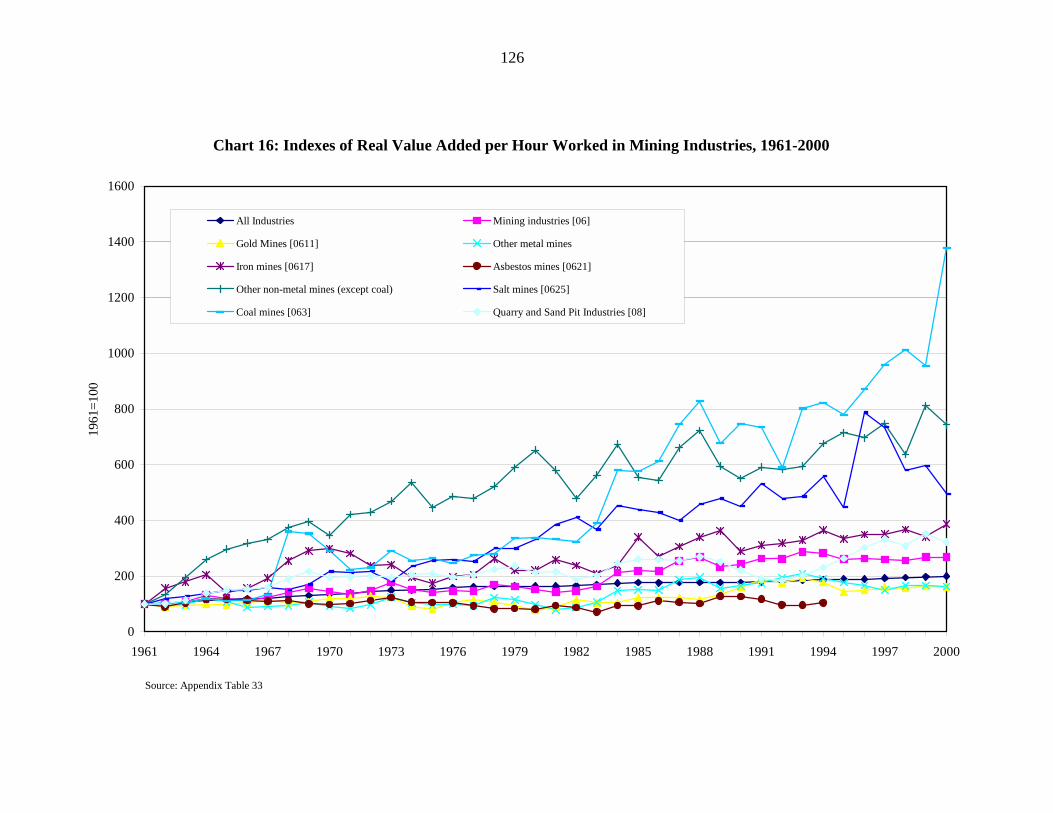
126
Chart 16: Indexes of Real Value Added per Hour Worked in Mining Industries, 1961-2000
0
200
400
600
800
1000
1200
1400
1600
1961 1964 1967 1970 1973 1976 1979 1982 1985 1988 1991 1994 1997 2000
1961
=100
All Industries Mining industries [06]
Gold Mines [0611] Other metal mines
Iron mines [0617] Asbestos mines [0621]
Other non-metal mines (except coal) Salt mines [0625]
Coal mines [063] Quarry and Sand Pit Industries [08]
Source: Appendix Table 33
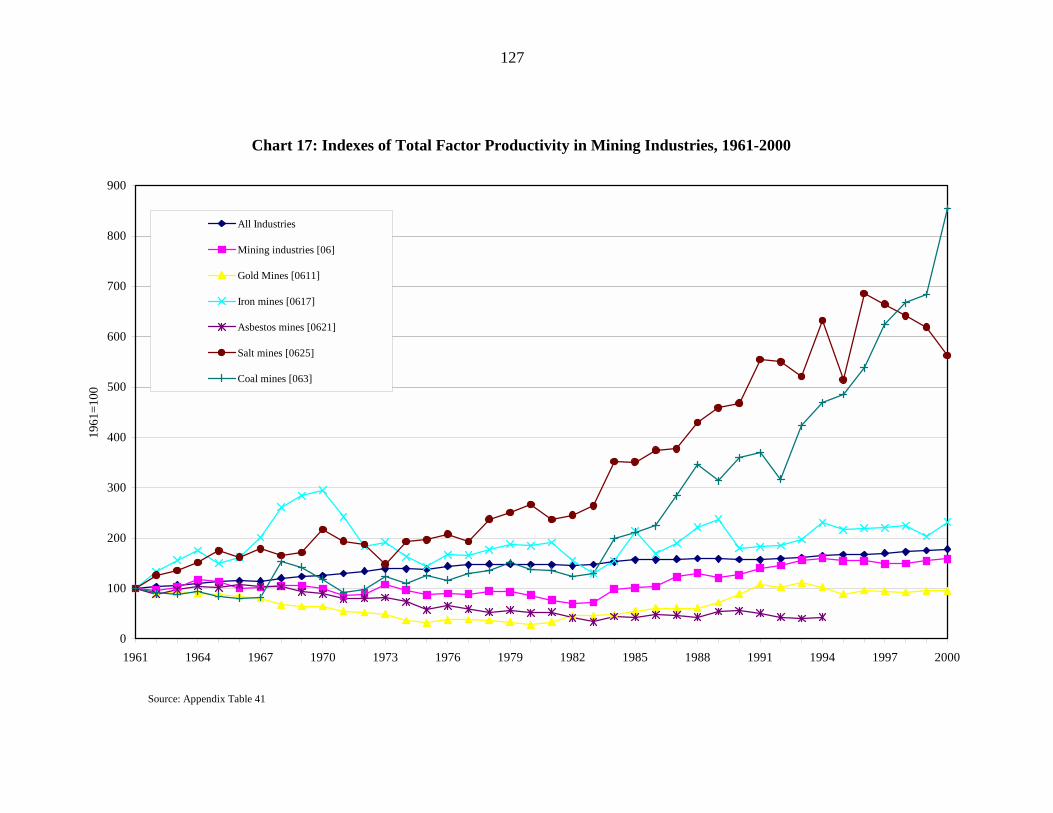
127
Chart 17: Indexes of Total Factor Productivity in Mining Industries, 1961-2000
0
100
200
300
400
500
600
700
800
900
1961 1964 1967 1970 1973 1976 1979 1982 1985 1988 1991 1994 1997 2000
1961
=100
All Industries
Mining industries [06]
Gold Mines [0611]
Iron mines [0617]
Asbestos mines [0621]
Salt mines [0625]
Coal mines [063]
Source: Appendix Table 41
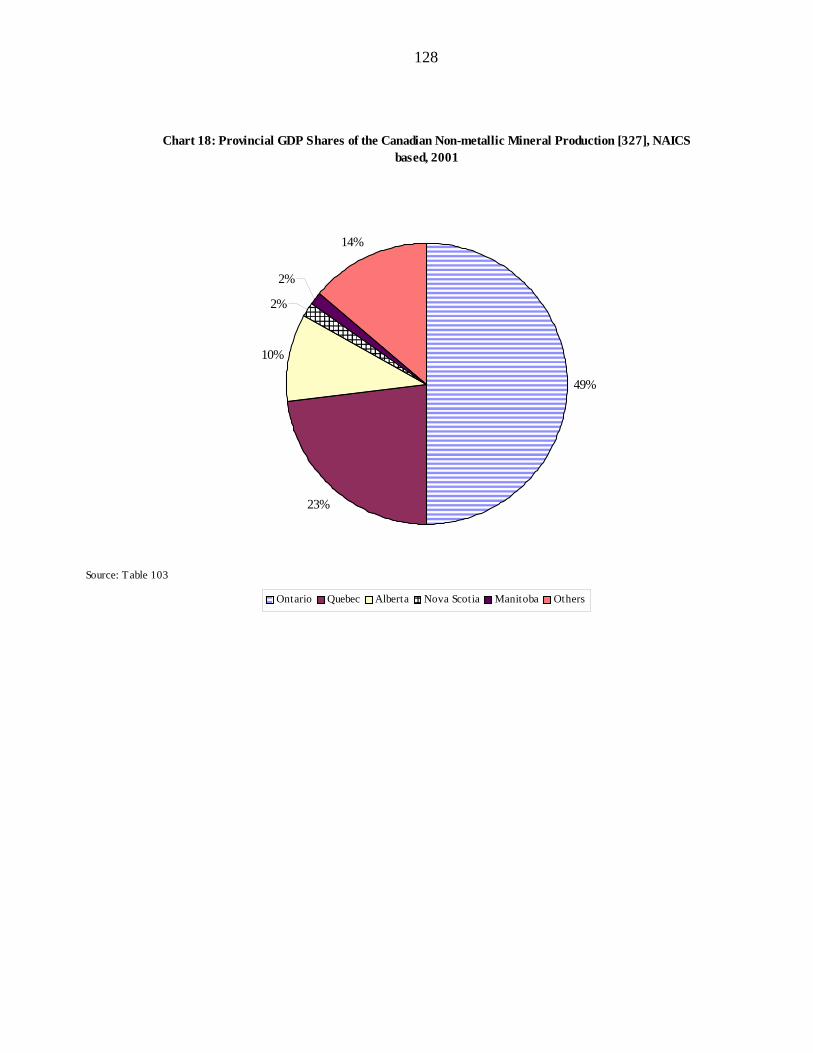
128
��������������������������������������������������������������������������������������������������������������������������������������������������������������������������������������������������������������������������������������������������������������������������������������������������������������������������������������������������������������������������������������������������������������������������������������������������������������������������������������������������������������������������������������������������������������������������������������������������������������������������������������������������������������������������������������������������������������������������������������������������������������������������������������������������������������������������������������������������������������������������������������������������������������������������������������������������������������������������������������������������������������������������������������������������������������������������������������������������������
������������������������������������������������������������������������������������������������������������������������������������������������������������������������������������������������������������������������������������������������������������������������������������������������������������
Chart 18: Provincial GDP Shares of the Canadian Non-metallic Mineral Production [327], NAICS based, 2001
49%
23%
10%
2%
2%
14%
���Ontario Quebec Alberta
���Manitoba Others
Source: Table 103
Nova Scotia
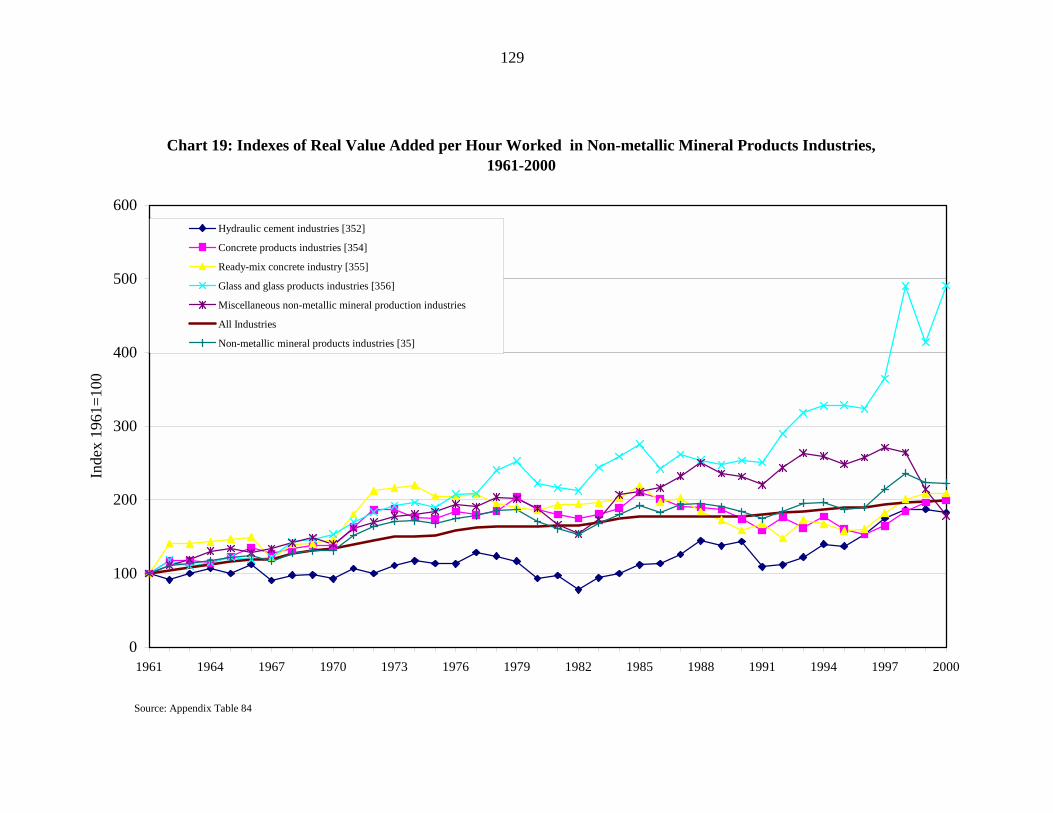
129
Chart 19: Indexes of Real Value Added per Hour Worked in Non-metallic Mineral Products Industries, 1961-2000
0
100
200
300
400
500
600
1961 1964 1967 1970 1973 1976 1979 1982 1985 1988 1991 1994 1997 2000
Inde
x 19
61=1
00
Hydraulic cement industries [352]
Concrete products industries [354]
Ready-mix concrete industry [355]
Glass and glass products industries [356]
Miscellaneous non-metallic mineral production industries
All Industries
Non-metallic mineral products industries [35]
Source: Appendix Table 84
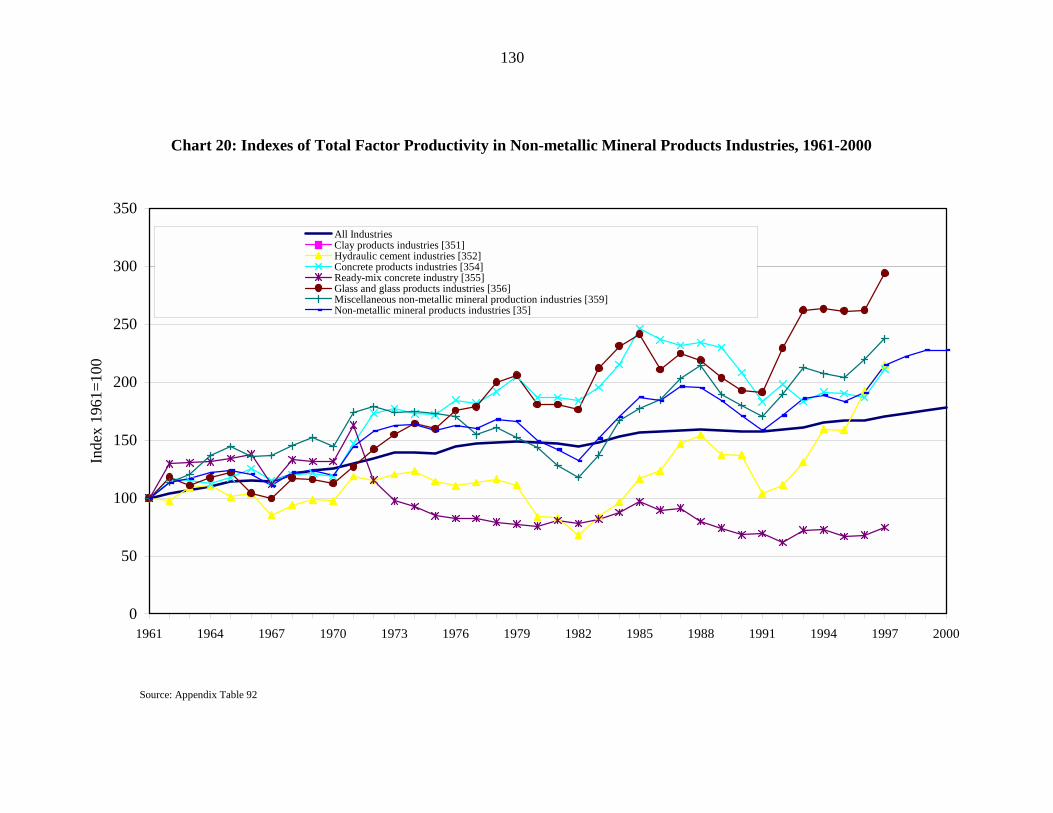
130
Chart 20: Indexes of Total Factor Productivity in Non-metallic Mineral Products Industries, 1961-2000
0
50
100
150
200
250
300
350
1961 1964 1967 1970 1973 1976 1979 1982 1985 1988 1991 1994 1997 2000
Inde
x 19
61=1
00
All IndustriesClay products industries [351]Hydraulic cement industries [352]Concrete products industries [354]Ready-mix concrete industry [355]Glass and glass products industries [356]Miscellaneous non-metallic mineral production industries [359]Non-metallic mineral products industries [35]
Source: Appendix Table 92
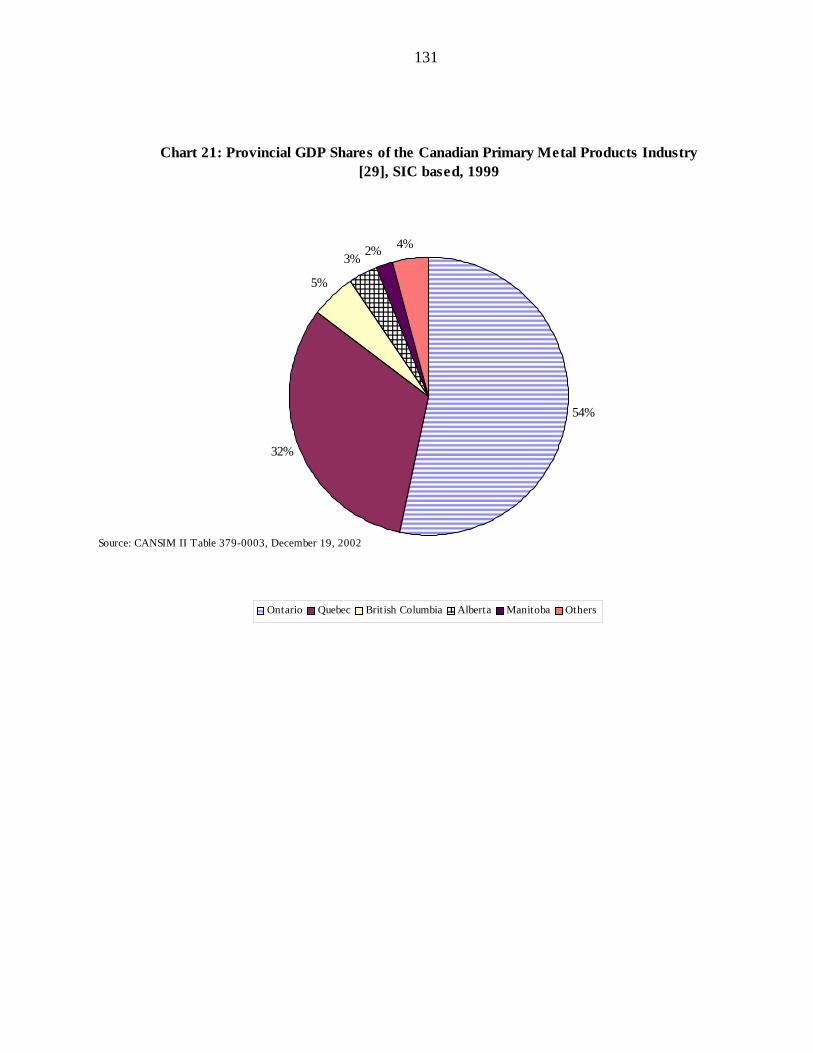
131
�������������������������������������������������������������������������������������������������������������������������������������������������������������������������������������������������������������������������������������������������������������������������������������������������������������������������������������������������������������������������������������������������������������������������������������������������������������������������������������������������������������������������������������������������������������������������������������������������������������������������������������������������������������������������������������������������������������������������������������������������������������������������������������������������������������������������������������������������������������������������������������������������������������������������������������������������������������������������������������������������������������������������������������������������������������������������������������������������������������������������������������������������������������������������������������������������������������������������������������������������������������������������������������������������������������������������
����������������������������������������������������������������������������������������������������������������������������������������������������������������������������������������������������������������������������������������������������������������������������������������������������������������������
Chart 21: Provincial GDP Shares of the Canadian Primary Metal Products Industry [29], SIC based, 1999
54%
32%
5%
3% 2% 4%
������ Ontario Quebec British Columbia
������ Manitoba Others
Source: CANSIM II Table 379-0003, December 19, 2002
Alberta
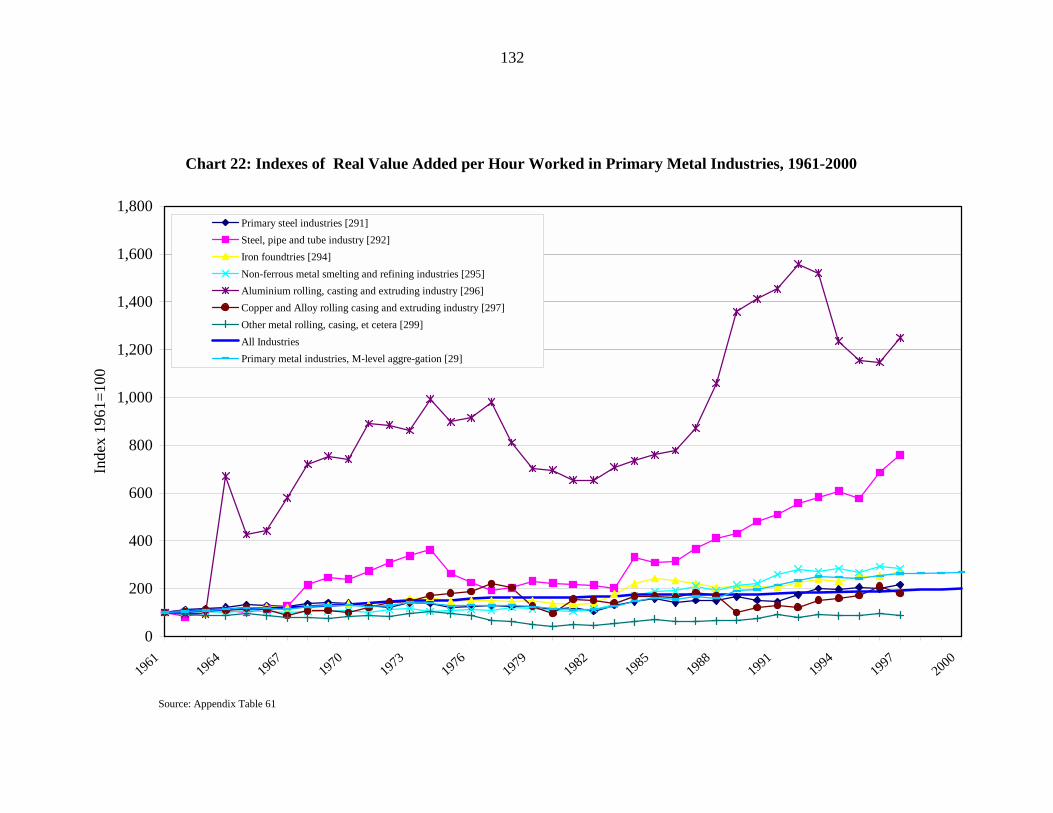
132
Chart 22: Indexes of Real Value Added per Hour Worked in Primary Metal Industries, 1961-2000
0
200
400
600
800
1,000
1,200
1,400
1,600
1,800
1961
1964
1967
1970
1973
1976
1979
1982
1985
1988
1991
1994
1997
2000
Inde
x 19
61=1
00
Primary steel industries [291]Steel, pipe and tube industry [292]Iron foundtries [294]Non-ferrous metal smelting and refining industries [295]Aluminium rolling, casting and extruding industry [296]Copper and Alloy rolling casing and extruding industry [297]Other metal rolling, casing, et cetera [299]All IndustriesPrimary metal industries, M-level aggre-gation [29]
Source: Appendix Table 61
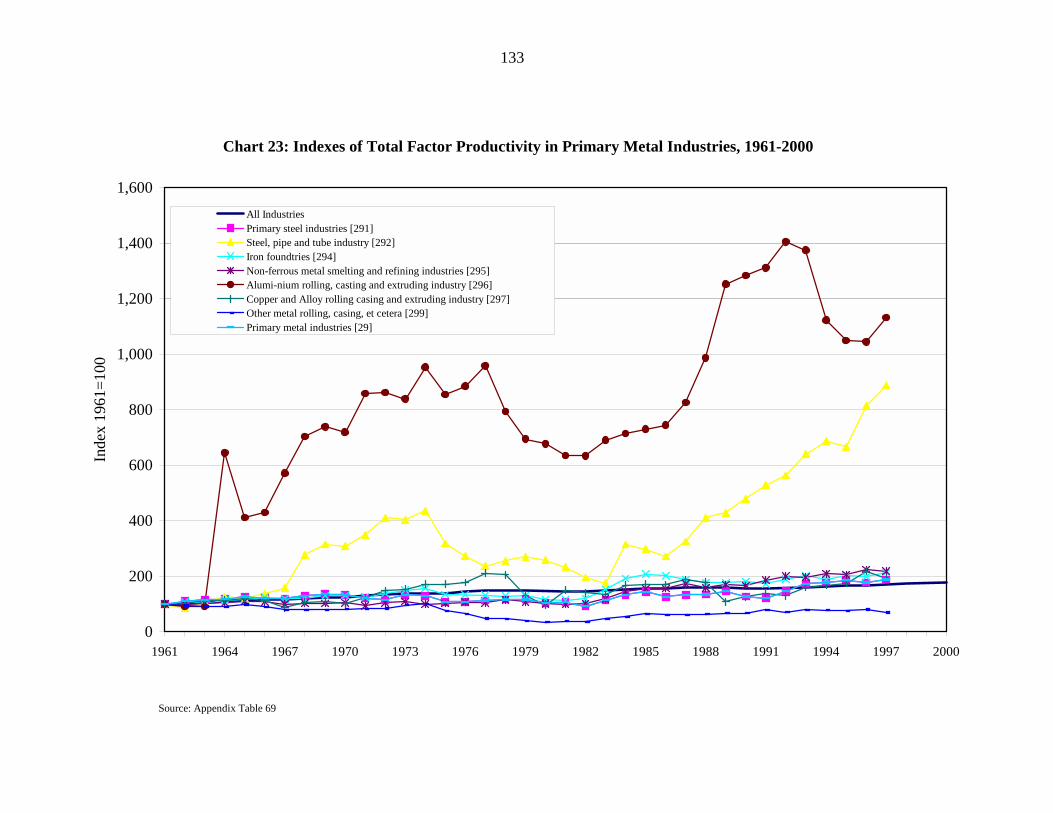
133
Chart 23: Indexes of Total Factor Productivity in Primary Metal Industries, 1961-2000
0
200
400
600
800
1,000
1,200
1,400
1,600
1961 1964 1967 1970 1973 1976 1979 1982 1985 1988 1991 1994 1997 2000
Inde
x 19
61=1
00
All IndustriesPrimary steel industries [291]Steel, pipe and tube industry [292]Iron foundtries [294]Non-ferrous metal smelting and refining industries [295]Alumi-nium rolling, casting and extruding industry [296]Copper and Alloy rolling casing and extruding industry [297]Other metal rolling, casing, et cetera [299]Primary metal industries [29]
Source: Appendix Table 69

134
���������������������������������������������������������������������������������������������������������������������������������������������������������������������������������������������������������������������������������������������������������������������������������������������������������������������������������������������������������������������������������������������������������������������������������������������������������������������������������������������������������������������������������������������������������������������������������������������������������������������������������������������������������������������������������������������������������������������������������������������������������������������������������������������������������������������������������������������������������������������������������������������������������������������������������������������������������������������������������������������������������������������������������������������������������������������������������������������������������������������������������������������������������������������������������������������������������������������������������������������������������������������������������������������������������������������������������������������������������������������������������������������������������������������������������������������������������������������������������������������������������������������������������������������������������������������������������������������������������������������������������������������������������������������������������������������������������������������������������������������������������������������������������������������������������������������������������������������������������������������������������������������������������������������������������������������������������������������������������������������������������������������������������������������������������������������������������������������������������������������������������������������������������������������������������������������������������������������������������������������������������������������������������������������������������������������������������������������������������������������������������������������������������������������������������������������������������������������������������������������������������������
������������������������������������������������������������������������������������������������������������������������������������������������������������������������������������������������������������������������������������������������������������������������������������������������������������������������������������������������������������������������������������������������������������������������������������������������������������������������������������������������������������������������������������������������
Chart 24: Provincial GDP Shares of the Canadian Fabricated Metal Products Industries [30], SIC based, 1999
59%20%
8%
7%
3% 3%
��� Ontario Quebec Alberta ��� Manitoba Others
Source: CANSIM Table 379-0003, December 19, 2002
British Columbia
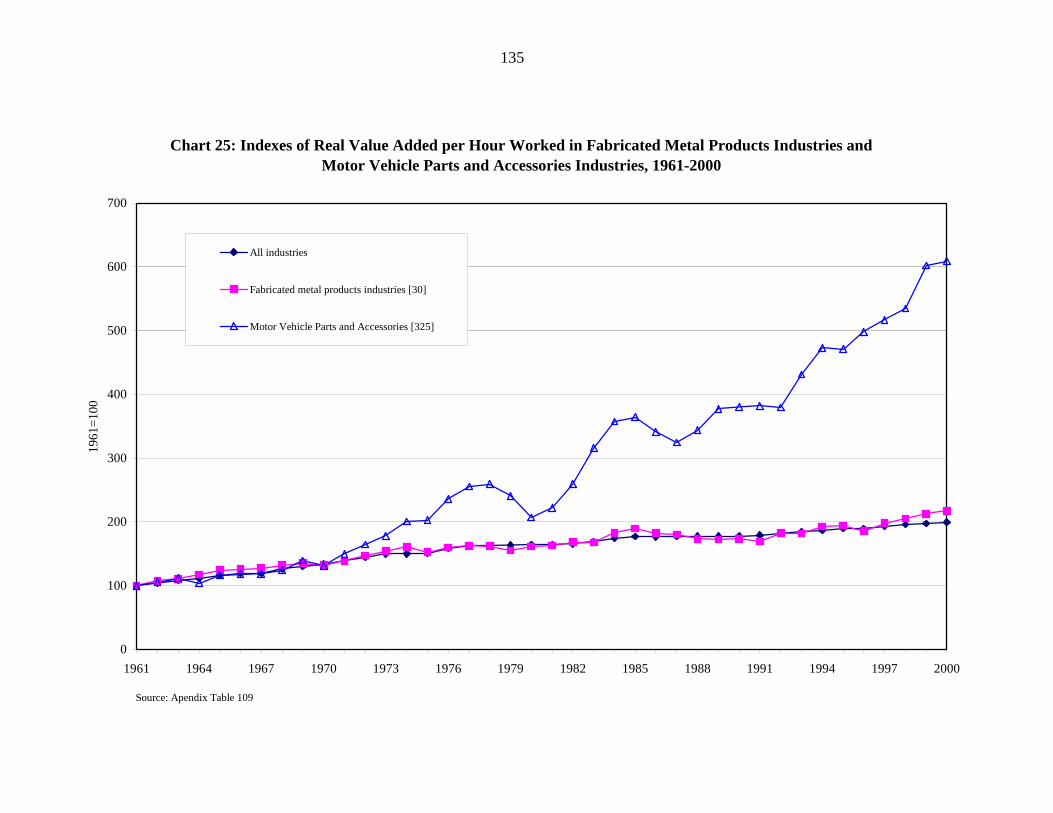
135
Chart 25: Indexes of Real Value Added per Hour Worked in Fabricated Metal Products Industries and Motor Vehicle Parts and Accessories Industries, 1961-2000
0
100
200
300
400
500
600
700
1961 1964 1967 1970 1973 1976 1979 1982 1985 1988 1991 1994 1997 2000
1961
=100
All industries
Fabricated metal products industries [30]
Motor Vehicle Parts and Accessories [325]
Source: Apendix Table 109
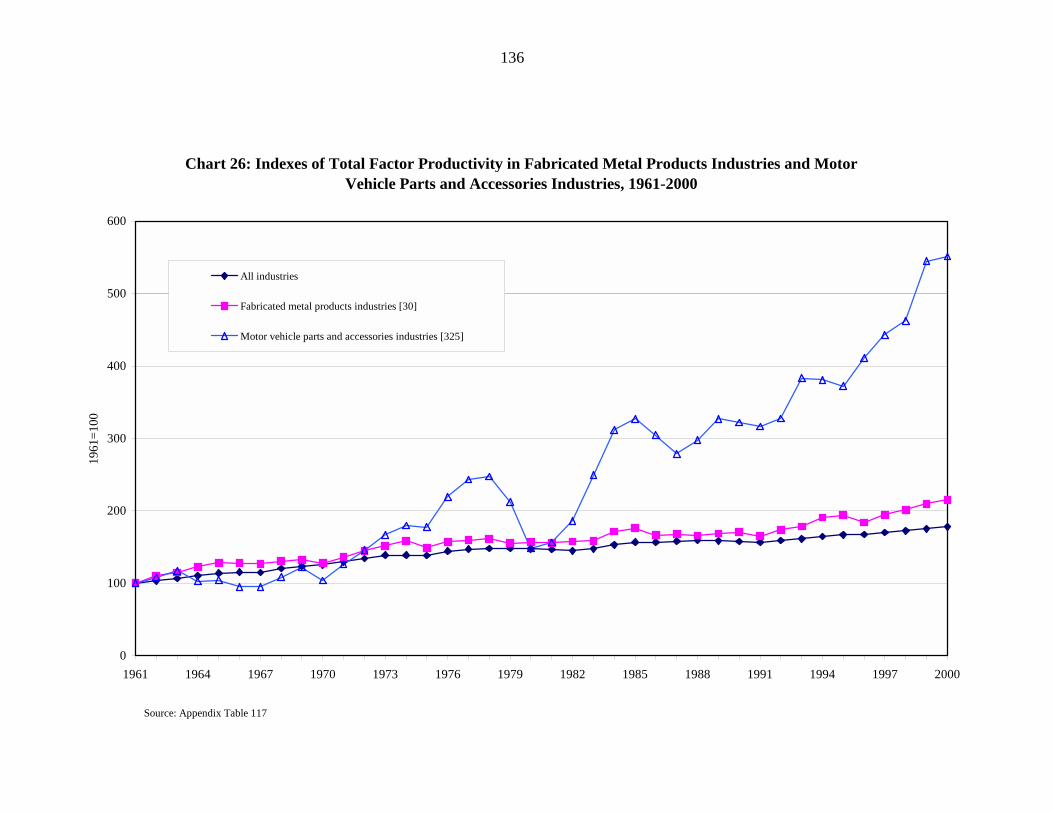
136
Chart 26: Indexes of Total Factor Productivity in Fabricated Metal Products Industries and Motor Vehicle Parts and Accessories Industries, 1961-2000
0
100
200
300
400
500
600
1961 1964 1967 1970 1973 1976 1979 1982 1985 1988 1991 1994 1997 2000
1961
=100
All industries
Fabricated metal products industries [30]
Motor vehicle parts and accessories industries [325]
Source: Appendix Table 117
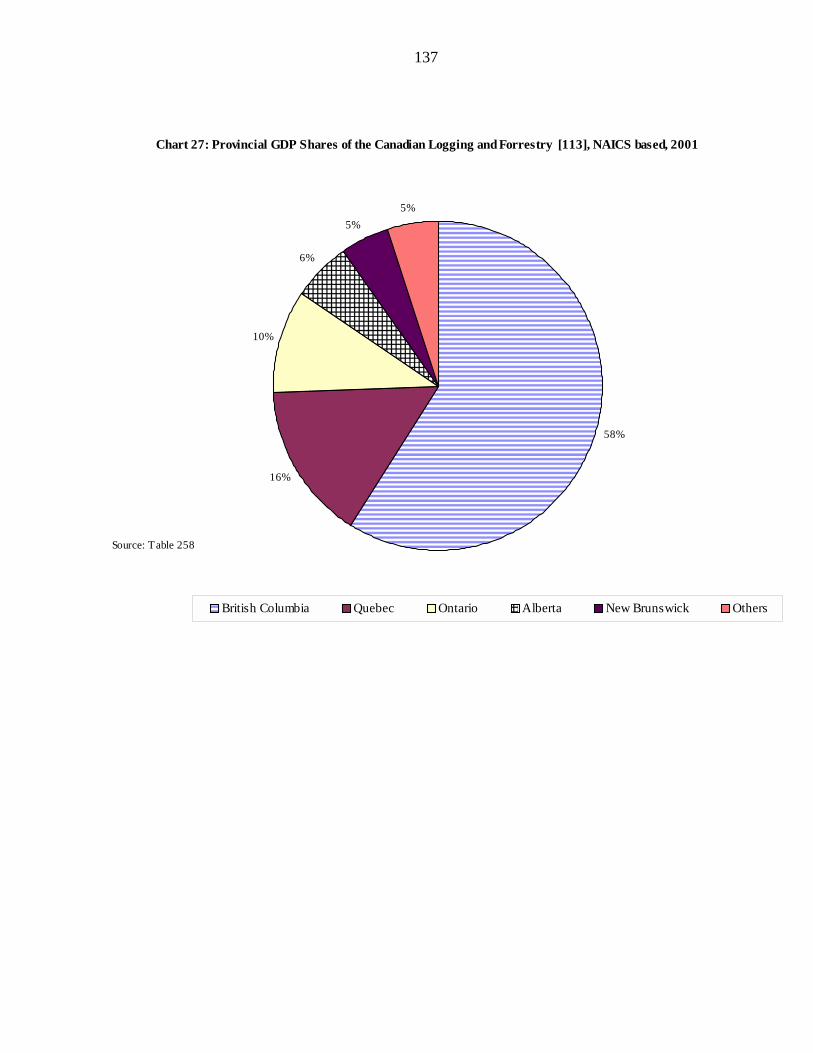
137
��������������������������������������������������������������������������������������������������������������������������������������������������������������������������������������������������������������������������������������������������������������������������������������������������������������������������������������������������������������������������������������������������������������������������������������������������������������������������������������������������������������������������������������������������������������������������������������������������������������������������������������������������������������������������������������������������������������������������������������������������������������������������������������������������������������������������������������������������������������������������������������������������������������������������������������������������������������������������������������������������������������������������������������������������������������������������������������������������������������������������������������������������������������������������������������������������������������������������������������������������������������������������������������������������������������������������������������������������������������������������������������������������������������������������������������������������������������������������������������������������������������������������������������������������������������������������������������������������������������������������������������������������������������������������������������������������������������������������������������������������������������������������������������������������������������������������������������������������������������������������������������������������������������������������������������������������������������������������������������������������������������������������������������������������������������������������������������������������������������������������������������������������������������������������������������������������������������������������������������������������������������������������������������������������������������������������������������������������������������������������������������������
������������������������������������������������������������������������������������������������������������������������������������������������������������������������������������������������������������������������������������������������������������������������������������������������������������������������������������������������������������������������������������������������������������������������������������������������������������������������������������������������������������������������������������������������������������
Chart 27: Provincial GDP Shares of the Canadian Logging and Forrestry [113], NAICS based, 2001
58%
16%
10%
6%
5%5%
�������� British Columbia Quebec Ontario
������ New Brunswick Others
Source: Table 258
Alberta
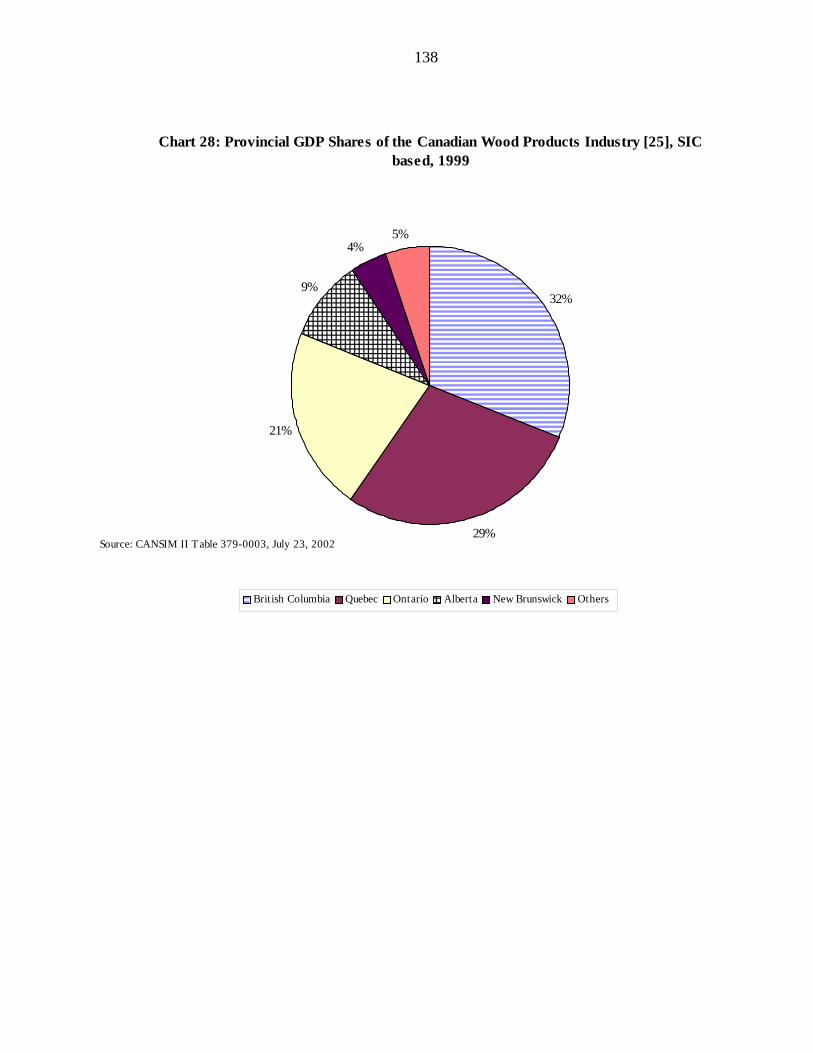
138
��������������������������������������������������������������������������������������������������������������������������������������������������������������������������������������������������������������������������������������������������������������������������������������������������������������������������������������������������������������������������������������������������������������������������������������������������������������������������������������������������������������������������������������������������������������������������������������������������������������������������������������������������������������������������������������������������������������������������������������������������������
������������������������������������������������������������������������������������������������������������������������������������������������������������������������������������������������������������������������������������������������������������������������������������������������������������������������������������������������������������������������������������������������������������������������������������������������������������������������������������
Chart 28: Provincial GDP Shares of the Canadian Wood Products Industry [25], SIC based, 1999
32%
29%
21%
9%
4%5%
���British Columbia Quebec Ontario
����New Brunswick Others
Source: CANSIM II Table 379-0003, July 23, 2002
Alberta
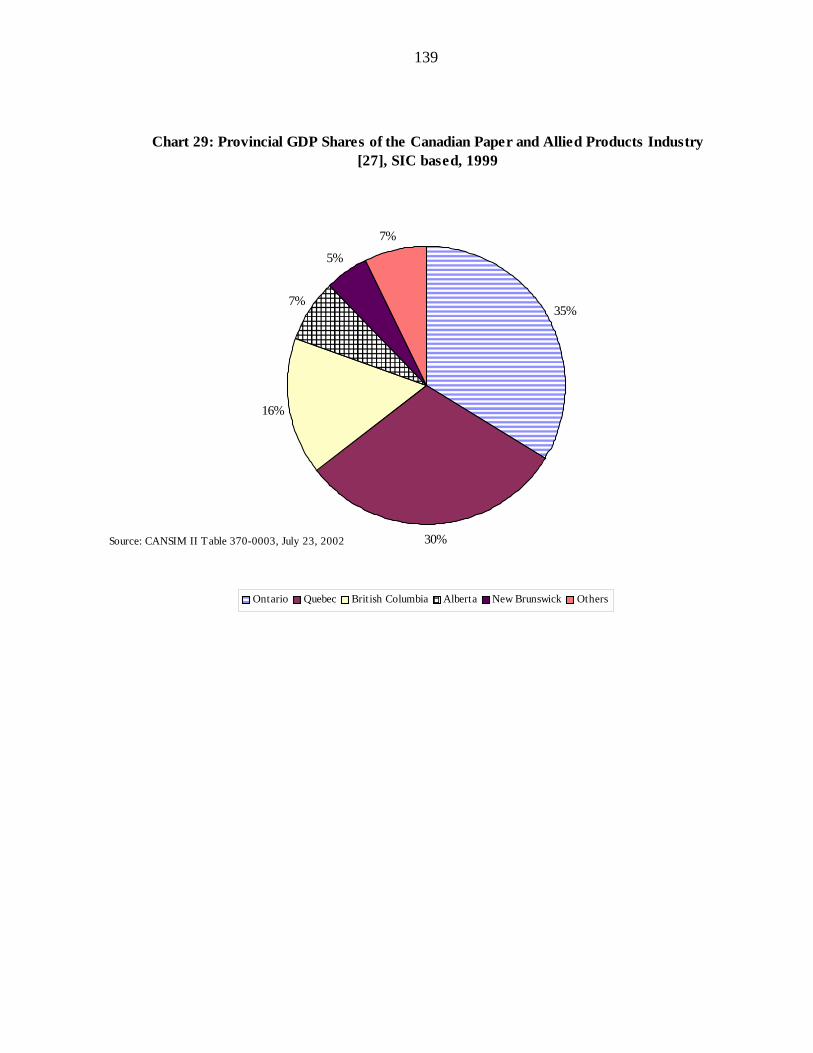
139
������������������������������������������������������������������������������������������������������������������������������������������������������������������������������������������������������������������������������������������������������������������������������������������������������������������������������������������������������������������������������������������������������������������������������������������������������������������������������������������������������������������������������������������������������������������������������������������������������������������������������������������������������������������������������������������������������������������������������������������������������������������������������������������������������������������������������������������������������������������������
��������������������������������������������������������������������������������������������������������������������������������������������������������������������������������������������������������������������������������������������������������������������������������������������������������������������������������������������������������������������������������������������������������������������������������
Chart 29: Provincial GDP Shares of the Canadian Paper and Allied Products Industry [27], SIC based, 1999
35%
30%
16%
7%
5%
7%
���Ontario Quebec British Columbia
����New Brunswick Others
Source: CANSIM II Table 370-0003, July 23, 2002
Alberta
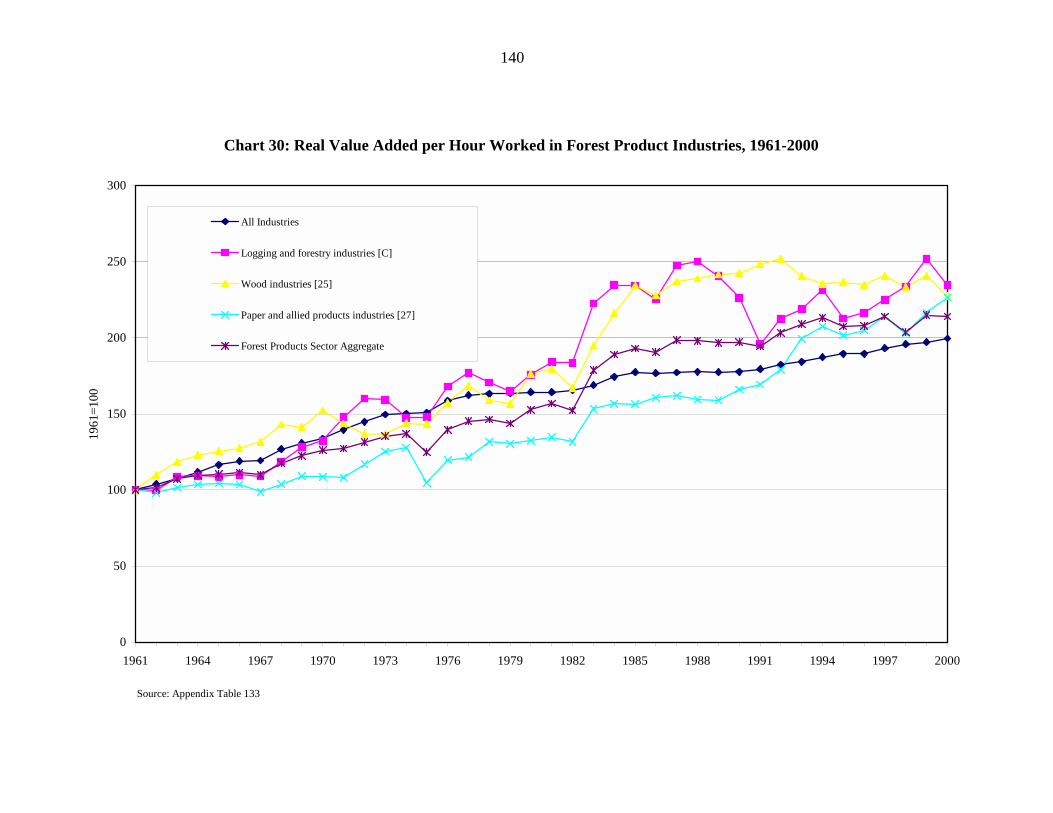
140
Chart 30: Real Value Added per Hour Worked in Forest Product Industries, 1961-2000
0
50
100
150
200
250
300
1961 1964 1967 1970 1973 1976 1979 1982 1985 1988 1991 1994 1997 2000
1961
=100
All Industries
Logging and forestry industries [C]
Wood industries [25]
Paper and allied products industries [27]
Forest Products Sector Aggregate
Source: Appendix Table 133
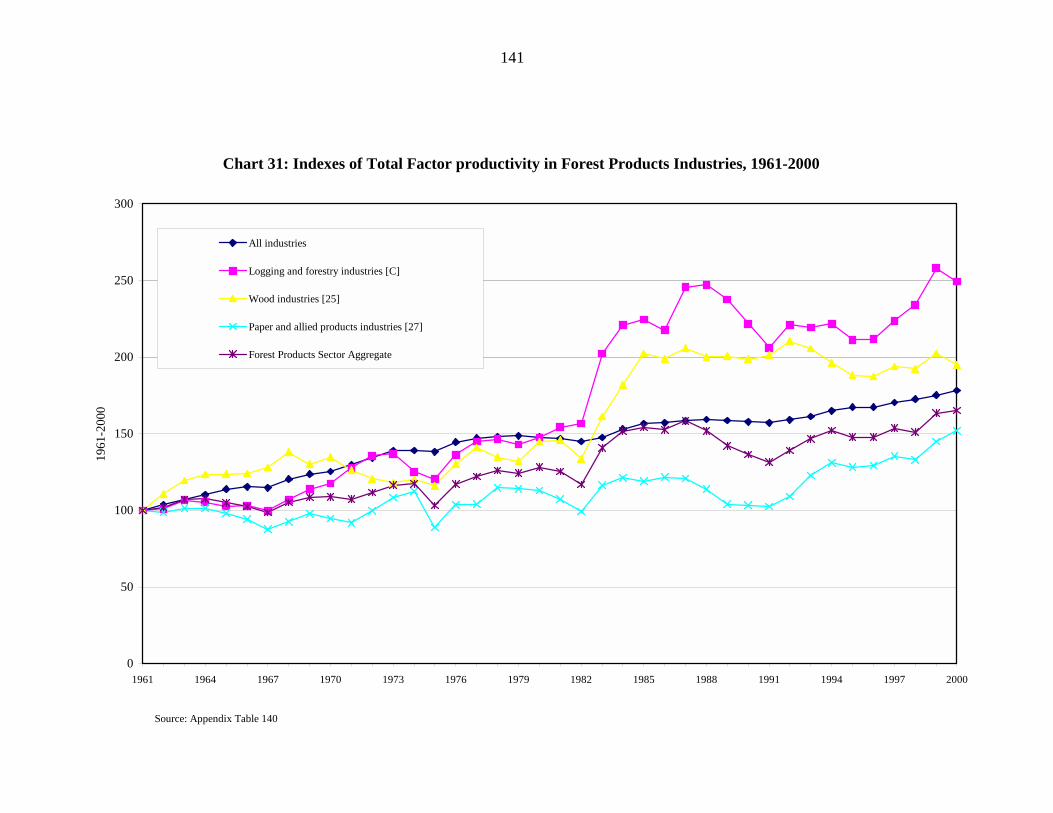
141
Chart 31: Indexes of Total Factor productivity in Forest Products Industries, 1961-2000
0
50
100
150
200
250
300
1961 1964 1967 1970 1973 1976 1979 1982 1985 1988 1991 1994 1997 2000
1961
-200
0
All industries
Logging and forestry industries [C]
Wood industries [25]
Paper and allied products industries [27]
Forest Products Sector Aggregate
Source: Appendix Table 140
142
Productivity Trends in Natural Resources Industries in Canada
List of Appendix Tables
I. National SIC Estimates
Energy Industries
Table 1: Real Value Added, in Millions of 1992 Constant Dollars, By Aggregate Productivity Measures, in Energy Industries Table 2: Gross Domestic Product (GDP) at Factor Cost, in 1992 Constant Dollars, By SIC 1980 National Accounts Benchmark Values, by Industry, Annual (in Millions of Dollars) in Primary Metal, Table 3: Total Number of Jobs in Energy Industries Table 4: Annual Average Number of Hours Worked for All Jobs, in Thousands, in Energy Industries Table 5: Total Labour Compensation for All Jobs, in Thousands of Current Dollars, in Energy Industries Table 6: Real Value Added, in 1992 Constant Dollars, per Hour Worked in Energy Industries Table 7: Real Value Added, in 1992 Constant Dollars, per Worker in Energy Industries Table 8: Nominal Hourly Labour Compensation, in Current Dollars, in Energy Industries Table 9: Real Hourly Labour Compensation, in 1992 Constant Dollars, in Energy Industries Table 10: Capital Stock, in Millions of 1992 Constant Dollars, in Energy Industries Table 11: Capital Stock, in 1992 Constant Dollars, per Hour Worked in Energy Industries Table 12: Capital Stock per Worker, in 1992 Constant Dollars, in Energy Industries in Energy Industries Table 13: Value Added, in 1992 Constant Dollars, per $1,000 of Capital Stock in Energy Industries Table 14: Total Factor productivity Indexes using Hours in Energy industries Table 15: Indexes of Labour Productivity, Total Factor Productivity, and Their Relative Levels in Petroleum Refining Industries, Canada to the United States, US=100, 1961-1999 Table 16: Capacity Utilization in Energy Industries Table 17: Unionized Workers as a Proportion of Employees in the Energy Sector, According to CALURA Canada, 1976-1995 Table 18: Employment by Educational Attainment in Aggregate Energy Industries, SIC and NAICS Based, Canada, 1976-2001 Table 19: Employment by Educational Attainment in Oil and Gas Extraction Industries, SIC and NAICS Based, Canada, 1976-2001 Table 20: Employment by Educational Attainment in Electric Power Generation, Transmission and Distribution Industries, SIC and NAICS Based, Canada, 1976-2001 Table 21: Employment by Educational Attainment in Natural Gas Distribution Industries, SIC and NAICS Based, Canada, 1976-2001 Table 22: Employment by Educational Attainment in Petroleum and Coal Products Manufacturing Industries, SIC and NAICS Based, Canada, 1976-2001 Table 23: Employment by Educational Attainment in Pipline Transportation Industries, SIC and NAICS Based, Canada, 1976-2001 Table 24: Incidence of Injuries and Fatalities in Energy Industries, SIC based, Canada 1984-1998 Table 25: Selected Principal Statistics of Refined Petroleum and Coal Products [36], Canada, 1970-1999 Table 26: Gross Domestic Product (GDP) at Factor Cost, in Current Prices, Total Economy, System of National Accounts Benchmark Values, by Industry, Annual, in Millions of Dollars, in Energy Industries Table 27: GDP Deflator in Energy Industries
143
Mining Industries
Table 28: Real Value Added, in Millions of 1992 Constant Dollars, By Aggregate Productivity Measures, in Mining Industries Table 29: Gross Domestic Product (GDP) at Factor Cost, in Millions of 1992 Constant Dollars, By SIC 1980 National Accounts Benchmark Values, by Industry, Annual, in Mining Industries Table 30: Total Number of Jobs in Mining Industries Table 31: Average Annual Number of Hours Worked for All Jobs, in Thousands, in Mining Industries Table 32: Total Labour Compensation for All Jobs, in Thousands of Current Dollars, in Mining Industries Table 33: Real Value Added, in Millions of 1992 Constant Dollars, per Hour Worked for All Jobs in Mining Industries Table 34: Real Value Added, in 1992 Constant Dollars, Per Worker in Mining Industries Table 35: Nominal Hourly Labour Compensation, in Current Dollars, in Mining Industries Table 36: Real Hourly Labour Compensation, in 1992 Constant Dollars, in Mining Industries Table 37: Capital Stock, in Millions of 1992 constant dollars, in Mining Industries Table 38: Capital Stock per Hour Worked in Mining Industries Table 39: Capital Stock per Worker, in Millions of 1992 Constant Dollars, in Mining Industries Table 40: Value Added, 1992 Constant Dollars, per $1,000 of Capital Stock in Mining Industries Table 41: Total Factor productivity Indexes using Hours in Mining industries Table 42: Compositional effect in Mining Industries Table 43: Capacity Utilization in Mining Industries Table 44: Unionized Workers as a Proportion of Employees in the Mining Sector, According to CALURA Canada, 1976-1995 Table 45: Employment by Educational Attainment in Aggregate Mining Industries, SIC and NAICS Based, Canada, 1976-2001 Table 46: Employment by Educational Attainment in Support Activities for Mining Industries, SIC and NAICS Based, Canada, 1976-2001 Table 47: Employment by Educational Attainment in Coal Mining Industries , SIC and NAICS Based, Canada, 1976-2001 Table 48: Employment by Educational Attainment in Metal Ore Mining Industries, SIC and NAICS Based, Canada, 1976-2001 Table 49: Employment by Educational Attainment in the Non-metallic Mineral Mining and Quarrying Industries Table 50: Incidence of Injuries and Fatalities in Mining Industries, SIC based, Canada 1984-1998 Table 51: Gross Domestic Product (GDP) at Factor Cost, in Current Prices, Total Economy, System of National Accounts Benchmark Values, by Industry, Annual (in Millions of Dollars) in Mining Industries Table 52: GDP Deflator in Mining Industries Table 53: Gross Value Addes in Mining in Selected OECD Countries Table 54:Employment (in thousands of workers) in Mining in Selected OECD Countries, 1947-1998 Table 55:Value Added per Worker in Selected OECD Countries, 1947-1998
Primary Metal Industries
Table 56: Real Value Added, in Millions of 1992 Constant Dollars, By Aggregate Productivity Measures, in Primary Metal Industries Table 57: Gross Domestic Product (GDP) at Factor Cost, in 1992 Constant Dollars, By SIC 1980 National Accounts Benchmark Values, by Industry, Annual, in Millions of Dollars, in Primary Metal Industries Industries Table 58: Total Number of Jobs in Primary Metal Industries Table 59: Average Annual Hours Worked for All Jobs, in Thousands, in Primary Metal Industries Table 60: Total Labour Compensation for All Jobs, in Thousands of Current Dollars, in Primary Metal Industries Table 61: Real Value Added, in 1992 Constant Dollars, per Hour Worked in Primary Metal Industries Table 62: Real Value Added, in 1992 Constant Dollars, per Worker in Primary Metal Industries Table 63: Nominal Hourly Labour Compensation, in Current Dollars, in Primary Metal Industries Table 64: Real Hourly LabourCompensation, in 1992 Constant Dollars, in Primary Metal Industries Table 65: Capital Stock in Millions of 1992 Constant Dollars in Primary Metal Industries
144
Table 66: Capital Stock per Hour Worked in Primary Metal Industries Table 67: Capital Stock per Worker in Thousands of 1992 Constant Dollars in Primary Metal Industries Table 68: Value Added, in1992 Constant Dollars, per $1,000 of Capital Stock in Primary Metal Industries Table 69: Total Factor Productivity Indexes, using Hours, in Primary Metal industries Table 70: Indexes of Labour Productivity, Total Factor Productivity, and Their Relative Levels in Primary Metal Industries, Canada to the United States, US=100, 1961-1999 Table 71: Compositional effect in Primary Metal Industries Table 72: Capacity Utilization in Primary Metal Industries Table 73: Unionized Workers as a Proportion of Employees in Primary Metal Industries, according to CALURA, 1976-1995 Table 74: Employment by Educational Attainment in Primary Metals Industries, SIC and NAICS Based, Canada, 1976-2001 Table 75: Incidence of Injuries and Fatalities in Primary Metal Industries, SIC based, Canada, 1983-1997 Table 76: Selected Principal Statistics of Primary Metal Industries [29], Canada, 1970-1999 Table 77: Gross Domestic Product (GDP) at Factor Cost, in Current Prices, Total Economy, System of National Accounts Benchmark Values, by Industry, Annual, in Millions of Dollars, in Primary Metal Industries Table 78: GDP Deflator in Primary Metals Industries
Non-Metallic Mineral Products Industries
Table 79: Real Value Added, in Millions of 1992 Constant Dollars, By Aggregate Productivity Measures in Non-metallic Mineral Products Industries Table 80: Gross Domestic Product (GDP) at Factor Cost, in 1992 Constant Dollars, By SIC 1980 National Accounts Benchmark Values, by Industry, Annual, in Millions of Dollars, in Non-metallic Mineral Products Industries Table 81: Total Number of Jobs in Non-Metallic Mineral Products Industries Table 82: Hours Worked for All Jobs ( in Thousands) in Non-metallic Mineral Products Industries Table 83: Total Labour Compensation for All Jobs, in Thousands of Current Dollars, in Non-metallic Mineral Products Industries Table 84: Real Value Added, in Millions of 1992 Constant Dollars, per Hours Worked in Non-metallic Mineral Products Industries Table 85: Real Value Added, in Millions of 1992 Constant Dollars, per Worker in Non-metallic Mineral Products Industries Table 86: Nominal Hourly Labour Compensation, in Current Dollar, in Non-metallic Mineral Products Industries Table 87: Real Hourly Labour Compensation, in 1992 Constant Dollars, in Non-metallic Mineral Products Industries Table 88: Capital Stock, in Millions of 1992 Constant Dollars, in Non-metallic Mineral Products Industries Table 89: Capital Stock per Hour in Non-metallic Mineral Products Industries Table 90: Capital Stock per Worker, in Thousands of 1992 Constant Dollars, in Non-metallic Mineral Products Industries Table 91: Value Added, 1992 Constant Dollars, per $1,000 of Capital Stock in Non-metallic Mineral Products Industries Table 92: Total Factor productivity Indexes using Hours in Non-metallic Mineral Products Industries Table 93: Indexes of Labour Productivity, Total Factor Productivity, and Their Relative Levels in Stone, Glass and Clay Industries, Canada to the United States, US=100, 1961-1999 Table 94: Compositional Effect in Non-metallic Mineral Products Industries Table 95: Capacity Utilization in Non-metallic Mineral Products Industries Table 96: Unionized Workers as a Proportion of Employees in Non Metallic Mineral Products Industries, according to CALURA, 1976-1995 Table 97: Employment by Educational Attainment in Non-Metallic Mineral Products Industries, SIC and NAICS Based, Canada, 1976-2001 Table 98: Incidence of Injuries and Fatalities in Non-metallic Mineral Products Industries, SIC based, Canada 1984-1998 Table 99: Selected Principal Statistics of Non-Metallic Mineral Products Industries [35], Canada, 1970-1999
145
Table 100: Gross Domestic Product (GDP) at Factor Cost, in Current Prices, Total Economy, System of National Accounts Benchmark Values, by Industry, Annual, in Millions of Dollars, in Non-metallic Mineral Products Industries Table 101: GDP Deflator in Non-metallic Mineral Industries
Fabricated Metal Industries and Motor Vehicle Parts and Accessories Industries
Table 102: Statistics of Fabricated Metal Products Industries [30] Table 103: Statistics of Motor Vehicle Parts and Accessories [325] Table 104: Real Value Added, in Millions of 1992 Constant Dollars, By Aggregate Productivity Measures, in Fabricated Metal Products Industries and Motor Vehicle Parts and Accessories Table 105: Gross Domestic Product (GDP) at Factor Cost, in 1992 Constant Dollars, By SIC 1980 National Accounts Benchmark Values, by Industry, Annual (in Millions of Dollars) in Fabricated Metal Products Industries and Motor Vehicle Parts and Accessories Industries Table 106: Total Number of Jobs in Fabricated Metal Products Industries and Motor Vehicle Parts and Accessories Industries Table 107: Annual Number of Hours Worked for All Jobs, in Thousands, in Fabricated Metal Products Industries and Motor Vehicle Parts and Accessories Industries Table 108: Total Labour Compensation for All Jobs , in Thousands of Current Dollars, in Fabricated Metal Products Industries and Motor Vehicle Parts and Accessories Industries Table 109: Real Value Added, in 1992 Constant Dollars, per Hour Worked for All Jobs in Fabricated Metal Products Industries and Motor Vehicle Parts and Accessories Industries Table 110: Real Value Added, in 1992 Constant Dollars, per Worker in Fabricated Metal Products Industries and Motor Vehicle Parts and Accessories Industries Table 111: Nominal Hourly Labour Compensation, in Current Dollars, in Fabricated Metal Products Industries and Motor Vehicle Parts and Accessories Industries Table 112: Real Hourly Labour Compensation, in 1992 Constant Dollars, in Fabricated Metal Products Industries and Motor Vehicle Parts and Accessories Industries Table 113: Capital Stock, in Millions of Constant 1992 Dollars, in Fabricated Metal Products Industries and Motor Vehicle Parts and Accessories Industries Table 114: Capital Stock Per Hour in Fabricated Metal Products Industries and Motor Vehicle Parts and Accessories Table 115: Capital Stock per Worker, in 1992 Constant Dollars, in Fabricated Metal Products Industries, and Motor Vehicle Parts and Accessories Industries Table 116: Value Added, in 1992 Constant Dollars, per $1,000 of Capital Stock, in Fabricated Metal Products Industries and Motor Vehicle Parts and Accessories Industries Table 117: Total Factor productivity Indexes using Hours in Fabricated metal Industries, Non-metallic and Motor Vehicle Parts and Accessories Industries Table 118: Indexes of Labour Productivity, Total Factor Productivity, and Their Relative Levels in Fabricated Metal Industries, Canada to the United States, US=100, 1961-1999 Table 119: Capacity Utilization in Fabricated Metal Products Industries Table 120: Unionized Workers as a Proportion of Employees in Metal Fabrication Industries, according to CALURA, 1976-1995 Table 121: Employment by Educational Attainment in Fabricated Metals Industries, SIC and NAICS Based, Canada, 1976-2001 Table 122: Employment by Educational Attainment in Motor Vehicle Parts and Accessories Industries, SIC and NAICS Based, Canada, 1976-2001 Table 123: Incidence of Injuries and Fatalities in Motor Vehicle Parts and Accessories Industries, SIC based, Canada, 1984-1998 Table 124: Selected Principal Statistics of Fabricated Metal Products Industries [30], Canada, 1970-1999 Table 125: Selected Principal Statistics of Motor Vehicle Parts and Accessories [325], Canada, 1970-1999 Table 126: Gross Domestic Product (GDP) at Factor Cost, in Current Prices, in Millions of Dollars, in Fabricated Metal Products Industries and Motor Vehicle Parts and Accessories Industries Table 127: GDP Deflator in Fabricated Metal Products Industries and Motor Vehicle Parts and Accessories Industries
146
Forest Products Sector
Table 128: Real Value Added in Forest Products Industries, SIC-based, according to Aggregate Productivity Measures, Canada, 1961-2000 Table 129: Real GDP in Forest Products Industries, SIC-based, according to National Accounts, Canada, 1961-2000 Table 130: Employment in Forest Products Industries, SIC-based, according to Aggregate Productivity Measures, Canada, 1961-2000 Table 131: Hours Worked in Forest Products Industries, SIC-based, according to Aggregate Productivity Measures, Canada, 1961-2000 Table 132: Total Compensation in Forest Products Industries, SIC-based, according to Aggregate Productivity Measures, Canada, 1961-2000 Table 133: Real Value Added per Hour Worked in Forest Products Industries, SIC-based, according to Aggrgate Productivity Measures, Canada, 1961-2000 Table 134: Real Value Added per Worker in Forest Products Industries, SIC-based, according to Aggregate Productivity Measures, Canada, 1961-2000 Table 135: Compensation per Hour Worked in Forest Products Industries, SIC-based, according to Aggregate Productivity Measures, Canada, 1961-2000 Table 136: Capital Stock in Forest Products Industries, SIC based, Canada, 1961-1999 Table 137: Capital Stock per Hour Worked in Forest Products Industries, SIC based, Canada, 1961-2000 Table 138: Capital Stock per Worker in Forest Products Industries, SIC based, Canada, 1961-2000 Table 139: Value Added per $1,000 of Capital Stock in Forest Products Industries, SIC based, Canada, 1961-2000 Table 140: Total Factor Productivity Indexes for Forest Products Industries, using Hours as the labour input, SIC based, Canada, 1961-2000 Table 141: Indexes of Labour Productivity, Total Factor Productivity, and their Relative Levels in Wood Products Industries, Canada to the United States, US=100, 1975-1999 Table 142: Indexes of Labour Productivity, Total Factor Productivity, and their Relative Levels in Paper Products Industries, Canada to the United States, US=100, 1975-1999 Table 143 Effect of Compositional Shift on Value Added per Hour Worked in the Wood Products Sector, SIC-based, According to Aggregate Productivity Measures, Canada, 1961-1997 Table 144: Effect of Compositional Shift on Value Added per Hour Worked in the Paper Products Sector, SIC-based, according to Aggregate Productivity Measures, Canada, 1961-1997 Table 145: Hour Shares in the Paper Products Sector sub-industries, SIC-based, Canada, 1961-1997 Table 146: Hour Shares in the Wood Products Sector sub-industries, SIC-based, Canada, 1961-1997 Table 147: Capacity utilization rate in the Forest Products Sectors, SIC-based, Canada, 1962-2000 Table 148: Unionized Workers as a Proportion of Employees, according to CALURA, Canada, 1976-1995 Table 149: Employment by Educational Attainment in the Forestry and Logging Sector as a Share of Total Sector Employment, SIC and NAICS based*, Canada, 1976-2001 Table 150: Employment by Educational Attainment in the Wood Products Sector as a Share of Total Sector Employment, SIC and NAICS based*, Canada, 1976-2001 Table 151: Employment by Educational Attainment in the Paper Products Sector as a Share of Total Sector Employment, SIC and NAICS based*, Canada, 1976-2001 Table 152: Incidence of Injuries and Fatalities in the Forest Products Sectors, SIC based, Canada, 1984-1998 Table 153: Selected Principal Statistics in Wood Products Industries [25], Canada, 1970-1999 Table 154: Selected Principal Statistics in Paper Products Industries [27], Canada, 1970-1999 Table 155: Gross domestic Product (GDP) at Factor Cost, in Current Prices, in Millions of Dollars, 1961-1997 Table 156: Implicit Price Indexes for Forest Products Industries, SIC based, 1961-1997

147
II. National NAICS Estimates
Value Added
Table 157: Real GDP in Energy Sector Selected Industries, in Millions of Constant 1997 Dollars, NAICS based, Canada, 1981-2001 Table 158: Real GDP in Mining Sector Selected Industries, in Millions of Constant 1997 Dollars, NAICS based, Canada, 1981-2001 Table 159: Real GDP in Forest Products Industries, NAICS-based, according to National Accounts, Canada, 1981-2001
Employment
Table 160: Employment in Energy Sector Selected Industries, in Thousands of Workers, NAICS based, Canada, 1987-2001 Table 161: Employment in Mining Sector Selected Industries, in Thousands of Workers, NAICS based, Canada, 1987-2001 Table 162: Employment in Forest Products Industries, NAICS-based, according to LFS, Canada, 1987-2001
Hours
Table 163: Total Weekly Hours Worked in Energy Sector Selected Industries, in Thousands of Hours, NAICS based, Canada, 1987-2001 Table 164: Total Weekly Hours Worked in Mining Sector Selected Industries, in Thousands of Hours, NAICS based, Canada, 1987-2001 Table 165: Weekly Hours Worked in Forest Products Industries, NAICS-based, according to LFS, Canada, 1987-2001
Average Weekly Hours
Table 166: Average Weekly Hours Worked in Energy Sector Selected Industries, NAICS based, Canada, 1987-2001 Table 167: Average Weekly Hours Worked in Mining Sector Selected Industries, NAICS based, Canada, 1987-2001 Table 168: Average Weekly Hours Worked in Forest Products Industries, NAICS-based, according to LFS, Canada, 1987-2001
Capital Stock
Table 169: End-Year Net Capital Stocks in Energy Sector Selected Industries, In Millions of Constant 1997 Dollars, NAICS based, Canada, 1981-2001 Table 170: End-Year Net Capital Stocks in Mining Sector Selected Industries, In Millions of Constant 1997 Dollars, NAICS based, Canada, 1981-2001 Table 171: Capital Stock in Forest Products Industries, NAICS-based, according to National Accounts, Canada, 1961-2001
Value Added per Hour
Table 172: Value Added per Hour Worked in Energy Sector Selected Industries, NAICS based,

148
Canada, 1987-2001 Table 173: Value Added per Hour Worked in Mining Sector Selected Industries, NAICS based, Canada, 1987-2001 Table 174: Value Added per Hour Worked in Forest Products Industries, NAICS-based, according to National Accounts and LFS, Canada, 1987-2001
Value Added per Worker
Table 175: Value Added per Worker in Energy Sector Selected Industries, NAICS based, Canada, 1987-2001 Table 176: Value Added per Worker in Mining Sector Selected Industries, NAICS based, Canada, 1987-2001 Table 177: Value Added per Worker in Forest Products Industries, NAICS-based, according to National Accounts and LFS, Canada, 1987-2001
Value Added per $1,000 of Capital Stock
Table 178: Value Added per $1,000 of Capital Stock in Energy Sector Selected Industries, NAICS based, Canada, 1981-2001 Table 179: Value Added per $1,000 of Capital Stock in Mining Sector Selected Industries, NAICS based, Canada, 1981-2001 Table 180: Value Added per 1,000$ of Capital Stock in Forest Products Industries, NAICS-based, according to National Accounts, Canada, 1981-2001
Total Factor Productivity using Hours
Table 181: Total Factor Productivity Indexes Using Hours as the Labour Input for Energy Sector Selected Industries (1997=1.000), NAICS based, Canada, 1987-2001 Table 182: Total Factor Productivity Indexes Using Hours as the Labour Input for Mining Sector Selected Industries (1997=1.000), NAICS based, Canada, 1987-2001 Table 183: Total Factor Productivity Indexes (1997=100) Using Hours as the Labour Input in Forest Products Industries, NAICS-based, according to National Accounts and LFS, Canada, 1987-2001
Total Factor Productivity using Employment
Table 184: Total Factor Productivity Indexes Using Employment as the Labour Input for Energy Sector Selected Industries (1997=1.000), NAICS based, Canada, 1987-2001 Table 185: Total Factor Productivity Indexes Using Employment as the Labour Input for Mining Sector Selected Industries (1997=1.000), NAICS based, Canada, 1987-2001 Table 186: Total Factor Productivity Indexes (1997=100) Using Employment as the Labour input in ForestProducts Industries, NAICS-based, according to National Accounts and LFS, Canada, 1987-2001
III. Provincial NAICS Estimates Value Added
Table 187: Real GDP in Oil and Gas Extraction [211], in Millions of Constant 1997 Dollars, Canada and the Provinces, NAICS based, 1997-2001 Table 188: Real GDP in Support Activities for Mining and Oil and Gas Extraction [2131], in Millions of Constant 1997 Dollars, Canada and the Provinces, NAICS based, 1997-2001
149
Table 189: Real GDP in Electric Power Generation [2211], in Millions of Constant 1997 Dollars, Canada and the Provinces, NAICS based, 1997-2001 Table 190: Real GDP in Natural Gas Distribution [2212], in Millions of Constant 1997 Dollars, Canada and the Provinces, NAICS based, 1997-2001 Table 191: Real GDP in Petroleum and Coal Products Manufacturing [324], in Millions of Constant 1997 Dollars, Canada and the Provinces, NAICS based, 1997-2001 Table 192: Real GDP in Pipeline Transportation [486], in Millions of Constant 1997 Dollars, Canada and the Provinces, NAICS based, 1997-2001 Table 193: Real GDP in Coal Mining [2121], in Millions of Constant 1997 Dollars, Canada and the Provinces, NAICS based, 1997-2001 Table 194: Real GDP in Metal Ore Mining [2122], in Millions of Constant 1997 Dollars, Canada and the Provinces, NAICS based, 1997-2001 Table 195: Real GDP in Non-metallic Mining [2123], in Millions of Constant 1997 Dollars, Canada and the Provinces, NAICS based, 1997-2001 Table 196: Real GDP in Non-Metallic Metal Production [327], in Millions of Constant 1997 Dollars, Canada and the Provinces, NAICS based, 1997-2001 Table 197: Real GDP in Primary Metals Manufacturing and Fabricated Metal Products [331+332], in Millions of Constant 1997 Dollars, Canada and the Provinces, NAICS based, 1997-2001 Table 198: Forestry and Logging (NAICS code 113): Real GDP (in millions of 1997$), for Canada and the Provinces, according to National Accounts, 1997-2001 Table 199: Wood Products Manufacturing (NAICS code 321): Real GDP (in millions of 1997$) for Canada and the Provinces, according to National Accounts, 1997-2001 Table 200: Paper Manufacturing (NAICS code 322): Real GDP (in millions of 1997$), for Canada and the Provinces, according to National Accounts, 1997-2001
Employment
Table 201: Employment in Oil and Gas Extraction [211], in Thousands of Workers, Canada and the Provinces, NAICS based, 1987-2001 Table 202: Employment in Support Activities for Mining and Oil and Gas Extraction [2131], in Thousands of Workers, Canada and the Provinces, NAICS based, 1987-2001 Table 203: Employment in Electric Power Generation [2211], in Thousands of Workers, Canada and the Provinces, NAICS based, 1987-2001 Table 204: Employment in Natural Gas Distribution [2212], in Thousands of Workers, Canada and the Provinces, NAICS based, 1987-2001 Table 205: Employment in Petroleum and Coal Products Manufacturing [324], in Thousands of Workers, Canada and the Provinces, NAICS based, 1987-2001 Table 206: Employment in Pipeline Transportation [486], in Thousands of Workers, Canada and the Provinces, NAICS based, 1987-2001 Table 207: Employment in Coal Mining [2121], in Thousands of Workers, Canada and the Provinces, NAICS based, 1987-2001 Table 208: Employment in Metal Ore Mining [2122], in Thousands of Workers, Canada and the Provinces, NAICS based, 1987-2001 Table 209: Employment in Non-metallic Mining [2123], in Thousands of Workers, Canada and the Provinces, NAICS based, 1987-2001 Table 210: Employment in Non-metallic Metal production [327], in Thousands of Workers, Canada and the Provinces, NAICS based, 1987-2001 Table 211: Employment in Primary Metals Manufacturing [331], in Thousands of Workers, Canada and the Provinces, NAICS based, 1987-2001 Table 212: Employment in Fabricated Metal Products [332], in Thousands of Workers, Canada and the Provinces, NAICS based, 1987-2001 Table 213: Forestry and Logging (NAICS code 113): Total Employment (in thousands), for Canada and the
150
Provinces, according to LFS, 1987-2001 Table 214: Wood Products Manufacturing (NAICS code 321): Total Employment (in thousands) for Canada and the Provinces, according to LFS, 1987-2001 Table 215: Paper Manufacturing (NAICS code 322): Total Employment (in thousands), for Canada and the Provinces, according to LFS, 1987-2001
Hours
Table 216: Total Hours Worked per Week in Oil and Gas Extraction [211], in Thousands of Workers, Canada and the Provinces, NAICS based, 1987-2001 Table 217: Total Hours Worked per Week in Support Activities for Mining and Oil and Gas Extraction [2131], in Thousands of Workers, Canada and the Provinces, NAICS based, 1987-2001 Table 218: Total Hours Worked per Week in Electric Power Generation [2211], in Thousands of Workers, Canada and the Provinces, NAICS based, 1987-2001 Table 219: Total Hours Worked per Week in Natural Gas Distribution [2212], in Thousands of Workers, Canada and the Provinces, NAICS based, 1987-2001 Table 220: Total Hours Worked per Week in Petroleum and Coal Products Manufacturing [324], in Thousands of Workers, Canada and the Provinces, NAICS based, 1987-2001 Table 221: Total Hours Worked per Week in Pipeline Transportation [486], in Thousands of Workers, Canada and the Provinces, NAICS based, 1987-2001 Table 222: Total Hours Worked per Week in Coal Mining [2121], in Thousands of Workers, Canada and the Provinces, NAICS based, 1987-2001 Table 223: Total Hours Worked per Week in Metal Ore Mining [2122], in Thousands of Workers, Canada and the Provinces, NAICS based, 1987-2001 Table 224: Total Hours Worked per Week in Non-metallic Mining [2123], in Thousands of Workers, Canada and the Provinces, NAICS based, 1987-2001 Table 225: Total Hours Worked per Week in Non-metallic Metal production [327], in Thousands of Workers, Canada and the Provinces, NAICS based, 1987-2001 Table 226: Total Hours Worked per Week in Primary Metals Manufacturing [331], in Thousands of Workers, Canada and the Provinces, NAICS based, 1987-2001 Table 227: Total Hours Worked per Week in Fabricated Metal Products [332], in Thousands of Workers, Canada and the Provinces, NAICS based, 1987-2001 Table 228: Forestry and Logging (NAICS code 113): Total Weekly Hours worked (in thousands), for Canada and the Provinces, according to LFS, 1987-2001 Table 229: Wood Products Manufacturing (NAICS code 321): Total Weekly Hours worked (in thousands) for Canada and the Provinces, according to LFS, 1987-2001 Table 230: Paper Manufacturing (NAICS code 322): Total Weekly Hours worked (in thousands), for Canada and the Provinces, according to LFS, 1987-2001
Average Weekly Hours
Table 231: Average Weekly Hours Worked in Oil and Gas Extraction [211], Canada and the Provinces, NAICS based, 1987-2001 Table 232: Average Weekly Hours Worked in Support Activities for Mining and Oil and Gas Extraction [2131], Canada and the Provinces, NAICS based, 1987-2001 Table 233: Average Weekly Hours Worked in Electric Power Generation [2211], in Thousands of Workers, Canada and the Provinces, NAICS based, 1987-2001 Table 234: Average Weekly Hours Worked in Natural Gas Distribution [2212], Canada and the Provinces, NAICS based, 1987-2001 Table 235: Average Weekly Hours Worked in Petroleum and Coal Products Manufacturing [324],
151
Canada and the Provinces, NAICS based, 1987-2001 Table 236: Average Weekly Hours Worked in Pipeline Transportation [486], in Thousands of Workers, Canada and the Provinces, NAICS based, 1987-2001 Table 237: Average Weekly Hours Worked in Coal Mining [2121], Canada and the Provinces, NAICS based, 1987-2001 Table 238: Average Weekly Hours Worked in Metal Ore Mining [2122], Canada and the Provinces, NAICS based, 1987-2001 Table 239: Average Weekly Hours Worked in Non-metallic Mining [2123], Canada and the Provinces, NAICS based, 1987-2001 Table 240: Average Weekly Hours Worked in Non-metallic Metal production [327], Canada and the Provinces, NAICS based, 1987-2001 Table 241: Average Weekly Hours Worked in Primary Metals Manufacturing [331], Canada and the Provinces, NAICS based, 1987-2001 Table 242: Total Hours Worked per Week in Fabricated Metal Products [332], in Thousands of Workers, Canada and the Provinces, NAICS based, 1987-2001 Table 243: Forestry and Logging (NAICS code 113): Average Weekly Hours Worked, for Canada and the Provinces, according to LFS, 1987-2001 Table 244: Wood Products Manufacturing (NAICS code 321): Average Weekly HoursWorked for Canada and the Provinces, according to LFS, 1987-2001 Table 245: Paper Manufacturing (NAICS code 322): Average Weekly Hours Worked, for Canada and the Provinces, according to LFS, 1987-2001
Capital Stock
Table 246: Capital Stock in Petroleum and Coal Products Manufacturing [324], in Millions of Constant 1997 Dollars, NAICS based, 1984-2001 Table 247: Capital Stock in Non-metallic Metal Production [327], in Millions of Constant 1997 Dollars, NAICS based, 1984-2001 Table 248: Capital Stock in Primary Metals Manufacturing [331], in Millions of Constant 1997 Dollars, NAICS based, 1984-2001 Table 249: Capital Stock in Fabricated Metal Products [332], in Millions of Constant 1997 Dollars, NAICS based, 1984-2001 Table 250: Forestry and Logging (NAICS code 113): Capital Stock (in millions of 1997$), for Canada and the Provinces, according to National Accounts, 1987-2001 Table 251: Wood Products Manufacturing (NAICS code 321): Capital Stock (in millions of 1997$) for Canada and the Provinces, according to National Accounts, 1984-2001 Table 252: Paper Manufacturing (NAICS code 322): Capital Stock (in millions of 1997$), for Canada and the Provinces, according to National Accounts, 1984-2001
Value Added per Hour
Table 253: Real GDP per Hour Worked in Oil and Gas Extraction [211], in Constant 1997 Dollars, Canada and the Provinces, NAICS based, 1997-2001 Table 254: Real GDP per Hour Worked in Support Activities for Mining and Oil and Gas Extraction [2131], in Constant 1997 Dollars, Canada and the Provinces, NAICS based, 1997-2001 Table 255: Real GDP per Hour Worked in Electric Power Generation [2211], in Constant 1997 Dollars, Canada and the Provinces, NAICS based, 1997-2001 Table 256: Real GDP per Hour Worked in Natural Gas Distribution [2212], in Constant 1997 Dollars, Canada and the Provinces, NAICS based, 1997-2001
152
Table 257: Real GDP per Hour Worked in Petroleum and Coal Products Manufacturing [324], in Constant 1997 Dollars, Canada and the Provinces, NAICS based, 1997-2001 Table 258: Real GDP per Hour Worked in Pipeline Transportation [486], in Constant 1997 Dollars, Canada and the Provinces, NAICS based, 1997-2001 Table 259: Real GDP per Hour Worked in Coal Mining [2121], in Constant 1997 Dollars, Canada and the Provinces, NAICS based, 1997-2001 Table 260: Real GDP per Hour Worked in Metal Ore Mining [2122], in Constant 1997 Dollars, Canada and the Provinces, NAICS based, 1997-2001 Table 261: Real GDP per Hour Worked in Non-metallic Mining [2123], in Constant 1997 Dollars, Canada and the Provinces, NAICS based, 1997-2001 Table 262: Real GDP per Hour Worked in Non-Metallic Metal Production [327], in Constant 1997 Dollars, Canada and the Provinces, NAICS based, 1997-2001 Table 263: Real GDP per Hour Worked in Primary Metals Manufacturing and Fabricated Metal Products [331+332], in Constant 1997 Dollars, Canada and the Provinces, NAICS based, 1997-2001 Table 264: Forestry and Logging (NAICS code 113): Value Added per Hour (in 1997$), for Canada and the Provinces, according to National Accounts and LFS, 1997-2001 Table 265: Wood Products Manufacturing (NAICS code 321): Value Added per Hour (in 1997$) for Canada and the Provinces, according to National Accounts and LFS, 1997-2001 Table 266: Paper Manufacturing (NAICS code 322): Value Added per Hour (in 1997$), for Canada and the Provinces, according to National Accounts and LFS, 1997-2001
Value Added per Worker
Table 267: Real GDP per Worker in Oil and Gas Extraction [211], in Constant 1997 Dollars, Canada and the Provinces, NAICS based, 1997-2001 Table 268: Real GDP per Worker in Support Activities for Mining and Oil and Gas Extraction [2131], in Constant 1997 Dollars, Canada and the Provinces, NAICS based, 1997-2001 Table 269: Real GDP per Worker in Electric Power Generation [2211], in Constant 1997 Dollars, Canada and the Provinces, NAICS based, 1997-2001 Table 270: Real GDP per Worker in Natural Gas Distribution [2212], in Constant 1997 Dollars, Canada and the Provinces, NAICS based, 1997-2001 Table 271: Real GDP per Worker in Petroleum and Coal Products Manufacturing [324], in Constant 1997 Dollars, Canada and the Provinces, NAICS based, 1997-2001 Table 272: Real GDP per Worker in Pipeline Transportation [486], in Constant 1997 Dollars, Canada and the Provinces, NAICS based, 1997-2001 Table 273: Real GDP per Worker in Coal Mining [2121], in Constant 1997 Dollars, Canada and the Provinces, NAICS based, 1997-2001 Table 274: Real GDP per Worker in Metal Ore Mining [2122], in Constant 1997 Dollars, Canada and the Provinces, NAICS based, 1997-2001 Table 275: Real GDP per Worker in Non-metallic Mining [2123], in Constant 1997 Dollars, Canada and the Provinces, NAICS based, 1997-2001 Table 276: Real GDP per Worker in Non-Metallic Metal Production [327], in Constant 1997 Dollars, Canada and the Provinces, NAICS based, 1997-2001 Table 277: Real GDP per Worker in Primary Metals Manufacturing and Fabricated Metal Products [331+332], in Constant 1997 Dollars, Canada and the Provinces, NAICS based, 1997-2001 Table 278: Forestry and Logging (NAICS code 113): Value Added per Worker (in 1997$), for Canada and the Provinces, according to National Accounts and LFS 1997-2001 Table 279: Wood Products Manufacturing (NAICS code 321): Value Added per Worker (in 1997$) for Canada and the Provinces, according to National Accounts and LFS, 1997-2001 Table 280: Paper Manufacturing (NAICS code 322): Value Added per Worker (in 1997$),
153
for Canada and the Provinces, according to National Accounts and LFS, 1997-2001
Value Added per $1,000 of Capital Stock
Table 281: Value Added per 1,000$ of Capital Stock in Petroleum and Coal Products Manufacturing [324], in Constant 1997 Dollars, NAICS based, 1997-2001 Table 282: Value Added per 1,000$ of Capital Stock in Non-metallic Metal Products [327], in Constant 1997 Dollars, NAICS based, 1997-2001 Table 283: Value Added per 1,000$ of Capital Stock in Primary Metals Manufacturing and Fabricated Metal Products [331+332], in Constant 1997 Dollars, NAICS based, 1997-2001 Table 284: Forestry and Logging (NAICS code 113): Value Added per 1,000$ of Capital Stock (in 1997$), for Canada and the Provinces, according to National Accounts, 1997-2001 Table 285: Wood Products Manufacturing (NAICS code 321): Value Added per 1,000$ of Capital Stock (in 1997$) for Canada and the Provinces, according to National Accounts, 1997-2001 Table 286: Paper Manufacturing (NAICS code 322): Value Added per 1,000$ of Capital Stock (in 1997$), for Canada and the Provinces, according to National Accounts, 1997-2001
Total Factor Productivity using Hours
Table 287: Total Factor Productivity Indexes Using Hours as the Labour Input in Petroleum and Coal Products Manufacturing [324], 1997=100, NAICS based, 1997-2001 Table 288: Total Factor Productivity Indexes Using Hours as the Labour Input in Non-metallic Metal Products [327], 1997=100, NAICS based, 1997-2001 Table 289: Total Factor Productivity Indexes Using Hours as the Labour Input in Primary Metals Manufacturing and Fabricated Metal Products [331-332], 1997=100, NAICS based, 1997-2001 Table 290: Forestry and Logging (NAICS code 113): Total Factor Productivity Indexes (using hours as the labour input) for Canada and the Provinces, according to National Accounts and LFS, 1997-2001 Table 291: Wood Products Manufacturing (NAICS code 321): Total Factor Productivity Indexes (using hours as the labour input) for Canada and the Provinces, according to National Accounts and LFS, 1997-2001 Table 292: Paper Manufacturing (NAICS code 322): Total Factor Productivity Indexes (using hours as the labour input) for Canada and the Provinces, according to National Accounts and LFS, 1997-2001
Total Factor Productivity using Employment
Table 293: Total Factor Productivity Indexes Using Employment as the Labour Input in Petroleum and Coal Products Manufacturing [324], 1997=100, NAICS based, 1997-2001 Table 294: Total Factor Productivity Indexes Using Employment as the Labour Input in Non-metallic Metal Products [327], 1997=100, NAICS based, 1997-2001 Table 295: Total Factor Productivity Indexes Using Employment as the Labour Input in Primary Metals Manufacturing and Fabricated Metal Products [331-332], 1997=100, NAICS based, 1997-2001 Table 296: Forestry and Logging (NAICS code 113): Total Factor Productivity Indexes (using employment as the labour input) for Canada and the Provinces, according to National Accounts and LFS, 1997-2001 Table 297: Wood Products Manufacturing (NAICS code 321): Total Factor Productivity Indexes (using employment as the labour input)
154
for Canada and the Provinces, according to National Accounts and LFS, 1997-2001 Table 298: Paper Manufacturing (NAICS code 322): Total Factor Productivity Indexes (using employment as the labour input) for Canada and the Provinces, according to National Accounts and LFS, 1997-2001
IV. Provincial SIC Estimates Real Value Added per Hour
Table 299: Real Value Added per Hour Worked in Mining (in 1992 dollars), SIC based, Canada and the Provinces, 1984-1998 Table 300: Real Value Added per Hour Worked in Metal Mining [061] (in 1992 dollars), SIC based, Canada and the Provinces, 1984-1998 Table 301: Real Value Added per Hour Worked in Non Metal Mining [062] (in 1992 dollars), SIC based, Canada and the Provinces, 1984-1998 Table 302: Real Value Added per Hour Worked in Coal Mining [063] (in 1992 dollars), SIC based, Canada and the Provinces, 1984-1998 Table 303: Real Value Added per Hour Worked in Crude Petroleum and Gas Industries [07] (in 1992 dollars),
Table 305: Real Value Added per Hour Worked in Primary Metal Industries [29] (in 1992 dollars), SIC based, Canada and the Provinces, 1984-1998
SIC based, Canada and the Provinces, 1984-1998
SIC based, Canada and the Provinces, 1984-1998
SIC based, Canada and the Provinces, 1984-1998 Table 304: Real Value Added per Hour Worked in Service Industries Incidental to Mineral Extraction [09] (in 1992 dollars), SIC based, Canada and the Provinces, 1984-1998
Table 306: Real Value Added per Hour Worked in Fabricated Metal Product Industries [30] (in 1992 dollars), SIC based, Canada and the Provinces, 1984-1998 Table 307: Real Value Added per Hour Worked in Motor Vehicle Parts and Accessories Industries [325] (in 1992 dollars), SIC based, Canada and the Provinces, 1984-1998 Table 308: Real Value Added per Hour Worked in Non Metal Mineral Products Industries [35] (in 1992 dollars), SIC based, Canada and the Provinces, 1984-1998 Table 309: Real Value Added per Hour Worked in Refined Petroleum and Coal Industries [36] (in 1992 dollars), SIC based, Canada and the Provinces, 1984-1998 Table 310: Real Value Added per Hour Worked in Pipeline Transport Industries [46] (in 1992 dollars), SIC based, Canada and the Provinces, 1984-1998 Table 311: Real Value Added per Hour Worked in Electric Power Systems Industries [491] (in 1992 dollars),
Table 312: Real Value Added per Hour Worked in Gas Distribution Systems Industries [492] (in 1992 dollars), SIC based, Canada and the Provinces, 1984-1998 Table 313: Real Value Added per Hour Worked in the Forestry and Logging Industry [C],
Table 314: Real Value Added per Hour Worked in the Wood Products Industry [25], SIC based, Canada and the Provinces, 1984-1998 Table 315: Real Value Added per Hour Worked in the Paper and Allied Products Industry [27], SIC based, Canada and the Provinces, 1984-1998
Real Value Added per 1,000 Dollar of Capital Stock
Table 316: Real Value Added per 1,000 of 1992 Constant Dollars of Capital Stock in Primary Metal Industries [29], SIC based, Canada and the Provinces, 1984-1998 Table 317: Real Value Added per 1,000 of 1992 Constant Dollars of Capital Stock in Fabricated Metal Products Industries [30], SIC based, Canada and the Provinces, 1984-1998 Table 318: Real Value Added per 1,000 of 1992 Constant Dollars of Capital Stock in Non Metallic Mineral Products Industries [35], SIC based, Canada and the Provinces, 1984-1998 Table 319: Real Value Added per 1,000 of 1992 Constant Dollars of Capital Stock in Refined Petroleum
155
and Coal Products Industries [36], SIC based, Canada and the Provinces, 1984-1998 Table 320: Real Value Added per 1,000 of 1992 Constant Dollars of Capital Stock in the Forestry and Logging Industry [C], SIC based, Canada and the Provinces, 1984-1998 Table 321: Real Value Added per 1,000 of 1992 Constant Dollars in the Wood Products Industry [25], SIC based, Canada and the Provinces, 1984-1998 Table 322: Real Value Added per 1,000 of 1992 Constant Dollars in the Paper and Allied Products Industry [27], SIC based, Canada and the Provinces, 1984-1998
Total Factor Productivity
Table 323: Total Factor Productivity Indexes for Primary Metal Industries [29], SIC based, Canada and the Provinces, 1984-1998 Table 324: Total Factor Productivity Indexes for Fabricated Metal Industries [30], SIC based, Canada and the Provinces, 1984-1998 Table 325: Total Factor Productivity Indexes for Non Metallic Mineral Products Industries [35], SIC based, Canada and the Provinces, 1984-1998 Table 326: Total Factor Productivity Indexes for Pretroleum and Coal Products Industries [36], SIC based, Canada and the Provinces, 1984-1998 Table 327: Total Factor Productivity Indexes for the Forestry and Logging Industry [C], SIC based, Canada and the Provinces, 1984-1998 Table 328: Total Factor Productivity Indexes for the Wood Products Industry [25], SIC based, Canada and the Provinces, 1984-1998 Table 329: Total Factor Productivity Indexes for the Paper and Allied Products Industry [27], SIC based, Canada and the Provinces, 1984-1998
VII. List of Appendix Charts
Energy Industries
Chart 1: Indexes of real Value added in Energy Industries, 1961-2000 Chart 2: Indexes of Employment in Energy Industries, 1961-2000
Chart 6: Indexes of Total Factor Productivity in Energy Industries, 1961-2000
Chart 3: Indexes of Real Value Added per Hour worked in Energy Industries, 1961-2000 Chart 4: Indexes of Capital Stock in Energy Industries, 1961-2000 Chart 5: Indexes of Capital Stock per Hour Worked in Energy Industries, 1961-2000
Mining Industries
Chart 7: Indexes of Real Value added in Mining Industries, 1961-2000 Chart 8: Indexes of Employment in Mining Industries, 1961=2000 Chart 9: Indexes of Value Added per Hour Worked in Mining Industries, 1961-2000 Chart 10: Indexes of Capital stock in Mining Industries, 1976-2000 Chart 11: Indexes of Capital stock per Hour Worked in Mining Industries, 1961-2000 Chart 12: Indexes of Total Factor Productivity in Mining Industries, 1961-2000
Primary Metal Industries
Chart 13: Indexes of Real value added in Orimary metal Industries, 1961-2000 Chart 14: Indexes of Employment in Primary metals industries, 1961-2000 Chart 15: Indexes of Value added per Hour Worked in Primary Metal Industries, 1961-2000
156
Chart 16: Indexes of Capital Stock in Primary Metal Industries, 1961-2000 Chart 17: Indexes of Capital Stock per Hour worked in Primary Metal Industries, 1976-2000 Chart 18: Indexes of Total Factor Productivity in Primary Metal Industries, 1961-2000
Non-Metallic Mineral Products Industries
Chart 19: Indexes of Real Value added in Non metallic Mineral Products Industries, 1961-2000 Chart 20: Indexes of employment in Non-metallic mineral products industries, 1961-2000 Chart 21: Indexes of Value added per Hour Worked in Non-metallic Mineral products Industries, 1961-2000 Chart 22: Indexes of Capital Stock in Non-metallic Mineral products Industries, 1961-2000 Chart 23: Indexes of Capital Stock per Hour Worked in Non-metallic Mineral Products Industries, 1961-2000 Chart 24: Indexes of Total Factor Productivity in Non-metallic Mineral Products Industries, 1961-2000
Fabricated Metal Products Industries and Motor Vehicule Parts and Accessories Industries
Chart 25: Indexes of Real Value Added in Fabricated Metal Products Industries and Motor Vehicle Parts and Accessories Industries, 1961-2000 Chart 26: Indexes of Employment in Fabricated Metal Products Industries and Motor Vehicle Parts and Accessories Industries, 1961-2000 Chart 27: Indexes of Real Value Added per Hour Worked in Fabricated Metal Products Industries and Motor Vehicle Parts and Accessories Industries, 1961-2000 Chart 28: Indexes of Capital Stock in Fabricated Metal Products Industries and Motor Vehicle Parts and Accessories Industries, 1961-2000 Chart 29: Indexes of Capital Stock per Hour Worked in Fabricated Metal products Industries and Motor Vehicle Parts and Accessories Industries, 1961-2000 Chart 30: Indexes of Total Factor Productivity in Fabricated Metal Products Industries and Motor Vehicle Parts and Accessories Industries, 1961-2000
Forest Product Industries
Chart 31: Indexes of Real Value Added in Forest Product Industries, 1961-2000 Chart 32: Indexes of Employment in Forest Product Industries, 1961-2000 Chart 33: Real Value Added per Hour Worked in Forest Product Industries, 1961-2000 Chart 34: Indexes of Capital Stock in Forest product Industries, 1961-2000 Chart 35: Indexes of Capital Stock per Hour Worked in Forest products Industries, 1961-2000 Chart 36: Indexes of Total Factor productivity in Forest Products Industries, 1961-2000