product and stock market responses to automotive product liability
TRANSCRIPT

STEVEN GARBER RAND
JOHN ADAMS RAND
Product and Stock Market Responses to Automotive Product Liability Verdicts
CLAIMS ABOUT DETRIMENTAL economic effects of product liability are a cornerstone of efforts by tort reformers to rally support. It seems fair to say, however, that existing evidence about economic effects of prod- uct liability is sketchy. ' In this paper, we attempt to develop information about a narrow but important piece of a very complex puzzle. In par- ticular, we develop quantitative evidence about a component of auto- mobile manufacturers' incentives stemming from product liability by examining effects of trial verdicts on company stock prices and on new vehicle sales. We know of no similar study.2
We gratefully acknowledge financial support from the Alfred P. Sloan Foundation and the RAND Institute for Civil Justice. Our conclusions and opinions do not neces- sarily reflect the views of the Institute for Civil Justice, RAND, or research sponsors. We thank Dan Relles for helpful discussions and Sam Peltzman, Daniel Rubinfeld, Clifford Winston, and other conference participants for insightful comments on a pre- vious draft. Eva Feldman, Sung-Ho Ahn, John Anderson, Darcy Byrne, Susan Mc- Glamery, Joan Schlimgen, and Roberta Shanman have provided extensive research assistance.
1. Efforts to provide empirical information about economic effects of product lia- bility include Viscusi (1991); Huber and Litan (1991); Garber (1993); Hunziker and Jones (1994); and Manning (1994, 1997).
2. Viscusi and Hersch (1990) examine stock price effects of product liability (and regulatory enforcement) events-mostly lawsuit filings and no verdicts-for various industries. Jarrell and Peltzman (1985); Hoffer, Pruitt, and Reilly (1988); Marcus and Bromiley (1988); Bromiley and Marcus (1989); and Barber and Darrough (1996) study stock market effects of automobile recalls. Wynne and Hoffer (1976); Crafton, Hoffer, and Reilly (1981); Reilly and Hoffer (1983); and McCarthy (1989) analyze effects of
1
2 Brookings Papers: Microeconomics 1998
Efficiency effects of product liability depend on the resource costs of bringing and resolving claims and lawsuits and on how incentives emanating from product liability exposure affect manufacturer deci- sions and economic outcomes outside the legal system. Such outcomes include product safety and usefulness, costs of designing and manufac- turing products, and rates and directions of innovation.
We focus on a component of incentives rather than directly exam- ining economic outcomes because few of the key economic outcomes can be observed or measured by researchers. This means that research- ers will be able at best to draw inferences about effects of product liability relying on assumptions about objectives of firms and informa- tion about how product liability affects the environment in which these objectives are pursued.
We focus on a single industry because liability effects on business decisions should depend on industry-specific factors such as market conditions, safety regulation, opportunities for improving product safety, and capabilities for developing evidence that products have caused injury. We chose motor vehicles because economic effects of product liability in the automobile industry have received substantial attention, and because it is possible to develop relatively extensive data for motor vehicles.3
We further focus the inquiry on trial verdicts. Manufacturer incen- tives emanating from the product liability system are a composite of many types of potential or actual "liability events" such as informal claims made (with the implicit or explicit threat of a lawsuit), lawsuit filings, negotiations about claims or suits, settlements, trial verdicts, and appeals and their resolution. We focus on trial verdicts for a com- bination of substantive and practical reasons, namely because verdicts are very prominent, can be documented, are sufficiently numerous to allow econometric analysis, and contain elements of surprise (that is, new information), the timing of which can be established.4
recalls on motor vehicle sales. Effects of automobile recalls on prices are studied by Hartman (1987) and Uri (1989).
3. For economic effects, see, for example, Graham (1991); Mackay (1991); Babcock (1994); and Castaing (1994).
4. Trial verdicts-unlike many other liability events such as informal claims, ne- gotiations, and settlements (the terms of which are often confidential), and even lawsuit filings-can be documented. Concerning suit filings, there is a comprehensive database on suits in federal court, but the information it contains is not sufficiently detailed to

Steven Garber and John Adams 3
Product Liability Incentives: A Priori Considerations
Incentives for motor vehicle manufacturers to invest in safety ema- nating from product liability operate in conjunction with incentives resulting from the behavior of motor vehicle buyers and the National Highway Traffic Safety Administration (NHTSA), the industry's prod- uct safety regulator. Automobile companies have market-based incen- tives to improve the safety of their products in the ways and to the extent that these improvements translate into consumers' willingness to pay. Consumers can observe or verify the presence of seat belts, padded dashboards, and air bags.5 Information about such other safety-related vehicle attributes as braking distances and handling in (simulated) emer- gency situations is available from automotive and consumer publica- tions. In addition, the NHTSA conducts crash tests of vehicles and releases the results publicly.6 Regulation by the NHTSA-promulga- tion and enforcement of motor vehicle design standards and the threat of safety-related recalls-provides additional incentives for product safety.
Product Liability Costs
Product liability may alter manufacturer behavior bearing on product safety because liability for product-related injuries can impose costs on manufacturers. It is helpful to distinguish between direct and indirect liability costs. Direct liability costs are incurred by companies within the product liability process. These include costs of responding to and settling informal claims that could become lawsuits; responding to, defending, negotiating over, and settling lawsuits before verdicts; trying cases; appealing, negotiating and settling lawsuits after trial ver- dicts; and paying trial judgments. Indirect liability costs are attributable to events within the liability process-they would not be incurred if it were not for these events-but are incurred outside that process. Indi-
support the kind of analysis reported in this paper (for example, the product involved in a suit cannot be identified), and most product liability suits are brought in the state courts.
5. Mannering and Winston (1995) estimate willingness to pay for airbags. Other recent studies providing evidence that consumer demand depends on vehicle safety include McCarthy (1990) and Dreyfus and Viscusi (1995).
6. See, for example, Hoffer, Pruitt, and Reilly (1992).

4 Brookings Papers: Microeconomics 1998
rect costs might result from demand decreases or regulatory actions triggered by liability events.
Product Liability Risks
When automobile companies make decisions to design, manufacture, and label a product in a particular way, the liability consequences are uncertain and will not be determined for decades. Uncertainty about eventual liability costs stems from many sources including unforeseen product hazards; doctrinal complexity and lack of precision; potential for doctrinal change; unpredictable behavior of company personnel, product users, attorneys, judges, and juries; changes in attitudes toward litigation and compensation; and unknown future capabilities for deter- mining accident or injury causation.
The term liability risk is used here to refer to the potential for product liability costs, direct and indirect, encompassing both the (subjective) probabilities and magnitudes of such costs. Risk may be an essential consideration in company responses to product liability because, unlike many other business risks, product liability risks are unlimited for all practical purposes.7
Liability Costs, Vehicle Sales, and Stock Prices: Theory
In this section we describe what sales and stock price effects would and would not reflect and the circumstances under which such effects would be expected to be larger or smaller. First we describe case studies that provide background and motivation. Then we consider how ver- dicts might affect product demand and vehicle sales.
Case Studies of Liability in Motor Vehicles
Case studies and journalistic accounts of particular motor vehicle models or types of vehicles with unusually extensive and eventful prod- uct liability histories suggest that product liability costs can be very substantial. Moreover, they suggest that indirect liability costs to motor
7. This is because product liability costs usually cannot be controlled after they begin to mount, and they are not limited to any amount a company explicitly chooses to place at risk.

Steven Garber and John Adams 5
vehicle manufacturers may be major elements of their product liability exposure.
More specifically, the histories of product liability litigation, NHTSA action, and market developments related to various car or truck models suggest that indirect costs of litigation, if and when they exist, are part of a complicated, dynamic process. Consider the following composite scenario. Safety concerns about a vehicle model, well founded or not, arise. A complex, interdependent chain of events fol- lows involving personal injury litigation; controversy over engineering evidence and injury causation; mass media attention, often triggered by large trial awards, many of which include punitive components; pres- sure on the NHTSA by groups representing consumers, victims, plain- tiffs, or plaintiffs' attorneys; defect investigations by the NHTSA; safety recalls of the vehicles; and declining sales of the model. Vehicles with case histories containing many of these elements, including the possibility of demand effects and a prominent role for mass media coverage, are the Ford Pinto (concerns about fuel tank position), the Jeep CJ-5 and CJ-7 (concerns about rollovers), the Audi 5000 (concerns about sudden acceleration), and, more recently, the GM C/K (side- saddle) pickup trucks (concerns about fuel tank position).8
In many of these cases it is difficult to judge whether, and if so to what extent, product liability contributed to decreases in demand for vehicles involved in litigation. More important, histories and journal- istic accounts are written about cases that seem atypical in various ways, including volume of litigation, sizes of awards, and the extent, char-
8. On the Pinto see Schwartz (1991). Graham (1991, p. 135) is skeptical that product liability was a fundamental factor in the declining sales of the Pinto, but he refers to speculation that "sales of all Ford models may have been adversely affected by the Pinto fuel tank controversy." In the case of the Jeep CJ-5, Graham (1991, p. 149) points to adverse publicity, resulting at least in part from efforts of plaintiff attorneys, as one cause of sharply declining sales.
On the Audi 5000, Sullivan (1990) focuses on events during 1986-most notably a report on CBS television's 60 Minutes-and concludes that concerns about the car's alleged problem with sudden acceleration and related publicity depressed prices of used Audi 5000S and other Audi models. Brown (1986) emphasizes effects on new Audi sales. Mackay (1991, pp. 210-11) briefly recounts the Audi 5000's history, emphasizing sales declines and the roles of the plaintiffs' bar and the media, and refers to the car as "a financial disaster for the manufacturer." Huber (1991, chap. 4) provides an extensive account of and commentary on the litigation.
On the GM pickups see LaManna (1993); Thomas (1993); and Pearl and Lavin (1994).
6 Brookings Papers: Microeconomics 1998
acter, and prominence of news media coverage. Our analysis provides some perspective from a much broader class of litigation episodes.
Vehicle Sales
A verdict against a motor vehicle manufacturer would be expected to decrease demand for a vehicle model found defective only if, and to the extent that, the verdict conveys new information relevant to pur- chase decisions and potential buyers become aware of this information. Regarding the potential information content of a verdict, the most ob- vious possibility is that verdicts against manufacturers lead consumers to become more concerned about the safety characteristics of the model involved in the trial. The degree to which consumers become aware of different verdicts is likely to vary considerably. A major potential factor is the extent of news coverage.9
Demand decreases are quantifiable from unit sales decreases only if price does not respond. We do not observe (transactions) prices for vehicles, however. Assuming that decreases in demand are generally not entirely and quickly absorbed by decreases in price, we examine empirically the possibility of declines in unit sales shortly after verdicts are announced. If verdicts do decrease demand but demand decreases are quickly and completely accommodated by price adjustments (of which consumers are quickly well informed), demand effects would not be apparent from effects on unit sales. Demand decreases that are newly anticipated by investors at the time of the verdict would, how- ever, be reflected in stock price responses to verdicts.
Stock Prices
A verdict for or against a motor vehicle manufacturer would be expected to affect its stock price to the extent that the verdict carries with it new information about factors relevant to future company profits, and this information becomes known to investors. 10 Future profitability
9. Garber and Bower (1998) find virtually no newspaper coverage of motor vehicle product liability trials prior to verdicts and virtually no coverage of verdicts finding manufacturers not liable. Thus, in analyzing demand effects we consider only plaintiff verdicts.
10. We think it plausible, and we investigate the possibility, that stock prices react to verdicts in favor of manufacturers as well as those holding manufacturers liable.

Steven Garber and John Adams 7
depends on an array of factors that are in principle sensitive to trial verdicts. These include indirect liability costs of types we have de- scribed. They also include direct liability costs, which are potentially affected through various mechanisms.
DIRECT LIABILITY COSTS IN THE CURRENT CASE. The announcement of a trial verdict should affect investor beliefs about direct costs associated with the lawsuit resulting in that verdict. Such effects of verdict an- nouncements are complicated because a verdict does not resolve a law- suit. For example, verdicts against manufacturers are often followed by settlement negotiations and appeals to higher courts. "I Postverdict ac- tivities by a manufacturer's legal team generate additional direct costs, and their effectiveness determines how much will eventually be paid to the plaintiff in damages (if any).
A verdict announcement should be viewed, then, as updating inves- tor beliefs about future direct liability costs in the lawsuit leading to the verdict, but with considerable uncertainty remaining. A verdict for a manufacturer seems safely presumed to be good news for investors about these direct liability costs. Although a verdict against a manufac- turer should usually be bad news in this regard, it can in principle be less costly than what investors had expected.'2
DIRECT LIABILITY COSTS IN OTHER CASES. Perhaps more important, verdicts may also affect direct liability costs in other cases, both through cases that would have been brought in any event and by af- fecting the number of cases. For cases that would have been brought anyway, suppose-which is not uncommon-that a company has sev- eral dozen or more other cases pending involving the same vehicle model and alleged defect. Often, a handful of cases (perhaps five or ten) will be tried, and the results of these trials could greatly affect the
11. Moreover, a jury award of damages against a manufacturer does not become a legal obligation to pay until a judgment is entered by the trial judge. Often a trial judge enters a judgment based precisely on the verdict, but sometimes the judge overrules the jury entirely or accepts the finding of liability but reduces the award. In any event, judgments for damages are often followed by appeals.
12. For example, suppose that as the jury went off to deliberate, investors believed that there was a 75 percent chance that they would find the manufacturer liable and expected the award to be $5 million. If the jury finds liability and announces damages of $1 million, investor assessments of the direct costs of this lawsuit may go down rather than up.

8 Brookings Papers: Microeconomics 1998
terms on which other cases are settled. The effect of a single verdict can be magnified in this way.
Moreover, a verdict against a manufacturer can trigger additional claims or lawsuits. For example, a large verdict against a manufacturer in a case alleging that vehicle model X is defective because of fuel tank leaks and a fire hazard may, particularly if it is widely publicized, lead people who were burned in accidents involving model X to contact an attorney. Finally, learning about the hypothetical verdict should make an attorney more willing to accept a similar case and pursue it energet- ically.
Samples of Verdicts
We focus on personal injury, product liability verdicts involving allegedly defective cars or light trucks. Different samples are used to study effects on vehicle sales and stock prices. We analyze sales effects for both domestic and foreign manufacturers. Lacking suitable data on stock prices for foreign manufacturers, we analyze stock price effects only for domestic manufacturers.
Sources of Verdict Information
The analyses require information about various characteristics of cases leading to verdicts, such as the model and model year of the vehicle alleged to be defective, the nature of the defect alleged, and the nature of the injuries involved in the accident. There is no comprehen- sive source of such information. 13 Moreover, there is no practical way of developing such information for a sample that can be reasonably viewed as random. 14
The primary source used to identify verdicts is the Automotive Liti-
13. There is no database of civil cases in state courts, where most product liability lawsuits are brought, that could be used for our purposes. There is a comprehensive database of federal court cases, but it does not include the kind of information we require: for example, vehicle models or, indeed, even if cases involved a car or light truck.
14. For example, sampling cases and developing the required data would require visits to several courthouses around the country, which would be prohibitively costly.

Steven Garber and John Adams 9
gation Reporter (ALR), which was initially searched from January 1985 through July 1996. 15 This search yielded 116 verdicts for which a do- mestic automobile manufacturer was found not to be liable ("defendant verdicts") and other required information was reported. We judged this number to be adequate for analysis of stock price responses to defendant verdicts. This search, however, yielded only 56 verdicts in which a domestic or foreign manufacturer was held liable for money damages ('plaintiff verdicts''). 16
This original set of plaintiff verdicts was augmented by writing and following up with phone calls to plaintiff attorneys listed in the ALR to request unreported verdict dates. We also extended the ALR search through December 2, 1996; searched the index of Jury Verdicts Weekly (JVW), a publication reporting verdicts throughout California; and searched newspaper databases.'7 These efforts yielded 37 additional plaintiff verdicts for a total of 93 personal injury, product liability verdicts against automobile manufacturers from 1985 to 1996.
15. The ALR is sold by subscription, primarily to plaintiff and defense attorneys and law libraries. In 1994 its circulation was about 150. The cases covered in the ALR are an unsystematic sample of unknown completeness: almost all of the articles are based on unsolicited reports from attorneys who send information to the publisher. (Telephone interview with Nick Sullivan, editor of the ALR, October 1994.)
16. It is very likely that defendant verdicts are overrepresented in the ALR relative to plaintiff verdicts. Victorious defense attorneys have more incentive to report to the ALR in the hope of attracting new clients than do victorious plaintiff attorneys because potential clients of defense attorneys (for example, staff attorneys at automobile com- panies) are much more likely to see the ALR than are potential clients of plaintiff attorneys (people injured in automobile accidents). The econometric work that follows does not seek to explain trial outcomes nor does it pool defendant and plaintiff verdicts, thus this nonrandom sampling does not imply bias in our estimates.
17. The search of newspaper databases yielded only four additional plaintiff verdicts, all during 1994-96. We used selected keywords related to litigation, liability, the NHTSA, and automobile safety and company names to generate lists of titles of articles written from 1990 to 1996. We did this by searching full-text articles in the Wall Street Journal, the New York Times and the ten highest-circulation newspapers in the DIALOG PAPERS database and reviewed these titles visually. Because this process was very laborious, we automated it somewhat and searched the titles of the articles in the other DIALOG newspapers using keywords selected from the titles of articles studied in Garber and Bower (1998). The process was very costly and yielded only four verdicts over a seven-year period that had not been previously identified, so we did not attempt to identify verdicts before 1990 by searching newspapers. Attempts to locate additional verdicts by electronic searches of databases of legal publications and investment house research reports were entirely unproductive.

10 Brookings Papers: Microeconomics 1998
Sample for Vehicle Sales Analyses
The sample of plaintiff verdicts used to study sales effects is 61 of the 93 plaintiff verdicts.'8 The analysis of sales effects involves fore- casting sales into the months following verdicts. Some verdicts were eliminated because the model had been discontinued by the time of the verdict. In addition, we examined the monthly sales time series and eliminated six series for which it was apparent that credible forecasts could not be produced. '9
Samples for Stock Price Analyses
We examined stock price effects for both defendant and plaintiff verdicts. The sample sizes are 116 for defendant verdicts and 64 for plaintiff verdicts, the latter being the subset of the 93 total plaintiff verdicts for which the defendant was a domestic manufacturer.
Appendix tables A-I and A-2 summarize the distributions of verdict years and defendant companies for the three samples.
Empirical Strategy and Variable Definitions
This section explains our approach to measuring outcomes and study- ing their determinants.
Outcome Variables: Sales Effects
Monthly U.S. new vehicle sales data by model were compiled from various issues of the Automotive News Market Data Book. We construct alternative dependent variables based on the difference between actual sales in the month after the verdict and two forecasts of what the sales would have been without the verdict. We interpret the dependent vari- ables as alternative (noisy) estimates of sales shortfalls attributable to the verdicts.
18. We do not analyze effects of defendant verdicts on new vehicle sales because such effects seem very implausible.
19. In particular, we eliminated two verdicts for which the models were already in steep sales declines before the verdicts, three for which the models had sales of fewer than one hundred units a month, and one for which fewer than five months of preverdict sales data were available.

Steven Garber and John Adams 11
To construct forecasts with as little noise as possible, we considered various forecasting methods, evaluated their performance for model- level sales data during the months before their corresponding verdicts, and selected the two best performers to construct our outcome mea- sures. We considered several forecasting approaches, including nonsta- tistical ones, various regression specifications, and some simple auto- regressive models.20
To evaluate the performance of each forecasting approach, a model was repeatedly fit to subsets of each sales time series (prior to the verdict month), and a series of one-month-ahead forecasts was constructed. The forecast errors were expressed as absolute percentage errors (APEs) to make them comparable across vehicle models. Forecasting ap- proaches were evaluated according to their mean APEs (MAPEs), which for each forecasting approach involves averaging over one- month-ahead forecasts for each vehicle model and then averaging across vehicle models.
The best forecasts, with a MAPE of 12.5 percent, resulted from a simple nonstatistical approach. In particular, using the most successful method, the forecast for a model's sales in month t (St) is given by
Ct st =
Ct t-1
where C, and C,tl are company-level sales of the type of vehicle (car or truck) involved in the verdict.2'
The forecasting method used to construct our other sales effects measure is an ordinary exponential smoother.22 Although these fore- casts had a substantially higher MAPE, 17.2 percent, we consider the
20. In the regression models we related monthly sales of an individual car (truck) model to various combinations of company sales of all cars (trucks), seasonally adjusted monthly unemployment rates, and interest rates on three- and five-year Treasury bonds adjusted to real terms by subtracting the CPI growth rate over the previous twelve months.
21. The relatively good performance of this approach may be attributable to the use of company-level sales (of the vehicle type involved in the trial) for the same month being forecast, which incorporates both seasonal and companywide effects that are not captured by the pre-forecast-month variables relied on in the other forecasting ap- proaches.
22. This uses a geometric weighted average of past sales of a model to forecast its future sales.

12 Brookings Papers: Microeconomics 1998
method to gauge the sensitivity of our conclusions to the use of two quite different forecasting approaches.
To define the sales-effects outcome measures analyzed, let OBSLSj - the observed level of sales of the model involved in verdict j during the month after verdict j was announced; CTPREDj = the level of those sales forecasted using the nonstatistical approach; and EXPREDj = the level of those sales forecasted using the exponential-smoothing method.
The outcome measures RASLCT and RASLEX are the forecast errors expressed relative to observed sales:
OBSLS. - CTPRED. RASLCTj- = BL , and
OBSLSj
R OBSLS. - EXPREDJ RASLEXJ= - OBSLSj
If verdicts against manufacturers typically reduce sales, we would expect actual sales to fall short of forecasts and, therefore, RASLCT and RASLEX averaged over verdicts to be negative. We also analyze cross-verdict variation in RASLCT and RASLEX.
Outcome Variables: Stock Market Effects
We develop measures of abnormal stock market responses to verdicts using standard event-study methods.23 Daily stock price data, adjusted for splits and dividends, were obtained from the Dow Jones Tradeline for the four U.S. motor vehicle manufacturers.24 For each verdict, we estimate the so-called "market model":
ri= i + 3iRmt ? Eit,
where ri, = return on security i from trading day t- Ito day t and Rmt = return on the Standard & Poor's 500 index from trading day t - 1 to day t, using data for the 120 trading days prior to the date the verdict was announced.25 We use the estimates of cxi and P3i and to construct
23. See, for example, Campbell, Lo, and MacKinlay (1997, chap. 4); or MacKinlay (1997).
24. The early part of the sample period predates the merger of American Motors and Chrysler.
25. Returns are computed from closing prices on the indicated trading days.

Steven Garber and John Adams 13
CAR, the cumulative abnormal return for the next two trading days.26 Finally, to construct CAVAL, a measure of abnormal dollar returns expressed in millions of 1996 dollars, we multiply CAR by the market equity of the company at the end of the month before the verdict.27
If verdicts against (for) manufacturers typically decrease (increase) stock prices, we would expect the cross-verdict means of CAR and CAVAL to be negative (positive) for the sample of plaintiff (defendant) verdicts. We also use regressions to analyze whether CAVAL varies systematically across plaintiff verdicts.
Independent Variables
It appears that no defensible model would yield identified structural equations for either sales or stock price effects.28 Instead, we estimate various regressions intended to provide an informative description of the data. We view such equations as predictive of the outcomes of interest, but we cannot ascribe causal interpretations to them. We report but pay little attention to t-ratios because several specifications were estimated and because the set of verdicts analyzed is not viewed as a sample from a much larger population.
Table 1 defines the independent variables used in the regressions and reports data sources.29 They are grouped into three categories: indirect cost, direct cost, and publicity.
PREDICTORS OF INDIRECT COSTS. Variables in this set are intended to
26. Thus if the verdict was announced on a trading day, the abnormal return incor- porates the stock return on the day of the verdict and the subsequent trading day. If (as happens in a few cases) the verdict was announced on a nontrading day (a Saturday or holiday), the abnormal return variable incorporates the stock return over the following two trading days.
27. Nominal values of market capitalization and other variables were adjusted using the CPI for all items for urban consumers (CPI-U), taken from the Economic Report of the President, February 1997, table B-58. Market equity (capitalization) data were obtained from Standard & Poor's, Compustat.
28. For example, sales effects are expected to depend on the nature of the injuries, recall histories, the extent of publicity, and interactions. But the extent of publicity depends (see Garber and Bower, 1998) on the nature of the injuries, recall histories, and characteristics of the verdict, which in turn depend on the nature of the injuries. A defensible structural model for stock price effects would seemingly be even more com- plicated because stock prices are expected to depend directly on the characteristics of the verdict in addition to any factors expected to affect sales.
29. Selected interactions are also used in some regressions.
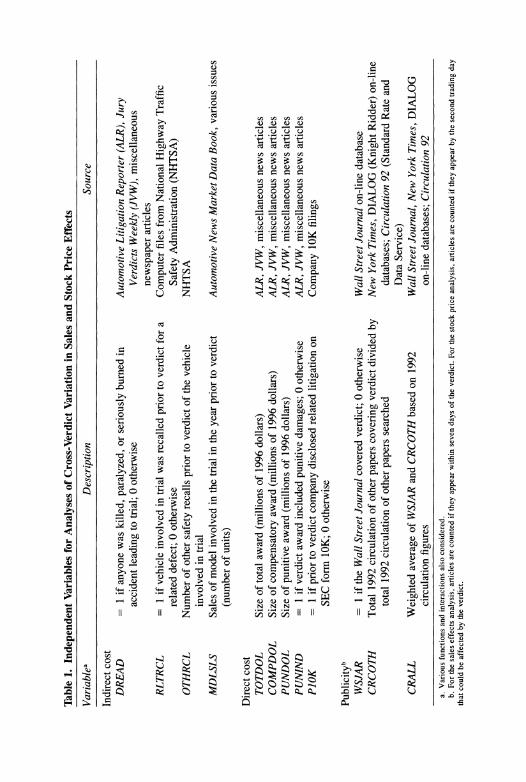
Table 1.
Independent
Variables
for
Analyses of
Cross-Verdict
Variation in
Sales
and
Stock
Price
Effects
Variablea
Description
Source
Indirect
cost DREAD
= 1 if
anyone
was
killed,
paralyzed, or
seriously
burned in
Automotive
Litigation
Reporter
(ALR),
Jury
accident
leading to
trial; 0
otherwise
Verdicts
Weekly
(JVW),
miscellaneous
newspaper
articles
RLTRCL
= 1 if
vehicle
involved in
trial
was
recalled
prior to
verdict for a
Computer
files
from
National
Highway
Traffic
related
defect; 0
otherwise
Safety
Administration
(NHTSA)
OTHRCL
Number of
other
safety
recalls
prior to
verdict of the
vehicle
NHTSA
involved in
trial
MDLSLS
Sales of
model
involved in the
trial in the
year
prior to
verdict
Automotive
News
Market
Data
Book,
various
issues
(number of
units)
Direct
cost TOTDOL
Size of
total
award
(millions of
1996
dollars)
ALR,
JVW,
miscellaneous
news
articles
COMPDOL
Size of
compensatory
award
(millions of
1996
dollars)
ALR,
JVW,
miscellaneous
news
articles
PUNDOL
Size of
punitive
award
(millions of
1996
dollars)
ALR,
JVW,
miscellaneous
news
articles
PUNIND
= 1 if
verdict
award
included
punitive
damages; 0
otherwise
ALR,
JVW,
miscellaneous
news
articles
P10K
= 1 if
prior to
verdict
company
disclosed
related
litigation on
Company
10K
filings
SEC
form
10K; 0
otherwise
Publicityb WSJAR
= 1 if
the
Wall
Street
Journal
covered
verdict; 0
otherwise
Wall
Street
Journal
on-line
database
CRCOTH
Total
1992
circulation of
other
papers
covering
verdict
divided by
New
York
Times,
DIALOG
(Knight
Ridder)
on-line
total
1992
circulation of
other
papers
searched
databases;
Circulation 92
(Standard
Rate
and
Data
Service)
CRALL
Weighted
average of
WSJAR
and
CRCOTH
based on
1992
Wall
Street
Journal,
New
York
Times,
DIALOG
circulation
figures
on-line
databases;
Circulation 92
a.
Various
functions
and
interactions
also
considered.
b.
For
the
sales
effects
analysis,
articles
are
counted if
they
appear
within
seven
days of
the
verdict.
For
the
stock
price
analysis,
articles
are
counted if
they
appear by
the
second
trading
day
that
could be
affected by
the
verdict.

Steven Garber and John Adams 15
control for factors that consumers might think are informative about the safety of the vehicle involved in the trial.
Injuries: Consumers might, upon learning of a verdict against a manufacturer, become more concerned about the safety of the model found defective if anyone involved in the accident leading to the trial sustained particularly severe or dreaded injuries. DREAD is a dichoto- mous variable that takes the value 1 if the accident caused any fatalities, serious burns, or paralysis.
Recall history: Upon learning of a verdict against a manufacturer, consumers may be more inclined to reduce their estimate of the safety of the model judged defective if they had some atypical preverdict reason to be concerned. To examine this possibility we use two varia- bles summarizing the safety recall histories of the vehicles (defined by model and model year) involved in the trials. RLTRCL equals 1 if before the date of the verdict the vehicle had ever been recalled for a safety problem similar or related to any safety defect alleged in the trial.30 OTHRCL is the number of other safety recalls-for any reason-of the vehicle involved in the trial that occurred before the verdict date.
PREDICTORS OF DIRECT COSTS. The first predictor is the size of the award. TOTDOL is the real dollar amount of the total damage award in millions of 1996 dollars. Its compensatory and punitive (if any) com- ponents are denoted by COMPDOL and PUNDOL.31 The existence of a punitive component of an award is indicated by the dichotomous variable PUNIND. Including this variable in combination with total damage amounts allows for an independent effect of a finding that the manufacturer deserves to be punished.
A second predictor is whether there is an unusual amount of similar pending litigation. As discussed earlier, a verdict is expected to have a larger effect on stock prices if there are several similar cases in the litigation pipeline. A measure of the amount of pending litigation cannot
30. The vehicle components alleged to be defective and the cause of the accident or injury in the trial were coded from the litigation reporters or newspaper articles. Recall data cover all safety-related recalls, whether or not they involved a previous NHTSA investigation. We focused on the vehicle components involved in the recalls and the descriptions of how the components were believed to fail (and thereby pose a hazard). RLTRCL was coded as 1 if there was any indication that there had been a prior recall for reasons related to allegations made during the trial.
31. Damage amounts are those initially determined by the jury before, for example, they are reduced or overturned by the trial judge or an appeals court.

16 Brookings Papers: Microeconomics 1998
be constructed because such information is proprietary. A dichotomous variable was constructed by examining litigation sections of the 10K reports filed by the manufacturers with the Securities and Exchange Commission. The variable P10K equals 1 if before the verdict date the manufacturer had disclosed pending product liability litigation involv- ing the same vehicle model and type of alleged defect.32
NEWSPAPER PUBLICITY VARIABLES. We focus on newspapers because very little data for television can be developed earlier than 1992 and because television coverage of verdicts appears to be very rare.33 To measure newspaper coverage, we used procedures described fully else- where.34 Briefly, we searched electronically through full-text newspa- per databases for articles "triggered" by these verdicts-those for which the verdict was the reason or justification for the article. The databases are the Wall Street Journal, the New York Times and the DIALOG PAPERS database group. The DIALOG databases include fifty-eight newspapers, but the time periods covered vary from paper to paper. Generally, more papers can be searched for later years.35 For each verdict, we searched all newspapers that could be searched given the date of the verdict. The searches were done using a keyword string of the form [(company name) or (division name) or (make name)] and [plaintiff(s) surname(s)] for the eight-day period beginning with the verdict date.36
32. According to general legal guidelines, firms are required to disclose information related to product liability only if such exposure is "material" according to the law. "Material" information is "information that a reasonable investor would consider sig- nificant in making an investment decision" (Hazen, 1993, p. 84).
33. See Garber (1998, pp. 280-81) for a discussion of three sources of information on television news coverage and their scopes and limitations. The data that can be developed, which include reports on the three network evening news shows over the entire sample period, suggest that it is very rare for verdicts to trigger television coverage (lead to reports at the time of or shortly after the verdict). The few exceptions are three sample verdicts involving exceptionally large damage awards, each of which included a punitive component.
34. Garber and Bower (1998). 35. For example, only eleven of the DIALOG newspapers can be searched back to
1986, twenty-four for 1988, thirty-nine for 1989, fifty-five for 1990, and a high of fifty- seven for 1994 and 1995. A few newspapers ceased publication during the analysis period.
36. Hypothetical search strings are (Chrysler or Plymouth) and Jones; (General Motors or GM or Chevrolet) and Smith; and (Ford or Mercury) and Thompson. This procedure was adopted after experimentation aimed at capturing virtually all relevant

Steven Garber and John Adams 17
Table 2. Descriptive Statistics for Sales Outcome Variables
Variable Mean Standard deviation Minimum Maximum
RASLCT -0.0225 0.233 -1.25 0.501 RASLEX -0.00899 0.339 -2.01 0.732
Source: Authors' calculations. The sample includes 61 plaintiff verdicts in cases involving makes and models for which new-vehicle unit sales could be forecast for the month following the verdict. RASLCT and RASLEX are forecast errors- which are interpreted as estimates of effects of verdicts-relative to actual sales based on two alternative methods of forecasting.
The publicity variables for the sales effect analysis are measures of coverage within this eight-day period. Because the stock price analysis examines effects within two trading days of the verdicts, the publicity measures used in that analysis incorporate only those articles published within this time period.37
Estimates and Interpretation
We begin by reporting and interpreting average values of the sales and stock price outcome measures. We then turn to analyses of their cross-verdict variation.
Average Values of Outcome Variables
Average sales effects. Table 2 reports descriptive statistics for RASLCT and RASLEX. These data provide at most a hint that verdicts against manufacturers typically depress sales of the vehicle model in- volved in the trial during the month immediately following the verdict. In particular, the means of RASLCT and RASLEX suggest that, on
average, unit sales or new vehicles may be depressed by 1 to 2 percent, but these means are dwarfed by the sample standard deviations of the measures.
Average stock market responses. Table 3 reports descriptive statistics for various measures of abnormal stock returns for both the plaintiff- and defendant-verdict samples. These data provide absolutely no sup- port for either the hypothesis that plaintiff verdicts typically depress
articles without also capturing excessive numbers of irrelevant ones (which are costly to collect and examine).
37. The discrepancies are minor because almost all relevant articles appear within two days of each verdict.

18 Brookings Papers: Microeconomics 1998
Table 3. Descriptive Statistics for Abnormal Returns, Three-Event Windows
Standard Variable Mean deviation Minium Maximum
Plaintiff verdicts (N = 64) Proportionate returns
CAR 0.00104 0.0203 -0.0656 0.0521 CAR3 0.00195 0.0215 -0.0481 0.0381 CAR4 0.00617 0.0243 -0.0509 0.0487
Dollar returns (millions of 1996 dollars) CAVAL 25.4 558 -1,643 1,711 CAVAL3 28.6 630 -1,814 1,369 CAVAL4 147.4 710 -1,816 1,777
Defendant verdicts (N = 116) Proportionate returns
CAR -0.00225 0.0228 -0.0934 0.0719 CAR3 -0.00112 0.0259 -0.0774 0.0900 CAR4 -0.000115 0.0299 -0.0663 0.0931
Dollar returns (millions of 1996 dollars) CAVAL -47.5 541 -1,936 1,834 CAVAL3 -50.0 647 -2,575 1,671 CAVAL4 -50.9 756 -2,207 2,360
Source: Authors' calculations. The samples include 64 verdicts holding U.S. manufacturers liable ("plaintiff verdicts") and 116 verdicts in which U.S. manufacturers were not found liable ("defendant verdicts"). CAR, CAR3, and CAR4 are estimated abnormal returns during two-, three-, and four-trading-day periods beginning with the first day that could be affected by the verdict announcement. CAVAL, CAVAL3, and CAVAL4 are the market capitalization of the defendant company at the end of the month preceding the verdict multiplied by CAR, CAR3, and CAR4, respectively, and are estimates of the real abnormal dollar returns associated with the verdicts over the three time intervals.
stock prices or the hypothesis that defendant verdicts typically increase them. The average values of CAR and CAVAL, which measure abnormal returns during the first two trading days that could be affected by the verdict, are in fact opposite in sign from what would be expected under these hypotheses. These means are, however, very small and are dwarfed by the sample standard deviations. To consider the possibility that investors react a bit slowly, table 3 also reports descriptive statistics for analogs to CAR and CAVAL computed over longer event windows. In particular, CAR3 and CAR4 are cumulative abnormal returns com- puted through the third and fourth trading days, respectively. CAVAL3 and CAVAL4 are defined analogously in terms of abnormal dollar re- turns. Extending the event windows by an extra day or two does nothing to change the basic conclusion.
Summary. On average, then, we find at most very weak evidence that verdicts against manufacturers typically depress sales and no evi-

Steven Garber and John Adams 19
dence that verdicts for or against manufacturers typically affect stock prices. We proceed to investigate the cross-verdict variation in the outcome measures for plaintiff verdicts. Appendix table A-3 reports descriptive statistics for independent variables used in the regression analyses.
Vehicle Sales Regressions
The mean values of the proportionate sales forecast errors provide almost no evidence that product markets generally react negatively to product liability verdicts against motor vehicle manufacturers. This may be because consumers do not use verdicts to update their beliefs about the relative safety of vehicles or because verdict-driven changes in beliefs are rarely sufficient to alter purchase decisions.38 Alterna- tively, verdicts may have major effects on sales in some unusual cases. For example, as might be inferred from case studies, consumers may react to verdicts that are extreme in their safety implications, are highly publicized, or both. We use regression analysis to examine such possibilities.
Table 4 reports estimates using RASLCT, which is based on our most accurate sales forecasting method, as the dependent variable. A weighted least-squares procedure was used to account for heteroske- dasticity attributable to the greatly varying precision with which model sales are forecast.39 The estimates in the first column of table 4 relate the relative forecast errors to DREAD, RLTRCL, and OTHRCL, three variables intended to control for potential effects of verdicts on con- sumers' beliefs about the safety of the vehicles involved in the trials.
38. One factor would be the importance of brand loyalty in automobile purchase decisions (Mannering and Winston, 1991).
39. The variances of CTPREDj for different verdicts were estimated from the forecast errors of one-month ahead forecasts for the ten months before the verdict month. The squared OLS residuals for the specifications in table 4 were regressed on the estimated variances of RASLCT; the coefficients in these regressions were statistically significant (with t-ratios on the order of 3 to 4), indicating heteroskedasticity of the maintained form. The predicted values from these regressions were then used to form the weights used to compute the estimates reported in table 4. See Judge and others (1985, pp. 434- 36) for a discussion of this estimator and some asymptotically equivalent alternatives. The previous version of this paper, Garber and Adams (1998), presents OLS estimates corresponding to the GLS estimates reported in table 4 and the analogous specifications with RASLEX as the dependent variable. The substantive implications of these estimates are similar to those discussed here.

20 Brookings Papers: Microeconomics 1998
Table 4. Estimated Sales Effects (RASLCT) Regressed on Indirect Cost and Publicity Factors (GLS)
Coefficients (t-ratios)
Independent variable 1 2 3
Constant 0.00116 0.000568 - 0.0126 (0.06) (0.02) (-0.42)
DREAD 0.0173 0.00753 -0.000939 (0.88) (0.24) (-0.03)
RLTRCL -0.0124 0.0253 0.0554 (-0.70) (0.81) (1.35)
OTHRCL -0.0124 -0.00957 -0.00217 (-1.66) (-0.91) (-0.17)
PUNIND . . . -0.0235 -0.0175 (-0.58) (-0.39)
CRALL . .. 0.00480 0.184 (0.07) (0.29)
Interactions CRALL*DREAD ... ... -0.0634
(-0.10) CRALL*RLRCL ... ... -0.0838
(-0.54)
CRALL*OTHRCL ... -0.0911 (-0.69)
R 2 0.04 0.03 0.06 N 61 61 61
Source: Authors' calculations. The sample include 61 plaintiff verdicts in cases involving makes and models for which new-vehicle sales could be forecast. The dependent variable is RASLCT, a sales forecast error relative to actual sales in the month after the verdict. Estimates are generalized (weighted) least-squares estimates allowing for heteroskedastic errors due to varying degrees of precision in forecasting sales for different observations. DREAD = I indicates that the accident involved in the verdict caused at least one fatality, case of paralysis, or serious burns. RLTRCL = I indicates that vehicles of the same make, model, and model year as the vehicle alleged defective in the trial had been previously recalled for a similar defect. OTHRCL counts the number of other safety recalls of vehicles of the same make, model, and model year prior to the verdict date. PUNIND = I indicates that the verdict included punitive damages. CRALL measures the extent of newspaper coverage of the verdict (with papers weighted by circulation). See text for explanation of coefficients.
The next column adds to the specification the variable indicating a punitive component to the award (PUNIND) and a variable measuring the extent of newspaper coverage of the verdict (CRALL). The last column of table 4 introduces interactions of CRALL with DREAD, RLTRCL, and OTHRCL.
Estimates of the coefficients of DREAD and RLTRCL are, contrary to expectation, each positive in two of three cases. Taken together the estimates suggest that neither factor is relevant to predicting the sales response (if any) to verdicts against manufacturers. The estimated coef-

Steven Garber and John Adams 21
ficients of OTHRCL are all negative, as hypothesized, and suggest perhaps a 1 percent decrease in sales for every additional recall. The hypothesis concerning punitive damages is that when a jury believes a manufacturer deserves to be punished, this leads to a product-market backlash. The estimated coefficients for PUNIND, although not statis- tically significant, suggest a decrease of perhaps 2 percent of sales.40 The estimated coefficients of CRALL are opposite the sign expected. The negative coefficients of the interaction variables are of the expected sign, but in view of the estimated coefficient of CRALL of 0. 18, are large enough to imply a negative marginal effect of publicity for only some combinations of values for DREAD, RLTRCL, and OTHRCL.
In sum, the estimates in table 4 provide very little indication of widespread, systematic product market reactions to verdicts against automobile manufacturers.4 There is some indication that punitive ver- dicts and previous safety recalls may contribute to sales declines after verdicts. There is little if any evidence, however, that particularly dreadful injuries or the extent of newspaper coverage plays a role.
Stock Market Regressions
In principle, stock markets should react to verdicts because verdicts cannot be entirely anticipated, direct liability costs undoubtedly exist, the stakes can be substantial, and investors are generally believed to learn quickly about relevant developments. The analysis of abnormal returns averaged over verdicts, however, suggests that the stock market does not usually respond negatively to verdicts against manufacturers. We analyze the cross-verdict variation in CAVAL to investigate.42
First, consider the relationship between CAVAL and two features of
40. OLS estimates for RASLCT and RASLEX reported in Garber and Adams (1998), however, contradict the inference that assessment of punitive damages depresses sales.
41. Because we have focused on unit sales, however, our estimates are uninforma- tive about the possibility that substantial demand effects exist but are accommodated largely by decreases in prices.
42. In principle, the error terms in the CAVAL equations are heteroskedastic because of varying degrees of precision in predicting normal stock returns for the different verdicts. OLS estimation is used to analyze stock returns, however, because regressions of squared OLS residuals on measures of the forecast variances from the estimated stock return equations did not indicate a statistically significant relationship. In addition, weighted least-squares estimates were computed for the specifications in table 5, and these estimates were very similar to the OLS estimates.

22 Brookings Papers: Microeconomics 1998
the verdict most relevant to direct costs: the size of the award (TOT- DOL) and the variable indicating whether the company had previously disclosed several pending cases similar to the one leading to the verdict (PIOK). A priori considerations suggest that CAVAL might be reason- ably modeled as a cubic function of TOTDOL.43
The first column of table 5 reports the results of regressing CAVAL on a constant, PI OK, TOTDOL, and its square and cube (TOTSQR and TOTCUB). Qualitatively, the results for the polynomial in TOTDOL conform to expectations. In addition, the coefficient of P10K suggests that holding the size of an award constant, abnormal dollar losses (that is, minus CAVAL) are almost a quarter of a billion dollars larger if a verdict involves a type of case that investors had been previously warned about.
Figure 1 summarizes these results by plotting predicted values of stock market losses against the award size, assuming alternatively that PI OK = 0 and PI OK = 1. Note that in an intermediate range of award sizes-from roughly $25 million to $75 million-the functions are steep, with slopes of about 20. Interpreted at face value this would suggest that within this range investors anticipate an extra $20 million of (discounted) future costs for every extra $1 million in awards. Fi- nally, the curves do flatten out as award size increases further and turn sharply downward at award sizes of about $100 million. (There are two sample verdicts in excess of $100 million.)
The second column of table 5 reports results adding PUNIND to the equation. The estimates of the other coefficients are largely insensitive to this change in specification. The estimated coefficient of PUNIND (383) suggests, however, that stock market losses are lower by more than a third of a billion dollars if part of the award is punitive. Although it is possible to rationalize a positive coefficient for PUNIND when the total award size is held constant, it seems implausible that the stock market reacts to the tune of several hundred million dollars.44
To probe this anomaly, the third column of table 5 decomposes the
43. This is because investors may not react to verdicts involving relatively small awards, stock market losses might increase somewhat rapidly with increasing awards within an intermediate range, and the function might tend to flatten out for exceptionally large awards because such awards (which are often primarily punitive) are often over- turned or reduced by trial judges or by appeals courts.
44. For example, it appears that punitive trial awards are more often reduced or overturned.

Steven Garber and John Adams 23
Table 5. Abnormal Dollar Returns (CAVAL) Regressed on Direct Cost Variables
Coefficients (t-ratios)
Independent variable 1 2 3
Constant 66.6 97.0 123 (0.66) (0.97) (0.97)
TOTDOL 13.8 1.99 (1.05) (0.14)
TOTSQR -0.694 -0.578 (-2.30) (-1.90)
TOTCUB 0.00424 0.00387 ... (2.71) (2.49)
COMPDOL ... ... -0.702 (-0.02)
COMPSQR ... ... -1.20 (-0.46)
COMPCUB ... ... 0.0423 (1.06)
PUNDOL ... ... 29.4 (1.26)
PUNSQR ... ... -1.72 (-2.29)
PUNCUB ... ... 0.0126 (2.43)
P1OK -242 -313 -223 (-1.30) (-1.67) (-1.10)
PUNIND ... 383 (1.72)
R 2 0.24 0.28 0.28 N 64 64 64
Source: Authors' calculations. The sample includes 64 verdicts holding U.S. manufacturers liable. The dependent variable is CAVAL, the abnormal dollar return (in millions of 1996 dollars) within two trading days of the verdict announcement. Estimates are computed by ordinary least squares. TOTDOL is the size of the total award; TOTSQR and TOTCUB are the square and cube of TOTDOL. COMPDOL is the size of the compensatory award; COMPSQR and COMPCUB are the square and cube of COMPDOL. PUNDOL is the size of the punitive award, if any; PUNSQR and PUNCUB are the square and cube of PUNDOL. P10K = I if prior to the verdict the company had disclosed to investors pending litigation of the type involved in the trial. PUNIND = I indicates that the verdict included punitive damages.
total award into its compensatory (COMPDOL) and punitive (PUN- DOL) components and estimates cubic functions of each separately. The estimated coefficient of PIOK is virtually identical to those for the other two specifications. The results for the dollar amounts are, how- ever, baffling. In particular, when the estimates are plotted they suggest entirely implausible patterns.
To consider the potential role of indirect costs and newspaper pub-

24 Brookings Papers: Microeconomics 1998
Figure 1. Predicted Stock Market Losses versus Total Award (64 verdicts)
Loss (millions of 1996 dollars) 1,600
1,400 -
1,200-
1,000 - With prior 1OK warning ,'
800
600 ,No prior 10K waning
400 -
200 -
0
-200 l l l l l l l l l l l l 5 10 20 30 40 50 60 70 80 90 100 110 120 130
Total award (millions of 1996 dollars)
Source: Authors' calculations.
licity, in table 6 we control for size of the total award using a cubic function and add variables to the specification in the second column of table 5. First, a look across the columns of table 6 reveals that the estimated coefficients of the total award variables are similar to those in table 5 and are somewhat insensitive to the additions of the indirect cost and publicity variables. The estimated coefficients of P10K and PUNIND are even larger absolutely than in the previous table.
In the first column of table 6, results are reported from adding four variables intended to capture potential effects on vehicle sales: DREAD, RLTRCL, OTHRCL, and MDLSLS.4s The coefficient of DREAD sug- gests that stock market losses after a verdict are $125 million larger if the case involves death, paralysis, or serious burns. The coefficients of the recall variables are positive (contrary to expectation) and are rela-
45. The variable MDLSLS is introduced to control for the quantity of sales poten- tially at stake, which was implicitly controlled in the sales effects analyses by the scaling of the dependent variables. In addition, MDLSLS may capture potential costs of liability- driven changes in vehicle design or production methods.

Steven Garber and John Adams 25
Table 6. Abnormal Dollar Returns (CAVAL) Regressed on Direct Cost, Indirect Cost, and Publicity Variables
Coefficients (t-ratios)
Independent variable 1 2 3
Constant 103 108 209 (0.77) (0.79) (1.45)
TOTDOL 3.32 4.32 12.9 (0.21) (0.26) (0.66)
TOTSQR -0.592 -0.570 -0.866 (-1.84) (-1.64) (-1.63)
TOTCUB 0.00394 0.00382 0.00536 (2.42) (2.20) (1.86)
P1OK -392 -387 -349 (- 1.69) (- 1.64) (- 1.45)
PUNIND 430 441 463 (1.78) (1.80) (1.87)
DREAD -124 -125 -174 (-0.89) (-0.88) (- 1.13)
RLTRCL 38.3 30.0 -68.3 (0.22) (0.17) (-0.37)
OTHRCL 40.5 36.7 26.3 (1.09) (0.96) (0.69)
MDLSLS -0.000127 -0.000146 -0.000632 (-0.29) (-0.33) (- 1.21)
WSJAR ... -389 -304 (-0.92) (-0.72)
CRCOTH ... 208 -2475 (0.23) (-1.53)
Interactions CRALL*MDLSLS ... ... 0.00924
(1.40) CRALL*DREAD ... ... 634
(0.38) CRALL*RLTRCL ... ... 1679
(1.09) R 2 0.30 0.32 0.38 N 64 64 64
Source: Authors' calculations. The sample includes 64 verdicts holding U.S. manufacturers liable. The dependent variable is CAVAL, the abnormal dollar return (in millions of 1996 dollars) within two trading days of the verdict announcement. Estimates are computed by ordinary least squares. TOTDOL is the size of the total award; TOTSQR and TOTCUB are the square and cube of TOTDOL. P10K = 1 if prior to the verdict the company had disclosed to investors pending litigation of the type involved in the trial. PUNIND = I indicates that the verdict included punitive damages. DREAD = I indicates that the accident involved in the verdict caused at least one fatality, case of paralysis, or serious burns. RLTRCL = I indicates that vehicles of the same make, model, and model year as the vehicle alleged defective in the trial had been previously recalled for a similar defect. OTHRCL counts the number of other safety recalls of vehicles of the same make, model, and model year prior to the verdict dare. MDLSLS is the number of units sold in the year prior to the verdict of the vehicle model involved in the trial. WSJAR = I indicates that the verdict was reported in the Wall Street Journal. CRCOTH measures the extent of newspaper coverage (with papers weighted by circulation) in other newspapers. CRALL measures the extent of newspaper coverage of the verdict in all newspapers searched, including the Wall Street Journal.

26 Brookings Papers: Microeconomics 1998
tively small. If interpreted at face value, despite the small t-ratio, the coefficient of MDLSLS suggests extra stock market losses of about $125 for each vehicle sold during the previous calendar year of the model involved in the trial. In sum, the estimates provide only a few hints that investors anticipate negative effects of verdicts on vehicle demand.
The second column of the table adds two variables measuring news- paper coverage of the verdict during the two-trading-day event window. Here the Wall Street Journal and the other newspapers are considered separately because the editors of the Journal may be better able than other editors to judge what verdicts are of importance to investors or because Wall Street Journal reports may actually affect the market. In fact, the coefficient of WSJAR suggests that losses are almost $400 million larger when a verdict is reported in the Journal. (There are only five such verdicts in the sample.) The coefficient of CRCOTH suggests, however, that losses would be $200 million lower if a verdict were reported in all other newspapers that were included in our newspaper searches.
One would expect that negative product demand effects-if they exist-would be larger if a verdict receives more publicity. Stock mar- ket responses should reflect this if, in addition, investors observe or are able to anticipate the amount of such publicity. The third column of table 6 examines this possibility by adding interactions of a publicity measure with the three indirect cost variables that seemed most impor-
46d tant a priori. If verdicts do affect vehicle demand, and investors expect the factors captured by DREAD, RLTRCL, and MDLSLS to play a role in proportion to the amount of newspaper publicity, we would expect negative coefficients on each interaction variable. The coefficients of DREAD, RLTRCL, MDLSLS, and CRCOTH decrease substantially when the interactions are added, but clearly the three positive coeffi- cients on the interactions themselves provide no support for the notion that demand effects, if any, are larger when verdicts are publicized more extensively.
The anomalous estimates reported in tables 5 and 6 for PUNIND and in table 5 for the compensatory and punitive components of total awards
46. A single publicity measure is used for the sake of parsimony, and we use CRALL (the weighted average of WSJAR and CRCOTH) because we see little reason to expect any role of WSJ reports on vehicle demand to be disproportionate to its share of total circulation.

Steven Garber and John Adams 27
Figure 2. Observed Abnormal Dollar Losses versus Total Award
Abnormal dollars loss (millions of 1996 dollars) 2,000
1,500
1,000 0
* * a
500
0$" .0 I 0
-500 *%
-1,000 .
-1,500 S
-2,000 l l l l 0 20 40 60 80 100 120 140 160
Total award (millions of 1996 dollars) Source: Authors' calculations.
suggest a closer look. A scatter plot of the data for minus CAVAL and TOTDOL is very revealing (figure 2). In particular, it suggests that the cubic shape illustrated in figure 1 is due almost entirely to the four sample observations with total awards greater than $50 million. The largest award is associated with a moderately large stock market gain and the next three largest awards are associated with large stock market losses. This raises the question: Which estimates in tables 5 and 6 are robust to deleting the observations corresponding to unusually large awards ?47
The scatter diagram in figure 2 suggests that stock market reactions may be essentially random for the predominant number of verdicts less
47. Readers will likely disagree about the information content of these "outliers," but we think it useful to reexamine the data for only those verdicts of more typical sizes. Besides providing more information about patterns in the data, this exercise speaks directly to a key motivation for the present study, namely probing whether case studies or journalistic accounts focusing on atypical litigation histories are revealing about effects of more typical liability episodes.

28 Brookings Papers: Microeconomics 1998
than $30 million. But perhaps their variation is explicable by a com- bination of award amounts and other variables.
Table 7 presents regression results for the fifty-nine verdicts with awards less than $30 million.48 The specifications in the table corre- spond to those of table 6. Looking across the columns of table 7 reveals that for all specifications the estimated effects of dollar amounts within the sample with awards less than $30 million are largely robust but very implausible.49 A sensible interpretation is that there is no systematic stock market reaction to increasing award amounts in the range of most awards.
Although the fits reported in table 7 are much worse than their coun- terparts in table 6, the estimated coefficients for some key variables are similar across the tables. In particular, the existence of 10K warnings and dreadful injuries continue to predict large stock market losses, while (again, very curiously) the existence of a punitive component to an award predicts the opposite.50
Summary Interpretation of Estimates
We have analyzed effects of a sample of automotive product liability verdicts on two outcomes of major interest to automobile manufactur- ers: sales of new vehicles and stock prices. Although a priori consid- erations led us to view such effects as plausible-especially for stock prices-we find very little evidence of them.5' How surprising are these results? How broad are their implications?
48. Garber and Adams (1998) report estimates for other specifications for the sample of fifty-nine verdicts, including specifications involving linear functions of the sizes of the compensatory and punitive awards separately.
49. In particular, when plotted, the cubic functions suggest negative market reactions to increasing awards up to about $15 million but sharply positive reactions to increasing awards from $15 million up to $30 million. Moreover, in specifications reported in Garber and Adams (1998) the coefficients of COMPDOL and PUNDOL are all positive, suggesting that the stock market reacts more favorably to larger awards.
50. The results for the publicity variables and their interactions are quite different across the two tables. For neither set of verdicts, however, are the estimates generally supportive of the hypothesis that more publicized verdicts involve larger losses or that more publicity tends to magnify effects of variables expected to control for effects of verdicts on consumers' views about the safety of individual vehicle models.
51. Such effects may exist, of course, despite our inability to detect them. Among factors contributing to the difficulty of detecting such effects-even if they exist-are that product liability events are unlikely to be primary determinants of automotive product demand or stock prices and that we lacked large numbers of verdicts to analyze.

Steven Garber and John Adams 29
Table 7. Abnormal Dollar Returns Regressed on Direct Cost, Indirect Cost, and Publicity Variables Deleting Five Largest Awards
Coefficients (t-ratios)
Independent variable 1 2 3
Constant 73.8 138 223 (0.46) (0.76) (1.13)
TOTDOL 21.6 22.7 5.63 (0.29) (0.28) (0.07)
TOTSQR -2.90 -3.84 -2.30 (-0.39) (-0.49) (-0.28)
TOTCUB 0.0928 0.121 0.0842 (0.48) (0.60) (0.39)
P1OK -288 -483 -433 (-1.38) (-1.89) (-1.59)
PUNIND ... 420 473 (1.72) (1.82)
DREAD ... -157 -118 (- 1.07) (-0.70)
RLTRCL ... 39.8 31.1 (0.21) (0.14)
OTHRCL ... 37.6 23.8 (0.99) (0.59)
MDLSLS .. . -.000345 -.000681 (-0.73) (- 1.20)
WSJAR . . . . . . 132 (0. 19)
CRCOTH ... ... -322 (-0.11)
Interactions CRALL*MDLSLS ... ... 0.0110
(1.49) CRALL*DREAD ... ... -2466
(-0.65) CRALL*RLTRCL ... ... - 1345
(-0.36) R 2 0.04 0.13 0.18 N 59 59 59
Source: Authors' calculations. The sample includes 59 verdicts holding U.S. manufacturers liable with total awards less than $30 million (in 1996 dollars). The dependent variable is CAVAL, the abnormal dollar return within two trading days of the verdict announcement. Estimates are computed by ordinary least squares. TOTDOL is the size of the total award; TOTSQR and TOTCUB are the square and cube of TOTDOL. P10K = I if prior to the verdict the company had disclosed to investors pending litigation of the type involved in the trial. PUNIND = I indicates that the verdict included punitive damages. DREAD = 1 indicates that the accident involved in the verdict caused at least one fatality, case of paralysis, or serious burns. RLTRCL = 1 indicates that vehicles of the same make, model, and model year as the vehicle alleged defective in the trial had been previously recalled for a similar defect. OTHRCL counts the number of other safety recalls of vehicles of the same make, model, and model year prior to the verdict dare. MDLSLS is the number of units sold in the year prior to the verdict of the vehicle model involved in the trial. WSJAR = I indicates that the verdict was reported in the Wall Street Journal. CRCOTH measures the extent of newspaper coverage (with papers weighted by circulation) in other newspapers. CRALL measures the extent of newspaper coverage of the verdict in all newspapers searched, including the Wall Street Journal.

30 Brookings Papers: Microeconomics 1998
The lack of detectable sales effects of verdicts against manufacturers is not hard to rationalize. Our findings are consistent with various plausible conjectures, including the following three.52 Consumers do not typically become informed about verdicts, and when they do learn of a verdict, they typically do not think it conveys much new informa- tion about the safety of the allegedly defective vehicle. In addition, cases for which trials could raise particularly serious safety concerns among consumers are rarely tried because of the settlement strategies of manufacturers. Finally, detectable sales effects would require sub- stantial changes in consumer views about safety because of relatively strong consumer loyalty to particular vehicle brands.
The lack of detectable effects of our samples of verdicts, either for or against manufacturers, on stock prices suggests that verdicts have at most minor effects on company values relative to other events affecting stock prices on a typical trading day. For example, verdicts in cases when there are not several similar cases pending may carry little news because the stakes in a single case are relatively low, investors are relatively good at predicting trial outcomes before verdicts are an- nounced, or both.53 The stakes in single cases may tend to be low because verdicts do not typically have important effects on vehicle sales, manufacturers try harder to settle cases when trial losses are likely and could have costly implications for future litigation, or both. Finally, even for the purpose of predicting direct liability costs for the lawsuit at hand, investors may ascribe relatively little import to verdict an- nouncements because of the uncertainty that remains due to the possi- bility of post-trial events such as successful appeals.
Before concluding, we discuss some issues that our results do not inform. First, our samples are dominated by individual awards of sizes that are not large relative to the values of the defendants; results aver- aged over our samples may mask large effects in a subset of instances. Second, our samples are dominated by cases that are not likely to affect exceptionally large numbers of related cases. In industries such as phar- maceuticals and chemicals, verdicts in individual cases that are part of
52. It is also possible that demand effects exist but take longer than a month or two to occur. This possibility was not explored because attempts to forecast sales more than one month ahead were judged too noisy to be adequate for this purpose.
53. In view of our finding that verdicts in favor of manufacturers do not tend to increase stock prices, the story cannot be as simple as "investors expect to lose."

Steven Garber and John Adams 31
a mass tort involving thousands or even hundreds of thousands of sim- ilar cases may have profound effects on company sales and stock values. Third, our results do not speak to effects of product liability events other than verdicts-lawsuit filings, settlements, or publicity about a set of related cases-even in the automobile industry. The accumulation of costs of numerous events within and across automotive cases, while very difficult to estimate, may be substantial, even relative to the size of automobile manufacturers.54 Finally, our results are not informative about the effects of automobile safety regulation, litigation of types other than product liability, or other safety-related events.55
Economic Effects of Product Liability in the Automobile Industry
The motivation for our work is to contribute to an understanding of how product liability affects business decisions and economic effi- ciency. The empirical basis for drawing conclusions is still very thin. We conclude by offering some conjectures.
Let us suppose that our estimates are informative. In particular, suppose that-apart from exceptional instances such as unusually large
54. Sullivan (1990) examines effects of concerns about "sudden acceleration" in Audi 5000S, but not individual verdicts or other liability events, on prices of used vehicles and concludes that such effects are substantial. Viscusi and Hersch (1990) examine stock price reactions to events other than trial verdicts associated with diverse types of safety-related litigation. Twenty-one of the events are related to private product liability cases, and several are lawsuit filings or court rulings related to a mass tort, such as litigation involving Agent Orange, DES, and the Dalkon Shield. The only two events involving automobile manufacturers are filings of class action suits alleging property damage (not personal injury).
55. There is a substantial literature-see citations in note 2-on effects of automo- bile safety recalls on stock prices, new vehicle sales, and used vehicle prices; many of these studies conclude that effects are significant.
Litigation not involving product liability would include, for example, Federal Trade Commission actions alleging false advertising (Peltzman, 1981), suits related to product safety brought by government agencies (Viscusi and Hersch, 1990), private suits and civil and criminal government actions alleging corporate fraud (Karpoff and Lott, 1993), and private antitrust litigation (Bizjak and Coles, 1995).
As to other safety-related events, there are, for example, studies of effects of airplane crashes on stock prices, demand, or both. See Chalk (1987); Borenstein and Zimmerman (1988); Mitchell and Maloney (1989); Barnett, Menighetti, and Prete (1992); and Neth- ercutt and Pruitt (1997).

32 Brookings Papers: Microeconomics 1998
verdicts or verdicts in cases of a type that investors have been warned are pending in large numbers-demand effects of automotive product liability verdicts are not substantial and stock prices do not typically react to such verdicts.56 The implications for economic effects of prod- uct liability depend on what automobile company decisionmakers be- lieve about these issues. Their beliefs may or may not accurately reflect industry experience.
Do Company Decisions Reflect Well-Calibrated Expected Liability Costs?
Formal economic models of responses to product liability typically assume that firms are risk neutral.57 Thus potential product liability costs affect decisions according to their mathematical expectations. Literature in psychology and management suggests, however, that com- pany decisions may be influenced to a surprising extent by rare, extreme cases. Two considerations underlie this claim.
First, the "availability heuristic" of the behavioral psychology lit- erature suggests that decisionmakers may significantly overestimate the past frequency of liability events or episodes that are highly publicized, often recounted, and unusually vexing to company decisionmakers.58 Examples include unusually large awards, punitive damage awards, and liability when injury causation is doubtful.59 If so, the decisionmakers are likely to greatly overestimate the likelihood of similar occurrences in the future.
Second, interviews with executives reported in management studies suggest that risk is often perceived by company decisionmakers in terms
56. Of course, stock prices may accurately reflect product liability costs even if particular liability events such as verdicts do not result in detectable, immediate re- sponses.
57. For overviews, see Shavell (1987); Cooter and Ulen (1988); or Cooter (1991). 58. "People using this heuristic judge an event to be likely or frequent if instances
of it are easy to imagine or recall" (Slovic, Fischhoff, and Lichtenstein, 1987, p. 19). 59. American Law Institute (1991, p. 235) refers to "the somewhat distorted per-
ception one gets from reading about only the largest and most questionable punitive awards." Daniels and Martin (1990) and Rustad (1991) also argue that misconceptions about punitive damages are widespread. Cecil, Hans, and Wiggins (1991, p. 743) comment: "Often repeated 'horror stories' about jury verdicts, many of which are unconfirmed or erroneous, encourage a misleading impression of the performance of the civil jury." Finally, Viscusi (1991, p. 1) says, "Seemingly outrageous cases have come to epitomize the malfunctioning of the tort liability system."

Steven Garber and John Adams 33
of worst-case scenarios and that executives are willing to go to great lengths to avoid even a very small probability of an extremely bad outcome.60 Interpreted formally, and in liability terms, executives may act as if they weigh the potential for extreme liability costs much more heavily than they would in calculating expected liability costs.
Thus company decisions may be surprisingly responsive to liability exposure because of overestimation of the probabilities of future ex- treme outcomes and because of overreaction, relative to behavior that maximizes expected profits, to extreme liability costs, given the sub- jective probabilities assigned to them.6' In sum, although our estimates suggest that past product liability costs are less than might be inferred from case studies that focus on unusually costly episodes, the kinds of events documented in the case studies may be disproportionately influ- ential in determining manufacturer responses to product liability exposure.
What Does Product Liability Really Deter?
Much of the theoretical literature on effects on manufacturer behav- ior is normative, exploring how a liability system could in principle achieve efficient levels of product safety.62 Considering the mechanisms by which behavior is affected is also instructive for our positive purposes.
In theoretical studies, product liability is often assumed to operate as either a "negligence" or "strict liability" system. Under a negli- gence system a manufacturer is held liable to pay damages to an injured product user only if the injury results from failure of the manufacturer to make the product as safe as required by a legal standard. Under a strict liability system a manufacturer is held liable for all injuries re- sulting from use of its products.
The U.S. product liability system contains elements of both strict liability and negligence. Generally liability for injuries due to manu-
60. On management interviews see, for example, March and Shapira (1987). 61. The latter suggestion may appear to conflict with the view that firms should be
viewed as risk neutral because investors can diversify risk across companies. We inter- pret the risk neutrality claim as normative and our claim as a positive one, referring to behavior by individual company decisionmakers who are risk averse, perceive personal risks when they make decisions, and are imperfectly controlled by stockholders.
62. See Shavell (1987); Cooter and Ulen (1988); or Cooter (1991).

34 Brookings Papers: Microeconomics 1998
facturing defects-units of a product that are not made to a manufac- turer's specifications-is strict. Liability for defective product design and labeling (or warning) is based on negligence principles.
Under ideal conditions, economic efficiency can be achieved with either type of liability rule. For negligence, suppose the legal standards for avoiding liability correspond to efficient levels of care, and that manufacturers know that the standards will be faithfully applied in court. Manufacturers will then choose to comply with the standards, that is, they will behave efficiently, if the direct plus indirect costs of noncompliance are sufficiently large. As in the theory of Pigouvian pollution taxes, a strict liability system will achieve efficiency if it makes product manufacturers bear precisely, as direct and indirect costs to them, the social costs of injuries.
The theoretical literature has also explored how standard liability rules can result in inefficiency in the presence of various departures from ideal conditions.63 And, in fact, much commentary (and some empirical evidence) by economists and others suggests that the U.S. product liability system fails to promote even approximately efficient outcomes. Among the reasons are that firms also have market and regulatory incentives to make products safer, costs of defending suits can be very large even when liability is not appropriate under the law, and negligence standards as applied are unpredictable and even on average may not correspond to efficient behavior. In addition, when liability is strict, it would be only by coincidence that the sum of expected direct and indirect liability costs were to approximate the level necessary to induce efficient responses. And finally, companies may overestimate liability exposure and overreact to worst-case scenarios.
Elsewhere, Steven Garber argues that when the potential for very large product liability costs is perceived by company decisionmakers,
63. For example, Epple and Raviv (1978) analyze imperfections in product and insurance markets and imperfect information of consumers about product characteristics. Polinsky (1980) considers long-run effects of liability on numbers of firms, market power, and product price. Polinsky and Rogerson (1983) analyze effects of market power of product sellers in the presence of underestimation of product hazards by consumers. Shavell (1984) analyzes uncertainty about whether injured parties will bring suit and the possibility that injurers will not have sufficient resources to pay judgments. Craswell and Calfee (1986) analyze uncertainty about the legal standards that will be applied in determining liability. Kolstad, Ulen, and Johnson (1990) analyze optimal use of liability in the presence of safety regulation and uncertainty about legal standards.

Steven Garber and John Adams 35
one should expect a mixture of efficient and inefficient company re- sponses.64 The basic problem, it appears, is that in many instances company decisionmakers-with good reason-cannot be confident that they will avoid major liability costs even if they act efficiently. One source of the lack of confidence is instances in which companies have been found liable for injuries in the absence of credible (to company decisionmakers) scientific evidence of accident or injury causation.65 Another is the considerable risk of punitive damages being assessed for cost-benefit balancing when risks to life and limb are involved, despite the fact that cost-benefit balancing is necessary for achieving economic efficiency .66
In sum, product liability in the real world appears to be a very imprecise policy instrument. Rather than selectively deterring socially undesirable behavior, the product liability system, especially as it is perceived by manufacturers, seems to swat at a broad variety of man- ufacturer behavior using something more akin to a lawn rake than a hammer, let alone a scalpel.
Would Reduced Liability Exposure Improve Automobile Industry Efficiency?
Broad reductions in liability exposure would tend to reduce antici- pated liability costs resulting from both efficient and inefficient manu- facturer decisions.67 Should we expect resulting changes in behavior by
64. Garber (1993, 1998). 65. A well-known example in the automobile context is controversy about "inad-
vertent vehicle movement" (Graham, 1991, pp. 137-44 ), or "sudden acceleration" (Huber, 1991, chap. 4; Center for Auto Safety, 1992), or "unintended acceleration" (Mackay, 1991, pp. 210-11).
66. It seems widely agreed that introduction of evidence of cost-benefit balancing, which is often portrayed in terms such as "trading off lives against dollars," makes assessment of punitive damages particularly likely. Schwartz (1991) discusses and ana- lyzes issues related to cost-benefit balancing in the context of Ford Pinto litigation. A potential for punitive damages can have major effects on behavior because the sizes of punitive damages are unlimited in any given instance, and (in the product liability context) they can be assessed in multiple cases for the same behavior. Moreover, com- panies can be very averse to negative publicity, and Garber and Bower (1998) estimate a very substantial effect of punitive damages on the extent of newspaper coverage of verdicts.
67. Perceptions about liability exposure could change in response to various mea- sures, including changes in legal doctrine or procedure. Some measures would tend to

36 Brookings Papers: Microeconomics 1998
automobile industry decisionmakers to be primarily efficient or ineffi- cient? That depends on the efficiency properties of the mix of automo- bile company decisions deterred by product liability.
Claims about inefficient consequences of liability in the automobile industry that invoke extensive inside knowledge of industry practices are not hard to find. For example, one long-time industry observer concludes that "liability has had a negative influence on innovation. It has held back new designs, consumed resources that might otherwise have been directed at design improvement, and added costs to the consumer. "68 A knowledgeable industry insider, a vice president for vehicle engineering at Chrysler, distinguishes three types of apparently inefficient effects of product liability on decisions by automotive en- gineers: hesitance to pursue revolutionary or radical innovation (be- cause radically different designs are hard to defend in court); disincen- tives for engineers to engage in "honest and critical evaluation of features of current and past vehicles" (for fear that internal company communications will become damaging legal evidence if interpreted out of context); and hesitance to improve vehicle designs quickly for fear that changes will be alleged-and believed-to be evidence of defects in earlier designs.69 Such claims suggest that reductions in per- ceived liability exposure have the potential to ameliorate some kinds of inefficient behavior, particularly if there are no market or regulatory incentives encouraging such behavior.
Across-the-board reductions in perceived liability exposure would also decrease perceived costs to manufacturers of accidents and injuries.
reduce perceptions of liability exposure for very broad ranges of company decisions and behavior; others would have much more selective effects. The discussion here considers changes that reduce perceptions of liability exposure across the spectrum of behavior. Many of the policy reforms currently being discussed, such as damage caps, are of that character. Garber (1993, 1998) discusses reforms aimed at improving the economic efficiency of product liability by targeting behavior more selectively.
68. Mackay (1991, p. 220). Mackay notes: "The background for this chapter, apart from published material, comes from personal contacts and knowledge of the industry for over a quarter-century" (p. 192).
69. Castaing (1994, pp. 78-79). An anecdote illustrates the points that it is percep- tions of legal risk, accurate or not, that determine behavior and that beliefs can differ substantially even between decisionmakers within a company. An automobile company attorney has reported to one of the authors on a confidential basis that a widespread concern among engineers in his company is that design improvements will be used as evidence of previous defects even though legal doctrine in most states does not allow such claims to be admitted as evidence.

Steven Garber and John Adams 37
Would inefficient decreases in safety result? That depends largely on the extent to which market incentives and National Highway Traffic Safety Administration regulation deter behavior that is inefficiently un- safe, that is, the extent to which liability-based incentives for increases in safety are redundant or excessive. People can be expected to disagree vigorously about this. But the product liability debate could benefit greatly by recognizing the fundamental importance of this issue.
Concluding Comments
Any product liability system, like any public policy, is inevitably imperfect. The wisdom of attempting to use product liability to deter inefficiently unsafe behavior depends on
-the extent of inefficiently unsafe behavior undeterred by market forces and administrative regulation,
-the scope and importance of efficient behavior that might be de- terred by product liability,
-how well the liability system will be designed and implemented, and
-the resource costs of operating the system. For many industries or products, the potential efficiency gains from product liability may be small in comparison with the resource costs and potential inefficiencies from using product liability to try to improve matters. Often the great is the enemy of the good.

38 Brookings Papers: Microeconomics 1998
Appendix
Table A-1. Distribution of Samples by Year of Verdict
Sales sample Stock price sample
Plaintiff Plaintiff Defendant Year verdicts verdicts verdicts
1985 2 3 4 1986 6 8 4 1987 2 3 8 1988 3 4 8 1989 3 3 6 1990 6 4 7
1991 5 3 8 1992 8 9 9 1993 6 3 14 1994 5 4 13 1995 5 7 26 1996 10 13 9
Total 61 64 116 Source: Authors' calculations.
Table A-2. Distribution of Samples by Defendant Manufacturer
Sales sample Stock price sample
Plaintiff Plaintiff Defendant Defendant verdicts verdicts verdicts
GM 34 41 58 Ford 7 13 46 Chrysler 3 7 9 American Motors 2 3 3 Toyota 7 0 0 Hyundai 4 0 0 Other foreign 4a 0 0 Total 61 64 116
Source: Authors' calculations. a. One each: Audi, Isuzu, Jaguar, and Suzuki.

Steven Garber and John Adams 39
Table A-3. Descriptive Statistics for Independent Variables, Plaintiff Verdicts
Stock price sample Sales sample (N = 61) (N = 64)
Standard Standard Variable Mean deviation Mean deviation
Indirect cost DREAD 0.607 0.493 0.609 0.492 RLTRCL 0.196 0.401 0.281 0.453 OTHRCL 1.39 1.59 1.59 1.77 MDLSLS a a 120,000 155,000
Direct cost TOTDOL 13.4 26.7 13.4 25.1 COMPDOL 7.80 10.8 7.13 9.06 PUNDOL 5.56 20.4 6.26 20.1 PUNIND 0.180 0.388 0.203 0.406 PIOK a a 0.156 0.366
Publicity WSJAR 0.0656 0.250 0.0781 0.270 CRCOTH 0.0928 0.186 0.0642 0.157 CRALL 0.0907 0.186 0.0653 0.163
Source: Authors' calculations. a. Not used in analysis of sales effects.

40 Brookings Papers: Microeconomics 1998
References
American Law Institute. 1991. Reporters' Study: Enterprise Responsibility for Personal Injury, vol. 2: Approaches to Legal and Institutional Change. Philadelphia.
Babcock, Charles W. Jr. 1994. "Approaches to Product Liability Risk in the U. S. Automotive Industry. " In Product Liability and Innovation: Managing Risk in an Uncertain Environment, edited by Janet R. Hunziker and Trevor 0. Jones, 82-112. Washington: National Academy Press.
Barber, Brad M., and Masako N. Darrough. 1996. "Product Reliability and Firm Value: The Experience of American and Japanese Automakers, 1973- 92." Journal of Political Economy 104 (October): 1084-99.
Barnett, Arnold, John Menighetti, and Matthew Prete. 1992. "The Market Re- sponse to the Sioux City DC- 10 Crash." Risk Analysis 12 (March): 45-52.
Bizjak, John M., and Jeffrey L. Coles. 1995. "The Effect of Private Antitrust Litigation on the Stock-Market Valuation of the Firm." American Economic Review 85 (June): 436-61.
Borenstein, Severin, and Martin B. Zimmerman. 1988. "Market Incentives for Safe Commercial Airline Operation." American Economic Review 78 (December): 913-35.
Bromiley, Philip, and Alfred Marcus. 1989. "The Deterrent to Dubious Cor- porate Behavior: Profitability, Probability and Safety Recalls." Strategic Management Journal 10 (May): 233-50.
Brown, Warren. 1986. "Consumers Steer Clear of the Audi 500OS; Sales Plum- met on Safety Allegations." Washington Post. December 28, 1986, p. KI.
Campbell, John Y., Andrew W. Lo, and A. Craig MacKinlay. 1997. The Econometrics of Financial Markets. Princeton University Press.
Castaing, Francois J. 1994. "The Effects of Product Liability on Automotive Engineering Practice." In Product Liability and Innovation: Managing Risk in an Uncertain Environment, edited by Janet R. Hunziker and Trevor 0. Jones, 77-81. Washington: National Academy Press.
Cecil, Joe S., Valerie P. Hans, and Elizabeth C. Wiggins. 1991. "Citizen Comprehension of Difficult Issues: Lessons from Civil Jury Trials." Amer- ican University Law Review 40 (Winter): 727-74.
Center for Auto Safety. 1992. "Audi 5000S Sudden Acceleration." (Collec- tion of letters, press releases, newspaper and television accounts). Washing- ton, D.C.
Chalk, Andrew J. 1987. "Market Forces and Commercial Airline Safety." Journal of Industrial Economics 36 (September): 61-81.
Cooter, Robert D. 1991. "Economic Theories of Legal Liability." Journal of Economic Perspectives 5 (Summer): 11-30.

Steven Garber and John Adams 41
Cooter, Robert, and Thomas Ulen. 1988. Law and Economics. Glenview, Ill.: Scott, Foresman.
Crafton, Steven M., George E. Hoffer, and Robert J. Reilly. 1981. "Testing the Impact of Recalls on the Demand for Automobiles." Economic Inquiry 19 (October): 694-703.
Craswell, Richard, and John E. Calfee. 1986. "Deterrence and Uncertain Legal Standards." Journal of Law, Economics, and Organization 2 (Fall): 279- 303.
Daniels, Stephen, and Joanne Martin. 1990. "Myth and Reality in Punitive Damages." Minnesota Law Review 75 (October): 1-64.
Dreyfus, Mark K., and W. Kip Viscusi. 1995. "Rates of Time Preference and Consumer Valuations of Automobile Safety and Fuel Efficiency." Journal of Law and Economics 38 (April): 79-105.
Epple, Dennis, and Artur Raviv. 1978. "Product Safety: Liability Rules, Mar- ket Structure, and Imperfect Information." American Economic Review 68 (March): 80-95.
Garber, Steven. 1993. Product Liability and the Economics of Pharmaceuticals and Medical Devices. R-4285-ICJ. Santa Monica, Calif.: RAND.
. 1998. "Product Liability, Punitive Damages, Business Decisions and Economic Outcomes." Wisconsin Law Review (1): 237-95.
Garber, Steven, and John Adams. 1998. "Product and Stock Market Responses to Automotive Product Liability Verdicts. Unpublished paper, RAND, Santa Monica, Calif. June.
Garber, Steven, and Anthony G. Bower. 1998. "An Econometric Analysis of Newspaper Coverage of Automotive Product Liability Verdicts." Unpub- lished paper, RAND, Santa Monica, Calif. October.
Graham, John D. 1991. "Product Liability and Motor Vehicle Safety." In The Liability Maze: The Impact of Liability Law on Safety and Innovation, edited by Peter W. Huber and Robert E. Litan, 120-90. Brookings.
Hartman, Raymond S. 1987. "Product Quality and Market Efficiency: The Effect of Product Recalls on Resale Prices and Firm Valuation." Review of Economics and Statistics 69 (May): 367-72.
Hazen, Thomas Lee. 1993. Federal Securities Law. Washington: Federal Ju- dicial Center.
Hoffer, George E., Stephen W. Pruitt, and Robert J. Reilly. 1988. "The Impact of Product Recalls on the Wealth of Sellers: A Reexamination." Journal of Political Economy 96 (June): 663-70.
. 1992. "Market Responses to Publicly Provided Information: The Case of Automobile Safety." Applied Economics 24 (July): 661-67.
Huber, Peter W. 1991. Galileo's Revenge: Junk Science in the Courtroom. Basic Books.

42 Brookings Papers: Microeconomics 1998
Huber, Peter W., and Robert E. Litan, eds. 1991. The Liability Maze: The Impact of Liability Law on Safety and Innovation. Brookings.
Hunziker, Janet R., and Trevor 0. Jones, eds. 1994. Product Liability and Innovation: Managing Risk in an Uncertain Environment. Washington: Na- tional Academy Press.
Jarrell, Gregg, and Sam Peltzman. 1985. "The Impact of Product Recalls on the Wealth of Sellers." Journal of Political Economy 93 (June): 512-36.
Judge, George G., and others. 1985. The Theory and Practice of Econometrics. Wiley.
Karpoff, Jonathan M., and John R. Lott Jr. 1993. "The Reputational Penalty Firms Bear from Committing Criminal Fraud." Journal of Law and Eco- nomics 36 (October): 757-802.
Kolstad, Charles D., Thomas S. Ulen, and Gary V. Johnson. 1990. "Ex Post Liability for Harm vs. Ex Ante Safety Regulation: Substitutes or Comple- ments?" American Economic Review 80 (September): 888-901.
LaManna, Sam. 1993. "GM Verdict Could Affect Future Cases." National Law Journal, May 3: 21, 25, and 26.
Mackay, Murray. 1991. "Liability, Safety, and Innovation in the Automotive Industry." In The Liability Maze: The Impact of Liability Law on Safety and Innovation, edited by Peter W. Huber and Robert E. Litan, 191-223. Brookings.
MacKinlay, A. Craig. 1997. "Event Studies in Economics and Finance." Journal of Economic Literature 35 (March): 13-39.
Mannering, Fred, and Clifford Winston. 1991. "Brand Loyalty and the Decline of American Automobile Firms." Brookings Papers on Economic Activity: Microeconomics: 67-114.
. 1995. "Automobile Air Bags in the 1990s: Market Failure or Market Efficiency?" Journal of Law and Economics 38 (October): 265-79.
Manning, Richard L. 1994. "Changing Rules in Tort Law and the Market for Childhood Vaccines." Journal of Law and Economics 37 (April): 247-75.
. 1997. "Products Liability and Prescription Drug Prices in Canada and the United States." Journal of Law and Economics 40 (April): 203-43.
March, James G., and Zur Shapira. 1987. "Managerial Perspectives on Risk and Risk Taking." Management Science 33 (November): 1404-18.
Marcus, Alfred, and Philip Bromiley. 1988. "The Rationale for Regulation: Shareholder Losses under Various Assumptions about Managerial Cogni- tion." Journal of Law, Economics, and Organization 4 (Fall): 357-72.
McCarthy, Patrick S. 1989. "Short-Term Effects of Safety-Related Recalls on New Vehicle Purchase Decisions: An Empirical Analysis" Transportation Research Record (1210): 58-65.

Steven Garber and John Adams 43
. 1990. "Consumer Demand for Vehicle Safety: An Empirical Study." Economic Inquiry 28 (July): 530-43.
Mitchell, Mark L., and Michael T. Maloney. 1989. "Crisis in the Cockpit? The Role of Market Forces in Promoting Air Travel Safety." Journal of Law and Economics 32 (October): 329-55.
Nethercutt, Leonard L., and Stephen W. Pruitt. 1997. "Touched by Tragedy: Capital Market Lessons from the Crash of ValuJet Flight 592." Economics Letters 56 (November): 351-58.
Pearl, Daniel, and Douglas Lavin. 1994. "U.S. Decision on Recall of GM Trucks Is Delayed as Agency Sees No Precedent." Wall Street Journal. June 6, p. A4.
Peltzman, Sam. 1981. "The Effects of FTC Advertising Regulation." Journal of Law and Economics 24 (December): 403-48.
Polinsky, A. Mitchell. 1980. "Strict Liability vs. Negligence in a Market Setting." American Economic Review 70 (May): 363-67.
Polinsky, A. Mitchell, and William P. Rogerson. 1983. "Products Liability, Consumer Misperceptions, and Market Power." Bell Journal of Economics 14 (Autumn): 581-89.
Reilly, Robert J., and George E. Hoffer. 1983. "Will Retarding the Informa- tion Flow on Automobile Recalls Affect Consumer Demand?" Economic Inquiry 21 (July): 444-47.
Rustad, Michael. 1991. Demystifying Punitive Damages in Products Liability Cases: A Survey of a Quarter Century of Trial Verdicts. Washington: Roscoe Pound Foundation.
Schwartz, Gary T. 1991. "The Myth of the Ford Pinto Case." Rutgers Law Review 43 (Summer): 1013-68.
Shavell, Steven. 1984. "A Model of the Optimal Use of Liability and Safety Regulation." RAND Journal of Economics 15 (Summer): 271-80.
. 1987. Economic Analysis of Accident Law. Harvard University Press. Slovic, Paul, Baruch Fischhoff, and Sarah Lichtenstein. 1987. "Behavioral
Decision Theory Perspectives on Protective Behavior." In Taking Care: Understanding and Encouraging Self-Protective Behavior, edited by Neil D. Weinstein, 14-41. Cambridge University Press.
Sullivan, Mary. 1990. "Measuring Image Spillovers in Umbrella-branded Products." Journal of Business 63 (July): 309-29.
Thomas, Rich. 1993. "Just as Safe at Any Speed." Newsweek. May 10, 1993, p. 52.
Uri, Noel D. 1989. "Analyzing the Impact of Recalls on the Market Valuation of New Cars." Transportation Planning and Technology 14 (July): 37-52.
Viscusi, W. Kip. 1991. Reforming Products Liability. Harvard University Press.

44 Brookings Papers: Microeconomics 1998
Viscusi, W. Kip, and Joni Hersch. 1990. "The Market Response to Product Safety Litigation." Journal of Regulatory Economics 2 (September): 215- 30.
Wynne, A. James, and George E. Hoffer. 1976. "Auto Recalls: Do They Affect Market Share?" Applied Economics 8 (September): 157-63.

Comments
Comment by Sam Peltzman: Steven Garber and John Adams present a view of the tort liability system that is at odds with much recent hand- wringing. For the auto manufacturers the direct costs of jury verdicts against them are small, essentially loose change considering the size of the industry. And the indirect effects-lost sales or "goodwill" as measured by loss of stock market value-cannot reliably be distin- guished from zero.
How can their results be reconciled with the seriousness with which the business community has pursued reform of the tort liability system both in Washington and in state capitals? The answer I think is that court cases, especially those reaching a decision, are only a small part of a much larger process that includes media publicity and regulatory scrutiny. Court cases are occasionally a vital part of the process, but they occur very rarely. Most are exactly what Garber and Adams show them to be-small potatoes.
I think this conclusion would stand up even if court cases were analyzed from their beginning instead of, as Garber and Adams have done, from their conclusion. The potential bias in their method is clear. By the time a case has reached a verdict, much relevant information for car buyers and stockholders has already been revealed. So lack of important effects around the date of a verdict need not preclude impor- tant effects from the whole history of the case.
The reason I think this potential bias is unimportant is that Garber and Adams's findings gibe well with others showing that, viewed in isolation, tort liability cases are not very costly. For example, Michelle White and Henry Farber tracked medical malpractice cases from their beginning and found results similar to those of Garber and Adams: the
45

46 Brookings Papers: Microeconomics 1998
expected value of a malpractice case was tiny, and the aggregate cost of all cases was a small fraction of the relevant total. I More recently, Jonathan Karpoff and John Lott examined the stock market response to the events engendered by the abortive effort of Republicans in Congress to limit damage awards in tort liability cases following their 1994 elec- tion victory.2 The authors found that changes in the likely success of this effort were greeted by yawns from Wall Street. The only important exception was for a handful of companies that already had pending cases with substantial amounts at risk. But the stock market seemed to be saying that any gain from reducing expected damage costs from future cases was trivial even for firms in industries heavily exposed to liability risk.
My more important caveat concerns the focus on court cases as the unit of analysis. This gives each case equal weight and thereby, I think, obscures the role of the courts in imposing product liability costs. Consider how such costs get determined. Typically the process begins with some media publicity-a story about sticking accelerator pedals might surface in the press, for example. The ensuing evolution of the story is fraught with uncertainty. It may end with a heated denial by the manufacturer. Or it may result in regulatory scrutiny, a recall per- haps. At some point a court case could arise. This could be an individ- ual's suit of the sort that dominates Garber and Adams's sample. Or it could be a more ominous class action case. Most of these events will end inconsequentially. Even if the action gets beyond the stage of heated denials, the likelihood of a single event mushrooming into some- thing significant is very small. That reality is what I think Garber and Adams's results reflect. However, a handful of these cases will become truly serious. The publicity itself may be so adverse that the seller's market nearly evaporates, as happened after the television report on Audi's accelerating brake pedals. Or litigation may result in an asbestos- style class action case that bankrupts the seller.
The correct way to think about these events then is that they are drawn from a highly skewed distribution whose expected value is dominated by a small probability times a very large conditional mean. Thus for most events the actual value will ultimately be less than the expected value at
1. White and Farber (1991). 2. Karpoff and Lott (1997).

Steven Garber and John Adams 47
the beginning. This view is confirmed by analyses of events closer to their beginning than court cases. For example, a fairly common finding in analyses of regulatory initiatives on product quality is that the stock market penalty seems to overstate any independent assessment of the costs im- posed by the particular case. This has been found for Fair Trade Com- mission false advertising cases, auto and drug product recalls and corpo- rate fraud cases.' Large "goodwill" (that is, otherwise inexplicable) losses have also been found around the date of airplane accidents.' These things are happening early enough after the event that the stock market cannot completely ignore the small probability that they will become major occurrences. Because most will not, backward-looking analysis will most often produce an overstated reaction.
A specific example will illustrate this point. In our 1985 article Gregg Jarrell and I used the recall of the Dalkon Shield (an intrauterine birth control device with alleged health risks) to illustrate the extent to which the stock market overestimated the direct costs of product defects. We were fortunate to have a nearly decade-long record of what those costs were because the Securities and Exchange Commission forced the manu- facturer, A. H. Robins, to disclose the costs separately each quarter. Even with the benefit of a decade's hindsight and a generous extrapolation of that experience, we could not come close to closing the gap between the market's devaluation of Robins and the actual costs of the recall. The ink was hardly dry on our article before a massive class action was brought against the company that ultimately forced it into bankruptcy. In the end the market had actually underestimated the cost of the recall to the com- pany's stockholders. We needed two decades' hindsight to see this rather than one. The point of the example, however, is that the large initial reaction could reasonably have included some allowance for the possibility of the company-busting kind of loss that emerged in this rare case.
Most events like this do not take decades for the uncertainty to be resolved. And for most events the uncertainty is resolved favorably for the defendants as well as quickly. This is why samples of the events in their mature stages, such as court decisions, will usually reveal small
3. For false advertising see Peltzman (1981); for recalls see Jarrell and Peltzman (1985); and for corporate fraud see Karpoff and Lott (1993). The direct effects of most auto recalls on sales have also been found to be small and temporary. Significant negative effects are found only for severe recalls. See, for example, Reilly and Hoffer (1983).
4. See, for example, Mitchell and Maloney (1989).

48 Brookings Papers: Microeconomics 1998
effects. If something like corporate survival is no longer even remotely at stake, the effect of resolving the remaining issues, whether the liability is $30 million or $300 million, for example, will typically be drowned in the noise.
What then do Garber and Adams's results say about the costs of prod- ucts liability and the proposals for reform of the liability system? If my reading is correct, they suggest the need for focusing on the main culprits, the extremely rare but outsized costs. Some-those stemming from ad- verse media publicity, for example-are beyond the reach of any practical change in the law. As for the rest, only something as drastic as eliminating or severely restricting the asbestos-type class action case is likely to have important effects. Garber and Adams's results imply, I think correctly, that the recent proposals for capping liability in garden variety cases are unlikely to have much meaningful effect on liability costs in most indus- tries.5
Comment by Daniel L. Rubinfeld: This study by Steve Garber and John Adams focuses on the empirical determination of certain effects of product liability laws. Specifically, the authors analyze the relation- ship between legal verdicts and stock prices of domestic automobile manufacturers of the models involved for two, three, and four business days following the announcement of the verdict. In addition they ex- amine postverdict sales of the models. The authors are to be commended for producing a thoughtful and balanced empirical analysis. They should also be praised for the balance they show in interpreting their results. The most interesting result is in fact a nonresult; although one might expect to see a product liability verdict affect both stock prices and product sales, the authors find little evidence of such an effect.
My comments on the Garber-Adams paper come in two parts. First, I discuss some methodological issues surrounding their empirical anal- ysis. I argue that one should not be surprised by the nonresult, once one reflects on the sample selection process that underlies the data analyzed. Second, I comment on some of the normative implications that one might draw from their paper. I emphasize the need to be
5. There will, of course, always be counterexamples. Manning (1994) describes the particularly dramatic one of childhood vaccines where nearly all of the wholesale price is product liability costs.
Marilyn Simon provided helpful comments.

Steven Garber and John Adams 49
extremely wary before drawing any normative implications from the study.
The Empirical Analysis
In their analysis Garber and Adams consider both direct product liability costs (those costs stemming directly from product liability lit- igation, including the costs of defending and settling lawsuits and judg- ments paid), and indirect product liability costs (the costs associated with decreases in demand related to the verdict and regulatory actions related to the liability events). The effect on sales, an indirect effect, and the effect on stock prices, a combination of direct and indirect effects, are estimated separately. The authors note that these measured effects are limited to the extent to which liability verdicts carry new information to the potential consumer about the quality of the vehicle and to the market about factors that are relevant to measuring future profitability. The nonresult obtained by the authors tells us that the verdicts carried little incrementally new information to consumers; it does not tell us that product liability cases have no deterrent effect.
The data used in the study are based on verdicts announced between January 1985 and December 2, 1996. In their empirical work the au- thors implicitly assume there was little publicity about a case before the announcement of the verdict. Although they have made some efforts to follow publicity, a more complete analysis would pursue the presence of publicity in greater depth, much as Garber has done in some earlier work.6 To determine whether there had been preverdict publicity, it would be necessary to search other media and to broaden the search to include articles that may not name the plaintiff explicitly but that never- theless refer to litigation about the defect during this time.
Sample selection is an important problem here: to the extent that there might have been preverdict publicity about either the defect or the case, that publicity could affect the selection of cases to be tried rather than settled. As a consequence, one's ability to draw implications from measurements of the immediate effect of the verdict on sales or profit- ability is limited. The measured effect is related only to the additional information given by the verdict and any uncertainty that the verdict might resolve. For example, a verdict in favor of the plaintiff might
6. Garber and Bower (1998).

50 Brookings Papers: Microeconomics 1998
actually increase the defendant's sales or profitability if before the announcement potential consumers and investors had expected a sig- nificantly higher verdict in favor of the plaintiff. I wonder, however, whether the largely negative results are due in part to the fact that there were expectations of possible adverse decisions that had already been capitalized into sales or profitability.
As an example of the informational concern that I just raised, con- sider one of the authors' chosen regression variables, the one that mea- sures whether there had been a recall on the make and model. This variable is assumed by the authors to measure whether consumers might be more inclined to reduce their estimate of the safety of the model after the announcement of the verdict than if they had not previously heard of the recall. However, there are other possible interpretations of the informational content of this variable. One is that consumers might have adjusted their estimate of the safety of the vehicle when they learned of the recall, and as a result additional significant adjustment would not have occurred at the time of the verdict. Further, it is not clear whether consumers would react positively or negatively to the recall information, because the nature of recall and the manufacturer's handling of it will determine whether it signals poor design or quality control or constructive and effective measures that respond to the re- ports of a defect and consequently improve future production of the model.
The verdicts included in the sample are of necessity limited; the authors' sample is based on listings in the Automotive Litigation Re- porter (a sample of unsolicited reports submitted by attorneys), as well as proplaintiff verdicts listed in a California publication, Jury Verdicts Weekly, and proplaintiff verdicts found through a newspaper search. Although not necessary for the purposes of this paper, it is important to remember that the chosen data base may not be an unbiased sample of all vehicle product liability cases. It is quite possible that other events such as recall announcements are not included in the event study and may have affected the estimated forecasting model. Remember the authors' focus on the measurement of the difference between forecast and actual sales in the month following the verdict. Limiting the anal- ysis to a forecast one period ahead increases the likelihood that the forecast itself will include data on sales for a period during which other significant informational events occurred.

Steven Garber and John Adams 51
Put in econometric terms, the sample selection problem that I have been discussing has the following interpretation. Suppose that all fac- tors that affected the likelihood of plaintiff's success in a product lia- bility case are filtered out by the settlement-discovery process (includ- ing information, risk aversion, and the differential stakes of the parties). Then any randomness associated with the outcomes of those cases that are tried will be a "white noise" process relating to factors that are trial-specific (for example, reflecting differential jury composition) and not related to the information about liability (and harm) that is available to the parties.7 Put in signal-noise terms, as a consequence it is possible that trial verdicts' information will provide a diffuse signal of the effects of information relating to product liability on consumer behavior.
To close this section, let me add a few minor technical econometric points. First, why emphasize forecasts only one period ahead, when multiperiod forecasting would better incorporate prior information? I believe there are sufficient data to do this. This would help eliminate the problem that most of the effect of the adverse verdict will have already been felt if the expectations of the relevant parties had been continually updated over time. It would also allow one to test the extent to which information had previously been capitalized. (Ideally, one would like a measure of the "expected outcome" of the case before trial.) Second, I worry about robust estimation issues (the sensitivity of the result to individual data points), since the sample is relatively small. Finally, it seems clear that the forecasting methodology works better with company variables. I would have found it interesting if the authors had reported the results of a regression approach or an approach that mixed regression and ARIMA (time-series) modeling in the forecasting part of their work.8
Normative Issues
After finding little evidence of a shift in demand for the model or the stock market price in the period following the announcement of the verdict, the authors explore other ways in which product liability might affect automobile company decisionmakers. The authors point correctly to the difficulties of drawing normative implications from their study.
7. See, for example, Cooter and Rubinfeld (1989); and Perloff and Ruud (1996). 8. Pindyck (1998).

52 Brookings Papers: Microeconomics 1998
I would perhaps go a step further by suggesting that any attempt to draw normative implications from this study alone is fraught with dif- ficulties. There are a number of reasons for this.
First, we know from the law and economics literature that the extent to which economic efficiency will be achieved depends on the particular liability rule in effect. Any conclusions that Garber and Adams reach are likely to be conditioned on the current state of product liability law, not a preferred ideal alternative. The choice of liability is complicated, depending among other things on the degree of risk aversion of cus- tomers and manufacturers, the availability of information, uncertainty about the application of the liability rule, and the extent to which risks and potential harms vary across customers.9
Second, the normative analysis is further complicated by evidence from the psychology literature that is inconsistent with the traditional models that explain consumer risk preferences. Findings that decision- makers overestimate the past frequency of liability events that are highly publicized lead one to conclude that these people might overreact to highly publicized liability events. Similarly, in the management lit- erature, interviews with executives indicating that risk is evaluated by considering worst-case scenarios imply that there would-be a premium placed on avoiding a small probability of an extremely bad outcome. Any normative interpretation of the empirical results based on a rela- tively small sample of information about low-probability events will consequently be difficult to make.
Third, because the authors have chosen to focus only on the effects on consumers of information provided at one stage of the litigation process, it is inappropriate to draw normative implications that apply to the entire process. Although useful in itself, the evidence presented in this paper does not allow one to conclude that there is either under- or overdeterrence from product defects. Garber and Adams are to be commended for avoiding such an inappropriate normative conclusion. If there is anything normative that I would draw from this study, it is the confirmation of my view that trials provide noisy information and that the effectiveness of jury verdicts in deterring bad acts is limited.
9. See, for example, Simon (1981).

Steven Garber and John Adams 53
Commentator's References
Cooter, Robert, and Daniel L. Rubinfeld. 1989. "Economic Analysis of Legal Disputes and their Resolution. " Journal of Economic Literature 27 (Septem- ber): 1067-97.
Garber, Steven, and Anthony G. Bower. 1998. "An Econometric Analysis of Newspaper Coverage of Automotive Product Liability Verdicts." Unpub- lished paper. RAND, Santa Monica, Calif. October.
Jarrell, Gregg, and Sam Peltzman. 1985. "The Impact of Product Recalls on the Wealth of Sellers. " Journal of Political Economy 93 (June): 512-36.
Karpoff, Jonathan M., and John R. Lott Jr. 1993. "The Reputational Penalty Firms Bear from Committing Criminal Fraud." Journal of Law and Eco- nomics 36 (October): 757-802.
. 1998. "Punitive Damages: Their Determinants, Effects on Firm Value, and the Impact of Supreme Court and Congressional Attempts to Limit Awards." Working Paper. University of Chicago Law School. July.
Manning, Richard. 1994. "Changing Rules in Tort Law and the Market for Childhood Vaccines." Journal of Law and Economics 37 (April): 247-75.
Mitchell, Mark L., and Michael T. Maloney. 1989. "Crisis in the Cockpit? The Role of Market Forces in Promoting Air Travel Safety." Journal of Law and Economics 32 (October): 329-55.
Peltzman, Sam. 1981. "The Effects of FTC Advertising Regulation." Journal of Law and Economics 24 (December): 403-48.
Perloff, Jeffrey M., Daniel L. Rubinfeld, and Paul Ruud. 1996. "Antitrust Settlements and Trial Outcomes." Review of Economics and Statistics 78 (August): 401-09.
Pindyck, Robert S. 1998. Econometric Models and Economic Forecasts, 4th ed. McGraw-Hill.
Reilly, Robert, and George Hoffer. 1983. "Will Retarding Information Flow on Automobile Recalls Affect Consumer Demand?" Economic Inquiry 21 (July): 444-47.
Simon, Marilyn. 1981. "Imperfect Information, Costly Information, and Prod- uct Quality." Bell Journal of Economics 12 (Spring): 171-84.
White, Michelle J., and Henry S. Farber. 1991. "Medical Malpractice: An Empirical Examination of the Litigation Process." RAND Journal of Eco- nomics 22 (Summer): 199-217.