product benchmarking using dfa and dfd tools amir...
TRANSCRIPT
PRODUCT BENCHMARKING USING DFA AND DFD TOOLS
AMIR REZA AKHIANI
DISSERTATION SUBMITTED IN FULFILMENT OF THE REQUIREMENT FOR THE DEGREE OF MASTER OF
ENGINEERING
INSTITUTE OF GRADUATE STUDIES
UNIVERSITY OF MALAYA KUALA LUMPUR
2013
i
Univers
ity of
Mala
ya
ABSTRAK
Persaingan sengit antara pengeluar memaksa mereka mencari cara baru meningkatkan
produktiviti dan kualiti sambil mengurangkan kos. Usaha sebegini membawa penyelidik
membangunkan kaedah seperti DFX Tools: Rekabentuk Pembuatan, Rekabentuk
Pemasangan, Rekabentuk Penguraian Pemasangan, Rekabentuk Alam Sekitar,
Rekabentuk Kitar Semula, dan lain-lain.
Dalam kajian ini, kaedah Rekabentuk Pemasangan (DFA) dan Rekabentuk Penguraian
Pemasangan (DFD) digunakan untuk menganalisis dan mengoptimumkan sebuah produk
automotif. DFA mengurangkan masa dan kos melalui pengurangan bilangan alat ganti,
lalu memudahkan pemasangan dan meningkatkan kebolehharapan. DFD mengurangkan
kos dengan mempercepat proses kitar semula atau penguraian (secara langsung) dan
mengurangkan impak dan kesan terhadap alam sekitar.
Kebanyakan syarikat pembuatan besar seperti Sony, Hitachi, Ford, dan Chrysler
mempunyai kaedah mereka sendiri melaksanakan DFA dan DFD, dibangunkan untuk
produk tertentu. Salah satu kaedah terawal dan umum untuk DFA dan DFD ialah Kaedah
Boothroyd.
Matlamat utama kajian ini adalah mengoptimumkan pemasangan lampu belakang kereta
Proton Waja dengan membekalkan data pemasangan kepada perisian DFA dan DFD, dan
melaksanakan syor perisian untuk menambahbaik rekabentuk awal. Apabila
dibandingkan dengan rekabentuk lama, rekabentuk baru jelas memperbaik pemasangan,
seperti yang ditunjukkan oleh indeks DFA dan graf pecahan kos.
Perisian tersebut mengambilkira pengurangan kos akibat pengurangan alat ganti
sahaja; kos menghasilkan alat ganti baharu seperti acuan alat ganti plastik atau acuan
terap untuk alat ganti logam tidak diambilkira.
ii
Univers
ity of
Mala
ya
ABSTRACT
Tight competition between manufacturers forces them to look for new ways to increase
productivity and quality and hence reduce costs. These efforts have led researchers to
develop methods such as the DFX Tools: Design for Manufacturing, Design for
Assembly, Design for Disassembly, Design for Environment, Design for Recyclability,
etc.
In this research, Design for Assembly (DFA) and Design for Disassembly (DFD) methods
are used to analyze and optimize an automotive product. DFA reduces time and cost
through parts reduction, which simplifies assembly and increases reliability. DFD reduces
cost by hastening the recycling or dismantling processes (direct effect) and decreases
environmental impact and damage to the environment (indirect effect).
Most big manufacturing companies such as Sony, Hitachi, Ford, and Chrysler have their
own method for implementing DFA and DFD, which are developed for a specific product.
One of the oldest and general methods for DFA and DFD is the Boothroyd Method.
The main goal of this research is to optimize assembly of the rear light of Proton Waja
cars through supply of the assembly data to the DFA and DFD software, and to implement
the software’s recommendations into improving the initial design. When compared with
the old design, the new design markedly improves assembly, as shown by the DFA index
and cost breakdown graph.
The software considers only the cost reduction that is due to parts reduction; costs of
producing new parts such as molds for the plastic parts or stamping die for the metallic
parts were not considered.
iii
Univers
ity of
Mala
ya
ACKNOWLEDGMENT
This project would not have been possible without the support of many people. First,
I would like to thank my supervisor, Prof. Dr. Zahari Bin Taha, who provided timely and
instructive comments and evaluation at every stage of the dissertation process, allowing
me to complete this project. Thanks to Raja Ariffin Bin Raja Ghazilla for his guidance
and Centre of Product Design and Manufacture (CPDM) for allowing me to use their
facilities to complete this project. And finally, I would like to thank my parents for their
unending love and support. My mother instilled in me, from an early age, the desire and
skills to further my studies.
iv
Univers
ity of
Mala
ya
TABLE OF CONTENTS
ABSTRAK ....................................................................................................................... ii
ABSTRACT .................................................................................................................... iii
ACKNOWLEDGMENT ............................................................................................... iv
LIST OF FIGURES ....................................................................................................... ix
LIST OF TABLES ......................................................................................................... xi
LIST OF ABBREVIATIONS ..................................................................................... xiii
CHAPTER 1 INTRODUCTION ................................................................................... 1
1.1 Background .......................................................................................................... 1
1.2 Problem Statement and Research Objectives....................................................... 3
1.3 Organization of the dissertation ........................................................................... 4
CHAPTER 2 LITERATURE REVIEW ....................................................................... 6
2.1 Importance of Design and Assembly Considerations .......................................... 6
2.2 Design for Manufacture and Assembly (DFMA) ................................................ 8
2.2.1 A brief historical review ............................................................................ 8
2.2.2 Definition ................................................................................................... 9
2.2.3 DFA objectives ........................................................................................ 10
2.2.4 General DFA steps ................................................................................... 11
2.2.5 Benefits of DFA ....................................................................................... 12
2.2.6 DFA Guidelines ....................................................................................... 12
2.2.7 DFA methods ........................................................................................... 14
2.2.8 Boothroyd and Dewhurst Method ............................................................ 14
v
Univers
ity of
Mala
ya
2.2.9 DFA practices .......................................................................................... 16
2.3 Design for Environment (Disassembly) ............................................................. 19
2.3.1 Principles of DFD .................................................................................... 20
2.3.2 DFD evaluation methods ......................................................................... 21
2.3.3 BDI & TNO analysis procedure .............................................................. 21
2.3.4 DFE (Disassembly) practices ................................................................... 22
2.4 Summary ............................................................................................................ 23
CHAPTER 3 METHODOLOGY ................................................................................ 24
3.1 Design overview: ............................................................................................... 28
3.2 Details of the DFA software panels ................................................................... 29
3.2.1 Minimum-part criteria .............................................................................. 30
3.2.2 Envelope dimensions ............................................................................... 30
3.2.3 Symmetry ................................................................................................. 30
3.2.4 Handling difficulties ................................................................................ 31
3.2.5 Insertion difficulties ................................................................................. 31
3.2.6 Securing method ...................................................................................... 31
3.2.7 Assembly.................................................................................................. 31
3.3 Details of the components for the DFA software .............................................. 32
3.3.1 Light shell ................................................................................................ 32
3.3.2 Bolts ......................................................................................................... 32
3.3.3 Light cover ............................................................................................... 33
3.3.4 Rubber seal (1) ......................................................................................... 33
vi
Univers
ity of
Mala
ya
3.3.5 Rubber seal (2) ......................................................................................... 34
3.3.6 Plastic board ............................................................................................. 34
3.3.7 Copper connectors ................................................................................... 35
3.3.8 Electrical circuit ....................................................................................... 35
3.3.9 White bulbs .............................................................................................. 36
3.3.10 Orange Bulb ........................................................................................... 36
3.3.11 Plastic base ............................................................................................. 36
3.3.12 Rubber washer ....................................................................................... 37
3.3.13 Metallic clip ........................................................................................... 37
3.3.14 Harness connector .................................................................................. 38
3.4 The assembly process ........................................................................................ 39
3.5 Details of the DFE software panels ................................................................... 43
3.6 Details of the components for the DFE software ............................................... 45
3.7 Summary ............................................................................................................ 47
CHAPTER 4 RESULT AND DISCUSSION .............................................................. 48
4.1 The structure chart of the original design .......................................................... 48
4.2 DFA analysis of the original design ................................................................... 48
4.2.1 Summary of the initial-design analysis .................................................... 49
4.2.2 Guidelines from the DFA software .......................................................... 52
4.2.3 Implementing the redesign suggestions of the DFA software ................. 54
4.3 DFA analysis of the redesigned product ............................................................ 60
4.3.1 Summary of the DFA redesign analysis .................................................. 60
vii
Univers
ity of
Mala
ya
4.3.2 Comparing the initial and the redesigned product ................................... 62
4.4 DFE analysis ...................................................................................................... 64
4.4.1 DFE analysis of the initial product .......................................................... 64
4.4.2 DFE of the redesigned product ................................................................ 68
4.5 Summary ............................................................................................................ 70
CHAPTER 5 CONCLUSION ...................................................................................... 71
REFERENCES
APPENDIX A
APPENDIX B
APPENDIX C
APPENDIX D
APPENDIX E
viii
Univers
ity of
Mala
ya
LIST OF FIGURES
Figure 2.1 Total time in production .................................................................................. 6
Figure 2.2 Total unit production cost ................................................................................ 7
Figure 2.3 Costs influence lever and the design ............................................................... 8
Figure 2.4 Typical stages in DFA procedure .................................................................. 11
Figure 2.5 The product architecture-based approach to DFA ......................................... 18
Figure 2.6 DFE analysis procedure ................................................................................. 22
Figure 3.1 The general scheme of the method ................................................................ 25
Figure 3.2 DFA methodology flow chart ........................................................................ 26
Figure 3.3 DFE methodology flow chart ........................................................................ 27
Figure 3.4 Assembly Chart (initial design) ..................................................................... 29
Figure 3.5 Subassembly of Electrical connection fastener ............................................. 39
Figure 3.6 Assembly of the copper connector onto the board ........................................ 39
Figure 3.7 The stamping and melting places on the electrical board .............................. 40
Figure 3.8 Exploded depiction of the bulbs and electrical board .................................... 40
Figure 3.9 Assembly of the electrical-connection fastener to the electrical board ......... 41
Figure 3.10 Light-shell subassembly, top view .............................................................. 41
Figure 3.11 Light-shell subassembly, bottom view ........................................................ 42
Figure 3.12 Assembly of the electrical board onto the light .......................................... 42
Figure 3.13 Disassembly Worksheet Window ............................................................... 43
Figure 3.14 The disassembly-questions panel ................................................................ 44
Figure 3.15 The environmental-questions panel ............................................................. 44
Figure 4.1(a) The structure chart; (b) The minimum-part criteria (initial design) .......... 48
Figure 4.2 Labor cost per part and operation (initial design) .......................................... 51
Figure 4.3 Breakdown of costs per product (initial design) ............................................ 52
Figure 4.4 Breakdown of time per product (initial design) ............................................. 52
ix
Univers
ity of
Mala
ya
Figure 4.5 The redesigned of the plastic base, rubber washer, and metallic clip............ 54
Figure 4.6 Back view of the redesigned plastic board .................................................... 55
Figure 4.7 Securing the main circuit ............................................................................... 56
Figure 4.8 Securing the narrow circuits .......................................................................... 56
Figure 4.9 Plastic-board redesign .................................................................................... 57
Figure 4.10 Electrical-circuit redesign ............................................................................ 57
Figure 4.11 Assembly of the electrical-board components (redesign) ........................... 58
Figure 4.12 Assembly of the electrical board onto the light ........................................... 58
Figure 4.13 The redesign assembly chart ........................................................................ 59
Figure 4.14 The redesign structure chart......................................................................... 60
Figure 4.15 Breakdown of time per product (redesign) .................................................. 61
Figure 4.16 Breakdown of cost per product (redesign)................................................... 62
Figure 4.17 Comparing the time breakdown................................................................... 63
Figure 4.18 Comparing the costs breakdown .................................................................. 63
Figure 4.19 Disassembly results (initial product) ........................................................... 65
Figure 4.20 The optimized subassembly results of the initial product ........................... 66
Figure 4.21 Disassembly Costs ....................................................................................... 67
Figure 4.22 Disassembly Time ....................................................................................... 67
Figure 4.23 The disassembly result of the redesigned product ....................................... 69
Figure 4.24 Comparing the disassembly results ............................................................. 70
x
Univers
ity of
Mala
ya
LIST OF TABLES
Table 2.1 General DFA Guidelines ................................................................................. 13
Table 2.2 Criteria for minimum number of parts ............................................................ 15
Table 2.3 Example of DFE additional to DFA analysis.................................................. 16
Table 3.1 Parts specification ........................................................................................... 28
Table 3.2 Specifications for a light shell ......................................................................... 32
Table 3.3 Specifications for the bolts .............................................................................. 32
Table 3.4 Light-cover specifications ............................................................................... 33
Table 3.5 Rubber seal (1) specifications ......................................................................... 33
Table 3.6 Rubber seal (2) specifications ......................................................................... 34
Table 3.7 Plastic-board specifications............................................................................. 34
Table 3.8 Copper-connector specifications ..................................................................... 35
Table 3.9 Electrical-circuit specifications ....................................................................... 35
Table 3.10 White-bulb specifications ............................................................................. 36
Table 3.11 Orange-bulb specifications ........................................................................... 36
Table 3.12 Plastic-base specifications............................................................................. 37
Table 3.13 Washer Specifications ................................................................................... 37
Table 3.14 Metallic-clip specifications ........................................................................... 38
Table 3.15 Harness-connector specifications .................................................................. 38
Table 3.16 Components disassembly specifications ....................................................... 45
Table 3.17 The material properties ................................................................................. 46
Table 3.18 The manufacturing processes ........................................................................ 46
Table 3.19 End-of-life considerations ............................................................................. 47
Table 3.20 Glued-joint specifications ............................................................................. 47
Table 4.1 Assembly worksheet (initial design) ............................................................... 49
Table 4.2 General Summary (initial design) ................................................................... 50
xi
Univers
ity of
Mala
ya
Table 4.3 Breakdown of the costs (initial design)........................................................... 50
Table 4.4 Breakdown of the time (initial design) ........................................................... 50
Table 4.5 Manual assembly times ................................................................................... 51
Table 4.6 Parts reduction................................................................................................. 53
Table 4.7 Operation reduction......................................................................................... 53
Table 4.8 Insertion difficulties ....................................................................................... 53
Table 4.9 Handling difficulty .......................................................................................... 53
Table 4.10 Assembly worksheet of the redesign ............................................................ 61
Table 4.11 General summary (comparison) ................................................................... 62
Table 4.12 Comparing the costs breakdown ................................................................... 62
Table 4.13 Comparing the time breakdown .................................................................... 63
Table 4.14 Disassembly result of the initial design ........................................................ 64
Table 4.15 Optimized disassembly sequence of the initial design.................................. 66
Table 4.16 Disassembly specifications of the redesign .................................................. 68
Table 4.17 Disassembly result of the redesign................................................................ 69
xii
Univers
ity of
Mala
ya
LIST OF ABBREVIATIONS
DFX Design for X
DFE Design for Environment
DFA Design for Assembly
DFD Design for Disassembly
MET Material cycle, Energy use, Toxic emission
LCA Life Cycle Assessment
BDI Boothroyd Dewhurst, Inc.
IP Instrument Panel
DPN Disassembly Petri Net
PS Phase Selector
ABS Acrylonitrile Butadiene Styrene
PMMA Poly Methyl Methacrylate
xiii
Univers
ity of
Mala
ya
CHAPTER 1 INTRODUCTION
INTRODUCTION
The automotive industry is always subject to change and continuously striving for
improvement. Sustainability has become a very critical issue as it determines the success
of automotive design and material developments. Consumers are demanding for products
of high quality but low cost. This motivates automotive manufacturers into looking for
new ways to increase productivity and quality at little cost.
The manufacturing of new designs today need consideration from a very early stage.
There is increasing pressure to manufacturers, from legislators and consumers, to
minimise a product’s impact on the environment through designing for the environment
(DFE) concepts. Design for Disassembly (DFD) reduces energy usage, wastage and
disposal mainly through recycling. DFD is part of DFE in product development.
1.1 Background
Brake lamps first appeared as early as 1905. The requirements for them were presented
in eleven U.S. states in 1928; after 1960, more general requirements for brake lamps were
considered (Moore, 1999).
In the history of rear lights, many functions were added to the rear signalling system.
Some functions have been studied but have yet to be implemented. The value of a rear
light includes (Moore, 1999):
• attracting attention by indicating vehicular presence
• indicating vehicular width
• indicating the distance between vehicles
• indicating the driver’s intention to brake
• indicating the driver’s application of the brakes
• indicating the driver’s intention to halt the vehicle
1
Univers
ity of
Mala
ya
• indicating the driver’s intention to turn (left or right)
• indicating vehicular turning (to left or to right)
• indicating change in vehicular movement from the main direction (from forward
to reverse)
• indicating that the vehicle is parked
• indicating a present emergency situation (hazard warning) of the vehicle
Several factors to automotive rear lighting were investigated in the late 1960s and early
1970s. The importance of distinguishing function and redundancy of each model was also
considered at the time (Cameron, 1995). Rear-end car accidents still highly occur in
various countries. Approximately two million rear-end collisions occur in the U.S. each
year. To reduce the incidence of such accidents, automotive rear lighting was improved
by specifying one color to each light function (McIntyre, 2008).
One lifecycle requirement for many products is assemble ability. Assembly is a major
part in product manufacturing; its function is to join all the components and turn it into a
complete product (Boothroyd et al. 2002). Assembly is the process that has high potential
for improvement of the product development method and manufacturing strategy.
Assembly considerations link all levels of product development - from customer
requirements to supply chain design, to management of variety and customization.
Assembly oriented products can greatly improve a company's prospects for higher
success in developing its products (Whitney, 2004).
The DFA software was developed in the 1980s, to analyze manufacturability of
mechanical designs. During the conceptual stage of product development, this software
comprehensively analyzes a design, its material requirements and manufacturability, and
the estimated costs. The data helps engineers build an information-based analysis for
evaluating the manufacturability of a design, step by step (Pennino & Potechin, 1993).
2
Univers
ity of
Mala
ya
Boothroyd Dewhurst Inc. (BDI) was the first company to commercialize Design for
Assembly (DFA) methods and software tools. The software simplifies product and
reduces cost through its evaluation and estimation of product manufacturing cost and time
in the design phase. Hundreds of Fortune 1,000 companies among the 1,000 largest
American companies (including Dell, John Deere, Harley-Davidson and Whirlpool) have
used DFA software to reduce the cost of manufacturing their products and to establish
market design innovation (Parker & Group, 2010).
Through cooperation with the BDI (USA) and the TNO (Institute of Industrial
Technology in the Netherlands), Boothroyd and Dewhurst Inc. (BDI) released DFE
(Design for Environment) in 1996. This product simulates ‘end of life’ disassembly of
the product and quantifies the economic and environmental effects as disassembly
proceeds. With help from this software, designers with no ecology background can also
consider environment factors in the design process (Winston Knight & Curtis, 1999).
DFE is one of the earliest software used in the analysis of disassembly and environment
cost, providing opportunities aimed at optimizing recycling (Xie, 2006).
PROTON is the first automaker in Malaysia, established in 1983 and is at present
having the largest production capacity. This national car company pioneered Malaysia’s
capabilities in automobile engineering, research, development, and manufacturing
(Abdullah & Keshav Lall, 2003). Through a joint venture with HICOM and the Japanese
Mitsubishi, Proton succeeded in becoming the dominant market player in 1987, in the
wake of the economic crisis of 1985-86, the collapse of the car market, and the return to
operational managerial control by the Japanese (Wad, 2004).
1.2 Problem Statement and Research Objectives
Tight competition between manufacturers have forced them to look for new ways to
increase productivity and quality while reducing costs. The effort has led researchers into
developing methods such as DFX Tools: Design for Manufacturing, Design for
3
Univers
ity of
Mala
ya
Assembly, Design for Disassembly, Design for Environment, Design for Recyclability,
etc.
DFA reduces production time and cost by decreasing the number of parts. Part
reduction simplifies assembly and increases reliability. DFD reduces costs by directly
speeding up and easing up recycling and dismantling, indirectly decreasing environment-
damaging impact.
Most articles on the two methods report of separate studies of DFA and DFD. An
analysis of various articles on design optimizing processes has led to a conclusion that
implementing DFA and DFD sequentially may increase a manufacturer’s optimization of
their production, i.e., implementing them together on the same product will increase
efficiency in product assembly and disassembly.
The goal of this dissertation is to provide a review of the design of car rear light from
the assembly and disassembly standpoints and to concentrate on redesigning through
DFA and DFD principles. The effectiveness of DFA and DFD methods is accordingly
evaluated.
This dissertation will focus on:
• Providing a better understanding of DFA and DFD methods
• Reviewing a case from the automotive industry through the Boothroyd and
Dewhurst DFA and DFD methods
• Redesigning the reviewed product to show the effectiveness of Boothroyd and
Dewhurst DFA and to maximize through DFD method the returns from
component recovery.
1.3 Organization of the dissertation
Chapter 2 presents a comprehensive review of literatures on assembly and
disassembly, divided into DFA and DFD. The literature review presents assembly and
4
Univers
ity of
Mala
ya
disassembly modeling, techniques of estimating values and costs, and solution
approaches to optimization.
Chapter 3 identifies the product design, assembly, and disassembly, detailing each of
the parts involved in assembly and disassembly. This information will be used in the
Boothroyd and Dewhurst assembly and disassembly software, for product analysis in the
next chapter.
Chapter 4 describes importing (exporting) of the DFA data on all the components
(from Chapter 3) to the software to calculate the assembly time for each part. Issues in
assembly and improvements areas are identified and discussed. Comparisons are made
through DFA between the initial design and the new design to show the product’s
potential development. Next the disassembly problems and possible improvements are
investigated through DFE software.
Chapter 5 concludes, summarizing validation of the objectives. Specific contributions
to each area that involved DFA and DFD are described.
5
Univers
ity of
Mala
ya
CHAPTER 2 LITERATURE REVIEW
LITERATURE REVIEW
2.1 Importance of Design and Assembly Considerations
A major part of product manufacturing process is assembly, whose function is to join
all the components, turning them into a complete product (Geoffrey Boothroyd et al.,
2002). According to Whitney (2004) “Assembly is more than putting parts together.
Assembly is the capstone process in manufacturing. It brings together all the upstream
processes of design, engineering, manufacturing, and logistics to create an object that
performs a function.”
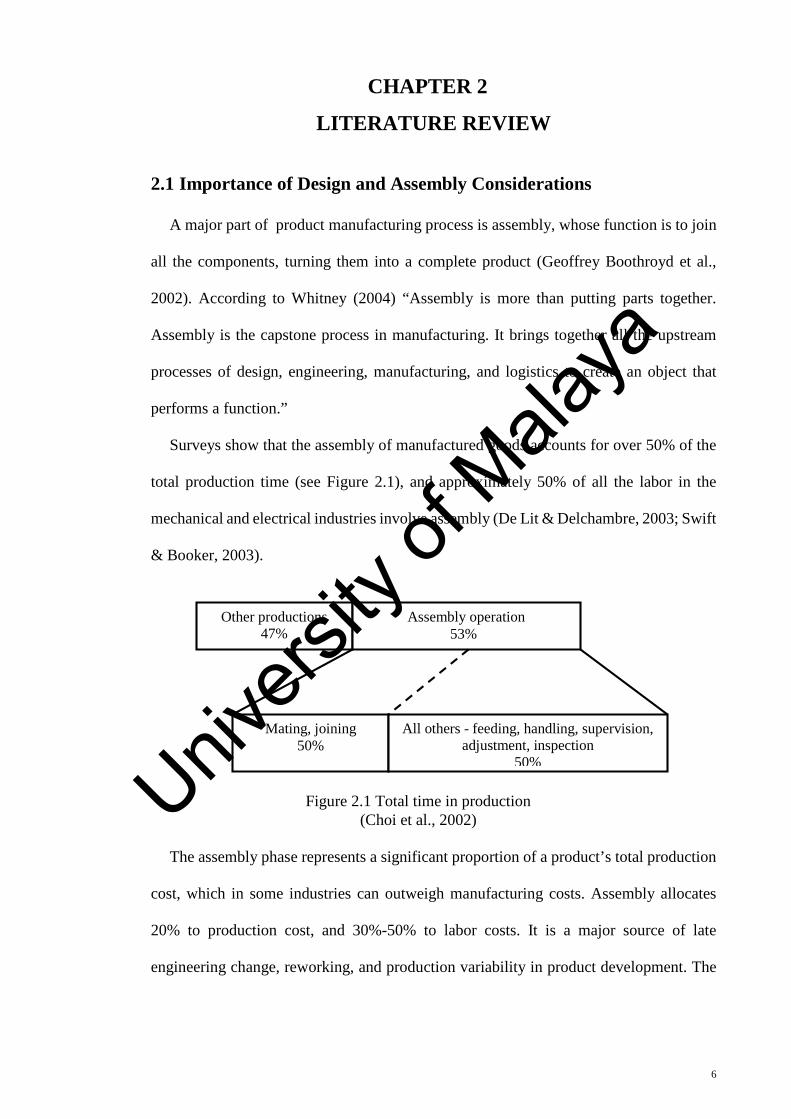
Surveys show that the assembly of manufactured goods accounts for over 50% of the
total production time (see Figure 2.1), and approximately 50% of all the labor in the
mechanical and electrical industries involve assembly (De Lit & Delchambre, 2003; Swift
& Booker, 2003).
The assembly phase represents a significant proportion of a product’s total production
cost, which in some industries can outweigh manufacturing costs. Assembly allocates
20% to production cost, and 30%-50% to labor costs. It is a major source of late
engineering change, reworking, and production variability in product development. The
Figure 2.1 Total time in production (Choi et al., 2002)
Other productions 47%
Assembly operation 53%
Mating, joining 50%
All others - feeding, handling, supervision, adjustment, inspection
50%
6
Univers
ity of
Mala
ya
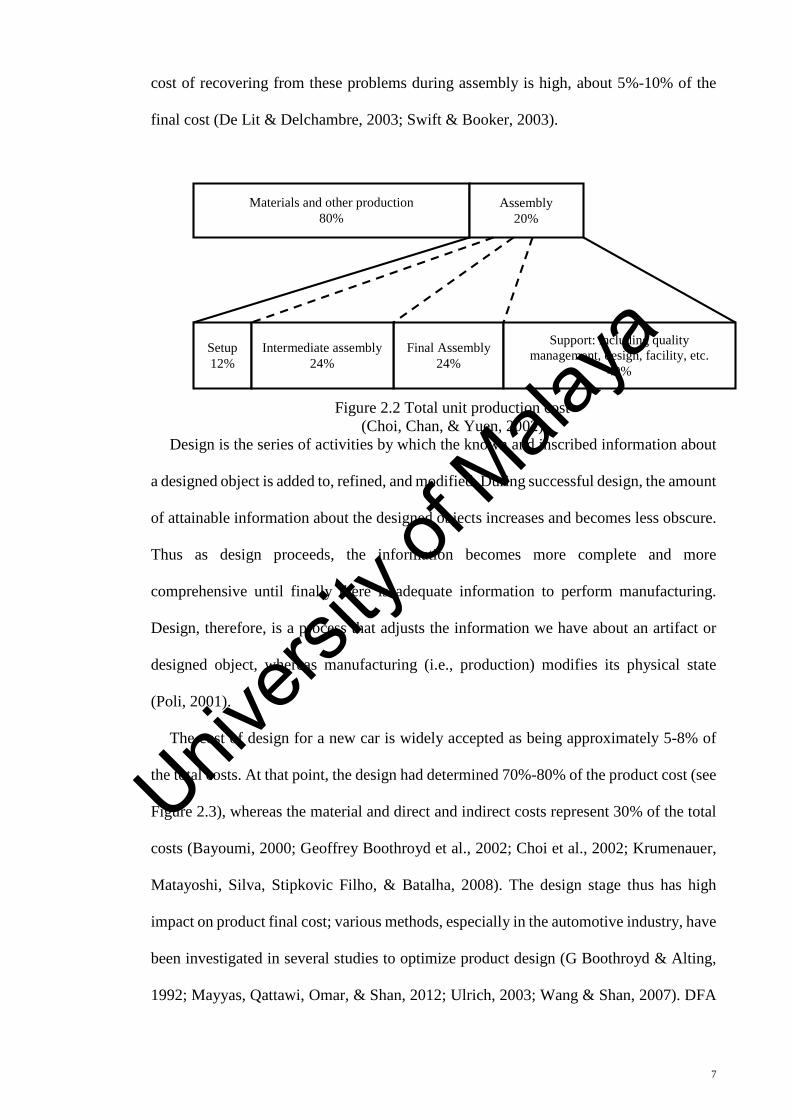
cost of recovering from these problems during assembly is high, about 5%-10% of the
final cost (De Lit & Delchambre, 2003; Swift & Booker, 2003).
Design is the series of activities by which the known and inscribed information about
a designed object is added to, refined, and modified. During successful design, the amount
of attainable information about the designed objects increases and becomes less obscure.
Thus as design proceeds, the information becomes more complete and more
comprehensive until finally there is adequate information to perform manufacturing.
Design, therefore, is a process that adjusts the information we have about an artifact or
designed object, whereas manufacturing (i.e., production) modifies its physical state
(Poli, 2001).
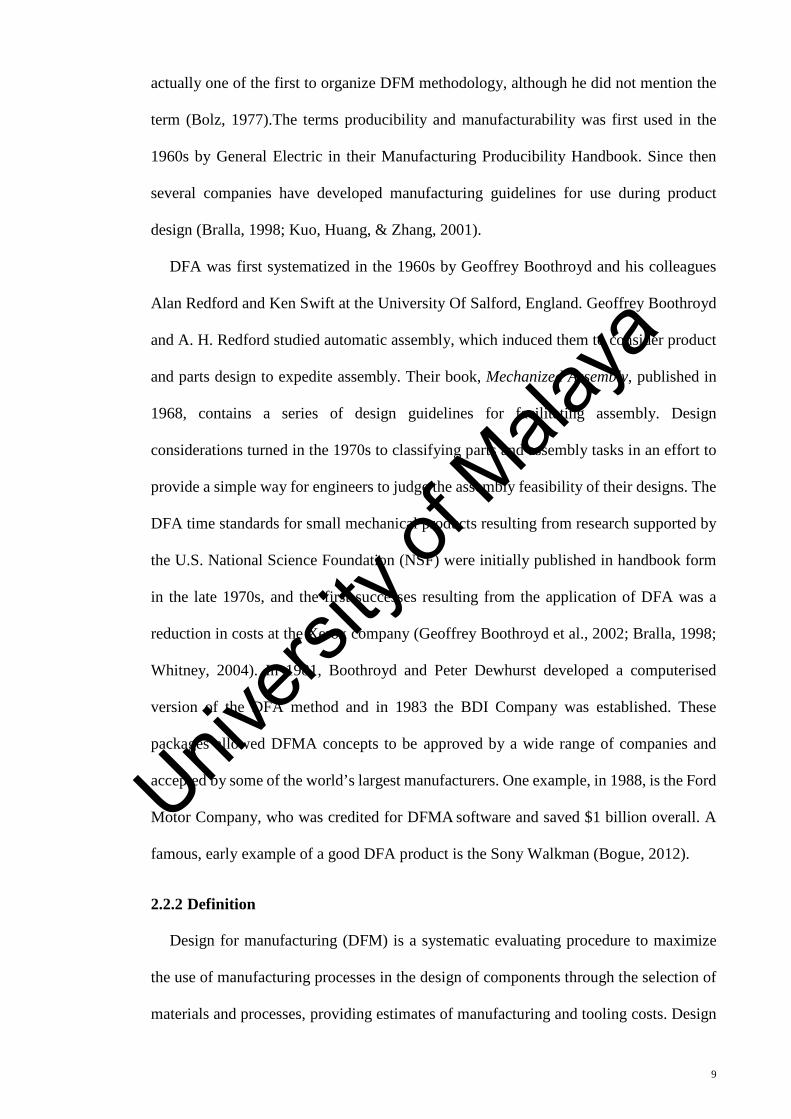
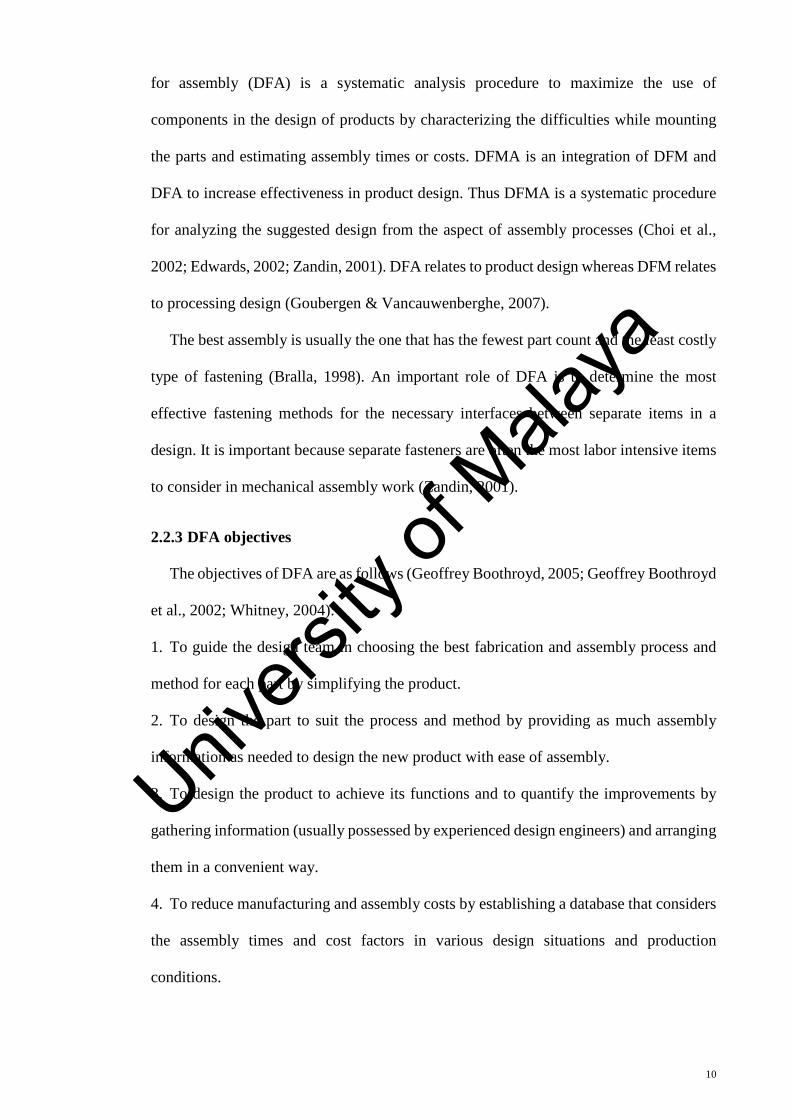
The cost of design for a new car is widely accepted as being approximately 5-8% of
the total costs. At that point, the design had determined 70%-80% of the product cost (see
Figure 2.3), whereas the material and direct and indirect costs represent 30% of the total
costs (Bayoumi, 2000; Geoffrey Boothroyd et al., 2002; Choi et al., 2002; Krumenauer,
Matayoshi, Silva, Stipkovic Filho, & Batalha, 2008). The design stage thus has high
impact on product final cost; various methods, especially in the automotive industry, have
been investigated in several studies to optimize product design (G Boothroyd & Alting,
1992; Mayyas, Qattawi, Omar, & Shan, 2012; Ulrich, 2003; Wang & Shan, 2007). DFA
Materials and other production 80%
Assembly 20%
Setup 12%
Final Assembly 24%
Intermediate assembly 24%
Support: including quality management, design, facility, etc.
40%
Figure 2.2 Total unit production cost (Choi, Chan, & Yuen, 2002)
7
Univers
ity of
Mala
ya
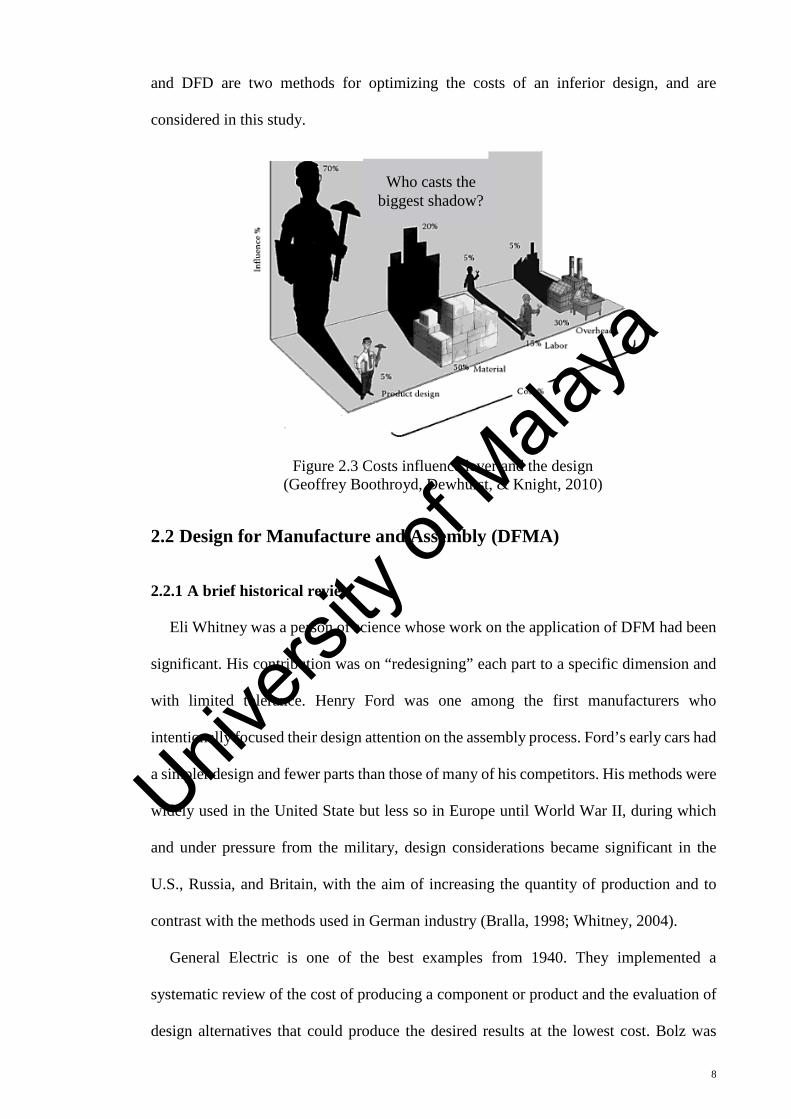
and DFD are two methods for optimizing the costs of an inferior design, and are
considered in this study.
Figure 2.3 Costs influence lever and the design (Geoffrey Boothroyd, Dewhurst, & Knight, 2010)
2.2 Design for Manufacture and Assembly (DFMA)
2.2.1 A brief historical review
Eli Whitney was a person of science whose work on the application of DFM had been
significant. His contribution was on “redesigning” each part to a specific dimension and
with limited tolerance. Henry Ford was one among the first manufacturers who
intentionally focused their design attention on the assembly process. Ford’s early cars had
a simpler design and fewer parts than those of many of his competitors. His methods were
widely used in the United State but less so in Europe until World War II, during which
and under pressure from the military, design considerations became significant in the
U.S., Russia, and Britain, with the aim of increasing the quantity of production and to
contrast with the methods used in German industry (Bralla, 1998; Whitney, 2004).
General Electric is one of the best examples from 1940. They implemented a
systematic review of the cost of producing a component or product and the evaluation of
design alternatives that could produce the desired results at the lowest cost. Bolz was
Who casts the biggest shadow?
8
Univers
ity of
Mala
ya
actually one of the first to organize DFM methodology, although he did not mention the
term (Bolz, 1977).The terms producibility and manufacturability was first used in the
1960s by General Electric in their Manufacturing Producibility Handbook. Since then
several companies have developed manufacturing guidelines for use during product
design (Bralla, 1998; Kuo, Huang, & Zhang, 2001).
DFA was first systematized in the 1960s by Geoffrey Boothroyd and his colleagues
Alan Redford and Ken Swift at the University Of Salford, England. Geoffrey Boothroyd
and A. H. Redford studied automatic assembly, which induced them to consider product
and parts design to expedite assembly. Their book, Mechanized Assembly, published in
1968, contains a series of design guidelines for facilitating assembly. Design
considerations turned in the 1970s to classifying parts and assembly tasks in an effort to
provide a simple way for engineers to judge the assembly feasibility of their designs. The
DFA time standards for small mechanical products resulting from research supported by
the U.S. National Science Foundation (NSF) were initially published in handbook form
in the late 1970s, and the first successes resulting from the application of DFA was a
reduction in costs at the Xerox company (Geoffrey Boothroyd et al., 2002; Bralla, 1998;
Whitney, 2004). In 1981, Boothroyd and Peter Dewhurst developed a computerised
version of the DFA method and in 1983 the BDI Company was established. These
packages allowed DFMA concepts to be approved by a wide range of companies and
accepted by some of the world’s largest manufacturers. One example, in 1988, is the Ford
Motor Company, who was credited for DFMA software and saved $1 billion overall. A
famous, early example of a good DFA product is the Sony Walkman (Bogue, 2012).
2.2.2 Definition
Design for manufacturing (DFM) is a systematic evaluating procedure to maximize
the use of manufacturing processes in the design of components through the selection of
materials and processes, providing estimates of manufacturing and tooling costs. Design
9
Univers
ity of
Mala
ya
for assembly (DFA) is a systematic analysis procedure to maximize the use of
components in the design of products by characterizing the difficulties while mounting
the parts and estimating assembly times or costs. DFMA is an integration of DFM and
DFA to increase effectiveness in product design. Thus DFMA is a systematic procedure
for analyzing the suggested design from the aspect of assembly processes (Choi et al.,
2002; Edwards, 2002; Zandin, 2001). DFA relates to product design whereas DFM relates
to processing design (Goubergen & Vancauwenberghe, 2007).
The best assembly is usually the one that has the fewest part count and the least costly
type of fastening (Bralla, 1998). An important role of DFA is to determine the most
effective fastening methods for the necessary interfaces between separate items in a
design. It is important because separate fasteners are often the most labor intensive items
to consider in mechanical assembly work (Zandin, 2001).
2.2.3 DFA objectives
The objectives of DFA are as follows (Geoffrey Boothroyd, 2005; Geoffrey Boothroyd
et al., 2002; Whitney, 2004):
1. To guide the design team in choosing the best fabrication and assembly process and
method for each part by simplifying the product.
2. To design the part to suit the process and method by providing as much assembly
information as needed to design the new product with ease of assembly.
3. To design the product to achieve its functions and to quantify the improvements by
gathering information (usually possessed by experienced design engineers) and arranging
them in a convenient way.
4. To reduce manufacturing and assembly costs by establishing a database that considers
the assembly times and cost factors in various design situations and production
conditions.
10
Univers
ity of
Mala
ya
5. To benchmark existing products against a competitor’s products and to quantify the
manufacturing and assembly difficulties.
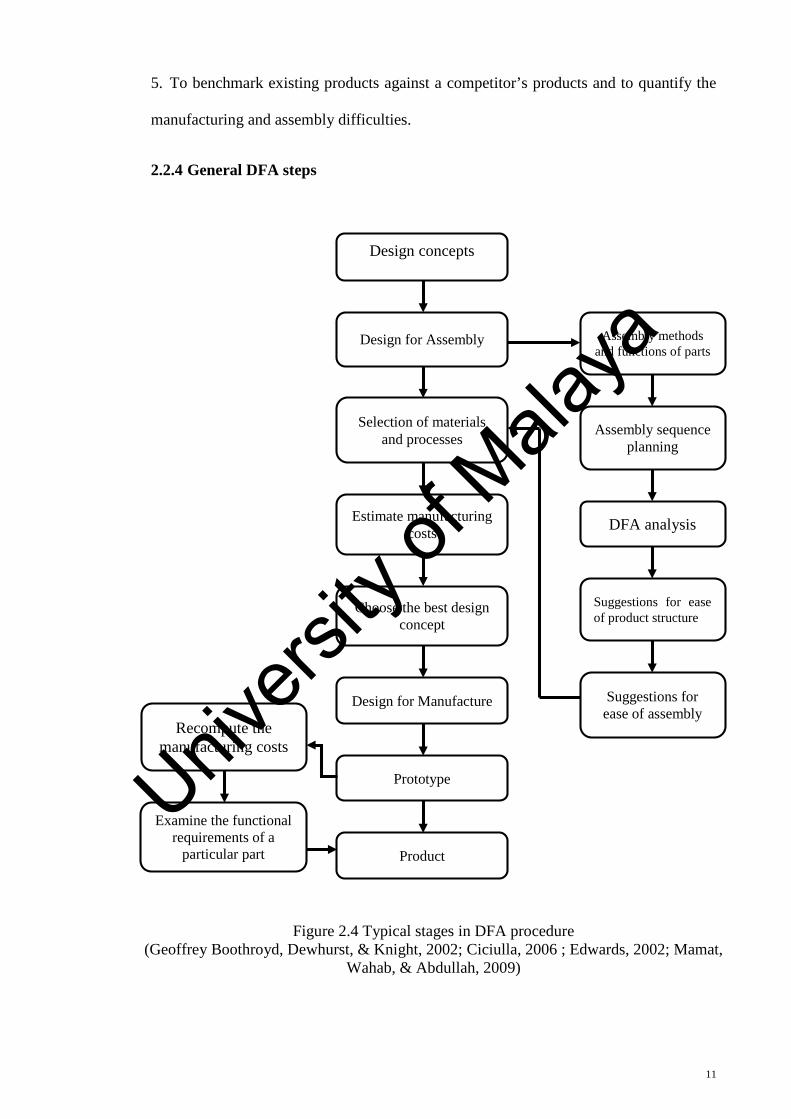
2.2.4 General DFA steps
Figure 2.4 Typical stages in DFA procedure (Geoffrey Boothroyd, Dewhurst, & Knight, 2002; Ciciulla, 2006 ; Edwards, 2002; Mamat,
Wahab, & Abdullah, 2009)
Recompute the manufacturing costs
Examine the functional requirements of a
particular part
Design concepts
Design for Assembly
Selection of materials and processes
Estimate manufacturing costs
Choose the best design concept
Design for Manufacture
Prototype
Product
Assembly methods and functions of parts
Assembly sequence planning
DFA analysis
Suggestions for ease of product structure
Suggestions for ease of assembly
11
Univers
ity of
Mala
ya
2.2.5 Benefits of DFA
The obvious benefits include lower production cost. Lower assembly costs results from
easy assembly and fewer parts minimizing manual labor (Bayoumi, 2000). Reduction in
product manufacturing cost, however, is not necessarily considered to be the most desired
outcome of redesign efforts (Geoffrey Boothroyd et al., 2002). DFA also gives benefits
such as improved ergonomics, reduced work, higher quality, increased reliability,
improved serviceability, reduced time to market launch and fewer production challenges
(Coma, Mascle, & Véron, 2003; Huang & Mak, 1998; Krumenauer et al., 2008).
DFA thus not only helps the manufactures who embrace it become more profitable
and more competitive, it also helps industries address other societal keys, e.g., considering
the factory floor operator in the design ergonomics reduces workplace injuries and related
health care costs (Munro, 1998).
DFA generates product and process benefits and enables a company to increase plant
capacity without having to expand facilities.
2.2.6 DFA Guidelines
Otto and Wood (2001) compiled the following list of general DFA guidelines from
various sources including Iredale, Crow, Tipping and Paterson. These are the
fundamental principles and thought processes that exemplify assembly-oriented design.
Systematic DFA methodologies were born on these principles and through use of these
types of guidelines.
Applying these types of design guidelines is the simplest way to approach DFA in
the product design. The designers need to be mindful of the fact that to every rule and
guideline there are exceptions. These guidelines should be approached and implemented
parallel with clear delineation of the design goals.
12
Univers
ity of
Mala
ya
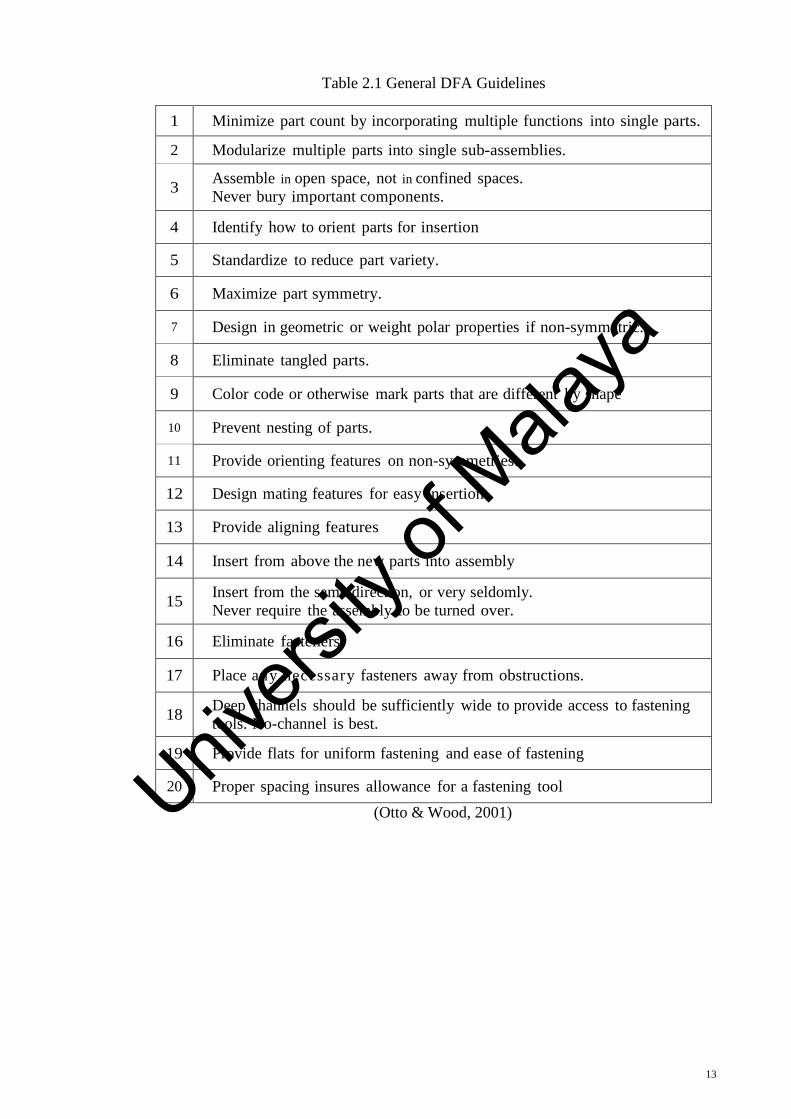
Table 2.1 General DFA Guidelines
1 Minimize part count by incorporating multiple functions into single parts.
2 Modularize multiple parts into single sub-assemblies.
3 Assemble in open space, not in confined spaces. Never bury important components.
4 Identify how to orient parts for insertion
5 Standardize to reduce part variety.
6 Maximize part symmetry.
7 Design in geometric or weight polar properties if non-symmetric.
8 Eliminate tangled parts.
9 Color code or otherwise mark parts that are different by shape
10 Prevent nesting of parts.
11 Provide orienting features on non-symmetries.
12 Design mating features for easy insertion.
13 Provide aligning features
14 Insert from above the new parts into assembly
15 Insert from the same direction, or very seldomly. Never require the assembly to be turned over.
16 Eliminate fasteners.
17 Place any necessary fasteners away from obstructions.
18 Deep channels should be sufficiently wide to provide access to fastening tools. No-channel is best.
19 Provide flats for uniform fastening and ease of fastening
20 Proper spacing insures allowance for a fastening tool (Otto & Wood, 2001)
13
Univers
ity of
Mala
ya
2.2.7 DFA methods
Throughout the years, many DFA methods have been developed and implemented.
Some are more effective than the others on some applications. DFA methods include
(Geoffrey Boothroyd et al., 2002; Bralla, 1998; Stone, McAdams, & Kayyalethekkel,
2004; Whitney, 2004):
1. The Boothroyd and Dewhurst Method
2. The Hitachi Assemble Ability Evaluation Method
3. Lucas Hull DFA Method
4. The Westinghouse DFA Calculator
5. The Toyota Ergonomic Evaluation Method
6. Sony DFA Methods
7. Xerox Producibility Analysis
2.2.8 Boothroyd and Dewhurst Method
One of the most widely recognized DFA methods was formulated by Boothroyd and
Dewhurst. The DFA analysis focuses on redesigning an existing product through a two-
step procedure applied to each part in the assembly. The first step questions each part to
determine if it is necessary or is a candidate for elimination or combination with other
parts in the assembly. The second step evaluates parts assembly in terms of ease of
handling and insertion. The findings are then compared with synthetic data, before time
and costs are accordingly generated for the assembly of each part (Appendix B and C)
(Geoffrey Boothroyd et al., 2002).
Design efficiency (DFA index) rating can be calculated and used to compare different
designs from these two steps. Higher DFA index indicates that a particular product is
easier to assemble. The number of parts and assembly difficulties are two main factors
that influence product assembly cost (Geoffrey Boothroyd et al., 2002). The DFA index
of a product can be calculated by Equation 2.1 (Geoffrey Boothroyd, 2005).
14
Univers
ity of
Mala
ya
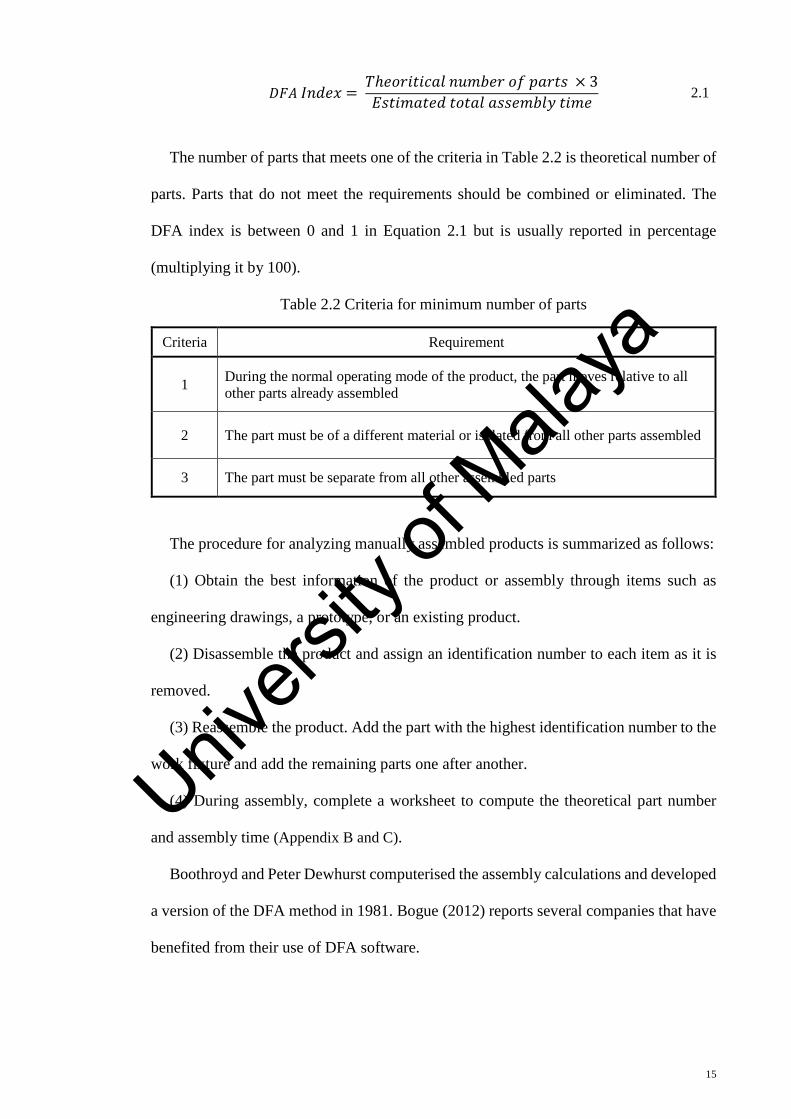
𝐷𝐷𝐷𝐷𝐷𝐷 𝐼𝐼𝐼𝐼𝐼𝐼𝐼𝐼𝐼𝐼 = 𝑇𝑇ℎ𝐼𝐼𝑒𝑒𝑒𝑒𝑒𝑒𝑒𝑒𝑒𝑒𝑒𝑒𝑒𝑒𝑒𝑒 𝐼𝐼𝑛𝑛𝑛𝑛𝑛𝑛𝐼𝐼𝑒𝑒 𝑒𝑒𝑜𝑜 𝑝𝑝𝑒𝑒𝑒𝑒𝑒𝑒𝑝𝑝 × 3𝐸𝐸𝑝𝑝𝑒𝑒𝑒𝑒𝑛𝑛𝑒𝑒𝑒𝑒𝐼𝐼𝐼𝐼 𝑒𝑒𝑒𝑒𝑒𝑒𝑒𝑒𝑒𝑒 𝑒𝑒𝑝𝑝𝑝𝑝𝐼𝐼𝑛𝑛𝑛𝑛𝑒𝑒𝑎𝑎 𝑒𝑒𝑒𝑒𝑛𝑛𝐼𝐼 2.1
The number of parts that meets one of the criteria in Table 2.2 is theoretical number of
parts. Parts that do not meet the requirements should be combined or eliminated. The
DFA index is between 0 and 1 in Equation 2.1 but is usually reported in percentage
(multiplying it by 100).
Table 2.2 Criteria for minimum number of parts
Criteria Requirement
1 During the normal operating mode of the product, the part moves relative to all other parts already assembled
2 The part must be of a different material or isolated from all other parts assembled
3 The part must be separate from all other assembled parts
The procedure for analyzing manually assembled products is summarized as follows:
(1) Obtain the best information of the product or assembly through items such as
engineering drawings, a prototype, or an existing product.
(2) Disassemble the product and assign an identification number to each item as it is
removed.
(3) Reassemble the product. Add the part with the highest identification number to the
work fixture and add the remaining parts one after another.
(4) During assembly, complete a worksheet to compute the theoretical part number
and assembly time (Appendix B and C).
Boothroyd and Peter Dewhurst computerised the assembly calculations and developed
a version of the DFA method in 1981. Bogue (2012) reports several companies that have
benefited from their use of DFA software.
15
Univers
ity of
Mala
ya
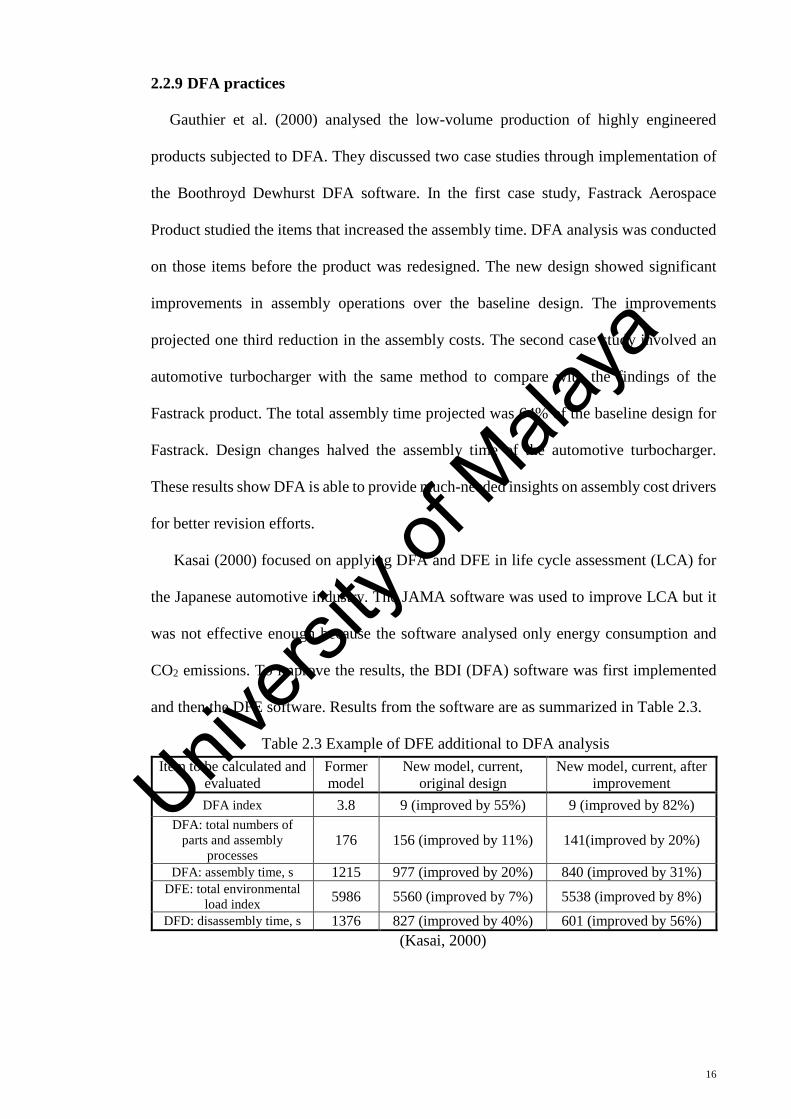
2.2.9 DFA practices
Gauthier et al. (2000) analysed the low-volume production of highly engineered
products subjected to DFA. They discussed two case studies through implementation of
the Boothroyd Dewhurst DFA software. In the first case study, Fastrack Aerospace
Product studied the items that increased the assembly time. DFA analysis was conducted
on those items before the product was redesigned. The new design showed significant
improvements in assembly operations over the baseline design. The improvements
projected one third reduction in the assembly costs. The second case study involved an
automotive turbocharger with the same method to compare with the findings of the
Fastrack product. The total assembly time projected was 64% of the baseline design for
Fastrack. Design changes halved the assembly time of the automotive turbocharger.
These results show DFA is able to provide much-needed insights on assembly cost drivers
for better revision efforts.
Kasai (2000) focused on applying DFA and DFE in life cycle assessment (LCA) for
the Japanese automotive industry. The JAMA software was used to improve LCA but it
was not effective enough because the software analysed only energy consumption and
CO2 emissions. To improve the results, the BDI (DFA) software was first implemented
and then the DFE software. Results from the software are as summarized in Table 2.3.
Table 2.3 Example of DFE additional to DFA analysis
(Kasai, 2000)
Item to be calculated and evaluated
Former model
New model, current, original design
New model, current, after improvement
DFA index 3.8 9 (improved by 55%) 9 (improved by 82%) DFA: total numbers of
parts and assembly processes
176 156 (improved by 11%) 141(improved by 20%)
DFA: assembly time, s 1215 977 (improved by 20%) 840 (improved by 31%) DFE: total environmental
load index 5986 5560 (improved by 7%) 5538 (improved by 8%) DFD: disassembly time, s 1376 827 (improved by 40%) 601 (improved by 56%)
16
Univers
ity of
Mala
ya
The results showed significant improvements in assembly and disassembly efficiency
of the product design, but no information was given about the details to achieve these
improvements.
An article by Choi et al. (2002) discusses the effectiveness of a virtual assembly
software (DYNAMO) and its relation to BDI (DFA) software. DYNAMO helps designers
find an acceptable assembly sequence but does not provide an optimum assembly
sequence. The software checks the assembly collision and clearance violation. After it
has checked the optimum assembly paths for collision, the assembly sequence is selected
based on user experience. BDI (DFA) software does not give a graphical view of the
assembly, so DYNAMO with 3D visualization can be combined with it. The combination
improves the design evaluation process and further saves cost. This paper, however, does
not detail the BDI (DFA) software’s input and output.
Stone et al. (2004) presented a novel product architecture-based DFA method. In two
case studies the efficiency of this new approach was compared with the well-known
Boothroyd and Dewhurst DFA method. In the Boothroyd Dewhurst DFA method each
part is first evaluated to determine whether it is necessary, can be eliminated, or can be
combined with the other parts in an assembly. Then, handling, insertion, and other
difficulties are considered to estimate the assembly process time. The product’s
architecture-based method is summarized in 5 steps as in Figure 2.3.
17
Univers
ity of
Mala
ya
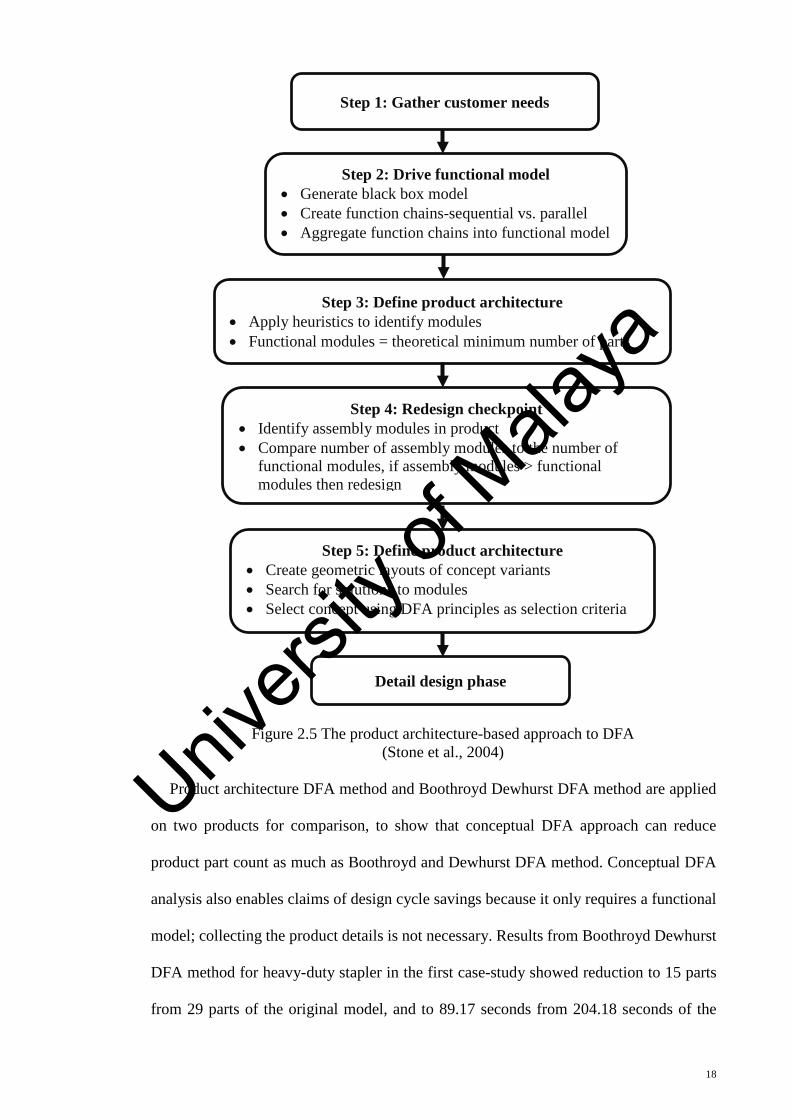
Figure 2.5 The product architecture-based approach to DFA (Stone et al., 2004)
Product architecture DFA method and Boothroyd Dewhurst DFA method are applied
on two products for comparison, to show that conceptual DFA approach can reduce
product part count as much as Boothroyd and Dewhurst DFA method. Conceptual DFA
analysis also enables claims of design cycle savings because it only requires a functional
model; collecting the product details is not necessary. Results from Boothroyd Dewhurst
DFA method for heavy-duty stapler in the first case-study showed reduction to 15 parts
from 29 parts of the original model, and to 89.17 seconds from 204.18 seconds of the
Step 1: Gather customer needs
Step 2: Drive functional model • Generate black box model • Create function chains-sequential vs. parallel • Aggregate function chains into functional model
Step 3: Define product architecture • Apply heuristics to identify modules • Functional modules = theoretical minimum number of parts
Step 4: Redesign checkpoint • Identify assembly modules in product • Compare number of assembly modules to the number of
functional modules, if assembly modules > functional modules then redesign
Step 5: Define product architecture • Create geometric layouts of concept variants • Search for solutions to modules • Select concept using DFA principles as selection criteria
Detail design phase
18
Univers
ity of
Mala
ya
assembly time. Through product architecture-based method, the part count reduced from
29 to 11 and the assembly time was assumed to be 88.04 seconds. The assembly time of
the original design was identical because it had been determined from Boothroyd
Dewhurst manual assembly time estimations. In the second case–study, on an electric
wok, fourteen parts were assumed to be eliminated. The assembly time improved from
233.48 seconds to 125.84 seconds through Boothroyd Dewhurst DFA method. In the new
design approach, 20 parts were eliminated and 233.48 seconds of assembly time
decreased to 91 seconds. The conclusion is that conceptual DFA is not a redesign method
but it helps designers concurrently consider DFA guidelines early on in the design stage.
The new method decreased more parts than did the Boothroyd Dewhurst DFA. This paper
discusses the potential of these two methods in reducing parts, though the part reduction
is theoretical and may not be achievable in a real product design through an architecture-
based method.
Ease of assembly and ergonomic issues were considered by Mamat et al. (2009). The
analyzed product was Proton’s (automobile) front seats. Boothroyd Dewhurst DFA
software was used to analyse the design efficiency. Software suggestions not only
simplified the product but also helped the author eliminate some ergonomic difficulties.
Yet another conclusion is that lifecycle considerations and difficulties should be
considered earlier on in the design stage. There was neither any comparison between the
new and old design nor the time saving ability of the software.
2.3 Design for Environment (Disassembly)
LCA (life cycle assessment) refers to the input–output exchange processes between
the environment and any given product throughout the phases of its life, from extraction
and processing of the raw materials to the production, transportation, distribution, use,
remanufacturing, recycling, and disposal processes (Gungor & Gupta, 1999; Vezzoli &
Manzini, 2008).
19
Univers
ity of
Mala
ya
If the specific phase of a product life focuses on minimizing environmental impact, it
improves the product design from an environmental perspective through Designing for
Environment (DFE). DFD is one aspect of DFE (Gungor & Gupta, 1999). It concentrates
on easy disassembly of a product through easy and economical separation of its parts and
materials. Designing the product for easy separation also facilitates maintenance, repairs,
updating, and re-manufacturing (Vezzoli & Manzini, 2008).
2.3.1 Principles of DFD
These are the general guidelines for improving disassembly. More details can be found
in the Design for Environment Sustainability Handbook (Vezzoli & Manzini, 2008).
Some of the guidelines are common in DFD and DFA (Chen, 2010; Scheuring, Bras, &
Lee, 1994).
1. Minimizing the number of items in disassembly
2. Reducing the number of separate fasteners
3. Making the parts accessible in disassembly
4. Avoiding orientation changes during disassembly
5. Using simple standard tools in disassembly process
6. Using attachments that are reversible and easy to disassemble without making the
joints unreliable
7. Minimizing the structures or components combined with different materials
8. Minimizing the use of hazardous substance
9. Designing products for reuse (through nondestructive separation methods)
10. Reducing the number of different materials
11. Avoiding non-compatible materials in the product structure
12. Selecting an efficient disassembly sequence
20
Univers
ity of
Mala
ya
2.3.2 DFD evaluation methods
• Hitachi Disassemble Ability Evaluation Method (Go, Wahab, Rahman, Ramli, &
Azhari, 2011)
• Spread sheet-like chart (Kroll & Hanft, 1998)
• BDI & TNO (Gupta & Veerakamolmal, 1996; Harjula, Rapoza, Knight, &
Boothroyd, 1996)
• AND/OR graph (Vinodh, Kumar, & Nachiappan, 2011)
• Disassembly Petri net (DPN) graph (Vinodh et al., 2011)
• Work Factor Method (Go et al., 2011)
• Genetic algorithm (Kongar & Gupta, 2006)
2.3.3 BDI & TNO analysis procedure
The Boothroyd method estimates the disassembly time and cost for every part in the
same way that the assembly time is calculated in Boothroyd and Dewhurst method (refer
to past discussion). Environmental assessment is obtained in terms of a single figure
indicator called MET points (Material cycles, Energy use, and Toxic emissions),
developed by the TNO Industry Centre in Delft, the analysis tool a collaborative
production with Boothroyd and Dewhurst Inc.. The best disassembly sequence can be
selected according to the cost of disassembly and environmental impact (Harjula et al.,
1996; W. Knight, 1999). The structure and procedure for the DFE analysis method is as
shown in Figure 2.6.
21
Univers
ity of
Mala
ya
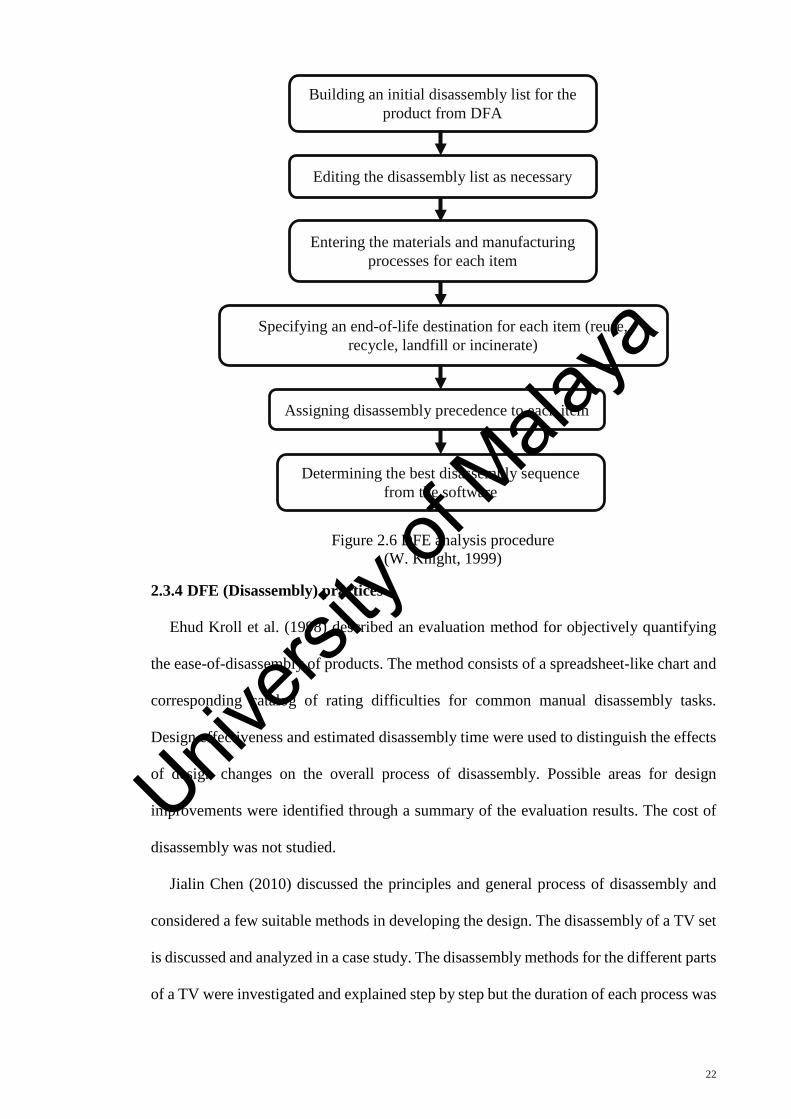
Figure 2.6 DFE analysis procedure (W. Knight, 1999)
2.3.4 DFE (Disassembly) practices
Ehud Kroll et al. (1998) described an evaluation method for objectively quantifying
the ease-of-disassembly of products. The method consists of a spreadsheet-like chart and
corresponding catalog of rating difficulties for common manual disassembly tasks.
Design effectiveness and estimated disassembly time were used to distinguish the effects
of design changes on the overall process of disassembly. Possible areas for design
improvements were identified through a summary of the evaluation results. The cost of
disassembly was not studied.
Jialin Chen (2010) discussed the principles and general process of disassembly and
considered a few suitable methods in developing the design. The disassembly of a TV set
is discussed and analyzed in a case study. The disassembly methods for the different parts
of a TV were investigated and explained step by step but the duration of each process was
Building an initial disassembly list for the product from DFA
Editing the disassembly list as necessary
Entering the materials and manufacturing processes for each item
Specifying an end-of-life destination for each item (reuse, recycle, landfill or incinerate)
Assigning disassembly precedence to each item
Determining the best disassembly sequence from the software
22
Univers
ity of
Mala
ya
not stated. Given, however, were the general methods and principles for improvement of
disassembly efficiency regardless of the application to the TV set.
The study by Vinodh et al. (2011) presented the disassembly modeling of PS (phase
selector) switch through component mating graph, directed graph, AND/OR graph, and
DPN. Compare with other articles in this field, the economic benefits were also calculated
and portrayed, giving the author a clear view of the magnitude of the gain developed by
implementing the disassembly operation on a rotary switch. The advantages and
drawbacks of all the modeling approaches were also discussed. The disassembly was
planned on a reverse assembly approach. The disassembly leveling focused on generating
feasible disassembly sequence. The disassembly precedence matrix and the final
disassembly tree were reported and compared.
2.4 Summary
This chapter focused on background information on DFA and DFD, their benefits,
guidelines, and methods. Boothroyd and Dewhurst method has been explained as being
one of the oldest and most widely used among DFA and DFD methods. Use of DFA and
DFD has been shown to save time and costs throughout various industries.
23
Univers
ity of
Mala
ya
CHAPTER 3 METHODOLOGY
METHODOLOGY
As mentioned, the Boothroyd and Dewhurst Method is one of the oldest and most
reliable methods for assembly analysis. In this dissertation, the DFA software version 9.3
(by BDI) was used for its analysis and implementation.
For disassembly, the DFE software version 1 (by BDI & TNO’s) was implemented, to
determine the financial effects of a product design in its end-of-life disassembly. The
product’s initial and end-of-life environmental effects were investigated. The software
uses a method suggested by the TNO Product Centre of the Delft University of
Technology for environmental assessment, which takes into account the effects of
Materials, Energy and Toxicity (MET) on the environment.
DFM Concurrent Costing V2.2 was used to estimate the cost of manufacturing and
producing the parts quickly, because item costs cannot easily be provided for this product.
The components costs were used to compare the costs of the old and new designs in DFA
and DFE software. The software products are located at the industrial lab of the University
of Malaya Mechanical Engineering Department.
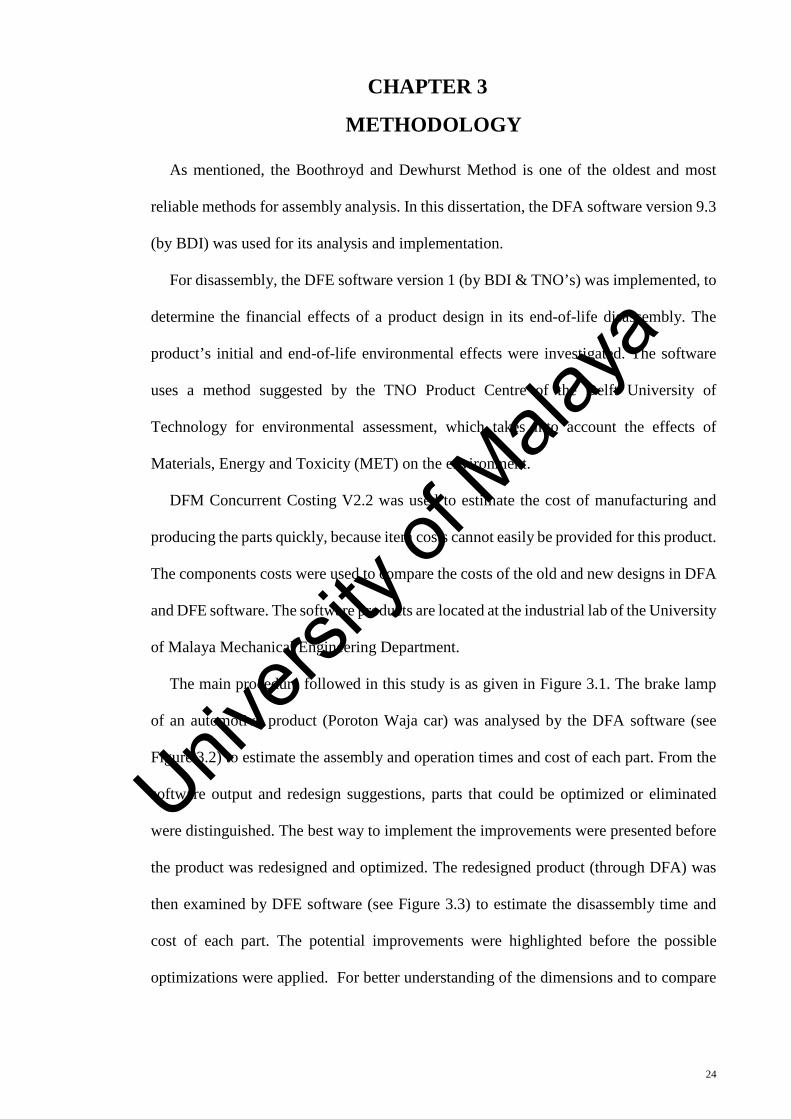
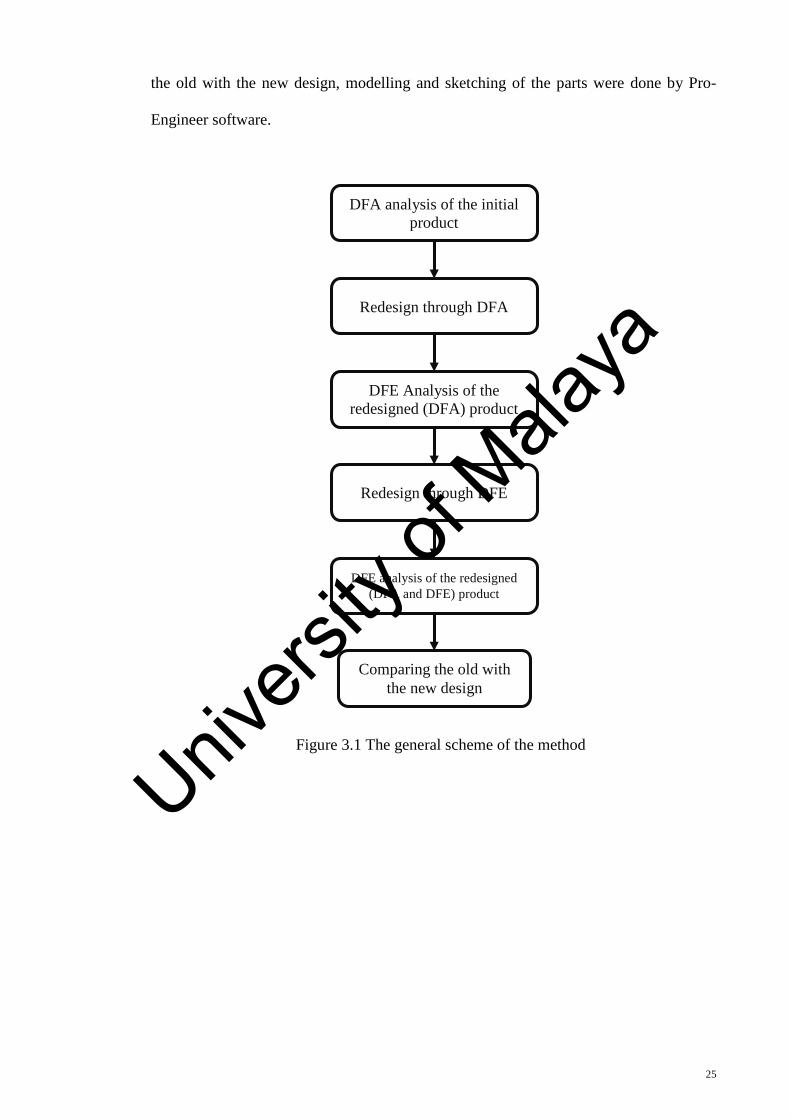
The main procedure followed in this study is as given in Figure 3.1. The brake lamp
of an automotive product (Poroton Waja car) was analysed by the DFA software (see
Figure 3.2) to estimate the assembly and operation times and cost of each part. From the
software output and redesign suggestions, parts that could be optimized or eliminated
were distinguished. The best way to implement the improvements were presented before
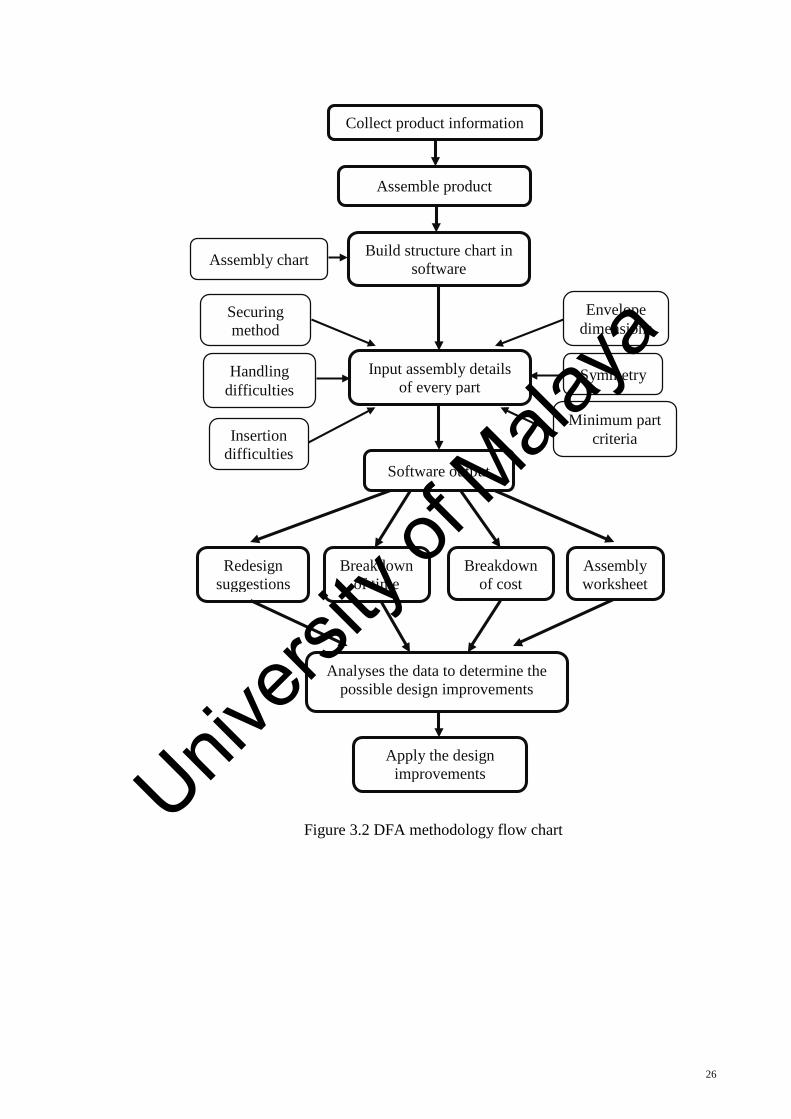
the product was redesigned and optimized. The redesigned product (through DFA) was
then examined by DFE software (see Figure 3.3) to estimate the disassembly time and
cost of each part. The potential improvements were highlighted before the possible
optimizations were applied. For better understanding of the dimensions and to compare
24
Univers
ity of
Mala
ya
the old with the new design, modelling and sketching of the parts were done by Pro-
Engineer software.
DFA analysis of the initial product
Redesign through DFA
DFE Analysis of the redesigned (DFA) product
DFE analysis of the redesigned (DFA and DFE) product
Redesign through DFE
Comparing the old with the new design
Figure 3.1 The general scheme of the method
25
Univers
ity of
Mala
ya
Handling difficulties
Assemble product
Collect product information
Build structure chart in software Assembly chart
Envelope dimensions
Securing method
Symmetry
Software output
Analyses the data to determine the possible design improvements
Assembly worksheet
Apply the design improvements
Input assembly details of every part
Insertion difficulties
Minimum part criteria
Breakdown of cost
Breakdown of time
Redesign suggestions
Figure 3.2 DFA methodology flow chart
26
Univers
ity of
Mala
ya
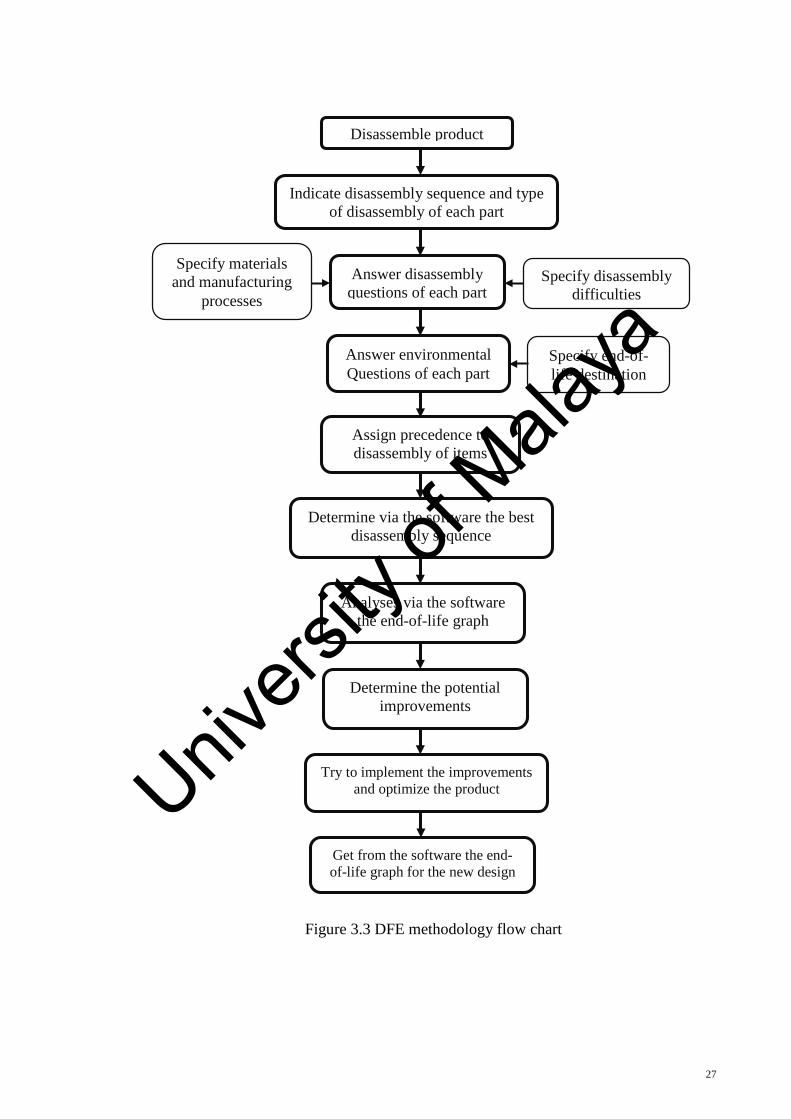
Disassemble product
Indicate disassembly sequence and type of disassembly of each part
Answer disassembly questions of each part
Answer environmental Questions of each part
Specify disassembly difficulties
Specify materials and manufacturing
processes
Specify end-of-life destination
Assign precedence to disassembly of items
Analyses via the software the end-of-life graph
Determine via the software the best disassembly sequence
Determine the potential improvements
Try to implement the improvements and optimize the product
Get from the software the end-of-life graph for the new design
Figure 3.3 DFE methodology flow chart
27
Univers
ity of
Mala
ya
3.1 Design overview:
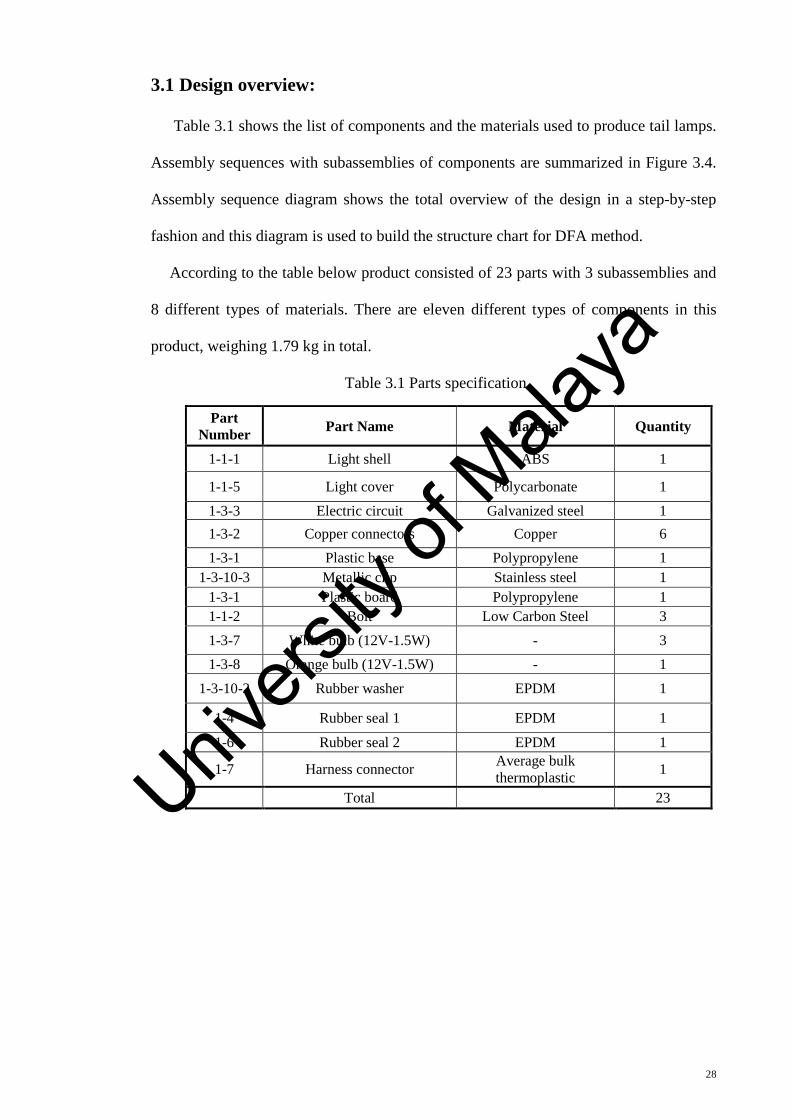
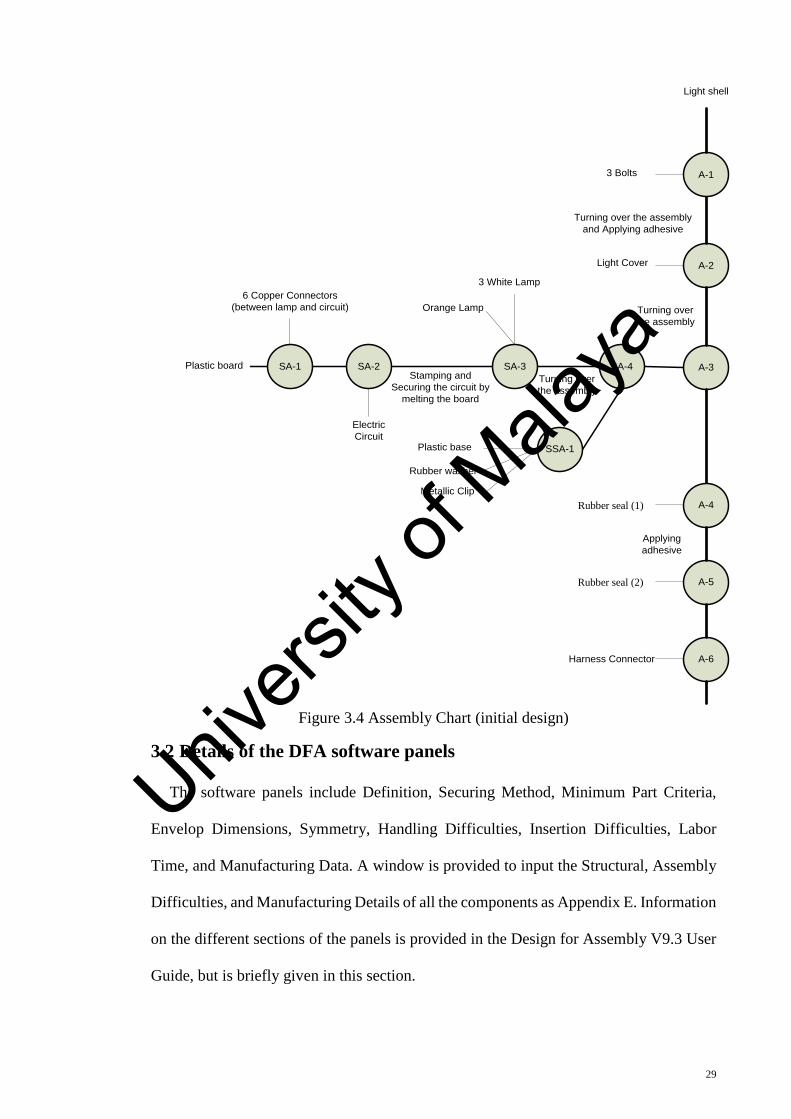
Table 3.1 shows the list of components and the materials used to produce tail lamps.
Assembly sequences with subassemblies of components are summarized in Figure 3.4.
Assembly sequence diagram shows the total overview of the design in a step-by-step
fashion and this diagram is used to build the structure chart for DFA method.
According to the table below product consisted of 23 parts with 3 subassemblies and
8 different types of materials. There are eleven different types of components in this
product, weighing 1.79 kg in total.
Table 3.1 Parts specification
Part Number Part Name Material Quantity
1-1-1 Light shell ABS 1
1-1-5 Light cover Polycarbonate 1 1-3-3 Electric circuit Galvanized steel 1 1-3-2 Copper connectors Copper 6 1-3-1 Plastic base Polypropylene 1
1-3-10-3 Metallic clip Stainless steel 1 1-3-1 Plastic board Polypropylene 1 1-1-2 Bolt Low Carbon Steel 3 1-3-7 White bulb (12V-1.5W) - 3 1-3-8 Orange bulb (12V-1.5W) - 1
1-3-10-2 Rubber washer EPDM 1
1-4 Rubber seal 1 EPDM 1 1-6 Rubber seal 2 EPDM 1
1-7 Harness connector Average bulk thermoplastic 1
Total 23
28
Univers
ity of
Mala
ya
A-3
A-2
SA-3
3 Bolts
Light shell
SA-2SA-1Plastic board
Electric Circuit
6 Copper Connectors (between lamp and circuit)
SSA-1Plastic base
Metallic Clip
3 White Lamp
Orange Lamp
Washer1
Stamping and Securing the circuit by
melting the board
Rubber washer
SA-4Turning over the assembly
A-4
A-1
A-5Washer2
Light Cover
Turning over the assembly and Applying adhesive
Turning over the assembly
Applying adhesive
A-6Harness Connector
Figure 3.4 Assembly Chart (initial design)
3.2 Details of the DFA software panels
The software panels include Definition, Securing Method, Minimum Part Criteria,
Envelop Dimensions, Symmetry, Handling Difficulties, Insertion Difficulties, Labor
Time, and Manufacturing Data. A window is provided to input the Structural, Assembly
Difficulties, and Manufacturing Details of all the components as Appendix E. Information
on the different sections of the panels is provided in the Design for Assembly V9.3 User
Guide, but is briefly given in this section.
Rubber seal (1)
Rubber seal (2)
29
Univers
ity of
Mala
ya
3.2.1 Minimum-part criteria
At the Minimum-Part Criteria tab a user must specify the purpose of the individual
items by classifying the item as either theoretically necessary or a candidate for
elimination. According to the Boothroyd and Dewhurst method the only parts
theoretically required are items that:
1. Have to move relative to the rest of the assembly.
2. Must be made from a different material.
3. Must be separate for reasons of assembly or repair.
4. Act as a base part (one per product)
The minimum-part count is the sum of the number of all the parts that fall into one of
these four categories. Any other item not included in the group is considered a candidate
for elimination. If we define a well-designed product to be one that needs all the parts it
has, it typically would have three times the number of parts predicted by the minimum-
part count.
3.2.2 Envelope dimensions
In the envelope dimensions tab, a user chooses the item shape - cylindrical or
rectangular. A cylindrical item has as input variables its diameter and height whereas a
rectangular item has length, width, and height. If an item is extremely small (or extremely
big), the software decides that the item is difficult to handle and/or assemble; it thus
includes extra time for assembling the item.
3.2.3 Symmetry
Users must specify the symmetries of an item because parts that are symmetrical are
easier to align and insert correctly.
30
Univers
ity of
Mala
ya
3.2.4 Handling difficulties
Through this tab a user can identify items that are difficult to handle (an item might
be: flexible, easy to tangle, heavy, or too small to handle). The software adds additional
handling/insertion time into the assembly-time calculations.
3.2.5 Insertion difficulties
This tab provides options for the software to factor in the extra time required to insert
difficult items. Threading a screw into a hole whose view or access is obstructed, for
example, would take an extra long time.
3.2.6 Securing method
Through this tab a user can choose how an item is secured to the assembly. The
software uses industry data to estimate the time required to perform the securing
operation. If the item is threaded, there are options to choose the number of revolutions
required and the method used (hand screwed vs. screwdriver vs. electric screwdriver).
The design specifications required for all the components are gathered and
summarized as follows. The information will be used as input to the DFA software.
3.2.7 Assembly
By filling in the information for each mechanical part, the leftmost column of the
software becomes populated in displaying a list of all the components making up the
product. This list can be configured to display or hide specific components according to
their type or tracking status. This tab is where a user can enumerate additional operations
such as reorientation of the assembly, application of glue, and wiring of cables; all to
provide even more accurate details on the assembly sequence. The DFA software
provides time and cost estimates for these operations.
31
Univers
ity of
Mala
ya
3.3 Details of the components for the DFA software
The DFA software collects the mentioned information on each separate item. In this
section details of each part is collected and summarized in different tables. This
information used as the input of the software.
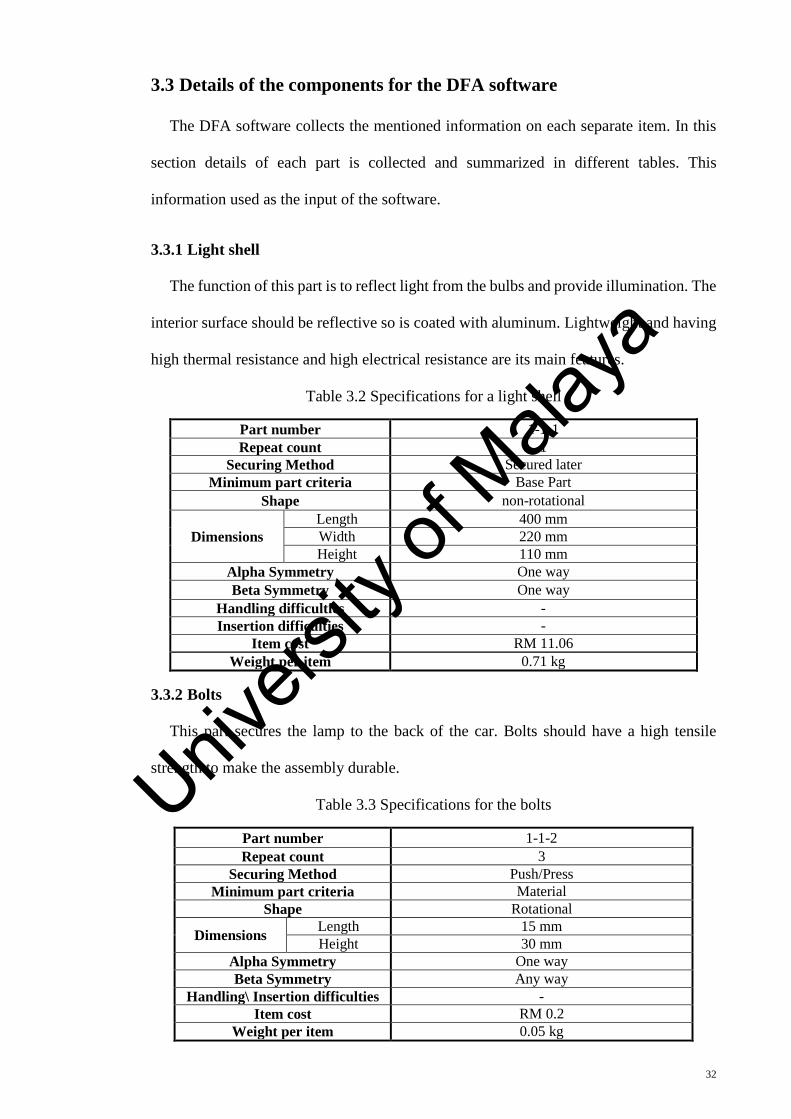
3.3.1 Light shell
The function of this part is to reflect light from the bulbs and provide illumination. The
interior surface should be reflective so is coated with aluminum. Lightweight and having
high thermal resistance and high electrical resistance are its main features.
Table 3.2 Specifications for a light shell
Part number 1-1-1 Repeat count 1
Securing Method Secured later Minimum part criteria Base Part
Shape non-rotational
Dimensions Length 400 mm Width 220 mm Height 110 mm
Alpha Symmetry One way Beta Symmetry One way
Handling difficulties - Insertion difficulties -
Item cost RM 11.06 Weight per item 0.71 kg
3.3.2 Bolts
This part secures the lamp to the back of the car. Bolts should have a high tensile
strength to make the assembly durable.
Table 3.3 Specifications for the bolts
Part number 1-1-2 Repeat count 3
Securing Method Push/Press Minimum part criteria Material
Shape Rotational
Dimensions Length 15 mm Height 30 mm
Alpha Symmetry One way Beta Symmetry Any way
Handling\ Insertion difficulties - Item cost RM 0.2
Weight per item 0.05 kg
32
Univers
ity of
Mala
ya
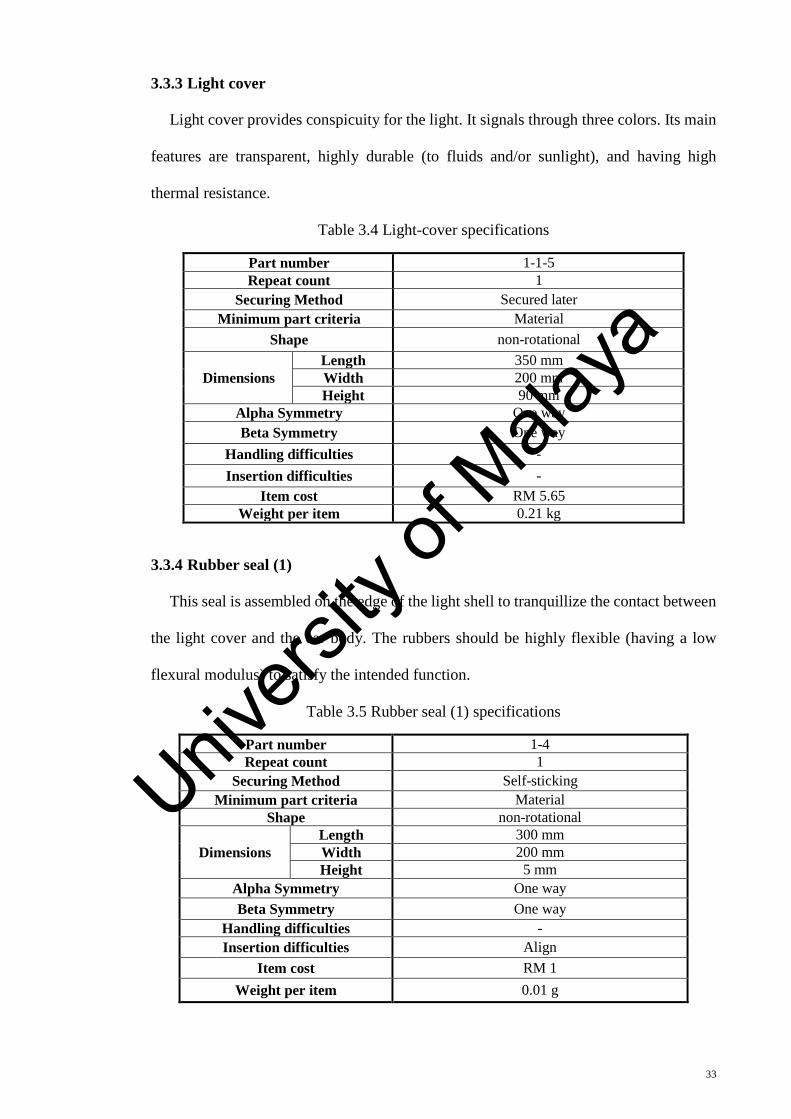
3.3.3 Light cover
Light cover provides conspicuity for the light. It signals through three colors. Its main
features are transparent, highly durable (to fluids and/or sunlight), and having high
thermal resistance.
Table 3.4 Light-cover specifications
Part number 1-1-5 Repeat count 1
Securing Method Secured later Minimum part criteria Material
Shape non-rotational
Dimensions Length 350 mm Width 200 mm Height 90 mm
Alpha Symmetry One way Beta Symmetry One way
Handling difficulties - Insertion difficulties -
Item cost RM 5.65 Weight per item 0.21 kg
3.3.4 Rubber seal (1)
This seal is assembled on the edge of the light shell to tranquillize the contact between
the light cover and the car body. The rubbers should be highly flexible (having a low
flexural modulus) to satisfy the intended function.
Table 3.5 Rubber seal (1) specifications
Part number 1-4 Repeat count 1
Securing Method Self-sticking Minimum part criteria Material
Shape non-rotational
Dimensions Length 300 mm Width 200 mm Height 5 mm
Alpha Symmetry One way Beta Symmetry One way
Handling difficulties - Insertion difficulties Align
Item cost RM 1 Weight per item 0.01 g
33
Univers
ity of
Mala
ya
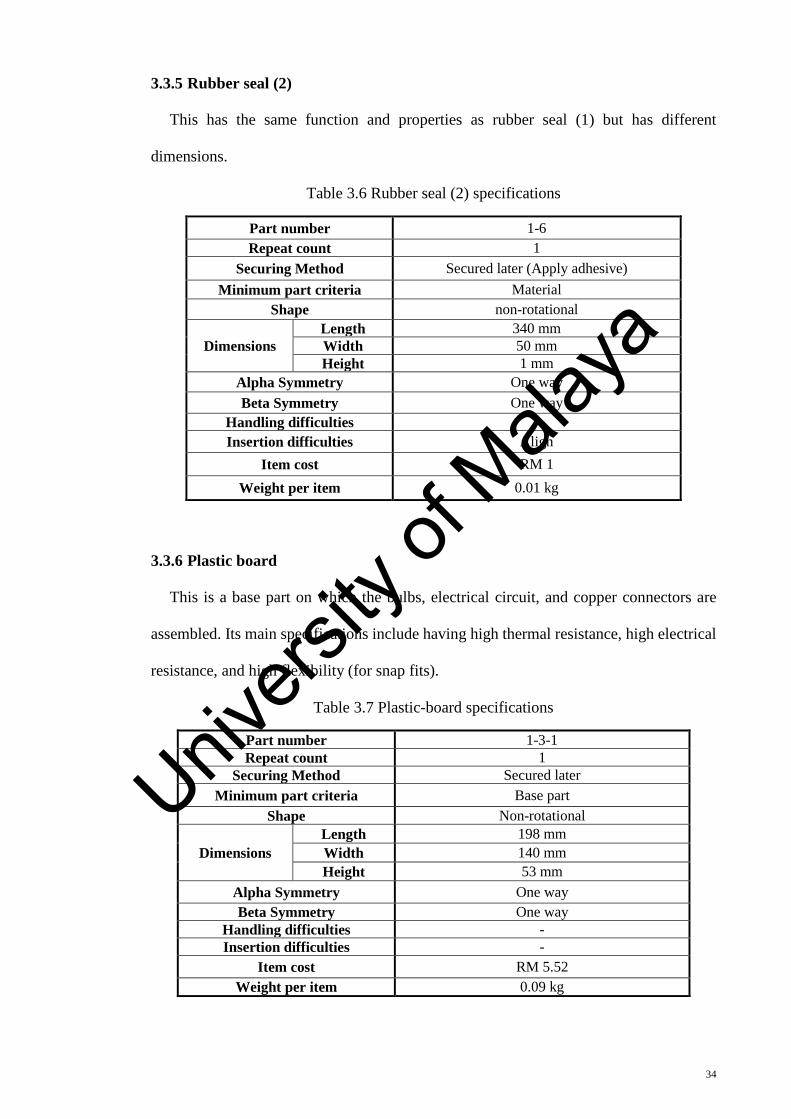
3.3.5 Rubber seal (2)
This has the same function and properties as rubber seal (1) but has different
dimensions.
Table 3.6 Rubber seal (2) specifications
Part number 1-6 Repeat count 1
Securing Method Secured later (Apply adhesive) Minimum part criteria Material
Shape non-rotational
Dimensions Length 340 mm Width 50 mm Height 1 mm
Alpha Symmetry One way Beta Symmetry One way
Handling difficulties - Insertion difficulties Align
Item cost RM 1 Weight per item 0.01 kg
3.3.6 Plastic board
This is a base part on which the bulbs, electrical circuit, and copper connectors are
assembled. Its main specifications include having high thermal resistance, high electrical
resistance, and high flexibility (for snap fits).
Table 3.7 Plastic-board specifications
Part number 1-3-1 Repeat count 1
Securing Method Secured later Minimum part criteria Base part
Shape Non-rotational
Dimensions Length 198 mm Width 140 mm Height 53 mm
Alpha Symmetry One way Beta Symmetry One way
Handling difficulties - Insertion difficulties -
Item cost RM 5.52 Weight per item 0.09 kg
34
Univers
ity of
Mala
ya
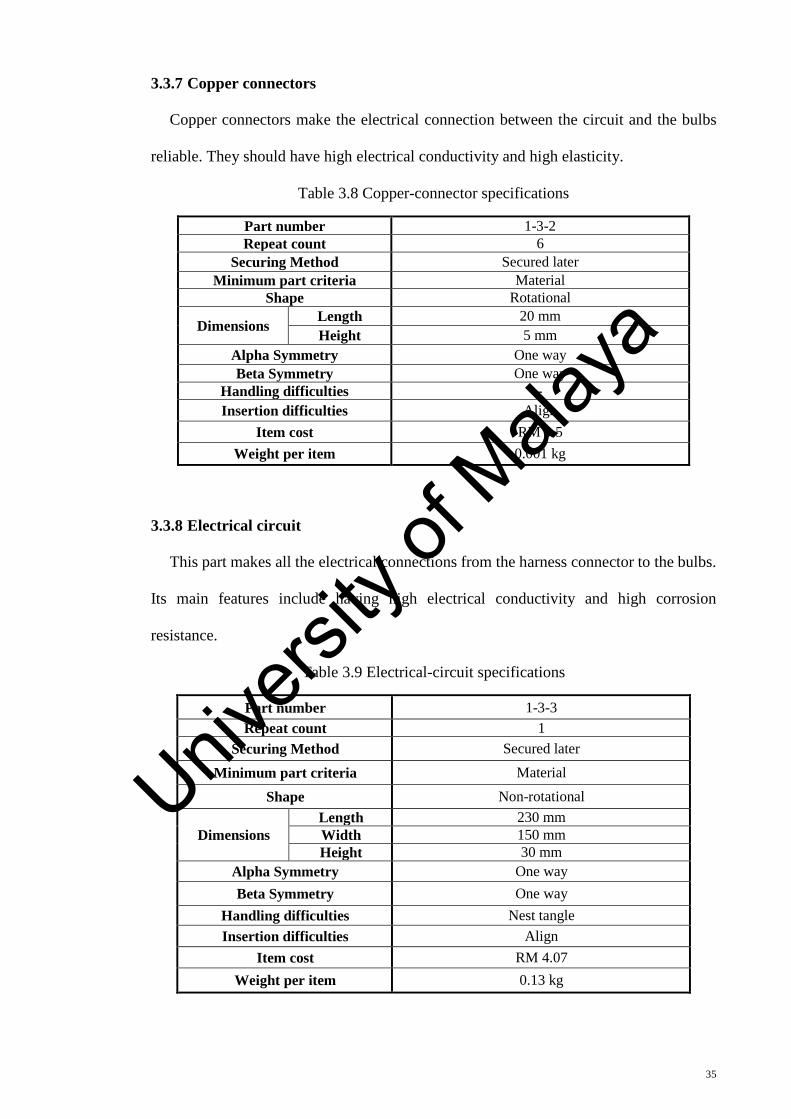
3.3.7 Copper connectors
Copper connectors make the electrical connection between the circuit and the bulbs
reliable. They should have high electrical conductivity and high elasticity.
Table 3.8 Copper-connector specifications
Part number 1-3-2 Repeat count 6
Securing Method Secured later Minimum part criteria Material
Shape Rotational
Dimensions Length 20 mm Height 5 mm
Alpha Symmetry One way Beta Symmetry One way
Handling difficulties - Insertion difficulties Align
Item cost RM 0.5 Weight per item 0.001 kg
3.3.8 Electrical circuit
This part makes all the electrical connections from the harness connector to the bulbs.
Its main features include having high electrical conductivity and high corrosion
resistance.
Table 3.9 Electrical-circuit specifications
Part number 1-3-3 Repeat count 1
Securing Method Secured later Minimum part criteria Material
Shape Non-rotational
Dimensions Length 230 mm Width 150 mm Height 30 mm
Alpha Symmetry One way Beta Symmetry One way
Handling difficulties Nest tangle Insertion difficulties Align
Item cost RM 4.07 Weight per item 0.13 kg
35
Univers
ity of
Mala
ya
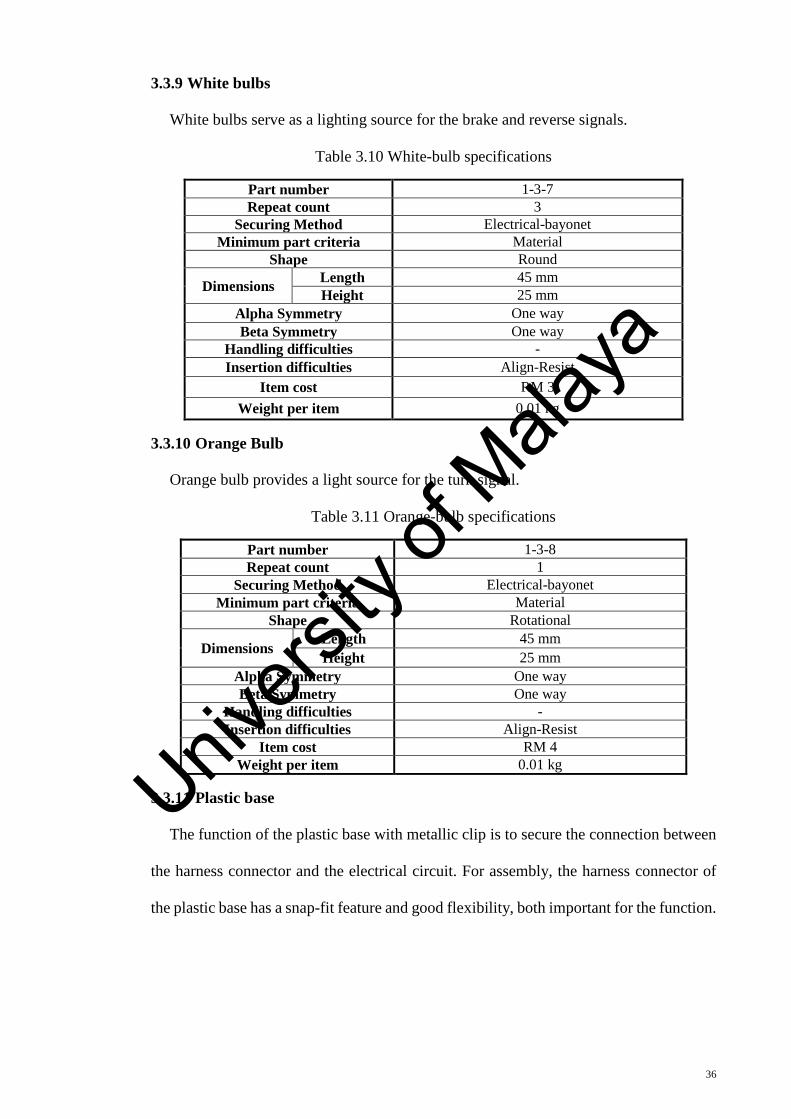
3.3.9 White bulbs
White bulbs serve as a lighting source for the brake and reverse signals.
Table 3.10 White-bulb specifications
Part number 1-3-7 Repeat count 3
Securing Method Electrical-bayonet Minimum part criteria Material
Shape Round
Dimensions Length 45 mm Height 25 mm
Alpha Symmetry One way Beta Symmetry One way
Handling difficulties - Insertion difficulties Align-Resist
Item cost RM 3 Weight per item 0.01 kg
3.3.10 Orange Bulb
Orange bulb provides a light source for the turn signal.
Table 3.11 Orange-bulb specifications
Part number 1-3-8 Repeat count 1
Securing Method Electrical-bayonet Minimum part criteria Material
Shape Rotational
Dimensions Length 45 mm Height 25 mm
Alpha Symmetry One way Beta Symmetry One way
Handling difficulties - Insertion difficulties Align-Resist
Item cost RM 4 Weight per item 0.01 kg
3.3.11 Plastic base
The function of the plastic base with metallic clip is to secure the connection between
the harness connector and the electrical circuit. For assembly, the harness connector of
the plastic base has a snap-fit feature and good flexibility, both important for the function.
36
Univers
ity of
Mala
ya
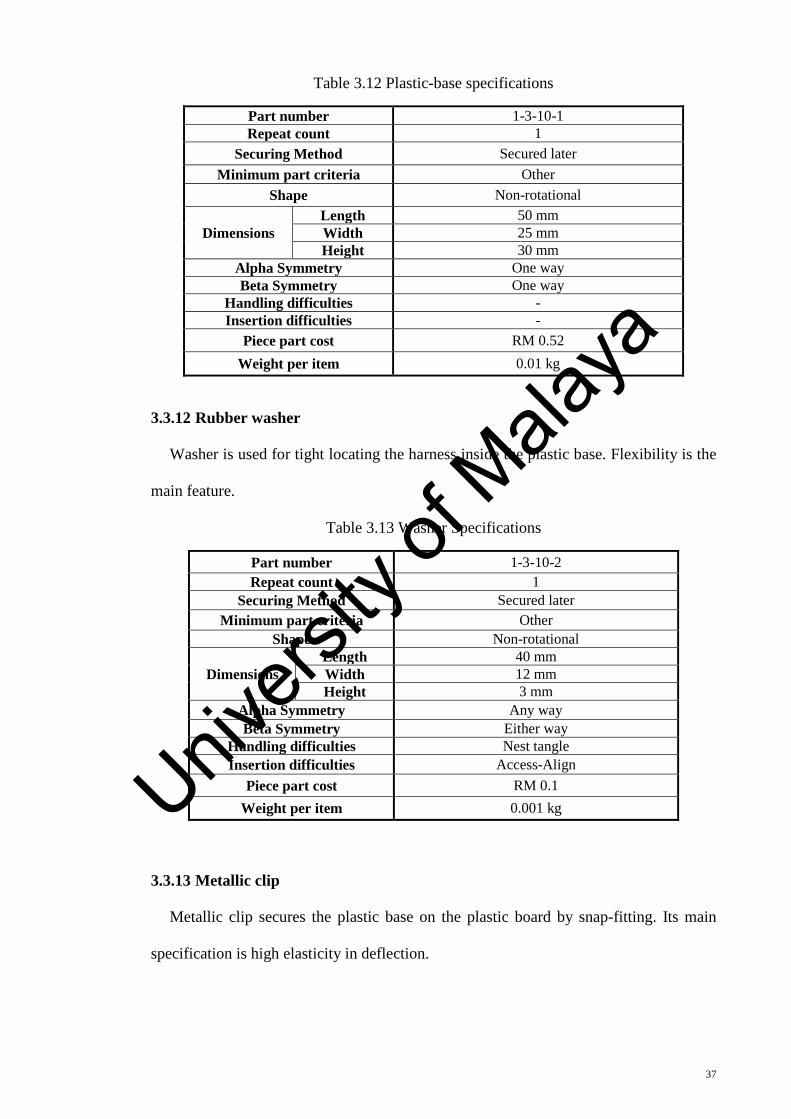
Table 3.12 Plastic-base specifications
Part number 1-3-10-1 Repeat count 1
Securing Method Secured later Minimum part criteria Other
Shape Non-rotational
Dimensions Length 50 mm Width 25 mm Height 30 mm
Alpha Symmetry One way Beta Symmetry One way
Handling difficulties - Insertion difficulties -
Piece part cost RM 0.52 Weight per item 0.01 kg
3.3.12 Rubber washer
Washer is used for tight locating the harness inside the plastic base. Flexibility is the
main feature.
Table 3.13 Washer Specifications
Part number 1-3-10-2 Repeat count 1
Securing Method Secured later Minimum part criteria Other
Shape Non-rotational
Dimensions Length 40 mm Width 12 mm Height 3 mm
Alpha Symmetry Any way Beta Symmetry Either way
Handling difficulties Nest tangle Insertion difficulties Access-Align
Piece part cost RM 0.1 Weight per item 0.001 kg
3.3.13 Metallic clip
Metallic clip secures the plastic base on the plastic board by snap-fitting. Its main
specification is high elasticity in deflection.
37
Univers
ity of
Mala
ya
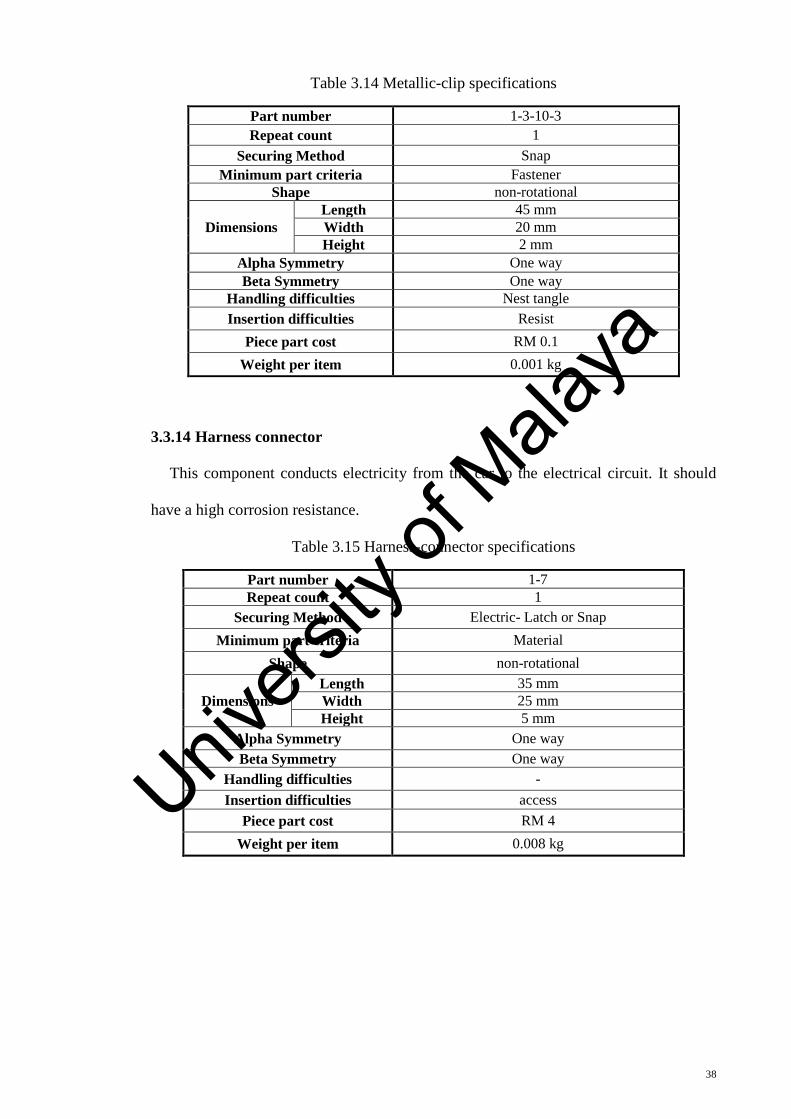
Table 3.14 Metallic-clip specifications
Part number 1-3-10-3 Repeat count 1
Securing Method Snap Minimum part criteria Fastener
Shape non-rotational
Dimensions Length 45 mm Width 20 mm Height 2 mm
Alpha Symmetry One way Beta Symmetry One way
Handling difficulties Nest tangle Insertion difficulties Resist
Piece part cost RM 0.1 Weight per item 0.001 kg
3.3.14 Harness connector
This component conducts electricity from the car to the electrical circuit. It should
have a high corrosion resistance.
Table 3.15 Harness-connector specifications
Part number 1-7 Repeat count 1
Securing Method Electric- Latch or Snap Minimum part criteria Material
Shape non-rotational
Dimensions Length 35 mm Width 25 mm Height 5 mm
Alpha Symmetry One way Beta Symmetry One way
Handling difficulties - Insertion difficulties access
Piece part cost RM 4 Weight per item 0.008 kg
38
Univers
ity of
Mala
ya
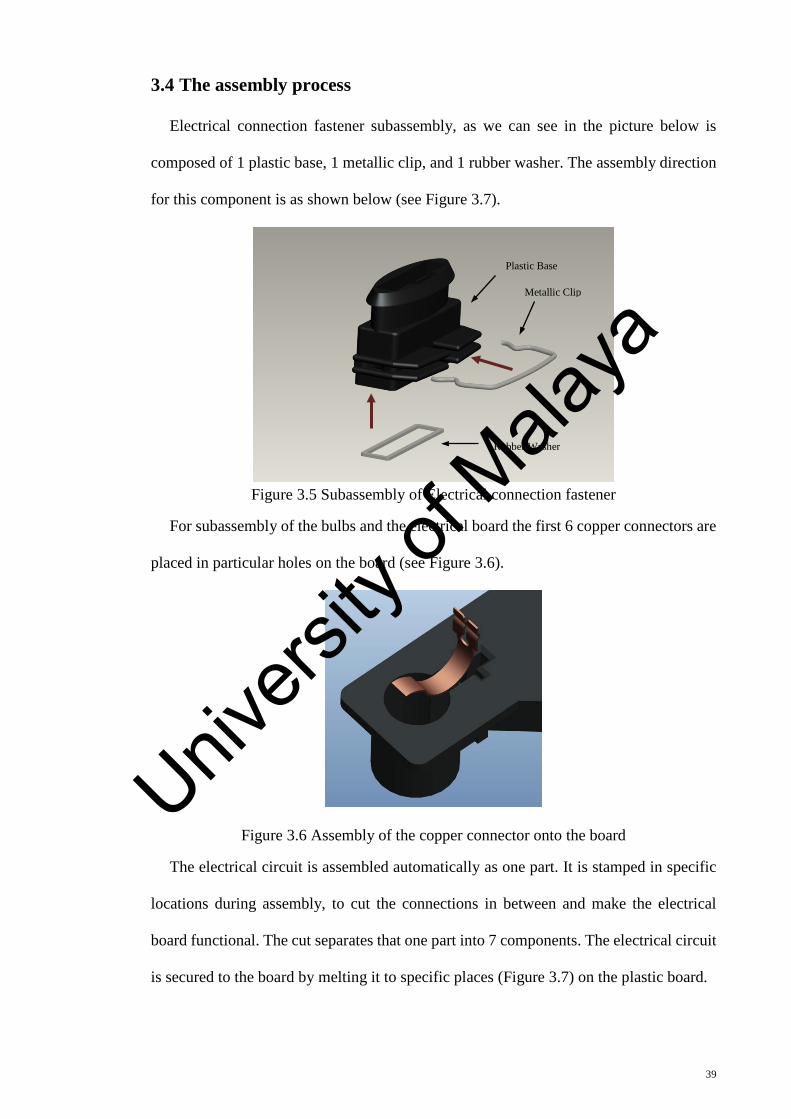
3.4 The assembly process
Electrical connection fastener subassembly, as we can see in the picture below is
composed of 1 plastic base, 1 metallic clip, and 1 rubber washer. The assembly direction
for this component is as shown below (see Figure 3.7).
Figure 3.5 Subassembly of Electrical connection fastener
For subassembly of the bulbs and the electrical board the first 6 copper connectors are
placed in particular holes on the board (see Figure 3.6).
Figure 3.6 Assembly of the copper connector onto the board
The electrical circuit is assembled automatically as one part. It is stamped in specific
locations during assembly, to cut the connections in between and make the electrical
board functional. The cut separates that one part into 7 components. The electrical circuit
is secured to the board by melting it to specific places (Figure 3.7) on the plastic board.
Plastic Base
Rubber Washer
Metallic Clip
39
Univers
ity of
Mala
ya
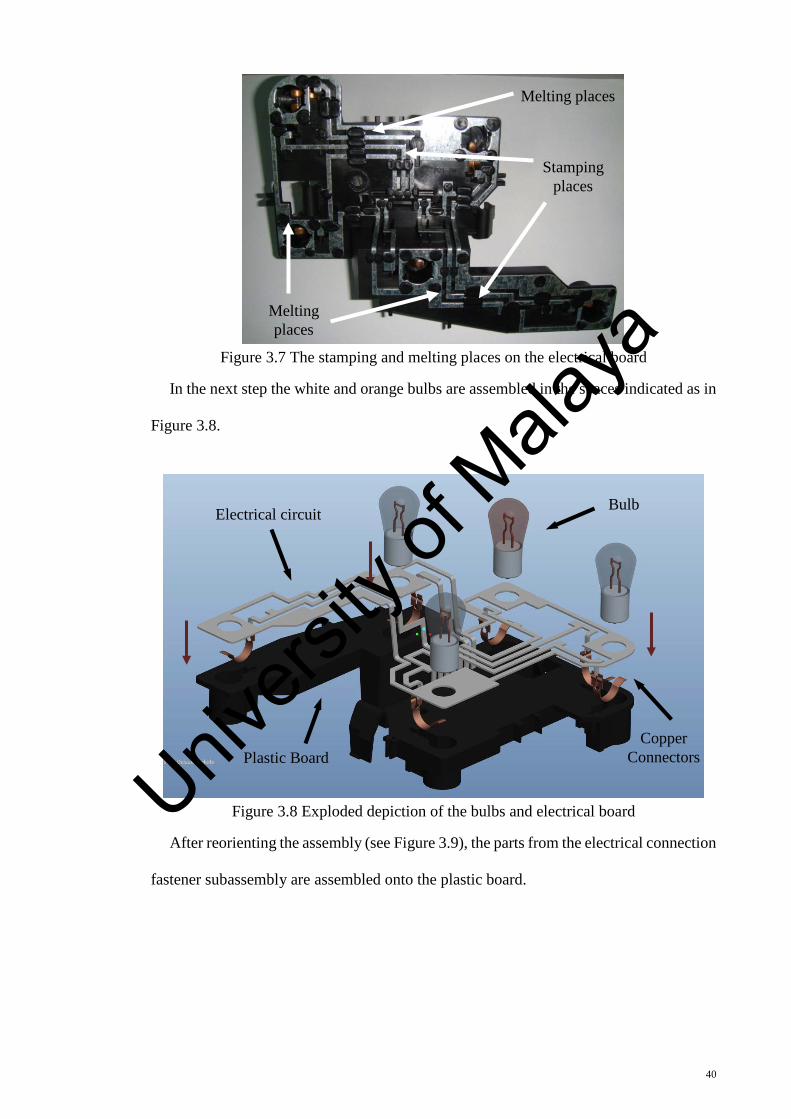
Figure 3.7 The stamping and melting places on the electrical board
In the next step the white and orange bulbs are assembled in the spaces indicated as in
Figure 3.8.
Figure 3.8 Exploded depiction of the bulbs and electrical board
After reorienting the assembly (see Figure 3.9), the parts from the electrical connection
fastener subassembly are assembled onto the plastic board.
Stamping places
Melting places
Melting places
Copper Connectors Plastic Board
Bulb Electrical circuit
40
Univers
ity of
Mala
ya
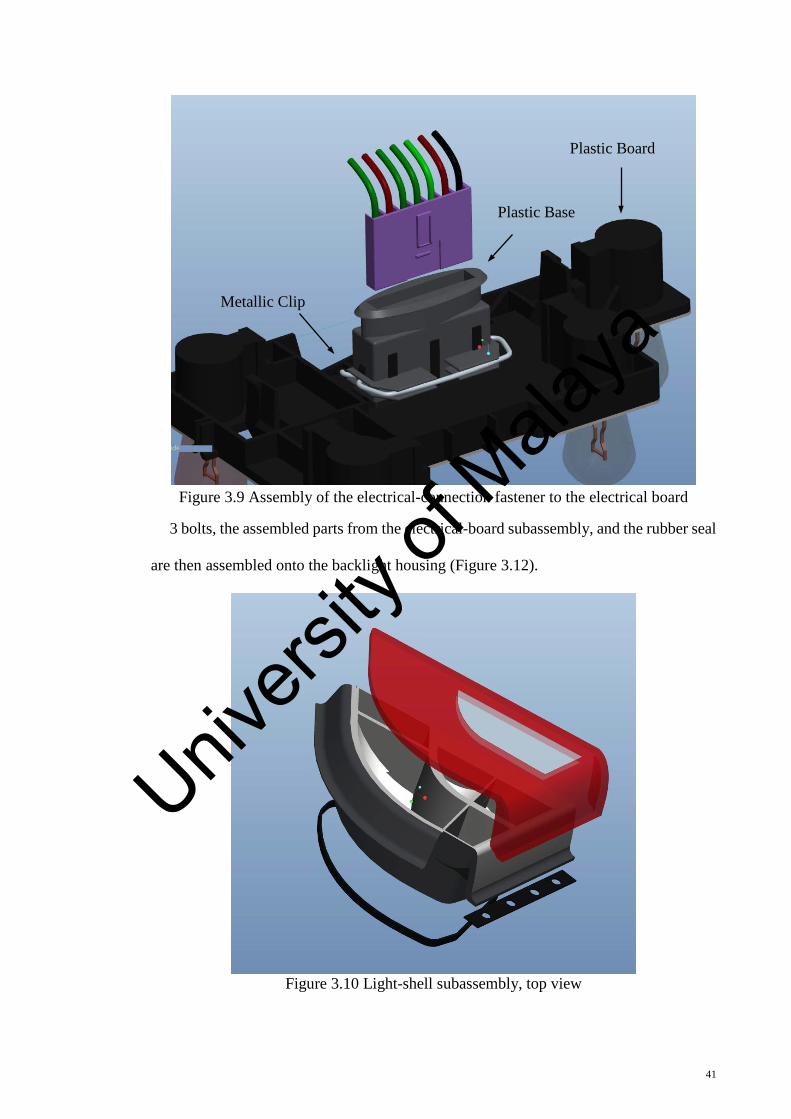
Figure 3.9 Assembly of the electrical-connection fastener to the electrical board
3 bolts, the assembled parts from the electrical-board subassembly, and the rubber seal
are then assembled onto the backlight housing (Figure 3.12).
Figure 3.10 Light-shell subassembly, top view
Metallic Clip
Plastic Base
Plastic Board
41
Univers
ity of
Mala
ya
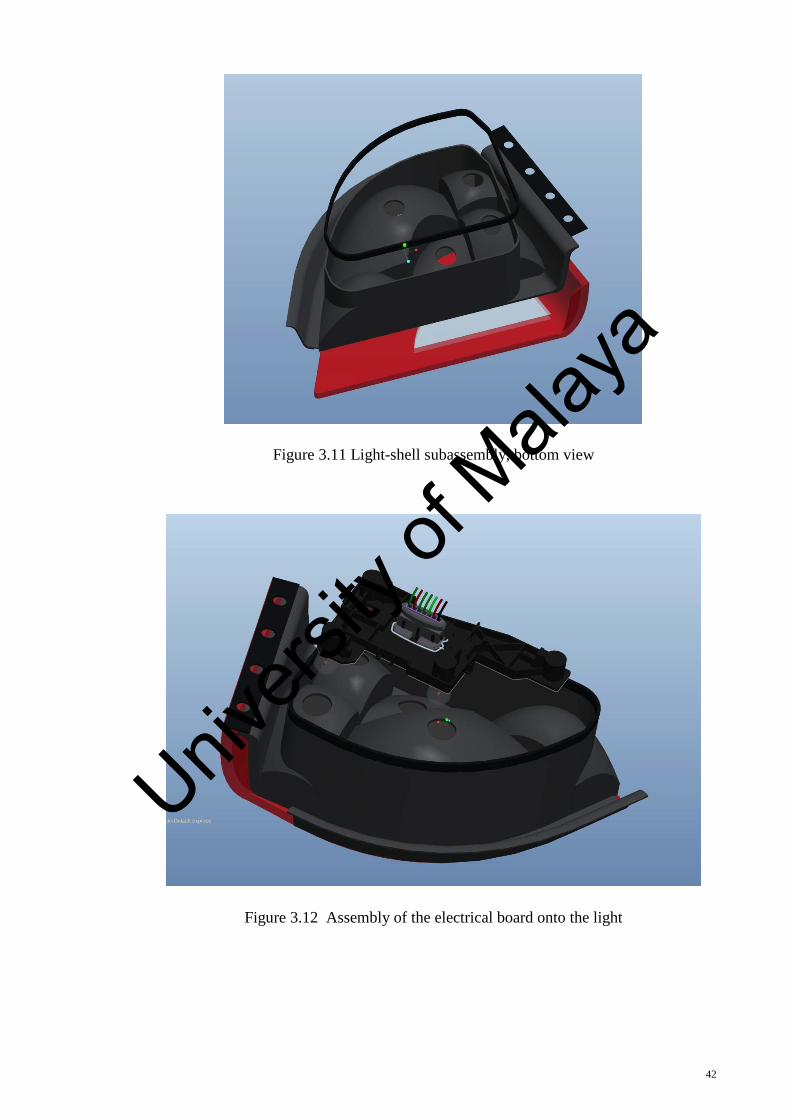
Figure 3.11 Light-shell subassembly, bottom view
Figure 3.12 Assembly of the electrical board onto the light
42
Univers
ity of
Mala
ya
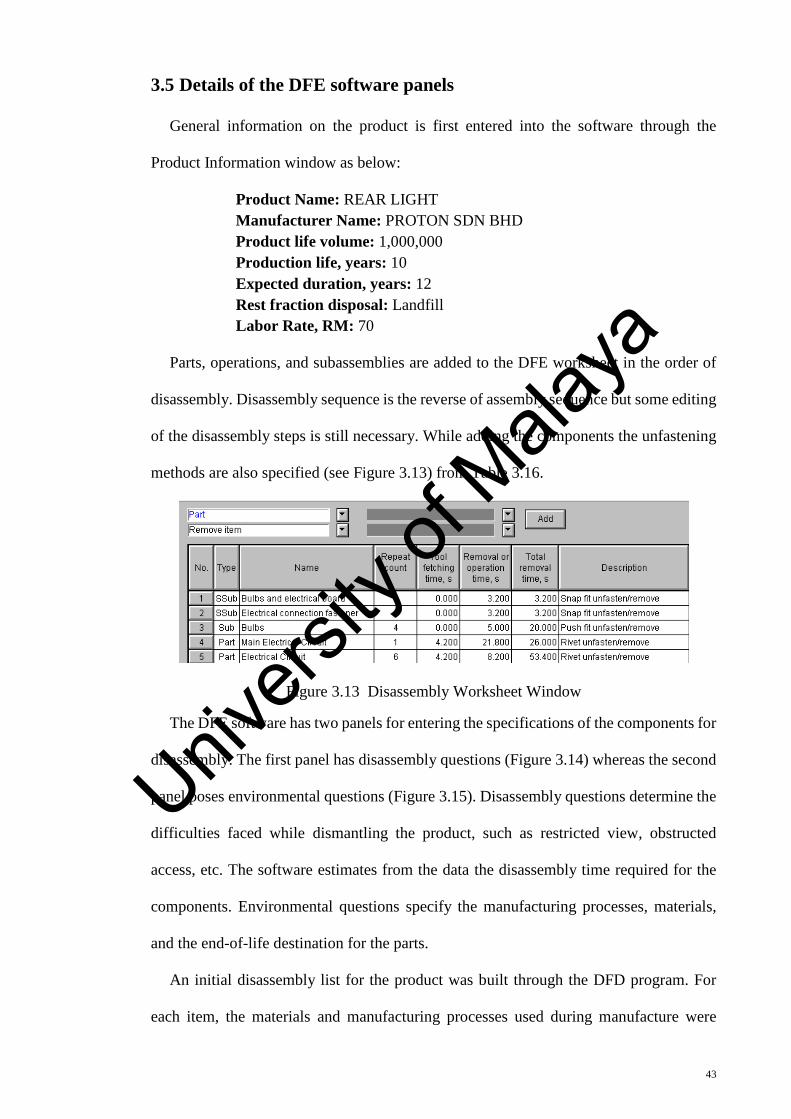
3.5 Details of the DFE software panels
General information on the product is first entered into the software through the
Product Information window as below:
Product Name: REAR LIGHT Manufacturer Name: PROTON SDN BHD Product life volume: 1,000,000 Production life, years: 10 Expected duration, years: 12 Rest fraction disposal: Landfill Labor Rate, RM: 70
Parts, operations, and subassemblies are added to the DFE worksheet in the order of
disassembly. Disassembly sequence is the reverse of assembly sequence but some editing
of the disassembly steps is still necessary. While adding the components the unfastening
methods are also specified (see Figure 3.13) from Table 3.16.
Figure 3.13 Disassembly Worksheet Window
The DFE software has two panels for entering the specifications of the components for
disassembly. The first panel has disassembly questions (Figure 3.14) whereas the second
panel poses environmental questions (Figure 3.15). Disassembly questions determine the
difficulties faced while dismantling the product, such as restricted view, obstructed
access, etc. The software estimates from the data the disassembly time required for the
components. Environmental questions specify the manufacturing processes, materials,
and the end-of-life destination for the parts.
An initial disassembly list for the product was built through the DFD program. For
each item, the materials and manufacturing processes used during manufacture were
43
Univers
ity of
Mala
ya
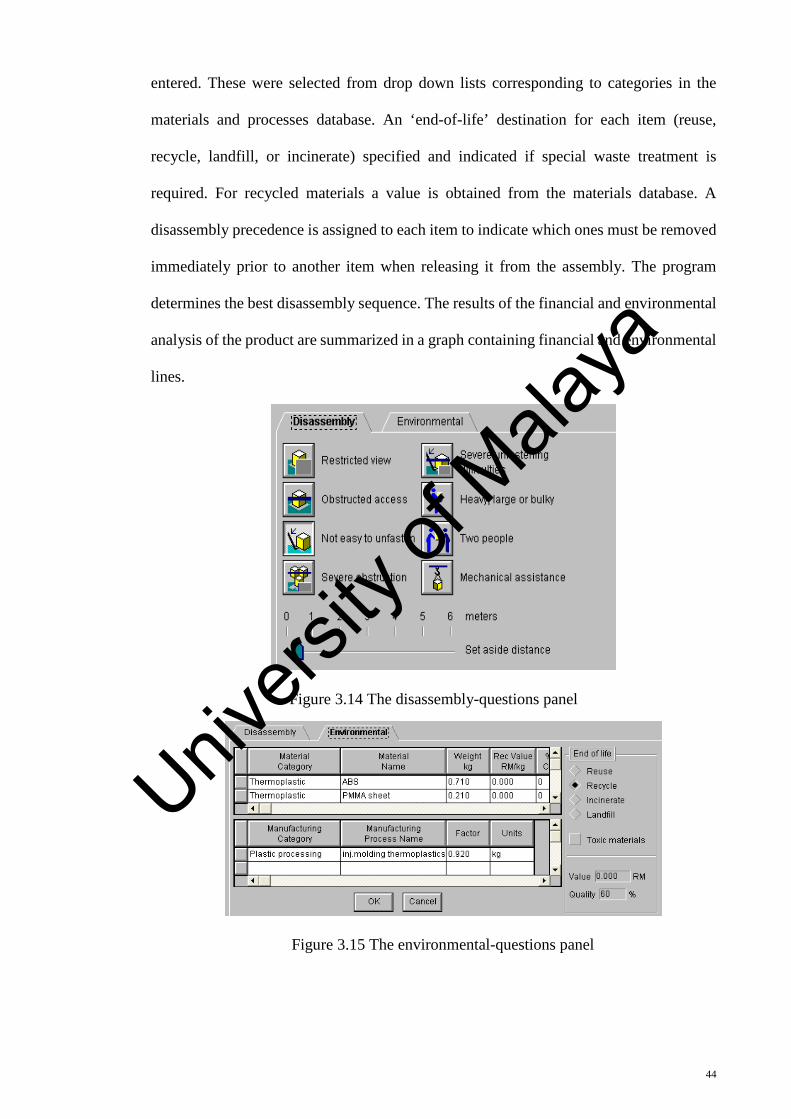
entered. These were selected from drop down lists corresponding to categories in the
materials and processes database. An ‘end-of-life’ destination for each item (reuse,
recycle, landfill, or incinerate) specified and indicated if special waste treatment is
required. For recycled materials a value is obtained from the materials database. A
disassembly precedence is assigned to each item to indicate which ones must be removed
immediately prior to another item when releasing it from the assembly. The program
determines the best disassembly sequence. The results of the financial and environmental
analysis of the product are summarized in a graph containing financial and environmental
lines.
Figure 3.14 The disassembly-questions panel
Figure 3.15 The environmental-questions panel
44
Univers
ity of
Mala
ya
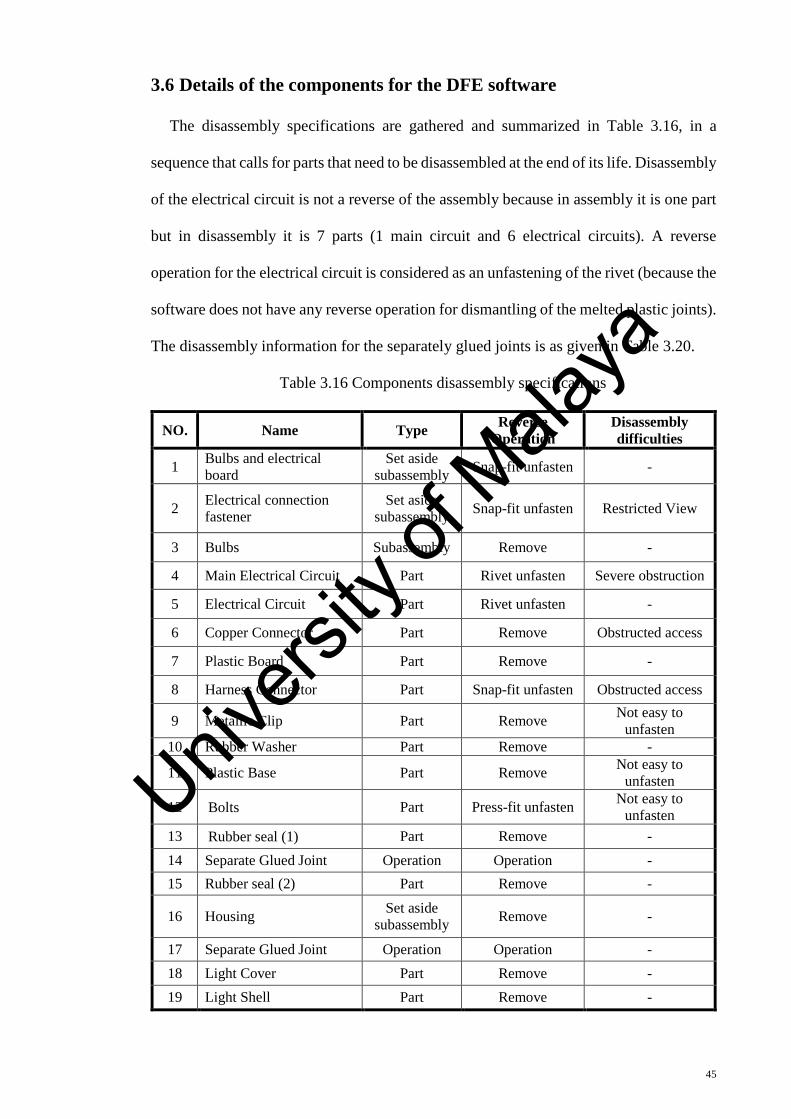
3.6 Details of the components for the DFE software
The disassembly specifications are gathered and summarized in Table 3.16, in a
sequence that calls for parts that need to be disassembled at the end of its life. Disassembly
of the electrical circuit is not a reverse of the assembly because in assembly it is one part
but in disassembly it is 7 parts (1 main circuit and 6 electrical circuits). A reverse
operation for the electrical circuit is considered as an unfastening of the rivet (because the
software does not have any reverse operation for dismantling of the melted plastic joints).
The disassembly information for the separately glued joints is as given in Table 3.20.
Table 3.16 Components disassembly specifications
NO. Name Type Reverse Operation
Disassembly difficulties
1 Bulbs and electrical board
Set aside subassembly Snap-fit unfasten -
2 Electrical connection fastener
Set aside subassembly Snap-fit unfasten Restricted View
3 Bulbs Subassembly Remove -
4 Main Electrical Circuit Part Rivet unfasten Severe obstruction
5 Electrical Circuit Part Rivet unfasten -
6 Copper Connector Part Remove Obstructed access
7 Plastic Board Part Remove -
8 Harness Connector Part Snap-fit unfasten Obstructed access
9 Metallic Clip Part Remove Not easy to unfasten
10 Rubber Washer Part Remove - 11 Plastic Base Part Remove Not easy to
unfasten 12 Bolts Part Press-fit unfasten Not easy to
unfasten 13 Rubber seal (1) Part Remove - 14 Separate Glued Joint Operation Operation - 15 Rubber seal (2) Part Remove -
16 Housing Set aside subassembly Remove -
17 Separate Glued Joint Operation Operation - 18 Light Cover Part Remove - 19 Light Shell Part Remove -
45
Univers
ity of
Mala
ya
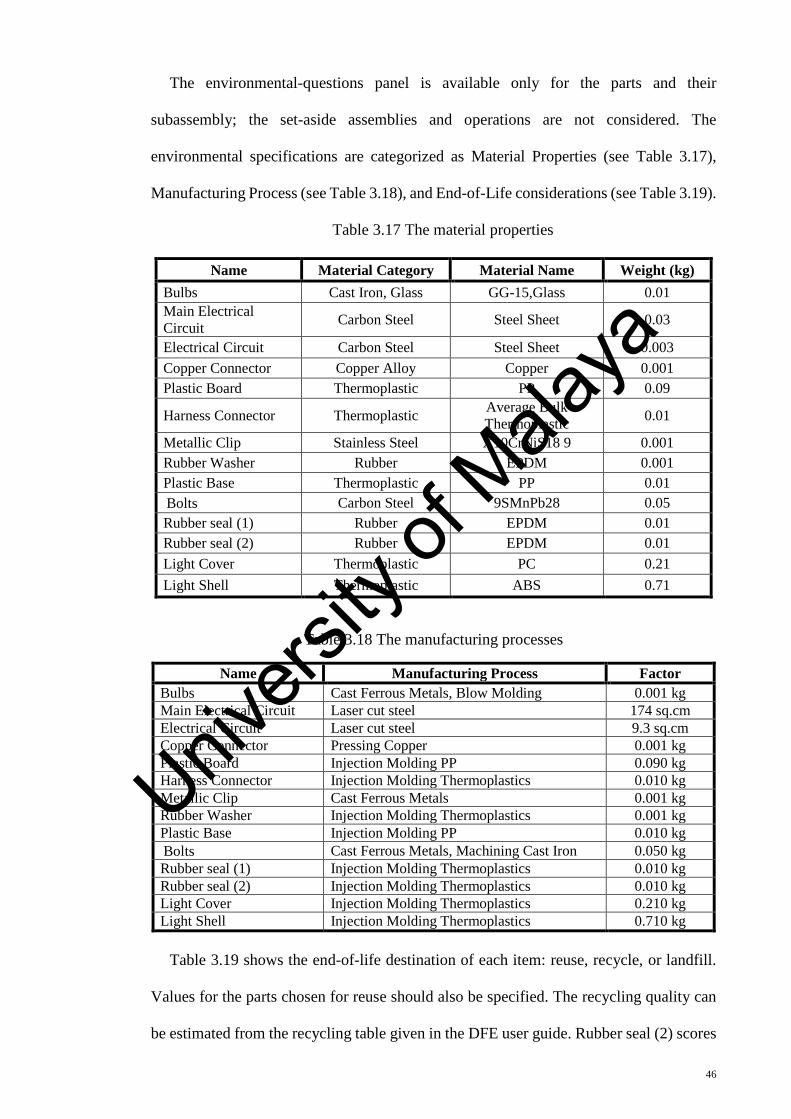
The environmental-questions panel is available only for the parts and their
subassembly; the set-aside assemblies and operations are not considered. The
environmental specifications are categorized as Material Properties (see Table 3.17),
Manufacturing Process (see Table 3.18), and End-of-Life considerations (see Table 3.19).
Table 3.17 The material properties
Name Material Category Material Name Weight (kg) Bulbs Cast Iron, Glass GG-15,Glass 0.01 Main Electrical Circuit Carbon Steel Steel Sheet 0.03
Electrical Circuit Carbon Steel Steel Sheet 0.003 Copper Connector Copper Alloy Copper 0.001 Plastic Board Thermoplastic PP 0.09
Harness Connector Thermoplastic Average Bulk Thermoplastic 0.01
Metallic Clip Stainless Steel X10CrNiS18 9 0.001 Rubber Washer Rubber EPDM 0.001 Plastic Base Thermoplastic PP 0.01 Bolts Carbon Steel 9SMnPb28 0.05 Rubber seal (1) Rubber EPDM 0.01 Rubber seal (2) Rubber EPDM 0.01 Light Cover Thermoplastic PC 0.21 Light Shell Thermoplastic ABS 0.71
Table 3.18 The manufacturing processes
Name Manufacturing Process Factor Bulbs Cast Ferrous Metals, Blow Molding 0.001 kg Main Electrical Circuit Laser cut steel 174 sq.cm Electrical Circuit Laser cut steel 9.3 sq.cm Copper Connector Pressing Copper 0.001 kg Plastic Board Injection Molding PP 0.090 kg Harness Connector Injection Molding Thermoplastics 0.010 kg Metallic Clip Cast Ferrous Metals 0.001 kg Rubber Washer Injection Molding Thermoplastics 0.001 kg Plastic Base Injection Molding PP 0.010 kg Bolts Cast Ferrous Metals, Machining Cast Iron 0.050 kg Rubber seal (1) Injection Molding Thermoplastics 0.010 kg Rubber seal (2) Injection Molding Thermoplastics 0.010 kg Light Cover Injection Molding Thermoplastics 0.210 kg Light Shell Injection Molding Thermoplastics 0.710 kg
Table 3.19 shows the end-of-life destination of each item: reuse, recycle, or landfill.
Values for the parts chosen for reuse should also be specified. The recycling quality can
be estimated from the recycling table given in the DFE user guide. Rubber seal (2) scores
46
Univers
ity of
Mala
ya
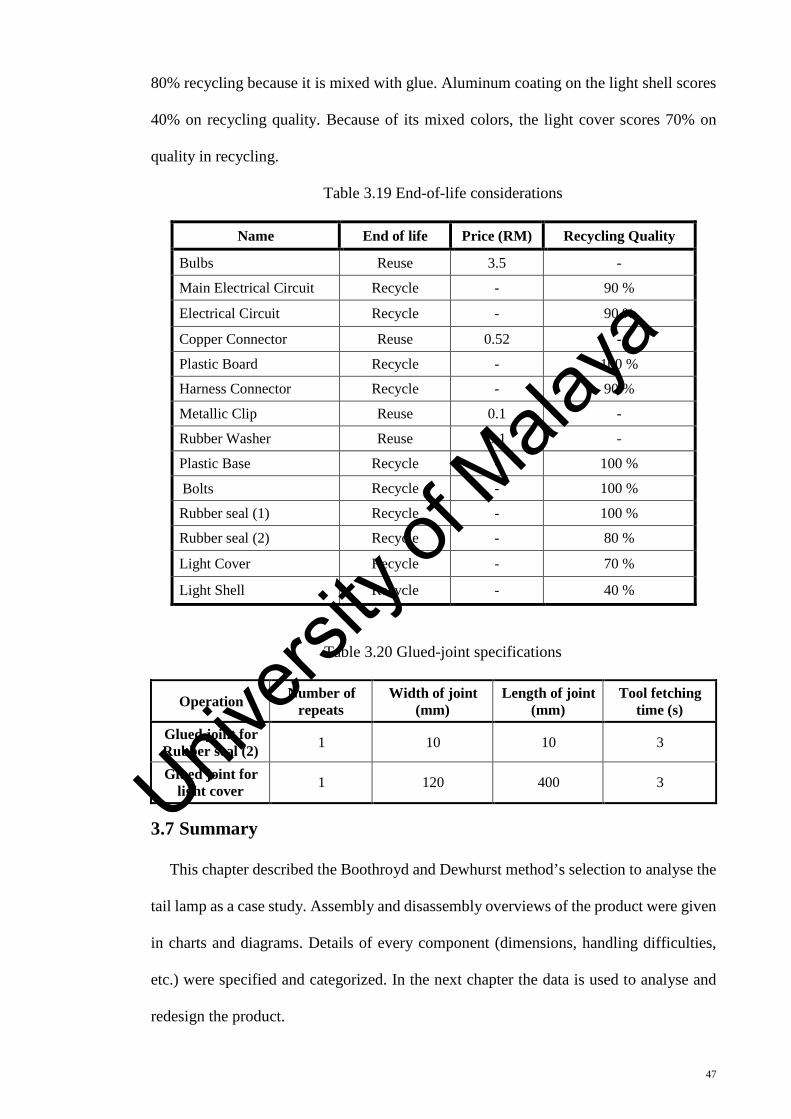
80% recycling because it is mixed with glue. Aluminum coating on the light shell scores
40% on recycling quality. Because of its mixed colors, the light cover scores 70% on
quality in recycling.
Table 3.19 End-of-life considerations
Name End of life Price (RM) Recycling Quality
Bulbs Reuse 3.5 - Main Electrical Circuit Recycle - 90 % Electrical Circuit Recycle - 90 % Copper Connector Reuse 0.52 - Plastic Board Recycle - 100 % Harness Connector Recycle - 90 % Metallic Clip Reuse 0.1 - Rubber Washer Reuse 0.1 - Plastic Base Recycle - 100 % Bolts Recycle - 100 % Rubber seal (1) Recycle - 100 % Rubber seal (2) Recycle - 80 % Light Cover Recycle - 70 %
Light Shell Recycle - 40 %
Table 3.20 Glued-joint specifications
Operation Number of repeats
Width of joint (mm)
Length of joint (mm)
Tool fetching time (s)
Glued joint for Rubber seal (2) 1 10 10 3
Glued joint for light cover 1 120 400 3
3.7 Summary
This chapter described the Boothroyd and Dewhurst method’s selection to analyse the
tail lamp as a case study. Assembly and disassembly overviews of the product were given
in charts and diagrams. Details of every component (dimensions, handling difficulties,
etc.) were specified and categorized. In the next chapter the data is used to analyse and
redesign the product.
47
Univers
ity of
Mala
ya
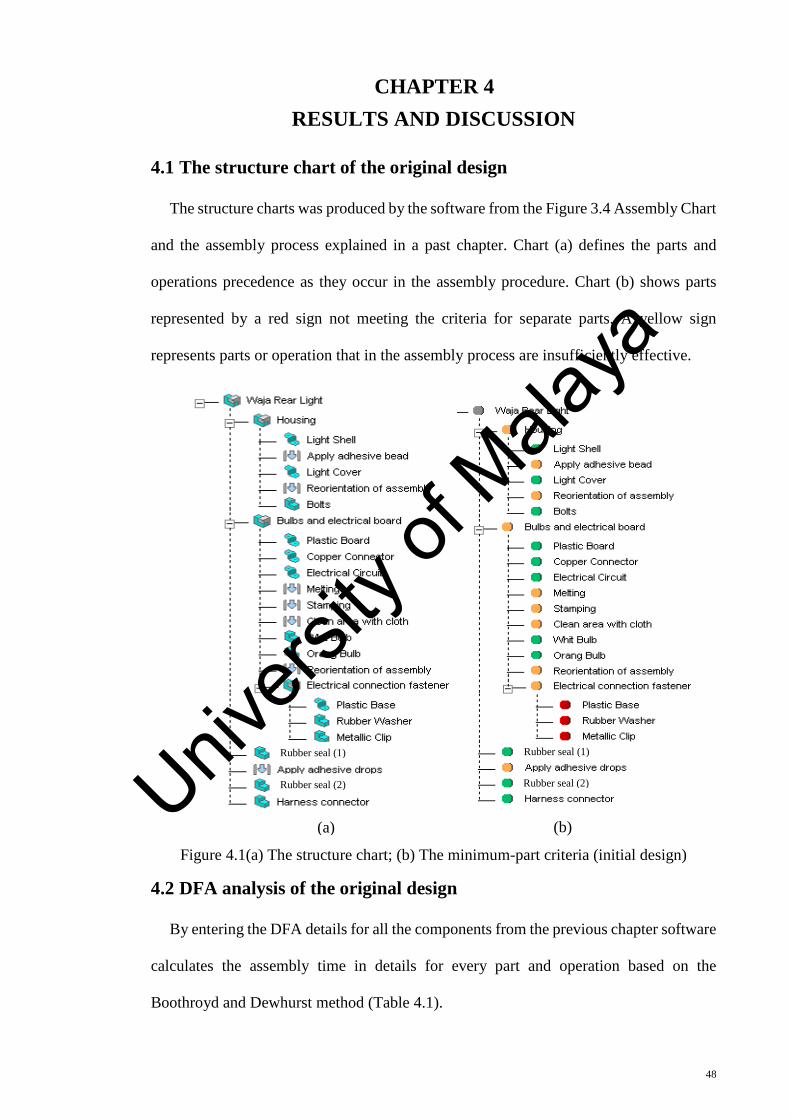
CHAPTER 4 RESULT AND DISCUSSION
RESULTS AND DISCUSSION
4.1 The structure chart of the original design
The structure charts was produced by the software from the Figure 3.4 Assembly Chart
and the assembly process explained in a past chapter. Chart (a) defines the parts and
operations precedence as they occur in the assembly procedure. Chart (b) shows parts
represented by a red sign not meeting the criteria for separate parts. A yellow sign
represents parts or operation that in the assembly process are insufficiently effective.
Figure 4.1(a) The structure chart; (b) The minimum-part criteria (initial design)
4.2 DFA analysis of the original design
By entering the DFA details for all the components from the previous chapter software
calculates the assembly time in details for every part and operation based on the
Boothroyd and Dewhurst method (Table 4.1).
(b) (a)
Rubber seal (1)
Rubber seal (2) Rubber seal (2)
Rubber seal (1)
48
Univers
ity of
Mala
ya
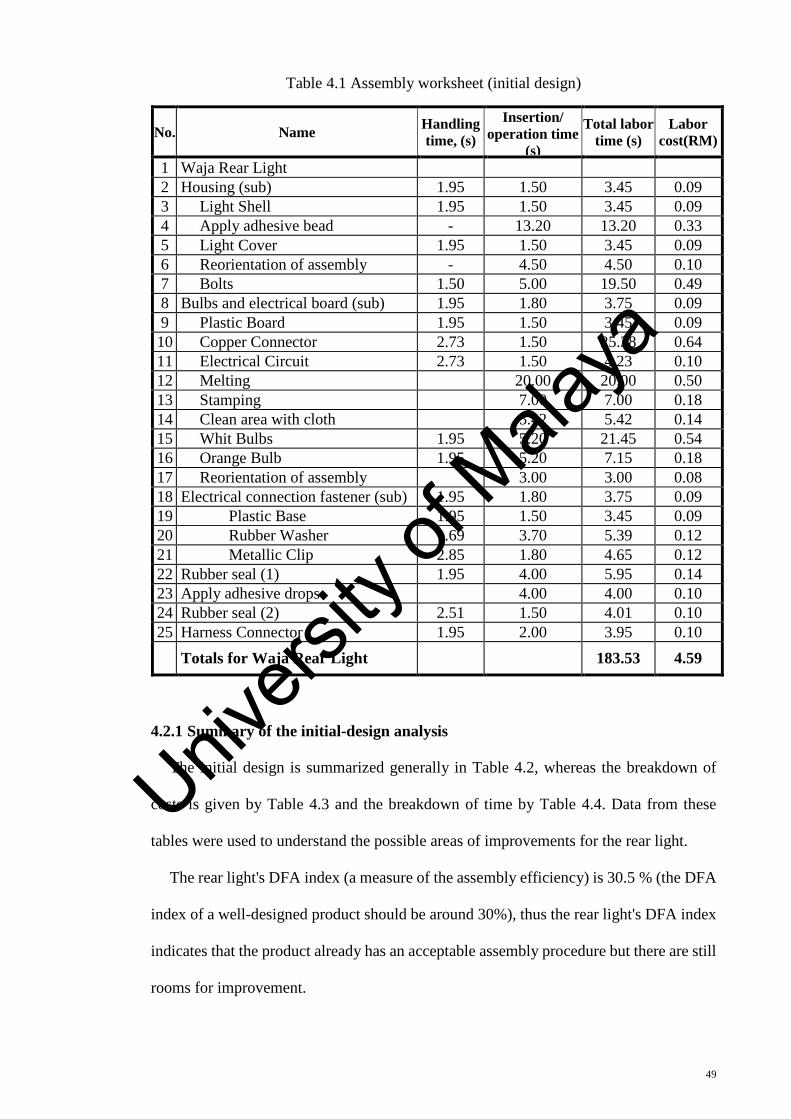
Table 4.1 Assembly worksheet (initial design)
No. Name Handling time, (s)
Insertion/ operation time
(s)
Total labor time (s)
Labor cost(RM)
1 Waja Rear Light 2 Housing (sub) 1.95 1.50 3.45 0.09 3 Light Shell 1.95 1.50 3.45 0.09 4 Apply adhesive bead - 13.20 13.20 0.33 5 Light Cover 1.95 1.50 3.45 0.09 6 Reorientation of assembly - 4.50 4.50 0.10 7 Bolts 1.50 5.00 19.50 0.49 8 Bulbs and electrical board (sub) 1.95 1.80 3.75 0.09 9 Plastic Board 1.95 1.50 3.45 0.09 10 Copper Connector 2.73 1.50 25.38 0.64 11 Electrical Circuit 2.73 1.50 4.23 0.10 12 Melting 20.00 20.00 0.50 13 Stamping 7.00 7.00 0.18 14 Clean area with cloth 5.42 5.42 0.14 15 Whit Bulbs 1.95 5.20 21.45 0.54 16 Orange Bulb 1.95 5.20 7.15 0.18 17 Reorientation of assembly 3.00 3.00 0.08 18 Electrical connection fastener (sub) 1.95 1.80 3.75 0.09 19 Plastic Base 1.95 1.50 3.45 0.09 20 Rubber Washer 1.69 3.70 5.39 0.12 21 Metallic Clip 2.85 1.80 4.65 0.12 22 Rubber seal (1) 1.95 4.00 5.95 0.14 23 Apply adhesive drops 4.00 4.00 0.10 24 Rubber seal (2) 2.51 1.50 4.01 0.10 25 Harness Connector 1.95 2.00 3.95 0.10 Totals for Waja Rear Light 183.53 4.59
4.2.1 Summary of the initial-design analysis
The initial design is summarized generally in Table 4.2, whereas the breakdown of
costs is given by Table 4.3 and the breakdown of time by Table 4.4. Data from these
tables were used to understand the possible areas of improvements for the rear light.
The rear light's DFA index (a measure of the assembly efficiency) is 30.5 % (the DFA
index of a well-designed product should be around 30%), thus the rear light's DFA index
indicates that the product already has an acceptable assembly procedure but there are still
rooms for improvement.
49
Univers
ity of
Mala
ya
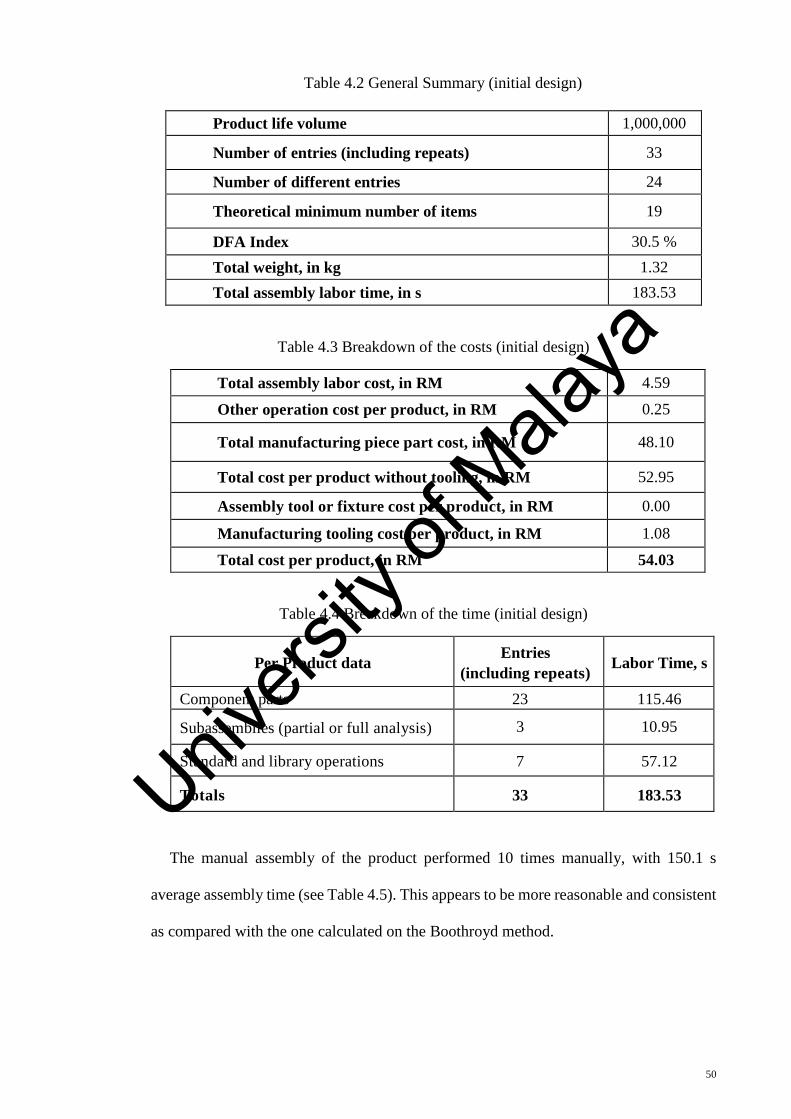
Table 4.2 General Summary (initial design)
Product life volume 1,000,000
Number of entries (including repeats) 33
Number of different entries 24
Theoretical minimum number of items 19
DFA Index 30.5 % Total weight, in kg 1.32 Total assembly labor time, in s 183.53
Table 4.3 Breakdown of the costs (initial design)
Total assembly labor cost, in RM 4.59
Other operation cost per product, in RM 0.25
Total manufacturing piece part cost, in RM 48.10
Total cost per product without tooling, in RM 52.95
Assembly tool or fixture cost per product, in RM 0.00
Manufacturing tooling cost per product, in RM 1.08
Total cost per product, in RM 54.03
Table 4.4 Breakdown of the time (initial design)
Per Product data Entries (including repeats) Labor Time, s
Component parts 23 115.46
Subassemblies (partial or full analysis) 3 10.95
Standard and library operations 7 57.12
Totals 33 183.53
The manual assembly of the product performed 10 times manually, with 150.1 s
average assembly time (see Table 4.5). This appears to be more reasonable and consistent
as compared with the one calculated on the Boothroyd method.
50
Univers
ity of
Mala
ya
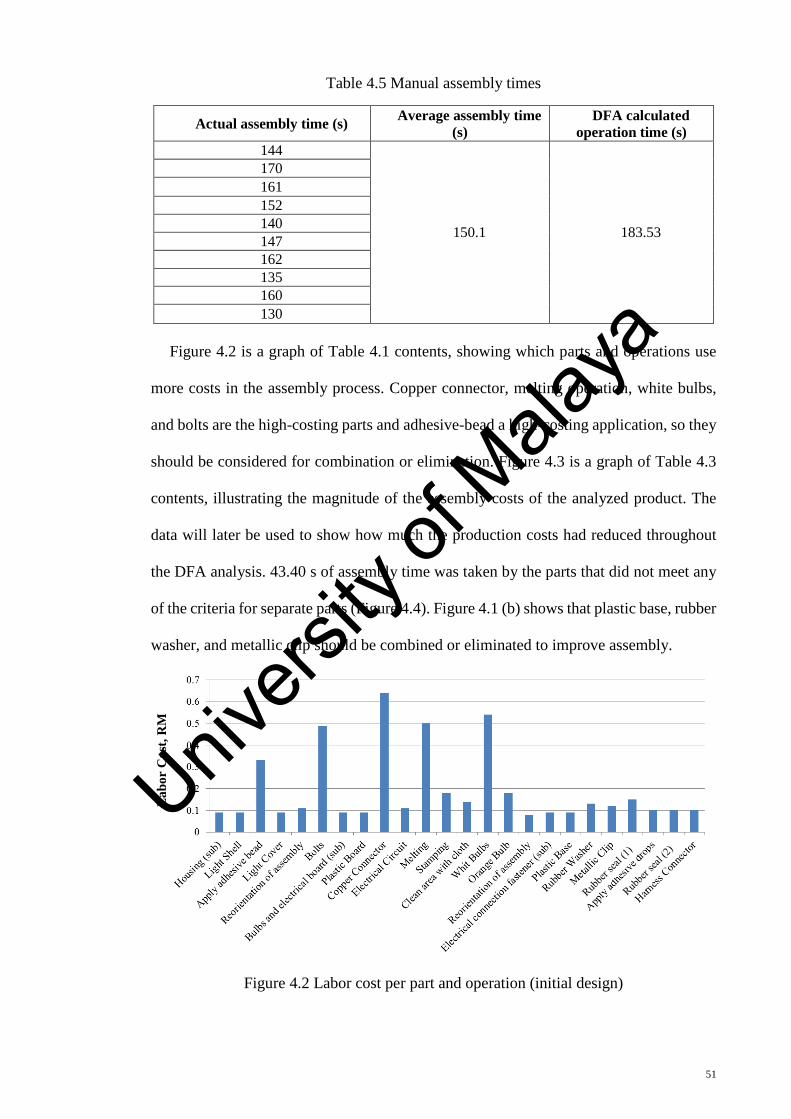
Table 4.5 Manual assembly times
Actual assembly time (s) Average assembly time (s)
DFA calculated operation time (s)
144
150.1 183.53
170 161 152 140 147 162 135 160 130
Figure 4.2 is a graph of Table 4.1 contents, showing which parts and operations use
more costs in the assembly process. Copper connector, melting operation, white bulbs,
and bolts are the high-costing parts and adhesive-bead a high-costing application, so they
should be considered for combination or elimination. Figure 4.3 is a graph of Table 4.3
contents, illustrating the magnitude of the assembly costs of the analyzed product. The
data will later be used to show how much the production costs had reduced throughout
the DFA analysis. 43.40 s of assembly time was taken by the parts that did not meet any
of the criteria for separate parts (Figure 4.4). Figure 4.1 (b) shows that plastic base, rubber
washer, and metallic clip should be combined or eliminated to improve assembly.
Figure 4.2 Labor cost per part and operation (initial design)
Lab
or C
ost,
RM
51
Univers
ity of
Mala
ya
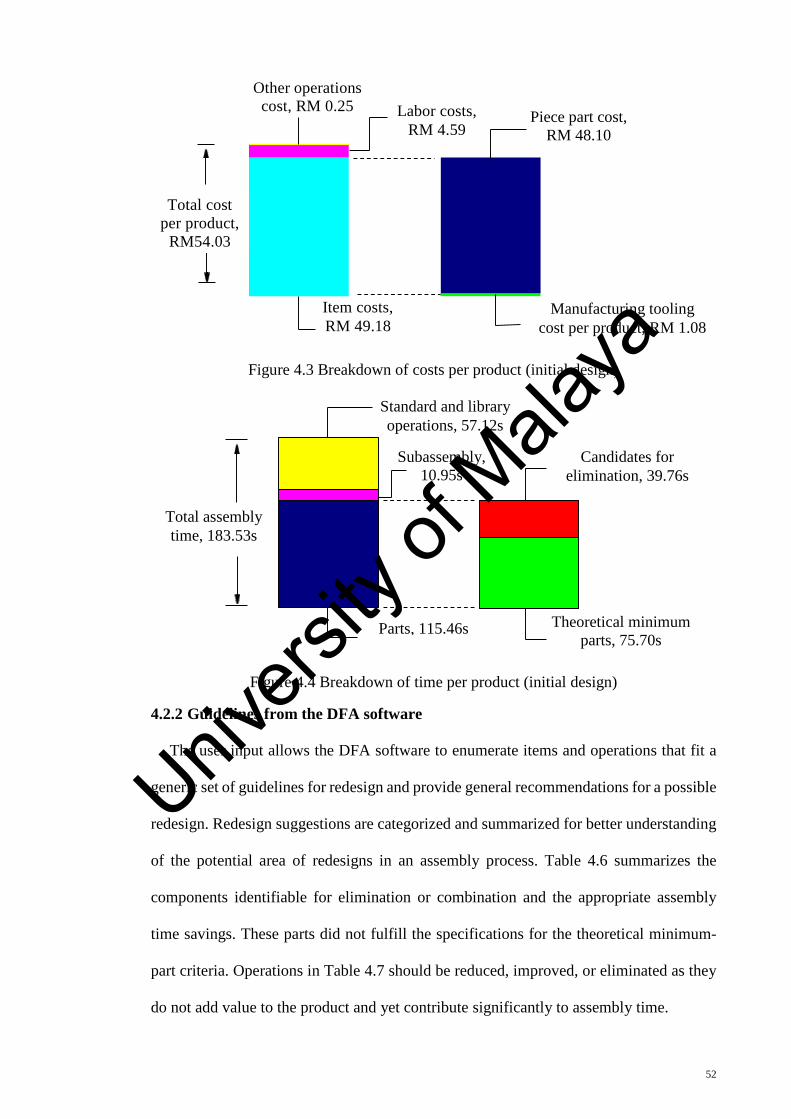
Figure 4.3 Breakdown of costs per product (initial design)
Figure 4.4 Breakdown of time per product (initial design)
4.2.2 Guidelines from the DFA software
The user input allows the DFA software to enumerate items and operations that fit a
generic set of guidelines for redesign and provide general recommendations for a possible
redesign. Redesign suggestions are categorized and summarized for better understanding
of the potential area of redesigns in an assembly process. Table 4.6 summarizes the
components identifiable for elimination or combination and the appropriate assembly
time savings. These parts did not fulfill the specifications for the theoretical minimum-
part criteria. Operations in Table 4.7 should be reduced, improved, or eliminated as they
do not add value to the product and yet contribute significantly to assembly time.
Item costs, RM 49.18
Manufacturing tooling cost per product, RM 1.08
Piece part cost, RM 48.10
Total cost per product,
RM54.03
Other operations cost, RM 0.25 Labor costs,
RM 4.59
Standard and library operations, 57.12s
Theoretical minimum parts, 75.70s
Total assembly time, 183.53s
Parts, 115.46s
Subassembly, 10.95s
Candidates for elimination, 39.76s
52
Univers
ity of
Mala
ya
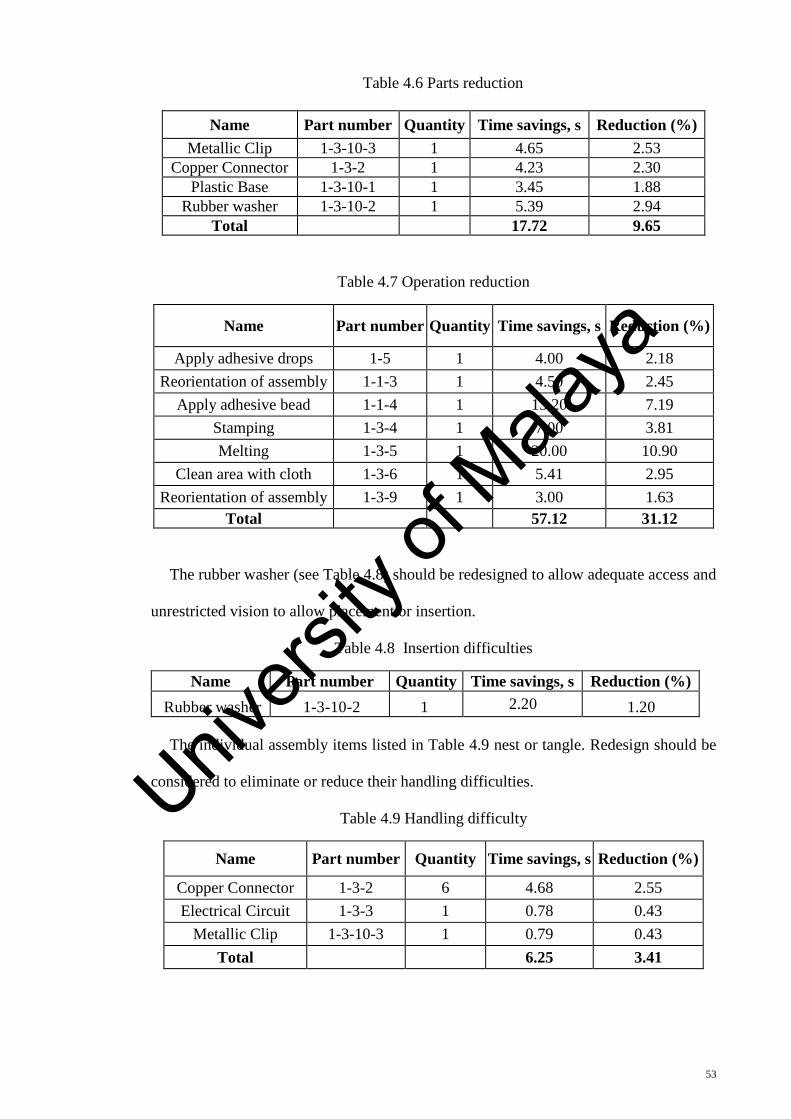
Table 4.6 Parts reduction
Name Part number Quantity Time savings, s Reduction (%) Metallic Clip 1-3-10-3 1 4.65 2.53
Copper Connector 1-3-2 1 4.23 2.30 Plastic Base 1-3-10-1 1 3.45 1.88
Rubber washer 1-3-10-2 1 5.39 2.94 Total 17.72 9.65
Table 4.7 Operation reduction
Name Part number Quantity Time savings, s Reduction (%)
Apply adhesive drops 1-5 1 4.00 2.18 Reorientation of assembly 1-1-3 1 4.50 2.45
Apply adhesive bead 1-1-4 1 13.20 7.19 Stamping 1-3-4 1 7.00 3.81 Melting 1-3-5 1 20.00 10.90
Clean area with cloth 1-3-6 1 5.41 2.95 Reorientation of assembly 1-3-9 1 3.00 1.63
Total 57.12 31.12
The rubber washer (see Table 4.8) should be redesigned to allow adequate access and
unrestricted vision to allow placement or insertion.
Table 4.8 Insertion difficulties
Name Part number Quantity Time savings, s Reduction (%) Rubber washer 1-3-10-2 1 2.20 1.20 The individual assembly items listed in Table 4.9 nest or tangle. Redesign should be
considered to eliminate or reduce their handling difficulties.
Table 4.9 Handling difficulty
Name Part number Quantity Time savings, s Reduction (%)
Copper Connector 1-3-2 6 4.68 2.55 Electrical Circuit 1-3-3 1 0.78 0.43
Metallic Clip 1-3-10-3 1 0.79 0.43 Total 6.25 3.41
53
Univers
ity of
Mala
ya
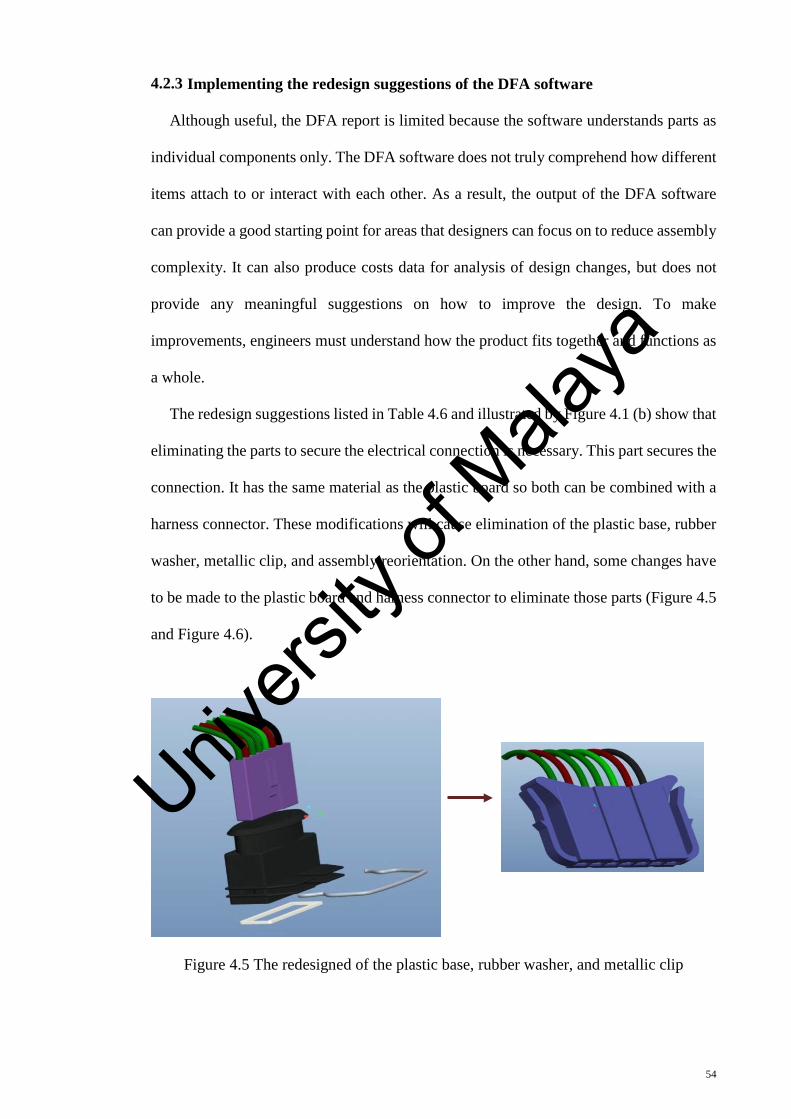
4.2.3 Implementing the redesign suggestions of the DFA software
Although useful, the DFA report is limited because the software understands parts as
individual components only. The DFA software does not truly comprehend how different
items attach to or interact with each other. As a result, the output of the DFA software
can provide a good starting point for areas that designers can focus on to reduce assembly
complexity. It can also produce costs data for analysis of design changes, but does not
provide any meaningful suggestions on how to improve the design. To make
improvements, engineers must understand how the product fits together and functions as
a whole.
The redesign suggestions listed in Table 4.6 and illustrated by Figure 4.1 (b) show that
eliminating the parts to secure the electrical connection is necessary. This part secures the
connection. It has the same material as the plastic board so both can be combined with a
harness connector. These modifications will cause elimination of the plastic base, rubber
washer, metallic clip, and assembly reorientation. On the other hand, some changes have
to be made to the plastic board and harness connector to eliminate those parts (Figure 4.5
and Figure 4.6).
Figure 4.5 The redesigned of the plastic base, rubber washer, and metallic clip
54
Univers
ity of
Mala
ya
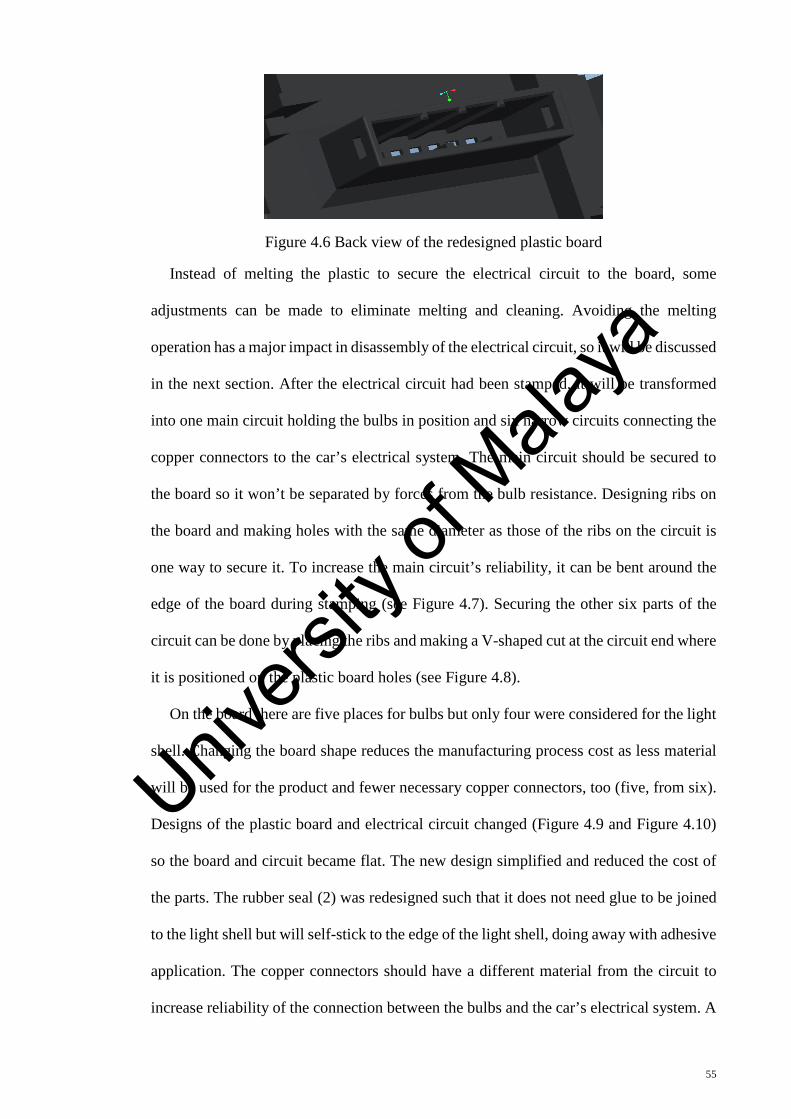
Figure 4.6 Back view of the redesigned plastic board
Instead of melting the plastic to secure the electrical circuit to the board, some
adjustments can be made to eliminate melting and cleaning. Avoiding the melting
operation has a major impact in disassembly of the electrical circuit, so it will be discussed
in the next section. After the electrical circuit had been stamped, it will be transformed
into one main circuit holding the bulbs in position and six narrow circuits connecting the
copper connectors to the car’s electrical system. The main circuit should be secured to
the board so it won’t be separated by forces from the bulb resistance. Designing ribs on
the board and making holes with the same diameter as those of the ribs on the circuit is
one way to secure it. To increase the main circuit’s reliability, it can be bent around the
edge of the board during stamping (see Figure 4.7). Securing the other six parts of the
circuit can be done by placing the ribs and making a V-shaped cut at the circuit end where
it is positioned on the plastic board holes (see Figure 4.8).
On the board there are five places for bulbs but only four were considered for the light
shell. Changing the board shape reduces the manufacturing process cost as less material
will be used for the product and fewer necessary copper connectors, too (five, from six).
Designs of the plastic board and electrical circuit changed (Figure 4.9 and Figure 4.10)
so the board and circuit became flat. The new design simplified and reduced the cost of
the parts. The rubber seal (2) was redesigned such that it does not need glue to be joined
to the light shell but will self-stick to the edge of the light shell, doing away with adhesive
application. The copper connectors should have a different material from the circuit to
increase reliability of the connection between the bulbs and the car’s electrical system. A
55
Univers
ity of
Mala
ya
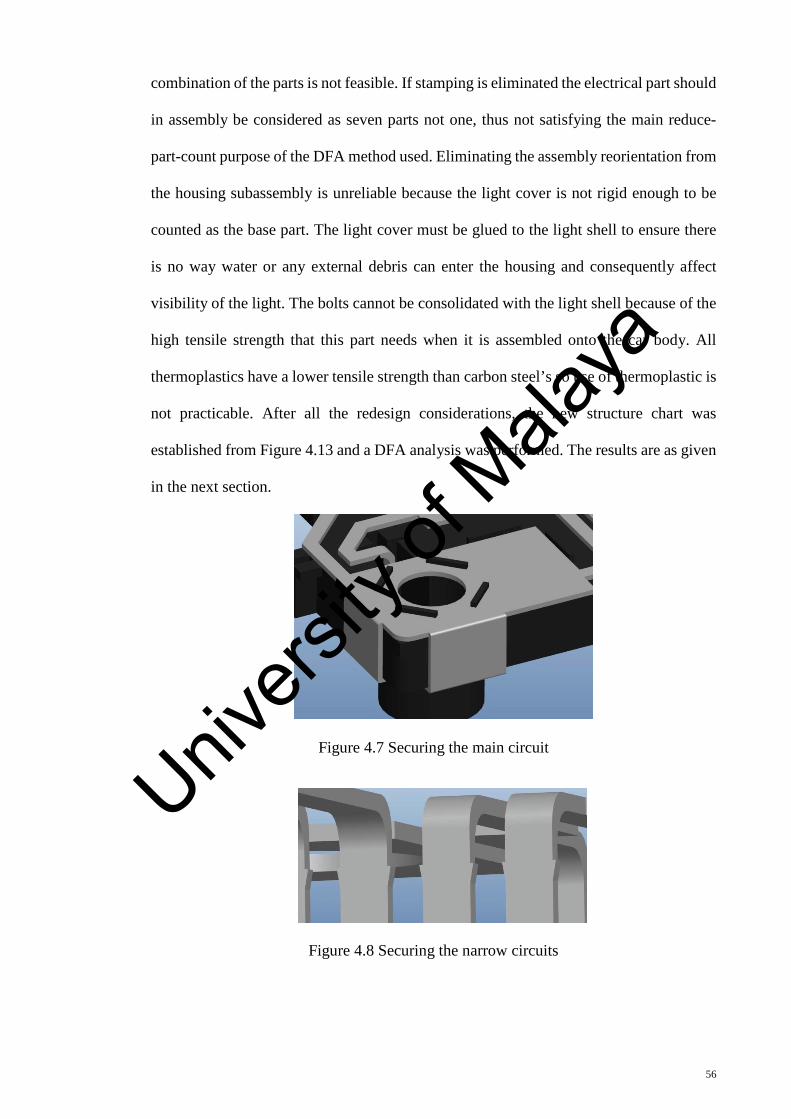
combination of the parts is not feasible. If stamping is eliminated the electrical part should
in assembly be considered as seven parts not one, thus not satisfying the main reduce-
part-count purpose of the DFA method used. Eliminating the assembly reorientation from
the housing subassembly is unreliable because the light cover is not rigid enough to be
counted as the base part. The light cover must be glued to the light shell to ensure there
is no way water or any external debris can enter the housing and consequently affect
visibility of the light. The bolts cannot be consolidated with the light shell because of the
high tensile strength that this part needs when it is assembled onto the car body. All
thermoplastics have a lower tensile strength than carbon steel’s so use of thermoplastic is
not practicable. After all the redesign considerations, the new structure chart was
established from Figure 4.13 and a DFA analysis was performed. The results are as given
in the next section.
Figure 4.7 Securing the main circuit
Figure 4.8 Securing the narrow circuits
56
Univers
ity of
Mala
ya
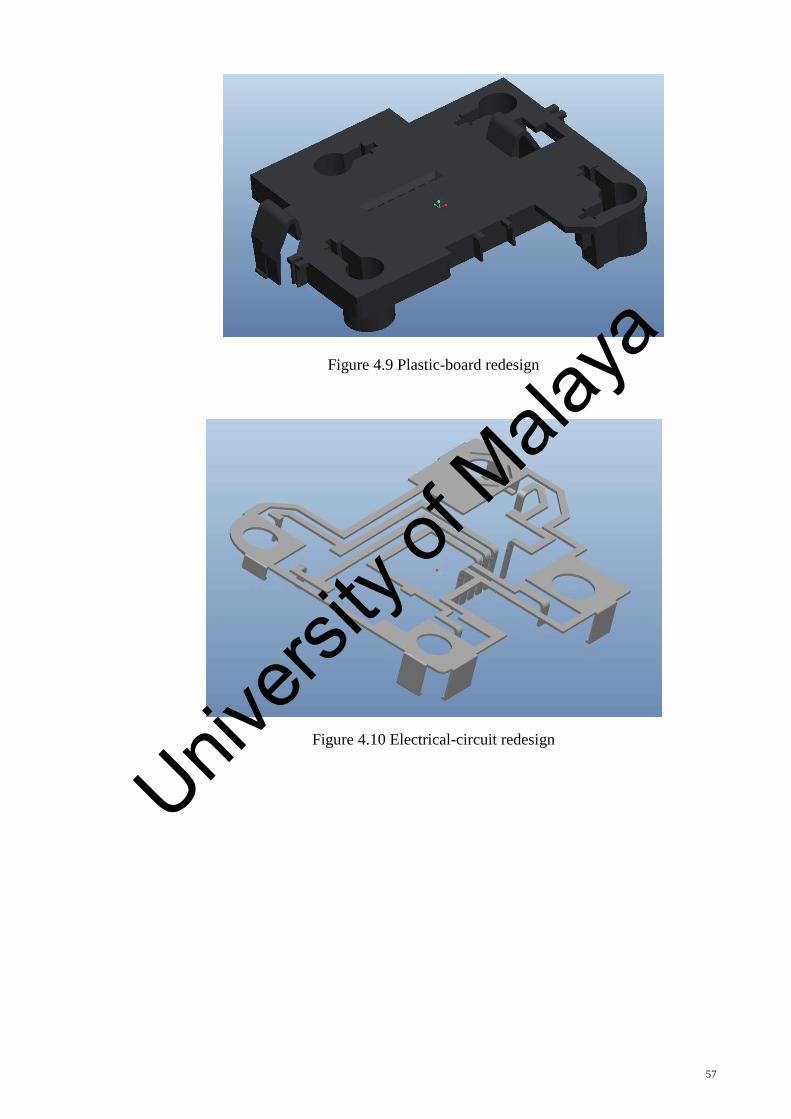
Figure 4.9 Plastic-board redesign
Figure 4.10 Electrical-circuit redesign
57
Univers
ity of
Mala
ya
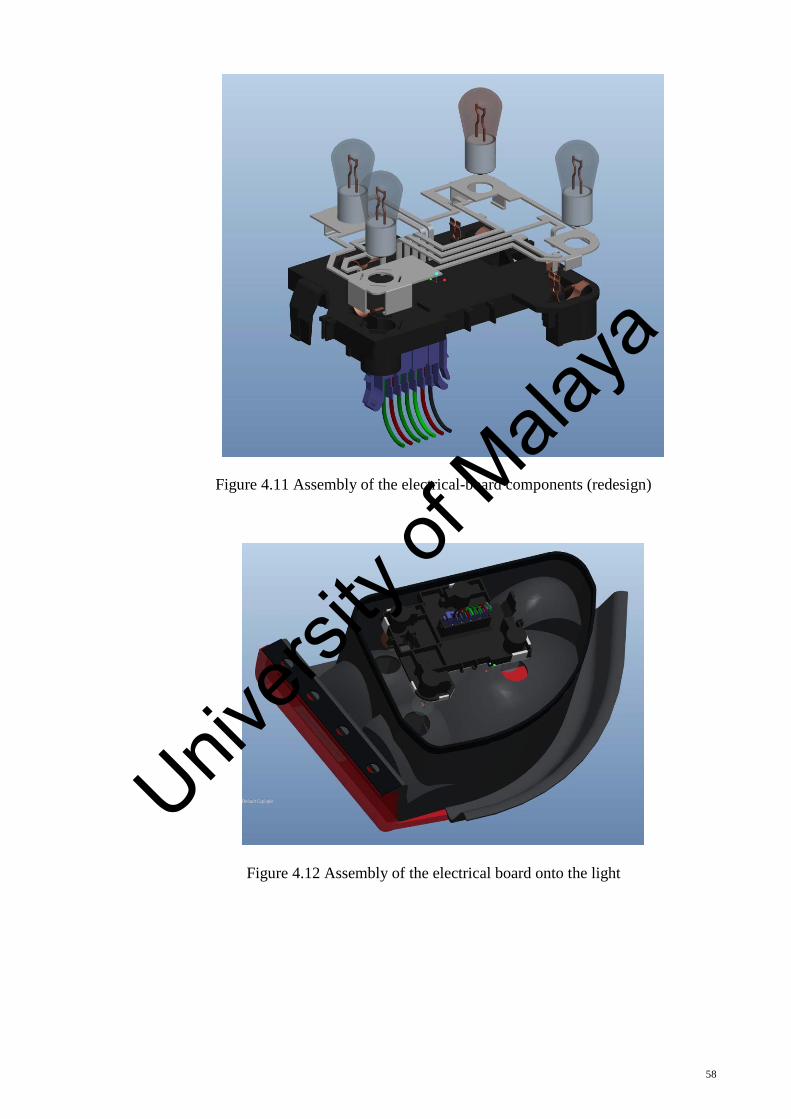
Figure 4.11 Assembly of the electrical-board components (redesign)
Figure 4.12 Assembly of the electrical board onto the light
58
Univers
ity of
Mala
ya
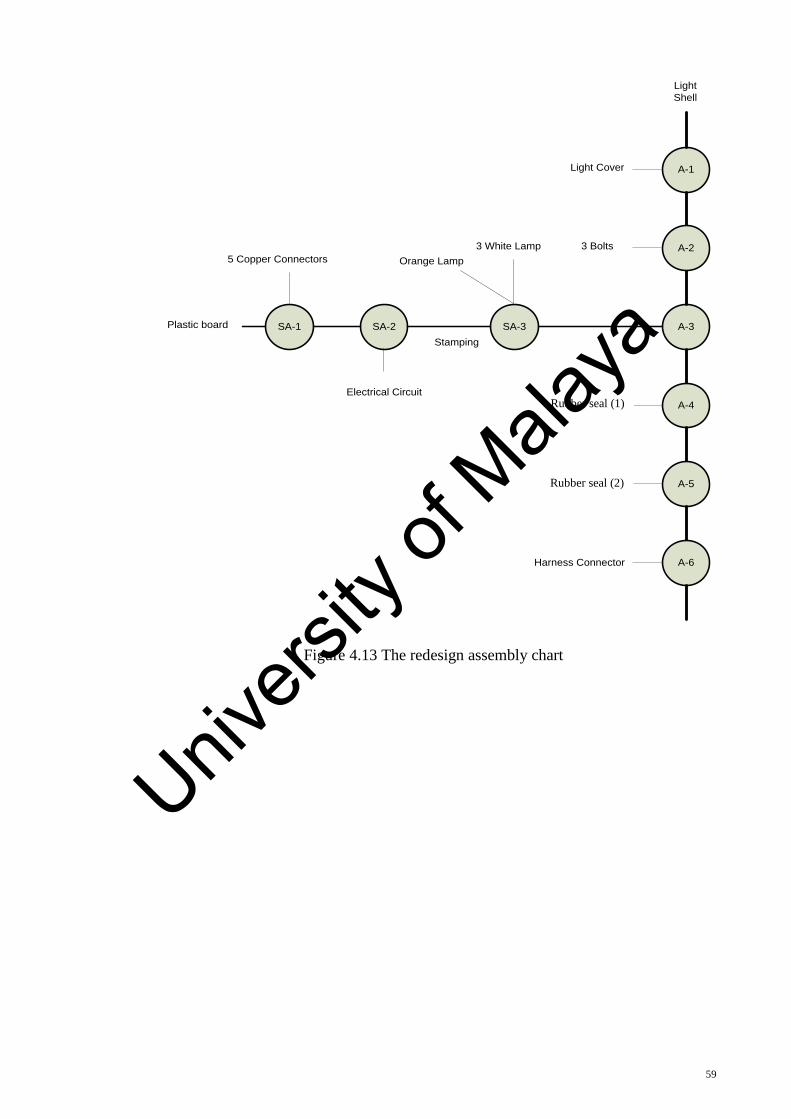
A-3
A-1
SA-3
Light Cover
Light Shell
SA-2SA-1Plastic board
Electrical Circuit
5 Copper Connectors3 White Lamp
Orange Lamp3 Bolts
Stamping
A-2
A-4
A-5
A-6
Washer1
Washer2
Harness Connector
Figure 4.13 The redesign assembly chart
Rubber seal (1)
Rubber seal (2)
59
Univers
ity of
Mala
ya
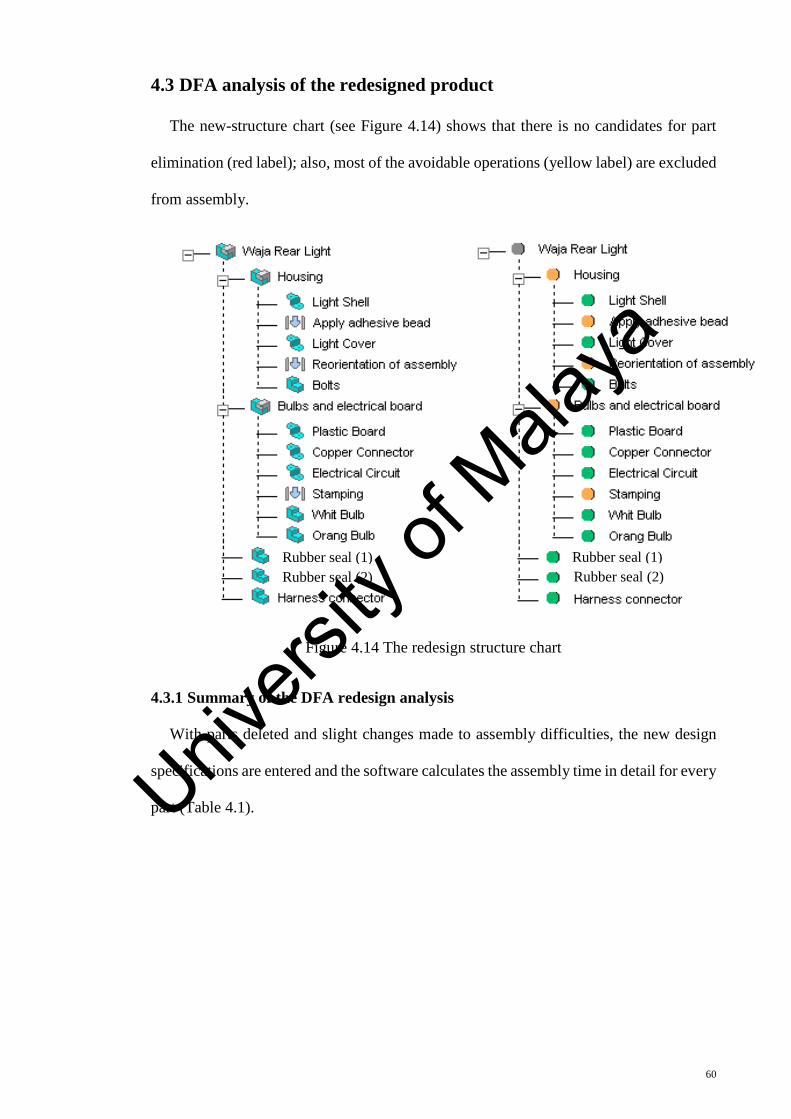
4.3 DFA analysis of the redesigned product
The new-structure chart (see Figure 4.14) shows that there is no candidates for part
elimination (red label); also, most of the avoidable operations (yellow label) are excluded
from assembly.
Figure 4.14 The redesign structure chart
4.3.1 Summary of the DFA redesign analysis
With parts deleted and slight changes made to assembly difficulties, the new design
specifications are entered and the software calculates the assembly time in detail for every
part (Table 4.1).
Rubber seal (2) Rubber seal (1) Rubber seal (1)
Rubber seal (2)
60
Univers
ity of
Mala
ya
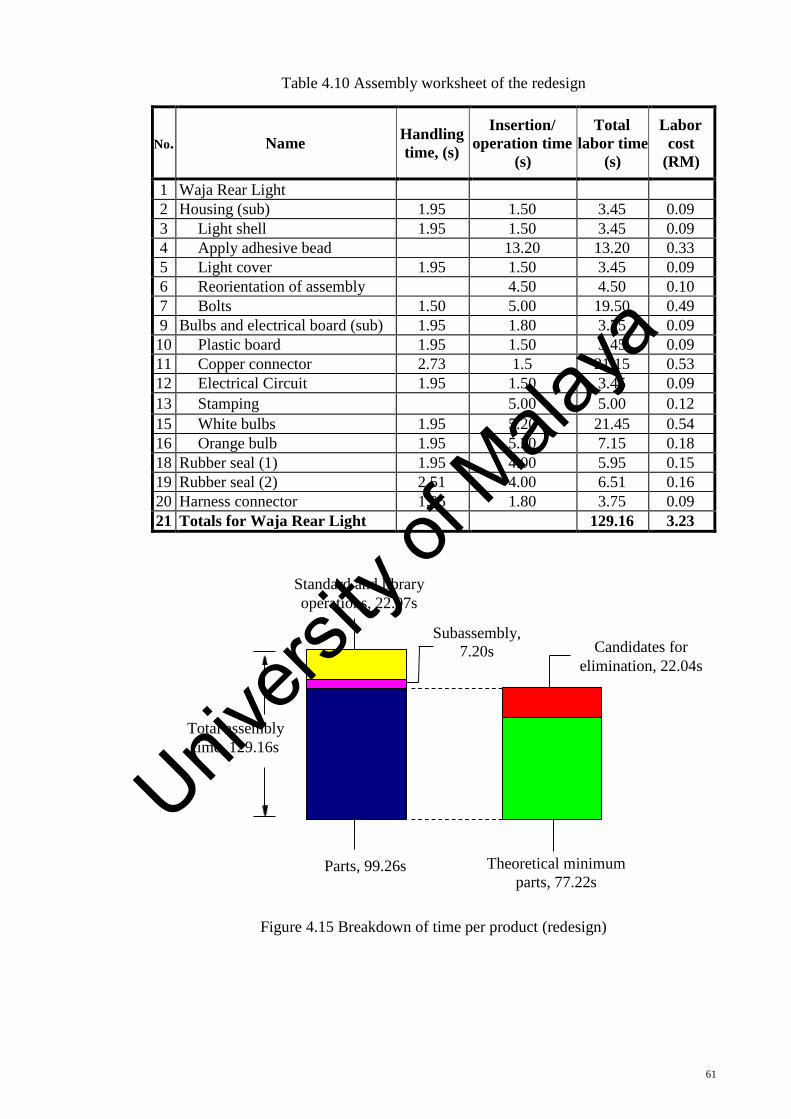
Table 4.10 Assembly worksheet of the redesign
No. Name Handling time, (s)
Insertion/ operation time
(s)
Total labor time
(s)
Labor cost
(RM)
1 Waja Rear Light 2 Housing (sub) 1.95 1.50 3.45 0.09 3 Light shell 1.95 1.50 3.45 0.09 4 Apply adhesive bead 13.20 13.20 0.33 5 Light cover 1.95 1.50 3.45 0.09 6 Reorientation of assembly 4.50 4.50 0.10 7 Bolts 1.50 5.00 19.50 0.49 9 Bulbs and electrical board (sub) 1.95 1.80 3.75 0.09 10 Plastic board 1.95 1.50 3.45 0.09 11 Copper connector 2.73 1.5 21.15 0.53 12 Electrical Circuit 1.95 1.50 3.45 0.09 13 Stamping 5.00 5.00 0.12 15 White bulbs 1.95 5.20 21.45 0.54 16 Orange bulb 1.95 5.20 7.15 0.18 18 Rubber seal (1) 1.95 4.00 5.95 0.15 19 Rubber seal (2) 2.51 4.00 6.51 0.16 20 Harness connector 1.95 1.80 3.75 0.09 21 Totals for Waja Rear Light 129.16 3.23
Figure 4.15 Breakdown of time per product (redesign)
Total assembly time, 129.16s
Standard and library operations, 22.07s
Theoretical minimum parts, 77.22s
Parts, 99.26s
Subassembly, 7.20s Candidates for
elimination, 22.04s
61
Univers
ity of
Mala
ya
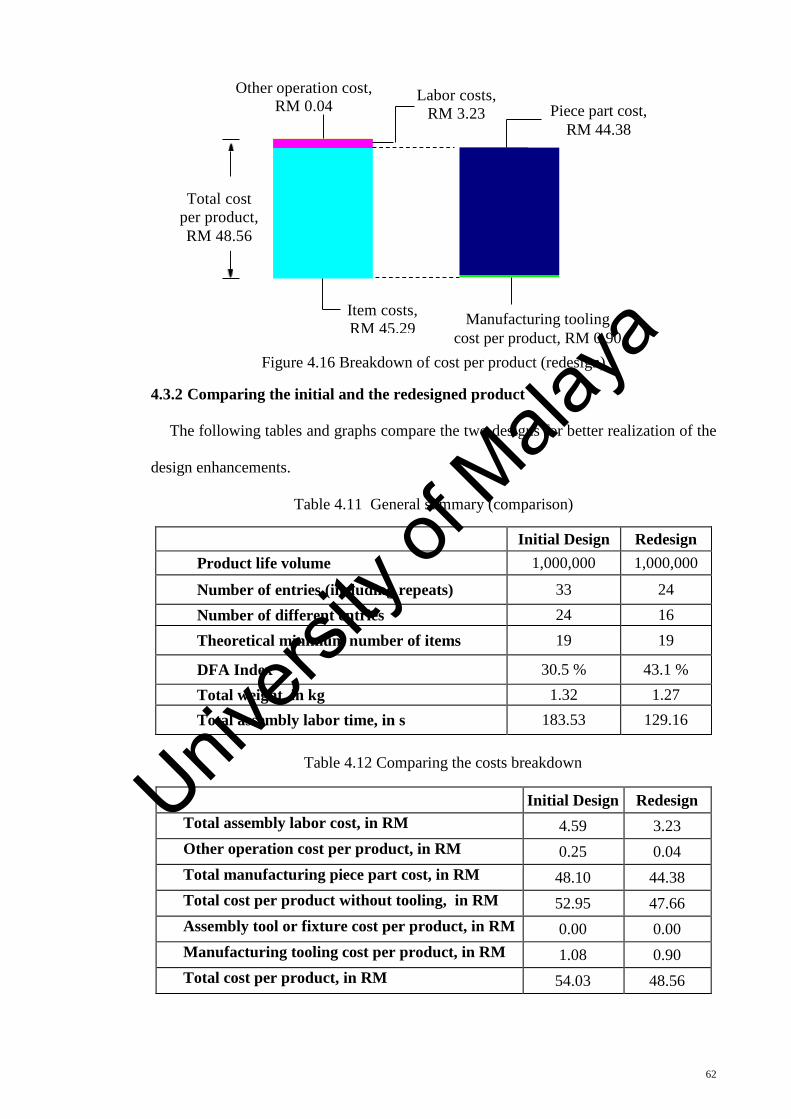
Figure 4.16 Breakdown of cost per product (redesign)
4.3.2 Comparing the initial and the redesigned product
The following tables and graphs compare the two designs for better realization of the
design enhancements.
Table 4.11 General summary (comparison)
Initial Design Redesign Product life volume 1,000,000 1,000,000
Number of entries (including repeats) 33 24 Number of different entries 24 16 Theoretical minimum number of items 19 19
DFA Index 30.5 % 43.1 % Total weight, in kg 1.32 1.27 Total assembly labor time, in s 183.53 129.16
Table 4.12 Comparing the costs breakdown
Initial Design Redesign Total assembly labor cost, in RM 4.59 3.23 Other operation cost per product, in RM 0.25 0.04 Total manufacturing piece part cost, in RM 48.10 44.38 Total cost per product without tooling, in RM 52.95 47.66 Assembly tool or fixture cost per product, in RM 0.00 0.00 Manufacturing tooling cost per product, in RM 1.08 0.90 Total cost per product, in RM 54.03 48.56
Piece part cost, RM 44.38
Manufacturing tooling cost per product, RM 0.90
Total cost per product, RM 48.56
Other operation cost, RM 0.04
Item costs, RM 45.29
Labor costs, RM 3.23
62
Univers
ity of
Mala
ya
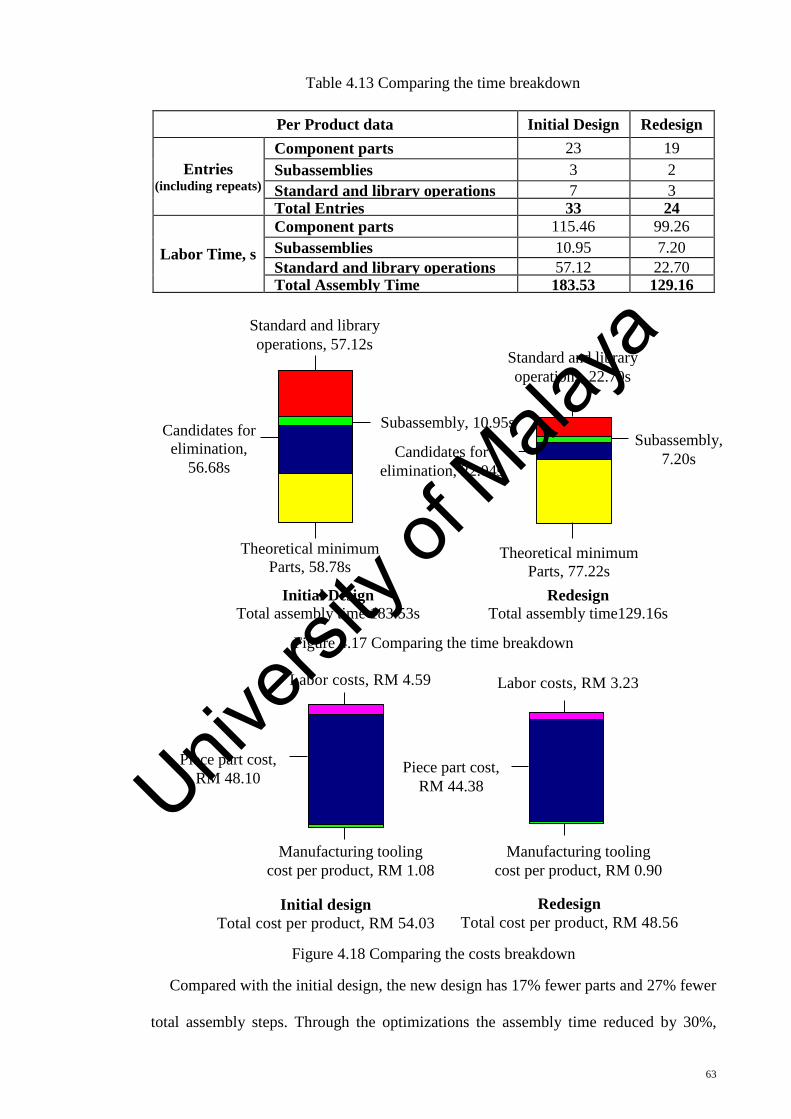
Table 4.13 Comparing the time breakdown
Per Product data Initial Design Redesign
Entries (including repeats)
Component parts 23 19 Subassemblies 3 2 Standard and library operations 7 3 Total Entries 33 24
Labor Time, s
Component parts 115.46 99.26 Subassemblies 10.95 7.20 Standard and library operations 57.12 22.70 Total Assembly Time 183.53 129.16
Figure 4.17 Comparing the time breakdown
Figure 4.18 Comparing the costs breakdown
Compared with the initial design, the new design has 17% fewer parts and 27% fewer
total assembly steps. Through the optimizations the assembly time reduced by 30%,
Subassembly, 10.95s
Standard and library operations, 57.12s
Candidates for elimination,
56.68s
Theoretical minimum Parts, 58.78s
Standard and library operations, 22.70s
Subassembly, 7.20s
Theoretical minimum Parts, 77.22s
Candidates for elimination, 22.04s
Initial Design Total assembly time 183.53s
Redesign Total assembly time129.16s
Labor costs, RM 3.23
Piece part cost, RM 48.10
Piece part cost, RM 44.38
Manufacturing tooling cost per product, RM 1.08
Manufacturing tooling cost per product, RM 0.90
Labor costs, RM 4.59
Initial design Total cost per product, RM 54.03
Redesign Total cost per product, RM 48.56
63
Univers
ity of
Mala
ya
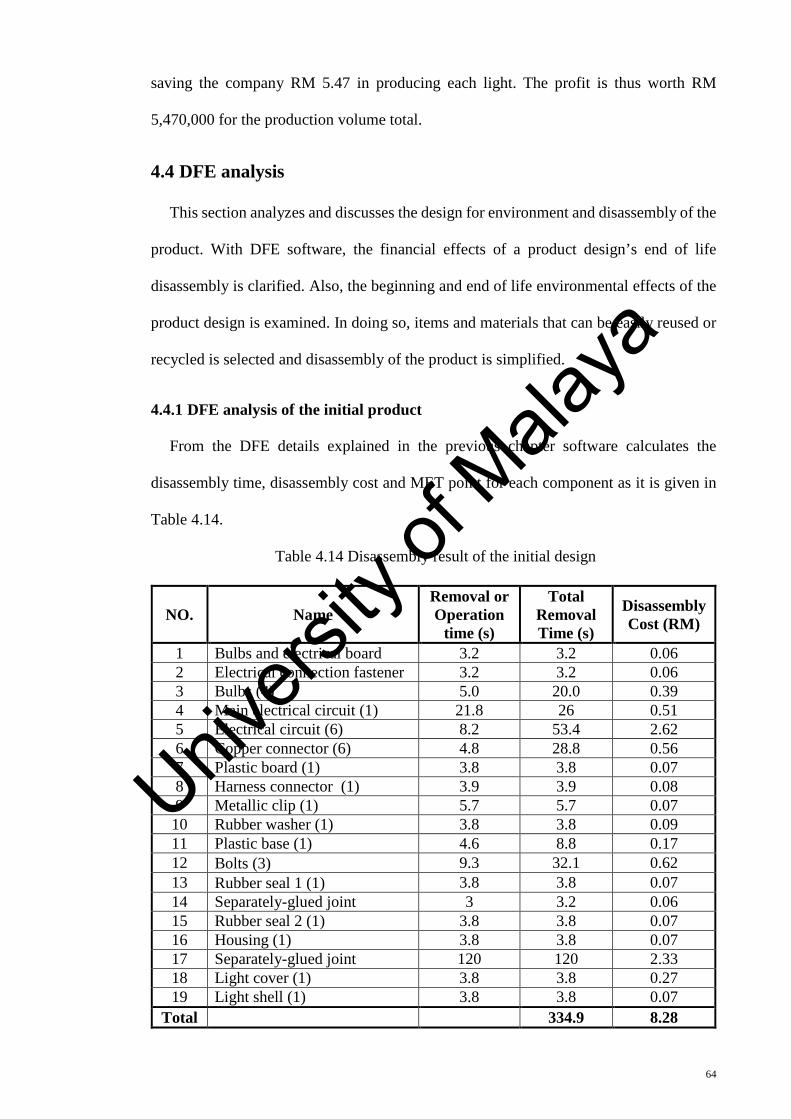
saving the company RM 5.47 in producing each light. The profit is thus worth RM
5,470,000 for the production volume total.
4.4 DFE analysis
This section analyzes and discusses the design for environment and disassembly of the
product. With DFE software, the financial effects of a product design’s end of life
disassembly is clarified. Also, the beginning and end of life environmental effects of the
product design is examined. In doing so, items and materials that can be easily reused or
recycled is selected and disassembly of the product is simplified.
4.4.1 DFE analysis of the initial product
From the DFE details explained in the previous chapter software calculates the
disassembly time, disassembly cost and MET point for each component as it is given in
Table 4.14.
Table 4.14 Disassembly result of the initial design
NO. Name Removal or Operation
time (s)
Total Removal Time (s)
Disassembly Cost (RM)
1 Bulbs and electrical board 3.2 3.2 0.06 2 Electrical connection fastener 3.2 3.2 0.06 3 Bulbs (4) 5.0 20.0 0.39 4 Main electrical circuit (1) 21.8 26 0.51 5 Electrical circuit (6) 8.2 53.4 2.62 6 Copper connector (6) 4.8 28.8 0.56 7 Plastic board (1) 3.8 3.8 0.07 8 Harness connector (1) 3.9 3.9 0.08 9 Metallic clip (1) 5.7 5.7 0.07 10 Rubber washer (1) 3.8 3.8 0.09 11 Plastic base (1) 4.6 8.8 0.17 12 Bolts (3) 9.3 32.1 0.62 13 Rubber seal 1 (1) 3.8 3.8 0.07 14 Separately-glued joint 3 3.2 0.06 15 Rubber seal 2 (1) 3.8 3.8 0.07 16 Housing (1) 3.8 3.8 0.07 17 Separately-glued joint 120 120 2.33 18 Light cover (1) 3.8 3.8 0.27 19 Light shell (1) 3.8 3.8 0.07
Total 334.9 8.28
64
Univers
ity of
Mala
ya
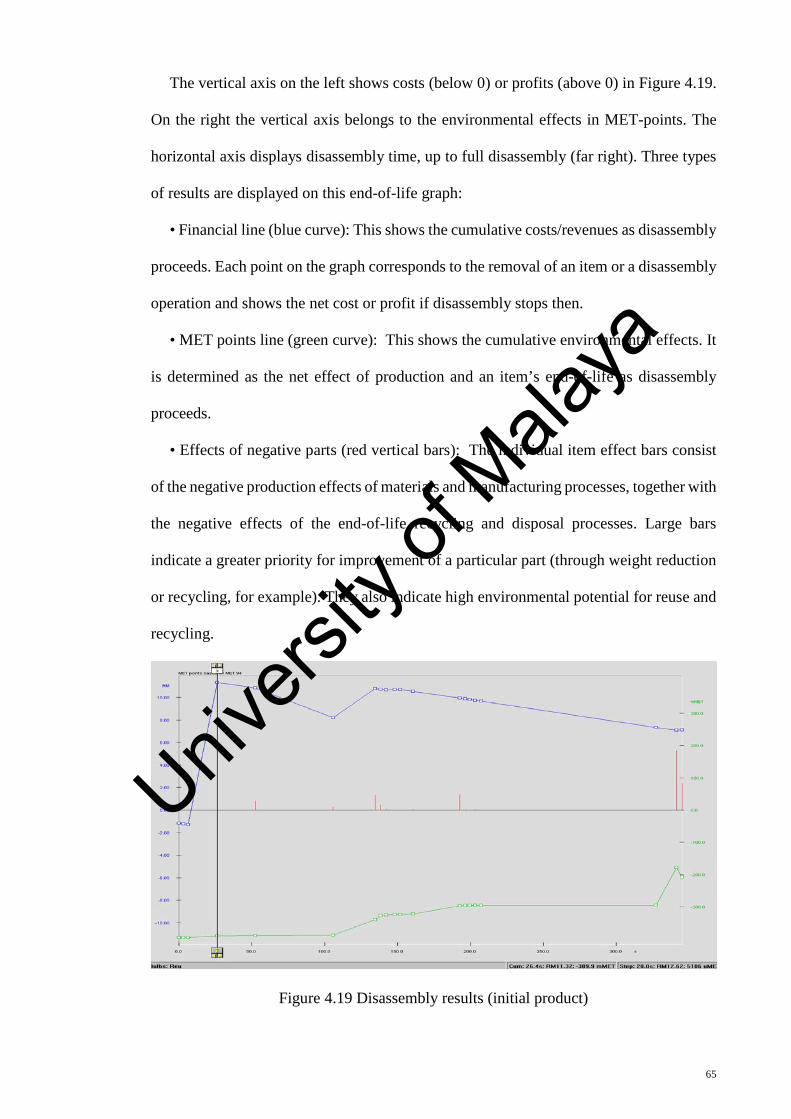
The vertical axis on the left shows costs (below 0) or profits (above 0) in Figure 4.19.
On the right the vertical axis belongs to the environmental effects in MET-points. The
horizontal axis displays disassembly time, up to full disassembly (far right). Three types
of results are displayed on this end-of-life graph:
• Financial line (blue curve): This shows the cumulative costs/revenues as disassembly
proceeds. Each point on the graph corresponds to the removal of an item or a disassembly
operation and shows the net cost or profit if disassembly stops then.
• MET points line (green curve): This shows the cumulative environmental effects. It
is determined as the net effect of production and an item’s end-of-life as disassembly
proceeds.
• Effects of negative parts (red vertical bars): The individual item effect bars consist
of the negative production effects of materials and manufacturing processes, together with
the negative effects of the end-of-life recycling and disposal processes. Large bars
indicate a greater priority for improvement of a particular part (through weight reduction
or recycling, for example). They also indicate high environmental potential for reuse and
recycling.
Figure 4.19 Disassembly results (initial product)
65
Univers
ity of
Mala
ya
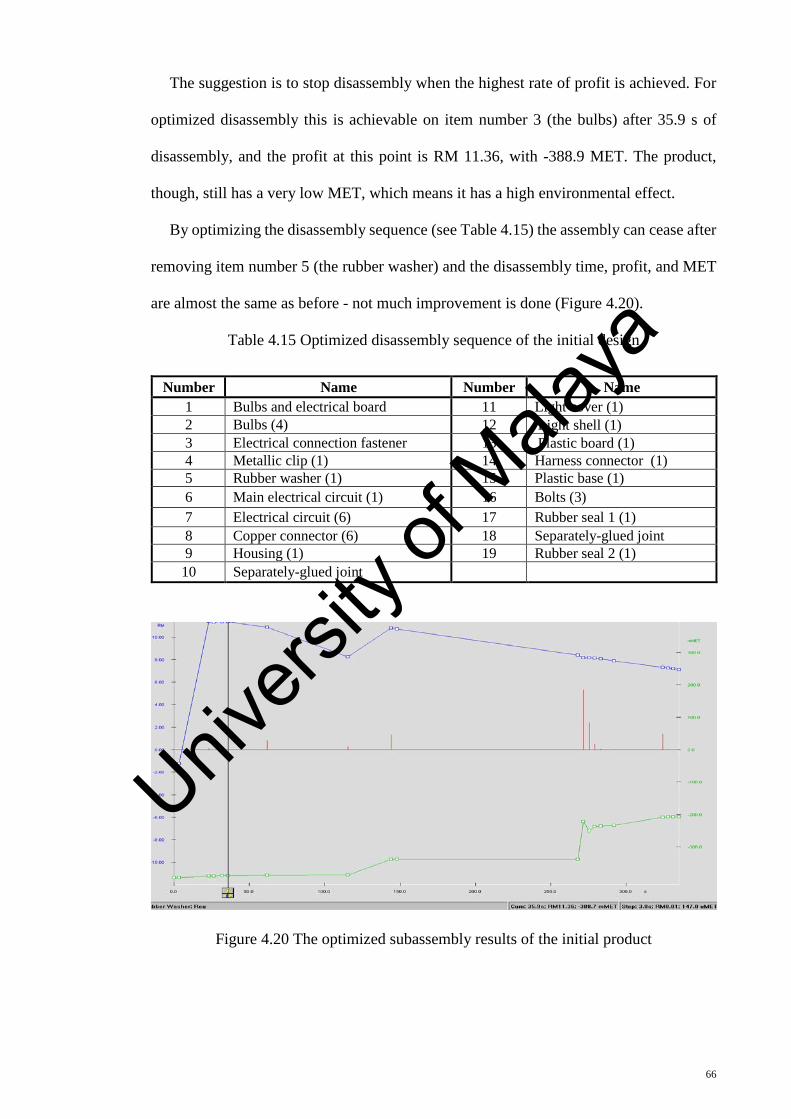
The suggestion is to stop disassembly when the highest rate of profit is achieved. For
optimized disassembly this is achievable on item number 3 (the bulbs) after 35.9 s of
disassembly, and the profit at this point is RM 11.36, with -388.9 MET. The product,
though, still has a very low MET, which means it has a high environmental effect.
By optimizing the disassembly sequence (see Table 4.15) the assembly can cease after
removing item number 5 (the rubber washer) and the disassembly time, profit, and MET
are almost the same as before - not much improvement is done (Figure 4.20).
Table 4.15 Optimized disassembly sequence of the initial design
Figure 4.20 The optimized subassembly results of the initial product
Number Name Number Name 1 Bulbs and electrical board 11 Light cover (1) 2 Bulbs (4) 12 Light shell (1) 3 Electrical connection fastener 13 Plastic board (1) 4 Metallic clip (1) 14 Harness connector (1) 5 Rubber washer (1) 15 Plastic base (1) 6 Main electrical circuit (1) 16 Bolts (3) 7 Electrical circuit (6) 17 Rubber seal 1 (1) 8 Copper connector (6) 18 Separately-glued joint 9 Housing (1) 19 Rubber seal 2 (1) 10 Separately-glued joint
66
Univers
ity of
Mala
ya
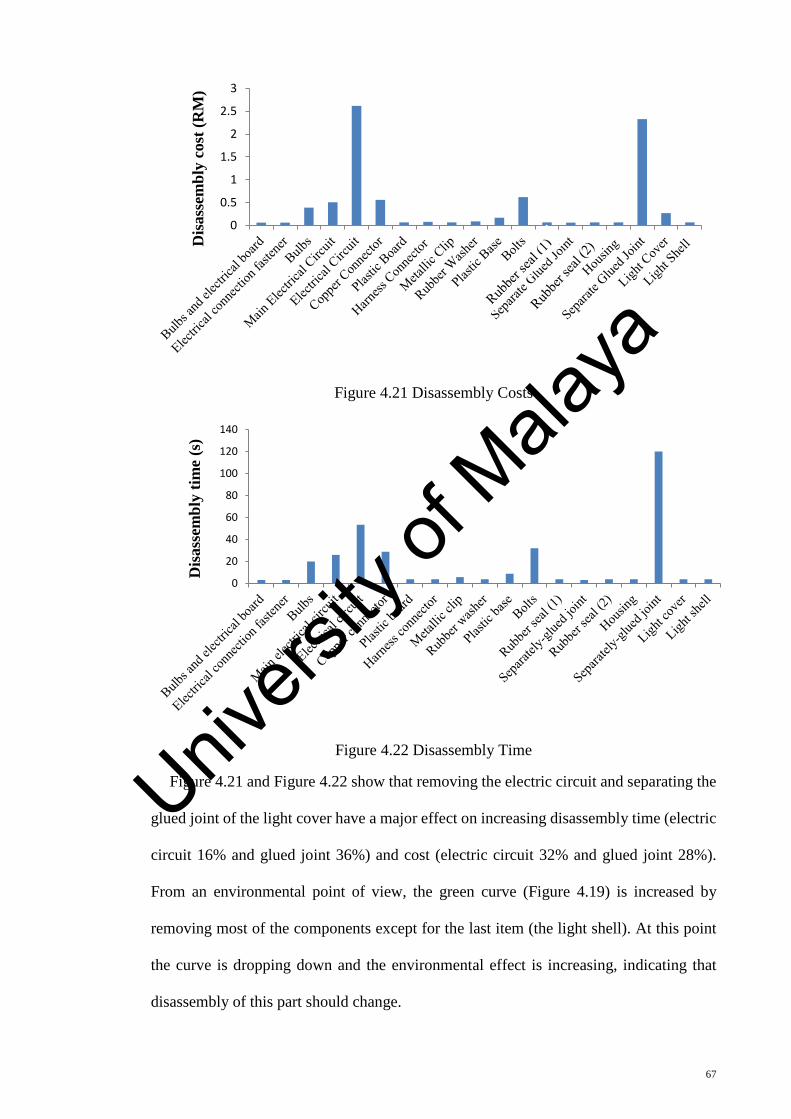
Figure 4.21 Disassembly Costs
Figure 4.22 Disassembly Time
Figure 4.21 and Figure 4.22 show that removing the electric circuit and separating the
glued joint of the light cover have a major effect on increasing disassembly time (electric
circuit 16% and glued joint 36%) and cost (electric circuit 32% and glued joint 28%).
From an environmental point of view, the green curve (Figure 4.19) is increased by
removing most of the components except for the last item (the light shell). At this point
the curve is dropping down and the environmental effect is increasing, indicating that
disassembly of this part should change.
0
0.5
1
1.5
2
2.5
3
Dis
asse
mbl
y co
st (R
M)
0
20
40
60
80
100
120
140
Dis
asse
mbl
y tim
e (s
)
67
Univers
ity of
Mala
ya
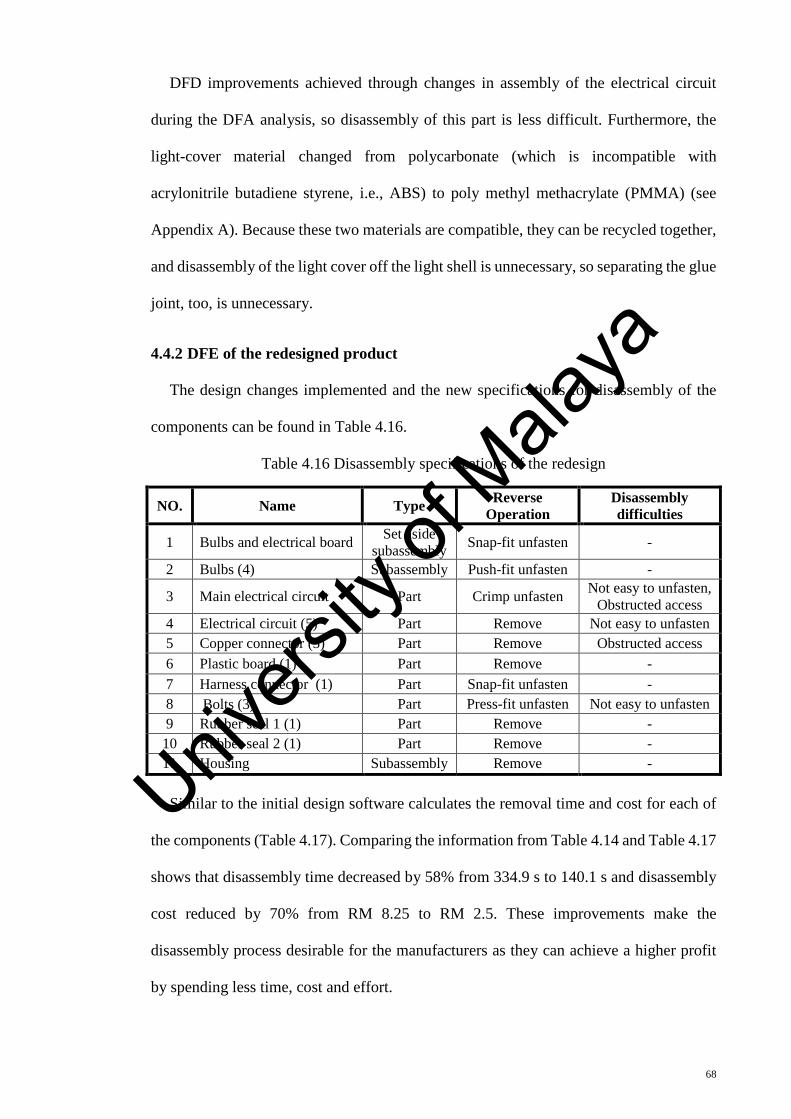
DFD improvements achieved through changes in assembly of the electrical circuit
during the DFA analysis, so disassembly of this part is less difficult. Furthermore, the
light-cover material changed from polycarbonate (which is incompatible with
acrylonitrile butadiene styrene, i.e., ABS) to poly methyl methacrylate (PMMA) (see
Appendix A). Because these two materials are compatible, they can be recycled together,
and disassembly of the light cover off the light shell is unnecessary, so separating the glue
joint, too, is unnecessary.
4.4.2 DFE of the redesigned product
The design changes implemented and the new specifications for disassembly of the
components can be found in Table 4.16.
Table 4.16 Disassembly specifications of the redesign
NO. Name Type Reverse Operation
Disassembly difficulties
1 Bulbs and electrical board Set aside subassembly Snap-fit unfasten -
2 Bulbs (4) Subassembly Push-fit unfasten -
3 Main electrical circuit Part Crimp unfasten Not easy to unfasten, Obstructed access
4 Electrical circuit (5) Part Remove Not easy to unfasten 5 Copper connector (5) Part Remove Obstructed access 6 Plastic board (1) Part Remove - 7 Harness connector (1) Part Snap-fit unfasten - 8 Bolts (3) Part Press-fit unfasten Not easy to unfasten 9 Rubber seal 1 (1) Part Remove -
10 Rubber seal 2 (1) Part Remove - 11 Housing Subassembly Remove - Similar to the initial design software calculates the removal time and cost for each of
the components (Table 4.17). Comparing the information from Table 4.14 and Table 4.17
shows that disassembly time decreased by 58% from 334.9 s to 140.1 s and disassembly
cost reduced by 70% from RM 8.25 to RM 2.5. These improvements make the
disassembly process desirable for the manufacturers as they can achieve a higher profit
by spending less time, cost and effort.
68
Univers
ity of
Mala
ya
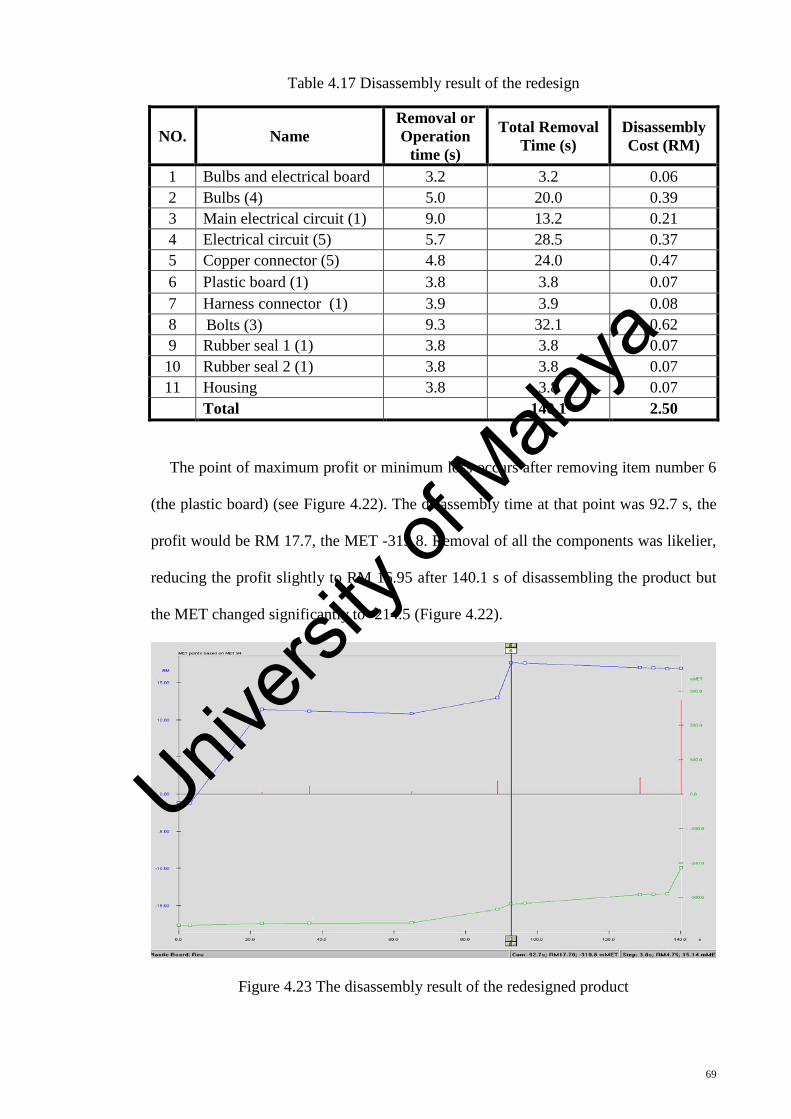
Table 4.17 Disassembly result of the redesign
NO. Name Removal or Operation
time (s)
Total Removal Time (s)
Disassembly Cost (RM)
1 Bulbs and electrical board 3.2 3.2 0.06 2 Bulbs (4) 5.0 20.0 0.39 3 Main electrical circuit (1) 9.0 13.2 0.21 4 Electrical circuit (5) 5.7 28.5 0.37 5 Copper connector (5) 4.8 24.0 0.47 6 Plastic board (1) 3.8 3.8 0.07 7 Harness connector (1) 3.9 3.9 0.08 8 Bolts (3) 9.3 32.1 0.62 9 Rubber seal 1 (1) 3.8 3.8 0.07 10 Rubber seal 2 (1) 3.8 3.8 0.07 11 Housing 3.8 3.8 0.07 Total 140.1 2.50
The point of maximum profit or minimum loss occurs after removing item number 6
(the plastic board) (see Figure 4.22). The disassembly time at that point was 92.7 s, the
profit would be RM 17.7, the MET -319.8. Removal of all the components was likelier,
reducing the profit slightly to RM 16.95 after 140.1 s of disassembling the product but
the MET changed significantly to -214.5 (Figure 4.22).
Figure 4.23 The disassembly result of the redesigned product
69
Univers
ity of
Mala
ya
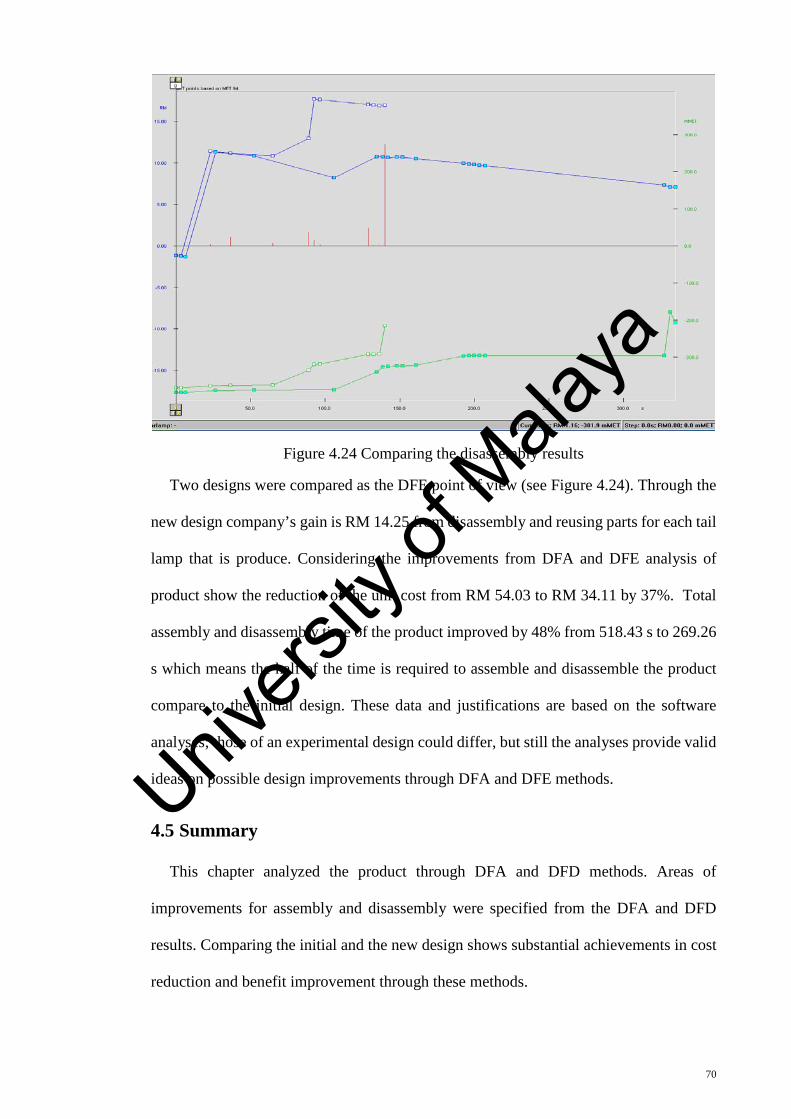
Figure 4.24 Comparing the disassembly results
Two designs were compared as the DFE point of view (see Figure 4.24). Through the
new design company’s gain is RM 14.25 from disassembly and reusing parts for each tail
lamp that is produce. Considering the improvements from DFA and DFE analysis of
product show the reduction of the unit cost from RM 54.03 to RM 34.11 by 37%. Total
assembly and disassembly time of the product improved by 48% from 518.43 s to 269.26
s which means the half of the time is required to assemble and disassemble the product
compare to the initial design. These data and justifications are based on the software
analyses; those of an experimental design could differ, but still the analyses provide valid
ideas on possible design improvements through DFA and DFE methods.
4.5 Summary
This chapter analyzed the product through DFA and DFD methods. Areas of
improvements for assembly and disassembly were specified from the DFA and DFD
results. Comparing the initial and the new design shows substantial achievements in cost
reduction and benefit improvement through these methods.
70
Univers
ity of
Mala
ya
CHAPTER 5 CONCLUSION
CONCLUSION
This chapter concludes the dissertation. Besides providing the conclusions it aims also
to make recommendations according to the outcome of the work done and the objectives
set at the beginning of the project.
The first objective was fulfilled through the analysis conducted in the introduction and
literature review (Chapters 1 and 2). The literature review provided the whole picture of
what DFA and DFD are. General DFA and DFD framework and guidelines were
reviewed, followed by a specific review of the Boothroyd and Dewhurst method. The
different approaches implemented to improve the product were also presented.
The second objective was achieved through the design analysis (chapter 3). A design
optimization method was selected and discussed. The benchmarking tools (DFA and
DFD) were implemented in a specific case study of tail-lamp design. Through the
benchmarking, the assembly and disassembly issues and the potential improvements were
specified and highlighted. The case study demonstrated that DFA and DFD could be used
to study and examine the existing designs of the automotive industries and accordingly to
develop new designs.
The third objective was accomplished in Chapter 4. The DFA and DFD redesign of
the tail lamp was developed from the results of the Boothroyd and Dewhurst method.
Through the process, important issues of the original design were identified and
examined. Successful redesigning of the case study proves that DFA and DFD are useful
tools helping designers solve assembly and disassembly problems, potentially and greatly
benefiting product development.
71
Univers
ity of
Mala
ya
REFERENCES
Abdullah, R., & Keshav Lall, M. (2003). Critical Elements of Supplier Development in
the Malaysian Automobile Industry: Parts and Components Procurement and Supplier Development Practice at Proton. Journal of International Development and Cooperation, 9(2), 65-87.
Bayoumi, A. M. E. (2000). Current Advances in Mechanical Design and Production. Paper presented at the the Seventh Cairo University International MDP Conference VII, Cairo-Egypt.
Bogue, R. (2012). Design for manufacture and assembly: background, capabilities and applications. Assembly Automation, 32(2), 112-118.
Bolz, R. W. (1977). Production processes: the productivity handbook: Industrial Press Inc.
Boothroyd, G. (2005). Assembly automation and product design (Vol. 536): Cambridge Univ Press.
Boothroyd, G., & Alting, L. (1992). Design for assembly and disassembly. CIRP Annals-Manufacturing Technology, 41(2), 625-636.
Boothroyd, G., Dewhurst, P., & Knight, W. A. (2002). Product Design for Manufacture and Assembly (Vol. 58): CRC Press.
Boothroyd, G., Dewhurst, P., & Knight, W. A. (2010). Product Design for Manufacture and Assembly (Vol. 74): CRC Press.
Bralla, J. G. (1998). Design for Manufacturability Handbook (Second ed.). United States: McGraw-Hill.
Cameron, D. L. (1995). Color-specificity to enhance identification of rear lights. Perceptual and motor skills, 80(3), 755-769.
Chen, J. (2010). A general study of design for disassembly for electronic products. Paper presented at the Computer-Aided Industrial Design & Conceptual Design (CAIDCD), 2010 IEEE 11th International Conference.
Choi, A. C. K., Chan, D. S. K., & Yuen, A. M. F. (2002). Application of Virtual Assembly Tools for Improving Product Design. The International Journal of Advanced Manufacturing Technology, 19(5), 377-383.
Univers
ity of
Mala
ya
Ciciulla, T. (2006 ). How a Design for Manufacturing method is built up and why it is so profitable for a company Paper presented at the Development of Modular Products Sweden
Coma, O., Mascle, C., & Véron, P. (2003). Geometric and form feature recognition tools applied to a design for assembly methodology. Computer-Aided Design, 35(13), 1193-1210.
De Lit, P., & Delchambre, A. (2003). Integrated design of a product family and its assembly system: Springer.
Edwards, K. L. (2002). Towards more strategic product design for manufacture and assembly: priorities for concurrent engineering. Materials & Design, 23(7), 651-656.
Gauthier, B., Dewhurst, P., & Japikse, D. (2000). Application of Design for Manufacture and Assembly Methodologies to Complex Aerospace Products. Paper presented at the 36th AIAA/ASME/SAE/ASEE Joint Propulsion Conference and Exhibit Huntsville, Alabama.
Go, T. F., Wahab, D. A., Rahman, M. N. A., Ramli, R., & Azhari, C. H. (2011). Disassemblability of end-of-life vehicle: a critical review of evaluation methods Journal of Cleaner Production, 19(13), 1536-1546.
Goubergen, D. V., & Vancauwenberghe, F. (2007). Using Time Studies for Quantifying Waste and Improvement Opportunities in Work Methods. Paper presented at the Industrial Engineering Research Conference, Belgium.
Gungor, A., & Gupta, S. M. (1999). Issues in environmentally conscious manufacturing and product recovery: a survey. Computers & Industrial Engineering, 36(4), 811–853.
Gupta, S. M., & Veerakamolmal, P. (1996). Disassembly Of Products. Boston: NIST Systems Integration for Manufacturing Application Program.
Harjula, T., Rapoza, B., Knight, W. A., & Boothroyd, G. (1996). Design for Disassembly and the Environment. CIRP Annals - Manufacturing Technology, 45(1), 109-114.
Huang, G., & Mak, K. (1998). A survey report on design for manufacture in the UK furniture manufacturing industry. Integrated Manufacturing Systems, 9(6), 383–387.
Kasai, J. (2000). Experiences and thoughts about life cycle assessment in the automotive industry in Japan The International Journal of Life Cycle Assessment, 5(5), 313-316.
Knight, W. (1999). Product benchmarking using DFE analysis tools. Paper presented at the Electronics and the Environment, 1999. ISEE -1999. Proceedings of the 1999 IEEE International Symposium.
Univers
ity of
Mala
ya
Knight, W., & Curtis, M. (1999). 'Design for Environment'software development. Journal of Sustainable Product Design, 36-44.
Kongar, E., & Gupta, S. M. (2006). Disassembly sequencing using genetic algorithm. The International Journal of Advanced Manufacturing Technology, 30(5-6), 497-506.
Kroll, E., & Hanft, T. A. (1998). Quantitative evaluation of product disassembly for recycling. Research in Engineering Design, 10(1), 1-14.
Krumenauer, F., Matayoshi, C., Silva, I., Stipkovic Filho, M., & Batalha, G. (2008). Concurrent engineering and DFMA approaches on the development of automotive panels and doors. Journal of Achievements in Materials and Manufacturing Engineering, 31, 690-698.
Kuo, T.-C., Huang, S. H., & Zhang, H.-C. (2001). Design for manufacture and design for 'X': concepts, applications, and perspectives. Computers & Industrial Engineering, 41(3), 241-260.
Mamat, R., Wahab, D. A., & Abdullah, S. (2009). The Integration of CAD and Life Cycle Requirements in Automotive Seat Design. European Journal of Scientific Research, 31(1), 148-156.
Mayyas, A., Qattawi, A., Omar, M., & Shan, D. (2012). Design for sustainability in automotive industry: A comprehensive review. Renewable and Sustainable Energy Reviews, 16(4), 1845-1862.
McIntyre, S. E. (2008). Capturing attention to brake lamps. Accident Analysis & Prevention, 40(2), 691-696.
Moore, D. W. (1999). Historical development and current effectiveness of rear lighting systems: The University of Michigan.
Munro, S. (1998). Design For Assembly/Manufacturability: winning the global manufacturing war by design. Paper presented at the CSVA international conference, Michigan.
Otto, K. N., & Wood, K. L. (2001). Product Design. New Jersey: Prentice Hall.
Parker, M., & Group, P. (2010). DFMA can help manufacturers navigate today’s economic turning point and successfully steer towards a new future. from http://www.dfma.com/news/2010forum.htm
Pennino, T. P., & Potechin, J. (1993). Design for manufacture. Spectrum, IEEE, 30(9), 51-53. doi: 10.1109/6.275165
Poli, C. (2001). Design for manufacturing: a structured approach: Butterworth-Heinemann.
Univers
ity of
Mala
ya
Scheuring, J. F., Bras, B., & Lee, K.-M. (1994). Effects of design for disassembly on integrated disassembly and assembly processes. Paper presented at the Computer Integrated Manufacturing and Automation Technology, 1994., Proceedings of the Fourth International Conference on.
Stone, R. B., McAdams, D. A., & Kayyalethekkel, V. J. (2004). A product architecture-based conceptual DFA technique. Design Studies, 25(3), 301-325.
Swift, K., & Booker, J. D. (2003). Process Selection From design to manufacture (Second ed.). Burlington MA: Butterworth-Heinemann.
Ulrich, K. T. (2003). Product design and development: Tata McGraw-Hill Education.
Vezzoli, C., & Manzini, E. (2008). Design for Environmental Sustainability (K. Pruul, Trans.). Milan, Italy: Springer.
Vinodh, S., Kumar, R. P., & Nachiappan, N. (2011). Disassembly modeling, planning, and leveling for a cam-operated rotary switch assembly: a case study. The International Journal of Advanced Manufacturing Technology.
Wad, P. (2004). Transforming Industrial Relations : the Case of the Malaysian Auto Industry. Labor in Southeast Asia. Local processes in a globalised world, RoutledgeCurzon, London, 235-264.
Wang, G. G., & Shan, S. (2007). Review of metamodeling techniques in support of engineering design optimization. Journal of Mechanical Design, 129, 370.
Whitney, D. E. (2004). Mechanical assemblies: their design, manufacture, and role in product development: Oxford university press New York.
Xie, X. (2006). Design for manufacture and assembly. Utah: Dept. of Mechanical.
Zandin, K. B. (2001). Maynard's Industrial Engineering Handbook (Fifth ed.): McGraw-Hill.
Univers
ity of
Mala
ya
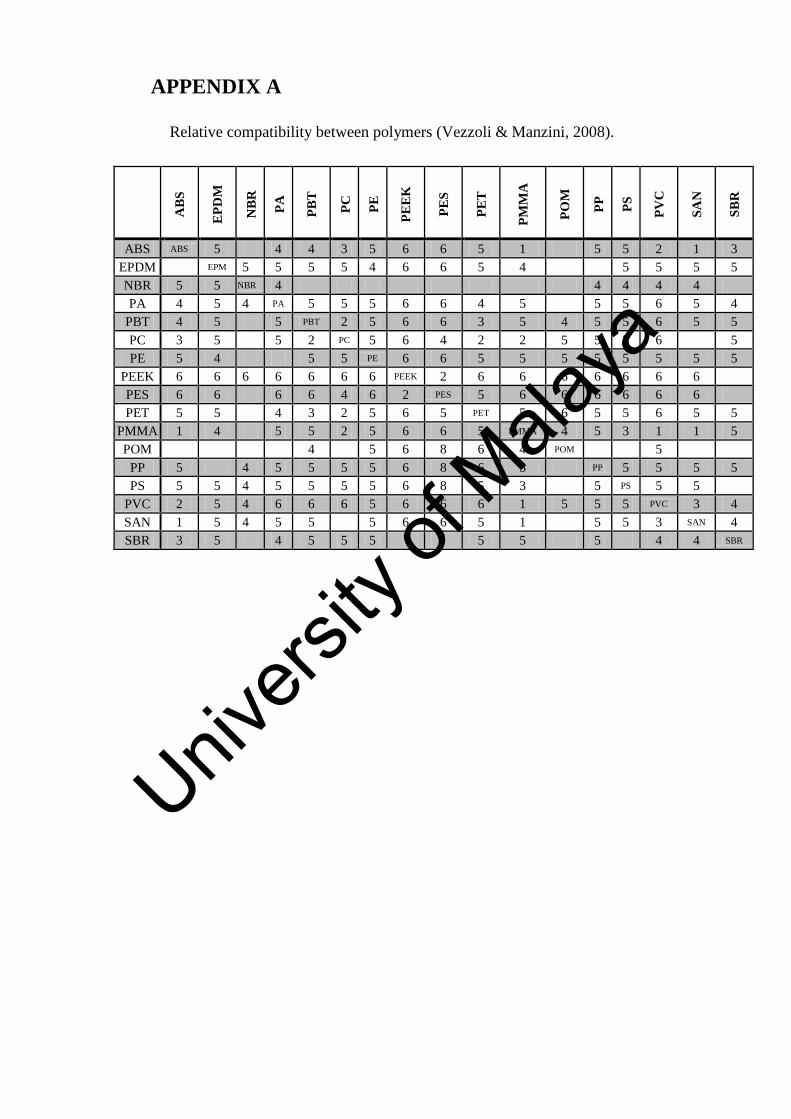
APPENDIX A
Relative compatibility between polymers (Vezzoli & Manzini, 2008).
AB
S
EPD
M
NB
R
PA
PBT
PC
PE
PEE
K
PES
PET
PMM
A
POM
PP
PS
PVC
SAN
SBR
ABS ABS 5 4 4 3 5 6 6 5 1 5 5 2 1 3 EPDM EPM 5 5 5 5 4 6 6 5 4 5 5 5 5 NBR 5 5 NBR 4 4 4 4 4 PA 4 5 4 PA 5 5 5 6 6 4 5 5 5 6 5 4
PBT 4 5 5 PBT 2 5 6 6 3 5 4 5 5 6 5 5 PC 3 5 5 2 PC 5 6 4 2 2 5 5 5 6 5 PE 5 4 5 5 PE 6 6 5 5 5 5 5 5 5 5
PEEK 6 6 6 6 6 6 6 PEEK 2 6 6 6 6 6 6 6 PES 6 6 6 6 4 6 2 PES 5 6 6 6 6 6 6 PET 5 5 4 3 2 5 6 5 PET 5 6 5 5 6 5 5
PMMA 1 4 5 5 2 5 6 6 5 PMMA 4 5 3 1 1 5 POM 4 5 6 8 6 4 POM 5
PP 5 4 5 5 5 5 6 8 6 5 PP 5 5 5 5 PS 5 5 4 5 5 5 5 6 8 5 3 5 PS 5 5
PVC 2 5 4 6 6 6 5 6 6 6 1 5 5 5 PVC 3 4 SAN 1 5 4 5 5 5 6 6 5 1 5 5 3 SAN 4 SBR 3 5 4 5 5 5 5 5 5 4 4 SBR
Univers
ity of
Mala
ya
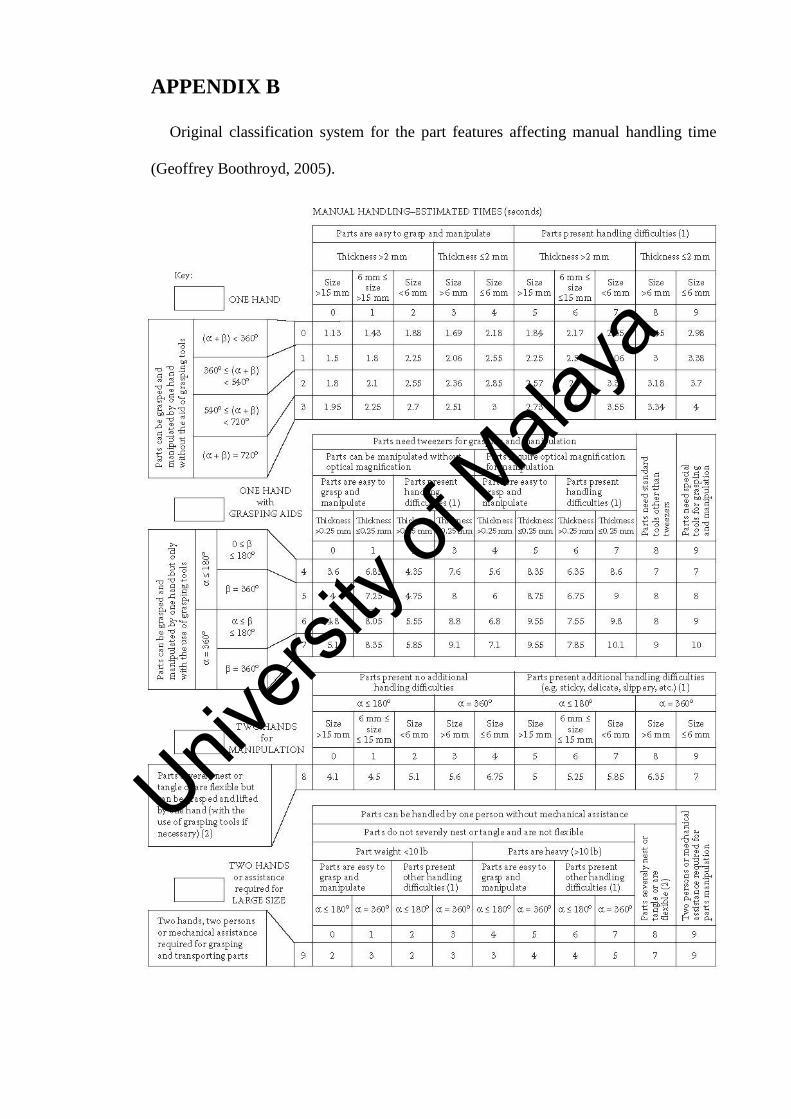
APPENDIX B
Original classification system for the part features affecting manual handling time
(Geoffrey Boothroyd, 2005).
Univers
ity of
Mala
ya
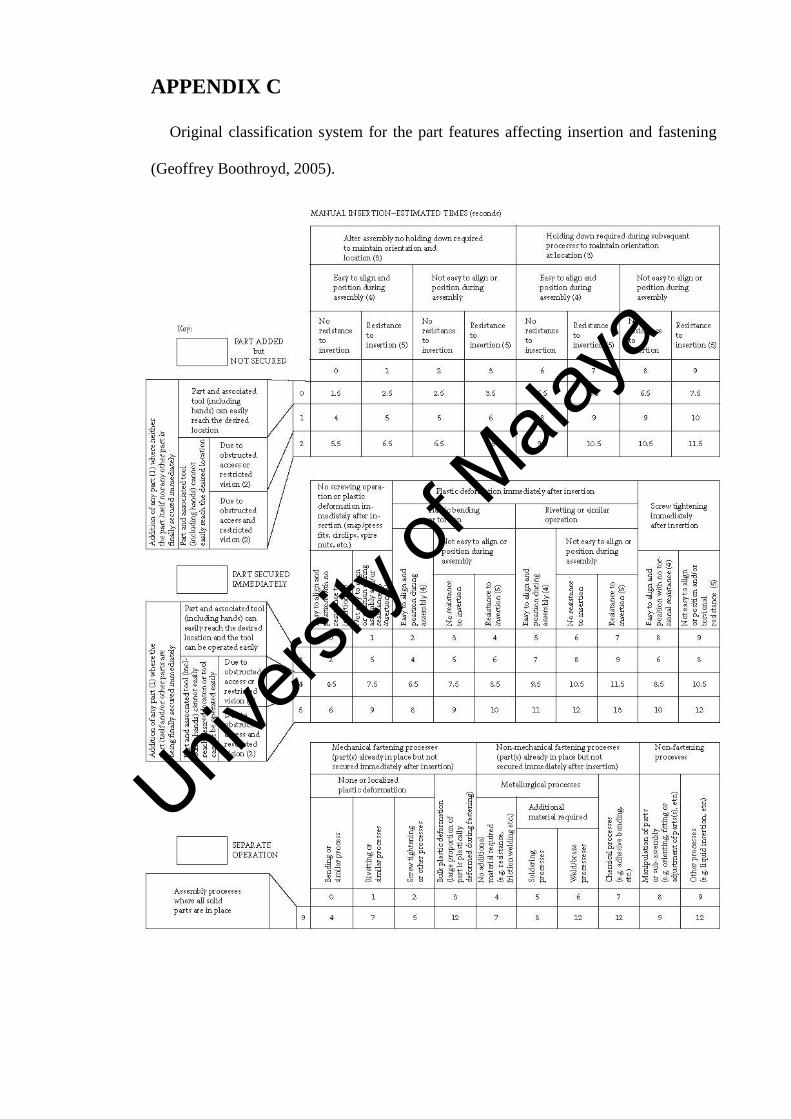
APPENDIX C
Original classification system for the part features affecting insertion and fastening
(Geoffrey Boothroyd, 2005).
Univers
ity of
Mala
ya
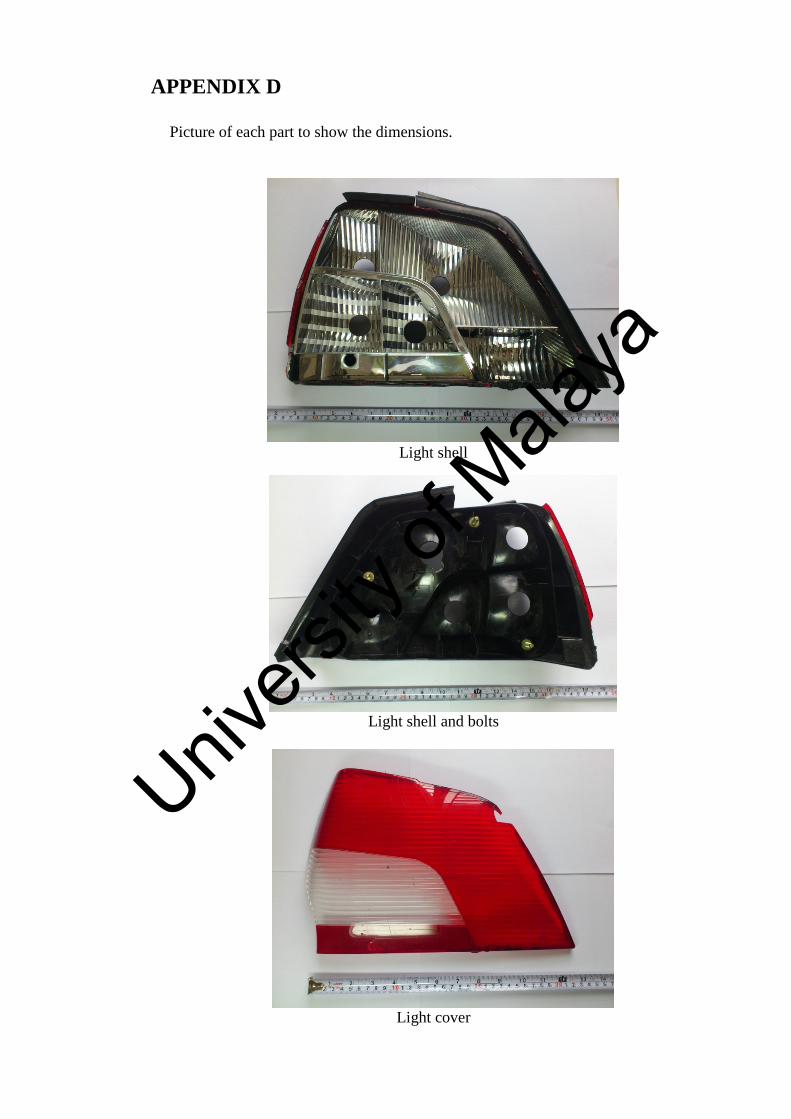
APPENDIX D
Picture of each part to show the dimensions.
Light shell
Light shell and bolts
Light cover
Univers
ity of
Mala
ya
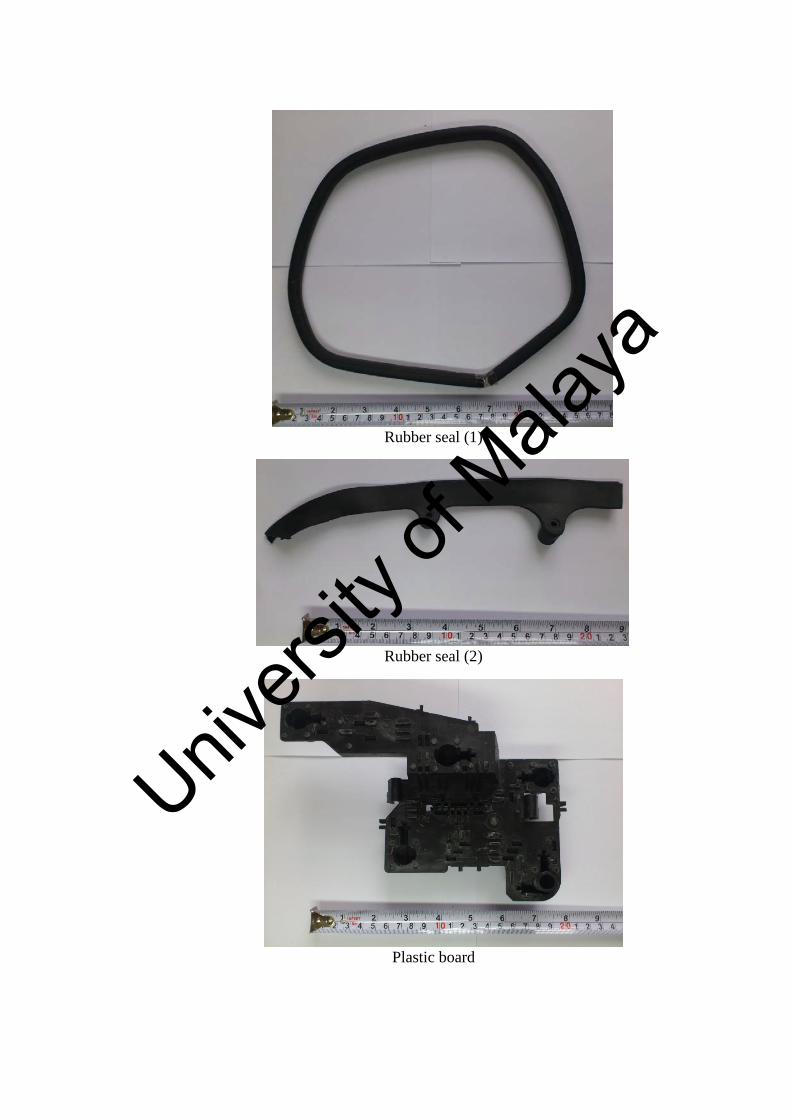
Rubber seal (1)
Rubber seal (2)
Plastic board
Univers
ity of
Mala
ya
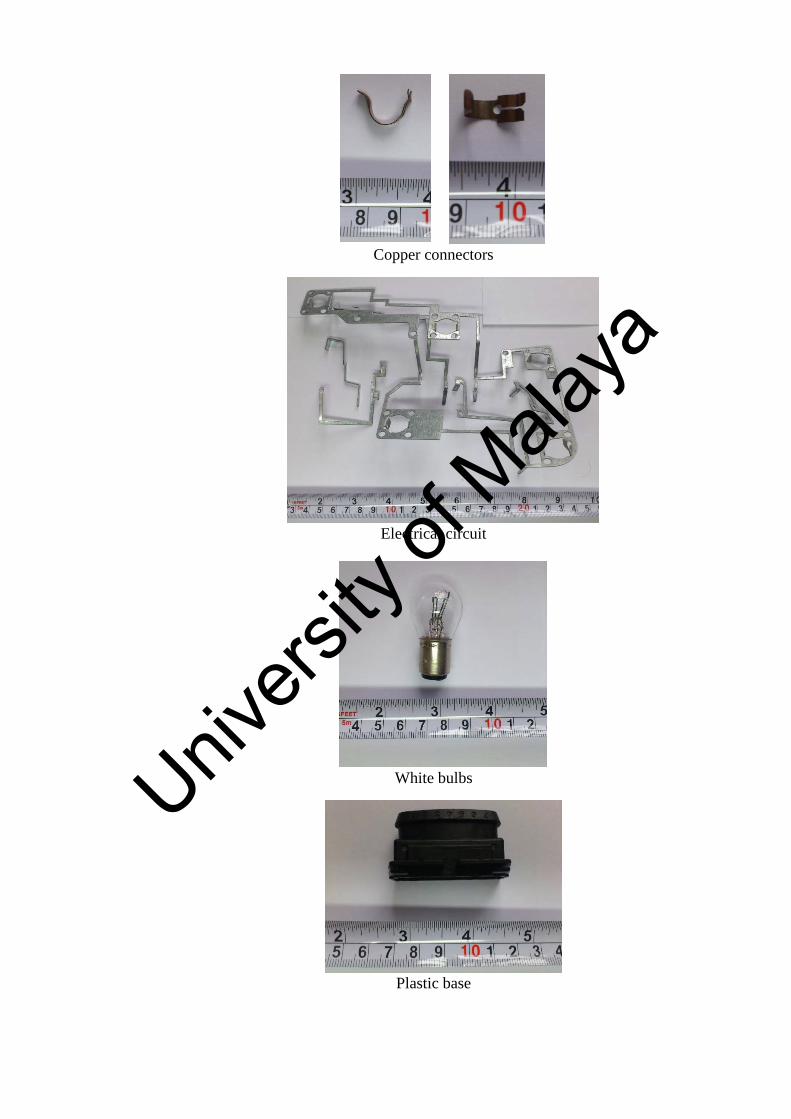
Copper connectors
Electrical circuit
White bulbs
Plastic base
Univers
ity of
Mala
ya
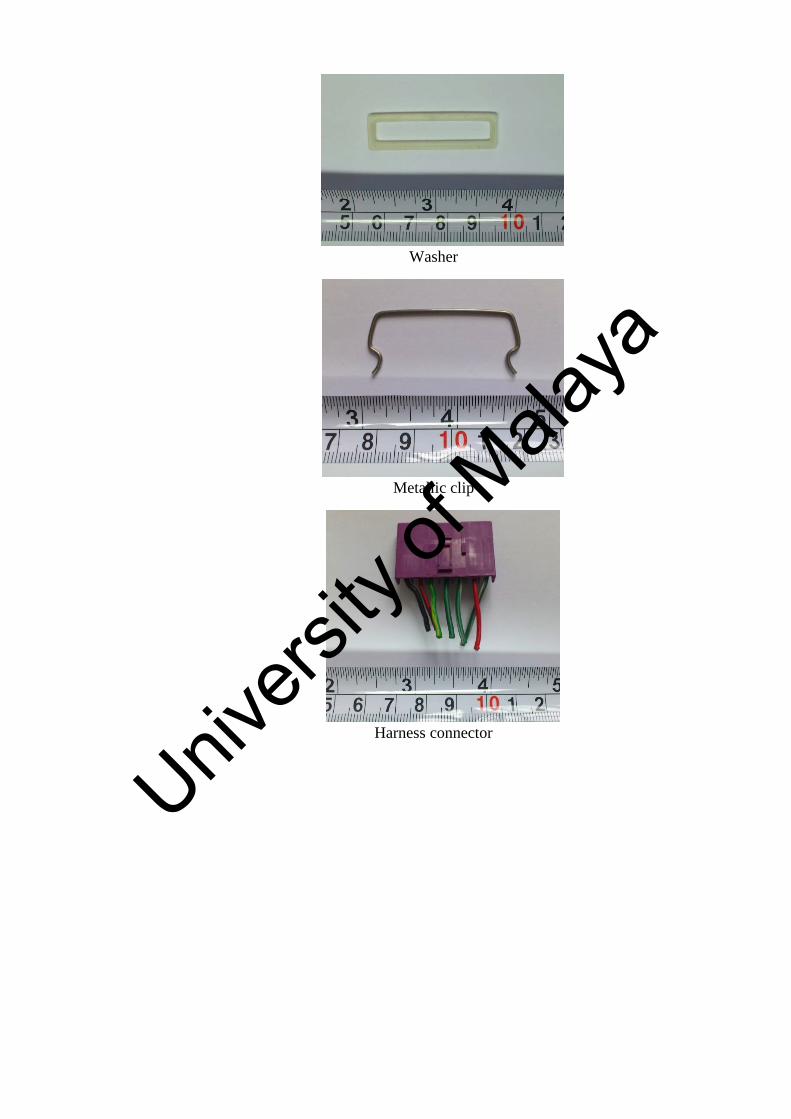
Washer
Metallic clip
Harness connector
Univers
ity of
Mala
ya
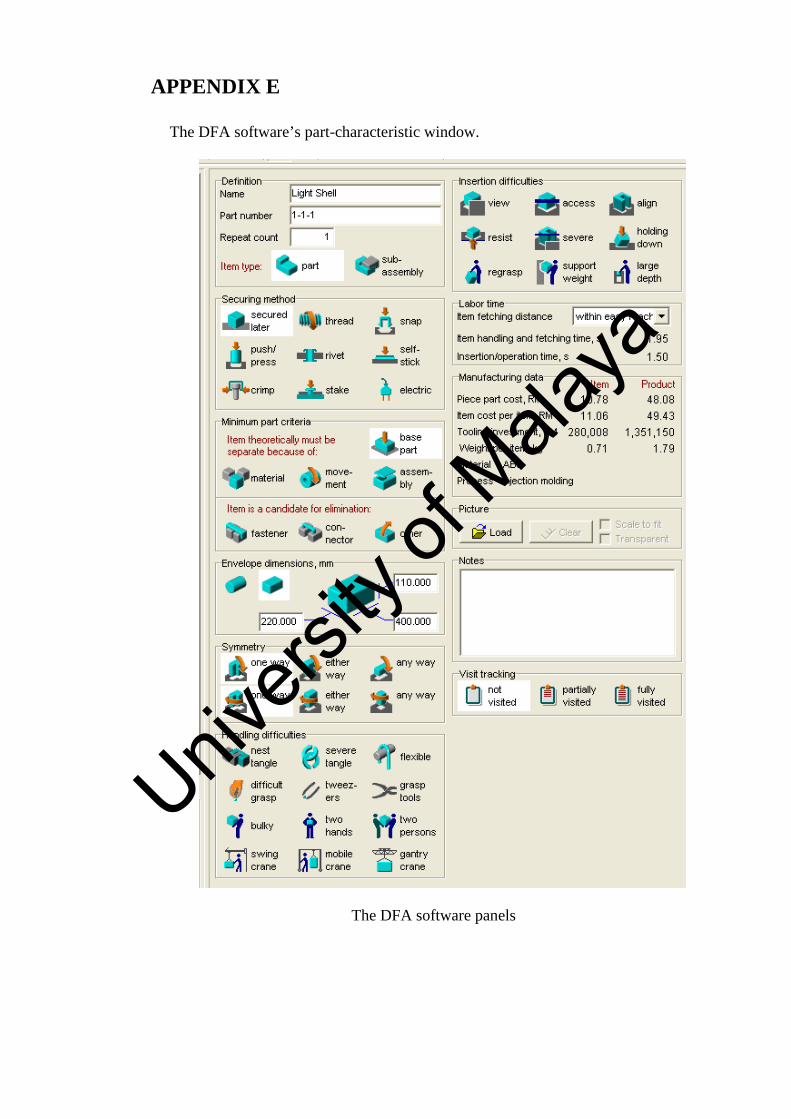
APPENDIX E
The DFA software’s part-characteristic window.
The DFA software panels
Univers
ity of
Mala
ya