product cost analysis in early stages of a product development
TRANSCRIPT
Akademin för Innovation, Design och Teknik
Product cost analysis in early stages of a product development process
Master Thesis, Innovative Production
30 points, Master level
Master’s Program in Product and Process Development - Production and Logistics, 120 Credits
Daniel Backlund
Presentationsdatum: 28 mars 2013 Uppdragsgivare: Volvo Construction Equipment Handledare (företag): Joel Schedin Handledare (högskola): Joel Schedin Examinator: Magnus Wiktorsson
2(42)
Abstract
On a global market with tighter gross margins the focus on product cost have increased. A
demand for improved methods within product cost calculations in the product development
process is important to sustain competitive.
Product cost is a vital part of a company’s cost base. During a product development process
early stage there is often a lack of established methods and processes for calculation of the
product cost. Especially difficult is it to estimate product cost in early stages of the product
development process when the uncertainty around the construction of the product is big. That
might lead to lack of knowledge around material cost and need of investments occur. The goal
with this thesis is to help, evaluate and support around improvements within the product
development projects when it comes to product cost calculation.
The purpose of this thesis is to create a suitable financial model that is applicable when
choosing concept in early stages of the product development process to sustain highest possible
profitability for Volvo Construction Equipment. To solve this problem a collection of theory in
form of books, articles and reports has been made with focus on product development and
product cost. The theory part showed a lot of material around the product development process
but less data around detailed product cost calculation. The empirical part has been created in
cooperation with Volvo Construction Equipment with purpose to increase knowledge for
problems in its natural environment. From interviews, documentations and other collection has
shown that improvement potential was found for product cost calculations in early stages of
product development project.
For further increased understanding a structured comparison and a discussion around each area
of theory and empirical data was created. The result of the comparison shows that Volvo
Construction Equipment’s handling of problems correlates with the theory that exists in the
thesis.
To improve the process with product development and product cost calculation at Volvo
Construction Equipment a calculation model was created. The model was applied in a real
product development project in the company and gave opportunity for estimations of the
development of the product cost during the different stages of the project.
3(42)
Sammanfattning
På en global marknad med allt tightare vinstmarginaler har fokus på produktkostnad ökat. I
produktutvecklingsprocessen har ett allt större behov av förbättrade arbetssätt kring
produktkostnadskalkylering uppstått för att företag skall vara konkurrenskraftiga.
Produktkostnad är en väsentlig del av ett företags kostnadsmassa. Under en
produktutvecklingsprocess tidiga skeden saknas ofta etablerade metoder och processer för
beräkning av produktens kostnad. Speciellt svårt är det att uppskatta produktkostnad i tidiga
faser av produktutvecklingsprocessen då osäkerheten kring konstruktionen är stor. Detta kan få
till följd att till exempel avsaknad av vetskap kring materialkostnad eller investeringsbehov
uppstår. Målet med denna uppsats är att hjälpa, utvärdera och supportera kring förbättringar av
arbetssätt inom produktutvecklingsprojekten när det kommer till produktkostnadskalkylering.
Syftet med detta examensarbete är att skapa en passande finansiell modell som kan användas
vid val av koncept i tidiga stadier av produktutvecklingsprocessen för att säkerställa högsta
möjliga lönsamhet för Volvo Construction Equipment. För att lösa detta problem så har
insamling av teori i form av böcker, artiklar samt rapporter genomförts med fokus på
produktutveckling och produktkostnad. Teoristudien påvisade mycket material kring
produktutvecklingsprocessen men mindre kring detaljerad produktkostnadskalkylering. Den
empiriska delen har genomförts i samarbete med Volvo Construction Equipment med syfte att
få ökad förståelse för problemställningar i dess verkliga miljö. Från intervjuer, dokumentation
samt övrig insamling så påvisades att förbättringspotential fanns kring
produktkostnadskalkylering i tidiga faser av produktutvecklingsprojekt.
För ytterligare ökad förståelse genomfördes en strukturerad jämförelse samt en diskussion
kring respektive område av teori och empiri. Resultatet av jämförelsen visar att Volvo
Construction Equipments hantering av problem korrelerar med den teori som existerar i
uppsatsen. I de situationer där Volvo avviker från teorin så finns orsaker till att företaget inte
väljer att följa denna.
För att förbättra processen kring produktutveckling och produktkostnadskalkylering på Volvo
Construction Equipment skapades en kalkylmodell. Modellen applicerades konkret i ett
pågående produktutvecklingsprojekt i företaget och gav möjlighet till uppföljning av
utvecklingen av produktkostnaden under de olika faserna av projektet.
4(42)
Acknowledgement
I would like to express my deep gratitude to PhD student Joel Schedin for his patient guidance,
enthusiastic encouragement and useful critiques of this research work.
I would also like to extend my thanks to my interview objects Finance Manager Allan Carlsson
at Volvo Construction Equipment, Lars Lewin VP and CFO Operations Europe at Volvo
Construction Equipment and Finance Manager Mats Lilja at Danfoss Heatpumps.
A special thanks also to Associate professor Magnus Wiktorsson and to Volvo Construction
Equipment Operations Eskilstuna and Arvika.
Daniel Backlund
Arvika, mars 2013
5(42)
Table of content
1. INTRODUCTION ................................................................................................................................................ 7
1.1 BACKGROUND .................................................................................................................................................. 7 1.1.1 Problem description ................................................................................................................................ 8
1.2 OBJECTIVE ....................................................................................................................................................... 9 1.3 RESEARCHED QUESTIONS ................................................................................................................................. 9 1.4 DELIMITATIONS ................................................................................................................................................ 9
2. METHODOLOGY ............................................................................................................................................. 10
2.1 RESEARCH APPROACH .................................................................................................................................... 10 2.2 RESEARCH METHOD ....................................................................................................................................... 10 2.3 DESIGN RESEARCH METHODOLOGY ............................................................................................................... 11 2.4 VALIDITY AND RELIABILITY ........................................................................................................................... 12
3. THEORETICAL FRAMEWORK ................................................................................................................... 13
3.1 STAGE-GATE PRODUCT DEVELOPMENT PROCESS ........................................................................................... 13 3.2 LEAN PRODUCT DEVELOPMENT ...................................................................................................................... 13 3.3 PRODUCT PLATFORMS .................................................................................................................................... 14 3.4 BUSINESS CASE CALCULATIONS ..................................................................................................................... 14 3.5 CASH FLOW .................................................................................................................................................... 15 3.6 BUSINESS CASE MODEL .................................................................................................................................. 16 3.7 PRODUCT COST ............................................................................................................................................... 16 3.8 PRODUCT COST ESTIMATION TECHNIQUES .................................................................................................... 18 3.9 LEAN ACCOUNTING ........................................................................................................................................ 19 3.10 PRODUCT COST CALCULATION CONSEQUENCES ........................................................................................... 19 3.11 ACTIVITY BASED COSTING........................................................................................................................... 20
4. EMPIRICAL STUDIES .................................................................................................................................... 21
4.1 STAGE-GATE PRODUCT DEVELOPMENT PROCESS ........................................................................................... 21 4.2 LEAN PRODUCT DEVELOPMENT ...................................................................................................................... 21 4.3 PRODUCT PLATFORMS .................................................................................................................................... 22 4.4 AB VOLVO BUSINESS CASE MODEL ................................................................................................................ 22 4.5 DESCRIPTION OF THE PRODUCT COST ............................................................................................................. 23
4.5.1 Direct Material ...................................................................................................................................... 23 4.5.2 Conversion Overhead cost ..................................................................................................................... 23
4.6 CURRENT SITUATION PRODUCT COST FOR CONCEPT CHOICE IN PROJECT NTP ................................................ 24 4.6.1 Product cost calculation consequences ................................................................................................. 24
4.7 INTERVIEWS ................................................................................................................................................... 25 4.7.1 Interview Allan Carlsson ....................................................................................................................... 25 4.7.2 Interview Mats Lilja............................................................................................................................... 25 4.7.3 Interview Lars Lewin ............................................................................................................................. 26
5. DISCUSSION ..................................................................................................................................................... 27
5.1 STAGE-GATE PRODUCT DEVELOPMENT PROCESS ........................................................................................... 27 5.2 LEAN PRODUCT DEVELOPMENT ...................................................................................................................... 27 5.3 PRODUCT PLATFORMS .................................................................................................................................... 27 5.4 BUSINESS CASE MODEL .................................................................................................................................. 27 5.5 DESCRIPTION OF THE PRODUCT COST ............................................................................................................. 27 5.6 CURRENT SITUATION PRODUCT COST FOR CONCEPT CHOICE IN PROJECT NTP AND CAST ............................. 28 5.7 SUMMARY ...................................................................................................................................................... 28
6. RESULT - CUSTOMIZED CALCULATION EXAMPLE CAST FRAMES .............................................. 29
7. CONCLUSIONS ................................................................................................................................................ 31
7.1 OBJECTIVE OF THIS RESEARCH PROJECT AND RESEARCH QUESTIONS. ............................................................. 31 7.1.1 Objective ................................................................................................................................................ 31 7.1.2 Research question 1 ............................................................................................................................... 31
6(42)
7.1.3 Research question 2 ............................................................................................................................... 31 7.1.4 Research question 3 ............................................................................................................................... 32
7.2 INDUSTRIAL AND ACADEMIC RELEVANCE....................................................................................................... 33 7.3 FUTURE RESEARCH ......................................................................................................................................... 33
REFERENCES ....................................................................................................................................................... 34
APPENDIX A ......................................................................................................................................................... 36
AB VOLVO BUSINESS CASE MODEL ..................................................................................................................... 36
APPENDIX B ......................................................................................................................................................... 38
ACCORDING TO VOLVO FINANCIAL POLICIES AND PROCEDURES 2011 THE DEFINITION OF THE COST CATEGORIES
ARE: ..................................................................................................................................................................... 38 Direct materials .............................................................................................................................................. 38 Direct labor .................................................................................................................................................... 38 Conversion overhead cost .............................................................................................................................. 38 Incoming material shipping costs ................................................................................................................... 38 Incoming material handling costs .................................................................................................................. 39 Procurement costs .......................................................................................................................................... 39 Vendor tool costs ............................................................................................................................................ 39
APPENDIX C ......................................................................................................................................................... 40
ACCORDING TO VOLVO FINANCIAL POLICIES AND PROCEDURES 2011 THE DEFINITION OF FIXED AND VARIABLE
COST IS: ................................................................................................................................................................ 40 Fixed/variable costs ........................................................................................................................................ 40 Fixed costs ...................................................................................................................................................... 40 Variable costs ................................................................................................................................................. 40
APPENDIX D ......................................................................................................................................................... 42
QUESTIONS IN INTERVIEWS .................................................................................................................................. 42
7(42)
1. Introduction
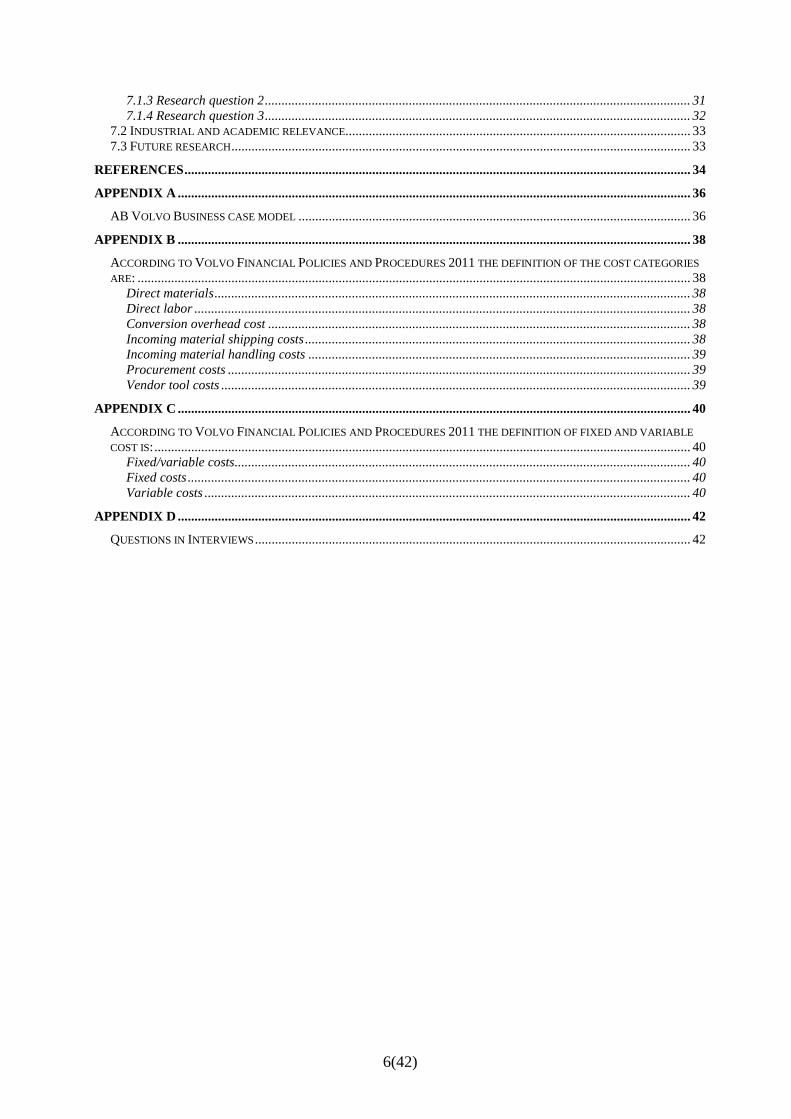
1.1 Background This thesis will be written together with the Industrialization and Production development
department at Volvo Construction Equipment (Volvo CE) in Eskilstuna. Volvo CE is a part of
the Volvo Group which is a major actor within transport solutions with products as trucks,
busses, construction equipment drive lines for marine and industry applications and
components for airplane engines. The Volvo Group consists of 19 different companies where
Volvo CE is the second biggest part. Volvo CE produces Wheel Loaders, Articulated Haulers,
Excavators and other machines for the construction equipment industry, see Figure 1 below.
Figure 1, Construction Equipment reference: Volvo (2011)
The division called Operations, which is the biggest part of Volvo CE, is assigned to produce
the different machines in the product portfolio. The Eskilstuna plant produces transmissions
and axles. The plant consists of advanced manufacturing, paint shop, hardening, testing and an
assembly line.
The department Industrialization and Product development, where the thesis will be written, is
organized under the department production engineering which is a part of Operations.
The Industrialization and Production development department’s tasks are:
Manage and develop the process for production development within Operations
Eskilstuna.
Manage projects within Industrialization when launching new product projects.
Operations Eskilstuna produces transmissions and axles to Wheel Loaders, Articulated Haulers
and Motor Graders. In purpose to create a plant with focus on Lean Production the
management decided to invest and rebuild the plant during 2007-2009. CS-09 (Components
Steps 2009) which was the name of the project was focusing on optimizing the production
approach for the plant.
In 2010 a new product development project called NTP (New Transmission Platform) started.
The purpose is to develop a new transmission platform for the majority of the company’s
products. Today the plant produces several transmission types which result in different
assembly and fabrication procedures. The consequences of this could be increased
manufacturing cost in form of machine cost, personnel cost, consumables and maintenance
comparing to what a common transmission platform. The NTP project gives the company an
opportunity to create this platform. A lot of suggestions on concept solutions have been created
which can be used for different sorts of machines.
8(42)
1.1.1 Problem description
The competition in the automotive and heavy duty machine industry is increasing with
companies fighting for the same customers on a global market. The need to introduce new
vehicles more often, in combination with higher customer expectations and increased pricing
pressure makes the situation really challenging. Morgan and Liker, 2006 also point out the
situation as because auto companies are introducing more vehicles more often, and are
simultaneously facing higher quality expectations and increasing pricing pressure; they have
less time to improve quality and manufacturing productivity. There is a smaller margin for
error: New vehicle introductions cannot result in a drop in vehicle quality. With shortened
model life spans, companies can no longer afford a spike in defects and or a leisurely hours per
vehicle pace. An effective product development process and capability that produces world
class products and productions systems has become a strategic differentiator. Whereas the
performance gap in manufacturing is closing, the gap between best-in-class and the rest of the
automotive industry in product development is increasing (Morgan and Liker 2006). To do the
right things from the beginning of a product development process is becoming more and more
important to remain competitive. This includes selecting the most promising solutions of
products and production system concepts. To support this work in early phases there has been
an identified need at Volvo construction equipment to create a description of a model for
estimation of the product cost in very early stages of the product development process. The
model is needed in general for all projects that are being industrialized in the Eskilstuna and
Arvika plants and especially also for the NTP project.
The NTP-project can be classified as a big project for Volvo CE with a lot of functions
involved. Meetings and groups are created in different parts of the company. The functions
Industrialization and production development, after market, purchasing and technology are all
involved in the project of develop a new transmission platform. Project leaders from different
parts of the organization are gathered in meetings where assignments and follow up are on the
agenda. These assignments are then the fundaments for the meetings that the project leaders for
the different parts of the organization are organizing. One example is the project leader for the
industrialization department who arranging meetings with material controllers, production
engineers, quality leaders and methodology engineers.
In relation to the phases of the product development process, at Volvo called GDP (Global
Development Process), the NTP project lies in the pre study phase and on the way into the
concept development phase (see chapter 4). Today the project has 30 Transmission concepts
divided in nine families. Family in this case means same technical solution. One goal in the
project is to decrease the number of concepts to ease up the work in the project. The
elimination of concepts is achieved by cooperation between all involved functions. The
different concepts are today on very different maturity levels. Some have CAD models while
others just have power point drawings. There is a need of early analyses from the production
engineering and different departments to create sustainable information for the elimination
process. The Industrialization and product development departments’ role in the project is to
validate the different concepts effect on the production set up.
To cut down the number of concepts is important to manage the projects time schedule. The
different phases of the GDP are not only the fundaments for the development progress, but also
for the entire projects time table. Earlier experiences have shown that if one phase tends to take
more time than expected the industrialization phase will suffer. To decrease the number of
concepts to an achievable level will lead to a lot of time savings and also make the
9(42)
industrialization phase to be achieved in a proper way. However it is important to clearly
describe why a concept is being eliminated so that there will be no misunderstanding’s later in
the project. The documentation is vital as precaution so that a potential successful concept will
not be eliminated by mistake during the project.
Thou the project is huge and involves several functions a well-organized cooperation between
the functions is vital for success. The cooperation between the different functions is something
that is on the agenda for the meetings mentioned earlier. Cooperation is necessary and
something that the GDP structures are focusing on for the finished product to satisfy all
functions, customers and other interest. One of the expected results from this cooperation is an
agreement about consequences from different perspectives and an estimation of the product
cost. Product cost is one of the most important evaluation and concept selecting criteria’s in the
product development projects at Volvo for assuring sustainable profitability and therefore there
the author and the company supervisor have agreed about the following objective for this
thesis.
1.2 Objective Create a suitable financial model that can be used when choosing a concept in early stages in
the product development process to secure highest possible profit for Volvo Construction
Equipment.
1.3 Researched questions To highlight the consequences on the production system when implementing different variants
of a common product platform there has been three Research Questions (RQ) created to
summary the objective of the work:
RQ1: What are suitable business models today?
RQ2: How should allocation of overhead and fixed costs in a product cost calculation
scenario work today?
RQ3: How can a financial model support early decisions in a product development
project?
1.4 Delimitations To delimitate the workload and set the system boundaries for this thesis the following early
delimitations were created:
- The limitation to answer and analyze my questions will only include the Volvo CE plants
within Sweden.
- The analyze of current state will only include the New Transmission Project as a case.
- The thesis will only reflect the cost included in the product cost. The product cost belongs
to the organization Operations. Operations from this project perspective include production
and purchasing.
- Follow the Volvo Group regulations for profitability calculations in projects.
10(42)
2. Methodology
This chapter describes the applied research methodology in this thesis project.
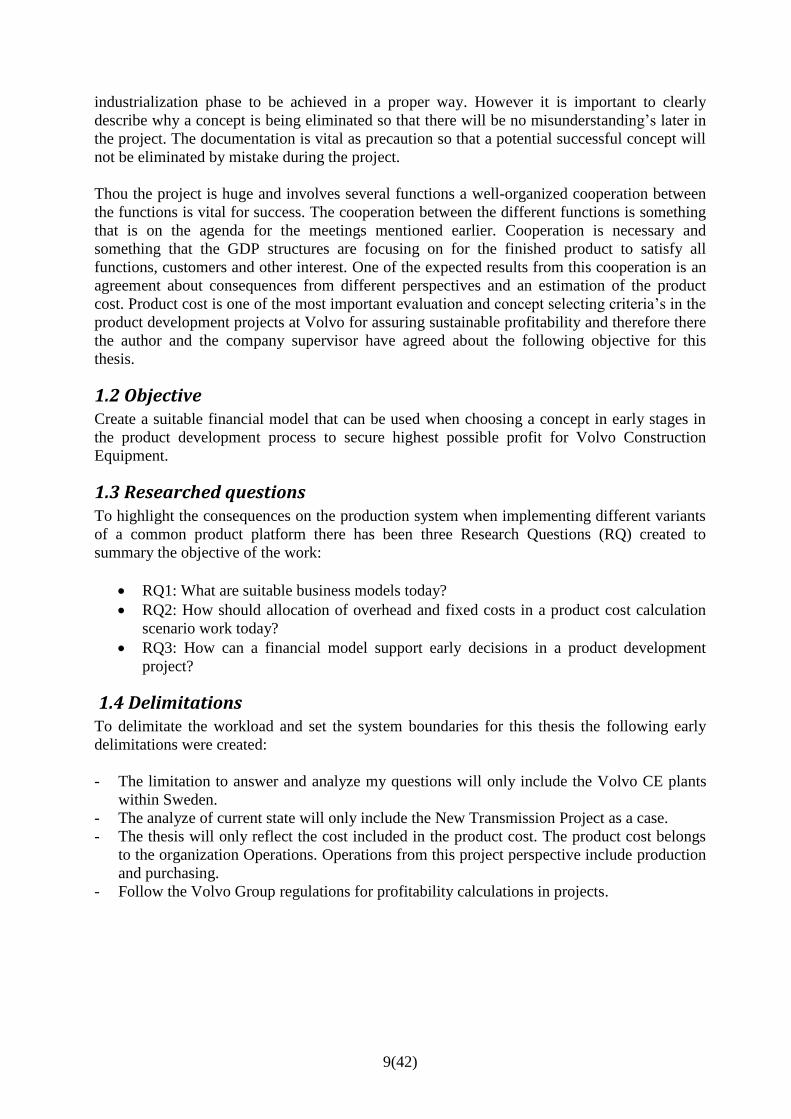
2.1 Research approach The objective and three research questions created in chapter 1 summarize the task and are the
fundaments of the thesis. Based on the questions and the thesis purpose the learning process
started. The background of the author as a business controller at the company together with a
clearly identified industrial need made the empirical context the starting point of the
research/learning process. During the work with the thesis the data collection switched between
empirical and theoretical knowledge. In that way a comparison between what the theories are
saying and practical experience was created. A schematic schedule of the research approach
and process is shown in figure 2 below from (Eriksson, 2009).
Figure 2 – Schematic schedule of the process, Eriksson (2009)
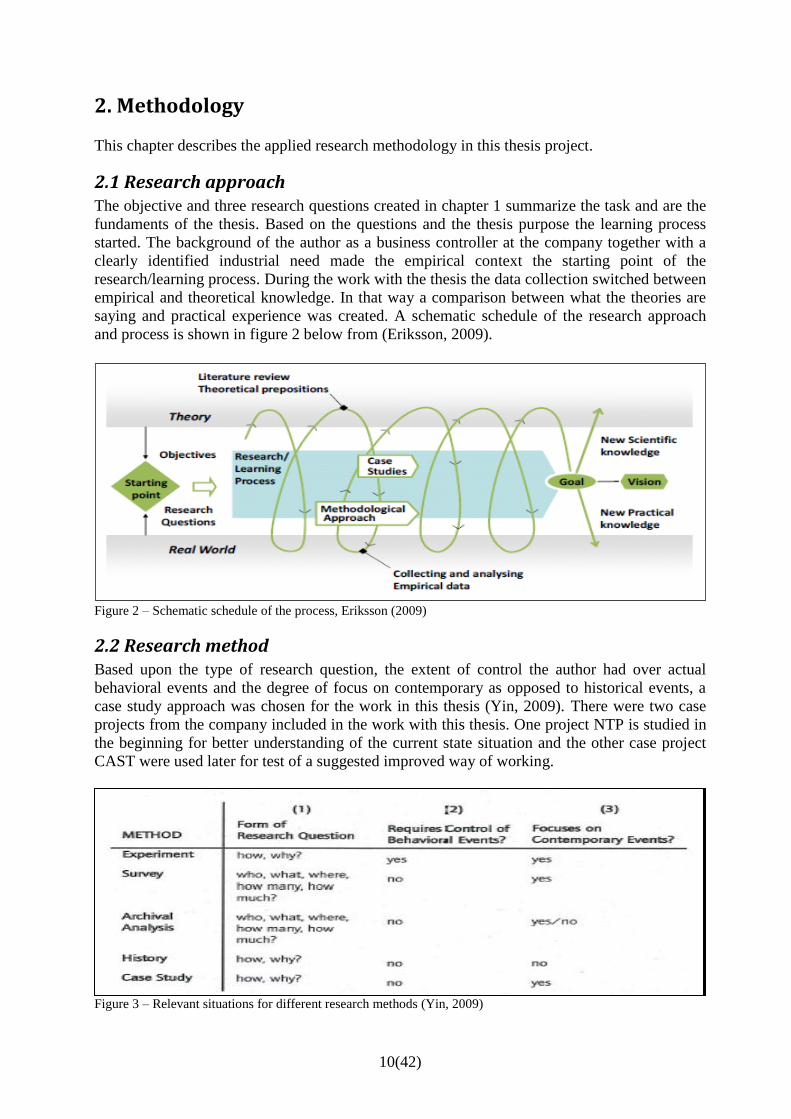
2.2 Research method Based upon the type of research question, the extent of control the author had over actual
behavioral events and the degree of focus on contemporary as opposed to historical events, a
case study approach was chosen for the work in this thesis (Yin, 2009). There were two case
projects from the company included in the work with this thesis. One project NTP is studied in
the beginning for better understanding of the current state situation and the other case project
CAST were used later for test of a suggested improved way of working.
Figure 3 – Relevant situations for different research methods (Yin, 2009)
11(42)
2.3 Design Research Methodology
2.3.1 DRM classification of the research
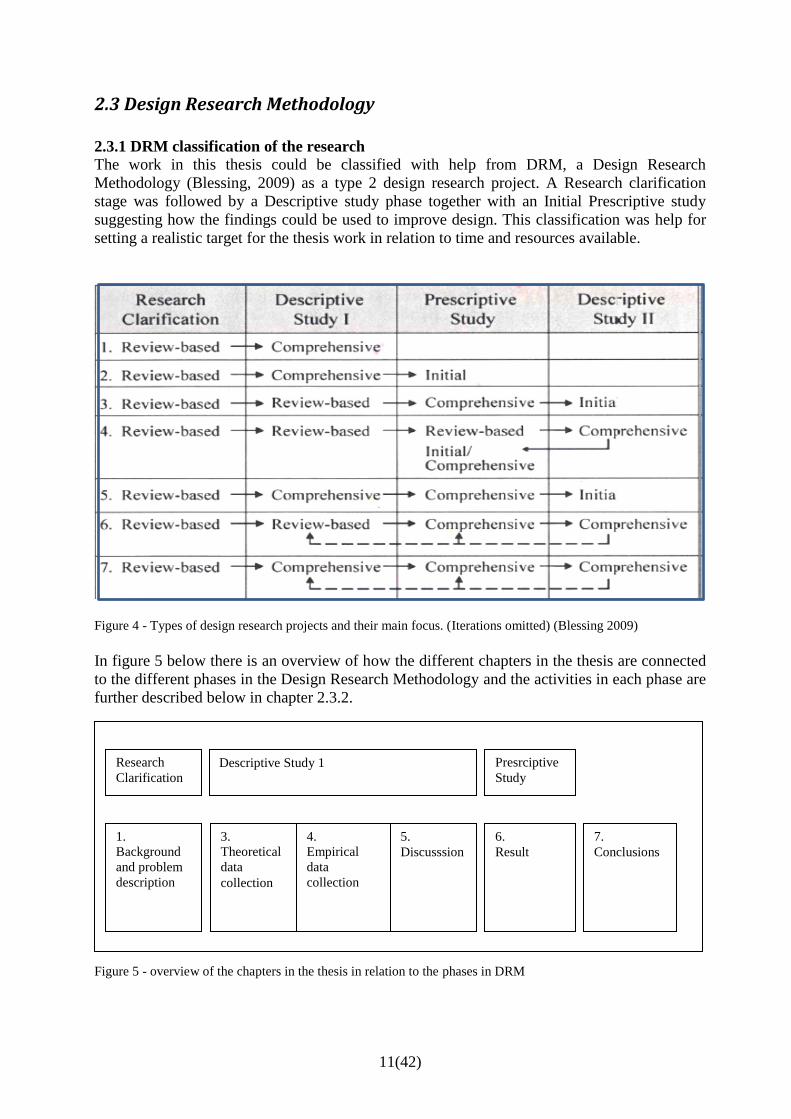
The work in this thesis could be classified with help from DRM, a Design Research
Methodology (Blessing, 2009) as a type 2 design research project. A Research clarification
stage was followed by a Descriptive study phase together with an Initial Prescriptive study
suggesting how the findings could be used to improve design. This classification was help for
setting a realistic target for the thesis work in relation to time and resources available.
Figure 4 - Types of design research projects and their main focus. (Iterations omitted) (Blessing 2009)
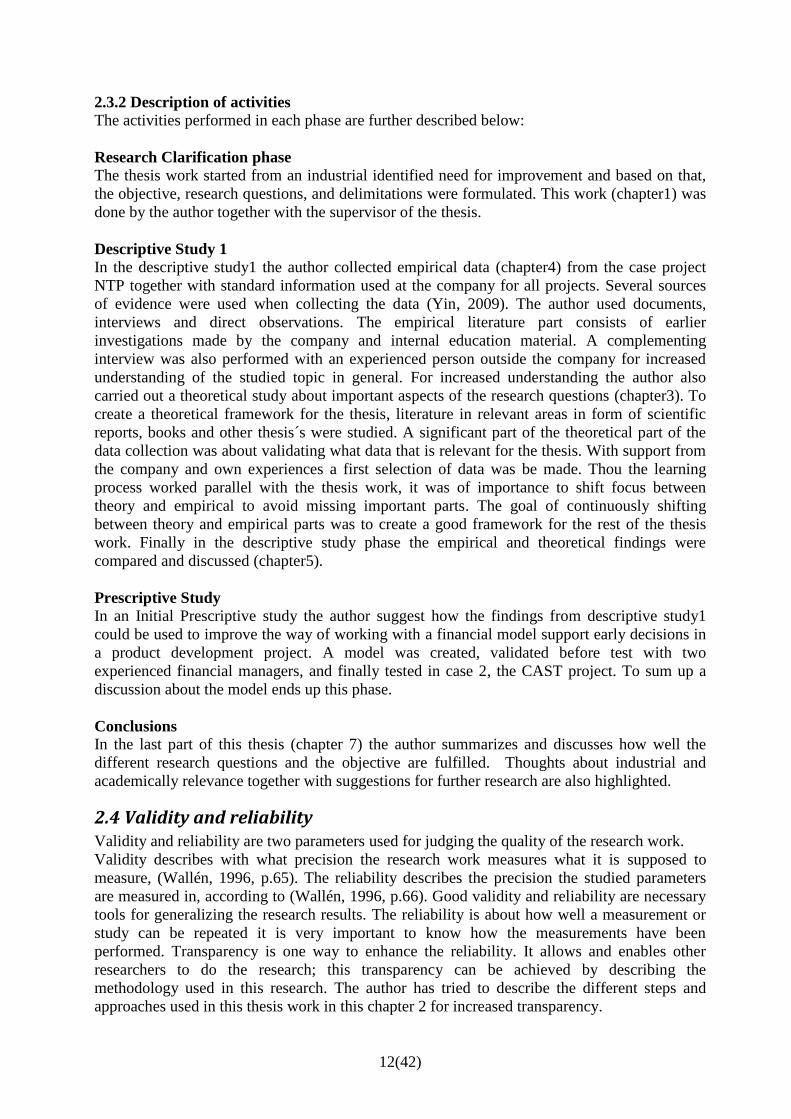
In figure 5 below there is an overview of how the different chapters in the thesis are connected
to the different phases in the Design Research Methodology and the activities in each phase are
further described below in chapter 2.3.2.
Figure 5 - overview of the chapters in the thesis in relation to the phases in DRM
1.
Background
and problem
description
3.
Theoretical
data
collection
4.
Empirical
data
collection
5.
Discusssion
6.
Result
7.
Conclusions
Research
Clarification Descriptive Study 1 Presrciptive
Study
12(42)
2.3.2 Description of activities
The activities performed in each phase are further described below:
Research Clarification phase
The thesis work started from an industrial identified need for improvement and based on that,
the objective, research questions, and delimitations were formulated. This work (chapter1) was
done by the author together with the supervisor of the thesis.
Descriptive Study 1
In the descriptive study1 the author collected empirical data (chapter4) from the case project
NTP together with standard information used at the company for all projects. Several sources
of evidence were used when collecting the data (Yin, 2009). The author used documents,
interviews and direct observations. The empirical literature part consists of earlier
investigations made by the company and internal education material. A complementing
interview was also performed with an experienced person outside the company for increased
understanding of the studied topic in general. For increased understanding the author also
carried out a theoretical study about important aspects of the research questions (chapter3). To
create a theoretical framework for the thesis, literature in relevant areas in form of scientific
reports, books and other thesis´s were studied. A significant part of the theoretical part of the
data collection was about validating what data that is relevant for the thesis. With support from
the company and own experiences a first selection of data was be made. Thou the learning
process worked parallel with the thesis work, it was of importance to shift focus between
theory and empirical to avoid missing important parts. The goal of continuously shifting
between theory and empirical parts was to create a good framework for the rest of the thesis
work. Finally in the descriptive study phase the empirical and theoretical findings were
compared and discussed (chapter5).
Prescriptive Study
In an Initial Prescriptive study the author suggest how the findings from descriptive study1
could be used to improve the way of working with a financial model support early decisions in
a product development project. A model was created, validated before test with two
experienced financial managers, and finally tested in case 2, the CAST project. To sum up a
discussion about the model ends up this phase.
Conclusions
In the last part of this thesis (chapter 7) the author summarizes and discusses how well the
different research questions and the objective are fulfilled. Thoughts about industrial and
academically relevance together with suggestions for further research are also highlighted.
2.4 Validity and reliability
Validity and reliability are two parameters used for judging the quality of the research work.
Validity describes with what precision the research work measures what it is supposed to
measure, (Wallén, 1996, p.65). The reliability describes the precision the studied parameters
are measured in, according to (Wallén, 1996, p.66). Good validity and reliability are necessary
tools for generalizing the research results. The reliability is about how well a measurement or
study can be repeated it is very important to know how the measurements have been
performed. Transparency is one way to enhance the reliability. It allows and enables other
researchers to do the research; this transparency can be achieved by describing the
methodology used in this research. The author has tried to describe the different steps and
approaches used in this thesis work in this chapter 2 for increased transparency.
13(42)
3. Theoretical Framework
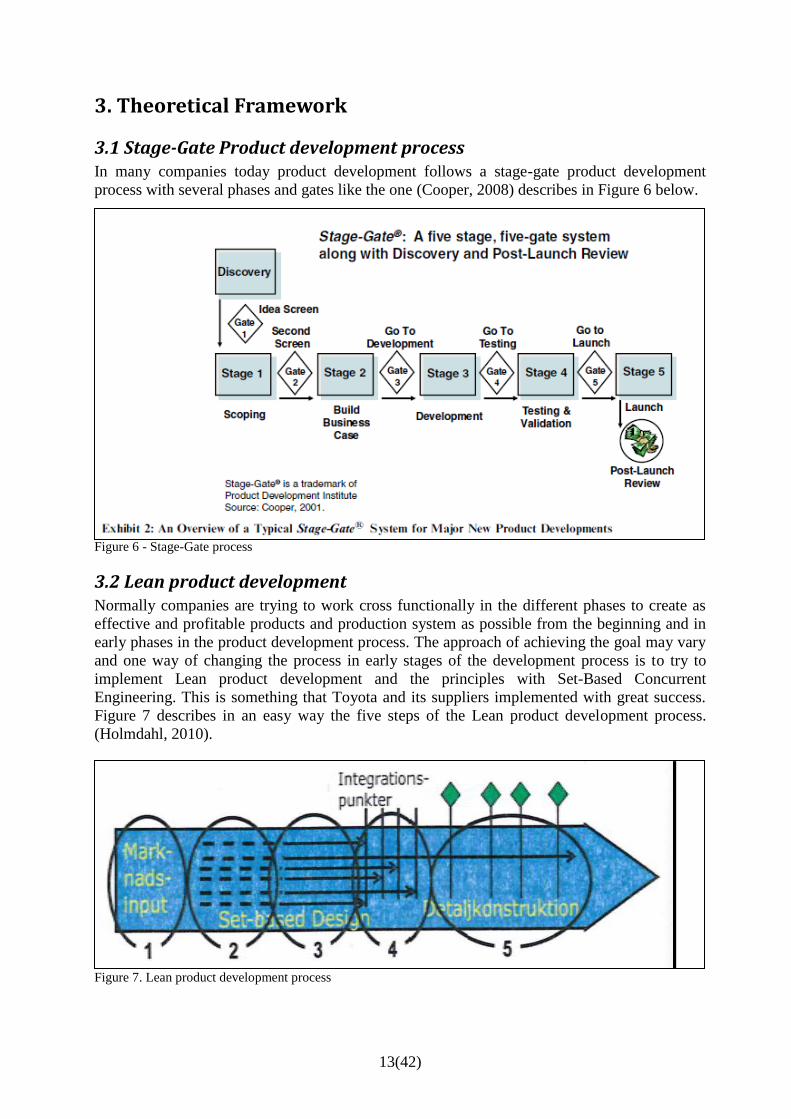
3.1 Stage-Gate Product development process In many companies today product development follows a stage-gate product development
process with several phases and gates like the one (Cooper, 2008) describes in Figure 6 below.
Figure 6 - Stage-Gate process
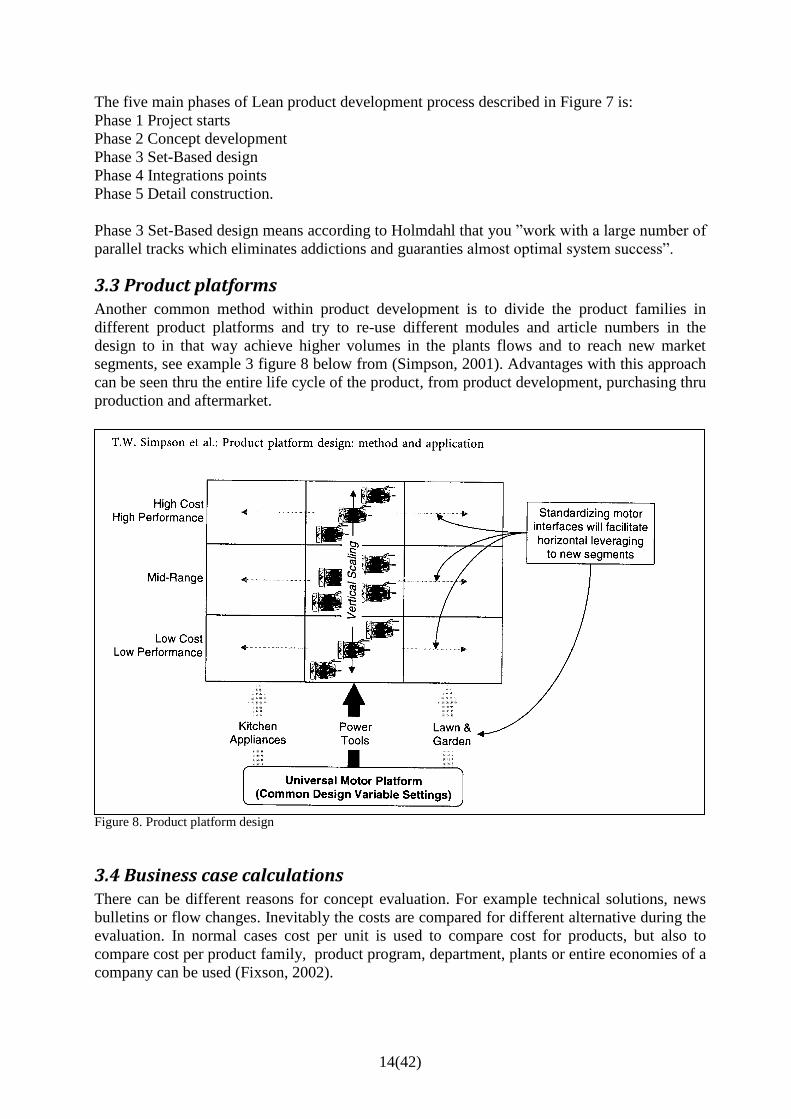
3.2 Lean product development Normally companies are trying to work cross functionally in the different phases to create as
effective and profitable products and production system as possible from the beginning and in
early phases in the product development process. The approach of achieving the goal may vary
and one way of changing the process in early stages of the development process is to try to
implement Lean product development and the principles with Set-Based Concurrent
Engineering. This is something that Toyota and its suppliers implemented with great success.
Figure 7 describes in an easy way the five steps of the Lean product development process.
(Holmdahl, 2010).
Figure 7. Lean product development process
14(42)
The five main phases of Lean product development process described in Figure 7 is:
Phase 1 Project starts
Phase 2 Concept development
Phase 3 Set-Based design
Phase 4 Integrations points
Phase 5 Detail construction.
Phase 3 Set-Based design means according to Holmdahl that you ”work with a large number of
parallel tracks which eliminates addictions and guaranties almost optimal system success”.
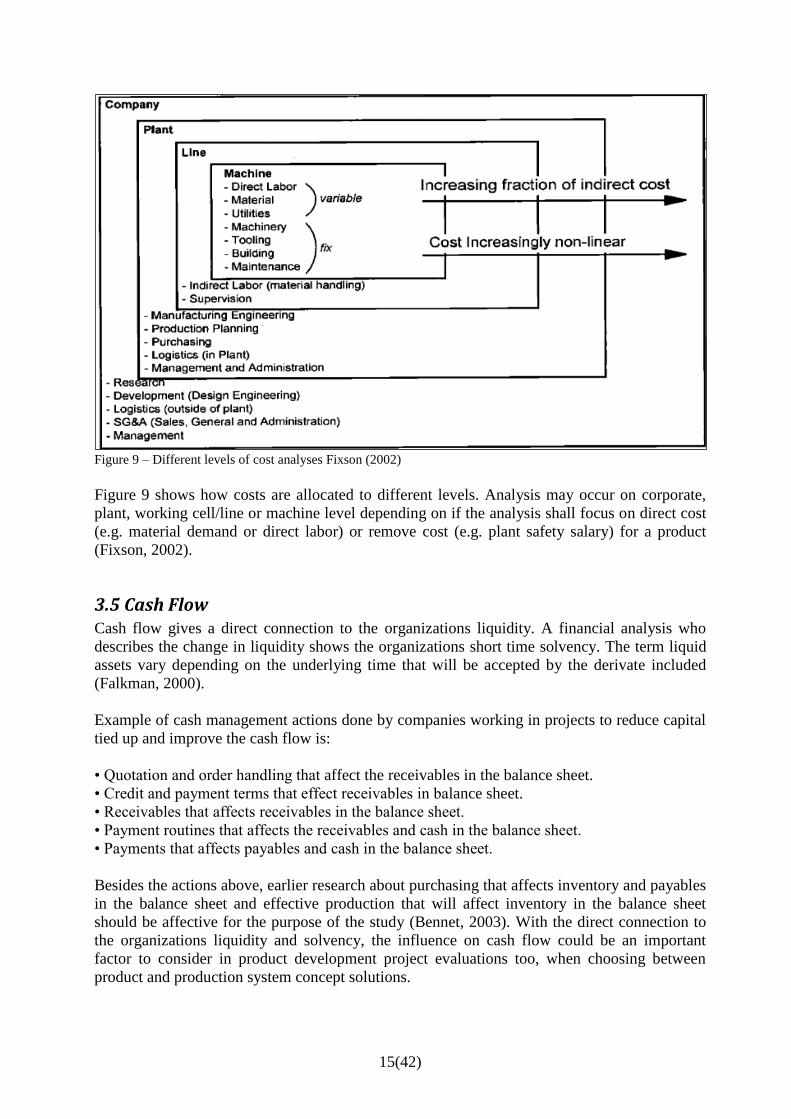
3.3 Product platforms Another common method within product development is to divide the product families in
different product platforms and try to re-use different modules and article numbers in the
design to in that way achieve higher volumes in the plants flows and to reach new market
segments, see example 3 figure 8 below from (Simpson, 2001). Advantages with this approach
can be seen thru the entire life cycle of the product, from product development, purchasing thru
production and aftermarket.
Figure 8. Product platform design
3.4 Business case calculations There can be different reasons for concept evaluation. For example technical solutions, news
bulletins or flow changes. Inevitably the costs are compared for different alternative during the
evaluation. In normal cases cost per unit is used to compare cost for products, but also to
compare cost per product family, product program, department, plants or entire economies of a
company can be used (Fixson, 2002).
15(42)
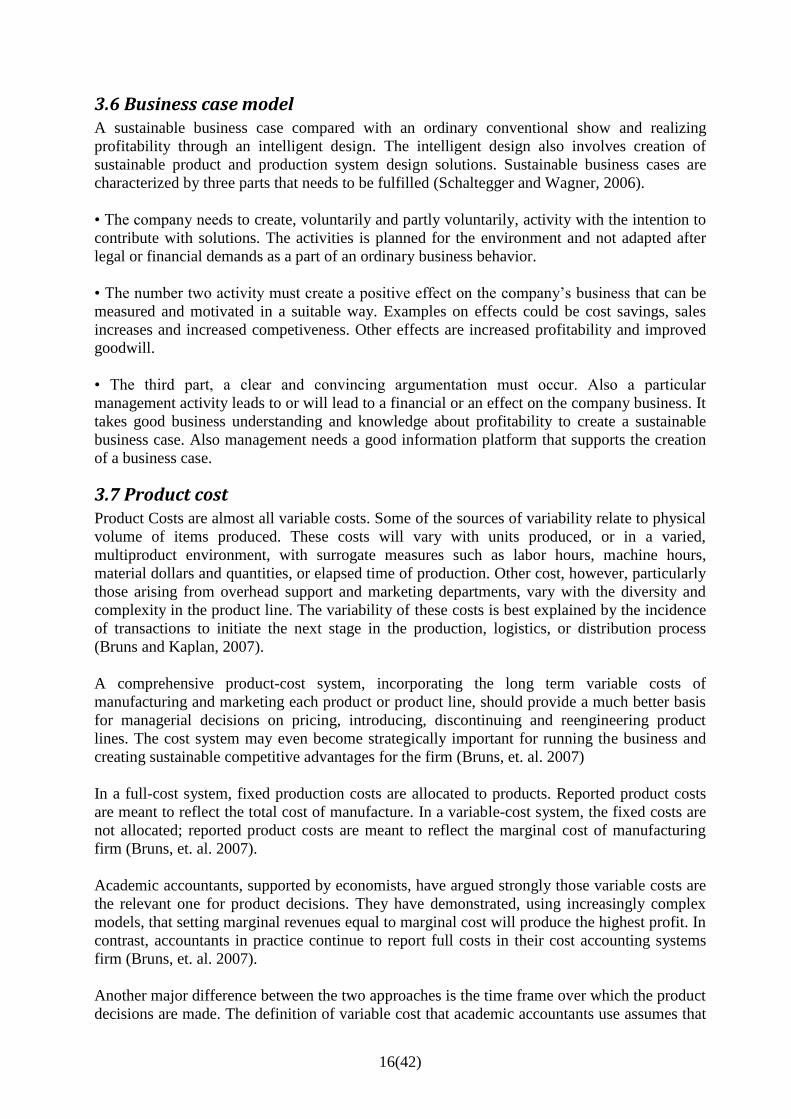
Figure 9 – Different levels of cost analyses Fixson (2002)
Figure 9 shows how costs are allocated to different levels. Analysis may occur on corporate,
plant, working cell/line or machine level depending on if the analysis shall focus on direct cost
(e.g. material demand or direct labor) or remove cost (e.g. plant safety salary) for a product
(Fixson, 2002).
3.5 Cash Flow Cash flow gives a direct connection to the organizations liquidity. A financial analysis who
describes the change in liquidity shows the organizations short time solvency. The term liquid
assets vary depending on the underlying time that will be accepted by the derivate included
(Falkman, 2000).
Example of cash management actions done by companies working in projects to reduce capital
tied up and improve the cash flow is:
• Quotation and order handling that affect the receivables in the balance sheet.
• Credit and payment terms that effect receivables in balance sheet.
• Receivables that affects receivables in the balance sheet.
• Payment routines that affects the receivables and cash in the balance sheet.
• Payments that affects payables and cash in the balance sheet.
Besides the actions above, earlier research about purchasing that affects inventory and payables
in the balance sheet and effective production that will affect inventory in the balance sheet
should be affective for the purpose of the study (Bennet, 2003). With the direct connection to
the organizations liquidity and solvency, the influence on cash flow could be an important
factor to consider in product development project evaluations too, when choosing between
product and production system concept solutions.
16(42)
3.6 Business case model A sustainable business case compared with an ordinary conventional show and realizing
profitability through an intelligent design. The intelligent design also involves creation of
sustainable product and production system design solutions. Sustainable business cases are
characterized by three parts that needs to be fulfilled (Schaltegger and Wagner, 2006).
• The company needs to create, voluntarily and partly voluntarily, activity with the intention to
contribute with solutions. The activities is planned for the environment and not adapted after
legal or financial demands as a part of an ordinary business behavior.
• The number two activity must create a positive effect on the company’s business that can be
measured and motivated in a suitable way. Examples on effects could be cost savings, sales
increases and increased competiveness. Other effects are increased profitability and improved
goodwill.
• The third part, a clear and convincing argumentation must occur. Also a particular
management activity leads to or will lead to a financial or an effect on the company business. It
takes good business understanding and knowledge about profitability to create a sustainable
business case. Also management needs a good information platform that supports the creation
of a business case.
3.7 Product cost Product Costs are almost all variable costs. Some of the sources of variability relate to physical
volume of items produced. These costs will vary with units produced, or in a varied,
multiproduct environment, with surrogate measures such as labor hours, machine hours,
material dollars and quantities, or elapsed time of production. Other cost, however, particularly
those arising from overhead support and marketing departments, vary with the diversity and
complexity in the product line. The variability of these costs is best explained by the incidence
of transactions to initiate the next stage in the production, logistics, or distribution process
(Bruns and Kaplan, 2007).
A comprehensive product-cost system, incorporating the long term variable costs of
manufacturing and marketing each product or product line, should provide a much better basis
for managerial decisions on pricing, introducing, discontinuing and reengineering product
lines. The cost system may even become strategically important for running the business and
creating sustainable competitive advantages for the firm (Bruns, et. al. 2007)
In a full-cost system, fixed production costs are allocated to products. Reported product costs
are meant to reflect the total cost of manufacture. In a variable-cost system, the fixed costs are
not allocated; reported product costs are meant to reflect the marginal cost of manufacturing
firm (Bruns, et. al. 2007).
Academic accountants, supported by economists, have argued strongly those variable costs are
the relevant one for product decisions. They have demonstrated, using increasingly complex
models, that setting marginal revenues equal to marginal cost will produce the highest profit. In
contrast, accountants in practice continue to report full costs in their cost accounting systems
firm (Bruns, et. al. 2007).
Another major difference between the two approaches is the time frame over which the product
decisions are made. The definition of variable cost that academic accountants use assumes that
17(42)
product decisions have a short time horizon, typically a month or a quarter. Cost are variable if,
and only if, they vary directly with monthly or quarterly changes in production volumes. Such
a definition is appropriate if the volume of production of all products can be changed at will
and there is no way to change simultaneously the level of fixed costs (Bruns, et. al. 2007).
In practice, managers reject this short-term perspective. In their eyes, the decision to
manufacture a product creates a long-term commitment to manufacture market and support that
product. Given this perspective, short-term variable cost is an insufficient measure of product
cost. Indeed, a long-term measure is required.
While full cost is meant to be a surrogate for long-run manufacturing cost, in nearly all of the
companies visited, management was not convinced that their full-cost systems were adequate
for product-related decisions. In particular, management did not believe that their systems
accurately reflected the costs of resources consumed to manufacture products. But they were
also unwilling to adopt a variable-cost approach. The goal of a study, therefore, was to
determine a relevant measure of product costs that would facilitate product decisions.
Conclusion is that almost all products related decisions introduction, pricing and
discontinuance are long term decisions. The short-term focus for product costing has led to the
situation of a large and growing proportion of total manufacturing cost is considered “fixed”.
This paradox that was called “fixed” costs is in fact the most variable and rapidly increasing
cost. The key for unlocking the paradox arises from introducing two fundamental changes in
our thinking about cost behavior.
First, the allocation of costs from the cost pools to the products should be achieved using bases
that reflect cost drivers. Since many overhead costs are driven by the complexity of production,
not the volume of production, non-volume related bases are required.
Second, many of those costs are somewhat discretionary, and while they vary with changes in
the complexity of the production process, these changes are intermittent.
A traditional cost system that defines variable costs as varying in the short term with
production volume will misclassify them as fixed costs. The misclassification arises from an
inadequate understanding of the actual cost drivers for most overhead cost
(Bruns, et. al. 2007).
18(42)
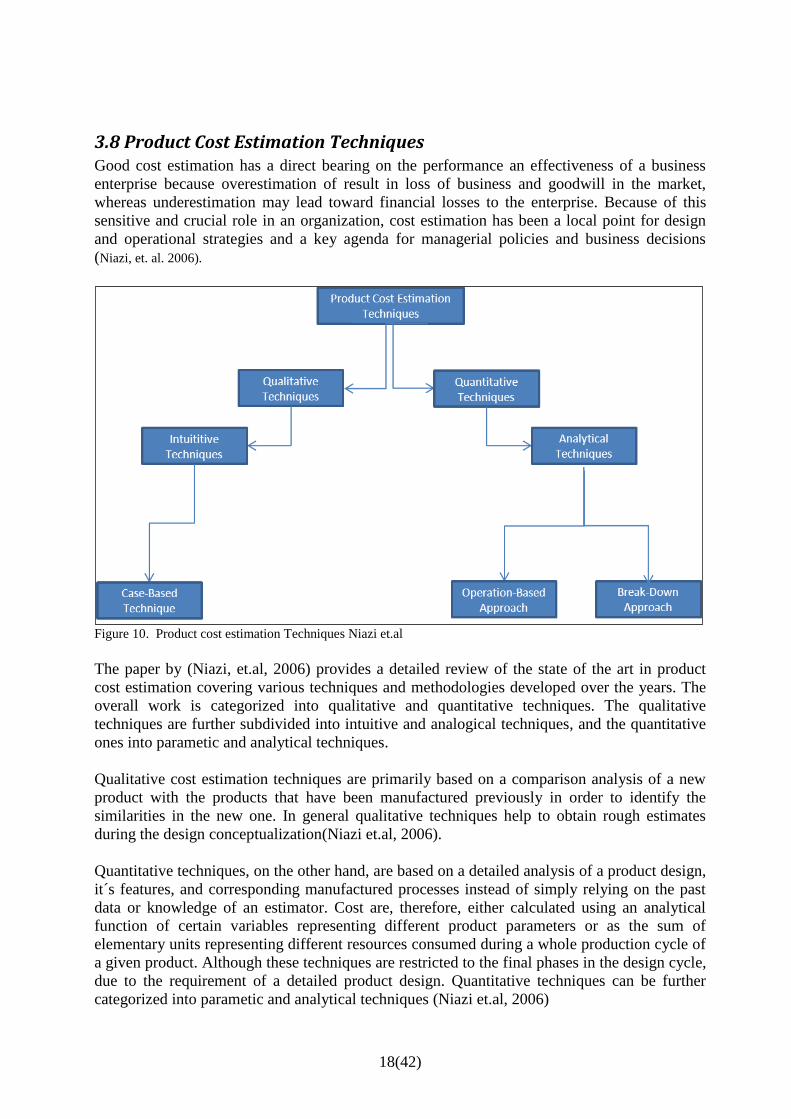
3.8 Product Cost Estimation Techniques Good cost estimation has a direct bearing on the performance an effectiveness of a business
enterprise because overestimation of result in loss of business and goodwill in the market,
whereas underestimation may lead toward financial losses to the enterprise. Because of this
sensitive and crucial role in an organization, cost estimation has been a local point for design
and operational strategies and a key agenda for managerial policies and business decisions
(Niazi, et. al. 2006).
Figure 10. Product cost estimation Techniques Niazi et.al
The paper by (Niazi, et.al, 2006) provides a detailed review of the state of the art in product
cost estimation covering various techniques and methodologies developed over the years. The
overall work is categorized into qualitative and quantitative techniques. The qualitative
techniques are further subdivided into intuitive and analogical techniques, and the quantitative
ones into parametic and analytical techniques.
Qualitative cost estimation techniques are primarily based on a comparison analysis of a new
product with the products that have been manufactured previously in order to identify the
similarities in the new one. In general qualitative techniques help to obtain rough estimates
during the design conceptualization(Niazi et.al, 2006).
Quantitative techniques, on the other hand, are based on a detailed analysis of a product design,
it´s features, and corresponding manufactured processes instead of simply relying on the past
data or knowledge of an estimator. Cost are, therefore, either calculated using an analytical
function of certain variables representing different product parameters or as the sum of
elementary units representing different resources consumed during a whole production cycle of
a given product. Although these techniques are restricted to the final phases in the design cycle,
due to the requirement of a detailed product design. Quantitative techniques can be further
categorized into parametic and analytical techniques (Niazi et.al, 2006)
19(42)
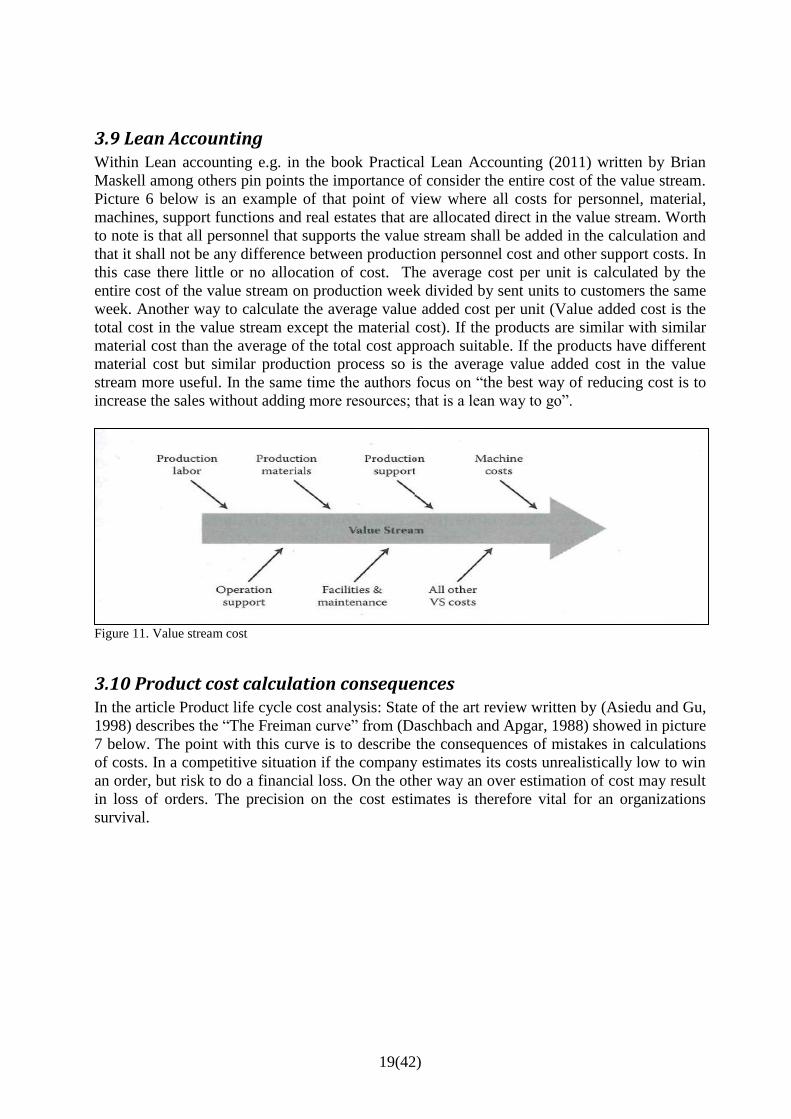
3.9 Lean Accounting Within Lean accounting e.g. in the book Practical Lean Accounting (2011) written by Brian
Maskell among others pin points the importance of consider the entire cost of the value stream.
Picture 6 below is an example of that point of view where all costs for personnel, material,
machines, support functions and real estates that are allocated direct in the value stream. Worth
to note is that all personnel that supports the value stream shall be added in the calculation and
that it shall not be any difference between production personnel cost and other support costs. In
this case there little or no allocation of cost. The average cost per unit is calculated by the
entire cost of the value stream on production week divided by sent units to customers the same
week. Another way to calculate the average value added cost per unit (Value added cost is the
total cost in the value stream except the material cost). If the products are similar with similar
material cost than the average of the total cost approach suitable. If the products have different
material cost but similar production process so is the average value added cost in the value
stream more useful. In the same time the authors focus on “the best way of reducing cost is to
increase the sales without adding more resources; that is a lean way to go”.
Figure 11. Value stream cost
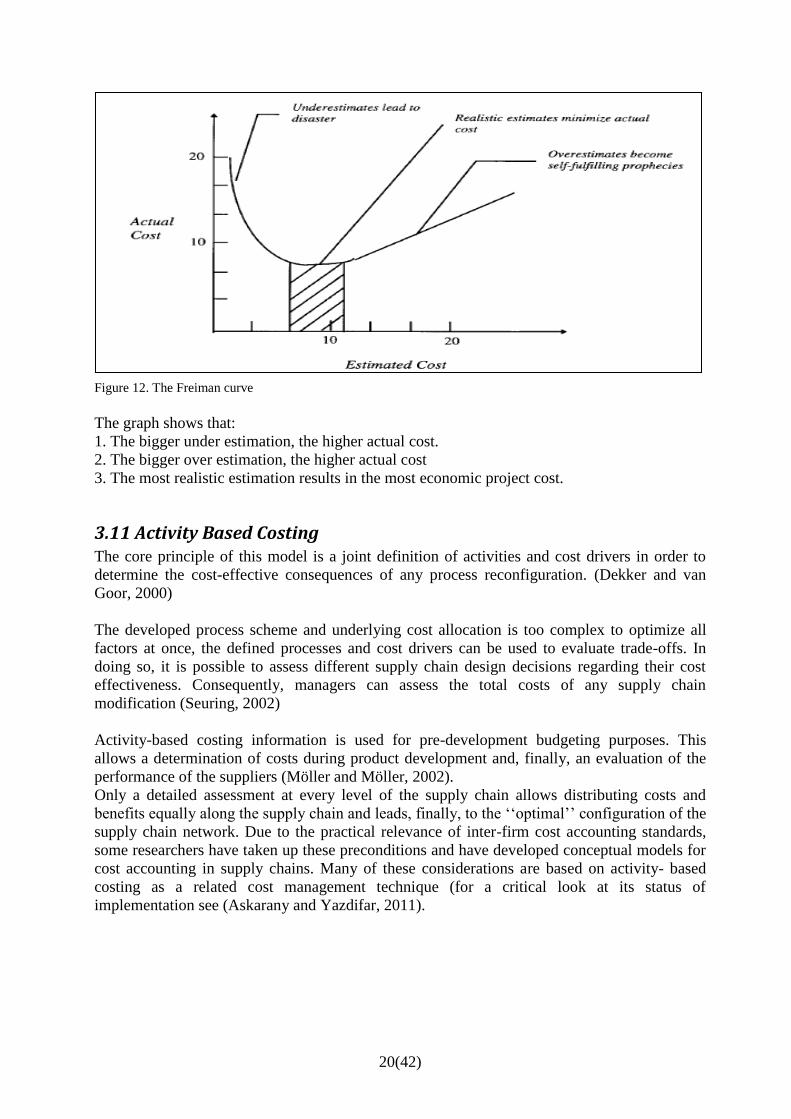
3.10 Product cost calculation consequences In the article Product life cycle cost analysis: State of the art review written by (Asiedu and Gu,
1998) describes the “The Freiman curve” from (Daschbach and Apgar, 1988) showed in picture
7 below. The point with this curve is to describe the consequences of mistakes in calculations
of costs. In a competitive situation if the company estimates its costs unrealistically low to win
an order, but risk to do a financial loss. On the other way an over estimation of cost may result
in loss of orders. The precision on the cost estimates is therefore vital for an organizations
survival.
20(42)
Figure 12. The Freiman curve
The graph shows that:
1. The bigger under estimation, the higher actual cost.
2. The bigger over estimation, the higher actual cost
3. The most realistic estimation results in the most economic project cost.
3.11 Activity Based Costing The core principle of this model is a joint definition of activities and cost drivers in order to
determine the cost-effective consequences of any process reconfiguration. (Dekker and van
Goor, 2000)
The developed process scheme and underlying cost allocation is too complex to optimize all
factors at once, the defined processes and cost drivers can be used to evaluate trade-offs. In
doing so, it is possible to assess different supply chain design decisions regarding their cost
effectiveness. Consequently, managers can assess the total costs of any supply chain
modification (Seuring, 2002)
Activity-based costing information is used for pre-development budgeting purposes. This
allows a determination of costs during product development and, finally, an evaluation of the
performance of the suppliers (Möller and Möller, 2002).
Only a detailed assessment at every level of the supply chain allows distributing costs and
benefits equally along the supply chain and leads, finally, to the ‘‘optimal’’ configuration of the
supply chain network. Due to the practical relevance of inter-firm cost accounting standards,
some researchers have taken up these preconditions and have developed conceptual models for
cost accounting in supply chains. Many of these considerations are based on activity- based
costing as a related cost management technique (for a critical look at its status of
implementation see (Askarany and Yazdifar, 2011).
21(42)
4. Empirical studies
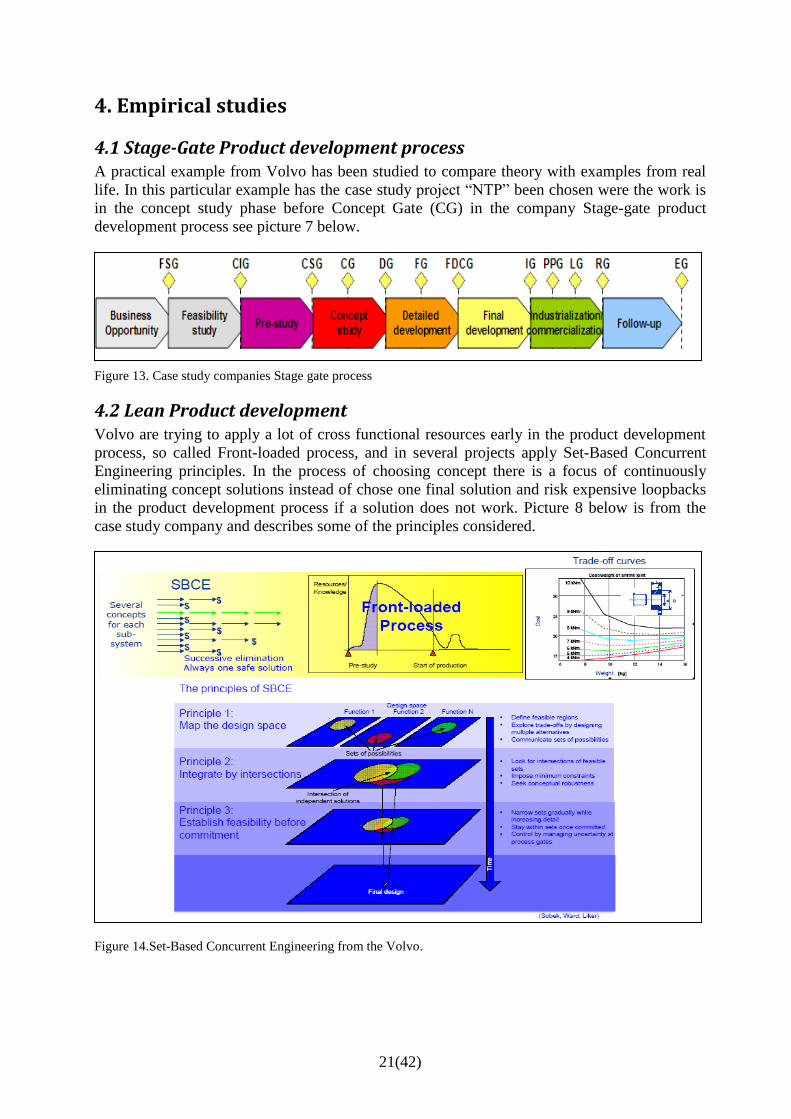
4.1 Stage-Gate Product development process A practical example from Volvo has been studied to compare theory with examples from real
life. In this particular example has the case study project “NTP” been chosen were the work is
in the concept study phase before Concept Gate (CG) in the company Stage-gate product
development process see picture 7 below.
Figure 13. Case study companies Stage gate process
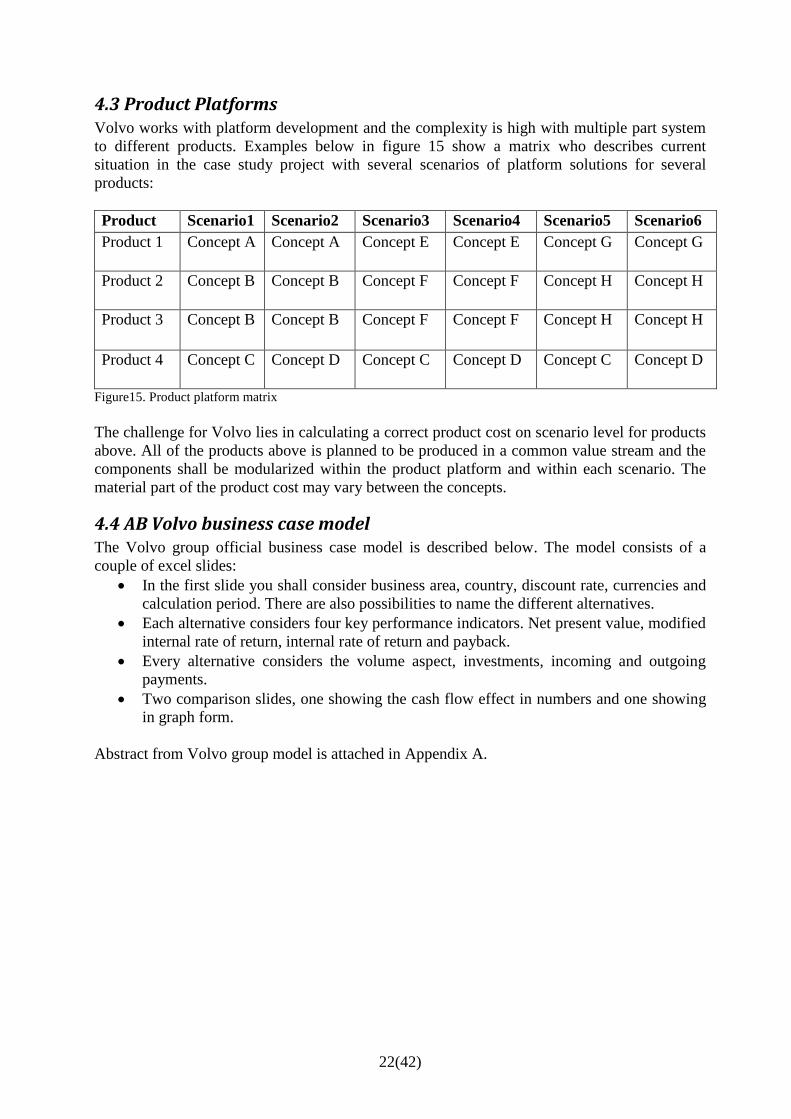
4.2 Lean Product development Volvo are trying to apply a lot of cross functional resources early in the product development
process, so called Front-loaded process, and in several projects apply Set-Based Concurrent
Engineering principles. In the process of choosing concept there is a focus of continuously
eliminating concept solutions instead of chose one final solution and risk expensive loopbacks
in the product development process if a solution does not work. Picture 8 below is from the
case study company and describes some of the principles considered.
Figure 14.Set-Based Concurrent Engineering from the Volvo.
22(42)
4.3 Product Platforms Volvo works with platform development and the complexity is high with multiple part system
to different products. Examples below in figure 15 show a matrix who describes current
situation in the case study project with several scenarios of platform solutions for several
products:
Product Scenario1 Scenario2 Scenario3 Scenario4 Scenario5 Scenario6
Product 1 Concept A Concept A Concept E Concept E Concept G Concept G
Product 2 Concept B Concept B Concept F Concept F Concept H Concept H
Product 3 Concept B Concept B Concept F Concept F Concept H Concept H
Product 4 Concept C Concept D Concept C Concept D Concept C Concept D
Figure15. Product platform matrix
The challenge for Volvo lies in calculating a correct product cost on scenario level for products
above. All of the products above is planned to be produced in a common value stream and the
components shall be modularized within the product platform and within each scenario. The
material part of the product cost may vary between the concepts.
4.4 AB Volvo business case model The Volvo group official business case model is described below. The model consists of a
couple of excel slides:
In the first slide you shall consider business area, country, discount rate, currencies and
calculation period. There are also possibilities to name the different alternatives.
Each alternative considers four key performance indicators. Net present value, modified
internal rate of return, internal rate of return and payback.
Every alternative considers the volume aspect, investments, incoming and outgoing
payments.
Two comparison slides, one showing the cash flow effect in numbers and one showing
in graph form.
Abstract from Volvo group model is attached in Appendix A.
23(42)
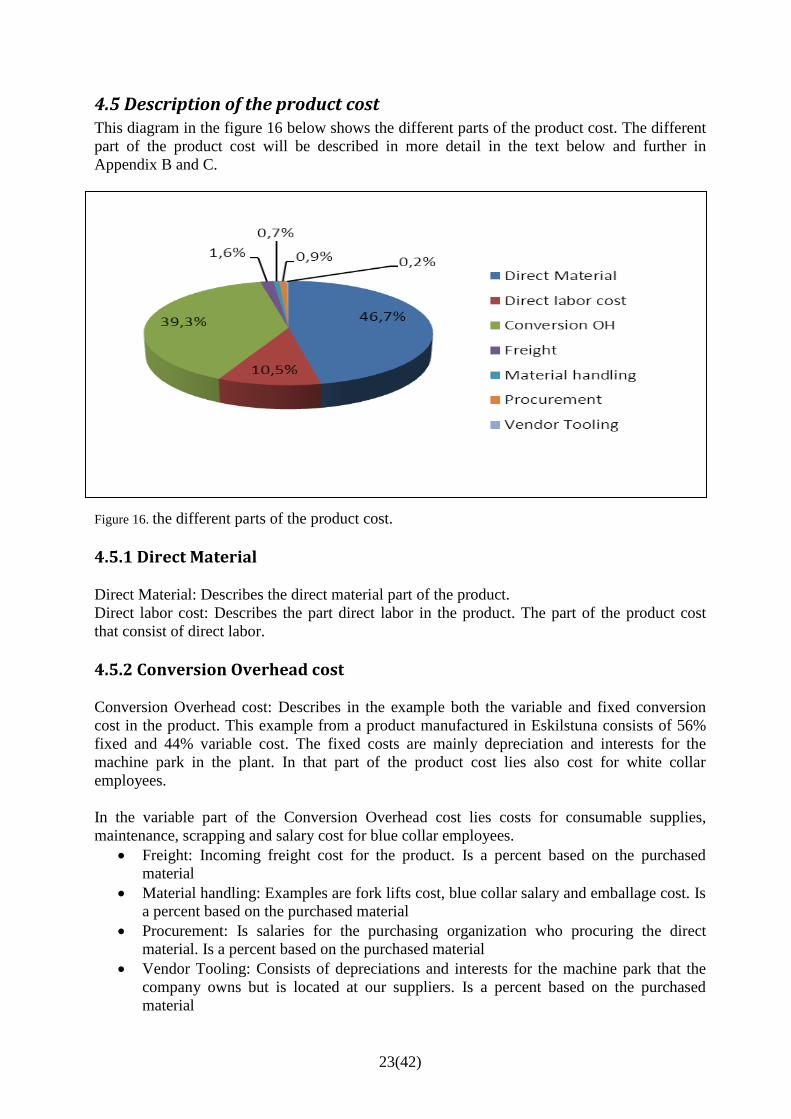
4.5 Description of the product cost This diagram in the figure 16 below shows the different parts of the product cost. The different
part of the product cost will be described in more detail in the text below and further in
Appendix B and C.
Figure 16. the different parts of the product cost.
4.5.1 Direct Material
Direct Material: Describes the direct material part of the product.
Direct labor cost: Describes the part direct labor in the product. The part of the product cost
that consist of direct labor.
4.5.2 Conversion Overhead cost
Conversion Overhead cost: Describes in the example both the variable and fixed conversion
cost in the product. This example from a product manufactured in Eskilstuna consists of 56%
fixed and 44% variable cost. The fixed costs are mainly depreciation and interests for the
machine park in the plant. In that part of the product cost lies also cost for white collar
employees.
In the variable part of the Conversion Overhead cost lies costs for consumable supplies,
maintenance, scrapping and salary cost for blue collar employees.
Freight: Incoming freight cost for the product. Is a percent based on the purchased
material
Material handling: Examples are fork lifts cost, blue collar salary and emballage cost. Is
a percent based on the purchased material
Procurement: Is salaries for the purchasing organization who procuring the direct
material. Is a percent based on the purchased material
Vendor Tooling: Consists of depreciations and interests for the machine park that the
company owns but is located at our suppliers. Is a percent based on the purchased
material
24(42)
4.6 Current situation product cost for concept choice in project NTP The case study company has usually a standardized process for product cost estimations within
product development projects. This process is based on an certain accuracy level of the
concepts created by the product developers so that production engineers will be able to create
detailed operations-, time- and investment solutions for each article. The case study project is
lacking significant accuracy levels of the design for the project members to use the
standardized process with a successful result in this early phase for each concept and scenario.
The high number of remaining concepts will demand big workloads with the standardized
process.
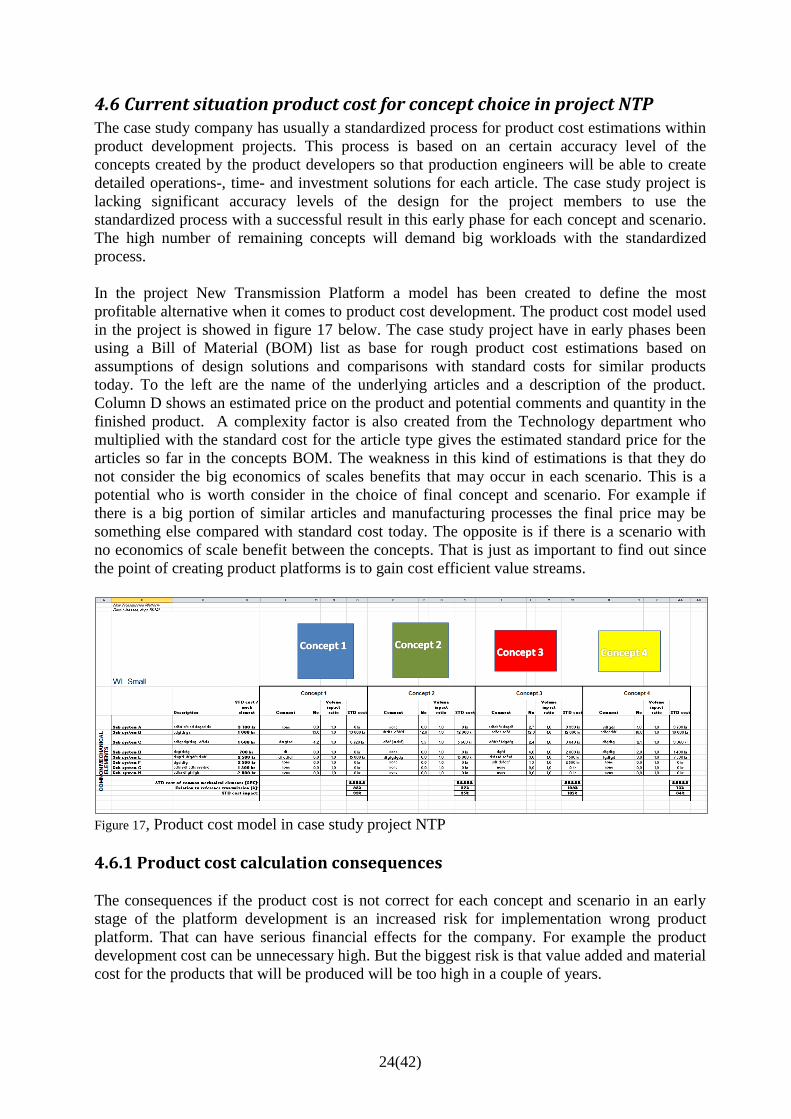
In the project New Transmission Platform a model has been created to define the most
profitable alternative when it comes to product cost development. The product cost model used
in the project is showed in figure 17 below. The case study project have in early phases been
using a Bill of Material (BOM) list as base for rough product cost estimations based on
assumptions of design solutions and comparisons with standard costs for similar products
today. To the left are the name of the underlying articles and a description of the product.
Column D shows an estimated price on the product and potential comments and quantity in the
finished product. A complexity factor is also created from the Technology department who
multiplied with the standard cost for the article type gives the estimated standard price for the
articles so far in the concepts BOM. The weakness in this kind of estimations is that they do
not consider the big economics of scales benefits that may occur in each scenario. This is a
potential who is worth consider in the choice of final concept and scenario. For example if
there is a big portion of similar articles and manufacturing processes the final price may be
something else compared with standard cost today. The opposite is if there is a scenario with
no economics of scale benefit between the concepts. That is just as important to find out since
the point of creating product platforms is to gain cost efficient value streams.
Figure 17, Product cost model in case study project NTP
4.6.1 Product cost calculation consequences
The consequences if the product cost is not correct for each concept and scenario in an early
stage of the platform development is an increased risk for implementation wrong product
platform. That can have serious financial effects for the company. For example the product
development cost can be unnecessary high. But the biggest risk is that value added and material
cost for the products that will be produced will be too high in a couple of years.
25(42)
4.7 Interviews To increase knowledge about the topic three interviews were performed with experienced
people.
4.7.1 Interview Allan Carlsson
The first interview was with Allan Carlsson, Finance Manager Operations Arvika, with 45
years of experience within the industry business and from several management positions in
finance for Wheel Loaders and Articulated Haulers at Volvo Construction Equipment.
After describing the suggestion of process Allan indicated that if you can show potential
savings in an early stage of the project you will be able to signal in opposite direction of the
process and control or suggest the technology department to use a concept that will give best
effect on the product cost. In a normal scenario the technology department will design the
product and production and purchasing implements chosen concept in form of adapting the
production system with investments, constructions and education. Purchasing department
adapts the stream of material and supplier relations to the concept.
Regarding calculations the best way to allocate cost to right type of product is by activity based
costing. VCE are not using ABC calculation, however VCE Arvika plant are using a similar
allocation of cost. The plant uses hourly rates on cost centers where the plant allocates their
fixed costs e.g. renting cost for buildings by the square meter in percentage the department are
using. Another example of allocating fixed cost is the production engineering department
where the cost for the technicians working with tasks regarding Welding and Machining are
allocated to the products lifting frames and back and rear frames.
“The purpose of ABC calculations is to achieve knowledge about which products that is most
profitable for the company”.
4.7.2 Interview Mats Lilja
The second interview was with Mats Lilja, Business Controller and Acting Finance Manager at
Danfoss Heatpumps. He has several years of experience from the Danfoss Group and from
IBM in Austria.
The discussion concerned the possibility of allocating cost with current methods. Danfoss only
allocates it´s variable cost today and have one fixed hourly rate in there assembly line. The
routing time varies among the products. The fixed part of the product cost is added in the
inventory report. Since Danfoss Heatpumps only have assembly of roughly 4 hours for their
products, the company sees no need of allocating its fixed cost during the manufacturing
process.
To allocate the total cost of a product, to really see the operating margin on one product, that to
see which products that are most profitable for the company, Mats suggests an Activity Based
Costing Analysis or using a business case model process.
26(42)
4.7.3 Interview Lars Lewin
The third interview was with Lars Lewin, CFO and Vice President Operations Europe.
Operation Europe is the biggest part of Operations within Volvo CE.
Lars mention activity based costing as a method to identify cost drivers. He also mentions that
when it comes product cost calculation there is no certain method that Volvo always uses.
New design may demand new calculation method. “The method shall be adapted for the
purpose”.
The hardest thing when it comes to estimation of product cost is the volume aspect. Base the
volume aspect on a long range forecast with a sensitivity analysis.
Business case is the only way to prioritize scenarios. “The way of make money is to focus on
the cash flow”.
27(42)
5. Discussion
5.1 Stage-Gate Product development process The theoretical five stage-gate model from Cooper is a little bit less complicated then Volvos
global product development process model, the GDP. However the different stages in Volvos
model is in many cases very formal and not very practical. What I like and think correlates is
the business case stage which occurs in Coopers model in stage 2 and in Volvos model between
pre-study and concept study. The difficulties by calculating a business case is to reflect on the
business opportunities in a very early stage with a lot of uncertain data to reflect on.
5.2 Lean Product development The reflection is that Volvo have developed the theory even further. Volvo is and shall be one
of the companies that leads the development within Lean Product development. Another
reflection is the use and focus on cross functional resources in the early and in the different
stages of the process. What I especially like with the Volvo model is the focus on eliminating
concepts. In that way you shrink the possibilities during the process down to one final solution
5.3 Product Platforms The thing I like with Volvos model and focus that correlates with theory is the focus on
commonalities. The CAST initiative is not really a commonality focus but the economics of
scale focus is there. Use similar article, components, fixtures and machines in as many products
as possible. In that way you create a competitive product cost for a range of products and in
that way sustain good profitability for the company.
5.4 Business case model The business case model setup that Volvo Construction Equipment and the rest of the Volvo
group use is complicated, old and not very tolerate to operational errors. However it shows and
focuses on the cash flow and the activities that have a positive effect on the business like
Schaltegger e.g. mention. The description of cash flow from Bennet shows also a correlation
with the model when it is comes to inventory consideration. The conclusion is that both the
theory and my interviews show that a business case is a vital tool to secure profitability for a
business. There are potential improvements to do for Volvo with current business case model.
5.5 Description of the product cost The reflection when it comes to product cost is that Volvo Construction Equipment is
competitive when it´s comes to calculations. Volvo uses a qualitative full-cost system which
includes fixed costs. Fixed cost is vital to use since many of our components for example axles
and transmissions have a lot of fixed cost allocated in form depreciation and interest. Activity
based costing technique is the best method to create the most accurate product cost which my
interviews confirms. The method is however too time consuming and Volvo does not use it for
that reason. Volvo allocates the overhead costs by produced hours per value added area. A very
productive area that creates a lot of program hours will absorb a lot of overhead costs in the
business.
28(42)
5.6 Current situation product cost for concept choice in project NTP and CAST After studying some theories both from Volvo and others I realized that this is an area that the
company has potential for improvements. Volvo Construction Equipment lacks a clear product
cost estimation model suitable for some of the earliest gates in the product development
process. I have therefore added a qualitative product cost estimation model to the CAST
project, see chapter 6. The model is now used in the project with the CAST frame in Arvika
production plant and been approved by the CFO and vice president of Operations Europe.
5.7 Summary The general reflection is that Volvo in many situations handles its problems in ways that
correlates with the theories that exits. In the situations that Volvo does not consider the theories
the company really has reasons not to. In other areas Volvo shall lead the development and
contribute to new research that will add more sustainable theory. My interviews confirm that a
competitive product cost and a decent business case secure incitements to good business
decisions in the future.
29(42)
6. Result - Customized calculation example CAST Frames
As a result of the identified opportunity for improvement in early product cost calculations at
Volvo CE, together with my theoretical and empirical experiences, this chapter now focus to
come up with a suggestion for an improved solution. To do so in an as realistic context as
possible, I tried my thoughts in a sharp product development project at Volvo CE in Arvika.
The case project is called CAST and is a platform project for some products. CAST stands for
Common Architecture Shared Technology and is a modular platform design philosophy used at
the company based on standardized fabrication and assembly processes.
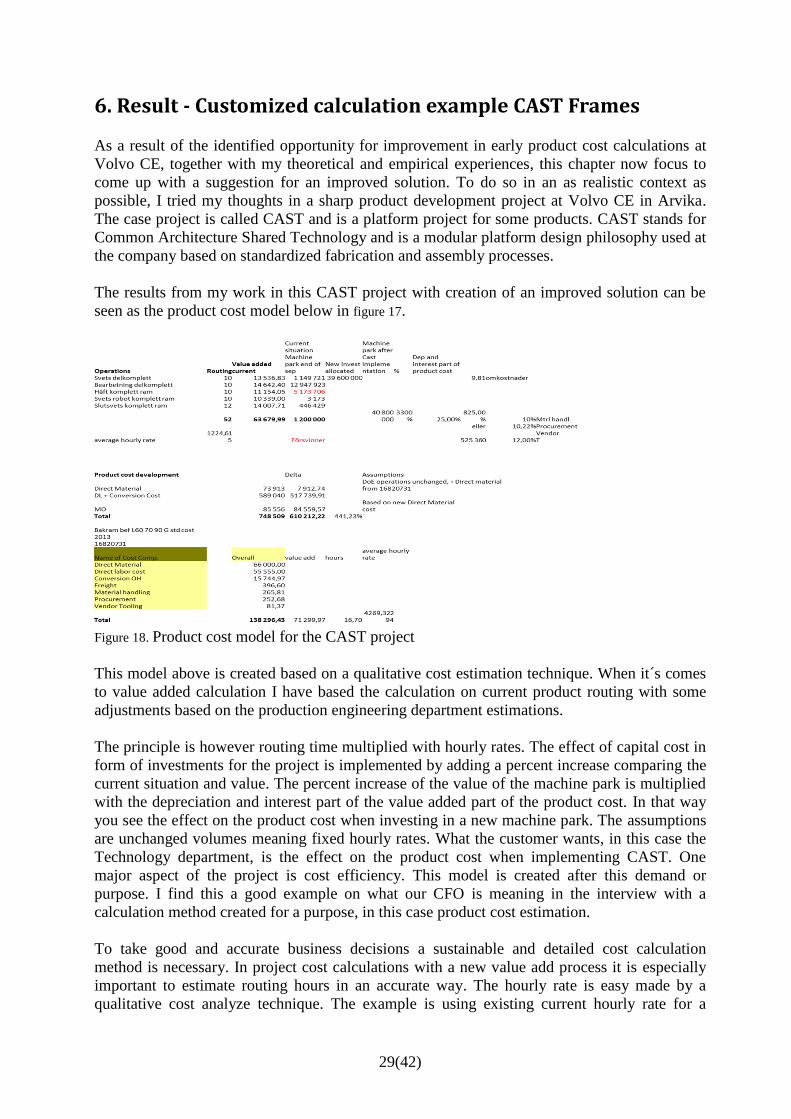
The results from my work in this CAST project with creation of an improved solution can be
seen as the product cost model below in figure 17.
Figure 18. Product cost model for the CAST project
This model above is created based on a qualitative cost estimation technique. When it´s comes
to value added calculation I have based the calculation on current product routing with some
adjustments based on the production engineering department estimations.
The principle is however routing time multiplied with hourly rates. The effect of capital cost in
form of investments for the project is implemented by adding a percent increase comparing the
current situation and value. The percent increase of the value of the machine park is multiplied
with the depreciation and interest part of the value added part of the product cost. In that way
you see the effect on the product cost when investing in a new machine park. The assumptions
are unchanged volumes meaning fixed hourly rates. What the customer wants, in this case the
Technology department, is the effect on the product cost when implementing CAST. One
major aspect of the project is cost efficiency. This model is created after this demand or
purpose. I find this a good example on what our CFO is meaning in the interview with a
calculation method created for a purpose, in this case product cost estimation.
To take good and accurate business decisions a sustainable and detailed cost calculation
method is necessary. In project cost calculations with a new value add process it is especially
important to estimate routing hours in an accurate way. The hourly rate is easy made by a
qualitative cost analyze technique. The example is using existing current hourly rate for a
30(42)
similar process area. The other aspect of project cost calculations is the consideration of the
investments. Which level of capital expenditure is necessary and how does it affect the product
cost.
Along with an accurate cost calculation a business case shall be the fundament for the decision
when launching a new product or business. The business case is focusing on the cash flow not
considering depreciation and calculated interest like the product cost calculation. Instead the
business case setup considers the cash flow of the investment that in a later stage creates the
cost for depreciation and interest.
31(42)
7. Conclusions
7.1 Objective of this research project and research questions.
7.1.1 Objective
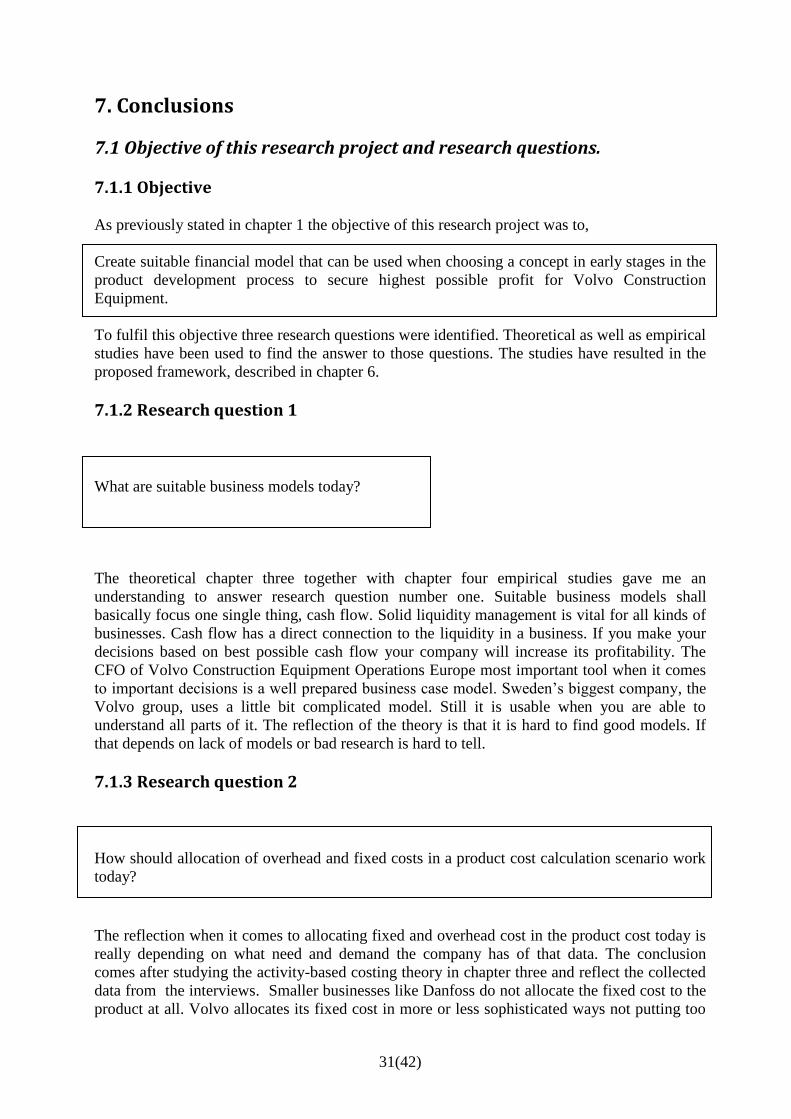
As previously stated in chapter 1 the objective of this research project was to,
Create suitable financial model that can be used when choosing a concept in early stages in the
product development process to secure highest possible profit for Volvo Construction
Equipment.
To fulfil this objective three research questions were identified. Theoretical as well as empirical
studies have been used to find the answer to those questions. The studies have resulted in the
proposed framework, described in chapter 6.
7.1.2 Research question 1
What are suitable business models today?
The theoretical chapter three together with chapter four empirical studies gave me an
understanding to answer research question number one. Suitable business models shall
basically focus one single thing, cash flow. Solid liquidity management is vital for all kinds of
businesses. Cash flow has a direct connection to the liquidity in a business. If you make your
decisions based on best possible cash flow your company will increase its profitability. The
CFO of Volvo Construction Equipment Operations Europe most important tool when it comes
to important decisions is a well prepared business case model. Sweden’s biggest company, the
Volvo group, uses a little bit complicated model. Still it is usable when you are able to
understand all parts of it. The reflection of the theory is that it is hard to find good models. If
that depends on lack of models or bad research is hard to tell.
7.1.3 Research question 2
How should allocation of overhead and fixed costs in a product cost calculation scenario work
today?
The reflection when it comes to allocating fixed and overhead cost in the product cost today is
really depending on what need and demand the company has of that data. The conclusion
comes after studying the activity-based costing theory in chapter three and reflect the collected
data from the interviews. Smaller businesses like Danfoss do not allocate the fixed cost to the
product at all. Volvo allocates its fixed cost in more or less sophisticated ways not putting too
32(42)
much effort on investigate where the cost belongs. In that way you never get a really accurate
product cost calculation. The conclusion of that is that it makes it harder to see which products
that have the best margins and earn the most money on in the business. Bad or no allocation of
fixed and overhead costs complicates business decisions and may affect the profitability for the
company in the long run.
Today the Volvo group allocates its fixed and conversion cost based mainly on production
hours and the support functions e.g. production engineering customers. The department with an
hourly rate will absorb the support functions cost in the business. The reason for not doing a
deeper analysis of the fixed cost is that it is too time consuming.
A suggestion for improving the process in the future is to adapt an activity based costing model
thru a business intelligence solution with some fixed parameters. That will ease up the
calculation process and will give more time for analyzing the calculation and margin for the
product.
7.1.4 Research question 3
How can a financial model support early decisions in a product development project?
A financial model that accomplishes to answer for all the necessary criteria’s within a product
development project is almost a guaranty for reaching its financial targets. The better data you
can provide a model in an early stage the better output you get. Many product development
models, like Coopers in chapter three, supports the construction of a business case in very early
stages of a project. If you can provide good information or estimations of for example supplier
contract, drawings, operational routings and potential investments when choosing a scenario
you will be able create consistent product cost estimation (business model). Product cost is an
important part of every development project. Can you have a good estimation in early stages it
eases up the other stages and the progress of the entire project.
The qualitative technique for product cost calculation that I created and uses in the result
chapter supports the CAST projects for products to Wheel Loaders. It is based on all the
criteria´s mentioned above. To secure the models credibility before presenting it for the project
I consulted with the CFO of Operations Europe which agreed using it.
33(42)
7.2 Industrial and academic relevance
Based on the theoretical and empirical collected data in this thesis I can say that Volvo
Construction Equipment applies a lot of the processes described in the theories. One example is
the Qualitative cost estimation technique described by Niazi among others. Volvo is looking a
lot on similarities when it´s comes to costing new products.
Qualitative cost estimation techniques are primarily based on a comparison analysis of a new
product with the products that have been manufactured previously in order to identify the
similarities in the new one. In general qualitative techniques help to obtain rough estimates
during the design conceptualization
7.3 Future research In general Volvo Construction Equipment needs to be more aware of the product cost. There
are several initiatives in form of cost reduction projects, gross margin councils and focus from
the Technology department to focus on product cost. However the knowledge and awareness of
how to calculate and what effect actions have on the product cost needs to improve in general
at the company before any significant change and improvement will occur. More research from
people with financial background is therefore to recommend for closing the knowledge gap in
Volvo Construction Equipment.
34(42)
References
Askarany, D., Yazdifar, H., 2011. An investigation into the mixed reported adoption rates for
ABC: evidence from Australia, NewZealand and the UK. International Journal of Production
Economics. doi:10.1016/j.ijpe.2011.08.017
Bennet S., 2003, Finanshandboken, Industrilitteratur AB, Stockholm.
Blessing, 2009, Design Research Methodology
Bruns, William J Jr. Kaplan, Robert S 2007 Accounting & Management Field study
perspectives
Cooper R.G. 2008 Product Development Institute
Dekker, H.C., van Goor, A.R., 2000. Supply chain management and management accounting: a
case study of activity based costing. International Journal of Logistics: Research and
Applications 3 (1), 41–52.
Falkman, 2000. Kassaflödesredovisning
Fixson Sebastian, 2002 Modularization and outsourcing: who drives whom? A
study of generational sequences in the US Automotive
cockpit industry
Holmdahl L, 2010 Lean Product Development .
Kvale, S. 1997: Den kvalitativa forskningsintervjun. Lund: Studentlitteratur
Maskel, Brian 2011 Practical Lean Accounting .
Morgan and Liker, 2006 The Toyota Product Development System
Möller,G.,Möller,K.,2002.KonstruktionsbegleitendesSupplyChainControlling mit
prozeßorientiertemKostenmanagement.in:Hahn,D.,Kaufmann,L.(Eds.), Handbuch
IndustriellesBeschaffungsmanagement2.Edn,Gabler,Wiesbaden, pp. 747–764.
Niazi, Adnan Dai, Jian S. Balabani, Stavroula Seneviratne Lakmal 2006 Product Cost
Estimation: Technique Classification and Methodology Review.
Seuring, S.,2002b.SupplyChainCosting.in:Franz,K.P.,Kaj ¨ uter, P.(Eds.),
Kostenmanagement—Wertsteigerung durchsystematischeKostensteuer- ung2nd ed.,Sch¨ affer-
Poeschl, Stuttgart,pp.5–27.
Schaltegger, S and M. Wagner 2006: Managing the Business Case of Sustainability, Sheffield:
Greenleaf.
Simpson, Timothy W. Maier, Jonathan R.A., Mistree, Farrokh 2001 Product platform design:
method and application.
35(42)
Volvo Financial Policies & Procedures 2013
Y. ASIEDU and P. GU, 1998 Product life cycle cost analysis
Yin, Robert K, 2009 Case Study Research: Design and Methods (Applied Social Research
Methods)
36(42)
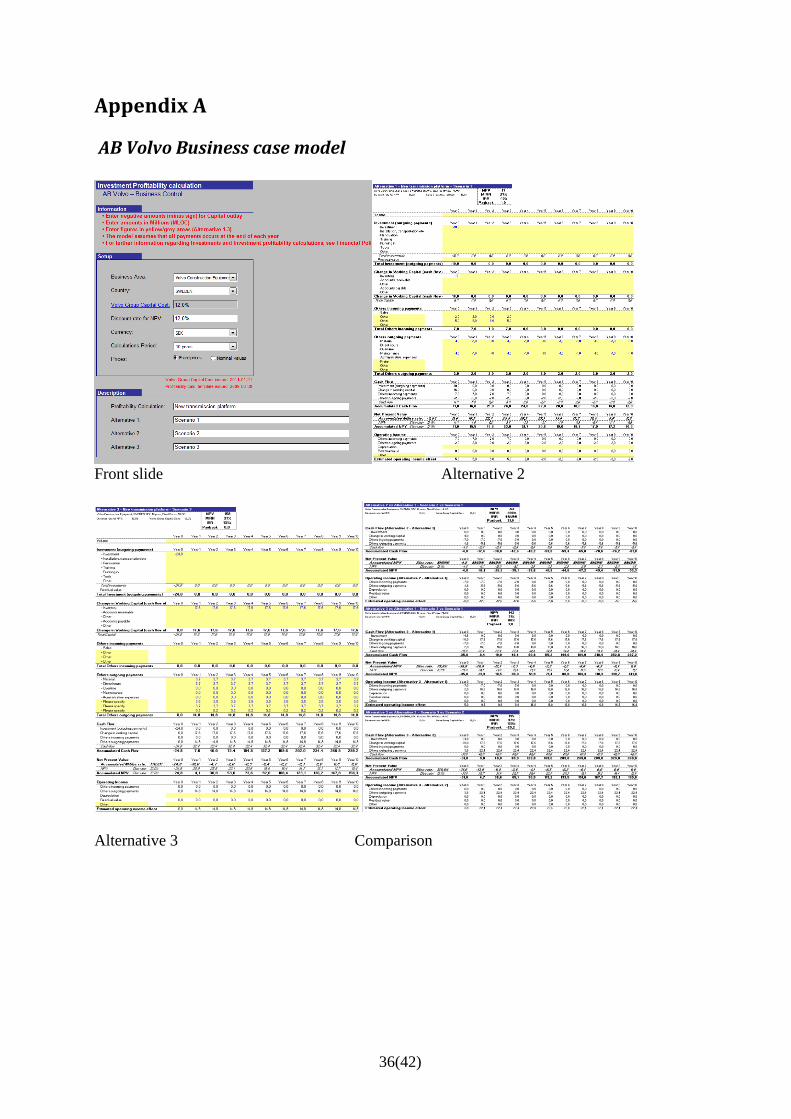
Appendix A
AB Volvo Business case model
Front slide Alternative 2
Alternative 3 Comparison
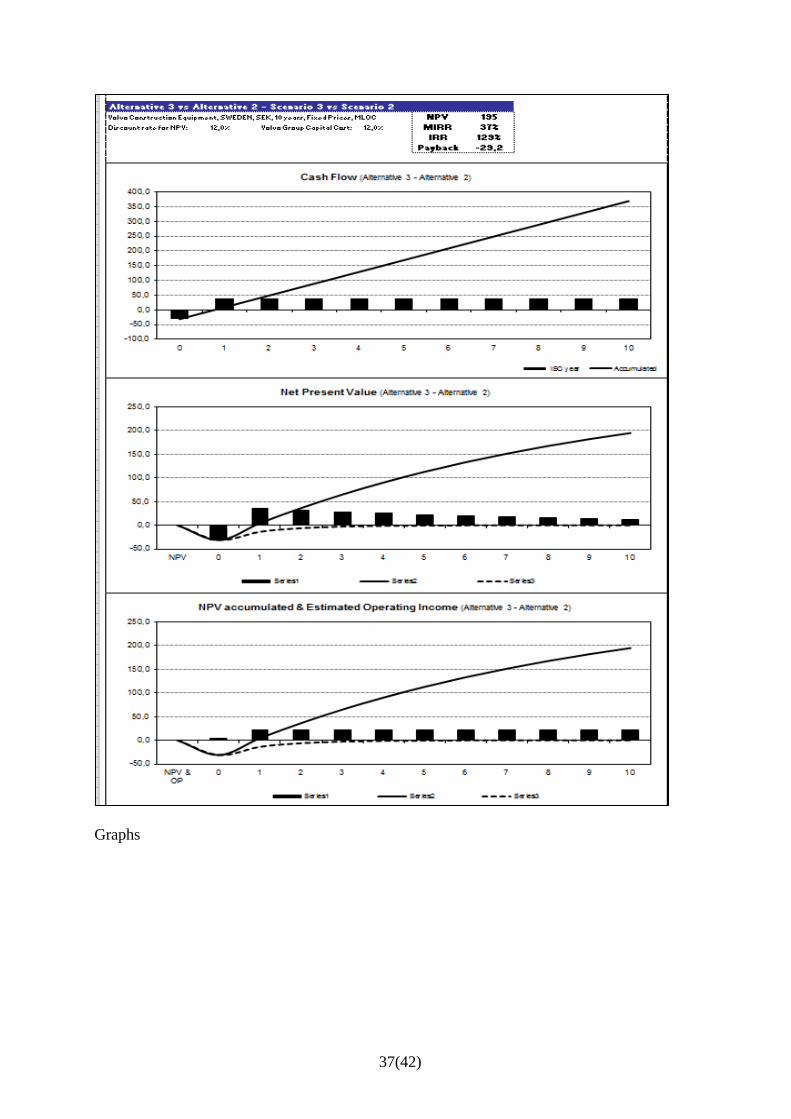
37(42)
Graphs
38(42)
Appendix B
According to Volvo Financial Policies and Procedures 2011 the definition of the cost categories are:
Direct materials
Contents
Raw material, parts and components purchased from suppliers outside the Volvo group.
Allocation method:
Directly traced to products.
Direct labor
Contents
Cost per man-hour, including social expenses.
Allocation method
Directly traced to products.
Resources directly consumed by the product, i.e. direct materials and direct labour.
Conversion overhead cost
Contents
• Salaries and wages, including social expenses, etc
• Company cars for employees and others
• Training
• Other personnel expenses
• Purchased services, both internal and external.
• Calculated interest on total inventory.
• Operational maintenance of property, plant and equipment
• Travel expenses
• Containers
• Energy
• Rejections, scrapping
• Consumables
• Hand-tools and consumable tools
• Small equipment
• Maintenance of machinery
Allocation method
Attributed to products based on cost drivers to the greatest possible extent, otherwise
allocated.
Incoming material shipping costs
Contents
Freight, insurance and customs duty.
Allocation method
Attributed to products based on a cost driver. In certain cases directly traced to products.
39(42)
Incoming material handling costs
Contents
Costs for handling of incoming goods up to the point where the conversion process starts.
Allocation method
Directly traced to products or attributed to products based on a cost driver.
Procurement costs
Contents
Costs of the purchasing department. Possible other costs in connection with the procurement
of material.
Allocation method
Attributed to products based on a cost driver.
Vendor tool costs
Contents
Costs for Volvo owned tools placed at suppliers. Include calculated interest and historical cost
depreciation.
Allocation method
Directly traced to products.
40(42)
Appendix C
According to Volvo Financial Policies and Procedures 2011 the definition of fixed and variable cost is:
Fixed/variable costs
The definitions of fixed/variable as per the below are to be used solely for the purpose of the
productivity calculation and for determining the short-term result effects of volume
fluctuations. For product costing, the definition of fixed/variable as per the FPP Chapter C3
must be used.
Fixed costs
For the purpose of the productivity calculation the following costs are considered as being
fixed. The main criteria has been a consideration of whether or not the cost type can be
regarded as being volume driven:
Capital costs (depreciation and calculated interest on fixed assets)
Renting or leasing of assets
Property insurance and taxes
Maintenance cost for buildings
Monthly salaries (white collar)
Company cars contracted
Media supplies (electricity, water, compressed air, etc)
IS/IT costs
Rented services (contracted, e.g. VBS costs)
Sold services (white collar salaries)
Variable costs
All other costs are regarded as being variable. This means that, for the sake of simplicity, all
blue collars (both direct and indirect) within the production process, with the exception of
building maintenance, are regarded as being volume-driven and therefore a variable cost.
Allocation methods in the product cost calculation
The various cost items are allocated to the products according to one of the following
Methods:
Direct tracing
Resources directly consumed by the product, i.e. direct materials and direct labor.
Attribution
Resources consumed by a cost driver that can be related to the product. Example: purchasing
costs linked to the number of parts used in the product can be attributed to the product.
Activity based costing (ABC) is recommended where applicable.
41(42)
Allocation
Resources consumed in producing the products which should be included in the product cost
but which cannot be traced or attributed need to be fairly allocated to the products. Example:
production maintenance costs could be allocated on the basis of machine hours.
Fixed and variable cost split of conversion costs
In the product cost calculation a distinction is made between:
• Costs that should be split on the production volume in the calculation period (variable in
this sense).
• Costs that should be split on average volume over a longer period (fixed).
All capital costs (see Section 8.11 below) are considered fixed. All conversion costs other than
capital costs and related costs are considered variable, even if some variable costs are not 100
% flexible to volume on a short-term basis.
Annual planning and decision-making would use the fixed/variable split in line with the
product cost calculation. Longer term planning would regard all cost as variable over that
longer time period.
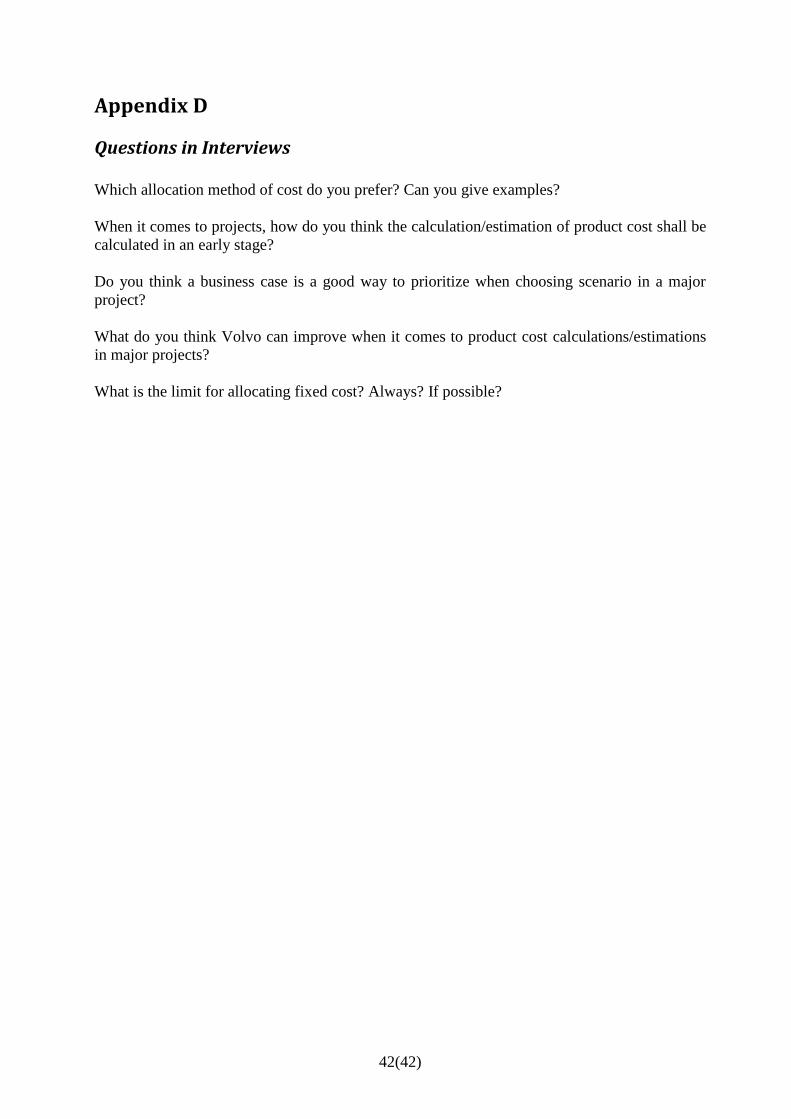
42(42)
Appendix D
Questions in Interviews
Which allocation method of cost do you prefer? Can you give examples?
When it comes to projects, how do you think the calculation/estimation of product cost shall be
calculated in an early stage?
Do you think a business case is a good way to prioritize when choosing scenario in a major
project?
What do you think Volvo can improve when it comes to product cost calculations/estimations
in major projects?
What is the limit for allocating fixed cost? Always? If possible?