product costing and performance analysis: a toolkit for ...russian microfinance center (rmc) sanabel...
TRANSCRIPT

2010
BUILDING STRONGASSOCIATIONS
Advancing Microfinance throughAssociation Leadership
Product Costing and Performance Analysis: A Toolkit for Analyzing Associations’ Service Offerings

Copyright © 2010 The SEEP Network
Sections of this publication may be copied or adapted to meet local needs without permission from The SEEP Network, provided that the parts copied are distributed for free or at cost—not for profit. Please credit The SEEP Network and “Product Costing and Performance Analysis:
A Toolkit for Analyzing Associations’ Service Offerings” for those sections excerpted.
For any commercial reproduction, please obtain permission from
The SEEP Network1875 Connecticut Avenue NW, Suite 414
Washington, DC 20009-5721Tel.: 1 202-534-1400 Fax: 1 202-534-1433
Printed in the United States of America.
To access this publication online, visit www.seepnetwork.org
The publication of this document is made possible by the generous support from Citi Foundation.

The SEEP Network1875 Connecticut Avenue NW, Washington, DC 20009-5721Tel.: 1 202-534-1400 Fax: 1 202-534-1433
The SEEP Network
Contributing Authors: Deena M. Burjorjee, Olga Tomilova, Nisha Singh, Mariana Marinho
Product Costing and Performance Analysis: A Toolkit for Analyzing Associations’ Service Offerings


CITI NETWORK STRENGTHENING PROGRAM · THE SEEP NETWORK iii
TABLE OF CONTENTS
Acknowledgments ivIntroduction 1Function of the Guide 1Preparation: Understanding the Methodological Approach 1Step 1: Identify Products 2Step 2: Identify Cost and Income Items for Allocation 3Step 3: Decide and Quantify Allocation Bases 6
1. Staff Time Estimates 62. Relative Contribution to Direct Income 63. Relative Consumption of Direct Costs 7
Step 4: Calculate Full Product Cost and Income 8Step 5: Analyze Product Performance 10
Cost Analysis 10Minimizing Costs 11Income Analysis 12Product Viability Analysis 14Establishing Unit Costs 15Assess Pricing Policy 16
Conclusion 16Glossary of Costing Terms 17

iv THE SEEP NETWORK · CITI NETWORK STRENGTHENING PROGRAM
ACKNOWLEDGMENTS
This Guide has been produced by The SEEP Network as an activity of the Citi Network Strengthening Program funded by the Citi Foundation.
The mission of the Citi Network Strengthening Program, the largest global grant program to be implemented in sup-port of the Citi Foundation’s microfinance strategy, is to increase the capacity and scale of the microfinance sector by strengthening the operational, technical, and financial capacity of twelve national and regional microfinance associations.
Special appreciation is owed to all of the contributing microfinance associations whose experience formed the basis of this Guide:
Red Financiera Rural (RFR) Russian Microfinance Center (RMC)Sanabel – The Microfinance Network of Arab Countries

CITI NETWORK STRENGTHENING PROGRAM · THE SEEP NETWORK 1
IntroductionMicrofinance associations rely on multiple sources of income to finance their activities, including member dues, fees for services, donor funding, and endowments. For many associations, donations make up the bulk of their financing, at least during the early start up phase. This is particularly true in emerging microfinance markets where members have lim-ited ability to pay for services and associations play a promotional role in the development of the industry. However, as associations grow and their markets mature, fees for services should start to replace donations as the primary source of revenue. This requires that associations have strategies in place to develop demand-driven, market-based products that are attractive to members and have the potential to become financially sustainable.
Function of the GuideThis Product Costing and Performance Analysis Guide provides guidance to associations to determine the cost struc-ture of their products and services, and the implications of their current policies on the association’s long-term financial sustainability. Tailored to reflect the unique business of associations, this tool has been designed to help institutions bet-ter understand 1) the full costs associated with their different service lines; 2) which products generate the most revenue for the association; and 3) the degree to which these products are, or can be, financially sustainable through membership dues, fees, and other charges. This exercise is a critical input in the business planning process and provides associations with important information needed to support realistic financial sustainability strategies and future fundraising efforts.1
This tool uses a simple cost-allocation approach as a first step to understanding the costs and revenues associated with the association’s products, recognizing that most associations do not have an activity-based accounting system nor business processes that are consistent across product lines. If association managers want a more in-depth analysis of the causes of costs and opportunities for increasing operational efficiencies, a more complex activity-based approach may be used.2
Preparation: Understanding the Methodological ApproachProduct costing is the process of tracking and analyzing all of the costs incurred in the production and sale of a product or service, including direct costs and overhead costs. While it is generally clear where to assign direct costs of service delivery, overhead costs are often more challenging to allocate to different products and services, particularly personnel costs, when staff support the delivery of multiple products. Therefore, the main objective of this exercise is to help associations think through this allocation process to ensure that all institu-tional costs have been considered in pricing decisions and to help them organize their financial data in a way that allows for a basic analysis of their financial performance.
1. For additional guidance on financial planning, see SEEP’s Strategic and Business Planning: A Guide for Microfinance Associations. http://networks.seepnetwork.org/en/resources
2. For a complete discussion of this approach, see B. Helms and L. Grace, 2004, Microfinance Product Costing Tool for MFIs (Washington, DC: CGAP), which can be used as a reference and adapted to meet the needs of networks. In addition, B. Helms, 1998, “Cost Allocation for Multi-Service Microfinance Institutions,” Occasional Paper, no. 2 (Washington, DC: CGAP) provides an in-depth discussion on cost allocation for multi-service institutions and guidance for defining distinct cost centers for different products and services.
Box 1. Steps for Analyzing Cost and Performance
Step 1: Identify productsStep 2: Identify cost and income items for allocationStep 3: Decide and quantify allocation bases Step 4: Calculate full product cost and incomeStep 5: Analyze product performance
2 THE SEEP NETWORK · CITI NETWORK STRENGTHENING PROGRAM
Step 1. Identify ProductsA first step in this exercise is for the association to clearly identify individual product offerings. One useful way to do this is to classify products according to key service lines. A service line can be defined as a group of products that are closely related, usually because they share similar objectives or are delivered through the similar types of delivery chan-nels. Service lines should represent the priorities of the association as reflected in its strategic and business plans. Some of the most common examples for associations are capacity building and information dissemination and exchange that are focused on the development of the sector, particularly member microfinance institutions (MFIs).
Once an association has defined its broader service areas, it is useful to then identify individual products. It is not uncommon for an association to offer multiple products within a service line, each with distinct sources of revenue and even possibly markets. For example, capacity-building services might include a training program, peer exchanges, tech-nical assistance, or consultancies. These products could generate revenue from multiple sources, such as service fees from members and non-members, grants from donors, and other related service charges.
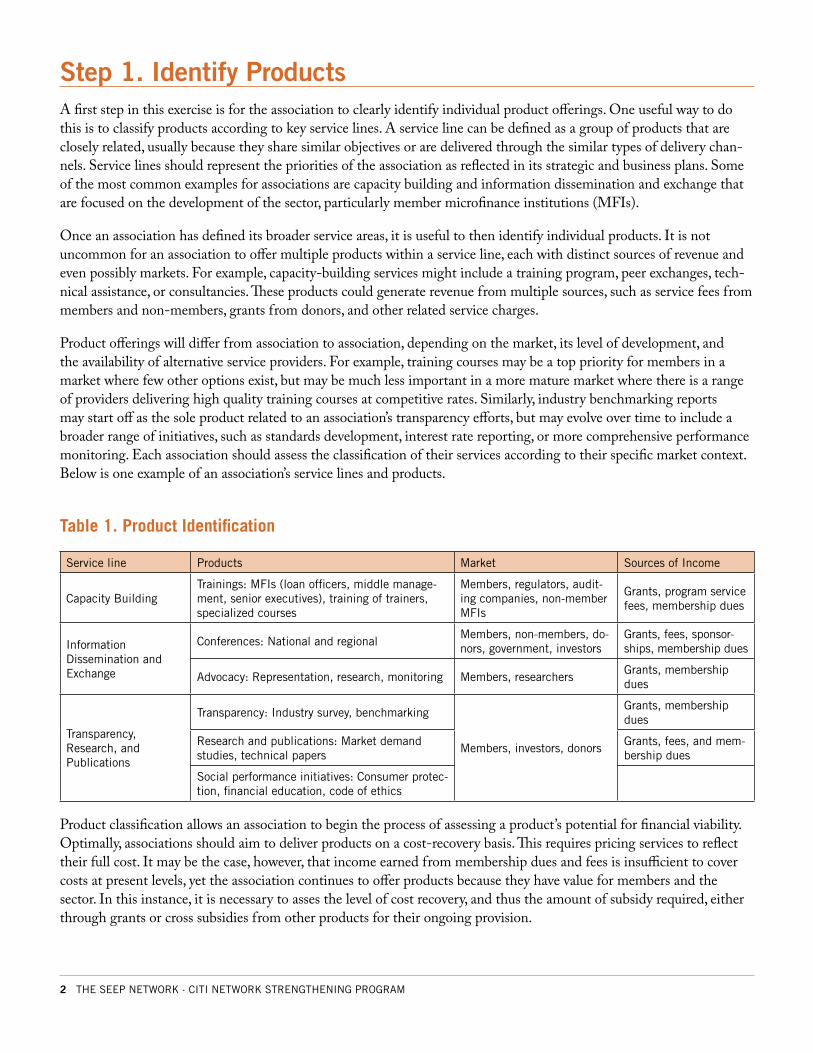
Product offerings will differ from association to association, depending on the market, its level of development, and the availability of alternative service providers. For example, training courses may be a top priority for members in a market where few other options exist, but may be much less important in a more mature market where there is a range of providers delivering high quality training courses at competitive rates. Similarly, industry benchmarking reports may start off as the sole product related to an association’s transparency efforts, but may evolve over time to include a broader range of initiatives, such as standards development, interest rate reporting, or more comprehensive performance monitoring. Each association should assess the classification of their services according to their specific market context. Below is one example of an association’s service lines and products.
Table 1. Product Identification
Service line Products Market Sources of Income
Capacity BuildingTrainings: MFIs (loan officers, middle manage-ment, senior executives), training of trainers, specialized courses
Members, regulators, audit-ing companies, non-member MFIs
Grants, program service fees, membership dues
Information Dissemination and Exchange
Conferences: National and regional Members, non-members, do-nors, government, investors
Grants, fees, sponsor-ships, membership dues
Advocacy: Representation, research, monitoring Members, researchersGrants, membership dues
Transparency, Research, and Publications
Transparency: Industry survey, benchmarking
Members, investors, donors
Grants, membership dues
Research and publications: Market demand studies, technical papers
Grants, fees, and mem-bership dues
Social performance initiatives: Consumer protec-tion, financial education, code of ethics
Product classification allows an association to begin the process of assessing a product’s potential for financial viability. Optimally, associations should aim to deliver products on a cost-recovery basis. This requires pricing services to reflect their full cost. It may be the case, however, that income earned from membership dues and fees is insufficient to cover costs at present levels, yet the association continues to offer products because they have value for members and the sector. In this instance, it is necessary to asses the level of cost recovery, and thus the amount of subsidy required, either through grants or cross subsidies from other products for their ongoing provision.

CITI NETWORK STRENGTHENING PROGRAM · THE SEEP NETWORK 3
Step 2. Identify Cost and Income Items for AllocationThe next step is to identify the cost and income items for allocation. In order to do this, the association will need to identify all costs associated with each of its individual products including direct costs and overhead costs. Direct costs
include all costs associated with the delivery of the product, including variable costs to the association—which are directly related to the delivery of services, such as venue rental, fees for external consultants or experts, travel cost, etc.—as well as fixed costs—which will not change regardless of output volume, such as the salary of a full time program manager. These differ from overhead costs that are essential for success-ful program management, but are not directly related to service provi-
sion. These include costs, such as rent, utilities, communications, and executive salaries that are shared among multiple products or services.
Ideally, associations should already track their costs and income by products. For those that do not, this exercise should help lay the foundation for the institutionalization of a cost-center approach to accounting from this point forward.
Below is an example of how one association organized its various products into five main product or program lines (training, confer-ence, advocacy, transparency, and social performance), in order to track direct costs. The example uses basic cost cat-egories characteristic of most associations. It is possible to use aggregate figures if more detailed data is not available. Given the lack of detail in many associations’ chart of accounts, it may be necessary to approximate based on what data is available.
Example 1. Identification of Direct Costs
Training Conference AdvocacyTransparency,
Research, Publications
Social Performance
COSTS
Direct 135,486.52 293,941.00 74,200.00 66,221.00 272,952.48
Salaries, wages, benefits 11,886.58 - 26,969.00 38,355.00 20,134.42
Staff development - - - - -
Training expenses 122,600.61 - - 5,837.00 226,903.39
Conference expenses - 290,023.00 - - -
Office expenses 35.51 2,301.00 45.00 3,385.00 2,487.49
Professional services 573.53 585.00 47,152.00 7,500.00 23,008.47
Travel 217.00 726.00 - 11,144.00 -
Depreciation - - - - -
Other 173.29 306.00 34.00 - 418.71
Total Costs 135,486.52 293,941.00 74,200.00 66,221.00 272,952.48
Direct costs include all costs directly related to product service delivery, for ex-ample, program manager salaries, program supplies, venue rentals, etc.
Overhead costs are central administration costs that are not directly related to a specific prod-uct or program activity, but are essential for successful program management, for example, key staff positions (managing director, finance manager), rent utilities, etc.

4 THE SEEP NETWORK · CITI NETWORK STRENGTHENING PROGRAM
Once this is done, the association can do the same for its key income streams. When assessing income streams, it is important to distinguish between earned income—member dues and user fees paid directly to the association for the provision of specific services—and contributed income—grants received from donors to support the provision of specific services, as well as the association as a whole. This will be useful when working on the association’s financing strategy. It is important to note that, in addition to coming directly from users of services, income may also come from govern-ments or donors paying for services on their behalf, for example, through conference sponsorships or training scholar-ships, and still be considered earned income.
While many associations work toward maximizing their earned income to lower their dependency on donor funding, most will end up with blended income streams, where a mix of fees for services and grants are needed to sustain the full functioning of the association.
Table 2. Example of Blended Income Streams
Income Types Description Example
Earned Income Member fees•Advertising revenue, sponsorship•Transaction fees•Licensing fees •Fees for intellectual property •Overhead charged to donors for •
project administration
Annual dues•Sale of advertising space in journals and newsletters•Training courses•Training of trainers certification•Sale of publications•Scholarships, conference sponsorship, peer exchange sponsorships•
Contributed Income
Grants•In-kind contributions•
Operating grants to support the association as a whole or direct sup-•port to specific product development and implementation
Staff time, equipment, conference space•
Regardless of whether the income is earned or contributed, it should be assigned to a respective product in the associa-tion’s tracking system. In the case below, the association has categorized direct income to include all earned and contrib-uted income generated from the association’s key products. For earned income, this would include training and confer-ence fees, as well as conference sponsorships. For contrib-uted income, this would include earmarked or restricted grants covering salaries and other related costs of project implementation of a specific product.
Direct income is all earned and contributed income gener-ated from the association’s products and services. It does not include grant income for overhead, membership fees, or investment income.

CITI NETWORK STRENGTHENING PROGRAM · THE SEEP NETWORK 5
Example 2. Identification of Direct Income
Training Conference AdvocacyTransparency,
Research, Publications
Social Performance
INCOME
Contributed Income: Grants
Direct 131,871.00 242,990.00 82,585.00 22,643.00 302,491.00
Donor A
Donor B - - 82,585.00 - -
Donor C - - - - -
Donor E 50,000.00 - - - -
Donor F - - - 22,643.00 -
Donor G 22,845.00 - - - -
Donor H 59,026.00 - - - -
Donor I - - - - -
Donor J - - - - 302,491.00
Donor K - - - - -
Donor L - 242,990.00 - - -
Total Contributed Income 131,871.00 242,990.00 82,585.00 22,643.00 302,491.00
Earned Income
Direct 34,825.23 128,384.00 - - 10,729.77
Membership fees - - - - -
Program fees 34,825.23 - - - 10,729.77
Conference fees - 128,384.00 - - -
Conference sponsorship fees
- - - - -
Other: interest, miscellaneous
- - - - -
Total Earned Income 34,825.23 128,384.00 - - 10,729.77
Total Income 166,696.23 371,374.00 82,585.00 22,643.00 313,220.77

6 THE SEEP NETWORK · CITI NETWORK STRENGTHENING PROGRAM
Step 3. Decide and Quantify Allocation Bases Once direct costs and income have been assigned to their specific products, overhead costs should be allocated across the association’s product lines, based on certain logical criteria that are known as allocation bases. Table 3 below describes the most common approaches to allocate overhead costs.
Table 3. Allocation Bases
Staff time estimates Assigns overhead costs in proportion to relative estimates of staff time.
May require the use of a time-keeping system to make accurate estimates.
Relative contribution to direct income
Assigns overhead costs in proportion to the product’s relative contribution to direct income.
Can overestimate costs of a product. Higher earning products do not necessarily consume more general overhead costs.
Relative consumption of direct costs
Assigns overhead costs in proportion to the prod-uct’s relative consumption of direct costs.
Assumes direct costs and general overhead costs are consumed in the same proportion.
1. Staff Time Estimates
The allocation method assigns overhead costs according to estimates of staff time. This may include salaries of the executive director, financial manager, and other positions that support the general administration of the association, but are not directly responsible for the delivery of products and services. These salaries are usually the largest category of overhead costs. Likewise, it may include the estimates of time that program managers dedicate to general administrative tasks. In the example below, salary costs of the advocacy, training, and transparency managers have already been fully assigned to products as direct costs; thus, only salaries of management (i.e., the executive director and finance manager) and the administrative staff need to be allocated. General administrative costs, such as rent and utilities, are then as-signed in the same proportion. Staff time estimates may be derived from a system of time keeping in which personnel are required to track their time by product with the use of timesheets.
Allocation Base Total Training Conference AdvocacyTransparency,
Research, Publications
Social Performance
1) Staff time 100% 30% 20% 20% 10% 20%
Costs
Overhead 178,417.00 53,525.10 35,683.40 35,683.40 17,841.70 35,683.40
2. Relative Contribution to Direct Income
This method uses an allocation based on the pro-rata distribution of costs, proportionate to the contribution of each product to direct income. Where training accounts for 25 percent of all income, it receives 25 percent of all overhead costs, and so on. While this is a straightforward method for allocating costs, it should be noted that higher earning products do not necessarily consume more costs. Therefore, this method may overestimate the share of administrative costs for certain products and underestimate on others.

CITI NETWORK STRENGTHENING PROGRAM · THE SEEP NETWORK 7
Allocation Base Total Training Conference AdvocacyTransparency,
Research, Publications
Social Performance
2) % Contribution to Direct Income 100% 17% 39% 9% 2% 33%
Costs
Overhead 178,417.00 31,093.41 69,271.43 15,404.37 4,223.54 58,424.26
3. Relative Consumption of Direct Costs
This method uses yet another allocation based on the pro-rata distribution of costs, proportionate to the use of direct costs by each product. Here we can see that “conferences,” the top earning product and highest recipient of administra-tive costs in allocation base 2 (above), in fact, is allocated a smaller portion of administrative costs, based on its relative cost structure.
Allocation Base Total Training Conference AdvocacyTransparency,
Research, Publications
Social Performance
3) % Contribution to Direct Costs 100% 16% 35% 9% 8% 32%
Costs
Overhead 178,417.00 28,681.86 62,225.92 15,707.79 14,018.67 57,782.75
As these examples illustrate, the choice of allocation method can make a considerable difference in the proportion of overhead costs allocated. Therefore, the key for the association is to understand the costs and revenues of its products and not to arrive at a “correct” answer. It is useful to compare different bases before choosing one to determine which calculation makes the most sense for its operations and on the availability of information. It is recommended that asso-ciations reevaluate their allocation methods on an annual basis to ensure their continued appropriateness. With experi-ence estimates may be adjusted to more accurately reflect known costs.

8 THE SEEP NETWORK · CITI NETWORK STRENGTHENING PROGRAM
Step 4: Calculate Full Product Cost and IncomeOnce an allocation method is selected and used to estimate the relative proportion of overhead costs for each product, the total product cost can be calculated. Full product cost is the sum of direct costs and overhead costs associated with each product. The figure below uses an allocation based on the relative contribution of the product to direct income illustrated in allocation base 2 (contribution to direct income). Applying full costs, there is a clear increase in the costs of service delivery, as each product now shares a portion of the association’s overhead, e.g. rent, utilities, communication, translation, director’s salary, accountant’s salary, etc.
Example 3. Full Product Costs Using Relative Contribution to Direct Income
Training Conference AdvocacyTransparency,
Research, Publications
Social Performance
COSTS
Direct 135,486.52 293,941.00 74,200.00 66,221.00 272,952.48
Salaries, wages, benefits 11,886.58 - 26,969.00 38,355.00 20,134.42
Staff development - - - - -
Training expenses 122,600.61 - - 5,837.00 226,903.39
Conference expenses - 290,023.00 - - -
Office expenses 35.51 2,301.00 45.00 3,385.00 2,487.49
Professional services 573.53 585.00 47,152.00 7,500.00 23,008.47
Travel 217.00 726.00 - 11,144.00 -
Depreciation - - - - -
Other 173.29 306.00 34.00 - 418.71
Indirect 31,093.41 69,271.43 15,404.37 4,223.54 58,424.26
Indirect 31,093.41 69,271.43 15,404.37 4,223.54 58,424.26
Total Expenses 166,579.93 363,212.43 89,604.37 70,444.54 331,376.74
After calculating total costs for each product, the same needs to be done for calculating total income. Total income is the sum of direct income and indirect income. Indirect income includes revenue not directly associated with any particular product, such as investment income, grants to cover general expenses, and membership dues. Some associations dis-tribute evenly across all service lines because overhead contributions and member dues are paid for the functioning of the association as a whole, in other words, for all of the products and service delivery, although others may argue that a weighted allocation basis for indirect income is more appropriate. As with overhead costs, the allocation base will be a management decision.
In the following example, the association has used an equal allocation bases for all unrestricted funds.

CITI NETWORK STRENGTHENING PROGRAM · THE SEEP NETWORK 9
Example 4. Total Income: Mixed Allocation Basis
Training Conference AdvocacyTransparency,
Research, Publications
Social Performance
INCOME
Contributed Income: Grants
Direct 131,871.00 242,990.00 82,585.00 22,643.00 302,491.00
Donor A - - - - -
Donor B - - 82,585.00 - -
Donor C - - - - -
Donor E 50,000.00 - - - -
Donor F - - - 22,643.00 -
Donor G 22,845.00 - - - -
Donor H 59,026.00 - - - -
Donor I - - - - -
Donor J - - - - 302,491.00
Donor K - - - - -
Donor L - 242,990.00 - - -
Indirect 16,038.60 16,038.60 16,038.60 16,038.60 16,038.60
Indirect 16,038.60 16,038.60 16,038.60 16,038.60 16,038.60
Total Contributed Income 147,909.60 259,028.60 98,623.60 38,681.60 318,529.60
Earned Income
Direct 34,825.23 128,384.00 - - 10,729.77
Membership fees - - - - -
Program fees 34,825.23 - - - 10,729.77
Conference fees - 128,384.00 - - -
Conference sponsorship fees
- - - - -
Other: interest, miscellaneous
- - - - -
Indirect 16,813.00 16,813.00 16,813.00 16,813.00 16,813.00
Indirect 16,813.00 16,813.00 16,813.00 16,813.00 16,813.00
Total Earned Income 51,638.23 145,197.00 16,813.00 16,813.00 27,542.77
Total Income 199,547.83 404,225.60 115,436.60 55,494.60 346,072.37

10 THE SEEP NETWORK · CITI NETWORK STRENGTHENING PROGRAM
Step 5: Analyze Product PerformanceOnce full product costs and income are accounted for, an association can begin to analyze individual product perfor-mance. There are several methods of analysis that can inform an association’s pricing policies and service delivery processes, as well as overall financial sustainability strategies.
Cost Analysis
Cost analysis is a useful first step in analyzing product performance. Costs are often the most significant barrier to achieving viability of a particular product. Understanding the most important contributors to product cost and how these costs have behaved over time allows managers to make more informed decisions about designing and delivering prod-ucts. When undertaking a cost analyses, there are a number of questions to keep in mind:
What is the relative importance of overhead costs?•Which products are the most costly to deliver?•What is the cost breakdown of products in terms of direct and overhead costs?•What have been the trends in costs over time?•Are there opportunities to reduce costs?•
An analysis of the historical cost structure of this associa-tion shows a significant growth in direct costs since its inception in 2006. This is to be expected from a young as-sociation as it grows and defines its products and services. As the association matures and introduces new product lines, one can expect to see a steady increase in the cor-responding costs associated with service delivery. It is im-portant for an association to keep an eye on the growth of overhead costs to ensure these stay within acceptable limits and do not impede the potential profitability of individual products. In this case, the association’s overhead costs grew considerably more, relative to direct costs, from 2006 to 2009—something to keep an eye on.
1,200,000
1,000,000
800,000
600,000
400,000
200,000
02006 2007 20092008
Overhead Costs
Direct Costs
Figure 1. Trends in Overhead Costs
Cost AnalysisTrends in overhead costs•Cost structure by product•Trends in direct costs by product•Cost determinants•
Income AnalysisTrends in earned income•Income structure by product•Product contribution to net income•Product contribution to total earned •
incomeTrends in earned income by product•
Product Viability AnalysisProduct cost recovery•Unit performance•Unit cost•
Box 2. Examples of Product Performance Analysis

CITI NETWORK STRENGTHENING PROGRAM · THE SEEP NETWORK 11
An analysis of the relative importance of direct and overhead costs by product allows managers to better understand the impacts of overhead costs on individual product costs. It may also help in assess-ing the appropriateness of certain cost allocation methods in the case that a particular product may not be sharing a reasonable proportion of the overhead burden. In the example above, “Transparency” bears a much smaller portion of overhead costs, relative to the other product lines, which is consistent with its relative contribution to earned income. If, however, this service line contributes to a large portion of the association’s overhead, in spite of its limited revenue potential, the allocation basis should be changed to more accurately apportion cost sharing.
An analysis of the historical trends in direct costs illustrates the relative contribution of individual products to direct costs. In figure 3, “Training and Capacity Building” accounted for the vast majority of direct costs for the associa-tion at its inception. However, as new products were introduced and the role of training dimin-ished, there has been a more even distribution of direct costs, with “Conferences” and “Social Per-formance Monitoring) consuming the majority of the association’s resources by 2009.
Minimizing Costs
One important aspect of cost analysis is to identify key factors that affect the costs of a particular product. Some ex-amples of the key factors that are typical for association product lines have been identified below. Associations should try to minimize costs wherever possible and use effective and efficient models for service delivery that can leverage the resource base and comparative advantage of the association.
100%
80%
60%
40%
20%
0%
Direct Costs Overhead Costs
Training
25%
75%
Conference
26%
74%
Advocacy
23%
77%
Transparency, Research,Publications
9%
91%
SocialPerformance
24%
76%
Figure 2. Cost Structure by Product
100%
80%
60%
40%
20%
0%
Social PerformanceMonitoring
2006 2007 2008 2009
Transparency, Research, and Publications
Advocacy
Conference
Training andCapacity Building
Figure 3. Trends in Direct Costs by Product

12 THE SEEP NETWORK · CITI NETWORK STRENGTHENING PROGRAM
Table 4. Cost Determinants
Product/Service Factors Affecting Costs Opportunities for Cost Control
1. Training: Courses for MFIs, regula-tors, and training of trainers (TOT); so-cial audits; e-learning; peer exchanges
Use of external trainers and their rates•Location and venue for events—hotel, venue •
rental, meal/coffee break costsNumber of events•Number of participants•Demand for translation services•Additional equipment/materials needed•Countries visited•Number of visits made•Number of participants•
Establish a minimum number of •participants per training unit or course to be sustainable
Balance quality of trainer and rate•Use association staff •Manage trainer travel costs•
2. Conferences Country/venue of event•Use of consultants, use of event management •
company, honorariums, etc.Printing: quantity and quality•Interpreters for conference, translation of •
materials
Manage number of “tracks” on agen-•da requiring multiple interpreters
Watch number of meals/coffee •breaks offered
3. Transparency, Research, Publi-cations: MIX Market participation, development and tracking of social indicators, regional MFI industry sur-vey, quarterly reports, newsletter, case studies
Quality and timeliness of raw data•Responsiveness of MFIs•Number of publications created and translated •Use of external consultants•Local and/or regional travel required•
Establish pay grades for staff•Use existing sources versus associa-•
tion collecting its own data
4. Advocacy: Document review, translation, maintenance of database/library (e.g., legal documents)
Number of publications translated• Keep computerized library•Cooperate with other companies to •
avoid duplication of translation, etc.
5. Social Performance Initiatives: Consumer protection, code of ethics, financial education
Number of events•Number of participants•Venue•Use of external experts•
Manage travel costs •Use association staff•
Income Analysis
Income analysis is an important element of product performance analysis. It provides useful information to managers concerning the relative importance of individual products, the impact of earned income, and trends in income generation overtime. Some of the most important questions to consider are:
What are the key income-earning products and services for the association?•Which products generate the most income from fees?•Which products are most dependent on donor funding?•Which products are the main income generators for the •association in terms of earned income?Is there room to expand on certain products?•
An analysis of the association’s income stream over the first four years of its operations shows a steady increase in both earned and contributed income. Earned income has slowly started to account for a larger portion of the association’s total income growing from 18% of all income in 2006 to 31% in
%
Contributed Income Earned Income
2006 2007 2008 2009
82%
18%
71%
29%
68%
32%
69%
31%
Figure 4. Trends in Earned Income

CITI NETWORK STRENGTHENING PROGRAM · THE SEEP NETWORK 13
2009, reflecting a growing independence from donor funding. Ideally, an association should strive to earn the bulk of key services from earned income, to ensure that its programming can be maintained in spite of changes in donor funding priorities.
Analyzing the importance of earned income relative to the total income generated for each individual product provides useful information to managers about members’ willingness or ability to pay for these services through fees and dues. In figure 5, it is apparent that the associa-tion has yet to find a clear market among its members for social performance monitoring, advocacy or its transparency initiatives, which at present are donor-sponsored initia-tives. While these activities may add clear value to the sector in terms of their development impact, if the association does not develop a strategy for to ensure greater cost recovery, either through member fees or ongoing donor support, it will be unable to ensure the sustainability of these products.
In terms of individual product contribution to total earned income for the association, it is obvious that conferences are the biggest contributor, account-ing for (61 percent) of all earned income, followed by trainings (19 percent); these two elements are the biggest revenue earners for the association at this point.
If contributed income is taken into account, as well as earned income from fees, dues, and other service charges, it is easy to see which of the associa-tion’s products are net income earners and which ones are net income losers, even with donor funding. In figure 7, the association is actually subsidizing the costs of its transparency-research-publications activities with income derived from its other products.
Looking at trends over time is a useful way to detect changes in the performance of individual products. The relative increase in conferences as the primary income earner for the association has occurred gradually over time. And, while it is positive to have a product with such high demand, the associa-tion should explore why the other products have decreased in their contribution to earned income and whether other products should be developed to add value to both members and the association.
Figure 6. Product Contribution to Total Earned Income
Transparency,Research,
Publications2%
Advocacy3%
Conference61%
Training19%
SocialPerformance
15%
Figure 7. Product Contribution to Net Income
Transparency,Research,
Publications-44%
Advocacy7%
Conference72%
Training29%
SocialPerformance
36%
100%
80%
60%
40%
20%
0%
Social Performance
2006 2007 2008 2009
Transparency, Research, Publications
Advocacy
Conference
Training
Figure 8. Trends in Earned Income by Product
%
Contributed Income Earned Income
Training
73%
27%
Conference
62%
38%
Advocacy
90%
10%
SocialPerformance
87%
13%
Transparency,Research,
Publications
90%
10%
Figure 5. Income Structure by Product

14 THE SEEP NETWORK · CITI NETWORK STRENGTHENING PROGRAM
Product Viability Analysis
While it is understood that a certain level of subsidy may be needed to help associations carry out certain functions, there is a basic assumption that key member services should be provided on a cost-recovery basis and have the potential, at least in the long run, to generate some measure of surplus for the association. While the timeline for full cost recovery for certain products may be different in different markets, based on the level of development and existence of other service providers, associations should be working toward this goal. There are several important questions to consider:
Does the association have a pricing policy in place, •including the use of subsidies for certain products?Is it clear where the responsibility for pricing deci-•sions lies?Is the pricing policy implemented consistently across •the organization? Are the products and services segmented to take into •account different consumer groups and their willing-ness to pay?Are there cost or sales objectives in place to guide •current pricing policies ( i.e., cost-plus, competitive, or value-driven pricing mechanisms)?What is the market price of comparable services?•Are subsidies needed for any of the products? Is there a strategy in place to raise these subsidies?•Are income-earning opportunities currently being optimized?•Are the fees generated from these products covering the full cost of service delivery?•If not, is there room to increase fees or dues, or create classes of members with different fee structures and benefits, •for example, membership grades, sliding fee scales, etc., to achieve higher levels of financial sustainability. Is it pos-sible to negotiate service arrangements with strategic partners to ensure cost recovery on key public goods impor-tant for the further development of the sector?
One of the most basic and essen-tial types of analysis is measuring the level of cost recovery of indi-vidual products—how much the cost of service delivery (direct and overhead costs) is being covered from earned income. In figure 9, conferences earn the greatest income for the association, but it still only covers 44 percent of its total costs. The same goes for training, which achieves only 30 percent cost recovery. For every product, there is likely an oppor-tunity to increase earned income through pricing adjustments and service improvements that increase use.
Cost plus pricing is a method of pricing where the base per-unit cost of a product is calculated, taking into ac-count all direct and overhead costs, with a percentage added on top for a profit margin.
Competitive pricing is where prices are set based on the price of comparable competitive products in the market.
Value-driven pricing is when prices are set based on the perceived value to the customer, rather than on the actual cost of the product, the market price, or competitor prices.
400,000
350,000
300,000
250,000
200,000
150,000
100,000
50,000
0
50%
40%
30%
20%
0%Training Conference Advocacy Transparency,
Research,Publications
SocialPerformance
Earned Income Total Cost
12%3%8%
44%
30%
Cost Recovery
Figure 9. Product Cost Recovery

CITI NETWORK STRENGTHENING PROGRAM · THE SEEP NETWORK 15
Establishing Unit Costs
Establishing unit costs is a necessary step to assess an association’s pricing policy. Total cost can be misleading as it provides little insight into actual cost recovery of services. By looking at costs per individual units, managers can more adequately assess fee structures for individual users of service as well as the need for subsidies. Different products will have different units of measure. Associations need to determine the most appropriate unit of measure for their particular product and market. The example includes some common measures.
When we look at each product in terms of unit cost, it becomes clear that there is considerable room for the association to adjust its current pricing to improve its cost recovery. Currently none of the association’s products are set at full cost recovery and two of the most expensive products per unit are provided at no additional cost to members.
Ideally, members should demonstrate their demand for products and services through a willingness to pay fees, which ought to be one of the key income streams for the association. It may be that fees are not enough to cover the costs of all these services, yet the association continues to provide them because of their value to its members. In this instance, it is important for associations to know exactly how much of their costs are being covered and how much subsidy will be needed to continue to provide these services.
Exactly what balance the association strikes between market-oriented and more industry-supportive products and services will greatly depend on the state of the industry and level of maturity
of the association’s members. However, understanding what products can be financially sustainable and which will need continued subsidy will be crucial in this decision making process.
Table 6. Unit Performance
Per Unit Analysis
Training Conference AdvocacyTransparency,
Research, PublicationsSocial Performance
Units 180 460 150 64 54
Unit cost 925.44 789.59 597.36 1,100.70 6,134.61
Current price 194.00 350.00 - - 194.00
Cost recovery (731.44) (439.59) (597.36) (1,100.70) (5,942.61)
Table 5. Unit Costs
Product Unit of Measure
Training No. of paid participants
Conference No. of paid participants
Advocacy No. of members
Transparency, Research, Publications
No. of publications
Social Performance Monitoring
No. of members participating
7,000
6,000
5,000
4,000
3,000
2,000
1,000
0Training Conference Advocacy Transparency, Research,
PublicationsSocial
Performance
Subsidy Current Price Unit Cost
Figure 10. Unit Performance

16 THE SEEP NETWORK · CITI NETWORK STRENGTHENING PROGRAM
Assess Pricing Policy
The last step in income analysis is to evaluate the association’s current pricing policy in relation to the unit cost calcu-lated. Given the public goods nature of many association products, the objective of this exercise will not necessarily be profit maximization, but rather cost contribution, particularly when it comes to member services.
Many associations set their fees at rates meant to ensure the greatest degree of participation by its members or to reflect the market situation—competitors’ pricing, for example, which is often at price points far below cost recovery. Although increasing access to services for its members is an important objective, this policy should be balanced with the larger goal of cost recovery to ensure the long-term viability of the association. Therefore, a pricing structure that takes into account the full cost of service delivery, industry averages, and perceived value of products among different user groups, as well as its own cost recovery goals, should be used. A more value-driven approach that segments the market into different customer groups—e.g., member MFIs, non-member MFIs, donors, investors, etc.—will increase sales oppor-tunities by identifying variations in ability and willingness to pay. By understanding the value of its products to different customer groups, associations can set different prices for different market segments, thereby increasing revenue from fees and reducing reliance on donor grants for core member services.
ConclusionProduct costing is a crucial exercise for associations, as they try to better understand their product offerings and how they position themselves in the market. By helping identify key service lines, managers can begin looking at their as-sociation’s unique products and allocating all associated costs (direct and overhead) to better understand the financial viability of the current pricing structure. Through an analysis of product costs and sales, associations can begin to think about which products contribute the most to their bottom line and where additional subsidies may be needed to sup-port services that may not be financially viable at least in the short term, but are still a priority for the association and its members. Finally, by better understanding the dynamics behind expense and revenue streams, associations will be better placed to develop financial projections that will form the basis of their financial sustainability strategy.

CITI NETWORK STRENGTHENING PROGRAM · THE SEEP NETWORK 17
Glossary of Costing Terms3
Activity-based costing (ABC)Costing method that traces costs through significant activities to products or other cost objects.
Allocation basisThe method used to assign overhead costs to individual products.
Contributed incomeAll revenue from grants, in-kind contributions, donation, etc.
Cost accountingManagerial accounting activity designed to help managers identify, measure, and control costs.
Cost determinantEvent or action that triggers an activity and allows for calculation of a unit cost.
Direct costsCosts that can be identified specifically with, or directly traced to, a specific product or service.
Direct incomeEarned and contributed income generated from the association’s main products and services, i.e., fees, sponsorships, advertising.
Earned incomeAll revenue derived from fees paid for membership services, sponsorship, foreign exchange gains/losses, interest, etc. Includes direct revenue generated by products and services.
Fixed costsCosts that remain constant, regardless of activity or output levels.
Full product costsSum of direct costs and overhead costs allocated to each product.
Indirect incomeRevenue derived from sources not directly attributable to a single service, such as interest in-come, foreign exchange gains/losses, grants to cover core expenses.
3. Adapted from Helms and Grace, Microfinance Costing Tool for MFIs.

18 THE SEEP NETWORK · CITI NETWORK STRENGTHENING PROGRAM
Net incomeNet income is equal to an organization’s income after subtracting all direct and overhead costs from the total revenue.
Overhead costsCentral administration costs that are essential for successful program management, e.g., ex-ecutive salaries, rent, utilities, etc., and shared among cost objects.
ProcessesSeveral activities directed toward a common outcome or objective.
Total incomeAll earned and contributed income generated by the association.
Total operating costsDirect costs and overhead costs.
Total product incomeSum of direct revenue earned from a product and indirect revenue.
Unit costCost per unit produced or per transaction.
Unrestricted net assetsAll unrestricted net assets calculated by averaging the opening and closing balances for the period.
Variable costsCosts that change in proportion to levels of activity or output.


About SEEP
The SEEP Network is a global network of microenterprise development practitioners. Its 80+ institutional members are active in 180 countries and reach over 35 million microentrepreneurs and their families. SEEP’s mission is to connect these practitioners in a global learning environment so that they may reduce poverty through the power of enterprise. For 25 years, SEEP has engaged with practitioners from all over the globe to discuss challenges and innovative approaches to microenterprise development. As a member-driven organization, our members drive our agenda while SEEP provides the neutral platform to share their experiences and engage in new learning on innovative practices. The SEEP Network helps strengthen our members collective global efforts to improve the lives of the world’s most vulnerable people.

The SEEP Network 1875 Connecticut Avenue, NW, Suite 414
Washington, DC USA 20009-5721Phone: 1 202 534 1400
Fax: 1 202 534 1433Email: [email protected]
Website: www.seepnetwork.org