product data: order analysis type 7702 (bp1634) · product data order analysis type 7702 for pulse,...
TRANSCRIPT

PRODUCT DATAN
Order Analysis Type 7702for PULSE, the Multi-analyzer SystemOrder Analysis Type 7702 provides PULSE™ with Tachometers,Autotrackers, Order Analyzers and related post-processingfunctions, as well as additional trigger types. The softwareincludes PULSE Application Projects that cover the main uses ofType 7702. The system can be easily customised for othermeasurement tasks.
ON-S
Uses and FeaturesUses• Separation of rotational and structural noise and
vibration phenomena• Identification of noise generated by rotational vibrations• Determination of critical speeds and resonances• Investigation of instabilities in rotating machinery
Features • Order analysis with high-speed tracking• Run-up/down testing with or without tracking• Tachometers based on tacho pulses and/or a voltage
proportional to the RPM
• Autotrackers to extract the fundamental frequency from the measured signals, instead of using a dedicated tacho signal
• Tacho, speed and speed interval triggers• Order analyzers with individual tracking references• Run-up and coast-down in a single test session• Synchronous averaging through tacho gearing• Simultaneous noise and vibration analysis• Slice mode for data reduction, rapid processing and fast
display of slices during measurement• Real-time calculation of average RPM• Interpolation of slices to “round” values allowing averaging
of slices• RPM scaling to velocity
ELLABLE

N
IntroductionOrder analysis is a technique for analysing imperfections in the moving parts of rotating and reciprocatingmachinery that cause unwanted noise and vibration. Engineers’ or scientists’ knowledge about machinerysuch as aircraft and automotive engines, power trains, pumps, compressors and electric motors is greatlyimproved by performing order analysis. This is because it allows measurements to be related to therevolutions of a rotating part.
Order Analysis Type 7702 provides three instruments, namely, an Order Analyzer, a Tachometer and anAutotracker, plus related post-processing functions and a wide range of display facilities. There are alsothree additional trigger types: tacho, speed and speed interval. These supplement the tools available in FFT& CPB Analysis Type 7700 to provide a complete diagnostic toolbox for both order tracking and generalnoise and vibration measurements. Type 7702 can also be used with FFT Analysis Type 7770.
A number of PULSE Application Projects can be found in the PULSE Knowledge Library. These cover themain uses of Order Analysis Type 7702 and allow you to perform order analyses quickly and easily. You canalso easily customise projects for other measurement tasks. The predefined PULSE Projects supplied canbe used for the following applications:• Run-up/down Acoustic Performance Test – projects for performing, for example, cabin noise or
exhaust noise tests using octave analysis and orders versus engine RPM• Run-up/down Vibration Diagnostics – a number of projects for the determination of critical speeds,
resonances and instabilities from measurements performed with and without tracking
Measurement
Order Analysis Type 7702 is for analysing data acquired during a change in the rotational speed of a shaft.Noise and vibration can be measured simultaneously and any instrument available in Type 7700, 7770 or7771 can be used in parallel with Order Analyzers, Tachometers and Autotrackers.
Type 7702 features frequency spectra or order spectra, frequency band profiles and order profiles asfunctions of RPM. The spectra can be displayed as waterfalls or colour contours. The frequency bands andorder profiles can be “cut out” from the colour contour spectra and are therefore referred to as “slices”.Because they are defined on inspection of the spectra as a function of RPM, the slices are called post-slices.
If the frequency bands or orders of interest are known prior to the measurement, the analyzer can extractthese slices during the measurement (pre-slices). Omitting the spectrum calculations reduces the demandfor processing power and dramatically reduces the storage space required for the results.
Recording data for later analysis can overcome excessive real-time demands.
Order analysis can be made with or without tracking:• without tracking, good for analysis of lower orders and moderate RPM slew rates• with tracking, for the analysis of higher orders or higher RPM slew rates
To obtain the fundamental frequency for the Order Analysis a Tachometer or an Autotracker is used.
Order Analysis with TrackingAn Order Analyzer and a Tachometer (or an Autotracker) are used to measure order spectra. Thetachometer provides a tracking reference in cases where there is a dedicated tacho signal. The Autotrackerprovides the tracking reference in cases where there is no tacho signal directly available. In this case, thefundamental frequency can be extracted indirectly from the measured vibration or acoustic signal*. The orderanalyzer, which consists of a tracking mechanism followed by an FFT analyzer, tracks the data and thenperforms an FFT on it to provide an order spectrum.
* The indirect (Autotracker) method is recommended in situations where direct access to rotating parts (for example, an encapsulated hot engine) is not possible or the tacho signal is of poor quality. It can be used very easily where the fundamental frequency and/or harmonic components are prominent. It should be noted, however, that if a well conditioned tacho signal can be obtained from the tachometer, this is still the preferred (and most accurate) method.
ON-SELLABLE
2
N
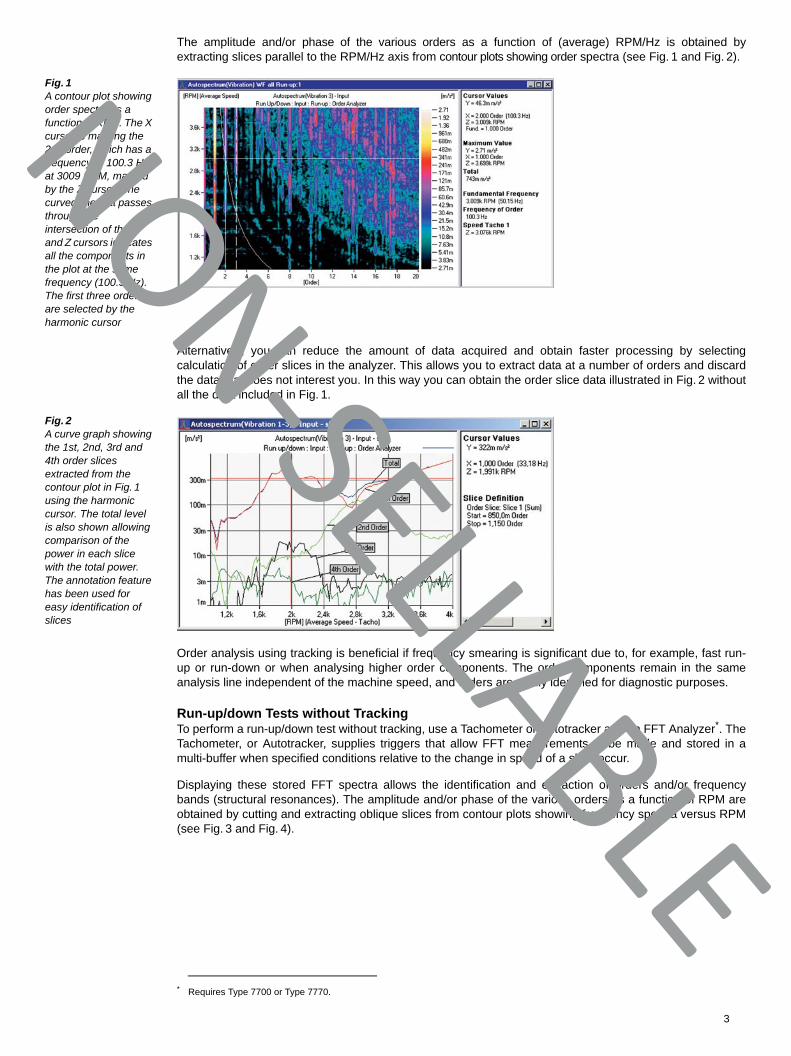
The amplitude and/or phase of the various orders as a function of (average) RPM/Hz is obtained byextracting slices parallel to the RPM/Hz axis from contour plots showing order spectra (see Fig. 1 and Fig. 2).
Fig. 1 A contour plot showing order spectra as a function of RPM. The X cursor is marking the 2nd order, which has a frequency of 100.3 Hz at 3009 RPM, marked by the Z cursor. The curved line that passes through the intersection of the X and Z cursors indicates all the components in the plot at the same frequency (100.3 Hz). The first three orders are selected by the harmonic cursor
Alternatively, you can reduce the amount of data acquired and obtain faster processing by selectingcalculation of order slices in the analyzer. This allows you to extract data at a number of orders and discardthe data that does not interest you. In this way you can obtain the order slice data illustrated in Fig. 2 withoutall the data included in Fig. 1.
Fig. 2 A curve graph showing the 1st, 2nd, 3rd and 4th order slices extracted from the contour plot in Fig. 1 using the harmonic cursor. The total level is also shown allowing comparison of the power in each slice with the total power. The annotation feature has been used for easy identification of slices
Order analysis using tracking is beneficial if frequency smearing is significant due to, for example, fast run-up or run-down or when analysing higher order components. The order components remain in the sameanalysis line independent of the machine speed, and orders are easily identified for diagnostic purposes.
Run-up/down Tests without TrackingTo perform a run-up/down test without tracking, use a Tachometer or Autotracker and an FFT Analyzer*. TheTachometer, or Autotracker, supplies triggers that allow FFT measurements to be made and stored in amulti-buffer when specified conditions relative to the change in speed of a shaft occur.
Displaying these stored FFT spectra allows the identification and extraction of orders and/or frequencybands (structural resonances). The amplitude and/or phase of the various orders as a function of RPM areobtained by cutting and extracting oblique slices from contour plots showing frequency spectra versus RPM(see Fig. 3 and Fig. 4).
* Requires Type 7700 or Type 7770.
ON-SELLABLE
3

N
Alternatively, you can reduce the amount of data acquired and obtain faster processing by selectingcalculation of slices in the analyzer. This allows you to extract data at a number of specified order and/orfrequency bands and discard the data that does not interest you. In this way you can obtain the slice dataillustrated in Fig. 4 without all the data included in Fig. 3.
Fig. 3 A colour contour plot of a run-up test performed without tracking. The line passing through the intersection of the X and Z cursors identifies the 6th order. The harmonic cursor marks the first ten orders for the extraction of order slices by making oblique cuts in the contour plot of frequency spectra versus RPM
Run-up/down tests without tracking are useful where frequency smearing is insignificant. This can, forexample, be the case when analysing lower order components. One of the main benefits of this method isthe real-time enhancement. A further advantage is that it shows structural resonances at fixed frequenciesparallel to the RPM axis.
Fig. 4 A waterfall showing the harmonic order slices extracted from the contour plot in Fig. 3. The 1st and the 6th orders are annotated. The slice definition indicates the method and bandwidth used to extract the selected (order) slice
Inputs and TachometerInput signals can be preprocessed by applying, for example, an acoustic weighting or integration/differentiation for conversion between acceleration, velocity and displacement. The same input signal can beconnected to a number of different types of instrument, for example, order and CPB analyzers, a tachometer,etc. Auxiliary signals may also be connected to a tachometer just as they are connected to an auxiliarylogger. Each tacho signal connected to a tachometer can be individually processed, conditioned and used asa tracking reference. This allows order tracking using multiple tracking references. Using a voltage signalconnected to the tachometer, the sensitivity of the auxiliary signal is set to account for the sensitivity(V⁄RMS) of the voltage signal and for possible gearing.
Using a pulse signal, there is a comprehensive set of parameters, including slope, level, hysteresis and hold-off, which can be set to ensure correct identification of tacho pulses in a contaminated tacho signal and adivider parameter allows the removal of unevenly spaced tacho pulses (see Fig. 5).
For removal of jitter from a low-quality tacho signal, you can apply an averager. This provides a runningaverage for the distance between tacho pulses. If the shaft under analysis in a machine is not the onesupplying the tacho pulses, a tacho gearing can be defined as either a single factor, a ratio containing up to4 fractions, or the product of these two methods.
Monitoring of the tacho signals before measuring allows you to adjust the tacho parameters to suit themeasurement. During measurements, the program gives assistance in the form of warning messages, forexample, “Acceleration too high”, indicating when the measured data are not reliable.
ON-SELLABLE
4

N
Fig. 5 Hardware setup, input level meter, tacho signal monitor and the settings for the tacho signal processing
Fig. 6 A measurement template in the Measurement Organiser and the setup for an Order analyzer. The Slice Setup tab shows how to define “pre-slices”. (Note: The Setup tab page and the Slice Setup tab page cannot be displayed at the same time)
AutotrackerTo be able to use Autotracker on a measured signal you have to make sure the RPM you are looking for ispresent in the signal. The RPM should manifest itself in the form of a corresponding frequency (1stHarmonic/Order), together with (possibly) other orders. Prior knowledge in recognising these orders withinthe measured signal is an advantage, because this means you can insert the appropriate values intoAutotracker straight away. (If you are not sure, use an FFT analyzer and contour plot to find thecorresponding order(s)). Once you have established what the orders are, enter the appropriate values forSpeed Range, Max. Acceleration and Dominant Orders into Autotracker using the Primary Settings panel onthe Autotracker Property page, see Fig. 7.
Autotracker generates default values for the Secondary Settings, but in the case of a ‘difficult’ signal, youmay adjust the values in the Secondary Settings panel.
Start the Autotracker running and it will then extract RPM directly from the signal – eliminating the need touse a tacho signal/probe.
Note: Autotracker will only work if the RPM you are looking for is actually present in the measured signal. Ifit is not present, Autotracker will run, but will be unable to extract an RPM!
ON-SELLABLE
5

N
The Autotracker algorithm establishes a model of the signal and by using Bayesian statistics, it correlatesthe model with the signal and estimates the RPM profile.
Autotracker has a lot of advantages over the tachometer method:• No need for direct access to the rotating parts• No need for tacho probes and tacho channels• Ease-of-use (no mounting of tacho probes)• Reduced safety requirements
Fig. 7 shows a typical Autotracker display, where Autotracking was performed using a microphone located inthe left ear of a Brüel & Kjær Head and Torso Simulator (see contour plot). The result was compared to theoutput from a Tachometer using a tacho probe mounted on the engine (see RPM plot, bottom right). Inaddition, the Measurement Organiser and the property page for setting up the parameters for theAutotracker are shown.
Fig. 7 RPM profiles obtained from Autotracker (blue curve) and the Tachometer (red curve – mostly concealed by the blue curve) for a 72 s car engine run-up/down measurement from 1.2 k RPM to 6 k RPM
The output from the Autotracker can be used as a tracking reference (for order analysis with tracking), as aspeed trigger or as a speed interval trigger (for run-up/down tests without tracking).
Measurement ControlThe Tachometer and Autotracker can supply two types of trigger output for use in measurement control. These are:• Speed Trigger• Speed Interval Trigger
A Speed Trigger operates by using the calculated RPM of the shaft. A trigger event occurs when thecalculated RPM passes through a specified RPM, going up, down or in both directions.
A Speed Interval Trigger measures the change in RPM of a shaft and generates a trigger event when thespeed changes by a predefined value in the specified direction. The direction can be set as up, down or both.
In addition, the Tachometer (only) can supply a Tacho Trigger that can also be used for measurementcontrol. A tacho trigger event occurs each time a tacho pulse that conforms to the specified conditions isdetected at the Tachometer output for the chosen trigger signal.
These three trigger types can, for example, each be used for triggering measurements or starting, updatingor stopping storage to multi-buffers. The start, update and stop conditions for the multi-buffers can be set upindividually, as can the number of time signals, spectra and slices to store, meaning that a run-up and coastdown measurement can be performed in a single test session.
ON-SELLABLE
6

N
Post-processingA wide range of functions are available for post-processing tracked and non-tracked data. All functions thatare available for the FFT analyzer, supplied as part of FFT & CPB Analysis Type 7700 and FFT AnalysisType 7770, are also available for the order analyzer. A function for calculating rotational speed of a shaft canbe applied to tachometer and Autotracker outputs.
In addition, time data recorded simultaneously with a measurement, or PULSE ASCII files exported fromPULSE LabShop’s Function Organiser can be imported for post-processing in PULSE Reflex™, which addsdedicated post-processing applications to the PULSE software environment and provides data import, datamanagement, data display and integrated reporting tools for communicating processed data. For moreinformation see Software for PULSE Reflex (BP2258).
Display
Data can be viewed in a variety of 2 D graphs and a sequence of measured time signals or spectra can beshown in waterfall or contour plots, including Campbell diagrams.
Fig. 8 A waterfall showing the results of a run-up test using tracking.
In Fig. 8, it can be seen that order and non-order components are present. The cursor readings indicate thatthe maximum measured value is 2.71 m/s2 for the 1st order at 3699 RPM. The speed tag reading gives thespeed at the moment the spectrum was stored. The fundamental frequency and the average speed valuesgive the average speed (and frequency) during measurement of the selected spectrum
If speed values are stored in the multi-buffer, the RPM/Hz values or averaged RPM/Hz values can be used as the Z-axis annotation for displays showing noise and vibration data. RPM/Hz values are taken at the time the data arestored in the multi-buffer. Averaged values are averaged over the duration of measurement of each spectrum, givingbetter RPM and order alignment for run-up/down measurements.
The RPM/Hz values can also be shown as RPM/Hz versus time profiles or RPM/Hz values for different tachoor Autotracker signals can be compared using a multi-value display.
If the measurement setup also includes an Overall Level Analyzer for which slice data have been saved in amulti-buffer, these values can also be used as the Z-axis annotation.
CursorsA number of different types of cursor can be used to extract information from displays, and points of interest,such as resonances, can be annotated.
In addition to the cursor types in Type 7700, 7770 and 7771, a set of order cursors is available for use onnon-tracked data and includes harmonic and sideband cursor types. For tracked data, it is possible toidentify fixed frequency components by using the fixed frequency indicator.
The fundamental frequency for a tracked record and the actual frequency of a selected order, as well as anyof the values available for Z-axis annotation, can be shown as cursor readings.
ON-SELLABLE
7

N
SlicesIn a colour contour or waterfall plot, individual or harmonic orders can be extracted and viewed in a 2 Dgraph. These order slices show the amplitude and/or phase of the orders as a function of, for example, RPMor time.
Slices can be extracted from tracked and non-tracked data using the cursors. For non-tracked data, if theZ-axis is rotational speed and annotated in RPM or Hz, an order slice is made by cutting across the spectraat an oblique angle with a user-definable width of cut. Thus, an order analysis is obtained using post-processing, i.e., without using an order analyzer.
Slices made as analyzer calculations are specified before measurement starts and extracted duringmeasurement. They can be used as functions in the Function Organiser (slices extracted from a contour orwaterfall plot are sub-functions) and collected in groups, simplifying data import and export and comparisonof results.
Applications
Fig. 9 Typical Order Analysis applications are found within a wide range of industries
ON-SELLABLE
8
N
Specifications – Order Analysis Type 7702Type 7702 is software for use with PULSE Type 3560
Requirements• The PC requirements for PULSE must be fulfilled (see BU0229)• FFT & CPB Analysis Type 7700 or FFT Analysis Type 7770 must be
installed
Application ProjectsType 7702 includes a number of application projects for:• Run-up/down Acoustic Performance Test• Run-up/down Vibration DiagnosticsThe projects can be found in the PULSE Knowledge Library
MeasurementType 7702 includes:• Order Analyzer• Tachometer• AutotrackerTachometer, Autotracker and Order Analyzer specifications are given below
Measurement ControlThe following additional trigger types are available with Type 7702:• Tacho Trigger (Tachometer only)• Speed Trigger• Speed Interval Trigger
DisplaySpecifications are the same as for FFT & CPB Analysis Type 7700 (see System Data BU 0229) with the following additions:
CURSORS• Order indicator for non-tracked data• Fixed frequency indicator for tracked data
CURSOR READINGS• Fundamental frequency for a record• Actual frequency of a selected order• Speed• Average speed from one or more tachometer channels (limited by the
channel count of Type 7702)
SLICESOrder slices from non-tracked data
Specifications – Tachometer
A number of variants of the tachometer output can be used simultaneouslyThe outputs of a tachometer are used:• As tracking references• As tacho triggers• As speed triggers• As speed interval triggers• For displaying rotational speed• For updating the multi-buffers
PerformanceThe precision of determination of the time period between tacho events is governed by the rise/fall time of the tacho signal. For pulses (short rise/fall time), the precision is better than 5 ppm. For a sine wave tacho signal, the precision ranges from 50 ppm for low frequencies to 5 ppm for high frequenciesUsing an auxiliary signal, the tachometer generates one ‘tacho pulse’ per revolution of the referenced shaft. Since the sampling frequency of the aux. signal is 10 Hz, speeds > 600 RPM will be measured as the average of speed (RPM)/600 revolutions (RPM)
MeasurementAny input signal can be used as a tachometer input
PARAMETERSThe following parameters can be set for each tachometer signal:• Reference Level: user-defined level that can be used instead of Max.
Input Level for setting Level and Hysteresis• Level: can be set with 1% resolution relative to Max. Input Level or
Reference Level• Hysteresis: can be set with 1% resolution relative to Max. Input Level
or Reference Level• Slope: positive or negative• Hold-off: set as the higher of the relative distance between two
successive tacho pulses and the absolute valueRelative: can be set from 1 to 90%Absolute: 0 to 10 s• Divider: can be set from 1 to 8192 in integer steps• Averager: running average of distance between a number of pulses.
Can be set from 1 to 999 in integer steps• Gearing: tacho gearing can be defined as a single factor, a ratio
containing 4 fractions or the product of these
AUX. SIGNAL The sensitivity (V/RMS) and offset (RPM) of the signal is set in the sensitivity of the individual auxiliary signals. The setting of the sensitivity can be used to account for a possible gearing
Post-processing Functions• Rotational speed
Specifications – Autotracker
A number of variants of Autotracker output can be used simultaneouslyThe outputs of Autotracker are used:• As tracking references• As speed triggers• As speed interval triggers• For displaying rotational speed• For updating the multi-buffers
MeasurementAny input signal can be used as an Autotracker input
PARAMETERSThe following can be set for the Autotracker analyzer:Primary Settings:• Speed Range: of the RPM or corresponding fundamental frequency• Max. Acceleration: The max RPM/s during the measurement session• Dominating Orders: The orders, visible in the signal, from which the
algorithm should estimate the RPM Secondary Settings:The Autotracker suggests a set of default values, which you can adjust in the case of ‘difficult’ signals.
Post-processing Functions• Rotational speed
ON-SELLABLE
9

N
Specifications – Order AnalyzerA number of variants of the order analyzer can be used simultaneously. The order analyzer resamples time signals, then performs an FFT transform on the result. One tachometer output is used as a tracking reference and it determines the digital low-pass filtering, decimation, interpolation and resampling in the order analyzer
MeasurementAny input signal can be measured using an order analyzer
TIME DOMAIN OPERATIONS• Single or double integration• Single or double differentiation
FREQUENCY WEIGHTING• A, B, C, D• jω2, jω, 1, 1/jω, 1/jω2
ORDER SPECTRUM ANALYSISOrder Span: 1–10000 ordersSpectral Lines: 50 – 6400
Post-processing Functions• Rotational speed
The other specifications for the order analyzer are the same as for the FFT analyzer, see the System Data for PULSE Software (BU 0229)
Performance – Tachometer and Order Analyzer
The processing power required of the PC is measured in terms of “beats”. The more analyzers and the more demanding the individual analyses, the greater the number of beats required. See the System Data for PULSE software (BU 0229) for details of PC performance specifications
The following examples show how the order analyzer performs and how many beats are required for various settings. The examples are made from a basic setup for acquisition of 3 signals at 25.6 kHz span, with 1 signal for tacho reference and 2 signals for order analysis• Acquisition and tachometer cost 8 beats (6 for Acquisition, 2 for the
tachometer)• Max. overlap itself does not require as many beats as 0% overlap, as
max. overlap has a range down to –1000%. But when max. overlap is chosen, the system will use every available resource to get an overlap as high as possible
Beat costs for 75% overlap* at various analysis spans:
Beat costs for 67% overlap at various analysis spans:
Beat costs for 0% overlap at various analysis spans:
Possible max. overlap on a system with 75 beats available at various analysis spans:
ON CHANGING THE NUMBER OF SIGNALS• Doubling the number of signals for the Order Analyzer doubles the
number of beats it requires
BEATS REQUIRED BY THE TACHOMETER• The Tachometer is analysing the signal at the acquired span• When using half the acquisition span, the Tachometer uses half the
number of beats• Doubling the number of signals for the Tachometer doubles the number
of beats required by the Tachometer
Span [kHz] Overlap [%]Beats Required
7702Beats Required
in Total
25.6
75
63 71
12.8 38 46
6.4 25 33
3.2 19 27
1.6 16 24
* Most demanding overlap specification in terms of beats required
Span [kHz] Overlap [%]Beats Required
7702Beats Required
in Total
25.6
67
59 67
12.8 36 44
6.4 24 32
3.2 18 26
1.6 15 23
Span [kHz] Overlap [%]Beats Required
7702Beats Required
in Total
25.6
0
48 56
12.8 30 38
6.4 21 29
3.2 17 25
1.6 15 23
Span [kHz] Overlap [%]Beats Required
7702Beats Available
in Total
12.8 82 28
756.4 94 20
3.2 97 16
1.6 98 14
ON-SELLABLE
10
N
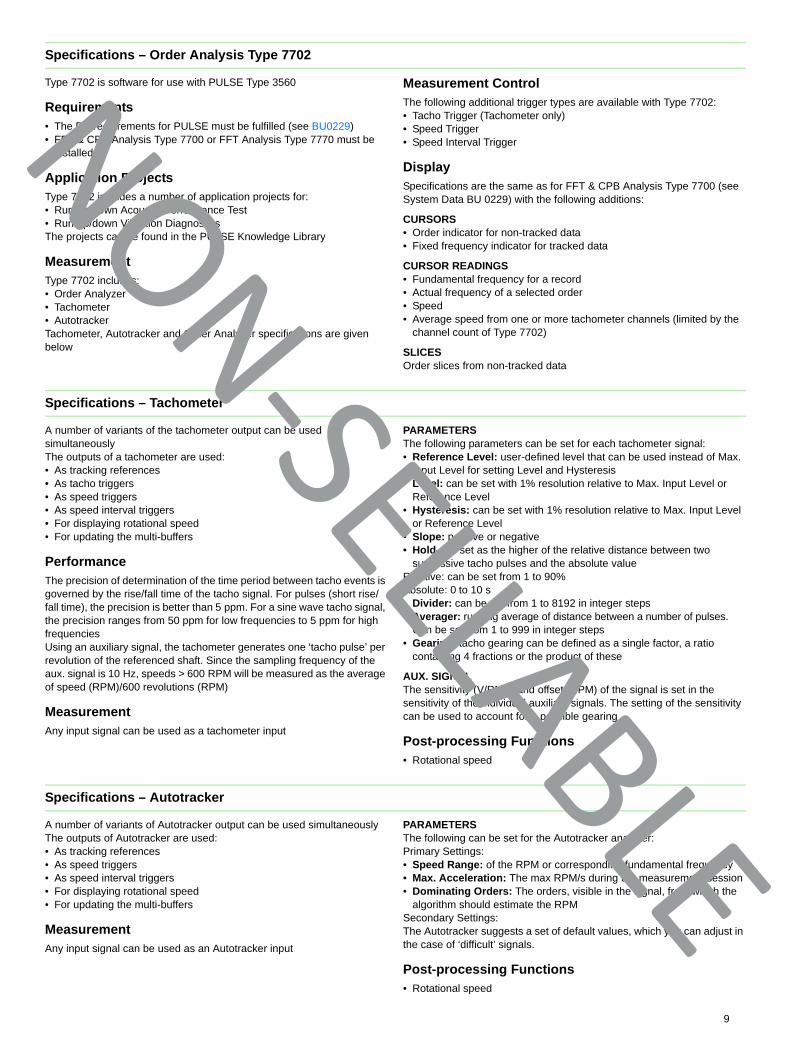
Performance – AutotrackerAUTOTRACKER ACCURACYThe accuracy of Autotracker depends primarily on the choice of parameters and the overall signal to noise ratio of the dominant harmonic orders in the measured signal. The tables below summarise the accuracy obtained for a simulated run-up from 1000 RPM to 6000 RPM over 27.8 seconds for different parameter combinations.The test signal consisted of a clipped sine wave, linearly sweeping from 6 Hz to 100 Hz at a rate of 3 Hz/s. The fundamental frequency was measured using both the Tachometer and Autotracker and recorded in a multi-buffer as average speed tags using an FFT analyzer, running maximum overlap with records of T = 0.5 s. The Autotracker error was then defined as the difference between the two average speed tags. The multi-buffer was updated every 100 ms.
Accuracy for varying number of harmonics:
The table shows that the accuracy generally increases with the number of harmonics
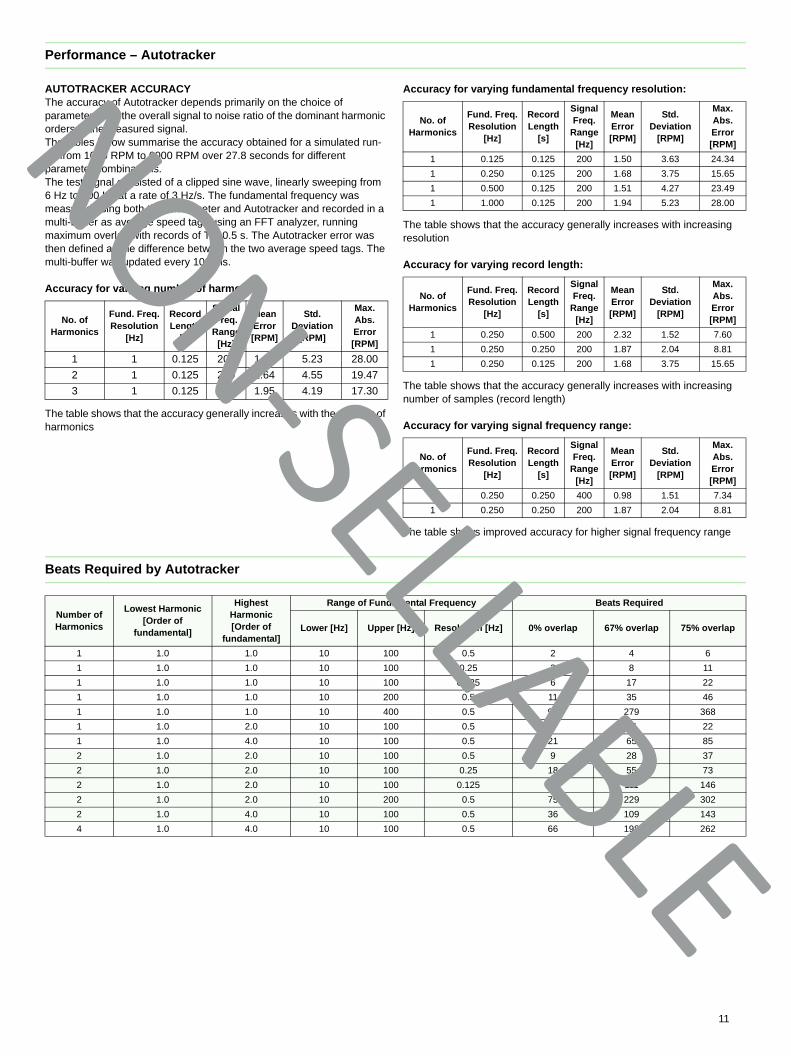
Accuracy for varying fundamental frequency resolution:
The table shows that the accuracy generally increases with increasing resolution
Accuracy for varying record length:
The table shows that the accuracy generally increases with increasing number of samples (record length)
Accuracy for varying signal frequency range:
The table shows improved accuracy for higher signal frequency range
Beats Required by Autotracker
No. ofHarmonics
Fund. Freq.Resolution
[Hz]
RecordLength
[s]
SignalFreq.
Range[Hz]
MeanError[RPM]
Std. Deviation
[RPM]
Max.Abs.Error[RPM]
1 1 0.125 200 1.94 5.23 28.00
2 1 0.125 200 1.64 4.55 19.47
3 1 0.125 200 1.95 4.19 17.30
No. ofHarmonics
Fund. Freq.Resolution
[Hz]
RecordLength
[s]
SignalFreq.
Range[Hz]
MeanError[RPM]
Std. Deviation
[RPM]
Max.Abs.Error[RPM]
1 0.125 0.125 200 1.50 3.63 24.34
1 0.250 0.125 200 1.68 3.75 15.65
1 0.500 0.125 200 1.51 4.27 23.49
1 1.000 0.125 200 1.94 5.23 28.00
No. ofHarmonics
Fund. Freq.Resolution
[Hz]
RecordLength
[s]
SignalFreq.
Range[Hz]
MeanError[RPM]
Std. Deviation
[RPM]
Max.Abs.Error[RPM]
1 0.250 0.500 200 2.32 1.52 7.60
1 0.250 0.250 200 1.87 2.04 8.81
1 0.250 0.125 200 1.68 3.75 15.65
No. ofHarmonics
Fund. Freq.Resolution
[Hz]
RecordLength
[s]
SignalFreq.
Range[Hz]
MeanError[RPM]
Std. Deviation
[RPM]
Max.Abs.Error[RPM]
1 0.250 0.250 400 0.98 1.51 7.34
1 0.250 0.250 200 1.87 2.04 8.81
Number ofHarmonics
Lowest Harmonic[Order of
fundamental]
Highest Harmonic[Order of
fundamental]
Range of Fundamental Frequency Beats Required
Lower [Hz] Upper [Hz] Resolution [Hz] 0% overlap 67% overlap 75% overlap
1 1.0 1.0 10 100 0.5 2 4 6
1 1.0 1.0 10 100 0.25 3 8 11
1 1.0 1.0 10 100 0.125 6 17 22
1 1.0 1.0 10 200 0.5 11 35 46
1 1.0 1.0 10 400 0.5 92 279 368
1 1.0 2.0 10 100 0.5 5 16 22
1 1.0 4.0 10 100 0.5 21 65 85
2 1.0 2.0 10 100 0.5 9 28 37
2 1.0 2.0 10 100 0.25 18 55 73
2 1.0 2.0 10 100 0.125 37 111 146
2 1.0 2.0 10 200 0.5 75 229 302
2 1.0 4.0 10 100 0.5 36 109 143
4 1.0 4.0 10 100 0.5 66 198 262
ON-SELLABLE
11
HT
L
BP
1634
–23
201
2-08
N
Ordering InformationType 7702-Xy* Order Analysis
The licenses allow measurements on the specified number of channels with order analyzers and the specified number of tachometer channels for Average Speed calculations. The license does not restrict the number of tachometer channels for speed monitoring purposes
SERVICESM1-7702-Xy Software Maintenance and Support AgreementM3-7702-Xy Update of M1-7702-Xy
See the Software Maintenance and Upgrade Product Data (BP 1800) for further details of M1 and M3 Agreements
* X = license model either N for node-locked or F for floatingy = optional channel count, from 1 (single) to 7. No number denotes unlimited channels (channel-independent) ON-SELLAB
EADQUARTERS: Brüel & Kjær Sound & Vibration Measurement A/S · DK-2850 Nærum · Denmarkelephone: +45 7741 2000 · Fax: +45 4580 1405 · www.bksv.com · [email protected]
ocal representatives and service organisations worldwide
ËBP-1634---9Î
Brüel & Kjær reserves the right to change specifications and accessories without notice. © Brüel & Kjær. All rights reserved.
LE