product life cycle management
TRANSCRIPT
1
Product Life Cycle Management A Guide to New Product Development
I.Komninos, D. Milossis, N. Komninos

2
This guide has been produced in the framework of INTERREG IIIC operation NPD-NET
(http://www.urenio.org/npd-net).
NPD-NET is a network of six European institutions aiming to enhance the capability of European
companies in the New Product Development (NPD). The project is based on the development and
implementation of a web-based guide to provide support material for the whole NPD process from
the idea generation through the product commercialization. NPD-NET is funded by INTERREG
IIIC.
The material of the New Product Development Guide has been collected from various sources,
referred in the guide content. URENIO was only responsible for the organization and editing of the
material included. The original owners of the material are clearly referred in all chapters of this
New Product Development Guide. This guide is also presented and organized in web form in the
web site of the project NPD-NET (http://www.urenio.org/npd-net).
Scientific coordination of NPD-NET and the NPD Guide has been provided by Prof Nicos
Komninos. The development and organization of the material of the Guide has been done by
Ioannis Komninos. The editing of the Guide has been done by Dimitris Milossis.

3
TABLE OF CONTENTS
TABLE OF CONTENTS .................................................................................................................................................. 3
INTRODUCTION ........................................................................................................................................................... 8
NPD STAGE 1: IDEA GENERATION ...................................................................................................................... 10
1.1 TOOLS & SOLUTIONS .............................................................................................................................................. 10 1.1.1 Brainstorming .............................................................................................................................................. 11
1.1.1.1 Brainstorming Methods ........................................................................................................................................ 12 1.1.1.1A. Affinity diagrams .......................................................................................................................................... 12 1.1.1.1B. Osborne's Checklist...................................................................................................................................... 13 1.1.1.1C. Multivoting .................................................................................................................................................... 13
1.1.1.2 Case Studies - Examples ..................................................................................................................................... 14 1.1.1.3 Brainstorming Tool from Urenio ......................................................................................................................... 15 1.1.1.4 Consultants - Experts ........................................................................................................................................... 15 1.1.1.5 Software Tools ...................................................................................................................................................... 15 1.1.1.6 References ............................................................................................................................................................. 16
1.1.2 Competitive Intelligence ............................................................................................................................ 16 1.1.2.1 Improving CI Capabilities .................................................................................................................................... 17 1.1.2.2. Case Studies - Examples .................................................................................................................................... 18 1.1.2.3 Consultants - Experts ........................................................................................................................................... 19 1.1.2.4 Online Resources .................................................................................................................................................. 20
1.1.2.4A. On-line CI Sources ....................................................................................................................................... 20 1.1.2.4B Tools from Urenio Research Unit ................................................................................................................ 20
1.1.2.5 References ............................................................................................................................................................. 20 1.1.3 Conjoint Analysis ........................................................................................................................................ 21
1.1.3.1 Case Studies - Examples ..................................................................................................................................... 22 1.1.3.2 Consultants - Experts ........................................................................................................................................... 24 1.1.3.3 Software Tools ...................................................................................................................................................... 24 1.1.3.4 References ............................................................................................................................................................. 25
1.1.4. Delphi Technique ...................................................................................................................................... 25 1.1.4.1 Consultants - Experts ........................................................................................................................................... 26 1.1.4.2 References ............................................................................................................................................................. 26
1.1.5 Morphological Charts ................................................................................................................................. 27 1.1.5.1 Case Studies – Examples ..................................................................................................................................... 27 1.1.5.2 References ............................................................................................................................................................. 29
1.1.6. Six Thinking Hats ...................................................................................................................................... 29 1.1.6.1. Case Studies - Examples .................................................................................................................................... 30 1.1.6.2. References ............................................................................................................................................................ 31
1.1.7 TRIZ - Idea generation using a problem-solving tool ........................................................................... 31 1.1.7.1 TRIZ Process Methodology .................................................................................................................................. 33 1.1.7.2 Consultants - Experts ........................................................................................................................................... 34 1.1.7.3 References ............................................................................................................................................................. 34
1.2 LEVEL ASSESSMENT FOR STAGE 1: IDEA GENERATION .............................................................................................. 34
NPD STAGE 2: IDEA SCREENING ......................................................................................................................... 35
2.1 TOOLS & SOLUTIONS .............................................................................................................................................. 35 2.1.1. Qualitative Research ................................................................................................................................. 36
2.1.1.1 Case Studies - Examples ..................................................................................................................................... 37 2.1.1.2 Consultants - Experts ........................................................................................................................................... 37 2.1.1.3 Software Tools ...................................................................................................................................................... 38 2.1.1.4 References ............................................................................................................................................................. 38
2.1.2 FMEA (Failure Modes and Effects Analysis) ............................................................................................ 38 2.1.2.1 References ............................................................................................................................................................. 39
2.1.3 Dot Sticking ................................................................................................................................................. 39

4
2.1.3.1 Case Studies - Examples ..................................................................................................................................... 40 2.1.4 SWOT Analysis ............................................................................................................................................ 41
2.1.4.1 Case Studies - Examples ..................................................................................................................................... 42 2.1.4.2 References ............................................................................................................................................................. 43
2.1.5 PMI Analysis ................................................................................................................................................ 44 2.1.5.1 Case Studies - Examples ..................................................................................................................................... 44
2.2. LEVEL ASSESSMENT FOR STAGE 2: IDEA SCREENING ............................................................................................... 45
NPD STAGE 3: CONCEPT DEVELOPMENT & TESTING ................................................................................... 46
3.1 CONCEPT DEVELOPMENT ......................................................................................................................................... 46 3.1.1 Controlled Convergence ............................................................................................................................ 46
3.1.1.1 References ............................................................................................................................................................. 47 3.1.2 Risk Management ....................................................................................................................................... 48
3.1.2.1 Risk Management Process ................................................................................................................................... 48 3.1.2.2 Case Studies - Examples ..................................................................................................................................... 49 3.1.2.3 References ............................................................................................................................................................. 50
3.1.3 Force Field Analysis .................................................................................................................................... 50 3.1.3.1 References ............................................................................................................................................................. 51
3.1.4 Relevancy Concepting ................................................................................................................................ 52 3.1.5 New Tech Commercialization .................................................................................................................... 53 3.1.6 Quicktime Workshop .................................................................................................................................. 53
3.2 CONCEPT TESTING .................................................................................................................................................. 55 3.2.1 Quantitative Research................................................................................................................................ 55
3.2.1.1 References ............................................................................................................................................................. 56 3.2.2 Quality Functional Deployment ................................................................................................................ 57
3.2.2.1 Case Studies - Examples ..................................................................................................................................... 58 3.2.2.2 QFD Tool from Urenio .......................................................................................................................................... 59 3.2.2.3 Consultants - Experts ........................................................................................................................................... 59 3.2.2.4 Software Tools ...................................................................................................................................................... 59 3.2.2.5 References ............................................................................................................................................................. 60
3.2.3 Decision Tree Analysis ............................................................................................................................... 60 3.2.4 KANO Model ................................................................................................................................................ 64
3.2.4.1 KANO Model Methodology ................................................................................................................................... 66 3.2.4.2 Case Studies - Examples ..................................................................................................................................... 67 3.2.4.3 References ............................................................................................................................................................. 68
3.2.5 Weighting and Rating ................................................................................................................................ 68 3.2.5.1 Case Studies - Examples ..................................................................................................................................... 69
3.2.6 Communications Check ............................................................................................................................. 70 3.2.7 Concept Screen Software .......................................................................................................................... 71
3.3 LEVEL ASSESSMENT FOR STAGE 3: CONCEPT DEVELOPMENT ..................................................................................... 71
NPD STAGE 4: BUSINESS ANALYSIS .................................................................................................................. 72
4.1 TOOLS & SOLUTIONS .............................................................................................................................................. 72 4.1.1 Cost Benefit Analysis .................................................................................................................................. 72
4.1.1.1 Cost Benefit Analysis Tool: "Financing Innovation" ......................................................................................... 73 4.1.2 Product Life Cycle ....................................................................................................................................... 73
4.1.2.1 PLC Quick Reference ............................................................................................................................................ 74 4.1.2.2 References ............................................................................................................................................................. 75
4.1.3 Gantt Charts ................................................................................................................................................ 76 4.1.3.1 Case Studies - Examples ..................................................................................................................................... 77 4.1.3.2 References ............................................................................................................................................................. 79
4.1.4 Critical Path Analysis & PERT .................................................................................................................... 79 4.1.5 Stakeholder Analysis .................................................................................................................................. 80
4.1.5.1 Stakeholder Analysis Management .................................................................................................................... 82 4.1.5.2 Stakeholder Analysis Planning ............................................................................................................................ 82 4.1.5.3 References ............................................................................................................................................................. 83
4.2 LEVEL ASSESSMENT FOR STAGE 4: BUSINESS ANALYSIS ........................................................................................... 84
NPD STAGE 5: BETA & MARKET TESTING ......................................................................................................... 85

5
5.1 TOOLS & SOLUTIONS .............................................................................................................................................. 85 5.1.1 Rapid Prototyping ....................................................................................................................................... 86
5.1.1.1 Prototyping Testing .............................................................................................................................................. 87 5.1.1.2 Prototyping Techniques ....................................................................................................................................... 89
5.1.1.2A Fused Deposition Modelling (FDM) ............................................................................................................. 89 5.1.1.2B Inkjets............................................................................................................................................................. 90 5.1.1.2C Laminated Object Manufacturing ................................................................................................................ 91 5.1.1.2D Laser Engineered Net Shaping .................................................................................................................... 92 5.1.1.2E Selective Laser Sintering .............................................................................................................................. 93 5.1.1.2F Stereolithography .......................................................................................................................................... 94 5.1.1.2G Three Dimensional Printing ......................................................................................................................... 95
5.1.1.3 Case Studies - Examples ..................................................................................................................................... 95 5.1.1.4 Software Tools ...................................................................................................................................................... 97 5.1.1.5 References ............................................................................................................................................................. 97
5.1.2 Product Development Testing .................................................................................................................. 98 5.1.2.1 Exploratory Tests .................................................................................................................................................. 99 5.1.2.2. Assessment Tests .............................................................................................................................................. 100 5.1.2.3 Validation Tests................................................................................................................................................... 100 5.1.2.4 Comparison Tests ............................................................................................................................................... 101 5.1.2.5. ISO 9000 Tests .................................................................................................................................................. 101
5.1.3 Market Research Issues .......................................................................................................................... 101 5.1.3.1 Market Targeting Strategy ................................................................................................................................ 101
5.1.3.1A Market segmentation .................................................................................................................................. 102 5.2 LEVEL ASSESSMENT ............................................................................................................................................... 103
NPD STAGE 6: TECHNICAL IMPLEMENTATION ............................................................................................. 104
6.1 TOOLS & SOLUTIONS ............................................................................................................................................ 104 6.1.1 Design for X............................................................................................................................................... 104
6.1.1.1 Design for Manufacture ..................................................................................................................................... 105 6.1.1.2 Design of Assembly ............................................................................................................................................ 106 6.1.1.3 Design for Life Cycle .......................................................................................................................................... 106
6.1.1.3A Design for Testability / Inspectability....................................................................................................... 107 6.1.1.3B Design for Reliability ................................................................................................................................... 108 6.1.1.3C Design for Maintainability / Serviceability .............................................................................................. 108
6.1.1.4. Design for the Environment ............................................................................................................................. 109 6.1.1.5 References ........................................................................................................................................................... 110
6.1.2 Industrial Design ...................................................................................................................................... 111 6.1.2.1 Industrial Design Management ......................................................................................................................... 111 6.1.2.2 Industrial Design Activity Map .......................................................................................................................... 113
6.1.2.2A Sketch & Draw ............................................................................................................................................. 114 6.1.2.2B Sketch Models.............................................................................................................................................. 114 6.1.2.2C 2D Technical Drawing ................................................................................................................................ 115 6.1.2.2D 3D Digital Model (Constrained) ................................................................................................................. 116 6.1.2.2E 3D Digital Model (Unconstrained) ............................................................................................................. 118 6.1.2.2F Appearance Model ....................................................................................................................................... 119 6.1.2.2G Computer Visualisation .............................................................................................................................. 120 6.1.2.2H Presentation - Illustration .......................................................................................................................... 120 6.1.2.2I Prototype....................................................................................................................................................... 121
6.1.2.3 Consultants - Experts ......................................................................................................................................... 122 6.1.2.4 References ........................................................................................................................................................... 123
6.1.3 Lean Manufacturing ................................................................................................................................. 123 6.1.3.1 Electrical Engineering Level............................................................................................................................... 123 6.1.3.2 Mechanical Engineering Level ........................................................................................................................... 124 6.1.3.3 System Engineering Level ................................................................................................................................. 124 6.1.3.4 Just In Time (JIT) ............................................................................................................................................... 124
6.1.4 CAD/CAM ................................................................................................................................................... 125 6.1.4.1 References ........................................................................................................................................................... 126
6.1.5 Re-engineering ......................................................................................................................................... 126 6.1.5.1 Case Studies - Examples ................................................................................................................................... 127 6.1.5.2 Software Tools .................................................................................................................................................... 127 6.1.5.3 Consultants - Experts ......................................................................................................................................... 127

6
6.1.5.4 References ........................................................................................................................................................... 127 6.1.6 Reverse Engineering ................................................................................................................................ 128
6.1.6.1 Reverse Engineering Methodology ................................................................................................................... 128 6.1.6.2 Major Applications .............................................................................................................................................. 130
6.1.6.2A Reverse Engineering of Business .............................................................................................................. 130 6.1.6.2B Reverse Engineering of Electronic Components ..................................................................................... 130 6.1.6.2C Reverse Engineering of Software ............................................................................................................. 130
6.1.6.3 Case Studies - Examples ................................................................................................................................... 131 6.1.6.4 Consultants - Experts ......................................................................................................................................... 131 6.1.6.5 References ........................................................................................................................................................... 131
6.1.7 Major Manufacturing Issues .................................................................................................................... 132 6.1.7.1 Bill of Material (BOM) ......................................................................................................................................... 132 6.1.7.2 Mass production .................................................................................................................................................. 135 6.1.7.3 Producibility ......................................................................................................................................................... 135 6.1.7.4 Quality Assurance ............................................................................................................................................... 136 6.1.7.5 Value Engineering ............................................................................................................................................... 138
6.2 LEVEL ASSESSMENT ............................................................................................................................................... 139
NPD STAGE 7: PRODUCT COMMERCIALISATION ........................................................................................ 140
7.1 TOOLS & SOLUTIONS ............................................................................................................................................ 140 7.1.1 Marketing Plan .......................................................................................................................................... 140 7.1.2 The Elevator Speech ................................................................................................................................ 141 7.1.3 Product on a Page - Advert ..................................................................................................................... 141 7.1.4 Distribution Channels ............................................................................................................................... 142
7.1.4.1 Distribution Definition and Considerations ...................................................................................................... 142 7.1.4.2 Distribution Channel Strategy ........................................................................................................................... 143 7.1.4.3 Types of Distribution Channels ......................................................................................................................... 144
7.1.5 Product Pricing .......................................................................................................................................... 145 7.1.5.1 Product Pricing Objectives ................................................................................................................................. 145 7.1.5.2 Pricing Methods .................................................................................................................................................. 146
7.1.5.2A Competitor Indexing ................................................................................................................................... 146 7.1.5.2B Cost-plus Pricing.......................................................................................................................................... 147 7.1.5.2C Price Skimming ............................................................................................................................................ 147 7.1.5.2D Target Rate of Return Pricing ................................................................................................................... 148
7.1.6 Product Promotion ................................................................................................................................................. 148 7.1.6.1 Advertising ........................................................................................................................................................... 149
7.1.6.1A Advertising Channels .................................................................................................................................. 149 7.1.6.1B Ways to get Free Advertising .................................................................................................................... 151 7.1.6.1C Product Placement ...................................................................................................................................... 152
7.1.6.2 Personal Selling ................................................................................................................................................... 152 7.1.6.3 Publicity & Public relations ................................................................................................................................ 153 7.1.6.4 Sales Promotion .................................................................................................................................................. 154
7.1.6.4A Consumer Promotion Techniques ............................................................................................................. 155 7.1.6.4B Trade Promotion Techniques .................................................................................................................... 155
7.2 LEVEL ASSESSMENT ............................................................................................................................................... 156
8. GENERAL PURPOSE TOOLS ............................................................................................................................. 157
8.1 BENCHMARKING TOOL, URENIO RESEARCH UNIT .................................................................................................... 157 8.2 BUSINESS PROCESS REENGINEERING ..................................................................................................................... 157
8.2.1 Business Process Reengineering Methodology .................................................................................... 157 8.2.2 References ................................................................................................................................................. 158
8.3 COLLABORATIVE PRODUCT DEVELOPMENT ............................................................................................................... 158 8.4 HUMAN RESOURCES MANAGEMENT ........................................................................................................................ 159 8.5 MARKET RESEARCH TOOLS .................................................................................................................................... 162 8.6 PRODUCT OUTSOURCING ....................................................................................................................................... 162
What to do and what don't for successful outsourcing .............................................................................................. 164 References ........................................................................................................................................................................ 164
8.7 PORTFOLIO MANAGEMENT ..................................................................................................................................... 165 References ........................................................................................................................................................................ 166
8.8 SUPPLY CHAIN MANAGEMENT ................................................................................................................................ 167

7
8.9 THE PLANNING CYCLE ........................................................................................................................................... 167
APPENDICES .............................................................................................................................................................. 169
APPENDIX 1: LEVEL ASSESSMENT FOR NPD STAGE 1: IDEA GENERATION ................................................... 170 APPENDIX 2: LEVEL ASSESSMENT FOR NPD STAGE 2: IDEA SCREENING ...................................................... 172 APPENDIX 3: LEVEL ASSESSMENT FOR NPD STAGE 3: CONCEPT DEVELOPMENT ........................................ 173 APPENDIX 4: LEVEL ASSESSMENT FOR NPD STAGE 4: BUSINESS ANALYSIS ................................................ 175 APPENDIX 5: LEVEL ASSESSMENT FOR NPD STAGE 5: PRODUCT TESTING .................................................. 177 APPENDIX 6: LEVEL ASSESSMENT FOR NPD STAGE 6: TECHNICAL IMPLEMENTATION .............................. 179 APPENDIX 7: LEVEL ASSESSMENT FOR NPD STAGE 7: COMMERCIALISATION ............................................. 182 APPENDIX 8: QUESTIONNAIRES FOR MARKET RESEARCH ............................................................................................ 184

Introduction .
8
INTRODUCTION
The existence and the course of a business in the form of a company, enterprise or corporation is
directly linked with the course of its products. A business unit exists to sell products and as far as
the product sales go well so is the business unit. Products like everything else in life have a certain
life cycle. Each product goes through this life cycle and eventually dies out. Products, which were
once a household name, have disappeared from the market as they entered the decline phase of their
life cycle. So due to this fact the long-term operation of a business depends on the on going
development of new products.
The rapid development of new technologies, the shift change in customer needs and attributes, and
the gradual increase of the competition has forced all business to adopt New Product Development
(NPD) as a necessary and unavoidable business practice. NPD is a complex and time-consuming
process, which cannot be taken lightly, since it holds more perils than first meets the eye.
According to David S. Hopkins and Earl L. Baily1 research has shown that 40% of new consumer
products, 20% of new industrial products and 18% of new services related products have failed
completely as products. Further research has shown that the new product failure percentage is even
greater in countries outside the US.
To avoid development of a new product that will not be a success in a market and to minimize the
costs of such a development a NPD Roadmap can be used. Such a roadmap is a tool that can help
companies and organizations to successfully develop new products or upgrade existing ones
through a series of logical steps, starting from the process of idea generation and ending at the
launch of the product into a market.
This process contains a series of activities called "Levels" and control points, called "Assessments".
Each Level contains information and well-defined series of activities concerned with the particular
Level of the development and each Assessment is a decision point where senior management can
keep on or stop funding the process. In more detail, a Level contains all the information and tools
that are needed to successfully complete the particular Level and an Assessment contains the
required questions or specifications or mandates to which the results of the previous Level are
compared to so that a go / kill or hold decision can be made. In the next chapters each Level is
analysed further, and all relevant information or tools that can be used are presented. All
Assessments are given in Appendices. In the final chapters of this report the complete roadmap is
presented including all Levels and Assessments.
Each Level is split up in sections that include a definition of the problem that the Level is asked to
tackle, a possible solution to the problem and an analysis of the tools available to tackle the
problem. Each tool is properly defined, the references, on-line resources, software sources and
consultancies or organizations that can help to use the tool are given and case studies of where and
how the toll has been used are presented in separate sections. All Assessments are designed to work
1 fn. David S. Hopkins and Earl L. Bailey, "New Product Pressures", Conference Board Record,
June 1971, p. 16-24, mentioned by Phillip Kotler, "Marketing Management", ch. 12, 7th Edition,
EMI/Interbooks, 1991.

Introduction .
9
interactively with a potential roadmap user. Also tools and templates developed are given for the
same reason.
The roadmap presented can be used not only as an informative tool but also as a complete guide of
a NPD process. The tools, best practices and other relevant material presented, explained and
analysed further down in the report are in most cases given in the form of files linked to this
document so that a reader can use them to perform his own NPD process. The true purpose and
final scope of this report is to provide the means for the development of a complete on-line NPD
roadmap. One should note that the roadmap itself would not be able to answer all the questions or
tackle all the problems of such a process unless the final user enters information whenever this is
required and based on analysis results move forward into the process.

NPD Stage 1: Idea Generation
10
NPD Stage 1: Idea Generation
Every new product and every new product development process starts with the idea generation.
Idea generation is a process in which creative thinking is used to produce large amount of ideas for
new products. It is very important that all ideas no matter how ludicrous or extreme may sound, to
be gathered.
The idea generation process should be on - going, have a specific purpose, involve the whole of the
company including its clientele, use a variety of methods, have one person in charge and not
evaluate the gathered ideas. During the idea generation - gathering process one should not criticize
the ideas of others, should be freewheeling and generate as many ideas as possible. The
management of ideas is also very important at this stage due to the large number of ideas to be
selected and their diversity.
Based on what said above the problem of this level is to generate as many ideas as possible and
manage them in such a way that it will be possible and easy for screening them later on.
1.1 Tools & Solutions
Ideas for new products can easily come from the very customers of the company. This can be
accomplished by gathering information about their needs and preferences. Then when all data is
collected a series of tools can help the company quantify these needs and translate them into new
product ideas.
Gathering the customer needs can be done easily using questionnaires either upon the purchase of
an existing product, or over the phone (telephone research based on a clientele list) or through the
Internet (on-line questionnaires). The golden rule in either case is to ask the proper questions that
can give a complete picture of the customer needs. This idea gathering process can also be done in
conjunction with a market research. A market research can give a present picture of the market, that
the new product is indented, and future market trends.
In the case that a market research is used to identify customer needs, a market plan must be formed
beforehand that will keep the research in focus and identify target groups, sampling methods,
possible ways of data evaluation, objectives of research etc.
Company suppliers, dealers, middlemen or partners can also be an invaluable source of new
product ideas, since they are the ones that come face to face with customers on a daily basis and
can draw from them information about company products. The way that they are communicating
with the customers, which is usually informal, can show aspects of customer needs that cannot be
shown in any market research. Furthermore, in the case of geographically dispersed customers,
where the market is differentiated from place to place, dealers and suppliers or partners are the only
ones that can give an accurate picture of the market and subsequently of the customer needs.
Fairs, seminars, expos and shows that competitors participate are a good place of obtaining new
product ideas for either completely new products or supplements of existing products or upgrades
of existing products. These events are places that competitor creativity is at a full-scale show and
new innovation techniques or new technologies can be observed. (See Competitive Intelligence)

NPD Stage 1: Idea Generation
11
Once customer, suppliers, middlemen, users, etc have expressed their wishes in respect to needs of
a new potential product, all data collected can be put into tools such as Conjoint Analysis (CA), so
that all customer wishes can be transformed into new product ideas and these ideas can be managed
properly. Some of the tools used such as QFD can also be used in creation of product concepts
from product ideas and come up with a final product plan.
Furthermore there are techniques or methodologies such as Brainstorming, Competitive
Intelligence, Think Tanks, the Delphi process, the Kano maps and Triz which can be used to
generate ideas or manage them with or without the use of data collected.
1.1.1 Brainstorming
Brainstorming in general is a very good technique of developing many solutions to a problem. In
the case of product idea generation, brainstorming can produce broad and odd ideas that can be
developed extremely fast. During brainstorming sessions no idea is criticized since the process tries
to open possibilities and break down assumptions about ones idea generation limitations. Also
judgment and analysis of ideas generated will probably shut down the whole generation idea
process.
There are two distinctive types of brainstorming: Individual and Group Brainstorming. Each has its
characteristics, strengths and weaknesses and both are analysed further bellow.
Individual Brainstorming tends to produce a wider range of ideas than the group one. In
this type, one has not to worry about other people's opinions and views and therefore can
be more creative. However sometimes ideas generated cannot be developed effectively
because there is no group help or experience.
Group Brainstorming can be very effective as it uses the experience of the whole group
to generate ideas. When a member of the group reaches its limits then another can always
pick up the idea generation to the next stage. In this way group brainstorming can develop
and generate ideas in more depth than the individual one.
Group brainstorming can be very dangerous for the individuals involved in it. One's good idea can
be another one's stupid idea. To avoid individual humiliation and to run brainstorming sessions
effectively there should be always someone to run the session as a leader who must do the
following.
Define the problem needed solving clearly.
Keep all members of the group focused on the problem in hand.
Keep criticism and evaluation at bay.
Encourage the participation of all members.
Stop long dragging of ideas.
Encourage members to further develop or follow up on other people ideas.
Keep track of all ideas generated so that nothing discussed is missed.
To sum up, brainstorming can generate radical ideas that can be developed quickly. Individual
brainstorming can produce more ideas than group but it is not as effective. And finally rules must
be set to manage group brainstorming.

NPD Stage 1: Idea Generation
12
1.1.1.1 Brainstorming Methods
1.1.1.1A. Affinity diagrams
Affinity diagrams are a good way of organizing data coming from customers or users. It is a useful
tool for sorting and managing of a lot of data from customer research and makes full use of team
participation in the development of customer oriented product definition. Having this in mind the
tool can be used in organizing the customer needs and wants in the process of idea generation in
Level 1 but also in selecting and developing a product concept in Level 2.
Typically the tool is used with personal interviews. From each interview the team can usually
identify 10 to 100 statements, which are connected to a product. Each statement can be identified,
by pinpointing the customer requirement hidden behind it. The Affinity Diagram permits customer
needs to be organized based on clustering and through group discussion. The method of
constructing Affinity Diagrams consists of five simple steps. These are given bellow.
Step1: Team formation. The generation of Affinity Diagrams is a group activity. So a group of
people must be gathered for that reason. It is useful to split the group in pairs so that people can
discuss their insights and confirm their thinking.
Step 2: Customer statements notation. Customer statements collected from interviews, observation
or customer research are written separately on a post-it note. One should have in mind that these
could be a lot. One colour should be used for the post-it notes at this point. Numbers or other means
of reference should be placed on the notes so that the origin of each note can be traced.
Step 3: Statements grouping. Statements on post-it notes should be grouped. There are no specific
rules on how this must be done but it is useful for someone to have some pre-determined headings
for each group of interest at the beginning of the process. Headings should not contain words that
the team is familiar with such as "quality", "speed", "price", etc. Typically there should be 5 to 6
statements at each group at the end of the process.
Step 4: Naming the groups. Each group or cluster of statements should be given a name that relates
to the statements that are contained in the specific group. A good name is such that when reading it
the team will have the feeling that the customer is talking directly to them. It should be direct and
using immediate language. The group names should be written in different colour post-it notes.
Step 5: Cluster the groups. Groups of statements should be clustered together to form higher-level
groups of statements. Again each cluster should be named to define the specific function of each
group.
The process of clustering and naming can go on until all members of the team are satisfied that a
hierarchical structure of customer statements is formed. This structure should tell a story about the
customer needs and wants.
Source: Better Product Design, Institute of Manufacturing, University of Cambridge, On-line
http://www.betterproductdesign.net/tools/definition/affinity.htm

NPD Stage 1: Idea Generation
13
1.1.1.1B. Osborne's Checklist
Osborne's checklist is a simple tool that supports product idea or concept generation that can be
used in a number of ways, brainstorming being the most popular one. The checklist contains a
series of questions, which can be used either individually or in groups to encourage creative
thinking concerning a specific issue.
In the case that the checklist is used in a brainstorming session, the questions are usually written in
cards and these cards are randomly selected while discussing a certain problem. Alternative all
questions are placed on a board that the group or the individual performing brainstorming can see.
A typical checklist is shown bellow.
Table 1: Typical Osborne’s Checklist
Other uses? New ways to use as is? Other uses if modified?
Adapt? What else is like this? What other ideas does this suggest? What could I copy? Are
there any past offers?
Modify? New twist? Change colours, motion, odour, taste, form, and shape? Other changes?
Magnify? What to add? More time? Greater frequency? Stronger? Higher? Larger? Thicker?
Heavier? Extra value? Plus ingredient? Duplicate? Multiply?
Minify? What to subtract? Smaller? Miniature? Lower? Shorter? Lighter? Split up?
Understate? Less frequent?
Substitute? Who else instead? What else instead? Other ingredient? Other material? Other
process? Other approach? Other tone of voice? Other time?
Rearrange? Interchange components? Other pattern? Other layout? Other sequence? Change
place? Change schedule? Earlier? Later?
Reverse? Opposite? Transpose positive and negative? Reverse roles? Upside down? Inside
out?
Combine? Blend? Alloy? Combine units? Assortment? Ensemble?
Source: Better Product Design, Institute of Manufacturing, University of Cambridge, On-line
http://www.betterproductdesig.net/tools/comcept/osborne.htm
Osborne's checklist in the form above is also known as SCAMPER - Substitute, Combine, Adapt,
Modify/Minify/Magnify, Put to other uses, Eliminate, Reverse/Rearrange.
Source: Better Product Design, Institute of Manufacturing, University of Cambridge, On-line
http://www.betterproductdesig.net/tools/comcept/osborne.htm
1.1.1.1C. Multivoting
Multivoting as Affinity Diagrams and Osborn's Technique is another brainstorming method. In
Multivoting a structured series of votes by a team are cast in order to narrow down a broad set of
options to a few ones. The way that the method works is described as a series of steps bellow.
Step 1: A list of items is generated.
Step 2: Similar items are combined into groups that the participants of multivoting agree upon.
Step 3: Each item is then numbered.
NPD Stage 1: Idea Generation
14
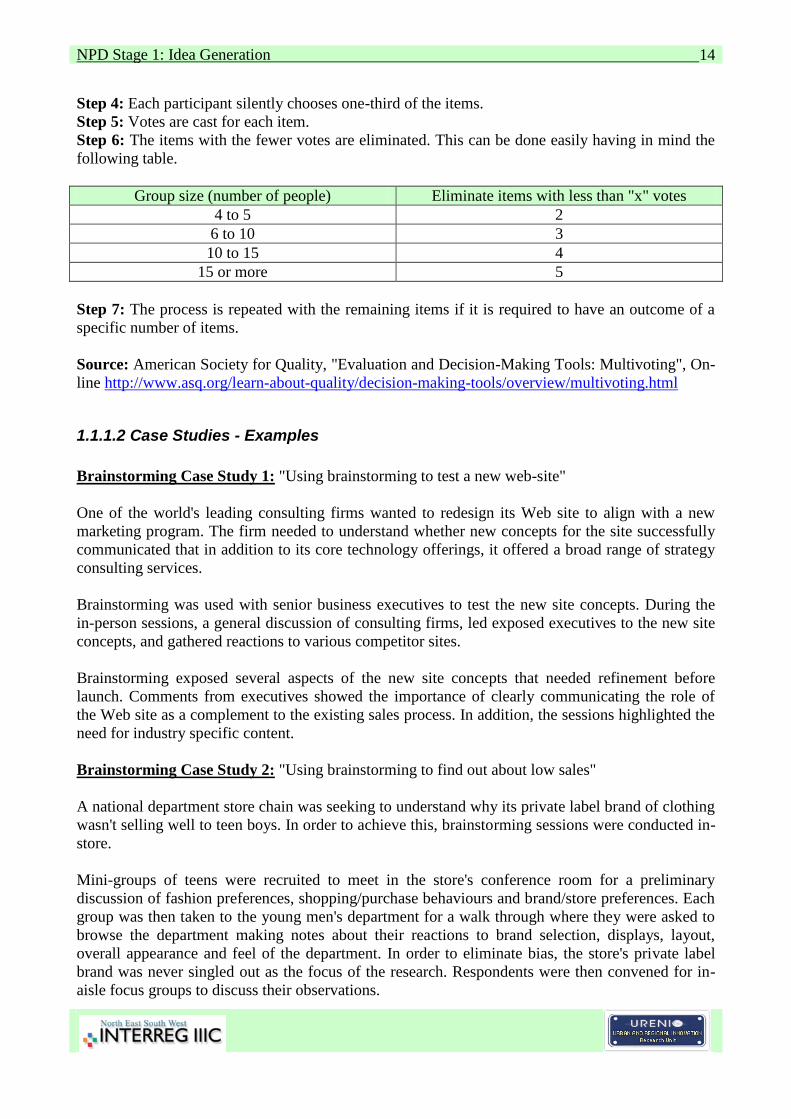
Step 4: Each participant silently chooses one-third of the items.
Step 5: Votes are cast for each item.
Step 6: The items with the fewer votes are eliminated. This can be done easily having in mind the
following table.
Group size (number of people) Eliminate items with less than "x" votes
4 to 5 2
6 to 10 3
10 to 15 4
15 or more 5
Step 7: The process is repeated with the remaining items if it is required to have an outcome of a
specific number of items.
Source: American Society for Quality, "Evaluation and Decision-Making Tools: Multivoting", On-
line http://www.asq.org/learn-about-quality/decision-making-tools/overview/multivoting.html
1.1.1.2 Case Studies - Examples
Brainstorming Case Study 1: "Using brainstorming to test a new web-site"
One of the world's leading consulting firms wanted to redesign its Web site to align with a new
marketing program. The firm needed to understand whether new concepts for the site successfully
communicated that in addition to its core technology offerings, it offered a broad range of strategy
consulting services.
Brainstorming was used with senior business executives to test the new site concepts. During the
in-person sessions, a general discussion of consulting firms, led exposed executives to the new site
concepts, and gathered reactions to various competitor sites.
Brainstorming exposed several aspects of the new site concepts that needed refinement before
launch. Comments from executives showed the importance of clearly communicating the role of
the Web site as a complement to the existing sales process. In addition, the sessions highlighted the
need for industry specific content.
Brainstorming Case Study 2: "Using brainstorming to find out about low sales"
A national department store chain was seeking to understand why its private label brand of clothing
wasn't selling well to teen boys. In order to achieve this, brainstorming sessions were conducted in-
store.
Mini-groups of teens were recruited to meet in the store's conference room for a preliminary
discussion of fashion preferences, shopping/purchase behaviours and brand/store preferences. Each
group was then taken to the young men's department for a walk through where they were asked to
browse the department making notes about their reactions to brand selection, displays, layout,
overall appearance and feel of the department. In order to eliminate bias, the store's private label
brand was never singled out as the focus of the research. Respondents were then convened for in-
aisle focus groups to discuss their observations.

NPD Stage 1: Idea Generation
15
Results of the research led to a total revamping of the department's private label shop including
aisle width, signage, product displays and merchandise offerings.
1.1.1.3 Brainstorming Tool from Urenio
Group brainstorming can be conducted using a file created by Urenio Research Unit.
Using this file one must note that it is really intended for use by the group leader and not only is a
tool for gathering the ideas generated by the group but also has some means of preliminary
selection of the best idea of the ones presented.
1.1.1.4 Consultants - Experts
Brainstorm network (http://www.brainstormnetwork.org/consulting.html) Brainstorm Network & Associates are
available to provide consulting in many areas of product innovation and marketing, including
brainstorming training.
Agency Consulting Group Inc
(http://www.agencyconsulting.com/displayLink.asp?linkID=6)
Begley Consulting (http://www.begleyconsulting.com/index.html)
The firm offers brainstorming sessions for generation of new ideas.
Turner consulting Group (http://www.turnerconsulting.com/index.html)
Adventure Associates (http://www.adventureassoc.com/consulting.html)
The firm offers creative brainstorming sessions in house for idea generation purposes.
1.1.1.5 Software Tools
http://www.paramind.net/
ParaMind software is a serious yet fun program that operates on the principle of generating new
text from text. It is totally configurable and can be used to logically expand any idea. It comes with
a database of 500 related word chains, and more can added.
http://www.infinn.com/toolbox.html
Brainstorming Toolbox is a tool for better brainstorming, creative thinking, lateral thinking,
creativity and problem solving. It improves ability to brainstorm either alone or in groups by
bringing pro-active brainstorming and lateral techniques at one's computer. There is a free 30-day
trial version of the software available.
http://www.mbaware.com/mbaware/min20staned.html
MindManager software is software that helps to organize and visually communicate ideas using a
widely used technique called "Mind Mapping".

NPD Stage 1: Idea Generation
16
http://www.randomwordgenerator.com/
Random Word Generator software, is a software that allows the user to generate random words
from a long list of common words called the "Brainstorming Toolbox". So it can be used to
generate ideas by inserting a single word expressing the problem.
1.1.1.6 References
"Idea Generation Tools: Brainstorming, Affinity Diagrams, and Multivoting"
(http://www.qualityhealthcare.org), Institute for Healthcare Improvement, Boston, MA, USA,
2003
"Osborne's Checklist" (http://www.betterproductdesign.net/tools/concept/osborne.htm), Good
Design Practice Program, Institute for Manufacturing & Engineering Design Center,
University of Cambridge, UK, 2004
Mind Tools "Brainstorming: Generating Many Radical Ideas"
(http://www.mindtools.com/index.html)
Osborne A, "Applied Imagination: Principles and Procedures of Creative Problem Solving",
Scribner, New York, 1957
1.1.2 Competitive Intelligence
A Competitive Intelligence Program (CIP) is "a formalised, yet continuously evolving process by
which the management team assesses the evolution of its industry and the capabilities and
behaviour of its current and potential competitors to assist in maintaining or developing a
competitive advantage" (Prescott and Gibbons 1993).
Competitive intelligence uses public recourses to find and develop information on competition,
competitors and market environments so that to produce new product ideas than can give an
advantage against these competitors. Resources from which information about the competition can
be drawn usually include the following.
Government Agencies. They can produce valuable data, but getting the information is
usually very time consuming.
Online databases. Faster method for obtaining information but more expensive than others.
Drawback is that databases do not contain information that has not been released or included
in the on-line reports.
Companies and investment community resources. Some information can be available from
the competitive companies and can be obtained either by contacting the company directly or
by contacting investment community sources.
Surveys and Interviews. Surveys can produce large amount of data about the competition
and interviews can give in - depth perspectives from small samples.
Drive - by and on - site observations. Data can be collected from competition retail outlets,
fairs and seminars where usually state of the art new products are on show.
Competitive benchmarking. This kind of benchmarking can be used to compare one's
company or business against the competition.

NPD Stage 1: Idea Generation
17
Defensive competitive intelligence. It is used as a means to present one's company to the
competition.
Reverse engineering. Acquiring competition products and analysing their quality, features,
costs, etc can yield invaluable information.
Effective implementation of a CIP requires not only information about the competitors products but
also information about the market trends in existence, the technological advances available, the
economic conditions in hand and the legal and regulatory mandates in force. Only when the above
factors are taken into account, new product ideas can be generated from the information gathered
on competitor products that can give a competition advantage against them.
It is important that all raw data is evaluated and screened for accuracy. Double-checking and cross -
reference must always be in mind of those that perform a CIP. Miscalculations and assumptions
made about the competitor's products can lead to false new product ideas that usually fail miserably
after their full development.
The four main steps in designing an effective CIP are: Setting up the system, collecting the data,
evaluating and analysing the data and disseminating information and responding to queries. These
are described bellow.
1. Setting up the system: The first step requires the identification of the types of vital
competitive information, identifying the best information sources and assigning someone to
manage the system. In the case of SME's, which usually cannot afford a formal competitive
intelligence officer, specific executives must be assigned to watch specific competitors. So
when someone needs information on a particular competitor will be able to contact the
executive assigned to him.
2. Collecting the data: Data must be collected on a continuous basis from the field i.e. from the
sources mentioned above.
3. Evaluating and analysing the data: In this step, company managers check the data that they
have collected for validity and reliability. Then they interpret the results organize them so
users can find what they need more easily.
4. Disseminating information and responding: Key information is then sent to decision
makers and managers. All inquiries are hopefully answered and all the people involved have
adequate information about the competition whoever he is. Based on the information gathered,
managers can also interpret the competition moves if any and his response to company moves.
Source: Malhorta Y. "Competitive Inteligence Programs: An Overview", 1996, Brint Institute, On-
line: http://www.brint.com/papers/ciover.htm
1.1.2.1 Improving CI Capabilities
The way a company conducts competitive intelligence can always be improved so that the
maximum results are obtained from such a process. Improvement can occur by following and
implementing the five steps - methods that are given bellow.
1. A CI plan should be created. Such a plan should contain objectives, strategies and tactics and
maybe a small roadmap on how to go about to conduct and manage CI.

NPD Stage 1: Idea Generation
18
2. Competitive Intelligence should be taken outside of product management. One must consult
experts that the company already has. Help from sales, customer service, field operations and
employees can be very valuable. In this way one can obtain information that can help on
product development and form strong inner - company relationships.
3. One should be creative with external tactics. For someone to get as much information about
his competition as possible, he must develop creative ways for obtaining it. Some of the ways
that can be implemented are mentioned in the description of CI.
4. A Competitive Development Matrix should be created. Such a matrix can be of the form of a
combination of the CI Tool and the CI File given. (See the two files for details)
5. One must conduct competitive intelligence ethically and legally. To do that one should follow
the ten CI commandments.
I will not lie when presenting myself to the competition.
I will observe the company's legal guidelines set by the legal department.
I will not tape - record a conversation without the permission of the person - persons
involved.
I will not bribe.
I will not plant listening - recording devices.
I will not deliberately mislead anyone in an interview.
I will neither give nor obtain price information to the competitor by unethical means.
I will not swap misinformation.
I will not steal a trade secret.
I will not press someone for information knowing that this action may jeopardise that
parson's job or reputation.
1.1.2.2. Case Studies - Examples
Competitive Intelligence Case study 1: "Discovering the launch date of a competitive product".
A client of a competitive intelligence consultancy based in the UK wanted to know the date of the
launch of a new competitive product. The client in question was not ready to launch his new
product and did not want to lose his share of the market from a new emerging competitive product.
Having the information of product launch, would allow the client to launch a counter - publicity
campaign so that the effect of the new product advertising campaign would be much smaller and
therefore his market share would not suffer as much. The consultancy discovered the new product
launch date directly or otherwise and by interviewing the following group of people.
Journalists: since they would have this kind of information for publicity reasons.
Members of the competitors PR agency or advertising agency: since they undoubtedly
have this kind of information since they are the ones managing the new product's
promotion and advertising.
Packaging suppliers: since they would have information on changes of production runs
and so a new product launch date could have been estimated.
Supermarket managers: since they would have been warned to reserve shelf space for
the new product.
All of the above are people that they did not realize the sensitivity of the information involved and
so did not compromise the competitive intelligence program that was under way.

NPD Stage 1: Idea Generation
19
Competitive intelligence Case Study 2: "Establishing a competitor's capabilities".
A big electronic parts manufacturer wanted to know about a competitor's warehouse handling
capabilities, and from that, estimate the market demand for the competitor's product. The
information needed was obtained by one of the manufacturer managers, who went on a Sunday
morning to the competitor's warehouse and chatted with the security guard of the front gate. The
manager used the following line of questions to discover the information needed plus a lot more.
When does the warehouse open for deliveries?
Are there enough bays to handle all the traffic?
Out of curiosity how many are there?
I wander, who else delivers to the warehouse?
By the answers that the manager got, not only he discovered that the demand exceeded the handling
capabilities of the competitor and so a market opening was available to accommodate the extra
demand by the manufacturer's products, but also that other companies, with different line of
products that were using the same warehouse, were having problems of satisfying the market
demand.
1.1.2.3 Consultants - Experts
Competia Inc (http://www.competia.com/home/)
Competia is the world's premier community for professionals in CI and strategic planning. It offers
everything, from news to custom coaching modules, to discounts on CI related material, to hosting
the CI symposium.
Aurora WDC (http://www.aurorawdc.com/)
The firm is a multi-faceted competitive intelligence outsourcing and support bureau. It serves
people and companies in every industry covering every continent worldwide.
Aware (http://www.competitive-intelligence.co.uk/)
A UK based competitive intelligence consultancy dedicated in helping a company gain and
maintain competitive advantage.
Richard Combes Associates Inc (http://www.combsinc.com/)
Leader in competitive intelligence consulting and research. Based in Chicago - USA.
Cipher Systems Inc (http://www.cipher-sys.com/)
Leading worldwide consultancy and solution developer fro companies engaged in competitive
intelligence or knowledge management.
Phoenix Consulting Group Inc (http://www.intellpros.com/)
NPD Stage 1: Idea Generation
20
1.1.2.4 Online Resources
1.1.2.4A. On-line CI Sources
US Patent and Trademark Office (http://www.uspto.gov). It is a non-commercial federal
entity of the US government, whose purpose is to promote the progress of science and to
protect the copyrights of inventors and innovators.
Search engine (http://164.195.100.11/netahtml/search-bool.html) of the US Patent image
and text database.
The European Patent Office website (http://www.eurpopean-patent-office.org). Members
of the EPO include all the EU member states plus some non - EU European countries.
The UK Patent Office (http://www.patent.gov.uk) - An organization devoted to enhancing
innovation and competitive advantage of British firms by granting intellectual property
rights.
Source for patent and invention documentation search (http://www.frankilforge.com),
market potential analysis and invention marketing to manufacturers. Specializing in
consumer and leisure markets.
Web site of the patent office (http://www.jpo.go.jp) of the Japanese government.
Elsevier (http://www.elsevier.com) - Web site of the leading worldwide publisher of
scientific, technological and medical information.
Business Monitor International (http://www.businessmonitor.com) - publishing specialist
business information on global emerging markets. Contains news, analysis, forecasts and
data. Need to register and some information comes with a cost.
KOMPASS (http://www.kompass.com) - excellent source of company data including
management, turnover, address, employees, export sales, product types, trade names, etc.
Some information must be purchased.
The site of National Institute for Economic & Social Research (http://www.niesr.ac.uk)
that contains information on microeconomic data in the UK. Also it is very good for
establishing international market trends.
1.1.2.4B Tools from Urenio Research Unit
Technology watch
(http://www.newventuretools.net/toolbox.html?toolwindow=http://193.92.80.99:8081/xeos/dyn
amic/onli/search.xsp): Easy and fast access to research results, and technology information, which
can increase the potential innovation capabilities of a company.
Website that helps SME's
(http://www.newventuretools.net/toolbox.html?toolwindow=http://services.oulutech.fi/vps/ind
ex_onli.html) (Small and Medium Enterprises) to gain access of knowledge through consortiums
or clusters of technological parks around the world.
1.1.2.5 References
"Competitive Analysis"

NPD Stage 1: Idea Generation
21
(http://www.betterproductdesign.net/tools/market/comp_analysis.htm), Good Design Practice
Program, Institute for Manufacturing & Engineering Design Center, University of Cambridge, UK,
Online, 2004
Malhorta, Y. "Competitive Intelligence Programs: An Overview"
(http://www.brint.com/papers/ciover.htm), Brint Research Institute, 1996
Prescott, J. E. & Gibbons, P. T. "Global Competitive Intelligence: An Overview", Global
Perspectives on Competitive Intelligence, Alexandria, Society of Competitive Intelligence
Professionals, 1993
1.1.3 Conjoint Analysis
In the 1960s and 70s, organizations and academics were looking for a way to understand how
people are taking decisions. They needed to know how people behaved during interviews. Did they
say things on top of their mind or did they say what the interviewer wanted to hear? In their studies,
academics, found that by looking at the ways people made decisions could predict which choices
would be made between products and services. This is how Conjoint Analysis was born. The
analysis produces market models for products and services, which enable companies to either
improve existing products or find ideas for new ones.
To understand how the analysis works, one should describe products according to their attributes
and features. For example a telephone device can be described by its weight, its appearance, its
battery life in the case of cordless phones etc. The analysis takes these attributes or features and
asks people to make a choice between same family products of different attributes. By asking for
adequate number of attributes or features, the interviewer can work out a numerical representation
of how valuable each attribute is to a customer.
Knowing the values of each attribute in respect to customer weight, one can compare one product
to a competitor one and optimise attributes for a new one that the customer will embrace.
Developing a Conjoint Analysis involves the following steps:
1. Choose product attributes, for example, appearance, size or price.
2. Choose the values or options for each attribute. For example in the case of size one can choose
the levels 5, 10, 15 and 20 cm. The more options one chooses for an attribute the more burden
will be placed no the respondents.
3. Define products as a combination of attribute options. The set of combinations of attributes
that will be used will be a subset of the possible set of products.
4. Choose the form in which the attributes and the options will be presented, for example, as a
paragraph or as a picture.
5. Decide how the responses will be differentiated. For example responses can be split up
depending on the preferences of the respondents or depending on other characteristics of the
respondents such as age, location, etc.
6. Select the technique that will be used to analyse the data. There are different models that can
be used such as the Part-Worth model, the Liner model or the Ideal-Point model. In either way
special software written especially for conjoint analysis must be used to perform the statistics.
Source: QuickMBA, "Conjoint Analysis", On-line
http://www.quickmba.com/marketing/research/conjoint/

NPD Stage 1: Idea Generation
22
1.1.3.1 Case Studies - Examples
Conjoint Analysis Case Study 1: "Finding out which attribute of some of the breakfast cereals
available in the market is more attractive to customers and therefore which attribute to optimize in a
new cereal development"
The conjoint analysis study that focused on the problem described above was conducted by Sydney
University in Australia, in behalf of a large food company that was considering entering into the
breakfast foods market. The study was conducted using 90 people, randomly selected as interview
respondents. The product attributes and the levels of each product attribute used are given bellow.
ATTRIBUTES LEVELS
1. Brand Kellogg, Sanitarium, Uncle Toby's, No Frills
2. Price (relative to market average) -30%, -10%, +10%, +30%
3. Sugar content High. Low
4. Fibre content High. Low
5. Fat content High. Low
6. Toys inside the pack Yes, No
Using some kind of software that was purchased from an outside source and written especially for
conjoint analysis, the interview questions were designed based on the attributes and levels given
above and the result data were analysed to yield the following graph of "Relative Influence on
Attribute Preference".
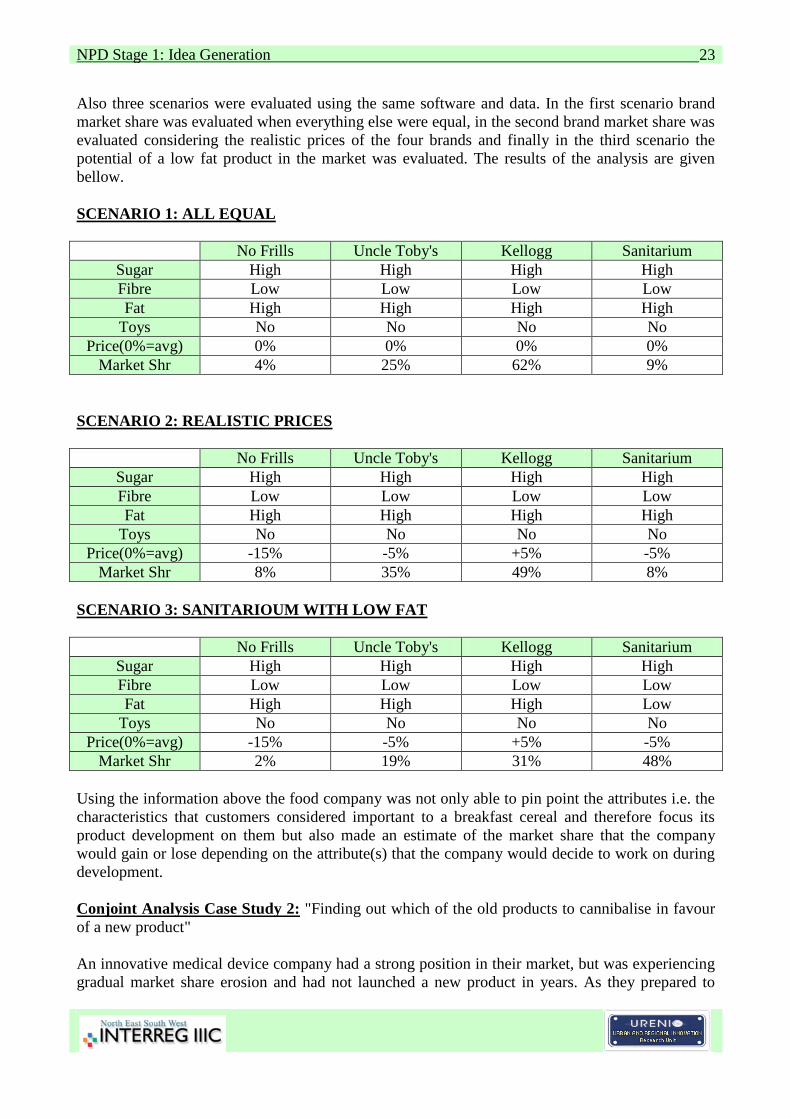
NPD Stage 1: Idea Generation
23
Also three scenarios were evaluated using the same software and data. In the first scenario brand
market share was evaluated when everything else were equal, in the second brand market share was
evaluated considering the realistic prices of the four brands and finally in the third scenario the
potential of a low fat product in the market was evaluated. The results of the analysis are given
bellow.
SCENARIO 1: ALL EQUAL
No Frills Uncle Toby's Kellogg Sanitarium
Sugar High High High High
Fibre Low Low Low Low
Fat High High High High
Toys No No No No
Price(0%=avg) 0% 0% 0% 0%
Market Shr 4% 25% 62% 9%
SCENARIO 2: REALISTIC PRICES
No Frills Uncle Toby's Kellogg Sanitarium
Sugar High High High High
Fibre Low Low Low Low
Fat High High High High
Toys No No No No
Price(0%=avg) -15% -5% +5% -5%
Market Shr 8% 35% 49% 8%
SCENARIO 3: SANITARIOUM WITH LOW FAT
No Frills Uncle Toby's Kellogg Sanitarium
Sugar High High High High
Fibre Low Low Low Low
Fat High High High Low
Toys No No No No
Price(0%=avg) -15% -5% +5% -5%
Market Shr 2% 19% 31% 48%
Using the information above the food company was not only able to pin point the attributes i.e. the
characteristics that customers considered important to a breakfast cereal and therefore focus its
product development on them but also made an estimate of the market share that the company
would gain or lose depending on the attribute(s) that the company would decide to work on during
development.
Conjoint Analysis Case Study 2: "Finding out which of the old products to cannibalise in favour
of a new product"
An innovative medical device company had a strong position in their market, but was experiencing
gradual market share erosion and had not launched a new product in years. As they prepared to

NPD Stage 1: Idea Generation
24
launch a new series of products, important marketing issues needed to be solved -- would the new
products cannibalise their already strong position, should the new product series replace or
supplement their current products, how should product options be bundled and priced for value, etc.
Using conjoint analysis as an integral piece of the market research, the strong position of the
company's products was confirmed. Two of the new products offered tremendous value to a
significant segment of customers and could command a premium price. Two other products were
shown to be favoured primarily from their current customer base and, as proposed, did not attract
current non-customers. By unbundling product features, and pricing them separately, a low-priced,
low-feature product line could compete in the price-sensitive market segment, while not
cannibalising their current products. The net effect was a multi-tiered product line, with value
pricing, and a very successful new product launch.
Source: Nelson C, "Conjoint Analysis Case Study", Sydney University, On-line
http://www.futuretoolkit.com/conjcase.htm
1.1.3.2 Consultants - Experts
Brand Institute (http://www.brandinstitute.com/index.htm)
The institute utilizes statistical methods such as Adaptive Conjoint Analysis to facilitate optimal
marketing decisions based on marketplace information.
Mangen Research (http://www.mrainc.com/conj_intro.html)
SpeedBack Market Research and Consulting (http://www.speedback.com/)
The firm is a full-time research agency specializing in Internet based and interactive market
research methods including Conjoint Analysis, Qualitative Research and Quantitative Research.
1.1.3.3 Software Tools
http://www.tigris-software.com/tigris8.htm
TiCon 1.3 is the name of the Conjoint Analysis software that if offered by the company Tigris
Software Systems. A demo is available that allows a complete set of the software features but it
only works for up to 3 attributes and 2 options for each attribute.
http://www.sawtoothsoftware.com
ACA, CBC and CVA are the names of the different software programs for conjoint analysis
offered by Sawtooth Software Inc. There is a demo version, which includes the capability of
writing web-based surveys for conjoint analysis. One can build his own questionnaire and analyse
the survey using the local web server installed with the demo program.
http://www.skim.nl/software/Ssd_ACA.html
Home of the ACA (Adaptive Conjoint Analysis) software offered by Skim Software Division.
The software includes interviewing, analysis and scenario simulations capabilities. There is a demo
available from the site.
http://www.palisade.com

NPD Stage 1: Idea Generation
25
The software offered by Palisade is called @Risk and it is really an add-on for MS Excel. It
allows users to run probability distributions and Monte Carlo simulations for conjoint analysis data.
http://www.statease.inc
Design Ease 6 is the name of the software offered by Stat-Ease. With the software a user can run
Design of Experiment simulations and it is intended for manufacturing, R&D and market research.
1.1.3.4 References
Acito, Franklin and Arun K. Jain, "Evaluation of Conjoint Analysis Results: A Comparison of
Methods", Journal of Marketing Research, 17, pages 106-112, 1980.
Dobney, "Conjoint Analysis"
(http://www.dobney.com/Conjoint/Conjoint_analysis.htm), Dobney Corporation Limited, 2002
DSS Research, "Conjoint Analysis" (http://www.dssresearch.com/conjoint), DSS Research
Co, 2001
Faura, Julio, "Contribution to Web-based Conjoint Analysis for Market Research,"
Management of Technology S. M. Thesis, Cambridge, MA: MIT, 2000.
Mangen Research, "Introduction to Conjoint Analysis"
(http://www.mrainc.com/conj_intro.html), 2002
Brigham Young University Marketing Dept, "Conjoint Analysis Tutorial"
(http://marketing.byu.edu/htmlpages/tutorials/conjoint.htm)
SpeedBack Market Research, >"Conjoint Analysis"
(http://www.speedback.com/conjoint_analysis.htm), 2002
SPSS Inc "Determine Customer Preferences When Planning with SPSS Conjoint"
(http://www.spss.com/spssmr/conjoint/planning.htm), SPSS Inc, 2002
Survey Site Inc, "The Basics of Conjoint Analysis"
(http://www.surveysite.com/newsite/docs/conjoint-tutor.html), Survey Site Inc, 2002
1.1.4. Delphi Technique
The Delphi Technique was originally developed by Rand Corporation in the late 60's as a
forecasting methodology. As the years passed its purpose was changed to the one of gathering
information and judgments from participants to facilitate problem solving, planning and decision-
making without physically assembling the contributors. Instead information is exchanged via mail,
email or fax. The technique is designed to take advantage of participants' creativity as well as the
facilitating effects of group involvement and interaction. It is structured to take full advantage on
the merits of group problem solving and minimize its liabilities. It is a great tool for idea generation
using external experts as well as product definition or product concept development.
The technique requires the presence of a coordinator whose job is to organize requests for
information; information received and is responsible for the communication with the participants.
Mail as means of communication can be used but email and fax can decrease the time required for
the process to be completed considerably. For example for a process using 20 participants a total of
44 days is required for the process to be completed using common mail and only 3-4 days using
email or fax.

NPD Stage 1: Idea Generation
26
The major steps of the technique are as follows:
1. The coordinator must identify the issue and prepare the first questionnaire which asks each
participant to start individual brainstorming so that as many ideas as possible to be generated on the
issue in hand.
2. Each participant must respond to the first questionnaire. His / hers ideas must be brief, concise,
and not fully developed. The participant must not try to justify or evaluate his ideas. The first
questionnaire must be returned to the coordinator anonymously.
3. The coordinator prepares and sends out a second questionnaire, which contains all the ideas
gathered by the first one, and asks the participants to comment on each idea's strengths and
weaknesses and to add some more if possible.
4. The participants respond to the second questionnaire and send it back to the coordinator.
5. The coordinator prepares and sends out a third questionnaire that sums up all the information
gathered in the previous step and asks for additional information, clarifications, strengths,
weaknesses and new ideas.
6. The participants respond to the third questionnaire and send it back to the coordinator.
7. The process can go on until no new ideas are emerging and all strengths, weaknesses and
opinions concerning the ideas gathered are identified.
When all ideas that have been gathered and all their strengths and weaknesses are identified the
exercise is declared finished. The end product is a list of highly evaluated ideas. If it is required the
coordinator can at this point screen or assess the ideas gathered by using two methods. In the first
method the coordinator prepares a questionnaire that lists all the ideas and asks the participants to
scale each idea by a number of 0 to 10, 10 being the best. The participants send back to the
coordinator rating forms and the coordinator compiles the results and finds the best idea that
addresses the issue best. In the second method the coordinator asks each participant to vote for the
top 5 ideas. The votes are returned to the coordinator who measures the results and prepares a
report on the best five ideas.
Sources:
Cline Alan, “Prioritization Process Using Delphi Technique”, White Paper, Carolla
Development, 2000, On-Line http://www.carolla.com/wp-delph.htm
Randall B Durham, “The Delphi Technique”, School of Business, University of Wisconsin,
Sep 1998, On-line http://instruction.bus.wisc.edu/obdemo/readings/delphi.htm
1.1.4.1 Consultants - Experts
Avant Consulting
(http://www.avantconsulting.com/services.asp?serv=SP&desc=36)
1.1.4.2 References
Cline A, "Prioritization Process Using the Delphi Technique"
(http://www.carolla.com/wp-delph.htm), Carolla Development, 2000
Randal B. Dunham, "The Delphi Technique"
(http://instruction.bus.wisc.edu/obdemo/readings/delphi.htm), School of Business,
University of Wisconsin, USA, Sep 1998
Stuter L, "The Delphi Technique"

NPD Stage 1: Idea Generation
27
(http://www.premier1.net/~barkonwd/school/DELPHI.HTM)
1.1.5 Morphological Charts
Morphological charts provide a well-structured approach to concept generation by widening the
area of search for solutions to a defined design problem. It can help the design team to generate a
complete set of alternative design solutions through a systematic analysis of the form, configuration
or functionality of a product.
The chart is a visual way to capture the required product functionality and explore different ways
and combinations to achieve that functionality. For each product function there may be a number of
possible solutions. The chart enables these solutions to be expressed and provides the means for
considering alternative combinations. This can help in the early visualization of the product
architecture through the generation of different sub-solutions that no one has before thought about.
When well used it can accommodate a user driven approach to product concept development.
The methodology behind the formation of such charts is simple. There are three main steps
description of which is given bellow.
Step 1: List product functions or features that are needed to the product. The list should not be too
long but should include the main product functions. Typically the list should not contain more than
10 items. It is useful to list the functions in an order of importance, putting the most important first
and the least important last. Each function listed should be exclusive in regards to the others.
Step 2: List the potential solutions by which each function listed earlier can be achieved. One
should think about new ideas as well as known solutions and all solution should be noted and
expressed visually as well as using words. Any important characteristics of a solution should also
be noted. Also a level of generality must be maintained.
Step 3: Draw up a chart containing all possible sub-solutions, which will represent the
morphological chart. The chart will include the total solution for the product and will be made up
from various sub-solutions. The total number of combinations can be large so the design team will
need to select the ones that are feasible and producible. Also each solution or combination of
solutions can be named so that it can be easily found and evaluated at a later time.
Source: Better Product Design, Institute of Manufacturing, University of Cambridge, On-line
http://www.betterproductdesign.net/tools/concept/morph_charts.htm
1.1.5.1 Case Studies – Examples
Case Study 1: Mobile phone concept generation using a morphological chart.
For a widely used and available product as the one of a mobile phone, a morphological chart can be
a very useful tool for finding a quick solution to new product concept generation. The possible
functions of a mobile phone are easily recognized and include holding, storage, dialling, display,
power supply, signal reception, signal processing, sound output, extra features, etc. Having these
and more in mind one can easily find solutions. For example in the case of holding possible

NPD Stage 1: Idea Generation
28
solutions can be stopwatch-type grip, attached to clothing, gun grip, etc. Inserting all the possible
functions and their solution into a table as the one shown bellow forms a morphological chart from
which a total solution for concept development can be generated.
Table 1: Morphlogical Chart Example for a Mobile Phone
Morphological chart for a mobile phone
Function Options
Holding Stopwatch style Calculator style not held
Storage Pin badge on sleeve on belt in pocket
Entering no Keypad Voice Bar code
Display LED LCD None
Power supply Mains Battery Solar
Signal reception Internal aerial External aerial Cable aerial
Sound output Speaker Earphone
Sound input Internal microphone External microphone
Extra features Calculator Memory bank Alarm Games
Source: Better Product Design, On-line
http://www.betterproductdesign.net/tools/concept/morph_charts.htm
Considering the above morphological chart one possible solution could be a mobile phone that it is
not held, can be stored as a pin badge, a keypad is used to dial the number, with no display, power
by a battery, with an internal aerial, an internal microphone and with a large memory bank.
Source: Better Product Design, Institute of Manufacturing, University of Cambridge, On-line
http://www.betterproductdesign.net/tools/concept/morph_charts.htm
Case Study 2: Forklift truck concept generation using a morphological chart.
In the case of generating a concept for a product such as a forklift truck to be used in a warehouse a
morphological chart would look as the one shown bellow.
Table 1: Morphlogical Chart Example for a Forklift Truck
Morphological chart for a forklift truck
Function Options
Support Wheels Tracks Slides Spheres
Steering Wheels Rails Air thrust
Stopping Reverse power Brakes Blocks
Moving Air thrust Power to wheels
Power Electric Gas Petrol Steam
Lifting Screw Hydraulics
Operator Seat in front Seat in back Standing Walking
Transmission Hydraulic Gears Flexible cable
Source: Kramer Steven, On-line
http://www.mime.eng.utoledo.edu/design_clinic/An%20Overview%20of%20the%20Design%20Pr
ocess/An%20Overview%20of%20the%20Design%20Process.PPT
NPD Stage 1: Idea Generation
29
Considering the above morphological chart a forklift truck can be designed to have wheels for
support and steering, brakes for stopping, power to wheels for moving, be electric, use a hydraulic
system for lifting things and a hydraulic system for transmission and having the operator walking
behind the truck.
Source: Kramer Steven, Naganathan Nagi, “An Overview of Design Process”, MIME Department,
University of Toledo, On-line
http://www.mime.eng.utoledo.edu/design_clinic/An%20Overview%20of%20the%20Design%20Pr
ocess/An%20Overview%20of%20the%20Design%20Process.PPT
1.1.5.2 References
"Morphological Charts"
(http://www.betterproductdesign.net/tools/concept/morph_charts.htm), Good Design Practice
Program, Institute for Manufacturing & Engineering Design Center, University of Cambridge, UK,
2004
Kardos G, "The Morphological Method"
(http://www.carleton.ca/~gkardos/88403/CREAT/MORPHO.html), Dept of Mechanical and
Aerospace Engineering, Carleton University, Ottawa, Canada, 1998
1.1.6. Six Thinking Hats
This technique is a very important one in the case of looking of project decisions from a number of
different prospectives. Edward de Bono created the tool in his book "6 Thinking Hats. For someone
to be creative in his decision-making especially in cases of large project management such as NPD
projects, he must look at problems from 4 different points of views. He must look through the
emotional point of view, the intuitive point of view, the creative point of view and the negative
point of view. The tool helps people to do just that.
The tool can be used during team meetings or by a single person. In the case of team meetings can
be very helpful since it can block confrontations of people with completely different points of
views or thinking styles. The way the tool can be used is the following.
The thinking styles are divided and sorted according to different colored hats. In particular:
* The White Hat represents the thinking that is based on the raw data available. Information for
example on competition, market place and others is taken into account to make decisions.
* The Red Hat represents people that look at problems using intuition, gut reaction and emotion.
Also represents the activity of understanding other people's emotion (for example emotional
customer reactions).
* The Black Hat represents the negative thinking. Bad points of a decision are considered. Also
decisions are looked at cautiously and defensively. Black Hat thinking helps in making more tough
and resilient plans.
* The Yellow Hatrepresents positive thinking. All the optimistic points of view are taken into
account when making a decision. Also all the benefits and values of the decision are noted.
* The Green Hat represents creativity. Under this hat one can develop creative solutions to a
given problem. The hat is surrounded by a lot of creativity tools that are available for use.

NPD Stage 1: Idea Generation
30
* The Blue Hat represents control. People assigned to this hat during meetings for example
should be able to control planning. If for instance if ideas are scarce then the person assigned to the
Blue Hat must direct the discussion towards the Green Hat thinking or in other words towards
creative thinking.
Source: Mind Tools, “Six Thinking Hats – Looking at a Decision from all Points of View”, On-
line http://www.mindtools.com/pages/article/newTED_07.htm
1.1.6.1. Case Studies - Examples
Case Study: "Decision making about the construction of a new office building by a real estate
- Property Company".
The directors of a property company are looking at whether they should construct a new office
building. The economy is doing well, and the amount of vacant office space is reducing sharply. As
part of their decision they decide to use the 6 Thinking Hats technique during a planning meeting.
Looking at the problem with the White Hat, they analyse the data they have. They examine the
trend in vacant office space, which shows a sharp reduction. They anticipate that by the time the
office block would be completed, that there would be a severe shortage of office space. Current
government projections show steady economic growth for at least the construction period.
With Red Hat thinking, some of the directors think the proposed building looks quite ugly. While
it would be highly cost-effective, they worry that people would not like to work in it.
When they think with the Black Hat, they worry that government projections may be wrong. The
economy may be about to enter a 'cyclical downturn', in which case the office building may be
empty for a long time. If the building is not attractive, then companies will choose to work in
another better-looking building at the same rent.
With the Yellow Hat, however, if the economy holds up and their projections are correct, the
company stands to make a great deal of money. If they are lucky, maybe they could sell the
building before the next downturn, or rent to tenants on long-term leases that will last through any
recession.
With Green Hat thinking they consider whether they should change the design to make the
building more pleasant. Perhaps they could build prestige offices that people would want to rent in
any economic climate. Alternatively, maybe they should invest the money in the short term to buy
up property at a low cost when a recession comes.
The Blue Hat has been used by the meeting's Chair to move between the different thinking styles.
He or she may have needed to keep other members of the team from switching styles, or from
criticizing other peoples' points.
Source: Mind Tools, “Six Thinking Hats – Looking at a Decision from all Points of View”, On-
line http://www.mindtools.com/pages/article/newTED_07.htm

NPD Stage 1: Idea Generation
31
1.1.6.2. References
Bono E. "Six Thinking Hats", Back Bay Books, 1st Edition, 1999.
Creative Thinking, >"How to Use De Bono's Six Thinking Hats to Improve Your Thinking
Skills"
(http://www.buildingbrands.com/goodthinking/08_six_thinking_hats.shtml), Building
Brands.
Labelle S. "Six Thinking Hats"
(http://members.optusnet.com.au/~charles57/Creative/Techniques/sixhats.htm), Creativity
Web.
Mind Tools, "Six Thinking Hats: Looking at a Decision form all Points of View"
(http://www.mindtools.com/pages/article/newTED_07.htm), Mind Tools, 2004.
1.1.7 TRIZ - Idea generation using a problem-solving tool
“Idea generation for product development is an inventive problem. Until some years ago its
solution was centered into the field of psychology where the links between the brain and
insight and innovation are studied. Methods such as brainstorming and trial-and-error were
commonly suggested and used. Depending on the complexity of the problem, the number of
trials would vary. If the solution lied within one's experience or field, such as mechanical
engineering, than the number of trials were fewer. If the solution was not forthcoming, then
the person that performed idea generation would look beyond his experience and knowledge
to new fields such as chemistry or electronics. Then the number of trials would grow large
depending on how well the person could master psychological tools like brainstorming,
intuition, and creativity.
Genrich S. Altshuller, born in the former Soviet Union in 1926, developed a better
approach, relying not on psychology but on technology. Serving in the Soviet Navy as a
patent expert in the 1940s, his job was to help inventors apply for patents. He found,
however, that often he was asked to assist in solving problems as well. His curiosity about
problem solving led him to search for standard methods. What he found were the
psychological tools that did not meet the rigors of inventing in the 20th century. At a
minimum, Altshuller felt a theory of invention should satisfy the following conditions:
Be a systematic, step-by-step procedure
Be a guide through a broad solution space to direct to the ideal solution
Be repeatable and reliable and not dependent on psychological tools
Be able to access the body of inventive knowledge
Be able to add to the body of inventive knowledge
Be familiar enough to inventors by following the general approach to problem
solving.
In the next few years, Altshuller screened over 200,000 patents looking for inventive
problems and how they were solved. Of these (over 1,500,000 patents have now been
screened), only 40,000 had somewhat inventive solutions; the rest were straightforward
improvements. Altshuller more clearly defined an inventive problem as one in which the
solution causes another problem to appear, such as increasing the strength of a metal plate
causing its weight to get heavier. Usually, inventors must resort to a trade-off and
compromise between the features and thus do not achieve an ideal solution. In his study of
patents, Altshuller found that many described a solution that eliminated or resolved the

NPD Stage 1: Idea Generation
32
contradiction and required no trade-off.
Altshuller categorized these patents in a novel way. Instead of classifying them by industry,
such as automotive, aerospace, etc., he removed the subject matter to uncover the problem
solving process. He found that often the same problems had been solved over and over
again using one of only forty fundamental inventive principles. If only later inventors had
knowledge of the work of earlier ones, solutions could have been discovered more quickly
and efficiently.
In the 1960s and 1970s, he categorized the solutions into five levels.
Level one: Routine design problems solved by methods well known within the
specialty. No invention needed. About 32% of the solutions fell into this level.
Level two: Minor improvements to an existing system, by methods known within
the industry, usually with some compromise. About 45% of the solutions fell into
this level.
Level three: Fundamental improvement to an existing system, by methods known
outside the industry. Contradictions resolved. About 18% of the solutions fell into
this category.
Level four: A new generation that uses a new principle to perform the primary
functions of the system. Solution found more in science than in technology. About
4% of the solutions fell into this category.
Level five: A rare scientific discovery or pioneering invention of essentially a new
system. About 1% of the solutions fell into this category.
He also noted that with each succeeding level, the source of the solution required broader
knowledge and more solutions to consider before an ideal one could be found.
What Altshuller tabulated was that over 90% of the problems engineers faced had been
solved somewhere before. If engineers could follow a path to an ideal solution, starting with
the lowest level, their personal knowledge and experience, and working their way to higher
levels, most of the solutions could be derived from knowledge already present in the
company, industry, or in another industry.
For example, a problem in using artificial diamonds for tool making is the existence of
invisible fractures. Traditional diamond cutting methods often resulted in new fractures,
which did not show up until the diamond was in use. What was needed was a way to split
the diamond crystals along their natural fractures without causing additional damage. A
method used in food canning to split green peppers and remove the seeds was used. In this
process, peppers are placed in a hermetic chamber to which air pressure is increased to 8
atmospheres. The peppers shrink and fracture at the stem. Then the pressure is rapidly
dropped causing the peppers to burst at the weakest point and the seedpod to be ejected. A
similar technique applied to diamond cutting resulted in the crystals splitting along their
natural fracture lines with no additional damage.
Altshuller distilled the problems, contradictions, and solutions in these patents into a theory
of inventive problem solving which he named TRIZ. This theory can be applied to idea
generation for product development or at the process of product development, as both are
inventive processes.”
Author: Glenn Mazur, Ideation International Inc., 23713 Riverside Drive, Southfield MI
48034 USA
Source: “Theory of Inventive Problem Solving”, Ideation International Inc, On-line
http://www.mazur.net/triz/

NPD Stage 1: Idea Generation
33
1.1.7.1 TRIZ Process Methodology
The TRIZ process as any process is governed by a simple and easy step-by-step methodology. This
methodology is illustrated in the figure given below.
The main steps of the methodology are as follows.
Step 1: Identify the problem in hand. In the case of early product development that would be the
generation of new product ideas according to already set criteria such as customer needs and
desires. In later stages of product development the problem could be a technical, engineering or
design issue that needs solving.
Figure 1: Graphical Representation of the TRIZ Methodology
Source: “Theory of Inventive Problem Solving”, Ideation International Inc, On-line
http://www.mazur.net/triz/
Step 2: Formulate the problem and create the prism of TRIZ. The problem is analyzed better and a
full description of what is looked for is noted.
Step 3: Search for a previously solved problem. In the case of early product development this
implies performing competitive analysis. Similar products that somewhat satisfy customer needs
can be used as initiatives for new products by changing their characteristics or attributes to satisfy
completely customer needs. In later stages of product development, a search in patent offices for
example may reveal a solution to the problem in hand.
Step 4: Look out for similar solutions to the ones already found. Sometimes although a single
solution may look to be the best by doing more research a new one could appear that would be even
better one. One should carefully select the solution to the problem in hand carefully after serious
consideration of all of the alternatives.

NPD Stage 1: Idea Generation
34
Source: “Theory of Inventive Problem Solving”, Ideation International Inc, On-line
http://www.mazur.net/triz/
1.1.7.2 Consultants - Experts
Triz Chance Network (http://www.triz-chance.ru/triz-chance_en.html)
INSYTEC (TRIZ training programs) (http://www.insytec.com/about.htm)
Elite Consulting (http://www.elite-consulting.com/problem_solving.htm)
Triz Consulting Inc (http://www.trizconsulting.com/)
1.1.7.3 References
"Assessment of Invention via Utilization of Ideation Methodology (the U.S. Adaptation of
the Russian-developed TRIZ)", Ideation International Inc, Santa Monica, CA, 1995.
"Directed Product Evolution", Ideation International Inc, Santa Monica, CA, 1995.
"The Process for Systematic Innovation", Ideation International Inc, Santa Monica, CA,
1995
"TRIZ History and Background", Ideation International Inc, Santa Monica, CA, 1995
Altshuller H, "The Art of Inventing (And Suddenly the Inventor Appeared)", Worcester,
MA, Technical Innovation Center, 1994
Braham J "Inventive ideas grow with Triz", Machine Design, Vol. 67 No. 18. October 12,
1995.
Kaplan S, "An Introduction to TRIZ: The Russian Theory of Inventive Problem Solving",
Draft. Ideation International Inc, Santa Monica, CA.
Mazur G, >"Theory of Inventive Problem Solving - TRIZ"< (http://www.mazur.net/triz/),
1995
Verduyn D M & Wu A, "Integration of QFD, TRIZ, & Robust Design: Overview &
Mountain Bike Case Study", ASI Total Product Development Symposium, Nov. 1-3, 1995,
Dearborn, MI, 1995
1.2 Level Assessment for Stage 1: Idea Generation
Assessment 1 evaluates the ideas generated in Level 1 and both the way and the tools used for idea
generation.
According to the answers a user gives to the questions a GO, HOLD or KILL decision is provided
for further progression in the roadmap and specifically to Level 2. In Appendix 1 the template for
Level Assessment is included.

NPD Stage 2: Idea Screening.
35
NPD Stage 2: Idea Screening
Once all viable ideas are gathered and managed, they must be further developed, examined,
prioritised and evaluated so that a single product idea is selected for further development into a
product concept. This whole process is called screening and is the main problem to solve in this
Level using different tools and techniques.
2.1 Tools & Solutions
Once all viable ideas are gathered and managed, they must be further developed, examined,
prioritised and evaluated so that a single product idea is selected for further development into a
product concept. This whole process is called screening and is the main problem to solve in this
Level using different tools and techniques.
There are many methods to screen ideas and select the best one for further development. Ideas can
be screened against company’s marketing strategies, against company sales and profitability
minimum’s, along with key customers and buyers etc. All screening processes should give
adequate answers to key questions such as “Is it worth it”, “Can the product win into the market”,
“Is it real”. Further analysis of such questions is given bellow.
Table 1: Assessing New Product Feasibility
Is it real? Is the market real? Is there a need?
Will the customers buy?
Is the product real? Will it satisfy the market?
Can it be made?
Can we win? Product competitive? Differentiation?
Low cost position?
Company competitive? Industry structure?
Organizational effectiveness?
Is it worth it? Will it be profitable? Is the return adequate?
Is the risk acceptable?
Satisfy other needs? Supports company’s objectives?
Other factors?
Source: Product Development Forum
The main idea screening methods are given bellow.
Screening Ideas Against Company’s Marketing Strategies
Idea screening against new or pre-existing company marketing strategies will reinforce company
focus and use of scare company resources. In this case the company’s marketing strategy acts as a
guideline for action. Such a strategy should consist of the following.

NPD Stage 2: Idea Screening.
36
A definition of the target customer group, either demographically, or by lifestyle or by using
habits etc.
A translation of the company’s mission into a measurable annual objective.
A set of product standards such as achievement of marketing goal, response to competition,
profits, sales etc.
A check list of accomplishments such as marketing spending, R&D spending, product
quality, market positioning, etc.
If any of the product ideas that are screened are not compatible with the company’s marketing
strategies, then one can either consider altering these strategies or not pursuing at all a new product
concept development.
Screening Ideas Against Company Sales and Profitability Minimums
Every new product must have the ability to generate a minimum amount of sales and subsequently
profits. The number of sales and the profit margin depend on the size of the company. For example
large consumer goods companies have an average profit margin of around 60%. This means that for
every item they are selling, 60% of its price is profit and only 40% covers the development and
production costs.
If a small company is competing with large ones, knowledge of profit margins and sales
potentiality of the competing companies is essential so that to provide a successful business
strategy. This strategy can be used to screen new product ideas that will be able to compete in a
market.
Screening Ideas Against Key Customers and Buyers
Data, which can be collected along with new product ideas in the first stage of new product
development, can be used to screen ideas. This means that input from customers cannot only
provide new ideas but also the means to screen them.
Managers can get so committed to a product idea and subsequently to a product concept, that
sometimes proceed to product development before all customer data is analysed and evaluated. To
avoid this, Qualitative Research and Quantitative Research, can be invaluable tools in evaluating all
data, screening ideas and producing feasible product concepts. Usually both tools are used after a
product concept is selected, to evaluate it against the customers.
2.1.1. Qualitative Research
Qualitative Research is an original company research tool on a subject such as new product ideas
or concepts, which is concerned with getting a "feel" for the research topic without doing a
numerical and statistical measurement. One can think of Qualitative Research as an in - depth -
interview or conversation with a target of potential users of the new product.
Qualitative Research might not accurately represent the whole of the market and consists of either
focus groups or individual interviews. Focus groups can be a manageable number of potential
buyers or users of products, to which a new product concept is presented. After the presentation
they are encouraged to discuss their opinion of the new product concept with an interviewer and

NPD Stage 2: Idea Screening.
37
with each other. A company can hire a research team to locate an adequate focus group, conduct
such a session and present the results. Otherwise the marketing department of the company can
conduct the whole process more economically. Individual interviews can be conducted with
potential users or buyers of the new product concept or with users of competitive products.
The analysis of the data gathered from Qualitative Research is usually subject to large statistical
errors and cannot predict the behaviour of a market accurately. False analysis of data can be
disastrous for large companies that may invest large amounts of money and time to develop the
wrong product concept. On the other hand, small companies that can recover quickly from actions
taken based on such data can use the research since they have low product development budgets,
they are closer to the market and the customers and they usually have small turnaround times.
Since Qualitative Research is based on interviewing a target group of potential users of a product
about the product concept, it really is a market research tool. As a market research tool, using a
market research plan and specially designed questionnaires can perform it. In the past Qualitative
Research interviews were conducted in person and face to face. Nowadays there is a shift in on-line
interviewing using the Internet.
2.1.1.1 Case Studies - Examples
Case Study: "Using Qualitative Research to identify market segments and new product solutions
for customers"
Company X used Qualitative Marketing so that it could determine the unnerved high-priority
opportunities for the company's technology, understand the priority segment, as well as its business
and product requirements to provide direction for product development and marketing and establish
the scope of opportunities for submission for next round funding.
Performance of Qualitative Marketing meant that the company conducted Qualitative Research of
the company's beta sites and prospects, identified and interviewed the influencers, and analysed the
findings and provided the results in report format.
The results of such an activity accomplished the following:
Determined the best segment to target. Expanded the segment beyond a narrowly defined
industry segment approach.
Identified five applications that the target customer needs. This included finding 28 areas of
problems that the company's product could solve.
Established the trends that affect the target customers buying behaviour.
Located seven influencer groups that reach the target audience.
2.1.1.2 Consultants - Experts
Association for Qualitative Research (http://www.aqrp.co.uk/)
The association represents people involved in qualitative research providing, help, tools and ways
of communication for those that use the technique.

NPD Stage 2: Idea Screening.
38
2.1.1.3 Software Tools
http://www.hostedsurvey.com/
The creators of the web site offer the creation of on-line surveys for every use.
http://www.myformsonline.com/
The web site offers the creation of survey forms that can be used for Qualitative Research or other
market research and have them submitted for on-line filling for 30 days for free. After that period
one can collect the results or it can install the software into a local server for a small fee and keep
the research going.
http://www.surveymonkey.com/home.asp?bhcd2=1041881504
SurveyMoney.com offers low cost on-line software that allows a user to design a Qualitative
Research survey and analyse the results based on the data collected during the survey.
2.1.1.4 References
Bocrec G, "Qualitative Methods Workbook"
(http://www.ship.edu/~cgboeree/qualmeth.html), Shippenberg University, Pennsylvania,
USA
CCH, "Qualitative Research"
(http://www.toolkit.cch.com/text/P03_3130.asp), CCH Business Owner's Toolkit, 2002
Hoepfl Marie, "Choosing Qualitative Research: A Primer for Technology Education
Researchers" (http://scholar.lib.vt.edu/ejournals/JTE/v9n1/hoepfl.html), Journal of
Technology Education, Vol. 9, No 1, 1997
InfoSpan Inc, "Qualitative and Quantitative Techniques"
(http://www.infospan.ca/qualquan.htm), Info Span Inc, Marketing Research Professionals
Mayers M. D, "Qualitative Research in Information Systems"
(http://www.qual.auckland.ac.nz/), Department of Management Science and Information
Systems, University of Auckland, New Zealand, Feb 2003
Norris J, "Qual Page: Resources for Qualitative Research"
(http://www.ualberta.ca/~jrnorris/qual.html), 2002
Schostac John, >"An Introduction to Qualitative Research"
(http://www.uea.ac.uk/care/elu/Issues/Research/Res1Cont.html), School of Education
and Professional Development, University of East Anglia, UK
2.1.2 FMEA (Failure Modes and Effects Analysis)
Nowadays customers are placing increased demands on companies for cheap high quality and
reliable products. As products become more and more complex, quality and reliability is getting
very hard to be maintained by manufacturers. In previous years reliability and quality was achieved
through extensive testing at the end of the product development process. The challenge was to
design reliable and quality products from the beginning of product development and in particular at
the early stages of product idea selection and product concept development.

NPD Stage 2: Idea Screening.
39
FMEA (Failure Modes and Effects Analysis), is used by many companies as their central pillar
of their design process, since it addresses in a big way the challenge mentioned above. FMEA can
provide a structured approach to the analysis of route causes of product failure, the estimation of
the severity of impact to the product, and the effectiveness of strategies for prevention. The output
of the analysis is the generation of action plans to prevent, detect or reduce the impact of potential
modes of product failure. When this analysis is conducted in the second Level of NPD i.e. the idea
screening - product concept development, for each generated idea, the selection of the best idea that
can result in a reliable and quality product can be achieved.
FMEA was firstly developed by the US military in the 1940's as a tool to improve the reliability of
military equipment. It was quickly adopted by the aerospace industry and the automotive industry
in the 70's. The analysis can be applied to address several issues such as organizational issues,
strategy issues, product design issues, production processes and individual product components.
FMEA cannot only be used in the early stages of product development. During the design and
product development processes updates are made to the product and its components. These changes
can introduce new failure modes and it is therefore critical to review some or all of the FMEA
analysis results by conducting an update to the analysis data.
Source: America Society for Quality, FMEA, On-line http://www.asq.org/learn-about-
quality/process-analysis-tools/overview/fmea.html
2.1.2.1 References
"Failure Modes and Effects Analysis Tool" (http://www.ihi.org), Institute for Healthcare
Improvement, 2004
ASI, "FMEA Roadmap (Design and Process)"
(http://www.amsup.com/fmea/index.htm), The American Supplier Institute, 2000
Crow K, "Failure Modes and Effects Analysis, FMEA"
(http://www.npd-solutions.com/fmea.html), DRM Associates, 2002
Robertson A & Shaw S, "Failure Modes and Effects Analysis, FMEA"
(http://technology.infomine.com/enviromine/Issues/cls_FMEA.html), Robertson Geo
Consultants Inc, 2004
2.1.3 Dot Sticking
Dot Sticking is a concept or idea selection tool that engages a wide number of people in the
process. It is a simple tool and easy to administer but does not provide rich feedback on the reasons
or motivations of the people involved in the process. It can be a powerful tool if the target
customers are involved in the process. The tool is extremely useful when there are a lot of potential
or competing ideas on the table. The tool is conducted by giving each person that it is involved a
series of colored dots that can be used to indicate preference. The tool's approach can be defined in
five simple steps.
Step 1. Each concept or idea must be presented in a similar way having the same amount of detail
so that the persons involved in the process can make their choices without bias. Usually small
drawings of each concept or idea are presented to the persons involved.

NPD Stage 2: Idea Screening.
40
Step 2. The participants must be then selected. The participants can be an internal product design
team or external stakeholders such as target customers or a combination of both.
Step 3. Dots are allocated to each of the participants. Depending on the number of concepts or
ideas these can be 3 to 5. Different colored dots can be used to indicate different things such as
performance, functionality, design etc. Participants can use his or her dots to indicate choice, by
sticking them next to the concept or idea drawing.
Step 4. After all participants have used their corresponding dots, dots for each concept or idea are
summed and the best concept is declared. Also a second round of dot sticking can take place by
selecting the best 2 or 3 strongest concepts or ideas.
Step 5. It is sometimes helpful and necessary to understand the reason of the voting or dot sticking.
In this case the participants are required to indicate or note likes and dislikes about the concepts by
using post-it notes. This enables the design team to keep strong features of rejected concepts in
mind.
Source: Better Product Design, Institute of Manufacturing, University of Cambridge, On-line
http://www.betterproductdesign.net/tools/concept/dot.htm
2.1.3.1 Case Studies - Examples
The following 4 figures are typical examples of concept or product idea drawings to be used in a
Dot Sticking process. As one can see each of the drawing has a number of dot that indicate the
choice of the participants in respect to it. Bellow the drawings some strong or week features of each
concept are noted for further study of participant motivations to be conducted by the design team.
The concept with the largest number of dots is chosen to be the one that can be further developed.
Figure 1: Dot Sticking Example

NPD Stage 2: Idea Screening.
41
Source: Better Product Design, Institute of Manufacturing, University of Cambridge, On-line
http://www.betterproductdesign.net/tools/concept/dot.htm
2.1.4 SWOT Analysis
SWOT Analysis is a very effective way of identifying one's Strengths and Weaknesses, and of
examining the Opportunities and Threats one can face. Carrying out an analysis using the SWOT
framework can help focusing activities into areas where the company is strong, and where the
greatest opportunities lie. By Performing a SWOT analysis, one can use the analysis results to
screen new product ideas against the characteristics of one's company and ultimately its strategic
goals.
The simplest way to carry out a SWOT Analysis one must write down answers to the following
questions. Where appropriate, one must use similar questions:
Strengths:
What are your advantages?

NPD Stage 2: Idea Screening.
42
What do you do well?
What do other people see as your strengths?
One must consider this from his own point of view and from the point of view of the people he
deals with. One mustn't be modest - be realistic. If there are any difficulties with doing this, one
must try writing down a list of the company's characteristics. Some of these will hopefully be
strengths!
Weaknesses:
What could you improve?
What do you do badly?
What should you avoid?
Again, one must consider this from an internal and external basis - do other people seem to
perceive weaknesses that you do not see? Are the competitors doing any better than the company?
It is best to be realistic now, and face any unpleasant truths as soon as possible.
Opportunities:
Where are the good opportunities facing you?
What are the interesting trends you are aware of?
Useful opportunities can come from such things as:
Changes in technology and markets on both a broad and narrow scale
Changes in government policy related to your field
Changes in social patterns, population profiles, lifestyle changes, etc.
Local Events
Threats:
What obstacles do you face?
What is your competition doing?
Are the required specifications for your job, products or services changing?
Is changing technology threatening your position?
Do you have bad debt or cash-flow problems?
Carrying out this analysis will often be illuminating - both in terms of pointing out what needs to be
done, and in putting problems into perspective. One can also apply SWOT analysis to one's
competitors - this may produce some interesting insights!
Source: Manktelow James, "SWOT Analysis: Discover New Opoortunities. Manage and Eliminate
Risks", Mind Tools, On-line: http://www.mindtools.com/pages/article/newTMC_o5.htm
2.1.4.1 Case Studies - Examples
Case Study: "SWOT Analysis on a starting up small consulting business"

NPD Stage 2: Idea Screening.
43
A start-up small consultancy business might carry out the following SWOT analysis:
Strengths:
We are able to respond very quickly as we have no red tape, no need for higher
management approval, etc.
We are able to give really good customer care, as the current small amount of work means
we have plenty of time to devote to customers
Our lead consultant has strong reputation within the market
We can change direction quickly if we find that our marketing is not working
We have small overheads; so can offer good value to customers
Weaknesses:
Our company has no market presence or reputation
We have a small staff with a shallow skills base in many areas
We are vulnerable to vital staff being sick, leaving, etc.
Our cash flow will be unreliable in the early stages
Opportunities:
Our business sector is expanding, with many future opportunities for success
Our local council wants to encourage local businesses with work where possible
Our competitors may be slow to adopt new technologies
Threats:
Will developments in technology change this market beyond our ability to adapt?
A small change in focus of a large competitor might wipe out any market position we
achieve
The consultancy might therefore decide to specialise in rapid response, good value services
to local businesses. Marketing would be in selected local publications, to get the greatest
possible market presence for a set advertising budget. The consultancy should keep up-to-
date with changes in technology where possible.
Source: Manktelow James, "SWOT Analysis: Discover New Opoortunities. Manage and Eliminate
Risks", Mind Tools, On-line: http://www.mindtools.com/pages/article/newTMC_o5.htm
2.1.4.2 References
AWARE, "SWOT Analysis and Value Chain Analysis" (http://www.marketing-
intelligence.co.uk/aware/services/swot.htm), AWARE Inc
Bartle, P >"SWOT for Transformation"
(http://www.scn.org/ip/cds/cmp/modules/dis-swot.htm), Community Self Management,
Empowerment and Development
Bobete, K "SWOT Analysis - Strengths, Weaknesses, Opportunities and Threads"
(http://www.websitemarketingplan.com/Arts/SWOT.htm)
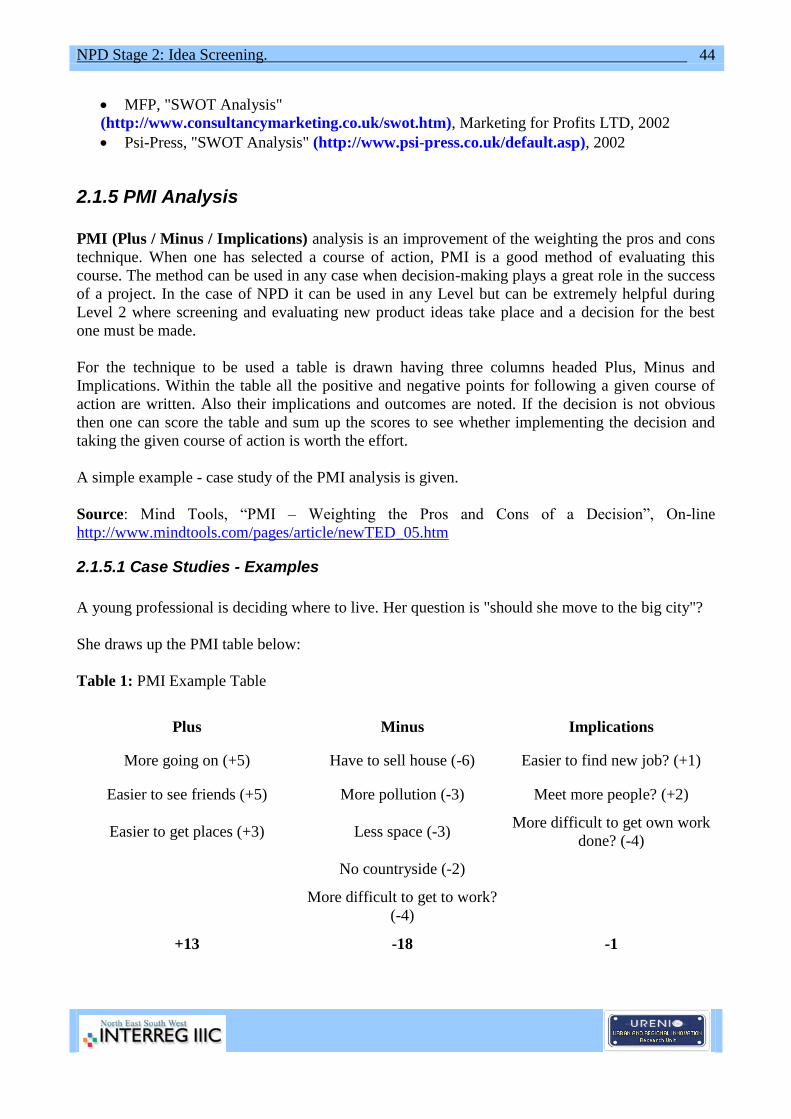
NPD Stage 2: Idea Screening.
44
MFP, "SWOT Analysis"
(http://www.consultancymarketing.co.uk/swot.htm), Marketing for Profits LTD, 2002
Psi-Press, "SWOT Analysis" (http://www.psi-press.co.uk/default.asp), 2002
2.1.5 PMI Analysis
PMI (Plus / Minus / Implications) analysis is an improvement of the weighting the pros and cons
technique. When one has selected a course of action, PMI is a good method of evaluating this
course. The method can be used in any case when decision-making plays a great role in the success
of a project. In the case of NPD it can be used in any Level but can be extremely helpful during
Level 2 where screening and evaluating new product ideas take place and a decision for the best
one must be made.
For the technique to be used a table is drawn having three columns headed Plus, Minus and
Implications. Within the table all the positive and negative points for following a given course of
action are written. Also their implications and outcomes are noted. If the decision is not obvious
then one can score the table and sum up the scores to see whether implementing the decision and
taking the given course of action is worth the effort.
A simple example - case study of the PMI analysis is given.
Source: Mind Tools, “PMI – Weighting the Pros and Cons of a Decision”, On-line
http://www.mindtools.com/pages/article/newTED_05.htm
2.1.5.1 Case Studies - Examples
A young professional is deciding where to live. Her question is "should she move to the big city"?
She draws up the PMI table below:
Table 1: PMI Example Table
Plus Minus Implications
More going on (+5) Have to sell house (-6) Easier to find new job? (+1)
Easier to see friends (+5) More pollution (-3) Meet more people? (+2)
Easier to get places (+3) Less space (-3) More difficult to get own work
done? (-4)
No countryside (-2)
More difficult to get to work?
(-4)
+13 -18 -1

NPD Stage 2: Idea Screening.
45
Source: Mind Tools, “PMI – Weighting the Pros and Cons of a Decision”, On-line
http://www.mindtools.com/pages/article/newTED_05.htm
She scores the table as 13 (Plus) - 18 (Minus) - 1 (Implications) = - 6
For her, the comforts of a settled rural existence outweigh the call of the 'bright lights' - it would be
much better for her to live outside the city, but close enough to travel in if necessary.
Source: Mind Tools, “PMI – Weighting the Pros and Cons of a Decision”, On-line
http://www.mindtools.com/pages/article/newTED_05.htm
2.2. Level Assessment for Stage 2: Idea Screening Assessment 2 evaluates the way the generated ideas of Level 1 were screened so that a single idea
is produced for further development.
As in Assessment 1 a GO, Hold or KILL decision is issued for proceeding to the next level
depending on the given answers to the questions. In Appendix 2 a template for Assessment of
Level 2 is included.

NPD Stage 3: Concept Development & Testing.
46
NPD Stage 3: Concept Development & Testing
As soon as a single product idea is selected through the process described in Levels 1 and 2, a
product concept has to be developed so that a complete product can emerge in later Levels of the
NPD Roadmap. So the problem one is forced to face in this Level is the product concept
development and its evaluation. The product concept must be the best from many and this is
accomplished by examining all available concepts for a single product idea.
3.1 Concept Development
When a single idea is selected from many generated ones through a screening process as described
in Level 1 and 2, a product concept must be developed based on this single idea. This product
concept should be an innovative solution that will be sold in the marketplace and produce revenue
for the business. The concept generation process involves the evaluation of several product
concepts all based on a single product idea.
Product concept generation involves the following:
Definition of target market and customers.
Identification of the competition and formation of a competitive strategy.
Early - preliminary product technical development and testing scheduling.
Estimation of product development required resources.
Creation of a preliminary business plan.
All of the above are tasks that are not necessarily performed during the concept development stage.
For example competition analysis and competitive strategy formation should be already carried out
during Level 1. Also in many cases some of the tasks performed in the Business Analysis Level are
carried out now so that preliminary business plans are created. That is why in some cases this level
incorporates the next one where business analysis is carried out.
3.1.1 Controlled Convergence
Controlled convergence is a non-numeric tool for concept development right after product idea
evaluation and selection. It helps the designer team to pick a concept by use of a simple matrix. It
was first developed in the 80's by Stuart Pugh. The matrix that is used enables the comparison of
concepts against some pre-determined criteria and provides the structure for evaluation of
alternatives and competing ideas.
The methodology behind the formation of the matrix and the data insertion in the matrix is base in a
number of simple steps that can be easily be followed by no-specialized personal. These steps are
given bellow.
Step 1: One should identify 5 to 10 different concepts for a given product idea. The concepts
should be sketched and some words can be added describing them. If there are less than 5 concepts
available it is advisable that some kind of creative method to be used so that more can be generated.
NPD Stage 3: Concept Development & Testing.
47
Each sketch representing a concept should be in the same detail as the rest and must communicate
the idea behind it easily.
Step 2: The most crucial aspect of the matrix to be used is the selection of the criteria against which
the different concepts will be screened. These should reflect deep understanding of the customer
needs, desires and purchasing motivations. Also criteria that reflect internal company needs such as
manufacturing, service, assembly, risk and maintenance issues should also be considered. The final
list of criteria should be agreed by all of the persons that make up the design team. Listing the
criteria in a vertical left hand axis and listing the concepts in a top horizontal axis sets the matrix.
Step 3: One should choose a concept as the predominant one. It helps if this concept already exists
as a product. Then one should compare all concepts with the predominant one. If the concept is
better or easier than the predominant one then it is marked with a "+", if it is worst or harder with a
"-" and if it is similar or same with an "S". For each concept the total number of "+", "-" and "S" are
added and the number of "-" is subtracted by the number of "+". Doing this gives each concept a
score number.
step 4: It is possible that there are good concepts that suffer from one specific feature. These can be
combined together so that a concept that has no drawbacks can be formed. In this way the matrix
result for the combination of two or more concepts can be better than the one of the concepts on
their own.
Step 5: The process should be repeated having the resulted from the previous process strongest
concept as the predominant one. In this case new concepts can be added into the matrix.
Step 6: After the completion of the process one must consider the results carefully and ask for a
team agreement of the outcome. One should look out for a solution that clearly stands out from the
rest.
Source: Better Product Design, Institute of Manufacturing, University of Cambridge, On-line
http://www.betterproductdesign.net/tools/concept/convergence.htm
3.1.1.1 References
"Controlled Convergence"
(http://www.betterproductdesign.net/tools/concept/convergence.htm), Good Design Practice
Program, Institute for Manufacturing & Engineering Design Center, University of Cambridge,
UK, 2004
Pugh S, "Creative Innovative Products Using Total Design", 1st Edition, Prentice Hall,
1996
Pugh S, "Total Design: Integrated Methods for Successful Product Engineering", Addison -
Wesley, 1991

NPD Stage 3: Concept Development & Testing.
48
3.1.2 Risk Management
The product development process is an innovative process and as such it involves a large amount of
risk. Much of this risk can be identified in advance and certain ways of dealing with that risk can be
designed and implemented when the time comes. The new product development process as it is
used nowadays in the form of a roadmap, consisting levels and assessment points, incorporates risk.
The new product development roadmap process by itself does not facilitate ways of dealing this
risk. Also sometimes the risk factors are so apparent that are not seen. Imagine looking for ones
glasses that are right under ones nose. This is where risk management comes into play.
3.1.2.1 Risk Management Process
Managing the risk in a new product development process is about following a number of steps.
These are graphically shown and discussed bellow.
Step1 & 2: Steps 1 and 2 are part of a planning process. During this process a cross-functional
team consisting of people of as many different disciplines as possible think hard of potential
development process problems. During this brainstorming session not only the risk factors must be
identified but also possible solutions to the problems that might occur.
Step 3: During step 3 one must prioritize risks. For this to be done the following formulae can be
used.
Le = Pe * Pi * Lt
Where Pe is the probability of the risk event, Pi is the probability of impact, Lt is the total loss and
Le is the expected loss.

NPD Stage 3: Concept Development & Testing.
49
By evaluating the expected loss for all risk events that were identified and analyzed during steps 1
and 2 one can rank risks in order of severity. The larger the number of expected loss the most
serious the risk is. By prioritizing the possible risks one can build solutions and plot courses of
action that will if necessary address the most future serious problems first.
Step 4: During this step all risks are moved from the "risk list" that was created at steps 1, 2 and 3
and starting from the most serious ones one by one are dealt with using specific action plans. These
actions plans must tackle the problems before they occur. They consist of preventive actions, which
sometimes may require some time before they are truly effective. Also contingency plans must be
formed and be ready to be implemented if the original action plans fail.
Step 5: All risks that were identified must be monitored. This must be done because one should
know whether an action plan was successful or not in preventing a risk event from occurring. If an
action plan was successful it should be retired, if not a new one or the contingency plan should be
implemented.
3.1.2.2 Case Studies - Examples
Case Study: "Risk management for Intel's Corp dual processor server".
Using the 5-step process for risk management, which is discussed in "Risk management Process",
the Intel Corp achieved to realize a dual processor server project having all customer requirements
in place.
To begin with, during the risk identification step the Intel's cross-functional team identified three
possible risk events: the inadequate product validation capacity, the high immortality of the new
memory modules and the incomplete requirements of power management features.
Then the team during the risk analysis step examined the identified risk events in two steps:
The team listed all the facts that led them to believe that the risk events and their impact will
occur and examined each one to find an increased or decreased likelihood or severity of
each of the risk event and its impact.
Based on the facts the team estimated the probability of total loss for each event.
In the following risk prioritization step, the team, managed to prioritize the two main risk events
that the project faced: The high immortality of the new memory modules and the incomplete
requirements regarding power management features. For the third one, which was the product
validation capacity, it was decided to be managed inactively by monitoring the risk event.
During the fourth step of the risk management process, the team formed action and contingency
plans for each risk event. Such plans included the elevation of the importance and the priority of the
whole project, the diversion of resources from other projects into this one and the possibility of
planning a later product launch so that risk events could be dealt with as they occurred.
Finally during the fifth step, the team monitored all risk events so that if required the action plans
would be implemented.

NPD Stage 3: Concept Development & Testing.
50
3.1.2.3 References
Gitthens G. "Risk Management Practices for NPD Programs"
(http://www.catalystpm.com), Catalyst Management Consulting, 2002
Smith G. P. "Managing Risk as Product Development Schedules Shrink", Research -
Technology Management, Sep- Oct 1999.
Smith G. P. "Managing Risk Proactively in Product Development Projects", ILPnet
Workshop, Saas-Fee, Valais, Switzerland, Sep 2002.
Smith G. P. "The Risk of Talking About Risk", Product Development Insight, Mar 2003
Smith G. P. "Thirteen Ways to Mismanage Development Project Risk: How to Avoid Those
Erroneous Routes", Product Development & Management Association, 2002
Smith G. P. "A Portrait of Risk", Product Management Network, Apr. 2003.
Smith G. P. Merritt G. M. "Managing Consulting Project Risk", Management Consulting,
Vol. 13, No 3, Sep 2002
Smith G. P. Merritt G. M. "Proactive Risk Management: Controlling Uncertainty in Product
Development", Productivity Press, New York, 2002.
Smith G. P. Merritt G. M. "Using a Risk Model to Build Development Team Consensus",
Project Management Innovations, Project Management Institution, Vol.6, Issue 4, Dec
2001.
3.1.3 Force Field Analysis
The Force Field Analysis is tool that uses a creative process for forcing agreement about all aspects
of a desired change. The analysis is used for:
Clarifying and strengthening the "driving forces" for change.
Identifying obstacles or "restraining forces" to change.
Encouraging agreement on relative priority of factors on each side of the balance sheet.
In the case of product development the analysis can show what path should be taken for a project to
be feasible and can be manufactured. In this case the changes mentioned are the different
characteristics of a path to be taken. To carry out such an analysis one should do the following.
List all forces for change in one column and all forces against change in another.
Assign a number to each force form 1 (being the weakest) to 5 (being the strongest).
Draw a diagram showing the forces for and against change. Also note the size of each force
by showing the assigned numbers next to them.
Add up all the numbers in each column and compare the two numbers. If the number
representing the total for change is bigger than the on against change then proceed with the
project.
The above steps of performing the analysis can be easily illustrated by the following example.
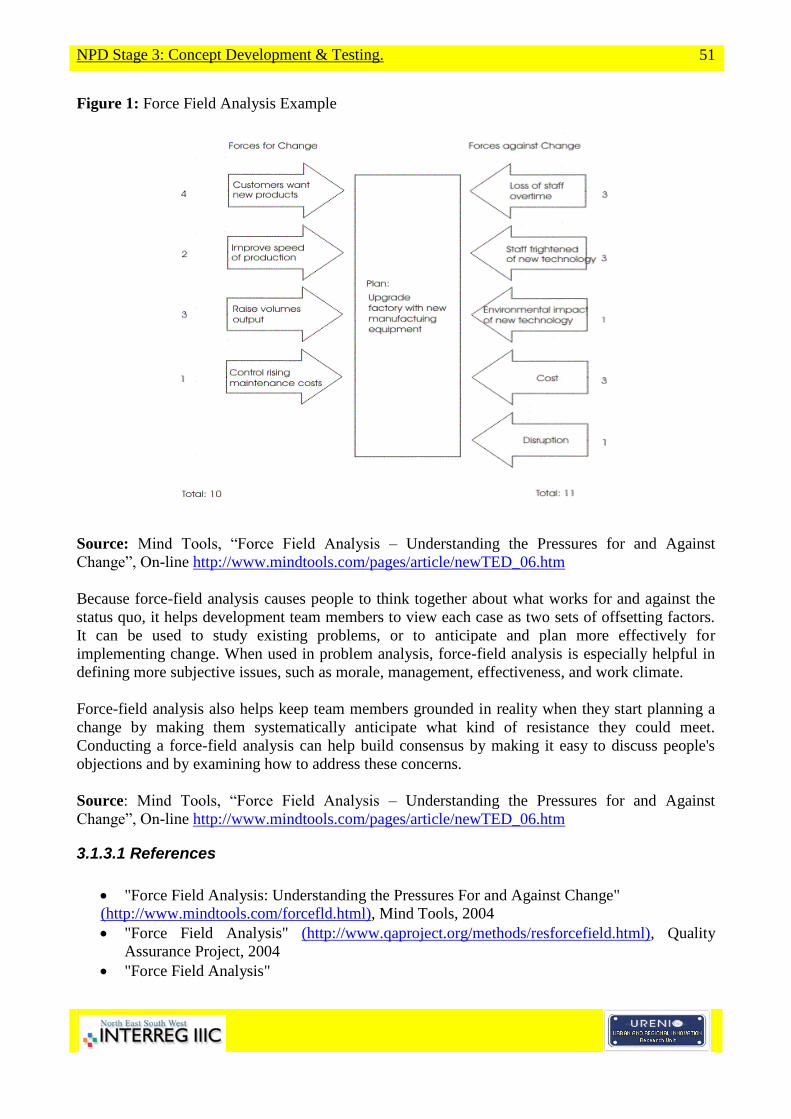
NPD Stage 3: Concept Development & Testing.
51
Figure 1: Force Field Analysis Example
Source: Mind Tools, “Force Field Analysis – Understanding the Pressures for and Against
Change”, On-line http://www.mindtools.com/pages/article/newTED_06.htm
Because force-field analysis causes people to think together about what works for and against the
status quo, it helps development team members to view each case as two sets of offsetting factors.
It can be used to study existing problems, or to anticipate and plan more effectively for
implementing change. When used in problem analysis, force-field analysis is especially helpful in
defining more subjective issues, such as morale, management, effectiveness, and work climate.
Force-field analysis also helps keep team members grounded in reality when they start planning a
change by making them systematically anticipate what kind of resistance they could meet.
Conducting a force-field analysis can help build consensus by making it easy to discuss people's
objections and by examining how to address these concerns.
Source: Mind Tools, “Force Field Analysis – Understanding the Pressures for and Against
Change”, On-line http://www.mindtools.com/pages/article/newTED_06.htm
3.1.3.1 References
"Force Field Analysis: Understanding the Pressures For and Against Change"
(http://www.mindtools.com/forcefld.html), Mind Tools, 2004
"Force Field Analysis" (http://www.qaproject.org/methods/resforcefield.html), Quality
Assurance Project, 2004
"Force Field Analysis"

NPD Stage 3: Concept Development & Testing.
52
(http://www.skymark.com/resources/tools/force_field_diagram.asp), Sky Mark Corporation,
2003
3.1.4 Relevancy Concepting
“It's not exactly a secret -- efficiently managed brands frequently generate better than 80% of volume from
20% of users. But here's a lesser known info-bit. An astoundingly high proportion of healthy brands with
low market penetration or an extended repurchase cycle -- or both -- track their success to the 80/20 Rule.
Because the only way to succeed as a small brand is to run lean, efficient and focused.
Question: if 80% of $volume of a mature brand is generated by 20% of users...why would a volume minded
manager allow the lightweights to drive the NPD process? It only takes third grade arithmetic to discover the
volume contribution of a frequent user is sixteen times that of moderate/light users and therefore the only
consumer needs, belief systems and product technologies that really impact volume are the ones relevant to
the heavy-users of brands from which the new brand will draw its sales volume. Ultimately the new product
concepts created by the 80/20 focus also should be evaluated by heavy-users and potential high volume
prospects. Once again, who cares how the lightweights vote?
NPD managers who know the new brand sales volume will -- from the introductory launch to the bitter end
of the brand's life cycle -- never support the $24,000,000+ A&P spending levels required to maintain mass
marketing efforts should design the brand to reflect that corporate reality. The consideration should
influence every phase of the NPD process from the concept development phase onward.
The ultimate reality, for most managers of low budget brands, is the bottom line. For that materialistic but
highly compelling reason, focusing concept development on the hi-volume 20% user base is the most
effective way to maximize the productivity of every dollar invested in any new brand -- large or small. For
low penetration or infrequently purchased brands it's the only way.
The tool concentrates the primary procedure -- for example, Re-Engineering Technology -- exclusively on
the high-volume users within either the category...or...the competitor targeted as the primary source from
which the new brand will draw its volume.
To ferret out heavy-user targets that may be as small as 1% of the US adult population, the tool uses a
200000-consumer database to identify the demographics, behaviour patterns and lifestyle characteristics of
homogeneous clusters of the targeted 20% heavy-users. From mind-numbing arrays of data crosscuts,
collections of best-bet cluster profiles are generated. Ultimately a half dozen are selected to generate the
information that will drive the primary NPD tool selected by managers.
Interviews with respondents recruited to match the selected subsets of heavy users are conducted to execute
the procedure involved in the preferred NPD tool. The effort pinpoints need gaps and perceived deficiencies
in existing technology of competitive options. Ultimately the new product concepts created by the concept
team are also evaluated by heavy-users and potential high volume prospects.
Most assuredly it's an elitist effort. For the last time, who cares how the lightweights feel? The addition of
pre and post supplements to the standard procedure chosen by NPD managers nearly doubles the effort,
completion time. And cost. Perhaps for that reason it's the last NPD Tool Polaris has added to an extensive
array of procedures. But the process that suggested the potential -- the Management Tool called "Relevancy
Marketing" -- has been a mainstay for re-staging small brands for years. Under its direction low penetration,
small budget brands like Clorets, Certs, Vivarin, Campho-Phenique, Blossom Hill and MG Vallejo typically
project payout of A&P investments in half the time required for traditional mass marketing programs.
Historically the profile of brands attracted to the process has run to low penetration... infrequent repeat
purchase...low margin brands that must run lean and focus available promotional funds on high volume
prospects. The definition runs from household cleaners to sparkling wines. From PC Notebooks to OTC
drugs. Prospective users include financial, discount brokerage and Internet services. Perhaps travel cruises,
gaming and recreational facilities.” Taken from: “Relevancy Concepting”, Polaris Marketing, On-line
http://www.polarismktg.com/senrelev.htm
NPD Stage 3: Concept Development & Testing.
53
3.1.5 New Tech Commercialization
Over the years some marketers have discovered that it is hopeless to use consumer input to
transform commercial applications of breakthrough technology into appealing products. There were
cases where high tech, first to launch, products based on consumer input were later on surpassed by
more effective and appealing competitive ones that used the same technology. To avoid and predict
this unpleasant phenomenon, marketers developed a simple tool that opened a window into the
future. "Commercializing New Technology", became a good way for NPD managers to peer into
a future world of opportunity and identify revolutionary new product technologies with great
market appeal.
The tool screens the population into "innovation acceptors" and "wait and see" segments making it
possible to work with a segment of the market that it is not rejecting a new product concept because
it is based on a new technology. In order to forecast possible commercial applications of
breakthrough technology, the concept development team first develops a series of presentations of
the core technology. This can be done by using technology prototypes or digital simulators. In both
cases a fully developed product positioning must exist.
Having the prototype applications presentations in hand the team can conduct a qualitative research
by using two persons at a time groups. During the research, functionality and end-benefit utilities
can be recognized, important commercial applications of the core technology and gaps or less
important possible product - concept features can be identified. During the research the consumer
must be perceived as a critic and not as a creator. This characteristic differentiates this kind of
research from other consumer needs and wants product researches.
The results of the research is then put through a refinement process in which the benefits or pitfalls
of the new technology and the possible product applications are demystified and decisions on
concept development can be taken without bias by the concept development team. One must
remember that the team always is biased towards the new technology that has been developed by
their company or business.
Source: “Commercialising New Technology”, Polaris Marketing, On-line
http://www.polarismktg.com/sencomme.htm
3.1.6 Quicktime Workshop
“When cycle time is critical, interactive exchanges between users and NPD teams can significantly shorten
the process of identifying "the next big thing"...improve the quality of the core concept...build cross-
functional cooperation...and create an all-important proprietary commitment to subsequent product
development efforts of the NPD team. It's the equivalent of a home run with the bases loaded.
The tool is typically selected for the wrong reason -- to save time up front. In the preliminary phases of
identifying the NPD concept. And it does save time. Only later does it becomes apparent the process forced
the NPD Team to work together to blueprint a concept that (1) places customers first and (2) inputs
everyone's ideas into an concept that merits "universal buy-in." Between the two latent features of the
process, NPD managers eradicate the unanticipated revise-rework-redirection problems that can easily

NPD Stage 3: Concept Development & Testing.
54
double product development time and cost -- a consideration that makes the 30 day delivery of the concept
seem like small potatoes.
The tool is an updated and significantly more sophisticated version of qualitatively assisted efforts to
generate new product concepts that most NPD managers know as "Focus Groups." The improvements add a
new dimension to qualitative ideation efforts.
Consumer respondents are truly focused on project-relevant issues by real-world assignments (i.e.,
keep a contact lens care log / diary, conduct a wardrobe inventory of casual wear apparel, videotape
a software installation, test-drive a Toyota and a Suburu).
Direct eyeball-to-eyeball interface between NPD manager (assisted by Polaris moderator) and paired
consumers.
Interviews of consumers conducted in "double dyads" -- pairs of interviewers interfacing with pairs
of consumers -- to facilitate in-depth exploration and concurrently eliminate group bias and "me-
too" response.
Post interview debriefing objectives include efforts to construct theoretical models of consumer
insights; objective is to encourage a broad-spectrum conceptual exploration of opportunity within
which specific new product concepts occur.
Because the effort places the idea generation responsibilities primarily on individual members of the NPD
Team and equips them with both consumer insights and coaching assistance in synthesizing the information
into user-relevant concepts, the tool generates a wide variety of cross-functional perspectives. Which in turn
generate a wider -- and deeper -- spectrum of new product concepts from which the team collectively can
pick and choose.
The process can be completed in less than 30 days. For managers uninterested in rehashing shop-worn ideas
and tacking frivolous gimmicks on existing technology platforms it's the fastest way to identify legitimately
innovative new product concepts. It's unquestionably the quickest way to develop big ideas that reflect both
consumer and corporate-wide perspectives.
The process is conducted in a three-phase effort where members of the NPD team define potential prospects,
usage parameters and pre-interview assignments to focus respondents...individually participate in depth
interviews with prospective users who have been pre-programmed to focus on NPD team issues...then
reconvene in a workshop in which they share insights and synthesize acquired information into consumer-
relevant new product concepts.
Members of the NPD Team assume primary responsibility for generating "the next-big-thing" concepts.
Polaris contribution to the effort is that of a coach / facilitator and creative resource whose primary
responsibility is to introduce and conduct the process, recruit & pre-program consumer respondents, co-host
the consumer in-depth interviews, assist individual team members in modelling / mapping insights produced
in the interviews in which they participated and moderate the ideation workshop in which models, need
matrices and new concepts are shared and improved.
Toyota design engineers ride shotgun for target prospects and informally probe observed behaviour; Nike
marketing and R&D managers interface with skateboarding mall rats to discuss the-next-big-thing in road
footgear. A list of potential applications for productively mixing consumers and NPD managers would be
only slightly shorter than the Yellow Pages. Particularly since the need to meet ever shortening windows of
opportunity means every manager needs the NPD concept yesterday. And it's that urgency that adds a new
dimension of risk to an already perilous journey.
Because ideas are fuzzy abstractions whose value is difficult to measure, there is an inclination to go with
two or three interesting ideas that have been lurking in the back of your mind for some time. It's a seductive
-- and dangerous -- temptation. But shun that devil, brothers and sisters. Take the 30 days it takes to generate
a full range spectrum of consumer-comes-first NPD options. It's critical. Because surveys show it takes more
than a dozen legitimately high potential NPD concepts to produce one successful new product launch for
package goods. The way to shorten the ideation functions that drive the remainder of the NPD effort is to
work together to shorten the conceptualisation time -- not short cut the quantity of ideas. Or their quality.”
Taken from: “Quicktime Workshop”, Polaris Marketing, On-line
http://www.polarismktg.com/senquick.htm

NPD Stage 3: Concept Development & Testing.
55
3.2 Concept Testing
Concept testing is the process of using quantitative methods for evaluating consumer response to a
product idea prior to the actual product development and product launch into a market. These
quantitative methods are usually performed using specific tools, filed surveys, personal interviews
or a combination of all three and aim to evaluate generated product concepts. Sometimes these
methods are used to generate concepts as well.
Concept testing procedures fall into three main categories:
Concept evaluations, where concepts representing product ideas are presented to
customers or consumers in a verbal or visual way and then they are evaluated by
quantitative methods by indicating degrees of purchase intent, likelihood of product trial
etc.
Positioning, which is concept evaluation where concepts are placed in the same
environment with other similar concepts or actual similar products.
Product / concept trials, where consumers evaluate a concept then the product and the
results are compared.
Concept testing has been many times in the past inadequate as a way to identify and evaluate the
criteria that consumer preferences are based. There are times when most of the concept testing
methods or tools cannot identify the relative importance of the factors governing the way
consumers; markets and market segments react differently to concepts or concept tests. So in these
cases the people carrying the tests did not have all the information necessary to create successful
products specifically tailored to the needs of the customers. For this reason one should be extra
careful about how he conducts a concept way, what kind of tool or method he is using and how he
is using the chosen tool or method.
3.2.1 Quantitative Research
Quantitative Research unlike Qualitative Research (1038) is based on reliable, numerical,
statistical measurement of the total target population. Quantitative Research is distinguished from
Qualitative Research by the large number of people who are questioned and the type of questions
asked. Usually 100 people are required to give yes/no answers to a survey to get results that are
95% accurate. For higher accuracies in the order of 97% or 99% samples of 400 to 2000 are
required. Quantitative Research is conducted after a product concept is developed and its features
are explained to potential customers or buyers. This kind of research suits better large companies
that have a lot of money to spent since it is usually quite expensive to implement. Smaller
companies can do a small field-study test in the real market instead. For a successful quantitative
research one needs the following three elements.
A well-designed questionnaire.
A randomly selected sample.
A large sample.

NPD Stage 3: Concept Development & Testing.
56
The design of a good questionnaire depends upon the elements that will contain and the well-
defined goals or questions to be answered by it. Questions can be set asked using the telephone,
fax, or writing. The Quantitative Research questionnaires are similar to Qualitative Research ones,
but more complex and more information demanding. All information gathered can be interpreted
numerically so that a statistical measurement to be made afterwards. Typical style questions that
can be asked and ultimate goals of the research are given in the table bellow.
Table 1: Quantitative Research Considerations and Questions
Research Considerations Typical Research Questions
What decisions can be based on
results?
Age? Sex? Occupation? Income range? Locality?
Use of similar products?
What information is needed? What competitive products are used?
Screening methods of sample? Frequency of purchase of competitive products?
Size of sample? Ranking of competitive products?
Results analysis method? Competitive product price considerations?
Competitive product features evaluation?
Product advertising evaluation?
Market positioning evaluation?
New product concept evaluation?
Purchase intent of new product concept?
All questions should be set in such a way that can be understood easily and encourage someone to
be willing to answer them. One should avoid vague, non-useful background, trick and difficult to
answer questions.
Once a good questionnaire is designed then the target sample of the research must be selected. This
sample can be a probability one or a non-probability one. Probability sampling is when each
customer sampled has an equal chance of being selected for testing. This means that results can
represent equally of the entire target population. Non-probability sampling is exactly the opposite
and that is why it can be biased. Small businesses use non-probability sampling due to budget
constraints.
The same budget constraints can dictate and the size of the sample to be selected. The larger the
size the more accurate the results will be. Also the more reliable the research will be.
3.2.1.1 References
CCH, "Quantitative Research" (http://www.toolkit.cch.com/text/P03_3150.asp), CCH
Business Owner's Toolkit, 2002
Hopkins G H, "Quantitative Research Design"
(http://www.sportsci.org/jour/0001/wghdesign.html), Dept of Physiology and School of
Physical Education, University of Otego, New Zealand, 2000
Joppe M, "Quantitative Research"
(http://www.ryerson.ca/~mjoppe/ResearchProcess/QuantitativeResearch.htm), School of
Hospitality and Tourism Management, University of Rayrson, Ontario, Canada

NPD Stage 3: Concept Development & Testing.
57
3.2.2 Quality Functional Deployment
Quality Functional Deployment (QFD) originated around 1985 by well-known Japanese firms as
a tool of new product development or existing product refinement. Very soon it was adopted by
most large firms worldwide and in the process acquired as many supporters as enemies.
A cross-functional team of individuals that are responsible of new product development usually
carries out QFD. The process uses a series of matrices to document information about new product
ideas collected or developed and through these matrices one can show a set of new product ideas
and if needed a complete plan for new product. So QFD cannot only be an idea generation or idea
management tool, but also a complete product development tool. This can be seen by careful
examination of the following steps that make up QFD methodology.
Acquisition of product characteristics or product customer requirements.
Development of product concepts that can fulfil these requirements.
Evaluation of each product concept.
Derivation of low-level product requirements.
Derivation of high-level product requirements.
Determination of manufacturing process to meet both low and high-level product
requirements.
Development of process and quality controls.
As mentioned above a QFD analysis is made up from different matrices. The basic QFD
methodology involves four basic steps containing the identification of customer needs or
requirements and the use of those in the creation of three matrices. All four steps are analysed and
explained bellow.
QFD requires that the basic customer needs or requirements are identified. This identification is the
first step of designing and conducting a QFD analysis. It is important that these requirements are
expressed in terms of "what" and not "how". For that reason it is important that marketing
personnel should ask "why" until they truly understand the root requirement of a customer. QFD
can also be used in such a way that the supplier requirements are identified and not the customer's.
(Suppliers and middlemen can also generate product ideas).
Once these requirements are gathered, they have to be organized and prioritised so that it could be
more simple and easy their insertion into the QFD matrices. Competitive products must be then
identified by some means of a CIP program and along with the customer needs identified, be
inserted into the first QFD matrix which is called "Product Specification Matrix". The filling up of
the first QFD matrix is the second step of the QFD methodology and analysis. This matrix can be
used to define customer needs in a mathematical way, analyse competitive products, plan a product
to respond to needs and establish critical characteristic target values for each of the product
requirements.
The third step of the QFD methodology helps to identify possible product design characteristics or
specifications to meet the derived product requirements from the previous matrix. This helps to
identify critical product parts or assemblies before product development. This second matrix is
called "Product Design Specification Matrix".

NPD Stage 3: Concept Development & Testing.
58
The fourth and final step of the QFD methodology and analysis is used to identify critical
processes in the product development. All the processes concerning the development of the critical
product parts identified in the previous matrix are identified and target values are set as a measure
during the development stage.
3.2.2.1 Case Studies - Examples
Case Study 1: "Product update due to changing customer needs"
A major supplier of medical implements needed to upgrade one of its products because of recent
improvements in associated medications, an increased level of use, and for better infection control.
They found they were losing business because their competitors were already a generation ahead of
their current product.
The team decided to use QFD in order to better understand customer wants and needs. This data
was gathered through numerous one on one interviews with their medical users. This really opened
their eyes. They could easily tell, even this early in the project, that a product concept, which had
been mandated by management, would not satisfy the customers. They decided to continue
following the process and see where it led.
Only after completing the product-level QFD matrices, did they identify the alternative design
concepts. These were documented, using CAD, to a level, which allowed them to choose one
alternative as being clearly better than the others at satisfying the customer requirements in a cost
effective way. The selected concept was significantly better than anyone had conceptualised before
the study. It was truly a breakthrough.
The project was completed significantly faster than any previous, similar project. They were able to
re-orient management's pre-conception of the product because they could prove that the selected
product concept would satisfy all of the requirements whereas the management concept would not.
Finally, the project manager states, "The new product was a revolutionary advancement in the
existing technology. This breakthrough was largely due to the insight obtained by the project team
as part of the QFD process." They credit the process with a lot of their success!
Case Study 2: "Differentiating from competitors"
A major bank was struggling with how to differentiate itself from its many competitors in a
particular market segment. They wanted to either change the way they were performing their
current business or add an innovative new service, which would be difficult for their competitors to
copy.
The team, consisting of the regional manager and his direct reports, was brought together to define
in strategic terms what direction their bank should go. Market research was performed and a
number of niches were identified which wanted very specialized services.
After a particularly attractive niche was selected, the team used QFD to convert the benefits desired
by the customers into measurable characteristics of a service offering. Alternative services were
brainstormed using a structured brainstorming process. These concepts were defined in enough

NPD Stage 3: Concept Development & Testing.
59
detail that they could be objectively analysed. The team used the characteristics of the service
offering to select the concept that would best satisfy the user and business requirements.
The team was able to identify, define, and develop a brand new concept in personal banking. While
the bottom-line results are not yet available, the team expects the new service to be a dramatic
success.
3.2.2.2 QFD Tool from Urenio
There are two files available that are created by the Urenio Research Unit to be used as a tool and
examples of the QFD matrices. The files can be used not only to see what QFD matrices look like
but also to perform QFD following the instructions given. The first file can be used to gather
customer requirements for QFD use and the second has three of the most important QFD matrices
ready for filling up. Also instructions are given in the second file. The names of the files are given
bellow.
3.2.2.3 Consultants - Experts
QFD Institute (http://www.qfdi.org/)
Non-profit organization that researches and develops state of the art market research tools such as
Quality functional deployment.
QFD Consultants Inc (http://www.qfd.bc.ca/)
Private sector consultancy that is made up by 14 engineers based in Vancouver - Canada. The firm
provides design, engineering and experience for QFD development.
QFD Insitut Deutschland EV (http://www.qfd-id.de/en/index.html)
The German QFD Institute is a non-profit organization whose purpose is the distribution and the
understanding of engineering technique known as QFD.
Quality Associates International Inc (http://www.quality-one.com/services/qfd.cfm)
QAI is an international full service quality and reliability-consulting firm. Among the
services it provides is QFD as a facilitation quality tool.
3.2.2.4 Software Tools
http://www.qfd2000.co.uk/introductionqfd2000.htm
QFD2000 software is a complete software solution for Quality Functional Deployment. The
QFD2000 software offers easily customisable matrices but also goes beyond this to provide the
extra tools one will need to understand customer requirements and develop products and services to
delight them.
http://www.qfdcapture.com/
QFD Capture software is a complete QFD software tool available from the above website. Along
with the software there are tutorials, case studies and an explanation of the QFD process available.

NPD Stage 3: Concept Development & Testing.
60
3.2.2.5 References
Crow, K. "Performing QFD Step By Step"
(http://www.npd-solutions.com/index.html), NPD Solutions Inc, 2002
Katz, G. M. "After QFD: Now What"
(http://www.pdma.org/visions/apr01/after_qfd.html), Visions Magazine
3.2.3 Decision Tree Analysis
Decision Trees are very good tools for helping someone to chose between several courses of
action. They can provide an effective structure, which one can lay options and investigate possible
outcomes of choosing these options. Also Decisions Trees can help in the formation of a complete
picture of the risks and rewards associated with a particular project and each course of action
related to it.
Decision Trees provide an effective method of decision making due to the following characteristics.
Clearly lay out a problem so that all options can be challenged.
Allow to analyze fully the possible consequences of a decision.
Provide a framework to quantify the values of outcomes and the probabilities of achieving
them.
Help making the best decisions on the basis of existing information and best guesses.
A complete example of a Decision Tree, which is used to investigate the perils and rewards of
developing a new product or upgrading an existing one, is given. One can study the example - case
study for deeper understanding of the way Decision Trees work.
Source: Mind Tools, “Decision Tree Analysis - Choosing Between Options by Projecting Likely
Outcomes”, On-line http://www.mindtools.com/dectree.html
Case Studies – Examples: Drawing a Decision Tree
One can start a Decision Tree with a decision that one needs to make. The first step is to draw a
small square to represent the decision on the left of a large piece of paper. From this squere one
then should draw out lines towards the right of the paper for each possible solution, and note that
solution along each line. One should keep the lines apart as far as possible so that one can expand
all possible thoughts.
At the end of each drawn line, one should think about the different outcomes. If the outcome of
taking a particular decision is uncertain, then a small circle should be drawn. If the outcome is
another decision, another square should be drawn. Squares always represent decisions, and circles
always represent outcomes. One should write the decision the square or circle. If one has completed
the solution at the end of a particular line, then this should be left blank.
Beggining from the new decision squares on a diagram, one should draw out lines representing
options. From the circles lines should be drawn representing possible outcomes. Again a brief note

NPD Stage 3: Concept Development & Testing.
61
should be made on each line explaining what it means. This exercise should be made until one has
drawn out as many as possible outcomes and decisions.
An example of the resulting procedure is shown in Figure 1:
Source: Mind Tools, “Decision Tree Analysis - Choosing Between Options by Projecting Likely
Outcomes”, On-line http://www.mindtools.com/dectree.html
Once this procedure is finished, one should review the tree diagram. Each square and circle should
be chalenged so that any solutions or outcomes that were not apparent can be identified. If there are
such outcomes or solutions, they must be drawn. If necessary, the tree must be redrawn if there are
parts of it that are too congested or untidy. One should now have identified all the possible
outcomes of ones decisions.
Evaluating Your Decision Tree
Evaluating the tree is where one can work out which outcome has the greatest value. One should
begin by assigning a cash value or score to each possible outcome. The estimation should be made
based upon the value of each outcome.
Next one should take a look at each circle and calculate the probability of each outcome. If
percentages are used, the total must come to 100% at each circle. If fractions are used, these must
add up to 1. If one has data on past events, one may be able to make calculations of the
probabilities. Otherwise one should write down ones best estimates.

NPD Stage 3: Concept Development & Testing.
62
This exercise will provide a tree like the one shown in Figure 2:
Source: Mind Tools, “Decision Tree Analysis - Choosing Between Options by Projecting Likely
Outcomes”, On-line http://www.mindtools.com/dectree.html
h2. Calculating Tree Values
Since one has worked out the value of the outcomes, and assessed the probability of the outcomes
of uncertainty, it is time to start calculating the values that will help to make ones decision.
One should begin on the right hand side of the tree, and work back towards the left. As one
completes a set of calculations all one needs to do is to note the result. One can ignore all the
calculations that lead to that result from that point and onwards.
Calculating The Value of Uncertain Outcome Nodes
Where one is calculating the value of uncertain outcomes, this must be done, by multiplying the
value of the outcomes by their probability. The total for that node of the tree is the total of these
values.
For the example in Figure 2, the value for 'new product, thorough development' is:

NPD Stage 3: Concept Development & Testing.
63
Table 1: Calculating The Value of Uncertain Outcome Nodes
0.4 (probability good outcome) x £500,000 (value) = £200,000
0.4 (probability moderate outcome) x £25,000 (value) = £10,000
0.2 (probability poor outcome) x £1,000 (value) = £200
TOTAL £210,200
Source: Mind Tools, “Decision Tree Analysis - Choosing Between Options by Projecting Likely
Outcomes”, On-line http://www.mindtools.com/dectree.html
Figure 3 shows the calculation of uncertain outcome nodes:
Source: Mind Tools, “Decision Tree Analysis - Choosing Between Options by Projecting Likely
Outcomes”, On-line http://www.mindtools.com/dectree.html
Calculating The Value of Decision Nodes
When one is calculating a decision node, one should write down the cost of each option along each
decision line. Then by subtracting the cost from the outcome value that one has already calculated,
will give a value that represents the benefit of that decision.
One should note that amounts already spent do not count for this analysis and should not be taken
into making the decision.

NPD Stage 3: Concept Development & Testing.
64
When one has calculated these decision benefits, one ought to choose the option that has the largest
benefit, and take that as the decision. This is the value of that decision point.
Figure 4 shows this calculation of decision nodes in our example:
Source: Mind Tools, “Decision Tree Analysis - Choosing Between Options by Projecting Likely
Outcomes”, On-line http://www.mindtools.com/dectree.html
In the example above, the benefit previously calculated for 'new product, thorough development'
was £210,000. The estimation of the future cost of this approach is £75,000. This gives a net
benefit of £135,000.
The net benefit of 'new product, rapid development' was £15,700. On this branch therefore it was
chosen the most valuable option, 'new product, thorough development', and allocated this value to
the decision node.
Source: "Decision Tree Analysis: Choosing Between Options By Projecting Likely Outcomes"
(http://www.mindtools.com/dectree.html), Mind Tools
3.2.4 KANO Model
The KANO Model, which was developed in the 80's by Professor Noriaki Kano, offers to its users
some insight into the new product attributes, which are perceived to be important to customers. For
NPD Stage 3: Concept Development & Testing.
65
this reason it is a very helpful tool for idea evaluation and extremely helpful for product concept
development. It focuses the attention of the user on differentiating features. It can be a very
powerful tool if all the methodology is followed and a very useful one as a visualization tool.
As mentioned above the tool is a very useful visualization tool. The model can visualize product
attributes or characteristics and stimulate discussion within the product design team. The model
offers a strong methodology for mapping consumer responses. This is done by classifying product
characteristics into three basic types:
Threshold / Basic Attributes. Characteristics, which must be present for the product to be
successful. One must note that a customer will most probably remain neutral towards the
product even when improved versions of these characteristics exist.
One-dimensional attributes (Performance / linear). These product characteristics are
directly related to customer satisfaction. As these are improved or their number increases in
a new product, the customer will be more satisfied. In the other hand if these are decreased
in functionality or quality the customer will be dissatisfied.
Attractive attributes. Product characteristics that offer great satisfaction to a customer. The
difference between them and the One- dimensional ones is that a decrease in quality,
functionality or number of these characteristics will not result in customer dissatisfaction.
These product features are difficult to be identified since they are considered as unexpected
by customers and basic customer needs usually are identified first. Sometimes these product
characteristics are called customer latent needs.
Successful product concept development can either be achieved by a high level of execution of
performance / liner attributes or by the inclusion of attractive attributes into a new product concept.
One should note that today's customer needs might become tomorrow's expected features as
customer expectations vary over time. The following figure shows the Kano Model in the form of
customer attributes combined with customer satisfaction.

NPD Stage 3: Concept Development & Testing.
66
Figure Kano Model
Source: Better Product Design, Institute of Manufacturing, University of Cambridge, On-line
http://www.betterproductdesign.net/tools/definition/kano.htm
3.2.4.1 KANO Model Methodology
The Model uses a structured user questioning methodology to characterize different features -
attributes and remove any doubts or misunderstood points by making certain that the categorization
of attributes is based on user research. The methodology is more or less straightforward can it sis
given in the form of five basic steps bellow.
Step 1. One must determine the main features of interest that are to be classified later on. This can
be done by the product design team.
Step 2. A questionnaire must be set up. The questionnaire must be designed in such a way that the
design team can understand exactly how the customer feels about a certain attribute. This can be
accomplished by asking two questions about a specific feature, a functional one and a non-
functional one (i.e. the feature is and it is not present).
Step 3. As with most interviews, a sufficient number of responses must be gathered and an average
response must be found.

NPD Stage 3: Concept Development & Testing.
67
Step 4. Based upon the responses gathered a type of feature can be determined from a simple look
up table that should be set up. In this case one should note that apart from the attributes that were
described earlier, one could have one or two additional attributes. These can be the "Indifferent
responses" and the "Contradiction responses".
Step 5. All features must be plotted into the Kano graph to provide a visual guide to the relative
importance of each attribute to the customers.
The model can be difficult for someone to grasp but it provides useful information about additional
product features apart from those that satisfy the customer wants and needs. As QFD it requires
team involvement since it relates product features with user perceptions.
Source: Better Product Design, Institute of Manufacturing, University of Cambridge, On-line
http://www.betterproductdesign.net/tools/definition/kano.htm
3.2.4.2 Case Studies - Examples
The following tables show an example of how a questionnaire can be set-up for gathering customer
product needed features for use in the Kano Model and an example of a simple look up table. The
first one includes a functional and a non-functional question about a mobile phone characteristic. In
the second one the user can see that SMS text is a must for a mobile phone.
Source: Better Product Design, Institute of Manufacturing, University of Cambridge, On-line
http://www.betterproductdesign.net/tools/definition/kano.htm

NPD Stage 3: Concept Development & Testing.
68
3.2.4.3 References
Kano S. Seraku N. Takahasi F. Tsuji S. "Attractive Quality and Must Be Quality. In the
Case of Quality", Book series of International academy for Quality, Volume 7, Quality
Press, 1996.
Special Issue on Kano's Methods for Understanding Customer - Defined Quality, Center of
Quality Management Journal, Volume 4, No 4, 1993.
3.2.5 Weighting and Rating
Weighting and Rating (W&R) is the simplest and most commonly used method or tool for
concept selection or product idea selection. The tool is very easy to understand and apply but it
demands very reliable information to be truly effective. The tool can be very good to show front
runners in terms of concepts or ideas, but since it is numerical it is very dangerous if someone is not
open minded because it tends to show only one right solution to a given problem. Also the tool is
very sensitive to small changes and can be easily be used in the wrong way since it is very easy to
"cook the books". The tool can be conducted if one follows the next four steps.
Step 1. One should list all the important features of the product that have been determined during
the product definition phase and from any other criteria against which competitive solutions can be
judged.
Step 2. Some of the features that are listed in Step 1 are more important in respect to others. So
weights must be assigned to each of the features indicating their importance. Ideally weights must
be considered and assigned in partnership with target customers.
Step 3. Each feature must be scored. Customers and not the design team must do the scoring. This
is done to remove bias.
Step 4. Each score is must then be multiplied by the feature's weight and all the totals must be
summed. The product option or concept with the highest score is the winner of the process.
Source: Better Product Design, Institute of Manufacturing, University of Cambridge, On-line
http://www.betterproductdesign.net/tools/concept/weight-rate.htm

NPD Stage 3: Concept Development & Testing.
69
3.2.5.1 Case Studies - Examples
The table bellow is a typical example of how Weighting and Rating tool can be used in selecting
the best concept for a new car.
Table 1: Weighting & Rating Example
Source: Better Product Design, Institute of Manufacturing, University of Cambridge, On-line
http://www.betterproductdesign.net/tools/concept/weight-rate.htm
As one can see all the features are listed in left hand side of the table and weights are assigned to
each of them. Then scores for each feature is noted and this score is multiplied by the weight to
give a total number. All numbers are then summed to give the grand total for each product option.
In the case of selecting a car the VW Passat is the winner and so the best product concept.
Source: Better Product Design, Institute of Manufacturing, University of Cambridge, On-line
http://www.betterproductdesign.net/tools/concept/weight-rate.htm

NPD Stage 3: Concept Development & Testing.
70
3.2.6 Communications Check
A developed new product concept is not the product by itself. It's simply a general representation of a
product technology and its end-benefits. Sooner or later this idea, fuzzy thought or generalized notion must
be translated using a certain way so that potential consumers can evaluate it. Typically this translation is
performed in a strategically oriented product positioning statement. The problem is, if a product concept is
talking "apples" and the target consumer is hearing "oranges," any evaluation of that particular product
concept is surely going straight for disaster. One could discard what could have been the best idea in the lot
during the idea screening process. Even worse, one could develop an unwanted apple -- not the required
orange that the consumer thought one was promising.
Since communication is an art it's easy for a product concept to be the wrong one or, more likely, have less
than optimal perceptions. Especially if the concept involves general benefits new technology or ideas driven
by emotional forms of logic. Over the years testing showed that out of eight concepts, one absolutely fails to
give out the intended message and/or strategic content and another two will be significantly less than the
best. Murphy's Law states that one of the three miscommunications would have been the "great idea."
“The tool, in its simplest configuration, troubleshoots communication efforts of candidates prior to concept
testing to determine if the intended selling proposition registered, was understood and accomplished key
strategic objectives. Communications that missed the strategic mark are revised and advanced to the next
step in the NPD effort. The effort is qualitative. Quick. Inexpensive. And can avoid costly downstream
mistakes.”2
The communication procedure can start at the beginning, developing the communications necessary to
pinpoint and transfer the concept as it was thought by the NPD team. The procedure uses whatever means
are necessary to express, in consumer terminology and graphics, the strategic elements of the product
benefit, supporting technology, tangible features & attributes, performance characteristics, pragmatic proof-
of-performance and abstract benefits. Typically the communication procedure depicts a fully developed
product concept and this way may take the form of a poster, an image or a set of storyboards. In some cases
even the concept itself may serve as the format conveying its message to the consumer. Animation,
videotape or CD presentations may be appropriate, but in no instance does the communication employ
tactical or executional variables.
In instances where the communication must be developed, members of the concept team are briefed by NPD
managers who top line product technology, tangible features & attributes, performance characteristics,
pragmatic proof-of-performance, abstract benefits. Plus profiles and need matrices of the target prospect.
In other situations the concept components have already been consolidated by managers into a finished
positioning statement that has been communicated in a poster board, frame-by-frame storyboard or
videotape. Working with these positioning materials, Two-On-One interviews probe concept communication
efforts to confirm target prospects "got it" at all four levels: registration of plain text
message...comprehension of strategic content... internalization of personally relevant
benefits/utility...rationalization of purchase decision (economic or coherence with personal value system).
No attempt to evaluate the concept's impact on purchase intent is made; the effort would be both premature
and statistically unreliable.
Necessary revisions are recommended to NPD managers and, with their approval, final versions of the
concept are advanced to the next phase of the project.
Source / Taken from: “Comm Check”, Polaris Marketing, On-line
http://www.polarismktg.com/sencommc.htm
2 Polaris Marketing

NPD Stage 3: Concept Development & Testing.
71
3.2.7 Concept Screen Software
Once a number of ideas are collected, the next step is to screen these ideas so that to identify which
one to pursue. Concept Screen® is an Internet based screening system provided by Decision
Analyst Inc, which can do exactly that.
Concept Screen® inserts all possible product ideas into a database and then a total of 50 - 70 target
audience consumers are asked to review and evaluate these ideas. The outcome of such a review
then goes through a market test called Conceptor to evaluate the market strength of the resulting
product concept and finally, a name and a packaging research is done to define the optimum name
and package for the new product concept.
Concept Screen® can be found on-line at the Decision Analyst Inc web site at the address:
http://www.decisionanalyst.com/Services/concept.asp
3.3 Level Assessment for Stage 3: Concept Development
Assessment 3 evaluates the way the selected product idea of Level 3 was turned into a product
concept so that a new product is produced for further development and how this concept was
evaluated.
As in Assessment 2 a GO, Hold or KILL decision is issued for proceeding to the next level
depending on the given answers to the questions.
In Appendix 3 the template for Level Assessment is included.

NPD Stage 4: Business Analysis
72
NPD Stage 4: Business Analysis
Since the company has a great idea for a new product chosen, the product concept has been
developed and the marketing strategy seems feasible, the next step is to check whether the finances
are there to back up such a project. The business analysis level looks more deeply into the cash
flow the product could generate, what the cost will be, how much market shares the product may
achieve and the expected life of the product. So in this Level the business situation surrounding a
proposed project is checked.
4.1 Tools & Solutions
The evaluation of the necessary financial resources for development of a concept into a new
product can be done using specific tools such as "Cost - Benefit Analysis" for the calculation of
expected costs and return of investment, "Gannt Charts" for the scheduling of the whole project
from now until product launch, "Critical Path Analysis & PERT" for the management and
relocation of resources if necessary and "Stakeholder Analysis" for the evaluation of support from
the companies executives, the investors and all the people that can influence the NPD project.
Also in this Level the new product life cycle must be evaluated since this factor will greatly affect
all above factors of the business analysis.
4.1.1 Cost Benefit Analysis
One of the tools available to select an idea for further development is Cost Benefit Analysis. Such
an analysis can show whether there are the economics to back up the development of the product
concept into a physical product. CBA is really the creation of a so-called Business Plan (BP). A BP
has the following structure.
The executive summary.
The business.
The marketing plan.
The organizational plan.
The production plan.
The financial plan.
The purpose of creating a business plan is to find and secure financing internal or external for the
product development process or more general for the start up or expansion of a business venture.
Since up to product idea screening and product concept development no real money was spend, it is
crucial that a BP is formed before going into development. A BP requires information from
different persons coming from different principles of a company. There is no way that a single
person can provide with all the answers needed for the creation of it. The result of a BP is usually
an estimate of whether there will be a profitable return, in this case, to the product development
investment.

NPD Stage 4: Business Analysis
73
Source: Financing Innovation, "Basic Business Plan", On-line
http://www.newventuretools.net/toolbox.html?toolwindow=http://onlibrowser.pt/financing-
innovation-tool
4.1.1.1 Cost Benefit Analysis Tool: "Financing Innovation"
A Business Plan (BP) can be formed on-line using a tool, which can be found under the heading
"Financing Innovation" on the following web site.
http://www.newventuretools.net
4.1.2 Product Life Cycle
All products and services have certain life cycles. The life cycle refers to the period from the
product's first launch into the market until its final withdrawal and it is split up in phases. During
this period significant changes are made in the way that the product is behaving into the market i.e.
its reflection in respect of sales to the company that introduced it into the market. Since an increase
in profits is the major goal of a company that introduces a product into a market, the product's life
cycle management is very important.
The product's life cycle - period usually consists of five major steps or phases: Product
development, Product introduction, Product growth, Product maturity and finally Product decline.
These phases exist and are applicable to all products or services from a certain make of automobile
to a multimillion-dollar lithography tool to a one-cent capacitor. These phases can be split up into
smaller ones depending on the product and must be considered when a new product is to be
introduced into a market since they dictate the product's sales performance.
Product development phase begins when a company finds and develops a new product idea. This
involves translating various pieces of information and incorporating them into a new product. A
product is usually undergoing several changes involving a lot of money and time during
development, before it is exposed to target customers via test markets. Those products that survive
the test market are then introduced into a real marketplace and the introduction phase of the product
begins. During the product development phase, sales are zero and revenues are negative. It is the
time of spending with absolute no return.
The introduction phase of a product includes the product launch with its requirements to getting it
launch in such a way so that it will have maximum impact at the moment of sale. This period can
be described as a money sinkhole compared to the maturity phase of a product. Large expenditure
on promotion and advertising is common, and quick but costly service requirements are introduced.
The growth phase offers the satisfaction of seeing the product take-off in the marketplace. This is
the appropriate timing to focus on increasing the market share. If the product has been introduced
first into the market, (introduction into a "virgin" market or into an existing market) then it is in a
position to gain market share relatively easily. A new growing market alerts the competition's
attention.
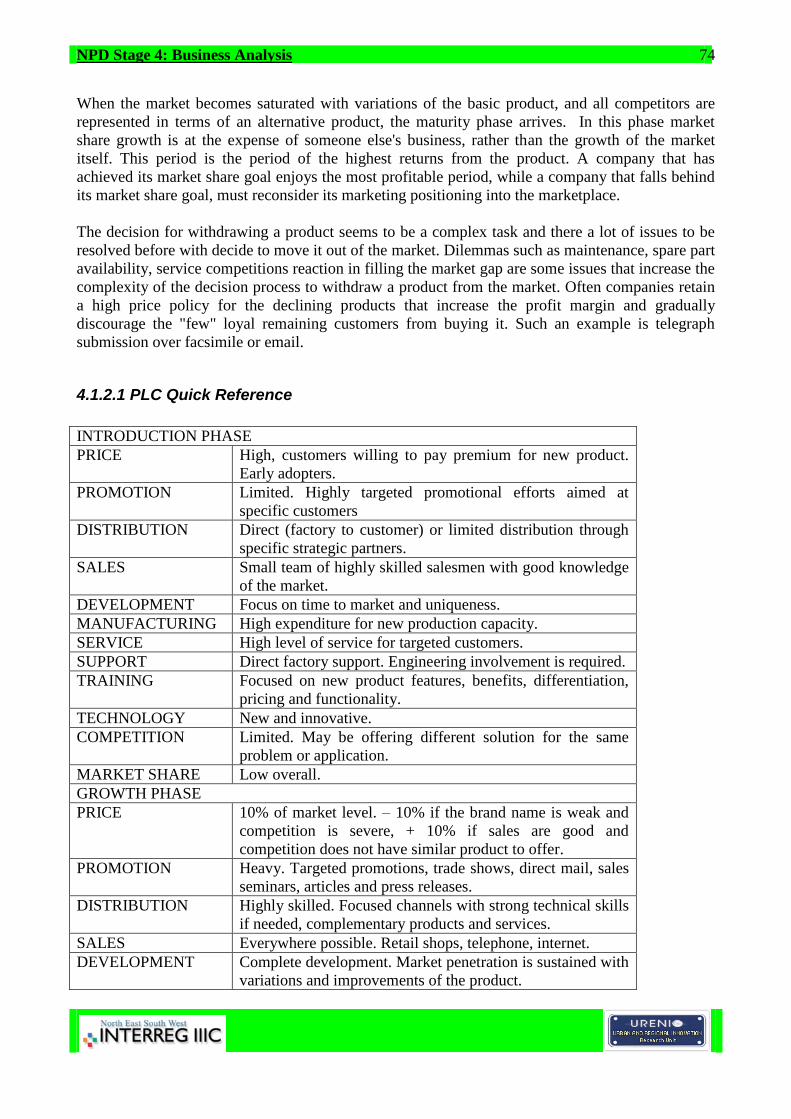
NPD Stage 4: Business Analysis
74
When the market becomes saturated with variations of the basic product, and all competitors are
represented in terms of an alternative product, the maturity phase arrives. In this phase market
share growth is at the expense of someone else's business, rather than the growth of the market
itself. This period is the period of the highest returns from the product. A company that has
achieved its market share goal enjoys the most profitable period, while a company that falls behind
its market share goal, must reconsider its marketing positioning into the marketplace.
The decision for withdrawing a product seems to be a complex task and there a lot of issues to be
resolved before with decide to move it out of the market. Dilemmas such as maintenance, spare part
availability, service competitions reaction in filling the market gap are some issues that increase the
complexity of the decision process to withdraw a product from the market. Often companies retain
a high price policy for the declining products that increase the profit margin and gradually
discourage the "few" loyal remaining customers from buying it. Such an example is telegraph
submission over facsimile or email.
4.1.2.1 PLC Quick Reference
INTRODUCTION PHASE
PRICE High, customers willing to pay premium for new product.
Early adopters.
PROMOTION Limited. Highly targeted promotional efforts aimed at
specific customers
DISTRIBUTION Direct (factory to customer) or limited distribution through
specific strategic partners.
SALES Small team of highly skilled salesmen with good knowledge
of the market.
DEVELOPMENT Focus on time to market and uniqueness.
MANUFACTURING High expenditure for new production capacity.
SERVICE High level of service for targeted customers.
SUPPORT Direct factory support. Engineering involvement is required.
TRAINING Focused on new product features, benefits, differentiation,
pricing and functionality.
TECHNOLOGY New and innovative.
COMPETITION Limited. May be offering different solution for the same
problem or application.
MARKET SHARE Low overall.
GROWTH PHASE
PRICE 10% of market level. – 10% if the brand name is weak and
competition is severe, + 10% if sales are good and
competition does not have similar product to offer.
PROMOTION Heavy. Targeted promotions, trade shows, direct mail, sales
seminars, articles and press releases.
DISTRIBUTION Highly skilled. Focused channels with strong technical skills
if needed, complementary products and services.
SALES Everywhere possible. Retail shops, telephone, internet.
DEVELOPMENT Complete development. Market penetration is sustained with
variations and improvements of the product.
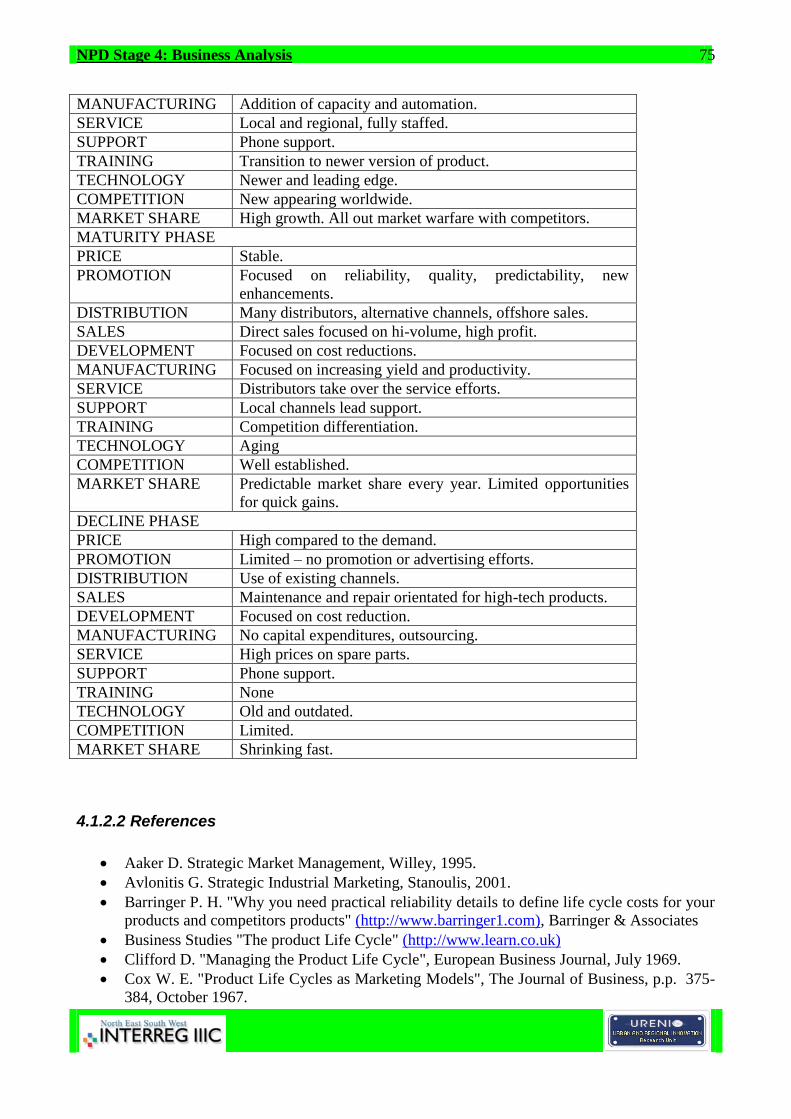
NPD Stage 4: Business Analysis
75
MANUFACTURING Addition of capacity and automation.
SERVICE Local and regional, fully staffed.
SUPPORT Phone support.
TRAINING Transition to newer version of product.
TECHNOLOGY Newer and leading edge.
COMPETITION New appearing worldwide.
MARKET SHARE High growth. All out market warfare with competitors.
MATURITY PHASE
PRICE Stable.
PROMOTION Focused on reliability, quality, predictability, new
enhancements.
DISTRIBUTION Many distributors, alternative channels, offshore sales.
SALES Direct sales focused on hi-volume, high profit.
DEVELOPMENT Focused on cost reductions.
MANUFACTURING Focused on increasing yield and productivity.
SERVICE Distributors take over the service efforts.
SUPPORT Local channels lead support.
TRAINING Competition differentiation.
TECHNOLOGY Aging
COMPETITION Well established.
MARKET SHARE Predictable market share every year. Limited opportunities
for quick gains.
DECLINE PHASE
PRICE High compared to the demand.
PROMOTION Limited – no promotion or advertising efforts.
DISTRIBUTION Use of existing channels.
SALES Maintenance and repair orientated for high-tech products.
DEVELOPMENT Focused on cost reduction.
MANUFACTURING No capital expenditures, outsourcing.
SERVICE High prices on spare parts.
SUPPORT Phone support.
TRAINING None
TECHNOLOGY Old and outdated.
COMPETITION Limited.
MARKET SHARE Shrinking fast.
4.1.2.2 References
Aaker D. Strategic Market Management, Willey, 1995.
Avlonitis G. Strategic Industrial Marketing, Stanoulis, 2001.
Barringer P. H. "Why you need practical reliability details to define life cycle costs for your
products and competitors products" (http://www.barringer1.com), Barringer & Associates
Business Studies "The product Life Cycle" (http://www.learn.co.uk)
Clifford D. "Managing the Product Life Cycle", European Business Journal, July 1969.
Cox W. E. "Product Life Cycles as Marketing Models", The Journal of Business, p.p. 375-
384, October 1967.
NPD Stage 4: Business Analysis
76
Daft L. Organizational Theory And Design, West Publishing, St Paul Minnesota, 1992.
Drummond G. Ensor J. Strategic Marketing: Planning and Control, Butterworth -
Heinemann, 2001.
Genesis Strategies "Product Life Cycle Management"
(http://www.genesisstrategies.com)
Hata T. Sakamoto H. Kato S. Kimura F. Suzuki H. "Feasibility Study for Rapid Product
Life Cycle" (http://www.cim.pe.u-tokyo.ac.jp), University of Tokyo
Jensch J. "Strategic Marketing and the Product Life Cycle"
(http://www.questteam.com), 1999
Life Cycle Strategies Inc. "Three Fundamentals for Effective Product Management: A
Practical Guide for Improving Product Success", 1999
Lightfoot W. "Product Life Cycle Stages" (http://www.marketinginc.com)
McGrath M. Product Strategy of High-Technology Companies, McGraw-Hill, 2000.
McNamara C. "Basic Overview of Organizational Life Cycles"
(http://www.mapnp.org/library/org_thry/org_cycl.htm)
Norman D. "The life cycle of a technology: Why it is so difficult for large companies to
innovate" (http://www.jnd.org), 1998
Resources "Locational Implications of the Product Cycle"
(http://www.faculty.washington.edu/krumme/systems/pcycle.html)
Smith J. C. "Product Life Cycle" (http://www.accessnorthga.com)
Twiss B. C. "Forecasting Market Size and Market Growth Rates for New Products", Journal
of Product Innovation Management, p.p. 19-29, 1984, Elsevier Science.
William D. & McCarthy J. E. Product Life Cycle: "Essentials of Marketing", Richard D
Irwin Company, 1997.
4.1.3 Gantt Charts
Gantt Charts are used to analyze and plan complex projects. Specifically they can be used to plan
the tasks ahead, to schedule all the tasks, to allocate resources and work out the critical path of a
project in terms of its required completion date. In this way Gantt Charts can be used to monitor the
progress of a project. All activities sequential or parallel can be at any time checked and remedy
actions can be taken if a project or a specific activity has fallen behind.
The most common software tool that is used by managers to build and manage Gantt Charts is
Microsoft Project. The steps that are needed for the Gantt Chart to be built are the following.
Listing all the project activities or tasks and their duration.
Plotting the tasks onto a graph paper.
Scheduling all the activities.
Presenting the analysis.
A case study of the creation of a Gantt Chart for the development of a custom written computer
project is available.
Source: “Gannt Charts: Planning and Scheduling More Complex Projects”, Mind Tools, On-line
http://www.mindtools.com

NPD Stage 4: Business Analysis
77
4.1.3.1 Case Studies - Examples
Case Study: "Planning a custom written computer project".
Step 1: All the required tasks or activities are noted. Information of their duration, potential
beginning and whether they are parallel or sequential is noted as well.
Table 1: Activities List
TASK START LENGTH TYPE DEPENDS ON
1. High level analysis Week 1 5 days Sequential
2. Selection of hardware Week 1 1 day Sequential 1
3. Installation of hardware Week 3 2 weeks Parallel 2
4. Analysis of core modules Week 1 2 weeks Sequential 1
5. Analysis of supporting modules Week 1 2 weeks Sequential 4
6. Programming of core modules Week 4 3 weeks Sequential 4
7. Programming of supporting
modules
Week 4 3 weeks Sequential 5
8. Quality assurance of core
modules
Week 5 1 week Sequential 6
9. Quality assurance of supporting
modules
Week 5 1 week Sequential 7
10. Core module training Week 7 1 day Parallel 6
11. Development of accounting
reporting
Week 6 1 week Parallel 5
12. Development of management
reporting
Week 6 1 week Parallel 5
13. Development of management
analysis
Week 6 2 weeks Sequential 5
14. Detailed training Week 7 1 week Sequential 1-13
15. Documentation Week 4 2 weeks Parallel 13
Source: Mind Tools, “Gantt Charts – Planning and Scheduling More Complex Projects”, On-line
http://www.mindtools.com/pages/article/newPPM_03.htm
Step 2: The tasks are plotted onto graph paper. This will produce an untidy diagram as the one
shown bellow.

NPD Stage 4: Business Analysis
78
Figure 1: Plotting the Tasks
Source: Mind Tools, “Gantt Charts – Planning and Scheduling More Complex Projects”, On-line
http://www.mindtools.com/pages/article/newPPM_03.htm
Step 3: All activities are scheduled in such a way that the sequential activities are carried out in the
required sequence. Parallel tasks are scheduled in such a way that they do not interfere with
sequential ones.
Step 4: The analysis is presented. This can look something like the chart shown bellow.
Figure 2: Analysis Presentation
Source: Mind Tools, “Gantt Charts – Planning and Scheduling More Complex Projects”, On-line
http://www.mindtools.com/pages/article/newPPM_03.htm

NPD Stage 4: Business Analysis
79
4.1.3.2 References
Durfee W, Chase T, >"Brief Tutorial on Gantt Charts"
(http://www.me.umn.edu/courses/me4054/assignments/gantt.html), 2003.
Gannt Charts & Timeline Center, >"How to Draw Gantt Charts"
(http://www.smartdraw.com/tutorials/gannt/tutorial.html), Smart Draw
Matthies L H, "Using the Gannt Chart to Plan and Control a Project", Systemation Inc,
1974.
4.1.4 Critical Path Analysis & PERT
Critical Path Analysis and PERT charts are two very powerful tools that can help a company or a
person to schedule and manage large complex projects. Both tools were developed in the 50's to
manage large defense projects and are used ever since. Critical Path Analysis is similar to Gantt
charts. It can help schedule large complex projects in a way that is familiar to Gantt Charts. The
benefit of using Critical Path Analysis instead of Gantt Charts is that CPA can identify the reason
behind the delay of a task or activity and very easily relocate resources so that the task can catch up
and be completed on time. Also CPA allows the user to know the minimum time required for a task
to be completed. This is very handy in the case of accelerated projects since CPA can identify
which tasks can be moved along faster. The main disadvantage of CPA is that the relation of tasks
is not so apparent as with Gantt Charts.
PERT (Program Evaluation and Review Technique) Chart is a variation of CPA. PERT Charts tend
to have a more sceptical approach than CPA in terms of scheduling tasks. For the tool to be used,
an estimation of the shortest possible time each task will take, the most likely length of time each
task will take and the longest time each time will take must be taken into account. A formula is then
used to calculate the time to use for each task. This is given bellow.
Task time = (Shortest time + 4 x Likely time + Longest time) / 6
This is very helpful for getting realistic estimates of time.
Both tools can be used in a series of steps that are described bellow.
Step 1: All the activities of a project are noted along with their respective duration, starting point,
type and dependency as with Gantt Charts.
Step 2: The activities are plotted as a circle and arrow diagram. For example a very simple diagram
for the case study presented for Gantt Charts is shown bellow.
Figure 1: Simple Circle and Arrow Diagram
1 2
1 Week
High Level Analysis

NPD Stage 4: Business Analysis
80
Source: Mind Tools, "Critical Path Analysis & PERT Charts", On-line:
http://www.mindtools.com/critpath.html
Step 3: All the activities sequential or parallel are interconnected using arrows. And the complete
CPA Chart is formed.
Step 4: Using the CPA Chart the steps or activities, which are required so that a goal is achieved,
are identified.
Source: Mind Tools, "Critical Path Analysis & PERT Charts", On-line:
http://www.mindtools.com/critpath.html
4.1.5 Stakeholder Analysis
The first step in stakeholder analysis is to identify who are the major stakeholders that can affect
positively or negatively a project. For this to be done one should consider the people that are
affected by the work done, the people that have some kind of influence or power over it and the
people that have a specific interest in the successful conclusion of the project. One can see in the
table bellow some of the stakeholders that usually influence a major project.
Table 1: Major Stakeholders Identification
INTERNAL BUSSINESS EXTERNAL BUSSINESS EXTERNAL GENERAL
The boss Shareholders Government
Senior executives Business partners Trade associations
Coworkers Suppliers The press
Project team Lenders Interest groups
Customers Analysts The public in general
Potential customers Future recruits The community
Source: Mankyelow Rachel, "Stakeholder Analysis & Stakeholder Management - Winnig Support
for Your Products", Mind Tools, On-line:
http://www.mindtools.com/pages/article/newPPM_07.htm
One should note that although stakeholders can sometimes be organizations or group of people one
must identify the single person from an organization or a group with whom one can communicate.
The second step in stakeholder analysis is the prioritization of the identified stakeholders. Some of
the stakeholders may have the power to block or advance a project. Others may be interested or not.
All the stakeholders must be mapped using a Power / Interest Grid as the one shown bellow.

NPD Stage 4: Business Analysis
81
Figure 1: Power / Interest Grid for Stakeholder Prioritization
Source: Mankyelow Rachel, "Stakeholder Analysis & Stakeholder Management - Winnig Support
for Your Products", Mind Tools, On-line:
http://www.mindtools.com/pages/article/newPPM_07.htm
The position of each stakeholder in the grid can reveal the way one can handle him and what kind
of actions to be taken for him. Specifically:
High power / interested people: These are the people that one should keep satisfied and be
engaged with.
High power / less interested people: An effort should be made to keep these people satisfied
but one should not over do it since they tend to be easily bored.
Low power / interested people: These must be kept inform about the progress of the project.
They can be very helpful in difficult times.
Low power / less interested people: These should be kept in a close watch. One must keep
communications with them at a minimum.
The next step in the analysis is for the person conducting the analysis to try to understand the key
stakeholders. In respect to that one must know how to approach them, how to communicate with
them, what are their likes and dislikes. The key questions that one should ask himself when he tries
to understand his stakeholders are:
What financial or emotional interest does the stakeholder concerning the completion of the
project?
What are his motivations?
What kind of information will he need?
What is the best way of communicating with him?
What is his opinion about the project?
Who or what can influence his opinion about the project?
If the stakeholder is negative about the project what will win him around?
If the stakeholder is negative about the project and cannot be won around how one can
manage his opposition?

NPD Stage 4: Business Analysis
82
One can manage the understanding he has gained on the stakeholder map by color-coding. For
example green could be used for supporters, red for critics and orange for neutrals.
Source: Mind Tools, “Stakeholder analysis & Stakeholder Management – Winning Support for
you Projects”, On-line http://www.mindtools.com/pages/article/newPPM_07.htm
4.1.5.1 Stakeholder Analysis Management
In every company small or large projects such as new product development tend to become more
important as time goes by and people, are more and more affected by them. Some of these people
have the power to get in the way of such projects and others can support them in a big way.
Stakeholder management is a process by which one can identify key stakeholders and win their
support. Stakeholder analysis is the first stage of stakeholder management. The analysis helps in the
identification and the visualization of the most important stakeholders. During the analysis one
must brainstorm so that to identify the main stakeholders, he must then prioritize them by power
and interest, and finally plot a Power / Interest Grid. Also the motivation that drives the
stakeholders and the way one can win them is also analyzed.
Once stakeholder analysis is completed a stakeholder planning must be performed. This is a process
where one can plan how to manage the stakeholders and gain their support for the project or
projects in hand. Stakeholder planning can be conducted by using a planning sheet by going
through the following steps.
Insertion of information from the Power / Interest Grid.
Management approach planning.
Identification of what it is required from each stakeholder.
Identification of the messages that need to be conveyed.
Identification of the actions that need to be carried out and the way communications should
be performed.
Good stakeholder management can help a company to manage the politics that sometimes can
come with major projects.
Source: Mankyelow Rachel, "Stakeholder Analysis & Stakeholder Management - Winnig Support
for Your Products", Mind Tools, On-line:
http://www.mindtools.com/pages/article/newPPM_07.htm
4.1.5.2 Stakeholder Analysis Planning
Once a stakeholder analysis is complete, one will have the needed information to plan stakeholder
communication. Stakeholder communication is crucial because communication will be the means
for successful stakeholder management. To start off the stakeholder planning process one must set-
up or draw a table such as the one shown bellow.

NPD Stage 4: Business Analysis
83
Power
Interest
Stakeholder name
Key interests and issues
Current status
Desired support
Desired project role
Actions desired
Messages needed
Actions and communications
Using the table one can go through the process using the following steps.
Update the planning sheet using the information in the Power / Interest Grid. Based on
the information gathered during the stakeholder analysis, one should enter the stakeholder
name, his influence, and his current status (advocate - supporter - neutral - critic - blocker).
Plan the approach to stakeholder management. One should think about what kind of
help would he need during the course of the project, the time necessary to obtain it and the
way to manage communications and the help provided. Help wit a project could include
sponsorship, advice, expert input, material, quality control etc.
Think of what is needed from each stakeholder. One should think about the levels of
support required from each stakeholder, the roles that the stakeholders should perform, and
the actions they should perform. This information should be entered in the "Desired
support", the "Desired project role" and the "Actions desired" lines of the planning table.
Identify the messages you want to get through. All the messages that need to be
conveyed to the stakeholders to win their support should be noted. Typical messages should
include the benefits in increasing profitability and delivering improvements.
Identify actions and communications. Finally one should identify all the actions needed
for the messages to be conveyed to the stakeholders and the means or ways of
communicating these messages to them.
Source: Mind Tools, “Stakeholder Planning – Planning Stakeholder Communications”, On-line
Source: Manktelow Rachel, “Stakeholder Planning – Planning Stakeholder Communications”,
Mind Tools, On-line http://www.mindtools.com/pages/article/newPPM_08.htm
4.1.5.3 References
Manktelow R, "Managing Stress for Career Success", Jul 2003.
Marr J & walker S, "Stakeholder Power: A Winning Plan for Building Stakeholder
Commitment and Driving Corporate Growth", Perseus Books Group, 1st Edition, 2002
Post J, "Redefining the Corporation: Stakeholder Management & Organizational Wealth",
Stanford University Press, 1st Edition, 2002
Svendson A, "The Stakeholder Strategy", Berret - Koehler Publishers, 1998.

NPD Stage 4: Business Analysis
84
4.2 Level Assessment for Stage 4: Business Analysis
Assessment 4 evaluates the way or ways of financing the development of the selected concept into
a new product and the way the whole project is scheduled in respect to time limitations and how the
required resources are located, used or reallocated to fit the project needs.
As in Assessment 3 a GO, Hold or KILL decision is issued for proceeding to the next level
depending on the given answers to the questions.

NPD Stage 5: Beta & Market Testing
85
NPD Stage 5: Beta & Market Testing
Product testing can occur in all levels of the NPD process. It can take the form of concept testing at
the end of concept development, of prototype and beta testing at the end of the prototype
development or of final product testing at the end of the technical implementation.
Regardless of the level or phase of the NPD process, the product testing process consists of three
components: the creation of a testing strategy (which often includes the creation of test cases), the
creation of a test plan (which includes test cases and test procedures and the execution of the tests.
The test strategy is a formal description of how a product will be tested. For the creation of such a
strategy the testing team must analyze all the product requirements, write the test strategy and
review the plan. The test plan may include test cases, conditions, the test environment, a list of
related tasks, pass / fail criteria and some kind of risk assessment.
The test plan is prepared by reviewing all the functional requirements of the product. These
requirements can be easily broken down into specific test procedures. The test procedures can
define the test conditions, data to be used for testing and the expected results. The test plan should
include tests cases or scenarios, which should be designed to represent typical and extreme
situations that may occur during the product's life.
Tests execution is completed, by following the test documents in a methodical manner. Test
documents are the results of the test strategy creation and the test plan development. As each test is
executed a record of the test result must be kept in a test execution log. All test results noted in the
execution log must be evaluated by engineers and screened against the pass / fail criteria set in the
test plan. Any faults or bugs in the operation of the product should be fixed before the product goes
through the technical implementation and manufacturing phase. There are cases where faults are
not fixed since they are noted as low importance in the risk assessment prepared in earlier levels of
development. After all tests are completed a summary is prepared and delivered to the project
manager, the quality assurance manager and the leader of the test team. When all tests in the test
summary are certified then the product takes the go ahead to the next level of development.
5.1 Tools & Solutions
The solution or solutions that deal with beta and market product testing vary and cover a lot of
different aspects and issues. One should look into product development testing and the tests that
must be carried out during this stage, he must give extra notice into major market research issues
and he must know what kind of tests are available. Also some basic or in some cases specialized
knowledge of prototyping techniques and testing must be in hand.
All the above are discussed in this Level as tools or methods or techniques and the Level aims to
give a spherical informative point of view of what is available and what can be done to solve the
problem of testing. Apart from that, the most important testing techniques are given bellow.
Unit testing. Unit testing occurs when all product components are tested and the expected test
results are met or their differences are explained and accepted. It involves the testing of the product
as a whole.
NPD Stage 5: Beta & Market Testing
86
Functional testing. It is a black-box testing procedure designed to examine the functionality of the
product. It is performed by specialized test engineers.
Usability testing. During this test the user-friendliness of the product is examined. This product
characteristic is purely subjective and depends on the targeted product end-user or consumer. User
interviews, surveys, market research results and other techniques can be used to define and analyze
the test procedure and the test results.
Integration testing. Integration testing is the continuous testing of an application as new
functionality is recommended. Programmers, engineers and testing personnel usually perform this
type of testing.
System testing. System testing is a black box testing performed by the test team as the complete
product is configured in a controlled environment. The purpose of the system testing is the
validation of the products or application accuracy, its ability to perform all the tasks designed for
and the simulation of real life scenarios.
End-to-End testing. This kind of testing is very similar to system testing since during the test
situations that mimic real life are used. During this test the product or service or application is put
to interact with other components that it will usually be connected to or incorporated with in real
life.
Performance testing. This kind of testing verifies possible loads, volumes and response times that
the product may be specified to have.
Installation testing. This test examines the way a new product or service can be installed,
uninstalled, upgraded or changed.
Alpha testing. This test takes place when development is near completion. End-users or customers
usually perform it and its results can only be used for minor design changes to be made.
Beta testing. As with alpha testing this test is performed by end-users or customers. The test is
performed when all development is completed and just before the product or service is launched
into a market.
Source: Better Product Design, Institute of Manufacturing, University of Cambridge, On-line
http://www.betterproductdesign.net/tools/concept/testing.htm
5.1.1 Rapid Prototyping
Rapid Prototyping (RP) is widely used in many industries such as aerospace, medical and
consumer products industries and as the name suggests its use is to quickly make prototypes for
communication and testing purposes. RP really refers to a set of technologies that can automatically
construct models from CAD data. These models allow developers and R&D teams to quickly make
three-dimensional designs of developing products. These models are used to simplify complex
products and can lead to early tooling for manufacturing or production and early packaging
planning. In this way substantial amounts of time and money are saved since manufacture,
production and preparation of product launch can be developed before the product reaches its final

NPD Stage 5: Beta & Market Testing
87
form. In addition RP models can do a few things that usual metal or plastic prototypes cannot.
Simulations on the performance of the product can be run using the RP model and the CAD data.
A very important feature of Rapid Prototyping is Rapid Tooling (RT). RT is the automatic
fabrication of production quality machine tools. Tooling for the production of new products is one
of the most expensive steps in a manufacturing process since high quality is required. Tools often
have complex geometries with dimensions of extremely low tolerances. Also they must be hard,
wear - resistant and have extremely smooth surfaces. To meet these requirements tool mold
construction can be very expensive and time consuming. So RP techniques are used to speed up the
process. It is said that RP techniques can reduce tooling costs and subsequently product developing
times up to 75%. Rapid tooling can be divided into two main categories: Direct and Indirect RT.
Direct Rapid Tooling is when CAD data are used to construct models of tools in the same
way as they it happens in the case of Rapid Prototyping for products. This technique is
today in the development process.
Indirect Rapid Tooling is when RP parts are used to construct molds and dies that are used
to construct the tools.
A usual result of Rapid Prototyping is Rapid Manufacturing (RM). RM is the automated production
of products direct from CAD data. Today only a small amount of products are produced in this
way. As new materials and technologies become available, the RM technique will become more
and more used.
RM can be expensive compared to traditional manufacturing processes especially compared with
large mass production runs. For short runs, however, RM can be cheaper since it does not require
tooling. RM is also the best technique for producing custom parts or products, which are tailored to
the customer's specifications. Finally RM can be used when the product geometry is too complex,
or contains internal voids and layered structures.
5.1.1.1 Prototyping Testing
When prototypes are ready, they must go through vigorous tests, which are divided into Functional
Tests, Customer Tests and Market Tests. Functional tests are divided into two sequential types of
tests: Alpha testing and Beta Testing. A brief description of each is given bellow.
Alpha Testing means testing the product prototype within the company to see how it
performs in different applications. Engineers or scientists do this usually within the R&D
department and if all tests are successful the product prototype moves into Beta Testing.
Beta testing, is a set of tests that are carried out using potential customers. These customers
test the product prototype and provide feedback to the company of their experience using
the product. The marketing department of a company usually supervises beta testing,
although the results go back to the R&D department for possible refinements of the product
prototype. It is most successful if the potential customers used are heterogeneous, if the
potential application(s) is not fully known, if several decision makers, such as high
executives or managers, are involved in purchasing the product and if the opinion leadership
of early adopters is sought.

NPD Stage 5: Beta & Market Testing
88
Customer Testing can take a variety of forms. One can bring customers into a lab and encourage
them to test the prototype or giving them samples of the product prototype to take back into their
homes and test it. In home placement are common for products ranging from ice cream flavours to
home appliances. For example when "DuPont" developed its new synthetic carpeting, it installed
free carpeting into several homes in exchange for the homeowners promise to report back to the
company, after a certain period of time, their likes and dislikes about the carpeting.
After management is satisfied that Functional and Customer Testing provided enough feedback,
then the product prototype is given a brand name and packaging and it is put through a Market
Test. During a Market Test, the new product is introduced into an authentic setting to learn how big
the market is and how consumers and dealers react to handling, using and purchasing the product.
In this way not only the product is tested but also the hypothesis, market research and work done in
the early stages of the NPD (mainly the first two stages). A good example of Market Testing is
"IdeaLab", which is a company that introduced new Internet based ventures such as EToys. When
the company decided to launch into the Internet a web-based car buying service called "Cars
Direct", a web site was created as a prototype to test the market for such a service. This web site
was a live one and monitored on-line market reactions. Through the site four cars were sold in one
evening, a fact that showed the product's potential for strong market acceptance.
In testing consumer products, a company should focus on the estimation of four variables: trial,
first repeat purchase, adoption and purchase frequency. A company by testing wants to see whether
these variables exist at high levels. For example one can see that many consumers trying a product
for the first time but few re-buying it. In another case one can see high adoption but very low
purchase frequency (good example of this are frozen foods). The major methods of consumer goods
market testing, from the least to the most costly are given bellow.
Sales - Wave Research. Consumers that initially try the product at no cost are offered the
product or a competitive one for up to five times at a slightly reduced price. The number of
customers that select the product again and their satisfaction towards the product is noted.
Simulated Test Marketing. 40 buyers are asked to answer questions about brand
familiarity and product preferences. Then they are asked to see commercials of both
competitive products and of the new product and they are given money and brought to a
store to make a purchase. The company then notes how many customers have bought the
new product and how many the competitive ones. This is a test of the advertisement's
effectiveness against competitive ones in a simulated trial. Also customers receive a free
sample of the product and then are asked to report on product attributes, usage, satisfaction
and purchase intention.
Controlled Test Marketing. In this kind of test a research company manages a panel of
outlets that will carry the new product for a fee. The new product company selects the
number of stores and their geographical location. The research company delivers the new
product to the selected stores and controls the positioning of the product into each store and
it's pricing. Sales are recorded through electronic means and evaluated. Also local
advertising and promotions during the test is evaluated.
Test Markets. In this case the company chooses few cities and through full advertising and
promotion, the company's sales force tries to carry the product into full exposure and large-
scale sales. Here the people involved with the test must decide on the number and location
of the cities, the length of the test, what to track and what action to take. Nowadays Market
Tests become more and more scarce since they cost too mush and companies prefer more
economical test methods with smaller test areas and shorter test periods.

NPD Stage 5: Beta & Market Testing
89
Business goods can also benefit from market testing and there are several methods available to do
just that. Expensive industrial goods usually undergo just Alpha and Beta Testing. But it is better to
undergo and some form of market test as well. So these goods usually are market tested in trade
shows. Trade shows draw large number of customers who view many products in a few
concentrated days. The company that wants to test its new product, can observe how much interest
customers show for the product, how they react to its various features and how many express
purchase intentions and place orders. The disadvantage of trade shows is that the new product is
revealed to the competition and so the company must be prepared to launch the new product into
the market soon after the trade show.
5.1.1.2 Prototyping Techniques
5.1.1.2A Fused Deposition Modelling (FDM)
Figure 1: Diagram of FDM
Source: "Fused Deposition Modeling", Worldwide Guide for Rapid Prototyping, On-line:
http://home.att.net/~castleisland/fdm_int.htm
“FDM is the second most widely used rapid prototyping technology, after stereolithography. A plastic
filament is unwound from a coil and supplies material to an extrusion nozzle. The nozzle is heated to melt
the plastic and has a mechanism, which allows the flow of the melted plastic to be turned on and off. The
nozzle is mounted to a mechanical stage, which can be moved in both horizontal and vertical directions.
As the nozzle is moved over the table in the required geometry, it deposits a thin bead of extruded plastic to
form each layer. The plastic hardens immediately after being squirted from the nozzle and bonds to the layer
below. The entire system is contained within a chamber, which is held at a temperature just below the
melting point of the plastic.
Several materials are available for the process including ABS and investment casting wax. ABS offers good
strength, and more recently polycarbonate and polysulfone materials have been introduced which extend the
capabilities of the method further in terms of strength and temperature range. Support structures are
fabricated for overhanging geometries and are later removed by breaking them away from the object. A
water-soluble support material, which can simply be washed away, is also available. The method is office-friendly and quiet. FDM is fairly fast for small parts on the order of a few cubic inches,
or those that have tall, thin form-factors. It can be very slow for parts with wide cross sections, however. The
finish of parts produced with the method have been greatly improved over the years, but aren't quite on a par
with stereolithography. The closest competitor to the FDM process is probably three-dimensional printing.”

NPD Stage 5: Beta & Market Testing
90
Source / Taken from: "Fused Deposition Modeling", Worldwide Guide for Rapid Prototyping,
On-line: http://home.att.net/~castleisland/fdm_int.htm
5.1.1.2B Inkjets
Figure 1: Inkjets Diagram
Source: "Inkjets", Worldwide Guide for Rapid Prototyping, On-line:
http://home.att.net/~castleisland/ink_int.htm
Thermal Phase Change Inkjets
“Solidscape, Inc.'s inkjet method is illustrated, but others are also available. This machine uses a single jet
each for a plastic build material and a wax-like support material, which are held in a melted liquid state in
reservoirs. The liquids are fed to individual jetting heads, which squirt tiny droplets of the materials as they
are moved in X-Y fashion in the required pattern to form a layer of the object. The materials harden by
rapidly dropping in temperature as they are deposited.
After an entire layer of the object is formed by jetting, a milling head is passed over the layer to make it a
uniform thickness. Particles are vacuumed away as the milling head cuts and are captured in a filter. The
process is repeated to form the entire object. After the object is completed, the wax support material is either
melted or dissolved away.
The most outstanding characteristic of the Solidscape system is the ability to produce extremely fine
resolution and surface finishes, essentially equivalent to CNC machines. However, the technique is very
slow for large objects. While the size of the machine and materials are office-friendly, the use of a milling
head creates noise, which may be objectionable in an office environment. Materials selection also is very
limited.
Other manufacturers use considerably different inkjet techniques, but all rely on squirting a build material in
a liquid or melted state, which cools or otherwise hardens to form a solid on impact. 3D Systems produces
an inkjet machine called the ThermoJet Modeller(tm), which utilizes several hundred nozzles in a wide
head configuration. It uses a hair-like matrix of build material to provide support for overhangs, which can
be easily brushed off once the object, is complete. This machine is much faster than the Solidscape
approach, but doesn't offer as good a surface finish or resolution.
All thermal phase change inkjets have material limitations and make fragile parts. The applications range
from concept models to precise casting patterns for industry and the arts, particularly jewellery.”
Photopolymer Phase Change Inkjets “Objet Geometries Ltd., an Israeli company, announced the Quadra(tm) system in early 2000. It's
potentially a promising replacement for stereolithography. The process is based on photopolymers, but uses
a wide area inkjet head to layer wise deposit both build and support materials. It subsequently completely
cures each layer after it is deposited with a UV flood lamp mounted on the print head. The support material,
which is also a photopolymer, is removed by washing it away in a secondary operation. The low price,
approximately $65K, and specifications that are similar to laser-based stereolithography systems costing ten

NPD Stage 5: Beta & Market Testing
91
times as much make this an important technology to watch.
In July 2002, 3D Systems introduced a similar photopolymer-based system called the InVision(tm). It uses
the technology originally developed for the ThermoJet Modeller(tm).”
Source / Taken from: "Inkjets", Worldwide Guide for Rapid Prototyping, On-line:
http://home.att.net/~castleisland/ink_int.htm
5.1.1.2C Laminated Object Manufacturing
Figure 1: Laminated Object Manufacturing Diagram
Source: "Laminated Object Manufacturing", Worldwide Guide for Rapid Prototyping, On-line:
http://home.att.net/~castleisland/lom_int.htm
“Profiles of object cross sections are cut from paper or other web material using a laser. The paper is
unwound from a feed roll onto the stack and first bonded to the previous layer using a heated roller, which
melts a plastic coating on the bottom side of the paper. The profiles are then traced by an optics system that
is mounted to an X-Y stage.
After cutting of the layer is complete, excess paper is cut away to separate the layer from the web. Waste
paper is wound on a take-up roll. The method is self-supporting for overhangs and undercuts. Areas of cross-
sections, which are to be removed in the final object, are heavily crosshatched with the laser to facilitate
removal. It can be time consuming to remove extra material for some geometries, however.
Many companies and research groups have developed variations on this method. For example, Kira's Paper
Lamination Technology (PLT) uses a knife to cut each layer instead of a laser and applies adhesive to bond
layers using the xerographic process. There are also variations, which seek to increase speed and/or material
versatility by cutting the edges of thick layers diagonally to avoid stair stepping.
In general, the finish, accuracy and stability of paper objects are not as good as for materials used with other
RP methods. However, material costs are very low, and objects have the look and feel of wood and can be
worked and finished in the same manner. This has fostered applications such as patterns for sand castings.
While there are limitations on materials, work has been done with plastics, composites, ceramics and metals.
Some of these materials are available on a limited commercial basis.
The principal commercial provider of LOM systems, Helisys, ceased operation in 2000. However, there are
several other companies with either similar LOM technology, or in early commercial stages. These
companies are addressing market segments ranging from concept modelling to very large objects for
architectural applications.”
Source / Taken from: "Laminated Object Manufacturing", Worldwide Guide for Rapid
Prototyping, On-line: http://home.att.net/~castleisland/lom_int.htm

NPD Stage 5: Beta & Market Testing
92
5.1.1.2D Laser Engineered Net Shaping
Figure 1: Laser Engineered Net Shaping Diagram
Source: "Laser Engineered Net Shaping", Worldwide Guide for Rapid Prototyping, On-line:
http://home.att.net/~castleisland/len_int.htm
“Laser Engineered Net Shaping (LENS) is a technology that is gaining in importance and in early stages of
commercialisation. A high power laser is used to melt metal powder supplied coaxially to the focus of the
laser beam through a deposition head.
The laser beam typically travels through the centre of the head and is focused to a small spot by one or more
lenses. The X-Y table is moved in raster fashion to fabricate each layer of the object. The head is moved up
vertically as each layer is completed. Metal powders are delivered and distributed around the circumference
of the head either by gravity, or by using a pressurized carrier gas. An inert shroud gas is often used to shield
the melt pool from atmospheric oxygen for better control of properties, and to promote layer-to-layer
adhesion by providing better surface wetting.
A variety of materials can be used such as stainless steel, Inconel, copper, aluminium etc. Of particular
interest are reactive materials such as titanium. Materials composition can be changed dynamically and
continuously, leading to objects with properties that might be mutually exclusive using classical fabrication
methods.
The strength of the process lies in the ability to fabricate fully dense metal parts with good metallurgical
properties at reasonable speeds. Objects fabricated are near net shape, but generally will require finish
machining. They have good grain structure, and have properties similar to, or even better than the intrinsic
materials. Selective laser sintering is at present the only other commercialised RP process that can produce
metal parts directly. LENS has fewer material limitations than SLS and doesn't require secondary firing
operations as some of those processes do, however.”
Source / Taken from: "Laser Engineered Net Shaping", Worldwide Guide for Rapid Prototyping,
On-line: http://home.att.net/~castleisland/len_int.htm

NPD Stage 5: Beta & Market Testing
93
5.1.1.2E Selective Laser Sintering
Figure 1: Selective Laser Sintering Diagram
Source: "Selective Laser Sintering", Worldwide Guide for Rapid Prototyping, On-line:
http://home.att.net/~castleisland/sls_int.htm
“A roller spreads thermoplastic powder over the surface of a build cylinder. The piston in the cylinder moves
down one object layer thickness to accommodate the new layer of powder. The powder delivery system is
similar in function to the build cylinder. Here, a piston moves upward incrementally to supply a measured
quantity of powder for each layer.
A laser beam is then traced over the surface of this tightly compacted powder to selectively melt and bond it
to form a layer of the object. The fabrication chamber is maintained at a temperature just below the melting
point of the powder so that heat from the laser need only elevate the temperature slightly to cause sintering.
This greatly speeds up the process. The process is repeated until the entire object is fabricated.
After the object is fully formed, the piston is raised to elevate it. Excess powder is simply brushed away and
final manual finishing may be carried out. No supports are required with this method, since overhangs and
undercuts are supported by the solid powder bed.
SLS offers the key advantage of making functional parts in essentially final materials. However, the system
is mechanically more complex than stereolithography and most other technologies. A variety of
thermoplastic materials such as nylon, glass filled nylon, and polystyrene are available. Surface finishes and
accuracy are not quite as good as with stereolithography, but material properties can be quite close to those
of the intrinsic materials. The method has also been extended to provide direct fabrication of metal and
ceramic objects and tools.
Since the objects are sintered they are porous. It may be necessary to infiltrate the part, especially metals,
with another material to improve mechanical characteristics.”
Source / Taken from: "Selective Laser Sintering", Worldwide Guide for Rapid Prototyping, On-
line: http://home.att.net/~castleisland/sls_int.htm

NPD Stage 5: Beta & Market Testing
94
5.1.1.2F Stereolithography
Figure 1: Stereolithography Diagram
Source: "Stereolithography", Worldwide Guide for Rapid Prototyping, On-line:
http://home.att.net/~castleisland/sla_int.htm
“Stereolithography is the most widely used rapid prototyping technology. Stereolithography builds plastic
parts or objects a layer at a time by tracing a laser beam on the surface of a vat of liquid photopolymer. This
class of materials, originally developed for the printing and packaging industries, quickly solidifies wherever
the laser beam strikes the surface of the liquid. Once one layer is completely traced, it's lowered a small
distance into the vat and a second layer is traced right on top of the first. The self-adhesive property of the
material causes the layers to bond to one another and eventually form a complete, three-dimensional object
after many such layers are formed.
Some objects have overhangs or undercuts, which must be supported during the fabrication process by
support structures. These are either manually or automatically designed, and fabricated right along with the
object. Upon completion of the fabrication process, the object is elevated from the vat and the supports are
cut off.
Stereolithography generally is considered to provide the greatest accuracy and best surface finish of any
rapid prototyping technology. Over the years, a wide range of materials with properties mimicking those of
several engineering thermoplastics, have been developed. Limited selectively colour-changing materials for
biomedical and other applications are available, and ceramic materials are currently being developed.
The technology is also notable for the large object sizes that are possible.”
Source / Taken from: "Stereolithography", Worldwide Guide for Rapid Prototyping, On-line:
http://home.att.net/~castleisland/sla_int.htm

NPD Stage 5: Beta & Market Testing
95
5.1.1.2G Three Dimensional Printing
Figure 1: Three Dimensional Printing Diagram
Source: "Three Dimensional Printing", Worldwide Guide for Rapid Prototyping, On-line:
http://home.att.net/~castleisland/3dp_int.htm
“Three-dimensional printing was developed at MIT. It's often used as a direct manufacturing process as well
as for rapid prototyping.
The process starts by depositing a layer of powder object material at the top of a fabrication chamber. To
accomplish this, a measured quantity of powder is first dispensed from a similar supply chamber by moving
a piston upward incrementally. The roller then distributes and compresses the powder at the top of the
fabrication chamber. The multi-channel jetting head subsequently deposits a liquid adhesive in a two
dimensional pattern onto the layer of the powder which becomes bonded in the areas where the adhesive is
deposited, to form a layer of the object.
Once a layer is completed, the fabrication piston moves down by the thickness of a layer, and the process is
repeated until the entire object is formed within the powder bed. After completion, the object is elevated and
the extra powder brushed away leaving a "green" object. No external supports are required during
fabrication since the powder bed supports overhangs.
Three-dimensional printing offers the advantages of speedy fabrication and low materials cost. In fact, it's
probably the fastest of all RP methods. Recently colour output has also become available. However, there
are limitations on resolution, surface finish, part fragility and available materials. The closest competitor to
this process is probably fused deposition modelling”.
Source / Taken from: "Three Dimensional Printing", Worldwide Guide for Rapid Prototyping,
On-line: http://home.att.net/~castleisland/3dp_int.htm
5.1.1.3 Case Studies - Examples
Case study: "Rapid Prototyping in the ceramics industry"
A study by the Royal Doulton Company has shown that, although Stereolithography may be too
expensive for use in the development of new tableware designs, there are specialist applications, in
particular, airline tableware, where the technology could be of great value. The study, which was
undertaken by Royal Doulton designer Richard Delaney as part of his Postgraduate Diploma in

NPD Stage 5: Beta & Market Testing
96
Design, compared the cost of developing a new teapot design by using conventional prototyping
methods and by using Stereolithography.
The concept design for the new pot was produced using Royal Doulton's concept visualisation
software. Before the design could be converted into the computer file needed to produce the
Stereolithography model, all the information was transferred into Delcam's Power Solution
software. Power Solution is a much more precise modelling and machining package that was
initially acquired by the company for the design and manufacture of dies for the granulate pressing
of tableware. One of the reasons for using Power Solution to generate the data needed for the
Stereolithography equipment was to ensure that all the surface fillets and intersections were
precisely closed. This is essential for successful operation of the rapid prototyping process. A
second reason for using Power Solution was to recreate the handle as the concept design software
gave a slightly inaccurate result, not always giving a constant thickness throughout the handle.
Thirdly, the Power Solution data used to produce the prototype can also be used to generate NC
data for machining production moulds or models.
The Stereolithography model was produced by the rapid prototyping bureaux at Rover Group in
four parts - the main body of the teapot, a plug to fit in the hole in the base that is required to allow
excess polymer to drain away, the spout and the lid. The parts were also assembled by the bureaux
and bead blasted to give a superior finish. The resulting prototype had a sufficiently good
appearance for use as a presentation model. In a genuine project, the prototype would be sprayed
white and lacquered to give an appearance closer to china. For this study, the surface was left in the
state that it was delivered to the Royal Doulton Company, so it could be used to help explain the
Stereolithography process.
The main advantage of the rapid prototyping approach was the speed of preparation of the model.
With this example, which is of average complexity, the prototype was produced in about a third of
the time taken using conventional modelling. Richard Delaney estimated that simple round designs
could be modelled conventionally in less time than would be needed for Stereolithography.
Equally, the gains with more complex shapes, including relief modelled decoration, would be even
greater. In the same way, the speed of modification of the design would depend on its complexity.
With conventional modelling, the item involved is usually completely remodelled, with each
modification taking almost as long as the production of the first prototype. Using CAD, any
adjustments can be made to the design relatively quickly. For pieces like the teapot,
Stereolithography also gives the ability to use the model as a china piece would be used. The
prototype has an exact wall thickness throughout the model so giving the same internal appearance.
This allows an accurate check to be made of its pouring capability, which is not possible with a
conventional solid prototype. In addition, the model can be supported by its handle, enabling the
feel and balance of the pot in use to be tested.
Despite these advantages, Peter Allen, Director of Design Development & Technology at Royal
Doulton, felt that the additional cost of Stereolithography, which totalled around one third more
than conventional techniques, could only be justified in special circumstances. Most new designs
for tableware are launched at a small number of key exhibitions. Since these dates are known well
in advance, the design development and prototyping work can be scheduled in plenty of time. One
area where time is more critical is in the supply of airline tableware. Royal Doulton has become
one of the world's largest suppliers of fine and bone china to the airline industry, supplying carriers
such as British Airways, All Nippon and Air Canada. Additionally, through its partnership with De
NPD Stage 5: Beta & Market Testing
97
Ster, the Dutch manufacturers of rotable plastics for airline use, the company's client base now
numbers around seventy airlines. The introduction of new shape designs for this market is usually
associated with a complete re-design of the aircraft interior, and always requires a rapid response.
"Customers from the airlines are not always sure what they want until they see our ideas visualised
on the computer" explained Mr. Allen. "Once a new design concept has been selected, we need to
make prototypes for approval as quickly as possible so that we can move into full-scale production
fast enough to meet the airline's deadline. In such cases, the additional cost of Stereolithography
could easily be justified.
Having built up the leading position in this market, we are keen to use any new technology that will
complement our traditional skills and allow us to offer an even better service to our customers."
The Royal Doulton Company The Royal Doulton Company is the world's leading manufacturer and
distributor in the premium ceramic tableware and giftware market. The company employs over
5,500 people on ten manufacturing sites, mainly based in Stoke-on Trent. In addition to the Royal
Doulton brand, the company manufactures other major brand names, including Royal Albert, Royal
Crown Derby and Minton. Around 50 % of the company's sales are made outside the UK.
Source: Programming Plus Inc, "Rapid Prototyping in the Ceramics Industry", On-line:
http://www.programmingplus.com/Roi_web/Demos/Delcam_web/info/case/doulton.htm
5.1.1.4 Software Tools
http://www.materialise.com/mt.asp?mp=hm_main
Materialise Software develops innovative applications enabling advanced use of the rapid
prototyping and tooling techniques. The Materialise software products provide a variety of
solutions for data handling in product communication, rapid prototyping and rapid tooling. Besides
this, the Materialise Software Development Services offer professional software solutions, tuned to
your needs. For this, Materialise has the largest software development team in the RP sector with
locations in Belgium and Kiev (Ukraine).
http://www.biba.uni-bremen.de/groups/rp/rp_soft.html
The currently available RP Workbench is a graphical data preparation tool for the verification
and conversion of geometric model data sets for Rapid Prototyping Applications. The system
allows creating error-free and build-ready RP data sets from various modelling sources and formats
within a consistent software environment. Their leading edge body healing technology is able to
handle and fix all kinds of incorrect model data. The powerful OpenGL-based visualisation
together with the easy-to-use and adaptable interface gives permanent and fast control of the Rapid
Prototyping data preparation process.
5.1.1.5 References
Castle Island Co, "What is Rapid Prototyping: A brief tutorial"
(http://home.att.net/~castleisland/rp_int.htm), The World Wide Guide to Rapid Prototyping
DRM Associates, "Rapid Prototyping Techniques" (http://www.npd-solutions.com/rp.html),
DRM Associates, 2002
Hartwig, G. "The Shape of Things to Come"
NPD Stage 5: Beta & Market Testing
98
(http://www.deskeng.com/articles/01/mar/cover/index.htm), Desktop Engineering Magazine,
March 2001
Hooker Manufacturing, "Rapid Prototyping"
(http://www.hookergroup.mcmail.com/rapid.htm), 2002
JJ Engineering Group, "Rapid Prototyping"
(http://www.jjengineering.co.uk/prototyping.htm), 2002
Lemley, B. "Future Tech: Behold the 3-D Fax"
(http://www.discover.com/feb_00/feat3dfax.html), Discover Magazine, Vol. 21, No. 2, Feb
2000
Morrison, G. "Rapid Harvest"
(http://www.memagazine.org/backissues/april99/features/harvest/harvest.html), Mechanical
Engineering Magazine, April 1999
Novak, A. "Rapid Prototyping Home Page"
(http://www.cc.utah.edu/~asn8200/rapid.html#COM), Dept of Mechanical Engineering,
University of Utah, 2002
Palm, W. "Rapid Prototyping Primer"
(http://www.me.psu.edu/lamancusa/rapidpro/index.htm), Penn State University Learning
Factory, July 1997
Smith, G. P. "The Business of Rapid Prototyping" (http://www.emerald-library.com), Rapid
Prototyping Journal, Volume 5, No 4, 1999 pp. 179-185
5.1.2 Product Development Testing
Product development testing is a testing process that starts at the front end of product
development and ends at the very end of it. It includes different types of tests that can be applied at
different levels of product development. These tests help the development team to fully understand
what exactly is going on and if whether things are on track. Also the different ways that data are
captured can sometimes reveal aspects of the development process that the tests on their own
cannot identify.
As mentioned product development testing consists of different tests that can be applied to different
levels of product development. These test are carried out to examine different objectives,
approaches and types of modelling. There are five main types of testing that can be described in
more detail and these are:
1. The Exploratory Tests
2. The Assessment Tests
3. The Validation Tests
4. The Comparison Tests
5. ISO 9000 Tests
In respect to the development process the timing of these different tests can be visualized using the
following figure.

NPD Stage 5: Beta & Market Testing
99
Source: Better Product Design, Institute of Manufacturing, University of Cambridge, On-line
http://www.betterproductdesign.net/tools/concept/testing.htm
5.1.2.1 Exploratory Tests
Exploratory tests are those that are carried out early in the development process during Levels 1
and 2. This is when the problem of NPD is still being defined and different solutions are being
considered. They usually take place after the team has a clear understanding of user profile or
customer needs. Their objective is to examine and to explore the preliminary design concepts and
answer some basic questions that include:
What to customers think about using the product concept?
Does the basic product functionality have value to the user or customer?
Is the product's user interface appropriate and easy to operate?
How does the user feel about the product concept?
Are the team's assumptions about the customer needs correct?
Has the team misunderstood any customer wants or needs?
This kind of early analysis of concepts and how are these fit into the user or customer profile or
specific wants and needs is very critical. It is the most critical one compared to all prototyping or
product evaluation analysis tests that can be performed later on. This due to the act that faulty
assumptions at this stage will most certainly be the root of a lot of problems further down the
development process.
Data collection at this point is usually qualitative and is based on observation, interview and
discussion with the target audience. The ideal scenario for this kind of tests is for the customer to
test the product concept without training or prompting so that he can assess freely all the controls
and instructions. Some metrics can be applied such as time to perform tasks or number of errors or
failures allowed.
Source: Better Product Design, Institute of Manufacturing, University of Cambridge, On-line
http://www.betterproductdesign.net/tools/concept/testing.htm

NPD Stage 5: Beta & Market Testing
100
5.1.2.2. Assessment Tests
Unlike to the exploratory tests that are designed to explore all potentially solutions for new product
development, the Assessment Tests are designed to look with more detail into the preferred single
solution. This is why they are usually performed at a later stage of development than the
exploratory ones.
The aim of the assessment tests is to ensure that all assumptions are relevant to the preferred
solution and that specific design choices are appropriate for that solution. These tests focus on
usability and functionality that is offered by the solution in hand. This in some cases can be
considered as an early new product evaluation. Assuming that the right product concept is chosen
the assessment tests tend to seek answers to questions like the following:
Is the product concept usable?
Does the product concept satisfy all user needs?
How does the user use the product and could it be more effective?
How will the product be assembled and tested and could this be achieved in a better way?
Can the user complete all the product tasks as intended?
Assessment tests require complex product modelling, analytical methods of testing, simulations and
working product replicas. The evaluation of the tests results can be informal using both internal and
external evaluation panels or teams. Data collection as in the case of the exploratory tests can be
qualitative and based on observation, interviews and discussions.
Source: Better Product Design, Institute of Manufacturing, University of Cambridge, On-line
http://www.betterproductdesign.net/tools/concept/testing.htm
5.1.2.3 Validation Tests
Validation tests are conducted at the late stages of new product development process and are
designed to examine that all design goals have been met. These kinds of tests may examine the
product's functionality, reliability, usability, performance, maintainability, assembly methods,
robustness and others. Validation tests examine the product as if it was just out of the production
line. So product activities should and are expected to be working in full.
A performed validation test is the first opportunity to examine product components altogether.
Single component testing can be performed at this point. During validation tests the product must
have its final form including packaging, documentation and labels. Included in the validation tests
are all formal test that are required for certification for safety or environmental purposes. Compared
to the assessment tests, validation ones focus on experimental rigor and consistency. Sometimes it
is preferable for the testing to be carried out by an external team and away from the original design
team.
Data collection is usually quantitative based on measures of performance. This is done by
benchmarking the new product against some kind of expected performance or pre-set standards.
Any failures on product performance must be noted and errors should be corrected before the
product reaches the manufacturing process.

NPD Stage 5: Beta & Market Testing
101
Source: Better Product Design, Institute of Manufacturing, University of Cambridge, On-line
http://www.betterproductdesign.net/tools/concept/testing.htm
5.1.2.4 Comparison Tests
A comparison test can be conducted at any point of the product development process. These tests
aim to compare companies, practices, concepts, products, or product elements against some
existing alternative. For example "Benchmarking", as it is offered by Urenio Research Unit, is a
comparison test that can be carried out at the beginning or the end of the process. The alternatives
against any of the above can be compared against could be either a existing solution or a
competitive one.
Comparison testing can include the examination of data from both product performance and
product preference. The tests are used to examine performance, to test superiority, or to understand
product advantages and disadvantages of different product designs.
Source: Better Product Design, Institute of Manufacturing, University of Cambridge, On-line
http://www.betterproductdesign.net/tools/concept/testing.htm
5.1.2.5. ISO 9000 Tests
ISO 9000 defines a series of test activities such as design review, design verification, design
validation, quality control, safety etc. Some of these activities are further discussed bellow.
Design review. A design review is a set of tests activities that aim to test the product design
against pre-determined quality requirements. During the tests it is imperative that all
problems must be identified and all the necessary action should be proposed to the design
team.
Design verification. Design verification tests are tests whose purpose is to examine product
design and development outputs and to use objective evidence to confirm that these outputs
meet the product design and development initial specifications.
Design validation. Design validation tests are tests that are performed to examine whether
the resulting product meets all user needs or wants.
Source: Better Product Design, Institute of Manufacturing, University of Cambridge, On-line
http://www.betterproductdesign.net/tools/concept/testing.htm
5.1.3 Market Research Issues
5.1.3.1 Market Targeting Strategy
Market targeting strategy sometimes is confused with marketing strategy since it can be a part of
it. It is a completely different thing. The marketing strategy is the creation of a market plan which is
described in Level 7 and which is used in product commercialization. Market target strategy is used
in market testing and it relates with the selection of the customers that will participate in the tests.

NPD Stage 5: Beta & Market Testing
102
Also sometimes market target strategy is used in the final selection of the market during product
concept development or marketing plan creation. In that case the same apply.
The targeting strategy must include the number of market segments to target, the number of product
to offer and a plan of which product to be offered where. There are three main steps of targeting:
the market segmentation, the target choice and the product positioning.
Target strategy is influenced by the market maturity, the diversity of customer needs and
preferences, the company's size, the strength of the competition and the volume of products
required for the tests.
5.1.3.1A Market segmentation
A very important issue related to market research and to market testing is market segmentation.
Market segmentation is the process of selecting a group or groups of consumers or customers
having similar characteristics for the market testing to be performed. Its purpose is to determine
specific segments of the market upon which to concentrate marketing efforts, research and testing,
to adopt a customer-oriented philosophy, to divide a large market into small sub-segments and to
develop a dominant position in a specialized market segments.
The most important requirements of market segmentation are three:
Market measurements: Identification and measurement of the characteristics and of the
size of the market segment.
Economic opportunity: The segment that is selected must have the income and the size so
that to make a specific product profitable.
Market access: The segment must be reachable i.e. must be easily handled, approached and
manipulated by marketing methods.
A market can be segmented using the following steps:
Step 1: A demographic profile must be created. For example a typical profile of a customer of a
specific market segment is given in the table bellow.
Market Segment Characteristics Consumer Profile
Age: 45-50
Income level: € 30.000 +
Education level: Post secondary education
Step 2: Identification of high concentrations of potential customers that fit the market segment
characteristics. Usually people with similar characteristics such as income level are located in
specific places. This information is very handy for the placement of products.
Step 3: Determination of consumer habits. How, where, when, and what potential consumers prefer
to buy should be identified and noted.
Assessment 1 evaluates the ideas generated in Level 1 and both the way and the tools used for idea
generation.

NPD Stage 5: Beta & Market Testing
103
According to the answers a user gives to the questions a GO, HOLD or KILL decision is provided
for further progression in the roadmap and specifically to Level 2.
Source: Better Product Design, Institute of Manufacturing, University of Cambridge, On-line
http://www.betterproductdesign.net/tools/market/segmentation.htm
5.2 Level Assessment
Assessment 5 evaluates the way a product prototype is build and how that prototype is tested in
respect to its functionality and market requirements as set in previous levels of the NPD Roadmap.
Also ways of testing the development process are looked into and the results of such tests are
evaluated.
Once again at the end of the assessment a Go, Kill or Hold recommendation is given to proceed
into Level 6 of the Roadmap.

NPD Stage 6: Technical Implementation
104
NPD Stage 6: Technical Implementation
As soon as all the market and beta testing of the new product prototype is concluded then the new
product must enter into the technical implementation Level. In this Level the product is
manufactured in large quantities so that it can be released into the selected market or market
segment. The problems one could face in this Level are manufacturing, production or
manufacturing management related. Tools and methods are provided in this Level to tackle some of
the most occurring problems.
6.1 Tools & Solutions
Issues that need to be looked at and solved in this Level are things to do with manufacturing and
the ways this can be done easily and effectively inside the cost and time limits set, and according to
the specifications that have been laid out during the previous levels of development.
Also this Level deals and gives some insight solutions with some major manufacturing issues such
as mass manufacturing, bill of materials management, quality assurance and value engineering and
major tools that can be a great help for engineers and production personnel are discussed. These
include CAD/CAM, Design for X, Industrial Design, Reengineering, Reverse Engineering and
others.
Solutions for specific industry related issues are not given since the Level contents are set to give
general directions in solving management problems that can arise in all industries and to provide
some insight of the situations that must be dealt in product production.
6.1.1 Design for X
The term "Design for Manufacture" was used in the past to describe a design approach that ensured
that a product is both manufacturable and simple to assemble. Nowadays the term "Design for X" is
used to include activities such as the design for manufacture that express product design using a
collection of tools, techniques and philosophies to link customer requirements and quality criteria
such as robustness, serviceability and others.
There are dozens of Design for X methodologies; tools and techniques, each of them have impact
on specific markets and for specific types of products. Some of the Design for X methodologies are
given bellow
Design for manufacture.
Design for assembly.
Design for disassembly.
Design for life cycle.
Design for ease of use.
Design for installation.
Design for maintenance.
Design for validation.

NPD Stage 6: Technical Implementation
105
Design for reliability.
Design for reuse.
Design for cost.
Design for the environment.
Design for quality.
Design for speed.
The most important of all the design approaches that are given above are the Design for
Manufacture and the Design for Assembly since they have direct and recognizable impact on
product costs.
Source: Better Product Design, Institute of Manufacturing, University of Cambridge, On-line
http://www.betterproductdesign.net/guide/design4X.htm
6.1.1.1 Design for Manufacture
Design for Manufacture (DfM) is more than a philosophy than a practice. It is a way of thinking,
which can be applied to any product component, product or product family tree. Its purpose is to
minimize the overall component count and to optimize the remaining components so that the
manufacturing costs to be reduced. For this to be accomplished the product design team must have
deep understanding of the things that contribute to the overall product cost and the relative trade-
offs between manufacturing processes, production volume and fixed and variable costs. The design
for manufacture is defined by three key elements: the process selection, the reduction of process
stages and the design of the process.
Process selection involves the selection of both material and methods for manufacturing the
individual product components and it is based on the following:
Performance criteria such as conductivity, strength, friction or thermal properties.
Tolerance specifications.
Component complexity requirements.
Set up and tooling costs.
Production volume.
Expertise required and capability.
The reduction of the manufacturing process stages can be achieved by eliminating the unnecessary
stages through a combination of alternative strategies. Such strategies can be the component
minimization (method that is used widely in the electronics industry), the elimination of finishing
processes (for components that may not be visible to the customer), the combining of
manufacturing processes and the single direction processing or machining (this helps to reduce set
up requirements).
The design of the process is defined by certain guidelines, which aim to ensure optimum design of
components to satisfy any constraints that govern the manufacturing process. These guidelines help
designers - engineers to avoid errors, recognize pitfalls and take advantage of benefits. Sometimes
they are identified as good practices for certain manufacturing processes. Many guidelines are
available for all, others are well kept company secrets. They can cover almost all industry segments

NPD Stage 6: Technical Implementation
106
but sometimes they can be difficult to use since one should expect the unexpected when it comes in
producing a new product.
Source: Better Product Design, Institute of Manufacturing, University of Cambridge, On-line
http://www.betterproductdesign.net/guide/design4X.htm
6.1.1.2 Design of Assembly
The Design of Assembly (DfA) can be considered as part of DfM since it also supports the
minimization of the total number of product components. In addition DfA focuses on the
optimisation of how product components can be moved, held, located and joint during the
manufacturing process.
Like DfM, there are certain guidelines that can be used for DfA. These guidelines are nothing more
than rules that govern part count, how wires and cables are set, how adjustments should be made,
how parts are inserted, and how components can be assembled in closed spaces. Like DfM, DfA
guidelines can also be difficult to implement since there are always unexpected issues that can
appear during the manufacturing - assembly process.
Systematic approaches can provide a unique environment for decision-making process for DfA.
These are many methods for someone to follow a systematic approach for DfA. The two best-
known ones are the one that was developed in the 70's by Boothroyd and Dewhurst, and the one
developed in the 80's by Lucas Engineering Systems. For the record a systematic approach for DfA
begins with an analysis of the assembly to determine if products components can be eliminated
based upon the following simple rules:
* Determine the relative movement between one part and another.
* Determine whether a material must be different from another.
* Determine whether a specific part needs to be altered or replaced.
The approach ends with mapping of the assembly sequence to determine matters such as the design
and setting up of the feeding for automated assembly, the setting up of the insertion order of
components and the setting up of fitting, securing and locating components.
Source: Better Product Design, Institute of Manufacturing, University of Cambridge, On-line
http://www.betterproductdesign.net/guide/design4X.htm
6.1.1.3 Design for Life Cycle
For many durable goods, there are a variety of other design considerations related to the total
product life cycle. For consumable products, some of these life cycle factors may be of lesser
importance. Life cycle factors that may need to be addressed during product design include:
Testability / Inspectability, Reliability / Availability, Maintainability / Serviceability, Design for the
Environment, Upgradeability, Installability, Safety and Product Liability and Human Factors.
The relative importance of these factors and their orientation will vary from industry to industry
and product to product. However, there are general design principles for these life cycle

NPD Stage 6: Technical Implementation
107
requirements that will be generally applicable to many items. A basic integrated product
development concept is the parallel design of support processes with the design of the product. This
parallel design requires early involvement and early consideration of life cycle factors (as
appropriate) in the design process. However, in many organizations, consideration or design of the
support processes is an after-thought and many of these developmental activities are started after
the design of the product is well under way if not essentially complete.
Source: Crow Kenneth, “Design for the Life Cycle”, DRM Associates, On-line http://www.npd-
solutions.com/lifecycle.html
6.1.1.3A Design for Testability / Inspectability
Test and inspection processes can consume a significant amount of effort and the development or
acquisition of test equipment can require considerable time and expense with some products. Early
involvement of the test engineering or quality assurance functions can lead to design choices that
can minimize the cost of developing or acquiring necessary equipment and the effort to test or
inspect the product at the various stages of production. A starting point is to establish a common
understanding between Engineering, their customers, and other functional departments regarding
the requirements for product qualification, product acceptance after manufacture, and product
diagnosis in the field. With this understanding, a design team can begin to effectively design
products and test and inspection processes in parallel.
Increasingly complex and sophisticated products require capabilities and features to facilitate test
and acceptance of products and diagnosis products if a defect is identified. Specific principles,
which need to be understood and applied in the design of products, are:
Use of Geometric Dimensioning and Tolerancing (GD&T) to provide unambiguous
representation of design intent.
Specification of product parameters and tolerances that are within the natural capabilities of
the manufacturing process (process capability index Cp and Cpk)
Provision of test points, access to test points and connections, and sufficient real estate to
support test points, connections, and built-in test capabilities
Standard connections and interfaces to facilitate use of standard test equipment and
connectors and to reduce effort to set-up and connect the product during testing.
Automated test equipment compatibility.
Built-in test and diagnosis capability to provide self-test and self-diagnosis in the factory
and in the field.
Physical and electrical partitioning to facilitate test and isolation of faults.
In addition, test engineering should be involved at an early stage to define test requirements and
design the test approach. This will lead to the design or specification of test equipment that better
optimizes test requirements, production volumes, equipment cost, equipment utilization, and testing
effort/cost. Higher production volumes and standardized test approaches can justify development,
acquisition, or use of automated test equipment. The design and acquisition of test equipment and
procedures can be done in parallel with the design of the product, which will reduce lead-time.
Design of products to use standardized equipment can further reduce the costs of test equipment
and reduce the lead-time to acquire, fabricate, and set-up test equipment for both qualification
testing and product acceptance testing.

NPD Stage 6: Technical Implementation
108
6.1.1.3B Design for Reliability
Reliability consideration has tended to be more of an after-thought in the development of many new
products. Many companies' reliability activities have been performed primarily to satisfy internal
procedures or customer requirements. Where reliability is actively considered in product design, it
tends to be done relatively late in the development process. Some companies focus their efforts on
developing reliability predictions when this effort instead could be better-utilized understanding
and mitigating failure modes. And so developing improved product reliability. Organizations will
go through repeated (and planned) design/build/test iterations to develop higher reliability products.
Overall, this focus is reactive in nature, and the time pressures to bring a product to market limit the
reliability improvements that might be made.
In an integrated product development environment, the orientation toward reliability must be
changed and a more proactive approach utilized. Reliability engineers need to be involved in
product design at an early point to identify reliability issues and concerns and begin assessing
reliability implications as the design concept emerges.
Use of computer-aided engineering (CAE) analysis and simulation tools at an early stage in the
design can improve product reliability more inexpensively and in a shorter time than building and
testing physical prototypes. Tools such as finite element analysis, fluid flow, thermal analysis,
integrated reliability prediction models, etc., are becoming more widely used, more user friendly
and less expensive. Design of Experiments techniques can provide a structured, proactive approach
to improving reliability and robustness as compared to unstructured, reactive design/build/test
approaches. Further, these techniques consider the effect of both product and process parameters on
the reliability of the product and address the effect of interactions between parameters. Finally, the
company should begin establishing a mechanism to accumulate and apply "lessons learned" from
the past related to reliability problems as well as other producibility and maintainability issues.
These lessons learned can be very useful in avoiding making the same mistakes twice.
Specific Design for Reliability guidelines include the following:
Design based on the expected range of the operating environment.
Design to minimize or balance stresses and thermal loads and/or reduce sensitivity to these
stresses or loads.
De-rate components for added margin.
Provide subsystem redundancy.
Use proven component parts & materials with well-characterized reliability.
Reduce parts count & interconnections (and their failure opportunities).
Improve process capabilities to deliver more reliable components and assemblies.
6.1.1.3C Design for Maintainability / Serviceability
Consideration of product maintainability/serviceability tends to be an after-thought in the design of
many products. Personnel responsible for maintenance and service need to be involved early to
share their concerns and requirements. The design of the support processes needs to be developed

NPD Stage 6: Technical Implementation
109
in parallel with the design of the product. This can lead to lower overall life cycle costs and a
product design that is optimized to its support processes.
When designing for maintainability/serviceability, there needs to be consideration of the trade-offs
involved. In high reliability and low cost products or with consumable products, designing for
maintainability/serviceability is not important. In the case of a durable good with a long life cycle
or a product with parts subject to wear, maintainability/serviceability may be more important than
initial product acquisition cost, and the product must be designed for easy maintenance. In these
situations, basic design rules need to be considered such as:
Identify modules subject to wear or greater probability of replacement. Design these
modules, assemblies or parts so that they can be easily accessed, removed and replaced.
Use quick fastening and unfastening mechanisms for service items.
Use common hand tools and a minimum number of hand tools for disassembly and re-
assembly.
Minimize serviceable items by placing the most likely items to fail, wear-out or need
replacement in a small number of modules or assemblies. Design so that they require simple
procedures to replace.
Use built-in self-test and indicators to quickly isolate faults and problems.
Eliminate or reduce the need for adjustment.
Use common, standard replacement parts.
Mistake-proof fasteners so that only the correct fastener can be used in re-assembly.
Mistake-proof electrical connectors by using unique connectors to avoid connectors being
mis-connected.
In addition, service and support policies and procedures need to be developed, service training
developed and conducted, maintenance manuals written, and spare parts levels established. As
these tasks are done in parallel with the design of the product, it reduces the time to market and will
result in a more satisfied customer when inevitable problems arise with the first delivery of a new
product.
Source: DRM Associates (http://www.npd-solutions.com/lifecycle.html)
6.1.1.4. Design for the Environment
There are three major elements of design for the environment: design for environmental
manufacturing, design for environmental packaging, and design for disposal and recycle ability.
Design for environmental manufacturing involves the following considerations:
Non-toxic processes & production materials.
Minimum energy utilization.
Minimize emissions.
Minimize waste, scrap & by-products.
Design for environmental packaging involves the following considerations:
Minimum of packaging materials.

NPD Stage 6: Technical Implementation
110
Reusable pallets, totes and packaging.
Recyclable packaging materials.
Bio-degradable packaging materials.
Design for disposal & recycle ability involves the following considerations:
Re-use / refurbishment of components & assemblies.
Material selection to enable re-use (e.g., thermo set plastics vs. thermoplastics) and
minimize toxicity.
Avoids filler material in plastics such as fibreglass and graphite.
Minimum number of materials / colors to facilitate separating materials and re-use.
Material identification to facilitate re-use.
Design to enable materials to be easily separated.
Design for disassembly (e.g., fracture points, fastening vs. bonding).
Avoid use of adhesives.
Limit contaminants - additives, coatings, metal plating of plastics, etc.
Maximize use of recycled or ground material with virgin material.
Design for serviceability to minimize disposal of non-working products
To support design for recycle ability, design for dis-assembly needs to be addressed. Design for
disassembly enhances maintainability or serviceability of a product, and it enables recycling of
materials, component parts, assemblies, and modules. There are a number of principles to facilitate
disassembly:
Provide ready access to parts, fasteners, etc. to support disassembly.
Design modular products to enable modules to be disassembled for service or re-use.
Minimize weight of individual parts and modules to facilitate disassembly
Use joining and fastening techniques to facilitate disassembly (e.g., fasteners instead of
adhesives)
Minimize fragile parts and leads to enable re-use and re-assembly.
Use connectors instead of hard-wired connections.
Design to enable use of common hand tools for disassembly.
Source: DRM Associates (http://www.npd-solutions.com/dfe.html)
6.1.1.5 References
"Design for Manufacturability Handbook", Bralla.
"Design for X" (http://www.betterproductdesign.net), Good Design Practice Program,
Institute for Manufacturing & Engineering Design Center, University of Cambridge, UK,
2004
Buxter M, "Product Design: Practical Methods for the Systematic Development of New
Products", Stanley Thormes, UK, 1999.
Crow K.A. "Design for the Environments" (http://www.npd-solutions.com/dfe.html), DRM
Associates, 2002
Crow K.A. "Design for the Life Cycle"
(http://www.npd-solutions.com/lifecycle.html), DRM Associates, 2002

NPD Stage 6: Technical Implementation
111
6.1.2 Industrial Design
“When someone chooses to buy a product, he takes for granted that the product will
perform the function or functions it is intended for. The customer is usually attracted by the
products appearance, specification and price. But he is also attracted by less obvious
product characteristics, such as sound, smell and feel. These subjective characteristics of a
product make the product a joy to use since they satisfy customer senses and so form a bond
between the customer and the product beyond rational purchasing criteria. By paying more
attention to these characteristics, manufacturers stand to benefit.
The work of Industrial Design has shown the importance of the quality of user experience
when interacting with product. For example, the balance of a wine glass or the action of a
hinge is qualities, which are often taken for granted until they are found to be lacking. A
company should consider these issues when designing from the users perspective.
The aim to develop guidelines to ensure that the subjective characteristics mentioned above,
is for industrial design to become a recognised part of the design cycle in the same way that
sophisticated procedures are used by some manufacturers to evaluate and refine the visual
aesthetics.
Whilst some quite ordinary products already possess many of these sensory attributes, it
would appear that manufacturing industry does not sufficiently recognize and prioritize
them. Even in more expensive consumer goods they are often missed.”
Author: Bailey Mark, ", The Center for Industrial Design, NorthCumbria University, UK
Source: Bailey Mark, "Sense Matter", The Center for Industrial Design, NorthCumbria University,
On-line: http://www.cfid.co.uk/portfolio/research/pdf/senses_matter.pdf
6.1.2.1 Industrial Design Management
Industrial Design as any of the design methods and processes available for NPD needs to be well
planed and managed. Also the need to locate and select the proper designer for a specific job is
crucial. Before embarking into a industrial design project one should give a little bit of thought to
the need of working with an industrial designer, the gains or potential benefits for such a
partnership and the ways to plan such an engagement.
To pinpoint the value of such engagement one should consider the following.
What are the customer requirements?
What elements of the design are crucial to the success of the product?
What skills are available and what do we need?
What are the financial benefits?
How do we compare to our competition?
To identify the type of industrial design involvement one should consider the following.

NPD Stage 6: Technical Implementation
112
How important are human factors or ser interface issues in the new product?
How important is creativity and innovation?
Is the work primarily styling?
Lastly to plan the engagement one should consider the following.
What is the scope of the project?
What form an initial brief on the engagement should have?
When all the above are answered i.e. the need for industrial design is established, the type of design
involvement is identified, and the relationship is planed, then the selection criteria should be set.
Their identification is crucial since they will be used later to evaluate the pros and cons of different
possible suppliers. These criteria can differ from company to company and can include elements
such as price, location, specific skills, IT and communication, track record and personality.
Often designers are selected based on word of mouth or previous experience. It can be very difficult
to locate the right person with the right skills. Alternative approaches include location using design
directories, web links, and local business links. If all fail one should seek out examples of products
that one likes and contact the manufacturer to identify the industrial designer(s) involved.
As a rule one must select 5 suppliers and contact 3 of them asking them to respond to a short brief
prepared with the involvement of all team members. All the members must agree on the form and
contents of the brief. An effective brief must have the following.
Exactly what is required from the industrial designer: all usability issues, potential form and
feel and technical and quality aspects.
All the critical constraints such as timescales, budget, resources, manufacturing process,
scope of project and specific technical requirements.
Some company information such as background, market information, user requirements (if
any) and expected sales volume.
Depending on the responses the right supplier with the skills needed is selected.
The relationship between engineers and industrial designers becomes increasingly important. It is
vital that all concepts are supported and are feasible and producible. Managing such relationship
requires a joint appreciation of the following issues.
Knowing who is responsible to deliver which aspects and when.
Breaking the project into discrete phases.
Having an agreed approach regarding management changes during the process.
Identifying the system architect.
Partitioning each task base on a understanding of interfaces between components.
Identifying the commercial, technical and market risks.
Ensuring IT compatibility and effective data transfer.
Identifying the modes of informal and formal communication between members.

NPD Stage 6: Technical Implementation
113
6.1.2.2 Industrial Design Activity Map
For someone to perform industrial design needs some kind of methodology and actions plan that
will guide him through the whole process. Such a guide is the design map that follows. The map is
basically a series of actions that one should take to be able successfully perform industrial design.
The main actions are four and each of them is split up depending if they are internal or external.
Each of the internal or external actions is made up by smaller activities that are described bellow.
Figure 1: Diagram of the Design Map
Industrial Design Actions
Analysis Conceptual Design Proposals Detailing and Specifications
Table 1. Activities of Industrial Design Actions (Some activities are the same in different actions
and may be repeated internally or externally depending on the action)
Activities
Actions
Analysis Conceptual
design
Proposals Detailing &
Specification
Internal
Sketch & Draw Sketch & Draw Sketch Model Sketch & Draw
Sketch Model 2D Technical
Drawing
3D Digital
Model
(Constrained)
Sketch Model
Prototype 3D Digital
Model
(Constrained)
3D Digital
Model
(Unconstrained)
2D Technical
Drawing
3D Digital
Model
(Unconstrained)
Prototype
External
Sketch & Draw 2D Technical
Drawing
Sketch & Draw Sketch Model
2D Technical
Drawing
3D Digital
Model
(Constrained)
Sketch Model 2D Technical
Drawing
3D Technical
Drawing
3D Digital
Model
(Unconstrained)
2D Technical
Drawing
3D Digital
Model
(Constrained)
3D Digital
Model
(Constrained)
Prototype Presentation 3D Digital
Model
(Unconstrained)
3D Digital
Model
(Unconstrained)
Appearance
Model
Prototype
Prototype Prototype

NPD Stage 6: Technical Implementation
114
6.1.2.2A Sketch & Draw
This activity is used to explore design issues. The activity by itself must be exploratory, quick and
descriptive. Sketches are used to explore issues raised by the brief. Sketches may be used to
establish in very approximate terms an outline of the issues posed by the brief, they enable us to
'shape' the problem and to understand it. Sketches are quick and loose and help to externalise
thoughts. They can be used to communicate and think through ideas with oneself or with others in a
team. They are often used in conjunction with words, written or spoken. They often serve as
illustrations to early conversations or thinking processes and although potentially may not mean
much to a 3rd party, often serve as markers for ideas, which can be returned to later.
Figure 1: Examples of sketch & draw activity results.
Source: "Sketch & Draw", The Center for Industrial Design, NorthCumbria University, On-line:
http://www.cfid.com/portfolio/research/Nina/HTML-files/media-types/analysis-internal-sketch &
draw.htm
In the examples shown above sketches were used at a very early stage to establish the extent of the
problem posed by the brief and to brainstorm some potential solutions to give confidence that the
problem could be solved. In this case study this was done prior to the project proposal being
written.
Source: The Center for Industrial Design, Northcumbria University, On-line Source: "Sketch &
Draw", The Center for Industrial Design, NorthCumbria University, On-line:
http://www.cfid.com/portfolio/research/Nina/HTML-files/media-types/analysis-internal-sketch &
draw.htm
6.1.2.2B Sketch Models
Sketch models are used to explore scale, volume, proportion and spatial issues. Sketch models must
be informative, exploratory and may take many forms: foam models, rough test rigs etc. In the
analysis action they might be used to establish & test configuration options, explore volume and
spatial issues. They are exploratory and as such they should always be moving in parallel with the
thinking process, and therefore need to be relatively quick to create. Sketch models can be seen as a
form of '3D sketching'. As with sketches they can assist personal thinking or be used as part of a
team process. Early configurations and volume studies can also be carried out within a 3D
modelling system which might be more accurate but has the disadvantage in that it cannot be

NPD Stage 6: Technical Implementation
115
touched, held or walked round. Sketch models are often not to scale and are often made in
materials, which bear no resemblance to the final product.
Figure 1: Example of a sketch full-scale model.
Source: The Center for Industrial Design, Northcumbria University, On-line Source: "Sketch
Models", The Center for Industrial Design, NorthCumbria University, On-line:
http://www.cfid.com/portfolio/research/Nina/HTML-files/media-types/analysis-internal-sketch
models.htm
6.1.2.2C 2D Technical Drawing
These drawings are used to discuss manufacturing details and issues. They must be detailed,
accurate, and informative and can be duplicated. Technical drawings, both hand drawn or digital
are an extremely useful means of communicating to third parties when researching issues such as
feasibility & cost. They can be used to describe a potential design in a way that can be understood
by suppliers and can provide enough detail & information to enable them to make some form of
considered feedback.
They are often used to obtain a range of castings, from ballpark to final. However, all 2D technical
drawings suffer the same drawbacks, they are an impression of a 3D shape, and for their creation
require a significant amount of skill in order to represent the 3D shape correctly. Further, they
require interpretation by the person reading the drawing in order that the 3D shape can be. Earlier
in the process this may not constitute a major problem, but if one is relying on a 2D specification
for manufacture, then the success of the end result depends heavily on the skill of both the creator
and the interpreter of the information. Although suffering the same drawbacks, digitally created 2D
technical drawings (2D CAD) are much more flexible and useful than their hand drawn cousins.
They can be edited and modified at will and can be printed as many times as needed. For the best
possible accuracy they can also incorporate 2D snapshots of 3D data, enabling the addition of
dimensions or notes, which can assist in the evaluation of the design or in the manufacturing
process.
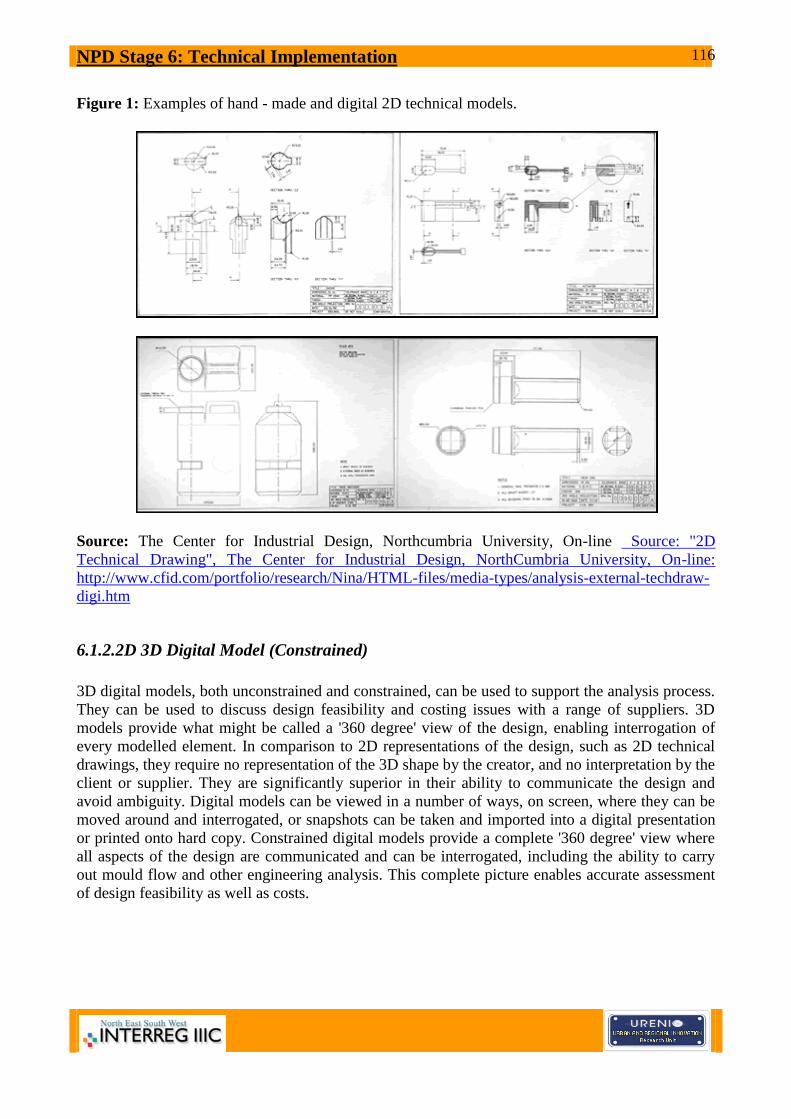
NPD Stage 6: Technical Implementation
116
Figure 1: Examples of hand - made and digital 2D technical models.
Source: The Center for Industrial Design, Northcumbria University, On-line Source: "2D
Technical Drawing", The Center for Industrial Design, NorthCumbria University, On-line:
http://www.cfid.com/portfolio/research/Nina/HTML-files/media-types/analysis-external-techdraw-
digi.htm
6.1.2.2D 3D Digital Model (Constrained)
3D digital models, both unconstrained and constrained, can be used to support the analysis process.
They can be used to discuss design feasibility and costing issues with a range of suppliers. 3D
models provide what might be called a '360 degree' view of the design, enabling interrogation of
every modelled element. In comparison to 2D representations of the design, such as 2D technical
drawings, they require no representation of the 3D shape by the creator, and no interpretation by the
client or supplier. They are significantly superior in their ability to communicate the design and
avoid ambiguity. Digital models can be viewed in a number of ways, on screen, where they can be
moved around and interrogated, or snapshots can be taken and imported into a digital presentation
or printed onto hard copy. Constrained digital models provide a complete '360 degree' view where
all aspects of the design are communicated and can be interrogated, including the ability to carry
out mould flow and other engineering analysis. This complete picture enables accurate assessment
of design feasibility as well as costs.

NPD Stage 6: Technical Implementation
117
Figure 1: 3D digital models example
Source: "3D Digital Model", The Center for Industrial Design, NorthCumbria University, On-line:
http://www.cfid.com/portfolio/research/Nina/HTML-files/media-types/analysis-
external_s_digimodel.htm
Constrained models can be used to support the detailing and specification process. It is during this
stage of the process that they are at their most useful. Constrained models are ideal for this action in
that they have access to dimensioning, draft and FEA tools. Further, constrained models have direct
access to 2D drawing output, what is known here as a 3D technical drawing. Constrained 3D digital
models can be used to fully define the design and detailing of all aspects of the product, including
internal and external detailing. By the time this action is undertaken the designer should have a very
good idea as to the general configuration and form language of the design, it is therefore ideal that
3D should be employed at this stage to create the model, which will be used to define all aspects of
the design.
Figure 2: Constrained 3D digital models example

NPD Stage 6: Technical Implementation
118
Source: "3D Digital Model", The Center for Industrial Design, NorthCumbria University, On-line:
http://www.cfid.com/portfolio/research/Nina/HTML-files/media-types/analysis-
external_s_digimodel.htm
6.1.2.2E 3D Digital Model (Unconstrained)
3D unconstrained digital models can be used to support the analysis process. They can be used to
discuss design feasibility and costing issues with a range of suppliers. 3D models provide what
might be called a '360 degree' view of the design, enabling interrogation of every modelled
element. In comparison to 2D representations of the design, such as 2D technical drawings, they
require no representation of the 3D shape by the creator, and no interpretation by the client or
supplier. They are significantly superior in their ability to communicate the design and avoid
ambiguity. Digital models can be viewed in a number of ways, on screen, where they can be moved
around and interrogated, or snapshots can be taken and imported into a digital presentation or
printed onto hard copy. Unconstrained 3D digital models provide this '360 degree' view but cannot
be interrogated to the same extent as a constrained model and therefore provide more in the way of
visual information than hard data. By their very nature unconstrained models are not modelled to
hard specifications and are therefore not as accurate as their constrained cousins. Unconstrained
models can also be used to support the creation of rapid prototypes although often-additional work
has to be done to the model to make it suitable.
They can also be used to support the conceptual design process. They are used much in the same
way as a physical 3D sketch model to provide the feedback necessary in order to progress the
design. Compared to a sketch model they are significantly superior in their ability to communicate
the design and avoid ambiguity. Unconstrained models are more likely to be used earlier in the
process due to their more 'sketchy' nature, 3D form, which may be difficult to visualise in sketches
or foam, can be created digitally providing a high level of feedback. The drawbacks are that digital
models take longer to create than a sketch or a sketch model, using a digital model too early in the
process may cause the designer to 'lock in' the design too early, perhaps being reluctant to change
the model radically once it has been created. Further, it has been found that problems can arise if
designers attempt to 'design' on CAD, digital modelling tools are such that progress is much better
if the designer knows, even approximately, what the design will be like before he/she sits down in
front of the screen. This is less so with unconstrained models, which have the opportunity to be
'pushed and pulled' into shape, however it is still advisable to have an approximate idea of the
design before sitting down at a blank screen.
Figure 1: Unconstrained 3D digital model example

NPD Stage 6: Technical Implementation
119
Source: "3D Digital Model (Unconstrained)", The Center for Industrial Design, NorthCumbria
University, On-line: http://www.cfid.com/portfolio/research/Nina/HTML-files/media-
types/analysis-internal_ns_digimodel.htm
6.1.2.2F Appearance Model
Appearance models might be created in order to present the concept to third parties outside the
immediate client/supplier sphere. Such models might be used in market research, or as part of a
company review process. The response to them may shape project funding or continuation
decisions. Appearance model are just that however, unlike prototypes, they would not have any
'working' aspects; they would merely be 3D 'pictures' of the proposed design. Despite having little
or no functionality, appearance models would look like real things and are therefore able to inspire
strong emotional reactions in viewers.
Figure 1: Example of appearance models
Source: "3D Digital Model", The Center for Industrial Design, NorthCumbria University, On-line:
http://www.cfid.com/portfolio/research/Nina/HTML-files/media-types/proposal-ex-
external_app_model_trad.htm
Digital appearance models differ from non-digital in that the main shape for the model is created
directly from data provided by the 3D digital model. The digital model provides data to drive
machinery such as a CNC milling machine. Non-digital models can be created in number of ways,
perhaps via the supply of 2D technical drawings, supported by a 3D sketch model. The key
difference is that the digitally driven model is accurate to the 3D digital model, whereas the non-
digital model requires interpretation by the model maker of the information provided.
Source: "3D Digital Model", The Center for Industrial Design, NorthCumbria University, On-line:
http://www.cfid.com/portfolio/research/Nina/HTML-files/media-types/proposal-ex-
external_app_model_trad.htm

NPD Stage 6: Technical Implementation
120
6.1.2.2G Computer Visualisation
The pre-existence of 3D digital models supports the creation of computer visualisations and/or
animations to support presentation of the concept outside of the immediate external client/supplier
audience. These more glamorous representations of the proposed design might be used for market
research, or perhaps to communicate the design to client peers or affiliates in order to maintain
confidence or just to communicate as part of a company wide project review process. Such forms of
communication are glamorous and can be informative and exciting, but are more of a surface view
of the product. They let the viewer see what the presenter wants them to see. Animations in
particular are highly time consuming and should not be undertaken lightly.
Figure 1: Example of a computer visualisation model
Source: The Center for Industrial Design, Northcumbria University, On-line Source: "Computer
Visualisation", The Center for Industrial Design, NorthCumbria University, On-line:
http://www.cfid.com/portfolio/research/Nina/HTML-files/media-types/proposal-ex-
external_comp_vis.htm
6.1.2.2H Presentation - Illustration
Presentation illustrations, created digitally or non-digitally, can be used to support design
presentations. The Non Digital versions are a development of sketch & draw and are a richer
method of communicating design intent. In some instances they try to suggest what the design
might look like once made, this is usually done via a process of rendering, using tools such as
markers or coloured pencils. They help add life to a design concept, giving it an extra dimension,
perhaps an element of 3D-ness. They are less coherent than a 3D representation; this may be
appropriate in some situations where only a gut reaction to a range of ideas is required. Often, if
less detail is available, viewers find it easier to focus on the idea as a whole, rather than on the way
the design looks. Although they might be seen to hold less value than a 3D representation of a
design, they are much quicker to create potentially allowing the creation of a much larger range of

NPD Stage 6: Technical Implementation
121
concepts. They can be used to make the product look very glamorous, and it is easy to hide the fact
that design issues have not been resolved behind this glamour.
Figure 1: Example of model presentation
Source: The Center for Industrial Design, Northcumbria University, On-line Source: "Presentation
- Illustration", The Center for Industrial Design, NorthCumbria University, On-line:
http://www.cfid.com/portfolio/research/Nina/HTML-files/media-types/proposal-
external_presillus_trad.htm
6.1.2.2I Prototype
Prototypes can be used to develop the design detailing and specification either as a personal
experimentation process or as part of a team. Hand built prototypes invite continual modification
until the design is acceptable. At this stage realistic materials should be used to reduce inaccuracies
as much as possible. Prototypes can be used to completely simulate the finished product,
incorporating working components etc.
Figure 1: Example of prototypes
Source: "Prototype", The Center for Industrial Design, NorthCumbria University, On-line:
http://www.cfid.com/portfolio/research/Nina/HTML-files/media-types/proposal-
external_prot_trad.htm
A prototype might exist as a support to the final specification, illustrating it and showing how the
product should look and function. A digital prototype could illustrate form, fit & assembly issues as
well as issues such as mechanistic behaviour. A digital prototype requires the pre-existence of a
digital model.

NPD Stage 6: Technical Implementation
122
Figure 2: Example of a digital prototype
Source: "Prototype", The Center for Industrial Design, NorthCumbria University, On-line:
http://www.cfid.com/portfolio/research/Nina/HTML-files/media-types/proposal-
external_prot_trad.htm
6.1.2.3 Consultants - Experts
Industrial Design & Construction (IDC) (http://www.idc-ch2m.com)
Industrial design and construction company based in the US, which supplies and facilitates
planning, designing and construction of products for process intensive technology industries.
Institute of Design of Ume University (http://www.dh.umu.se)
Institute of Design of Ume University was founded in 1989 and it is organized solely for the
purpose of teaching industrial design. The institute is collaborating with the EU through the Mal1
Norra Norland Program.
Sowden Design (http://www.sowdendesign.com/english/index.cfm)
Sowden Design is a company that designs and constructs computer peripherals and other
electronics using 3D computer models, which are used for prototyping.
Center for Industrial Design (http://www.cfid.co.uk/)
The Center for Industrial Design is a research led design consultancy, which functions as a
commercial enterprise within the University of Nothcumbria at Newcastle, UK.
Transform Design (http://www.transformdesign.com)
Transform Design is an industrial design firm servicing both industry and consumer oriented
manufacturers since 1991. Transform Design services include all phases of bringing a product
to a market, from analysis to manufacturing.
Teams Design (http://www.teamsdesign.com)
Teams Design in an international industrial design consultant, which provides complete product
design and development services.
Creative Design (http://www.creative-design.co.uk)
Creative Design is an award winning product design consultant based in the UK.

NPD Stage 6: Technical Implementation
123
6.1.2.4 References
Cooper R, "The Design Agenda: A Guide to Successful Design Management", John Wiley
& Sons, UK, 1995
Kelley T, "The Art of Innovation", Harper Collins Business, London, 2001
Thackara J, "Winners: How Today's Successful Companies Innovate by Design", Gower
Publishing UK, 1997
Ulrich & Eppinger, "Product Design and Development", McGraw Hill, USA, 2000
Walsh, Roy, Bruce & Potter, "Winning by Design", Blackwell Business, UK, 1992
6.1.3 Lean Manufacturing
Lean manufacturing is a business tactic whose aim is to reduce waste in manufactured products and
can be applied during the manufacturing process. Most product costs are assigned when a product
is first designed. It is typical for engineers to assign or specify materials and manufacturing
processes that are reliable but in most cases expensive. This tactic reduces the reliability risk but
increases the manufacturing costs of a product. Instead of doing a lot of companies have adopted
some kind of checklists that are designed to review product designs and cut manufacturing costs.
Techniques have been developed for all levels of product design namely system engineering,
mechanical engineering, electrical engineering and software engineering. Also tactics such as the
"Just In Time" technique are applied to reduce waste of the form of unused inventory of product
components.
Source: This article is licensed under the GNU Free Documentation License, On-line
http://www.gnu.org/copyleft/fdl.html. It uses material from
http://en.wikipedia.org/wiki/Lean_manufacturing. For more information please see:
http://en.wikipedia.org/wiki/Wikipedia:Copyrights
6.1.3.1 Electrical Engineering Level
At the electrical engineering level, lean manufacturing is the process of identifying the product
components or processes that add cost and replace them or completely eliminate them. Usually
what happens is that expensive mechanical processes are replaced with cheap electrical or software
ones and expensive electrical or electronic components eliminated or replaced with cheaper ones.
An important factor in electronic and electrical engineering is the way tolerances are treated.
Usually components have different tolerances and the small tolerances are found in expensive
components. So a solution based on lean manufacturing is to replace these components with other
ones of larger tolerances but in the same case the product functionality remain the same or close to
the one achieved with the small tolerance components.
Another lean manufacturing solution that can be applied to the electrical engineering level is the
integration of mechanical and electrical parts in such a way to reduce count of cables, connectors
and other electro-mechanical material.
NPD Stage 6: Technical Implementation
124
Source: This article is licensed under the GNU Free Documentation License, On-line
http://www.gnu.org/copyleft/fdl.html. It uses material from
http://en.wikipedia.org/wiki/Lean_manufacturing
For more information please see: http://en.wikipedia.org/wiki/Wikipedia:Copyrights
6.1.3.2 Mechanical Engineering Level
In the case of the mechanical engineering level, lean manufacturing is the process of reviewing the
materials and processes to be used in product manufacturing. A review team made of an
accountant, a product design engineer and a manufacturing engineer, should identify the materials
and processes that add costs into manufacturing and try to eliminate or reduce them. For example
the use of die casts or moulds instead of machining in the case of metal part production is a cost
cutting solution.
The tooling costs and any production machinery costs are also estimated and alternative solutions
should be identified by the review team. For example the reuse of machinery for completing
different tasks can be a cost cutting solution.
In many cases it is crucial to identify materials that require less time to form or less time to be
machined due to their characteristic properties. Again the review team should identify such
possibilities.
Source: This article is licensed under the GNU Free Documentation License, On-line
http://www.gnu.org/copyleft/fdl.html. It uses material from
http://en.wikipedia.org/wiki/Lean_manufacturing
For more information please see: http://en.wikipedia.org/wiki/Wikipedia:Copyrights
6.1.3.3 System Engineering Level
At the system engineering level, product requirements must be reviewed with marketing and
customer representatives to eliminate or reduce costly product requirements. Product requirements
are assigned to the cheapest discipline. For example product adjustments and measurements may be
moved to software rather than a electrical or mechanical solution that may be more expensive.
Source: This article is licensed under the GNU Free Documentation License, On-line
http://www.gnu.org/copyleft/fdl.html. It uses material from
http://en.wikipedia.org/wiki/Lean_manufacturing
For more information please see: http://en.wikipedia.org/wiki/Wikipedia:Copyrights
6.1.3.4 Just In Time (JIT)
The Just In Time (JIT) technique is a lean manufacturing tactic designed to reduce manufacturing
costs by reducing and eventually eliminating the product parts or components in a company
inventory. The idea behind the technique is to have enough product parts or components in
NPD Stage 6: Technical Implementation
125
inventory (in a warehouse) to achieve production of a specific number of product units. Usually this
specific number being the number of ordered units by the customers.
This tactic or technique which, was first tried and developed by Toyota Motor Corporation, has the
advantage of cutting costs by reducing or eliminating the stocked pilled unsold products or product
parts. But in the same time has the risk of stopping or even slowing down the production line in the
case of a bad or faulty part since there are usually no replacement parts as the product parts or
components are just the ones required to have a certain number of product units. Also ones of the
tactics main characteristics is the one of been able to plan an exact production timetable based on
the available product orders and save money on labor.
Source: This article is licensed under the GNU Free Documentation License, On-line
http://www.gnu.org/copyleft/fdl.html. It uses material from
http://en.wikipedia.org/wiki/Just_In_Time.
For more information please see: http://en.wikipedia.org/wiki/Wikipedia:Copyrights
6.1.4 CAD/CAM
Computer Aided Design-CAD is defined the use of information technology (IT) in the Design
process. A CAD system consists of IT hardware (H/W), specialized software (S/W) (depending on
the particular area of application) and peripherals, which in certain applications are quite
specialized. The core of a CAD system is the S/W, which makes use of graphics for product
representation; databases for storing the product model and drives the peripherals for product
presentation. Its use does not change the nature of the design process but as the name states it aids
the product designer. The designer is the main actor in the process, in all phases from problem
identification to the implementation phase. The role of the CAD is in aiding him/her by providing:
Accurately generated and easily modifiable graphical representation of the product. The
user can nearly view the actual product on screen, make any modifications to it, and present
his/her ideas on screen without any prototype, especially during the early stages of the
design process.
Perform complex design analysis in short time. Implementing Finite Elements Analysis
methods the user can perform: Static, Dynamic and Natural Frequency analysis, Heat
transfer analysis, Plastic analysis, Fluid flow analysis, Motion analysis, Tolerance analysis
and Design optimization.
Record and recall information with consistency and speed. In particular the use of Product
Data Management (PDM) systems can store the whole design and processing history of a
certain product, for future reuse and upgrade.
The technique initiated in the MIT from Ian Sutherland, when the first system the Sketchpad was
created within the SAGE (Semi-Automatic Ground Environment) research project. The automotive
and aerospace industries were the first users and the forerunners of development of CAD
technology.
The first system was very expensive, the computer graphics technology was not so advanced at that
time and using the system required specialized H/W and S/W, which was provided mainly by the
CAD vendors. The first CAD systems were mainframe computer supported systems, while today
the technology is for networked but stand alone operating workstations (UNIX or WINDOWS

NPD Stage 6: Technical Implementation
126
based systems). AUTODESK was the first vendor to offer a PC based CAD system the AUTOCAD
(beginning of 1980). Today WINDOWS is the main operating system for CAD systems.
The first applications were for 2D Drafting and the systems were also capable of performing only
2D modelling. Even today 2D-drafting is still the main area of application (in terms of number of
workplaces). Later, (mid-1980), following the progress in 3D modelling technology and the growth
in the IT H/W, 3D modelling systems are becoming very popular. 3D modelling was at the
beginning wire frame based. Aerospace and automotive industries were using surface modelling
systems for exact representation of the body of the product. At the same time solid modelling was
recognized as the only system, which could provide an unambiguous representation of the product,
but it was lacking adequate support for complex part representations.
Today we are experiencing a merge of solid and surface modelling technology. Most solid
modelling systems are capable of modelling most of industrial products. Systems sold today
(especially for mechanical applications, which are the majority of systems sold world-wide) are
characterized as NURBS (Non Uniform Rational B-Sline) based systems, employing solid
modelling technology, and they are parametric and feature based systems.
The use of CAD systems has also been expanded to all industrial sectors, such AEC, Electronics,
Textiles, Packaging, Clothing, Leather and Shoe, etc. Today, numerous CAD systems are offered
by several vendors, in various countries.
Source: Computer Aided Design - CAD, by Dr N. Bilalis, Technical University of Crete, On-line
at http://www.urenio.org under the heading Innovation Reports.
6.1.4.1 References
* Bilalis N. "Computer Aided Design - CAD" (http://www.urenio.org/rsi.htm), Urenio, Technical
University of Crete
6.1.5 Re-engineering
Product development practices can create many opportunities to reengineer and improve the
process as a whole and reduce development time. Whether a product is developed in an R&D
environment or not, it is very easy to improve the development process by perceiving problems,
brainstorming opportunities, analyzing and redesigning.
To reengineer the development process one needs to fully understand the development process
itself since the development of a new product can redefine a company's development process. Also
benchmarking of the process can identify any changes and pinpoint improvement opportunities.
Brainstorming can be also used to look for new improvement opportunities. In either case,
knowledgeable personnel, to the appropriate level of management, must present all opportunities.
To be effective, any action that results to the improvement of the way that people work and
subsequently the way business is done, leads to better processes and practices. In reengineering
these actions must at all times lead to evolutionary change, which can stimulate morale and

NPD Stage 6: Technical Implementation
127
imagination (hence innovation) and can create the opportunities for the appearance of creative ways
for dealing with adversary and competitive challenges.
In many cases as companies fight competition and severe economic situation; they tend to find
solutions in extreme actions such as downsizing. This is a very good short-term solution but a very
poor long term one. By reengineering the business processes of a company, especially its product
development practices, the company can benefit a great deal in the long term. Reengineering can
mobilize employee commitment and imaginative cooperation and hence its product innovative
development ability and not only that.
6.1.5.1 Case Studies - Examples
A hypothetical government agency charges $10 per employee paycheck issued due to layers upon
layers of bureaucracy. By comparison a private sector commercial services agency with the same
number of employees charges only $1,5. The government agency management decided to bring the
$10 figure down to the one of the private sector agency by reengineering its payroll processes. To
accomplish this, management asked all employees to write down workflow diagrams that showed
who does what, how and when. When these diagrams were entered into a computer for data
analysis, it became apparent that the charges were that high because the paycheck had to go through
typically, the controller, then the personnel department, then the regional processing center and
then the auditors.
Next the management made out a diagram showing how much money would have been saved if say
the controller or the regional processing center or the personnel department were removed from the
chain. By removing one of them and by reengineering the actual business practices that ordinarily
take place in the remaining elements of the chain, so that to be more effective, the charges were
reduced to those of the private sector agency.
6.1.5.2 Software Tools
http://www.semdesigns.com/Products/DMS/DMSToolkit.html
Semantic designs Inc is a company that has developed software package called DMS Software
Reengineering Toolkit. The DMS Software Reengineering Toolkit is a set of tools for automating
customized source program analysis and modification of large scale software systems and therefore
reengineer the whole systems.
6.1.5.3 Consultants - Experts
Reengineering Forum (http://reengineer.org/)
The forum is an industry related association that encourages the combined industry - research
review of the practice of reengineering of software, systems and business processes.
6.1.5.4 References
Shandler. D, >"It's Time to Reengineer Training"

NPD Stage 6: Technical Implementation
128
(http://www.reengineering.com/articles/apr96/Consjour.htm), Enterprise Reengineering, Apr 96
Strassmann. P A, "Reengineering"
(http://www.strassmann.com/pubs/reengineering.html), Politics of Information Management,
The Information Economics Press, 1995
Strassmann. P A, "The Hocus - Pocus of Reengineering"
(http://www.strassmann.com/pubs/hocus-pocus.html), Enterprise Reengineering, June 1994
Willets. L G, "The Best Ways to Survive Reengineering: Expert Tips on How to Reinvent
Your Attitude"
(http://www.reengineering.com/articles/sept96/reengsurvival.htm), Enterprise Reengineering,
Sep 96
6.1.6 Reverse Engineering
Reverse engineering is defined as the process of analysing a system or an object to identify its
components and their inter-relationships and create representations of the system or the object in
another form or at a higher level of abstraction. In the case of product development this is translated
into the process in which an existing competitive product is analysed and documented so that its
development process is understood. In this case the tricky part is to avoid copying it or stepping
into copyright laws while doing so. This process can help companies that have no product
development experiences and although have the resources to conduct product development do not
know where and how to start.
The process is a practice that nowadays is often used by almost everyone in industry related
companies such as computer hardware and software manufacturers, automobile industries,
pharmaceutical firms etc. It provides a fairly cheap way in developing a new or a better offering of
a product without the hassle of going through a complete development process. For example an
automobile industry can purchase car of a competitive firm, disassemble it, examine the welds,
seals and other components of the car for the purpose of enhancing their vehicles of similar
components.
Source: Crow Kenneth, “A Methodology for Reverse Engineering”, On-line http://www.npd-
solutions.com/remethod.html
6.1.6.1 Reverse Engineering Methodology
A typical workflow in reverse engineering could involve scanning an object and recreating it. This
process comes in a series of steps, which are discussed and illustrated bellow.
Step 1: A cloud of points is taken from scanned data using a
digitizer such as a laser scanner, a computed tomography or
faro arms.

NPD Stage 6: Technical Implementation
129
Step 2: The cloud of points is converted to a polygonal
model. The result is cleaned up, smoothed and sculptured to
the required shape and accuracy.
Step 3: Curves are drawn or created on the mesh using
automated tools such as feature detection tools or dynamic
templates.
Step 4: A restructured spring mesh is created using semi-
automatic tools.
Step 5: NURBS surfaces are fitted using surface fitting and
editing tools.
Step 6: The final resulting NURBS surface, which satisfies
accuracy and smoothness requirements, is exported to a
CAD package for generating toll paths for machining.
Step 7: The part is manufactured and then analyzed for
physical, thermal, electric or other properties.
Source: Crow Kenneth, “A Methodology for Reverse Engineering”, On-line http://www.npd-
solutions.com/remethod.html

NPD Stage 6: Technical Implementation
130
6.1.6.2 Major Applications
6.1.6.2A Reverse Engineering of Business
Reverse engineering is not used only in cases of products or product components. It can also be
used in the case of a business. The most common application of business reverse engineering is
competitor product analysis. Reverse engineering can be used to analyse how a competitor product
works, what it does, who manufactures it, what kind of components consists of, how much does it
cost to be produced, what kind of patents protects it etc.
Value engineering is a related activity which involves the deconstruction and the analysis of
products and whose objective is to find opportunities for cost cutting.
6.1.6.2B Reverse Engineering of Electronic Components
Reverse engineering of electronic components is very much used nowadays since manufacturers of
new electronic products need to solve interoperability problems. This means that new electronic
components or new electronic in nature products need to be compatible with others so that
information and services can be exchanged between them directly and satisfactory. Reverse
engineering is used for competitive or otherwise electronic equipment functionality analysis so that
a new product can be 100% compatible with them.
Coordinate - Measuring Machines (CMM) is one of the reverse engineering techniques that are
used for electronic equipment. CMM can be used to digitize a circuit and the information to be used
in computer-aided modelling. Another new and improved technique is laser scanning. The
technique uses a laser beam o scan across the surface of components of any shape and display the
results in real time in a computer screen.
6.1.6.2C Reverse Engineering of Software
Reverse engineering is applied to software in a big way. One of the most famous cases of reverse
engineering of software is the case of the first non-IBM implementation of BIOS. In the US the
"Digital Millennium Copyright Act" exempts from the circumvention ban some acts of reverse
engineering aimed at interoperability of file formats and protocols and judges in key cases have
ignored the law since it is possible to be acceptable to circumvent restrictions for use but not for
access.
A typical example of software reverse engineering is the "Samba Software". The software allows
systems that are not using or running Microsoft Windows to share files with systems that are. The
Samba project had to reverse engineer the way Windows file shared worked which was
unpublished and restricted Microsoft Corp information, so that a computer that did not use
windows could emulate the procedure.
Reverse engineering of software can be accomplished by various methods. The two main ones is
analysis through observation of information exchange and decompilation or disassembly using a
disassmbler.

NPD Stage 6: Technical Implementation
131
Source: This article is licensed under the GNU Free Documentation License, On-line
http://www.gnu.org/copyleft/fdl.html. It uses material from http://internet-
encyclopedia.org/wiki.php?title=Reverse_engineering.
For more information please see: http://en.wikipedia.org/wiki/Wikipedia:Copyrights
6.1.6.3 Case Studies - Examples
Reverse Engineering Case Study
Although the use of reverse engineering as means to duplicate or copy a software program
constitutes a copyright violation and it is illegal, an example of how can be done is very useful in
understanding the process and act as a case study of reverse engineering use.
Software reverse engineering involves in reversing a program's machine code (the binary string of
0's and 1's that are send to the processor) back into the source code that it was written in, using
programming language commands. To do this, in the case of a complicated program, someone can
use for example a hexadecimal dumper, which prints or displays the binary numbers of a program
in hexadecimal format (which is easier to read). Knowing the hex words that make up the processor
instructions, as well as the instructions length, a reverse engineer can identify certain portions of the
program and see how it works. Also besides the dumper, a disassembler can be used to read the
binary code and transform it into text displaying each executable command. A disassembler usually
cannot tell the difference between an executable instruction and data send to the processor. So in
this case the reverse engineer can use a debugger that does exactly that. So in any case using
different tools a software program can be analyzed to the point that it is understood completely and
can be copied or its source code altered to create a new software product through reverse
engineering.
6.1.6.4 Consultants - Experts
Future Technology Systems Consultancy (http://www.fts.gr/fts/ftsprduk.htm), Greece
Industrial Center, Hong Kong Polytechnic University
(http://www.ic.polyu.edu.hk/services/consultancy.htm)
Liveware Software Engineering, Reverse Engineering Services
(http://www.liveware.com/english/services/reengineering.htm)
Team Engineering (http://www.team-eng.com/services/consultancy.html)
6.1.6.5 References
Cameron D, "Reverse Engineering of Software"
(http://www.jurisdiction.com/reverse.htm), 1997
Klint P, Verhoef C, Van den Brand M, "Reverse Engineering and System Renovation - An
Annotated Bibliography" (http://adam.wins.uva.nl/~x/reeng/REanno.html), University of
Amsterdam, The Netherlands, 1996
NPD Stage 6: Technical Implementation
132
Muller H A, "Understanding Software Systems Using Reverse Engineering Technologies
Research and Practice"
(http://www.rigi.csc.uvic.ca/UVicRevTut/F4rev.html), Department of Computer Science,
University of Victoria, 1996
Smith D B, Tilley S R, Wong K, Muller H, "Reverse Engineering: A Roadmap"
(http://www.cs.ucl.ac.uk/staff/A.Finkelstein/fose/finalmuller.pdf)
6.1.7 Major Manufacturing Issues
6.1.7.1 Bill of Material (BOM)
A bill of material is a formally structured list for an object (semi-finished or finished product),
which lists all the component parts of the object with the name, reference number, quantity, and
unit of measure of each component. A bill of material can only refer to a quantity greater than or
equal to one of an object. It is a product data structure, which captures the end products, its
assemblies, their quantities and relationships.
There are usually two kinds of bills of materials needed for a product: engineering and
manufacturing BOM. The engineering BOM normally lists items according to their relationships
with parent product as represented on assembly drawings. But this may not be sufficient to show
the grouping of parts at each stage of the production process nor include all of the data needed to
support manufacturing or procurement. These requirements may force the arrangement of the
product structure to be different in order to assure manufacturability. Thus, engineering and
manufacturing will usually have different valid views for the same product.
Manufacturing Requirements Planning (MRP) systems typically rely on a Bill of Materials (BOM)
and the product structure for their information. In theory, the BOM can and should be produced
automatically by the CAD system but in practice there is usually human intervention or even re-
entry. The main reasons are: The difficulty of tracking changes to the BOM (product structure) and
affectivity dates and transferring this data back to the design system. Many changes, such as
different suppliers for fasteners, do not affect the design form, fit and function and are therefore
only made and stored in the manufacturing systems. The need in manufacturing to view the product
structure differently. It is often necessary to batch similar components from different products
together for mass production or efficient purchasing.
Product Data Management (PDM) technology enables changes to be tracked and implemented
through the design and engineering change process and then passed over to the MRP system when
approved. Therefore PDM systems use BOM to represent configuration management of the
product.
A Bill of Materials is a product data structure, which captures the end products, its assemblies, their
quantities and relationships. The structure of a part's list determines the accessibility of the part's
information by various departments in a company. It also helps to determine the level of burden put
on the computational device in searching for product information. In many companies the BOM is
structured for the convenience of individual departments. This, however, engenders problems in
other departments.

NPD Stage 6: Technical Implementation
133
In Figure 1, a product named Product 1 is shown graphically with the summarized products
structure and the number of all items that are needed to make the parent products are enclosed in
brackets.
Figure 1: Graphical Representation of Product 1 Structure
Source: Crow Kenneth, “Product structure and Bills of Material”, DRM Associates, On-line
http://www.npd-solutions.com/bom.html
Table 1 contains a bill of materials for Product 1 in which the total usage of each item is collected
into a single list for the product. This kind of list is convenient for the master production schedule
but results in the duplication assemblies. This implies that each product bill that uses assembly
must be changed whenever there is a change in assembly. Furthermore, since lead times of
intermediate assemblies cannot be determined, parts are ordered too early the first time they are
encountered in the product structure.
Table 1: BOM for Product 1.
Source: Crow Kenneth, “Product structure and Bills of Material”, DRM Associates, On-line
http://www.npd-solutions.com/bom.html
Other arrangements used in arranging the bill of materials is by indenting the product data as shown
in Table 2. One disadvantage of this method is that all components of an assembly are repeated
each time the assembly is used, resulting in massive duplication of data.
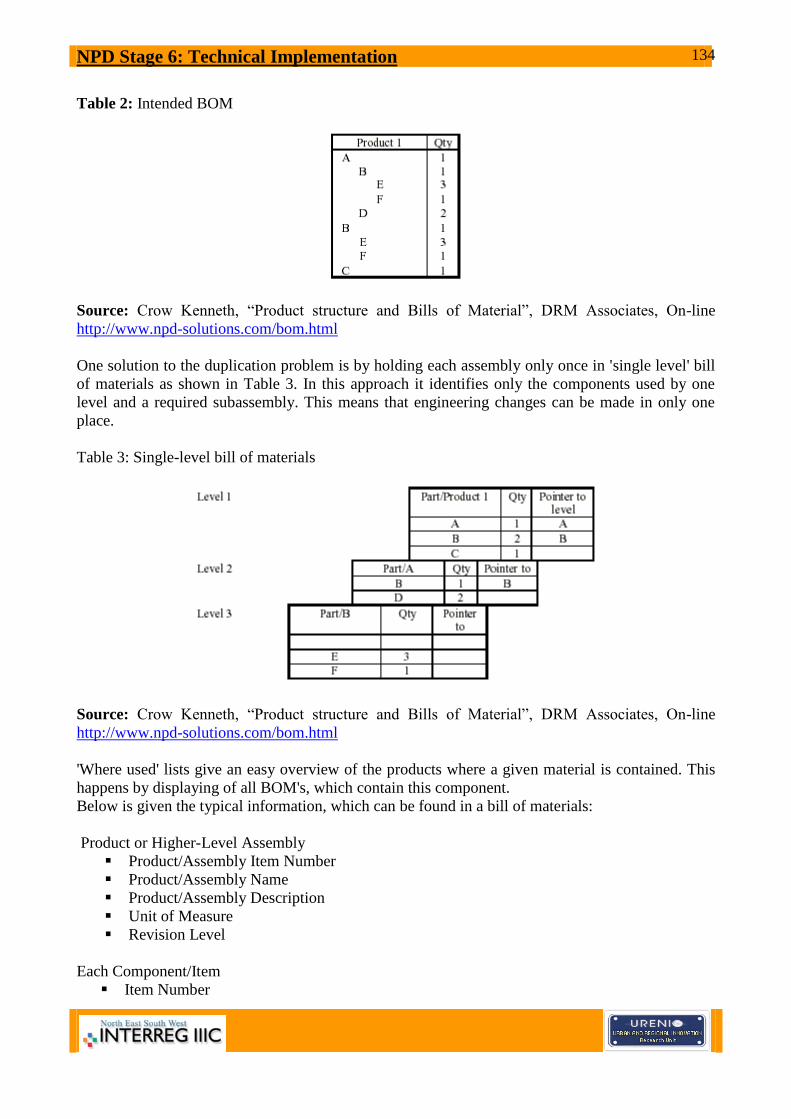
NPD Stage 6: Technical Implementation
134
Table 2: Intended BOM
Source: Crow Kenneth, “Product structure and Bills of Material”, DRM Associates, On-line
http://www.npd-solutions.com/bom.html
One solution to the duplication problem is by holding each assembly only once in 'single level' bill
of materials as shown in Table 3. In this approach it identifies only the components used by one
level and a required subassembly. This means that engineering changes can be made in only one
place.
Table 3: Single-level bill of materials
Source: Crow Kenneth, “Product structure and Bills of Material”, DRM Associates, On-line
http://www.npd-solutions.com/bom.html
'Where used' lists give an easy overview of the products where a given material is contained. This
happens by displaying of all BOM's, which contain this component.
Below is given the typical information, which can be found in a bill of materials:
Product or Higher-Level Assembly
Product/Assembly Item Number
Product/Assembly Name
Product/Assembly Description
Unit of Measure
Revision Level
Each Component/Item
Item Number

NPD Stage 6: Technical Implementation
135
Item Name
Item Description
Revision Level
Unit of Measure
Quantity per (each higher level assembly)
Effectivity (date in and date out or serial number in and serial number out)
Source: DRM Associates (http://www.npd-solutions.com/bom.html)
6.1.7.2 Mass production
Mass production is the process of manufacturing large amounts of standardized products is a
production line. The process permits very high rates of production per person and so it provides
very inexpensive products. The aim of the process is the reduction of non-productive effort of any
kind.
In craft production a single person must get all the necessary parts and assemble them to produce a
product with the help of all kind of tools which are used many times. In mass production each
worker repeats one or few related tasks and uses the same tool to perform almost identical
operations in a stream of products. The tool and the parts required are always there and no time is
spent getting them or finding them.
Mass production systems are usually organized in assembly lines. A factory may have more than
one assembly lines in the cases of complex products. A diagram of typical mass production factory
looks like the skeleton of a fish. Different sub-assembly lines are used to produce different parts of
a product and all finished parts are joint together at the end.
Nowadays managers choose which part or which product to put in a assembly line based on the
return of investment (ROI) that a specific assembly line can produce. Assembly lines that are
considered to have bad ROI are usually outsourced.
Source: This article is licensed under the GNU Free Documentation License, On-line
http://www.gnu.org/copyleft/fdl.html. It uses material from
http://en.wikipedia.org/wiki/Mass_production
For more information please see: http://en.wikipedia.org/wiki/Wikipedia:Copyrights
6.1.7.3 Producibility
Sometimes manufactured products have unnecessary precision, production operations or parts.
Simple redesign of the product can eliminate these so that costs are lowered and manufacturability,
reliability and profits are increased. There are a lot of examples in different industries where this is
common practice.
Some Japanese disc brakes have parts with tolerances of three mm an easy to meet precision. This
fact combined with some basic statistical process controls assures that less than one in a million
will fail. Also many vehicle manufacturers have programs of reducing the number of types of
fasteners in their product so that their inventory, tooling and assembly costs are reduced.

NPD Stage 6: Technical Implementation
136
Another reducibility technique is "near net shape" forming. A forming process can eliminate many
low precision machining or drilling steps. Also precision transfer stamping can produce hundreds
of high quality parts fast from generic rolls of steel and aluminium. Die-casting is used to produce
metal parts from aluminium or tin alloys. Plastic injection molding is a handy technique in cases
where the part is supplemented with inserts of brass or steel.
In the case of computer manufacturing, parts can be replaced with software that fits into a single
lightweight low power memory part or micro-controller. In the electronics industry some PCB's
(Printed Circuit Boards) contain parts that are leadless. This reduces the count of holes (Via) and
clipping off the leads after soldering and therefore the cost of manufacturing.
Source: This article is licensed under the GNU Free Documentation License, On-line
http://www.gnu.org/copyleft/fdl.html. It uses material from
http://en.wikipedia.org/wiki/Industrial_engineering.
For more information please see: http://en.wikipedia.org/wiki/Wikipedia:Copyrights
6.1.7.4 Quality Assurance
Quality assurance covers all the activities from design, development, production, installation,
servicing and documentation. But it also includes the management of raw materials, assemblies,
products and product components; services related to production and all the inspection processes.
That is why it is vary important to the product manufacturing process. One of the most widely used
quality assurance tool is the Plan - Do - Check - Act (PDCA) cycle that is also known as the
"Shewhart Cycle".
The PDCA cycle is really nothing more than a four-stage checklist that one must go through to get
from "problem faced" to "problem solved". The cycle was originally developed by Walter
Shewhart. He was a pioneer statistician who was working in the Bell laboratories in the 1930's in
the US. The cycle can be graphically presented as shown bellow.
Figure 1: The PDCA Cycle.
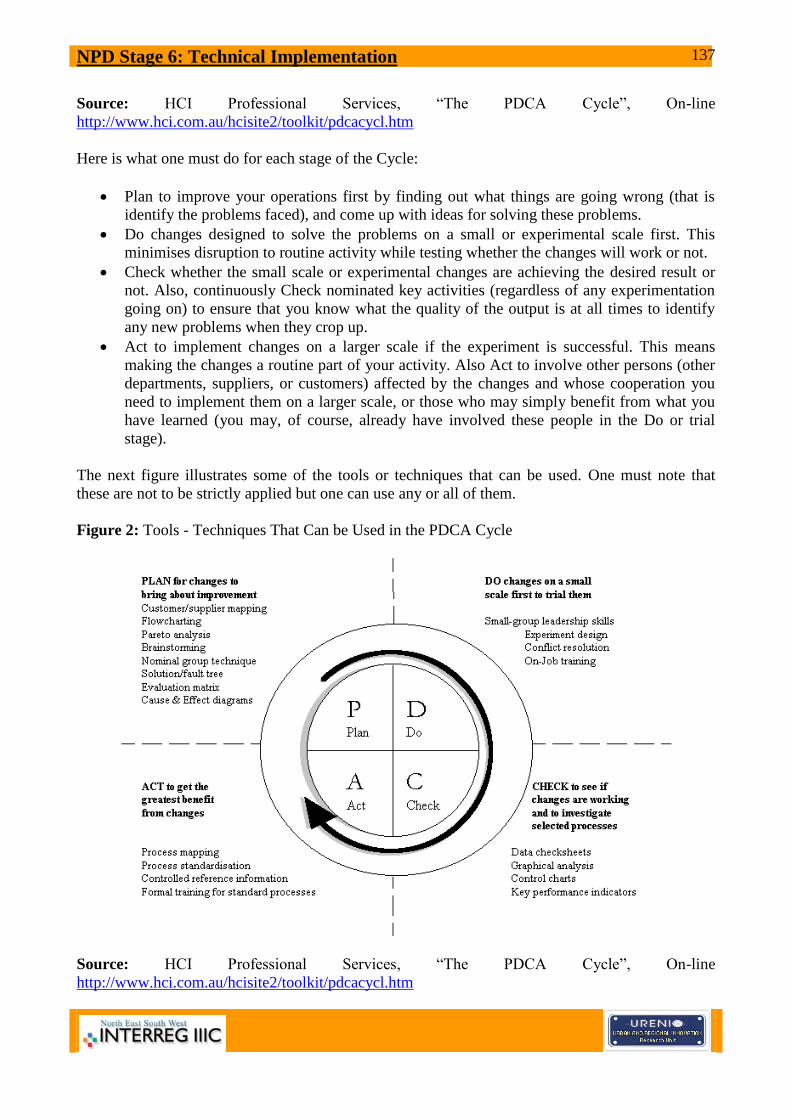
NPD Stage 6: Technical Implementation
137
Source: HCI Professional Services, “The PDCA Cycle”, On-line
http://www.hci.com.au/hcisite2/toolkit/pdcacycl.htm
Here is what one must do for each stage of the Cycle:
Plan to improve your operations first by finding out what things are going wrong (that is
identify the problems faced), and come up with ideas for solving these problems.
Do changes designed to solve the problems on a small or experimental scale first. This
minimises disruption to routine activity while testing whether the changes will work or not.
Check whether the small scale or experimental changes are achieving the desired result or
not. Also, continuously Check nominated key activities (regardless of any experimentation
going on) to ensure that you know what the quality of the output is at all times to identify
any new problems when they crop up.
Act to implement changes on a larger scale if the experiment is successful. This means
making the changes a routine part of your activity. Also Act to involve other persons (other
departments, suppliers, or customers) affected by the changes and whose cooperation you
need to implement them on a larger scale, or those who may simply benefit from what you
have learned (you may, of course, already have involved these people in the Do or trial
stage).
The next figure illustrates some of the tools or techniques that can be used. One must note that
these are not to be strictly applied but one can use any or all of them.
Figure 2: Tools - Techniques That Can be Used in the PDCA Cycle
Source: HCI Professional Services, “The PDCA Cycle”, On-line
http://www.hci.com.au/hcisite2/toolkit/pdcacycl.htm

NPD Stage 6: Technical Implementation
138
References
Deming E.W. "Out of the Crisis", MIT Press, 1st Edition, Aug. 2000
Deming E.W. "The PDCA Cycle"
(http://www.glassworks.org/glassworks/winter97/page2.html), Glass Works, 1997
Imai M. "Kaizen: The Key to Japan's Competitive Success", McGraw-Hill / Irwin, 1st
Edition, Nov. 1986
Quest, >"The PDCA Cycle" (http://www.questlearningskills.org/pdca.htm), Quest Learning
Skills
Scoltes P. "The Team Handbook: How to Use Teams to Improve Quality", Oriel Inc, 1st
Edition, Aug 1988.
Wikipedia, "PDCA" (http://en.wikipedia.org/wiki/PDCA), Free On-line Encyclopedia
6.1.7.5 Value Engineering
Value engineering is a branch of industrial - manufacturing engineering in which the output of a
system is optimized. The optimization process consists of two components: the optimization of
performance and the optimization of cost.
Usually cost and performance optimization within value engineering involves the reduction of
product quality and thus the reduction of cost. But this should not to be the case. Cost optimization
should reduce cost by eliminating wasteful practices. This can be done by several ways, which are
discussed bellow.
Material substitutions. Some materials that are used in a product can sometimes be
substituted by less expensive ones. For example if a product has a life cycle expectancy of
10 years and it consists of materials with life expectancy of 15 or 20 years then these can be
substituted since keeping them is a wasteful practice.
Process efficiency. Sometimes manufacturing or production processes can be redesigned so
that they are more efficient and therefore more cost effective. Process engineering can help
a lot in this case.
Modularity. Modules that are designed once and are used in many different products can
reduce cost a great deal. By using the same modules in different products or applications
reduces development costs, production costs and product complexity.
Energy efficiency. A product can be designed to be energy efficient. This adds value to the
product and although it does not necessarily reduces production costs may increase profits
by increased sales. This is applied to heating and air-conditioning, transportation, and
industrial equipment products.
Value engineering usually is performed in four stages:
1. Information gathering stage. This stage is really a product function analysis stage where all
required product functions are determined.
2. Alternatives generation stage. In this stage all possible alternatives in respect to product
functionality are identified.
3. Analysis stage. A thorough analysis of both the product functions and their alternatives is
carried out during this stage.

NPD Stage 6: Technical Implementation
139
4. The decision stage. Finally in this stage, decisions are made in respect to which functions can
be altered and which can be replaced so that cost and performance are optimized.
Source: This article is licensed under the GNU Free Documentation License, On-line
http://www.gnu.org/copyleft/fdl.html. It uses material from
http://en.wikipedia.org/wiki/Industrial_engineering
For more information please see: http://en.wikipedia.org/wiki/Wikipedia:Copyrights
6.2 Level Assessment
Assessment 6 evaluates the way the selected concept and the resulting product prototype is finally
produced, manufactured in large quantities so that it can be launched into a market at the end of
Level 7.
The use of CAD/CAM techniques, of industrial design techniques, of reverse engineering and of re-
engineering techniques is examined and the whole work in Level 6 is judged so that again a GO,
KILL or HOLD decision to be issued for progression into Level 7 of the roadmap.

NPD Stage 7: Product Commercialisation .
140
NPD Stage 7: Product Commercialisation
If a company decides to go ahead with the commercialisation of a new product, it will face the
largest costs to date. The company would have already spent much on product idea generation,
product idea selection, product development, prototype development and product prototype testing
and validation, but the amount of money that commercialisation requires is far more. The company
will have to built, rent a large full-scale manufacture facility if it has none or outsource the
manufacturing process, it will have to spend a bundle on promotion and advertising, it will have to
decide upon and rent or contract a large distribution and delivery system, and it will have to take
some very difficult and important decisions about the commercialisation process in general.
7.1 Tools & Solutions
Due to the nature of the NPD-NET Roadmap matters concerning manufacturing related issues are
dealt in >Level 6< (1123). So in this Level the solution to the commercialising problem are related
to all the marketing aspects of product distribution, product pricing and product promotion. These
aspects include product advertising, product publicity and public relations, product pricing
methodologies and product personal selling and selling promotion.
7.1.1 Marketing Plan
Marketing planning is a very complex and cross - functional process. It contains all the marketing
activities and tasks that should reflect the company's strategies. Ideally all levels of an organization
should understand such strategies so that each level can carry out its part. Since markets today are
highly competitive, marketing strategies and marketing planning must have a big understanding of
customer needs and market behaviour. Successful companies are those that have acute awareness of
such issues and form their strategies accordingly.
The market plan is a document that focuses on bringing such strategies into life. It can be
considered as a roadmap for performing marketing activities and tasks such as sales, advertising,
promotion, and others having the successful product launch always in mind. Forming a market plan
is a step-by-step process, which includes the following.
1. Understanding the strategy of one's company and taking steps for the establishment of links
between company strategy and marketing planning.
2. Analyzing the environment within the company does business. This includes the market, the
industry, the competitors and other issues.
3. Understanding the market segmentation so that the right customers can be targeted. These
customers are the ones whose needs a new product will satisfy.
4. Knowing how and where to position the product so that its key features and values are shown to
the target audience.
5. Forming the "marketing mix" which consists of a combination of activities which are used to
bring the product into a market and sustaining it into this market for as long as possible. These
activities include:
Deciding which products meet the needs of the pre - identified target customers.

NPD Stage 7: Product Commercialisation .
141
Pricing those products so that their competitive value price is recognized by the market
targets.
Defining promotional programs to reach those target customers. Such programs include
advertising and communications programs.
Creating channels of distribution so that the new product or products are at the right time
close to the target customers.
6. Determining the person or team that will bring the product into the market. That includes the
sales team.
7. Launching product line extensions if this is considered necessary.
8. Training the sales team to competitive position the product.
9. Budgeting the marketing program so that all goals and strategies are satisfied.
10. Describing operational difficulties an dependencies of other organizations.
7.1.2 The Elevator Speech
The Elevator speech is a tool that can be used in Level 7 just prior to product launch into the
market. The tool helps the developing team to focus on how the product will be sold and what the
selling message will be. The aim of the tool is to drive the team's attention towards the target
market, critical product characteristics and important product features that differentiate it from the
other competitive products.
The tool's name is derived form an imaginary scenario in which one finds him in an elevator where
he has to describe the product in 30 seconds (time to get from ground floor to the top floor). The
Elevator Speech should be produced by a large team that includes sales, marketing, production and
design personnel, so that contribution and support is ensured.
The tool approach or methodology is very simple. The team tries to focus upon and answer to the
following key questions or statements in a small amount of time.
For... (Identification of target customer).
Who... (Statement of product need or opportunity).
The... (Product name) is a... (Product category).
That... (Key feature, compelling reason to buy).
Unlike... (Main competitive product).
Our product... (Statement of primary differentiation).
Source: Better Product Design, Institute of Manufacturing, University of Cambridge, On-line
http://www.betterproductdesign.net/tools/definition/elevator.htm
7.1.3 Product on a Page - Advert
As with The Elevator Speech, The Product on a Page is another tool that helps the product
developing team to think about how the product will be sold and what the selling message will be.
Unlike with the Elevator Speech, the use of the tool drivers the team's attention, only toward the
important product features and its main differences from the competitive products.

NPD Stage 7: Product Commercialisation .
142
Usually a product specification sheet is a detailed and lengthy document. A single page advert that
is well structured can give more or less the same information as the product specification sheet. The
team by creating such an advert can focus easily on the crucial product characteristics and visualize
the product proposition from a customer's point of view. For such an advert to be created the whole
developing team must be included. In some cases it is useful to have a customer present. Also such
an advert can be a draft of the advertising or promotion campaign during product launch.
The methodology of creating such an advert is very easy to grasp and to follow. It consists of six
simple steps.
Step 1: Who is the adverts target and where it should be placed? (Statement or description of the
profile of the target customers or users. At this point it is decided whether one type of advert is
sufficient to cover all potential customer segments).
Step 2: Purpose of advert? (Statement of the reason behind the advert. In this step it is decided how
the advert will raise customer interest. For example will the advert compare the product against
competitive ones or will the advert try to change purchase customer behaviour?).
Step 3: Issues to address? (At this step all key product features are identified and noted. Sometimes
a bullet system is used. Also customer needs are noted).
Step 4: Catch phrase? (At this point the team must come with a phrase that catches the full selling
product message and product mission).
Step 5: Images? (The team must decide what kind of product or other images will be used. Typical
examples include the product in use, the potential customers, the place of use or some abstract
image that carries a certain message).
Step 6: Product brochure or handbook development. (In step 6 as all elements of the advert are in
place, the team can build a brochure or handbook outline that can be used in conjunction with the
advert during the advertising or promotion campaign).
Source: Better Product Design, Institute of Manufacturing, University of Cambridge, On-line
http://www.betterproductdesign.net/tools/definition/pop-advert.htm
7.1.4 Distribution Channels
7.1.4.1 Distribution Definition and Considerations
The definition of a distribution channel was first given by Buclin in his book "Theory of
Distribution Channel Structure" (1966). He wrote "Channel of distribution comprises a set of
institutions which perform all of the activities utilized to move a product and its title from
production to consumption". But in reality a distribution channel is not as simple as it is presented
above. Many factors must be taken into consideration and a lot of things to be decided for a product
to be moved from manufacture into the market.

NPD Stage 7: Product Commercialisation .
143
First of all for successful distribution channel set up there are six basic decisions that must be made
by the marketing team beforehand. These decisions are related to the questions that are given
below.
Use of direct or indirect channels?
Use of single or multiple channels?
What will be the cumulative length of the multiple channels if those are used?
What types of intermediaries will be used?
What will be the potential number of intermediaries if those are used?
Which companies will be used so that to avoid "inter-channel" conflict?
When all the above questions are answered then the marketing team should select the distributor
taking into account the following considerations.
Market segment: the distributor must be familiar with the target consumer and segment.
Changes during the product life cycle: different channels can be exploited at different points
of the product's life cycle.
Producer - distributor fit: there must be a match concerning policies, strategies and image
between the producer and the distributor.
Qualification assessment: the experience and the track record of all potential distributors
must be established and assessed.
Training and support: the amount of training and support that a distributor will require to
have the job done must be taken into account.
7.1.4.2 Distribution Channel Strategy
A distribution channel strategy is influenced by many factors that fall into three main categories:
market, producer and product. These factors influence the way a product distribution channel is set
up and their consideration is crucial on the decisions that must be made by the marketing team to
accomplish a successful product launch. All major factors are analyzed and discussed bellow.
Market factors. An important market factor is "buyer behaviour". This factor describes the way
customers prefer to buy a product. For example do customers prefer to buy a product from a
retailer, locally, via mail or perhaps from the Internet? Another one is "buyer needs" which
describes what customers would like to have in regards to technical product assistance, product
installation or product servicing. Both factors contain information that can be easily gathered
during the early stages of NPD process by a market research when the product or the product
concept is designed. The willingness and cost of channel intermediaries to the product are also a
market factors. An intermediary could either charge a high commission that would be unacceptable
by the producer or he could decide not to support a specific product if it requires a heavy
investment.
Producer factors. Sometimes a producer will not have the resources that are necessary for all the
distribution channel activities to be performed. If that is the case the use of agents or outside
contractors is the only way that a product can reach a market. Also producers may not have the
required customer approaching skills to sell their products. Channel intermediaries that invest
heavily in customer relations are the only people that can create a competitive advantage for a
given product. Another producer factor is the price and location of product sale. For example in the

NPD Stage 7: Product Commercialisation .
144
case when a producer sells via a retailer it is common that he loses control of the final product price
due to retailer discounts, promotional offers.
Product factors. The way that products reach customers depend on what kind of products they are.
For example complex equipment such as medical, aerospace or electronic components are sold
directly to customers without the intervention of intermediaries, retailers or agents.
Another thing that influences the formation of a distribution channel strategy is distribution
intensity. This can be intensive, selective or exclusive. Intensive distribution is focused on the
complete saturation of the market by using all available methods to sell a product. Selective
distribution on the other hand aims at the use of a limited number of outlets to sell a product. It can
work very well when customers are willing to "shop-around". Finally exclusive distribution is an
extreme form of selective distribution in which only one wholesaler, retailer or distributor in a
specific geographical area is allowed to sell a particular product.
Source: Tutor2u Ltd, “Distribution Channel Strategy”, On-line
http://www.tutor2u.net/business/marketing/distribution_channel_strategy.asp
7.1.4.3 Types of Distribution Channels
There are many types of distribution channels. The most important ones are wholesalers, agents,
retailers, the Internet and overseas distributors and direct sales. A description of each is given
bellow.
Wholesalers. These usually buy products from producers in large quantities and sell these to
retailers. They take ownership or title of goods. Most of the times they provide storage facilities
and sometimes take some of the product marketing responsibilities. The wholesaler provides
minimum contact between the producer and the customer.
Agents. They are used mostly in international markets. They will typically secure orders for
products and take commissions from the producer. Agents usually do not tie capital to goods but
sometimes they can stockpile products in cases when products need to get into a market as soon as
they are produced. They are very expensive to train and keeping them under control is a difficult
task due to the distances involved. Also they are difficult to be motivated due to the nature of their
payment.
Retailers. Retailers have a strong relationship with the customers. They will hold a lot of different
products and brands in stock and they will usually offer credit or discounts to the customers. All
products are promoted and merchandised by them. Also the retailers will have the final say on
price.
The Internet. E-commerce is a distribution channel that is growing steadily in the past years. The
Internet offers a large dispersed market to producers. Set up costs can be low and all the e-
commerce technology is easily attainable. Also in recent years there is a shift in commerce and
consumption habits that benefits distribution through the Internet.

NPD Stage 7: Product Commercialisation .
145
Direct sales. Direct sales involve the supply of customers directly from the producer's factory. The
marketing or sales in-house department looks after all contacts. Usually direct sales involve
international sales and require sales personnel or office away from home base.
In some cases one of the above alternatives is sufficient by one's company to bring a new product
into a market. But in other cases a combination of some or all of the above alternatives will bring
the desired result.
Sources:
Marketing Teacher, “Place, Distribution, Channel or Intermediary”, On-line
http://www.marketingteacher.com/Lessons/lesson_place.htm
ICT USA, “ICT Channels of Distribution”, On-line
http://www.emich.edu/ict_usa/CHANNELS_OF_DISTRIBUTION.htm
7.1.5 Product Pricing
Pricing is one of the product commercialization components along with promotion and distribution.
A well-chosen price for a product should focus on three things: achieve the financial goals of the
business i.e. profitability, fit with the reality of the market and support a products positioning that is
aligned with the other aspects of product commercialization.
Price can be influenced by the distribution channel, the type of promotion used for the product and
the quality of the product. It can be high if manufacturing is expensive, distribution is exclusive and
the product is heavily supported by advertising and promotional campaigns. A low product price
can balance product characteristics such as low quality and light advertising. From the marketers
point of view the best price is the one that it is very close to the maximum customers are willing to
pay.
Product pricing can have different characteristics and involve different strategies. Some of the
strategies that are used in product pricing are:
"Premium Pricing" is a pricing strategy that involves pricing of a product at or near its
possible range. Consumers will buy Premium Priced products because they believe that are
of high quality (a high price is a sign of self worth) and they require best product
performance.
"Demand Pricing" is a pricing method that uses consumer demand as the central element.
"Promotional Pricing" is a pricing strategy that sets price as the key element of product
commercialization i.e. is used in conjunction with advertising and promotion to get the
product quickly known.
Source: This article is licensed under the GNU Free Documentation License, On-line
http://www.gnu.org/copyleft/fdl.html. It uses material from http://en.wikipedia.org/wiki/Pricing.
For more information please see: http://en.wikipedia.org/wiki/Wikipedia:Copyrights
7.1.5.1 Product Pricing Objectives
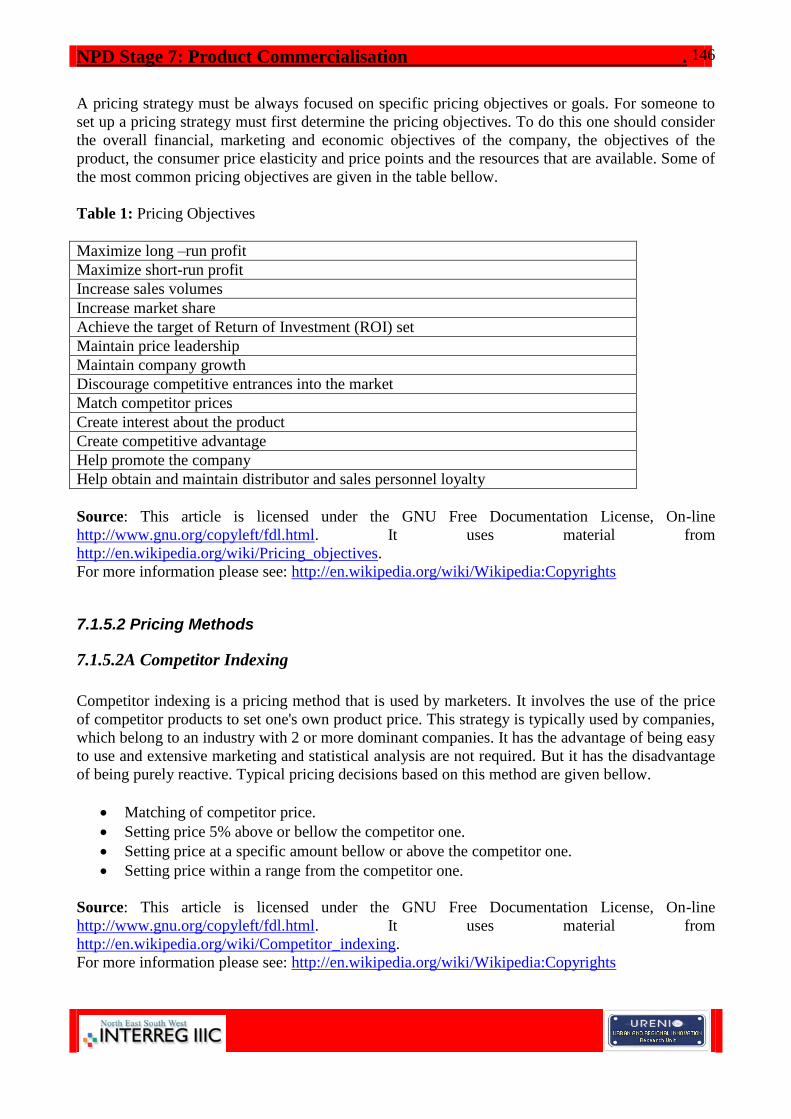
NPD Stage 7: Product Commercialisation .
146
A pricing strategy must be always focused on specific pricing objectives or goals. For someone to
set up a pricing strategy must first determine the pricing objectives. To do this one should consider
the overall financial, marketing and economic objectives of the company, the objectives of the
product, the consumer price elasticity and price points and the resources that are available. Some of
the most common pricing objectives are given in the table bellow.
Table 1: Pricing Objectives
Maximize long –run profit
Maximize short-run profit
Increase sales volumes
Increase market share
Achieve the target of Return of Investment (ROI) set
Maintain price leadership
Maintain company growth
Discourage competitive entrances into the market
Match competitor prices
Create interest about the product
Create competitive advantage
Help promote the company
Help obtain and maintain distributor and sales personnel loyalty
Source: This article is licensed under the GNU Free Documentation License, On-line
http://www.gnu.org/copyleft/fdl.html. It uses material from
http://en.wikipedia.org/wiki/Pricing_objectives.
For more information please see: http://en.wikipedia.org/wiki/Wikipedia:Copyrights
7.1.5.2 Pricing Methods
7.1.5.2A Competitor Indexing
Competitor indexing is a pricing method that is used by marketers. It involves the use of the price
of competitor products to set one's own product price. This strategy is typically used by companies,
which belong to an industry with 2 or more dominant companies. It has the advantage of being easy
to use and extensive marketing and statistical analysis are not required. But it has the disadvantage
of being purely reactive. Typical pricing decisions based on this method are given bellow.
Matching of competitor price.
Setting price 5% above or bellow the competitor one.
Setting price at a specific amount bellow or above the competitor one.
Setting price within a range from the competitor one.
Source: This article is licensed under the GNU Free Documentation License, On-line
http://www.gnu.org/copyleft/fdl.html. It uses material from
http://en.wikipedia.org/wiki/Competitor_indexing.
For more information please see: http://en.wikipedia.org/wiki/Wikipedia:Copyrights

NPD Stage 7: Product Commercialisation .
147
7.1.5.2B Cost-plus Pricing
Cost-plus pricing is a pricing method that is often used by companies because it is very easy to
calculate product price with little information. There are several varieties of the method and the
most common one is the one that uses the following formulae.
P = (AVC + FC%) * (1 + MK%)
Where P = price, AVC = average variable cost, FC% = percentage allocation of fixed costs, MK%
= percentage markup. For example if variable costs are €30, the allocation to cover fixed costs is
€10, and a 50% markup is needed then one should charge €60 for the product.
To make things even easier and simpler, some retailers ignore fixed costs and just use the price that
they have paid to their suppliers as the cost term of the equation. This way they "insert" the fixed
cost into the markup percentage. To simplify things even more sometimes a percentage for the
markup is not used. Instead a fixed amount is set by the head office to make it easy to retailers and
store managers to set price for products.
Cost-plus pricing is easy to calculate, it requires minimum amount of information, it is easy to
administer and has the ability to stabilize markets (it is not affected by factors such as demand
variations, competitive forces and ethical advantages). In the same time cost-plus pricing ignores
the role of the customers, ignores the role of the competitors, uses historical accounting costs rather
than real-time ones, uses a standard output level to allocate fixed costs, ignores the opportunity
costs and ignores possible incremental costs.
Source: This article is licensed under the GNU Free Documentation License, On-line
http://www.gnu.org/copyleft/fdl.html. It uses material from http://en.wikipedia.org/wiki/Cost-
plus_pricing.
For more information please see: http://en.wikipedia.org/wiki/Wikipedia:Copyrights
7.1.5.2C Price Skimming
Price skimming is a pricing method in which a marketer set a high price for the product at first and
then gradually lowers this price over a period of time. This pricing strategy allows the company to
recover production and other product costs quickly before competition steps using the high product
price in and then profit and work against the competition by lowering the product price. The
strategy is often referred as "riding down the demand curve". This is because marketers try to lower
product price following the decrease in consumer demand as time goes by and competition steps
into the market.
There are some drawbacks of the strategy that must be considered before embarking into price
skimming. Firstly the method encourages the introduction of competitors that see an opportunity
and step in very quickly. This often has the result of using the pricing method for defensive
purposes and not for goal achieving ones. Secondly negative publicity can result from fast price
lowering. This is because some early consumers or customers will feel ripped-off since they would
have paid a high price for a product that will have a low price in a short period of time. Thirdly cost
may not be recovered and the objective of the price strategy not achieved. And last but not least

NPD Stage 7: Product Commercialisation .
148
lowering the price of a product may have legal implications depending on the laws that apply to a
specific market.
Source: This article is licensed under the GNU Free Documentation License, On-line
http://www.gnu.org/copyleft/fdl.html. It uses material from
http://en.wikipedia.org/wiki/Price_skimming.
For more information please see: http://en.wikipedia.org/wiki/Wikipedia:Copyrights
7.1.5.2D Target Rate of Return Pricing
Target rate of return pricing is a pricing method used almost only by market leaders or companies
that have product monopolies. The idea behind the method is to start-off with a rate of return
objective, for example 5% of invested capital or 10% of sales revenue, and then arrange the price
structure so that to achieve the target rates of return. The idea and the pricing method are best
illustrated using the simple example that is given bellow.
A company invests €100 million to produce and market designer woman's shoes.
They estimate that the European demand is such that they can sell 2 million shoes per year.
From preliminary production cost evaluation they know that each pair of shoes will cost
€50. So the annual production cost will be €100 million.
Management decides that a 20% return of investment is needed. So the return of investment
must be €20 million.
So the price for a pair of woman's designer shoes must be set to €60.
A typical but often unseen consequence of this pricing method is the fact that price should be
altered often to match consumer demand. Since a fixed rate of return of investment is used in the
price calculations, as demand falls, price must be increased to keep the desired rate. As demand
falls the profit margin can be decreased to keep the price steady but this will decrease the profit
objectives set by the company. This is the reason why this pricing method is used only by market
leaders and product monopolists. Only they are in the position to change rates of ROI or profit
margins without much effect for their businesses.
Source: This article is licensed under the GNU Free Documentation License, On-line
http://www.gnu.org/copyleft/fdl.html. It uses material from
http://en.wikipedia.org/wiki/Rate_of_return_pricing.
For more information please see: http://en.wikipedia.org/wiki/Wikipedia:Copyrights
7.1.6 Product Promotion
Product promotion involves the disseminating of information about the product. It consists of four
subcategories: advertising, personal selling, sales promotion and publicity and public relations.
These four subcategories create the promotional mix or the promotional plan of a product. The
promotional plan has to do with how much attention one must pay to each of the four promotional
subcategories and includes a set of objectives, which are given bellow.
Sales increase.
New product acceptance.

NPD Stage 7: Product Commercialisation .
149
Creation of brand.
Product positioning.
Competitive retaliations if required.
Creation of a company image.
7.1.6.1 Advertising
In the early years of mankind and until printing was discovered advertising only existed in the form
of word-of-mouth. As printing was developed in the 15th and 16th century the first steps towards
modern advertising were taken. In the 17th century advertisements started to appear in weekly
newspapers in England and a century later advertising had become a popular and common thing.
As the economy grew and mankind entered the industrial age in the 19th century advertising grew
as well. The first advertising agency was created in 1843 in Philadelphia by Volney Palmer and this
agency and the ones that followed were just brokers for space in newspapers. Only in the 20th
century advertising agencies started to take over the responsibility of the advertisement content as
well.
From the early 20th century until now the purpose of advertising was to stimulate the consumer
demand for a product, service or idea. The way this is achieved is by creating a brand franchise for
a product. A brand franchise is created by the ability of the product to draw buyers. This ability is
established in small or large degree depending on the product and the market. There are many
advertising methods and techniques available which are presented and discussed in a separate
section.
Source: This article is licensed under the GNU Free Documentation License, On-line
http://www.gnu.org/copyleft/fdl.html. It uses material from
http://en.wikipedia.org/wiki/Advertising.
For more information please see: http://en.wikipedia.org/wiki/Wikipedia:Copyrights
7.1.6.1A Advertising Channels
Brochures or flyers. Nowadays one of the most common methods of advertising is the use of
brochures or flyers. Brochures can contain a great deal of information if they are well designed and
written. Production of brochures can be done either in-house by using some kind of desk - top
publishing or word processor software or they can be outsourced using an advertising agency. In
the case of in-house production a attractive tri-fold brochure can be made by using a 8.5-inch by
11-inch sheet folded in thirds.
Direct mail. Direct mail can be used if one needs to convey product information directly to his
customers. Direct mail can be customized so that the material sent is focused on customer specific
needs and wants. Addresses can be collected either from customers by asking them to fill out
information cards when they purchase a product or by collecting customer addresses from checks
or invoices. A direct mail list must be kept updated. An easy way for someone to do this is to notice
all returning mail.
Email messages. Emails can be a very easy way of informing people about your business. For this
to be done a signature line can be inserted to every outgoing mail. One should note that this is much

NPD Stage 7: Product Commercialisation .
150
appreciated and noted by the recipients. One should be careful about inserting advertisements into
outgoing mails since nowadays this can be perceived as Spam.
Magazines. Magazines advertisements can be very expensive but they can get your message out in
a very powerful way. One should be careful to choose magazines that address issue in specific
industries that interest you and your customers. A short article about one's business can be an
alternative to an advertisement and can provide more information to potential customers. One way
of keeping the cost at a low level is to contact a magazine reporter and arrange for a short
interview. Most of the times reporters are looking for new stories or sources and do not charge for
their services.
Newsletters. Newsletters can be an inexpensive way of advertising one's business or products.
Unlike emails customers usually sign up for these when visiting a business website. The best way
to go about introducing newsletters is to hire a consultant for the initial design and layout and then
use the in-house Webmaster for web insertion or Internet set-up.
Newspapers (major or neighbourhood). One can get his/hers business known to the public using
the newspapers by placing ads, writing a letter to the editor or working with a reporter to get a story
written about the business. Advertising can get very expensive especially in the case of the major
(large circulation) newspapers. Newspapers can sometimes provide advice about what and how to
advertise. For small or medium size companies the best way of reaching the public is local or
neighbourhood newspapers that are closest to the target customer interests.
Posters and bulletin boards. Posters can be a very powerful way of advertising when placed in
places that the public can notice them easily. The best places to post advertisements are places that
customers frequently use such as buses, the metro, by the road etc. One should make sure that
advertisements in posters or bulletin boards contain vivid colors so that a customer's eye is easily
attracted to.
Radio announcements or advertisements. One of the main advantages of radio ads is that they
are cheaper than the television ones and reach almost the same audience in respect to size. Timing
is very important factor concerning radio ads. These should be placed at times when customers can
listen to the radio such as in the morning or afternoon rush hour when they go or return from work.
Television advertisements. Most companies do not consider television ads at all due to their high
cost. But nowadays, new television networks or station emerge at a very fast rate and competition
can sometimes drop prices. So a company can place a television ad at a relative cheap rate. One
should note that television ads are priced depending on their length, the time of showing and the
number of ads per month or week or day.
Web pages. Nowadays advertising in the World Wide Web is commonplace for most businesses.
Using the web for advertising requires some expertise, equipment and some kind of software so
that ads can be designed, written and placed under a domain name. Also maintenance is required so
that the advertisements are kept up to date in respect to new products and services. In the case that
web advertisements are linked to some kind of ?-commerce then things can be complicated in terms
of extensive functions and graphics and so a consultant or a web designer may be required.

NPD Stage 7: Product Commercialisation .
151
7.1.6.1B Ways to get Free Advertising
Promotion and advertising can be a heavy expense for a business that either it is new and wants to
be known in a market or has a new product that is going to be launched into a market. In the case of
a small or tight budget, such as the budgets of typical small or medium size businesses, there are
some low cost advertising techniques that can be used. A number of such methods are described
bellow.
Giveaways. People always like to receive free items and especially items that can be used
to increase their knowledge or improve their way of living. One can build an entire
advertising and promotion campaign based on this customer desire. For example a furniture
business can give away free planning guides or free repair instruction manuals. Both items
can be very attractive to customers or the public in general and giving them away can
produce positive comments about the business. Also giving away such specific items can
have the result of the business being perceived as an expert in the field of furniture planning
or repairing.
News Creation. Publicity about one's business in the newspapers (local or national) can be
a very easy thing for someone to accomplish without the cost of having an advertisement
inserted in the newspaper. The recruiting of a new associate, the selling of an unusual
product, a free advice column concerning the sector that the business is in, the
announcement of receiving an award or a grant, can be news that a newspaper will be
interested in and that would attract the attention to many potential customers.
Events. One can easily attract the attention of media or a crowd by staging a promotional
event. For instance a business that manufactures children's food can arrange a lunch with a
"Easter Bunny" during the Easter holidays.
Charities. In the case of launching a new product and when the business is targeting a
specific market segment it would be a great idea to offer the product to a charity as a raffle
price at a fund raising event. Not only the product will be known but also the business.
Contests. As with the case of charities one can use contests to promote his / hers product.
The business must choose a contest that is relevant to the products that is manufacturing or
selling. For example an eating contest will be a great promotion activity for a food
manufacturing business.
Couponing. This method can be applied after the launch of a new product. Giving away
discount coupons can increase both the sales and the company publicity. Coupons can be
handed out through magazines, newspapers, store counters, door-to-door mail, or hand by
hand at locations where big crowds are gathering such as shopping malls, athletic events,
social events etc.
Badges and Novelties. One can easily and inexpensive produce badges, bumper stickers,
book covers and other novelties that bear the company name or a smart slogan that is related
to one's business. These can be distributed free by the same methods that are described
above in the case of coupons.
Parties. Everyone enjoy and attend parties. These can be held at the company's premises
and celebrate the anniversary of the company or some special holiday. This is great way of
getting publicity not only about one's company and its products but also its facilities and
employees.

NPD Stage 7: Product Commercialisation .
152
7.1.6.1C Product Placement
Product or brand placement is a form of advertising in which a product or a brand name is inserted
intentionally in motion pictures and television programs. The product or the brand name can be
mentioned in the dialogues, can appear in the set, can be used by a character or can be seen in
vehicles or billboards. The product or the brand name can also appear in commercials inserted in
the motion film. These commercials usually are made for use in the specific motion picture. This
kind of advertising is also known as stealth advertising.
Brand placement usually begins with the studio representatives contacting brand marketers or their
advertising agencies and informing them of the film's potential for product placement. If the
marketers or the advertising agencies are interested then the film's scripts are sent to them for
review and for placement strategy formation. If everything goes well some negotiations take place
regarding cost, availability, merchandising opportunities and promotion of the product, brand name
or film.
Brand or product placement offers marketers some great advantages over other kind of advertising
methods. The greatest of all is cost efficient communication. Over the life cycle of a film, a film
will be shown in theatres for a period of time, then maybe on television and then released on DVD
or VHS. As time goes by the cost of advertising per viewer or viewing decreases. So product or
brand placement maybe thought expensive at start but is very cheap in the long run. Also another
great advantage is that the product advertising through placement lacks competition since it is run
in an environment that is clean from other advertisements of competitive products.
Sometimes marketers require guarantees of audience attendance and always prefer lengthy
theatrical viewings. This is due to the fact that in the dark environment of a theatre the advertising
through product or brand placement has the maximum effect on viewers.
Brand or product placement is commonly directed to large corporations or companies since they are
usually the ones with the money available to embark in such an advertising adventure. Nowadays
the method is also used in the case of video games and music videos.
7.1.6.2 Personal Selling
Sales, or the activity of selling, forms an integral part of commercial activity. The primary function
of sales is to find and close leads, turning prospective customers into actual ones. Forms of selling
include:
Direct Sales - involving face-to-face contact
1. Retail or consumer
2. Door-to-door or travelling
3. Business-to-business
Indirect - human-mediated but with direct contact
1. Telephone or telesales
2. Mail-order

NPD Stage 7: Product Commercialisation .
153
Electronic
1. Web B2B, B2C
2. EDI
Agency-based
1. Consignment
2. Multi-level.
3. Sales agents (real estate, manufacturing)
Source: This article is licensed under the GNU Free Documentation License, On-line
http://www.gnu.org/copyleft/fdl.html. It uses material from http://en.wikipedia.org/wiki/Sales.
For more information please see: http://en.wikipedia.org/wiki/Wikipedia:Copyrights
7.1.6.3 Publicity & Public relations
Public relations (PR) is the practice of conveying messages to the public through the media on
behalf of a client, with the intention of changing the public's actions by influencing their opinions.
PR practitioners usually target only certain segments of the public ("audiences"), since similar
opinions tend to be shared by a group of people rather than an entire society. Communication is
more regarded as an instrument and the "media" as one of the possible channels. The rather
simplistic view in the first sentences doesn't explain internal relationship management and
communication activities carried out by public relations practitioners. Nor does it explain
community relations and activities.
Many people criticize the PR industry for its influence on the public, and for its sometimes
unethical actions in pursuing a preferred message over the facts. However, to say that of all PR
practitioners would be inaccurate. Most do not work for the large, multinational agencies, but are
rather in-house employees of organizations, like companies, nonprofit organizations, and federal
and local governments. Most are concerned with gaining any publicity for their clients or
employers in the first place rather than "spinning" a controversial issue over a prolonged period.
The "spinning" that the industry's critics complain of generally occurs in the service of large
corporations and prominent issue advocates rather than the rank-and-file of the PR industry, though
the amount of "spin" that can be bought with either financial or political capital does have a strong
influence on public discourse
Publicity is closely related to public relations. Whereas public relations is the management of all
communications between the firm and the general public, publicity is the management of product or
brand related communications between the firm and the general public. It is primarily an
informative activity (as opposed to a persuasive one), but its ultimate goal is to promote the
companies products, services, or brands. A publicity plan is a planned program aimed at obtaining
favourable press coverage for a companies products.
The most basic tool of the publicist is the press release, but other techniques include telephone
press conferences, in-studio media tours, multi-component video news releases (VNR's), newswire
stories, and internet releases. For these releases to be used by the media, they must be of interest to
the public ( or at least to the market segment that the media outlet is targeted to). The releases are
often customized to match the media vehicle that they are being sent to. Getting noticed by the
press is all about saying the right thing at the right time. A publicist is continuously asking what

NPD Stage 7: Product Commercialisation .
154
about you or your company will pique the reader's curiosity and make a good story? The most
successful publicity releases are related to topics of current interest. These are referred to as news
pegs. An example is if three people die of water poisoning, an alert publicist would release stories
about the technology embodied in a water purification product.
But the publicist cannot wait around for the news to present opportunities. They must also try to
create their own news. Examples of this include:
Contests
Walkathons
Art exhibitions
Event sponsorship
Arrange a speech or talk
Make an analysis or prediction
Conduct a poll or survey
Issue a report
Take a stand on a controversial subject
Arrange for a testimonial
Announce an appointment
Celebrate an anniversary
Invent then present an award
Stage a debate
Organize a tour of your business or projects
Issue a commendation
The advantages of publicity are low cost, and credibility (particularly if the publicity is aired in
between news stories like on evening TV news casts). The disadvantages are lack of control over
how your releases will be used, and frustration over the low percentage of releases that are taken up
by the media.
7.1.6.4 Sales Promotion
Sales promotions are non-personal promotional efforts that are designed to have an immediate
impact on sales. Sales promotion is media and non-media marketing communications employed for
a pre-determined, limited time to increase consumer demand, stimulate market demand or improve
product availability. Examples include:
Coupons
Discounts and sales contests
Point of purchase displays
Rebates
Sales promotions can be directed at either the customer, sales staff, or distribution channel
members (such as retailers). Sales promotions targeted at the consumer are called consumer sales
promotions. Sales promotions targeted at retailers and wholesalers are called trade sales
promotions. Some sale promotions, particularly ones with unusual methods, are considered
gimmicks by many.

NPD Stage 7: Product Commercialisation .
155
Source: This article is licensed under the GNU Free Documentation License, On-line
http://www.gnu.org/copyleft/fdl.html. It uses material from
http://en.wikipedia.org/wiki/Sales_promotion.
For more information please see: http://en.wikipedia.org/wiki/Wikipedia:Copyrights
7.1.6.4A Consumer Promotion Techniques
The most known and used techniques of consumer sales promotional techniques are given bellow.
These are mostly used in large retailer establishments such as super markets and shopping malls.
NAME DESCRIPTION
Price deal A temporary reduction in the price. For example “happy
hour”.
Cents-off deal Offers a brand at a lower price. Price reduction may be
percentage marked on the package.
Price-pack deal The packaging offers a certain percentage more of the product
for the same price.
Coupons Coupons that offer reduced price on a product or even a free
product are common practice today.
Free standing insert A coupon booklet that is offered inside newspapers or
magazines containing price reductions on selected products.
Rebates Consumers are offered money back if the receipt or the bar
codes of a product are mailed back to the manufacturing or
promotion company.
Contests / Games The consumer is automatically inserted into a game or a
contest with a high value price by purchasing a specific
product.
Source: This article is licensed under the GNU Free Documentation License, On-line
http://www.gnu.org/copyleft/fdl.html. It uses material from
http://en.wikipedia.org/wiki/Sales_promotion.
For more information please see: http://en.wikipedia.org/wiki/Wikipedia:Copyrights
7.1.6.4B Trade Promotion Techniques
The most known and used techniques of trade sales promotional techniques are given bellow.
NAME DESCRIPTION
Trade allowances A short-term incentive offered to make a retailer to stock
up on a product.
Dealer loader An incentive offered to make a retailer to purchase and
display a product.
Trade contest A contest to reward retailers that sell the most of a
specific product.
Point of purchase displays Extra sales tools given to retailers to boost sales.

NPD Stage 7: Product Commercialisation .
156
Training programs Dealer employees are trained in selling a specific
product.
Push money An extra commission paid to the retailer employees to
push a specific product.
Source: This article is licensed under the GNU Free Documentation License, On-line
http://www.gnu.org/copyleft/fdl.html. It uses material from
http://en.wikipedia.org/wiki/Sales_promotion.
For more information please see: http://en.wikipedia.org/wiki/Wikipedia:Copyrights
7.2 Level Assessment
Assessment 7, which is the last assessment before the product is launched into a market, evaluates
the marketing aspects of product launch. Although the assessment is not obligatory since the
product is already by now produced and market insertion is one way or the other imminent, it is
advisable to be considered so that the product is as much successful as possible and maximum
returns of investment and profits are achieved. Also the detail of the assessment questioning is low
since the assessment is only for advisory purposes and serves the role of a checklist.

General Purpose Tools .
157
8. General Purpose Tools
8.1 Benchmarking Tool, Urenio Research Unit
Benchmarking is the process in which a company's practices, technology, production process, and
its actual products are evaluated comparative with other companies of the same filed of activities.
In the case of this NPD roadmap a tool can be used to evaluate the entire above characteristics
comparative to European best organizations in the same field. The performance of a company is
evaluated through financial data, administration and management, strategy, R&D, manufacturing,
engineering, products and marketing, quality and customer satisfaction and warehousing and
distribution.
Benchmarking as a tool can be used either at the beginning or at the end of the NPD process. It can
reveal strengths and weaknesses of the company when used at the beginning of the process and
evaluate the result of the process when used at its end.
URENIO Research Unit offers benchmarking in this form online at
http://www.urenio.org/benchmark/index.asp.
8.2 Business Process Reengineering
Business Process Reengineering or Redesign (BPR) is a method of finding the optimum processes
or tasks that result in cost cutting, efficiency and productivity optimization and better work -
business performing. Companies on the brink of disaster to cut costs and return to profitability
often use it. Also it can be used to optimize resources in complex projects so that efficiency is
optimized.
BPR must be accompanied by strategic planning, must be "owned" throughout the organization,
must include the IT section of a business, must be sponsored by top executives, must have projects
with strict timetables of the range of six months and must not ignore corporate culture and
emphasize constant communication and feedback.
It can be applied to literally all sections or departments of a business: from human resources to
research and development, from marketing to sales and from production to quality control.
8.2.1 Business Process Reengineering Methodology
There is a 5-step general methodology for BPR. This is described bellow.
Development of business vision and process objectives: BPR is driven by a business
vision, which implies specific business objectives such as cost reduction, time reduction and
output quality improvement.
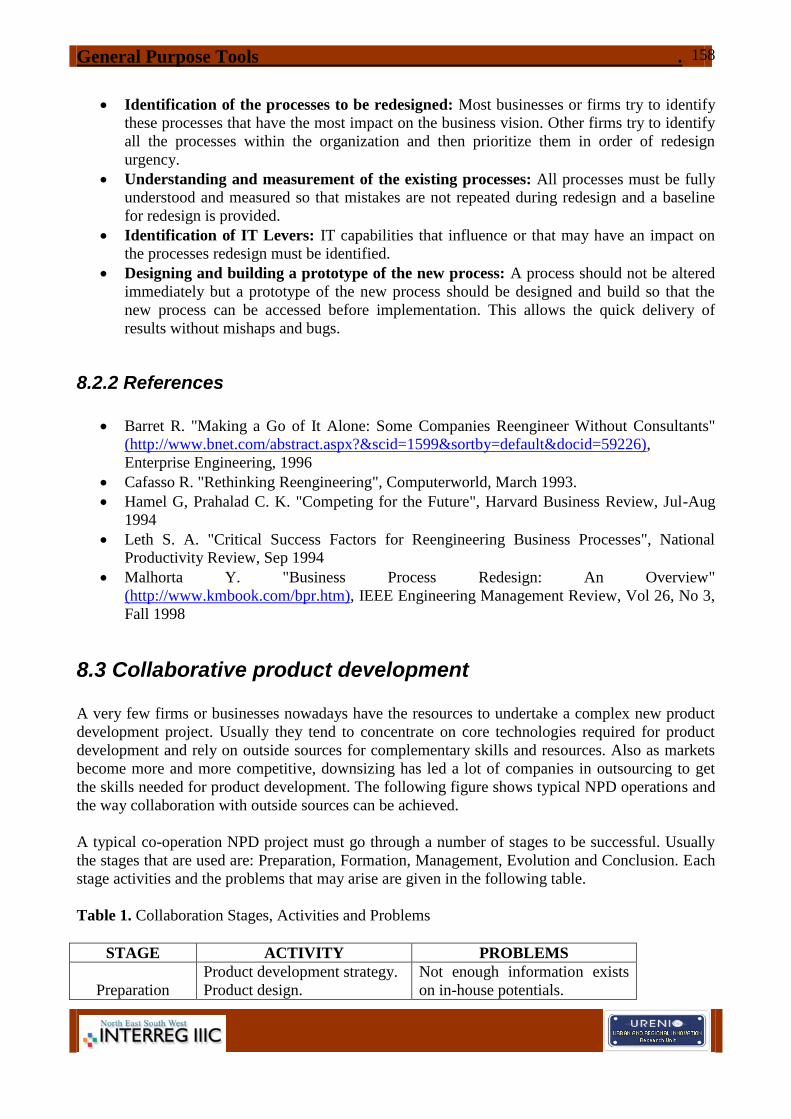
General Purpose Tools .
158
Identification of the processes to be redesigned: Most businesses or firms try to identify
these processes that have the most impact on the business vision. Other firms try to identify
all the processes within the organization and then prioritize them in order of redesign
urgency.
Understanding and measurement of the existing processes: All processes must be fully
understood and measured so that mistakes are not repeated during redesign and a baseline
for redesign is provided.
Identification of IT Levers: IT capabilities that influence or that may have an impact on
the processes redesign must be identified.
Designing and building a prototype of the new process: A process should not be altered
immediately but a prototype of the new process should be designed and build so that the
new process can be accessed before implementation. This allows the quick delivery of
results without mishaps and bugs.
8.2.2 References
Barret R. "Making a Go of It Alone: Some Companies Reengineer Without Consultants"
(http://www.bnet.com/abstract.aspx?&scid=1599&sortby=default&docid=59226),
Enterprise Engineering, 1996
Cafasso R. "Rethinking Reengineering", Computerworld, March 1993.
Hamel G, Prahalad C. K. "Competing for the Future", Harvard Business Review, Jul-Aug
1994
Leth S. A. "Critical Success Factors for Reengineering Business Processes", National
Productivity Review, Sep 1994
Malhorta Y. "Business Process Redesign: An Overview"
(http://www.kmbook.com/bpr.htm), IEEE Engineering Management Review, Vol 26, No 3,
Fall 1998
8.3 Collaborative product development
A very few firms or businesses nowadays have the resources to undertake a complex new product
development project. Usually they tend to concentrate on core technologies required for product
development and rely on outside sources for complementary skills and resources. Also as markets
become more and more competitive, downsizing has led a lot of companies in outsourcing to get
the skills needed for product development. The following figure shows typical NPD operations and
the way collaboration with outside sources can be achieved.
A typical co-operation NPD project must go through a number of stages to be successful. Usually
the stages that are used are: Preparation, Formation, Management, Evolution and Conclusion. Each
stage activities and the problems that may arise are given in the following table.
Table 1. Collaboration Stages, Activities and Problems
STAGE ACTIVITY PROBLEMS
Preparation
Product development strategy.
Product design.
Not enough information exists
on in-house potentials.

General Purpose Tools .
159
Deciding what to do in-house.
Identifying partners.
Performing partner selection.
Partner may have a hidden
agenda.
Partner is not fully accessed.
Formation
Setting ground rules.
Agreeing commercial terms.
Setting copyright issues.
Definition of communication
channels.
Overestimating partner’s
capabilities.
Very strict or rigid rules may
slow down partners and the
entire process.
Being too cautious and
mistrustful may have the effect
of not achieving a win-win
solution.
Management
Open and regular
communications.
Identification of risks.
Adequate resources allocation.
Sometimes managers that run
the project are not advised in
forming it so renegotiations are
required.
Incompatible metric systems,
time zones, file formats and
software tools may be a
problem.
Incompatible business practices
and cultural differences may
also be a problem.
Evolution
Adapting to new facts and
problems quickly.
Process required to be resourced
due to partner inability to
achieve goal.
Conclusion
Planning for long-term
production and support.
Learning from any mistakes
that have been made.
Support agreements must be in
place.
Uncertainty over joint assets,
materials or inventory.
Very few small and medium size companies have experience in dealing with collaborative projects.
The table bellow illustrates the levels of collaborative maturity of companies and the problems that
exist in each level for each NPD activity.
8.4 Human Resources Management
In the last decade the human factor and the human resources in general are taking center stage in
the operations of a business or a company. Globalization and the development of new products
demand personnel with new skills and expertise and force companies to adopt flexible methods of
managing this personnel. Especially in R&D environments where there are fast technological
changes and the need for innovation is continuous, Human Resources Management (HRM) is
thought to be a valuable and flexible tool.
Effective HRM requires good knowledge of the external and internal environment it is operated i.e.
the R&D department and the market as a whole and a good understanding of the strategic
orientation of the company (in this case the product concept to be developed). HRM has two

General Purpose Tools .
160
distinctive and separate phases: the strategic planning and the strategy implementation. The effect
of these on the formation of HRM strategies is shown at the figure bellow.
Fig 1. Formation of Human Resources Strategies
Source: Xirotiri - Koufidou S.
HRM Strategies
By interpreting the external and internal environment of a company and with good knowledge of
company goals and mission, Human Resources Management strategies or tasks can be developed
and used to recruit new personnel, to evaluate, motivate and train existing personnel and explore
new management practices and strategies.
The simplest HRM task is recruitment of new personnel. A typical recruitment process has specific
steps as the ones shown in the table bellow.
Table 1: Recruitment Process
1. Job definition as a result of HRM strategy
2. Evaluation and selection of recruitment sources
2.1 External recruitment sources 2.2 Internal recruitment sources
Job announcements in the press Formal job announcement
Personal recommendations Informal job announcement
Universities and educational institutions
Data banks
Institutes of professionals
3. Preparation and job vacancy announcement
4. Candidate selection
5. Hiring
Source: Xirotiri - Koufidou S.
Mission Goals Strategic
selection
Human resources
needs
Analysis of external
environment
Human Resources
policies
Analysis of internal
environment
HR
abilities
Business
effectiveness
HR
activities

General Purpose Tools .
161
Another HRM task is the evaluation, motivation and training of existing or new personnel.
Evaluation of personnel can be done by several ways. Job analysis, successful task or goal
achievement measurement and productivity measurement are some of these ways. Evaluation can
also be done using qualitative, quantitative or absolute standards methods, which require a more in
depth analysis and sometimes, personal interviews. Evaluation results can show how motivated as
well as how well trained an employee is. Also they can show the level of employee commitment
and the need if any for personal achievements award granting.
Finally HRM strategy formation can help explore new ways of operating a business or company
depending on the market situation. Such ways of operations can be downsizing, re-engineering and
Total Quality Management (TQM). Downsizing is the planed reduction of personnel to compact
negative economic and market trends. HRM is the only management tool that can successful
conduct such a process, since downsizing also means the re-arrangement of human resources so
that the company stays competitive and flexible with reduced personnel. Re-engineering requires
the redesign of the company's processes and operations. Again HRM can help, since such a
redesign means the reposition of personnel and their retraining according to their new positions and
tasks. Total quality management is the nothing but an effort to provide better and more quality
products to customers. The business of producing quality products sometimes requires the re-
organization of departments and processes. HRM can help in this case as well, since departments
and processes are nothing without the people that works in them.
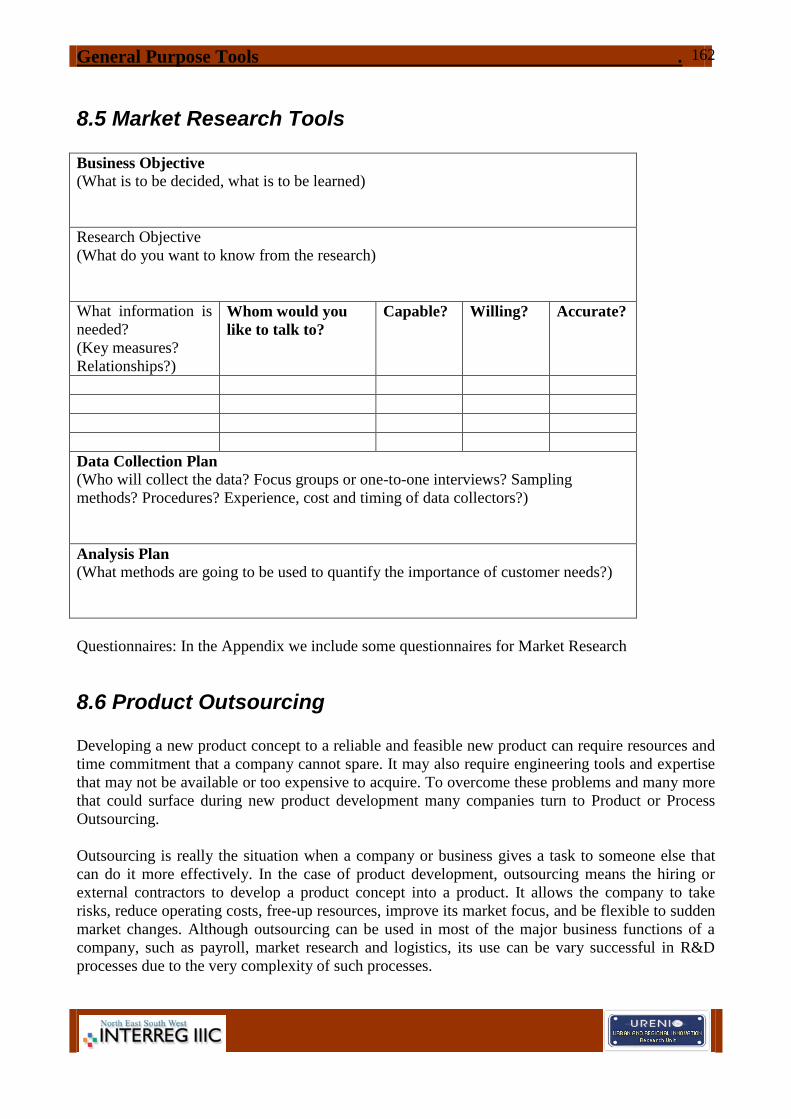
General Purpose Tools .
162
8.5 Market Research Tools
Business Objective
(What is to be decided, what is to be learned)
Research Objective
(What do you want to know from the research)
What information is
needed?
(Key measures?
Relationships?)
Whom would you
like to talk to?
Capable? Willing? Accurate?
Data Collection Plan
(Who will collect the data? Focus groups or one-to-one interviews? Sampling
methods? Procedures? Experience, cost and timing of data collectors?)
Analysis Plan
(What methods are going to be used to quantify the importance of customer needs?)
Questionnaires: In the Appendix we include some questionnaires for Market Research
8.6 Product Outsourcing
Developing a new product concept to a reliable and feasible new product can require resources and
time commitment that a company cannot spare. It may also require engineering tools and expertise
that may not be available or too expensive to acquire. To overcome these problems and many more
that could surface during new product development many companies turn to Product or Process
Outsourcing.
Outsourcing is really the situation when a company or business gives a task to someone else that
can do it more effectively. In the case of product development, outsourcing means the hiring or
external contractors to develop a product concept into a product. It allows the company to take
risks, reduce operating costs, free-up resources, improve its market focus, and be flexible to sudden
market changes. Although outsourcing can be used in most of the major business functions of a
company, such as payroll, market research and logistics, its use can be vary successful in R&D
processes due to the very complexity of such processes.

General Purpose Tools .
163
Outsourcing must be careful designed, the outsourcer - company relationship must be very well
managed and the outsourcing results must be thoroughly benchmarked. Also the outsourcing
process must be assessed beforehand so that one would not embark in a process that it is not useful.
Table 1: Outsourcing Assessment and Possible Results.
Outsourcing Assessment Assessment Results
Identification of outsourcing costs Pint point unexpected costs that are not
explicitly in the scope of outsourcing
such as personnel related costs, costs of
additional resources and costs due to
confidential information leaks that can
lead in legal liabilities or competitive
disadvantage.
Determination of Service Levels
Agreements (SLA’s)
Determine what is needed and expected
though each stage of the outsourcing
process and set levels of commitment of
the outsourcer.
Flexibility check Determine outsourcer flexibility and
remove inflexible work practices.
Investigation of the form of penalties Pre-set standards that an outsourcer must
uphold and penalties that may imposed to
the outsourcer in the case of no
compliance of those standards.
Source: Australian Quennsland Government
Managing the outsourcing process is a task difficult by itself. The essence of outsourcing is to
transfer the company's focus from managing resources and processes to managing results. So
outsourcing management centers on the management of the outsourcer performance. Careful
contracting, well-defined result benchmarking and quick resolution of disputes can do just this.
Also the creation of a scoreboard of the behaviour of the outsourcer and of the end result may
appear extremely helpful. Such a scoreboard is shown bellow.
Table 2: Possible Outsourcing Scoreboard
Criteria Evaluated Sub Criteria Possible Metrics
Experience Specialized Knowledge
Technology know-how
Communication Presentations Number / Month
Frequent updates Number / Month
Contract uphold On-time delivery % Above time set
Budget keep % Above budget set
Contract terms uphold No of penalties imposed
Efficiency Completion on schedule
Quality end result
Goal achievement
Source: Avlonitis G.

General Purpose Tools .
164
Most companies decide to outsource the development of a product concept or the development of a
part of the product concept, feeling very confident that this action will save them money and time.
The main mistake a company is bound to make is the impression that outsourcing is a good deal
just because the outsourcer's product developing cost is lower than the company's. This can many
times lead to poor quality products and subsequently dissatisfaction and grief. So benchmarking is
required to provide a baseline of costs and service levels. Also benchmarking can be used for
contract refinement and contract negotiations.
What to do and what don't for successful outsourcing
Five do's of successful outsourcing
One must outsource the "bottlenecks", the things that are really keeping the company from
growing profitably.
One must pick great partners, check them out and speak to their customers.
Once outsourcing is done, the outsourcer must be regarded as part of the company and
treated as such.
One must demand excellence, since outsourcing is what the outsourcer does for a living.
Outsourcing might scare employees. One must communicate honestly with them.
Six mistakes in outsourcing
Not really defining the desired results and they could be measured.
Not talking to the outsourcer current and past clients.
Failing to consider long-term relationship dynamics.
Not planning up-front on how the company-outsourcer relationship will end.
Treating the outsourcer as an outsider.
Four inhibitors to outsourcing
Fear of loss of control.
Work viewed as too strategic.
Company's unique culture.
Measuring the value.
References
Australian Queensland Government "Queensland Government Guide to Best Practices in IT
Outsourcing", (Jun 1997).
Avlonitis G. Strategic Industrial Marketing, Stamoulis, 2001.
Bierce & Kenerson "Insights on Effective Outsourcing" (http://www.outsourcing-law.com),
(2000)
Bragg S. M. Outsourcing: A guide to ... Selecting the correct business unit ... Negotiating
contract ... Maintaining control of the process, John Wiley & Sons, Jul. 1998.
Corbett M. F. "A Small Business Guide to Successful Outsourcing"
(http://www.firmbuilder.com), (2001)

General Purpose Tools .
165
Corbett M. F. "Managing the Outsourcing Relationship" (http://www.firmbuilder.com),
(2001)
Drummond G. Ensor J. Strategic Marketing: Planning and Control, Butterworth -
Heinemann, 2001.
Goldafrb S. Heller R. "Outsourcing - Establishing a Winning Approach"
(http://www.qpmg.com), Q/P Management Group Inc
Gonchar A. "The When and Why of Benchmarking" (http://www.outsourcing-journal.com),
Outsourcing Journal, (Dec. 1997)
Greaver M. K. Strategic Outsourcing: A structural Approach to Outsourcing Decision and
Initiative, AMACOM, Feb. 1999
Griffiths D. "The Theory & Practice of Outsourcing" (http://ww.kudos-idd.com), KUDOS
Q/P Management Group Inc "Outsourcing Management" (http://www.qpmg.com)
Samuel P. B. Turning Lead into Gold: The Demystification of Outsourcing, Executive
Excellence, Oct. 2000.
Terdiman R. "Six Tips and Techniques for Managing Outsourcing Deals"
(http://www.gartnerweb.com/public/static/home/home.html), Gartner Group Inc
Wiegler B. A. "Managing Outsourcing Results" (http://www.sourcingintrestes.org),
Sourcing Interests Group
8.7 Portfolio Management
Portfolio management has to do with how a person or a company invests his product development
resources, how project are prioritized and how resources are allocated across development projects.
Portfolio management treats R&D investments much like a manager treats his investments in a
stock market.
There are four goals in portfolio management: maximizing the value of the portfolio, looking for
the right balance of projects, making sure that all the projects are aligned and making sure that one
does not have too many projects for his given resources. There are a number of tools that can help
someone to choose the right portfolio. These can be quantitative, graphical and strategic. Each of
the portfolio goals is analyzed bellow.
Goal 1: Maximizing the value of ones portfolio. The goal in this case is to select a new product
project so that to maximize the sum of commercial worth of all active projects in terms of some
strategic objective. Tools that can be used in this case are:
Net Present Value (NPV). One could calculate the net present value of each project and then
rank all by the outcome of NPV divided to a constrained predetermined value. For example
a predetermined value could be remaining - unspent R&D costs. Projects can be ranked
according to this index until out of resources. This way the value of the portfolio is
maximized for a given limited resource expenditure.
Expected Commercial Value (ECV). This method uses decision tree analysis i.e. breaking
the project into decision stages for example R&D, prototyping, testing, commercialization.
All possible outcomes of the project combined with the probability of each of them
occurring are defined. The resulting ECV is divided by a pre determined constrained
resource as in the case of NPV and projects are ranked according to the resulting index.

General Purpose Tools .
166
Scoring Model. During this method decision makers rate projects according to a number of
questions. Depending on the answers given projects are ranked in a 1 to 5 or 0 to 10 scale.
Addition of these rating makes up the quantified Project Attractiveness Score, which
incorporates strategic, financial and other considerations. The projects are ranked according
to the PAS until resources run out.
Goal 2: Balancing ones portfolio. In this case the goal is to balance all projects according to a set of
parameters. These parameters can be time, risk factors, product types, different markets, project
types etc. The techniques used to achieve this goal are mainly graphical. The most used ones
include bubble diagrams and pie charts.
Goal 3: Portfolio Alignment. Portfolio alignment means that all the projects should be on target in
terms of the strategy and all spending should reflect ones strategic priorities. Several tools have
been designed to align ones portfolio. Such tools are the "Top-down Strategic Buckets", "Top-
down Product Roadmaps" and the "Bottom-up".
Goal 4: Picking the Right Number of Projects. Many companies have too many projects running at
the same time and limited resources. The result is that projects end up in a queue and products
make too much time to reach a market. So an over-riding goal is required so that a balance is
maintained between projects and resources available. This can be done in several ways, some of
which are given bellow.
* Resource limits. Using the tools that are mentioned in the case of the 1st goal one can build a
resource limitation and projects can be ranked until the company is out of resources. The same
occurs if the Bubble Diagrams are used.
Resource Capacity Analysis. In this case one should calculate the resource demand,
prioritize projects from best to worst, and add up the resources required by the R&D
department for all projects. Using then some kind of software toll such as MS Project the
available resources per project per month can be determined. The outcome of this exercise
is the identification of the projects or departmental groups that are hold back due to the lack
of resources.
References
Cooper R G & Edgett S J, "Portfolio Management for New Products", 2nd Edition,
Cambridge, Persus Books, 2001.
Cooper R G & Edgett S J, "Winning at New Products: Accelerating the Process from Idea
to Launch", 3rd Edition, Cambridge, Persus Books, 2001.
Cooper R G, "The Invincible Success Factors in Product Innovation", Journal of Product
Innovation Management, No 16, 115-133, April 1999.
Evans P, "Streamline Formal Portfolio Management", Scrip Magazine, Feb 1996.
Graves S B & Ringuest J L, "Formulating Optimal R&D Portfolios", Research -
Technology Management, 43:3, 2000.
Jackson B, "Decision Methods for Selecting a Portfolio of R&D Projects", Research
Management, 21-26, 1983.
General Purpose Tools .
167
8.8 Supply Chain Management
Supply chain management is a powerful tool that brings together all activities of a company that
bring a product into a market. It contains activities from different departments of a company such
as manufacturing, purchasing and transportation, and links external partners of a company such as
vendors, carriers, distributors and information providers to the company. In the case of product
development process related activities in general; supply chain management can be an even more
powerful tool. Using it correctly the development process can be completed smoothly as key
departmental and external activities can be integrated and used in parallel and in conjunction to one
another.
Supply chain management today focus on inventory management, transportation service
procurement, materials handling, inbound / outbound transportation, warehousing management and
transportation operations management. All of the above are critical factors in the product
development process although sometimes tend to be considered as secondary activities. Future
trends in supply chain management include customer service focus and information technology.
The main goal of supply chain management is to help accomplish corporate strategic objectives
(one of which is NPD) through reducing working capital, taking assets off the balance sheet,
accelerating cash to cash cycles and increasing inventory turns. To make these happen supply chain
management uses the following principles.
Segmentation of customers based on service needs.
Customization of the supply chain management network.
Listening to market demand and planning accordingly.
Differentiation of product close to the customer.
Strategic management of supply sources.
Development of a supply chain wide technology strategy.
Adaptation of channel spanning performance measures.
Supply chain management benefits include:
Profitable growth.
Working capital reduction.
Fixed capital efficiency.
Global tax minimization.
Cost minimization.
Source: Zigiaris S.
8.9 The Planning Cycle
The Planning Cycle is a tool that can be used to bring all the aspects of a project into a single
process. The tool can be used for projects up to a certain level of complexity and this makes it very
handy to small or medium size companies that usually undertake simple development projects. For
projects that involve a lot of people over a long period of time other methodologies are necessary.
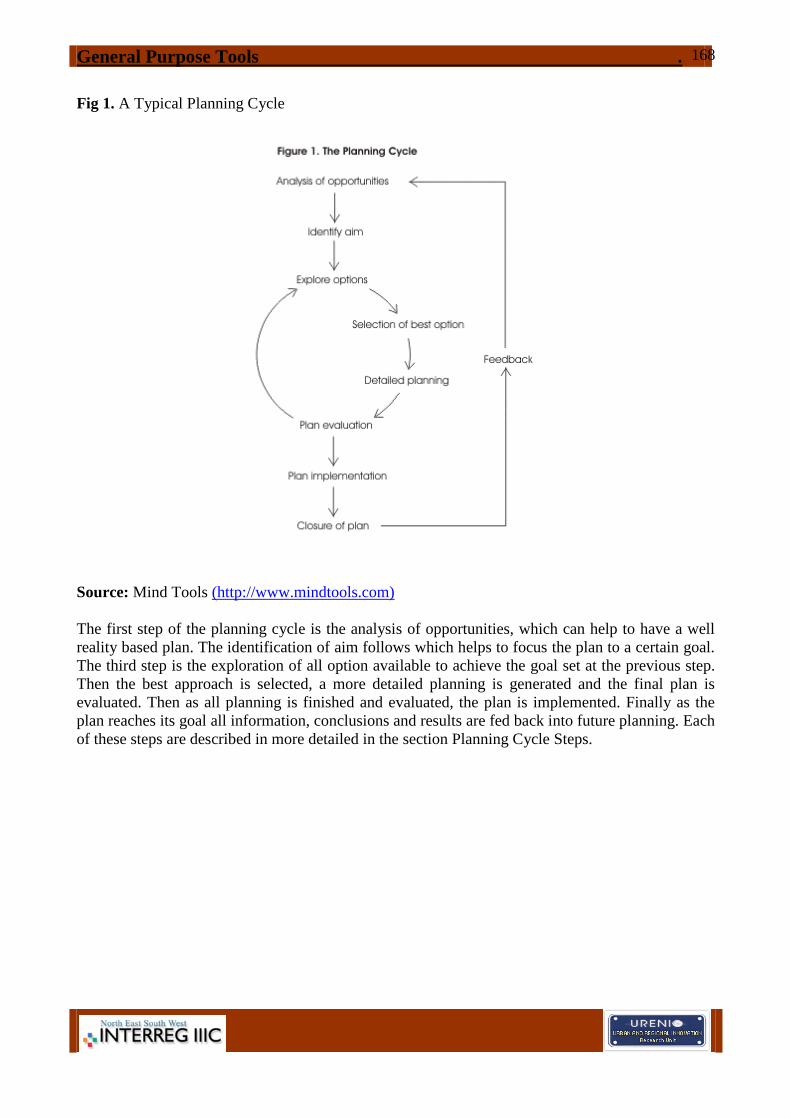
General Purpose Tools .
168
Fig 1. A Typical Planning Cycle
Source: Mind Tools (http://www.mindtools.com)
The first step of the planning cycle is the analysis of opportunities, which can help to have a well
reality based plan. The identification of aim follows which helps to focus the plan to a certain goal.
The third step is the exploration of all option available to achieve the goal set at the previous step.
Then the best approach is selected, a more detailed planning is generated and the final plan is
evaluated. Then as all planning is finished and evaluated, the plan is implemented. Finally as the
plan reaches its goal all information, conclusions and results are fed back into future planning. Each
of these steps are described in more detailed in the section Planning Cycle Steps.

APPENDICES
169
APPENDICES

APPENDICES
170
APPENDIX 1: LEVEL ASSESSMENT FOR NPD STAGE 1: IDEA GENERATION
Assessment 1 evaluates the ideas generated in Level 1 and the both the way and the tools used for
idea generation.
According to the answers a user gives to the following questions a GO, HOLD or KILL decision is
provided for further progression in the roadmap and specifically to Level 2.
Methods used for idea generation
Tick all that applies
a. Conjoint analysis
b. Delphi technique
c. Competitive intelligence analysis
d. Brainstorming (Group or individual)
e. Morphological charts
f. Six thinking hats technique
g. Triz
h. None of the above
Please state method if option (h) is selected in the above question
Ideas generated are
Tick all that applies
a. Less than 10
b. Less than 25
c. Less than 50
d. Less than 100
e. None
Ideas generated information (general)
Ideas generated have (rated description)
Ideas generated are possibly (feasibility)
They have
Ideas Documentation
Ideas generated information (specific)
Their description contains a possible target market
Yes
No
Ideas are based on a competitive product or an existing product Yes
No
Idea description contain customer needs Yes
No
The people used in idea generation were
a. Customers - Consumers
b. Employees - Business partners
c. Competitors
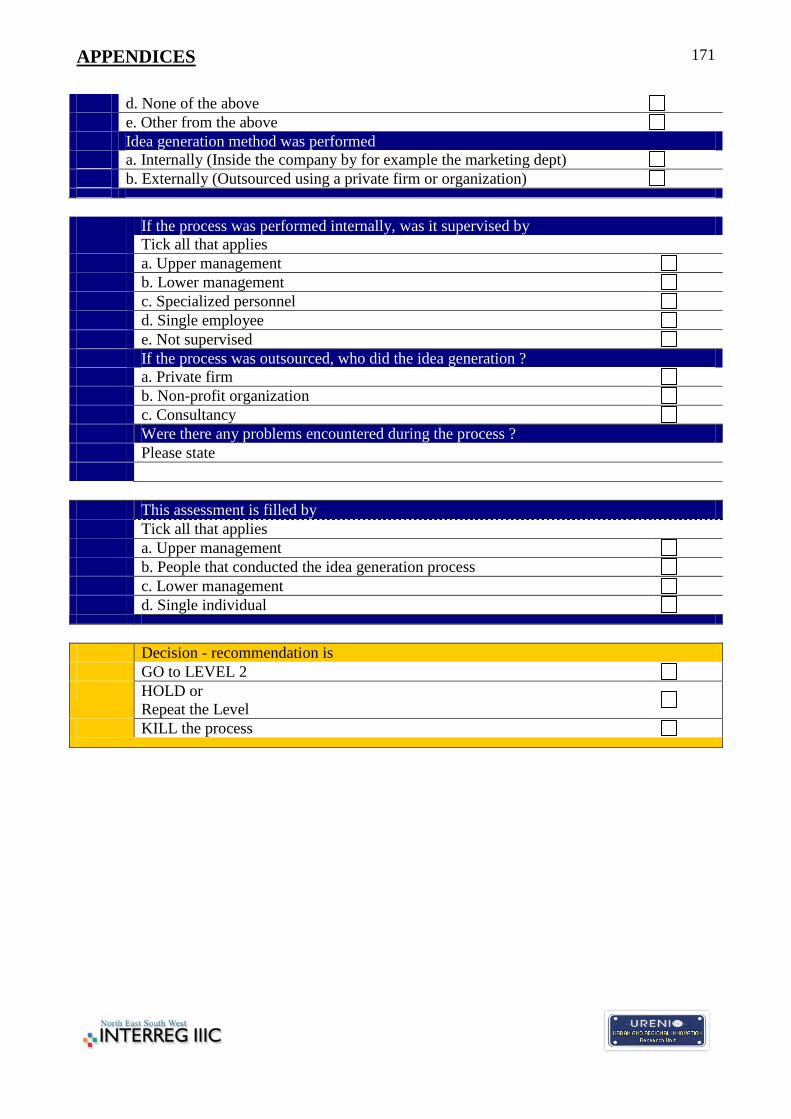
APPENDICES
171
d. None of the above
e. Other from the above
Idea generation method was performed
a. Internally (Inside the company by for example the marketing dept)
b. Externally (Outsourced using a private firm or organization)
If the process was performed internally, was it supervised by
Tick all that applies
a. Upper management
b. Lower management
c. Specialized personnel
d. Single employee
e. Not supervised
If the process was outsourced, who did the idea generation ?
a. Private firm
b. Non-profit organization
c. Consultancy
Were there any problems encountered during the process ?
Please state
This assessment is filled by
Tick all that applies
a. Upper management
b. People that conducted the idea generation process
c. Lower management
d. Single individual
Decision - recommendation is
GO to LEVEL 2
HOLD or
Repeat the Level
KILL the process

APPENDICES
172
APPENDIX 2: LEVEL ASSESSMENT FOR NPD STAGE 2: IDEA SCREENING
Assessment 2 evaluates the way the generated ideas of Level 1were screened so that a single idea is
produced for further development. As in Assessment 1 a GO, Hold or KILL decision is issued for
proceeding to the next level depending on the given answers to the following questions.
Idea screening was done against
Tick all that applies
a. Company's marketing strategies
b. Company sales and profitability minimums
c. Key customers and buyers
d. None
Tools that were used for screening were
Tick all that applies
a. Dot sticking technique
b. Failure mode and effects analysis
c. PMI analysis
d. Qualitative research
e. SWOT analysis
f. Roadmap provided screening tool
g. None
Please give a YES or NO answer to the following questions
Was there an idea selected for further development?
Yes
No
According to the SWOT analysis are the strengths more than the others? Yes
No
If qualitative research was used, were there any specific focus groups in
the research? Yes
No
If PMI analysis was used, was the number of pluses more than the
minuses? Yes
No
Was the FMEA worksheet used in the FMEA analysis? Yes
No
Decision - recommendation is
GO to LEVEL 3
HOLD or
Repeat the Level
KILL the process

APPENDICES
173
APPENDIX 3: LEVEL ASSESSMENT FOR NPD STAGE 3: CONCEPT DEVELOPMENT
Assessment 3 evaluates the way the selected product idea of Level 3 was turned into a product
concept so that a new product is produced for further development and how this concept was
evaluated. As in Assessment 2 a GO, Hold or KILL decision is issued for proceeding to the next
level depending on the given answers to the following questions.
Tools that were used for concept development
Tick all that applies
a. Controlled convergence technique
b. Force field analysis
c. New technology commercialization technique
d. QuickTime workshop technique
e. Relevancy concepting technique
f. Risk management and analysis
g. None
Tools that were used for concept evaluation
Tick all that applies
a. Communications check technique
b. Decision tree analysis
c. Kano model technique
d. Quality functional deployment
e. Quantitative technique
f. Weighting and rating technique
e. None
Please give a YES or NO answer to the following questions
Was there a product concept developed based on the idea? Yes
No
Has the concept consumer appeal? Yes
No
Has the concept competitive advantage?
(Based on the competitive intelligence analysis of Level 1) Yes
No
Is there a clear and viable market position for the product? Yes
No
Is the concept development technical feasible? Yes
No
Does the concept has international appeal? Yes
No

APPENDICES
174
Is the market big enough for enough sales and hence profits? Yes
No
Are there any known killer variables that might crop up during
development? Yes
No
Does the concept fit into the strategic planning of the company? Yes
No
Is the concept complex and hence its development? Yes
No
Does the concept offer value for money to a potential customer? Yes
No
Decision - recommendation is
GO to LEVEL 4
HOLD or
Repeat the Level
KILL the process

APPENDICES
175
APPENDIX 4: LEVEL ASSESSMENT FOR NPD STAGE 4: BUSINESS ANALYSIS
Assessment 4 evaluates the way or ways of financing the development of the selected concept into
a new product and the way the whole project is scheduled in respect to time limitations and how the
required resources are located, used or reallocated to fit the project needs. As in Assessment 3 a
GO, Hold or KILL decision is issued for proceeding to the next level depending on the given
answers to the following questions.
Tools that were used for project management
Tick all that applies
a. Cost benefit analysis
b. Gannt charts
c. Critical path analysis & PERT
d. Stakeholder analysis
e. None
Project financing
Tick all that applies
a. Were there adequate funds available for the development?
b. Was the funding external?
c. Was there any use of the BIC (Business and Innovation Centers)?
d. Was there any use of the EIC (Euro Info Centers)?
e. If CBA was used were the benefits more than the costs?
Project scheduling and life cycle issues
Was there a product life cycle evaluation performed that included
development times as well?
Yes
No
According to Gantt charts (if any), were all the tasks scheduled? Yes
No
According to the critical path analysis (if any) were the tasks times
evaluated? Yes
No
If critical path analysis was used were any potential delays identified so
that resources can be easily relocated? Yes
No
Project support issues
If a stakeholder analysis was performed, will the project have the
necessary support? Yes
No
If the necessary support is lacking, did the analysis reveal ways of
motivating such support? Yes
No

APPENDICES
176
Decision - recommendation is
GO to LEVEL 5
HOLD or
Repeat the Level
KILL the process

APPENDICES
177
APPENDIX 5: LEVEL ASSESSMENT FOR NPD STAGE 5: PRODUCT TESTING
Assessment 5 evaluates the way a product prototype is build and how that prototype is tested in
respect to its functionality and market requirements as set in previous levels of the NPD Roadmap.
Also ways of testing the development process are looked into and the results of such tests are
evaluated. Once again at the end of the assessment a Go, Kill or Hold recommendation is given to
proceed into Level 6 of the Roadmap.
Product prototyping construction
Was there a product prototype build? Yes
No
Were there rapid prototyping methods used? Yes
No
Did the prototype undergo extensive testing? Yes
No
Was the prototype developed adequate according to
a. Customer expressed needs Yes
No
b. Company strategic planning Yes
No
c. CBA analysis Yes
No
d. Competitive analysis Yes
No
e. Product concept specifications Yes
No
Specific prototype tests that were carried out
Tick all that applies
a. Alpha tests
b. Beta tests
c. Functionality tests
d. Usability tests
e. End-to-end tests
f. System tests

APPENDICES
178
g. Customer tests
h. Market tests
Product development tests
a. At this time were there any other tests carried out such as product
development tests? Yes
No
b. Were there any product development tests scheduled to be carried out
in the future during the next Levels of development? Yes
No
Product development tests carried out or to be carried out
Tick all that applies
a. Assessment tests
b. Validation tests
c. Comparison tests
d. Exploratory tests
e. ISO 9000 tests
f. None of the above
Decision - recommendation is
GO to LEVEL 6
HOLD or
Repeat the Level
KILL the process
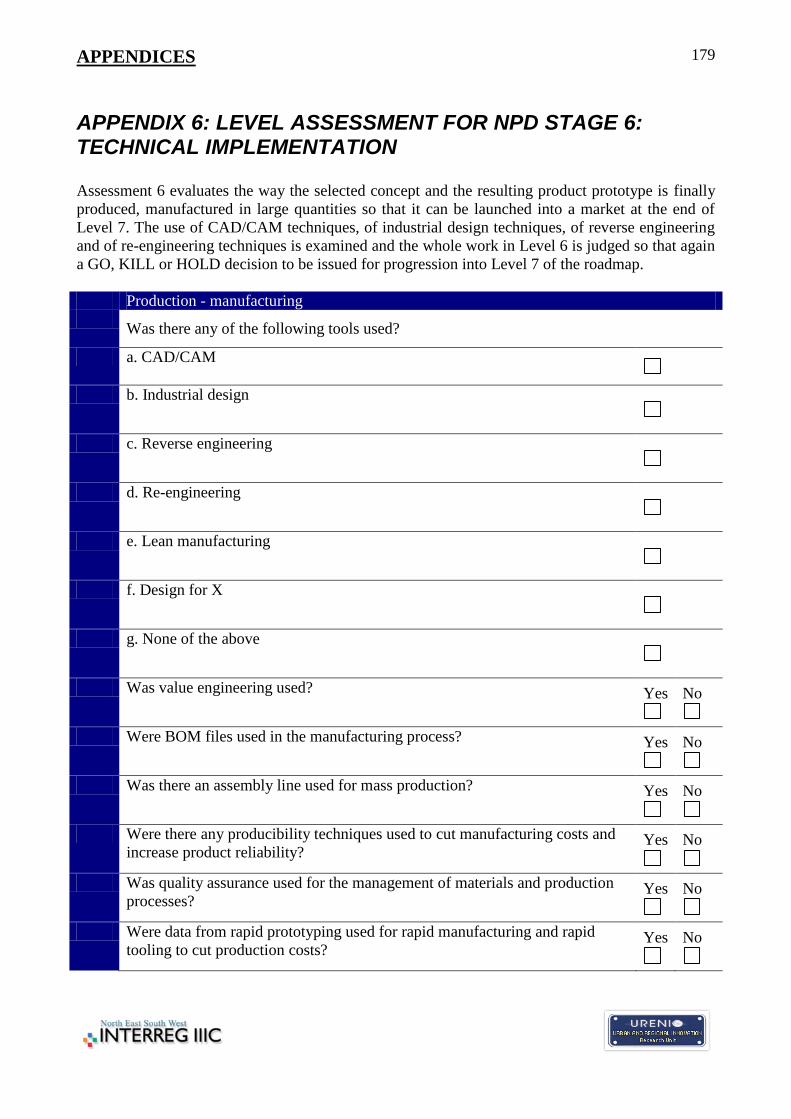
APPENDICES
179
APPENDIX 6: LEVEL ASSESSMENT FOR NPD STAGE 6: TECHNICAL IMPLEMENTATION
Assessment 6 evaluates the way the selected concept and the resulting product prototype is finally
produced, manufactured in large quantities so that it can be launched into a market at the end of
Level 7. The use of CAD/CAM techniques, of industrial design techniques, of reverse engineering
and of re-engineering techniques is examined and the whole work in Level 6 is judged so that again
a GO, KILL or HOLD decision to be issued for progression into Level 7 of the roadmap.
Production - manufacturing
Was there any of the following tools used?
a. CAD/CAM
b. Industrial design
c. Reverse engineering
d. Re-engineering
e. Lean manufacturing
f. Design for X
g. None of the above
Was value engineering used? Yes
No
Were BOM files used in the manufacturing process? Yes
No
Was there an assembly line used for mass production? Yes
No
Were there any producibility techniques used to cut manufacturing costs and
increase product reliability? Yes
No
Was quality assurance used for the management of materials and production
processes? Yes
No
Were data from rapid prototyping used for rapid manufacturing and rapid
tooling to cut production costs? Yes
No

APPENDICES
180
Were there any other techniques or methods used to make the manufacturing
process easier and more reliable? Yes
No

APPENDICES
181
Decision - recommendation is
GO to LEVEL 7
HOLD or
Repeat the Level
KILL the process

APPENDICES
182
APPENDIX 7: LEVEL ASSESSMENT FOR NPD STAGE 7: COMMERCIALISATION
Assessment 7, which is the last assessment before the product is launched into a market, evaluates
the marketing aspects of product launch. Although the assessment is not obligatory since the
product is already by now produced and market insertion is one way or the other imminent, it is
advisable to be considered so that the product is as much successful as possible and maximum
returns of investment and profits are achieved. Also the detail of the assessment questioning is low
since the assessment is only for advisory purposes and serves the role of a checklist.
Issues considered
Tick all that applies
a. Distribution
b. Pricing
c. Promotion
Distribution issues
Was there a distribution strategy developed? Yes
No
Were the distribution channels selected and agreed upon? Yes
No
Pricing issues
Was there a pricing strategy developed? Yes
No
Tick the pricing methods that were used
a. Competitor indexing
b. Cost plus pricing
c. Price skimming
d. Target rate of return pricing

APPENDICES
183
e. None of the above
Promotion issues
Tick all the promotion activities that were carried out
a. Advertising
b. Personal selling
c. Publicity and public relations
d. Sales promotion
e. None of the above
f. Other
Decision - recommendation is
LAUNCH THE PRODUCT
HOLD or
Repeat the Level

APPENDICES
184
APPENDIX 8: Questionnaires for Market Research
Questionnaire 1: Consumer Satisfaction (How satisfied are customers from a Generic
Product)
Q1. When did you last buy Generic Product?
In the past month
2-3 months ago
4-6 months ago
7-12 months ago
1-2 years ago
More than 2 years ago
Q2. Whereabouts do you buy Generic Product?
Outlet 1
Outlet 2
Outlet 3
Outlet 4
Outlet 5
Outlet 6
Other (PLEASE WRITE IN)_________
Q3. How satisfied are you overall with Primary Brand of the Generic Product?
Very satisfied
Quite satisfied
Neither satisfied nor dissatisfied
Quite dissatisfied
Very dissatisfied
Q4. How satisfied are you with the Value for Money of Primary Brand?
Very satisfied
Quite satisfied
Neither satisfied nor dissatisfied
Quite dissatisfied
Very dissatisfied
Q5. How satisfied are you with the Service and Delivery of Primary Brand?
Very satisfied
Quite satisfied
Neither satisfied nor dissatisfied
Quite dissatisfied
Very dissatisfied
Q6. How satisfied are you with the After-Sales Support of Primary Brand?
Very satisfied
Quite satisfied
Neither satisfied nor dissatisfied
Quite dissatisfied

APPENDICES
185
Very dissatisfied
Q7. How satisfied are you with the Design and Durability of Primary Brand?
Very satisfied
Quite satisfied
Neither satisfied nor dissatisfied
Quite dissatisfied
Very dissatisfied
Q8. How satisfied are you with the Quality of Primary Brand?
Very satisfied
Quite satisfied
Neither satisfied nor dissatisfied
Quite dissatisfied
Very dissatisfied
Q9. How satisfied are you with the Ease of use of Primary Brand?
Very satisfied
Quite satisfied
Neither satisfied nor dissatisfied
Quite dissatisfied
Very dissatisfied
Q10. How would you rate Primary Brand compared to Competitive Brand overall?
Primary Brand is a lot better
Primary Brand is a little better
They are about the same
Competitive Brand is a little better
Competitive Brand is a lot better
Q11. How would you rate Primary Brand compared to Competitive Brand on Value for money?
Primary Brand is a lot better
Primary Brand is a little better
They are about the same
Competitive Brand is a little better
Competitive Brand is a lot better
Q12. How would you rate Primary Brand compared to Competitive Brand on Service and
Delivery?
Primary Brand is a lot better
Primary Brand is a little better
They are about the same
Competitive Brand is a little better
Competitive Brand is a lot better
Q13. How would you rate Primary Brand compared to Competitive Brand on After sales support?
Primary Brand is a lot better
Primary Brand is a little better
They are about the same

APPENDICES
186
Competitive Brand is a little better
Competitive Brand is a lot better
Q14. How would you rate Primary Brand compared to Competitive Brand on Design and
Durability?
Primary Brand is a lot better
Primary Brand is a little better
They are about the same
Competitive Brand is a little better
Competitive Brand is a lot better
Q15. How would you rate Primary Brand compared to Competitive Brand on Quality?
Primary Brand is a lot better
Primary Brand is a little better
They are about the same
Competitive Brand is a little better
Competitive Brand is a lot better
Q16. How would you rate Primary Brand compared to Competitive Brand on Ease of use?
Primary Brand is a lot better
Primary Brand is a little better
They are about the same
Competitive Brand is a little better
Competitive Brand is a lot better
We would like to know a little more about you to help us understand how different people
like different products and services
Q17. Are you...?
Male
Female
Q18. How old are you?
15-19
20-24
25-34
35-44
45-54
55-64
65+
Q19. Which of these best describes your job?
Managerial
Professional
Clerical
Skilled Trades
Manual worker
Student
Retired

APPENDICES
187
Unemployed
Home maker
Other PLEASE WRITE IN ______
Q20. Which of these best describes you
Married/Living with partner
Single/Widowed/Divorced
Q21. Which of these best describes your home?
Owned
Privately rented
Share parent/relative's home

APPENDICES
188
Questionnaire 2: Usage and Attributes (Understand how a Generic Product is used and how)
Q1 When did you last buy Generic Product?
In the past month
2-3 months ago
4-6 months ago
7-12 months ago
1-2 years ago
More than 2 years ago
Q2 Which is your favourite Generic Product?
Primary Brand of Generic Product
Competitive Product 1
Competitive Product 2
Competitive Product 3
Competitive Product 4
Competitive Product 5
Competitive Product 6
Other (PLEASE WRITE IN)_______
Q3 Whereabouts do you buy Generic Product?
Outlet 1
Outlet 2
Outlet 3
Outlet 4
Outlet 5
Outlet 6
Other (PLEASE WRITE IN)_________
Q4 Why is that?
__________________
__________________
Q5 How do you find out information about Generic Product?
TV
Radio
General newspapers or magazines
Specialist magazines
Direct mail
Leaflets
In my local outlet
From friends or colleagues
From sales reps
From special exhibitions or seminars
Other (PLEASE WRITE IN)______
None of these
Q6 How would you rate the Primary Brand of Generic Product compared to Competitive
Product 1 overall?

APPENDICES
189
Primary Brand of Generic Product is a lot better
Primary Brand of Generic Product is a little better
They are about the same
Competitive Product 1 is a little better
Competitive Product 1 is a lot better
Q7 How would you rate the Primary Brand of Generic Product compared to Competitive
Product 1 on Quality?
Primary Brand of Generic Product is a lot better
Primary Brand of Generic Product is a little better
They are about the same
Competitive Product 1 is a little better
Competitive Product 1 is a lot better
Q8 How would you rate the Primary Brand of Generic Product compared to Competitive
Product 1 on Ease of Use?
Primary Brand of Generic Product is a lot better
Primary Brand of Generic Product is a little better
They are about the same
Competitive Product 1 is a little better
Competitive Product 1 is a lot better
Q9 How would you rate the Primary Brand of Generic Product compared to Competitive
Product 1 on Value for Money?
Primary Brand of Generic Product is a lot better
Primary Brand of Generic Product is a little better
They are about the same
Competitive Product 1 is a little better
Competitive Product 1 is a lot better
Q10 How would you rate the Primary Brand of Generic Product compared to Competitive
Product 1 on After-Sales Support?
Primary Brand of Generic Product is a lot better
Primary Brand of Generic Product is a little better
They are about the same
Competitive Product 1 is a little better
Competitive Product 1 is a lot better
Q11 How would you rate the Primary Brand of Generic Product compared to Competitive
Product 1 on Service and/or Delivery?
Primary Brand of Generic Product is a lot better
Primary Brand of Generic Product is a little better
They are about the same
Competitive Product 1 is a little better
Competitive Product 1 is a lot better
Q12 How would you rate the Primary Brand of Generic Product compared to Competitive
Product 1 on Design and/or Durability?
Primary Brand of Generic Product is a lot better

APPENDICES
190
Primary Brand of Generic Product is a little better
They are about the same
Competitive Product 1 is a little better
Competitive Product 1 is a lot better
Here are a number of statements that people have made. For each one please say how much
you agree or disagree with the statement.
Q13 I like to have a routine that I stick to
Agree strongly
Agree a little
Neither Agree nor Disagree
Disagree a little
Disagree a lot
Q14 I tend to spend most evenings at home
Agree strongly
Agree a little
Neither Agree nor Disagree
Disagree a little
Disagree a lot
Q15 I like to keep up with new technology
Agree strongly
Agree a little
Neither Agree nor Disagree
Disagree a little
Disagree a lot
Q16 My friends would describe me as someone who likes talking
Agree strongly
Agree a little
Neither Agree nor Disagree
Disagree a little
Disagree a lot
Q17 I often find myself helping in organising clubs or community groups
Agree strongly
Agree a little
Neither Agree nor Disagree
Disagree a little
Disagree a lot
Q18 It's important to me to keep up appearances and to look good
Agree strongly
Agree a little
Neither Agree nor Disagree
Disagree a little
Disagree a lot

APPENDICES
191
We would like to know a little more about you to help us understand how different people
like different products and services
Q19 Which of these television services do you have?
Digital Television
Satellite/Cable Television
Don't have digital or satellite, but have a TV
Don't have a TV
Q20 Do you have access to the Internet at home or at work?
Yes - at home
Yes-at work
Yes-both
No
Q21 Which of the following, if any, have you bought on the Internet?
Computer software
Computer hardware
Books
Music
Travel/Holidays
Food/Groceries
Household appliances
Financial services
Other products
Haven't shopped via Internet
Q22 Are you...?
Male
Female
Q23 How old are you?
15-19
20-24
25-34
35-44
45-54
55-64
65+
Q24 Which of these best describes your job?
Managerial
Professional
Clerical
Skilled Trades
Manual worker
Student
Retired

APPENDICES
192
Unemployed
Other PLEASE WRITE IN ______
Q25 Which of these best describes you
Married/Living with partner
Single/Widowed/Divorced
Q26 Which of these best describes your home?
Owned
Privately rented

APPENDICES
193
Questionnaire 3: Segmentation (Understand how customers are segmented)
Q1 Which is your favourite Generic Product?
Primary Brand of Generic Product
Brand 1
Brand 2
Brand 3
Brand 4
Brand 5
Brand 6
Other (PLEASE WRITE IN)_______
Q2 Whereabouts do you buy Generic Product?
Outlet 1
Outlet 2
Outlet 3
Outlet 4
Outlet 5
Outlet 6
Other (PLEASE WRITE IN)_________
Q3 Why is that?
__________________
__________________
Q4 How do you find out information about Generic Product?
TV
Radio
General newspapers or magazines
Specialist magazines
Direct mail
Leaflets
In my local outlet
From friends or colleagues
From sales reps
From special exhibitions or seminars
Other (PLEASE WRITE IN)______
None of these
Here are a number of statements that people have made. For each one please say how much
you agree or disagree with the statement.
Q5 I like to have a routine that I stick to
Agree strongly
Agree a little
Neither Agree nor Disagree
Disagree a little
Disagree a lot
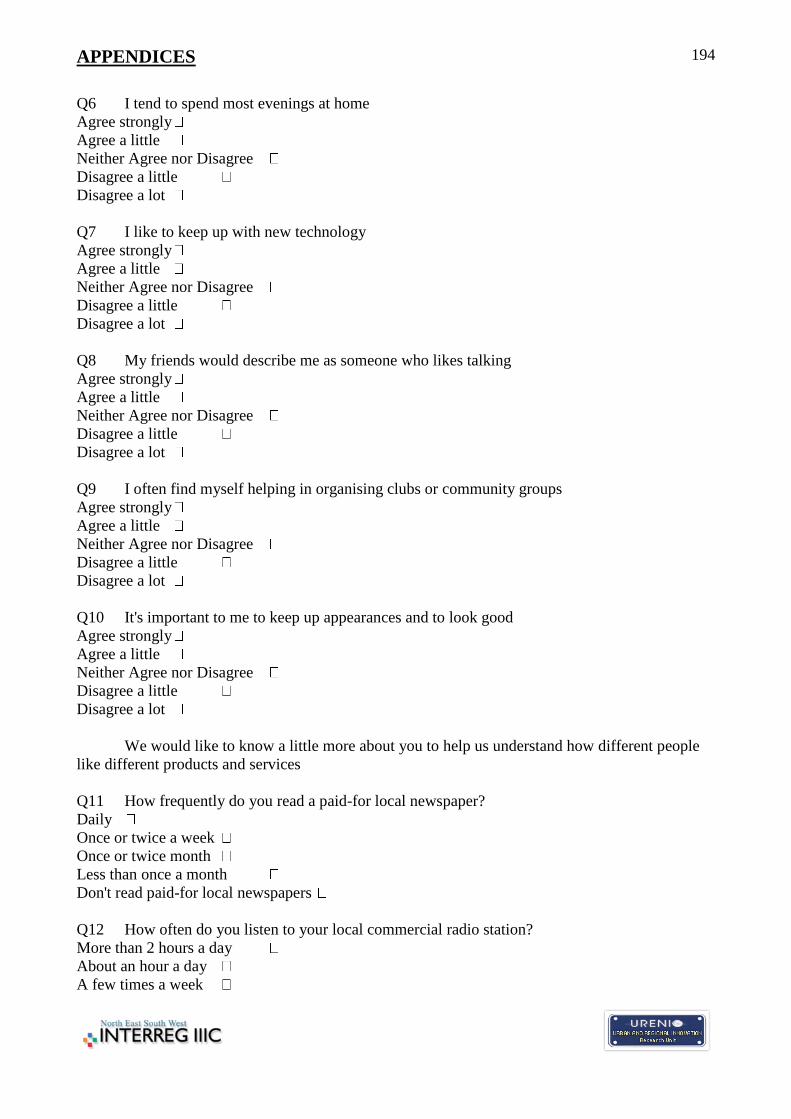
APPENDICES
194
Q6 I tend to spend most evenings at home
Agree strongly
Agree a little
Neither Agree nor Disagree
Disagree a little
Disagree a lot
Q7 I like to keep up with new technology
Agree strongly
Agree a little
Neither Agree nor Disagree
Disagree a little
Disagree a lot
Q8 My friends would describe me as someone who likes talking
Agree strongly
Agree a little
Neither Agree nor Disagree
Disagree a little
Disagree a lot
Q9 I often find myself helping in organising clubs or community groups
Agree strongly
Agree a little
Neither Agree nor Disagree
Disagree a little
Disagree a lot
Q10 It's important to me to keep up appearances and to look good
Agree strongly
Agree a little
Neither Agree nor Disagree
Disagree a little
Disagree a lot
We would like to know a little more about you to help us understand how different people
like different products and services
Q11 How frequently do you read a paid-for local newspaper?
Daily
Once or twice a week
Once or twice month
Less than once a month
Don't read paid-for local newspapers
Q12 How often do you listen to your local commercial radio station?
More than 2 hours a day
About an hour a day
A few times a week

APPENDICES
195
Less than a few times a week
Don't listen to local commercial radio
Q13 Do you have access to the Internet at home or at work?
Yes - at home
Yes-at work
Yes-both
No
Q14 Which of the following, if any, have you bought on the Internet?
Computer software
Computer hardware
Books
Music
Travel/Holidays
Food/Groceries
Household appliances
Financial services
Other products
Haven't shopped via Internet
Q15 Are you...?
Male
Female
Q16 How old are you?
15-19
20-24
25-34
35-44
45-54
55-64
65+
Q17 Which of these best describes your job?
Managerial
Professional
Clerical
Skilled Trades
Manual worker
Student
Retired
Unemployed
Other PLEASE WRITE IN ______
Q18 Which of these best describes you
Married/Living with partner
Single/Widowed/Divorced

APPENDICES
196
Q19 Which of these best describes your home?
Owned
Privately rented
Share parent/relative's home