product market competition and corporate social...
TRANSCRIPT
1
PRODUCT MARKET COMPETITION
AND CORPORATE SOCIAL RESPONSIBILITY
Marion Dupire Declerck1
Bouchra M'Zali2
This draft: September 14, 2012
Abstract
We investigate the link between industry competitiveness and corporate social
performance. Fernandez and Santalo (2010) show that firms in more competitive environments
have better social ratings, consistent with the strategic purpose of social initiatives. We show
that competition alone is not a sufficient mechanism to improve all dimensions of corporate
social responsibility. Using the Hoberg and Phillips' fitted HHI as a proxy for competition, our
results suggest that competitive pressure, on average, leads to an increase in social strengths but
not necessarily to a decrease in social concerns (1). We do find a positive association between
overall social performance and product market competition but this relationship does not hold
with all dimensions of social responsibility. More specifically, the positive impact of competition
is significant for both shareholder- and employee-related social actions (corporate governance,
diversity, employee relations, human rights) but is not verified for actions affecting other
stakeholders (community, environment) (2). In more competitive environments, product quality
and safety concerns are decreased, but product strengths are not significantly increased (3).
Interestingly, concerns with alcohol, gambling and tobacco do not appear to be affected by
competition whereas involvement in firearms, military and nuclear power is reduced under
competitive pressure (4).
1 Université Lille Nord de France, [email protected] 2 Université du Québec à Montréal (UQAM), [email protected]
2
1. Introduction
Corporate social responsibility (CSR) is one of the most important corporate trends of
the last decade. Microsoft, Chevron, Pepsico, Nike and many other companies are now publishing
sustainability, environmental or citizenship reports, beside their usual annual report. In parallel,
America's economy is recognized as being "the world's most competitive market society" (Sachs,
2011). A positive relationship between market competition and firms' social performance has
been raised in recent empirical research (Fernandez and Santalo, 2010). This suggests a
strategic rather than altruistic purpose of corporate social initiatives. In this paper, we provide a
further investigation of the link between competition and social actions based on alternative
measurement of product market competition and detailed measures of the different dimensions
of corporate social responsibility.
Existing literature has emphasized the strategic nature of corporate social responsibility.
What is referred to as corporate social responsibility actually includes many different
dimensions that should be studied as different constructs. Prior research has shown that a lack
of social strengths is not systematically associated to more social concerns and vice versa
(Mattingly and Berman, 2006), it has even been shown that negative social action is positively
related to positive social action: firms invest in social initiatives in order to offset their negative
social impact (Kotchen and Moon, 2011). In this perspective, studying the different dimensions
of CSR independently does make sense.
While confirming the positive association of CSR to product market competition, our
study provides additional insights on how the different dimensions of social responsibility are
affected by competition and which of these dimensions are more or less likely to be used as part
of a competitive strategy. Our results can be summarized in four axes. -1- A more intense
competitive pressure leads to more social strengths but not necessarily less social concerns; -2-
the positive association of social performance to competition does not hold for all dimensions of
social responsibility: it is verified for shareholder- and employee-related social initiatives,
namely corporate governance, diversity, employee relations and human of rights, but not
significantly for actions affecting other stakeholders like customers, suppliers and community
(generous giving, environment, product quality strengths); -3- product quality and safety
concerns decrease under the competitive pressure but product strengths are not significantly
increased; -4- concerns with alcohol, gambling and tobacco are not significantly related to
competitive intensity, whereas involvement in firearms, military and nuclear power is
significantly lower in more competitive environments. Overall, these results indicate that
competition alone is not a sufficient mechanism to maintain or improve every dimension of
social welfare.
To the best of our knowledge, this is the first study that offers an in depth investigation
of the effect of competition on the different dimensions of CSR. Another contribution lies into the
measurement of product market competition, based on a recently developed measure of market
concentration that accounts for all public and private firms, on a yearly basis and on all
industries beside the manufacturing ones.
This study may be of particular interest for investors and regulators who are concerned
by the implicit "social contract" between business and society. Investing in socially responsible
organizations requires to understand the underlying dynamics that prompt firms to engage in

3
social actions. Understanding which responsible actions are initiated under external constraints
such as competitive pressure is a first step to the design of appropriate incentives that would
lead to improved social welfare.
The paper is organized as followed. The first section reviews the existing literature
related to the definition of CSR, its purpose and its link to product market competition. The
second section provides details about data and methodology. The third section describes the
sample. The fourth section presents the results and the last part concludes.
2. Literature Review
Prior literature has defined corporate social responsibility as a set of policies, programs
and other observable initiatives toward a firm's societal relationships (communities,
environment, employees) that go beyond what is required by law (McWilliams and Siegel, 2001;
McWilliams et al., 2006; Siegel and Vitaliano, 2007). It is sometimes referred to as a component
of an implicit "social contract" between business and society with mutual gains for both sides
(Baron, 2001; Davis, 2005).
Corporate social responsibility can be motivated by different purposes. It can either be
used in a moral perspective, in response to a threat from government and activists, by managers
as a way to improve their private reputation or as a competitive strategy. Under the first motive,
firms altruistically sacrifice profits for social interest (Elhauge, 2005). The second motive has
been put forward by Baron (2001), Heal (2005) and Kotchen & Moon (2011). Social actions may
be initiated in anticipation of social pressure, in order to avoid external conflicts. Thirdly, the
decision to engage in social actions may be taken by managers who want to extract private
reputational benefits. In that case, these decisions may represent agency costs for shareholders
(Barnea and Rubin, 2010). Under the strategic view of CSR, firms "do well by doing good" and
engage in profit-maximizing social actions. This latter view has been the most emphasized in the
recent literature (Baron, 2001; McWilliams and Siegel, 2001; Bagnoli and Watts, 2003; Fisman et
al., 2005; McWilliams et al., 2006; Siegel & Vitaliano, 2007). In this perspective, a significant
effort has been devoted to the study of whether financial performance is indeed positively
associated to social performance. The corresponding literature found mixed results but a
majority of studies confirms the superior financial performance of socially responsible
corporations (see Margolis and Walsh, 2003 for a complete literature review on this
relationship).
Under the strategic-CSR view, firms in more competitive environment have more
incentives to invest in social actions. The theoretical literature has argued that product market
competition and social performance are closely linked with each other: the ethical behavior of
firms enable them to achieve a competitive advantage (Jones 1995), companies compete for
socially responsible customers (Baron 2001). Russo and Fouts (1997) show empirically that
social performance can constitute a source of competitive advantage especially in high growth
industries, Fernandez and Santalo (2010) show that firms in more competitive environments
have better social ratings and present evidence that CSR is at least in part a profit motivated
decision. In contrast, Delios (2010) argues that the nature of industry and institutional
environments harm the competitiveness of organizations that "dare to care", Hillman and Keim
(2001) find evidence that while caring about primary stakeholders such as employees,
4
customers, suppliers and communities can lead to increased shareholder value, social issue
participation reduces shareholder value.
In this paper, we further analyze the relationship between product market competition
and corporate social responsibility by using alternative measures of both industry
competitiveness and social performance.
3. Data and method
3.1. Measuring product market competition
Measuring competitive intensity on the product markets present empirical issues arising
notably from the difficulty to gather information on all firms, including the non listed ones.
Concentration is generally characterized by the Herfindahl-Hirschman Index (HHI),
constructed by adding the squared market shares of all firms operating in an industry for a given
year. The US Census Bureau provides, every five years, the index for all manufacturing
industries, including data on all public and private companies. The Census' HHI is the most
precise existing measure of industry concentration but is limited because of its magnitude (only
manufacturing industries) and frequency (every five years). Compustat data on annual sales
allow to compute an alternative HHI, but the resulting index only includes data on listed
companies. In the financial literature, Ali et al. 2009 showed that given this limitation, the
Compustat-based HHI is a poor proxy for actual industry concentration, with a correlation of
only 13 percent with the corresponding US Census measures. Another issue arises from whether
total sales of diversified firms are included in the measure of industry concentration. If they are
included, the concentration is biased downward, but if they are not, the concentration is biased
upward.
Hoberg and Phillips combined Compustat with Herfindahl data from the Census Bureau
(US Department of Commerce) and employee data from the Bureau of Labor statistics (BLS), and
computed a measure of industry concentration that accounts for all public and private firms on
all industries. The resulting fitted-HHI is made available on the authors' website. This indicator
of industry concentration offers significant improvements to existing Census- and Compustat-
based HHI. First it covers all industries, second it over performs Compustat-based concentration
measure. Hoberg and Phillips (2010b) indeed show that the correlation with Census' HHI is
54.2% for the fitted-HHI. The fitted-HHI is computed with a two-step procedure. In a first step,
the authors regress, on a manufacturing subsample, the Census' HHI on: the Compustat's HHI
computed with firm segment tapes, the average number of employees for public firms according
to the BLS, the average number of employees per firm according to Compustat, and interaction
variables of each of these size variables with the Compustat's HHI. In a second step, they use the
coefficient estimates from step 1 and compute a fitted-HHI for all industries.
3.2. Measuring social performance
Prior literature has raised specific issues related to the measurement of social
performance. It turns out that the most widely used database for social ratings is provided by
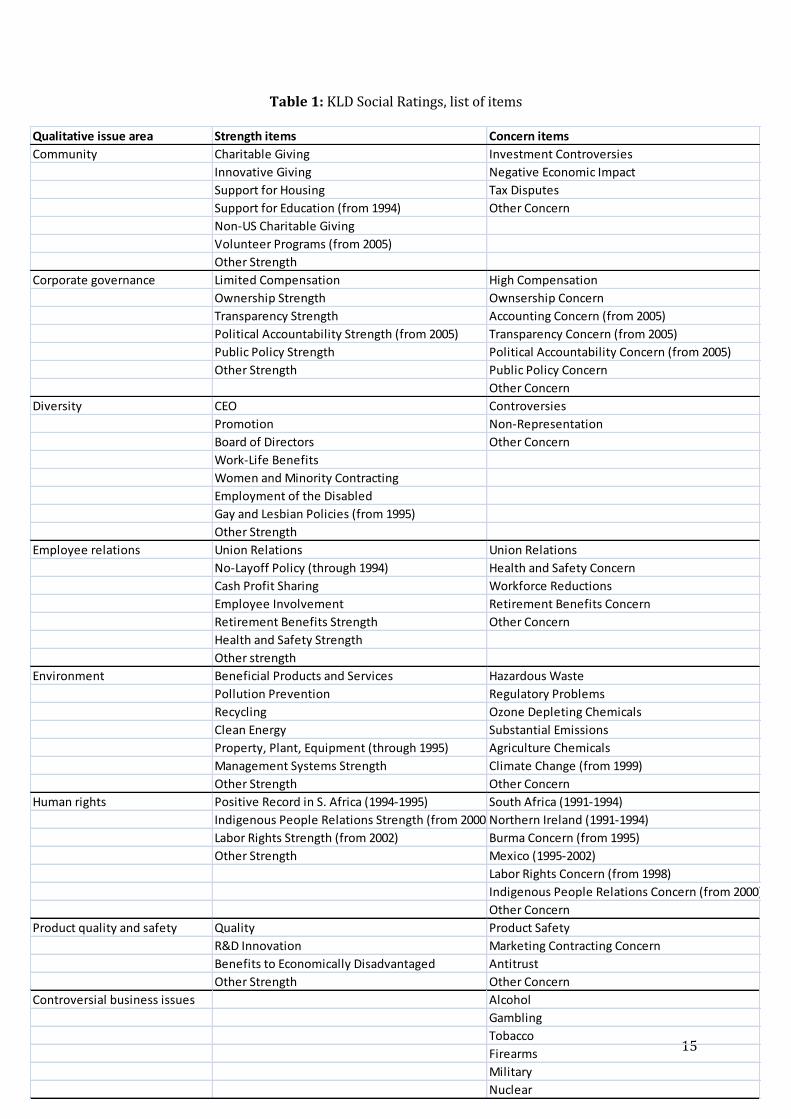
MSCI, formerly KLD Research and Analytics, Inc.. Companies are assessed based on several
dimensions distributed under 12 headings, namely community, corporate governance, diversity,
employee relations, environment, human rights, product, alcohol, firearms, gambling, military,
5
nuclear power, tobacco. Under each heading, strengths and/or concerns are identified and
counted. Each heading contains unequal number of strengths and concerns, and some headings
only include concerns (alcohol, firearms, gambling, military, nuclear power, tobacco). The latter
categories, that only include concerns, are called Controversial Business Issues (CBI).
Insert Table 1
Table 1 provides the list of the qualitative issues under each of the mentioned headings.
The community section records generous giving for charities, innovation, housing, education, as
well as, since 2005, the presence of strong volunteer programs. Until 2002, the respect for the
sovereignty, land, culture, human rights, and intellectual property of indigenous people was
included in this section, it was then moved into the Human Rights area. Involvement in tax
disputes, major controversies on lending or investment practices (for financial institutions), on
the economic impact (environment, quality of life, tax, property values), and other controversies
that have mobilized community opposition are also accounted for.
The corporate governance heading considers top management and board members
remuneration levels, ownership by or of companies rated as having social strengths or concerns,
social, environmental and political transparency, attitude toward public policy issues,
involvement in accounting related controversies and other noteworthy corporate initiatives.
Some of these items were renamed in 2002 or added in 2006 (see table 1).
The diversity area notifies the presence in the company of women, members of minority
groups and disabled, it records outstanding employee benefits (including childcare, elder care,
or flextime), progressive policies toward gay and lesbian employees or other commitment to
diversity as well as involvement in diversity controversies.
Fair treatment of the workforce is assessed in the employee relations' section. It includes
layoff, health, safety and retirement policies, profit-sharing programs, employee involvement in
the financial performance (stock options, gain sharing, stock ownership, sharing financial
information, participation to management decisions) and other major employee relations
initiatives or controversies.
Attitude toward the environment is also examined. The development of products and
services with environmental benefit or harm, pollution prevention programs, the use of
renewable energy and clean fuels, and other noteworthy environmental commitments are taken
into account, as well as waste management, disrespect of environmental regulations, ozone
depleting chemicals manufacturing, toxic chemicals production, impact on climate change and
other environmental controversies.
The human rights section considers social record and controversies in South Africa from
1991 to 1994, relation with indigenous people (added in 2004), labor rights overseas, concerns
for having operations in Northern Ireland, Burma, controversies in Mexico toward employees or
environment, and other human rights commitment or controversies.
The quality and safety of products is also evaluated, by looking at long-term company-
wide programs, research and development, provision of products or services for the
economically disadvantaged, advertising policies, consumer fraud and government contracting,
6
antitrust violations (pricing, collusion), franchises, nuclear safety or other product-related
issues.
Finally, KLD ratings deal with controversial business issues with alcohol, gambling,
tobacco, firearms, military and nuclear power. Licensing the company or brand name to alcohol,
gambling or tobacco products; manufacturing, retailing, having ownership in or supporting
companies related to alcoholic beverages (beer, distilled spirits, or wine) and/or products
necessary for production of alcoholic beverages, goods used for gambling (slot machines,
roulette wheels, lottery terminals), tobacco products (cigarettes, cigars, pipe tobacco, smokeless
tobacco products), small arms ammunition or firearms, weapons or weapons systems or related
components; building, owning or designing nuclear power plants, or providing nuclear power
service are all considered as controversial business issues' concerns.
Further details on how these issues are rated are made available online by KLD Research
& Analytics (now MSCI).
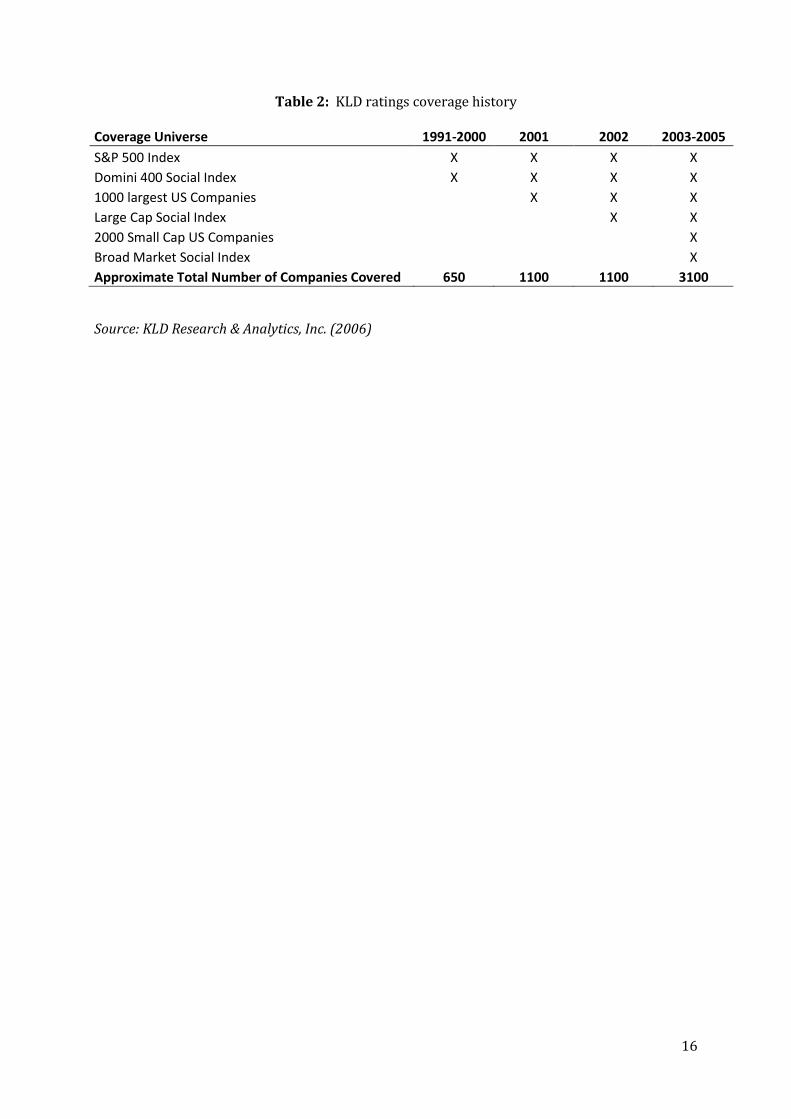
Insert Table 2
Table 2 presents the coverage history of KLD statistics. The coverage has expanded over
time, starting with 650 companies including the Domini 400 Social Index and S&P500 from 1991
to 2001, and recording now 3100 companies by adding US companies in the 1000 largest, Large
Cap Social Index, 2000 Small Cap Social Index and Broad Market Social Index.
The use of aggregate measures of CSR based on KLD data is problematic for two reasons.
First, positive and negative social actions are independent constructs (Mattingly and Berman
2006). Strengths and weaknesses may have contradictory effects on the dependent variable.
Effects associated with positive social actions are different from those associated with negative
social actions. In our case, we might expect that firms engage strategically in social activities
when they face intense competition, this could lead to more social strengths but not necessarily
to the absence of social concern, or vice versa. Second, adding raw KLD scores across domains
overweights some domains and underweights others because the maximum number of
strengths and concerns is not equal across domains (Fernandez and Santalo 2010).
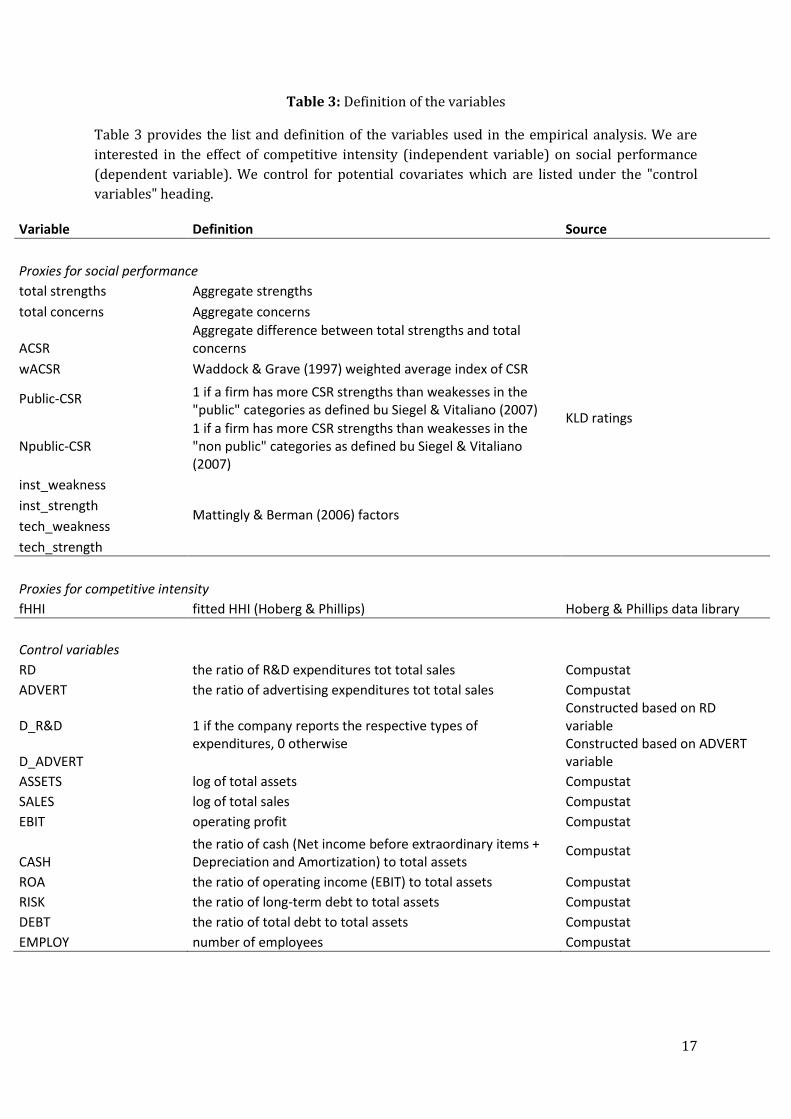
Prior research has designed several alternatives. In our analysis, we will compare the
results that we obtain with both aggregate and disaggregate measures of CSR. The first part of
table 3 lists and defines the variables used as proxies for social performance and the following
paragraph explains how these variables are computed in more details and what each can bring
to the analysis.
Insert Table 3
Aggregate strengths and aggregate concerns can be studied as separate variables as in
Mattingly and Berman (2006) or Fernandez and Santalo (2010). The substraction of total
concerns to total strengths gives the aggregate CSR (ACSR). Waddock and Grave (1997) created
an index based on eight CSP attributes: community relations, employee relations, environment,
product characteristics, women and minorities, military contracting, nuclear power, and human
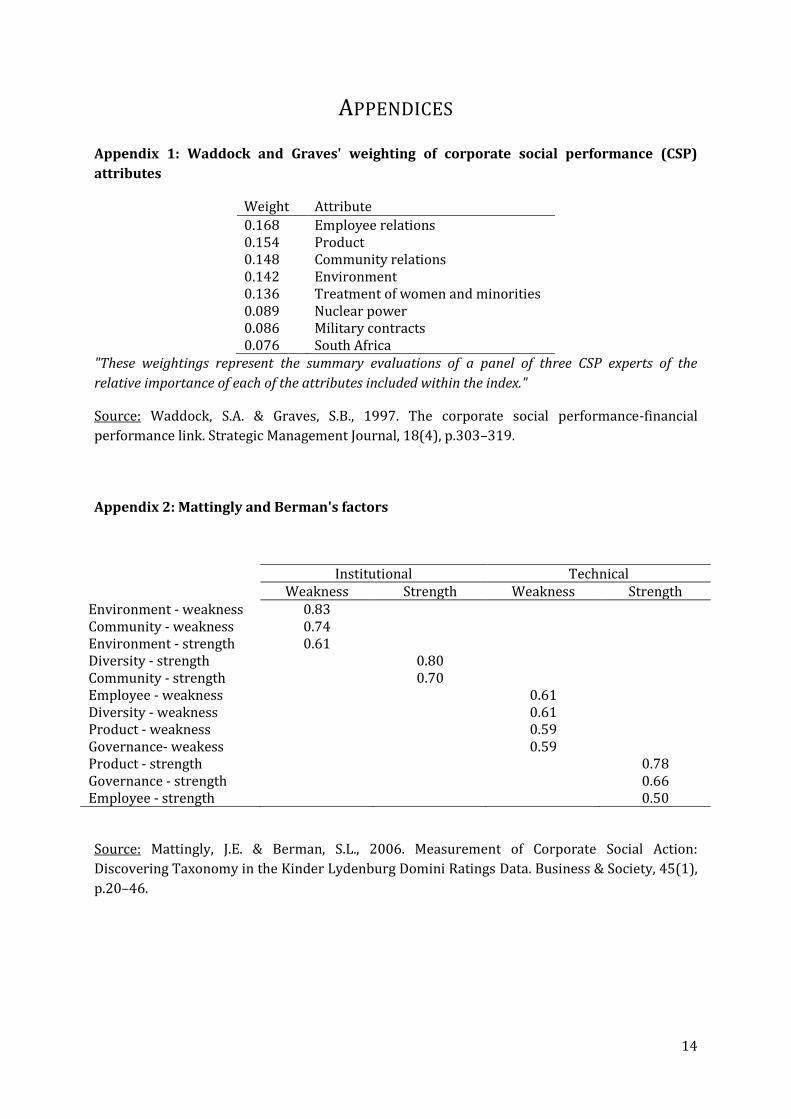
rights. A weighting scheme (see appendix 1) is used to deal with the problem of relative
importance of each items in the KLD rating over time and with changing social standards. We
compute a weighted aggregate CSR based on the same weighting scheme and include the
7
variable in the analysis (wACSR). Following Siegel and Vitaliano (2007), we consider a proxy for
"public CSR" with a dummy variable taking the value of 1 if a firm has more strengths than
weaknesses in community relations, diversity, environment and human rights (Public-CSR). We
also include a proxy for "non public CSR" focusing on the other KLD dimensions: employee
relations, corporate governance and product quality and safety (NPublic-CSR). Mattingly and
Berman (2006) show that the 12 KLD variables can be reduced to 4 distinct factors, underlying
patterns in corporate social actions. Institutional weakness corresponds to weak or negative
social action toward environment and community, institutional strength consists in strong or
positive social activity toward community and diversity stakeholders, technical weakness is
defined as weak social action toward stakeholders that are primarily engaged in resource
exchanges with the firm (employees, consumers, stockholders (governance), diversity), and
technical strength means positive social action toward technical stakeholders (consumers,
stockholders and employees). We compute the four factors based on the weighting scheme
detailed in appendix 2, reported in Mattingly and Berman's paper.
3.3. Control Variables
Corporate social responsibility has been shown to be affected by several other factors
that need to be included to the analysis:
Research and development (RD): firms operating in more competitive industries might
invest more in R&D in addition to implementing socially responsible policies
(McWilliams and Siegel 2001, Fernandez and Santalo 2010). We measure R&D intensity
using the ratio of R&D expenditures to total sales.
Advertising (ADVERT): the inclusion of a variable capturing advertising intensity is
motivated by two issues. First, under higher competitive pressures, firms are more likely
to invest in advertising (Fernandez and Santalo 2010). Second, in more advertising
sensitive industries, visible social performance has more impact (Fisman et al. 2005). We
capture advertising intensity with a ratio of advertising expenditures to total sales.
Servaes and Tamayo (2012) recently showed that advertising expenditures are
determinant in the relationship between corporate social responsibility and financial
performance.
D_RD and D_ADVERT: as reporting advertising and R&D expenditures to the SEC is not a
mandatory requirement, a large fraction of observations have missing values for these
variables. Following prior literature, instead of dropping observations, we assign them a
zero value and create two dummies, one for each variable, that is equal to 1 if the
company reports each respective type of expenditures, and 0 otherwise.
Operating performance (EBIT, CASH and ROA): firms in more competitive environments
are likely to have lower excess resources available to spend on CSR. We employ three
different measures of operating performance: operating profits (Fernandez and Santalo
2010), the ratio of cash to total assets (Fisman et al. 2005) and the return on assets
(Harjoto and Jo 2011).
Firm size (ASSETS and SALES): size is related to both competitive intensity and social
performance: less competitive industries are more likely to have fewer and larger firms,
larger firms have greater visibility, larger operational impact and are expected to invest
more in socially responsible actions. The most commonly used proxies for firm size are
the logarithm of total value of assets and the logarithm of total net sales.
8
Firm risk (RISK): we control for firm risk using the ratio of long-term debt to total assets.
The management's risk tolerance influences its attitude toward social activities
(Waddock and Graves 1997).
Industry characteristics: unobserved industry characteristics, other than product market
competition can be correlated at the same time with CSR and competition proxies. We
neutralize this effect by adding industry dummies using 3-digit SIC codes.
3.4. Method
In this paragraph, we develop the method employed to assess the effect of product
market competition on social performance. We run both univariate and multivariate analyses.
Hoberg and Phillips' fitted HHI was estimated empirically by the authors and contains some
measurement error. A way to mitigate this problem is to classify industries into concentrated
and competitive terciles, rather than using raw values of the index. In the univariate tests, we
compare average social performance indicators between concentrated and competitive
industries. To construct the two subsamples, we use the thresholds defined by the US
department of justice: a market can be considered as concentrated with an Herfindahl-
Hirschman index below 1000 and competitive above 1800. We compute correlations between
different measures of social performance to assess the independence or relationship between
strengths, concerns, aggregate and disaggregate indicators. We also calculate correlation
coefficients with the indicator of competitive intensity but correlation does not mean causation.
In the multivariate analysis, we investigate the effect of competition on social
performance indicators. Ordinary least squared (OLS) estimation can be used in our case but
some empirical issues must be taken into consideration. Firstly, we need to consider the
endogeneity problem resulting from a potential simultaneous relationship between the
dependent and independent variables. Competition may, at least partially, be determined as a
function of social actions. Social actions can indeed be used by firms as a way to introduce or
intensify existing competition on the industry. In order to neutralize this effect, we
systematically use lagged independent variables in all our regressions. Secondly, we are dealing
with panel data i.e. our sample provides information on a set of firms in the cross-section and on
several time-periods (yearly basis). In such a situation, observations are not independent,
coefficients and standard errors are biased. We cluster standard errors by considering that
observations are independent across firms but not within firms and across time. In the
specification, we take into account time and industry effects. The introduction of year dummies
allows to neutralize the time-period period effect across the whole sample. Industry dummies
isolate unobserved factors that are fixed within each industry and that affect the dependent
variable. Our model therefore captures the intra-industry variation across time.
4. Sample
Our sample includes all firms reported in both Compustat and KLD data from 1995 to
2009 and whose industry-level fitted HHI is available in Hoberg and Phillips' data. Industries are
defined by their 3-digit SIC code.
The matching between Compustat, KLD and Hoberg and Phillips data is based on firms'
cusip and 3-digit SIC-codes as reported by Compustat's historical SIC codes. More specifically,
we match KLD to Compustat data by first converting KLD's cusip into Compustat's permno

9
based on Compustat's recorded cusips and then by merging converted permno-based KLD
variables to Compustat's sample.
Before matching the databases, Compustat's data on all recorded firms from 1995 to
2009 include 58,096 firm-year observations on 3,873 unique firms. KLD data include 26,895
firm-year observations on 4,790 unique firms. Hoberg and Phillips' data contain 6,807 industry-
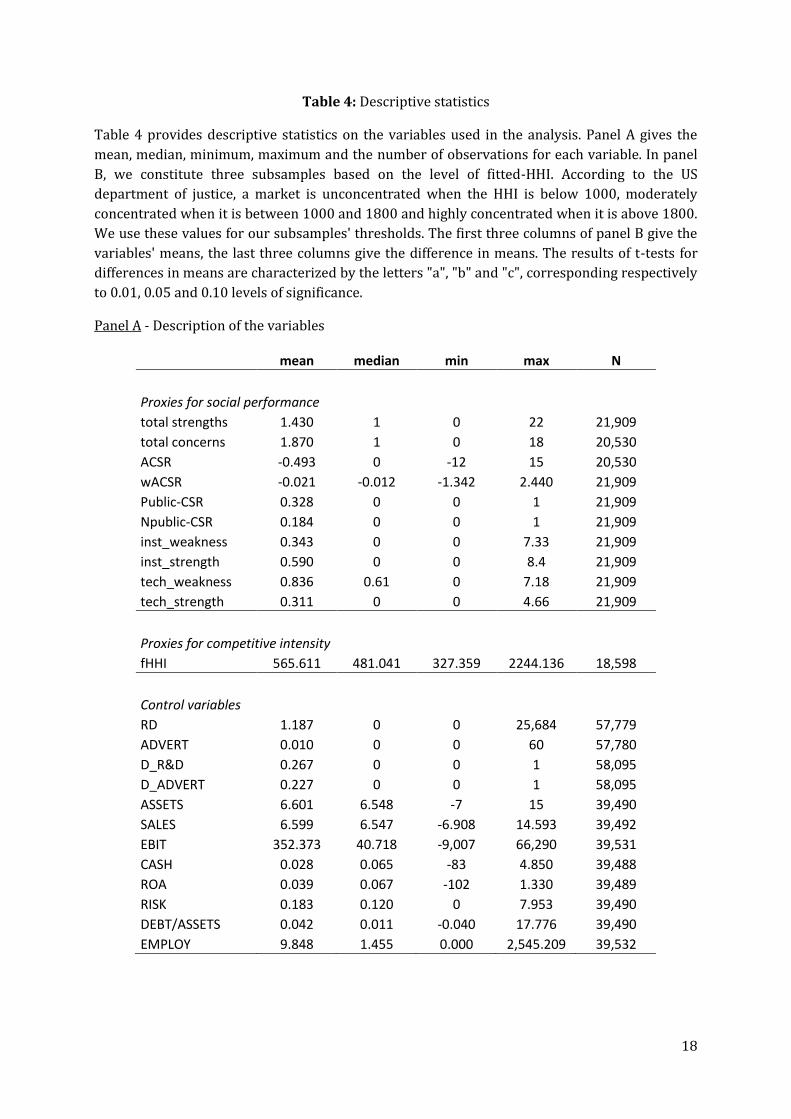
year observations on 255 unique industries. Panel A of table 4 gives descriptive statistics on the
sample after the matching procedure. Missing values may result from either the absence of
record in the database, or for KLD data the impossibility to convert the cusip into the
corresponding Compustat's permno based on Compustat's recorded historical cusips. The
reason why we have unequal number of observations for social performance proxies is that the
"firearms" category was only added in 1999 to KLD ratings. Aggregate measures of social
performance that include the "firearms" section are therefore not observed before this date.
Insert Table 4
On table 4, we can see that the median difference between total strengths and total concerns
(ACSR) is 0, the most negative values for this variable are actually pulling the mean downward.
Its negative value suggests that there are on average more concerns than strengths in our
sample. Not surprisingly, the public corporate social responsibility (Public-CSR) seems to be
higher than the non public one on average. This is consistent with social actions being a way to
improve a firm's public image. Technical weakness has the highest mean, suggesting particularly
weak social action toward employees, consumers, stockholders in our sample. Statistics on
market concentration indicate the presence of highly concentrated industries, the average fitted-
HHI being higher than its median and the maximum value being almost four times bigger than
the mean.
5. Results
5.1. Univariate statistics
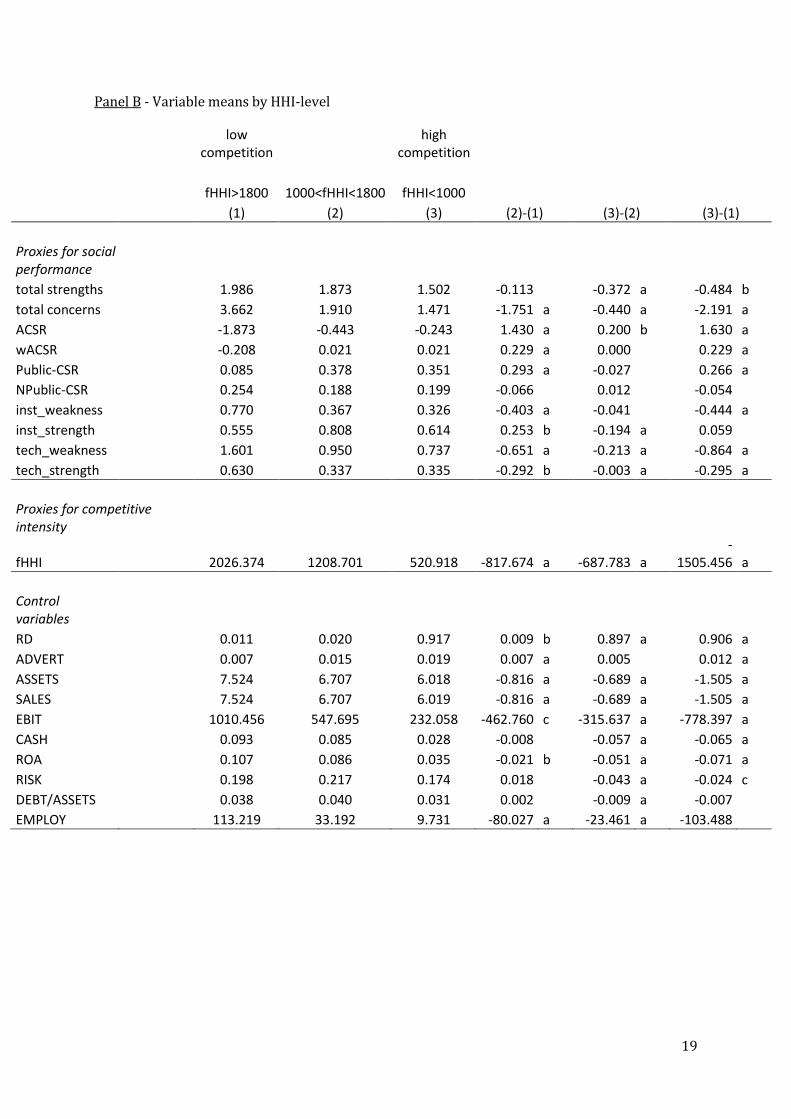
In Panel B of table 4, we observe in the last column the difference between the variables'
means of the most competitive industries and those of the most concentrated ones. Letters "a",
"b", or "c" indicate the significance level of the means' differences. Overall social performance
(ACSR) is on average significantly higher in competitive industries (+1.630). When there is more
competition, there seems to be fewer social strengths on average (-0.484), but also fewer
concerns and in a bigger proportion (-2.191). The use of Waddock and Graves weights to
compute an aggregate social performance (wACSR) confirms the improved social performance
in more competitive markets but at a lower level (0.229). Interestingly, public CSR is
significantly better in competitive markets (+0.266) but there is no significant difference for non
public CSR. Both institutional and technical weaknesses are lower in more competitive
environment but technical strength is also lower.
Concerning the control variables, we can see that firms in more competitive industries
spend more on average in research and development and in advertising, are lower in size
(ASSETS and SALES), have lower profits (EBIT), less cash available and a lower profitability
(ROA).
Insert Table 5

10
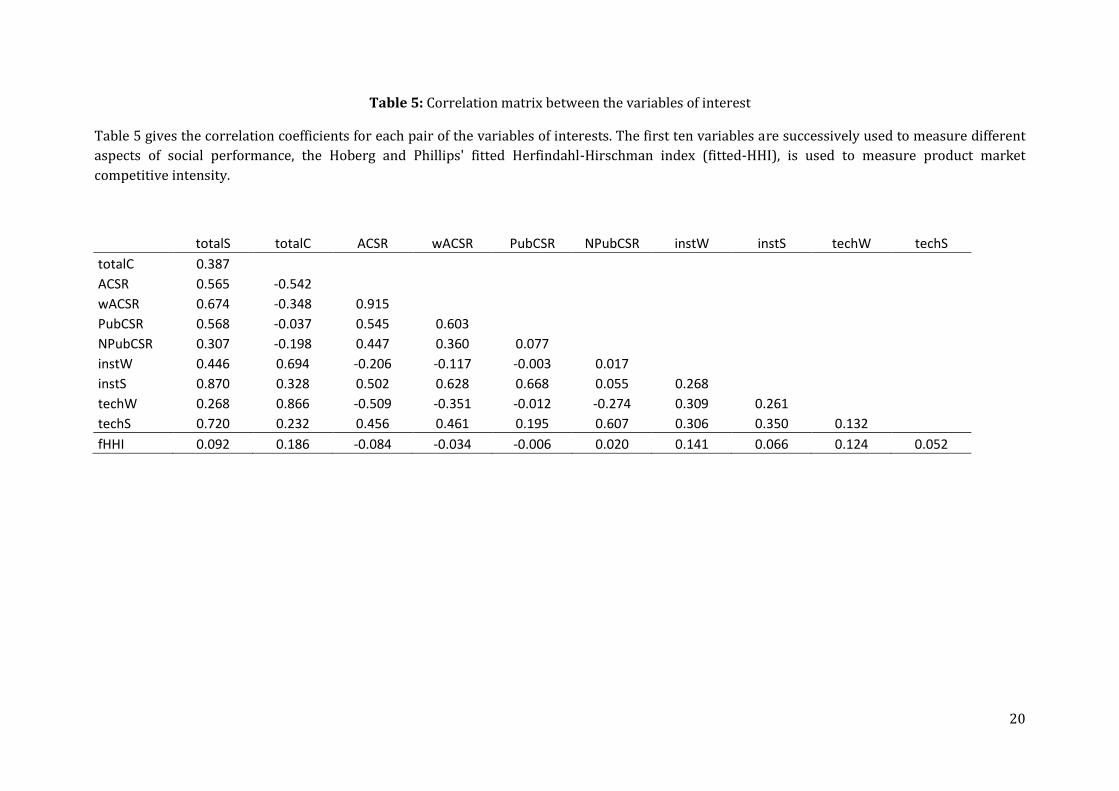
Table 5 presents the correlation coefficients between our variables of interest. It is interesting to
notice a positive correlation between total strengths and total concerns, consistent with the
findings of Kotchen and Moon (2011) that social responsibility is associated to social
irresponsibility. It is also consistent with Mattingly and Berman (2006) that positive social
action is not necessarily associated to less negative social action. The correlation of fitted HHI
with total strengths is small but positive, the correlation with total concern is positive and
bigger, consistent with the results of Table 4 - Panel B: the improved social performance of
competitive markets seems to be explained by less concerns, rather than by more strengths.
5.2. Multivariate statistics
Insert Table 6
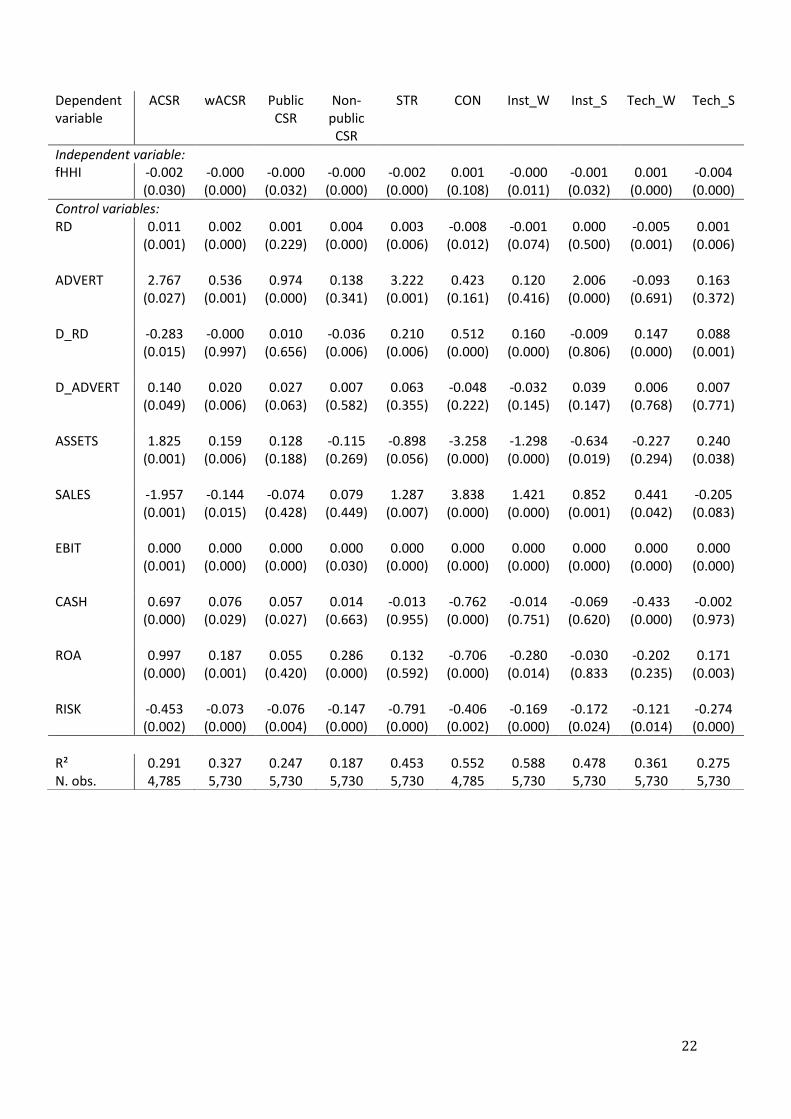
In Table 6, the results of the OLS regressions are presented. This table shows very
consistent results with the idea that intensified competition increase social performance. The
negative and significant coefficients of the fitted HHI for total strengths, both aggregate and
weighted differences between total strengths and total concerns, both public and non-public CSR
indicate that firms operating on less concentrated (more competitive) markets have better social
performance. The coefficient for total concerns is positive but weakly significant. This result
invalidates conclusions in the univariate analysis that the improvement of social performance in
more competitive environments is driven by a decrease in total concerns. Here we observe on
the contrary that it is driven by a very significant increase of total strengths and a weakly
significant decrease of total concerns. These results support the idea that considering positive
and negative social actions as different constructs provides additional insights on how social
performance varies. Institutional and technical strengths appear to be improved in more
competitive environments (negative coefficient with concentration index) and technical
weakness is lower. Interestingly, institutional weakness is significantly related to the fitted HHI
but the coefficient is negative. The sign of this coefficient shows that negative social action
toward environment and community (definition of institutional weakness) is actually more
developed under competitive pressure.
Table 6 also provides details on the coefficients of the control variables. Consistent with
prior literature, research & development and advertising expenditures are positively associated
to indicators of social performance. As mentioned by McWilliams and Siegel (2001), in more
competitive environments firms increase these expenditures in addition to undertaking socially
responsible initiatives. Moreover, there is a positive impact of visible social responsibility in
industries where advertising activity is more intense (Fisman et al., 2005). Interestingly, the log
of total assets is positively associated to social performance, whereas the log of total sales is
negatively associated with social performance. The first result is consistent with the idea that
bigger firms have more public visibility and need to worry about their social impact. The second
result seems to be driven by a significant increase of social concerns, despite an increase in
social strengths but in a smaller proportion. Indicators of operating performance (EBIT, cash,
ROA) are significantly positively related to aggregate social performance, consistent with the
idea that investing in socially responsible initiatives is more likely when the firm has excess
resources available. The negative relationship with risk can be explained by a similar argument.
Riskier firms in terms of the ratio of long-term debt to total assets will prefer to save resources
to compensate this risk, rather than investing it in social actions.
11
Insert table 7
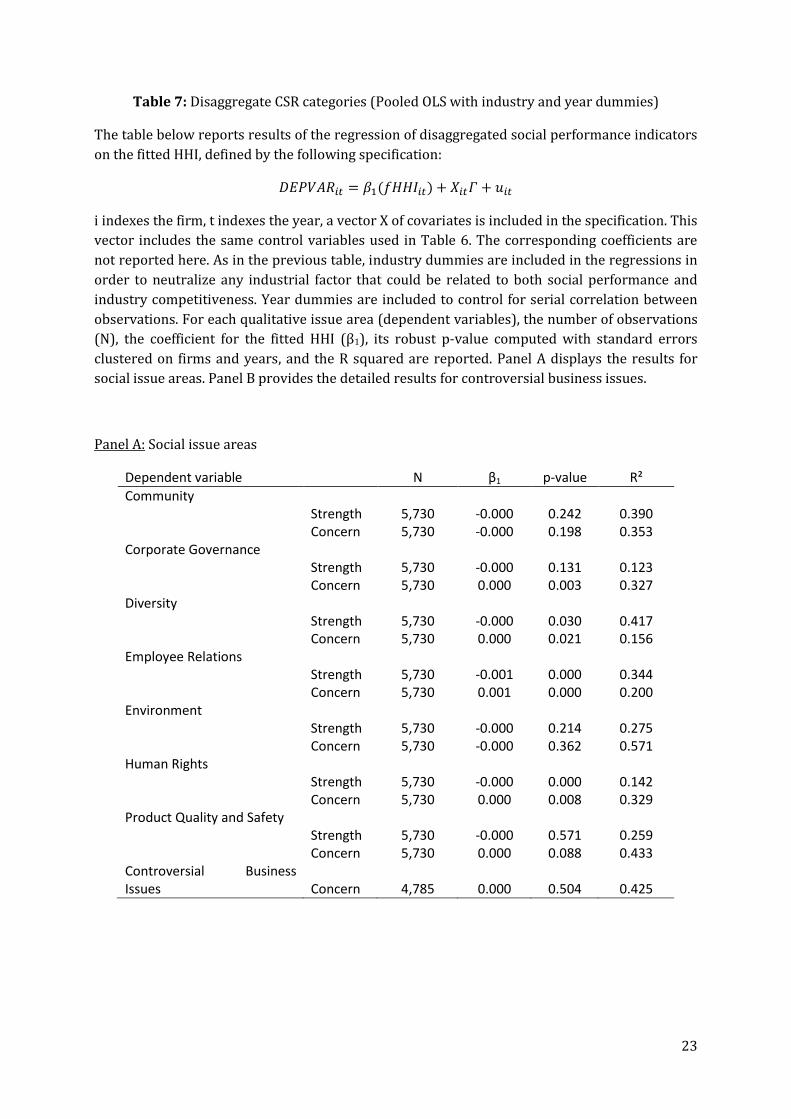
Table 7 examines the effect of competitive intensity on the separate dimensions of
corporate social performance. If competition drives social performance, we expect a negative
relationship between social strengths and our indicator of industry concentration (the fitted
HHI), and a positive relationship between concerns and the fitted HHI. Interestingly, this
relationship is significantly verified for corporate governance, diversity and human rights but is
not true for the community and environment sections. Product quality and safety strengths is
not significantly associated to market competition whereas product concerns are significantly
reduced in more competitive environment. The relationship with controversial business issues
(CBI) does not appear to be significant when computed as an aggregate score. Panel B allows to
understand what underlines the high p-value associated to the CBI coefficient (0.504).
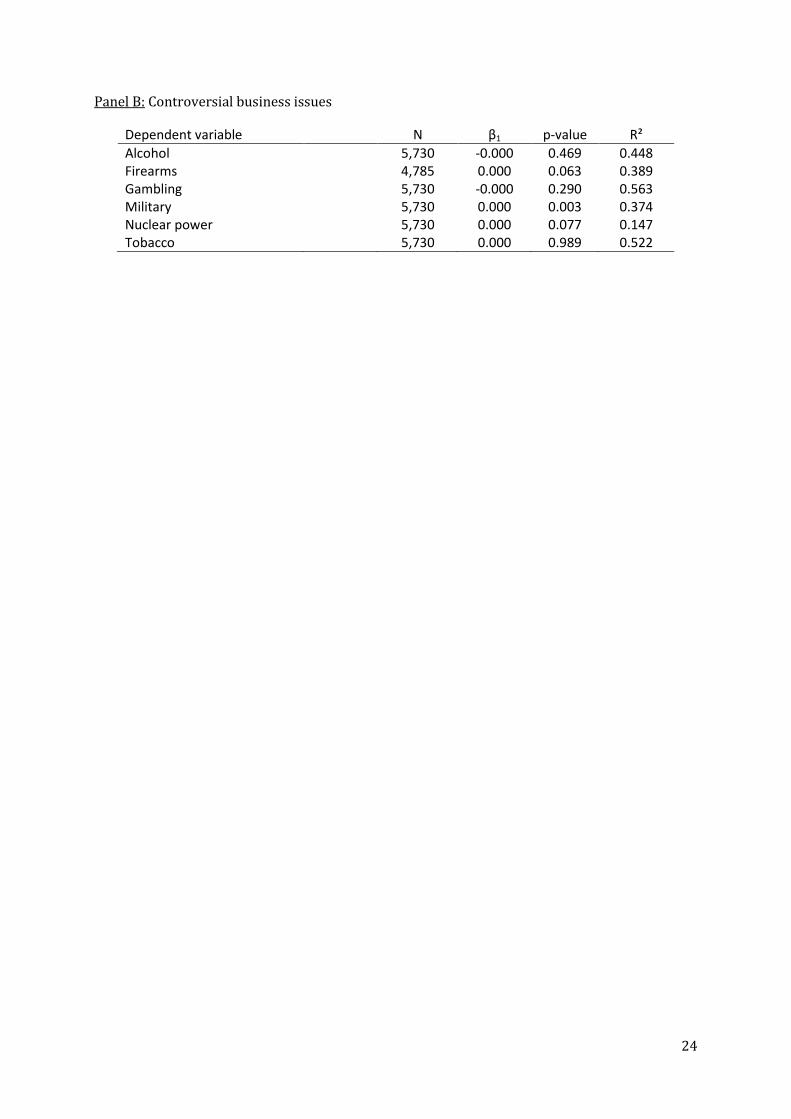
Indeed, we observe in panel B that some controversial business issues are not
significantly related to competition. Namely, issues related to alcohol, gambling and tobacco do
not appear to be related to competitive intensity, whereas firearms, military and nuclear power
issues do show significant positive coefficients i.e. positive association with concentration:
negative association with competition.
Overall, panels A and B of table 7 show that the positive relationship between
competition and social performance does not hold every separate dimension of social
responsibility. More specifically, shareholder- and employee-related social actions are improved
in more competitive environment while community and environment sections are not
significantly different depending on industry competition. Product quality and safety strengths
do not vary significantly with competition but product concerns are significantly reduced.
6. Conclusion
The aim of this paper is to analyze the link between product market competition and the
different dimensions of corporate social responsibility. Positive and negative corporate social
actions are different constructs and what is referred to as corporate social responsibility
includes different areas whose strategic interest may vary. The measurement of product market
competition present many empirical issues notably because of the difficulty to access to data on
companies that are not publicly listed.
Given these empirical issues, we use different measures of CSR, including detailed
indicators for every dimensions that are included in MSCI (formerly KLD) social ratings. For the
measurement of industry competitiveness, we use a recently developed measure of
concentration that provides information on all public and private firms, all industries, and every
year from 1975 to 2005. We carry out OLS regressions, taking into account endogeneity
concerns and serial correlation of panel data.
Our results provide additional insights on the strategic purpose of CSR. Specifically, we
show that -1- competition increases corporate social strengths but does not significantly reduces
social concerns, -2- the positive relationship between social performance and market
competition does not hold for environment, community, -3- product quality and safety strengths
12
are not significantly improved in more competitive environments while product concerns are
reduced, -4- involvement in firearms, military and nuclear power is not related to competition.
Corporate social initiatives can be strategic and competition exerts a positive pressure
on some dimensions of corporate social responsibility. However, some other dimensions are not
affected by competition, which suggests that those dimensions are not considered by firms as of
strategic competitive interest. Competitive motives may not be sufficient to maintain or improve
every dimension of social welfare.
References
Ali, A., Klasa, S. & Yeung, E., 2009. The Limitations of Industry Concentration Measures
Constructed with Compustat Data: Implications for Finance Research. The Review of
Financial Studies, 22, p.3839–3871.
Bagnoli, M. & Watts, S.G., 2003. Selling to Socially Responsible Consumers: Competition and The
Private Provision of Public Goods. Journal of Economics & Management Strategy, 12(3),
p.419–445.
Barnea, A. & Rubin, A., 2010. Corporate Social Responsibility as a Conflict Between Shareholders.
Journal of Business Ethics, 97(1), p.71-86.
Baron, D.P., 2001. Private politics, corporate social responsibility, and integrated strategy.
Journal of Economics & Management Strategy, 10(1), p.7-45.
Davis, I., 2005. Business and society: The biggest contract. The Economist.
Delios, A., 2010. How Can Organizations Be Competitive but Dare to Care? Academy of
Management Perspectives, 24(3), p.25-36.
Elhauge, E.R., 2005. Corporate managers’ operational discretion to sacrifice corporate profits in
the public interest. Environmental Protection and the Social Responsibility of Firms.
Washington: Resources for the Future, p.13–76.
Fernández-Kranz, D. & Santaló, J., 2010. When Necessity Becomes a Virtue: The Effect of Product
Market Competition on Corporate Social Responsibility. Journal of Economics &
Management Strategy, 19(2), p.453–487.
Fisman, R., Heal, G. & Nair, V., 2005. Corporate social responsibility: doing well by doing good?
Working Paper (Wharton School, University of Pennsylvania).
Harjoto, M.A. & Jo, H., 2011. Corporate Governance and CSR Nexus. Journal of Business Ethics,
100(1), p.45–67.
Heal, G., 2005. Corporate social responsibility: An economic and financial framework. The
Geneva papers on risk and insurance-Issues and practice, 30(3), p.387–409.
Hillman, A. & Keim, G., 2001. Shareholder value, stakeholder management, and social issues:
what’s the bottom line? Strategic Management Journal, 22(2), p.125-139.
13
Hoberg, G. & Phillips, G., 2010a. Product Market Synergies and Competition in Mergers and
Acquisitions: A Text-Based Analysis. Review of Financial Studies, 23(10), p.3773 –3811.
Hoberg, G. & Phillips, G.M., 2010b. Real and Financial Industry Booms and Busts. Journal of
Finance, Forthcoming.
Jones, T.M., 1995. Instrumental stakeholder theory: a synthesis of ethics and economics.
Academy of Management Review, 20(2), p.404-437.
Kotchen, M.J. & Moon, J.J., 2011. Corporate social responsibility for irresponsibility, National
Bureau of Economic Research.
Margolis, J.D. & Walsh, J.P., 2003. Misery Loves Companies: Rethinking Social Initiatives by
Business. Administrative Science Quarterly, 48(2), p.268-305.
Mattingly, J.E. & Berman, S.L., 2006. Measurement of Corporate Social Action: Discovering
Taxonomy in the Kinder Lydenburg Domini Ratings Data. Business & Society, 45(1),
p.20–46.
McWilliams, A. & Siegel, D., 2001. Corporate Social Responsibility: A Theory of the Firm
Perspective. The Academy of Management Review, 26(1), p.117-127.
McWilliams, A., Siegel, D.S. & Wright, P.M., 2006. Corporate Social Responsibility: Strategic
Implications. Journal of Management Studies, 43(1), p.1-18.
Russo, M.V. & Fouts, P.A., 1997. A resource-based perspective on corporate environmental
performance and profitability. Academy of Management Journal, 40(3), p.534-559.
Sachs, J.D., 2011. The Price of Civilization: Reawakening American Virtue and Prosperity,
Random House.
Servaes, H. & Tamayo, A.M., 2012. The Impact of Corporate Social Responsibility on Firm Value:
The Role of Customer Awareness. Management Science, Forthcoming.
Siegel, D.S. & Vitaliano, D.F., 2007. An Empirical Analysis of the Strategic Use of Corporate Social
Responsibility. Journal of Economics & Management Strategy, 16(3), p.773–792.
Waddock, S.A. & Graves, S.B., 1997. The corporate social performance-financial performance
link. Strategic Management Journal, 18(4), p.303–319.
14
APPENDICES
Appendix 1: Waddock and Graves' weighting of corporate social performance (CSP)
attributes
Weight Attribute
0.168 0.154 0.148 0.142 0.136 0.089 0.086 0.076
Employee relations Product Community relations Environment Treatment of women and minorities Nuclear power Military contracts South Africa
"These weightings represent the summary evaluations of a panel of three CSP experts of the
relative importance of each of the attributes included within the index."
Source: Waddock, S.A. & Graves, S.B., 1997. The corporate social performance-financial
performance link. Strategic Management Journal, 18(4), p.303–319.
Appendix 2: Mattingly and Berman's factors
Institutional Technical Weakness Strength Weakness Strength Environment - weakness Community - weakness Environment - strength Diversity - strength Community - strength Employee - weakness Diversity - weakness Product - weakness Governance- weakess Product - strength Governance - strength Employee - strength
0.83 0.74 0.61
0.80 0.70
0.61 0.61 0.59 0.59
0.78 0.66 0.50
Source: Mattingly, J.E. & Berman, S.L., 2006. Measurement of Corporate Social Action:
Discovering Taxonomy in the Kinder Lydenburg Domini Ratings Data. Business & Society, 45(1),
p.20–46.
15
Qualitative issue area Strength items Concern items
Community Charitable Giving Investment Controversies
Innovative Giving Negative Economic Impact
Support for Housing Tax Disputes
Support for Education (from 1994) Other Concern
Non-US Charitable Giving
Volunteer Programs (from 2005)
Other Strength
Corporate governance Limited Compensation High Compensation
Ownership Strength Ownsership Concern
Transparency Strength Accounting Concern (from 2005)
Political Accountability Strength (from 2005) Transparency Concern (from 2005)
Public Policy Strength Political Accountability Concern (from 2005)
Other Strength Public Policy Concern
Other Concern
Diversity CEO Controversies
Promotion Non-Representation
Board of Directors Other Concern
Work-Life Benefits
Women and Minority Contracting
Employment of the Disabled
Gay and Lesbian Policies (from 1995)
Other Strength
Employee relations Union Relations Union Relations
No-Layoff Policy (through 1994) Health and Safety Concern
Cash Profit Sharing Workforce Reductions
Employee Involvement Retirement Benefits Concern
Retirement Benefits Strength Other Concern
Health and Safety Strength
Other strength
Environment Beneficial Products and Services Hazardous Waste
Pollution Prevention Regulatory Problems
Recycling Ozone Depleting Chemicals
Clean Energy Substantial Emissions
Property, Plant, Equipment (through 1995) Agriculture Chemicals
Management Systems Strength Climate Change (from 1999)
Other Strength Other Concern
Human rights Positive Record in S. Africa (1994-1995) South Africa (1991-1994)
Indigenous People Relations Strength (from 2000)Northern Ireland (1991-1994)
Labor Rights Strength (from 2002) Burma Concern (from 1995)
Other Strength Mexico (1995-2002)
Labor Rights Concern (from 1998)
Indigenous People Relations Concern (from 2000)
Other Concern
Product quality and safety Quality Product Safety
R&D Innovation Marketing Contracting Concern
Benefits to Economically Disadvantaged Antitrust
Other Strength Other Concern
Controversial business issues Alcohol
Gambling
Tobacco
Firearms
Military
Nuclear
Table 1: KLD Social Ratings, list of items
16
Table 2: KLD ratings coverage history
Coverage Universe 1991-2000 2001 2002 2003-2005
S&P 500 Index X X X X
Domini 400 Social Index X X X X
1000 largest US Companies
X X X
Large Cap Social Index
X X
2000 Small Cap US Companies
X
Broad Market Social Index
X
Approximate Total Number of Companies Covered 650 1100 1100 3100
Source: KLD Research & Analytics, Inc. (2006)
17
Table 3: Definition of the variables
Table 3 provides the list and definition of the variables used in the empirical analysis. We are
interested in the effect of competitive intensity (independent variable) on social performance
(dependent variable). We control for potential covariates which are listed under the "control
variables" heading.
Variable Definition Source
Proxies for social performance total strengths Aggregate strengths
KLD ratings
total concerns Aggregate concerns
ACSR Aggregate difference between total strengths and total concerns
wACSR Waddock & Grave (1997) weighted average index of CSR
Public-CSR 1 if a firm has more CSR strengths than weakesses in the "public" categories as defined bu Siegel & Vitaliano (2007)
Npublic-CSR 1 if a firm has more CSR strengths than weakesses in the "non public" categories as defined bu Siegel & Vitaliano (2007)
inst_weakness
Mattingly & Berman (2006) factors inst_strength
tech_weakness
tech_strength
Proxies for competitive intensity
fHHI fitted HHI (Hoberg & Phillips) Hoberg & Phillips data library
Control variables RD the ratio of R&D expenditures tot total sales Compustat
ADVERT the ratio of advertising expenditures tot total sales Compustat
D_R&D 1 if the company reports the respective types of expenditures, 0 otherwise
Constructed based on RD variable
D_ADVERT Constructed based on ADVERT variable
ASSETS log of total assets Compustat
SALES log of total sales Compustat
EBIT operating profit Compustat
CASH the ratio of cash (Net income before extraordinary items + Depreciation and Amortization) to total assets
Compustat
ROA the ratio of operating income (EBIT) to total assets Compustat
RISK the ratio of long-term debt to total assets Compustat
DEBT the ratio of total debt to total assets Compustat
EMPLOY number of employees Compustat
18
Table 4: Descriptive statistics
Table 4 provides descriptive statistics on the variables used in the analysis. Panel A gives the
mean, median, minimum, maximum and the number of observations for each variable. In panel
B, we constitute three subsamples based on the level of fitted-HHI. According to the US
department of justice, a market is unconcentrated when the HHI is below 1000, moderately
concentrated when it is between 1000 and 1800 and highly concentrated when it is above 1800.
We use these values for our subsamples' thresholds. The first three columns of panel B give the
variables' means, the last three columns give the difference in means. The results of t-tests for
differences in means are characterized by the letters "a", "b" and "c", corresponding respectively
to 0.01, 0.05 and 0.10 levels of significance.
Panel A - Description of the variables
mean median min max N
Proxies for social performance total strengths 1.430 1 0 22 21,909
total concerns 1.870 1 0 18 20,530
ACSR -0.493 0 -12 15 20,530
wACSR -0.021 -0.012 -1.342 2.440 21,909
Public-CSR 0.328 0 0 1 21,909
Npublic-CSR 0.184 0 0 1 21,909
inst_weakness 0.343 0 0 7.33 21,909
inst_strength 0.590 0 0 8.4 21,909
tech_weakness 0.836 0.61 0 7.18 21,909
tech_strength 0.311 0 0 4.66 21,909
Proxies for competitive intensity fHHI 565.611 481.041 327.359 2244.136 18,598
Control variables RD 1.187 0 0 25,684 57,779
ADVERT 0.010 0 0 60 57,780
D_R&D 0.267 0 0 1 58,095
D_ADVERT 0.227 0 0 1 58,095
ASSETS 6.601 6.548 -7 15 39,490
SALES 6.599 6.547 -6.908 14.593 39,492
EBIT 352.373 40.718 -9,007 66,290 39,531
CASH 0.028 0.065 -83 4.850 39,488
ROA 0.039 0.067 -102 1.330 39,489
RISK 0.183 0.120 0 7.953 39,490
DEBT/ASSETS 0.042 0.011 -0.040 17.776 39,490
EMPLOY 9.848 1.455 0.000 2,545.209 39,532
19
Panel B - Variable means by HHI-level
low competition
high competition
fHHI>1800 1000<fHHI<1800 fHHI<1000
(1) (2) (3) (2)-(1) (3)-(2) (3)-(1)
Proxies for social performance
total strengths
1.986 1.873 1.502 -0.113
-0.372 a -0.484 b
total concerns
3.662 1.910 1.471 -1.751 a -0.440 a -2.191 a
ACSR
-1.873 -0.443 -0.243 1.430 a 0.200 b 1.630 a
wACSR
-0.208 0.021 0.021 0.229 a 0.000
0.229 a
Public-CSR
0.085 0.378 0.351 0.293 a -0.027
0.266 a
NPublic-CSR
0.254 0.188 0.199 -0.066
0.012
-0.054 inst_weakness
0.770 0.367 0.326 -0.403 a -0.041
-0.444 a
inst_strength
0.555 0.808 0.614 0.253 b -0.194 a 0.059 tech_weakness
1.601 0.950 0.737 -0.651 a -0.213 a -0.864 a
tech_strength 0.630 0.337 0.335 -0.292 b -0.003 a -0.295 a
Proxies for competitive intensity
fHHI 2026.374 1208.701 520.918 -817.674 a -687.783 a
-1505.456 a
Control variables
RD
0.011 0.020 0.917 0.009 b 0.897 a 0.906 a
ADVERT
0.007 0.015 0.019 0.007 a 0.005
0.012 a
ASSETS
7.524 6.707 6.018 -0.816 a -0.689 a -1.505 a
SALES
7.524 6.707 6.019 -0.816 a -0.689 a -1.505 a
EBIT
1010.456 547.695 232.058 -462.760 c -315.637 a -778.397 a
CASH
0.093 0.085 0.028 -0.008
-0.057 a -0.065 a
ROA
0.107 0.086 0.035 -0.021 b -0.051 a -0.071 a
RISK
0.198 0.217 0.174 0.018
-0.043 a -0.024 c
DEBT/ASSETS
0.038 0.040 0.031 0.002
-0.009 a -0.007 EMPLOY 113.219 33.192 9.731 -80.027 a -23.461 a -103.488
20
Table 5: Correlation matrix between the variables of interest
Table 5 gives the correlation coefficients for each pair of the variables of interests. The first ten variables are successively used to measure different
aspects of social performance, the Hoberg and Phillips' fitted Herfindahl-Hirschman index (fitted-HHI), is used to measure product market
competitive intensity.
totalS totalC ACSR wACSR PubCSR NPubCSR instW instS techW techS
totalC 0.387 ACSR 0.565 -0.542
wACSR 0.674 -0.348 0.915 PubCSR 0.568 -0.037 0.545 0.603
NPubCSR 0.307 -0.198 0.447 0.360 0.077 instW 0.446 0.694 -0.206 -0.117 -0.003 0.017
instS 0.870 0.328 0.502 0.628 0.668 0.055 0.268 techW 0.268 0.866 -0.509 -0.351 -0.012 -0.274 0.309 0.261
techS 0.720 0.232 0.456 0.461 0.195 0.607 0.306 0.350 0.132 fHHI 0.092 0.186 -0.084 -0.034 -0.006 0.020 0.141 0.066 0.124 0.052
21
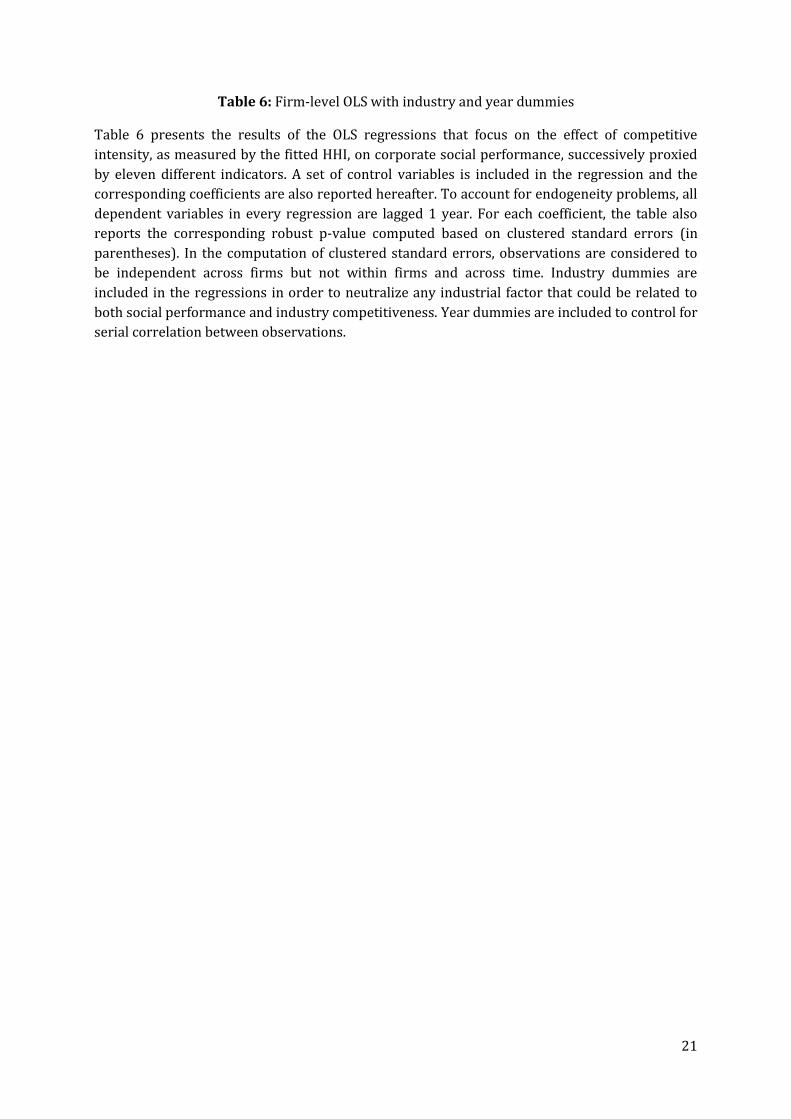
Table 6: Firm-level OLS with industry and year dummies
Table 6 presents the results of the OLS regressions that focus on the effect of competitive
intensity, as measured by the fitted HHI, on corporate social performance, successively proxied
by eleven different indicators. A set of control variables is included in the regression and the
corresponding coefficients are also reported hereafter. To account for endogeneity problems, all
dependent variables in every regression are lagged 1 year. For each coefficient, the table also
reports the corresponding robust p-value computed based on clustered standard errors (in
parentheses). In the computation of clustered standard errors, observations are considered to
be independent across firms but not within firms and across time. Industry dummies are
included in the regressions in order to neutralize any industrial factor that could be related to
both social performance and industry competitiveness. Year dummies are included to control for
serial correlation between observations.
22
Dependent variable
ACSR wACSR Public CSR
Non-public
CSR
STR CON Inst_W Inst_S Tech_W Tech_S
Independent variable: fHHI -0.002
(0.030) -0.000 (0.000)
-0.000 (0.032)
-0.000 (0.000)
-0.002 (0.000)
0.001 (0.108)
-0.000 (0.011)
-0.001 (0.032)
0.001 (0.000)
-0.004 (0.000)
Control variables: RD 0.011
(0.001) 0.002
(0.000) 0.001
(0.229) 0.004
(0.000) 0.003
(0.006) -0.008 (0.012)
-0.001 (0.074)
0.000 (0.500)
-0.005 (0.001)
0.001 (0.006)
ADVERT 2.767 (0.027)
0.536 (0.001)
0.974 (0.000)
0.138 (0.341)
3.222 (0.001)
0.423 (0.161)
0.120 (0.416)
2.006 (0.000)
-0.093 (0.691)
0.163 (0.372)
D_RD -0.283 (0.015)
-0.000 (0.997)
0.010 (0.656)
-0.036 (0.006)
0.210 (0.006)
0.512 (0.000)
0.160 (0.000)
-0.009 (0.806)
0.147 (0.000)
0.088 (0.001)
D_ADVERT
0.140 (0.049)
0.020 (0.006)
0.027 (0.063)
0.007 (0.582)
0.063 (0.355)
-0.048 (0.222)
-0.032 (0.145)
0.039 (0.147)
0.006 (0.768)
0.007 (0.771)
ASSETS
1.825 (0.001)
0.159 (0.006)
0.128 (0.188)
-0.115 (0.269)
-0.898 (0.056)
-3.258 (0.000)
-1.298 (0.000)
-0.634 (0.019)
-0.227 (0.294)
0.240 (0.038)
SALES -1.957
(0.001)
-0.144 (0.015)
-0.074 (0.428)
0.079 (0.449)
1.287 (0.007)
3.838 (0.000)
1.421 (0.000)
0.852 (0.001)
0.441 (0.042)
-0.205 (0.083)
EBIT 0.000 (0.001)
0.000 (0.000)
0.000 (0.000)
0.000 (0.030)
0.000 (0.000)
0.000 (0.000)
0.000 (0.000)
0.000 (0.000)
0.000 (0.000)
0.000 (0.000)
CASH 0.697
(0.000)
0.076 (0.029)
0.057 (0.027)
0.014 (0.663)
-0.013 (0.955)
-0.762 (0.000)
-0.014 (0.751)
-0.069 (0.620)
-0.433 (0.000)
-0.002 (0.973)
ROA 0.997 (0.000)
0.187 (0.001)
0.055 (0.420)
0.286 (0.000)
0.132 (0.592)
-0.706 (0.000)
-0.280 (0.014)
-0.030 (0.833
-0.202 (0.235)
0.171 (0.003)
RISK -0.453 (0.002)
-0.073 (0.000)
-0.076 (0.004)
-0.147 (0.000)
-0.791 (0.000)
-0.406 (0.002)
-0.169 (0.000)
-0.172 (0.024)
-0.121 (0.014)
-0.274 (0.000)
R² 0.291 0.327 0.247 0.187 0.453 0.552 0.588 0.478 0.361 0.275 N. obs. 4,785 5,730 5,730 5,730 5,730 4,785 5,730 5,730 5,730 5,730
23
Table 7: Disaggregate CSR categories (Pooled OLS with industry and year dummies)
The table below reports results of the regression of disaggregated social performance indicators
on the fitted HHI, defined by the following specification:
i indexes the firm, t indexes the year, a vector X of covariates is included in the specification. This
vector includes the same control variables used in Table 6. The corresponding coefficients are
not reported here. As in the previous table, industry dummies are included in the regressions in
order to neutralize any industrial factor that could be related to both social performance and
industry competitiveness. Year dummies are included to control for serial correlation between
observations. For each qualitative issue area (dependent variables), the number of observations
(N), the coefficient for the fitted HHI (β1), its robust p-value computed with standard errors
clustered on firms and years, and the R squared are reported. Panel A displays the results for
social issue areas. Panel B provides the detailed results for controversial business issues.
Panel A: Social issue areas
Dependent variable N β1 p-value R²
Community Strength Concern
5,730 5,730
-0.000 -0.000
0.242 0.198
0.390 0.353
Corporate Governance Strength Concern
5,730 5,730
-0.000 0.000
0.131 0.003
0.123 0.327
Diversity Strength Concern
5,730 5,730
-0.000 0.000
0.030 0.021
0.417 0.156
Employee Relations Strength Concern
5,730 5,730
-0.001 0.001
0.000 0.000
0.344 0.200
Environment Strength Concern
5,730 5,730
-0.000 -0.000
0.214 0.362
0.275 0.571
Human Rights Strength Concern
5,730 5,730
-0.000 0.000
0.000 0.008
0.142 0.329
Product Quality and Safety Strength Concern
5,730 5,730
-0.000 0.000
0.571 0.088
0.259 0.433
Controversial Business Issues
Concern
4,785
0.000
0.504
0.425
24
Panel B: Controversial business issues
Dependent variable N β1 p-value R²
Alcohol 5,730 -0.000 0.469 0.448 Firearms 4,785 0.000 0.063 0.389 Gambling 5,730 -0.000 0.290 0.563 Military 5,730 0.000 0.003 0.374 Nuclear power 5,730 0.000 0.077 0.147 Tobacco 5,730 0.000 0.989 0.522