product market competition, managerial incentives, and ... iv/iv.a... · product market...
TRANSCRIPT

Product Market Competition, Managerial Incentives,
and Firm Valuation*
Stefan Beinera, Markus Schmida,b, and Gabrielle Wanzenriedc,d,#
aDepartment of Finance, University of Basel, CH-4051 Basel, Switzerland bLeonard N. Stern School of Business, New York University, New York, NY 10012, USA
cDepartment of Economics, University of Bern, CH-3012 Bern, Switzerland dHaas School of Business, University of California Berkeley, Berkeley, CA 94700, USA
This version: February 2005
Abstract
This paper contributes to the still very small empirical literature on the effects of competition on managerial incentive schemes. Based on a theoretical model that incorporates both strategic interaction between firms and a principal agent rela-tionship, we investigate the relationships between product market competition, in-centive schemes and firm valuation in a multivariate OLS framework. To take into account a possible endogeneity of the incentives provided to managers and Tobin’s Q, our measure of firm value, we additionally employ a simultaneous equations framework. The sample comprises 156 Swiss firms for the year 2002, and the compensation data refer to the firms’ top management and the board of directors in total. Our results suggest that more intensive product market competition is associ-ated with stronger incentive schemes for managers and a lower firm value.
Key Words : Product Market Competition; Managerial Incentives; Firm Valua-tion; Simultaneous Equations System
JEL Classification: G30, J33, L1
____________________
* We thank Stefan Duffner, Colin Mayer, and Ken Okamura for helpful comments and Edith Bernhard for sup-port with data provision. Parts of this research were undertaken while Beiner was a visiting scholar at the Sa?d Business School at the University of Oxford; he acknowledges financial support from the Swiss National Sci-ence Foundation (SNF). Schmid acknowledges financial support from the Swiss National Science Foundation (SNF) and the Freiwillige Akademische Gesellschaft (FAG). All errors remain our responsibility. # Corresponding author’s e-mail address: [email protected]

Product Market Competition, Managerial Incentives,
and Firm Valuation
This version: February 2005
Abstract
This paper contributes to the still very small empirical literature on the effects of competition on managerial incentive schemes. Based on a theoretical model that incorporates both strategic interaction between firms and a principal agent rela-tionship, we investigate the relationships between product market competition, in-centive schemes and firm valuation in a multivariate OLS framework. To take into account a possible endogeneity of the incentives provided to managers and Tobin’s Q, our measure of firm value, we additionally employ a simultaneous equations framework. The sample comprises 156 Swiss firms for the year 2002, and the compensation data refer to the firms’ top management and the board of directors in total. Our results suggest that more intensive product market competition is associ-ated with stronger incentive schemes for managers and a lower firm value.
Key Words : Product Market Competition; Managerial Incentives; Firm Valua-tion; Simultaneous Equations System
JEL Classification: C31, J33, L1

1. Introduction
What are the effects of product market competition on managerial incentives? Do managers
work harder when the firm’s environment is more competitive, i.e. do competition and incen-
tive schemes substitute each other? And what are the impacts on firm value? While these and
related questions are at the heart of an ongoing debate about corporate governance issues, the
underlying mechanisms are only partly understood, and there is a serious lack of empirical
evidence on these issues.
The effects of competition on incentive schemes and firm valuation are not only interesting
from a purely academic point of view. These issues are also highly relevant for public policy
makers. During the last decade, there has been an increasing influence of governments and
non-governmental organizations on corporate governance rules.1 As Khemani and Leechor
(2001) outline, much of the attention has focused on the firms and the regulations that protect
shareholder rights and govern the conduct of management. However, the environment in
which business is conducted, such as the degree of competition among firms, entry and exit
rules, and the openness of the economy, requires close consideration. Competition has the
potential to facilitate the effectiveness of a culture of good corporate governance. Moreover,
competition policy may help to increase efficiency, reduce price distortions, lower the risk of
poor investment decisions, promote greater accountability and transparency in business deci-
sions, and lead to better corporate governance. Consequently, the design of effective corporate
governance rules necessarily has to take into account the competitiveness of markets. While
1 The OECD is about to revise its Principles of Corporate Governance that were adopted in 1999. In the USA, the Sar-
banes-Oxley Act, which reinforces the firms’ transparency requirements among other things with respect to executive
compensation, came into effect in 2002. In Germany, the German Corporate Governance Code, a similar set of transpar-
ency rules that is however not compulsory, has recently been implemented by the German government. In Switzerland, the
Swiss Code of Best Practice has become effective in 2002. The authorities of the European Union discuss the adoption of a
corporate governance codex. See also Emons and Wanzenried (2003).

questions about the role of public policy are clearly beyond the scope of our paper, we should
keep in mind that there may exist important interaction effects between competition and cor-
porate governance rules.
The theoretical literature on the links between product market competition and managerial
incentives can basically be divided into two main strands. A first strand analyzes the effects of
product market competition on managerial incentives, but compensation contracts are not
allowed to affect competition. While the earlier literature informally argues that competition
reduces managerial slack (e.g., Machlup, 1967), Hart (1983) is the first to formalize this idea
by modeling the effect of competition on the agency problems between a firm’s owner and a
manager. Subsequent research shows, however, that the relationship between competition and
managers’ effort level is ambiguous (e.g., Scharfstein, 1988; Hermalin, 1992; Graziano and
Parigi, 1998).2 While these studies rely on the information effect of competition, which means
that competition induced by many firms in the market may give more precision to incentives
based on relative performance evaluation, Schmidt (1997) uses the idea that more competition
increases the probability of firms going bankrupt. He shows that the effects of competition on
managers’ effort level and the strength of their incentive schemes crucially depend on manag-
ers’ outside options. In particular, an increase in the product market competition is more
likely to result in stronger incentives in case managers have good outside options. Raith
(2003) examines how the degree of competition among firms in an industry with free entry
and exit affects the incentives for their managers. Such a setup with free entry and exit implies
2 Scharfstein (1988) reconsiders Hart’s model while relaxing the assumption of infinitely risk-adverse managers. Hermalin
(1992) considers additional effects of competition on the agency problem, all of which are of potentially ambiguous sign.
Therefore, he concludes that theory cannot offer a definitive answer to the question of whether competition reduces mana-
gerial slack. Graziano and Parigi (1998) analyze the relationship between product market competition and managerial ef-
fort in a linear principal agent model. While increasing competition stemming from a lower degree of product market dif-
ferentiation reduces the manager’s optimal effort level and the optimal piece-rate, an increase in the number of firms has
an ambiguous effect on effort and piece-rate.

that changes in the nature of competition lead to changes in the equilibrium market structure.
His results suggest an unambiguous positive relationship between competition and incentives.
The second strand of the theoretical literature on competition and incentives is based on the
idea that precommitment to managerial incentive contracts can alter the strategic competition
between rivals.3 Aggarwal and Samwick (1999) extend the literature by considering compen-
sation contracts based on relative performance evaluation.4
The empirical papers that relate product market competition to compensation are not very
numerous and are mostly in line with Aggarwal and Samwick (1999), Kedia (2003) and Joh
(1999). These studies explicitly take into account strategic interactions between firms and the
structure of product markets to explain managerial compensation contracts. In particular, they
use these aspects to address the relative performance evaluation puzzle, which is the fact that
empirical studies do not seem to find any role for relative performance evaluation in incentive
contracts. Another recent paper by Funk and Wanzenried (2003) provides some evidence for
Schmidt’s (1997) hypothesis that the relationship between competition and strength of incen-
tives depends on the managers’ outside options. Finally, Cuñat and Guadalupe (2004) study
the impact of product market competition on the compensation packages in the US banking
and finance industry.
There is very little empirical evidence on the relation between product market competition
and firm value. Griffith (2001) argues on page 1 that the direction of the effect that product
market competition should have on firm value is ambiguous: „On the one hand increasing
3 See, e.g., Vickers (1985), Fershtman and Judd (1987), Sklivas (1987), and Fumas (1992).
4 They examine compensation contracts for managers in imperfectly competitive product markets and show that strategic
interactions among firms can explain the lack of relative performance-based incentive schemes for which compensation
decreases with rival firm performance. They find that firms in more competitive industries place more weight on rival firm
performance relative to own firm performance. Their study is one of the very few papers that empirically test the relation-
ship between incentives and competition.

competition lowers firm’s profits and thus reduces incentives to exert effort (the Schumpete-
rian effect), on the other hand it reduces agency costs (or increases the risk of bankruptcy)
thus increasing incentives to exert effort.“ However, the empirical literature is mainly con-
cerned with the effect of product market competition on productivity growth instead of firm
value. For example, Nickell et al. (1997) find that product market competition has a positive
impact on total factor productivity.5 Consistently, Januszewski et al. (2002) find for a sample of
almost 500 German firms in the manufacturing industry that firms experience higher produc-
tivity growth when operating in markets with intense competition. Grosfeld and Tressel
(2001) analyze the impact of competition and corporate governance on firm performance for
firms listed on the Warsaw Stock exchange. They find that product market competition and
good governance tend to reinforce each other.6 One exception is Habib and Ljungqvist (2004)
investigating the effect of product market competition, as measured by a Herfindahl index
based on four-digit SIC codes, on firm value. They provide evidence that firm value is posi-
tively related to product market competition.
The aim of our paper is to contribute to the still very small empirical literature on the relation-
ship between product market competition and managerial incentives. Based on a theoretical
model that incorporates both strategic interaction between firms and a principal agent rela-
tionship, we use a multivariate OLS framework to empirically investigate the relationships
between product market competition, incentive schemes, and firm valuation for Swiss compa-
nies.
We consider a principal-agent model in a Cournot oligopoly setup. Such a setup not only
takes into account the classical moral hazard problem within the firm, which is induced by the
5 See, e.g., Nickell et al. (1997) for a summary of empirical evidence on the effect of product market competition on produc-
tivity performance.
6 See, e.g., Carlin and Horvath (2000) for a summary of empirical evidence on the impact of competition on firm perform-
ance in transition economies.

unobservability of the manager’s effort, but it also incorporates strategic interaction between
the firms. The model is structured as follows: At stage one, the firm owner hires a manager
whose task is to reduce the firm’s costs. At stage two, the manager decides on his unobserv-
able effort level. At the last stage, finally, the firms compete with each other on output mar-
kets. The theoretical predictions of the model are threefold. First, the relationship between the
strength of the incentive scheme and the intensity of competition depends on the absolute
level of competition. For low levels of competition, more competition leads to weaker incen-
tives. For higher levels of competition, however, a higher intensity of competition results in
stronger incentives. Second, the marginal effect of competition on the strength of the incen-
tive schemes increases in the level of competition. Third, the effect of competition on firm
value is negative, meaning that firms in more competitive environments realize lower profits.
Our data comprises information about firm characteristics and top management’s and board of
directors’ compensation of 156 firms quoted at the Swiss Exchange (SWX) for the year 2002.
In addition, we use three different variables for measuring the intensity of competition on
product markets, namely one firm-specific and two industry-specific measures. The firm-
specific measure is based on firms’ rents from production and other business activities. The
two industry-specific competition measures are a sales-based Herfindahl index and an indica-
tor that measures the intensity of regulations for entering a new industry. We use a multivari-
ate OLS regression analysis to investigate the relationship between product market competi-
tion, managerial incentives and firm value. Based on Agrawal and Knoeber (1996) and Beiner
et al. (2004), we additionally apply a simultaneous equations framework in order to take into
account a potential endogeneity problem.
The empirical results reveal that in general a more intense product market competition is as-
sociated with stronger incentive schemes for managers, where the strength of incentives is
measured by the fraction of share-based to cash compensation. This result is consistent with

the first hypothesis of our theoretical model and suggests that firms are operating in competi-
tive environments on average. Moreover and consistent with our second hypothesis, we find
the positive influence of competition on incentive schemes to be stronger for firms operating
in a high competition environment. Finally and consistent with the third hypothesis of our
theoretical model, we find a positive but not statistically significant effect on firm value for all
three competition proxies indicating that a higher product market competition is associated
with a lower firm value. Thus, the negative effect of lower economic rents seems to outweigh
the positive effect of reducing managerial slack and increasing the managers’ effort by pro-
viding additional monitoring and increasing the threat of liquidation.
The new aspects of our paper are the following ones: It is the first study that provides empiri-
cal evidence on the effects of competition on managerial incentives and firm valuation for
Swiss companies. Furthermore, our empirical framework based on a simultaneous equations
system suggests a way to deal with the potential endogeneity problem between competition,
incentives, and firm valuation. Finally, our theoretical principal-agent model explicitly takes
into account the strategic interactions between firms without relying on the information effect
of competition and the relative performance evaluation. This feature of the model allows us to
formulate our hypothesis in terms of observable variables, which makes it particularly attrac-
tive for empirical tests.
The paper is structured as follows. The theoretical model and our main hypotheses are in sec-
tion 2. Section 3 describes the data. The empirical analysis is in section 4, and section 5 com-
prises some robustness tests. Section 6 concludes.

2. Theoretical model and main hypotheses
2.1. The setup
The purpose of our model is to investigate the effect of product market competition on the
incentive schemes for managers and the value of the firm when there are strategic interactions
between the market players.7 We consider a principal-agent model within a Cournot oligopoly
setup, where the owner of the firm hires a manager to reduce marginal costs. In contrast to
other work, our model neither relies on the information effect of competition, nor on relative
performance evaluation, which both impose rather strong constraints in terms of observability
of certain variables. The model has three stages. At stage one, the owner of firm i hires a ma-
nager who has to reduce the costs of the firm. At stage two, the manager provides effort that
affects the firm’s marginal production cost. At stage three, the owner decides on the output
level, profits are realized and the manager gets paid.
Each firm i has constant marginal costs given by ( )i i ic c e u= − − , where c is a constant, ie
is the effort level exerted by the manager, and iu is a random term that is assumed to be nor-
mally distributed with zero mean, variance 2σ , and is independent of the other firms’ shocks.
The manager’s effort level is not observable. The owner of the firm can only observe the real-
ized costs ic , which are also contractible. There are no fixed costs. The owner of the firm of-
fers the manager a linear compensation scheme that is a function of the observed cost reduc-
tion, i.e.,
( )i i i iw c cα β= + − (1)
7 Our model is similar to Raith (2003), who considers the effects of competition on incentives within a circular city model
with an endogenous determination of market structure.

The parameter iα denotes the fixed part of the salary, and iβ is the piece rate that ties the
manager’s wage to the performance of the company, and ( )ic c− is the observed cost reduc-
tion. Given that the cost reduction affects the profitability of the firm, we can interpret iβ also
as pay-for-performance sensitivity.8
The utility of the manager is given by ( )[ ]{ }ii egwr −−− exp , where r, with r>0, is the man-
ager’s degree of risk aversion, which we assume to be constant, and 2( ) / 2i ig e ke= is his dis-
utility of exerting effort, with 1k > . The expected value of the manager’s wage is thus
i i ieα β+ with variance of 2 2iβ σ . Given the normal distribution of iu , the utility of the man-
ager can be written as in (2), i.e.,
22
222ii
iiiiker
eU −−+=σβ
βα (2)
The manager accepts any contract ( , )i iα β that gives him an expected utility of at least his
reservation utility, which we normalize to zero.
The inverse demand function of firm i is given by (3):
( , ) , 1,..., , i i i i j jjp q q a bq d q i j N i j− = − − = ≠∑ (3)
where a, with 0a > and a c> , is the size of the market, b is a positive constant, and qi is
firm i’s output. The variable qj is the output of firm i’s rival j. The coefficient jd , with
0 jd b< < , captures the degree of product differentiation between the products on the market.
The larger jd , the closer substitutes the products are. The parameter jd is commonly used to
measure the degree of competition in a market, where higher values imply a more intensive
8 See, e.g., Jensen and Murphy (1990) and Murphy (1999).

competition.9 To keep things simple, we set b=1 and ,i jd d d i j= = ∀ ≠ . We further assume
that there are only two firms in the market. We are looking for the subgame perfect equilib-
rium of the game. Therefore, we solve the model by backwards induction.
2.2. The firm’s output decision
At t=3, the firms simultaneously choose their output levels. The profit of firm i gross of ma-
nagerial compensation is given by (4).
2 ,1, ,)()( =−−−=−= jiqcdqqaqcp iijiiiiπ (4)
From maximizing (4) with respect to iq and solving for iq we get the firms’ reaction func-
tion, i.e.,
( )( ) , , 1,2
2i j
i j
a c dE qq q i j
− −= = (5)
If firm i’s rival is expected to set a quantity of ( )jE q , the resulting profit of firm i is as in (6).
2( ( ))( , ( )) , , 1,2
2i j
i i ja c dE q
c E q i jπ− −
= =
(6)
Simultaneously solving the system of two equations as given by (5) yields the equilibrium
quantities of the third stage as a function of the firm’s own marginal costs ic and the rival’s
expected costs ( )jE c , i.e.,
2 ,1 , ,)4(
))(()(22
*** =−
−−−= ji
d
cEadcaq ji
i (7)
9 See, e.g., Graziano and Parigi (1998).

From substituting (7) into (3) we obtain the equilibrium price given by (8) and can compute
the expected gross profits as given by (9):
2***
2
2( ) ( ( )), , 1,2
(4 )i j i
i
a c d a E c d cp i j
d
+ − − −= =
− (8)
2 ,1 , ,)4(
))(()(22
2*** =
−
−−−= ji
dcEadca ji
iπ (9)
2.3. The manager’s effort decision
At t=2, the manager of firm i chooses his effort level by maximizing his utility given in (2):
2 2 21max , 1,2
2 2ii i i i i i
e
kU e r e i jα β β σ= + − − = (10)
Differentiating (10) with respect to ei yields the effort level as a function of the compensation
parameter iβ , i.e.,
( ) , 1,2ii ie i j
kβ
β = = (11)
The individual rationality constraint (IRC) of the manager i is given by
2 2 210 , 1,2
2 2i i i i ik
e r e i jα β β σ+ − − ≥ = (12)
where the manager’s outside utility is normalized to zero. Assuming competitive labor mar-
kets, the (IRC) is binding, which also means that (12) holds with equality. This allows us to
calculate the fixed salary component iα the manager has to be paid in order to have a reserva-
tion utility of zero.

2 2** (1 )
( ) , 1,22
ii i
kri j
kβ σ
α β−
= − = (13)
The manager’s wage as a function of iβ is then given by
2 2** (1 )
( ) ( ) , 1,22
ii i i i
krw c c i j
kβ σ
β β−
= − + − = (14)
2.4. The optimal incentive scheme
At the first stage of the game at t=1, the owner of the firm chooses the incentive scheme for
the manager. He maximizes his expected profit net of the manager’s wage, which is given by
(9) minus (14). Using ( )i i ic c e u− = + , ( ) /i i ie kβ β= , and ( ) 0iE u = , the net expected profit
is given by (15).
2 ,1 , ,2
)1()4(
))(())((2)(
22
22
2
, =−−
+−
−+−−
= jikk
krd
acEdk
cai
ii
ji
iinetβ
βσβ
β
βπ (15)
Differentiating (15) with respect to iβ and solving for iβ leads to
2 ,1 , ,8)4)((
)))(()(2(42222i =
−−+
−+−= ji
drkk
acEdcak j
σβ (16)
In a symmetric equilibrium, all firms choose the same piece rate β , and each manager
chooses the same effort level e . Accordingly, kceccE j /)( β−=−= . Substituting this ex-
pression into (16) and solving for β leads to (17), the optimal incentive parameter.
4)842)((
)(42322
*
−++−−+−
=dddkrk
cakσ
β (17)

To find the equilibrium quantity and profit net of managerial compensation, we plug (17) into
the corresponding second-stage equilibrium values, which yields the following results:
4)842)(())(4)((
2322
222*
−++−−+−−+
=dddkrk
cadkrkq
σσ
(18)
[ ][ ]
4)842)((
8)4)(())(1(2 2322
222222*
+−−++
−−+−+=
dddkrk
dkrkkcakrnet
σ
σσπ
(19)
2.5. The effects of competition on the strength of incentive schemes and firm
value
How does competition affect the optimal pay-for-performance sensitivity β* and firm value?
Following Graziano and Parigi (1998), we use the degree of product differentiation d as a
proxy for the intensity of competition. The larger d, the closer substitutes the products are,
and the higher the intensity of competition. As to firm value, we look at the profit net of man-
ager’s compensation.
From differentiating the optimal pay-for-performance sensitivity as given by (17) with respect
to competition measure d, we obtain
[ ]2 2322
22*
4)842)((
)1)(23)(2)((4
+−−++
+−+−=
∂∂
dddkrk
krddcakd σ
σβ (20)
To obtain the sign of this expression, we only need to look at the numerator since the denomi-
nator is always positive. Given that a c> by assumption, this expression is positive iff
2 / 3d > . It follows that the owner of the firm more closely ties the manager’s wage to the
performance of the company once the intensity of product market competition has reached a
certain level. This leads us to our first hypothesis.
Hypothesis 1: A higher intensity of product market competition, as measured by the degree of
product differentiation d, leads to stronger incentive schemes for the manager in case the in-
tensity of product market competition exceeds a certain level, i.e., *
0 d
β∂>
∂ for d>2/3.
Obviously, there are different effects at work. First, there is a business stealing effect: a higher
value of d implies a more elastic demand, which makes it easier for a firm with a cost advan-
tage to take away business from its rival. Accordingly, for a given quantity of its rival, a more
intensive competition increases a firm’s marginal benefit of reducing its costs. Given this first
effect, the firm wants to give stronger incentives to its manager with increasing competition,
leading to lower marginal costs. However, there is a second effect at work that can be denoted
as a scale effect: a higher value of d also leads to a drop in firm i’s output.10 This decreases the
firm’s gain from reducing its costs and leads the firm to give weaker incentives to the man-
ager when competition is increasing. While the second effect, the scale effect, is dominating
for lower values of d, the formerly described business stealing effect starts to dominate once
the degree of competition has reached a certain level, i.e., for values of d>2/3. Accordingly,
for lower values of d, the incentive parameter β is decreasing when the intensity of competi-
tion is increasing; for higher values of d, in contrast, the incentive parameter β is increasing
in the intensity of the competition parameter. In other words: For values of d>2/3, firms pro-
vide stronger managerial incentives because greater competition increases the value of mak-
ing good decisions.
10 This can best be seen by differentiating the equilibrium output level as given by (18) with respect to d, which is clearly
negative. From an economic point of view, the willingness to pay for the product of firm i decreases with a higher value of
d, i.e., the closer substitutes the products are. As we can see from firm i’s reaction function as given by (5), a higher value
of d leads to a lower output for firm i. This is to compensate the fall in profits due to the lower price.
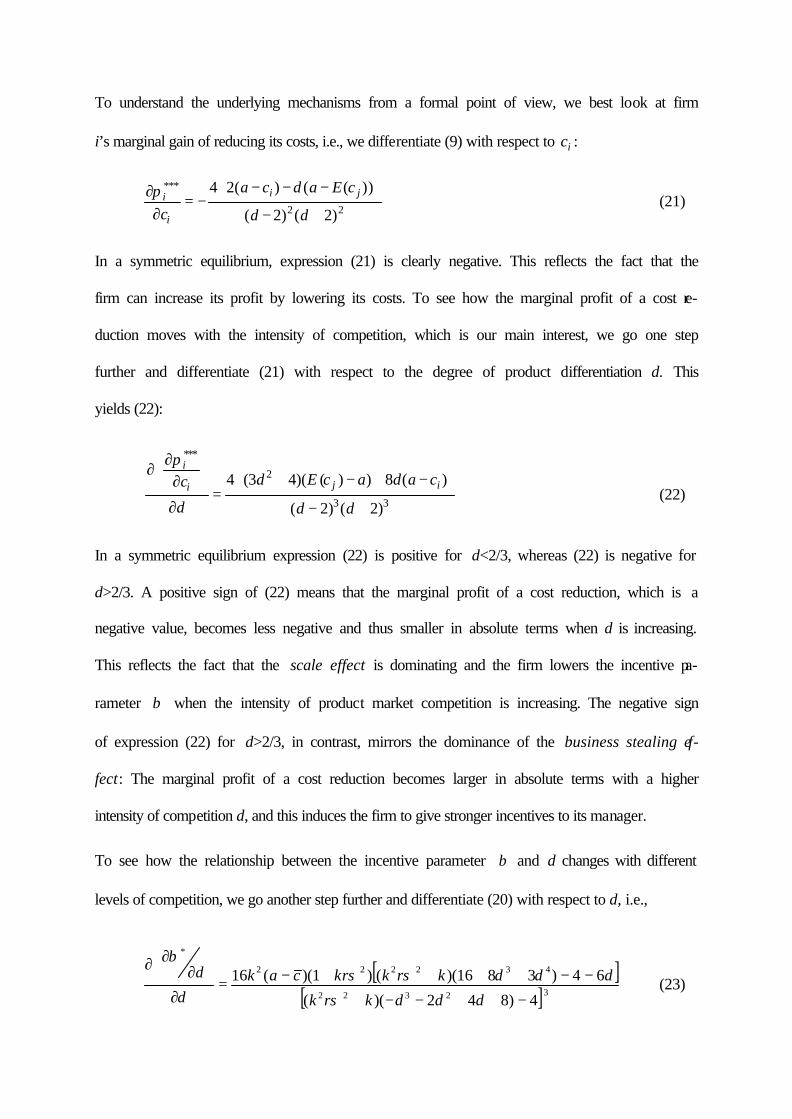
To understand the underlying mechanisms from a formal point of view, we best look at firm
i’s marginal gain of reducing its costs, i.e., we differentiate (9) with respect to ic :
***
2 2
4 2( ) ( ( ))
( 2) ( 2)i ji
i
a c d a E c
c d dπ − − −∂ = −∂ − +
(21)
In a symmetric equilibrium, expression (21) is clearly negative. This reflects the fact that the
firm can increase its profit by lowering its costs. To see how the marginal profit of a cost re-
duction moves with the intensity of competition, which is our main interest, we go one step
further and differentiate (21) with respect to the degree of product differentiation d. This
yields (22):
***
2
3 3
4 (3 4)( ( ) ) 8 ( )
( 2) ( 2)
i
j ii d E c a d a cc
d d d
π ∂∂ + − + −∂ =
∂ − + (22)
In a symmetric equilibrium expression (22) is positive for d<2/3, whereas (22) is negative for
d>2/3. A positive sign of (22) means that the marginal profit of a cost reduction, which is a
negative value, becomes less negative and thus smaller in absolute terms when d is increasing.
This reflects the fact that the scale effect is dominating and the firm lowers the incentive pa-
rameter β when the intensity of product market competition is increasing. The negative sign
of expression (22) for d>2/3, in contrast, mirrors the dominance of the business stealing ef-
fect: The marginal profit of a cost reduction becomes larger in absolute terms with a higher
intensity of competition d, and this induces the firm to give stronger incentives to its manager.
To see how the relationship between the incentive parameter β and d changes with different
levels of competition, we go another step further and differentiate (20) with respect to d, i.e.,
[ ][ ]3 2322
432222
*
4)842)((
64)3816)(()1)((16
−++−−+
−−++++−=∂
∂∂∂
dddkrk
dddkrkkrcakd
d
σ
σσβ
(23)

Expression (23) is positive, which also means that the marginal effect of competition on the
incentive parameter becomes stronger with increasing competition. To see this, we only need
to look at the square brackets in the numerator since all other expressions including the de-
nominator are positive, given that d<1. Within the square bracket, the product is always equal
to or bigger than 16, since k is equal to or bigger than one and r is positive. Therefore, the
considered expression in the square brackets is positive for all values of d (to remember:
10 ≤≤ d ). This expression becomes even larger with higher values of k. These considerations
lead us to our second hypothesis:
Hypothesis 2: The marginal effect of competition on the incentive parameter β increases with
the intensity of product market competition, as measured by the degree of product differentia-
tion d, i.e.,
*( )
0dd
β∂∂ ∂ >∂
d∀ .
Let us now consider the effect of competition on firm value. For this purpose we differentiate
the net profit as given by (19) with respect to d, which yields (24).
[ ][ ]3 2322
342222222*
4)842)((
88)16164)(()2()()1(2
−++−−+
+−−+−++−+=
∂∂
dddkrk
ddddkrkdcakkrdnet
σ
σσπ (24)
Expression (24) is clearly negative: From before, we know that the denominator is always
positive. As to the numerator, we only need to look at the expressions in the square brackets
since all other expressions are positive. Within the square bracket, the product is always equal
to or bigger than -16, since k is equal to or bigger than one and r is positive. Since 1>k and
(8d + 8) is equal or smaller than 8 for all values of d, the expression in the square bracket is
always negative. These considerations lead us to our third hypothesis.
Hypothesis 3: A higher intensity of product market competition, as measured by the degree of
product differentiation d, leads to a lower net profit, i.e. *
0 net
dπ∂
<∂
d∀ .

The explanation of this result is straightforward and stands in line with standard oligopoly
models. The closer we move to perfect competition in terms of having more homogenous
products, c.p., the lower the profits of the firms are.
The hypotheses derived from our theoretical model are subject of our empirical tests in sec-
tions 4 and 5.
3. Data and sample
3.1. Definition of variables
3.1.1. Product market competition
In this section we provide a detailed description of the variables we use in our empirical
analysis. Similar to Nickell (1996), Nickell et al. (1997) and Grosfeld and Tressel (2001), our
standard measure of product market competition is a firm’s rents from production and other
business activities, Rents, which can be interpreted as an ex-post measure of market power.
The motivation for using this measure is that firms operating in less competitive markets
should be able to sell their products well above marginal costs and, therefore, earn higher
rents after covering their expenses. We define Rents as profits before interest payments, tax,
and depreciation (EBITDA) minus the costs of capital (cc) multiplied by total assets (TA) and
standardized by the company’s sales (SA):
( ) SATAccEBITDARents /⋅−= .
The costs of capital (cc) are defined as follows:
( )fmf rrrcc −⋅++= βλδ ,

where rf is the risk free rate, δ is the rate of depreciation, λ is equal to the equity ratio of the
firm, β is the estimated market beta of the firm’s stock, and rm is the return to a broad market
index. The risk free rate is calculated as the average one month Swiss Interbank Rate over 60
monthly values from January 1997 to December 2001 and amounts to 1.92%. Following
Nickell (1996), the depreciation rate is assumed to be constant at 4 percent.11 The equity ratio,
λ, is calculated as 1 minus the ratio of total (non-equity) liabilities to total assets.12 The mar-
ket beta, β , is estimated by regressing the firm’s monthly stock returns over the past five years
on the respective returns of the market as proxied by the Swiss Performance Index (SPI).13
The risk premium is equal to the average return of the Pictet-Rätzer Index, a broad Swiss
stock market index, less the average short-term interest rate (the one month Swiss Interbank
Rate).
The main drawback of this measure of ex-post monopoly power is that it is strongly correlated
not only with market power, but also with profitability, whatever the precise definition chosen
(see also Nickell, 1996). Since we analyze the impact of product market competition on firm
valuation and firm value is expected to be positively correlated with profitability, we may
obtain a positive bias in our results. In fact, as our empirical results in Section 4 reveal, Rents
affects firm value positively. To mitigate this potential bias, we control for the influence of
profitability on Tobin’s Q by including an alternative measure, namely the return on assets,
into our regression analysis.
11 Alternatively, to test the robustness of our results to this assumption, we apply a second measure of rents based on a rate of
depreciation of 8 percent, labeled as Rents8. The results change only immaterially (see Tables 8 and 9 in the robustness
section).
12 Following Nickell (1996), we also apply an alternative measure of rents, RentsL1, where λ is set equal to one. The results
remain basically unchanged as Tables 8 and 9 in the robustness section reveal.
13 For firms with more than one share category all variables related to stock return data are weighted based on nominal val-
ues. Firms with return data not available for the full period of 60 months are not excluded from our sample if return data
could be obtained for at least 9 months.

In addition to the firm-specific competition indicator Rents, we employ two alternative indus-
try-level measures of product market competition that are presumably not afflicted with this
problem. Specifically, we use a sales-based Herfindahl index, Herf, and an indicator measur-
ing the level of regulation for new industry entrants, Reg, as additional proxy variables for
competition. Herf is calculated as follows:
2
1 1∑ ∑= =
=
jN
i
jN
iijij SASAHerf ,
where SAij is the sales attributable to firm i in industry group j, where industry groups are
based on the classification of the Swiss Exchange (SWX). Each industry group comprises all
quoted Swiss firms and not only the firms in our sample. As argued by Aggarwal and Sam-
wick (1999), the Herfindahl index can be used as a proxy for product substitutability. Of
course, there are also some problems associated with the use of Herf as a measure of market
power. First, Herf does not take into account foreign competitors, a problem, which is likely
to be especially severe in a small open economy as Switzerland. Second, our classification of
industry groups is arbitrary and may not represent anything like the relevant product market
for the firms included in the respective industries.14 Third, actual as well as potential competi-
tion influences the market power of firms within an industry and Herf does clearly not take
into account the latter. Rents, on the other hand, is supposed to be much less afflicted with
these problems.
Our third competition proxy, Reg, measures the intensity of legal regulations for firms enter-
ing a new industry. This indicator is unique in the sense that is only available for Switzerland
in this form. It goes back to a study that was commissioned by the Swiss government and is
described in detail in Ledergerber et al. (1998). The purpose of the study was to build a simple
14 To investigate this issue, we use an additional variation of Herf, which is based on an alternative industry definition, in the
robustness section. In fact, we find some of the results to depend on the precise definition of Herf.

indicator that measures the intensity of regulations by law area and by industry in Switzer-
land. The industry classification includes 32 industrial sectors and is based on the NOGA In-
dustry Classification System.15 Without going too much into details, the construction of the
indicator can be described as follows: In a first step, the relevant regulations imposed by fed-
eral law were classified into the five categories Information Rules, Qualitative Standards,
Quantitative Standards, Permits, and Implementation by Cantons. This categorization goes
back to Ogus (1994) and reflects the strength of regulations, in ascending order, and the im-
plied costs for firms. The category Information Rules is the weakest form of interventions,
whereas Permits represents the strongest regulation category.16 In a second step, the number
of regulations by law area and by regulation category was derived. In addition, the industries
affected by each regulation were identified. Finally, the indicator was built by first allocating
specific weights to the number of regulations by categories, where stronger regulations got
larger weights, and then by building the sum of these weighted numbers. The higher the value
of the indicator, the stronger is the impact of regulations for firms.
The regulation indicator Reg that we use in our study is a variation of the general indicator as
described above. It is based on a smaller set of regulations that are specifically relevant for
market entry. The weakest forms of interventions are categorized under Market Regulations,
which include activities related to certifications, registrations or type tests of new products.
The second category refers to Permits the firms have to apply for by the governmental au-
thorities. The final category is denoted by Professional Licences, which are a recognized cer-
tification of professional capabilities. The higher the value of the indicator Reg, the stronger is
the impact of the regulations for firms entering a new market.
15 NOGA stands for Nomenclature Générale des Activités Economiques.
16 The category Implementations by Cantons was introduced to fit the specific characteristics of the Swiss system. It is paral-
lel to the other categories and does not represent the strongest form of regulation.

Given that these regulations are barriers to entry, fewer firms are expected to enter in highly
regulated industries. Therefore, we interpret a high value of Reg as a low intensity of product
market competition. Note that we divided the original values as reported in the study by Led-
ergerber et al. (1998) by 1000. Also, the information refers to the time period before 1998.
We are aware of the fact that this indicator is not perfect, and it is vulnerable to all sorts of
criticism. The weighting procedure, for instance, is not based on some objective criteria and is
therefore rather arbitrary. Furthermore, the analysis is limited to federal law only, and the
considered regulations mainly refer to small and medium companies. Nevertheless, this regu-
lation indicator is still useful in the sense that it gives us some indication about the costs asso-
ciated with entering a new industry or market, and this type of information is hardly available
elsewhere.
Since all three proxy variables for product market competition measure different aspects of
competition and, hence, are afflicted with other problems, it makes perfectly sense to include
all three variables simultaneously into the empirical investigations. To cope with a potential
endogeneity problem related to our competition measures, we use lagged values for Rents and
Herf. That is, in contrast to the other variables, which in general refer to the reporting period
from January 2002 to December 2002, our competition proxies are based on 2001 data.17
3.1.2. Measuring incentives for managers
To measure the incentive schemes provided to managers, we use the percentage value of
shares alloted in 2002 to the firm’s officers and directors in total relative to cash compensa-
tion paid during the same year, Sratio. Besides the fraction of share-based to cash compensa-
tion to the firm’s officers and directors, this paper considers four additional corporate govern-
17 The results obtained by using 2002 data for the competition proxies are reported in Tables 8 and 9 in the robustness sec-
tion.
ance mechanisms, which are assumed to provide incentives to managers and therefore allevi-
ate the agency problems between managers and shareholders (see Beiner et al., 2004). Stock-
sod is the sum of all shares owned by officers and executive as well as non-executive mem-
bers of the board divided by the total number of shares outstanding.18 Blocko denotes the per-
centage of cumulated voting rights exercised by large outside investors with voting rights ex-
ceeding 5%. Outsider refers to outside membership on the board, measured by the percentage
of board seats held by directors without any executive function. Leverage denotes firm lever-
age and is calculated as the ratio of total (non-equity) liabilities to total assets.
Besides these corporate governance mechanisms, we employ eight different control variables
in this paper. Firm size is measured by the natural logarithm of total assets and is labeled
Lnassets. As a measure of profitability, we include the return on assets, ROA, which is calcu-
lated as operating profit in 2002 divided by the average of the 2002 starting and ending value
of total assets. Pgrowth is the average annual sales growth over the past three years (2000-
2002). As it is standard in the literature on the relationship between pay and performance, we
use the change in shareholder value, CSV, as a measure of firm performance in our investiga-
tions related to Sratio. Following Jensen and Murphy (1990) and Funk and Wanzenried
(2003), we define CSV as the return on equity multiplied by the market value of equity in the
previous period. Stdv is the standard deviation of 60 monthly returns of a firm’s stock. Beta is
the market beta estimated by regressing the firm’s monthly stock returns over the past five
years on the respective returns of the market as proxied by the Swiss Performance Index
(SPI). CEOP is a dummy variable which is equal to one if the chief executive officer (CEO) is
also president of the board of directors and zero otherwise. To control for industry effects, we
18 Weighting has to be based on nominal values because market values are not available for all share categories of the firms
in our sample. However, Schmid (2004) shows that for the 116 firms of his total sample of 145 Swiss firms for which he
has market values for all existing share categories, the values of Stocksod are very close to those obtained by using nomi-
nal values to weigh the ownership of different share categories.

include 9 dummy variables, labeled Industry, which are equal to one if the firm belongs to a
particular economic sector based on the classification of the Swiss Exchange (SWX) and zero
otherwise.
Finally, our measure of firm valuation is Tobin’s Q, alternatively simply labeled as Q. As
suggested by Chung and Pruitt (1994), Perfect and Wiles (1994), Agrawal and Knoeber
(1996), Kang and Stulz (1996), and Loderer and Peyer (2002), among others, Tobin’s Q is
estimated as the ratio of the market value of equity plus the book value of debt to the book
value of total assets. To avoid that fluctuations in the market value of firms’ equity influence
our results, we follow Beiner et al. (2004) and Schmid (2004) and compute the market value
of equity as the mean of daily observations during 2002.19 Definitions of all variables em-
ployed in this study are also provided in Table 1.
[Insert Table 1 about here]
3.2. Sample description
As a starting point we target all 275 firms quoted at the Swiss Exchange (SWX) by the end of
2002. The exclusion of investment companies leaves us with a sample of 235 firms. Compen-
sation data (Sratio, Stocksod) is available for 171 firms. Another 13 firms must be dropped
because no data on Rents, our standard measure of product market competition, is available.
Finally, the exclusion of two obvious outliers concerning their value of ROA and Rents leaves
us with a sample of 156 firms for our cross-sectional regression analysis.
19 For some firms daily stock price data is not available for all share categories on Datastream, and we replace them by the
mean of the 2001 and 2002 year end values of total market capitalization obtained from Worldscope.

Data has been collected from different sources and generally refers to the reporting period
from January 2002 to December 2002. The necessary data to compute Rents, Herf, Q, Lever-
age, Lnassets, ROA, Pgrowth, CSV, Stdv, and Beta were obtained from Datastream and
Worldscope. Data for the variables Blocko, Bsize, Outsider, and CEOP stems from the web-
site of “Finanz & Wirtschaft”20 and the “Swiss Stock Guide 2002/2003”. However, for most
variables data was not available for all firms in our sample. Missing values were obtained
from the companies’ annual reports. Sratio and Stockod have been directly collected from the
2002 annual reports of the companies covered in this study. Reg is taken from the report “Re-
gelungsdichte nach Branchen” by Ledergerber et al. (1998). Finally, the variable Industry is
based on the classification of the Swiss Exchange (SWX) and stems from the SWX website.21
3.3. Descriptive statistics
Table 2 shows descriptive statistics of all variables included in our analysis. The negative av-
erage value of Rents indicates that Swiss firms destroyed value in 2001, on average.22 How-
ever, the median value is positive and amounts to 2.9%. The mean and the median of Herf are
quite similar; 0.412 and 0.409, respectively. Reg takes on average a value of 1.27. It has a low
of 0.72 for the information technology industry, and a high of 3.26 for the travel industry,
which faces the highest market entry regulations. The average value of Tobin’s Q is 1.41, and
the median is 1.13, indicating that Swiss firms, on average, invest in positive NPV projects.
20 The website of “Finanz und Wirtschaft”, Switzerland’s major financial newspaper, is: www.finanzinfo.ch.
21 The website of the Swiss Exchange is: www.swx.ch.
22 Two different reasons may be responsible for this somewhat surprising finding. First, 2001 was a worldwide down-market
and many firms experienced substantial losses. Second, our measure of profits included in the calculation of Rents
(EBITDA) contains a number of balance sheet items that can potentially distort the economic content of this variable, re-
sulting in values of EBITDA that are downward-biased measures of raw operating surplus (e.g., see Januszewski et al.,
2002).

Concerning our measure of incentive schemes provided to managers, Sratio, we find that total
share-based compensation to officers and directors amounts to 5.7% of cash-based compensa-
tion, on average, while the median value is zero. These quite small values are not surprising as
Murphy (1999) shows, that stock (and option) participation plans for the top management are
relatively rare in Switzerland and account for a much smaller fraction of total compensation
than in most other countries and especially as compared to the US.23
Table 2 further shows several other interesting results, which we only briefly summarize: Of-
ficers and directors hold on average 16.5% of the equity of a firm. However, the median of
2.6% is much smaller, indicating that there are some firms in our sample where officers and
directors hold very large fractions of total equity. A comparison of these values to the samples
of U.S. firms used by Loderer and Martin (1997) and Anderson et al. (2000) confirms that
average insider shareholdings are even slightly higher in Switzerland than in the U.S. How-
ever, the median is a lot smaller in our sample and, hence, insider shareholdings are much
more skewed in Switzerland. Many other firm characteristics are comparable to those reported
by other studies in this area. However, the mean value of Blocko of 28% is much larger than
the value of 7.6% reported by Anderson et al. (2000) for the U.S. Similarly, the average value
of Outsider is 87.9%, which strongly differs from the much lower values of 54% and 60%
reported by Yermack (1996) and Barnhart et al. (1994), respectively, for U.S. companies and
44% reported by Peasnell et al. (2003) for U.K. companies. This finding is especially surpris-
ing, because founding families are still regarded as an important factor in corporate Switzer-
land.
23 Murphy (1999) compares the level and structure of CEO pay in 23 countries based on data reported in Towers Perrin’s
1997 ‘Worldwide Total Remuneration’ report. Due to the increasing importance of option-based pay, it is obvious that
Sratio is an incomplete measure of the incentive schemes provided to officers and directors. Hence, it would be interesting
to enhance our analysis by using the fraction of share- and option-based pay to cash compensation as an alternative, and
arguably more complete, measure of the incentive schemes provided to managers. Unfortunately, data on option allotment
and ownership is very sparse for Swiss companies in 2002.

[Insert Table 2 about here]
3.4. Correlations
Table 3 shows the correlation coefficients between all variables included in the empirical
analysis of Section 4. Of special interest are the correlation coefficients between Rents, Herf,
Reg, Sratio, and Q. Consistent with the implications of our theoretical model, we find a posi-
tive correlation coefficient between Rents and Q and a negative and significant coefficient
between Rents and Sratio. Based on our theoretical model, this latter result suggests that firms
may be operating in competitive environments on average, where more intensive product
market competition is associated with stronger incentives provided to managers by increasing
the fraction of share-based compensation (see hypothesis 1). The relatively high and statisti-
cally significant positive correlation coefficient between Rents and ROA is expected as men-
tioned in Section 3.1. Consistent with the main hypothesis of Raith (2003), the correlation
coefficients between all three competition proxies and Beta and Stdv are negative. Raith
(2003) argues that firms operating in an intensive competition environment experience a
higher volatility of profits, which, in turn, leads to higher stock price volatility and arguably
higher market betas.
With respect to the two other measures of competition, we find a negative correlation coeffi-
cient between Herf and Q and a significant positive relation between Reg and Q, indicating
that the different product market competition proxies measure different aspects of competi-
tion. The correlation between Herf and Sratio is positive and that between Reg and Sratio
negative but both coefficients are not statistically significant. Furthermore, Rents is negatively
correlated with Herf and positively correlated with Reg. However, both correlations are weak
and not statistically significant, confirming the conjecture that all three proxy variables for
competition measure different aspects of product market competition.24 Thus, we conclude
from this correlation analysis that our empirical investigation should include both firm-level
as well as industry-level measures of competition.
Let us finally look at the corporate governance mechanisms. Sratio and Stocksod are posi-
tively correlated with Q, while Blocko, Leverage, and Outsider are negatively correlated with
Q. Rents is only very weakly correlated with all corporate governance mechanisms (besides
Sratio) and no coefficient is statistically significant. The same is true for Herf and Reg with
the exception of significant correlation coefficients between Stocksod and Herf and Stocksod
and Reg. Sratio is negatively correlated with Blocko indicating possible substitution effects
between the monitoring by large outside blockholders and using share-based compensation to
tie the personal wealth of officers and directors to their company’s performance. As the posi-
tive and statistically significant coefficient between Sratio and Lnassets indicates, share-based
compensation seems to be more common in large than in small firms. Interestingly, a CEO
who is by the same time president of the board seems to be associated with higher values of
Sratio as well. Finally and consistent with earlier empirical findings (e.g., see Jensen and
Murphy, 1990, or Funk and Wanzenried, 2003), we find a significantly positive correlation
coefficient between Sratio and firm performance as measured by the change in shareholder
value (CSV).
[Insert Table 3 about here]
24 Hence, collinearity problems should not be likely when using all three competition measures simultaneously in the empiri-
cal analysis.

4. Empirical analysis
4.1. Comparisons of firms operating in an intensive competition environment and
other firms
We begin our empirical analysis by investigating whether there are systematic differences
with respect to the variables employed in this study between firms operating in an intensive
competition environment and firms which do not. Table 4 presents comparisons of mean and
median values between firms with a value of Rents equal to or above the median value (non-
competition firms) and firms with a value of Rents below the median value (competition
firms).
Most importantly, we find that non-competition firms have significantly higher values of
Tobin’s Q than competition firms. This indicates that the lower economic rents, and therefore
profits, associated with a higher product market competition outweigh the potential benefits of
reducing managerial slack. Such a finding is consistent with our third hypothesis. Furthermore
and consistent with our theoretical model, Sratio is higher for competition firms. Even though
the difference is not statistically significant at any conventional level, this outcome may pro-
vide some evidence for our theoretical findings that the relationship between the strength of
incentives and the intensity of competition differs depending on the level of product market
competition. In particular, it is consistent with our second hypothesis, stating that the relation-
ship between incentives and competition becomes steeper with increasing competition.
Table 4 furthermore reveals a significantly higher profitability, as measured by ROA, of non-
competition firms. This result is expected since ROA and Rents are correlated by construc-
tion.25 For the same reason, the significantly higher mean and median values of the change in
shareholder value CSV, which is also some measure of profitability, of non-competition firms
25 As Table 3 reveals, the correlation coefficient between ROA and Rents is 0.342 and statistically significant at the 1% level.

as compared to competition firms comes as no surprise.26 The finding of significantly higher
leverage ratios of competition firms stands in line with Lord and McIntyre Jr. (2003), who
provide evidence for leverage increasing with import competition in the textile and apparel
industry.27 Finally, competition firms have significantly higher mean and median values of
Stdv and Beta. A possible reason for that finding is that firms operating in an intensive compe-
tition environment experience a higher volatility of profits (e.g., see Raith, 2003), which, in
turn, leads to higher stock price volatility and arguably higher market betas.
[Insert Table 4 about here]
4.2. Multivariate OLS-regressions
In this section, we investigate the influence of product market competition on Sratio and
Tobin’s Q by controlling for different governance mechanisms and control variables in a mul-
tivariate regression framework. First, we motivate the regression equation aimed to investi-
gate the determinants of Sratio and report the results of OLS estimations. Then, we examine
the effect of competition on Tobin’s Q.
26 Given the construction of Rents, non-competition firms are either firms, which are not operating in an intensive competi-
tion environment or just highly efficient firms. Hence, it is important to carefully control for profitability in a multivariate
framework to assess whether competition as measured by Rents affects firm value. In fact, when we repeat the univariate
analysis in Table 4 for Herf, we find higher mean and median values of Tobin’s Q and ROA for competition than non-
competition firms. In contrast, when we use Reg to distinguish between competiton and non-competition firms, we again
find higher values of Q and ROA for non-competition firms.
27 Other work on the relationship between leverage and competition include Brander and Lewis (1986), Maksimovic (1988),
Chevalier (1995), Kovenock and Phillips (1995), Phillips (1995), and Zingales (1998).

4.2.1. The effect of product market competition on incentive schemes
Since our main interest is to investigate the effect of product market competition on incentive
schemes, we include Rents, Herf, or Reg as a first explanatory variable into our regression
equation with Sratio as a dependent variable. Because managers are more likely to accept
share-based compensation when they are confident that their company will do well and it is
beneficial for them to participate on this success, we include Tobin’s Q as a forward-looking
performance measure of the firm. To investigate whether there are any interrelations between
Sratio and other governance mechanisms (e.g., see Beiner et al., 2004), we also include Stock-
sod, Blocko, Leverage, and Outsider.
Besides the measures of product market competition and governance mechanisms, we include
four control variables. The first is firm size, Lnassets. Because larger firms operating in an
international environment are more likely to adopt share-based compensation, we expect Sra-
tio to be higher for larger firms. As it is standard in the literature on the relationship between
pay and performance, we use the change in shareholder value, CSV, as an additional control
variable. CSV is expected to have a positive impact on Sratio.28 In contrast, we expect Sratio
to be lower where the costs of the shareholdings are higher. As a measure of these costs,
which arise mainly from holding an under-diversified portfolio, we use the standard deviation
of 60 monthly returns of a firm’s stock, Stdv. Thus, we expect Sratio to be negatively related
to Stdv. The fourth control variable we include into our regression equation is CEOP. The
concentration of power associated with a CEO who is by the same time president of the board
may increase the demand for aligned interests. Thus, we expect managers and directors, but
especially the CEO, to be compensated by a higher fraction of performance dependent wages.
28 In the regression equations including Rents as an explanatory variable, we additionally control for accounting profitability
by including ROA. ROA is always positive but never statistically significant and the results (not reported) remain basically
unchanged.

Finally, to control for industry effects, we include eight dummy variables, Industry. Summa-
rizing, the regression equation is:
iijj
j
iiiii
iiiiii
Industry
CEOP StdvCSVLnassetsOutsider
LeverageBlockoStocksodQRents Sratio
εα
ααααα
αααααα
+⋅
+⋅+⋅+⋅+⋅+⋅+
⋅+⋅+⋅+⋅+⋅+=
∑=
+
8
110
109876
543210
(4.1)
The results of an OLS estimation of equation 4.1 are reported in Column 1 of Table 5. Consis-
tent with our theoretical model, we find a negative, although not quite statistically significant,
coefficient on Rents. This indicates that a more intense product market competition is associ-
ated with stronger incentive schemes for managers as measured by the fraction of share-based
to cash compensation. Therefore, firms operating in a competitive environment seem to pro-
vide stronger managerial incentives because competition raises the marginal cost of poor
managerial decisions. The significantly negative coefficient on Blocko suggests that monitor-
ing by outside blockholders reduces the demand for incentive alignment of managers and di-
rectors. This result is consistent with the findings of Agrawal und Knoeber (1996) and Beiner
et al. (2004) that large outside blockholdings are an alternative mechanism for shareholdings
by officers and directors. In contrast, as indicated by the positive and significant coefficient,
Outsider seems not to be a substitute for share-based compensation. A higher fraction of out-
siders on the board seems to enhance incentive alignments of managers and directors by in-
creasing the ratio of share-based to cash compensation. This result suggests that outside board
members encourage share-based compensation contracts. Q, Stocksod, and Leverage all have
no significant effect on Sratio.
With respect to the control variables only CSV and CEOP have a significant effect on Sratio.
Consistent with Jensen and Murphy (1990) and Funk and Wanzenried (2002), CSV has a posi-
tive influence on Sratio indicating a positive relation between the percentage of share-based to

cash compensation and past firm performance. The significantly positive coefficient on CEOP
indicates that the concentration of power associated with the CEO being president of the
board by the same time, increases the demand for share-based compensation to align the in-
terests between managers and shareholders.
Column 2 of Table 5 reports the results of an OLS regression of equation 4.1, which includes
Herf as a measure of product market competition instead of Rents. In contrast to Rents, the
coefficient on Herf is positive indicating a negative relation between competition and Sratio.
However, the p-value of 0.912 shows that Herf has basically no influence on Sratio. The coef-
ficients on all other variables are robust to replacing Rents by Herf and remain basically un-
changed.
The results of an OLS regression of equation 4.1 including Reg as competition proxy are very
similar to those obtained for Rents (see Column 3 of Table 5). Again, the coefficient is nega-
tive indicating a positive, though not significant, relation between competition and Sratio. All
other coefficients are very similar to those reported in Columns 1 and 2 of Table 5.
Since all three competition variables measure different aspects of product market competition,
we also estimate equation 4.1 by including all three measures of competition. As the results in
Column 4 of Table 5 reveal, the coefficients on Rents and Reg remain negative, but not statis-
tically significant at any conventional level. In contrast to the results reported in Column 2,
the coefficient on Herf is now also negative, indicating a positive relation between competi-
tion and incentive schemes provided to managers. The coefficients on all other variables re-
main basically unchanged. An F-test for the simultaneous significance of all coefficients (ex-
cept the constant and the industry dummies) rejects the null hypothesis that they are jointly
zero in all four equations and the adjusted R-squares are between 0.204 and 0.318.
As a direct test of our hypothesis 2, we separately estimate equation 4.1 for firms in a high
and firms in a low competition environment. We split our sample into two subsamples based

on the value of Rents. “Competition firms” are firms with a value of Rents below the median
value and “non-competition firms” are those firms with a value of Rents equal to or above the
median value. Based on hypothesis 2, which states that the marginal effect of competition on
the incentives provided to managers increases with the intensity of product market competi-
tion, we expect higher coefficients on the competition proxies for “competition firms”. In fact,
Columns 5 and 6 of Table 5 reveal that the coefficients on all three competition proxies are
higher (in absolute terms) for firms operating in a high competition environment than for
firms operating in a low competition environment.
The empirical results of this section reveal that in general a more intense product market
competition is associated with stronger incentive schemes for managers as measured by the
fraction of share-based to cash compensation. While the statistical significance of this result is
relatively weak, it is consistent with hypothesis 1 and suggests that firms are operating in
competitive environments on average. Moreover and consistent with hypothesis 2, we find the
(positive) influence of competition on incentive schemes to be stronger for firms operating in
a high competition environment.
[Insert Table 5 about here]
4.2.2. The effect of competition on firm value
To test our third hypothesis, which is to examine the effect of product market competition on
firm value as measured by Tobin’s Q, we additionally estimate an OLS regression of Q on the
three measures of competition, Rents, Herf, or Reg. Since the additional monitoring on man-
agers associated with a more intense product market competition may be a substitute for in-
centive schemes and other governance mechanisms, we also include Sratio and the four gov-
ernance mechanisms, Stocksod, Blocko, Leverage, and Outsider into the regression equation.

Finally, we include four control variables. Lnassets and Pgrowth aim to control for growth
opportunities. Thus, we expect a positive relationship between Pgrowth and Q and a negative
influence of Lnassets on Q, because growth opportunities tend to be lower for larger firms.
Based on simple valuation models, Q may additionally depend on ROA and Beta. Finally, to
control for industry effects, we again include eight dummy variables, Industry. Summarizing,
the regression equation is:
iijj
j
iiiii
iiiiii
Industry
BetaPgrowth ROA LnassetsOutsider
LeverageBlockoStocksodSratioRentsQ
εα
ααααα
αααααα
+⋅+
+⋅+⋅+⋅+⋅+⋅+
⋅+⋅+⋅+⋅+⋅+=
∑=
+
8
110
109876
543210
(4.2)
The results of estimating equation 4.2 by OLS are reported in Table 6. As Column 1 reveals,
Rents has a positive but not statistically significant effect on firm value indicating that a
higher product market competition as measured by a firm’s rents is associated with a lower
firm value. Thus, the negative effect of lower economic rents seems to outweigh the positive
effect of reducing managerial slack and increasing the managers’ effort by providing addi-
tional monitoring and increasing the threat of liquidation. This result is consistent with our
third hypothesis.29
As Columns 2 and 3 reveal, Herf and Reg have a positive effect on Q as well. However, both
coefficients are not statistically significant. Herf measures the market power of the firms in an
industry. From standard microeconomic theory it is well known that profits are higher when
firms have more market power. As to the level of regulation within an industry concerning
new market entrants, Reg, the positive effect is due to the fact that regulations are similar to
barriers to entry that protect the incumbents from competition. The positive effect of all three
29 In contrast, Habib and Ljungqvist (2004) provide evidence that firm value is positively related to product market competi-
tion.

measures of competition is robust to the estimation of a regression equation including Rents,
Herf, and Reg (see Column 4).
The coefficients on Sratio, the four governance mechanisms, and the control variables are
very similar in all four regression equations. Consistent with the findings of Schmid (2004),
Sratio has a positive but not statistically significant effect on firm value. The only statistically
significant governance mechanism is Stocksod, which is significantly positively related to
Tobin’s Q in columns (1) and (3).30 An inspection of the control variables reveals, that Lnas-
sets seems to be unrelated with Q (p-values between 0.895 and 0.998). The coefficients on
ROA, Pgrowth, and Beta are all positive, while only ROA and Beta are statistically significant.
An F-test for the simultaneous significance of all coefficients (except the constant and the
industry dummies) always rejects the null hypothesis that they are jointly zero and the ad-
justed R-squares between 0.500 and 0.507 are quite high.
The empirical results of this section are consistent with hypothesis 3 of our theoretical model.
For all three competition proxies, we find a positive but not statistically significant effect on
firm value indicating that a higher product market competition is associated with a lower firm
value. Thus, the negative effect of lower economic rents seems to outweigh the positive effect
of reducing managerial slack and increasing the managers’ effort by providing additional
monitoring and increasing the threat of liquidation.
[Insert Table 6 about here]
30 The inclusion of a quadratic term of Stocksod reveals that the relation between Stocksod and Tobin’s Q is parabolic, but
leaves all other results basically unchanged. Empirical evidence on a parabolic relationship between managerial sharehold-
ings and firm value is provided by McConnell and Servaes (1990) and Schmid (2004), for example.

4.3. The problem of endogeneity: A simultaneous equations analysis
A possible concern with respect to our OLS results is that some of our right-hand-side vari-
ables are correlated with the error term of the respective equation and, thus, that our results
are affected by a possible endogeneity of some of the variables included in our regression
equations (e.g., see Agrawal and Knoeber, 1996; and Beiner et al., 2004).
To investigate whether our results suffer from an endogeneity bias, we implement a Durbin-
Wu-Hausman test (e.g., see Hausman, 1978; and Davidson and MacKinnon, 1993) on the
endogeneity of Sratio and Q. The test involves a two-stage procedure. In the first stage, each
presumably endogenous variable (i.e., Sratio and Q) is regressed on all other variables in-
cluded in the two regression equations. Then, predicted values for the dependent variables are
calculated using the estimated coefficients from these first-stage regressions. In the second
stage, each dependent variable is regressed on the predicted values of the presumably endoge-
nous variable and the respective right-hand-side variables of that regression equation. The
significance of the predicted right-hand-side dependent variable is then tested using a T-test
with the null hypothesis of no endogeneity.
We report the Durbin-Wu-Hausman test statistics with the respective p-values in each Col-
umn of Tables 5 and 6 below the OLS results. In no case are we able to reject the null hy-
pothesis of no endogeneity, suggesting that estimating the equations as a simultaneous system
is not necessary or appropriate. However, as pointed out by Johnston and DiNardo (1997)
among others, the test results can be inconclusive, first, because the test is designed for large
samples, and, second, because it may either reflect that the endogeneity bias of the parameters
estimated with OLS is not serious or that the predetermined variables excluded from the struc-
tural equations are only weakly correlated with the endogenous variables. Following Cohen
and Walsh (2000) and notwithstanding the appropriateness of the Durbin-Wu-Hausman speci-
fication test for a relatively small sample such as ours, we check the robustness of our results
by estimating both regression equations simultaneously by 3SLS.
The results are reported in Table 7. Panel A presents the estimates for the equation with Sratio
as dependent variable and Panel B those for the equation with Q as dependent variable. As a
comparison with the OLS results reported in Tables 5 and 6 reveals, the simultaneous estima-
tion of the two equations leaves the majority of the OLS results unchanged. The most impor-
tant change is that Rents has now a significantly negative influence on Sratio confirming that
a more intense product market competition as measured by lower economic rents is associated
with stronger incentive schemes for managers (see Panel A). The coefficient on Reg in col-
umn 3 stands in line with this finding, even though the result is not significant. Column 4 fur-
ther shows that the coefficient on Herf is also negative if all three measures of competition are
included in the system. Panel B reveals that the effects of Rents, Herf and Reg on Q are still
positive confirming that the negative effect of lower economic rents dominates the positive
effect of reducing managerial slack and increasing the managers’ effort by providing addi-
tional monitoring and increasing the threat of liquidation. However, all three coefficients are
not statistically significant for equations investigating the effect of each competition proxy
separately. In contrast, the inclusion of all three measures of competition into the two equa-
tions of the system leads to a coefficient on Herf which is statistically significant at the 10%
level. With respect to the corporate governance mechanisms and control variables, there are
barely any changes between the OLS and 3SLS estimates. The coefficient of Outsider on Sra-
tio is still positive but not statistically significant any more (Panel A) and the coefficient of
Pgrowth on Q is now significant at the 1% level.

To test for the correctness of the specification of our entire system of simultaneous equations,
we apply the Hausman specification test (e.g., see Hausman, 1978; and Hausman, 1983).31 As
the results in Table 7 reveal, the Hausman test statistic cannot be rejected at the 10% level for
both equations of our system. Thus, under the assumption that at least one of the two equa-
tions are correctly specified, the specification of the system of two simultaneous equations
cannot be rejected and hence the most efficient estimates can be obtained by applying 3SLS.
[Insert Table 7 about here]
5. Robustness tests
In this section, we investigate the robustness of our empirical results with respect to alterna-
tive definitions of the competition variables Rents, Herf, and Reg. With respect to Rents, we
employ three additional, alternative definitions. First, we investigate whether our results are
robust to the use of 2002 data for the variable Rents, Rents_02. Second, we apply a second
measure of Rents based on a rate of depreciation (δ) of 8 percent (instead of 4 percent),
Rents8. Following Nickell (1996), we finally apply an alternative measure of Rents where the
31 The test statistic of the Hausman specification test is based on a comparison of the 2SLS and 3SLS estimates. Under the
null hypothesis of no misspecification, the 3SLS results are consistent and efficient while the 2SLS results are consistent
but not efficient. The test investigates for each equation whether the 3SLS results are inconsistent due to a misspecification
in one of the other equations. Under 3SLS, the misspecification of one single equation is transmitted to all equations by the
use of an inconsistently estimated covariance matrix in the third stage. In contrast, under 2SLS only the single equation
that is misspecified is affected by the misspecification. Thus, the crucial assumption of the test is that at least one equation
of the system is correctly specified (if this is not the case, 2SLS as well as 3SLS results are inconsistent and the Hausman
specification test is not meaningful). If the null is rejected, there is a misspecification somewhere in the system. However,
the test does not provide any suggestions about what has to be changed in the system. The Hausman test statistic is distrib-
uted Chi-squared with degrees of freedom equal to min[k i, p-pi], where k i denotes the number of all variables contained in
equation i, pi is the number of additional exogenous variables that could be included into equation i to be exactly identified,
and p is the sum of all pi’s for all equations.

equity ratio (λ) is set equal to one for all firms, RentsL1. With respect to Herf, we use two
alternative measures. Again, the first is based on 2002 data for the calculation of Herf. The
second is based on an alternative classification of the relevant industries and uses “market
sectors” instead of “industry groups”.32 Market sectors are defined to be broader than industry
sectors leading to a reduction from 33 to 17 industries underlying the calculations of the Her-
findahl index. This variable is labeled as Herf_MaSe. Finally, we use an alternative definition
of Reg, Reg_General, measuring not only the intensity of legal regulations that are specifi-
cally relevant for market entry but the level of regulation within the respective industry in
general.
To investigate the robustness of our results with respect to these alternative definitions of our
competition proxies, we reestimate the regression equations reported in Column 4 of Table 5
(Sratio) and Column 4 of Table 6 (Q) by OLS. The results in Table 8 reveal that our results
with respect to Sratio are robust to replacing any one of the three competition variables
(Rents, Herf, and Reg) by one of the alternatives. The use of 2002 data leads to a coefficient
on Rents which is statistically significant at the 1% level. All other coefficients remain basi-
cally unchanged. Table 9 reports the results with respect to Tobin’s Q. Again, the results are
quite robust to the use of alternative definitions of the competition variables. Two exceptions
are the negative sign on Rents_02 (Column 2) and the negative sign on Herf_MaSe (Column
6). However, both p-values, especially the former, are quite high: 0.875 and 0.476, respec-
tively.
In general, we conclude that our results are robust to the use of alternative definitions for our
three measures of product market competition. However, as already mentioned in Section
3.1.1, our classification of industry groups is arbitrary and may not represent anything like the
relevant product market for the firms included in the respective industries. Thus, the finding
32 Industry groups as well as market sectors are both based on the classification of the Swiss Exchange (SWX).

of a positive coefficient on Herf and a negative on Herf_MaSe may, in fact, suggest that the
results with respect to the Herfindahl index depend on the precise definition of the relevant
industries.
[Insert Table 8 about here]
[Insert Table 9 about here]
6. Conclusion
This paper is a further contribution to better understand the effects of competition on compen-
sation schemes for managers and on firm valuation. While the theoretical literature offers
some insights on this issue, the picture is far from being complete, and more research is
clearly needed in this area. Given that the theoretical models often lead to ambiguous results,
it seems especially important to provide further empirical evidence on these issues. This topic
has become even more relevant with the increasing influence of public organizations on cor-
porate governance rules and the general insight that competition is necessary for a culture of
good corporate governance.
In the theoretical section we consider a principal-agent model within a Cournot setup where
the manager provides unobservable effort to affect the firm’s marginal costs. The key features
of our model are as follows: First, it relies neither on information effects of competition nor
on relative performance evaluation. Second, it integrates strategic interaction on product mar-
kets between the firms. These features provide an accurate description of firm behavior and
lead to testable hypotheses in terms of observable variables.
The empirical part tests the main hypotheses of our theoretical model on the relationships
between competition, managerial incentives and firm valuation using data of 156 Swiss com-
panies. Although the statistical significance is rather weak, our empirical results reveal that in
general a more intense product market competition is associated with stronger incentive
schemes for managers as measured by the fraction of share-based to cash compensation. This
result is consistent with hypothesis 1 of our theoretical model and suggests that firms are op-
erating in competitive environments on average. Moreover and consistent with hypothesis 2,
we find the positive influence of competition on incentive schemes to be stronger for firms
operating in a high competition environment. Finally and consistent with hypothesis 3 of our
model, we find a positive but not statistically significant effect on firm value for all three
competition proxies, indicating that a higher product market competition is associated with a
lower firm value. Thus, the negative effect of lower economic rents seems to outweigh the
positive effect of reducing managerial slack and increasing the managers’ effort by providing
additional monitoring and increasing the threat of liquidation.
While our work provides some potentially insightful results, it also raises further questions
that have to be addressed in future work. It would be interesting to look not only at public
companies, but also consider small and medium sized private corporations that build the core
part of many economies. More importantly, due to the increasing importance of option-based
pay it is obvious that Sratio is an incomplete measure of the incentive schemes provided to
officers and directors.33 Hence, it would be interesting to enhance our analysis by using the
fraction of share- and option-based pay to cash compensation as an alternative, and arguably
more complete, measure of the incentive schemes provided to managers.34 Also, more de-
tailed compensation and performance data of top and especially middle management could be
of some interest since some important corporate decisions are taken on this level. Finally,
increasing governmental interventions on corporate governance issues call for a good under-
standing of the role of public policy.
33 Recent evidence on the development of option-based pay in the US is given by Hall and Murphy (2002), for example.
34 Unfortunately, data on option allotment and ownership is very sparse for Swiss companies in 2002.
References
Aggarwal, R.K. and A.A. Samwick, 1999, Executive compensation, strategic competition,
and relative performance evaluation: Theory and evidence, Journal of Finance 54, 1999-2043.
Agrawal, A. and C.R. Knoeber, 1996, Firm performance and mechanisms to control agency
problems between managers and shareholders, Journal of Financial and Quantitative Analysis
31, 377-397.
Anderson, R.C., Bates, T.W., Bizjak, J.M. and M.L. Lemmon, 2000, Corporate governance
and firm diversification, Financial Management 78, 5-22.
Barnhart, S.W., Marr, M.W. and S. Rosenstein, 1994, Firm performance and board composi-
tion: Some new evidence, Managerial and Decision Economics 15, 329-340.
Beiner, S., Drobetz, W., Schmid, M.M. and H. Zimmermann, 2005, An integrated framework
of corporate governance and firm valuation – Evidence from Switzerland, European Financial
Management (forthcoming).
Boone, J. and J. Weigand, 2000, Measuring competition: How are cost differentials mapped
into profit differentials? Working Paper No. 131, CPB Netherlands Bureau of Economic Pol-
icy Analysis, The Hague.
Brander, J. and T. Lewis, 1988, Oligopoly and financial structure: The limited liability effect,
American Economic Review 76, 956-970.
Carlin, W. and R. Horvath, 2000, Competitive pressures and enterprise performance in transi-
tion economies: Conceptual issues and empirical evidence, mimeo.
Chevalier, J., 1995, Capital structure and product-market competition: Empirical evidence
from the supermarket industry, American Economic Review 85, 415-436.

Chung, K.H. and S.W. Pruitt, 1994, A simple approximation of Tobin’s Q, Financial Man-
agement 23, 70-74.
Cohen, W.M. and J.P. Walsh, 2000, R&D spillovers, appropriability and R&D intensity,
Working Paper, Carnegie Mellon University and University of Illinois at Chicago.
Cuñat, V. and M. Guadalupe, 2004, Executive compensation and competition in the banking
and financial sectors, Discussion Paper No. 1123, Institute for the Study of Labor (IZA),
Bonn.
Davidson, R. and J. MacKinnon, 1993, Estimation and inference in econometrics (Oxford
University Press).
Emons, W. and G. Wanzenried, 2003, Neue Regeln guter Unternehmensführung: Eine
Analyse aus der Sicht von New Institutional Economics, Wirtschaftsdienst Heft 7, 83.
Jahrgang, Hamburgisches Welt-Wirtschafts-Archiv.
Fershtman, C. and K.L. Judd, 1987, Equilibrium incentives in oligopolies, American Eco-
nomic Review 77, 927-940.
Funk, P. and G. Wanzenried, 2003, Product market competition and executive compensation:
An empirical investigation, Working Paper No. 03.09., Department of Economics University
of Bern.
Geroski, P., 1990, Innovation, technological opportunity, and market structure, Oxford Econ.
Papers 42, 586-602.
Graziano, C. and B.M. Parigi, 1998, Do Managers work harder in competitive industries?,
Journal of Economic Behavior and Organization 34, 489-498.

Griffith, R., 2001, Product market competition, efficiency and agency costs: An empirical
analysis, Working Paper 01/12, The Institute for Fiscal Studies.
Grosfeld, I. and T. Tressel, 2001, Competition and corporate governance: Substitutes or com-
plements? Evidence from the Warsaw Stock Exchange, mimeo.
Habib, M.A. and A. Ljungqvist, 2004, Firm value and managerial incentives: A stochastic
frontier approach, Journal of Business (forthcoming).
Hausman, J.A., 1978, Specification tests in econometrics, Econometrica 46, 1251-1271.
Hausman, J.A., 1983, Specification and estimation of simultaneous equation models, in: Z.
Griliches and M. Intriligator (Eds.), Handbook of Econometrics, Vol. I (North-Holland, Am-
sterdam) 391-448.
Hermalin, B.E., 1992, The effects of competition on executive behavior, Rand Journal of Eco-
nomics 23, 350-365.
Januszewski, S.I., Köke, J. and J.K. Winter, 2002, Product market competition, corporate
governance and firm performance: An empirical analysis for Germany, Research in Econom-
ics 56, 299-332.
Jensen, M.C. and K.J. Murphy, 1990, Performance pay and top-management incentives, Jour-
nal of Political Economy 98, 225-264.
Joh, S.W., 1999, Strategic Managerial incentive compensation in Japan: Relative performance
evaluation and product market collusion, Review of Economics and Statistics 81, 303-13.
Johnston, J. and J. DiNardo, 1997, Econometric methods, Fourth Edn. (McGraw-Hill, New
York).
Kedia, S., 2003, Product market competition and top management compensation, Harvard
University Working Paper Series, Finance Unit.
Kang, J.-K. and R.M. Stulz, 1996, How different is Japanese corporate finance? An investiga-
tion of the information content of new security issues, Review of Financial Studies 9, 109-
139.
Khemani, R.S. and C. Leechor, 2001, Competition boots corporate governance, World Bank,
Washington, D.C.
Kovenock, D. and G. Phillips, 1995, Capital structure and product-market rivalry: How do we
reconcile theory and evidence?, American Economic Review 85, 403-408.
Ledergerber, U., Haering, B., Koch, P., Kälin, R. and R. Eigenmann, 1998, Regelungsdichte
nach Branchen, Studienreihe Bundesamt für Wirtschaft und Arbeit, BWA.
Loderer, C. and K. Martin, 1997, Executive stock ownership and performance - Tracking faint
traces, Journal of Financial Economics 45, 223-255.
Loderer, C. and U. Peyer, 2002, Board overlap, seat accumulation and share prices, European
Financial Management 8, 165-192.
Lord, R.A. and J.E. McIntyre Jr., 2003, Leverage, imports, profitability, exchange rates, and
capital investments: A panel data study of the textile and apparel industries 1974-1987, Inter-
national Review of Financial Analysis 12, 287-310.
Machlup, F., 1967, Theories of the firm: Marginalist, behavioral, managerial, American Eco-
nomic Review 57, 1-33.

Maksimovic, V., 1988, Capital structure in repeated oligopolies, Rand Journal of Economics
19, 389-408.
McConnell, J. and H. Servaes, 1990, Additional evidence on equity ownership and corporate
value, Journal of Financial Economics 27, 595-613.
Morck, R., Shleifer, A. and R. Vishny, 1988, Management ownership and market valuation –
An empirical analysis, Journal of Financial Economics 20, 293-316.
Murphy, K.J., 1999, Executive compensation, in: O. Ashenfelter and D. Card (Eds.), Hand-
book of Labor Economics, Vol. 3, (North-Holland, Amsterdam).
Nickell, S.J., 1996, Competition and corporate performance, Journal of Political Economy
104, 724-746.
Nickell, S.J., Nicolitsas, D. and N. Dryden, 1997, What makes firms perform well?, European
Economic Review 41, 783-796.
Ogus, A.I., 1994, Regulation - legal form and economic theory (Oxford University Press).
Peasnell, K.V., Pope, P.F. and S. Young, 2003, Managerial equity ownership and the demand
for outside directors, European Financial Management 9, 231-250.
Perfect, S. and K. Wiles, 1994, Alternative construction of Tobin’s q – An alternative com-
parison, Journal of Empirical Finance 1, 313-341.
Phillips, G., 1995, Increaded debt and industry product markets. An empirical analysis, Jour-
nal of Financial Economics 37, 189-238.
Raith, M., 2003, Competition, risk and managerial incentives, American Economic Review
93, 1425-1436.

Salas Fumas, V., 1992, Relative performance evaluation of management: The effects on in-
dustrial competition and risk sharing, International Journal of Industrial Organization 10, 473-
489.
Scharfstein, D., 1988, Product market competition and managerial slack, Rand Journal of
Economics 19, 147-155.
Schmid, M.M., 2004, Managerial incentives and firm valuation – Evidence from Switzerland,
Working Paper, University of Basel.
Schmidt, K., 1997, Managerial incentives and product market competition, Review of Eco-
nomic Studies 64, 191-213.
Sklivas, S., 1987, The strategic choice of managerial incentives, Rand Journal of Economics
18, 452-458.
Vickers, J., 1985, Delegation and the theory of the firm, Economic Journal 95, 138-147.
Yermack, D., 1996, Higher market valuation of companies with a small board of directors,
Journal of Financial Economics 40, 185-211.
Zingales, L., 1998, Survival of the fittest or the fattest? Exit and financing in the trucking in-
dustry, Journal of Finance 53, 905-938.
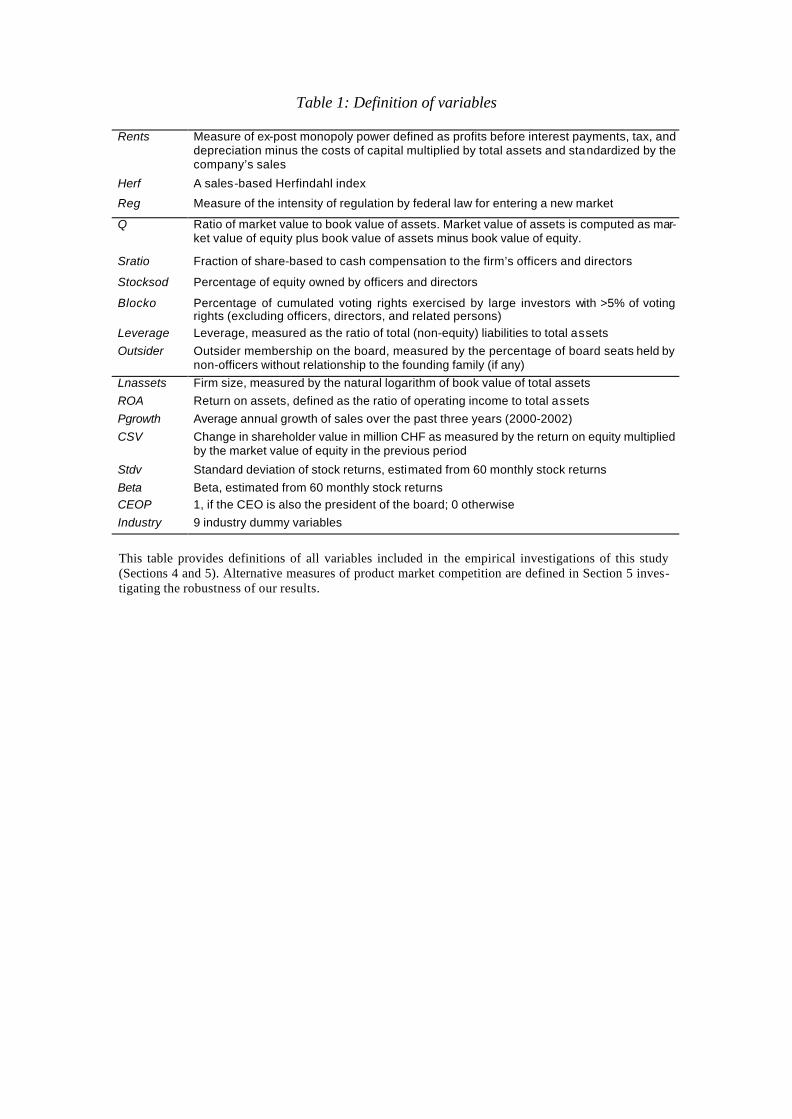
Table 1: Definition of variables
Rents Measure of ex-post monopoly power defined as profits before interest payments, tax, and depreciation minus the costs of capital multiplied by total assets and standardized by the company’s sales
Herf A sales-based Herfindahl index
Reg Measure of the intensity of regulation by federal law for entering a new market
Q Ratio of market value to book value of assets. Market value of assets is computed as mar-ket value of equity plus book value of assets minus book value of equity.
Sratio Fraction of share-based to cash compensation to the firm’s officers and directors
Stocksod Percentage of equity owned by officers and directors
Blocko Percentage of cumulated voting rights exercised by large investors with >5% of voting rights (excluding officers, directors, and related persons)
Leverage Leverage, measured as the ratio of total (non-equity) liabilities to total assets Outsider Outsider membership on the board, measured by the percentage of board seats held by
non-officers without relationship to the founding family (if any) Lnassets Firm size, measured by the natural logarithm of book value of total assets ROA Return on assets, defined as the ratio of operating income to total assets Pgrowth Average annual growth of sales over the past three years (2000-2002) CSV Change in shareholder value in million CHF as measured by the return on equity multiplied
by the market value of equity in the previous period
Stdv Standard deviation of stock returns, estimated from 60 monthly stock returns Beta Beta, estimated from 60 monthly stock returns CEOP 1, if the CEO is also the president of the board; 0 otherwise Industry 9 industry dummy variables
This table provides definitions of all variables included in the empirical investigations of this study (Sections 4 and 5). Alternative measures of product market competition are defined in Section 5 inves-tigating the robustness of our results.

Table 2: Summary statistics of variables
Mean Median Maximum Minimum Std. Dev. Rents -0.042 0.029 5.672 -5.680 0.733Herf 0.412 0.409 1.000 0.131 0.230Reg 1.274 1.0160 3.257 0.724 0.552Q 1.415 1.130 7.710 0.581 0.918Sratio 0.057 0.000 0.878 0.000 0.142Stocksod 0.165 0.026 0.858 0.000 0.224Blocko 0.280 0.198 1.000 0.000 0.271Leverage 0.578 0.587 1.138 0.074 0.213Outsider 0.879 0.875 1.000 0.400 0.133Lnassets 13.638 13.431 20.890 10.083 1.742ROA 0.024 0.046 0.334 -0.610 0.122Pgrowth 0.157 0.060 3.973 -0.624 0.466CSV 0.909 0.038 32.728 -2.430 4.231Stdv 0.394 0.342 1.118 0.057 0.204Beta 0.863 0.790 3.279 -0.224 0.582CEOP 0.192 0.000 1.000 0.000 0.395
This table reports descriptive statistics of all variables included in the empirical investigations of this study (Section 4), with the exception of Industry and the alternative measures of product market competition employed in the robustness section. The data generally refers to the reporting period from January 2002 to December 2002 and the sample size is 156.

Table 3: Correlation analysis Rents Herf Reg Q Sratio Stocksod Blocko Leverage Outsider Lnassets ROA Pgrowth CSV Stdv Beta Herf -0.1005 (0.2119) Reg 0.0721 0.1579** (0.3713) (0.0490) Q 0.0353 -0.0513 0.1890** (0.6614) (0.5250) (0.0181) Sratio -0.3068*** 0.0804 -0.0142 0.0622 (0.0001) (0.3181) (0.8602) (0.4403) Stocksod -0.0845 0.1569* 0.1531* 0.1438* -0.0027 (0.2945) (0.0504) (0.0564) (0.0734) (0.9738) Blocko 0.0515 0.0273 -0.0545 -0.1705** -0.1860** -0.2775*** (0.5232) (0.7354) (0.4989) (0.0334) (0.0201) (0.0005) Leverage -0.0647 0.1045 -0.0996 -0.2166*** 0.0279 -0.2793*** 0.2583*** (0.4222) (0.1941) (0.2162) (0.0066) (0.7293) (0.0004) (0.0011) Outsider 0.0787 -0.0343 0.0478 -0.0533 0.0599 -0.1986** 0.0901 0.2330 *** (0.3290) (0.6705) (0.5531) (0.5088) (0.4574) (0.0130) (0.2635) (0.0034) Lnassets -0.0744 0.0527 0.0935 0.0723 0.2915*** -0.2485*** 0.0481 0.4067 *** 0.2997*** (0.3560) (0.5133) (0.2458) (0.3697) (0.0002) (0.0018) (0.5512) (0.0000) (0.0001) ROA 0.3420*** -0.0887 0.1310 0.2308*** 0.0004 -0.0330 -0.0657 -0.0302 0.1754** 0.2612*** (0.0000) (0.2709) (0.1031) (0.0038) (0.9965) (0.6823) (0.4149) (0.7084) (0.0285) (0.0010) Pgrowth -0.1356* -0.0821 0.0029 0.2705*** -0.0152 -0.0332 0.0745 -0.0576 0.0071 -0.0015 -0.1203 (0.0914) (0.3082) (0.9711) (0.0006) (0.8510) (0.6804) (0.3556) (0.4749) (0.9304) (0.9854) (0.1348) CSV -0.0267 0.1599** 0.1633** 0.2438*** 0.4169*** -0.0946 -0.0758 0.0134 0.0643 0.5071*** 0.1376* -0.0583 (0.7406) (0.0461) (0.0416) (0.0022) (0.0000) (0.2399) (0.3469) (0.8683) (0.4249) (0.0000) (0.0867) (0.4694) Stdv -0.2225*** -0.1516* -0.2002** 0.1612** -0.0099 0.0789 -0.1595** -0.1624 ** -0.3149*** -0.3435*** -0.5362*** 0.0859 -0.1515* (0.0052) (0.0588) (0.0122) (0.0444) (0.9019) (0.3277) (0.0467) (0.0428) (0.0001) (0.0000) (0.0000) (0.2866) (0.0590) Beta -0.0152 -0.1730** -0.1509* 0.2480*** -0.0107 0.0337 -0.2288*** -0.0872 -0.1030 0.0004 -0.2810*** 0.0744 -0.0266 0.7239*** (0.8504) (0.0308) (0.0601) (0.0018) (0.8946) (0.6765) (0.0041) (0.2790) (0.2008) (0.9963) (0.0004) (0.3563) (0.7416) (0.0000) CEOP -0.0389 0.0003 -0.0329 0.0956 0.1959** 0.0747 -0.0615 -0.1520 * -0.4045*** -0.0101 -0.0084 0.0295 0.1400* 0.1797** 0.0957 (0.6297) (0.9975) (0.6833) (0.2349) (0.0142) (0.3543) (0.4455) (0.0582) (0.0000) (0.9004) (0.9167) (0.7144) (0.0812) (0.0248) (0.2349) This table reports Pearson correlation coefficients between all variables included in the empirical investigations of this study (Section 4), with the exception of Industry and the alternative measures of product market competition employed in the robustness section. The data generally refers to the reporting period from January 2002 to December 2002 and the sample size is 156. The p-values are in parentheses. ***/**/* denotes statistical significance at the 1%/5%/10% level.

Table 4: Comparisons of firms “operating in intensive competition environment” and other firms Competition Firms Non-Competition Firms Difference Difference
Mean Median Mean Median Mean t-test Median Wilcoxon
Q 1.205 1.025 1.625 1.254 -0.420 0.004 *** -0.229 0.000*** Sratio 0.061 0.000 0.053 0.000 0.008 0.719 0.000 0.698 Stocksod 0.154 0.013 0.176 0.050 -0.023 0.529 -0.036 0.402 Blocko 0.292 0.228 0.267 0.161 0.025 0.564 0.068 0.299 Leverage 0.621 0.633 0.536 0.552 0.085 0.013 ** 0.081 0.008*** Outsider 0.870 0.866 0.888 0.888 -0.018 0.391 -0.021 0.546 Beta 1.005 0.992 0.722 0.650 0.283 0.002 *** 0.342 0.007*** CEOP 0.192 0.000 0.192 0.000 0.000 1.000 0.000 0.999 CSV 0.306 0.013 1.513 0.081 -1.207 0.075 * -0.068 0.000*** Lnassets 13.577 13.409 13.700 13.494 -0.124 0.659 -0.085 0.539 Pgrowth 0.156 0.035 0.158 0.063 -0.003 0.970 -0.028 0.007*** ROA -0.023 0.017 0.071 0.073 -0.094 0.000 *** -0.056 0.000*** Stdv 0.448 0.397 0.340 0.305 0.108 0.001 *** 0.091 0.001*** This table presents a comparison of firm value, five corporate governance mechanisms, and additional firm characteris-tics between firms with a value of Rents equal to or above the median value (non-competition firms) and firms with a value of Rents below the median value (competition firms). The sample size is 156 (78 competition and 78 non-competition firms). Equality of means is tested using a standard t-test and equality of medians is tested using a Wilcoxon signed rank test. The table reports p-values. ***/**/* denotes statistical significance at the 1%/5%/10% level.

Table 5: Results from OLS regressions of Sratio on different measures of product market competition
Dependent Variable = Sratio (1) (2) (3) (4) (5) (6)
C -0.095 -0.119 -0.111 -0.070 -0.280 * -0.097 (0.518) (0.408) (0.462) (0.635) (0.062) (0.740) Rents -0.065 -0.068 -0.143 *** -0.044 (0.108) (0.106) (0.001) (0.274) Herf 0.006 -0.050 -0.176 *** 0.092 (0.912) (0.255) (0.005) (0.497) Reg -0.008 -0.008 -0.043 0.030 (0.686) (0.689) (0.137) (0.359) Q 0.007 -0.002 -0.002 0.008 0.005 0.006 (0.525) (0.840) (0.835) (0.504) (0.829) (0.678) Stocksod 0.008 0.029 0.032 0.018 0.046 0.015 (0.792) (0.427) (0.453) (0.541) (0.306) (0.742) Blocko -0.088 ** -0.092 ** -0.092 ** -0.085 ** -0.018 -0.130 (0.033) (0.031) (0.029) (0.037) (0.645) (0.154) Leverage -0.034 -0.020 -0.020 -0.033 0.038 0.031 (0.526) (0.733) (0.728) (0.542) (0.579) (0.760) Outsider 0.130 ** 0.127 ** 0.124 ** 0.121 ** 0.145 * 0.190 (0.026) (0.032) (0.039) (0.038) (0.095) (0.208) Lnassets 0.002 0.004 0.004 0.003 0.011 -0.005 (0.808) (0.697) (0.662) (0.784) (0.397) (0.667) CSV 0.014 ** 0.014 ** 0.014 ** 0.014 ** 0.027 *** 0.011 (0.045) (0.044) (0.046) (0.042) (0.000) (0.112) Stdv 0.083 0.102 0.103 0.086 0.021 -0.022 (0.235) (0.174) (0.183) (0.216) (0.737) (0.869) CEOP 0.070 ** 0.066 * 0.064 * 0.067 ** 0.090 * 0.102 ** (0.026) (0.060) (0.085) (0.038) (0.061) (0.039) Industry included included included included included Included Adjusted R2 0.318 0.204 0.204 0.313 0.487 0.279
F-statistic 3.026 *** 2.987 *** 2.993 *** 2.531 *** 8.294 *** 1.506 Prob(F-statistic) (0.002) (0.002) (0.002) (0.005) (0.000) (0.149)
Durbin-Wu- Hausman 0.017 0.715 0.642 0.104
Prob(D-W-H) (0.895) (0.399) (0.424) (0.748) N 156 156 156 156 78 78
Columns 1 to 4 report estimates from OLS regressions of the percentage of share-based to cash compensation on individual measures of product market competition (Columns 1 to 3) and all three measures together (Column 4) along with Tobin’s Q, four corporate governance mechanisms, and control variables. Columns 5 and 6 report separate OLS estimates for firms operating in a high and firms operating in a low competition environment. “Competition firms” (Column 5) are firms with a value of Rents below the median value and “non-competition firms” (Column 6) are firms with a value of Rents equal to or above the median value. An F-test is performed for the simultaneous sig-nificance of all coefficients (except the constant and industry dummies). The numbers in parenthe-ses are probability values for two-sided tests. ***/**/* denotes statistical significance at the 1%/5%/10% level.
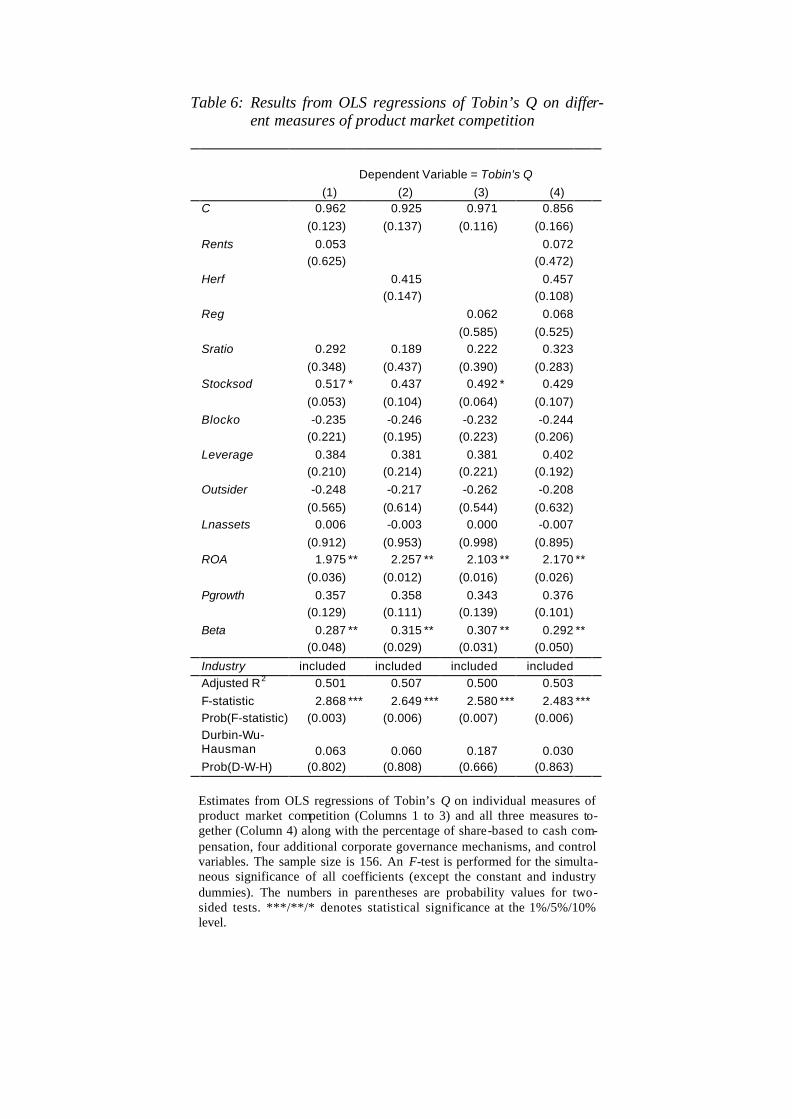
Table 6: Results from OLS regressions of Tobin’s Q on differ-ent measures of product market competition
Dependent Variable = Tobin's Q (1) (2) (3) (4) C 0.962 0.925 0.971 0.856 (0.123) (0.137) (0.116) (0.166) Rents 0.053 0.072 (0.625) (0.472) Herf 0.415 0.457 (0.147) (0.108) Reg 0.062 0.068 (0.585) (0.525) Sratio 0.292 0.189 0.222 0.323 (0.348) (0.437) (0.390) (0.283) Stocksod 0.517 * 0.437 0.492 * 0.429 (0.053) (0.104) (0.064) (0.107) Blocko -0.235 -0.246 -0.232 -0.244 (0.221) (0.195) (0.223) (0.206) Leverage 0.384 0.381 0.381 0.402 (0.210) (0.214) (0.221) (0.192) Outsider -0.248 -0.217 -0.262 -0.208 (0.565) (0.614) (0.544) (0.632) Lnassets 0.006 -0.003 0.000 -0.007 (0.912) (0.953) (0.998) (0.895) ROA 1.975 ** 2.257 ** 2.103 ** 2.170 ** (0.036) (0.012) (0.016) (0.026) Pgrowth 0.357 0.358 0.343 0.376 (0.129) (0.111) (0.139) (0.101) Beta 0.287 ** 0.315 ** 0.307 ** 0.292 ** (0.048) (0.029) (0.031) (0.050) Industry included included included included Adjusted R2 0.501 0.507 0.500 0.503 F-statistic 2.868 *** 2.649 *** 2.580 *** 2.483 *** Prob(F-statistic) (0.003) (0.006) (0.007) (0.006)
Durbin-Wu- Hausman 0.063 0.060 0.187 0.030
Prob(D-W-H) (0.802) (0.808) (0.666) (0.863)
Estimates from OLS regressions of Tobin’s Q on individual measures of product market competition (Columns 1 to 3) and all three measures to-gether (Column 4) along with the percentage of share-based to cash com-pensation, four additional corporate governance mechanisms, and control variables. The sample size is 156. An F-test is performed for the simulta-neous significance of all coefficients (except the constant and industry dummies). The numbers in parentheses are probability values for two-sided tests. ***/**/* denotes statistical significance at the 1%/5%/10% level.

Table 7: Results from 3SLS estimations of the simultaneous equa-tions system
Panel A: Dependent Variable = Sratio 1 2 3 4 C -0.089 -0.108 -0.096 -0.064
(0.517) (0.478) (0.527) (0.646)
Rents -0.065 *** -0.067 ***
(0.000) (0.000)
Herf 0.009 -0.049
(0.868) (0.332)
Reg -0.008 -0.008
(0.745) (0.722)
Q 0.003 -0.037 -0.040 -0.002
(0.920) (0.278) (0.261) (0.942)
Stocksod 0.010 0.045 0.050 0.023
(0.834) (0.386) (0.335) (0.629)
Blocko -0.089 ** -0.104 ** -0.104 ** -0.089 ** (0.034) (0.024) (0.023) (0.035)
Leverage -0.033 -0.017 -0.017 -0.032
(0.560) (0.787) (0.788) (0.580)
Outsider 0.126 0.126 0.121 0.118
(0.126) (0.164) (0.182) (0.155)
Lnassets 0.003 0.006 0.007 0.003
(0.757) (0.483) (0.446) (0.679)
CSV 0.014 *** 0.013 *** 0.013 *** 0.014 ***
(0.000) (0.000) (0.000) (0.000)
Stdv 0.086 0.108 0.110 0.090
(0.178) (0.122) (0.115) (0.159)
CEOP 0.067 ** 0.066 ** 0.062 ** 0.064 **
(0.013) (0.024) (0.039) (0.019)
Industry included included included included Wald test 87.732 *** 43.900 *** 41.224 *** 89.176 *** Prob (Wald test) (0.000) (0.000) (0.000) (0.000)
System-Hausman 0.098 0.328 0.223 0.007
Chi2 (10%) 6.251 (3) 6.251 (3) 6.251 (3) 6.251 (3)

Panel B: Dependent Variable = Tobin's Q 1 2 3 4 C 1.017 0.988 1.078 0.887
(0.142) (0.163) (0.131) (0.197)
Rents 0.066 0.082
(0.502) (0.405)
Herf 0.409 0.460 *
(0.140) (0.099)
Reg 0.074 0.072
(0.575) (0.576)
Sratio 0.521 0.388 0.612 0.480
(0.578) (0.686) (0.536) (0.608)
Stocksod 0.518 ** 0.436 * 0.485 ** 0.427 *
(0.032) (0.074) (0.048) (0.082)
Blocko -0.209 -0.222 -0.187 -0.227
(0.388) (0.368) (0.455) (0.344)
Leverage 0.397 0.386 0.396 0.410
(0.206) (0.214) (0.208) (0.187)
Outsider -0.250 -0.221 -0.269 -0.209
(0.540) (0.587) (0.511) (0.606)
Lnassets -0.001 -0.009 -0.012 -0.011
(0.990) (0.843) (0.803) (0.803)
ROA 2.002 *** 2.278 *** 2.164 *** 2.182 *** (0.000) (0.000) (0.000) (0.000)
Pgrowth 0.357 *** 0.357 *** 0.346 *** 0.378 ***
(0.003) (0.002) (0.003) (0.002)
Beta 0.288 ** 0.330 *** 0.324 *** 0.293 ** (0.013) (0.004) (0.005) (0.011)
Industry included included included included Wald test 41.319 *** 52.406 *** 52.304 *** 44.936 *** Prob (Wald test) (0.000) (0.000) (0.000) (0.000)
System-Hausman 0.050 0.077 0.047 0.004
Chi2 (10%) 6.251 (3) 6.251 (3) 6.251 (3) 6.251 (3)
Results from estimating equations 4.1 (Panel A) and 4.2 (Panel B) simultane-ously by 3SLS. The sample size is 156. A Wald test is performed for the simu l-taneous significance of all coefficients (except the constant and industry dum-mies). The numbers in parentheses are probability values for two-sided tests. To test for the correctness of the specification of the system of two simultaneous equations, a Hausman specification test is applied. The test statistic is distributed Chi-squared and we report the respective 10% critical values. ***/**/* denotes statistical significance at the 1%/5%/10% level.

Table 8: Robustness tests - OLS regressions of Sratio on different measures of product market competition
Dependent Variable = Sratio (1) (2) (3) (4) (5) (6) (7) C -0.070 -0.080 -0.074 -0.047 -0.080 -0.067 -0.024 (0.635) (0.380) (0.617) (0.762) (0.586) (0.653) (0.884) Rents -0.068 -0.068 -0.066 -0.068 (0.106) (0.109) (0.106) (0.107) Rents_02 -0.059 *** (0.000) Rents8 -0.051 (0.143) RentsL1 -0.053 (0.152) Herf -0.050 -0.059 -0.044 -0.041 -0.051 (0.255) (0.129) (0.324) (0.357) (0.244) Herf_02 -0.038 (0.372) Herf_MaSe -0.111 (0.159) Reg -0.008 -0.007 -0.008 -0.007 -0.007 -0.008 (0.689) (0.726) (0.694) (0.735) (0.739) (0.708) Reg_General -0.004 (0.364) Q 0.008 0.006 0.007 0.007 0.007 0.006 0.008 (0.504) (0.523) (0.547) (0.526) (0.526) (0.584) (0.485) Stocksod 0.018 0.007 0.018 0.017 0.016 0.023 0.021 (0.541) (0.792) (0.543) (0.555) (0.578) (0.494) (0.487) Blocko -0.085** -0.084 ** -0.086 ** -0.085 ** -0.086 ** -0.093 ** -0.090 ** (0.037) (0.048) (0.036) (0.036) (0.038) (0.026) (0.029) Leverage -0.033 -0.011 -0.034 -0.037 -0.034 -0.021 -0.029 (0.542) (0.801) (0.546) (0.520) (0.530) (0.707) (0.586) Outsider 0.121** 0.123 ** 0.118 ** 0.117 ** 0.123 ** 0.141 ** 0.116 ** (0.038) (0.035) (0.044) (0.044) (0.035) (0.025) (0.047) Lnassets 0.003 0.005 0.003 0.001 0.003 0.002 0.003 (0.784) (0.570) (0.802) (0.913) (0.774) (0.807) (0.769) CSV 0.014** 0.013 * 0.014 ** 0.014 ** 0.014 ** 0.014 ** 0.014 ** (0.042) (0.051) (0.041) (0.042) (0.043) (0.035) (0.040) Stdv 0.086 0.062 0.101 0.083 0.085 0.075 0.086 (0.216) (0.368) (0.157) (0.240) (0.221) (0.284) (0.215) CEOP 0.067** 0.075 ** 0.066 ** 0.067 ** 0.067 ** 0.071 ** 0.065 ** (0.038) (0.013) (0.043) (0.040) (0.036) (0.028) (0.041) Industry included included included included included included included Adjusted R2 0.318 0.412 0.299 0.293 0.311 0.318 0.315 F-statistic 3.026*** 4.067 *** 2.505 *** 2.561 *** 2.537 *** 2.614 *** 2.529 *** Prob(F-stat) (0.002) (0.000) (0.005) (0.004) (0.005) (0.004) (0.005)
This table reports estimates from OLS regressions of the percentage of share-based to cash compensa-tion on alternative measures of product market comp etition as defined in Section 5 and different com-binations of three measures together (one measure of rents, one Herfindahl index, and one measure of the level of regulation) along with Tobin’s Q, four corporate governance mechanisms, and control variables. The sample size is 156. An F-test is performed for the simultaneous significance of all coef-ficients (except the constant and industry dummies). The numbers in parentheses are probability values for two-sided tests. ***/**/* denotes statistical significance at the 1%/5%/10% level.

Table 9: Robustness tests - OLS regressions of Tobin’s Q on different measures of product market competition
Dependent Variable = Tobin's Q (1) (2) (3) (4) (5) (6) (7) C 0.856 0.899 0.842 0.810 0.918 0.961 0.639 (0.166) (0.149) (0.175) (0.194) (0.140) (0.123) (0.336) Rents 0.072 0.067 0.050 0.074 (0.472) (0.509) (0.650) (0.458) Rents_02 -0.009 (0.875) Rents8 0.061 (0.409) RentsL1 0.079 (0.266) Herf 0.457 0.414 0.458 0.465 0.458 (0.108) (0.150) (0.106) (0.100) (0.102) Herf_02 0.345 (0.219) Herf_MaSe -0.230 (0.476) Reg 0.068 0.069 0.068 0.066 0.056 0.059 (0.525) (0.516) (0.524) (0.535) (0.613) (0.603) Reg_General 0.020 (0.336) Sratio 0.323 0.172 0.322 0.346 0.314 0.293 0.330 (0.283) (0.543) (0.277) (0.247) (0.298) (0.347) (0.277) Stocksod 0.429 0.417 0.430 0.433 0.444* 0.529 * 0.420 (0.107) (0.115) (0.105) (0.103) (0.095) (0.054) (0.118) Blocko -0.244 -0.245 -0.242 -0.245 -0.242 -0.243 -0.220 (0.206) (0.204) (0.209) (0.204) (0.210) (0.211) (0.256) Leverage 0.402 0.390 0.403 0.415 0.406 0.411 0.382 (0.192) (0.216) (0.190) (0.177) (0.190) (0.192) (0.209) Outsider -0.208 -0.227 -0.203 -0.202 -0.225 -0.231 -0.190 (0.632) (0.598) (0.639) (0.642) (0.604) (0.602) (0.661) Lnassets -0.007 -0.007 -0.006 -0.005 -0.006 0.003 -0.006 (0.895) (0.888) (0.908) (0.929) (0.914) (0.955) (0.906) ROA 2.170** 2.316** 2.180 ** 2.158** 2.145** 2.007 ** 2.146** (0.026) (0.017) (0.023) (0.024) (0.029) (0.036) (0.026) Pgrowth 0.376 0.356 0.377 0.379* 0.369 0.354 0.382* (0.101) (0.117) (0.101) (0.097) (0.110) (0.137) (0.094) Beta 0.292** 0.320** 0.288 * 0.291** 0.294** 0.284 * 0.286* (0.050) (0.030) (0.056) (0.046) (0.049) (0.053) (0.054) Industry included included included included included included included Adjusted R2 0.503 0.500 0.503 0.505 0.499 0.495 0.504 F-statistic 2.483*** 2.313** 2.509 *** 2.609*** 2.451*** 2.384 *** 2.594*** Prob(F-stat) (0.006) (0.010) (0.005) (0.004) (0.006) (0.008) (0.004)
This table reports estimates from OLS regressions of Tobin’s Q on alternative measures of product market competition as defined in Section 5 and different combinations of three measures together (one measure of rents, one Herfindahl index, and one measure of the level of regulation) along with the per-centage of share-based to cash compensation, four additional corporate governance mechanisms, and control variables. The sample size is 156. An F-test is performed for the simultaneous significance of all coefficients (except the constant and industry dummies). The numbers in parentheses are probability values for two-sided tests. ***/**/* denotes statistical significance at the 1%/5%/10% level.