product market regulation
TRANSCRIPT
PRODUCT MARKET REGULATIONA detailed explanation of the Methodology used to build the OECD PMR Indicators

Organisation for Economic Co-operation and Development
ECO/WKP(2020)00
Unclassified English - Or. English
ECONOMICS DEPARTMENT
A detailed explanation of the methodology used to build the OECD PMR indicators
By Cristiana Vitale, Carlotta Moiso, Isabelle Wanner
This note explains in some details the approach used by the OECD to build the latest vintage of the PMR Economy-wide and Sector indicators.
OFDE
This document, as well as any data and map included herein, are without prejudice to the status of or sovereignty over any territory, to the
delimitation of international frontiers and boundaries and to the name of any territory, city or area.

2
A DETAILED EXPLANATION OF THE METHODOLOGY USED TO BUILD THE OECD PMR INDICATORS
Table of contents
A detailed explanation of the methodology used to build the OECD PMR indicators 3
The PMR indicators 3
The economy wide PMR indicator 4 The sector PMR indicators 7
Calculating the PMR Indicators 9 How the information is collected 9 How the information is coded 10 How the information is aggregated 14
Annex A. Methodology used in the case of federal countries 16
Special case: PMR Indicators for the United States of America 16
Data Collection 17 Indicator values 17
Annex B. Other data sources 19
Main source: the PMR questionnaires 19
Services Trade Restrictiveness Index (STRI) 19
Indicators of Regulatory Policy and Governance (iREG) 19
Regulatory Restrictiveness Index (FDI index) 20
Trade Facilitation Indicators (TFIs) 21
UNCTAD Trade Analysis Information System database 22
Tables
Table A.1. Representative states used when collecting data on federal countries 16 Table A.2. Level at which data was collected by sector or regulatory area 17 Figures
Figure 1. The structure and content of the economy-wide PMR indicator (2018 update) 4 Figure 2. Structure of the PMR indicators for Network Sectors (2018 update) 7 Figure 3. Structure of the 2018 PMR indicators for Professional Services 8 Figure 4. The structure of the PMR indicators for Retail Distribution (2018 update) 8 Figure 5. Process followed to calculate the PMR indicators 9 Figure 6. Example of how an answer providing qualitative information is scored 10 Figure 7. Example of an answer providing quantitative information is scored 11 Figure 8. Schemata table for the low-level indicator Direct Control over Business Enterprises 12 Figure 9. Schemata table for the low-level indicator Governance of SOEs 13 Figure 10. Example of a score attributed to a combination of the answers 14 Figure 11. Aggregation process for the PMR economy-wide indicator. 15 Boxes
Box A.1. Example of how answers are scored to build the Complexity of Regulatory Procedures low-level
indicator 18 Box B.1. Information that come from the STRI database 19 Box B.2. Information that come from the iREG database 20 Box B.3. Adjusting the value of FDI Index 21 Box B.4. Adjusting the value of the TFIs 21

3
A DETAILED EXPLANATION OF THE METHODOLOGY USED TO BUILD THE OECD PMR INDICATORS
1. In 1998, the OECD developed a set of indicators of product market regulation (PMR) in order to
measure a country’s regulatory barriers to competition, and to track reform progress over time. This set
included an economy-wide PMR indicator and a group of indicators that measures regulation at the sector
level, which are referred to as PMR sector indicators. The PMR indicators have been updated every five
years since then.
2. Over time, the PMR indicators have become an essential element of the OECD’s policy analysis
toolkit, as they enhance the knowledge of regulatory practices in individual countries and permit to
investigate their link with economic performance. The PMR indicators form an integral part of the Going
for Growth exercise and the OECD Economic Surveys, where they are used to formulate recommendations
for policy reforms. These indicators and their underlying database are also widely used by national
governments, other international organisations (e.g. IMF, WB, and European Union), and international
forums, such as the G20 and APEC, to determine areas for regulatory change. Academics and research
institutions also employ largely the PMR indicators, as it is the most extensive quantitative measure of the
state of regulation in the markets for goods and services currently available.
3. This note provides a detailed explanation of the methodology used to build the PMR indicators. It
refers to the methodology used to build the PMR indicators for the 2018 update. This methodology is
different from the one used to build previous vintages because after twenty years in which the PMR
indicators had only been subject to small changes, the OECD considered that a review of their content and
structure was necessary. This review was undertaken to ensure that these indicators maintain their
relevance in the context of evolving insights from economic theory, modifications in the economic and
business environment, and changes in the practice of regulation.
4. This note also contains two Annexes. Annex A provides a detailed explanation of how federal
countries are treated and in particular the United States of America of America. Annex B explains in details
the additional sources of information used to compile the PMR database.
The PMR indicators
5. The PMR indicators are based on an extensive database, which is prepared by the OECD relying
on the answers to a questionnaire compiled by national authorities.
6. The information included in the database is used to build two sets of indicators: an economy-wide
indicator, which provides a general quantitative measure of a country’s regulatory stance, and a group of
sector indicators that focus on regulation at the level of specific network and service sectors.
7. To calculate the indicators, this qualitative information is transformed into quantitative information
by assigning a numerical value to each answer. The coding is based on accepted international best
A detailed explanation of the
methodology used to build the OECD
PMR indicators
4
A DETAILED EXPLANATION OF THE METHODOLOGY USED TO BUILD THE OECD PMR INDICATORS
practices, which are summarised in the 2018 PMR Schematas (available on the PMR webpage). The
coded information is normalised over a zero to six scale, where a lower value reflects a more competition-
friendly regulatory stance. This information is then incorporated through a bottom-up approach into the two
sets of indicators. This bottom-up approach allows tracing indicator scores back to individual policies.
8. The information refers to laws and regulations in force in the countries surveyed at a specific point
in time. For most of the countries included in the latest vintage, the information refers to the 1 January
2018. However, for some countries, where the data collection was undertaken at a later stage, the
information refers to a later date. The database available on the OECD webpage shows the date the
information refers to.
9. The information only captures the ‘de jure’ policy settings. This means that the answers are not
based on ‘subjective’ assessments by market participants, as in opinion surveys, and that they do not
reflect the actual enforcement of the laws. These two aspects make the indicators’ comparability across
countries more reliable by insulating them from context-specific assessments, and by allowing the OECD
to verify the reliability and precision of the answer. However, this entails that the extent and manner in
which laws and regulations are applied is hardly reflected in the indicators. Hence, a country that has laws
“in the books” that are competition-friendly, but does not enforce them, would still obtain a favourable score.
The economy wide PMR indicator
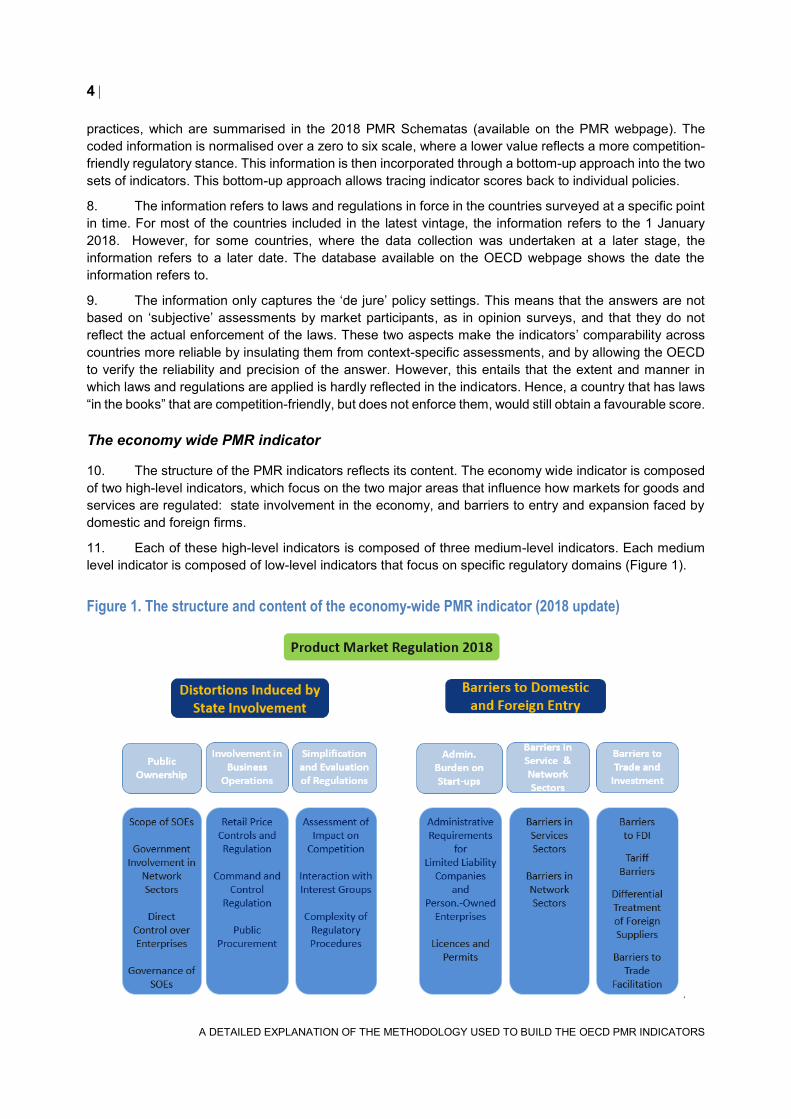
10. The structure of the PMR indicators reflects its content. The economy wide indicator is composed
of two high-level indicators, which focus on the two major areas that influence how markets for goods and
services are regulated: state involvement in the economy, and barriers to entry and expansion faced by
domestic and foreign firms.
11. Each of these high-level indicators is composed of three medium-level indicators. Each medium
level indicator is composed of low-level indicators that focus on specific regulatory domains (Figure 1).
Figure 1. The structure and content of the economy-wide PMR indicator (2018 update)

5
A DETAILED EXPLANATION OF THE METHODOLOGY USED TO BUILD THE OECD PMR INDICATORS
Distortions Induced by State Involvement
12. The first high-level component of the economy-wide PMR indicator, Distortions Induced by State
Involvement, captures the distortions that can be caused by the involvement of the state in the economy
through ownership and control of firms, and other forms of controls and obligations imposed on private
firms. It also captures the way in which new and existing regulations are evaluated to minimize the impact
on competition, and the nature of rules that discipline the public procurement of goods, services and public
works.
13. Its three mid-level components focus on:
1. Extent of the presence of state-owned enterprises in the economy and their governance (Public
Ownership),
2. Controls and obligations imposed on private firms (e.g. price regulation) including the rules
regulating public procurement (Involvement in Business Operations), and
3. Rules in place to evaluate new and existing regulations in order to minimize negative impacts on
competition, regulation of interaction between interest groups and policymakers, and efforts in
simplifying the administrative burden on firms of interacting with the government (Simplification and
Evaluation of Regulations).
14. The 10 low-level indicators (marked in blue) focus each on a specific regulatory area, more
specifically:
Scope of state-owned enterprises (SOEs): measures whether the government controls at least one firm in a number of business sectors, with a higher weight given to the key network sectors on which the PMR exercise focuses.
Direct control over business enterprises: measures the existence of special voting rights by the government in privately owned firms and constraints to the sale of government stakes in publicly controlled firms (based on same sectors and weights as the indicator above).
Government involvement in network sectors: measures the size of the government’s stake in the largest firm in key network sectors.
Governance of state-owned enterprises: measures the degree of insulation of state-owned enterprises from market discipline and degree of political interference in the management these firms. This indicator is aligned with the key requirements of the 2015 OECD Guidelines on Corporate Governance of State-Owned
Enterprises1.
Retail Price Controls: measures the extent and type of retail price controls in the key network and service sectors.
Command and control regulation: measures the extent to which the government uses coercive (as opposed to incentive-based) regulations across key network and service sectors.
Public procurement: measures the degree to which procurement rules ensure a level playing field in access to public contracts for the provision of goods, services and public works.
Assessment of Impact on Competition: measures the level of assessment of the impact of new and existing regulations on competition to ensure minimization of distortions to competition. For OECD countries, this indicator partially relies on the
1 The 2015 OECD Guidelines on Corporate Governance of State-Owned Enterprises can be found at:
https://www.oecd.org/corporate/guidelines-corporate-governance-soes.htm

6
A DETAILED EXPLANATION OF THE METHODOLOGY USED TO BUILD THE OECD PMR INDICATORS
regulatory policy and governance (iREG) database developed by the OECD
Directorate for Public Governance2.
Interaction with Interest Groups: measures the existence of rules for engaging stakeholders in the design of new regulation to reduce unnecessary restrictions to competition and for ensuring transparency in lobbying activities. For OECD countries, this indicator partially relies on the regulatory policy and governance
(iREG) database developed by the OECD Directorate for Public Governance3.
Communication and simplification of rules and procedures: measures the
government’s efforts in reducing and simplifying the administrative burden on firms of interacting with the government.
15. For more information on the use of other indicators and databases in the computation of the PMR
indicators, please refer to Appendix A.
Barriers to Domestic and Foreign Entry
16. The second high-level component of the economy-wide PMR indicator, Barriers to Domestic and
Foreign Entry, includes information on the level of the barriers to entry and expansion of domestic and
foreign firms in various sectors of the economy.
17. Its three mid-level components focus on:
1. The administrative burden that new firms have to face to start their business (Administrative
Burden on Start-ups),
2. The qualitative and quantitative barriers firms face when entering and operating in specific key
economic sectors (Barriers in Service and Network Sectors),
3. The barriers that could limit the access to domestic markets of foreign firms and foreign
investors (Barriers to Trade and Investment).
18. The 8 low-level indicators focus each on a specific regulatory area, more specifically:
Administrative requirements limited liability companies and personally owned enterprises:
measures the administrative requirements necessary to set up new enterprises, including the
number of private and public bodies that need to be contacted and the costs of complying with this
requirements, with a focus on two specific legal forms: limited liability companies and personally
owned enterprises.
Licences and permits: measures the existence of initiatives to simplify licensing procedures, such
as ‘one-stop-shops’ for informing business about licences and notifications and for
issuing/accepting them, ‘silence is consent’ rule and programs to review and reduce number of
licences.
Barriers in services sectors: measures the extent of the qualitative and quantitative barriers to
competition arising from existing regulation in key service sectors.
Barriers in network sectors: measures the extent the qualitative and quantitative barriers to
competition arising from existing regulation in network sectors.
Differential treatment of foreign suppliers: measures the level of discrimination that foreign firms
may experience when participating in public procurement processes, and the barriers to entry that
foreign firms may experience sectors relative to domestic firms in key network and service.
2 The only exception are the United States of America of America. Please refer to Annex B for more details.
3 The only exception are the United States of America of America. Please refer to Annex B for more details.
7
A DETAILED EXPLANATION OF THE METHODOLOGY USED TO BUILD THE OECD PMR INDICATORS
Barriers to Foreign Direct Investment (FDI): measures the restrictiveness of a country’s FDI rules
in 22 sectors in terms of foreign equity limitations, screening or approval mechanisms, restrictions
on the employment of foreigners as key personnel and operational restrictions. This indicator
reflects the value of the FDI Restrictiveness Index developed by the OECD Directorate for Financial
and Enterprise Affairs.
Tariff barriers: reflect the value of a cross-product average of effectively applied tariffs. The source
of the relevant information is the UNCTAD Trade Analysis Information System database.
Barriers to trade facilitation: measures the level of complexity of the technical and legal procedures
for international trade, ranging from border procedures to the simplification and harmonisation of
trade documents. This indicator reflects the value of the average of a subset of the Trade
Facilitation Indicators developed by the OECD Trade and Agricultural Department.
19. For more information on the use of other indicators and databases in the computation of the PMR
indicators, please refer to Appendix B.
The sector PMR indicators
20. The sector PMR indicators summarize information by sector, and not by regulatory domain, as in
the economy-wide indicator. These indicators cover three broad sectors: network industries, professional
services and retail distribution.
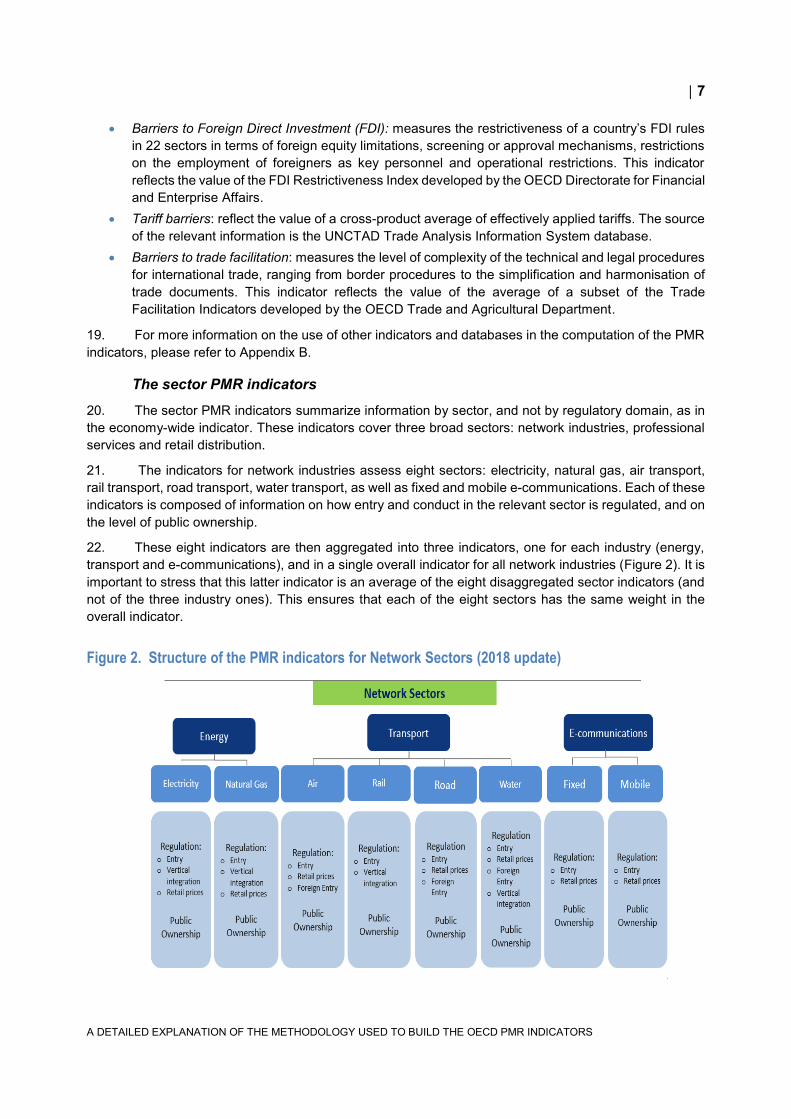
21. The indicators for network industries assess eight sectors: electricity, natural gas, air transport,
rail transport, road transport, water transport, as well as fixed and mobile e-communications. Each of these
indicators is composed of information on how entry and conduct in the relevant sector is regulated, and on
the level of public ownership.
22. These eight indicators are then aggregated into three indicators, one for each industry (energy,
transport and e-communications), and in a single overall indicator for all network industries (Figure 2). It is
important to stress that this latter indicator is an average of the eight disaggregated sector indicators (and
not of the three industry ones). This ensures that each of the eight sectors has the same weight in the
overall indicator.
Figure 2. Structure of the PMR indicators for Network Sectors (2018 update)

8
A DETAILED EXPLANATION OF THE METHODOLOGY USED TO BUILD THE OECD PMR INDICATORS
23. The services sector indicators cover six professions (accountants, architects, civil engineers,
estate agents, lawyers, and notaries), as well as two sectors in retail distribution (general retail trade and
retail sales of medicines).
24. The professional services indicators cover information on entry requirements and conduct
constraints (Figure 3), whereas the retail trade indicators covers a broad set of regulatory issues, ranging
from shop opening hours to retail price regulation, and licensing (Figure 4).
25. There is no aggregate indicator covering all eight sectors given the very different nature of the
sectors covered. In addition, there is no single indicator on the regulation of all professional services,
because some professions do not exist in all countries and a single average would distort comparisons.
Figure 3. Structure of the 2018 PMR indicators for Professional Services
Figure 4. The structure of the PMR indicators for Retail Distribution (2018 update)
Panel A: General Retail Trade Panel B: Retail Sales of Medicines

9
A DETAILED EXPLANATION OF THE METHODOLOGY USED TO BUILD THE OECD PMR INDICATORS
Calculating the PMR Indicators
26. The PMR indicators are calculated through of a process articulated in many phases (Figure 5).
Figure 5. Process followed to calculate the PMR indicators
How the information is collected4
27. The information is collected using a large questionnaire. More details on this questionnaire can be
found in Appendix A.
28. Each of the countries surveyed appoints a contact person, usually in the Ministry of Economy or
Ministry of Finance. This person is in charge of identifying the relevant bodies within his/her country that
have the competences to answer to the questionnaire and of coordinating the information collection.
29. Once the national authorities have completed the questionnaire, the OECD PMR team proceeds
to the verification of the answers. This process is essential to ensure that questions have been correctly
interpreted, that the answers are consistent across countries and, where relevant, over time, and that the
information provided is in line with similar information held by the OECD (e.g. information collected through
other projects). Without these checks the OECD could not guarantee the comparability of the information
across countries and, where applicable, over time.
30. To facilitate the verification process, the questionnaire asks national authorities to provide legal
references and other supporting information for each of the answers they provide. In addition, where
relevant, the OECD team involves experts from other OECD directorates to exploit their country and
sectoral knowledge.
4 The approach herein described refers to the OECD PMR indicators. The data collection and verification that leads
to the computation of the OECD-WBG PMR indicators, which are the outcome of a joint programme of work between
the OECD and the World Bank Group, follows a slightly different process. However, the methodology for calculating
the indicators is the same.

10
A DETAILED EXPLANATION OF THE METHODOLOGY USED TO BUILD THE OECD PMR INDICATORS
31. When doubts or uncertainties about specific answers arise, or when answers are missing, the
OECD team requires the relevant country’s authorities to provide clarifications or further information. If the
authorities do not respond, the OECD team tries to fill the answers using other reliable sources or leaves
them as missing answers.
32. However, in order to limit the burden imposed on national authorities, in some cases the PMR
database draws directly on other OECD indicators and databases. Further, in one specific area, tariff
barriers to trade, the OECD relies on an external dataset: UNCTAD Trade Analysis Information System
database (see Appendix B for more details).
How the information is coded
33. When the verification is completed, the OECD team assigns quantitative values to the answers
collected (Figure 6). The values range from zero to six, where a lower value reflects a more competition-
friendly answer. Zero represents the international best practice.
Figure 6. Example of how an answer providing qualitative information is scored
34. Some questions require the respondent to answer by giving a numerical value, rather than a
qualitative information. In this case, the possible answers are grouped into classes according to a set of
thresholds, and the 0 to 6 values are applied to these classes (Figure 7).

11
A DETAILED EXPLANATION OF THE METHODOLOGY USED TO BUILD THE OECD PMR INDICATORS
Figure 7. Example of an answer providing quantitative information is scored
35. The PMR Schematas, available on the PMR dedicated webpage, explain in detail how each
answer is scored.
36. If more than 20% of the data points that are necessary to calculate a low-level indicator are
missing, the OECD does not calculate that low-level indicator because it considers the information not
sufficient to provide a reliable score. If one low-level indicator is missing, the OECD cannot compute the
economy-wide aggregate PMR indicator. Similarly, if more than 20% of the data points that are necessary
to calculate a sector indicator are missing, the OECD does not calculate that indicator.
The PMR schematas
37. The PMR Schematas are two files that explain the methodology used to score the information
collected and to aggregate it into the economy-wide and sector PMR indicators.
38. The PMR Schemata for the economy-wide indicator is composed of 18 tables, one for each low-
level indicator, while the PMR Schemata for the sector indicators is composed of 16 tables, one for each
sector indicator.
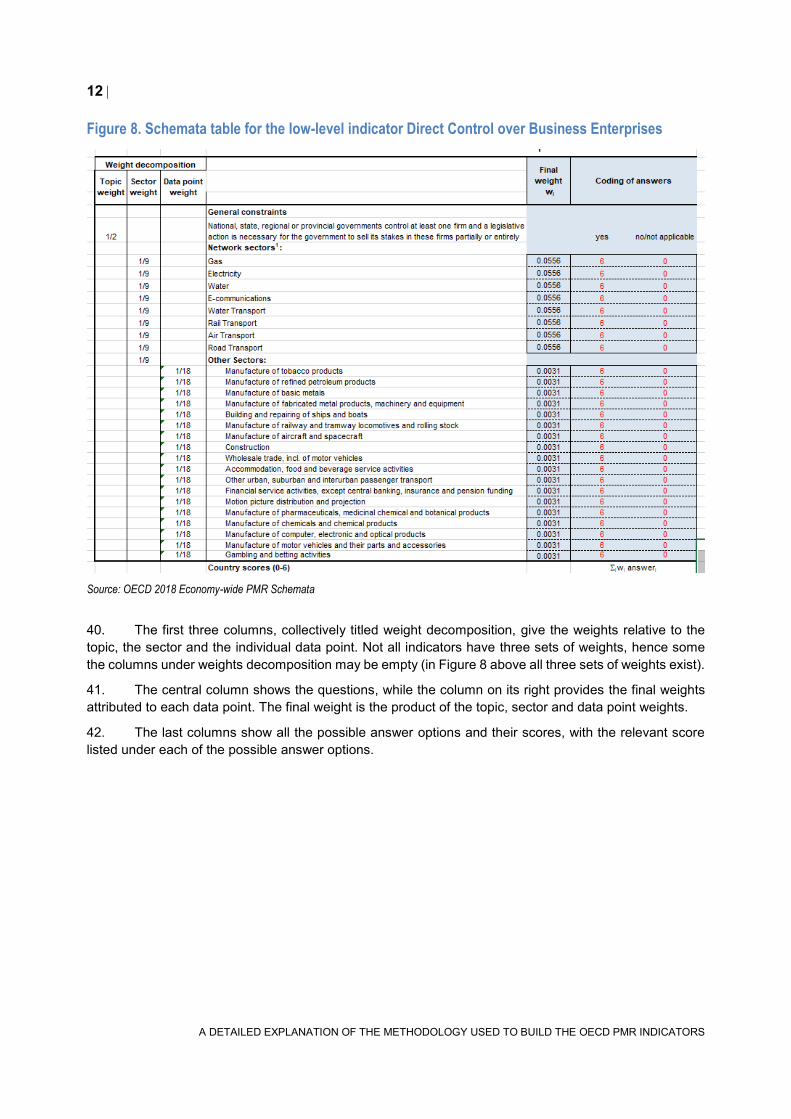
39. Figure 8 below provides an example of the structure of the tables in the PMR Schematas by
showing the schemata for one low-level indicator: Direct Control over Business Enterprises.
12
A DETAILED EXPLANATION OF THE METHODOLOGY USED TO BUILD THE OECD PMR INDICATORS
Figure 8. Schemata table for the low-level indicator Direct Control over Business Enterprises
Source: OECD 2018 Economy-wide PMR Schemata
40. The first three columns, collectively titled weight decomposition, give the weights relative to the
topic, the sector and the individual data point. Not all indicators have three sets of weights, hence some
the columns under weights decomposition may be empty (in Figure 8 above all three sets of weights exist).
41. The central column shows the questions, while the column on its right provides the final weights
attributed to each data point. The final weight is the product of the topic, sector and data point weights.
42. The last columns show all the possible answer options and their scores, with the relevant score
listed under each of the possible answer options.

13
A DETAILED EXPLANATION OF THE METHODOLOGY USED TO BUILD THE OECD PMR INDICATORS
Figure 9. Schemata table for the low-level indicator Governance of SOEs
Source: OECD 2018 Economy-wide PMR Schemata
43. If more than one answer option have the same score, the two options are listed together. For
example in Figure 9 above the two answer options treasury/ ministry of finance or economy (circled in
yellow) both lead to a score of 3, hence they are in the same column.

14
A DETAILED EXPLANATION OF THE METHODOLOGY USED TO BUILD THE OECD PMR INDICATORS
Figure 10. Example of a score attributed to a combination of the answers
44. Sometimes the answers to two questions can be scored jointly. An example can be seen in Figure
10 above and relates to the two questions: “Are there any SOEs which are not incorporated into limited
liability companies?”, and “If yes, are these SOEs subject to private company law?”. In this case, the scores
are attributed to a combination of the answers to the two questions.
How the information is aggregated
45. These scores are then aggregated into the 18 low-level indicators using the weights that are shown
in the relevant tables of the PMR Schematas. These low-level indicators are then aggregated into six mid-
level indicators, which are in turn aggregated into two high-level indicators. The overall economy-wide
indicator is the average of these two high-level indicators.
46. At each step of aggregation, the composite indicators are calculated as a simple average of their
components (Figure 11).

15
A DETAILED EXPLANATION OF THE METHODOLOGY USED TO BUILD THE OECD PMR INDICATORS
Figure 11. Aggregation process for the PMR economy-wide indicator.
47. A similar approach is used for the sector indicators, though the aggregation involves less steps.
48. The weights shown in the Schematas are the ones that are used when all data points for a low-
level indicator are available. However, there can be case when one or more data points are missing,
because the answer was not provided or because the relevant sector does not exist. In those cases, the
final weights applied to these data points is set at zero and the final weights attributed to the other data
points contained in the same low-level indicator/sector indicator are rebalanced so that they still sum to 1.
49. For instance, the low-level indicator Governance of SOEs is composed of ten data points, each
with a final weight of 1/10. In case the answer to one of the questions contributing to the low-level indicator
is missing, the data points would become nine and the final weight for each would become 1/9 (Figure 9).
The rebalancing is not always as easy as in the example just given, since there could be more than one
set of weights, whose product gives the final weight. The rebalancing of the weights is done using the
statistical program Stata.

16
A DETAILED EXPLANATION OF THE METHODOLOGY USED TO BUILD THE OECD PMR INDICATORS
Annex A. Methodology used in the case of
federal countries
50. The information used to build the PMR indicators refers to laws and regulations in force in the
countries surveyed at a specific point in time. These laws and regulations are usually those set by the
central government, and for federal countries this would be the federal government. However, there may
sectors or regulatory areas where laws, regulations and policies are set by lower levels of government, for
example, they may be set at regional level or even at city level. Respondents are then asked to refer to
the laws and regulations set at the level that is most relevant in the specific case. For example, regulation
of shop opening hours in some countries is set at national level, while in others it is set at city level.
51. In federal countries, it is often the case that some sectors are regulated at state level rather than
by the central (federal) government and in that case, the PMR questionnaire has to be answered with
reference to state legislation. The answers should then refer to a state that is considered as
representative.Table A.1 below shows the state that is considered for the federal countries for which such
a selection has been necessary. In order to ensure that answers are comparable over time this list remains
fixed over time.
Table A.1. Representative states used when collecting data on federal countries
Federal Country Representative State
Australia New South Wales
Brazil Distrito Federal
Belgium Flemish region
Canada Ontario
Germany Bavaria
Indonesia Special Capital Region of Jakarta (DKI Jakarta)
Mexico Districto Federal de Mexico
Switzerland Canton of Zurich
USA See next section
Special case: PMR Indicators for the United States of America
52. In previous PMR vintages, the PMR database for the United States of America included
information on the state of New York, which was considered as the representative state for the matters
regulated at state level. For this vintage, the administration has asked the OECD to consider the
information relative to two states, in order to give a more balanced picture of the overall country. Hence,
they have commissioned a consultant to collect data for the state of New York (NY) and the state of Texas
(TX). Hence, the methodology for calculating the PMR indicators for the USA has been changed to
consider this novelty.
17
A DETAILED EXPLANATION OF THE METHODOLOGY USED TO BUILD THE OECD PMR INDICATORS
Data Collection
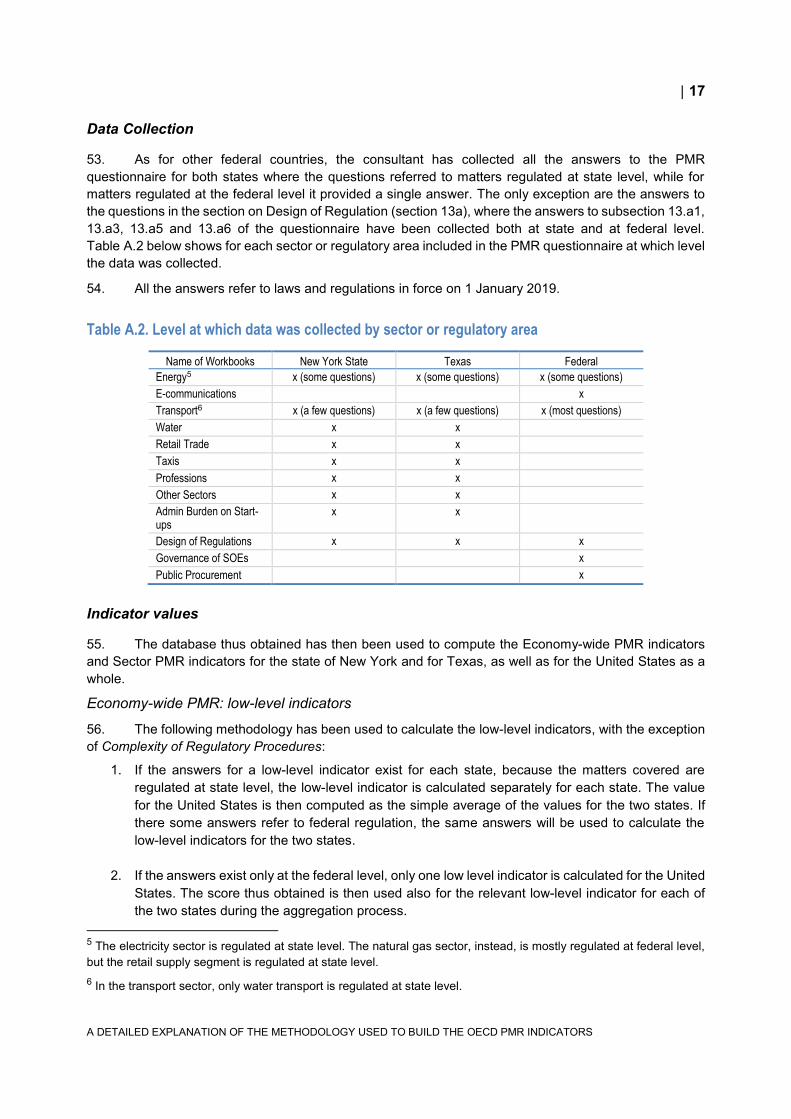
53. As for other federal countries, the consultant has collected all the answers to the PMR
questionnaire for both states where the questions referred to matters regulated at state level, while for
matters regulated at the federal level it provided a single answer. The only exception are the answers to
the questions in the section on Design of Regulation (section 13a), where the answers to subsection 13.a1,
13.a3, 13.a5 and 13.a6 of the questionnaire have been collected both at state and at federal level.
Table A.2 below shows for each sector or regulatory area included in the PMR questionnaire at which level
the data was collected.
54. All the answers refer to laws and regulations in force on 1 January 2019.
Table A.2. Level at which data was collected by sector or regulatory area
Name of Workbooks New York State Texas Federal
Energy5 x (some questions) x (some questions) x (some questions)
E-communications x
Transport6 x (a few questions) x (a few questions) x (most questions)
Water x x
Retail Trade x x
Taxis x x
Professions x x
Other Sectors x x
Admin Burden on Start-ups
x x
Design of Regulations x x x
Governance of SOEs x
Public Procurement x
Indicator values
55. The database thus obtained has then been used to compute the Economy-wide PMR indicators
and Sector PMR indicators for the state of New York and for Texas, as well as for the United States as a
whole.
Economy-wide PMR: low-level indicators
56. The following methodology has been used to calculate the low-level indicators, with the exception
of Complexity of Regulatory Procedures:
1. If the answers for a low-level indicator exist for each state, because the matters covered are
regulated at state level, the low-level indicator is calculated separately for each state. The value
for the United States is then computed as the simple average of the values for the two states. If
there some answers refer to federal regulation, the same answers will be used to calculate the
low-level indicators for the two states.
2. If the answers exist only at the federal level, only one low level indicator is calculated for the United
States. The score thus obtained is then used also for the relevant low-level indicator for each of
the two states during the aggregation process.
5 The electricity sector is regulated at state level. The natural gas sector, instead, is mostly regulated at federal level,
but the retail supply segment is regulated at state level.
6 In the transport sector, only water transport is regulated at state level.

18
A DETAILED EXPLANATION OF THE METHODOLOGY USED TO BUILD THE OECD PMR INDICATORS
57. The low-level indicator Complexity of Regulatory Procedures has been calculated in a different
manner, because a subset of questions that refer to law-making process can be answered both at federal
and at state level. For these questions, the OECD has calculated a score that is an average of the answer
at federal level and the one at state level (see Box A.1)
Box A.1. Example of how answers are scored to build the Complexity of Regulatory Procedures low-level indicator
For a generic OECD country: yes no
Does the government publish online a list of primary laws to be prepared, modified, reformed or repealed in the next six months or more? 0 6 Does the government publish online a list of subordinate regulations to be prepared, modified, reformed or repealed in the next six months or more? 0 6
For the state of New York and Texas only: FED is the answer relative to regulation at federal level
and States is the answer for the individual state
yes(FED) & yes(States)
yes(FED) & no(States) / no(FED) & yes(States)
no(FED) & no(States)
Does the government publish online a list of primary laws to be prepared, modified, reformed or repealed in the next six months or more? 0 3 6 Does the government publish online a list of subordinate regulations to be prepared, modified, reformed or repealed in the next six months or more? 0 3 6
58. These scores have been used to calculate the low-level indicator Complexity of Regulatory
Procedures for each of the two states, and their simple average is used to construct the low-level indicator
Complexity of Regulatory Procedures for the United States as a whole.
Economy-wide PMR: mid-level indicators and high-level indicators
The methodology used to calculate these indicators is the same as those adopted for all the other countries
included in the PMR dataset, which is describe in the first part of this note.
Sector indicators
The methodology that has been used to calculate the sector indicators differs across individual sectors:
1. Energy and Transport: Since these sectors are mostly regulated at state-level, these sector
indicators have been computed separately for the state of New York and for Texas. The value for
the United States is the simple average of the indicators for the two states. However, in the case
of water transport and natural gas, regulations are mostly set at the federal level, hence in these
two industries most of the answers are the same across the two states.
2. E-communications: Since this sector is regulated at federal level, this sector indicator has been
computed directly for the United States as a whole. The score obtained has then been attributed
to each state individually.
3. Retail Distribution, Professional Services and Retail Sales of Medicines: Since these sectors are
mostly regulated at state-level, these sector indicators have been computed separately for the
state of New York and for Texas. The value for the United States is the simple average of the
indicators for the two states.

19
A DETAILED EXPLANATION OF THE METHODOLOGY USED TO BUILD THE OECD PMR INDICATORS
Annex B. Other data sources
59. The following sections will explain more in detail the additional sources of information used to
compile the PMR database.
Main source: the PMR questionnaires
60. The PMR database is mostly based on the answers to the PMR questionnaire provided by the
relevant authorities of the countries surveyed. However, in order to limit the burden imposed on these
authorities, where possible the PMR database directly draws on other OECD indicators and databases.
Only in one case the OECD relies on an external dataset: UNCTAD Trade Analysis Information System
database.
Services Trade Restrictiveness Index (STRI)
61. A few answers are taken from the database underlying the OECD Services Trade Restrictiveness
Index (STRI)7, developed by the OECD Trade and Agricultural Directorate (See Box B.1 for more details).
The STRI measures to what extent national regulations create obstacles to international trade in 22 service
sectors, such as e-communication, transport and retail trade.
62. The STRI database covers all the OECD countries and a few other important world economies.
When the STRI database does not include a country, the national authorities are asked to answer the
relevant questions.
Box B.1. Information that come from the STRI database
The answers to the following questions, which are related to barriers to foreign entry, are taken from the STRI database:
Retail trade: Q7a.1.6
Professions: Q8a.5.2, Q8a.5.3, Q8c.5.2, Q8c.5.3, Q8d.5.2, Q8d.5.3, Q8e.5.2, Q8e.5.3, Q8a.5.4, Q8c.5.4, Q8d.5.4, Q8e.5.4
Public procurement: Q13c.4.4_i, Q13c.4.4_ii, Q13c.4.4_iii, Q13c.4.4_iv
Indicators of Regulatory Policy and Governance (iREG)
63. The Regulatory Policy and Governance (iREG)8 indicators have been developed by the OECD
Public Governance Directorate to measure regulatory performance in two regulatory areas - stakeholder
engagement and regulatory impact assessment (RIA) - and provide a baseline measurement to track
countries’ progress over time.
64. For the countries for which iREG database available, the information therein contained is used to
provide the answers to some of the questions that are included in three low-level components of the PMR
7 http://www.oecd.org/trade/topics/services-trade/
8 http://www.oecd.org/gov/regulatory-policy/indicators-regulatory-policy-and-governance.htm

20
A DETAILED EXPLANATION OF THE METHODOLOGY USED TO BUILD THE OECD PMR INDICATORS
economy-wide indicator: Assessment of Impact on Competition, Interaction with Interest Groups, and
Complexity of Regulatory Procedures (See Box B.2 for more details).
65. The only exception is the United States of America, for this information is not taken from the iREG
database. The reason lies in the fact that the iREG database only includes information on the process
used to design primary laws and secondary regulations that are issued by the executive. In the United
States of America, it is Congress that issues the majority of these laws and regulation. Since information
on this process was not available in the iREG dataset, it was collected by the consultant. Furthermore, for
federal countries the iREG database does not include information on design of laws and regulations at
state level, hence the answers for the state of New York and Texas were also collected by the consultant.
66. At present, the iREG database includes information on OECD member countries, the 5 EU
member states that are not part of the OECD, and a few other countries. When the iREG database does
not include a country, the national authorities are asked to answer the relevant questions.
Box B.2. Information that come from the iREG database
The answers to the following questions are taken from the iREG database:
Q13a.1.1, Q13a.1.1a, Q13a.1.1b, Q13a.1.2, Q13a.1.2a, Q13a.1.5, Q13a.1.6, Q13a.2.8,
Q13a.3.1_i, Q13a.3.1_ii, Q13a.3.1_iii Q13a.3.1a, Q13a.3.2, Q13a.3.2a, Q13a.3.3, Q13a.3.3a,
Q13a.3.4, Q13a.3.4a, Q13a.3.5, Q13a.3.5a, Q13a.3.6, Q13a.3.6a, Q13a.3.8a,
Q13a.6.1, Q13a.6.1a, Q13a.6.2, Q13a.6.2a, Q13a.6.3, Q13a.6.3a, Q13a.6.4, Q13a.6.4a, Q13a.6.5
Q13a.6.5a, Q13a.6.6, Q13a.6.6a, Q13a.6.7;
Regulatory Restrictiveness Index (FDI index)
67. The FDI Index9, developed by the Directorate for Financial Affairs, measures statutory restrictions
on foreign direct investment across 22 economic sectors.
68. It assesses four main types of restrictions on FDI: 1) foreign equity limitations; 2) discriminatory
screening or approval mechanisms; 3) restrictions on the employment of foreigners as key personnel and
4) other operational restrictions, e.g. restrictions on branching and on capital repatriation or on land
ownership by foreign-owned enterprises. Restrictions are evaluated on a 0 to 1 scale, from more to less
open. The overall restrictiveness index is the average of 22 sectoral scores.
69. The FDI Index is used to calculate the low-level indicator of the economy-wide PMR Barriers to
FDI. The value of this low-level indicator is set equal to the value of the FDI index, adjusted to 0 to 6 scale.
(as explained in Box B.3).
9 http://www.oecd.org/investment/fdiindex.htm

21
A DETAILED EXPLANATION OF THE METHODOLOGY USED TO BUILD THE OECD PMR INDICATORS
Box B.3. Adjusting the value of FDI Index
The FDI index is between 0 and 1, where 0 designates a situation in which there are no restrictions to FDI, and 1 designates a situation in which restrictions are very high. In order to adjust the FDI index to
the 0 to 6 scale used in the PMR indicators, the following formula is used: 𝑩𝒂𝒓𝒓𝒊𝒆𝒓𝒔 𝒕𝒐 𝑭𝑫𝑰 =𝑭𝑫𝑰 𝒊𝒏𝒅𝒆𝒙 ∗ 𝟔
70. The FDI index is calculated for all OECD countries and an increasing number of other countries.
However, if the FDI index is not available for a country that is included in the PMR database, the following
approach is used:
If the country is a European Union member, the average of the FDI indexes for all the EU member states for which such an index is available is used as a proxy
If the country is neither a member of the OECD nor of the EU, the average of the FDI index for all the non-OECD countries for which such an index is available is used as a proxy.
Trade Facilitation Indicators (TFIs)
71. The TFIs, developed by the OECD Trade and Agricultural Directorate, are 11 indicators that
measure trade border procedures10. Each of the eleven TFIs is composed of several specific and fact-
based variables assessing existing trade-related policies and regulations and their implementation.
72. The low-level indicator of the economy-wide PMR Barriers to Trade Facilitation is calculated as
the simple average of eight TFIs (A to H), adjusted to reflect the PMR scale (as explained in Box B.4).11
Box B.4. Adjusting the value of the TFIs
The TFIs ranges from 0 to 2, where 2 designates the best performance that can be achieved. Hence, not only is the scale different, but also the highest and the lowest value have the opposite interpretation for the PMR indicators.
Hence in order to adapt the TFIs to PMR, the following formula has been used:
𝑩𝒂𝒓𝒓𝒊𝒆𝒓𝒔 𝒕𝒐 𝑻𝒓𝒂𝒅𝒆 𝑭𝒂𝒄𝒊𝒍𝒊𝒕𝒂𝒕𝒊𝒐𝒏𝒔 = (𝟏 −𝒂𝒗𝒆𝒓𝒂𝒈𝒆 𝒐𝒇 𝑻𝑭𝑰𝒔 𝑨 𝒕𝒐 𝑯
𝟐) ∗ 𝟔
73. The OECD TFIs are updated every two years. Their methodology was updated in the 2017 vintage
by inserting additional variables in several of the eleven indicators. As a result, the 2017 vintage includes
two sets of indicators: the first set calculated using the new methodology, and the second set calculated
using the previous one. The latest vintage of PMR indicators includes the latter, i.e. the set of indicators
based on the old methodology.
74. The TFIs are calculated for 160 countries. In those rare cases in which the TFIs are not available
for a country that is included in the PMR database, the following approach is used:
10 http://www.oecd.org/trade/topics/trade-facilitation/
11 In previous vintages the Barriers to Trade Facilitation low-level indicator was based on a set of information collected
through the PMR database. However, during the 2018 methodological review of the PMR indicators it was felt that
using the TFIs would give a more precise overview of these barriers as these indicators include a much large set of
information. In addition, using the TFIs limited the information that had to be asked in the PMR questionnaire.
22
A DETAILED EXPLANATION OF THE METHODOLOGY USED TO BUILD THE OECD PMR INDICATORS
If the country is an OECD member, the average of the relevant TFIs for all the OECD member
states for which such indexes are available is used as a proxy
If the country is not an OECD member, the average of the relevant TFIs for all the non-OECD
countries for which such indexes are available is used as a proxy.
UNCTAD Trade Analysis Information System database
75. The UNCTAD Trade Analysis Information System (TRAINS) is a computerised database that
collects data on trade control measures. It includes data on 150 countries.
76. The OECD takes from this database the average value of the tariff rates effectively applied in a
country for all trade. This average value is broken down in classes to which the 0 to 6 PMR scale is applied.
This value feeds into the Tariff Barriers low-level indicator in the PMR economy-wide indicator.