product profitability management and analysis on-ramp to sap plm
Post on 19-Dec-2015
225 views
TRANSCRIPT
Product Profitability Management and Analysis
On-Ramp to SAP PLM

• Introduction to Samsung
• PLM at Samsung
• Product Profitability Management&Analysis and SAP
• Case Study
• Demo
• Summary
Overview

World-class products are core to Samsung
•$28B revenues in FY 2000•Introduced 250 products last year•32 award winning products•Average 14 month concept to obsolescence lifecycles•6 month concept-to-shelf lifecycle
ElectronicsElectronics
Electro-MechanicsElectro-Mechanics
Heavy IndustriesHeavy Industries
ChemicalsChemicals
•Ship building•Aerospace•Defense•Optical and semi-conductor equipment
•Display devices•Liquid crystal displays•Cathode ray tubes
•Petro-chemicals•Fine chemicals•Defense•Optical and semi-conductor equipment

Strategic PLM Initiative at SDSA(Samsung Data Systems America)
• Introduce and support PLM initiatives through out Samsung and its subsidiaries to keep Samsung corporation competitive
• Make best practices and lessons learnt from our experience with Samsung to our customers in discrete manufacturing vertical
• Partner with the leading PLM Vendors and provide domain knowledge (CAD Data Management, Visualization and Integration) that enhances their PLM offering
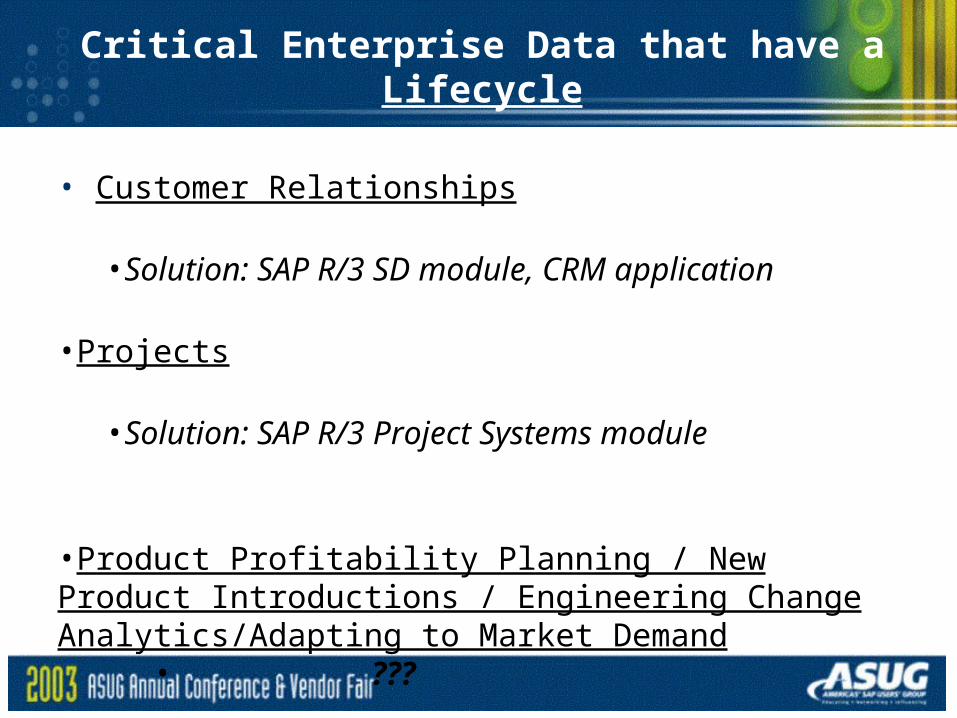
Critical Enterprise Data that have a Lifecycle
• Customer Relationships
•Solution: SAP R/3 SD module, CRM application
•Projects
•Solution: SAP R/3 Project Systems module
•Product Profitability Planning / New Product Introductions / Engineering Change Analytics/Adapting to Market Demand
• ???
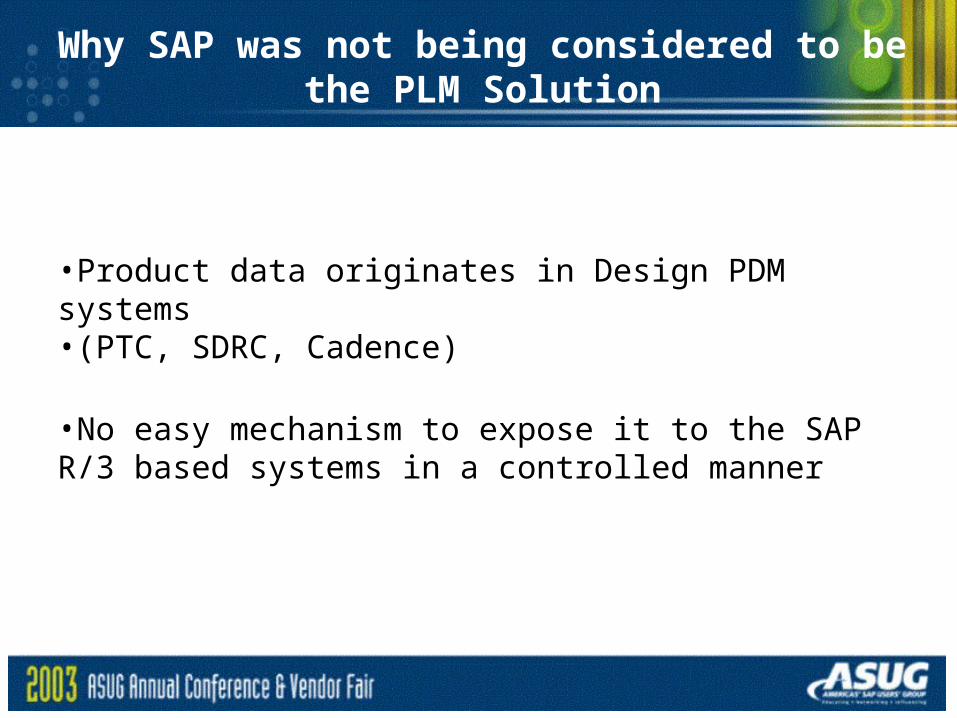
Why SAP was not being considered to be the PLM Solution
•Product data originates in Design PDM systems•(PTC, SDRC, Cadence)
•No easy mechanism to expose it to the SAP R/3 based systems in a controlled manner

Conditions in Manufacturing
Product ProfitabilityMany products do not meet projected profitability targets
Time to MarketTime delays common in most
new product introductions
Cost of QualityCost of quality cutting into
profits
The Industry is under pressure to perform

The Challenges to achieving these goals
Product Profitability
Demand forecast
Investment model Cost models
Industry specific models SG & A
Time to Market
Design Lead time
Launch Lead time
Testing Lead time
Corrective action lead time Response
Cost of Quality
Design Issues
Component Failure
Continuous improvement
Cost of Obsolescence Inventory

The Existing Approach to Measuring ROI
Investments
Revenues
SGA
COGs
Service
Data Warehouse P&L Statement
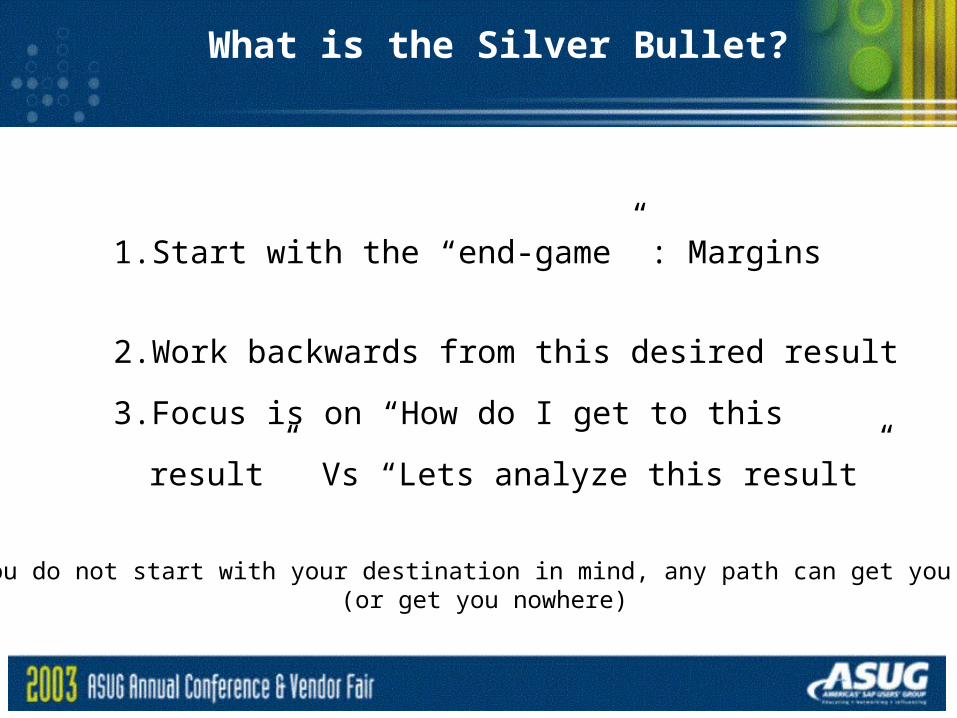
What is the Silver Bullet?
1. Start with the “end-game” : Margins
2. Work backwards from this desired result
3. Focus is on “How do I get to this result” Vs
“Lets analyze this result”
If you do not start with your destination in mind, any path can get you there(or get you nowhere)

Our ApproachProduct Profitability Management&Analysis
1. Start with the “end-game” : Margins
2. Work backwards from this desired result
3. Leverage data in existing systems
PPMA
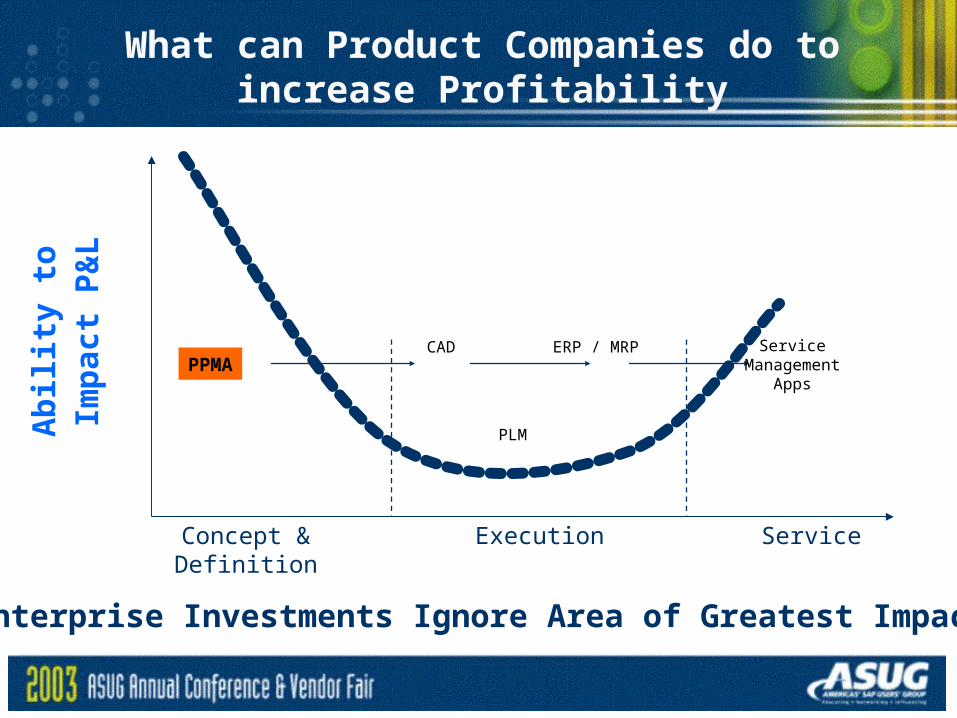
What can Product Companies do to increase Profitability
Concept & Definition
Execution Service
Service Management
AppsAb
ilit
y to
Im
pac
t P
&L
Enterprise Investments Ignore Area of Greatest Impact!
ERP / MRP
PLM
CADPPMA

THE INVERTED P&L STATEMENT FLOW
Product Profitability
Demand forecast
Investment model Cost models
Industry specific models SG & A
Time to Market
Design Lead time
Launch Lead time
Testing Lead time
Corrective action lead time Response
Cost of Quality
Design Issues
Component Failure
Continuous improvement
Cost of Obsolescence Inventory
Investments
Revenues
SGA
COGs
Service
P&L Statement
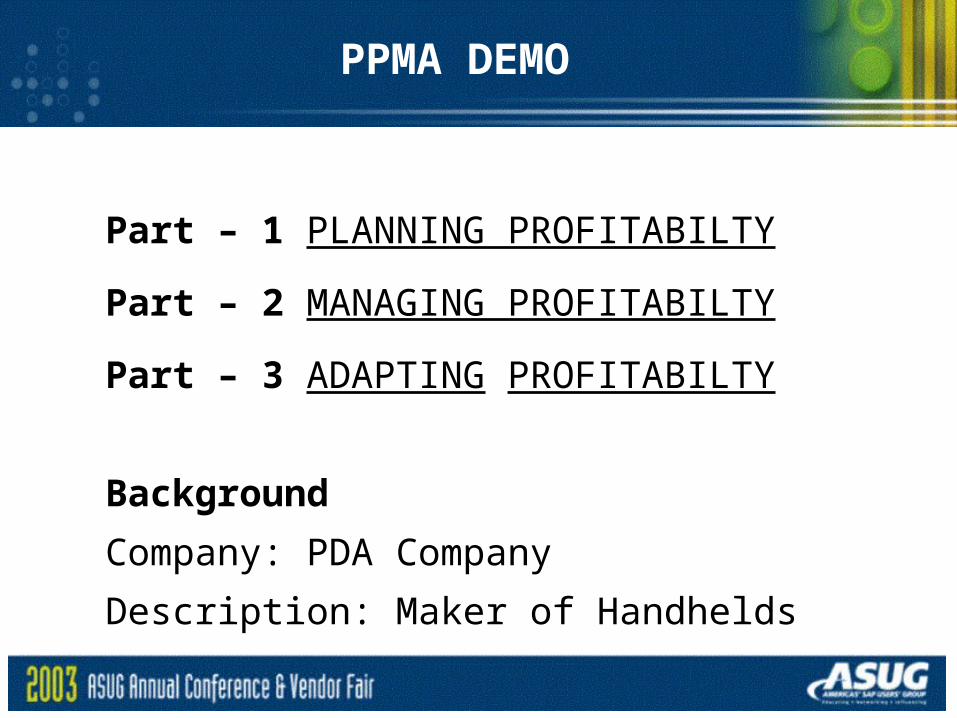
Part – 1 PLANNING PROFITABILTY
Part – 2 MANAGING PROFITABILTY
Part – 3 ADAPTING PROFITABILTY
Background
Company: PDA Company
Description: Maker of Handhelds
PPMA DEMO

Part I - PLANNING PROFITABILITY
Problem Description
– PDA Company is evaluating different design options
– Basic PDA
– Basic PDA with cell phone
– Basic PDA with cell phone and camera
What product has the highest profit potential?
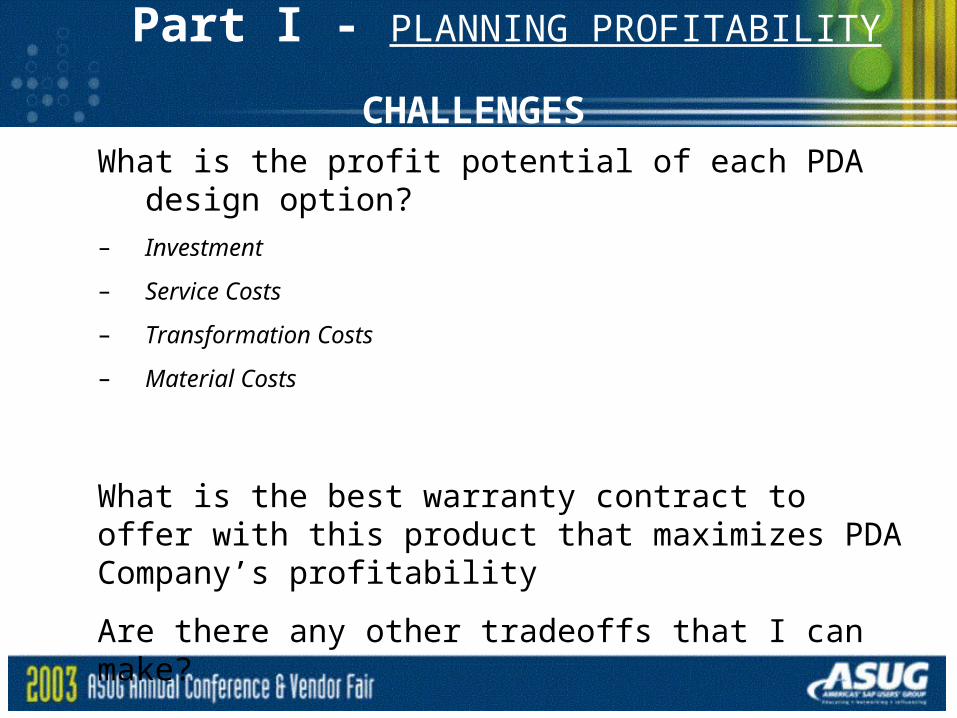
Part I - PLANNING PROFITABILITY
What is the profit potential of each PDA design option?
– Investment
– Service Costs
– Transformation Costs
– Material Costs
What is the best warranty contract to offer with this product that maximizes PDA Company’s profitability
Are there any other tradeoffs that I can make?
CHALLENGES

Part II - MANAGING PROFITABILITY
Problem Description
– The chosen PDA is being manufactured and an
Engineering Change for the LCD panel is being
considered in response to a competitive
situation
What is the impact of this change and when is the right time to introduce this
change
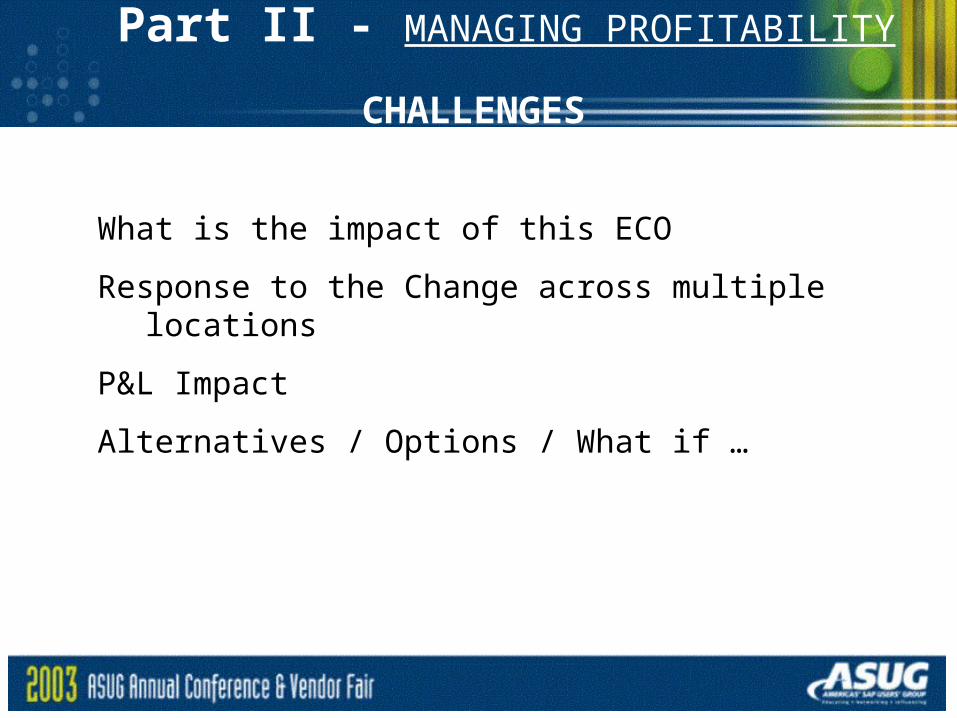
Part II - MANAGING PROFITABILITY
What is the impact of this ECO
Response to the Change across multiple locations
P&L Impact
Alternatives / Options / What if …
CHALLENGES
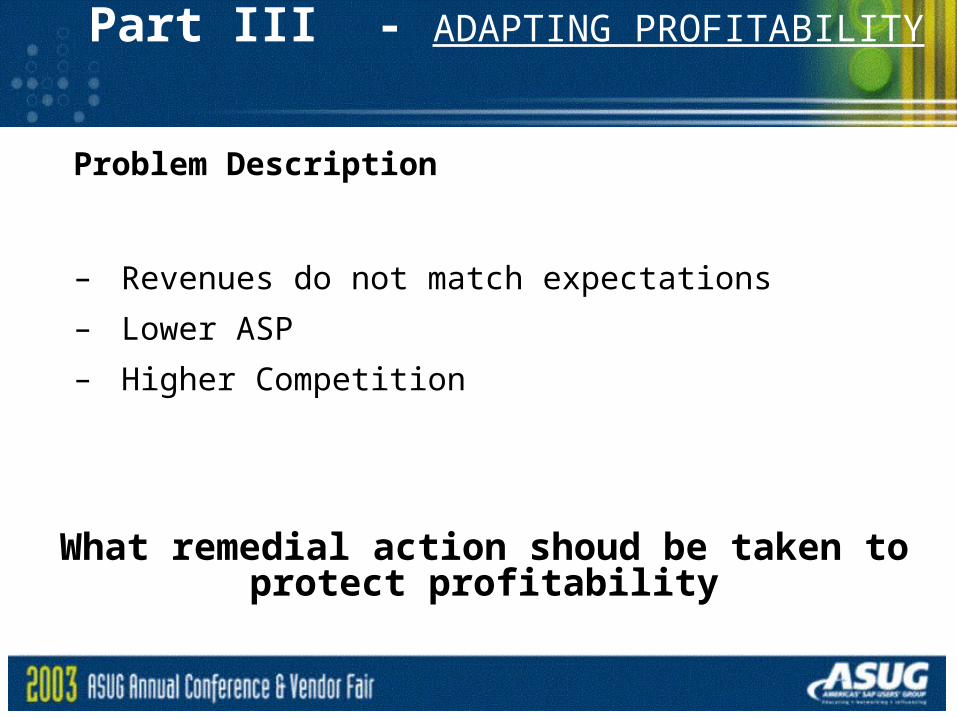
Part III - ADAPTING PROFITABILITY
Problem Description
– Revenues do not match expectations
– Lower ASP
– Higher Competition
What remedial action shoud be taken to protect profitability
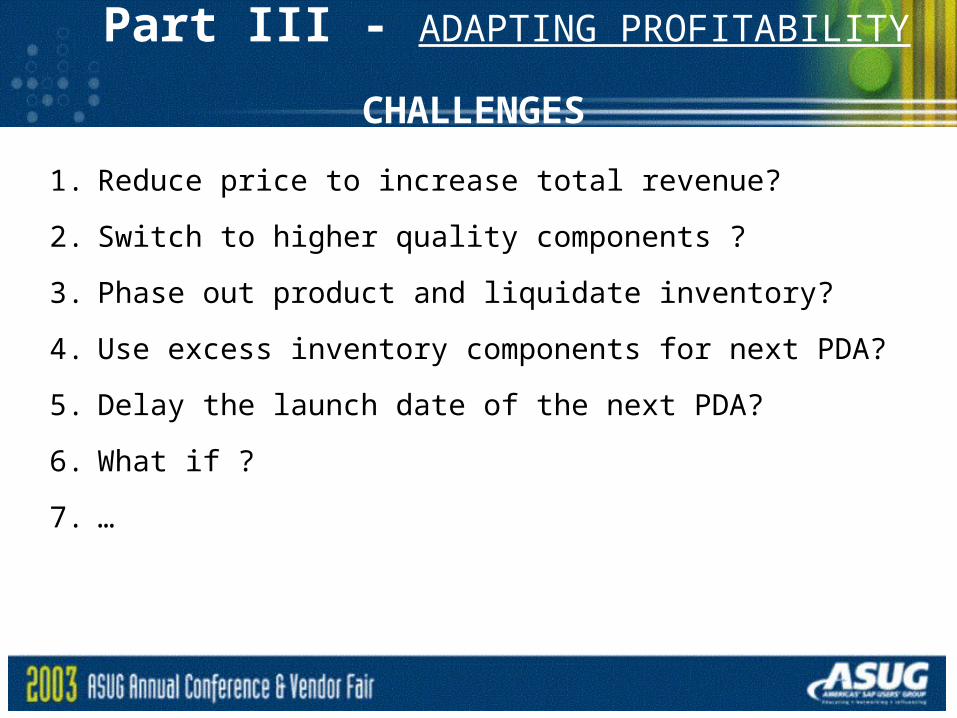
Part III - ADAPTING PROFITABILITY
1. Reduce price to increase total revenue?
2. Switch to higher quality components ?
3. Phase out product and liquidate inventory?
4. Use excess inventory components for next PDA?
5. Delay the launch date of the next PDA?
6. What if ?
7. …
CHALLENGES

SUMMARY
•Redefining PLM in Financial Terms allows SAP to take control
•Provides an ON-RAMP to SAP PLM functionality
•SAP R/3 continues to be the master repository and the system of reference
•Increases the usability and ROI of the investment in SAP R/3
Thank you for attending!Please remember to complete and return your evaluation form following this session.
Session Code: [3702]
650 954 7047