product stewardship & extended ... - aspen science center
TRANSCRIPT

Comprehensive Product Stewardship Oct 2010 v2.3& Extended Producer Responsibility
Product Stewardship & Extended Producer Responsibility
Towards a Comprehensive Packaging Recycling Strategy for the US
Lisa Chacón, Gil Friend, Nicholas Kordesch, Steven ReinhardtNatural Logic, Inc.
October 25 2010v 2.3
This white paper was produced by Natural Logic, Inc.The opinions expressed in this white paper are solely those of Natural Logic, Inc.
PO Box 119 • Berkeley CA 94701 • http://www.natlogic.com • [email protected]
Natural Logic Inc. http://www.natlogic.com/EPR Page 1 of 69

Comprehensive Product Stewardship Oct 2010 v2.3& Extended Producer Responsibility
Contents
I. Summary...................................................................................................................................................4
II. Introduction.............................................................................................................................................6
A Framing the Challenges...........................................................................................................................6
B The Opportunity.......................................................................................................................................7
C Progress towards Product Stewardship in the US................................................................................8
III. Getting to Greater Than 70% Diversion of Packaging in the US.....................................................9
A Design for a “Hybrid” EPR System in the US.......................................................................................9
1 EPR Principles..........................................................................................................................................102 System Definition.....................................................................................................................................103 Stakeholder Accountabilities....................................................................................................................124 System Financing......................................................................................................................................16
B Transparency and Consistency in Metrics & Reporting....................................................................18
C Strategy for Adoption in the US............................................................................................................19
1 EPR Pilot...................................................................................................................................................192 Alliances and Partnerships........................................................................................................................203 Barriers/Potential opposition.....................................................................................................................214 Implementing EPR in Bottle Deposit Law (BDL) States.........................................................................225 Other issues...............................................................................................................................................266 Next steps..................................................................................................................................................26
IV. Appendices............................................................................................................................................28
A Appendix: Tables....................................................................................................................................29
Table 1. Overall performance of EPR systems in selected countries ........................................................29 Table 2: EPR Systems Summary.................................................................................................................31 Table 3. Fees per material* (PET, HDPE, Al, Cardboard/Paper, Glass).....................................................34 Table 4. US Bottle Deposit Systems by State.............................................................................................36 Table 5. PET Recovery and System Performance ......................................................................................38 Table 6. EPR system accountabilities.........................................................................................................39 Table 7. Pending State EPR Legislation in the US ....................................................................................41
B Appendix: Figures..................................................................................................................................44
Figure 1. Proposed US Product Stewardship/EPR System ........................................................................44 Figure 2. Population density and concentration in the US .........................................................................45 Figure 3a. Voluntary Curbside Pickup (Local Government contracts with WMOs)..................................46 Figure 3b. Voluntary Curbside Pickup (Local Government is waste management services provider).......47 Figure 3c. Voluntary Curbside Pickup (Consumer contracts directly with WMO)....................................48 Figure 4. Bottle Deposit System.................................................................................................................49 Figure 5. European EPR System.................................................................................................................50
Natural Logic Inc. http://www.natlogic.com/EPR Page 2 of 69

Comprehensive Product Stewardship Oct 2010 v2.3& Extended Producer Responsibility
C Appendix: Resource Management Systems in the US........................................................................51
1 Voluntary Curbside Pickup.......................................................................................................................512 Pay-As-You-Throw (PAYT)......................................................................................................................523 Bottle Deposit Laws (BDL)......................................................................................................................53
D Appendix: Extended Producer Responsibility in Europe, Canada & Japan...................................54
1 Legal Basis................................................................................................................................................552 System Structure, Funding and Accountability........................................................................................563 Cost Model for Material Fees...................................................................................................................594 Collection & Operations...........................................................................................................................615 Concurrent Policies...................................................................................................................................636 Outreach & Education...............................................................................................................................647 Lessons Learned .......................................................................................................................................648 Summary of Best Practices in EPR...........................................................................................................66
E Appendix: OECD Guidelines for EPR Systems..................................................................................68
Natural Logic Inc. http://www.natlogic.com/EPR Page 3 of 69

Comprehensive Product Stewardship Oct 2010 v2.3& Extended Producer Responsibility
I. Summary
There is now an opportunity to overcome thirty years of stagnation in waste management policy in the US to achieve a whole-system transformation of recycling and resource management systems – by applying extended producer responsibility (EPR) principles. This opportunity is driven by clear and compelling financial accountability, and has the potential to meet or exceed global best practices and achieve greater than 70% diversion from landfill, as well as provide benefits to all stakeholders.
This white paper summarizes work conducted by Natural Logic Inc. to:
Explore the benefits and understand the barriers to implementing an EPR-based comprehensive product stewardship system in the US;
Survey and assess best practices internationally; Identify key opportunities and barriers to improving resource management practices in
the US; Convene internal and external experts on design, packaging and materials, waste;
management, environmental and waste policy, European, Japanese and Canadian EPR systems, and sustainability; and
Develop this white paper as a “provocation” for a new generation of discussion and action.
As part of this work, Natural Logic designed and facilitated a two-day “innovation charrette” to design a packaging recycling system for the US that could ultimately achieve greater than 70% diversion from landfill for packaging from household and industrial, commercial and institutional (ICI) waste streams. Participants conducted a systems-level analysis of existing resource management systems, and contributed to a design for a US system that would benefit the widest range of stakeholders, which is presented in this white paper.
Getting to greater than 70% diversion for all packaging in the US (perhaps with intermediate targets) will require a policy and legislative framework that includes mechanisms to:
Shift accountability for packaging recycling systems to Producers (usually defined under EPR policies as brand owners and first importers)
Create incentives for Producers to make more sustainable packaging choices Maintain accountability of local and regional government for waste disposal and
diversion of organics Educate residential consumers and industrial, commercial and institutional (ICI) waste
generators and incent them to sort recyclables out of the waste stream Create a standard for measuring and reporting on program performance
The foundation of this proposal, outlined in Section III, is a strategy for packaging which includes enactment of state legislation, such as a framework Product Stewardship bill, that assigns responsibility for meeting specific packaging recycling targets to the Producers, and enables them to be collectively responsible for establishing and financing collection and
Natural Logic Inc. http://www.natlogic.com/EPR Page 4 of 69

Comprehensive Product Stewardship Oct 2010 v2.3& Extended Producer Responsibility
recycling programs. This will effectively shift the burden of cost for current recycling programs to Producers and away from local government. The strategy for a state-level pilot, and arguments for enacting state rather than federal legislation is discussed in Section III C of this document.
Based on lessons learned from existing EPR systems in Europe, Japan and Canada, the basic principles of EPR should include:
1. A legal basis for assigning Producers (inclusive of first importers) responsibility for the recovery of recyclable packaging materials;
2. Targets that producers must meet collectively;3. Authorization to form recovery organization(s) that could manage the collection of
materials on behalf of Producers;4. With the option for producers to meet their obligations individually as appropriate 5. Material fees based on the net costs to manage individual material types;6. Penalties or other mechanisms to eliminate non-compliance and free riders among
producers.
The EPR system proposed here for recycling of packaging material is 100% funded by Producers, with the Recovery Organization (NPRO) controlling the funds, contracts and details of curbside recycling programs. (Alternately, funding responsibility could be shared between producers and municipalities, but our research suggests that a “full cost” system provides for better control of recovery system efficiencies, and more powerful incentives for product design strategies that will drive further waste stream reductions.)
In summary:
Producers (or first importers) pay fees to the Recovery Organization based on the volume and type of packaging materials put into the market.
Producers (through the retailers) sell goods to the Consumer. Consumers pay for products (with package recycling costs potentially rolled into the
product price by Producers). Consumers pay Local Government or Waste Management Operators (WMOs) for waste
disposal and composting– ideally incented by a PAYT scheme. The Recovery Organization contracts with WMOs for collection, sorting and processing
services (Local government would be eligible to compete for the contracts or be grandfathered in depending on system details).
The Recovery Organization and/or WMOs sell recycled material on the open market (with revenue sharing to be determined).
The Recovery Organization applies the Producer fees and revenues from the sale of recycled material to the cost of operating and improving the system, by allocating material-specific profits towards reducing the next year’s material-specific fees, and towards public education, research, infrastructure investment, etc.
This white paper represents a starting point, based on research and interviews, and a synthesis of experience and perspectives from people and organizations with decades of experience in these issues. We hope that it will provoke and support considered discussion of the issues and options
Natural Logic Inc. http://www.natlogic.com/EPR Page 5 of 69

Comprehensive Product Stewardship Oct 2010 v2.3& Extended Producer Responsibility
presented here, and the development of systems that significantly advance resource recovery policies in the US.
To that end, we propose these next steps:
Review this white paper with key stakeholders Circulate and discuss with key industry sectors (initially: beverage, CPG, retail waste
management, etc) and key political & NGO partners); Engage with the California, New York, Texas, Vermont, Connecticut, Washington,
Oregon, Midwest, Northwest Product Stewardship Councils; Review responses (perhaps in an additional Innovation Charrette cycle) and refine
strategy; Conduct cost benefit analyses and diversion potential analyses in order to fairly evaluate
parallel BDL and Product Stewardship versus Product Stewardship only scenarios; Develop detailed business and operational plans for pilot, financing scheme, information
systems, etc. to address issues including revenue sharing from the sale of processed recyclable materials
Design and host “legislation charrettes” to bring together key stakeholders to craft initial legislation.
Develop business and operational templates for a state pilot, financing scheme, information systems, etc.
Gain commitments and roll out campaign in pilot state(s).
II. Introduction
A Framing the Challenges
In 2006 the United States generated an estimated 413 million tons of municipal solid waste (MSW) – more than a ton of “waste” for every American, of which only 29% was recycled and composted.1 The cost of waste is substantial – not only the direct costs of waste management, and the indirect costs of environmental and health impacts, but also the lost value of both raw and processed materials used once and then lost to commerce.
In addition, trash is piling up in places where we don’t want it to, such as the garbage patch in the Pacific Ocean, where an estimated 100 million tons of plastic packaging has drifted and collected.2
1 “The 16th Nationwide Survey of MSW Management in the US: The State of Garbage in America,” Biocycle Magazine, Dec 2008, pp. 22-29.2 Marks, Kathy, and Daniel Howden. "The world's rubbish dump: a garbage tip that stretches from Hawaii to Japan." The Independent. 5 Feb. 2008. Web. 27 July 2009. <By Kathy Marks, Asia-Pacific Correspondent, and Daniel Howden>.
Natural Logic Inc. http://www.natlogic.com/EPR Page 6 of 69

Comprehensive Product Stewardship Oct 2010 v2.3& Extended Producer Responsibility
B The Opportunity
There is now an opportunity to overcome thirty years of entrenched waste management policy debate (some would say “stagnation”) to achieve a whole-system transformation of recycling and resource management systems – by applying the principles of extended producer responsibility (EPR) to US systems. EPR and Pay As You Throw (PAYT) systems provide clear and compelling financial accountability and together, have the potential to meet or exceed global best practices and achieve greater than 70% diversion from landfill, as well as provide benefits to all stakeholders.
Recycling rates for packaging can reach or exceed 65%, and recovery rates can be as high as 95% with material-specific deposit systems (or when waste-to-energy (WTE) systems are employed, as demonstrated in Europe). “Existence,” as Kenneth Boulding astutely observed, “is proof of the possible.”
Even without WTE, which is controversial in the US, there is a significant opportunity to improve the US recycling rate, which averaged 33.4% in 2007. The EPA estimates that 75% of landfilled material can be readily recycled.3 Therefore, there is an opportunity to recover an additional estimated 156.5 million tons of recyclable material of the 254 million tons of municipal waste4 generated in the US in 2007.
The world’s leading programs are based on a framework that requires producers to meet specific targets for material recycling and recovery, relative to the total amount of packaging that they have put into the marketplace – effectively assigning end of life responsibility to producers. These programs are commonly known as “extended producer responsibility,” or EPR programs. There are significant benefits of EPR, including shifting the responsibility for collecting packaging – and the incentives for recycling, waste reduction and design innovation – from local government to producers; recycling targets which are mandated by law; and recycling systems that are financed, and in some cases managed by packaging producers rather than government for greater effectiveness and efficiency.
To further explore the benefits and understand the barriers to implementing an EPR system in the US, Natural Logic surveyed and assessed best practices internationally; identified key opportunities and barriers to improve practices in the US; convened internal and external experts on design, packaging and materials, waste management, environmental and waste policy, European, Japanese and Canadian EPR systems, and sustainability; and developed this white paper as a “provocation” for a new generation of discussion and action.
As part of this work, Natural Logic designed and facilitated a two-day “innovation charrette” to design a packaging recycling system for the US that could achieve greater than 70% diversion of 3 "California Reaches Over 50% Waste Diversion." Earth911.com. Web. 02 Nov. 2009. <http://earth911.com/blog/2009/02/20/california-reaches-over-50-waste-diversion/>. See also “Municipal Solid Waste Generation, Recycling, and Disposal in the United States:, Facts and Figures for 2008”, <http://www.epa.gov/osw/nonhaz/municipal/pubs/msw2008rpt.pdf>.4 US. EPA. Office of Resource Conservation and Recovery. Municipal Solid Waste Generation, Recycling, and Disposal in the United States: Facts and Figures for 2007. Nov. 2008. Web. 28 July 2009. <http://www.epa.gov/waste/nonhaz/municipal/pubs/msw07-fs.pdf>.
Natural Logic Inc. http://www.natlogic.com/EPR Page 7 of 69

Comprehensive Product Stewardship Oct 2010 v2.3& Extended Producer Responsibility
recyclable packaging and printed materials from household and commercial waste streams. The team conducted a systems-level analysis of existing recycling systems, and agreed on a consensus design for a US system that would benefit the widest range of stakeholders, which is presented in this white paper.
As a way to explore the question from multiple perspectives and elicit synergistic solutions, the team explored this key question:
“How can a resource recovery system & policy framework incentivize recycling of all materials, within current economic structures and infrastructures; in up, down and upside-down economic cycles; get to 70+% diversion of packaging and printed paper in the US.”
C Progress towards Product Stewardship in the US
Since the inception of this project there has been significant progress towards Product Stewardship in the United States.
There are Product Stewardship Councils in several states and regions (California, New York, Texas, Vermont, Connecticut, Washington, Oregon, Midwest, Northwest), several national organizations (Product Stewardship Institute, Product Policy Institute, etc) and growing legislative activity addressing EPR and Product Stewardship. (We use the terms interchangeably here.)
In early 2010, the state of Maine passed a product stewardship “framework” bill (L.D. 1631), which established a mechanism for creating a product stewardship program via the Maine Legislature. This bill creates a high-level process for creating product stewardship systems in the state, though it targets a broader array of products (i.e., batteries, electronics) and is not exclusively focused on packaging.
At this writing, the US Conference of Mayors has adopted an EPR resolution5, and framework bills are pending in California, Minnesota, Rhode Island, Vermont and Washington. Delaware has replaced refundable bottle deposits with a non-refundable fee (moving “against recent trends” according to the Container Recycling Institute), while other states (including Oklahoma, Tennessee and Texas) are considering expanding bottle recycling or extended producer responsibility laws.
Further details about state-level progress in the US towards Product Stewardship are presented in Table 7.
5 “U.S. Mayors Agree to Producer Responsibility Resolution”, Environmental Leader, June 15, 2010, <http://www.environmentalleader.com/2010/06/15/u-s-mayors-agree-to-producer-responsibility-resolution/>
Natural Logic Inc. http://www.natlogic.com/EPR Page 8 of 69
Comprehensive Product Stewardship Oct 2010 v2.3& Extended Producer Responsibility
III. Getting to Greater Than 70% Diversion of Packaging in the US
Getting to greater than 70% diversion for all packaging and printed paper in the US (perhaps with intermediate targets of 25% and 50%) will require a policy framework that includes mechanisms to:
Shift accountability for packaging recovery to brand owners, producers and first importers
Create incentives for producers to make more sustainable packaging choices Maintain accountability of local government for waste disposal and diversion of organics Educate residential and ICI consumers and incent them to sort recyclables out of the
waste stream Create consistent, transparent standards for measuring and reporting on material recovery
performance
A Design for a “Hybrid” EPR System in the US
This proposal sets forth a high level proposal based on EPR principles that will leverage all stakeholders in the system – producers, consumers, local government and the waste management industry – towards greater recycling effectiveness and efficiency.
The design brief is straightforward: create a viable system with built in financial incentives that encourage actors at each stage of the value chain to “do the right thing”— to take actions that significantly reduce the flow of packaging and printed paper to landfill, and that make waste reduction, recycling and design for environment commonplace.
The foundation of this proposal is the enactment of state legislation which assigns responsibility for recycling of packaging and printed paper to producers, and shifts the cost for of recycling programs away from local government and on to producers (or first importers) of materials that become “waste.” Producers may choose to pass these fees on to consumers or not; in either case, consumers continue to pay for waste management services, either through taxes or waste disposal fees to local government or service providers.
These financial incentives are intended to shift producer and consumer behavior, and to finance program and system improvements to increase diversion (for example, as the Alameda County CA, StopWaste program has invested landfill tipping fees to finance waste prevention and recycling). Both producers and consumers are incented to reduce waste to landfill – producers by re-designing products and logistics systems; and consumers by recycling more (and potentially by changing their purchasing decisions).
In EPR systems, producers typically form an industry-led recovery organization to manage the collection and recycling of packaging materials and meet the recycling targets collectively. In the proposed system, the recovery organization would contract for the collection of recyclables (for which any municipal-owned programs could compete through bidding, or be grandfathered in depending on the structure of the system).
Natural Logic Inc. http://www.natlogic.com/EPR Page 9 of 69

Comprehensive Product Stewardship Oct 2010 v2.3& Extended Producer Responsibility
We refer to this as a "hybrid" system because it incorporates elements of two significant approaches: PAYT to provide financial incentives to Consumers to "throw" less, and EPR to provide financial incentives to Producers to change packaging materials, put less packaging into the market in the first place, and increase recycling rates for what does enter the market.
The strategy for a state-level pilot, and arguments for beginning with state legislation rather than federal legislation is discussed in Section III C of this document. The rest of Section III outlines the proposal for a US Product Stewardship system.
1 EPR PrinciplesBased upon existing EPR systems in Europe, Japan and Canada, the basic principles of EPR should include:
A legal basis for assigning Producers (inclusive of first importers) responsibility for the recycling of packaging materials;
Recycling targets that Producers must meet, whether they choose to meet them individually or collectively (e.g., by transfer to an authorized compliance scheme);
Authorization of a Recovery Organization (to which the Producer’s obligation is transferred), to manage the collection of materials on behalf of the Producers;
Material fees based on recycling targets, and the true costs of managing different material types (including collection, management and recycling costs per material type, revenues and costs of secondary materials markets, etc.);
Penalties or other strong enforcement mechanisms to eliminate non-compliance and free-riders among Producers.
EPR systems can include options for either collective collection schemes or for individual take-back programs to meet goals. Collective schemes work best for low value, high volume materials and individual take-back systems are better for high value, low volume materials such as electronics. Packaging is a mix of high and low value materials, but the current trend is towards lower value materials.
2 System DefinitionThe proposed EPR system for recovery of packaging material would be 100% funded by producer fees, with the Recovery Organization controlling the funds, contracts and details of curbside recycling collection programs. Alternately, funding responsibility could be split between producers and municipalities, but our research suggests that a “full cost” system, fully funded by producers, enables higher system efficiencies, and gives producers a more powerful incentive to design products and packaging that will drive further waste stream reductions.
The proposed system is shown in Figure 1, which represents material flows as black lines and flows as green lines. In summary:
Producers (or first importers) pay fees to the Recovery Organization based on the volume and type of packaging materials put into the market.
Producers (through the retailers) sell goods to the Consumer.
Natural Logic Inc. http://www.natlogic.com/EPR Page 10 of 69

Comprehensive Product Stewardship Oct 2010 v2.3& Extended Producer Responsibility
Consumers pay for products (with package recycling costs potentially rolled into the product price by Producers).
Consumers pay Local Government or Waste Management Operators (WMOs) for waste disposal and composting–incented by a PAYT scheme, and sort their waste and recyclables.WMOs collect, sort and process recyclables under contract from the Recovery Organization (Local government would be eligible to compete for the contracts or be grandfathered in depending on system details).
The Recovery Organization and/or WMOs sell recycled material on the open market, (with revenue sharing between them, and potentially also Local Government, to be determined).
The Recovery Organization applies the Producer fees and revenues from the sale of recycled material to the cost of operating and improving the system, public education, research, infrastructure investment, etc. Typically, a portion of material-specific profits is allocated towards reducing the next year’s material-specific Producer fees.
The proposed Product Stewardship/EPR system for the US is based on a case where waste disposal is contracted out by Local Government, and Consumers pay taxes or fees for these services. In reality, there are cases where the Local Government is also the Waste Management Operator, or where the Consumer contracts directly with the WMO (see Figures 3a, 3b, 3c and 4 for analogous non-PS/EPR system structures). There would be similar variations in the EPR system depending on the local case.
Overall, the system needs to reward all stakeholders financially for “doing the right thing” environmentally. The key leverage points than can drive positive change throughout the system are:
Shift recycling costs to Producers (and away from Local Government and garbage ratepayers)
Incent Producers to reduce impacts through design (e.g., dematerialization, material substitution) and programs (e.g., product take-back, marcomm, public education) that would result in lower Producer fees recycled-content and sustainable packaging
Drive demand for recycled materials and support the markets for these commodities, with material-specific producer fees that give pricing advantage to recycled-content packaging;
Increase the amount of material that gets recycled (which increases revenue streams for Local Government and WMOs, and reduces fees for Producers) by requiring the NPRO to design and operate optimized collection systems that increase access to recycling and make it easy to recycle;
Incent Consumers to sort their waste, using PAYT fees that tie their costs to amount of waste generated;
Educate Consumers through sustained, ongoing education programs on how to sort waste properly;
Provide feedback to Consumers (residential, commercial, ICI, etc.) on their actual recycling and diversion performance.
Natural Logic Inc. http://www.natlogic.com/EPR Page 11 of 69

Comprehensive Product Stewardship Oct 2010 v2.3& Extended Producer Responsibility
3 Stakeholder AccountabilitiesThe key stakeholders in this system are State and Federal Government, Producers, Retailers, Municipal Government, Recyclers, Waste Management Operators and Consumers. Each stakeholder has a role to play in meeting diversion goals. (Table 6 provides a summary of stakeholder accountabilities in current and proposed systems.)
a) State GovernmentState (or national) government is accountable for creating the rules of play for the system by creating a legal framework for Producers (or first importers) that requires them to meet recycling targets for packaging materials; sets recovery and recycling targets, authorizes a Recovery Organization(s) which can fulfill the obligation of the Producers; and penalizes non-compliance (by fines and/or prosecution).
To create a system with the greatest potential for success, state government would also mandate that waste disposal fees be based on waste volume – as in Pay-As-You-Throw – but could allow local governments to develop the fee structure.
To remedy the current problems of poor transparency and data availability on material recovery and recycling, inconsistent metrics and reporting, State Government should mandate standardized, performance metrics that Producers and the Recovery Organization(s) must use, and specify the reporting process. Performance metrics – which should include quantity of material collected, diversion and recycling rates by material type – would guide program management, provide the basis for setting and revising fees, enable industry identification and pursuit of low-hanging opportunities, and support public oversight and accountability. (See III. B. below.)
b) ProducersProducers (any seller, or first importer, of packaged goods) are accountable for reporting how much packaging is being put into the market, and for meeting – individually, or through the Recovery Organization – the recycling targets set by the State Government. Producers pay fees to the Non-Profit Recovery Organization, based on the type and volume of packaging that they put into the market.
Producers may choose to form a non-profit recovery organization to collectively manage the collection of packaging materials, so that each producer does not have to actually recover their own packaging from consumers, and to ensure that packaging is actually collected and reported through a third-party compliance process.
Independent take-back programs are a permissible option for producers who would find it more economical or efficient to individually meet the recycling targets, but they must follow the same rules; otherwise there is an invitation to free riders, especially if the enforcement is low. Self-compliers, if they are permitted, should be required to announce their plans and packaging quantities in advance to seek an “authorization,” and submit annual reports to prove that they have correctly implemented the rules.
Natural Logic Inc. http://www.natlogic.com/EPR Page 12 of 69

Comprehensive Product Stewardship Oct 2010 v2.3& Extended Producer Responsibility
c) Non-Profit Recovery OrganizationA Non-Profit Recovery Organization (NPRO) is assigned the obligation to meet, on behalf of the Producers, the diversion and recycling targets set by State Government. The NPRO is accountable for developing the strategy for managing the material types and collection details, defining a state-wide collection system that will provide the greatest efficiency and economies of scale, and implementing and supporting collection systems, for recyclable materials. (Defining the collection system includes specifying which materials will be collected and how the materials are to be sorted by the consumer into bins, or whether they can be commingled.)
The NPRO may contract with Waste Management Operators or Local Government for waste management services, including collection, processing and sale of recyclable materials on behalf of Producers. The NPRO sets and collects fees from Producers based on the volume and type of packaging material put into the market. The NPRO is also responsible for auditing Producers to ensure that they are measuring and reporting their packaging volumes accurately. NPRO funds may be used in part to set up the uniform collection system (e.g. costs for new bins and equipment), as transitioning the existing diverse collection systems will come with some cost.
We recommend that the NPRO cover the full costs of the system, with Producers taking full responsibility for the cost of collecting and recycling of packaging waste in order to control the details of the collection program and ensure a highly efficient system.
The NPRO should also require known best practices in designing their curbside recycling systems or collection sites including:
1. Parallel access, or pairing recycling service and trash service pickup on the same day2. Properly sized recycling containers, in particular larger bins with wheels3. Including high value recyclables in the collection or drop-off program4. Effective education and outreach programs to communicate with consumers.
These best practices in collection have demonstrated ~40% diversion from landfill, and should be incorporated, but alone they are not sufficient to reach 70+% diversion.
We considered but have not included “single stream” recycling as a best practice, since there is still debate over its merits, and this proposal is not the place to resolve them. Single stream increases participation by 3-20% and simplifies collection, but requires properly designed MRFs and results in material contamination. On the other hand, multi-stream requires public participation in sorting the waste stream. This will likely remain an NPRO decision, and will likely vary from state to state.
A portion of revenues from sale of recycled materials can be used to reduce Producer fees in the next annual cycle of fee setting. It is important to note that in current US waste management systems, revenues from the sale of recycled materials are owned and/or shared by the Waste Management Operators with Local Government according to their contractual and franchising agreements, and sharing likely is biased toward the party which owns the capitalized infrastructure. In Product Stewardship schemes where recycling systems are funded by Producers, these revenues would belong to the NPRO, which may also engage in revenue-
Natural Logic Inc. http://www.natlogic.com/EPR Page 13 of 69

Comprehensive Product Stewardship Oct 2010 v2.3& Extended Producer Responsibility
sharing with the infrastructure owners. The NPRO’s focus on increasing diversion rates and recycling rates should increase the size of the market for all stakeholders. Revenues may be shared among more parties, but overall revenues will increase, and are anticipated to more than offset the share dilution.
Finally, NPROs would invest in Consumer education, outreach, and in order to drive consumer participation and thereby increase the volume of material collected. The best performing systems include extensive educational and outreach programs, including curricula that teach school children how to sort recyclables (which they then teach to their parents), “waste ambassadors,” and competitions and rewards for meeting recycling or diversion targets. Waste separation needs to be positioned as “cool” and modern, as well as good for the environment, and the best behavior change models need to be applied to educate and motivate people in order to drive participation. This is potentially one of the biggest opportunities in this system, because even the most technologically sophisticated systems still depend on public support and participation.
The NPRO board should be diverse enough to enough to represent key stakeholders (including Producers, Retailers, WMOs, Local Government, NGOs, Product Stewardship Councils), and small enough to make and implement decisions.
d) Local governmentLocal Government retains the accountability for providing or contracting for waste collection services, while the NPRO is accountable for management and funding of the recycling collection services.
We recommend that waste disposal fees be linked to the volume of waste produced, through some form of Pay-As-You-Throw (PAYT) system. PAYT has been shown to financially incent consumers to sort recyclables from their waste to avoid higher disposal costs, and in some cases, PAYT has demonstrated ~60% diversion from landfill. PAYT is a necessary ingredient, but alone is probably not sufficient to reach 70+% diversion.
Local government should also implement complementary policies to divert more materials from landfills, such as mandatory recycling (e.g. for businesses), landfill bans, such as recently passed in North Carolina,6 or organics composting. Implementation of these policies, coupled with a strong system for collection of recyclables, will support the NPRO in maximizing diversion and packaging collection rates and achieving economies of scale, as well as reduce landfill constraints and costs for municipalities.
Local Governments that own and operate waste management infrastructure would be eligible for contracts with the NPRO to provide recyclables collection. The NPRO could initially contract with existing systems under a “grandfather clause,” and open contracting to competition some years in the future.
6"North Carolina to Ban Recyclables in Landfills : EcoLocalizer." EcoLocalizer - Celebrating Local Environmental Action. Web. 03 Sept. 2009. <http://ecolocalizer.com/2009/08/31/north-carolina-to-ban-recyclables-in-landfills/>.
Natural Logic Inc. http://www.natlogic.com/EPR Page 14 of 69

Comprehensive Product Stewardship Oct 2010 v2.3& Extended Producer Responsibility
Local Governments that currently fund recyclables collection will be relieved of this financial responsibility, and may also be party to revenue sharing agreements with the NPRO, where they own the recycling infrastructure and/or currently already have such arrangements in place with WMOs.
e) Waste Management OperatorsWMOs serve as the contracted service provider for collection of recyclables through contracts with the NPRO, and may also provide waste collection services through franchise and contract agreements with Local Governments. In some parts of the country, they contract directly with the Consumer. The NPRO will contract with WMOs to meet the Producer obligations for packaging recovery.
Issues to be resolved here include determining to how and to what degree WMOs – which serve several potential roles in the system (including hauling and processing services, material brokerage, and capital investment in system infrastructure) – will be compensated for each of those roles. For example, municipal systems may prefer to be relieved of the burden of funding infrastructure, but will still expect a share of revenues; WMOs, on the other hand, will likely seek revenues from material brokerage as well as material processing, in addition to appropriate returns on capital investment.
System design will need to adapt to existing market structure, which is a mixture of municipally franchised waste management contracts, municipally owned and operated services, and subscription-based direct services to Consumers (either residential or Industrial, Commercial & Institutional, or ICI).
The role of the NPRO with respect to ICI customers is a subject that will require resolution. Currently, WMOs collect ICI recyclables under private contracts, and therefore they own the material. However, there may be other incentives that the NPROs can offer to WMOs for increasing the volumes of material collected, such as performance rewards. NPROs may also choose to expand ICI collection and contract with WMOs for the new services.
f) ConsumersConsumers are responsible for recycling their waste, (sorted as required), and should be incent to do so by multiple policy instruments, which may include PAYT, mandatory recycling and landfill bans. Recycle Bank™ or similar programs may further incent recycling,7 but if they do so by encouraging more consumption, overall waste flows could actually increase.
Since Consumers are ultimately accountable for the cost of both recycling and waste disposal systems (and bear the cost if Producers increase product prices to offset their NPRO fees), it is in their best interest that the devised recovery and disposal systems be as cost effective and efficient as possible. Consumers will benefit from NPRO support of education, advertisement and consistency of recycling systems.
7 “RecycleBank partners with cities and haulers to reward households for recycling. Households earn RecycleBank Points that can be used to shop at over 1,500 local and national businesses.” From http://www.recyclebank.com
Natural Logic Inc. http://www.natlogic.com/EPR Page 15 of 69

Comprehensive Product Stewardship Oct 2010 v2.3& Extended Producer Responsibility
4 System FinancingThe NPRO calculates Producer fees on the basis of material volume and type, as well as costs associated with collection and processing of the materials for sale, and administration of the program. There will also be one-time startup costs incurred for the development and creation of the recovery organization.
a) Start-up costsStartup costs for EPR system development and implementation include: creation of the NPRO; system design; market and waste stream analysis; business planning; information management systems; contracting; government relations; public outreach; etc. These startup costs could be amortized over three to five years, and potentially allocated to Producers in addition to the material fees. This approach spreads the startup costs over laggards as well as early adopters, to avoid penalizing early compliance.
b) Material FeesWe recommend that material fees be based on a transparent scheme designed to fully fund the operation of the system (as well as amortization of startup costs).
Fees would be set by the NPRO, and revised annually based on system performance. Material fees from existing EPR organizations are shown in Table 3, and some examples of how fees are calculated are shown below. This proposal stops short of making prescriptive recommendations for actual material fee formulas, but we do recommend key factors that should be taken into consideration, and provide some examples from existing systems in the following section.
i) Fee formulaWe recommend a weight-based material fee, rather than a unit-based fee. Unit-based fees penalize higher sales volumes, while weight-based fees will encourage Producers to reduce packaging – for example, “light-weighting” packaging by making it thinner.
A basic fee formula model for each material type typically includes the following costs, according to Austria’s ARA:8
Material Fee = (Collection cost + Handling cost + Sorting cost + Processing cost (cleaning, baling, etc) + Depreciation (bins, trucks, etc) + Infrastructure cost + Administrative cost Sale of recovered material) Total licensed quantity
The initial scheme could be modeled, for example, on Stewardship Ontario’s formula, which sets fees to meet the total cost of operations, allocated by the following formula (for the 2008 program year9):
Net cost to handle 40%Relative recovery rate 35% (higher recovery rates yield lower fees)
8 Private communication, ARA9 Methodology for Calculating Blue Box Steward Fees http://www.stewardshipontario.ca/bluebox/pdf/fees/Fees_Methodology_04_2006.pdf
Natural Logic Inc. http://www.natlogic.com/EPR Page 16 of 69

Comprehensive Product Stewardship Oct 2010 v2.3& Extended Producer Responsibility
Equalization 25% (calculated incremental cost for each material to achieve common threshold recovery rate)
The fee formula must at a minimum account for the full costs of collection and processing which will meet the legal targets at lowest financially sustainable costs. In addition we recommend the inclusion of a sustainability component.
ii) Sustainability component of material feeA sustainability component of the material fee would provide a rational and quantifiable basis for including traditionally externalized costs, and motivate all stakeholders to systematically reduce both tonnages and toxicity (such as heavy metals), of waste streams over time. Producers would have a direct financial incentive to choose packaging materials that are more sustainable, and therefore less costly in terms of material fees.
The sustainability component should be based on simple, transparent factors, such as:o Recycled content o Ease of recyclability o Toxicity
Other environmental factors may be important to consider, but it is beyond the scope of this paper to resolve them. Some have evaluated Life-Cycle Assessment (LCA) or carbon footprint as environmental metrics for packaging, but the complexity and variability of calculating these values for packaging from around the world suggests that they may not be appropriate in this context.
c) System economicsIn most European systems, the NPRO is responsible for design and management of recycling collection systems. The Producer fees to the NPRO fund all of the WMO contracts and actual system operations. In the US, EPR would be woven into the existing waste management system where these systems and contracts already exist between Local Government and WMOs. This calls for a decidedly different approach to the effective application of the funds collected by the NPRO from Producers.
The primary needs that could be funded by the NPRO:1. Pay for services, or incremental services not currently offered2. Build the infrastructure for more effective diversion and recycling (including building
capacity for onshore processing as opposed to shipping material overseas)3. Provide effective targeted incentives across the supply chain to shift behavior and
economic decisions by Producers, Government, WMOs and Consumers in the direction of closed loop economy.
We anticipate that WMOs will continue to receive a significant proportion of their revenues from contracts with Local Governments or directly with Consumers, as well as from sale of recyclables.
Natural Logic Inc. http://www.natlogic.com/EPR Page 17 of 69

Comprehensive Product Stewardship Oct 2010 v2.3& Extended Producer Responsibility
In the EU, some recycling and recovery systems were established by the NPRO, which contract with the WMOs and own recycling revenues. In the US, where extensive (though uneven) recycling and resource management systems already exist (often with revenue sharing of recycling revenues between WMOs and Local Government), the allocation of funds will need to be explicitly addressed. On one hand, WMOs may be reluctant to "surrender" any recycling revenue (which typically represent a small portion of their revenues); on the other hand, since WMOs will receive substantial contract revenues and other funds from the NPROs, in addition to a significant increase in the overall volume of recyclable materials collected, the perceived loss of revenue could be more than offset by flow of funds from NPRO (in contract/service payments as well as other financial flows as described in Appendix D). The specific business model and formulae will need to be negotiated.
Some fundamental questions will need to be addressed: On what basis should recycling revenues be shared between the NPRO, Local
Government and WMOs? (given ownership of capitalized infrastructure, historical sharing agreements, performance-based sharing to incentivize greater diversion?)
How should NPRO contract with Local Government and WMOs for collection of recyclables e.g., grandfathering of historical service providers for a period of time?)
How can NPRO funds be applied to best effect, to meet the fundamental goal of diverting waste from landfill to productive reuse and recycling?
How can NPRO best support the optimization of existing systems and infrastructure?
Possible uses of NPRO funds to the system could include: Provide low-cost capital for recycling/reuse infrastructure investments Provide cost sharing to overcome specific barriers (e.g., space requirements for recycling
in multi-unit buildings) Provide competitive grants to Local Government to support innovation and
implementation (e.g., pilots) Provide competitive grants to colleges and universities to support research, design and
innovation Provide waste reduction technical assistance to generators, through Government, WMOs
or third parties (e.g. similar to StopWaste.org waste reduction services, which are funded by tipping fees)
Provide cost sharing to Producers to support research, design and innovation Reward entities that produce and verify the highest diversion rates and recycling rates Provide transition funding (e.g., support or acquisition of small processors or recyclers
that might be financially stressed by the transition to EPR) Support Local Government planning and zoning to develop solutions for recycling
infrastructure (e.g., mandated space for recycling in commercial and multi-family residential construction)
Underwrite public education, marketing and communication
B Transparency and Consistency in Metrics & ReportingExisting recycling programs, globally and in the US, have proved difficult to evaluate because inconsistent methods were used to track the amount of waste diverted. A coherent system will require common terminology, methods, and metrics. For example, some recovery organizations
Natural Logic Inc. http://www.natlogic.com/EPR Page 18 of 69

Comprehensive Product Stewardship Oct 2010 v2.3& Extended Producer Responsibility
include incineration in diversion rates and others exclude it. Some programs are evaluated on tonnage collected, while others are evaluated on tonnage recycled.
We suggest that common metrics be used for reporting from all parties in the system, from the Producers and NPRO, to the Municipal Governments and Waste Management Operators, on both waste and recyclables, and that the metrics be absolutely explicit, including:
Tonnage of material flowing through the system; Tonnage of material landfilled, recovered, recycled and incinerated; and Operating costs and profitability (including net costs per ton).
Collecting and reporting this data will enable policy makers and other stakeholders to compare results between program types. Annual reporting on progress and achievements must be done to enforce the law, check on commitment and deliverables, and to provide the basis for calculating and revising fees.
Ensuring data transparency, and the interoperability of data systems (in ways that appropriately protect valid confidentiality issues) would:
Enable meaningful comparisons between programs; Minimize the confusion that has characterized waste management policy debates (e.g.,
What is the money used for? Is it being used equitably and efficiently?); Support better system management (If you can’t see the money, you can’t evaluate the
incentives); and Enable healthy competition for contracts with the NPRO.
C Strategy for Adoption in the USGiven the current political and financial climate in the US, introduction of an EPR program at the federal level is an unlikely political option in the near term. Therefore we propose introduction at the state level, with a pilot program to demonstrate feasibility and test the hybrid EPR/PAYT system. As the pilot demonstrates success, and more states introduce EPR systems, there will ultimately be a tipping point when a coordinated national scheme will become more cost effective than many separate state programs.
One disadvantage of a state by state approach is that each state will likely adopt its own reporting and calculation methods, which would undermine the above stated need of consistency and transparency in metrics and reporting; involvement of State-based Stewardship Councils (which already have a strong history of working together and sharing best-practices and common Product Stewardship Principles) could mitigate this concern.
1 EPR PilotThe best case scenario would be a pilot program undertaken in a state that does not already have a bottle deposit law to compete for the recovered material and that also has high penetration of curbside recycling. One or several Northeastern states could be potential candidates, given their successful effort with the Regional Greenhouse Gas Initiative (RGGI).
Alternately, a pilot could target a state with a bottle deposit law exists, with the likelihood of greater support from grocers and the beverage industry, and the possibility of greater opposition
Natural Logic Inc. http://www.natlogic.com/EPR Page 19 of 69

Comprehensive Product Stewardship Oct 2010 v2.3& Extended Producer Responsibility
from recycling advocates. For example, there is EPR momentum and proposed legislation on the books in California (AB 283 - California Product Stewardship Act), which could make it a good candidate, despite its existing bottle deposit law. While the political challenges and cost of a campaign would be larger in California, the impact of a successful pilot will be greater as well. Other strong candidates for a pilot include the states with existing product stewardship councils.
State selection criteria should include: political support and endorsement, collection infrastructure, the presence of supportive packaging companies and other key stakeholders, waste characterization, legal/policy supports/constraints, data availability – and, arguably, lack of existing bottle deposit legislation. The EPR system proposed here could function in a state with a bottle deposit law, but launching a pilot might be easier in a non-bottle bill state (and pilot results would be able to show impact on diversion more clearly, without having to be untangled from deposit system impacts).
The pilot should be based on a single recovery organization, to provide consistency, coordination, and economy of scale. The system could be opened up to multiple recovery organizations in the future, as many European countries have done – as long as there are clear and consistent rules for the recovery organizations, open data systems and a mechanism to ensure transparency of fee setting are in place, to avoid the loss of information that has occurred as some markets have opened to competition.
Once a critical mass of state-level programs is achieved, we anticipate a “spontaneous” movement towards a national system on the grounds of the cost effectiveness of centralization and greater penetration of Product Stewardship in the US. The federal government could establish or task a national body such as the EPA to manage the state programs, and to collect and report the state level data. While the detailed design of a national program is beyond the scope of this program, we anticipate the pilot design schema outlined here would form the basis for a national scheme – or schemes, since a “federal” system (with frameworks set at national level and details designed at state or regional levels, similar to Europe) may be indicated.
2 Alliances and PartnershipsConsumer packaged goods (CPG) producers – starting with the beverage industry, but broadening rapidly – need to be on board in order for this to work. Packaging producers – and of course the waste management industry itself – are additional priorities. Retailers may need more substantial education on program implications for their sector.
Strong support can be expected from the state and regional product stewardship councils, 10 and national organizations like the Product Stewardship Institute and the Product Policy Institute – which are a key starting point for the engagement process. They have built awareness, and broad coalitions, as well as deep knowledge of the political landscape.
Strong support can be expected as well as from NGOs and grassroots recycling advocates that have focused on these issues for many years, including Sierra Club, NRDC and Clean Water
10 (which at the time of this writing include the California, New York, Texas, Vermont, Connecticut, Washington, Oregon state Product Stewardship Councils; and the Midwest and Northwest regional Product Stewardship Councils)
Natural Logic Inc. http://www.natlogic.com/EPR Page 20 of 69

Comprehensive Product Stewardship Oct 2010 v2.3& Extended Producer Responsibility
Action. There may also be initial opposition from some recycling advocates (due to long standing involvement with bottle deposit systems, but we believe they will find EPR appealing because of its greater potential impact on waste diversion and recycling goals across all material types. See below.
Individual and group dialogues with key stakeholder groups and the state product stewardship councils will be essential – to test the ideas presented here, identify specific concerns, refine system design to address those concerns, and develop specific business and legislative proposals.
Once a sufficient range of responses has been gathered, it might be productive to convene a high level working group and a multi-stakeholder design workshop to hash out the details around revenue sharing between the NPRO, WMOs and Local Government.
An alternative long-term strategy could aim for the creation of an overall takeback platform that not only covers packaging and printed paper, but also electronics, durables, tires, etc. Commodity-specific take back programs are on the books in several states, with more in the pipeline; several US electronics producers, including Dell and Hewlett-Packard, are already involved in take-back programs for their products, and might be strong allies in a broader framework. This strategy might engender a greater degree of buy-in amongst a wider range of producers and therefore appeal to a sense of fairness that all producers are taking part in this new regime; on the other hand, it could increase the system complexity and could add to costs if the materials are not high value. Our assessment, based on initial conversations with recycling industry operators and advocates, suggest that a comprehensive system offers a compelling logic that may be useful in turning opposition to support.
3 Barriers/Potential oppositionPotential opposition to this initiative can be anticipated, but if the issues can be adequately understood, many of the concerns driving them can be addressed within the framework proposed here.
Local Government may resist yielding contract control to basic parameters set by Statewide NPRO schemes, as well as the loss of ability to use franchise revenues to cross-subsidize other programs, but will no longer need to fund recycling services, and may stand to gain additional revenue sources.
WMOs may have concerns over changes in revenue allocation, but will gain consistency and scale of collection as well as new flows of both revenues and capital.
Specific industry sectors (e.g., beverage, pharmaceuticals, retail, etc) will have their own concerns, and will be responsive – or not – based on how well the product stewardship scheme addresses their financial and operational concerns. Industry leadership will be indispensable in winning industry support. (Note that the political landscape forming around the proposed California EPR legislation, where initial support is largely local government, recycling industry and NGOs, and initial opposition is a diverse array of industry associations, is indicative of the challenge – and the solution.)
Natural Logic Inc. http://www.natlogic.com/EPR Page 21 of 69

Comprehensive Product Stewardship Oct 2010 v2.3& Extended Producer Responsibility
Bottle bill advocates may oppose this initiative, given their commitments to sunk infrastructure, existing financial flows, etc., as well as more “ideological” concerns. On the other hand, initial conversations we have had with some bottle bill advocates generate rapid recognition that the Deposit Legislation strategy can’t be extended to hundreds or even thousands of product classes; simply put, it doesn’t scale, and so cannot provide a comprehensive solution, even though it may be effective for selected materials. (A recent State Auditor's report on the California beverage container recycling program concluded that the program “is not always able to reliably project the revenues and expenditures for the beverage fund.”) 11
Taking this landscape into account, we suggest consideration of parallel policy initiatives.
4 Implementing EPR in Bottle Deposit Law (BDL) States
There has been a great deal of debate over the past thirty years about how best to improve material recovery rates in the US, in order to deal with the environmental and economic consequences of waste. Some advocate for greater expansions of deposit laws – most notably “bottle bills”, which were originally designed to cover only selected beverage products, such as carbonated beverages, beer, wine and spirits. Some states, including California, Maine, Oregon, Connecticut and New York have expanded these laws to also cover bottled water, while Hawaii’s law included water bottles from its inception.
Bottle deposit legislation proponents argue that states with such laws achieve high redemption rates for beverage containers, as high as 97% in Michigan,12 for example. However opponents of bottle deposit laws argue that these laws address only 3-6% of the waste stream, and that creating a system for only some beverage containers is inefficient, doesn’t address our overall recycling challenge, and fragments the waste stream – in turn straining the profitability of MSW collection programs, which rely on economies of scale and materials with strong commodity value in order to be viable.
Deposit legislation has been extended to other commodities – notably automotive batteries and tires, and some electronic products – but even the most enthusiastic deposit legislation advocates agree that the strategy can’t scale to cover the thousands of product types that need to be recovered and recycled.
Over the past thirty years, pro- and anti- bottle deposit positions in the US have become entrenched, leaving political gridlock about how to best increase recycling rates while the trash keeps piling up. This decades-long debate has slowed forward progress in recycling. It is time to move beyond the stalemate to comprehensive solutions that get the job done.
Special consideration should be given to the design and introduction of product stewardship systems in the eleven states where bottle deposit laws currently exist. The penetration of product
11 California State Auditor, Department of Resources, Recycling and Recovery: Deficiencies in Forecasting and Ineffective Management Have Hindered the Beverage Container Recycling Program, June 2010 Report 2010-101, <http://www.auditor.ca.gov/pdfs/reports/2010-101.pdf>12 This figure has been criticized as being elevated by out-of-state containers that are redeemed in Michigan to take advantage of the ten cent deposit.
Natural Logic Inc. http://www.natlogic.com/EPR Page 22 of 69

Comprehensive Product Stewardship Oct 2010 v2.3& Extended Producer Responsibility
stewardship into these markets will be more complex and may potentially face opposition. The basic options for EPR in these states are to either have parallel systems, or to phase out the deposit system over time system.
Quantitative analysis comparing the potential environmental and economic benefits of an EPR/Product Stewardship and bottle deposit strategies would be extremely helpful in making the case for either of the options below. This is beyond the scope of our project, but we recommend that a full cost-benefit analysis plus a waste diversion analysis be conducted comparing three scenarios – a) a bottle deposit law alone, b) a product stewardship system alone, and c) parallel BDL and product stewardship systems.
Scenario 1. Parallel BDL and EPR/Product Stewardship SystemsThere are a few examples of deposit and EPR systems coexisting in Europe and Canada, which can provide some lessons and possibly serve as models for parallel BDL and EPR/Product Stewardship systems. In addition, Maine’s new law will function in parallel with their BDL system, so could be an interesting test if Maine they apply product stewardship to packaging.
The most important consideration in the impact of parallel systems is the sequence of establishing the BDL or EPR system. Parallel deposit systems for containers have worked in Austria, Canada and Sweden, where EPR was introduced into a functional deposit regime. On the other hand, Germany nearly devastated a highly performing EPR system by introducing a bottle deposit system in 2003.
Based on the EPR principles outlined in section IV.A.1, the best approach is to mandate clear targets and allow for variable approaches for meeting them. This gives Producers or whole industries the flexibility to opt out of an EPR system – if they guarantee to provide or support a system that will enable them to reach the equivalent targets and agree to be audited to prove that they are reaching them. This gives producers more options, and if they want to retain a particular deposit system (e.g. beer bottles), then it should be possible to build an EPR system around it – though it may not be desirable for financial reasons. In Canada, the beer industry opted out of the Stewardship Ontario system in favor of maintaining its refillable bottle program – believing that it was simpler to keep selling beer in refillable bottles and keep the redemption depots in place. The combined cost for the two systems is substantially more than the cost of one overarching EPR system. Experience in Austria also shows that a parallel system with deposits on refillable bottles and a collection and recovery system for one-way packaging can complement one another.
However parallel systems for one-way packaging (collection and recovery system plus a deposit system) are not efficient and should be avoided, as the situation in Germany clearly shows. The German experience with introducing a deposit system into a pre-existing EPR system stands as a negative exemplar. The new deposit system undermined the economic basis of the EPR system – and cost as much as three times per unit as the original household collection, according to a study published in 2007.13 The study also concluded that the deposit model alone was not sufficient to
13 “European Packaging Policy: The consequences of a deposit system for disposable packaging based on the German example”, AGVU & Roland Berger Strategy Consultants, June 2007
Natural Logic Inc. http://www.natlogic.com/EPR Page 23 of 69

Comprehensive Product Stewardship Oct 2010 v2.3& Extended Producer Responsibility
meet the requirements of the packaging directive, as disposable drink packaging constituted only a small percentage (2.7%) of the national waste stream.
This latter point is also true in the United States – disposable drink packaging for beer and sodas comprises only 3% of the waste stream. In Alberta, Canada, bottle deposits have been extended to include milk cartons and drink boxes, which addresses up to 6% of the waste stream, but that is as high as it gets for beverage containers in the waste stream. So while recovery rates as high as 97% have been achieved with deposit laws, they have a limited overall impact relative to more comprehensive product stewardship and EPR systems.
If parallel systems are to be considered, then the costs should be assessed carefully through a cost-benefit analysis and assessment of diversion potential. The German study found that the cost per container in the deposit program was 5.3 euro-cents per container, about three times the cost per unit under the EPR household collection system, at 2.2 euro-cents. The extra costs of the deposit program add marginal costs of 22 euro-cents per extra unit collected.11 In the US, recovery costs work out to approximately 3 cents per unit, as a rule of thumb, for a basic deposit program that includes beer and soda only.14
Scenario 2. Timed Phase-out of BDL with Product Stewardship introduction
The other option is to phase out the deposit system over time as the a new Product Stewardship system becomes established. The implications are primarily economic and logistical. Within an EPR framework, dedicated infrastructure for the deposit system (stand-alone redemption centers) would probably not be utilized anymore and would become obsolete. However, few states have sole-purpose redemption centers; redemption is predominantly done at the retailer. Retailers (including grocers) would probably support a move away from BDLs, as they could use the floor space more profitably if it were freed up. (On the other hand, some retailer organizations are opposed to the proposed EPR legislation in California.)
There may be some displacement and job losses for businesses that support redemption, such as reverse vending machine (RVM) companies, or contractors who transport beverage containers. On the other hand, there is positive experience in some non-deposit European countries with RVMs for collection of containers for EPR systems.
The environmental benefits would include recovery of beverage packaging at least on par with EPR and product stewardship systems, as the typical 5-cent deposit program achieves 60-70% recovery (as an optimistic estimate). There should also be some savings in terms of greenhouse gas emissions related to consumer travel, plus significant consumer time savings of interfacing with a single system rather than parallel systems.
The impact on behavior would likely be minimal; the impact of deposit systems in correlating value with beverage containers has to a large extent already been absorbed by consumers. In fact, a surprising number of people don’t understand that when they put a bottle in the reverse vending machine, they are just getting their money back; they view it as a windfall rather than a recoup of their deposit. The bulk of the value of the deposit for motivating and educating is probably past. 14 Private communication with Kevin Dietly, Northbridge Environmental Consultants
Natural Logic Inc. http://www.natlogic.com/EPR Page 24 of 69

Comprehensive Product Stewardship Oct 2010 v2.3& Extended Producer Responsibility
The only thing left to adjust in the existing BDL systems is monetary value, which Michigan has done with a 10-cent deposit. This has enabled Michigan to achieve the highest redemption rates of any BDL system, but the redemption rate are almost certainly inflated by fraud, as containers from other states are brought into Michigan to gain the higher redemption rates.
In places with a high standard of living, a nickel is not a big motivator to recycle, and in Europe deposits are much higher – 25 euro-cents or approximately 31 cents (US)15. In California, for instance, the vast majority of containers is redeemed by people who were not the original buyers. There is a rather sophisticated scavenger system, complete with informal markets and collection systems that are mobilized to take advantage of the deposits. Scavengers can range from homeless people to organized groups of immigrants who pick the bins clean on recycling pickup day in the neighborhoods, and in NYC scavenging has become a big business that involves more than just homeless people.
Based on the experience of other countries, we expect that a full cost-benefit analysis would not support parallel systems from an economics and standpoint. Therefore we propose that the best option would be to phase out the bottle deposit system over time in order to ease the transition for sole-purpose redemption centers and those whose livelihoods depend on the BDL system, such as in Maine or Vermont. Sunk capital associated with redemption infrastructure may be repurposed for waste management under the EPR system, or job re-training may be offered.
Companies that manufacture RVMs are completely reliant on a BDL environment and may mount a strong opposition, unless they see the opportunity to provide RVMs for non-deposit systems. The market leader of RVMs in the US is Tomra, a Norwegian company. Tomra provides much of the funding for the Container Recycling Institute, which is a primary advocate for deposit systems in the US, and was involved in the expansion of bottle deposit laws in Connecticut and New York in 2009.
Environmental advocates are likely to support EPR when they consider the fact that BDL systems address only 3% of the problem – highly effectively, but not efficiently. Columbia, Missouri offers an example of a city that successfully repealed its bottle deposit law. Consumers continued to recycle (recycling behavior was already largely part of the culture thanks to the BDL system); in fact there was a noticeable uptick in the volumes and success of curbside pickup programs, despite losing some number of deposit containers from the surrounding counties.
There are also social justice issues that should be considered and dealt with in phasing out BDLs, such as loss of income to scavengers; this may be the domain of NGOs, or perhaps could be addressed through job training for scavengers.
Hopefully this movement will not face opposition from the state governments themselves, but it is possible where the state is a recipient of unredeemed deposits, as in California, Michigan, Maine, Connecticut, Massachusetts and Hawaii. Phasing out BDLs in those states may face opposition from legislators concerned about already-strained state budgets.
15 Using currency conversion rate as of 24 June 2010.
Natural Logic Inc. http://www.natlogic.com/EPR Page 25 of 69

Comprehensive Product Stewardship Oct 2010 v2.3& Extended Producer Responsibility
5 Other issues
As stated above, the design brief for this White Paper is straightforward:
Create a viable system with built in financial incentives that encourage actors at each stage of the value chain to “do the right thing”— to take actions that significantly reduce the flow of packaging and printed paper waste to landfill, and that make waste reduction, recycling and design for environment the status quo.
The purpose of this white paper is to stimulate a focused and productive conversation that can move EPR forward in the US. No one analyst – or stakeholder group – knows enough to design an entire system that would be workable in every setting. Therefore we have not attempted to resolve all open questions, but rather to tee them up for more effective engagement and resolution by stakeholders.
Examples of open issues include: The scale and scope of the NPRO role – state, regional, national? Monopoly or
competitive? Systems for multi-State metro areas Perverse incentives in the system (e.g. landfill operators making money from valuable
material being landfilled, or consumers paying for recycling services) “Ownership” of recyclables and material from ICI generators Allocation of recycling revenues Implications of dual vs. unitary contracting schemes
We will add to this list as stakeholder dialogues identify additional issues.
In a companion document, we will conduct basic systems modeling and financial analysis to better calibrate the concepts presented here.
6 Next stepsThis white paper represents a starting point, based on careful research and listening, and a synthesis of experience and perspectives from people and organizations with decades of experience in these issues. We hope that it will provoke and support considered discussion of the issues and options presented here, and the development of systems that significantly advance resource recovery policies in the US.
To that end, we propose these next steps:
Review this white paper with key stakeholders; Circulate and discuss with industry sectors (initially: beverage, consumer products
(CPG), retail, waste management operators, etc.) and key political & NGO partners); Engage with the state, regional and national Product Stewardship Councils; Refine strategy based on stakeholder response (perhaps in an additional Innovation
Charrette cycle)
Natural Logic Inc. http://www.natlogic.com/EPR Page 26 of 69

Comprehensive Product Stewardship Oct 2010 v2.3& Extended Producer Responsibility
Conduct cost benefit analyses and diversion potential analyses in order to fairly evaluate parallel BDL and Product Stewardship versus Product Stewardship only scenarios;
Develop detailed business and operational plans for pilot, financing scheme, information systems, etc. to address issues including revenue sharing from the sale of processed recyclable materials
Design and host “legislation charrette” to bring together key stakeholders to craft initial legislation;
Gain commitments and roll out campaign in pilot state(s).
Natural Logic Inc. http://www.natlogic.com/EPR Page 27 of 69

Comprehensive Product Stewardship Oct 2010 v2.3& Extended Producer Responsibility
IV. Appendices
Natural Logic Inc. http://www.natlogic.com/EPR Page 28 of 69
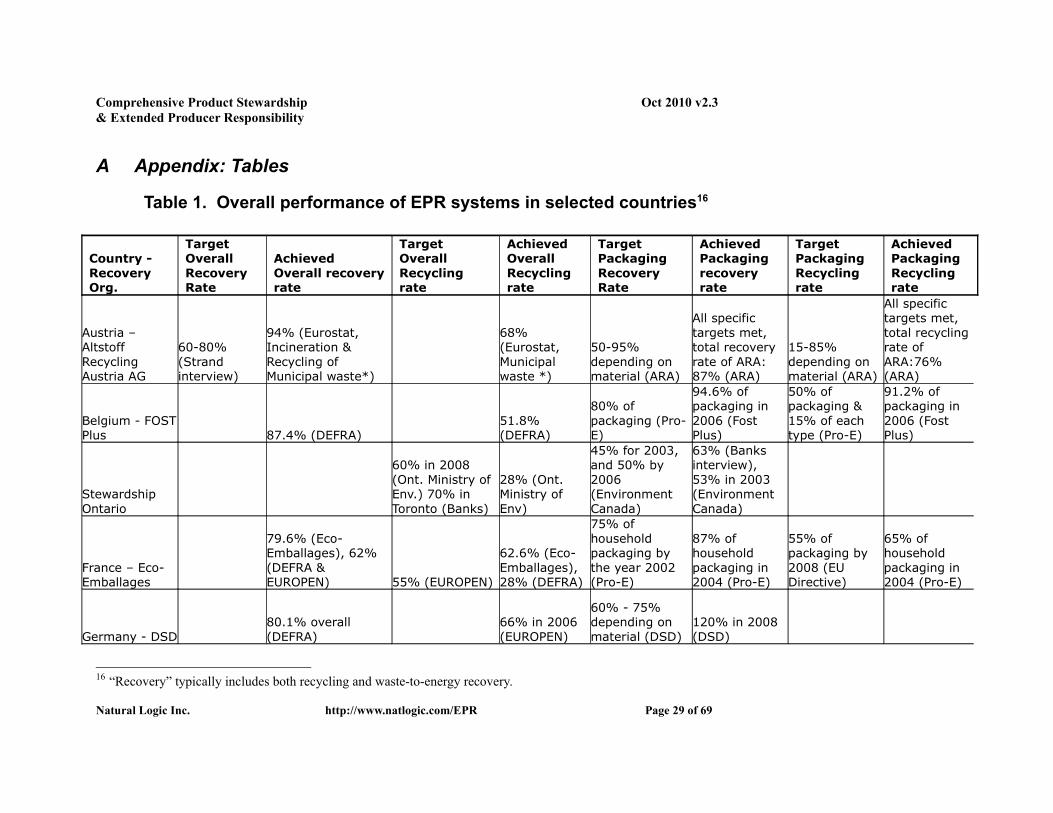
Comprehensive Product Stewardship Oct 2010 v2.3& Extended Producer Responsibility
A Appendix: Tables
Table 1. Overall performance of EPR systems in selected countries16
Country - Recovery Org.
Target Overall Recovery Rate
Achieved Overall recovery rate
Target Overall Recycling rate
Achieved Overall Recycling rate
Target Packaging Recovery Rate
Achieved Packaging recovery rate
Target Packaging Recycling rate
Achieved Packaging Recycling rate
Austria – Altstoff Recycling Austria AG
60-80% (Strand interview)
94% (Eurostat, Incineration & Recycling of Municipal waste*)
68% (Eurostat, Municipal waste *)
50-95% depending on material (ARA)
All specific targets met, total recovery rate of ARA:87% (ARA)
15-85% depending on material (ARA)
All specific targets met, total recycling rate of ARA:76% (ARA)
Belgium - FOST Plus 87.4% (DEFRA)
51.8% (DEFRA)
80% of packaging (Pro-E)
94.6% of packaging in 2006 (Fost Plus)
50% of packaging & 15% of each type (Pro-E)
91.2% of packaging in 2006 (Fost Plus)
Stewardship Ontario
60% in 2008 (Ont. Ministry of Env.) 70% in Toronto (Banks)
28% (Ont. Ministry of Env)
45% for 2003, and 50% by 2006 (Environment Canada)
63% (Banks interview), 53% in 2003 (Environment Canada)
France – Eco-Emballages
79.6% (Eco-Emballages), 62% (DEFRA & EUROPEN) 55% (EUROPEN)
62.6% (Eco-Emballages), 28% (DEFRA)
75% of household packaging by the year 2002 (Pro-E)
87% of household packaging in 2004 (Pro-E)
55% of packaging by 2008 (EU Directive)
65% of household packaging in 2004 (Pro-E)
Germany - DSD80.1% overall (DEFRA)
66% in 2006 (EUROPEN)
60% - 75% depending on material (DSD)
120% in 2008 (DSD)
16 “Recovery” typically includes both recycling and waste-to-energy recovery.
Natural Logic Inc. http://www.natlogic.com/EPR Page 29 of 69

Comprehensive Product Stewardship Oct 2010 v2.3& Extended Producer Responsibility
Netherlands - Nedvang 97.3% (DEFRA)
64.4% (DEFRA)
75% by 2010(Pro-E)
65%-70% (pro-E)
Sweden - REPA 86.4% (DEFRA)41.4% (DEFRA)
50% - 65% of packaging waste
81% of packaging in 2006
25% - 45% of packaging waste
58% of packaging in 2006
United Kingdom – Valpak 0.5
26% overall (DEFRA),
18% (DEFRA), 37% (Bickerstaff interview)
35% by 2012 (EU directive)
42% of packaging
55% of packaging by 2008 (EU Directive)
Japan
40% (Japan for Sustainability)
81% (Japan for Sustainability)
25% (Japan for Sustainability)
19% (Japan for Sustainability)
*http://epp.eurostat.ec.europa.eu/portal/page/portal/waste/data/sectors/municipal_waste
Natural Logic Inc. http://www.natlogic.com/EPR Page 30 of 69

Comprehensive Product Stewardship Oct 2010 v2.3& Extended Producer Responsibility
Table 2: EPR Systems Summary
Country - Recovery Org.
Financial responsibility:
recovery organization
Financial responsibility: municipalities
How financing works Structure
AustriaAltstoff Recycling Austria AG
100% (Perchard) 0% (Perchard) Producers, distributors, importers, traders, and any other businesses that introduce packaging or packaged goods into the Austrian market (all kinds of packaging: packaging from households and trade/industry) are required to participate in an approved collection & recovery system (ARA) or to fulfill obligations of collection and recovery individually (self-compliance)
ARA is a non-profit organization owned by trade & industry responsible for organizing the collection and recovery of packaging waste. Producers exert their control by being on the supervisory board of ARA.
BelgiumFOST Plus
100% (Perchard) 0% (Perchard) Producers, importers and distributors of packaging finance pay fees to to FOS Plus, which pays the municipal collection, sorting, and recovery. This is often contracted to waste hauling companies. (Pro-E)
FOST Plus is an industry-formed non-profit org. Municipalities have control over how the funds are used to recover and recycle materials.
CanadaStewardship Ontario
50% 50% Individual and regional municipalities are responsible for waste collection, diversion and disposal. The private sector is responsible for its own waste management costs (Pro-E)
Municipal governments appear to have a high degree of control of which materials get collected and the accounting systems by which programs are evaluated. There is a tension between industry and municipal government over how to control, finance, and operate a more efficient EPR system.
FranceEco-Emballages
65% (Perchard) 35% (Perchard) Producers pay a fee to non-profit Eco-Emballages, which creates contracts with local municipalities who are responsible
Natural Logic Inc. http://www.natlogic.com/EPR Page 31 of 69

Comprehensive Product Stewardship Oct 2010 v2.3& Extended Producer Responsibility
for providing sorted waste streams. (OECD)
GermanyDSD
100% (Perchard) 0% (Perchard)
Packaging producers pay fees to DSD which holds responsibility for managing packaging waste. Municipalities, retailers, haulers, recyclers, consumers, etc. are responsible for the physical processing. (NZ Trust)
NetherlandsNedvang
1% (Perchard) 99% (Perchard) SVM-Pact does not contribute significantly to the costs of collection or recycling. EcoVerpakkingen provided some support for recovery of beverage cartons and recently for glass recycling and plastic bottle collection, as well as anti-litter (Perchard)
SwedenREPA
95% (Perchard) 5% (Perchard) Four material waste management companies organize collection and recycling/recovery of waste packaging. Collection is carried out under contract with municipal and private organizations and companies that compete for acquiring the right to collect. Recycling is carried out by contracted recycling units or by selling collected materials on the market. (Pro-E)
United KingdomValpak
7% (Perchard) 93% (Perchard) Uses a market-based financial formula to divide costs across producers, distributors, and retailers of packaging material. All participants at all levels of the packaging chain contribute proportionally to their responsibilities and obligations. Britain's packaging scheme allocates a specific percentage of the responsibility to each industry player: 47% for retailers, 36% for packers and fillers, 11% for
Natural Logic Inc. http://www.natlogic.com/EPR Page 32 of 69

Comprehensive Product Stewardship Oct 2010 v2.3& Extended Producer Responsibility
converters and 6% for raw material processors. (NZ Trust)
JapanJCPRA
45% (Gomi Komatani interview)
55% (Gomi Komatani interview)
Producers pay a fee to the Container and Packaging Association, which contracts with local municipalities that are required to collect and supply sorted waste streams to the Association. The Association is responsible for recycling, while municipalities are responsible for financing the collection of materials.
Sources: Perchard, David, Gill Bevington, Fred Soomers, Kees Wielenga, and Raphael Veit. "Study on the Progress of the Implementation and Impact of Directive 94/62/EC on the Functioning of the Internal Market: Final Report, Volume I - Main Report." 6 May 2005. Web. 24 June 2010.PRO EUROPE. Web. September 2009. <http://www.pro-e.org/>."Zero Waste New Zealand Trust | Packaging." Zero Waste New Zealand Trust | Recycle, Minimise Waste, Reduce Rubbish, Reuse Resource, Eliminate Waste for Sustainable World. Web. 24 June 2010. <http://www.zerowaste.co.nz/default,582.sm>.
Natural Logic Inc. http://www.natlogic.com/EPR Page 33 of 69

Comprehensive Product Stewardship Oct 2010 v2.3& Extended Producer Responsibility
Table 3. Fees per material* (PET, HDPE, Al, Cardboard/Paper, Glass)Country -
Recovery Org.PET Fees
($/#)Aluminum Fees
($/#)Paper /
Cardboard Fees ($/#)
Glass Fees
($/#)
HDPE Fees ($#)
Notes on fees
How fees are set
AustriaAltstoff Recycling Austria AG 0.85 0.56 0.15 0.10 0.85
Different rates for packaging from households and industry/trade
Tariffs are calculated annually by the system operators of the ARA System, according to the real costs for the collection, sorting, and recycling of each packaging material.
BelgiumFOST Plus 0.15 0.05 0.01 0.03 0.15
Based on the actual cost of collecting, sorting and recycling/ recovery of each material
CanadaStewardship Ontario 0.12 (0.03) 0.08 0.04 0.11
Based on recovery rates and net cost of recycling, by material; cost allocations to each municipality; and “equalization” fees based on distance from targets
FranceEco-Emballages 0.25 0.25 0.25 0.25 0.25
Single fee for all plastics
Fee by weight of each material + a fee per pack, taking into account packaging waste prevention
GermanyDSD 1.81 1.81 1.81 1.81 1.81
Single fee for all plastics
Calculated on the basis of the material used, the weight and the number of items sold. They also take account of the different costs incurred for collecting and sorting the packaging materials and, in the case of plastics, for recycling.
Natural Logic Inc. http://www.natlogic.com/EPR Page 34 of 69

Comprehensive Product Stewardship Oct 2010 v2.3& Extended Producer Responsibility
NetherlandsNedvang 0.61 1.22 0.10 0.09 0.61
Single fee for all plastics except bio-based
Tax tariffs calculated based on the damage the material does to the environment.
SwedenREPA 0.16 0.10 0.06 NA 0.16
Different fees for different uses of paper cardboard
Fees are set by the material companies. They are based on weight and charged on the basis of reports submitted by REPA´s customers as a quarterly or yearly payment for the preceding period.
United KingdomValpak 0.05 0.07 0.01 0.07 0.05
Single fee for all plastics
Valpak distributes its operating costs through a flat annual administration charge (a one off joining fee) plus a graduated charge per tonne of net obligation. This decreases as the tonnage increases. These figures can fluctuate, depending on the total net obligation of the scheme at any one time.
JapanJCPRA 0.02 NA 0.15 0.05 0.72
Fees based on collection costs
Sources (fees converted from original currency to USD, based on exchange rates as of Jan 1, 2009)PRO EUROPE. Web. September 2009. <http://www.pro-e.org/>.JCPRA. "Recycling Unit Cost and Coefficient 2009." Http://www.jcpra.or.jp/eng/2009.pdf. Web. 9 Sept. 2009.
Natural Logic Inc. http://www.natlogic.com/EPR Page 35 of 69

Comprehensive Product Stewardship Oct 2010 v2.3& Extended Producer Responsibility
Table 4. US Bottle Deposit Systems by StateState CS
DNCB W&S Beer Water Fees Escheat
sRedemptio
n RateUnredeemed deposits
Oregon $.05 - - $.05 $.05 Since 1/09
- No 84% Retained by distributor/ bottlers
California $.05 $.05 - $.05 - Varying Fees Yes 60%-74% Used for program administration and grants to non-profits
Iowa $.05 - $.05 $.05 - $.01 HF No 93% Retained by distributor/bottlers
Michigan $.10 - - $.10 - - Yes 97.2% 75% to state for environmental programs, 25% to retailers
New York $.05 - - $.05 $0.05 since 6/09
$.02 HF for CSD, beer,
$.035 for water
Enjoined by court order
70.2% Retained by distributor/ bottlers
Vermont $.05 - $.05 $.05 - $.035 or $.04 HF
No 90-95% Retained by distributor/ bottlers
Maine $.05 $.05, excl dairy
$.05 $.05 ? $.03 or $.035 HF
Partial Inadequate data
Property of state
Delaware $.05 - - $.05 in glass, SS
PET
- $.01 HF No Unknown Retained by distributor/bottlers
Connecticut $.05 - - $.05 Starting $.015 or $.03 Yes Unknown Returned to the state
Natural Logic Inc. http://www.natlogic.com/EPR Page 36 of 69

Comprehensive Product Stewardship Oct 2010 v2.3& Extended Producer Responsibility
10/09 HFMassachusetts
$.05 - - $.05 - $.025 HF Yes 68.6% Property of state general fund
Hawaii $.05 $.05 - $.05 $.01 Consumer Yes 77% Property of state: used for program administration
Sources: Kevin Deitly, Northbridge Environmental, http://www.bottlebill.org/legislation/usa.htm. CSD – carbonated soft drink, NCB – noncarbonated beverages, W&S – wine, spirits, HF – Handling Fee
Natural Logic Inc. http://www.natlogic.com/EPR Page 37 of 69

Comprehensive Product Stewardship Oct 2010 v2.3& Extended Producer Responsibility
Table 5. PET Recovery and System Performance Country Producer
Responsibility (%)
PET Producer
Fees ($/kg)
Municipal Recovery
Costs ($/kg)
Total System Costs ($/kg)
PET Recycling Rate (%)*
PETOther
Recovery Rate (%) *
(Incineration)
Total PET recovery (%)*
Japan 45% 0.02 0.4 - 1.90˚ 0.42 – 1.92˚ 77.9% --- 77.9%Austria+ 100% 0.85 --- 0.85 59% 21% 80%Belgium* 100% 0.15 --- 0.15 39% 46% 85%France* 65% 0.25 ? ? 22.5% 32% 54.5%Ontario§
50% 0.09 0.18 0.27 57% (PET bottles only)
--- 57%(PET bottles only)
˚ range reflects the cost of selective collection cost on the high end, and the net cost to the municipalities on the low end (net cost = cost of selective collection - cost of incineration/landfill)+ ARA* FFact Study§ Private communication, Derek Stephenson
Natural Logic Inc. http://www.natlogic.com/EPR Page 38 of 69

Comprehensive Product Stewardship Oct 2010 v2.3& Extended Producer Responsibility
Table 6. EPR system accountabilitiesPackaging recycling and diversion accountabilities under Current waste management systems and Proposed EPR Systems
Stakeholder Current System Proposed EPR SystemState Government No accountability Create the rules of the game
Establish recycling targets that Producers must meet, individually or collectivelyAuthorizes and charters a Recovery Organization that can fulfill Producer obligationsEstablish uniform metrics and reporting processSpecify an environmental component for the fee formula (to incent recycled content, low toxicity or more easily recyclable materials)Require Local Government to implement PAYT fee structures for waste disposal
Penalize free-ridersNPRO Does not exist Meet recycling target obligations on behalf of Producers
Design and manage an efficient collection system (statewide) & transition plan Create a material-specific fee structure and collect fees from ProducersContract with WMOs (including Local Government, where applicable) to provide recycling servicesAudit Producers for compliance with reporting and feesFund a variety of waste reduction/diversion strategiesDeliver or contract for marketing, education, product design, technical assistance and other services in support of diversion
Producers No accountability Report packaging (quantity and type) put into the marketPay fees to NPROMinimize fees by reducing amount of packaging, or choosing packaging with higher commodity value, higher recycled content, non-toxic and/or more easily recyclable materials
WMO Service contracts to Local Government for recycling and waste pickupProcess recyclable materialSell recycled materialReceive revenue share from sale of recycled material (subject to
Fulfill service contracts to Local Government for waste pickupFulfill service contracts to NPRO for recyclables pickupCollect, process and sell recyclable materialShare revenues from sale of recycled material with NPRO (also subject to sharing agreements with Local Government)
Natural Logic Inc. http://www.natlogic.com/EPR Page 39 of 69

Comprehensive Product Stewardship Oct 2010 v2.3& Extended Producer Responsibility
sharing agreements with Local Government)
Local Government Contract for recycling and waste pickup services (if they are not the waste management operator)Perform recycling and waste pickup services (if they are the waste management operator)Levy taxes or fees on the consumers/citizens to cover recycling and waste pickup services
Contract for with WMO for waste pickup services (if they are not the WMO)Perform waste pickup services (if they are the WMO)Receive revenue share from sale of recycled material (subject to sharing agreements with WMOs and NPRO)
Consumer Pay fees for waste pickup services (either to Local Government or WMO)Pay fees for recycling pickup services (?)
Sort recyclables out of waste streamPay fees for waste pickup services (either to Local Government or WMO)
Natural Logic Inc. http://www.natlogic.com/EPR Page 40 of 69

Comprehensive Product Stewardship Oct 2010 v2.3& Extended Producer Responsibility
Table 7. Pending State EPR Legislation in the US California, Minnesota, Rhode Island, Vermont and Washington have pending framework bills (see below). Maine passed the first EPR framework bill in the nation in March 2010. This table summarizes status as of October 2010.
For current status please see Product StewardShip Institute maps: http://www.productstewardship.us/index.cfm and http://productstewardship.us/displaycommon.cfm?an=1&subarticlenbr=615
State Framework Paint Packaging/Print Material and FrameworkCalifornia California Product Stewardship Act (AB
2139)*Architectural Paint Recovery Program (AB 1343)*
*Placed on Assembly Appropriations Committee Suspense File (5-5-10)
*Carried over from previous session; currently held in Appropriations Committee
AB 2139: “covered product” includes medical sharps, containers used to contain pesticides intended for residential use, small personal use propane tanks, personal butane lighters, and single-use food packaging that the department determines is a significant source of ocean and beach contamination.Note: A bill is being developed behind closed doors that is purportedly the one the governor wants to sign; contents unknown at this time.
Connecticut An Act Establishing a Paint Stewardship Pilot Program (HB 5122)**Failed to Reach a Vote (4-26-10)
Maine An Act to Provide Leadership Regarding the Responsible Recycling of Consumer Products (LD 1631)**Signed by Governor (3-17-10
Natural Logic Inc. http://www.natlogic.com/EPR Page 41 of 69

Comprehensive Product Stewardship Oct 2010 v2.3& Extended Producer Responsibility
First EPR Framework Law in the USANew Jersey Architectural Paint Stewardship Act (SB
3112)**Introduced 12-7-09This bill is not part of the PSI-facilitated Paint Product Stewardship Initiative agreement and does not have manufacturer support.
New Mexico The Safe Paint Stewardship Act (HB 135)**Currently in House Rules Committee (2-8-10)This bill is not part of the PSI-facilitated Paint Product Stewardship Initiative agreement and does not have manufacturer support.
New York Paint Stewardship Pilot Program (A. 9239)**Referred to Assembly Committee on Environmental Conservation (1-6-10)This bill is not part of the PSI-facilitated Paint Product Stewardship Initiative agreement and does not have manufacturer support.
Minnesota Product Stewardship Act of 2009 (HF 2407)**Carried over from previous sessionProduct stewardship framework operated and funded by producers to collect, recycle, and dispose of products at the end of their useful lives, account created, civil penalties provided, report required, and money appropriated.
Rhode Island An Act Relating to Health and Safety - Product Stewardship (H. 7998)**Held for further study in House committee on Environment and Natural Resources (5-
Natural Logic Inc. http://www.natlogic.com/EPR Page 42 of 69

Comprehensive Product Stewardship Oct 2010 v2.3& Extended Producer Responsibility
6-10)
Vermont Paint Product Stewardship bill: Packaging/Print Material and Framework bill
S-224 requires paint manufacturers to finance and manage an environmentally sound, cost-effective paint stewardship program.
H.696 would require producers of solid waste to pay for and implement a program for the collection, recycling, and disposition of designated solid wastes, including certain types of packaging. The bill would also repeal the beverage container redemption system.
http://www.leg.state.vt.us/docs/2010/bills/Intro/S-224.pdf
http://www.vtpsc.org/framework/legislation.php
Bill failed to reach a vote in April 2010 http://www.leg.state.vt.us/docs/2010/bills/Intro/H-696.pdfThis is a 2 year Bill - is under active study in House Comm. On Nat. Res & EnergyWill be taken up again in Jan. 2011 (Heidi S).
Washington Reducing Greenhouse Gases in Washington (HB 1718)**Re-introduced and retained in present status (3-15-10)
Natural Logic Inc. http://www.natlogic.com/EPR Page 43 of 69

Comprehensive Product Stewardship Oct 2010 v2.3& Extended Producer Responsibility
B Appendix: Figures
Figure 1. Proposed US Product Stewardship/EPR System
Natural Logic Inc. http://www.natlogic.com/EPR Page 44 of 69

Comprehensive Product Stewardship Oct 2010 v2.3& Extended Producer Responsibility
Figure 2. Population density and concentration in the US
Natural Logic Inc. http://www.natlogic.com/EPR Page 45 of 69

Comprehensive Product Stewardship Oct 2010 v2.3& Extended Producer Responsibility
Figure 3a. Voluntary Curbside Pickup (Local Government contracts with WMOs)
Natural Logic Inc. http://www.natlogic.com/EPR Page 46 of 69

Comprehensive Product Stewardship Oct 2010 v2.3& Extended Producer Responsibility
Figure 3b. Voluntary Curbside Pickup (Local Government is waste management services provider)
Natural Logic Inc. http://www.natlogic.com/EPR Page 47 of 69

Comprehensive Product Stewardship Oct 2010 v2.3& Extended Producer Responsibility
Figure 3c. Voluntary Curbside Pickup (Consumer contracts directly with WMO)
Natural Logic Inc. http://www.natlogic.com/EPR Page 48 of 69

Comprehensive Product Stewardship Oct 2010 v2.3& Extended Producer Responsibility
Figure 4. Bottle Deposit System
Natural Logic Inc. http://www.natlogic.com/EPR Page 49 of 69

Comprehensive Product Stewardship Oct 2010 v2.3& Extended Producer Responsibility
Figure 5. European EPR System
Natural Logic Inc. http://www.natlogic.com/EPR Page 50 of 69

Comprehensive Product Stewardship Oct 2010 v2.3& Extended Producer Responsibility
C Appendix: Resource Management Systems in the USThe US is regionally, politically and culturally diverse, with 79% of its population concentrated in a relatively small number of urban areas and a handful of states (Figure 2). There are several common recycling and recovery systems in use throughout the US: voluntary curbside recycling, Pay-As-You-Throw (PAYT) and bottle deposit laws.
1 Voluntary Curbside Pickup
According to the EPA, there were approximately 8,660 curbside recycling programs nationwide in 2006, down from 8,875 in 2002.17 According to the environmental site, Earth 911, curbside recycling now serves about half of the US population.18 The most commonly recycled materials are aluminum cans, glass bottles, paper, plastic and steel/tin cans. These programs are generally voluntary (though with mandates and fines being introduced in a few communities) and vary widely in terms of the types of material collected and how the consumer must sort the materials into different bins for pickup. Diversion from landfill for voluntary curbside programs is consequently low; the national mean diversion rate for voluntary curbside recycling programs hovers at about 12 percent.19
The voluntary curbside pickup system is shown in Figure 3a. In summary:
The Consumer purchases a packaged product from the Producer (for simplicity, wholesalers and retailers are not shown in this schematic).
The Consumer pays taxes or fees to Local Government for disposal (and hopefully recycling) of the packaging.
Local Government contracts for waste disposal and recycling services through Waste Management Operators.
WMOs separate waste from valuable recycled material and process it for resale to other producers for use in recycled content packaging or products, and landfill the remaining waste.
WMOs receive the revenues from the sale of recycled material, and in some cases share these revenues with the Local Government through contractual agreements.
17 US EPA. Office of Resource Conservation and Recovery. Municipal Solid Waste Generation, Recycling, and Disposal in the United States: Facts and Figures for 2006. Nov. 2006. Web. 28 July 2009. <http://www.epa.gov/waste/nonhaz/municipal/pubs/msw06.pdf>.18 O'Sullivan, Laurence. "Recycling Programs Can Encourage Waste Reduction: The Availability Of Programs To Reduce Household Waste." Waste Reduction | Suite101.com. Web. 27 July 2009. <http://waste-reduction.suite101.com/article.cfm/recycling_programs_can_encourage_waste_reduction>.19 Miranda, Marie L. "Managing residential municipal solid waste: The unit-pricing approach." Resource Recycling (1993). Web. 28 July 2009. <http://www.p2pays.org/ref/03/02388.pdf>
Natural Logic Inc. http://www.natlogic.com/EPR Page 51 of 69

Comprehensive Product Stewardship Oct 2010 v2.3& Extended Producer Responsibility
In reality, there are a few variations on this scenario. In some cases, the Local Government is also the Waste Management Operator, as shown in Fig 3b. In this case, the system is the same as in 3a, but with the following changes in material and financial flows:
The Local Government collects the recyclables and waste, and landfills the waste WMOs are contracted to sort and process the recyclables The WMO receives the revenues from the sale of recycled material, and in some
cases shares these revenues with the Local Government through contractual agreements.
In another exception, in many parts of the US (predominantly in the Northeast, Southeast and Midwest), the Consumer contracts directly with the Waste Management Operator for removal of both waste and recycling, as shown in Figure 3c. This case differs from 3a and 3b in that the local government is not involved in either contracting or providing waste and recyclable collection services. The WMO collects, processes and sells the material and receives the revenue from the sale of the recycled material.
The drawbacks of the voluntary curbside pickup system are that there are no incentives to get Consumers to sort their recyclables, nor are there incentives for Producers to use less material or choose more recyclable types of packaging.
2 Pay-As-You-Throw (PAYT)
“Pay as you throw” (PAYT) programs, which represent a rapidly growing segment of curbside recycling programs, utilize a variety of methods to scale disposal fees to quantity of waste generated. In some instances users select the size or number of disposal cans with higher rates for larger volumes of waste. In other programs, users purchase special plastic bags, tags or stickers which must be used for waste that is to be collected. Still other programs use a weight-based system to weigh the garbage when it is collected. Regardless of the method, these programs effectively encourage waste generators to reduce waste and sort out recyclables in order to avoid higher disposal costs. These programs have demonstrated a 17% decrease in MSW and an 8-11% increase in diversion of materials to recycling, by charging a variable rate for the quantity of garbage disposed.20 These PAYT programs are also easy to implement and have low administrative costs. There are about 7,100 PAYT programs operating in the US, serving about 25% of the population.21
20 Poyry, Jaakko, and Skumatz Economic Research Associates. Proc. of New York State Association of Reduction, Reuse, and Recycling (NYSAR3) Conference. 2006. Print.21 Skumatz, Lisa A., and David J. Freeman. "Pay As You Throw (PAYT) in the US: 2006 Update and Analyses. Final Report. Co-Sponsored by EPA Office of Solid Waste, Washington DC, Skumatz Economic Research Associates, Inc., Superior CO." Articles & Research - Pay-As-You-Throw. US EPA, 30 Dec. 2006. Web. 28 July 2009. <http://www.epa.gov/waste/conserve/tools/payt/pdf/sera06.pdf>.
Natural Logic Inc. http://www.natlogic.com/EPR Page 52 of 69

Comprehensive Product Stewardship Oct 2010 v2.3& Extended Producer Responsibility
The PAYT systems function in much the same way as the voluntary curbside pickup system shown in Figures 3a, 3b and 3c, with the exception that the cost for waste disposal scales with the amount of material disposed. In a PAYT system, Consumers have an incentive to sort their waste, in order to avoid disposal costs, but like the voluntary curbside system, there are no incentives for Producers to change their use of packaging.
3 Bottle Deposit Laws (BDL)
Eleven states (OR, CA, IA, MI, NY, VT, ME, DE, CT, MA, HI), home to almost a third of the US population, also have bottle deposit laws. These states place a five-cent deposit on carbonated beverage and beer containers, with the exception of Michigan where there is a ten-cent deposit. A few states have extended the deposit laws to also cover non-carbonated beverages (CA, ME, HI) and water bottles (OR, NY, CT). Published redemption rates range from 60 - 97% for these beverage containers (though some assert that these rates may be inflated by interstate transfers). Table 1 compares the different bottle deposit systems in terms of container type covered, fees, redemption rates and the fate of unredeemed deposits.
A typical bottle deposit system is shown in Figure 4. In summary,
The Consumer purchases a bottled beverage and pays a deposit to the Retailer, who turns the deposit over to the Distributor.
When the Consumer returns the bottle to the Retailer, they recover their deposit and the bottle is returned to the Distributor.
The Distributor holds the deposit monies in “escrow” so that they can refund the deposit on returned bottles, but there is always positive cash flow because redemption rates are less than 100%. (In some states the Distributor remits a percentage of the deposit monies to the State Government, which uses the funds to pay for waste reduction and education programs, and some recycling infrastructure.)
The Distributor then recycles the bottles, through a WMO. The WMO sorts and processes the bottles, sells the material and receives the revenue
from the sale of the material.
Unredeemed deposits have been retained by distributors in most states to defray system operating costs, but the increasing trend is for the state government to lay claim to these funds. Only the Michigan and California programs utilize a portion of these funds for investment in recycling and environmental programs or grants to non-profits. In 2008, California collected deposits worth $1,148.8 million and paid out $983 million for redemption, using the remainder for education, market development, administration, etc. (However a recent State Auditor's report on the California beverage container recycling program concluded that the program “is not always
Natural Logic Inc. http://www.natlogic.com/EPR Page 53 of 69

Comprehensive Product Stewardship Oct 2010 v2.3& Extended Producer Responsibility
able to reliably project the revenues and expenditures for the beverage fund.” 22), and budget-strapped states are increasingly looking to special purpose funds to provide General Fund relief.)
Bottle deposit systems can achieve extremely high redemption rates for the containers that are covered by the law, particularly when the deposit amount is high. Critics note, however, that the bottles covered comprise only three percent of the overall waste stream, that the systems are expensive to implement and manage, that they compete with curbside pickup systems for valuable material, and that reported recovery rates may be inflated due to fraud, interstate transfers, etc.
D Appendix: Extended Producer Responsibility in Europe, Canada & Japan
Extended Producer Responsibility systems use a variety of mechanisms to link the cost of waste management to the generator of the waste – usually the producer or “first importer” of the materials or products.
In 1994, the European Union created The European Packaging Directive, a legal framework allocating responsibility for recovery and recycling of used packaging to producers by mandating that producers in each member state develop and/or join a system to meet targets for recovery and recycling of used packaging. Each member state approached this challenge in its own way; as a result there are many insights that can be gained by studying these parallel "experiments" in EPR. The highest recovery rate is found in Denmark (96.4%), followed by Belgium (80.4%), Norway (68.4%), Austria (67.2%) and Germany (66.9).23
Japan and Canada have also passed EPR legislation and established programs based on the European models. Current performance for recovery organizations in Europe, Canada and Japan, including target and actual recovery and recycling rates, are shown in Table 3.
22 California State Auditor, Department of Resources, Recycling and Recovery: Deficiencies in Forecasting and Ineffective Management Have Hindered the Beverage Container Recycling Program, June 2010 Report 2010-101, <http://www.auditor.ca.gov/pdfs/reports/2010-101.pdf>23 Eurostat. "Recycling Rate by Country." European Commission. 2010. http://epp.eurostat.ec.europa.eu/portal/page/portal/waste/data/wastestreams/packaging_waste Web. 17 May
Natural Logic Inc. http://www.natlogic.com/EPR Page 54 of 69

Comprehensive Product Stewardship Oct 2010 v2.3& Extended Producer Responsibility
Several in-depth studies and many review articles compare European EPR programs.24, 25 This white paper does not provide a comprehensive review of existing programs, but rather offers highlights from both existing literature and interviews with representatives of several EPR organizations, including ARA (Austria), FOST Plus (Belgium), JCPRA (Japan), and Stewardship Ontario (Canada).
1 Legal Basis
a) EuropeThe legal basis for the European EPR systems is the 1994 EU Packaging Directive. Material recovery goals were set at a minimum of 50-65%, with recycling goals of 25-45% of the total packaging material introduced to the marketplace. Each member state was responsible for translating the goals set by the EU directive into national law, though they were also allowed to have higher targets than those set by the EU.
b) JapanJapan passed the Container and Packaging Recycling Law in 1995, holding companies that use or produce containers and packaging to be responsible for recovering the materials. The sole chartered industry organization is the Japanese Container and Packaging Recovery Association, or JCPRA.
The Japanese system was modeled after the German and French systems, and adapted for the Japanese market in 1996. JCPRA is a government-mandated entity, and there are no competitors in the marketplace. Despite this uniformity, accounting and cost allocation is inconsistent across municipalities, and may be modified in upcoming revisions to the law. (See section 2.b. below.)
c) Canada Several territorial and provincial recycling organizations have been formed to implement EPR systems in Canada. The province of Ontario passed the Waste Diversion Act of 2002, under which the Minister of the Environment is authorized to require Waste Diversion Ontario to develop a waste diversion program for “designated waste,” in conjunction with an Industry Funding Organization (IFO). Stewardship Ontario is Ontario's first Industry Funding Organization (IFO). Manitoba has a similar program.
24Perchards, and MS2. "Final Report: Product Stewardship in North America and Europe, Prepared for Department of the Environment, Water, Heritage and the Arts on Behalf of the Waste Policy Taskforce June 2009." Http://www.environment.gov.au/wastepolicy/resources.html. Australian Government, Department of the Environment, Water, Heritage & the Arts, June 2009. Web. 24 June 2010. <http://www.environment.gov.au/wastepolicy/resources.html>.25Perchard, David, Gill Bevington, Fred Soomers, Kees Wielenga, and Raphael Veit. "Study on the Progress of the Implementation and Impact of Directive 94/62/EC on the Functioning of the Internal Market: Final Report, Volume I - Main Report." 6 May 2005. Web. 24 June 2010.
Natural Logic Inc. http://www.natlogic.com/EPR Page 55 of 69

Comprehensive Product Stewardship Oct 2010 v2.3& Extended Producer Responsibility
British Columbia has a suite of deposit and take-back programs that apply to specific materials, but it is not a comprehensive EPR system after the European model. The British Columbia Ministry of the Environment administers the Recycling Regulation, under the Environmental Management Act (October 2004), a suite of deposit and take-back programs that apply to specific materials, but it is not a comprehensive EPR system after the European model; the British Columbia scheme requires packaging producers to submit a stewardship plan for packaging and requires retailers to operate a deposit system.26
The New Brunswick Department of Environment administers an EPR program that regulates distributors under the Beverage Container Regulation. The Northwest Territories, Prince Edward Island, Quebec, and Saskatchewan also have deposit-based EPR programs.
2 System Structure, Funding and AccountabilityThough there are variations in EPR systems, there are basic similarities in system structure. The typical EPR system features a non-profit organization, founded by a coalition of industry producers, to manage the recovery of recyclable materials (Figure 5). In summary:
Producers pay variable fees to the non-profit organization on the basis of the type and quantity of material they put into the marketplace.
Consumers buy product through retailers or wholesalers (European producers typically pass the packaging fee through to Consumer, but not transparently)The Non-Profit Recovery Organization applies those fees to end-of-life management of the collection of the materials, in turn maintaining Producers’ compliance with the legislated targets.
The NPRO manages the contracts for the collection, sorting and processing of the recyclable materials.
Recycling system costs are sometimes split between the NPRO and Local Government (see Table 2), in which case the Local Government also has some control over the collection system details.
WMOs collect, sort and process recyclables and waste. (Most non-recycled waste in Europe is burned rather than landfilled.) When the processed materials are sold, the revenues flow back to the NPRO to manage their operations, and offset the material-specific Producer fees.
More successful diversion and recycling programs offset and reduce Producer fees by providing direct financial incentives and accountability to Producers to both design products and support behaviors that reduce waste to landfill. Each EPR system has its own approach for determining the material fees, managing material collection, and allocating the share of costs between Producers and Local Government.
26 "Extended Producer Responsibility and Stewardship - Principles." Environment Canada. Web. 02 Nov. 2009. <http://www.ec.gc.ca/epr/default.asp?lang=En&n=9D626C74-1>.
Natural Logic Inc. http://www.natlogic.com/EPR Page 56 of 69

Comprehensive Product Stewardship Oct 2010 v2.3& Extended Producer Responsibility
Funding for EPR collection and recycling programs is generated by Producer fees, which are linked to the quantity and characteristics of waste generated. Material-specific fees encourage producers to design and sell products that reduce the quantity and impacts of “wastes”. Producers typically build the incremental EPR fees into product pricing, and pass those costs on to the consumer. Packaging which can be recovered and recycled with the greatest efficiency and highest revenues cost the consumer less, rewarding consumers with lower prices and producers with higher sales.
The definition of costs also varies from system to system. Some EPR organizations own waste management equipment and infrastructure, and their costs include everything from collection to recycling and depreciation on the infrastructure. Other systems contract all services out to independent providers.
While cost sharing may seem more equitable and less of a burden on producers, this is not necessarily the case. In cases where the public sector is financially responsible, it also exerts more control over the collection program, which can lead to higher overall costs if their process is less than efficient.
When the producers pay the full cost of collection they also control the details of the collection program – and tend to assert that they operate them more efficiently. Where municipalities own waste management infrastructure, they provide services under contract to the industry organization, enabling them to standardize collection programs and thus manage costs.
a) EuropeGermany was the first country to create an EPR system – DSD, or Duales System Deutschland – in 1991, prior to the EU packaging directive. Based on Germany’s results, the EU moved forward with the packaging directive, and France, Belgium and Austria organized their EPR systems shortly thereafter.
The funding mechanisms of the European EPR systems vary from country to country. In Austria, Belgium and Germany the non-profit industry organization pays the full cost of handling the recyclables. The other countries have varying levels of public and private sector cost sharing, as shown in Table 4.
b) Japan Japan’s Container and Packaging Recycling (CPR) Law established cost sharing at 55% for municipalities, and 45% for producers. The actual costs to municipal governments are difficult to determine, however, due to accounting inconsistencies. While business entities have clear and consistent accounting systems, municipal systems do not consistently allocate operating costs, depreciation costs, etc., so unit prices are different across municipal government systems. During recent attempts to revise the Packaging and Container law, estimates were presented that producer costs were Y40B and municipality costs were as high as Y200B (or more than 80%
Natural Logic Inc. http://www.natlogic.com/EPR Page 57 of 69

Comprehensive Product Stewardship Oct 2010 v2.3& Extended Producer Responsibility
municipal). In the next round of revisions, producers are advocating for an accounting standard for municipalities that will include standard allocated costs, depreciation, and a clear definition of unit price, as these currently vary widely in reporting and accounting.27
Municipal costs can run high though, as a result of the trade-off in cost for collection vs. sorting. Some municipalities require consumers to sort recyclables to as many as 47 categories, resulting in high collection costs; if they ask consumers to sort less, then collection costs go down, but their own sorting/processing costs go up. Japan hasn't determined the best balance, and lacks data for making such a determination because of the accounting inconsistencies noted above. Strong cultural values around tidiness and a clean environment support high rates despite weaknesses in system design.
The CPR law provides incentives for producers to reduce packaging. If a company increases sales volume while reducing packaging volume, the JCPRA reduces its fees in the following year.
The system assesses financial penalties against free-riders, and also relies on “socially penalties”, with JCPRA publishing the names of companies that participate and those that don’t comply.
c) CanadaOntario based its system on the French model, and launched Stewardship Ontario in 2002. Stewardship Ontario is currently 50% funded by industry, 50% by municipal government through general tax revenues. The province of Manitoba has a similar system to Ontario’s, but is 80% industry funded.
There are several different tools and instruments that are used to drive performance in Ontario. Under the Waste Diversion Act, Waste Diversion Ontario (WDO) was established to develop, implement and operate waste diversion programs for a wide range of materials, including packaging. Stewardship Ontario (SO) is required submit a plan to WDO detailing how it meet designated targets. The WDO may levy penalties or raise targets if producers are not meeting their targets or “free-riding.”
In Ontario’s system, stewards (producers) are responsible for 50% of the cost of recyclable collection, with municipalities bearing the other 50% cost. However, there is a strong possibility that the steward responsibility will be increased to 100% in the near future as legislators review the Waste Diversion Act prior to its sunset provision at the end of 2009. If producer responsibility increases to 100%, then Stewardship Ontario will become a waste management utility rather than a transfer payment organization. The industry will have to pay for the full cost of the program, but the benefit is that it will also have full control; industry advocates expect that performance will improve and cost per ton will decline.
27 Private communication with representatives from JCPRA and Coca-Cola Japan.
Natural Logic Inc. http://www.natlogic.com/EPR Page 58 of 69

Comprehensive Product Stewardship Oct 2010 v2.3& Extended Producer Responsibility
3 Cost Model for Material FeesMaterial fees are generally based on the cost of collection and recycling of the material. Materials with higher market value generally have lower fees, however it has to be taken into account that the collection and sorting costs are the dominant cost factors in the fee calculation. Table 3 shows material fees for all recyclables across the EPR organizations in Europe, Japan and Canada, normalized to the U.S. dollar for comparison purposes. However, it is difficult to make comparisons between the European and Japanese systems because of differences in how the fees are calculated.
Taking PET as an example in Table 5, the Japanese producer fee reflects only the costs of recycling and the sale of the processed material, and does not include the collection costs, which are covered by the municipalities; when a material has market value, producers pay only administration costs to the JCPRA, not a material based fee. For European countries with 100% producer responsibility, fees also include the cost of material collection. In order to make an equivalent comparison between the Japanese and 100% producer financed European systems, the municipal costs must be added to the producer fees, which results in total system costs of $0.42 - $1.92/kg for PET. Another factor that makes comparison between these systems difficult is that Japan does not permit incineration of PET; all of the collected PET must be recycled into pellets or flakes. This contributes to the high PET recovery rates in European countries, and reduces their material processing costs for PET.
Municipal recovery costs in Japan vary widely due to many factors including extensive sorting and collection requirements and inconsistent accounting and reporting practices. These issues will be a focus for discussion during the next review of the CPR law in Japan.
The first industry coalitions were essentially monopolies, but they are now giving way to competition. One consequence of increased competition between recovery organizations is less transparency into the funding mechanisms and material fees. For example, in Germany material fee structures are not transparent and not published by the competitive NPRO organizations. However FOST-PLUS but also Eastern European EPR organizations have transparent material fee structures though there is also competition among the NPROs. Furthermore, where there are multiple NPROs the motivation of competitors to audit their own participants (the Producers) naturally decreases, since participants will tend to join those organizations that offer the lowest regime of control. As a consequence, reporting totals and therefore payments organizations receive from Producers decrease as well, both of which have an increasing effect on material fees, if costs for collection and recovery are not altered sufficiently..
Stability, or at least predictability, of any fee scheme supports better planning, enabling waste industry participants to better ride the ups and downs of the commodity markets – an important part of the business model for some providers.
Natural Logic Inc. http://www.natlogic.com/EPR Page 59 of 69

Comprehensive Product Stewardship Oct 2010 v2.3& Extended Producer Responsibility
a) Europe
i) Austria, ARAIn Austria, ARA’s material fee formula includes the following:
Material Fee (glass, PET, aluminum, etc) = (Collection cost + Handling cost + Sorting cost + Processing cost (cleaning, baling, etc) + Depreciation (bins, trucks, etc) + Infrastructure cost + Administrative cost sale of recovered material) Total licensed quantity
Any revenues from the sale of recycled material are used to offset costs and decrease producer fees. Given the current state of commodity markets, revenues have fallen significantly and ARA must now pay to get rid of certain materials which quite recently had value on the commodities markets. Paper is doing poorly. There is modest revenue from clear glass, but zero on colored glass. PET brought €500-600/ton last year, but now only sells for €150/ton.28
ii) Belgium, FOST PlusFost Plus is entirely financed by its 5,783 members, representing 92% of the Belgian household packaging market. System financing is based on all packaging that is put into the market, but the recycling scheme is based on a limited number of packaging types. By selecting a subset for recovery and recycling, FOST Plus is able to comply with legislated recycling targets. Consumers place plastic bottles, metal cans, and drink cartons in a blue bag for recycling.
Financial contributions determined by quantities and types of packaging, based on annual declaration of packaging quantities, with a simplified declaration systems for smaller companies. Participants gain the right to use the Green Dot mark (which is not a sorting instruction, but rather an indication of participation in the collection and recycling scheme). Open-ended agreements can be terminated each year.29
b) JapanJapan’s “Recycling Fee” formula is a function of “Estimated Amount of Output” x “Calculation Coefficient” x “Recycling Unit Cost”, applied to a detailed breakdown of material types. (For example, containers for food manufacturing, non-alcoholic beverages, alcoholic Beverages, pharmaceuticals, cosmetics, etc. each have different coefficients.) It includes the cost of processing recycled material, offset my material sales, but does not include collection costs since these are covered by municipalities.
The detailed fee structure is published on the JCPRA web site, along with a web form for producers, and is summarized in Appendix D.
28 Private communication with Coca-Cola Hellenic representative.29 FostPLUS Corporate presentation EN-V2008, January 17, 2008
Natural Logic Inc. http://www.natlogic.com/EPR Page 60 of 69

Comprehensive Product Stewardship Oct 2010 v2.3& Extended Producer Responsibility
c) CanadaIn Canada, PET is in its own category, because other plastics cost more to recycle and have lower market values. There is a negative fee for aluminum cans because they are cheaper to recycle and they have a high market value.
Stewardship Ontario’s initial fee model (in place for years one-three, to be periodically revised for subsequent years) allocates fees for each material type on the following basis:
Net cost to handle 40%Relative recovery rate 35% (inverse: higher recovery rate > lower fee)Equalization 25% (what it would have cost to bring each material
up to the norm)
4 Collection & OperationsIn terms of the infrastructure for sorting, there have been arguments made for the industry organization playing a social role in jobs creation for manual sorting operations. For instance, in Belgium, sorting is 70% automated and 30% manual, whereas in France it is the reverse with 70% manual and 30% automated.
a) EuropeThe collection processes and the materials collected vary from system to system.
i) BelgiumIn Belgium, consumers sort into four bins: 1) Plastics+Metals+Tetrapaks, 2) Paper, 3) Garbage, 4) Organics+Compost.
FOST Plus pays municipalities on a weight basis for sorted materials. The municipalities manage all aspects of the collection and sorting. Producers and FOST Plus jointly create incentives for festival and large event attendees to recycle, for instance, using special incentives to get people to bring 4-10 bottles to receive a free t-shirt.
ii) AustriaIn Austria, ARA decides how the consumers will sort the materials, and which type of containers are to be collected – and any adjustments are established in cooperation with the municipalities. The municipalities are treated as contractors, and if they want to expand the collection program to recover additional types of materials then they are responsible for the cost. ARA monitors the quantity and quality of the waste streams, and has optimized its systems to reach the highest recovery targets of any country in the EU.
iii) HollandHolland is a special case because it has only a deposit system that requires consumers to bring bottles back to the supermarket. This system achieves a 98% recovery rate of bottles, because
Natural Logic Inc. http://www.natlogic.com/EPR Page 61 of 69

Comprehensive Product Stewardship Oct 2010 v2.3& Extended Producer Responsibility
consumers have always had a system of returnable bottles. The deposit is €0.25 for 700 mL bottles, and approximately €1.50 on 1.5 L. However, Holland is far below the EU target of 35% for all materials, and by 2010 will have to begin collection at home. They are in a planning phase to develop a program modeled after Belgium’s FOST Plus. There are no landfills in Holland; non-recyclable waste is burned for energy recovery.
iv) United KingdomThe UK has so far achieved its goals by focusing on industrial recycling, but to meet the 35% goal it will have to establish a primary household collection system. There are significant trade barriers within the UK; as it is not possible to set up a single company that does the collection across municipalities, the recovery organization would have to contract with each municipality to do the collection.
b) JapanIn some Japanese municipalities, consumers must sort 8-15 different types of waste streams: garbage; three types of glass (white/brown/other); PET bottles; paper packaging; plastic; newspapers and magazines; cardboard; metals; combustible and non-combustible refuse; batteries and large refuse. Some municipalities collect the steel and aluminum together, colored and clear glass together, and some collect glass and PET together but PET quality deteriorates in this case. JCPRA is trying to encourage municipalities to separate in the most effective manner, however, the collection method is decided by each municipality, and JCPRA has little control.
With this wide range of municipal approaches to sorting in Japan, a clear impact on costs has emerged. If consumers are required to sort waste into a large number of categories, the cost of collection increases. On the other hand, if the municipal governments combine materials at collection, sorting costs increases.
The current package recycling law in Japan allocates responsibility for package recovery to the three relevant parties -- such as consumers, municipalities and industries. Municipalities are required to collect the packages by type, industries are required to actually recycle the collected packages or to pay their recycling fee, and consumers provide discards to the given municipal sites by types. This responsibility scheme seems to result in high recovery rate (e.g., PET: 75%) and lower recycling fees; steel/aluminium cans were excepted from recycling obligation by the law since they had already achieved over 90% recovery. Discussion for the next revision of the recycling law may include modified responsibilities, as well as possible inclusion of cans.30
c) CanadaConsumer participation in recycling is directly related to convenience, which translates into curbside pickup. The alternative to curbside pickup is deposit-based systems, and though they have advantages, they haven’t out-performed curbside pickup, and they can also be quite costly.
30 Naoto Gomi, Coca-Cola Japan, personal communication, Nov 5 2009
Natural Logic Inc. http://www.natlogic.com/EPR Page 62 of 69

Comprehensive Product Stewardship Oct 2010 v2.3& Extended Producer Responsibility
In Ontario, curbside collection is managed at the municipal level, so it is up to each individual municipal government to determine its own approach. There tends to be inconsistency in the collection schemes amongst municipalities, which leaves consumers confused about what materials are supposed to go into the blue box (which is common across all of Ontario). Some municipalities have a single stream approach, and others have dual stream (fibers and containers). There is lost opportunity for cooperation in harmonizing collection schemes across larger geographic area; thus the strategy going forward is to create more consistency across municipalities and encourage more cooperation and participation on a regional level.
5 Concurrent PoliciesThe EPR systems described in this section do not exist in a vacuum. There are other waste management policies and programs that co-exist and support the EPR system by getting people to sort recyclables from waste.
a) EuropeIn Belgium, there is a growing trend for municipalities to charge consumers for general waste by the kilogram, which stimulates recycling. In France consumers pay a monthly fee for waste collection, but it is not related to the weight or volume of the waste.
In Austria, there are some prevention targets for landfill waste, by total amount of packaging put in the landfill (for packaging materials glass and metals). There is a waste analysis every three years.
Additionally Austria has introduced a landfill ban for waste with more than 5% total organic content (either natural carbon, or synthetically derived) from January 1, 2004. Hence the disposal of untreated MSW or plastics, paper and wood packaging is not allowed.
b) Japan In Japan, 47 different types of materials are required to be recycled by law, including automobiles, home appliances, cell phones, etc. Only ten types of containers and packaging are subject to producer recovery obligation under the Container and Packaging Recycling Law.
c) CanadaIn Canada, provincial mandates require the collection of certain materials for recycling. Policy and programs vary by municipality, including PAYT based on bin size or special bag, fee for recycling, and mandatory composting. The city of Toronto requires retailers to charge five cents for disposable plastic bags. There are no landfill bans in effect in Ontario at this time.
Natural Logic Inc. http://www.natlogic.com/EPR Page 63 of 69

Comprehensive Product Stewardship Oct 2010 v2.3& Extended Producer Responsibility
6 Outreach & Education
a) EuropeIn Belgium and Austria, major television advertising campaigns were utilized to help consumers navigate the learning curve of sorting recyclables into the correct bins or bags. Waste contamination of recyclables is monitored constantly, and television commercials reinforce the message if contamination begins to rise. There are also curriculum packages for schools – even kindergartners get a sorting course, and the children end up training the parents.
Austria’s ARA subsidizes the payroll costs of 290 “waste ambassadors” who are employed by municipalities to design strategies and campaigns to increase recycling. There are annual competitions, with award categories for all age groups from kindergarteners to elderly people. In the last 10 years, there have been many successful projects, games and information campaigns. The top three most effective campaigns for increasing recycling participation are rewarded with prizes and documented for replication in other locations. The idea of the recycling ambassadors has been exported to other countries.
i) Japan, JCPRAIn Japan, consumer education is mainly led by municipalities; there are also many programs being implemented by the producers to educate consumers – for example, Coca-Cola’s various programs and television advertisements around collection recycling education for consumers.
ii) Canada, Stewardship OntarioIndividual municipalities are responsible for participation and education, which results in inconsistencies in collection schemes for consumers who move to another municipality. Stewardship Ontario is dealing with that through exercising persuasiveness and using the levers that they have to generate some consistency, but it’s an area for improvement.
7 Lessons Learned We asked our interviewees to summarize the lessons learned through their country’s experience with EPR systems. Here are the particulars that they felt were important to highlight.
a) Europe
i) Belgium, FOST PlusThe keys to success for the FOST Plus system include:
Uniformity of collection scheme – in almost every municipality three waste streams are collected in the same way. This is very important for consumer participation, and there is no learning curve when they move house. Financial and performance comparisons are also much easier to make.
Natural Logic Inc. http://www.natlogic.com/EPR Page 64 of 69

Comprehensive Product Stewardship Oct 2010 v2.3& Extended Producer Responsibility
The FOST Plus collection program was introduced in a progressive way over ten years and now there is 100% coverage across municipalities. By contrast, Germany introduced their collection system too quickly on too large a scale and then struggled to manage the system at first.
In Belgium, there is solidarity amongst the different industry sectors. A system has evolved where they have jointly selected for packaging that has value as recycled material, so there is enough volume to make collection cost effective.
Quality management – FOST Plus invests a lot of time and effort in managing the quality of the materials, through communication with municipalities. A uniform collection scheme also makes it easier to manage the quality of the materials and avoid contamination.
Other observations: There must be incentives for consumers to recycle, as only minority will do it to “save
the planet”. The incentive doesn’t necessarily have to be cash, but discount coupons have been shown to be very effective.
Introducing recycling sorting curriculum into schools is very effective, but it takes about five to ten years to see an effect.
If Belgium were starting a new system today, they would consider a system where collection is done at supermarkets (though the supermarkets may not agree). What makes FOST Plus expensive is the fuel overhead for curbside collection. When fuel prices were high a year ago it was a very high cost.
ii) Austria, ARA The Austrian example highlights issues with setting the target too high at the outset. The
Austrian government set a recovery target that was 80-90% higher than EU directive. They recommend starting with something more modest and ramping it up over time.
The ARA system was also started on a very short timeline, with only eighteen months for the producers to organize themselves and create a system to comply with the packaging directive. This resulted in very high startup costs. System costs were also quite high initially, but they have come down significantly over time.
In the early days of EPR in Austria, there were some mandatory recycling policies that required people to separate recyclables or face penalties. The problem was measuring, analyzing, and enforcing these policies. This part of the law disappeared entirely by the third revision. It is the responsibility of the EPR organization and the municipalities to educate and increase participation with consumers.
Key success factors for ARA have been: strong enforcement, high fines and penalities for non-compliance, and high costs for landfilling. Based on our experiences. Campaigns to
Natural Logic Inc. http://www.natlogic.com/EPR Page 65 of 69

Comprehensive Product Stewardship Oct 2010 v2.3& Extended Producer Responsibility
make separation of waste “cool” and motivate consumers to separate are of additional help.
Austria now includes producers and importers of packaging such as plastic bags that are usually for bagging purchases at the point of sale.
b) Japan Having a standard for definition of costs and a reporting standard for municipalities to
use would have enabled better financial comparisons. New rules are under consideration for the next round of revisions of the law.
Better reporting would also provide an informed basis for controlling costs around sorting. If the consumer must sort a large number of materials, then collection costs increase, but if municipalities do the sorting then sorting costs increase.
c) Canada A few years after the launch of the WDA in Ontario, municipalities began to expand their
collection programs to include other materials such as additional types of plastic, hazardous waste, used oil, tires, and electronics. This significantly diffused the mission around packaging recovery. Collection costs and steward fees increased significantly by the inclusion materials with little or no market value.
This is directly related to the sharing of control and cost in Ontario’s 50-50 structure. The producers have little control or oversight around the collection program, or definition of what the municipalities can call “costs” and include in the budget.
In hindsight, a standard collection system across all municipalities would have been more effective. When consumers move to a new municipality, they have a learning curve to recycle, and participation is impacted. Another opportunity to boost participation was a stronger marketing and outreach program for consumers. Less than 3% of SO’s budget was spent on PR and outreach, as the board the board was primarily concerned with running the program as efficiently as possible, they didn’t approve much budget for communications.
Given the sunset provision for the WDA in 2009 and the move to increase steward responsibility to 100%, there is general consensus that it would have been better to begin at 100% responsibility and take 100% control and design a system that is more efficient and more to the producer’s advantage. The question is one of carrying 50% percent of the cost of a poorly efficient (high cost) system, or 100% of a highly efficient (low cost) system.
8 Summary of Best Practices in EPRThree of the five top performing European EPR systems began with a strong industry coalition where producers assumed 100% responsibility for the cost of recyclable material collection from the outset. This enabled producer control of the collection and management of the collection
Natural Logic Inc. http://www.natlogic.com/EPR Page 66 of 69

Comprehensive Product Stewardship Oct 2010 v2.3& Extended Producer Responsibility
process, including types of materials collected, and the manner in which they are collected and sorted.
There is a perverse incentive in current EPR systems in that diverting more waste costs more, particularly when the new materials are more expensive to recycle and have low market value (e.g. shrink wrap, plastic bags, vegetable clamshells). To address this, material fees should be designed to shift producer material choices. As producers begin to use higher market value packaging in aggregate, diversion volumes will increase, collection costs will decrease, revenues from processed material will increase and thus producer fees will decrease. (Since producer costs (fees) in EPR systems are passed to the consumer in the form of higher product prices, the system should be operated as efficiently as possible.)
For successful systems with high consumer participation in sorting, it is important to utilize processes that are compatible with existing systems and culture. Incentives that motivate consumers to sort waste can take the form of municipal Pay-As-You-Throw fees that are related to the amount of waste disposed, or programs that offer discount coupons in exchange for recyclables, similar to the RecycleBank. Mandatory recycling and landfill bans are complementary policies that will also drive sorting behavior. Advertising, and school curricula to train schoolchildren in waste sorting, are also effective in helping everyone climb the learning curve.
The first industry-led recovery organizations in Europe were essentially monopolies, but they are now giving way to competition as new organizations are granted charters to operate. The main consequence has been less transparency into the funding mechanisms and material fees. FOST-PLUS is currently the only European EPR organization that has maintained transparency regarding fees, despite having new competitors. Establishing a mechanism to ensure transparency of costs and fees will be important in establishing a market-responsive EPR system in the US.
Natural Logic Inc. http://www.natlogic.com/EPR Page 67 of 69

Comprehensive Product Stewardship Oct 2010 v2.3& Extended Producer Responsibility
E Appendix: OECD Guidelines for EPR SystemsThe OECD indicates that the "following guiding principles underlie an effective EPR program:
1. EPR policies and programs should be designed to provide producers with incentives to incorporate changes upstream at the design phase in order to be more environmentally sound.
2. Policies should stimulate innovation by focusing more on results than on the means of achieving them - thus allowing producers flexibility with regard to implementation.
3. Policies should take into consideration a life cycle approach so that environmental impacts are not increased or transferred somewhere else in the product chain.
4. Responsibilities should be well defined and not be diluted by the existence of multiple actors across in the product chain.
5. The unique characteristics and properties of a product, product category or waste stream should be factored into policy decisions. Given the diversity of products and their different characteristics, one type of program or measure is not applicable to all products, product categories or waste streams.
6. The policy instrument(s) selected should be flexible and chosen on a case-by-case basis, rather than setting one policy for all products and waste streams.
7. Extension of producer responsibilities for the product’s life cycle should be done in a way to increase communication among the actors in the entire product chain.
8. A communication strategy should be devised to inform all the actors in the product chain, including consumers, about the program and to enlist their support and co-operation.
9. To enhance a program’s acceptability and effectiveness, a consultation of stakeholders should be conducted to discuss goals, objectives, costs and benefits.
10. Local governments should be consulted in order to clarify their role and obtain their advice concerning the program’s operation.
11. Both voluntary and mandatory approaches should be considered with a view on how to best meet national environmental priorities, goals and objectives.
12. A comprehensive analysis of the EPR program should be made (e.g. which products, product categories and waste streams are appropriate for EPR, whether historical products should be included, and the roles of the actors in the product chain).
13. EPR programs should undergo periodic evaluations to ensure that they are functioning appropriately and are flexible enough to respond to these evaluations.
14. Programs should be designed and implemented in a way that environmental benefits are obtained while domestic economic dislocations are avoided.
Natural Logic Inc. http://www.natlogic.com/EPR Page 68 of 69

Comprehensive Product Stewardship Oct 2010 v2.3& Extended Producer Responsibility
15. The process of developing and implementing EPR policy and programs should be based on transparency." (http://www.ec.gc.ca/epr/default.asp?lang=En&n=9D626C74-1)
a) References
1. Organization for Economic and Cooperative Development. Working Party on Pollution Prevention and Control. Extended Producer Responsibility: A Guidance Manual for Governments. October 2000
2. Canadian Ministers of the Environment. Guiding Principles for Packaging Stewardship. May 1996.
3. Organization for Economic and Cooperative Development. Sustainable Consumption Webpage - Glossary of Terms.
4. World Business Council for Sustainable Development. Measuring Eco-efficiency: A guide to measuring company performance. June 2000
5. Organization for Economic and Cooperative Development. Eco-Labeling: Actual Effects of Selected Programs. May 1997.
6. United States Environmental Protection Agency. Extended Product Responsibility: A Strategic Framework for Sustainable Products. December 1998.
7. World Business Council on Sustainable Development. Definitions Webpage.8. European Commission: DGXI. Integrated Product Policy: A study analyzing
national and international developments with regard to Integrated Product Policy in the environment field and providing elements for an EC policy in this area. March 1998.
9. Government of Canada. Pollution Prevention: A Federal Strategy for Action. June 1995
10. Symposium: Sustainable Consumption, Oslo, Norway. January 1994.11. World Commission on Environment and Development. Our Common Future,
Oxford University Press, New York, 1987
Natural Logic Inc. http://www.natlogic.com/EPR Page 69 of 69