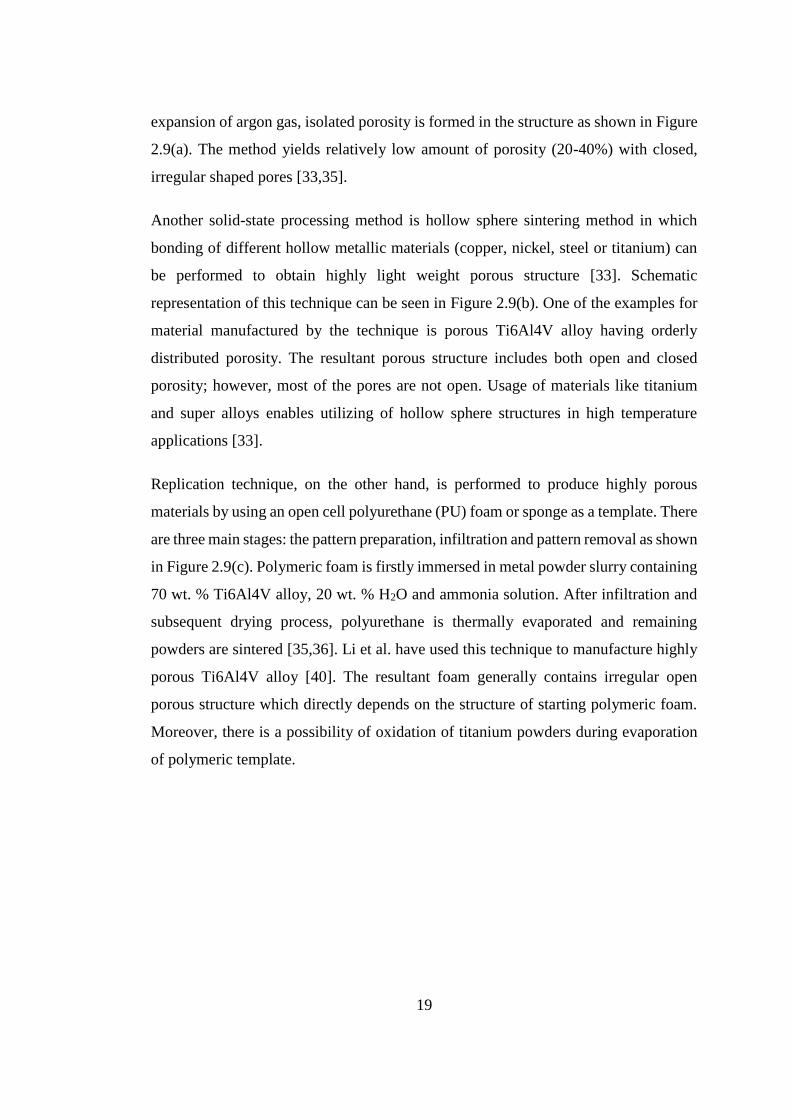
production and characterization of surface treated...
TRANSCRIPT
PRODUCTION AND CHARACTERIZATION OF SURFACE TREATED
BIOMEDICAL Ti6Al7Nb ALLOY FOAMS
A THESIS SUBMITTED TO
THE GRADUATE SCHOOL OF NATURAL AND APPLIED SCIENCES
OF
MIDDLE EAST TECHNICAL UNIVERSITY
BY
EZGİ BÜTEV
IN PARTIAL FULFILLMENT OF THE REQUIREMENTS
FOR
THE DEGREE OF MASTER OF SCIENCE
IN
METALLURGICAL AND MATERIALS ENGINEERING
FEBRUARY 2015

Approval of the thesis:
PRODUCTION AND CHARACTERIZATION OF SURFACE TREATED
BIOMEDICAL Ti6Al7Nb ALLOY FOAMS
submitted by EZGİ BÜTEV in partial fulfillment of the requirements for the degree
of Master of Science in Metallurgical and Materials Engineering Department,
Middle East Technical University by,
Prof. Dr. Gülbin Dural Ünver
Dean, Graduate School of Natural and Applied Sciences
Prof. Dr. Hakan Gür
Head of Department, Metallurgical and Materials Engineering
Prof. Dr. A. Şakir Bor
Supervisor, Metallurgical and Materials Eng. Dept., METU
Assoc. Prof. Dr. Ziya Esen
Co-supervisor, Materials Science and Eng. Dept., Çankaya Uni.
Examining Committee Members:
Prof. Dr. Bilgehan Ögel
Metallurgical and Materials Eng. Dept., METU
Prof. Dr. A. Şakir Bor
Metallurgical and Materials Eng. Dept., METU
Prof. Dr. Caner Durucan
Metallurgical and Materials Eng. Dept., METU
Assist. Prof. Dr. Mert Efe
Metallurgical and Materials Eng. Dept., METU
Kaan Pehlivanoğlu, Ph.D.
Advanced Materials Technologies Div., TUBİTAK SAGE
Date: 02.02.2015

iv
I hereby declare that all information in this document has been obtained and
presented in accordance with academic rules and ethical conduct. I also declare
that, as required by these rules and conduct, I have fully cited and referenced all
material and results that are not original to this work.
Name, Last name : Ezgi Bütev
Signature :
v
ABSTRACT
PRODUCTION AND CHARACTERIZATION OF SURFACE TREATED
BIOMEDICAL Ti6Al7Nb ALLOY FOAMS
Bütev, Ezgi
M.S., Department of Metallurgical and Materials Engineering
Supervisor: Prof. Dr. A. Şakir Bor
Co-Supervisor: Assoc. Prof. Dr. Ziya Esen
February 2015, 134 pages
The current study was undertaken to investigate the production and surface processing
of biomedical Ti6Al7Nb alloy foams. Space holder method was utilized to
manufacture foams with varying porosities around 53.0-73.0 vol. % via evaporation
of magnesium from compacted Ti6Al7Nb-Mg powder mixtures. Bioactivities of foam
surfaces were further enhanced by obtaining sodium rich phases using NaOH alkali-
heat treatment method. Moreover, untreated and surface treated foams were tested in
simulated body fluid (SBF) in order to investigate the apatite formation and compare
the bioactivities of the surfaces.
It has been observed that Ti6Al7Nb alloy foams with average pore size of 200 μm can
be considered as suitable materials for biomedical applications due to their mostly
interconnected open porous structures. Quasi-static compression tests showed that
stress-shielding problem may be alleviated by use of foams having porosities in the
range 63.0-73.0 vol. % because of their elastic moduli close to that of bone. The
relation between mechanical properties and macro porosity contents of foams was
observed to obey power law relation in which the proportionality constant and the

vi
exponent reflected the structure and properties of micro porous cell walls and
macropore character of foams.
Heat treatment of foams at 600 oC, subsequent to immersion in 5 M NaOH solution at
60 oC, provided transformation of sodium titanate hydrogel, NaxH2-xTiyO2y+1.nH2O,
layer into more stable sodium titanate, Na2TiyO2y+1, phase. NaOH alkali-heat treated
surfaces allowed hydroxyapatite, Ca10(PO4)6(OH)2, formation in shorter time and
exhibited superior bioactivities during SBF tests.
Keywords: Ti6Al7Nb Alloy Foams, Mechanical Properties, Biomaterials, NaOH-
alkali and Heat Treatment, Simulated Body Fluid

vii
ÖZ
YÜZEY İŞLEMİ GÖRMÜŞ BİYOMEDİKAL Ti6Al7Nb ALAŞIM KÖPÜK
MALZEMELERİNİN ÜRETİMİ VE KARAKTERİZASYONU
Bütev, Ezgi
Yüksek Lisans, Metalurji ve Malzeme Mühendisliği
Tez Yöneticisi: Prof. Dr. A. Şakir Bor
Ortak Tez Yöneticisi: Doç. Dr. Ziya Esen
Şubat 2015, 134 sayfa
Bu çalışma, biyomedikal Ti6Al7Nb alaşım köpüklerinin üretimini ve yüzey
işlemlerini ele almıştır. Preslenmiş Ti6Al7Nb-Mg toz karışımlarından magnezyumun
uçurulmasıyla % 53.0-73.0 arasında değişen gözeneklere sahip köpük malzemelerin
üretimi için boşluk yapıcı yöntem kullanılmıştır. Köpük yüzeylerinin biyoaktivitesi,
NaOH alkali-ısıl işlem yönteminin uygulanıp, sodyumca zengin fazların
oluşturulmasıyla iyileştirilmiştir. Ayrıca, apatit oluşumunu incelemek ve yüzeylerin
biyoaktivitelerini karşılaştırmak için alkali işlem yapılan ve yapılmayan köpük
malzemeler yapay vücut sıvısında (YVS) test edilmişlerdir.
Ortalama 200 µm gözenek boyutuna sahip Ti6Al7Nb alaşım köpüklerinin birbirine
bağlı, çoğunlukla açık gözenekli yapıları sayesinde biyomedikal uygulamalar için
uygun oldukları görülmüştür. Yarı-durağan basma testi, elastik modülü kemiğin
elastik modülüne yakın olan % 63.0-73.0 gözenekli köpüklerin kullanımının “gerilim
perdelemesi” sorununu azaltabileceğini göstermiştir. Üretilen köpüklerin mekanik
özellikleri ile makro gözenek miktarları arasındaki ilişkinin üssel olarak değiştiği
görülmüştür. Denklemdeki üs ve oran katsayıları mikro gözeneklere sahip hücre
viii
duvarlarının yapısı ve özellikleri ile köpüklerin makro gözenek karakterini
yansıtmıştır.
Köpüklerin 5 M NaOH çözeltisinde 60 ⁰C’de bekletilmelerinin ardından 600 ⁰C‘de
uygulanan ısıl işlem, sodyum titanat hidrojel, NaxH2-xTiyO2y+1.nH2O, tabakasının daha
kararlı sodyum titanat, Na2TiyO2y+1, fazına dönüşmesini sağlamıştır. NaOH alkali-ısıl
işlem yönteminin uygulandığı yüzeyler, YVS testleri sırasında daha kısa zamanda
hidroksiapatit, Ca10(PO4)6(OH)2, oluşumuna imkan sağlamış ve daha üstün biyoaktif
özellik göstermiştir.
Anahtar Kelimeler: Ti6Al7Nb Alaşım Köpükleri, Mekanik Özellikler,
Biyomalzemeler, NaOH-alkali ve Isıl İşlem, Yapay Vücut Sıvısı

ix
To my beloved family
x
ACKNOWLEDGEMENTS
My sincere thanks goes to my supervisor Prof. Dr. Şakir Bor for his continuous
encouragement to begin my graduate study. I am indebted to him for leading me to the
field of research and shaping my academic vision and background with his endless
academic experience.
I would like to express my sincere appreciation to my remarkable advisor Assoc. Prof.
Dr. Ziya Esen for his exceptional patience, endless motivation and invaluable support.
His guidance helped me in all the time of my research. I would not have imagined
writing this thesis without his motivation.
I appreciate to my friends Zübeyde Öztürk, Simge Tülbez, Mertcan Başkan, Bensu
Tunca, and Aylin Güneş for their helps, and never ending support. My special thanks
to Erkan Aşık for sharing his valuable knowledge and experience.
I would like to thank Dr. Kaan Pehlivanoğlu for spending his valuable time for
reviewing my thesis and providing feedback. I also appreciate to Dr. Elif Tarhan Bor
for her support and guidance.
I am also grateful to my colleagues at Çankaya University and biomaterials group
members, Elif Eda Yeni and especially Emre Yılmaz who spends great effort to my
work more than me. The achievement of experiments and completion of this study
would not have been possible without their help.
I specially thank to Asutay Meriç, Laçin İncisiz and Nazan Kara for their
understanding, endless support and their lovely friendship.
I am also grateful to my cousin and my sweet heart Pınar Tuğçe Barış for her valuable
support and encouragement. There may be distance, but I know you are not so far.
xi
I would like also to express my deep appreciation to my family; Nazmiye, Ayhan and
Fatih Kağan Bütev who have been patient about my silly and aggressive mood. I am
so lucky to have such a great family.
Finally, I owe my deepest and warmhearted thanks to Arda Öcal who gives me strength
and endures me and my caprices throughout the entire period of the study. I am also
thankful for his everlasting support, guidance and love. I will always indebted to him.
This thesis study has been financially supported by TÜBİTAK through the project
112M341.
xii
TABLE OF CONTENTS
ABSTRACT ................................................................................................................. v
ÖZ ............................................................................................................................... vii
ACKNOWLEDGEMENTS ......................................................................................... x
TABLE OF CONTENTS ........................................................................................... xii
LIST OF TABLES ..................................................................................................... xv
LIST OF FIGURES .................................................................................................. xvii
CHAPTERS
1. INTRODUCTION ............................................................................................ 1
2. THEORETICAL BACKGROUND .................................................................. 5
2.1 Titanium and Its Alloys ........................................................................... 5
2.1.1 Titanium as Biomaterial ............................................................... 8
2.2 Solid Metal Foams ................................................................................ 16
2.2.1 Cellular Solids ............................................................................ 16
2.3 Production of Metallic Foams ............................................................... 18
2.3.1 Liquid State Processing .............................................................. 18
2.3.2 Solid State Processing ................................................................. 18
2.3.2.1 Space Holder Method ....................................................... 21
2.4 Mechanical Behavior of Porous Metals ................................................ 24
2.5 Surface Modification of Titanium and Titanium Alloys ....................... 28
2.5.1 Mechanical Methods ................................................................... 30
2.5.2 Physical Methods ........................................................................ 31
2.5.3 Chemical Methods ...................................................................... 32
2.5.3.1 Chemical Vapor Deposition (CVD) ................................. 32
xiii
2.5.3.2 Sol-gel Method ................................................................. 33
2.5.3.3 Anodic Oxidation ............................................................. 33
2.5.3.4 Biochemical Method ........................................................ 33
2.5.3.5 Chemical Treatment ......................................................... 34
2.5.3.5.1 Acid Etching and Hydrogen Peroxide (H2O2) Treatment ......... 34
2.5.3.5.2 Alkali Treatment ....................................................................... 35
2.6 Structure of Bone and in vitro Studies .................................................. 40
3. EXPERIMENTAL PROCEDURE ................................................................. 49
3.1 Raw Materials ....................................................................................... 49
3.1.1 Powders ...................................................................................... 49
3.1.2 Bulk Ti6Al7Nb Alloy ................................................................. 51
3.2 Production of Ti6Al7Nb Alloy Foams .................................................. 52
3.3 Surface Processing ................................................................................ 53
3.3.1 Surface Activation of Bulk Ti6Al7Nb Alloy ............................. 54
3.3.2 Surface Activation of Porous Ti6Al7Nb Alloy .......................... 55
3.4 In vitro Studies ...................................................................................... 56
3.5 Characterization .................................................................................... 59
3.5. Particle Size .................................................................................. 59
3.5.2 Chemical Composition Analysis ................................................ 60
3.5. O, H, N, C Contents ..................................................................... 60
3.5.4 X-ray Photoelectron Spectroscopy (XPS) .................................. 60
3.5.5 Structural Analysis by X-ray Diffraction Analysis (XRD) ........ 60
3.5.6 Microstructural Analysis ............................................................ 61
3.5.7 Atomic Force microscopy (AFM) .............................................. 61
3.5.8 Density Measurement ................................................................. 62
xiv
3.5.9 Mechanical Characterization ...................................................... 63
4. RESULTS ....................................................................................................... 65
4.1 Production of Ti6Al7Nb Alloy Foams .................................................. 66
4.1.1 Chemical Composition and Microstructure ................................ 66
4.1.2 Compression Behavior of Foam Samples ................................... 74
4.2 Surface Modifications ........................................................................... 80
4.2.1 Preliminary Surface Studies Using Bulk Ti6Al7Nb Alloys ....... 81
4.2.1.1 Starting Bulk Ti6Al7Nb Alloy ......................................... 81
4.2.1.2 Effect of NaOH Solution Concentration and Post Heat
Treatment Temperature ................................................................ 85
4.2.1.3 Effect of NaOH Solution Temperature ............................ 91
4.2.1.4 Characterization of Bulk Alloys Treated by Optimized
Parameters .................................................................................... 96
4.2.2 Surface Activation of Porous Ti6Al7Nb Alloy ........................ 100
4.2.2.1 Surface Structure and Chemical Composition ............... 101
4.2.2.2 Mechanical Properties of Coating Layer and Surface
Processed Ti6Al7Nb Foams....................................................... 108
4.3 In vitro Studies with SBF .................................................................... 111
5. CONCLUSION ............................................................................................. 121
REFERENCES ......................................................................................................... 125

xv
LIST OF TABLES
TABLES
Table 2.1 Application areas of most common titanium alloys [8]. .............................. 8
Table 2.2 Mechanical behavior of titanium and its alloys [9]. .................................. 12
Table 2.3 Classification of biomaterials according to their response in body
environment [9]. ......................................................................................................... 13
Table 2.4 Approximate composition of biological apatite compared with synthetic
HAp [101]. ................................................................................................................. 42
Table 2.5 Ion concentration of various SBFs compared to that of human blood plasma
[101,102]. ................................................................................................................... 44
Table 2.6 Characterization methods for apatite phase. .............................................. 47
Figure 3.1 Particle size distribution of (a) Ti6Al7Nb alloy and (b) Mg powders. ..... 50
Figure 3.2 SEM images of (a) spherical Ti6Al7Nb alloy powders and (b) spherical Mg
powders. ..................................................................................................................... 50
Figure 3.3 SEM images showing the microstructure of (a) as-received and (b) furnace
cooled bulk Ti6Al7Nb alloy. ..................................................................................... 51
Figure 3.4 PARR 5500 high temperature and pressure vessel with stirrer. ............... 54
Table 4.1 Porosity changes of Ti6Al7Nb foams with addition of different magnesium
contents. ..................................................................................................................... 69
Table 4.2 EDX results of α and β phases in as-manufactured foams. ....................... 70
Table 4.3 O, H, N and C contents of as-received powders and as-manufactured
Ti6Al7Nb alloy foams................................................................................................ 74
Table 4.4 Mechanical properties of bone and Ti6Al7Nb samples in different forms.
.................................................................................................................................... 77
Table 4.5 Binding energy values of heat treated starting bulk Ti6Al7Nb alloy surfaces.
.................................................................................................................................... 85
xvi
Table 4.6 EDX results of set A and B samples. ......................................................... 89
Table 4.7 EDX analysis of A4 and C1 samples. ........................................................ 93
Table 4.8 EDX results of bulk Ti6Al7Nb samples. ................................................... 97
Table 4.9 XPS analysis results showing the elemental compositions of bulk Ti6Al7Nb
surfaces. ...................................................................................................................... 99
Table 4.10 EDX results of porous Ti6Al7Nb surfaces before and after various
treatments. ................................................................................................................ 102
Table 4.11 XPS analysis results showing the elemental compositions of porous
Ti6Al7Nb surfaces. .................................................................................................. 104
Table 4.12 Binding energy values of untreated and treated porous samples. .......... 107
Table 4.13 Mechanical properties of untreated and treated Ti6Al7Nb foams. ........ 110
Table 4.14 Concentration of Ca and P (at.%) of porous Ti6Al7Nb surface immersed
in SBF for 1, 5 and 15 days, obtained from EDX analysis. A: untreated sample, B:
NaOH treated sample, C: NaOH-heat treated sample .............................................. 114
Table 4.15 Binding energy values of porous sample surface after immersion in SBF
for 15 days ................................................................................................................ 119
xvii
LIST OF FIGURES
FIGURES
Figure 2.1 The crystal structure of titanium (a) hcp α phase and (b) bcc β phase [3].. 6
Figure 2.2 Schematic representation of the effect of alloying elements on phase
diagrams of titanium alloys [5]. ................................................................................... 7
Figure 2.3 Titanium and its alloys used in various biomedical applications; (a) dental
implants, (b) hip joint replacement, (c) bone screws and plate and (d) artificial vascular
stents [7,9]. ................................................................................................................... 9
Figure 2.4 Schematic representation of (a) stress shielding and (b) stress shielding zone
at hip joint replacement [11]. ..................................................................................... 10
Figure 2.5 Elastic modulus of metallic biomaterials [9]. ........................................... 11
Figure 2.6 Flowchart of the interaction between living tissue and implant surface
within different time intervals [9]. ............................................................................. 15
Figure 2.7 Three dimensional metallic foams with (a) closed and (b) open cell structure
[35]. ............................................................................................................................ 16
Figure 2.8 Porous metallic materials used in various biomedical application areas; (a)
trabecular metal dental implant, (b) fusion device, (c) continuum acetabular system
and (d) trabecular metal glenoid fixation [37]. .......................................................... 17
Figure 2.9 Various production methods for porous titanium; (a) gas entrapment
technique, (b) hollow sphere sintering, (c) replication method and (d) loose powder
sintering [38]. ............................................................................................................. 20
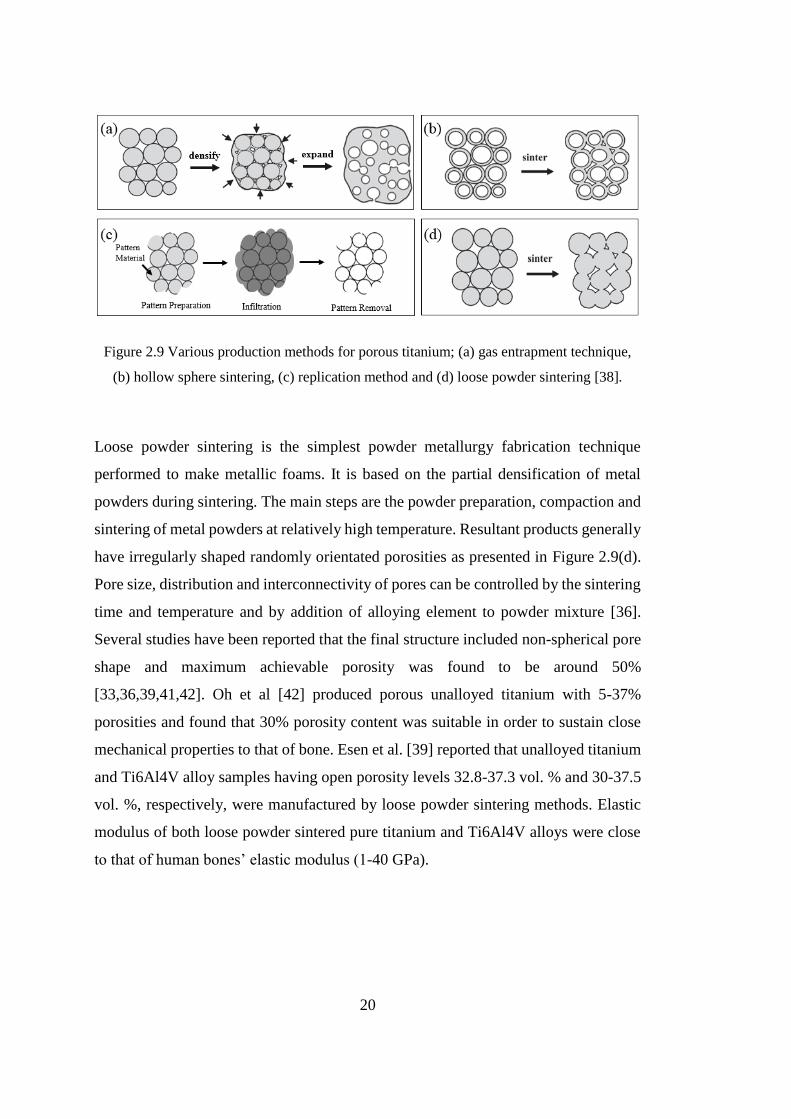
Figure 2.10 Schematic representation of space holder method.................................. 21
Figure 2.11 Ti-Mg phase diagram showing limited low temperature solid solubility of
magnesium in titanium [46]. ...................................................................................... 23
Figure 2.12 Typical stress-strain diagrams of metallic foams under compressive load
[34]. ............................................................................................................................ 24
xviii
Figure 2.13 Stress-strain diagram of bulk furnace cooled Ti6Al4V and Ti6Al4V foam
having different porosity content [48]. ....................................................................... 25
Figure 2.14 Relative elastic modulus change of porous Ti-18Nb-4Sn alloy with relative
density (ρ/ρs) [51]. ...................................................................................................... 27
Figure 2.15 Yield strength change with macro porosity fraction [48]. ...................... 28
Figure 2.16 Classification of surface modification techniques for titanium and titanium
alloys. ......................................................................................................................... 30
Figure 2.17 Schematic representation of surface structural change of Ti metal during
alkali and heat treatments [82]. .................................................................................. 36
Figure 2.18 Illustration of change in layered crystal structures of (a) Na2Ti3O7. H2O,
(b) Na1.5H0.5 Ti3O7 and (c) Na2Ti6O13 phases [83]. .................................................... 37
Figure 2.19 Crystal structure of sodium titanate, Na2TiyO2y+1 [84]. .......................... 37
Figure 2.20 Cross section of sodium titanate layer formed on titanium metal surface
exposed to NaOH-alkali and subsequent heat treatment process [86]. ...................... 38
Figure 2.21 SEM images of sodium titanate phase formed on (a) pure titanium
subjected to 10 M NaOH at 60 °C for 24 h, (b) pure titanium and (c) porous Ti-Nb-Zr
scaffolds subjected to 5 M NaOH at 60 °C for 24 h and [91,94,99]. ......................... 39
Figure 2.22 The structure of typical bone at various length scales [100]. ................. 41
Figure 2.23 Various HAp nanostructures with modulated shapes (a) irregular,
formless, sphere, (b) sphere, microsphere, nanosphere, ball, (c) rod, needle, tube,
filament, fiber, wire, whisker, prism, worm, hexagonal prism, platelet, lath, strip, (d)
plate, flake, sheet, (e) self-assembled nanorods, bundles of nanorods, oriented bundle,
oriented raft, enamel prism-like structures, clusters of nanotubes, oriented array of
bundled needles, packed nanorods, (f) dandelion, chrysanthemum, flower, feathery
structure, bundle of fibers, selfassembled nanorods, rosette, (g) leaf, flake, sheet, plate,
(h) flower, (i) porous microsphere, mesoporous sphere, (j) bowknot, self-assembled
nanorods, and (k) dumbbell [100]. ............................................................................. 43
Figure 2.24 SEM images of NaOH and heat treated titanium (a) surface and (b) cross
section after immersion in SBF for 1 day [103]. ........................................................ 45
xix
Figure 2.25 Morphology of apatite formed from SBF on various silicon based surfaces,
(a) 45S5bioglass, (b) borate glass, (c) CaSiO3 and (d) borate glass (cross section)
[101]. .......................................................................................................................... 46
Figure 3.1 Particle size distribution of (a) Ti6Al7Nb alloy and (b) Mg powders. ..... 50
Figure 3.2 SEM images of (a) spherical Ti6Al7Nb alloy powders and (b) spherical Mg
powders. ..................................................................................................................... 50
Figure 3.3 SEM images showing the microstructure of (a) as-received and (b) furnace
cooled bulk Ti6Al7Nb alloy. ..................................................................................... 51
Figure 3.4 PARR 5500 high temperature and pressure vessel with stirrer. ............... 54
Figure 4.1 As-manufactured Ti6Al7Nb foams having 73.0 vol. % porosity content (a)
front view and (b) top view. ....................................................................................... 66
Figure 4.2 SEM images of as-manufactured Ti6Al7Nb foams showing (a) open macro
porous structure at fracture surface, (b) macropores, (c) cell walls containing sintered
powders with some micropores and (d) underlying microstructure of foams containing
lamellar microstructure with α and β phases. ............................................................. 67
Figure 4.3 The change of total, macro and micro porosity content of as-manufactured
Ti6Al7Nb foams with the magnesium powder content. ............................................ 68
Figure 4.4 Ti6Al7Nb alloy foams with the total porosities of (a) 53.0%, (b) 63.0% and
(c) 73.0%. ................................................................................................................... 69
Figure 4.5 XRD diffractograms of (a) as-received Ti6Al7Nb powders and (b) as-
manufactured Ti6Al7Nb alloy foams......................................................................... 71
Figure 4.6 Ellingham diagram showing the relative stabilities of MgO and TiO2 at
sintering temperature, 1200 ⁰C. ................................................................................. 72
Figure 4.7 XPS survey spectrum of as-manufactured Ti6Al7Nb foams. .................. 72
Figure 4.8 Stress-strain curves of Ti6Al7Nb foams with total porosities of 53.0%,
63.0% and 73.0% compared with sintered and bulk Ti6Al7Nb alloy. ...................... 75
Figure 4.9 Ti6Al7Nb alloy samples after compression tests; (a) bulk alloy, (b) sintered
alloy and foams with the total porosities of (c) 53.0%, (d) 63.0% and (e) 73.0%. .... 76
xx
Figure 4.10 Mechanical property change with macro porosity fraction; (a) yield
strength, σy and (b) elastic modulus, E. ...................................................................... 79
Figure 4.11 SEM image showing the microstructure of as-received bulk Ti6Al7Nb
samples. ...................................................................................................................... 81
Figure 4.12 EDX results of as-received bulk Ti6Al7Nb consisting of (a) primary α
(region A) and (b) lamellar α+β (region B). ............................................................... 81
Figure 4.13 Isotherm drawn at 1100 °C, Ti-Al-Nb ternary system [108]. ................. 82
Figure 4.14 SEM images of furnace cooled Ti6Al7Nb bulk alloy showing the lamellar
microstructure consisting of α-platelets and β-laths................................................... 83
Figure 4.15 EDX results of furnace cooled Ti6Al7Nb alloy consists of (a) α phase and
(b) β phase. ................................................................................................................. 83
Figure 4.16 Furnace cooled starting bulk Ti6Al7Nb alloy (a) SEM image, (b) AFM
3D microtopography. ................................................................................................. 84
Figure 4.17 XPS spectra of (a) Ti2p and (b) O1s for untreated bulk Ti6Al7Nb alloy
surfaces. ...................................................................................................................... 85
Figure 4.18 SEM images of bulk Ti6Al7Nb surfaces of set A (A1) alkali treated with
5 M NaOH at 60 °C then, (A2) heat treated at 500 °C, (A3) 600 °C and (A4) 700 °C,
and set B specimens; (B1) alkali treated with 10 M NaOH at 60 °C then, (B2) heat
treated at 500 °C, (B3) 600 °C and (B4) 700 °C. ....................................................... 87
Figure 4.19 TF-XRD patterns of (a) untreated Ti6Al7Nb alloy surface and set A
samples’ surfaces; (b) alkali treated with 5 M NaOH at 60 °C, and then heat treated at
(c) 500 °C, (d) 600 °C and (e)700 °C for 1 h in air. ................................................... 90
Figure 4.20 Enlarged TF-XRD patterns of set A samples’ surface treated with (a) 5 M
NaOH treatment at 60 °C (A1) , (b) 5 M NaOH treatment at 60 °C and heat treated at
600 °C (A3). ............................................................................................................... 91
Figure 4.21 SEM images of bulk Ti6Al7Nb surfaces of set A (A4) alkali treated with
5 M NaOH at 60 °C then heat treated at 700 °C, and set C specimens; (C1) alkali
treated with 5 M NaOH at 100 °C then heat treated at 700 °C. ................................. 92
Figure 4.22 TF-XRD results of bulk Ti6Al7Nb surfaces of set C (C1) alkali treated
with 5 M NaOH at 100 °C then heat treated at 700 °C. ............................................. 93
xxi
Figure 4.23 Schematic representation of surface structural change of Ti metal during
alkali and heat treatments [103]. ................................................................................ 94
Figure 4.24 Surface structure of bulk Ti6Al7Nb surface; (a) 5 M NaOH-treated at 60
°C, 24 h then (b) heat treated at 600 °C, 1 h. ............................................................. 96
Figure 4.25 XPS survey spectra of bulk Ti6Al7Nb (a) untreated, (b) NaOH and (c)
NaOH-heat treated. .................................................................................................... 98
Figure 4.26 XPS depth profile analysis result of bulk Ti6Al7Nb (a) untreated, (b)
NaOH and (c) NaOH-heat treated. ........................................................................... 100
Figure 4.27 SEM images of Ti6Al7Nb foams’ surfaces at x25.000 and x100.000
magnifications. ......................................................................................................... 102
Figure 4.28 XPS survey spectra of porous Ti6Al7Nb (a) untreated, (b) NaOH, and (c)
NaOH-heat treated. .................................................................................................. 104
Figure 4.29 XPS spectra for as-manufactured porous Ti6Al7Nb samples (a) Mg2p, (b)
Ti2p, and (c) O1s...................................................................................................... 105
Figure 4.30 XPS spectra of (a) Na1s, (b) O1s and (c) Ti2p for untreated and treated
porous surfaces. ........................................................................................................ 106
Figure 4.31 TF-XRD results of Ti6Al7Nb samples; (a) untreated, (b) NaOH-treated,
and (c) NaOH and subsequent heat treated at 600 °C. ............................................. 107
Figure 4.32 SEM photograph of fracture surface showing the mechanically stable
sodium titanate coating layer (region B) formed on porous Ti6Al7Nb substrates
(region A) as a result of NaOH and subsequent heat treatment in air at 600 °C. .... 109
Figure 4.33 Stress-strain curves of Ti6Al7Nb foams; curve (a) untreated, (b) NaOH
and (c) NaOH-heat treated. ...................................................................................... 110
Figure 4.34 SEM images of different sets of porous Ti6Al7Nb samples immersed in
SBF for 0, 1,5 and 15 days. A: untreated sample, B: NaOH treated sample, C: NaOH-
heat treated sample ................................................................................................... 113
Figure 4.35 Change in Ca/P (at. %) ratio of untreated and treated foams with 1, 5 and
15 days of immersion in SBF. .................................................................................. 115
Figure 4.36 Schematic illustration of the apatite formation mechanism on the surface
of NaOH- and heat-treated titanium in SBF [103]. .................................................. 115
xxii
Figure 4.37 SEM and EDX results showing morphology and chemical composition of
apatite deposited after immersion of porous Ti6Al7Nb samples in SBF for 15 days.
.................................................................................................................................. 116
Figure 4.38 XRD patterns of porous samples after immersion in SBF for 15 days; (A)
untreated, (B) NaOH treated, and (C) NaOH and subsequent heat treated at 600 °C.
.................................................................................................................................. 117
Figure 4.39 XPS spectra of (a) Ca2p, (b) P2p, and (c) O1s for untreated and treated
porous surface after immersion in SBF for 15 days ................................................. 118
1
CHAPTER 1
INTRODUCTION
1. INTRODUCTION
In several application fields, there has been a growing interest in using titanium and
its alloys instead of traditional metallic materials due to their outstanding properties.
Their relatively low densities, easy formabilities, low creep rates and withstanding
high temperatures enable frequent usage of them in aerospace applications such as fan-
jet engines, sandwich cores, fan disc and blades. Also, great corrosion resistance of
titanium makes it desirable in marine and offshore structures. Besides these practices,
titanium and its alloys are also utilized in the biomedical applications. When
considering the great combinations of excellent corrosion resistance, mechanical
properties and superior biocompatibilities, it is not surprising that titanium has been
used as a first choice of metallic material for biomedical applications.
However, it is concluded in previous studies that elastic moduli differences between
implant material and bone may cause failure in load transmission for prolonged usage
under repetitive loading. Therefore, the inconsistency in elastic moduli values, which
leads to ‘’stress-shielding problem’’, finally causes bone resorption and implant
loosening at the end. A suggestion to overcome this drawback could be the
introduction of pores to the dense structure. In this regard, open cell metal foams offer
a number of advantages over fully dense bulk materials such that comparatively lower
elastic moduli enables to balance the mechanical stability between bone and implant
materials and as a result the stress shielding problem may be eliminated or alleviated.
Accordingly, metallic porous materials, especially titanium foams, can yield desired
mechanical properties as well as providing suitable place for bone growth. Therefore,
2
majority of researches has been focused on the manufacturing of metallic foams due
to aforementioned reasons. Liquid state and solid state processing are the two basic
approaches currently performed to produce metallic foams. In liquid state sintering,
desired porous structure is generally produced by melting process through the use of
metals having low melting temperature like Al, Zn and Mg instead of Ti whose melting
temperature is relatively high. Because of that, titanium foams can be produced by
means of space holder method which is one of the most convenient and practical solid
state processing methods and enables close control of porosities in addition to the
mechanical properties without excessive oxidation.
The space holder method allows direct fabrication of porous structure with relatively
homogenous, interconnected high level of porosity through the evaporation of spacer
particles. Additionally, it enables great control over pore size, its distribution and
porosity content, which is ensured by selecting the right spacer because morphology
and structure of the pores primarily depend on the size, amount and shape of the
starting spacers. Carbamide (urea), ammonium hydrogen carbonate, polymeric
granules and metallic powders like magnesium are the spacers which are employed in
current practices and removed from the system by evaporation during heating.
Although the interconnected porous structure presented in titanium foams alleviates
the biomechanical incompatibility, the major concern is the inadequate bonding ability
of the surfaces, which is called insufficient osseointegration. In order to achieve both
physical and chemical attachment of bone tissues to porous surfaces, surface chemical
composition and structural properties of foams should be adjusted by additional
surface modifications to improve bioactivities of surfaces. Because of that, surface
processing has been gaining importance for improvement of structural and functional
properties of implant materials. Additionally, the surface chemical composition of
titanium becomes the subject of debate due to the possibility of releasing some
elements from Ti-based alloy to the human body fluid. Alloying elements like
vanadium and aluminum are thought to be the potential toxic elements which may
cause allergic and adverse reactions in human body. Therefore, newly improved Ti-
3
based alloys such as Ti6Al7Nb containing toxic-free elements like Nb have been
preferred as biocompatible alternatives.
On the other hand, various surface modification methods namely; physical, mechanical
and chemical treatments have been introduced to create a surface layer, which improve
osseointegration or the bone tissue attachment on the porous titanium surfaces.
However, either mechanical treatments that provide highly rough surfaces or physical
methods requiring expensive and complex equipment are not frequently used in
surface activation of porous titanium alloys due to their complex geometries. Probably,
the most promising technique is the chemical treatment used to form a homogenous
bioactive layer on porous titanium.
Chemical treatments can be divided into four main subgroups; acid, hydrogen peroxide
(H2O2), sol-gel and alkali treatments. Because of providing a number of advantages
such as applicability to structure having complex geometry, i.e. porous structure,
simplicity and easy to control the process parameters, alkali treatment is mostly used
to obtain homogenous and uniform coating on porous titanium surfaces. The method
includes two interrelated major stages. Firstly, porous titanium substrates are
immersed in NaOH-alkali solution having various concentrations (2-10 M) at various
temperatures (60-100 °C) to obtain bioactive titanate layer called sodium titanate
hydrogel (NaxH2-xTiyO2y+1.nH2O). Secondly, subsequent heat treatment is performed
to get mechanically stable crystalline bioactive titanate (Na2TiyO2y+1) layer at different
temperatures (500-800 °C) and environments (in air, argon or vacuum). After alkali
and heat treatment, bioactivities or osseointegration properties of porous titanium are
enhanced by the formation of bioactive sodium titanate phase which allows
hydroxyapatite precipitation in the body environment.
Although extensive research has been carried out on the formation of bioactive titanate
layer on titanium and its alloy surfaces, no detailed study exists which adequately
covers the production and characterization of surface activated porous Ti6Al7Nb
alloys.
4
In this regard, the present study searches remedies for the mentioned problems,
namely, stress shielding and insufficient osseointegration encountered in Ti6Al7Nb
alloys by production of highly porous Ti6Al7Nb alloys using magnesium powder and
by applying NaOH-alkali and subsequent heat treatment, respectively. Accordingly,
the resultant bioactive surfaces are believed to integrate and form biologically stable
bond with living bone. Therefore, the bioactivities of untreated and surface treated
porous samples are predicted through the use of in vitro tests by checking the ‘‘apatite-
forming ability” (AFA) – that is, the occurrence sooner or later of an apatitic layer on
the implant by immersing in simulated body fluid (SBF) with ion concentrations nearly
equal to those of human blood plasma.
This thesis consists of five main chapters that give information about the topics
covered in the study. Chapter 2 is subdivided into various parts to present a detailed
background about the main components of the study. First of all, properties of titanium
and its alloys and the requirements for biomaterials are being explained. Then,
production methods of porous materials and their mechanical responses under
compressive loading are discussed in addition to properties of cellular metallic foams
and their application areas. Apart from these, various surface modification techniques
and structure of bone together with in vitro studies are also presented in Chapter 2. In
Chapter 3, properties of materials used in the current study, details of space holder
method utilized in production of Ti6Al7Nb alloy foams, application of NaOH alkali
and subsequent heat treatment process and in vitro studies are explained in detail.
Additionally, this chapter also includes the characterization techniques utilized in the
current study. Chapter 4 assesses the experimental results which include structure and
mechanical behavior of foams, the preliminary studies about surface processing of
bulk samples and application of alkali treatment to porous Ti6Al7Nb samples using
optimized processing variables derived from preliminary studies. Moreover, results
and discussions of in vitro studies which make use of SBF have been presented in this
chapter. Finally, conclusions together with the future works are given in Chapter 5.
5
CHAPTER 2
THEORETICAL BACKGROUND
2. THEORETICAL BACKGROUND
2.1 Titanium and Its Alloys
Titanium is a transition element having atomic number and atomic weight 22 and 47.9
g/mol, respectively. It was first discovered by William Gregor in 1791 and
rediscovered in the form of rutile ore by Martin Heinrich Klaproth and entitled as
Titans of Greek mythology. Although the production method of titanium called Kroll’s
process is an expensive method and requires great effort and complex equipment, its
usage has been widely increased recently due to its unique properties; light weight,
high biocompatibility, relatively high specific strength and most importantly high
corrosion resistance owing to formation of stable oxide layer on the surface [1].
Titanium exists in two different crystallographic forms, namely, hexagonal closed
packed (hcp) α-phase, stable at room temperature and body centered cubic (bcc) β-
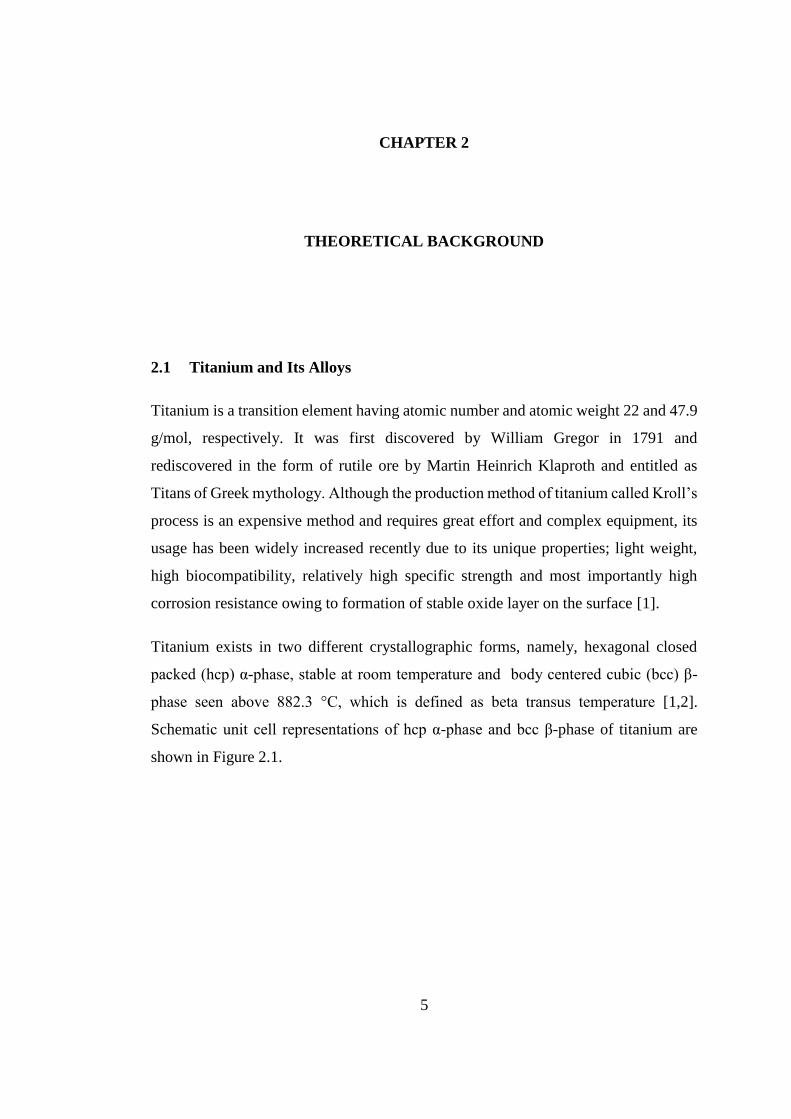
phase seen above 882.3 °C, which is defined as beta transus temperature [1,2].
Schematic unit cell representations of hcp α-phase and bcc β-phase of titanium are
shown in Figure 2.1.
6
(a) (b)
Figure 2.1 The crystal structure of titanium (a) hcp α phase and (b) bcc β phase [3].
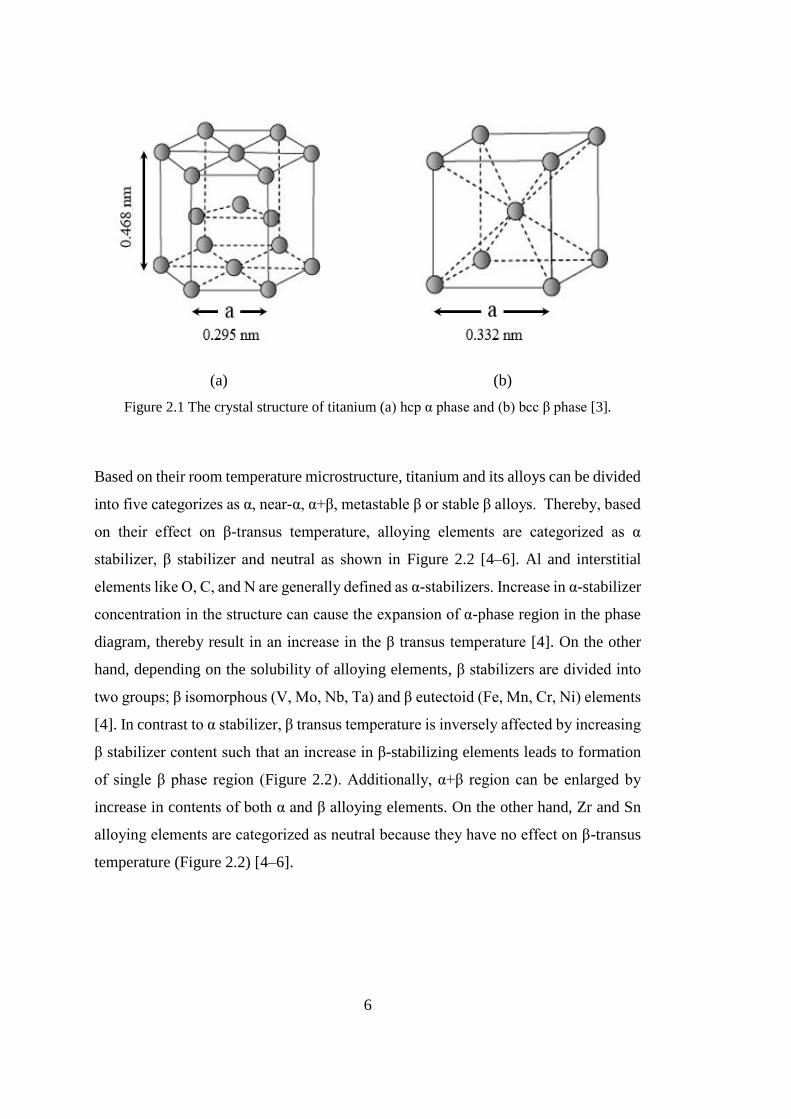
Based on their room temperature microstructure, titanium and its alloys can be divided
into five categorizes as α, near-α, α+β, metastable β or stable β alloys. Thereby, based
on their effect on β-transus temperature, alloying elements are categorized as α
stabilizer, β stabilizer and neutral as shown in Figure 2.2 [4–6]. Al and interstitial
elements like O, C, and N are generally defined as α-stabilizers. Increase in α-stabilizer
concentration in the structure can cause the expansion of α-phase region in the phase
diagram, thereby result in an increase in the β transus temperature [4]. On the other
hand, depending on the solubility of alloying elements, β stabilizers are divided into
two groups; β isomorphous (V, Mo, Nb, Ta) and β eutectoid (Fe, Mn, Cr, Ni) elements
[4]. In contrast to α stabilizer, β transus temperature is inversely affected by increasing
β stabilizer content such that an increase in β-stabilizing elements leads to formation
of single β phase region (Figure 2.2). Additionally, α+β region can be enlarged by
increase in contents of both α and β alloying elements. On the other hand, Zr and Sn
alloying elements are categorized as neutral because they have no effect on β-transus
temperature (Figure 2.2) [4–6].
7
Figure 2.2 Schematic representation of the effect of alloying elements on phase diagrams of
titanium alloys [5].
Besides, mechanical properties of titanium and its alloys mainly depend on their
composition and the relative amount of α and β phases in the microstructure [6]. For
example, α-titanium containing alpha stabilizers (Al, O) exhibits good creep resistance
at elevated temperatures. However, the major limitation of α-alloys is their non-heat
treatable nature so that mechanical properties cannot be easily controlled. On the other
hand, β-titanium can easily be deformed even at lower temperatures due to its bcc
structure [1,2,7]. In contrast to α-alloys, properties of α+β alloys can be adjusted easily
so that great combination of desired properties such as high tensile strength and
fracture toughness can be obtained [2]. Ti5Al2.5Fe, Ti6Al4V and Ti6Al7Nb alloys are
most frequently used well-known α+β titanium alloys. [1,3]. Common application
areas of titanium alloys having various microstructures are listed in Table 2.1.
.

8
Table 2.1 Application areas of most common titanium alloys [8].
Material Microstructure Application areas
pure Ti α Airframes, heat exchangers, surgical implants,
marine
Ti-6Al-4V α+β
Aircraft turbines, pressure vessels, gas and
chemical pumps, steam turbine blades,
biomedical applications
Ti-6Al-7Nb α+β Biomedical applications
Ti-5Al-2.5Fe α+β Heavy airframe structural components
Ti-5Al-3Mo-4Zr α+β Component for advanced jet engines
Ti-13Nb-13Zr near β Orthopedic implants
Ti-15 Mo β Corrosion resistance required field, marine,
medium temperature, high strength forging Ti-15 Mo-5Zr-3Al β
2.1.1 Titanium as Biomaterial
Recent developments in the field of biomedical applications have led to frequent use
of titanium and titanium alloys because of their unique combination of properties like
high biocompatibility, high corrosion and wear resistance as well as the mechanical
properties similar to that of bone [4]. The biomedical applications of titanium and its
alloys include dental implants and parts for orthodontic surgery, joint replacement
parts, screw-shaped bone fixation devices, artificial vascular stents, surgical
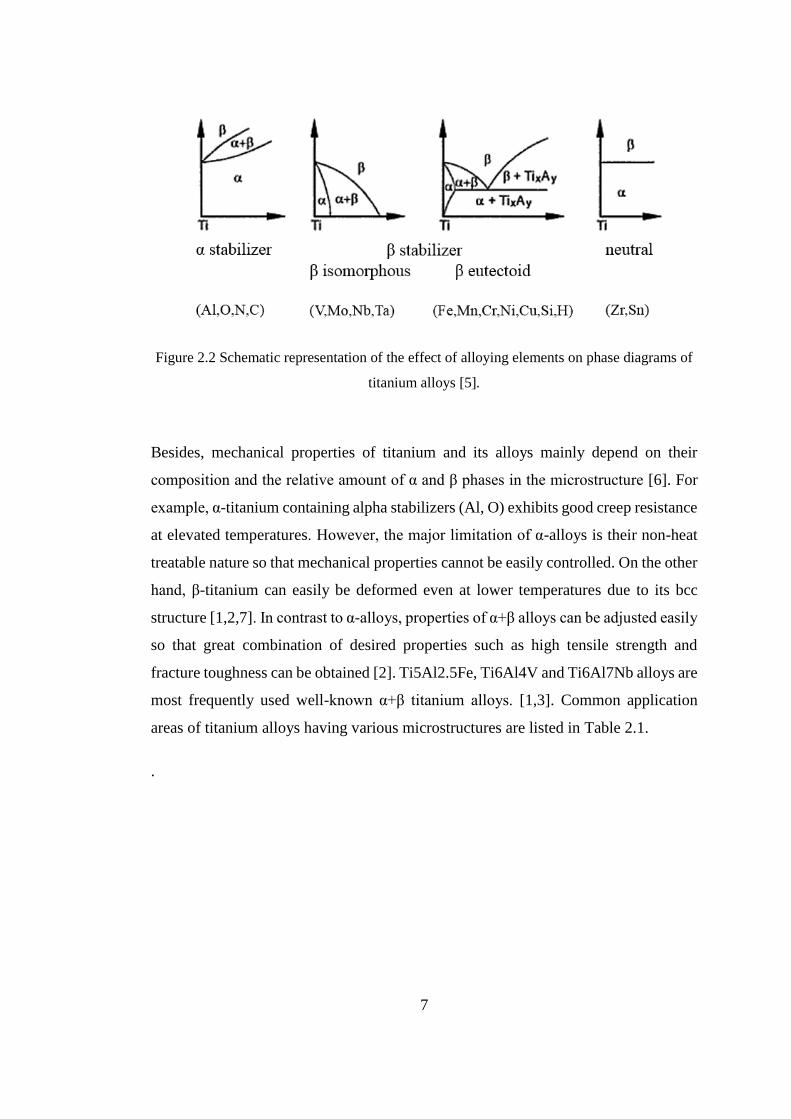
instruments and components in high-speed blood centrifuges, Figure 2.3.
9
(a) (b) (c) (d)
Figure 2.3 Titanium and its alloys used in various biomedical applications; (a) dental
implants, (b) hip joint replacement, (c) bone screws and plate and (d) artificial vascular
stents [7,9].
An implant material including titanium should possess the following attributes in order
to serve for longer period in the body without rejection:
- Mechanical properties similar to bone,
- High biocompatibility,
- High corrosion and wear resistance,
- Satisfactory osseointegration.
Mechanical properties
Among the biomaterials, ceramics and polymers are the first choice materials due to
their high biocompatibility properties. Ceramics; however, have low fracture
toughness so that they are not suitable for load bearing or repeated cyclic loading
applications. Meanwhile, polymers have insufficient strength and cannot withstand to
high loads despite their low densities. Consequently, usage of ceramic and polymeric
materials in load bearing applications is not preferred due to their insufficient
mechanical properties [8,10].
Although metallic materials possess greater mechanical strength under load bearing
applications, they suffer from elastic modulus mismatch problem which is called as
biomechanical incompatibility. The entire mechanical load is carried by the bone alone
10
before implantation but the problem arises when the implant material is placed in dense
skeleton structure and carries most of the load in the body. In order to get uniform
distribution of stresses at bone implant interface, a successful implant should possess
close elastic modulus to that of bone (1-40 GPa). However, when bone’s stiffness is
lower than the implant material as schematically shown in Figure 2.4(a), stress cannot
be delivered directly to the bone and stress concentration occurs around implant
material, Figure 2.4(b), since most of the load is carried by implant. In further stages,
it can lead to bone resorption and implant loosening which is known as stress shielding.
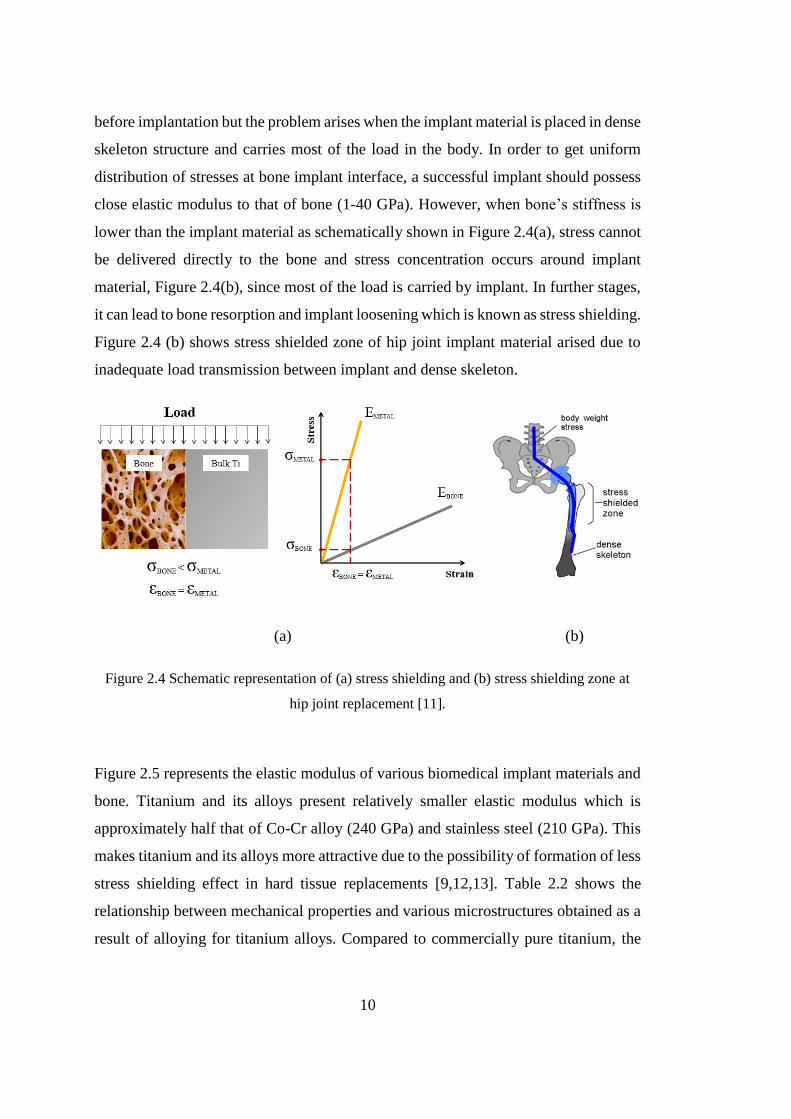
Figure 2.4 (b) shows stress shielded zone of hip joint implant material arised due to
inadequate load transmission between implant and dense skeleton.
(a) (b)
Figure 2.4 Schematic representation of (a) stress shielding and (b) stress shielding zone at
hip joint replacement [11].
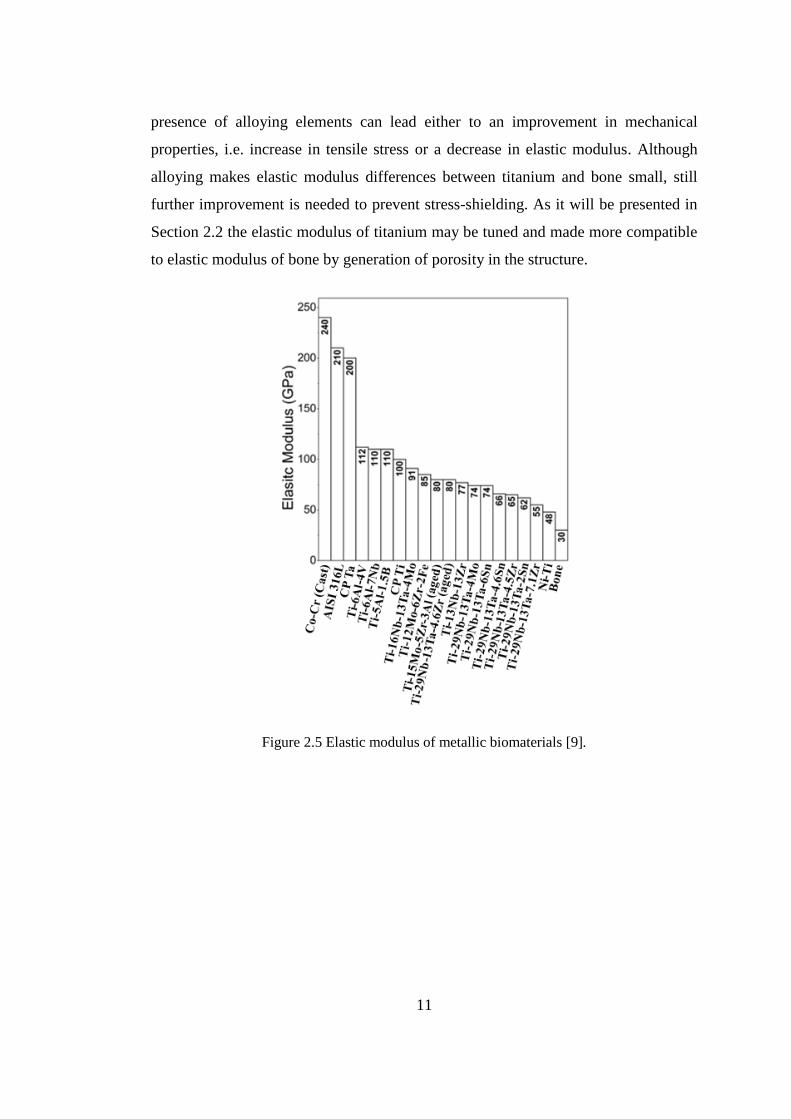
Figure 2.5 represents the elastic modulus of various biomedical implant materials and
bone. Titanium and its alloys present relatively smaller elastic modulus which is
approximately half that of Co-Cr alloy (240 GPa) and stainless steel (210 GPa). This
makes titanium and its alloys more attractive due to the possibility of formation of less
stress shielding effect in hard tissue replacements [9,12,13]. Table 2.2 shows the
relationship between mechanical properties and various microstructures obtained as a
result of alloying for titanium alloys. Compared to commercially pure titanium, the
11
presence of alloying elements can lead either to an improvement in mechanical
properties, i.e. increase in tensile stress or a decrease in elastic modulus. Although
alloying makes elastic modulus differences between titanium and bone small, still
further improvement is needed to prevent stress-shielding. As it will be presented in
Section 2.2 the elastic modulus of titanium may be tuned and made more compatible
to elastic modulus of bone by generation of porosity in the structure.
Figure 2.5 Elastic modulus of metallic biomaterials [9].
12
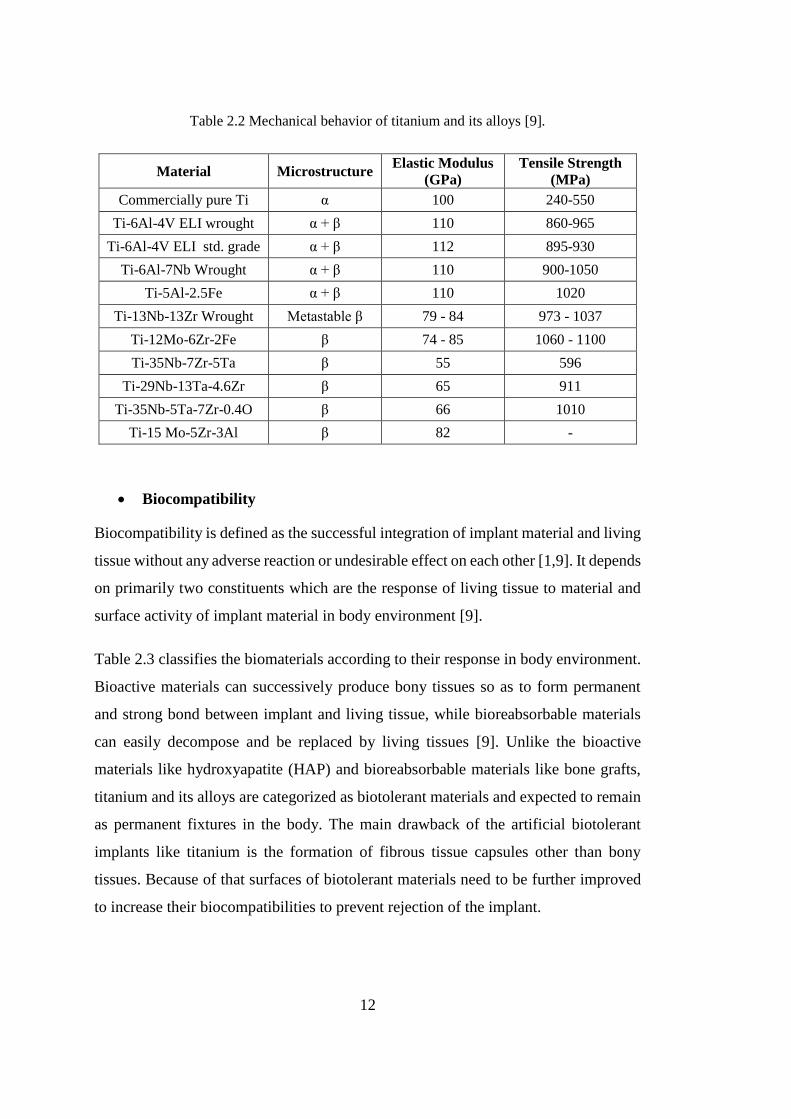
Table 2.2 Mechanical behavior of titanium and its alloys [9].
Material Microstructure Elastic Modulus
(GPa)
Tensile Strength
(MPa)
Commercially pure Ti α 100 240-550
Ti-6Al-4V ELI wrought α + β 110 860-965
Ti-6Al-4V ELI std. grade α + β 112 895-930
Ti-6Al-7Nb Wrought α + β 110 900-1050
Ti-5Al-2.5Fe α + β 110 1020
Ti-13Nb-13Zr Wrought Metastable β 79 - 84 973 - 1037
Ti-12Mo-6Zr-2Fe β 74 - 85 1060 - 1100
Ti-35Nb-7Zr-5Ta β 55 596
Ti-29Nb-13Ta-4.6Zr β 65 911
Ti-35Nb-5Ta-7Zr-0.4O β 66 1010
Ti-15 Mo-5Zr-3Al β 82 -
Biocompatibility
Biocompatibility is defined as the successful integration of implant material and living
tissue without any adverse reaction or undesirable effect on each other [1,9]. It depends
on primarily two constituents which are the response of living tissue to material and
surface activity of implant material in body environment [9].
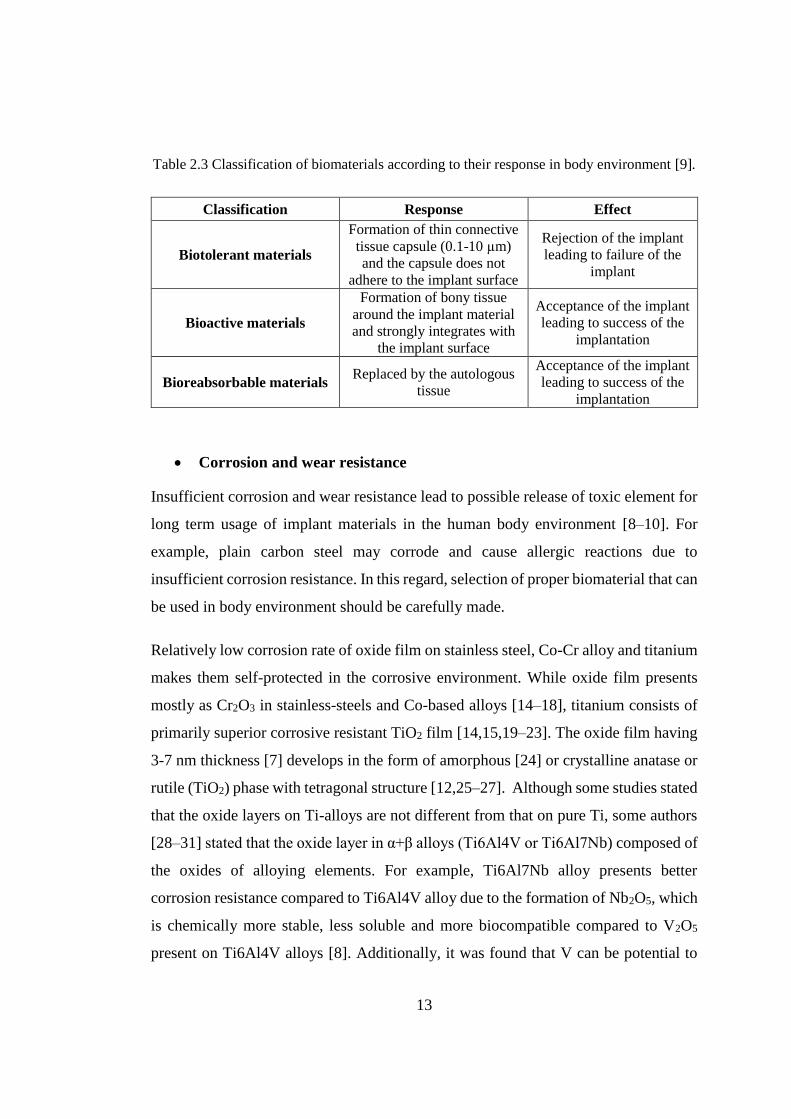
Table 2.3 classifies the biomaterials according to their response in body environment.
Bioactive materials can successively produce bony tissues so as to form permanent
and strong bond between implant and living tissue, while bioreabsorbable materials
can easily decompose and be replaced by living tissues [9]. Unlike the bioactive
materials like hydroxyapatite (HAP) and bioreabsorbable materials like bone grafts,
titanium and its alloys are categorized as biotolerant materials and expected to remain
as permanent fixtures in the body. The main drawback of the artificial biotolerant
implants like titanium is the formation of fibrous tissue capsules other than bony
tissues. Because of that surfaces of biotolerant materials need to be further improved
to increase their biocompatibilities to prevent rejection of the implant.
13
Table 2.3 Classification of biomaterials according to their response in body environment [9].
Classification Response Effect
Biotolerant materials
Formation of thin connective
tissue capsule (0.1-10 µm)
and the capsule does not
adhere to the implant surface
Rejection of the implant
leading to failure of the
implant
Bioactive materials
Formation of bony tissue
around the implant material
and strongly integrates with
the implant surface
Acceptance of the implant
leading to success of the
implantation
Bioreabsorbable materials Replaced by the autologous
tissue
Acceptance of the implant
leading to success of the
implantation
Corrosion and wear resistance
Insufficient corrosion and wear resistance lead to possible release of toxic element for
long term usage of implant materials in the human body environment [8–10]. For
example, plain carbon steel may corrode and cause allergic reactions due to
insufficient corrosion resistance. In this regard, selection of proper biomaterial that can
be used in body environment should be carefully made.
Relatively low corrosion rate of oxide film on stainless steel, Co-Cr alloy and titanium
makes them self-protected in the corrosive environment. While oxide film presents
mostly as Cr2O3 in stainless-steels and Co-based alloys [14–18], titanium consists of
primarily superior corrosive resistant TiO2 film [14,15,19–23]. The oxide film having
3-7 nm thickness [7] develops in the form of amorphous [24] or crystalline anatase or
rutile (TiO2) phase with tetragonal structure [12,25–27]. Although some studies stated
that the oxide layers on Ti-alloys are not different from that on pure Ti, some authors
[28–31] stated that the oxide layer in α+β alloys (Ti6Al4V or Ti6Al7Nb) composed of
the oxides of alloying elements. For example, Ti6Al7Nb alloy presents better
corrosion resistance compared to Ti6Al4V alloy due to the formation of Nb2O5, which
is chemically more stable, less soluble and more biocompatible compared to V2O5
present on Ti6Al4V alloys [8]. Additionally, it was found that V can be potential to
14
lead cytotoxic effect and allergic reaction in body environment for long service usage
period [8]. In fact, there exists various factors that affect the protectiveness of the
passive film; which are chemical composition of alloys, the rate of ion transfer through
the oxide film, stability of the oxide film against dissolution and spontaneous
regeneration of oxide film in milliseconds even after damage.
Osseointegration
Osseointegration is defined as the direct structural and functional connection between
implant and living bone without formation of foreign tissue [32]. Artificial implants in
vivo may induce several reactions in the biological micro-environment through the
interaction of the biomaterial with body fluid, proteins and various cells. These
reactions determine the compatibility of the implant material in body environment.
When bone tissues do not attach to implant material due to inadequate surface
condition, fibrous tissue encapsulates around the material as presented previously.
This can give rise to reduction in the mechanical stability between bone and implant
so that loosening of implant may be observed [9,13].
It is known that biomaterial’s surface plays significant role in development of tissue
since it is the first interaction site where biological reactions take place. In this regard,
osseointegration ability is directly related to the surface characteristics of material such
as chemical composition, surface roughness and topography that may adjust the type
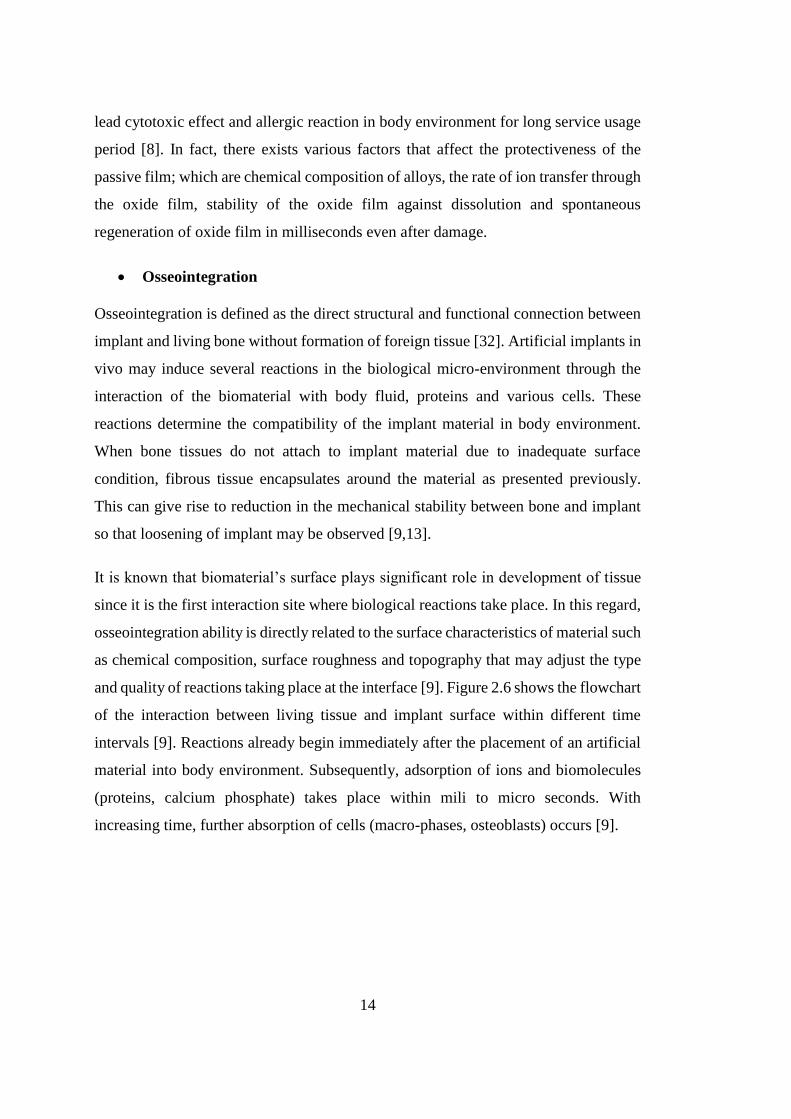
and quality of reactions taking place at the interface [9]. Figure 2.6 shows the flowchart
of the interaction between living tissue and implant surface within different time
intervals [9]. Reactions already begin immediately after the placement of an artificial
material into body environment. Subsequently, adsorption of ions and biomolecules
(proteins, calcium phosphate) takes place within mili to micro seconds. With
increasing time, further absorption of cells (macro-phases, osteoblasts) occurs [9].
15
Figure 2.6 Flowchart of the interaction between living tissue and implant surface within
different time intervals [9].
It can be concluded that the initial surface condition decides rejection or acceptance of
the artificial implant through a series of reactions [9]. However, there is no detailed
study about the occurrence of totally free allergic reactions taking place in human body
due to implantation of an artificial material. Titanium has been recognized as the
bioinert material that cannot react with living tissue or body fluids so that no new bone
formation is observed on its surfaces at the early stage of the implantation [12] which
highlights the importance of surface modification for titanium alloys.
Consequently, it can be inferred from the previous findings and clinical applications
that two major problems, namely, stress shielding and insufficient osseointegration are
frequently encountered ones that should be alleviated or solved for titanium alloys to
make their implantation and usage in the body safe.
In the following sections the techniques which are utilized to generate pores in
biomaterials for eliminating or lessening the stress shielding problem will be
presented. Additionally, surface modification of titanium alloys which aims to increase
osseointegration properties will be given by a particular emphasis in the surface
processing of titanium foams.

16
2.2 Solid Metal Foams
2.2.1 Cellular Solids
Cellular solids are categorized as two dimensional “honeycomb” structures due to
hexagonal nature and three dimensional “foam” structures having polyhedron shape.
Porous materials are already found in nature as cork, sponge, wood and cancellous
bone [33,34].
Over the last two decades, three dimensional foam structures, also called as porous
structures, have been taken into consideration in biomedical applications due to their
low specific weights with suitable balance between stiffness and strength. These
porous materials are classified according to whether they contain open or closed pores.
Figure 2.7(a) presents the closed pore structure in which pores are isolated from each
other by cell walls. On the other hand, open cell foams possess interconnected
continuous network structure as seen in Figure 2.7(b).
Man-made open porosity type foams are generally used for filters while, closed cells
are preferred for packaging due to high energy absorption capabilities and also used in
lightweight structure like sandwich core because of relatively higher specific strength
[34]. Additionally, foams with open cells are preferred in biomedical applications
because body fluids can easily flow through the entire structure due to interconnected
open pores [34,35].
(a) (b)
Figure 2.7 Three dimensional metallic foams with (a) closed and (b) open cell structure [35].
17
Various investigations about man-made porous materials have been performed due to
presenting wide range of properties like physical, mechanical and thermal. However,
since polymeric and ceramic foams cannot sustain mechanical forces under repetitive
loading due to their insufficient strength, in load bearing biomedical applications they
are replaced by metallic counterparts. As previously mentioned, by introducing pores
to the structure, mechanical properties can be controlled and stress shielding
encountered in bulk materials may be lessened [33,36]. In addition to these, the pores
either provide physical attachment sites for bone tissues or enable transfer of body
fluids throughout the material. As a result, porous metallic materials provide unique
balance between strength and biocompatibility properties so that they are extensively
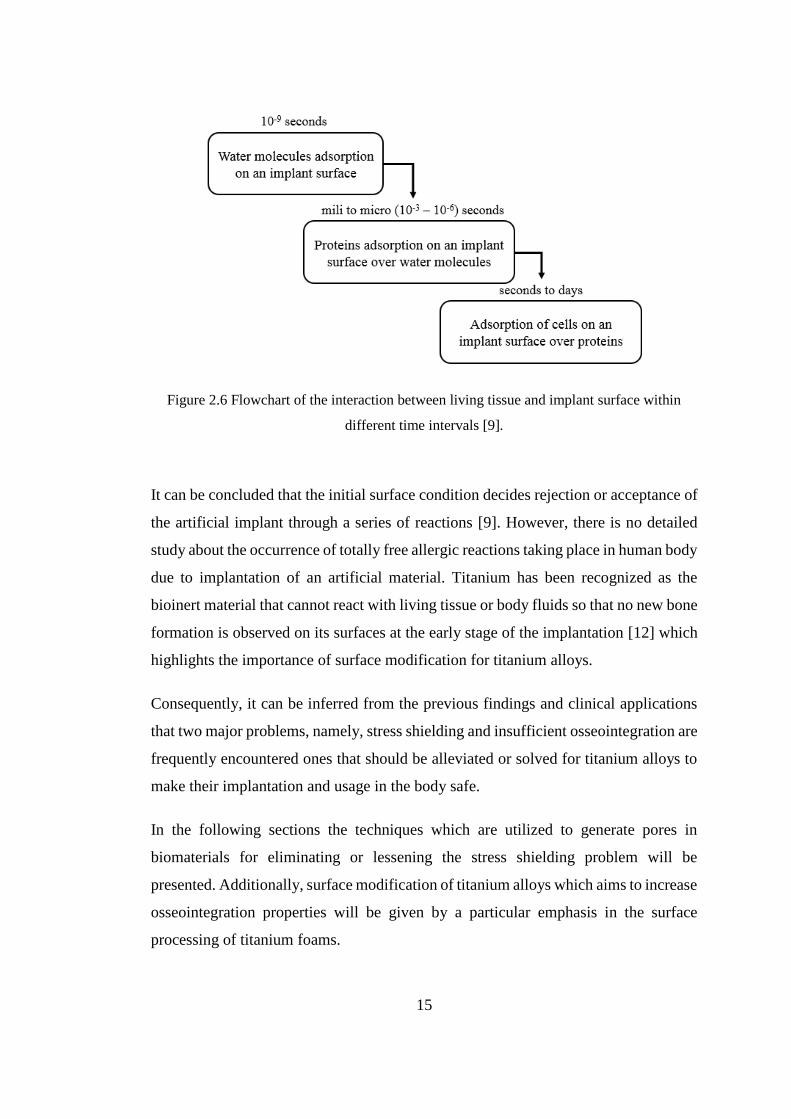
used in various biomedical applications such as in dental implant, fusion device,
acetabular systems and fixation systems, Figure 2.8.
Figure 2.8 Porous metallic materials used in various biomedical application areas; (a)
trabecular metal dental implant, (b) fusion device, (c) continuum acetabular system and (d)
trabecular metal glenoid fixation [37].
18
2.3 Production of Metallic Foams
There are four main production methods for porous metals which are liquid state
processing, solid state processing, electro-deposition and vapor deposition techniques.
The last two methods are generally used in the production of porous Ni, Cu or Ni-Cr
alloy. The first two commonly used methods are presented in the following sections.
2.3.1 Liquid State Processing
Liquid state processing is a technique in which molten metal is turned into a porous
structure by applying different methods like direct foaming by creating gas bubbles,
by blowing gas into liquid metal, solid-gas eutectic solidification or by spray forming
[33]. The method has been widely used in production of metals like aluminum (Al)
and zinc (Zn) which have low melting point and low reactivity [33,38,39]. Despite
providing faster atomic diffusion than solid-state processing, it is not suitable for
production of titanium alloy foams due to extreme reactivity of liquid titanium with
atmospheric gases [38,39].
2.3.2 Solid State Processing
Powder metallurgy, which is a simple and cost effective method, is an effective way
to produce titanium foams since it enables close control of pore size and distribution,
and utilizes low processing temperature which decreases possible severe oxidation
[36,39].
Various fabrication methods, namely, gas entrapment technique, hollow sphere
sintering, replication method, loose powder sintering and space holder technique are
commonly used to form titanium and titanium alloy foams as schematically shown in
Figure 2.9. Brief introduction will be presented for these methods whilst detailed
information about space holder method will be given in the following section.
Gas entrapment technique has been extensively used in aerospace industry so as to
form porous titanium sandwich panels. The technique includes heating the argon filled;
densified titanium powder containing cans to elevated temperatures. As a result of
19
expansion of argon gas, isolated porosity is formed in the structure as shown in Figure
2.9(a). The method yields relatively low amount of porosity (20-40%) with closed,
irregular shaped pores [33,35].
Another solid-state processing method is hollow sphere sintering method in which
bonding of different hollow metallic materials (copper, nickel, steel or titanium) can
be performed to obtain highly light weight porous structure [33]. Schematic
representation of this technique can be seen in Figure 2.9(b). One of the examples for
material manufactured by the technique is porous Ti6Al4V alloy having orderly
distributed porosity. The resultant porous structure includes both open and closed
porosity; however, most of the pores are not open. Usage of materials like titanium
and super alloys enables utilizing of hollow sphere structures in high temperature
applications [33].
Replication technique, on the other hand, is performed to produce highly porous
materials by using an open cell polyurethane (PU) foam or sponge as a template. There
are three main stages: the pattern preparation, infiltration and pattern removal as shown
in Figure 2.9(c). Polymeric foam is firstly immersed in metal powder slurry containing
70 wt. % Ti6Al4V alloy, 20 wt. % H2O and ammonia solution. After infiltration and
subsequent drying process, polyurethane is thermally evaporated and remaining
powders are sintered [35,36]. Li et al. have used this technique to manufacture highly
porous Ti6Al4V alloy [40]. The resultant foam generally contains irregular open
porous structure which directly depends on the structure of starting polymeric foam.
Moreover, there is a possibility of oxidation of titanium powders during evaporation
of polymeric template.
20
Figure 2.9 Various production methods for porous titanium; (a) gas entrapment technique,
(b) hollow sphere sintering, (c) replication method and (d) loose powder sintering [38].
Loose powder sintering is the simplest powder metallurgy fabrication technique
performed to make metallic foams. It is based on the partial densification of metal
powders during sintering. The main steps are the powder preparation, compaction and
sintering of metal powders at relatively high temperature. Resultant products generally
have irregularly shaped randomly orientated porosities as presented in Figure 2.9(d).
Pore size, distribution and interconnectivity of pores can be controlled by the sintering
time and temperature and by addition of alloying element to powder mixture [36].
Several studies have been reported that the final structure included non-spherical pore
shape and maximum achievable porosity was found to be around 50%
[33,36,39,41,42]. Oh et al [42] produced porous unalloyed titanium with 5-37%
porosities and found that 30% porosity content was suitable in order to sustain close
mechanical properties to that of bone. Esen et al. [39] reported that unalloyed titanium
and Ti6Al4V alloy samples having open porosity levels 32.8-37.3 vol. % and 30-37.5
vol. %, respectively, were manufactured by loose powder sintering methods. Elastic
modulus of both loose powder sintered pure titanium and Ti6Al4V alloys were close
to that of human bones’ elastic modulus (1-40 GPa).
21
2.3.2.1 Space Holder Method
Previously described foam production processes either result in contamination of the
foam structures during creation of pores or induce only limited porosity levels with
irregularly shaped pores having a wide range distribution in size. Space holder method,
on the other hand, is a simple technique that provides solutions for the problems
associated with the foam production techniques aforementioned.
The process begins by mixing of metallic powders and space holder powder with the
addition of binder to cover all spacer surfaces’ to achieve tight physical bonds between
the powders. The mixture is then cold compacted to give sufficient strength to green
body without distortion of the space holder powders’ shape [36]. Prior to sintering to
get the desired foam strength, the space holder material is removed from the compacts
slowly. In water leaching methods, the water soluble spacer particles are removed by
dissolution of the spacer particles. On the other hand, thermally removable spacer
particles are eliminated by evaporation during heating to sintering temperatures. In the
final step, remaining metallic skeleton is sintered at high temperatures, i.e. at around
1300 ºC for titanium, under protective atmosphere. Schematic representation of space
holder methods is demonstrated in Figure 2.10. The primary objective of sintering is
to bond metallic powders together and to provide certain mechanical strength to porous
body.
Figure 2.10 Schematic representation of space holder method.
22
Characteristic of spacer material determines the morphology and size of the pores and
also the contamination degree of titanium which plays significant role in determination
of functional and structural properties of the resultant foams. In biomedical
applications, for example, the spacer particle should not leave a residue or contaminate
the foam. Additionally, the porosity content, pore size and distribution should be
adjusted in such a way that the foam should be mechanically compatible to natural
bone. Furthermore, it should have open porous structure and ideal pore size around
200 μm to allow transfer of body fluids and to have sufficient space for bone ingrowth.
In space holder method, the addition of different amounts of spacer particles can
control the distribution and size of the porosity which usually ranges between 50 and
85 vol. % with interconnected porous structure and desired mechanical properties
[8,35]. However, the primary criteria in obtaining targeted properties are the selection
of most proper spacer particles. Usually thermally removable spacer particles such as
ammonium hydrogen particle, carbamide (urea), polymer granules and even metallic
materials have been utilized in order to create pores in titanium and titanium alloys
[35,38,41,43–45].
For the purpose of producing titanium foam, Wen et al. [45] used ammonium hydrogen
carbonate particles which were decomposed at 200 ºC and subsequently the titanium
skeleton was sintered at 1200 ºC for 2 h. Resultant titanium foams exhibited 78%
porosity, and compressive strength and elastic moduli at around 35 MPa and 5.3 GPa,
respectively, which were close to mechanical properties of cancellous bone. However,
there was no detailed explanation about contamination level of titanium due to
evaporation of ammonium hydrogen carbonate [45].
Rausch et al. [41], on the other hand, utilized polymer granules that were evaporated
at relatively lower temperatures (130 ºC). By sintering at 1100-1250 ºC, they obtained
titanium scaffolds with tensile strength and elastic moduli between 1.5-30 MPa and
0.3-16 GPa, respectively. However, micro porosities observed in the sintered structure
deteriorated the mechanical properties.
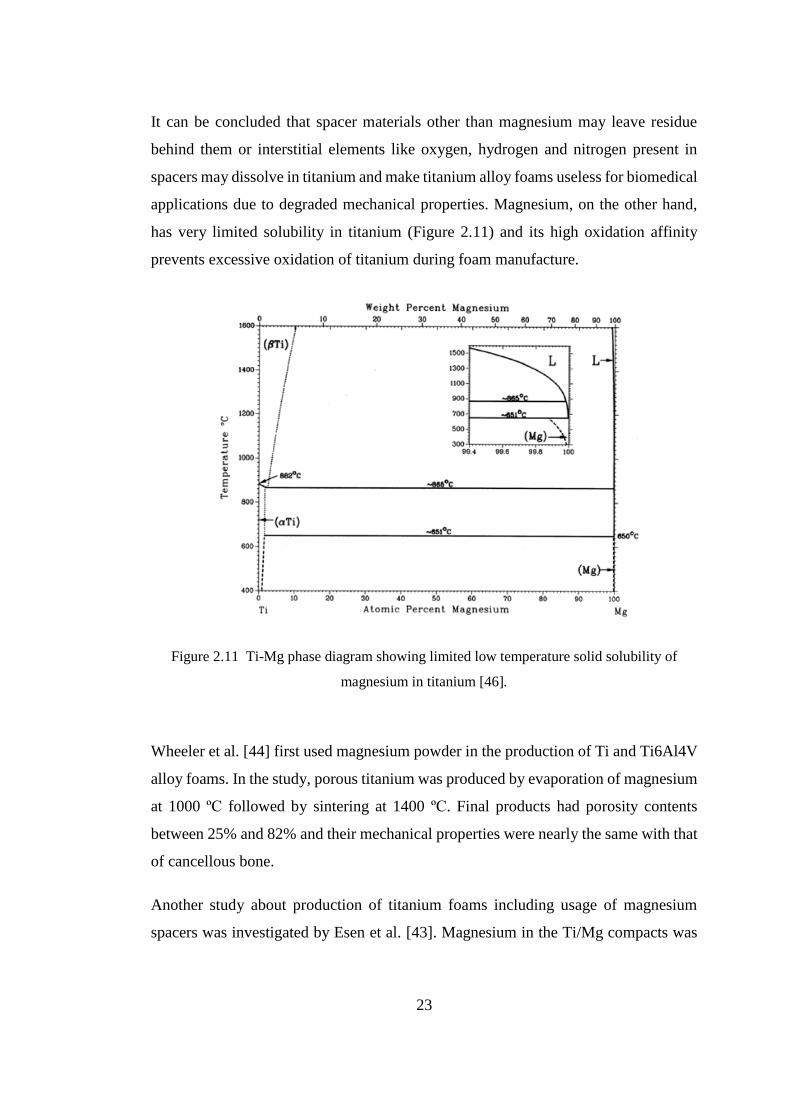
23
It can be concluded that spacer materials other than magnesium may leave residue
behind them or interstitial elements like oxygen, hydrogen and nitrogen present in
spacers may dissolve in titanium and make titanium alloy foams useless for biomedical
applications due to degraded mechanical properties. Magnesium, on the other hand,
has very limited solubility in titanium (Figure 2.11) and its high oxidation affinity
prevents excessive oxidation of titanium during foam manufacture.
Figure 2.11 Ti-Mg phase diagram showing limited low temperature solid solubility of
magnesium in titanium [46].
Wheeler et al. [44] first used magnesium powder in the production of Ti and Ti6Al4V
alloy foams. In the study, porous titanium was produced by evaporation of magnesium
at 1000 ºC followed by sintering at 1400 ºC. Final products had porosity contents
between 25% and 82% and their mechanical properties were nearly the same with that
of cancellous bone.
Another study about production of titanium foams including usage of magnesium
spacers was investigated by Esen et al. [43]. Magnesium in the Ti/Mg compacts was

24
removed during slow heating to sintering temperature (1200 ⁰C). The contents of
interconnected open pores obtained by evaporation of magnesium were in the range of
45-70 vol. %. The relative Young’s modulus of the porous structures was observed to
decrease with increasing porosity contents of the foams. They found that Young’s
modulus and yield strength were in the range of 0.42–8.8 GPa and 15–116 MPa,
respectively, which were similar to that of natural bone [43].
2.4 Mechanical Behavior of Porous Metals
The mechanical responses of porous materials under various loads, and the effect of
pore content, shape, type and its distribution on mechanical properties, i.e. strength,
elastic modulus, are the crucial fields needed to be investigated before implantation of
foams to desired applications.
Mechanical behavior of foam materials basically depends on their relative density,
presence of open or closed pores, pore shape and pore content. Under compressive
loads, metallic foams display characteristic stress-strain behavior similar to elastic-
plastic foams consisting of three distinct regions which start with linear elastic
deformation followed by plateau and densification stages as shown in Figure 2.12.
Figure 2.12 Typical stress-strain diagrams of metallic foams under compressive load [34].
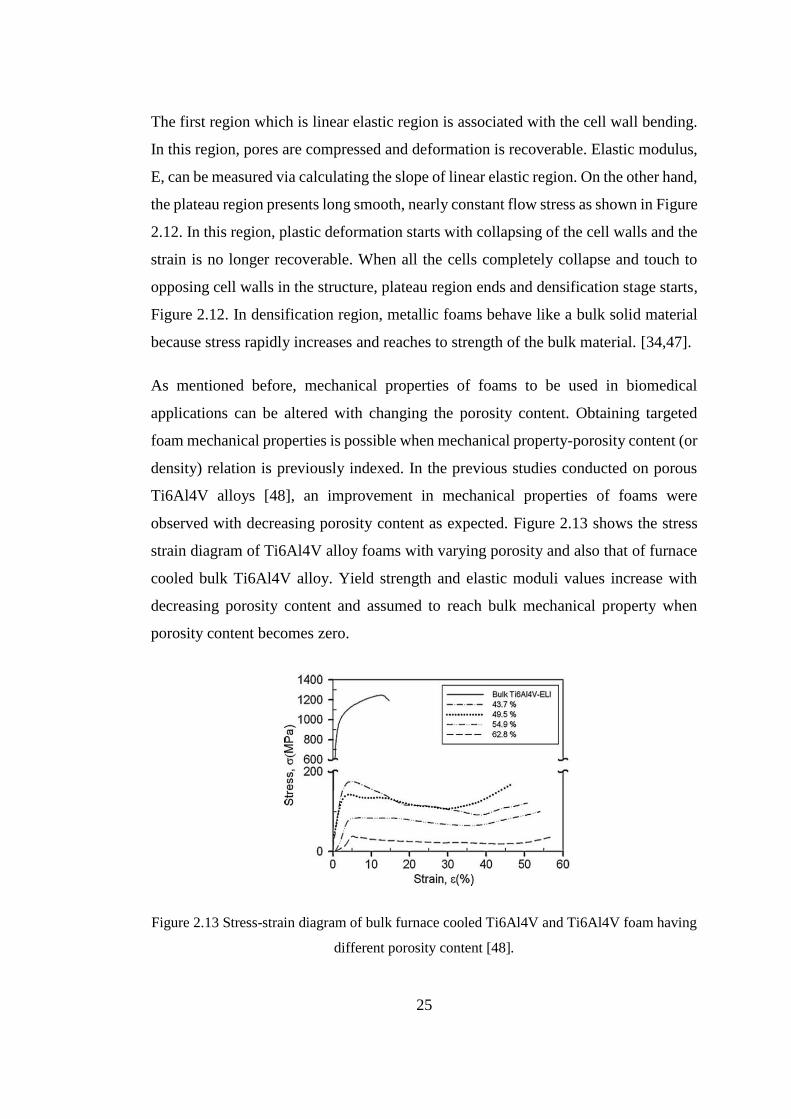
25
The first region which is linear elastic region is associated with the cell wall bending.
In this region, pores are compressed and deformation is recoverable. Elastic modulus,
E, can be measured via calculating the slope of linear elastic region. On the other hand,
the plateau region presents long smooth, nearly constant flow stress as shown in Figure
2.12. In this region, plastic deformation starts with collapsing of the cell walls and the
strain is no longer recoverable. When all the cells completely collapse and touch to
opposing cell walls in the structure, plateau region ends and densification stage starts,
Figure 2.12. In densification region, metallic foams behave like a bulk solid material
because stress rapidly increases and reaches to strength of the bulk material. [34,47].
As mentioned before, mechanical properties of foams to be used in biomedical
applications can be altered with changing the porosity content. Obtaining targeted
foam mechanical properties is possible when mechanical property-porosity content (or
density) relation is previously indexed. In the previous studies conducted on porous
Ti6Al4V alloys [48], an improvement in mechanical properties of foams were
observed with decreasing porosity content as expected. Figure 2.13 shows the stress
strain diagram of Ti6Al4V alloy foams with varying porosity and also that of furnace
cooled bulk Ti6Al4V alloy. Yield strength and elastic moduli values increase with
decreasing porosity content and assumed to reach bulk mechanical property when
porosity content becomes zero.
Figure 2.13 Stress-strain diagram of bulk furnace cooled Ti6Al4V and Ti6Al4V foam having
different porosity content [48].
26
Various theoretical models have been developed to understand the relation between
mechanical properties of foams and their porosity contents [34,48–50]. Commonly
used theoretical models try to explain the relation by use of idealized structures
regardless of the pore shape, size and its distribution. The resultant pores in the foam
structures may be two types, namely, macropores obtained by removal of spacer
particles and micropores on the cell walls due to limited sintering of powders. Hence,
the commonly used models should be modified and include the effects of macro and
micropores separately. Moreover, the influences of chemical composition and
underlying microstructure are missing in commonly used models. Mechanical
properties of titanium and titanium alloys are sensitive to the content of interstitial
elements like oxygen, hydrogen and nitrogen. Additionally, depending on the type of
titanium alloys (α, α+β and β-type) used in foam manufacturing; one can result in
equiaxed, lamellar and martensitic structure at the end. Therefore, proposed
mechanical models should also contain the mechanical properties of cell walls
calculated considering the interstitial element content and underlying microstructure.
To characterize the mechanical properties of porous materials, usually cross-section
area or minimum solid area model (MSA) has been applied. Relative mechanical
properties (M*/Mo) can be estimated by the following formula given in Eq. (2.1), where
‘’n’’ and “ρ*/ρo” denote an exponent and relative density term. Superscript “*” and
subscript “o” point the bulk and foam properties, respectively [48–50].
M∗
Mo= (
ρ∗
ρo)
n
(2.1)
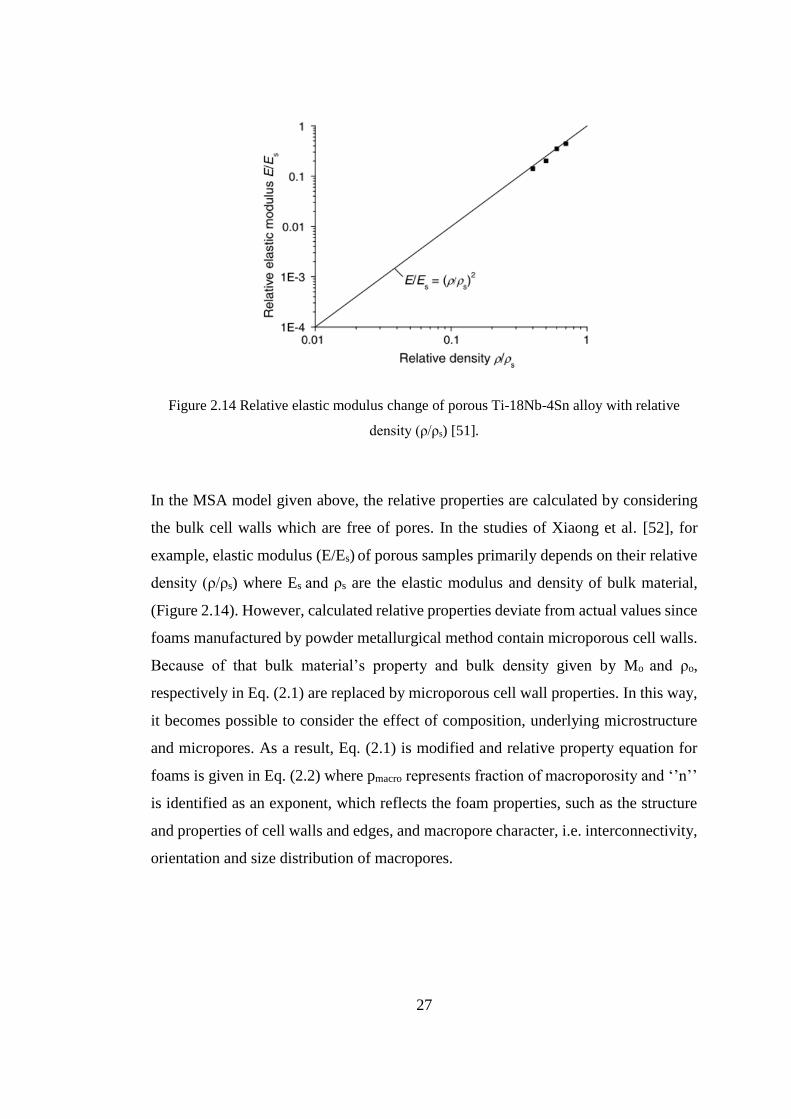
27
Figure 2.14 Relative elastic modulus change of porous Ti-18Nb-4Sn alloy with relative
density (ρ/ρs) [51].
In the MSA model given above, the relative properties are calculated by considering
the bulk cell walls which are free of pores. In the studies of Xiaong et al. [52], for
example, elastic modulus (E/Es) of porous samples primarily depends on their relative
density (ρ/ρs) where Es and ρs are the elastic modulus and density of bulk material,
(Figure 2.14). However, calculated relative properties deviate from actual values since
foams manufactured by powder metallurgical method contain microporous cell walls.
Because of that bulk material’s property and bulk density given by Mo and ρo,
respectively in Eq. (2.1) are replaced by microporous cell wall properties. In this way,
it becomes possible to consider the effect of composition, underlying microstructure
and micropores. As a result, Eq. (2.1) is modified and relative property equation for
foams is given in Eq. (2.2) where pmacro represents fraction of macroporosity and ‘’n’’
is identified as an exponent, which reflects the foam properties, such as the structure
and properties of cell walls and edges, and macropore character, i.e. interconnectivity,
orientation and size distribution of macropores.

28
M∗
Mcell wall= (
ρ∗
ρcell wall)
n
= (1 − 𝑝𝑚𝑎𝑐𝑟𝑜)𝑛 (2.2)
Figure 2.15 Yield strength change with macro porosity fraction [48].
One of the example of modified equation is the study of Esen et al. [48] in which the
effect of partially sintered powders on total porosity content have been taken into
consideration. Their experimental results given in Figure 2.15 show the relationship
between foam yield strength (σy*) and macropore fraction (1-pmacro) of porous Ti6Al4V
samples that are similar to commonly used MSA models.
2.5 Surface Modification of Titanium and Titanium Alloys
In order to accomplish desired biological integration of titanium with bone tissues,
surface modification methods have been performed. The reasons for applying surface
modification techniques are classified under three main headings [7,13,53]. One of the
reasons is to clean the contaminated materials’ surfaces arised during production due
to plastic deformation which leads to the formation of non-uniform coating layer on
substrate surfaces. Insufficient osseointegration ability is another reason for
modification of titanium and titanium alloys’ surfaces since the major limitation of a
metallic material for long term survival in the body is the lack of a stable biological
29
fixation to living bone. Thirdly, the need for hard surface layer in load bearing
applications where the materials are subjected to repeated loading on touching surfaces
makes surface modification inevitable.
In the scope of the present study, since it is aimed to functionalize the surfaces of
titanium and titanium alloy foams for biological use, particularly surface processing
techniques which enhance osseointegration properties are examined.
Various researches have been conducted to adjust the bioactivity of titanium and its
alloys by common surface modification techniques such as mechanical, physical and
chemical methods summarized in Figure 2.16 [7,10,13,53–58]. Most of the physical
methods, like thermal spraying and ion beam deposition, focus on the deposition of a
biocompatible layer by using electrical, kinetic and thermal energy, while in
mechanical methods like machining, grinding or polishing, the purpose is to increase
the surface roughness by physical forces. However, these techniques are not
appropriate for surface modification of titanium and titanium alloys having complex
geometries in the form of porous structures due to difficulty in treating the whole
surface homogenously. Therefore, in the following sections applications of physical
and mechanical methods are described briefly, whilst the characteristic of chemical
methods which are relatively more suitable techniques for surface modification of
porous materials are reviewed in detail.
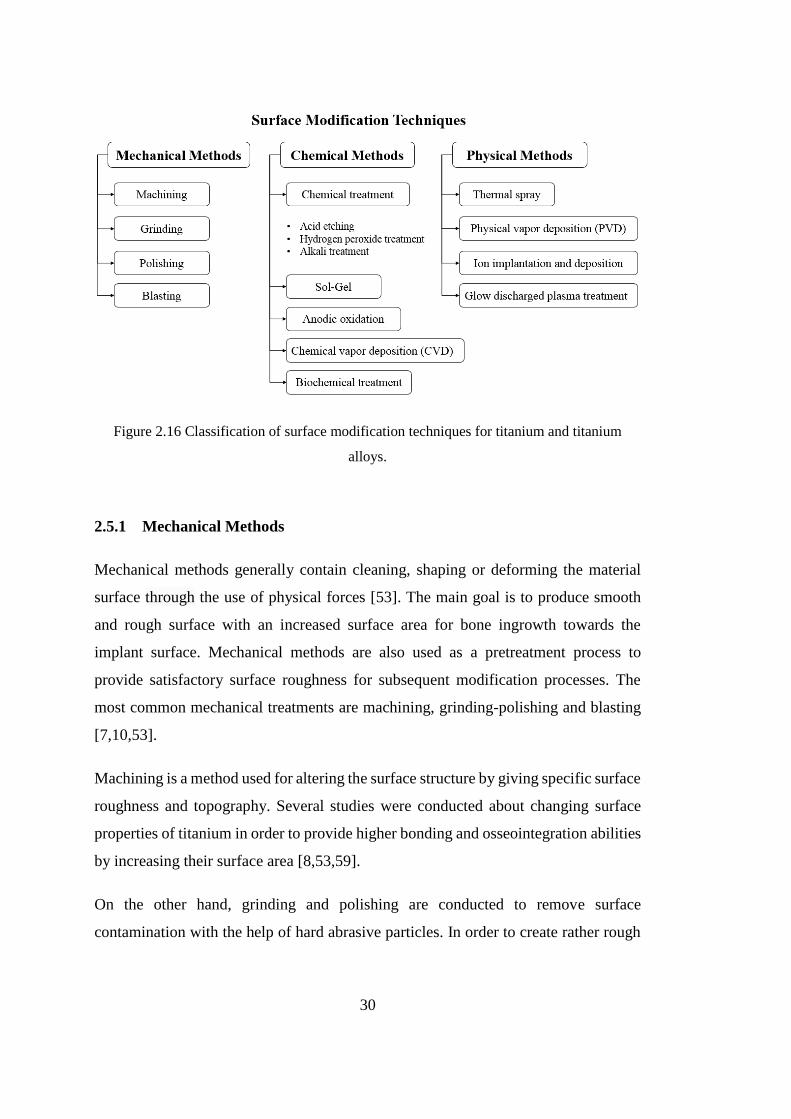
30
Figure 2.16 Classification of surface modification techniques for titanium and titanium
alloys.
2.5.1 Mechanical Methods
Mechanical methods generally contain cleaning, shaping or deforming the material
surface through the use of physical forces [53]. The main goal is to produce smooth
and rough surface with an increased surface area for bone ingrowth towards the
implant surface. Mechanical methods are also used as a pretreatment process to
provide satisfactory surface roughness for subsequent modification processes. The
most common mechanical treatments are machining, grinding-polishing and blasting
[7,10,53].
Machining is a method used for altering the surface structure by giving specific surface
roughness and topography. Several studies were conducted about changing surface
properties of titanium in order to provide higher bonding and osseointegration abilities
by increasing their surface area [8,53,59].
On the other hand, grinding and polishing are conducted to remove surface
contamination with the help of hard abrasive particles. In order to create rather rough
31
surface and generally unidirectional surface topography, the grinding method is
preferred. Conversely, polishing is used to obtain extremely smooth and mirror like
surface by using finer abrasive particles like SiC, diamond or alumina [53].
Similarly, blasting is used to remove contaminated surface layer and to increase the
roughness of the surfaces for better adhesion of cell attachment. In this method,
material’s surface is exposed to accelerated hard ceramic particles such as alumina and
silica, in liquid suspension environment. Shot peening is one of the examples in which
compressive stresses occur on material surface due to localized plastic deformation
caused by high speed particles [7,8,10,55].
2.5.2 Physical Methods
Common physical methods are classified as thermal spray, physical vapor deposition
(PVD), ion implantation and glow discharge plasma techniques. These techniques are
based on the thermal, kinetic and electrical energy instead of chemical reaction
between coating layer and modified surface [7,57].
Usually, thermal spraying is applied for the purpose of increasing the corrosion
resistance as well as the biocompatibility of titanium alloys. The coating material is
thermally melted or softens and then takes the form of liquid droplets. After gaining
enough energy, they hit the surface and then cool down and solidify. Coating layer is
formed after condensation of the liquid droplets on the substrate surface [7,8,60].
Surfaces are generally coated with hydroxyapatite, Al2O3, ZrO2, calcium silicate
having 30 to 200 µm thickness [7]. One of the limitations of this method is its high
application temperature which may damage the surface of titanium [61].
PVD is another method in which growth of thin film takes place by the condensation
reaction between substrate surface and vapor phase [57]. Surfaces are generally coated
with titanium nitride (TiN), titanium carbide (TiC), titanium carbo-nitride (TiCN) or
diamond like carbon thin film having coating thickness around 1 µm. Although PVD
is an effective and alternative method to obtain high coating density and strongly
32
attached coating layer, it is not suitable for complex shaped objects due to the difficulty
in obtaining-uniform thickness [7,54,57].
Ion implantation and deposition technique, on the other hand, is suitable to increase
wear and corrosion resistance of titanium and its alloys which are important properties
especially in load bearing applications [10,53]. This technique basically consists of
acceleration of the ions (i.e. carbon, oxygen and nitrogen) in an electric field and
attachment of them to solid titanium surfaces. In addition, the technique allows to
obtain antibacterial surface coating, as well as increasing corrosion resistance by
formation of Ti-N rich coating [53].
In glow discharge plasma treatment, the main purpose is cleaning and sterilization of
the titanium surface by changing the structure of oxide layer [53]. Further, it enhances
the surface energy and improves wetting ability of the surfaces compared to the
conventional cleaning methods. Due to low operating temperature and low vacuum
environment, this technique called as cold plasma treatment [53].
2.5.3 Chemical Methods
Chemical methods consist of chemical vapor deposition (CVD), sol-gel method,
anodic oxidation, biochemical method and chemical treatments.
2.5.3.1 Chemical Vapor Deposition (CVD)
CVD mainly involves chemical reaction of atoms or molecules in the gaseous
environment at relatively high temperature and results in deposition of nonvolatile
phase on substrate surfaces [7,36,54]. It is widely used to increase wear and corrosion
resistance of titanium by depositing TiN, TiC, hydroxyapatite, diamond or diamond-
like carbon film having approximately 1 µm thickness [7,10,57]. CVD presents good
coating uniformity even if coating objects have complex geometry; however, high
application temperature (850-1200 °C) causes severe degradation on titanium substrate
surfaces [7,57,62].
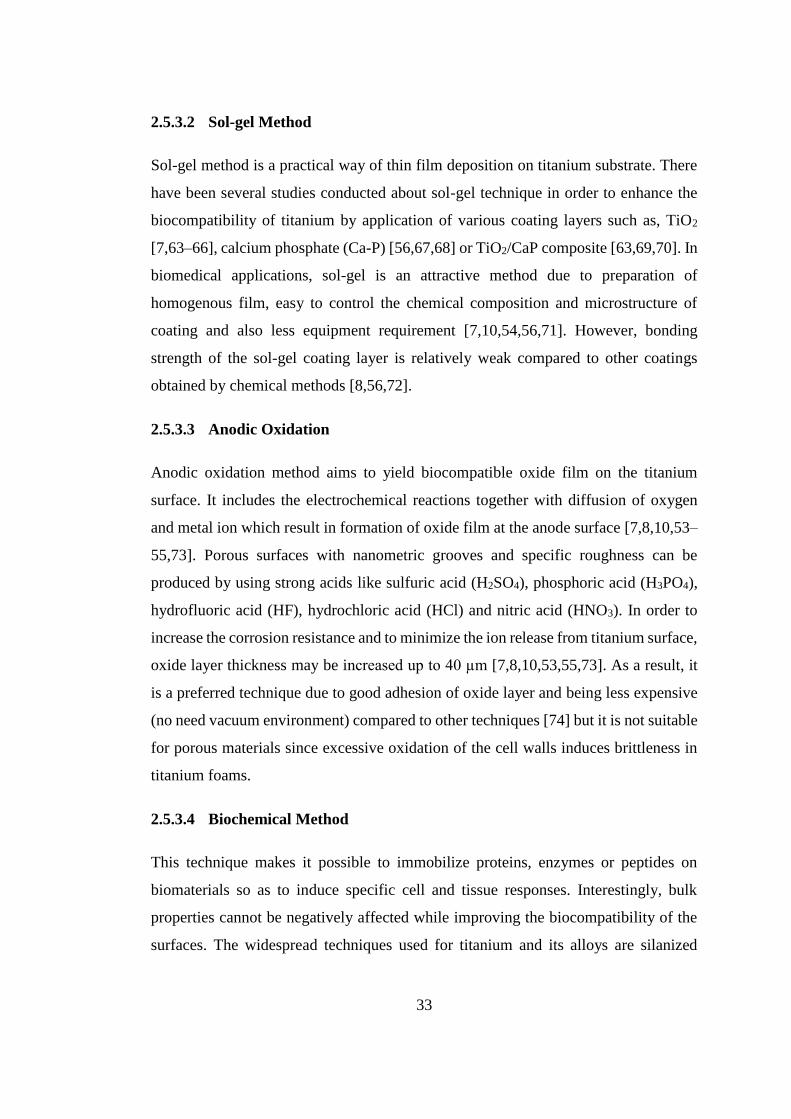
33
2.5.3.2 Sol-gel Method
Sol-gel method is a practical way of thin film deposition on titanium substrate. There
have been several studies conducted about sol-gel technique in order to enhance the
biocompatibility of titanium by application of various coating layers such as, TiO2
[7,63–66], calcium phosphate (Ca-P) [56,67,68] or TiO2/CaP composite [63,69,70]. In
biomedical applications, sol-gel is an attractive method due to preparation of
homogenous film, easy to control the chemical composition and microstructure of
coating and also less equipment requirement [7,10,54,56,71]. However, bonding
strength of the sol-gel coating layer is relatively weak compared to other coatings
obtained by chemical methods [8,56,72].
2.5.3.3 Anodic Oxidation
Anodic oxidation method aims to yield biocompatible oxide film on the titanium
surface. It includes the electrochemical reactions together with diffusion of oxygen
and metal ion which result in formation of oxide film at the anode surface [7,8,10,53–
55,73]. Porous surfaces with nanometric grooves and specific roughness can be
produced by using strong acids like sulfuric acid (H2SO4), phosphoric acid (H3PO4),
hydrofluoric acid (HF), hydrochloric acid (HCl) and nitric acid (HNO3). In order to
increase the corrosion resistance and to minimize the ion release from titanium surface,
oxide layer thickness may be increased up to 40 µm [7,8,10,53,55,73]. As a result, it
is a preferred technique due to good adhesion of oxide layer and being less expensive
(no need vacuum environment) compared to other techniques [74] but it is not suitable
for porous materials since excessive oxidation of the cell walls induces brittleness in
titanium foams.
2.5.3.4 Biochemical Method
This technique makes it possible to immobilize proteins, enzymes or peptides on
biomaterials so as to induce specific cell and tissue responses. Interestingly, bulk
properties cannot be negatively affected while improving the biocompatibility of the
surfaces. The widespread techniques used for titanium and its alloys are silanized
34
titania, photo-chemistry, self-assembled monolayers, and protein resistant and protein
immobilization [7,58,59].
2.5.3.5 Chemical Treatment
This treatment is originated from chemical reaction occurring at the interface between
solution and titanium surface. The remarkable treatments are acid etching, hydrogen
peroxide (H2O2) and alkali treatments [7,8,53]. In the present study, bulk and porous
Ti6Al7Nb alloy samples were subjected to alkali treatment, thereby, information about
alkali treatment will be given in detail.
2.5.3.5.1 Acid Etching and Hydrogen Peroxide (H2O2) Treatment
Acid etching which is also called acid pickling is one of the practical ways of changing
the surface structure by removing oxide layer [7,10,53,55,73]. Etching is performed
by using strong acids like HNO3, HF, H2SO4 and HCl which have strong affinity to
react with titanium oxide layer. Standard etching solution for titanium and its alloys is
specified as an aqueous solution with 10-30 vol. % of HNO3 and 1-3 vol. % of HCl
[53,73,75,76]. Alternatively, 100 ml HCl + 100 ml H2SO4 mixture is also used as
etching solution to acquire a large surface area [7,8,53,55,61]. Sometimes, in dual acid
etching solution containing HCl and H2SO4 is heated above 100 °C in order to obtain
desired relatively rough surface [77].
After the acid treatment, thin oxide layer approximately 10 nm thickness is formed on
the surface. However, strongest acid like HF predominantly reacts with titanium and
forms titanium fluoride and hydrogen. This free hydrogen may cause hydrogen
embrittlement thereby, mechanical properties may be deteriorated due to the formation
of micro cracks on the surfaces [7,53,78].
In hydrogen peroxide treatment, as in the other surface modification techniques, the
main purpose is to obtain specific surface structure for better osseointegration ability
[7,8,53,66,79]. After chemical reaction between H2O2 and titanium surface,
amorphous titania gel layer is formed with sub-micron size and roughness mainly
35
consisting of TiO2 but high amount of hydroxyl group is observed on the surface
[53,80]. Shi et al [81] have found that additional heat treatment conducted at various
temperatures transforms the amorphous layer into crystalline titania phase with some
anatase and rutile phase. Pan et al. [80] found that thickness of formed oxide layer
mostly depends on the H2O2 concentration and treatment time which means that the
higher the treatment time, the thicker the oxide layer is. This method, however, is not
suitable for surface processing of porous titanium since it induces severe oxidation of
cell walls thus, increases brittleness of titanium foams.
2.5.3.5.2 Alkali Treatment
Alkali treatment has become a popular technique because of its simplicity and easy to
control the process parameters. It is an alternative method to physical modification
techniques such as ion beam deposition, plasma spray coating due to the possibility of
its application to complex shapes. In addition, it is a more suitable method among
chemical treatments for foams since other methods like acid etching and H2O2
treatment may leave some residue or result in excessive dissolution of some
interstitials.
Alkali treatment can be basically described as a simple surface modification technique
applied by alkali aqueous solutions containing sodium hydroxide (NaOH) or
potassium hydroxide (KOH) to obtain bioactive sodium or potassium titanate layer.
The titanate layer obtained by alkali treatment on titanium substrates allows apatite
nucleation and thus, enhances bioactivity and bone regeneration on the implant
surface. The details of apatite formation on the alkali treated surfaces will be discussed
in the following part.
Alkali method is generally followed by heat treatment to dehydrate the amorphous
sodium titanate hydrogel (NaxH2-xTiyO2y+1.nH2O, where 0< x <2 , y=2,3,4) and to
transform it into more stable crystalline sodium titanate phase (Na2TiyO2y+1 ; y=5,6,..)
so as to make the surface layer mechanically more stable. The combination of these
treatments is called alkali heat treatment, Figure 2.17.
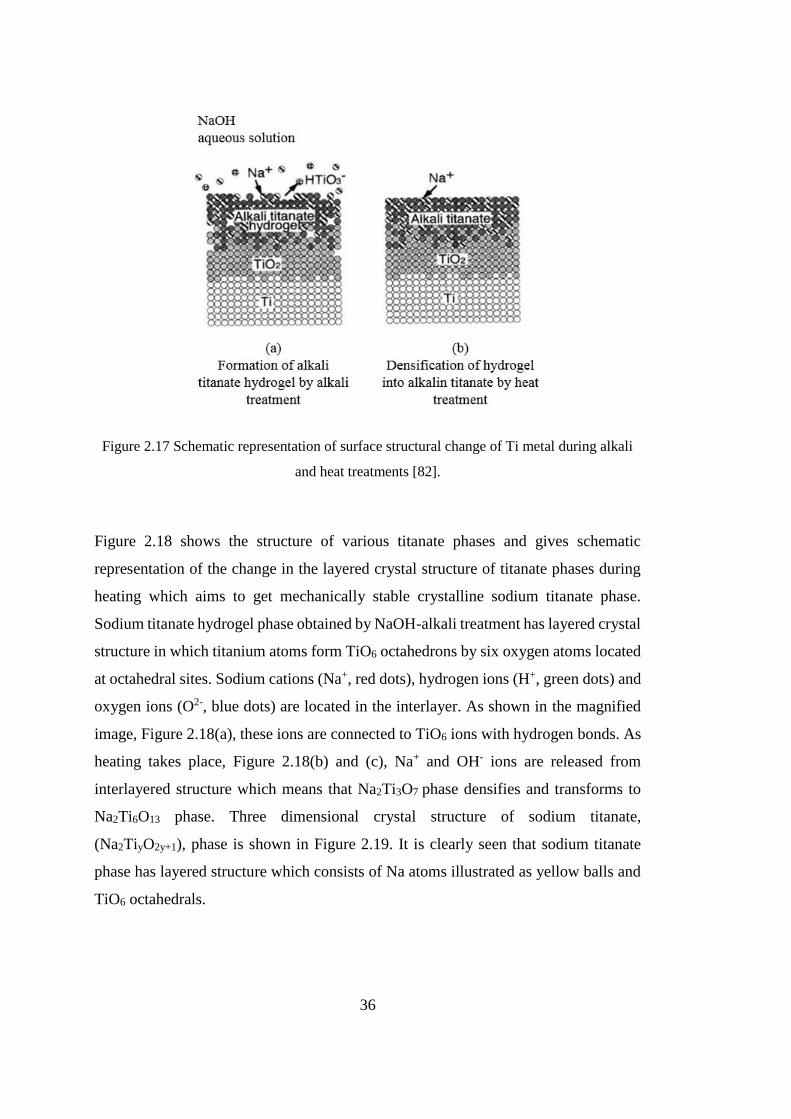
36
Figure 2.17 Schematic representation of surface structural change of Ti metal during alkali
and heat treatments [82].
Figure 2.18 shows the structure of various titanate phases and gives schematic
representation of the change in the layered crystal structure of titanate phases during
heating which aims to get mechanically stable crystalline sodium titanate phase.
Sodium titanate hydrogel phase obtained by NaOH-alkali treatment has layered crystal
structure in which titanium atoms form TiO6 octahedrons by six oxygen atoms located
at octahedral sites. Sodium cations (Na+, red dots), hydrogen ions (H+, green dots) and
oxygen ions (O2-, blue dots) are located in the interlayer. As shown in the magnified
image, Figure 2.18(a), these ions are connected to TiO6 ions with hydrogen bonds. As
heating takes place, Figure 2.18(b) and (c), Na+ and OH- ions are released from
interlayered structure which means that Na2Ti3O7 phase densifies and transforms to
Na2Ti6O13 phase. Three dimensional crystal structure of sodium titanate,
(Na2TiyO2y+1), phase is shown in Figure 2.19. It is clearly seen that sodium titanate
phase has layered structure which consists of Na atoms illustrated as yellow balls and
TiO6 octahedrals.
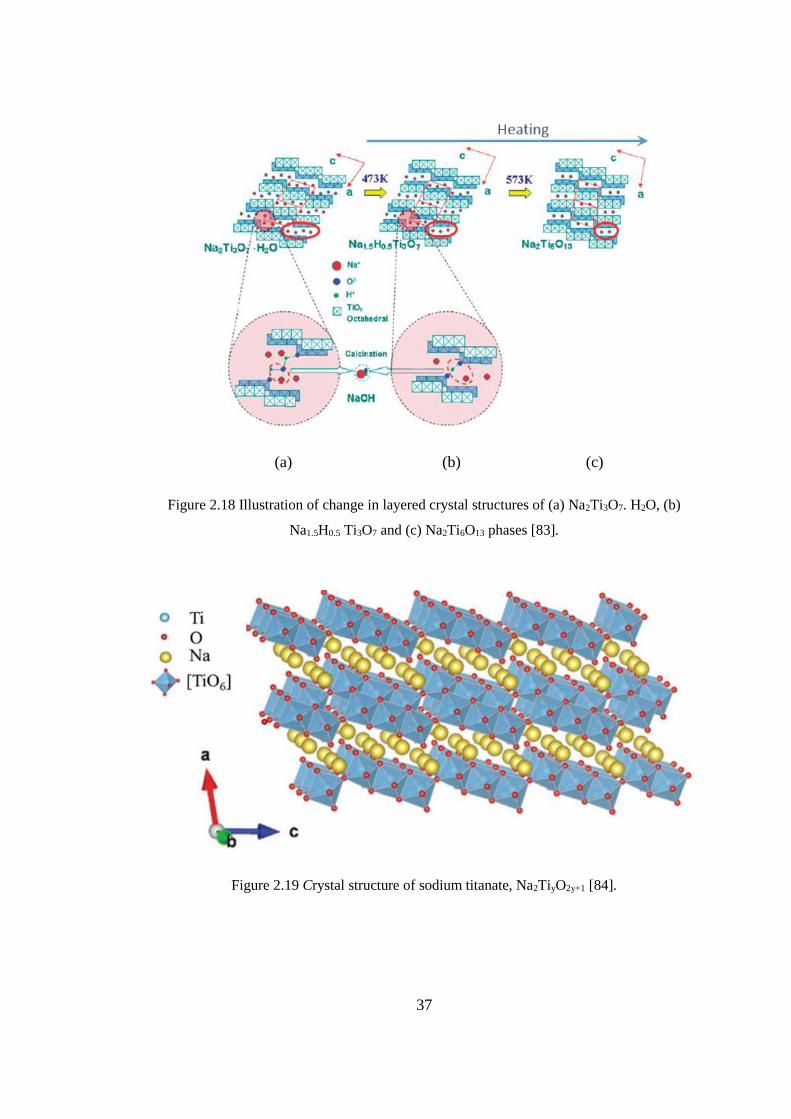
37
(a) (b) (c)
Figure 2.18 Illustration of change in layered crystal structures of (a) Na2Ti3O7. H2O, (b)
Na1.5H0.5 Ti3O7 and (c) Na2Ti6O13 phases [83].
Figure 2.19 Crystal structure of sodium titanate, Na2TiyO2y+1 [84].
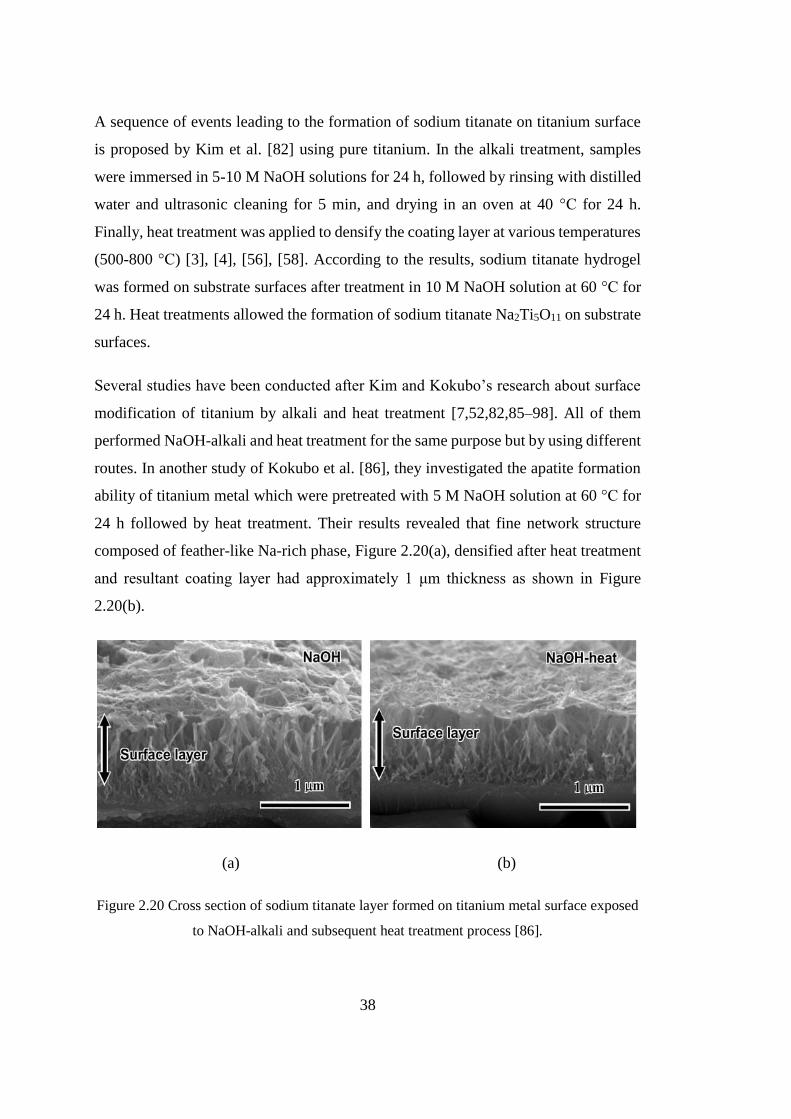
38
A sequence of events leading to the formation of sodium titanate on titanium surface
is proposed by Kim et al. [82] using pure titanium. In the alkali treatment, samples
were immersed in 5-10 M NaOH solutions for 24 h, followed by rinsing with distilled
water and ultrasonic cleaning for 5 min, and drying in an oven at 40 °C for 24 h.
Finally, heat treatment was applied to densify the coating layer at various temperatures
(500-800 °C) [3], [4], [56], [58]. According to the results, sodium titanate hydrogel
was formed on substrate surfaces after treatment in 10 M NaOH solution at 60 °C for
24 h. Heat treatments allowed the formation of sodium titanate Na2Ti5O11 on substrate
surfaces.
Several studies have been conducted after Kim and Kokubo’s research about surface
modification of titanium by alkali and heat treatment [7,52,82,85–98]. All of them
performed NaOH-alkali and heat treatment for the same purpose but by using different
routes. In another study of Kokubo et al. [86], they investigated the apatite formation
ability of titanium metal which were pretreated with 5 M NaOH solution at 60 °C for
24 h followed by heat treatment. Their results revealed that fine network structure
composed of feather-like Na-rich phase, Figure 2.20(a), densified after heat treatment
and resultant coating layer had approximately 1 μm thickness as shown in Figure
2.20(b).
(a) (b)
Figure 2.20 Cross section of sodium titanate layer formed on titanium metal surface exposed
to NaOH-alkali and subsequent heat treatment process [86].
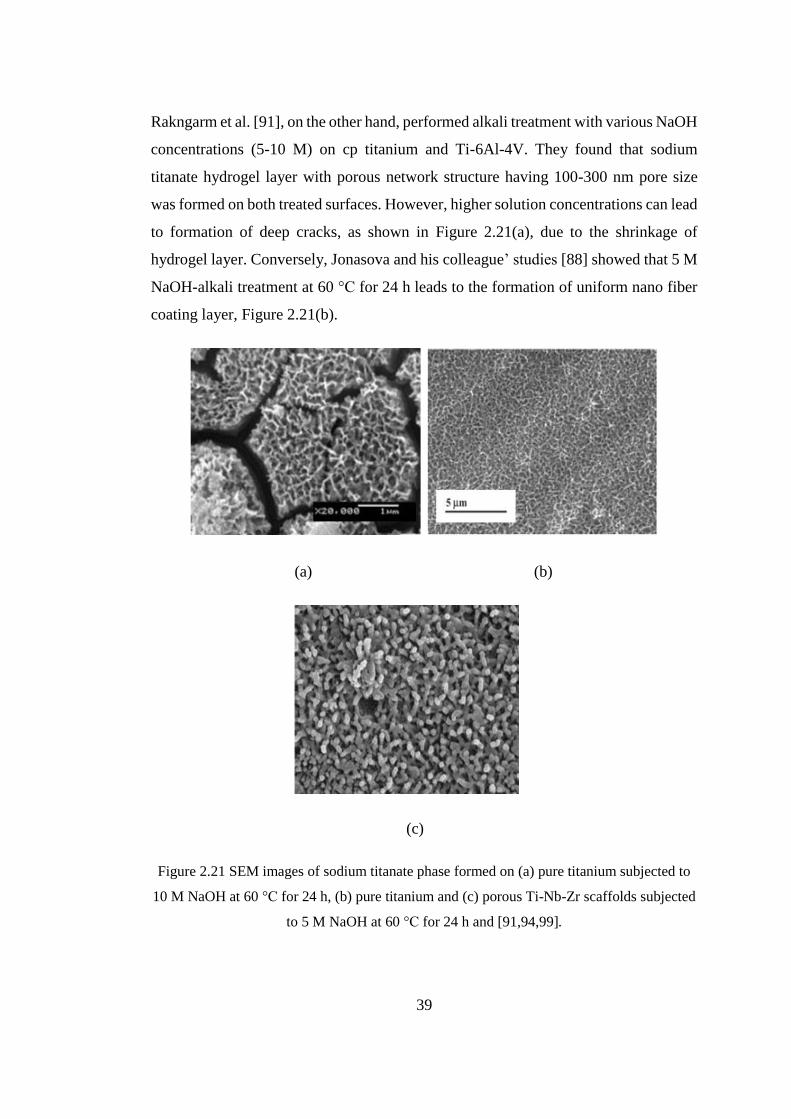
39
Rakngarm et al. [91], on the other hand, performed alkali treatment with various NaOH
concentrations (5-10 M) on cp titanium and Ti-6Al-4V. They found that sodium
titanate hydrogel layer with porous network structure having 100-300 nm pore size
was formed on both treated surfaces. However, higher solution concentrations can lead
to formation of deep cracks, as shown in Figure 2.21(a), due to the shrinkage of
hydrogel layer. Conversely, Jonasova and his colleague’ studies [88] showed that 5 M
NaOH-alkali treatment at 60 °C for 24 h leads to the formation of uniform nano fiber
coating layer, Figure 2.21(b).
(a) (b)
(c)
Figure 2.21 SEM images of sodium titanate phase formed on (a) pure titanium subjected to
10 M NaOH at 60 °C for 24 h, (b) pure titanium and (c) porous Ti-Nb-Zr scaffolds subjected
to 5 M NaOH at 60 °C for 24 h and [91,94,99].
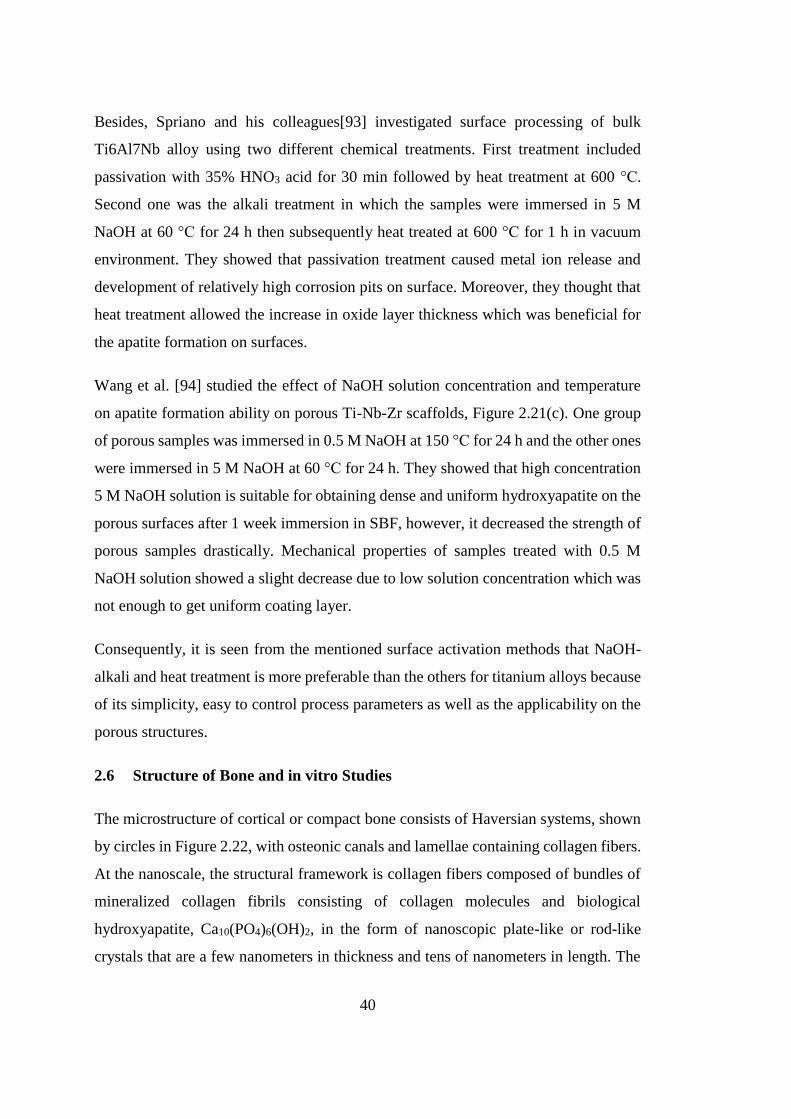
40
Besides, Spriano and his colleagues[93] investigated surface processing of bulk
Ti6Al7Nb alloy using two different chemical treatments. First treatment included
passivation with 35% HNO3 acid for 30 min followed by heat treatment at 600 °C.
Second one was the alkali treatment in which the samples were immersed in 5 M
NaOH at 60 °C for 24 h then subsequently heat treated at 600 °C for 1 h in vacuum
environment. They showed that passivation treatment caused metal ion release and
development of relatively high corrosion pits on surface. Moreover, they thought that
heat treatment allowed the increase in oxide layer thickness which was beneficial for
the apatite formation on surfaces.
Wang et al. [94] studied the effect of NaOH solution concentration and temperature
on apatite formation ability on porous Ti-Nb-Zr scaffolds, Figure 2.21(c). One group
of porous samples was immersed in 0.5 M NaOH at 150 °C for 24 h and the other ones
were immersed in 5 M NaOH at 60 °C for 24 h. They showed that high concentration
5 M NaOH solution is suitable for obtaining dense and uniform hydroxyapatite on the
porous surfaces after 1 week immersion in SBF, however, it decreased the strength of
porous samples drastically. Mechanical properties of samples treated with 0.5 M
NaOH solution showed a slight decrease due to low solution concentration which was
not enough to get uniform coating layer.
Consequently, it is seen from the mentioned surface activation methods that NaOH-
alkali and heat treatment is more preferable than the others for titanium alloys because
of its simplicity, easy to control process parameters as well as the applicability on the
porous structures.
2.6 Structure of Bone and in vitro Studies
The microstructure of cortical or compact bone consists of Haversian systems, shown
by circles in Figure 2.22, with osteonic canals and lamellae containing collagen fibers.
At the nanoscale, the structural framework is collagen fibers composed of bundles of
mineralized collagen fibrils consisting of collagen molecules and biological
hydroxyapatite, Ca10(PO4)6(OH)2, in the form of nanoscopic plate-like or rod-like
crystals that are a few nanometers in thickness and tens of nanometers in length. The
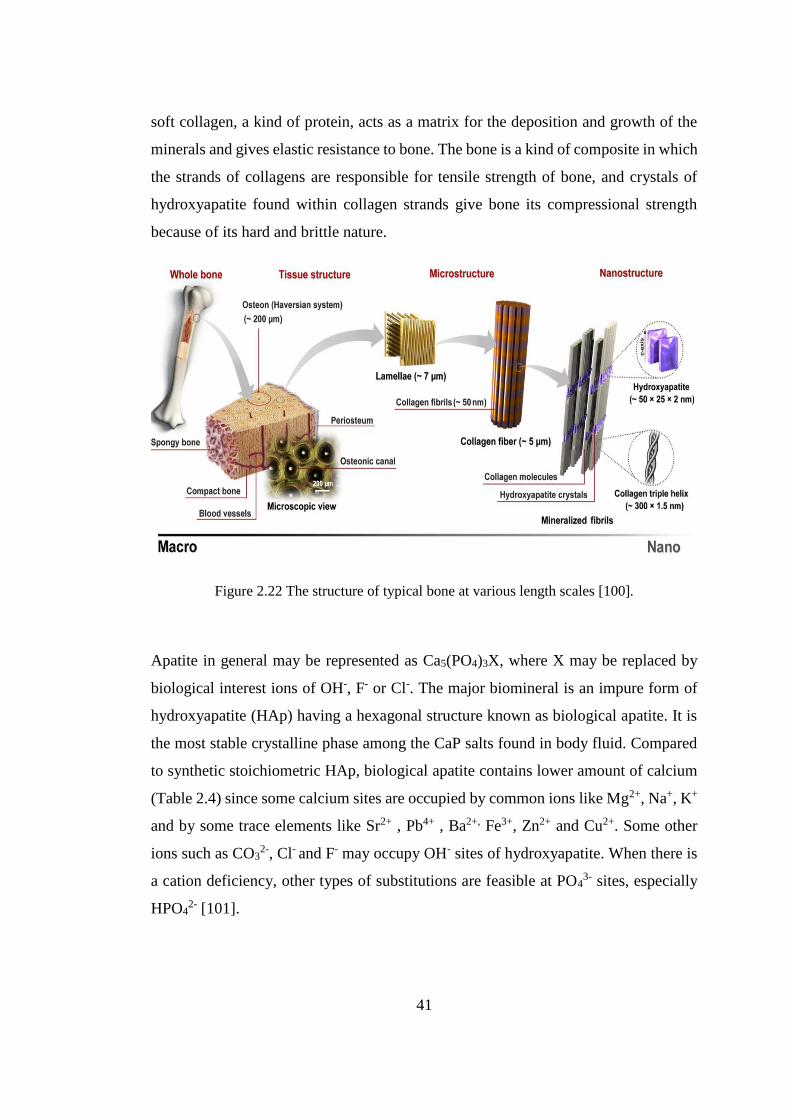
41
soft collagen, a kind of protein, acts as a matrix for the deposition and growth of the
minerals and gives elastic resistance to bone. The bone is a kind of composite in which
the strands of collagens are responsible for tensile strength of bone, and crystals of
hydroxyapatite found within collagen strands give bone its compressional strength
because of its hard and brittle nature.
Figure 2.22 The structure of typical bone at various length scales [100].
Apatite in general may be represented as Ca5(PO4)3X, where X may be replaced by
biological interest ions of OH-, F- or Cl-. The major biomineral is an impure form of
hydroxyapatite (HAp) having a hexagonal structure known as biological apatite. It is
the most stable crystalline phase among the CaP salts found in body fluid. Compared
to synthetic stoichiometric HAp, biological apatite contains lower amount of calcium
(Table 2.4) since some calcium sites are occupied by common ions like Mg2+, Na+, K+
and by some trace elements like Sr2+ , Pb4+ , Ba2+, Fe3+, Zn2+ and Cu2+. Some other
ions such as CO32-, Cl- and F- may occupy OH- sites of hydroxyapatite. When there is
a cation deficiency, other types of substitutions are feasible at PO43- sites, especially
HPO42- [101].

42
Table 2.4 Approximate composition of biological apatite compared with synthetic HAp
[101].
Major component Biological apatite
HAp (mass %) Enamel Dentine Bone
Ca 36.1 35.0 26.7 39.9
P 17.3 17.1 12.47 18.5
Na 0.2 0.020 0.731
K 0.3 0.07 0.055
Mg 0.5 1.2 0.436
F 0.016 0.017 0.07
Cl 0.3 0.03 0.08
CO32- 3.0 4.0 3.48
Ca/P
(molar ratio) 1.613 1.582 1.655 1.667
There has been a growing interest in developing synthetic HAp as a material for bone
replacement and healing since natural bone contains hydroxyapatite. Synthetic HAp is
known to induce new bone formation without causing any toxicity, inflammation or
foreign body response. Studies have shown that nanosized HAp exhibits better
resorbability in the body compared to its micron-sized counterpart. Various methods
like chemical precipitation, solid-state synthesis and the hydrothermal methods are
being used for synthesizing nano-sized HAp; however, in each method HAp is
obtained with various different morphologies and dimensions, Figure 2.23 [100].
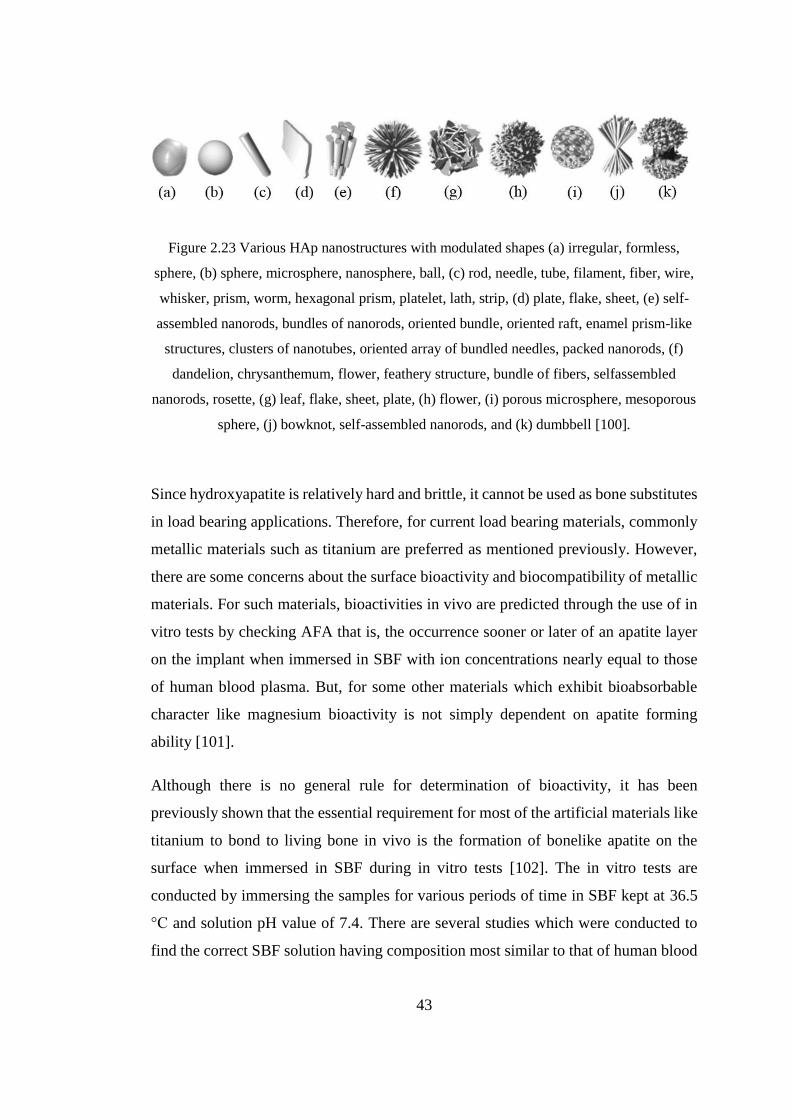
43
Figure 2.23 Various HAp nanostructures with modulated shapes (a) irregular, formless,
sphere, (b) sphere, microsphere, nanosphere, ball, (c) rod, needle, tube, filament, fiber, wire,
whisker, prism, worm, hexagonal prism, platelet, lath, strip, (d) plate, flake, sheet, (e) self-
assembled nanorods, bundles of nanorods, oriented bundle, oriented raft, enamel prism-like
structures, clusters of nanotubes, oriented array of bundled needles, packed nanorods, (f)
dandelion, chrysanthemum, flower, feathery structure, bundle of fibers, selfassembled
nanorods, rosette, (g) leaf, flake, sheet, plate, (h) flower, (i) porous microsphere, mesoporous
sphere, (j) bowknot, self-assembled nanorods, and (k) dumbbell [100].
Since hydroxyapatite is relatively hard and brittle, it cannot be used as bone substitutes
in load bearing applications. Therefore, for current load bearing materials, commonly
metallic materials such as titanium are preferred as mentioned previously. However,
there are some concerns about the surface bioactivity and biocompatibility of metallic
materials. For such materials, bioactivities in vivo are predicted through the use of in
vitro tests by checking AFA that is, the occurrence sooner or later of an apatite layer
on the implant when immersed in SBF with ion concentrations nearly equal to those
of human blood plasma. But, for some other materials which exhibit bioabsorbable
character like magnesium bioactivity is not simply dependent on apatite forming
ability [101].
Although there is no general rule for determination of bioactivity, it has been
previously shown that the essential requirement for most of the artificial materials like
titanium to bond to living bone in vivo is the formation of bonelike apatite on the
surface when immersed in SBF during in vitro tests [102]. The in vitro tests are
conducted by immersing the samples for various periods of time in SBF kept at 36.5
°C and solution pH value of 7.4. There are several studies which were conducted to
find the correct SBF solution having composition most similar to that of human blood

44
plasma. For example, Kokubo et al. [102] designed the SBF consisting of only
inorganic ions having the concentration nearly equal to human blood plasma shown in
Table 2.5. Several SBFs (Table 2.5) were prepared in order to compensate the
difference in concentrations. However, it was recognized that increase in HCO3-
content may lead to precipitation of calcium carbonate from revised SBF (r-SBF)
[102]. Additionally, it was seen after round robin testing that there is no significant
difference between prepared SBFs in accordance with stability and reproducibility of
apatite [102]. Therefore, corrected SBF with refined recipe has been used in vitro
measurements to check the apatite forming abilities of materials. It is also stated that
SBF is a supersaturated solution therefore during preparation, every steps should be
done carefully [102].
Table 2.5 Ion concentration of various SBFs compared to that of human blood plasma
[101,102].
Solution Ion Concentration (mM)
Na+ K+ Mg2+ Ca2+ Cl- HCO3- HPO4
2- SO42-
Blood Plasma 142.0 3.6 -
5.5 1.0
2.1-
2.6
95.0-
107.0 27.0
0.65-
1.45 1.0
Human blood
plasma 142.0 5.0 1.5 2.5 103.0 27.0 1.0 0.5
Original SBF 142.0 5.0 1.5 2.5 148.8 4.2 1.0 0
Corrected SBF
(c-SBF)* 142.0 5.0 1.5 2.5 147.8 4.2 1.0 0.5
Revised SBF
(r-SBF) 142.0 5.0 1.5 2.5 103.0 27.0 1.0 0.5
Newly
improved SBF
(n-SBF)
142.0 5.0 1.5 2.5 103.0 4.2 1.0 0.5
* Corrected SBF(c-SBF) is used in the present study
During soaking in SBF, it has been proposed that sodium titanate layer in NaOH alkali
treated titanium surfaces dissolves in the solution and Na+ ions are released from the
surface and exchanged with H3O+ ions. These positively charged ions then react with
Ti-OH groups and combine with Ca2+ ions. Then, surface becomes positively charged
and available for possible nucleation of (PO4)3- ions due to Columbic attraction
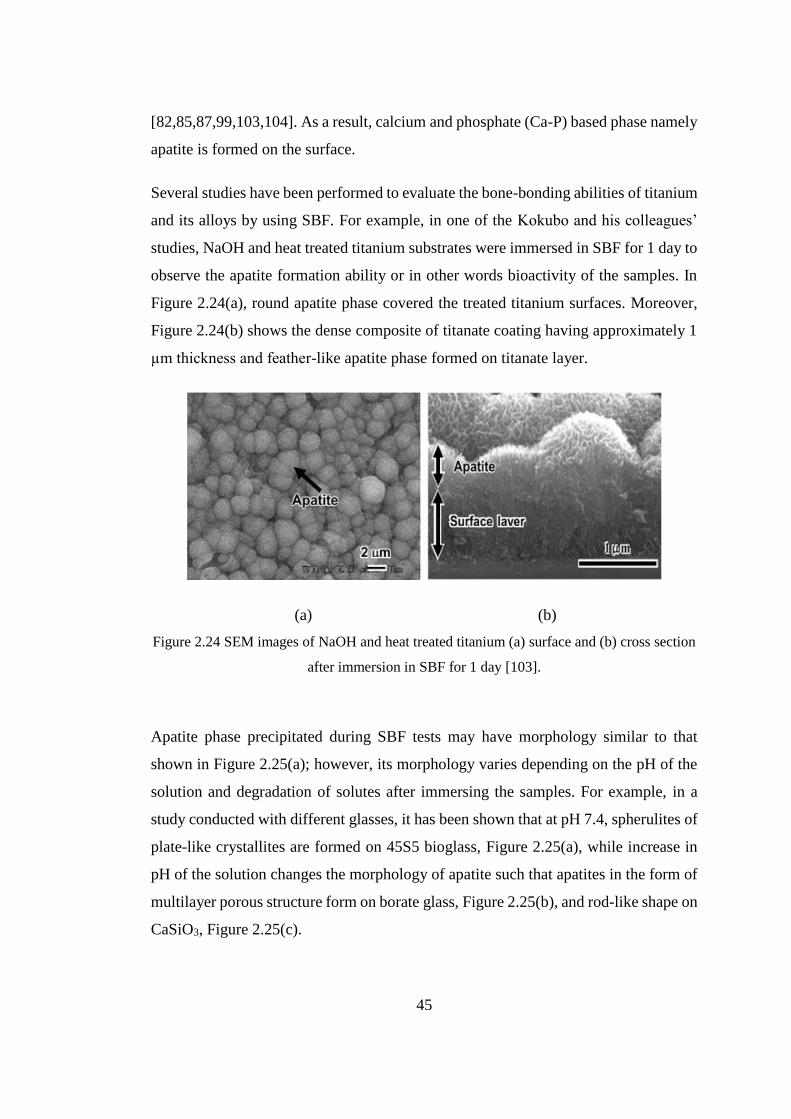
45
[82,85,87,99,103,104]. As a result, calcium and phosphate (Ca-P) based phase namely
apatite is formed on the surface.
Several studies have been performed to evaluate the bone-bonding abilities of titanium
and its alloys by using SBF. For example, in one of the Kokubo and his colleagues’
studies, NaOH and heat treated titanium substrates were immersed in SBF for 1 day to
observe the apatite formation ability or in other words bioactivity of the samples. In
Figure 2.24(a), round apatite phase covered the treated titanium surfaces. Moreover,
Figure 2.24(b) shows the dense composite of titanate coating having approximately 1
µm thickness and feather-like apatite phase formed on titanate layer.
(a) (b)
Figure 2.24 SEM images of NaOH and heat treated titanium (a) surface and (b) cross section
after immersion in SBF for 1 day [103].
Apatite phase precipitated during SBF tests may have morphology similar to that
shown in Figure 2.25(a); however, its morphology varies depending on the pH of the
solution and degradation of solutes after immersing the samples. For example, in a
study conducted with different glasses, it has been shown that at pH 7.4, spherulites of
plate-like crystallites are formed on 45S5 bioglass, Figure 2.25(a), while increase in
pH of the solution changes the morphology of apatite such that apatites in the form of
multilayer porous structure form on borate glass, Figure 2.25(b), and rod-like shape on
CaSiO3, Figure 2.25(c).
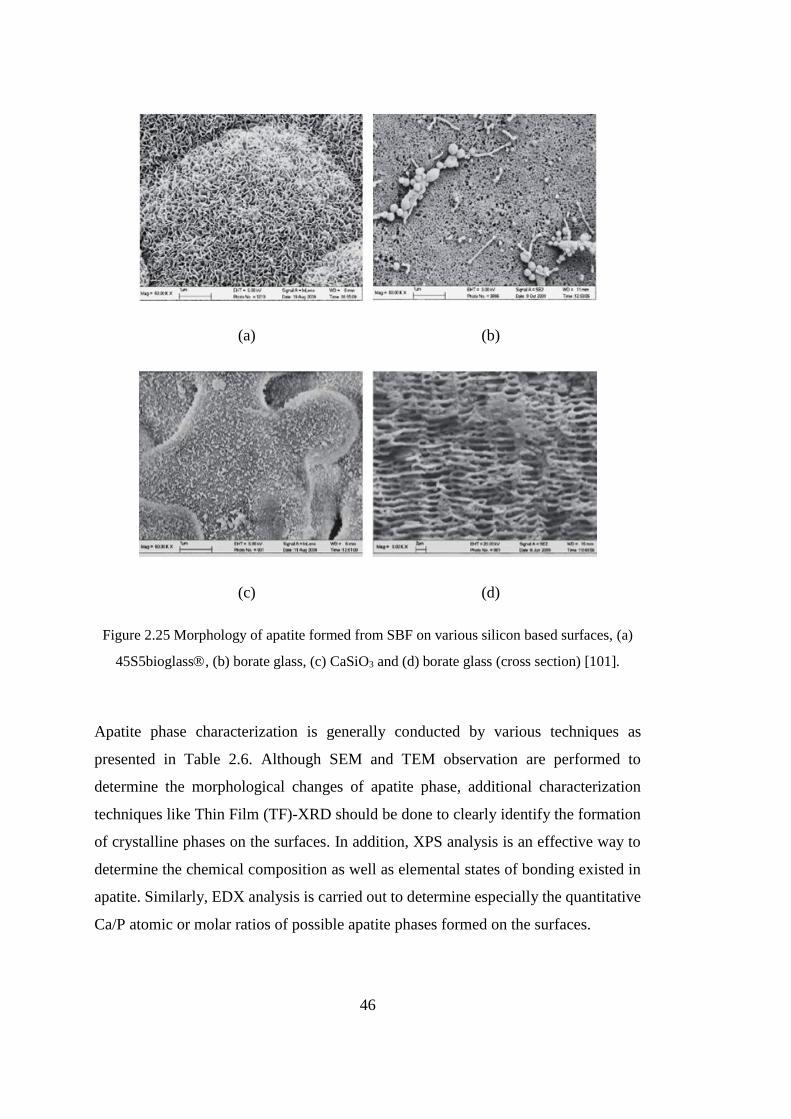
46
(a) (b)
(c) (d)
Figure 2.25 Morphology of apatite formed from SBF on various silicon based surfaces, (a)
45S5bioglass, (b) borate glass, (c) CaSiO3 and (d) borate glass (cross section) [101].
Apatite phase characterization is generally conducted by various techniques as
presented in Table 2.6. Although SEM and TEM observation are performed to
determine the morphological changes of apatite phase, additional characterization
techniques like Thin Film (TF)-XRD should be done to clearly identify the formation
of crystalline phases on the surfaces. In addition, XPS analysis is an effective way to
determine the chemical composition as well as elemental states of bonding existed in
apatite. Similarly, EDX analysis is carried out to determine especially the quantitative
Ca/P atomic or molar ratios of possible apatite phases formed on the surfaces.

47
Table 2.6 Characterization methods for apatite phase.
Characterization techniques Aim
Microscopic analysis TEM To check the presence of deposited phase
To determine morphological features SEM
X-Ray Diffraction
(XRD) Analysis TF-XRD To identify crystallized phases
Chemical Analysis
XPS To determine chemical states of bonding
EDS To display compositional change
To determine the atomic ratio of Ca/P

48
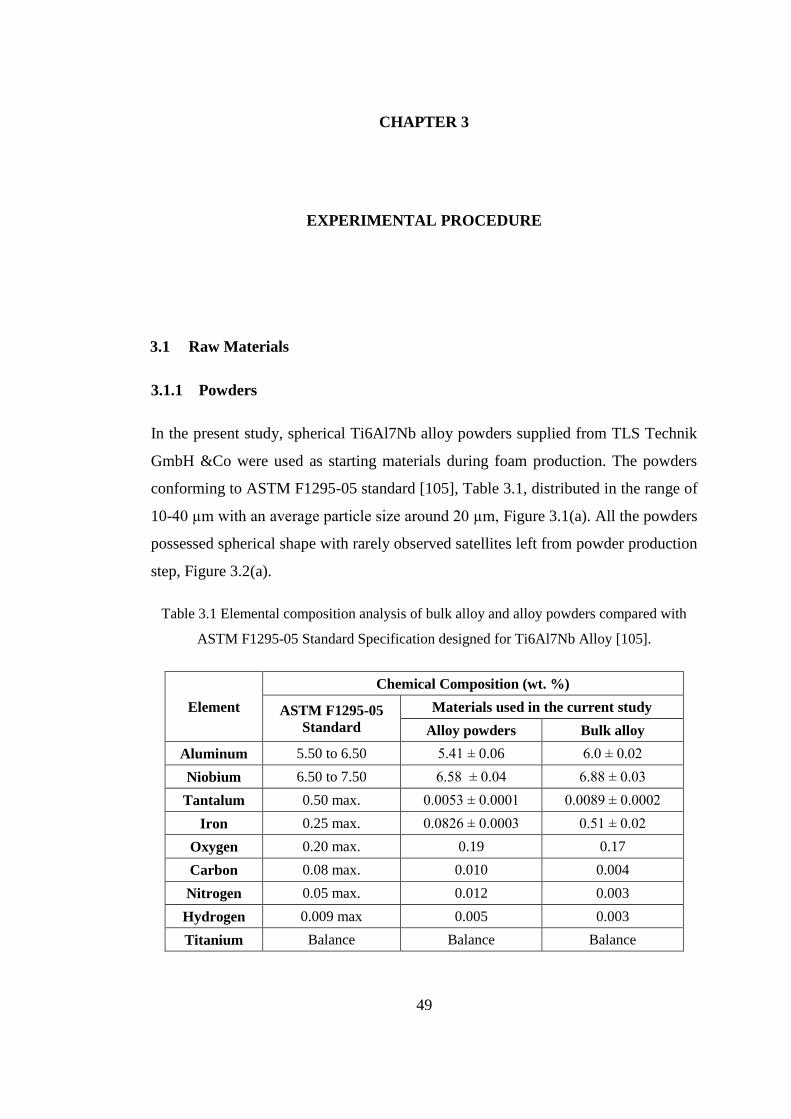
49
CHAPTER 3
EXPERIMENTAL PROCEDURE
3. EXPERIMENTAL PROCEDURE
3.1 Raw Materials
3.1.1 Powders
In the present study, spherical Ti6Al7Nb alloy powders supplied from TLS Technik
GmbH &Co were used as starting materials during foam production. The powders
conforming to ASTM F1295-05 standard [105], Table 3.1, distributed in the range of
10-40 µm with an average particle size around 20 µm, Figure 3.1(a). All the powders
possessed spherical shape with rarely observed satellites left from powder production
step, Figure 3.2(a).
Table 3.1 Elemental composition analysis of bulk alloy and alloy powders compared with
ASTM F1295-05 Standard Specification designed for Ti6Al7Nb Alloy [105].
Element
Chemical Composition (wt. %)
ASTM F1295-05
Standard
Materials used in the current study
Alloy powders Bulk alloy
Aluminum 5.50 to 6.50 5.41 ± 0.06 6.0 ± 0.02
Niobium 6.50 to 7.50 6.58 ± 0.04 6.88 ± 0.03
Tantalum 0.50 max. 0.0053 ± 0.0001 0.0089 ± 0.0002
Iron 0.25 max. 0.0826 ± 0.0003 0.51 ± 0.02
Oxygen 0.20 max. 0.19 0.17
Carbon 0.08 max. 0.010 0.004
Nitrogen 0.05 max. 0.012 0.003
Hydrogen 0.009 max 0.005 0.003
Titanium Balance Balance Balance
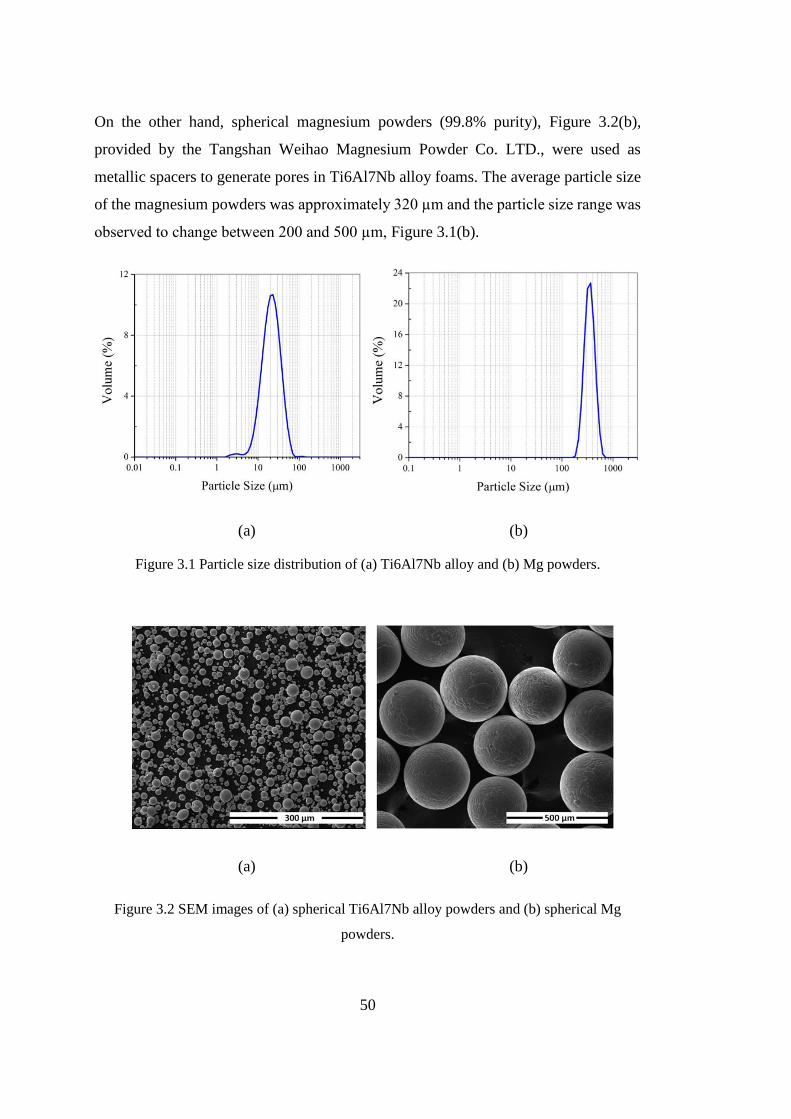
50
On the other hand, spherical magnesium powders (99.8% purity), Figure 3.2(b),
provided by the Tangshan Weihao Magnesium Powder Co. LTD., were used as
metallic spacers to generate pores in Ti6Al7Nb alloy foams. The average particle size
of the magnesium powders was approximately 320 µm and the particle size range was
observed to change between 200 and 500 µm, Figure 3.1(b).
(a) (b)
Figure 3.1 Particle size distribution of (a) Ti6Al7Nb alloy and (b) Mg powders.
(a) (b)
Figure 3.2 SEM images of (a) spherical Ti6Al7Nb alloy powders and (b) spherical Mg
powders.
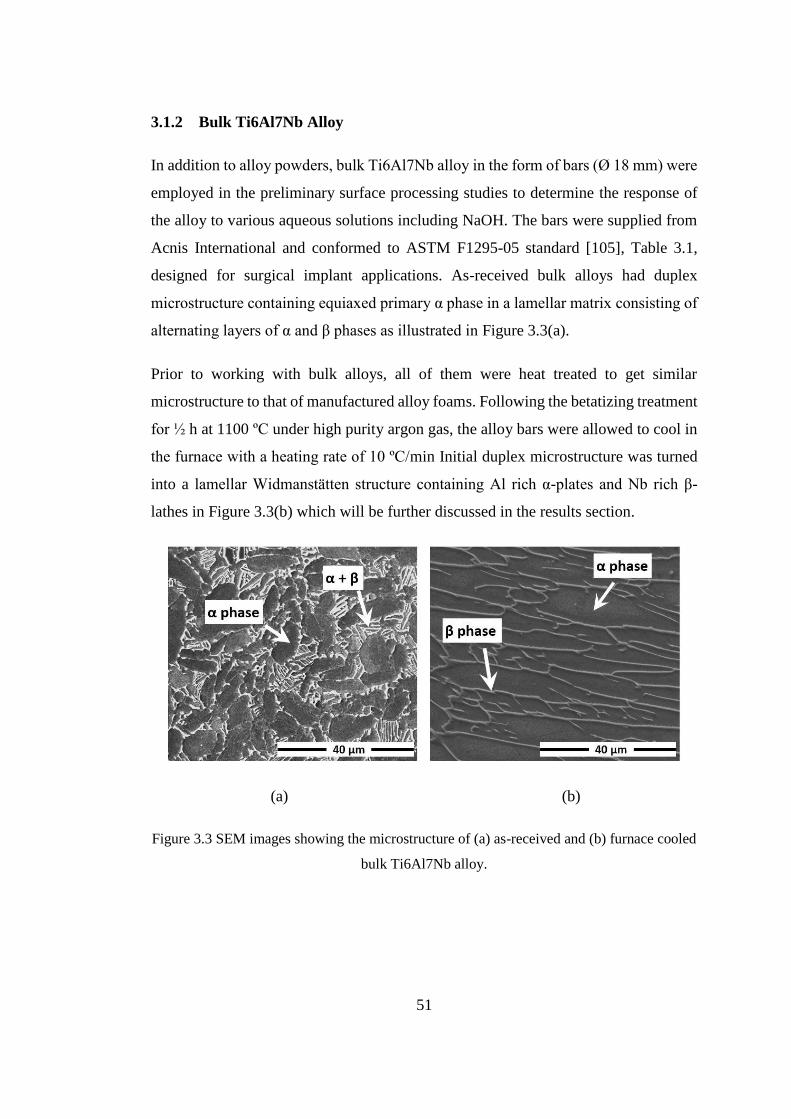
51
3.1.2 Bulk Ti6Al7Nb Alloy
In addition to alloy powders, bulk Ti6Al7Nb alloy in the form of bars (Ø 18 mm) were
employed in the preliminary surface processing studies to determine the response of
the alloy to various aqueous solutions including NaOH. The bars were supplied from
Acnis International and conformed to ASTM F1295-05 standard [105], Table 3.1,
designed for surgical implant applications. As-received bulk alloys had duplex
microstructure containing equiaxed primary α phase in a lamellar matrix consisting of
alternating layers of α and β phases as illustrated in Figure 3.3(a).
Prior to working with bulk alloys, all of them were heat treated to get similar
microstructure to that of manufactured alloy foams. Following the betatizing treatment
for ½ h at 1100 ºC under high purity argon gas, the alloy bars were allowed to cool in
the furnace with a heating rate of 10 ºC/min Initial duplex microstructure was turned
into a lamellar Widmanstätten structure containing Al rich α-plates and Nb rich β-
lathes in Figure 3.3(b) which will be further discussed in the results section.
(a) (b)
Figure 3.3 SEM images showing the microstructure of (a) as-received and (b) furnace cooled
bulk Ti6Al7Nb alloy.

52
3.2 Production of Ti6Al7Nb Alloy Foams
In the manufacturing of porous Ti6Al7Nb alloys, space holder method was performed
by means of evaporation of magnesium powders from cold compacted Ti6Al7Nb-Mg
powder mixtures at elevated temperature under high purity argon atmosphere. One of
the main reasons of choosing magnesium as a spacer material was its comparatively
higher oxidation affinity even at low temperatures like 650 °C, which helps
minimizing the oxidation of titanium during foam manufacture. Also, magnesium can
be removed completely by evaporation unlike the other spacers like carbamide,
ammonium hydrogen carbonate, and polymeric granules which may leave residue
behind them. Additionally, insufficient evaporation of spacers other than magnesium
may lead to a decrease in mechanical properties due to the contamination of the
titanium by some interstitials that come from spacers [39,48].
Amount of the porosity, pore shape and size not only influence the mechanical
properties of the foams but also play a significant role in bone growth and
transportation of body fluid throughout the pores in biomedical applications.
Therefore, to obtain desirable pore size during foam production, magnesium powders
were sieved to get particle size in the range of 250-355 µm which is the suitable size
for bone ingrowth. In addition, different amounts of magnesium powders; 60, 70 and
80 vol. %, were added to Ti6Al7Nb alloy powders to get foams with various porosity
contents and mechanical properties.
The foam manufacturing started by mixing of spherical Ti6Al7Nb alloy powders and
magnesium powders with the addition of around 5 wt. % of poly vinyl alcohol (PVA)
solution (2.5 % PVA ([ -CH2CHOH- ]n)+pure water). PVA which acted as binder was
also used to cover surfaces of Mg powders for better attachment of Ti6Al7Nb alloy
powders during mixing step. After obtaining homogenous powder mixtures, cold
compression of Ti6Al7Nb-Mg powder mixtures was carried out at an approximate
compaction pressure of 500 MPa using a double ended steel die having 10 mm
diameter. Prior to compaction, the die surfaces were covered with a thin layer of zinc
stearate (C36H70O4Zn) which acted as a lubricant to minimize the friction between die

53
and powder mixtures. Next, the obtained green compacts were inserted into titanium
alloy crucibles prior to placing them in the hot zone of a laboratory type vertical
atmosphere controlled tubular furnace. Additionally, titanium sponge particles ( 2-3
mm) were filled into crucibles above the green compacts, which were considered to
minimize possible oxidation of samples due to flowing argon gas (Ar >99.999%, O2
<5 vpm, H2O <4 vpm) containing trace amount of oxidizing species.
Before heating the tubular furnace, air in the furnace was removed by a rotary type
vacuum pump and then, the furnace was re-filled with high purity argon gas which
was allowed to flow at least 5 min. Vacuum degassing-argon purging cycle was
repeated 3 times to ensure that the furnace was fully filled with high purity Ar gas
before starting foam production and sintering process. Following this, compacted
samples were heated up to sintering temperature, 1200 °C, with a heating rate of 10
°C/min so as to produce Ti6Al7Nb foams by evaporation of magnesium powders. The
samples were kept at the sintering temperature for 1 h for complete removal of
magnesium and to allow sufficient sintering of titanium alloy powders.
3.3 Surface Processing
Present part of the study was aimed to activate the surfaces of porous Ti6Al7Nb alloys
by formation of sodium rich titanate phase (Na2TiyO2y+1), which is proposed to be
bioactive and integrate with living bone by forming a bonelike apatite layer on its
surface in body fluid. The hydrothermal surface processing method includes two steps,
namely, treatment in NaOH aqueous solution and subsequent heat treatment of the
coating layer. However, the hydrothermal processing parameters like the temperature
of NaOH solution and its concentration have to be optimized in addition to subsequent
heat treatment temperature to get chemically homogenous uniform sodium titanate
phase on the porous surfaces. Since it is comparatively easier to process and
characterize the bulk samples, preliminary process parameter optimization studies
have been conducted by using bulk Ti6Al7Nb alloy samples. Then, porous samples
were surface processed with optimized variables determined by the use of bulk alloys.
Hydrothermal surface processing with aqueous NaOH solution was carried out in high
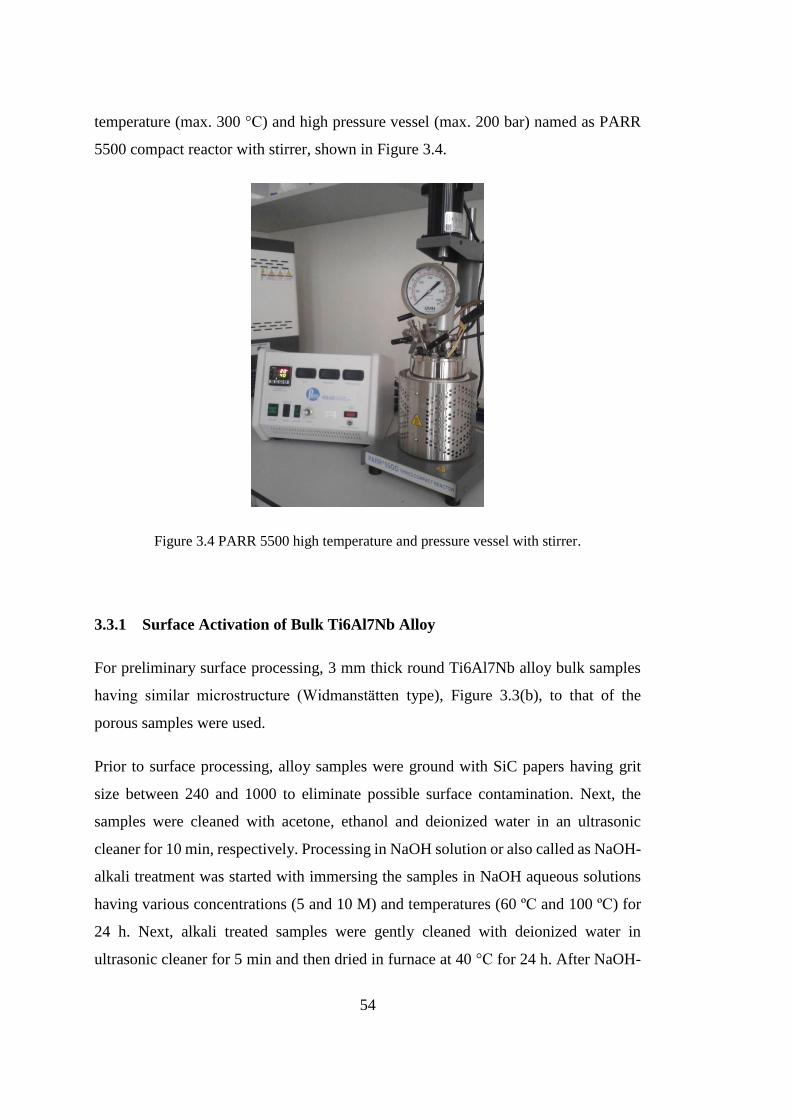
54
temperature (max. 300 °C) and high pressure vessel (max. 200 bar) named as PARR
5500 compact reactor with stirrer, shown in Figure 3.4.
Figure 3.4 PARR 5500 high temperature and pressure vessel with stirrer.
3.3.1 Surface Activation of Bulk Ti6Al7Nb Alloy
For preliminary surface processing, 3 mm thick round Ti6Al7Nb alloy bulk samples
having similar microstructure (Widmanstätten type), Figure 3.3(b), to that of the
porous samples were used.
Prior to surface processing, alloy samples were ground with SiC papers having grit
size between 240 and 1000 to eliminate possible surface contamination. Next, the
samples were cleaned with acetone, ethanol and deionized water in an ultrasonic
cleaner for 10 min, respectively. Processing in NaOH solution or also called as NaOH-
alkali treatment was started with immersing the samples in NaOH aqueous solutions
having various concentrations (5 and 10 M) and temperatures (60 ºC and 100 ºC) for
24 h. Next, alkali treated samples were gently cleaned with deionized water in
ultrasonic cleaner for 5 min and then dried in furnace at 40 °C for 24 h. After NaOH-

55
treatment, crystallization heat treatment was conducted at different temperatures (500,
600 and 700 ºC). Details of investigated processing parameters have been presented in
Table 3.2.
Table 3.2 NaOH-alkali and subsequent heat treatment process parameters.
SET
NaOH-alkali treatment Heat treatment in air
Solution
concentration
(M)
Solution
temperature
(⁰C)
Holding
time
(h)
Temperature
(⁰C)
Time
(h)
SET A
A-1
5 60
24
No HT*
1
A-2 500
A-3 600
A-4 700
SET B
B-1
10 60
No HT*
B-2 500
B-3 600
B-4 700
SET C C-1 5 100 700
*No heat treatment
3.3.2 Surface Activation of Porous Ti6Al7Nb Alloy
In the second part of the surface processing studies, optimized processing variables
(concentration and temperature of NaOH solution and subsequent heat treatment
temperature) obtained from bulk alloy surface studies were applied to porous
Ti6Al7Nb alloys. For this purpose, the foam sample with around 73 % vol. porosity
and interconnected pore structure was chosen to ensure that NaOH solution can
penetrate to all pores during hydrothermal treatment. As-manufactured porous samples
were initially immersed in 5 M NaOH solution at 60 °C for 24 h and subsequent heat
treatment was performed at 600 °C in air for 1 h. Moreover, one group of porous
samples was left in untreated condition to identify the changes during surface
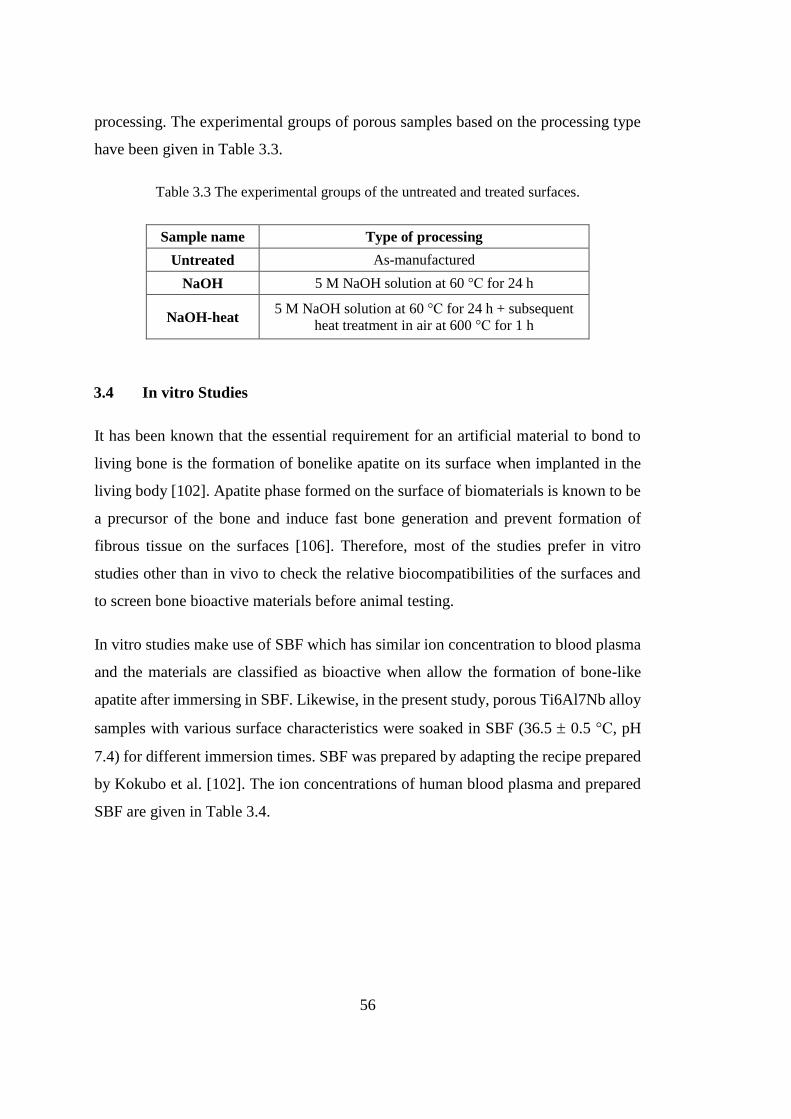
56
processing. The experimental groups of porous samples based on the processing type
have been given in Table 3.3.
Table 3.3 The experimental groups of the untreated and treated surfaces.
Sample name Type of processing
Untreated As-manufactured
NaOH 5 M NaOH solution at 60 °C for 24 h
NaOH-heat 5 M NaOH solution at 60 °C for 24 h + subsequent
heat treatment in air at 600 °C for 1 h
3.4 In vitro Studies
It has been known that the essential requirement for an artificial material to bond to
living bone is the formation of bonelike apatite on its surface when implanted in the
living body [102]. Apatite phase formed on the surface of biomaterials is known to be
a precursor of the bone and induce fast bone generation and prevent formation of
fibrous tissue on the surfaces [106]. Therefore, most of the studies prefer in vitro
studies other than in vivo to check the relative biocompatibilities of the surfaces and
to screen bone bioactive materials before animal testing.
In vitro studies make use of SBF which has similar ion concentration to blood plasma
and the materials are classified as bioactive when allow the formation of bone-like
apatite after immersing in SBF. Likewise, in the present study, porous Ti6Al7Nb alloy
samples with various surface characteristics were soaked in SBF (36.5 0.5 °C, pH
7.4) for different immersion times. SBF was prepared by adapting the recipe prepared
by Kokubo et al. [102]. The ion concentrations of human blood plasma and prepared
SBF are given in Table 3.4.

57
Table 3.4 Ion concentration of prepared SBF and human blood plasma [102].
Ion Ion Concentration (mM)
Blood plasma SBF
Na+ 142.0 142.0
K+ 5.0 5.0
Mg2+ 1.5 1.5
Ca2+ 2.5 2.5
Cl- 103.0 147.8
HCO3- 27.0 4.2
HPO42- 1.0 1.0
SO42- 0.5 0.5
pH 7.2-7.4 7.40
At the initial stage of the preparation of SBF, a polyethylene bottle containing 700 ml
ion-exchanged deionized water with 8.4 pH was placed on a temperature controlled
magnetic stirrer. Then, the temperature was set to 36.5 ± 0.5 °C and stirring speed was
adjusted to moderate agitation mode. Reagents, shown in Table 3.5, were dissolved in
the sequence of sodium chloride (NaCl), sodium hydrogen carbonate (NaHCO3),
potassium chloride (KCl), di-potassium hydrogen phosphate trihydrate
(K2HPO4.3H2O), magnesium chloride hexahydrate (MgCl2.6H2O), HCl, calcium
chloride (CaCl2) and sodium sulfate (Na2SO4). Special attention had been given during
dissolving CaCl2 and the weighted amount was added part by part in small quantities.
Complete dissolution of the CaCl2 particles was allowed by addition to solution in 7
or 8 steps.

58
Table 3.5 Order of mixing, formula weight and amount of the reagents needed for
preparation of one liter SBF [102].
Order Reagent Formula weight Amount
1 NaCl 58.4430 8.035 g
2 NaHCO3 84.0068 0.355 g
3 KCl 74.5515 0.225 g
4 K2HPO4. 3H2O 228.2220 0.231 g
5 MgCl2. 6H2O 203.3034 0.311 g
6 1.0 M HCl - 39 ml
7 CaCl2 110.9848 0.292 g
8 Na2SO4 142.0428 0.072 g
9 Tris 121.1356 6.118 g
10 1.0 M HCl - 0-5 ml
After each reagent dissolved completely, volume of the solution was increased to 900
ml. At this point, pH and temperature of this solution were tried to be kept around 2.0
± 1.0 and 36.5 ± 0.5 °C. Then, the solution was buffered with addition of small amount
of Tris-hydroxymethyl aminomethane (Tris, (HOCH2)3CNH2) to prevent sudden
increase in the pH value. Addition of Tris was continued until pH of the solution
reached to 7.30 ± 0.05 when the temperature was 36.5 ± 0.5 °C. The final pH was
adjusted to 7.4 by addition of Tris and 1.0 M hydrochloric acid (HCl) one by one with
specific proportions to compensate the effect of each substance. After being ensured
that pH was 7.4 and temperature exactly was at 36.5 °C, the volume of the solution
was increased to 1000 ml. Finally, the prepared solution was allowed to cool down to
room temperature naturally in open environment, then put into the refrigerator kept at
around 5-10 °C.
After preparation of SBF, apatite formation ability of samples was investigated. In this
context, as-manufactured porous samples and those which were exposed to different
surface treatment processes were immersed in SBF for 1, 5 and 15 days, respectively.
The temperature of the SBF solution during tests was maintained at 36.5 ± 0.5 °C and
it was refreshed in every two days to stabilize ion concentration in the test
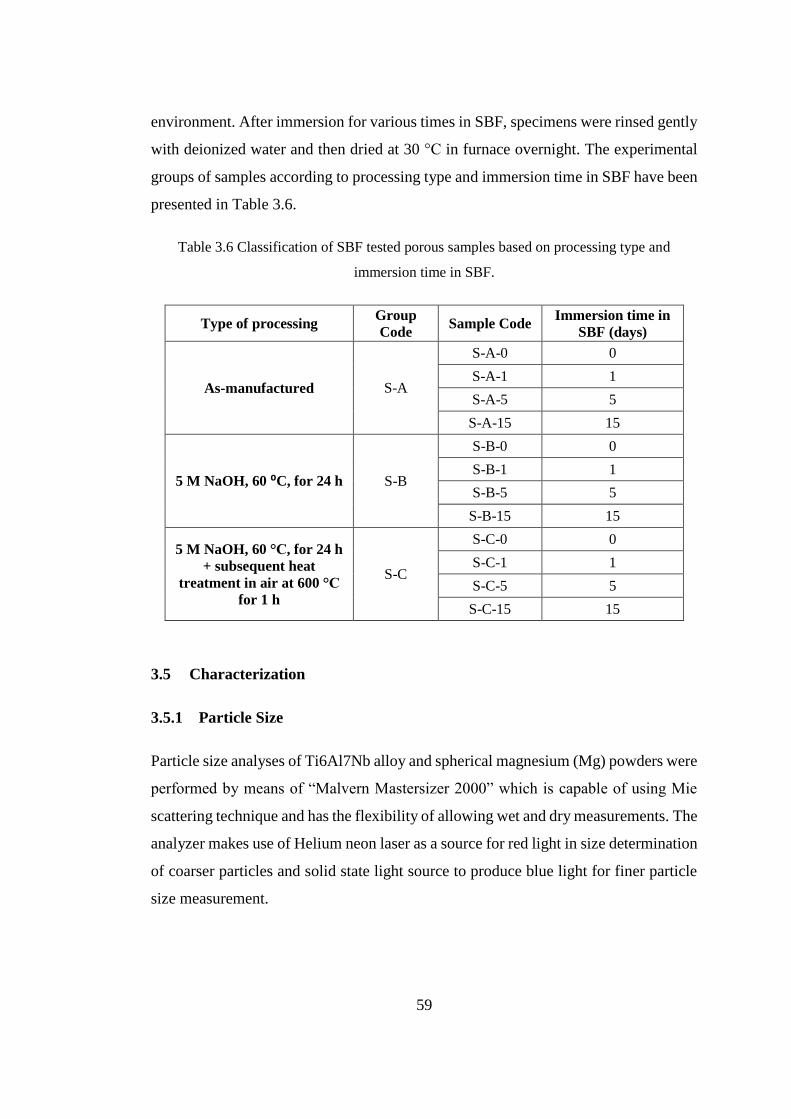
59
environment. After immersion for various times in SBF, specimens were rinsed gently
with deionized water and then dried at 30 °C in furnace overnight. The experimental
groups of samples according to processing type and immersion time in SBF have been
presented in Table 3.6.
Table 3.6 Classification of SBF tested porous samples based on processing type and
immersion time in SBF.
Type of processing Group
Code Sample Code
Immersion time in
SBF (days)
As-manufactured S-A
S-A-0 0
S-A-1 1
S-A-5 5
S-A-15 15
5 M NaOH, 60 ⁰C, for 24 h S-B
S-B-0 0
S-B-1 1
S-B-5 5
S-B-15 15
5 M NaOH, 60 °C, for 24 h
+ subsequent heat
treatment in air at 600 °C
for 1 h
S-C
S-C-0 0
S-C-1 1
S-C-5 5
S-C-15 15
3.5 Characterization
3.5.1 Particle Size
Particle size analyses of Ti6Al7Nb alloy and spherical magnesium (Mg) powders were
performed by means of “Malvern Mastersizer 2000” which is capable of using Mie
scattering technique and has the flexibility of allowing wet and dry measurements. The
analyzer makes use of Helium neon laser as a source for red light in size determination
of coarser particles and solid state light source to produce blue light for finer particle
size measurement.
60
3.5.2 Chemical Composition Analysis
The elemental compositions of the as-received Ti6Al7Nb powders and bars were
measured using inductively coupled plasma optical emission spectroscope (ICP-OES)
“Perkin Elmer Optima 4300DV”. Results were calculated by taking the average of
three measurements. The analyzer measures the lower concentration of elements by
using argon plasma (at 6000-10000 °K) to excite atoms in analysis sample. Elements
are determined by measuring the characteristic radiation released from the excited
atoms passed through the lower energy state.
3.5.3 O, H, N, C Contents
O, H and N contents as well as C content of Ti6Al7Nb alloy samples (as-received
Ti6Al7Nb powders and bulk alloy and as-manufactured Ti6Al7Nb foams) were
measured with “a LECO TCH 600 Simultaneous N, O, H Determinator” and “LECO
CS 230 C, S Determinator”, respectively. For each specimen, three measurements
were utilized in order to obtain more accurate results.
3.5.4 X-ray Photoelectron Spectroscopy (XPS)
The surface chemical compositions of as-manufactured and surface processed samples
both in foam and bulk form were analyzed by X-ray Photoelectron Spectroscopy, XPS,
“PHI 5000 VersaProbe” using monochromatised Al radiation. Samples were
examined by general surface scan (Al mono 48.1 W, 200.0 μm, 187.85 eV) and to
obtain a depth profile four layers’ chemical compositions were measured after
sputtering with argon gas for at least 3 min at each depth (Al mono 24.5 W, 100.0 μm,
58.70 eV). The samples were positioned with respect to the analyzer at the electron
take off angle 45o to the surface. The measured binding energies were corrected
referring to the energy position of C1s in CH2 (284.6 eV).
3.5.5 Structural Analysis by X-ray Diffraction Analysis (XRD)
X-ray diffraction (XRD) analysis was utilized to examine the phase constituents of as-
manufactured and surface treated bulk and porous samples. Analysis was performed
61
by using a conventional X-ray diffractometer “Rigaku D/Max 2200/PC, Rigaku
Corporation, Tokyo, Japan” (Cu-Kα radiation operating at 40kV) by continuous
scanning between 10⁰ and 70⁰ 2 angles with a scan speed of 1˚/min
X-Ray diffractograms of SBF immersed samples were taken by continuous scanning
(0.2 o/min) between 20⁰ to 40 2θ angles using “Bruker D8 Advance Eco model X-Ray
Diffractometer”.
Phases analysis of surface treated (NaOH and NaOH-heat) bulk Ti6Al7Nb alloy
samples, on the other hand, were performed by Thin Film X-ray Diffraction (TF-XRD)
technique so as to detect nano metric titanate layers on substrates’ surface. In this
regard, TF-XRD analyses were performed with “Rigaku Ultima-IV X-ray
Diffractomer” at 40kW between 10⁰ and 70⁰ 2 angles with a grazing angle of 1°.
3.5.6 Microstructural Analysis
Morphological and microstructural examination of as-received, as-manufactured and
surface treated bulk and porous Ti6Al7Nb alloy samples were performed by “FEI 430
Nano Scanning Electron Microscope” (SEM) equipped with an energy dispersive X-
ray spectroscopy (EDS) analyzer. Microstructural examination of as-manufactured
Ti6Al7Nb foams were made across the cross-sections of epoxy resin impregnated
foams, while the other samples were examined without applying the mounting process.
Moreover, samples were examined in the etched condition after grinding and polishing
the surfaces using SiC papers 220-2000 grit size and alumina (1 and 0.1 m) suspended
solution, respectively. The etchant used throughout the metallographic examinations
was Kroll’s Reagent (10 ml HF, 5 ml HNO3 and 85 ml H2O).
3.5.7 Atomic Force microscopy (AFM)
The surface roughness and three dimensional topography of as-received bulk
Ti6Al7Nb surface prior to surface processing were examined with “Nanomagnetics
Instruments Atomic Force Microscope” (AFM) on 10 µm by 10 µm scans using
tapping mode.
62
3.5.8 Density Measurement
Density and porosity (total, open and closed) content of as-manufactured Ti6Al7Nb
foams were evaluated by weight measurement on the basis of the Archimedes’
principle using Xylol solution (CH3C6H4CH3) by PRECISA XB220A balance
equipped with a density determination kit.
First of all, samples were weighed in dry condition in air and then submerged into xylol
solution kept in desiccators. Vacuum was applied to desiccators for penetration of
xylol solution completely in foams and vacuum pumping continued for 30 min in order
to ensure full penetration of xylol solution throughout the pores. Then, foams were
placed in a beaker filled with xylol solution and the weights of the foams were
measured when they were in the solution. Finally, foams were taken from solution and
immediately the weight of xylol impregnated foams were measured in air.
During determination of total porosity percentages of foams, Ptotal (%), by Eq. (3.3),
volumes of the foams, Vfoam, were initially calculated according to Eq. (3.1). Then, the
densities of the foams, ρfoam, were determined using Eq. (3.2) where density of xylol
(ρxylol) and density of bulk Ti6Al7Nb alloy (ρTi6Al7Nb) are taken as 0.861 g/cm3 and
4.52 g/cm3, respectively.
Vfoam =ma,x − mx,x
ρxylol (3.1)
ρfoam =ma
Vfoam
(3.2)
Ptotal(%) = 100 − (ρfoam
ρTi6Al7Nbx100)
(3.3)
63
Where,
ma: mass of the foam in air
ma,x: mass of xylol impregnated foam in air
mx,x: mass of xylol impregnated foam in xylol solution
Percentages of open and closed porosities, Popen (%) and Pclose (%), of the Ti6Al7Nb
foams, on the other hand, were determined by Eqs. (3.4) and (3.5).
Popen (%) =
volume of xylol in pores
volume of the foamx100
= (
ma,x − maρxylol
⁄
ma,x − mx,xρxylol
⁄) x100
(3.4)
Pclosed(%) = Ptotal (%) − Popen (%) (3.5)
3.5.9 Mechanical Characterization
In order to characterize the stress-strain behavior of Ti6Al7Nb foams, compression
tests were performed by a 100 kN capacity “Instron 5582 Universal Testing Machine”
using a crosshead-speed of 0.5 mm/min In addition, video extensometer equipment,
“Instron 2663-821, Instron Co. LTD., Norwood, USA”, was also used to measure the
dimensional change during the tests. Quasi-static compression tests were performed
for both as-manufactured and surface processed foams produced using various
processing parameters. For comparison, compression tests were also carried out on the
bulk and as-sintered Ti6Al7Nb alloy samples. Height (H) / Diameter (D) ratio of the
samples was maintained at around one to prevent buckling or non-homogenous

64
deformation. Compressive yield strength values were calculated by 0.2% offset
method and the slope of the stress-strain diagram in linear region was used to calculate
the elastic modulus of the foams. Finally, based on the experimental results empirical
models were derived to index the porosity-elastic modulus and porosity-yield strength
relations of the foams.
65
CHAPTER 4
RESULTS
4. RESULTS
This chapter consists of three main parts related to the production of Ti6Al7Nb alloy
foams, surface processing of both bulk and porous Ti6Al7Nb alloys, and in vitro
studies conducted using SBF to check apatite formation. Characterization studies
including structural, image, surface, elemental and mechanical analyses are presented
and also, the obtained results are discussed.
In the first part of the study, space holder method via evaporation of magnesium was
utilized to produce highly porous Ti6Al7Nb alloy scaffolds having interconnected
porous structure in order to prevent or alleviate the stress shielding problem
encountered in bulk alloys. Then, the mechanical behavior of manufactured foams was
investigated by quasi-static compression tests. Additionally, MSA model was used to
index the mechanical properties, i.e. yield strength and elastic modulus-porosity
relation of manufactured foams. Although porous structures enable mechanical
fixation and create suitable place for bone ingrowth, they do not allow direct structural
and functional connection with bone. Therefore, the second part of the study was
aimed to provide desired surface properties for foams by conducting NaOH alkali and
heat treatment which lead to formation of bioactive sodium titanate (Na2TiyO2y+1)
layers. Before the surface activation of Ti6Al7Nb foams, optimum surface processing
parameters were determined by the preliminary studies conducted on bulk Ti6Al7Nb
samples. Then, porous Ti6Al7Nb samples were subjected to NaOH alkali and
subsequent heat treatment processes using optimized variables. Finally, to check the
bioactivity of alkali treated porous surfaces and the mechanism of apatite formation,
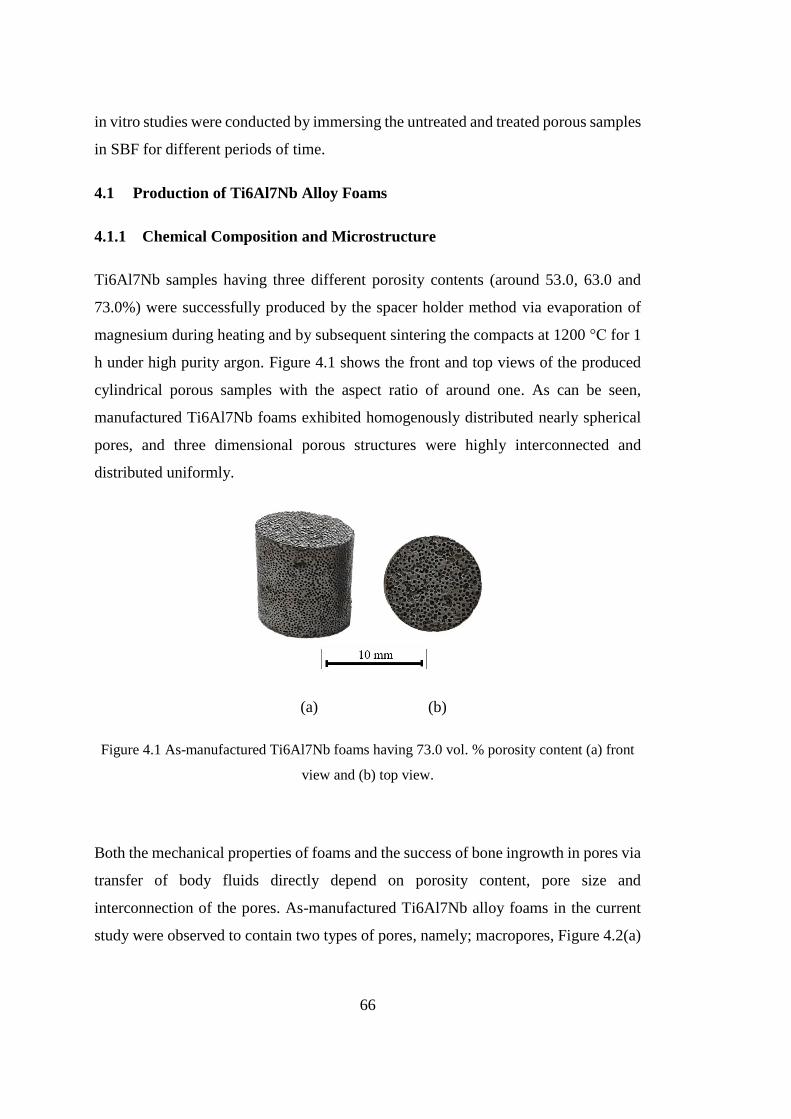
66
in vitro studies were conducted by immersing the untreated and treated porous samples
in SBF for different periods of time.
4.1 Production of Ti6Al7Nb Alloy Foams
4.1.1 Chemical Composition and Microstructure
Ti6Al7Nb samples having three different porosity contents (around 53.0, 63.0 and
73.0%) were successfully produced by the spacer holder method via evaporation of
magnesium during heating and by subsequent sintering the compacts at 1200 °C for 1
h under high purity argon. Figure 4.1 shows the front and top views of the produced
cylindrical porous samples with the aspect ratio of around one. As can be seen,
manufactured Ti6Al7Nb foams exhibited homogenously distributed nearly spherical
pores, and three dimensional porous structures were highly interconnected and
distributed uniformly.
(a) (b)
Figure 4.1 As-manufactured Ti6Al7Nb foams having 73.0 vol. % porosity content (a) front
view and (b) top view.
Both the mechanical properties of foams and the success of bone ingrowth in pores via
transfer of body fluids directly depend on porosity content, pore size and
interconnection of the pores. As-manufactured Ti6Al7Nb alloy foams in the current
study were observed to contain two types of pores, namely; macropores, Figure 4.2(a)
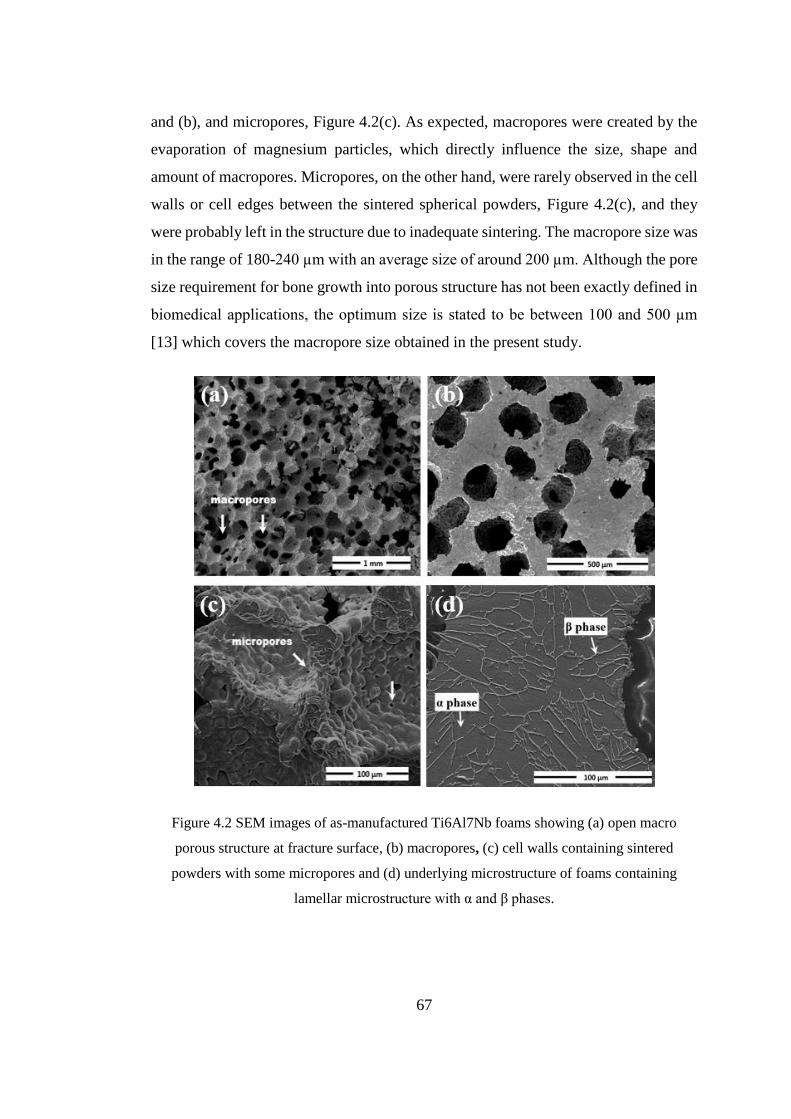
67
and (b), and micropores, Figure 4.2(c). As expected, macropores were created by the
evaporation of magnesium particles, which directly influence the size, shape and
amount of macropores. Micropores, on the other hand, were rarely observed in the cell
walls or cell edges between the sintered spherical powders, Figure 4.2(c), and they
were probably left in the structure due to inadequate sintering. The macropore size was
in the range of 180-240 µm with an average size of around 200 µm. Although the pore
size requirement for bone growth into porous structure has not been exactly defined in
biomedical applications, the optimum size is stated to be between 100 and 500 µm
[13] which covers the macropore size obtained in the present study.
Figure 4.2 SEM images of as-manufactured Ti6Al7Nb foams showing (a) open macro
porous structure at fracture surface, (b) macropores, (c) cell walls containing sintered
powders with some micropores and (d) underlying microstructure of foams containing
lamellar microstructure with α and β phases.
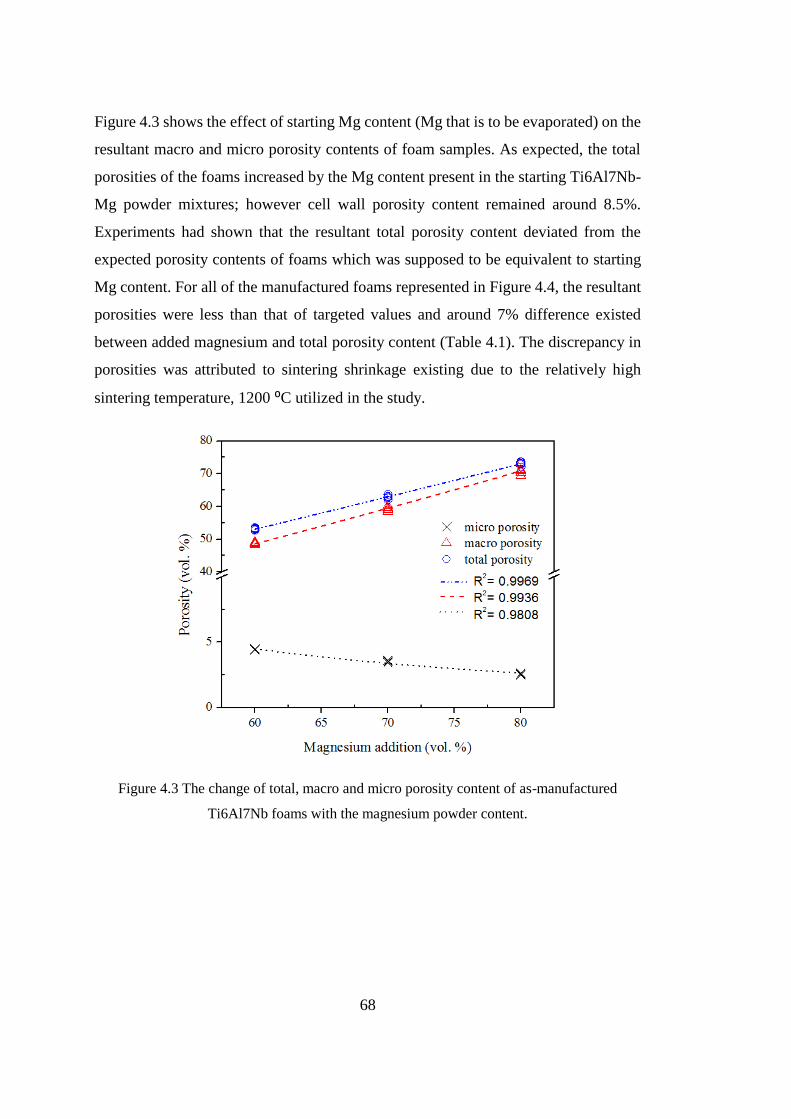
68
Figure 4.3 shows the effect of starting Mg content (Mg that is to be evaporated) on the
resultant macro and micro porosity contents of foam samples. As expected, the total
porosities of the foams increased by the Mg content present in the starting Ti6Al7Nb-
Mg powder mixtures; however cell wall porosity content remained around 8.5%.
Experiments had shown that the resultant total porosity content deviated from the
expected porosity contents of foams which was supposed to be equivalent to starting
Mg content. For all of the manufactured foams represented in Figure 4.4, the resultant
porosities were less than that of targeted values and around 7% difference existed
between added magnesium and total porosity content (Table 4.1). The discrepancy in
porosities was attributed to sintering shrinkage existing due to the relatively high
sintering temperature, 1200 ⁰C utilized in the study.
Figure 4.3 The change of total, macro and micro porosity content of as-manufactured
Ti6Al7Nb foams with the magnesium powder content.
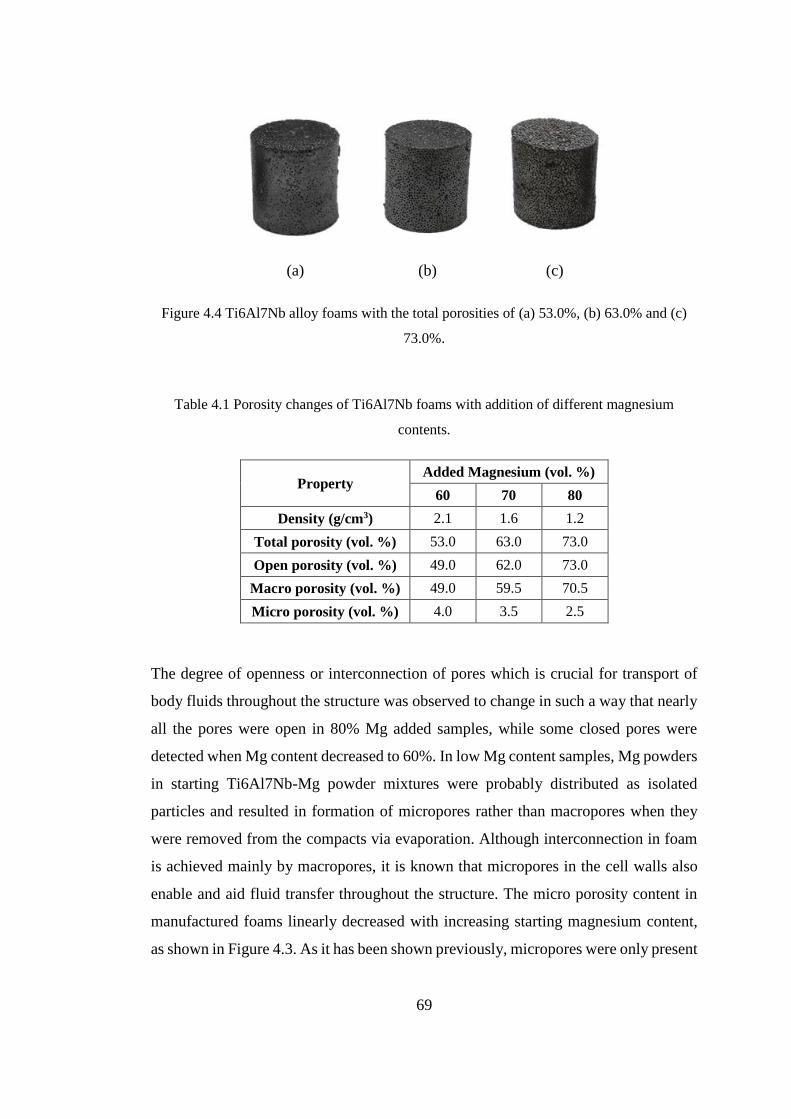
69
(a) (b) (c)
Figure 4.4 Ti6Al7Nb alloy foams with the total porosities of (a) 53.0%, (b) 63.0% and (c)
73.0%.
Table 4.1 Porosity changes of Ti6Al7Nb foams with addition of different magnesium
contents.
Property Added Magnesium (vol. %)
60 70 80
Density (g/cm3) 2.1 1.6 1.2
Total porosity (vol. %) 53.0 63.0 73.0
Open porosity (vol. %) 49.0 62.0 73.0
Macro porosity (vol. %) 49.0 59.5 70.5
Micro porosity (vol. %) 4.0 3.5 2.5
The degree of openness or interconnection of pores which is crucial for transport of
body fluids throughout the structure was observed to change in such a way that nearly
all the pores were open in 80% Mg added samples, while some closed pores were
detected when Mg content decreased to 60%. In low Mg content samples, Mg powders
in starting Ti6Al7Nb-Mg powder mixtures were probably distributed as isolated
particles and resulted in formation of micropores rather than macropores when they
were removed from the compacts via evaporation. Although interconnection in foam
is achieved mainly by macropores, it is known that micropores in the cell walls also
enable and aid fluid transfer throughout the structure. The micro porosity content in
manufactured foams linearly decreased with increasing starting magnesium content,
as shown in Figure 4.3. As it has been shown previously, micropores were only present
70
on the cell walls and the volume percentages of cell walls decrease as Mg content
increases. Therefore, micro porosity content in foam samples decreased as added Mg
increased so that the content of macro porosity finally reached to a value closer to total
porosity content.
The structural and functional properties of foams were affected from underlying
microstructure as well as the type and content of porosity created. Figure 4.2(d) shows
the underlying microstructures of Ti6Al7Nb foams that were cooled slowly
subsequent to sintering at 1200 °C. Cooling slowly in the furnace from beta phase
region, 1200oC, down to room temperature resulted in formation of Widmanstätten
lamellar type microstructure consisting of alpha and beta phases. The dark alpha phase
was rich in α-stabilizer element, namely, aluminum (8.60 wt. %Al, 6.49 wt. %Nb),
while bright beta phase was aluminum depleted phase and contained relatively high
content of niobium (5.60 wt. % Al, 18.45 wt. % Nb) as given in Table 4.2.
Table 4.2 EDX results of α and β phases in as-manufactured foams.
Phase Element (wt. %)
Ti Al Nb
α-phase 84.91 8.60 6.49
β-phase 75.95 5.60 18.45
Figure 4.5 shows the XRD diffraction patterns of as-received Ti6Al7Nb powders and
as-manufactured Ti6Al7Nb foams. As it can be seen, no residual magnesium was left
and foam manufacturing process resulted in neither oxides such as TiO, Ti2O or Ti3O5,
nor nitrides of titanium despite the high chemical affinity of titanium in environment
containing oxygen, water vapor or air [48].
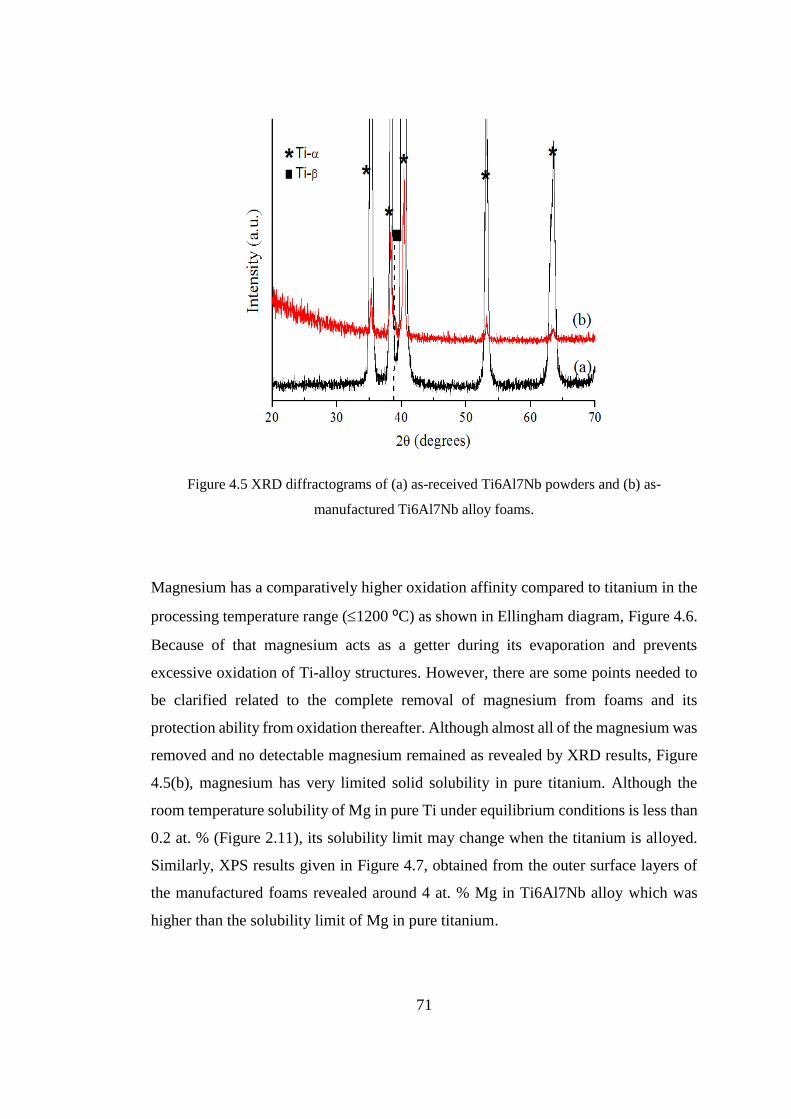
71
Figure 4.5 XRD diffractograms of (a) as-received Ti6Al7Nb powders and (b) as-
manufactured Ti6Al7Nb alloy foams.
Magnesium has a comparatively higher oxidation affinity compared to titanium in the
processing temperature range (1200 ⁰C) as shown in Ellingham diagram, Figure 4.6.
Because of that magnesium acts as a getter during its evaporation and prevents
excessive oxidation of Ti-alloy structures. However, there are some points needed to
be clarified related to the complete removal of magnesium from foams and its
protection ability from oxidation thereafter. Although almost all of the magnesium was
removed and no detectable magnesium remained as revealed by XRD results, Figure
4.5(b), magnesium has very limited solid solubility in pure titanium. Although the
room temperature solubility of Mg in pure Ti under equilibrium conditions is less than
0.2 at. % (Figure 2.11), its solubility limit may change when the titanium is alloyed.
Similarly, XPS results given in Figure 4.7, obtained from the outer surface layers of
the manufactured foams revealed around 4 at. % Mg in Ti6Al7Nb alloy which was
higher than the solubility limit of Mg in pure titanium.
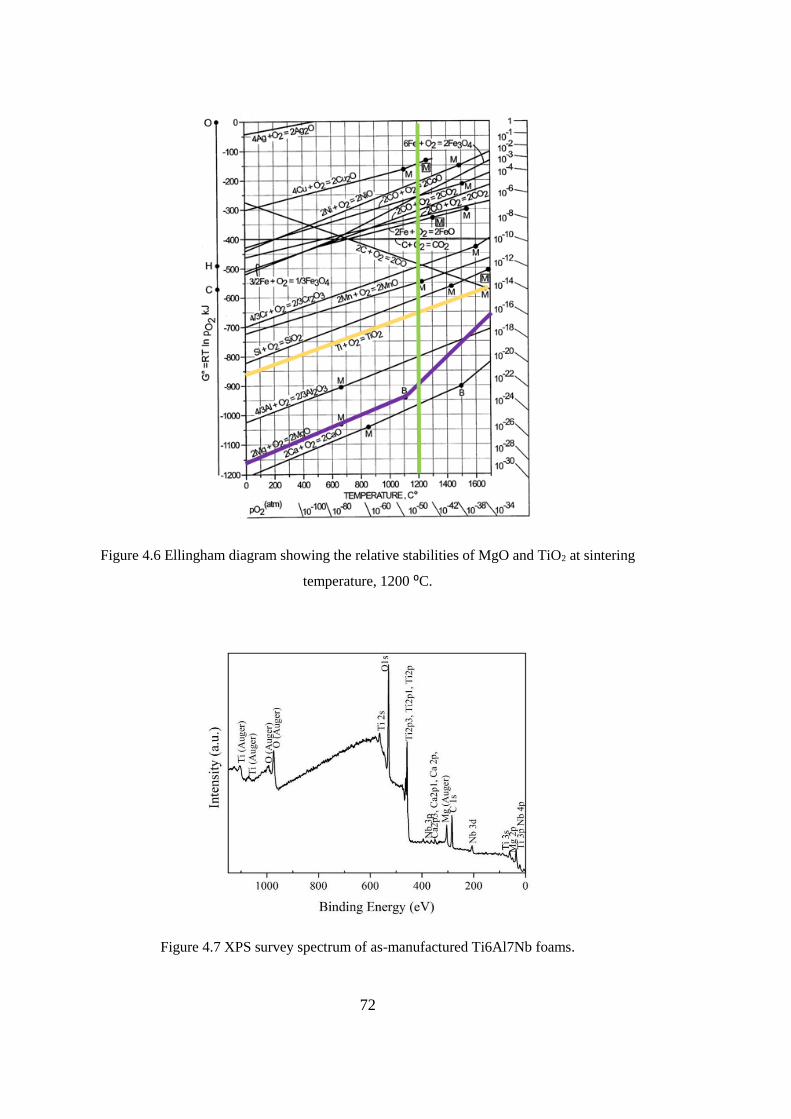
72
Figure 4.6 Ellingham diagram showing the relative stabilities of MgO and TiO2 at sintering
temperature, 1200 ⁰C.
Figure 4.7 XPS survey spectrum of as-manufactured Ti6Al7Nb foams.
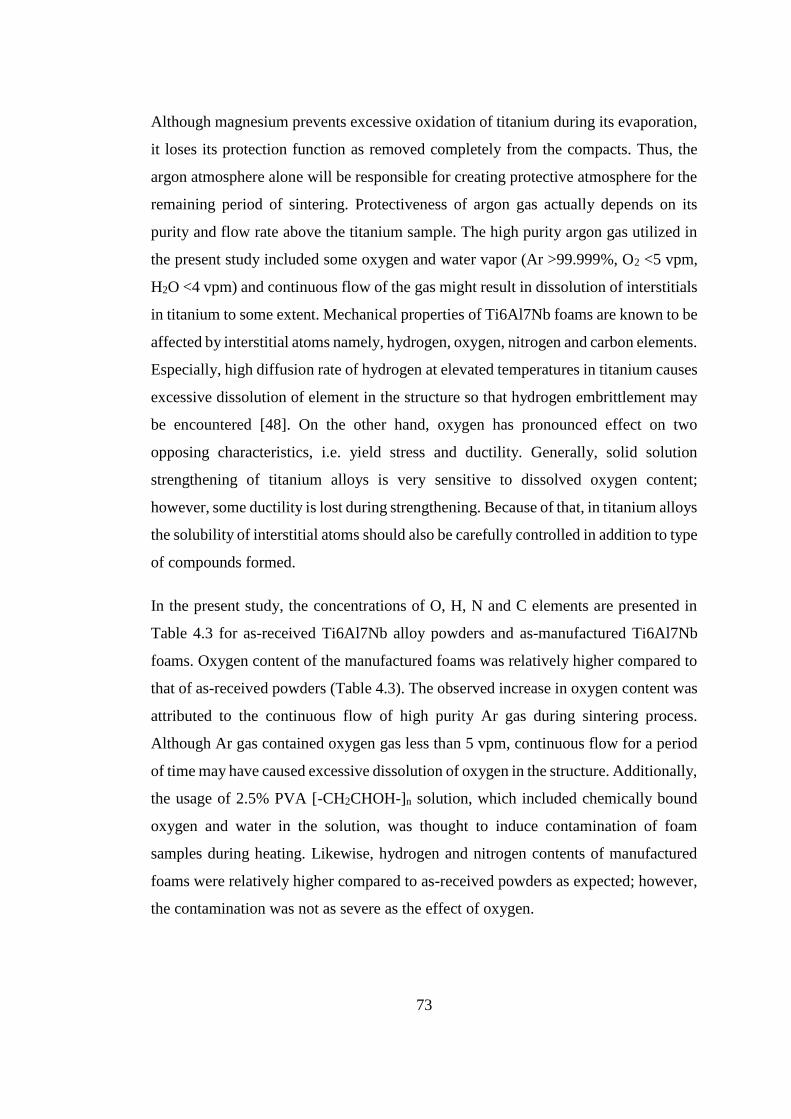
73
Although magnesium prevents excessive oxidation of titanium during its evaporation,
it loses its protection function as removed completely from the compacts. Thus, the
argon atmosphere alone will be responsible for creating protective atmosphere for the
remaining period of sintering. Protectiveness of argon gas actually depends on its
purity and flow rate above the titanium sample. The high purity argon gas utilized in
the present study included some oxygen and water vapor (Ar >99.999%, O2 <5 vpm,
H2O <4 vpm) and continuous flow of the gas might result in dissolution of interstitials
in titanium to some extent. Mechanical properties of Ti6Al7Nb foams are known to be
affected by interstitial atoms namely, hydrogen, oxygen, nitrogen and carbon elements.
Especially, high diffusion rate of hydrogen at elevated temperatures in titanium causes
excessive dissolution of element in the structure so that hydrogen embrittlement may
be encountered [48]. On the other hand, oxygen has pronounced effect on two
opposing characteristics, i.e. yield stress and ductility. Generally, solid solution
strengthening of titanium alloys is very sensitive to dissolved oxygen content;
however, some ductility is lost during strengthening. Because of that, in titanium alloys
the solubility of interstitial atoms should also be carefully controlled in addition to type
of compounds formed.
In the present study, the concentrations of O, H, N and C elements are presented in
Table 4.3 for as-received Ti6Al7Nb alloy powders and as-manufactured Ti6Al7Nb
foams. Oxygen content of the manufactured foams was relatively higher compared to
that of as-received powders (Table 4.3). The observed increase in oxygen content was
attributed to the continuous flow of high purity Ar gas during sintering process.
Although Ar gas contained oxygen gas less than 5 vpm, continuous flow for a period
of time may have caused excessive dissolution of oxygen in the structure. Additionally,
the usage of 2.5% PVA [-CH2CHOH-]n solution, which included chemically bound
oxygen and water in the solution, was thought to induce contamination of foam
samples during heating. Likewise, hydrogen and nitrogen contents of manufactured
foams were relatively higher compared to as-received powders as expected; however,
the contamination was not as severe as the effect of oxygen.

74
Besides, high solubility of C element in the produced foams compared to as-received
powder, Table 4.3, can be explained by the high diffusion rate of carbon at high
temperatures. Additionally, attachment of hydrocarbons on the foam surfaces
subsequent to foam production and dissolution of carbon present in PVA solution may
lead to increase in carbon concentrations.
Table 4.3 O, H, N and C contents of as-received powders and as-manufactured Ti6Al7Nb
alloy foams.
Specimen Element (wt. %)
Oxygen Hydrogen Nitrogen Carbon
As-received powder 0.19 0.005 0.012 0.010
As-manufactured foam 0.61 0.008 0.015 0.034
4.1.2 Compression Behavior of Foam Samples
Quasi-static compression tests were utilized to determine the compression behavior of
as-manufactured foams. Figure 4.8 shows the stress-strain curves of alloy foams
consisting of three main stages similar to elastic-plastic foams. First stage in the curves
was identified as the linear elastic region, in which small strains with recoverable
deformation were observed up to the yield point. Subsequent to yielding of cell walls,
a second region named as plateau region was observed with nearly constant flow
stresses up to high strain values. All the curves were characterized by a maximum flow
stress seen just after yielding and a sudden drop of flow stress caused by initial collapse
of the cell walls. In the densification region, the third region of deformation, which
was clearly seen in foam sample with 53.0% porosity, all the pores became closed so
that stress increased sharply since the foam started to display mechanical response
similar to that of bulk samples, Figure 4.8.
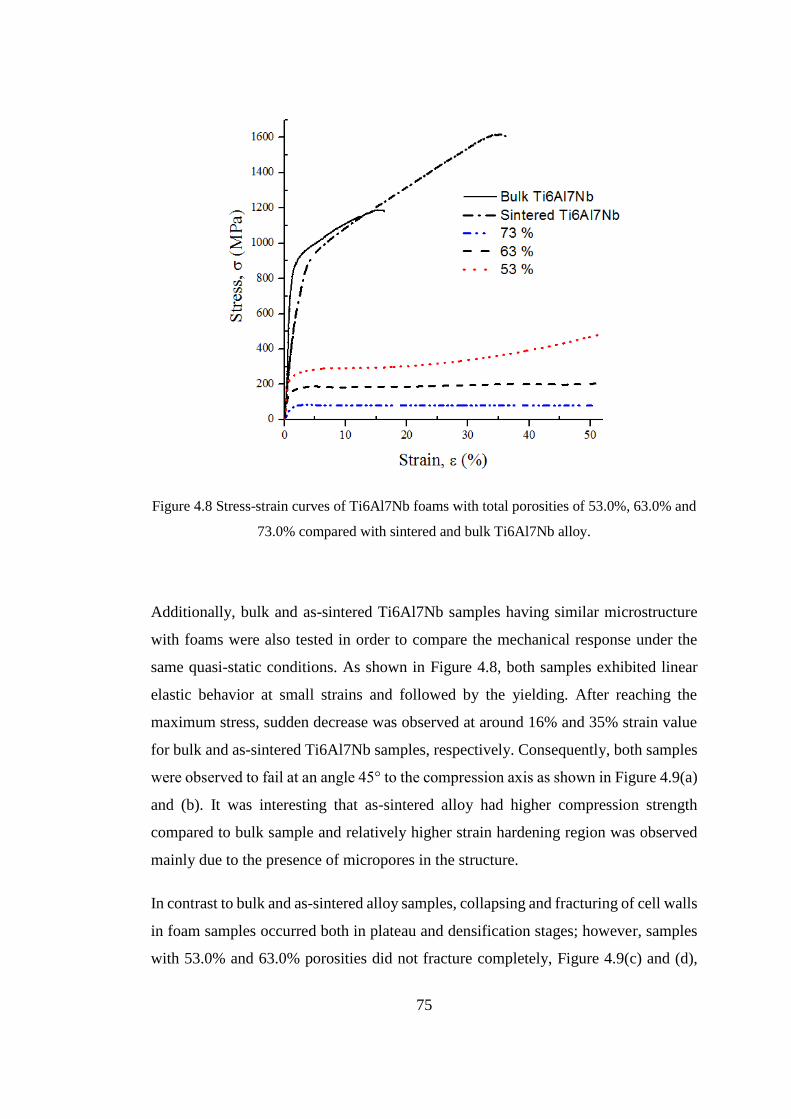
75
Figure 4.8 Stress-strain curves of Ti6Al7Nb foams with total porosities of 53.0%, 63.0% and
73.0% compared with sintered and bulk Ti6Al7Nb alloy.
Additionally, bulk and as-sintered Ti6Al7Nb samples having similar microstructure
with foams were also tested in order to compare the mechanical response under the
same quasi-static conditions. As shown in Figure 4.8, both samples exhibited linear
elastic behavior at small strains and followed by the yielding. After reaching the
maximum stress, sudden decrease was observed at around 16% and 35% strain value
for bulk and as-sintered Ti6Al7Nb samples, respectively. Consequently, both samples
were observed to fail at an angle 45° to the compression axis as shown in Figure 4.9(a)
and (b). It was interesting that as-sintered alloy had higher compression strength
compared to bulk sample and relatively higher strain hardening region was observed
mainly due to the presence of micropores in the structure.
In contrast to bulk and as-sintered alloy samples, collapsing and fracturing of cell walls
in foam samples occurred both in plateau and densification stages; however, samples
with 53.0% and 63.0% porosities did not fracture completely, Figure 4.9(c) and (d),
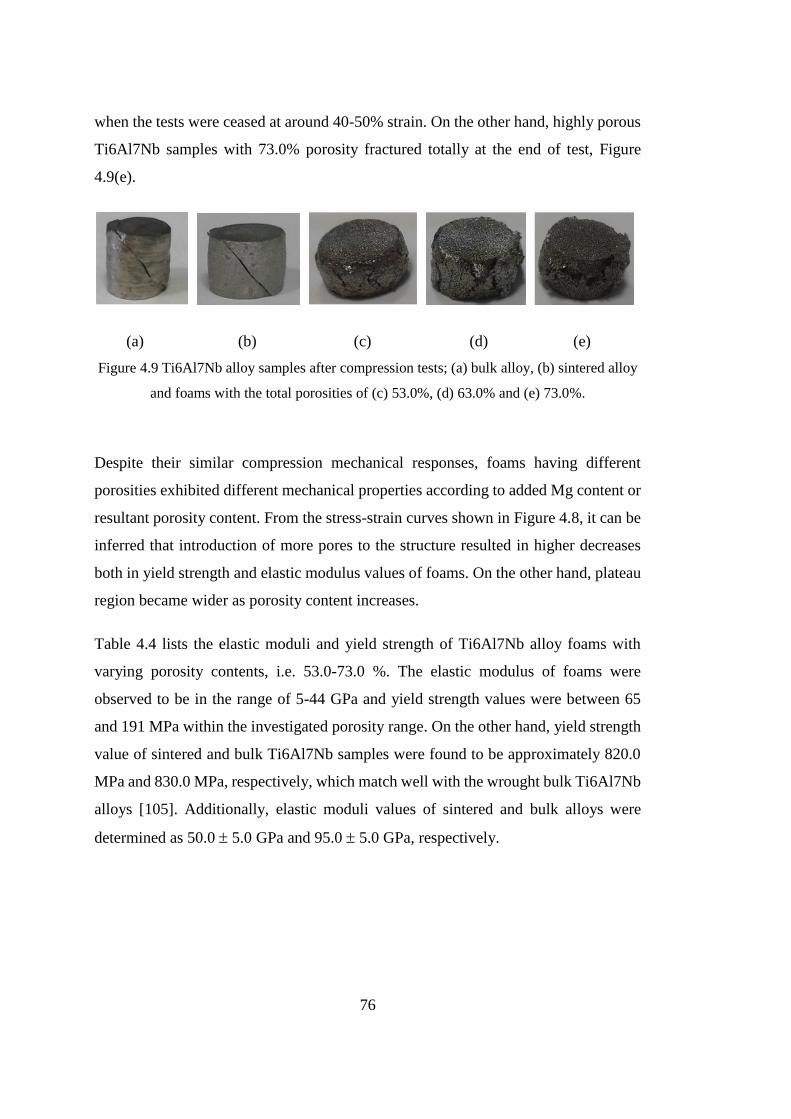
76
when the tests were ceased at around 40-50% strain. On the other hand, highly porous
Ti6Al7Nb samples with 73.0% porosity fractured totally at the end of test, Figure
4.9(e).
(a) (b) (c) (d) (e)
Figure 4.9 Ti6Al7Nb alloy samples after compression tests; (a) bulk alloy, (b) sintered alloy
and foams with the total porosities of (c) 53.0%, (d) 63.0% and (e) 73.0%.
Despite their similar compression mechanical responses, foams having different
porosities exhibited different mechanical properties according to added Mg content or
resultant porosity content. From the stress-strain curves shown in Figure 4.8, it can be
inferred that introduction of more pores to the structure resulted in higher decreases
both in yield strength and elastic modulus values of foams. On the other hand, plateau
region became wider as porosity content increases.
Table 4.4 lists the elastic moduli and yield strength of Ti6Al7Nb alloy foams with
varying porosity contents, i.e. 53.0-73.0 %. The elastic modulus of foams were
observed to be in the range of 5-44 GPa and yield strength values were between 65
and 191 MPa within the investigated porosity range. On the other hand, yield strength
value of sintered and bulk Ti6Al7Nb samples were found to be approximately 820.0
MPa and 830.0 MPa, respectively, which match well with the wrought bulk Ti6Al7Nb
alloys [105]. Additionally, elastic moduli values of sintered and bulk alloys were
determined as 50.0 5.0 GPa and 95.0 5.0 GPa, respectively.
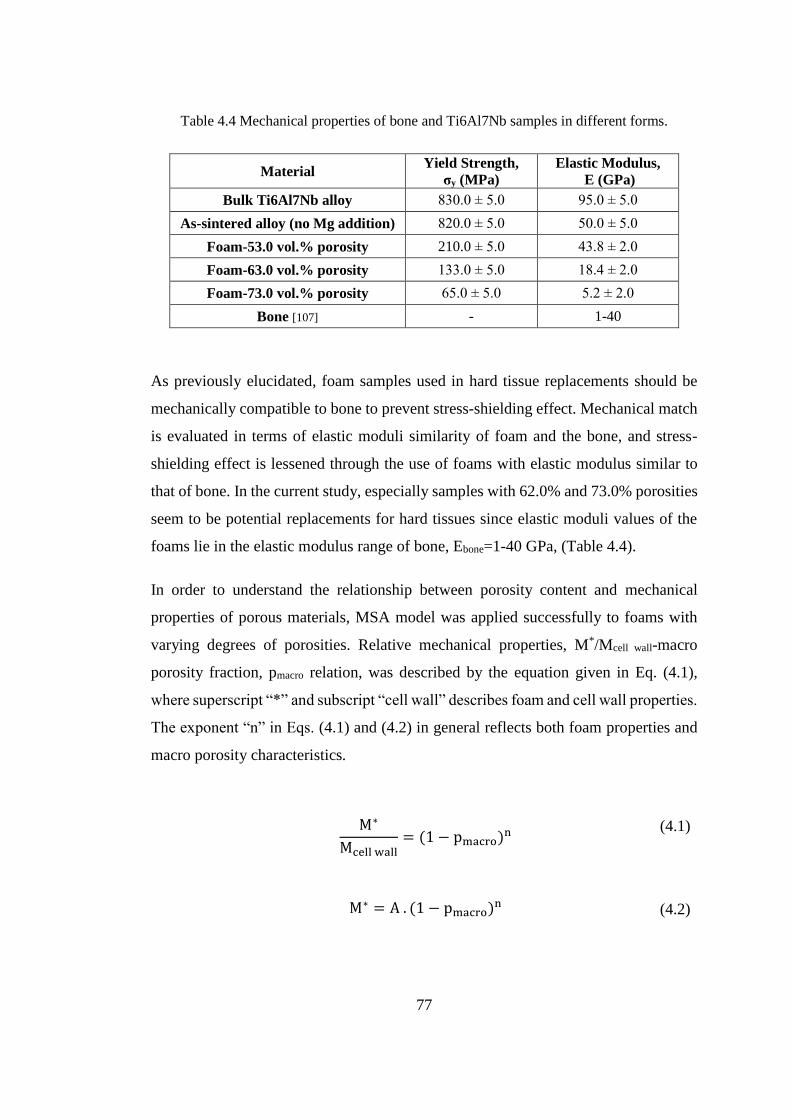
77
Table 4.4 Mechanical properties of bone and Ti6Al7Nb samples in different forms.
Material Yield Strength,
σy (MPa)
Elastic Modulus,
E (GPa)
Bulk Ti6Al7Nb alloy 830.0 ± 5.0 95.0 ± 5.0
As-sintered alloy (no Mg addition) 820.0 ± 5.0 50.0 ± 5.0
Foam-53.0 vol.% porosity 210.0 ± 5.0 43.8 ± 2.0
Foam-63.0 vol.% porosity 133.0 ± 5.0 18.4 ± 2.0
Foam-73.0 vol.% porosity 65.0 ± 5.0 5.2 ± 2.0
Bone [107] - 1-40
As previously elucidated, foam samples used in hard tissue replacements should be
mechanically compatible to bone to prevent stress-shielding effect. Mechanical match
is evaluated in terms of elastic moduli similarity of foam and the bone, and stress-
shielding effect is lessened through the use of foams with elastic modulus similar to
that of bone. In the current study, especially samples with 62.0% and 73.0% porosities
seem to be potential replacements for hard tissues since elastic moduli values of the
foams lie in the elastic modulus range of bone, Ebone=1-40 GPa, (Table 4.4).
In order to understand the relationship between porosity content and mechanical
properties of porous materials, MSA model was applied successfully to foams with
varying degrees of porosities. Relative mechanical properties, M*/Mcell wall-macro
porosity fraction, pmacro relation, was described by the equation given in Eq. (4.1),
where superscript “*” and subscript “cell wall” describes foam and cell wall properties.
The exponent “n” in Eqs. (4.1) and (4.2) in general reflects both foam properties and
macro porosity characteristics.
M∗
Mcell wall= (1 − pmacro)n
(4.1)
M∗ = A . (1 − pmacro)n (4.2)
78
Eq. (4.1) was modified in the current study and Eq. (4.2) was utilized to predict the
foam mechanical properties and the proportionality constant ‘’A’’ was assumed to
reflect cell wall properties. Figure 4.10 shows the yield strength, σy, and elastic
modulus, E, changes of foams as a function of macro porosity fraction, pmacro. It has
been clearly seen from the fitted curves that improvements in both σy and E were
observed with decrease in macro porosity content and empirical relations, given in
Eqs. (4.3) and (4.4) were obtained for yield strength and elastic moduli of foams. The
fitted curves were observed to obey well the power law relation given in empirical
equation defined by Eq. (4.2).
σy(MPa) = 826.9 (1 − pmacro)2.0 (4.3)
E(GPa) = 658.0 (1 − pmacro)4.1 (4.4)
The proportionality constant found in Eq. (4.3) is known to reflect the yield strength
of the cell wall structure as given in Eq. (4.2). Thus, the cell wall yield strength of the
foam samples was found as 826.9 MPa. The calculated cell wall yield strength value
by use of empirical equations was observed to match well with experimentally
calculated values such that the yield strength of as-sintered alloy samples which
simulate the cell wall structure of the foams was found to be around 820.0 5.0 MPa,
Table 4.4.
Although, elastic modulus-macro porosity relation of foams was also defined by the
power law relation given in Eq. (4.4), the cell-wall elastic moduli (658.0 GPa,
proportionality constant in Eq. (4.4)) was far from the experimentally determined cell
wall elastic modulus (50.0 5.0 GPa). The inconsistency between elastic moduli
calculated by empirical models and experimental studies could not be defined clearly
and needs further investigation. The tested foam samples had both open and closed
type of porosities within the examined porosity range. Because of that, the samples
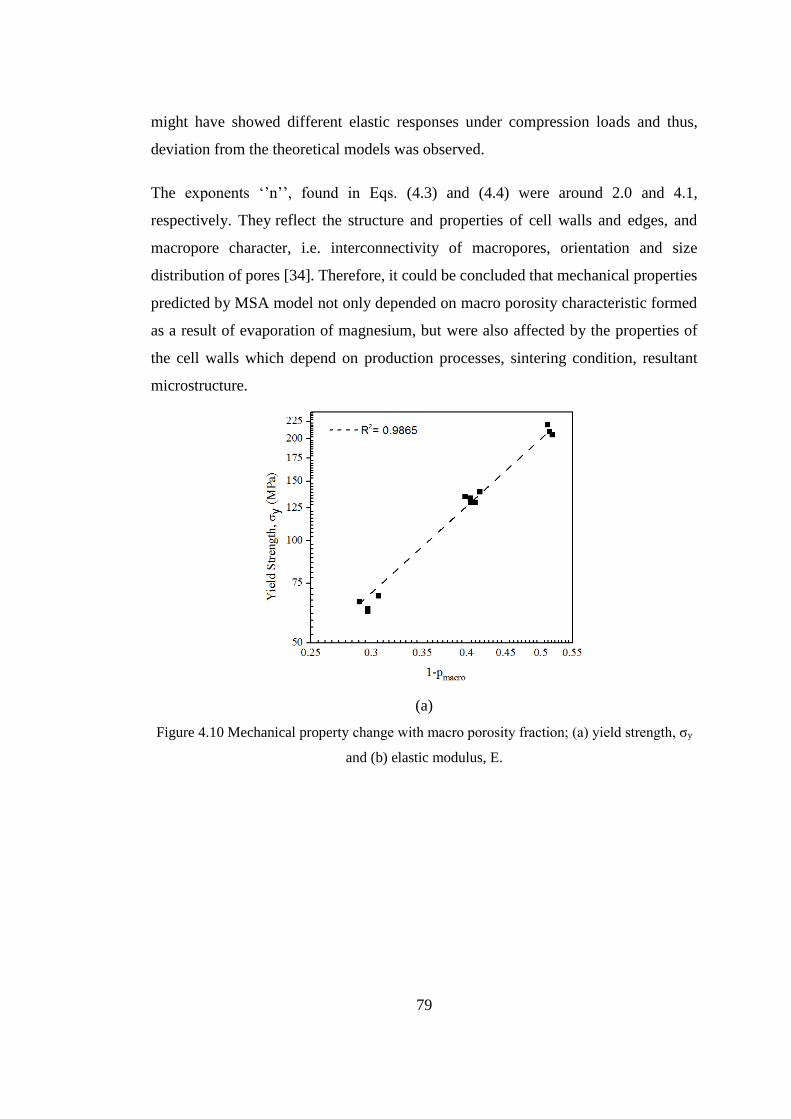
79
might have showed different elastic responses under compression loads and thus,
deviation from the theoretical models was observed.
The exponents ‘’n’’, found in Eqs. (4.3) and (4.4) were around 2.0 and 4.1,
respectively. They reflect the structure and properties of cell walls and edges, and
macropore character, i.e. interconnectivity of macropores, orientation and size
distribution of pores [34]. Therefore, it could be concluded that mechanical properties
predicted by MSA model not only depended on macro porosity characteristic formed
as a result of evaporation of magnesium, but were also affected by the properties of
the cell walls which depend on production processes, sintering condition, resultant
microstructure.
(a)
Figure 4.10 Mechanical property change with macro porosity fraction; (a) yield strength, σy
and (b) elastic modulus, E.
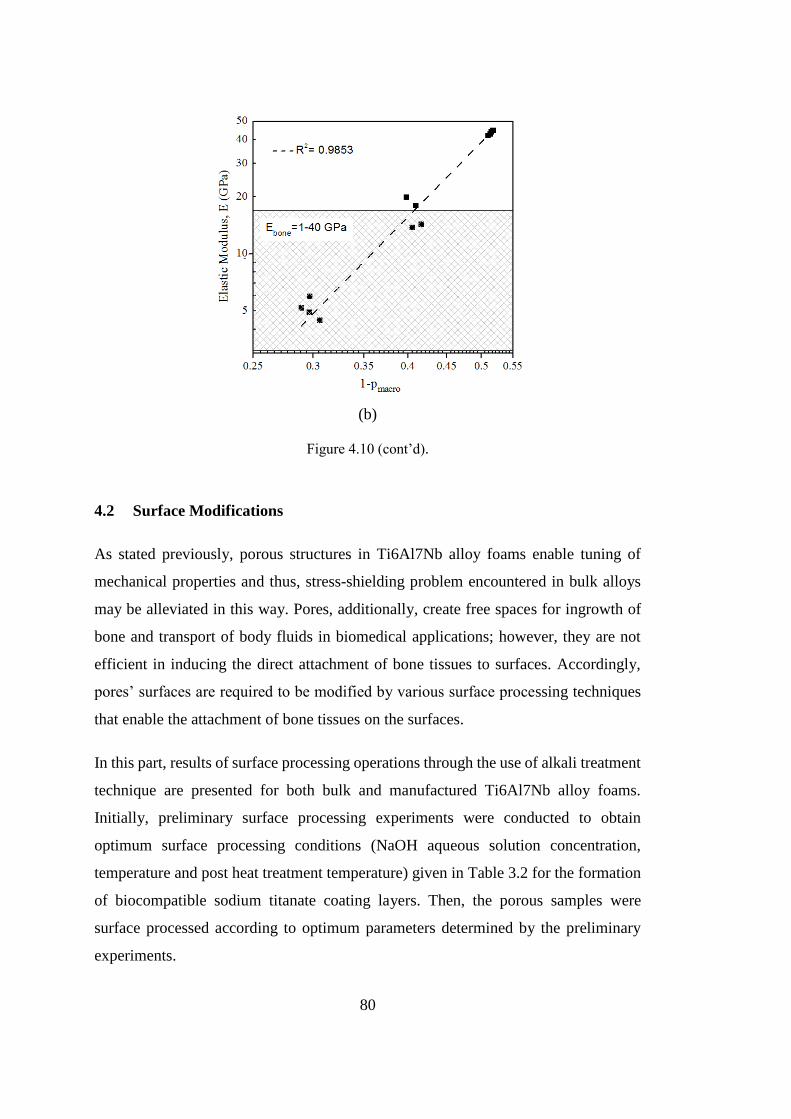
80
(b)
Figure 4.10 (cont’d).
4.2 Surface Modifications
As stated previously, porous structures in Ti6Al7Nb alloy foams enable tuning of
mechanical properties and thus, stress-shielding problem encountered in bulk alloys
may be alleviated in this way. Pores, additionally, create free spaces for ingrowth of
bone and transport of body fluids in biomedical applications; however, they are not
efficient in inducing the direct attachment of bone tissues to surfaces. Accordingly,
pores’ surfaces are required to be modified by various surface processing techniques
that enable the attachment of bone tissues on the surfaces.
In this part, results of surface processing operations through the use of alkali treatment
technique are presented for both bulk and manufactured Ti6Al7Nb alloy foams.
Initially, preliminary surface processing experiments were conducted to obtain
optimum surface processing conditions (NaOH aqueous solution concentration,
temperature and post heat treatment temperature) given in Table 3.2 for the formation
of biocompatible sodium titanate coating layers. Then, the porous samples were
surface processed according to optimum parameters determined by the preliminary
experiments.
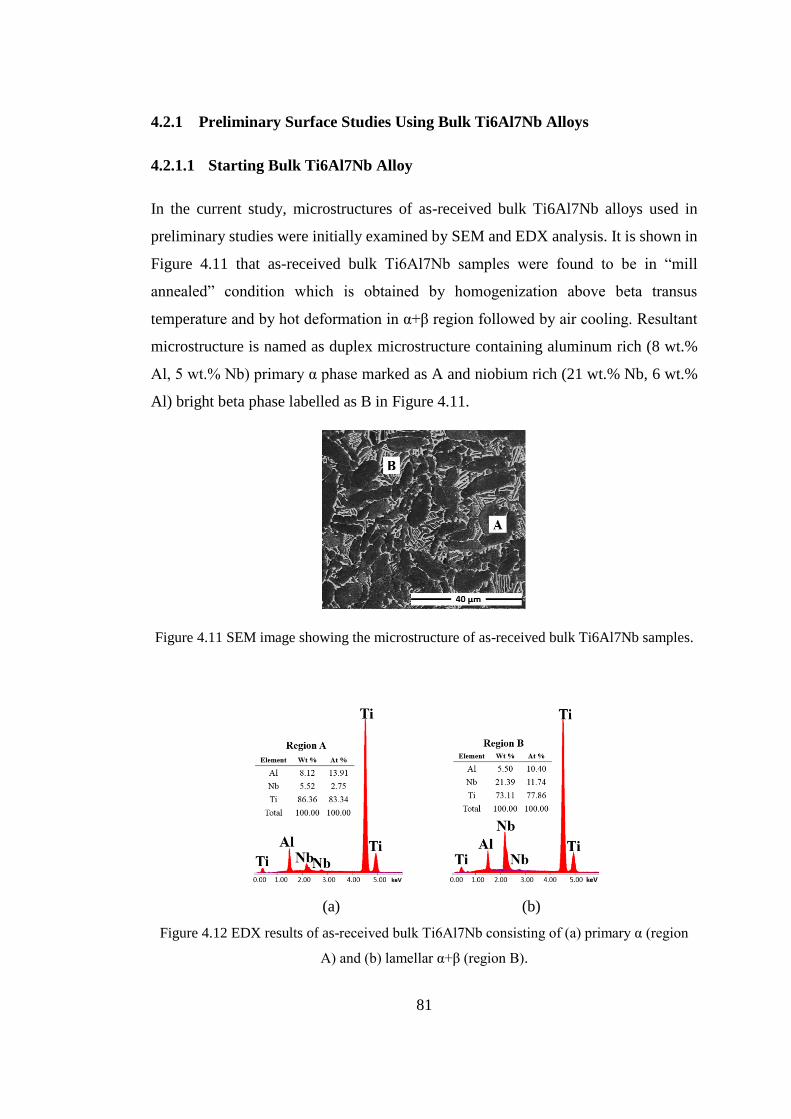
81
4.2.1 Preliminary Surface Studies Using Bulk Ti6Al7Nb Alloys
4.2.1.1 Starting Bulk Ti6Al7Nb Alloy
In the current study, microstructures of as-received bulk Ti6Al7Nb alloys used in
preliminary studies were initially examined by SEM and EDX analysis. It is shown in
Figure 4.11 that as-received bulk Ti6Al7Nb samples were found to be in “mill
annealed” condition which is obtained by homogenization above beta transus
temperature and by hot deformation in α+β region followed by air cooling. Resultant
microstructure is named as duplex microstructure containing aluminum rich (8 wt.%
Al, 5 wt.% Nb) primary α phase marked as A and niobium rich (21 wt.% Nb, 6 wt.%
Al) bright beta phase labelled as B in Figure 4.11.
Figure 4.11 SEM image showing the microstructure of as-received bulk Ti6Al7Nb samples.
(a) (b)
Figure 4.12 EDX results of as-received bulk Ti6Al7Nb consisting of (a) primary α (region
A) and (b) lamellar α+β (region B).
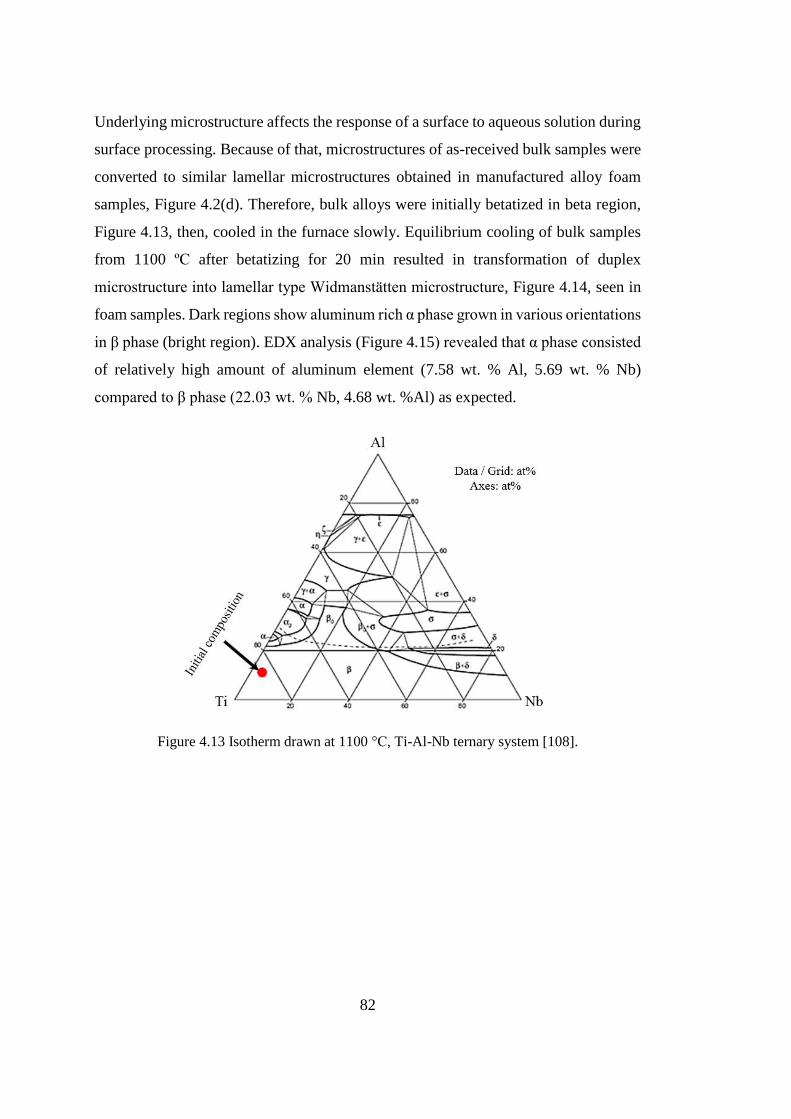
82
Underlying microstructure affects the response of a surface to aqueous solution during
surface processing. Because of that, microstructures of as-received bulk samples were
converted to similar lamellar microstructures obtained in manufactured alloy foam
samples, Figure 4.2(d). Therefore, bulk alloys were initially betatized in beta region,
Figure 4.13, then, cooled in the furnace slowly. Equilibrium cooling of bulk samples
from 1100 ºC after betatizing for 20 min resulted in transformation of duplex
microstructure into lamellar type Widmanstätten microstructure, Figure 4.14, seen in
foam samples. Dark regions show aluminum rich α phase grown in various orientations
in β phase (bright region). EDX analysis (Figure 4.15) revealed that α phase consisted
of relatively high amount of aluminum element (7.58 wt. % Al, 5.69 wt. % Nb)
compared to β phase (22.03 wt. % Nb, 4.68 wt. %Al) as expected.
Figure 4.13 Isotherm drawn at 1100 °C, Ti-Al-Nb ternary system [108].

83
Figure 4.14 SEM images of furnace cooled Ti6Al7Nb bulk alloy showing the lamellar
microstructure consisting of α-platelets and β-laths.
(a) (b)
Figure 4.15 EDX results of furnace cooled Ti6Al7Nb alloy consists of (a) α phase and (b) β
phase.
Then, heat treated disk shaped bulk alloy samples (18 mm Ø and 5 mm in thickness)
were used for preliminary surface studies to determine the optimum process
parameters. Prior to surface treatments, the heat treated bulk samples were ground with
SiC paper up to 2000 grit and washed with acetone, ethanol and finally with distilled
water in an ultrasonic cleaner. Figure 4.16(a) shows the relatively smooth bulk alloy
surface with rarely observed grinding scratches. In addition, Figure 4.16(b) shows the

84
AFM three dimensional (3D) microtopography of the starting bulk Ti6Al7Nb alloy
surface. The average roughness of ground surface was found to be 24 ± 7 nm. As it
was previously stated that spontaneously formed oxide layer affects the response of a
surface to NaOH solution during surface treatment process. Thereby, the existence of
the oxide layer on the surface of bulk alloy was investigated by the XPS analysis
(Figure 4.17). Analysis conducted on starting bulk alloy’s surface revealed doublet
peaks of Ti2p at around 458.5 eV (2p3/2) and 464.1 eV (2p1/2) and a main peak of
O1s at 530.4 eV. The observed binding energies of Ti2p and O1s agreed well with the
Ti-O bonds present in TiO2 (Table 4.5) and confirmed the presence of titanium oxide
on the starting bulk Ti6Al7Nb surface.
(a) (b)
Figure 4.16 Furnace cooled starting bulk Ti6Al7Nb alloy (a) SEM image, (b) AFM 3D
microtopography.
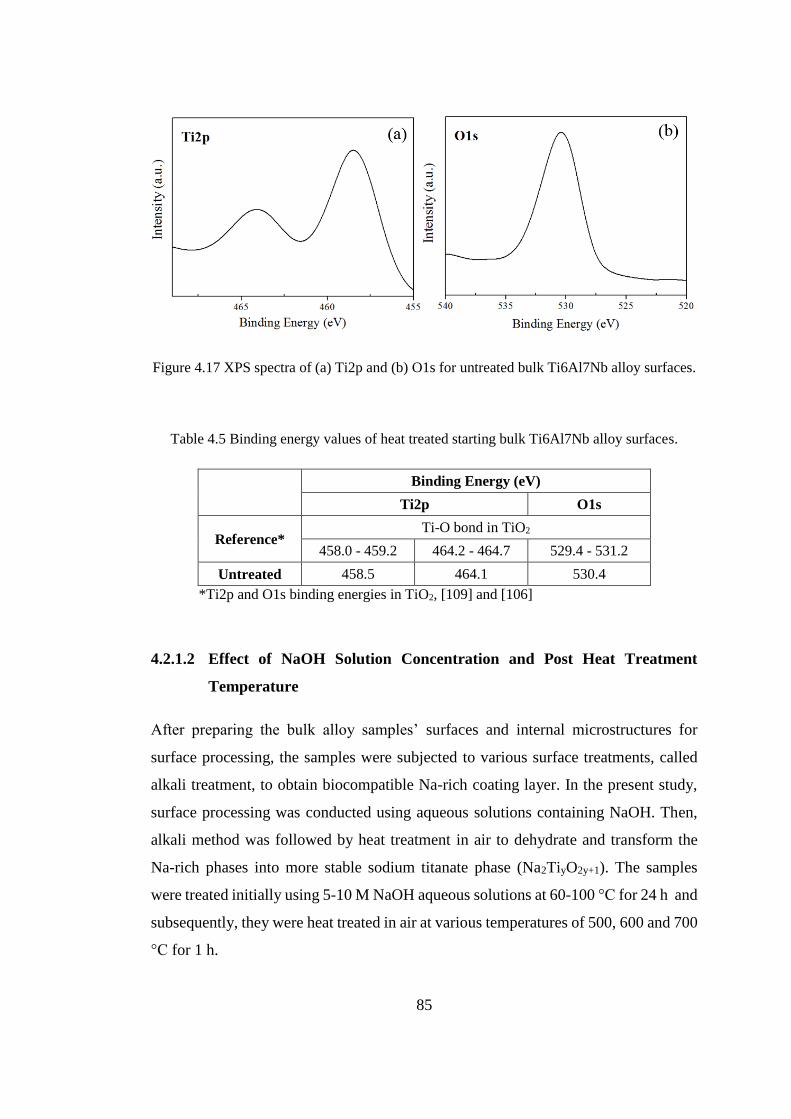
85
Figure 4.17 XPS spectra of (a) Ti2p and (b) O1s for untreated bulk Ti6Al7Nb alloy surfaces.
Table 4.5 Binding energy values of heat treated starting bulk Ti6Al7Nb alloy surfaces.
Binding Energy (eV)
Ti2p O1s
Reference* Ti-O bond in TiO2
458.0 - 459.2 464.2 - 464.7 529.4 - 531.2
Untreated 458.5 464.1 530.4
*Ti2p and O1s binding energies in TiO2, [109] and [106]
4.2.1.2 Effect of NaOH Solution Concentration and Post Heat Treatment
Temperature
After preparing the bulk alloy samples’ surfaces and internal microstructures for
surface processing, the samples were subjected to various surface treatments, called
alkali treatment, to obtain biocompatible Na-rich coating layer. In the present study,
surface processing was conducted using aqueous solutions containing NaOH. Then,
alkali method was followed by heat treatment in air to dehydrate and transform the
Na-rich phases into more stable sodium titanate phase (Na2TiyO2y+1). The samples
were treated initially using 5-10 M NaOH aqueous solutions at 60-100 °C for 24 h and
subsequently, they were heat treated in air at various temperatures of 500, 600 and 700
°C for 1 h.
86
In the first stage of the preliminary studies, the effect of NaOH solution concentration
(5 M and 10 M) and post processing heat treatment temperatures (500, 600 and 700
⁰C) on the biocompatible sodium titanate formation were examined simultaneously.
All the other variables, namely, solution temperature, holding time in solution and heat
treatment time were kept constant at 60 ⁰C, 24 h and 1 h, respectively, Table 3.2.
Figure 4.18 shows the change in surface morphologies of bulk Ti6Al7Nb specimens
belonging to two different sets of samples, set A; treated with 5 M NaOH solution and
set B; treated with 10 M NaOH solution. The effects of solution concentration and
subsequent heat treatment temperature on the surface structure were clearly
recognized. The coating layer having porous network structure was observed on both
sets of samples’ surfaces; however, some variations in surface morphologies existed
due to the differences in solution concentrations (5 M and 10 M). The main difference
between 5 M and 10 M treated samples was that set A samples’ surfaces had
continuous and relatively coarser porous coating structure, while deep cracks were
formed on the coating layers of 10 M treated set B samples and the coating layer was
observed to be non-uniform, Figure 4.18.

87
Fig
ure
4.1
8 S
EM
im
ages
of
bulk
Ti6
Al7
Nb s
urf
aces
of
set
A (
A1)
alkal
i tr
eate
d w
ith
5 M
NaO
H a
t 60
°C
th
en,
(A2
) hea
t tr
eate
d a
t
50
0 °
C, (A
3)
60
0 °
C a
nd (
A4)
700
°C
, an
d s
et B
spec
imen
s; (
B1)
alkal
i tr
eate
d w
ith
10
M N
aOH
at
60
°C
th
en,
(B2
) h
eat
trea
ted
at
500
°C
, (B
3)
600 °
C a
nd (
B4)
700
°C
.
88
As shown in Figure 4.18, prior to heat treatment process, as-NaOH treated A1 samples
contained two dimensional relatively coarse continuous layers. As a result of post
processing heat treatment, the layers transformed into finer rod-like structures named
as “nano fibers” each having diameter approximately 100 nm, Figure 4.18, (A2, 3 and
4). Unlike the set A samples, coating layers of as-NaOH treated B1 samples have been
observed to consist of finer network structure; however, the structures in some heat
treated samples, B2 and B3, were not uniform such that semi-spherical sodium rich
particles (Table 4.6) formed on the network structure, Figure 4.18. Additionally,
changing of heat treatment temperature from 500 °C to 700 °C caused coarsening of
coating layers obtained both in set A and B samples. But, coarsening effect was more
severe in 10 M NaOH treated set B samples. Moreover, unlike the 5 M NaOH treated
samples, post processing heat treatment at 700 ⁰C distorted continuity of the coating
layers and caused formation of relatively deeper cracks on 10 M treated samples’
surfaces. The differences in thermal expansion coefficients of titanium substrate and
high sodium rich coating layer in 10 M treated samples might be one of the reasons of
intensified cracking due to heat treatment at 700 °C. In addition, the formation of
cracks in some samples was also attributed to higher thickness and relatively high
water content of the coating layer formed after 10 M alkali treatment. Likewise, in a
previous study conducted by similar solution concentration [97], it was reported that
10 M NaOH alkali treatment causes the formation of thicker sodium titanate hydrogel
(Na2Ti3O7. H2O) layer which has relatively higher water content compared to samples
treated with 5 M NaOH. Therefore, the shrinkage of thicker hydrogel layer during
drying and heat treatment via releasing of water was shown to be responsible for
intensified cracking.
The EDX analysis of set A and B samples given in Table 4.6 displayed the presence
of Na and O elements on the surfaces. It is apparent that relatively high amounts of Na
and O elements were incorporated into the surface of Ti6Al7Nb alloys after surface
treatment which implies the formation of the Na-rich coating layers on all surfaces.
However, no direct correlation between sodium, oxygen contents of the coating layers
and the processing variables (solution concentration and heat treatment temperatures)
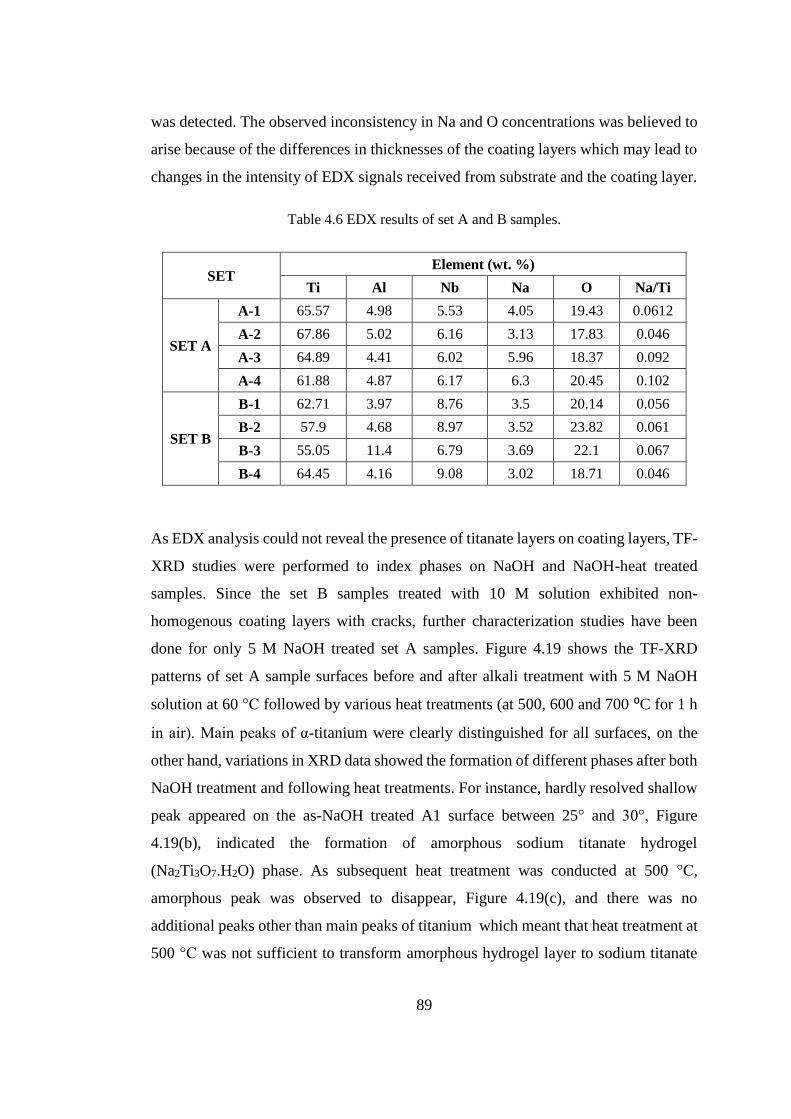
89
was detected. The observed inconsistency in Na and O concentrations was believed to
arise because of the differences in thicknesses of the coating layers which may lead to
changes in the intensity of EDX signals received from substrate and the coating layer.
Table 4.6 EDX results of set A and B samples.
SET Element (wt. %)
Ti Al Nb Na O Na/Ti
SET A
A-1 65.57 4.98 5.53 4.05 19.43 0.0612
A-2 67.86 5.02 6.16 3.13 17.83 0.046
A-3 64.89 4.41 6.02 5.96 18.37 0.092
A-4 61.88 4.87 6.17 6.3 20.45 0.102
SET B
B-1 62.71 3.97 8.76 3.5 20.14 0.056
B-2 57.9 4.68 8.97 3.52 23.82 0.061
B-3 55.05 11.4 6.79 3.69 22.1 0.067
B-4 64.45 4.16 9.08 3.02 18.71 0.046
As EDX analysis could not reveal the presence of titanate layers on coating layers, TF-
XRD studies were performed to index phases on NaOH and NaOH-heat treated
samples. Since the set B samples treated with 10 M solution exhibited non-
homogenous coating layers with cracks, further characterization studies have been
done for only 5 M NaOH treated set A samples. Figure 4.19 shows the TF-XRD
patterns of set A sample surfaces before and after alkali treatment with 5 M NaOH
solution at 60 °C followed by various heat treatments (at 500, 600 and 700 ⁰C for 1 h
in air). Main peaks of α-titanium were clearly distinguished for all surfaces, on the
other hand, variations in XRD data showed the formation of different phases after both
NaOH treatment and following heat treatments. For instance, hardly resolved shallow
peak appeared on the as-NaOH treated A1 surface between 25° and 30°, Figure
4.19(b), indicated the formation of amorphous sodium titanate hydrogel
(Na2Ti3O7.H2O) phase. As subsequent heat treatment was conducted at 500 °C,
amorphous peak was observed to disappear, Figure 4.19(c), and there was no
additional peaks other than main peaks of titanium which meant that heat treatment at
500 °C was not sufficient to transform amorphous hydrogel layer to sodium titanate
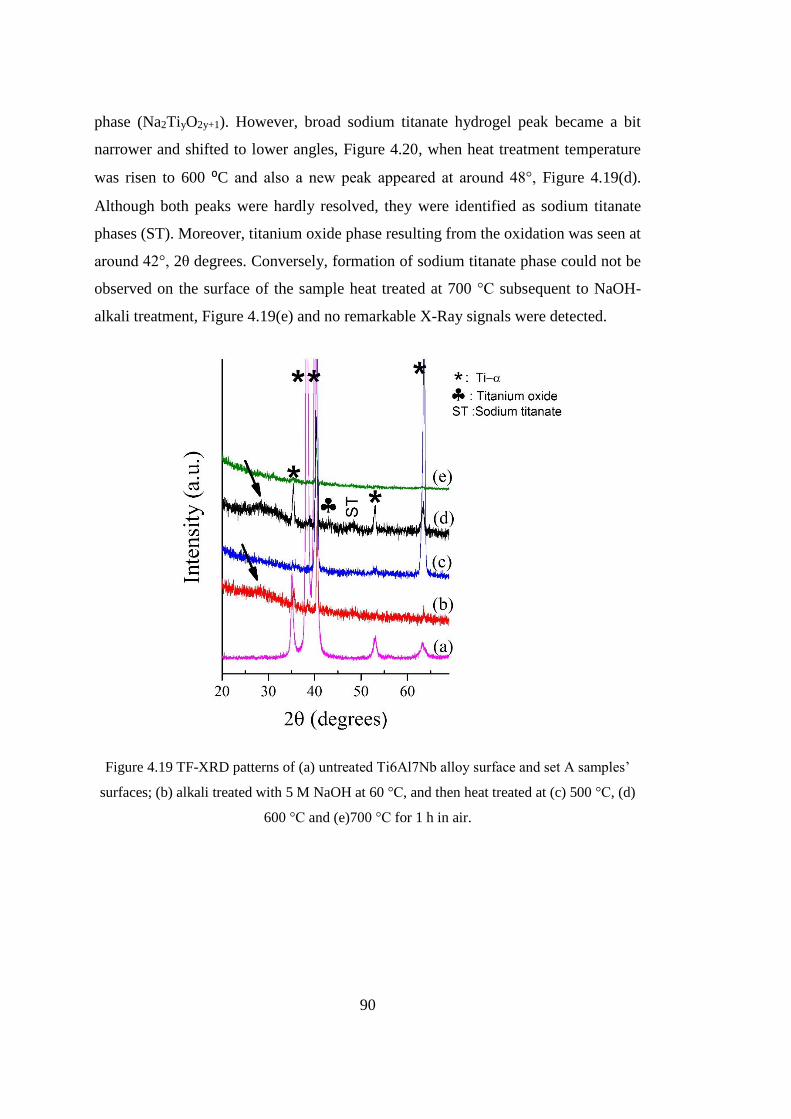
90
phase (Na2TiyO2y+1). However, broad sodium titanate hydrogel peak became a bit
narrower and shifted to lower angles, Figure 4.20, when heat treatment temperature
was risen to 600 ⁰C and also a new peak appeared at around 48°, Figure 4.19(d).
Although both peaks were hardly resolved, they were identified as sodium titanate
phases (ST). Moreover, titanium oxide phase resulting from the oxidation was seen at
around 42°, 2θ degrees. Conversely, formation of sodium titanate phase could not be
observed on the surface of the sample heat treated at 700 °C subsequent to NaOH-
alkali treatment, Figure 4.19(e) and no remarkable X-Ray signals were detected.
Figure 4.19 TF-XRD patterns of (a) untreated Ti6Al7Nb alloy surface and set A samples’
surfaces; (b) alkali treated with 5 M NaOH at 60 °C, and then heat treated at (c) 500 °C, (d)
600 °C and (e)700 °C for 1 h in air.
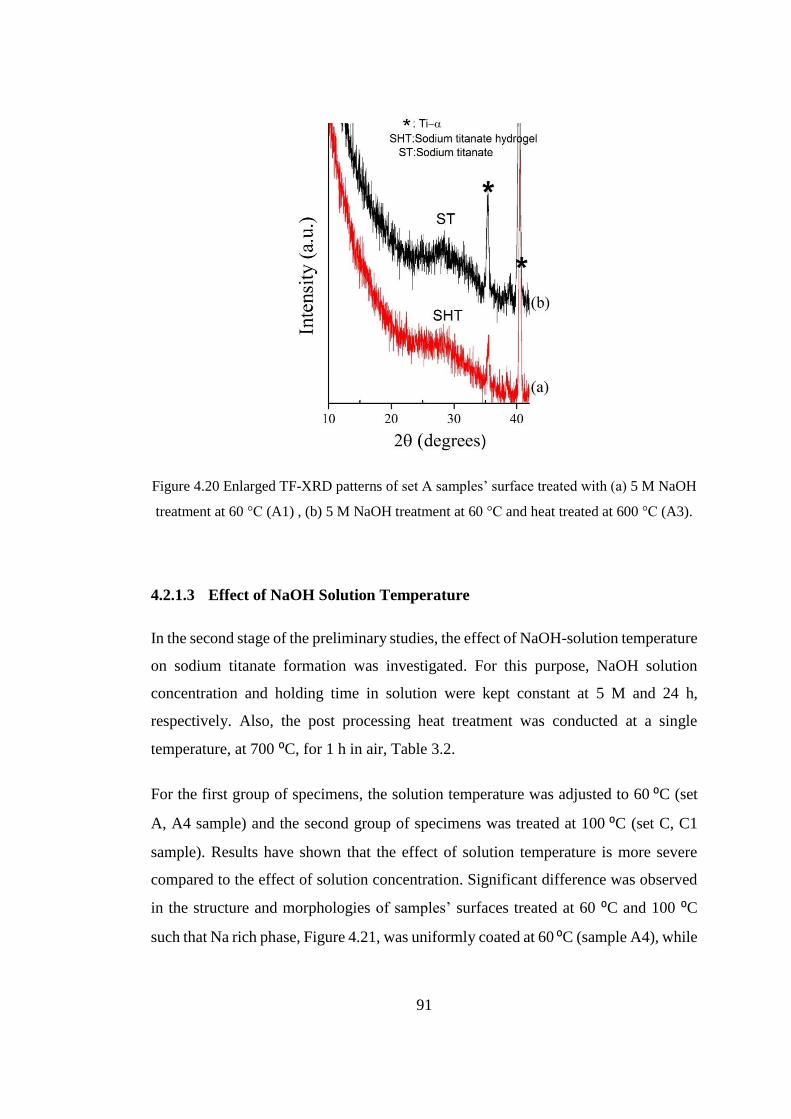
91
Figure 4.20 Enlarged TF-XRD patterns of set A samples’ surface treated with (a) 5 M NaOH
treatment at 60 °C (A1) , (b) 5 M NaOH treatment at 60 °C and heat treated at 600 °C (A3).
4.2.1.3 Effect of NaOH Solution Temperature
In the second stage of the preliminary studies, the effect of NaOH-solution temperature
on sodium titanate formation was investigated. For this purpose, NaOH solution
concentration and holding time in solution were kept constant at 5 M and 24 h,
respectively. Also, the post processing heat treatment was conducted at a single
temperature, at 700 ⁰C, for 1 h in air, Table 3.2.
For the first group of specimens, the solution temperature was adjusted to 60 ⁰C (set
A, A4 sample) and the second group of specimens was treated at 100 ⁰C (set C, C1
sample). Results have shown that the effect of solution temperature is more severe
compared to the effect of solution concentration. Significant difference was observed
in the structure and morphologies of samples’ surfaces treated at 60 ⁰C and 100 ⁰C
such that Na rich phase, Figure 4.21, was uniformly coated at 60 ⁰C (sample A4), while
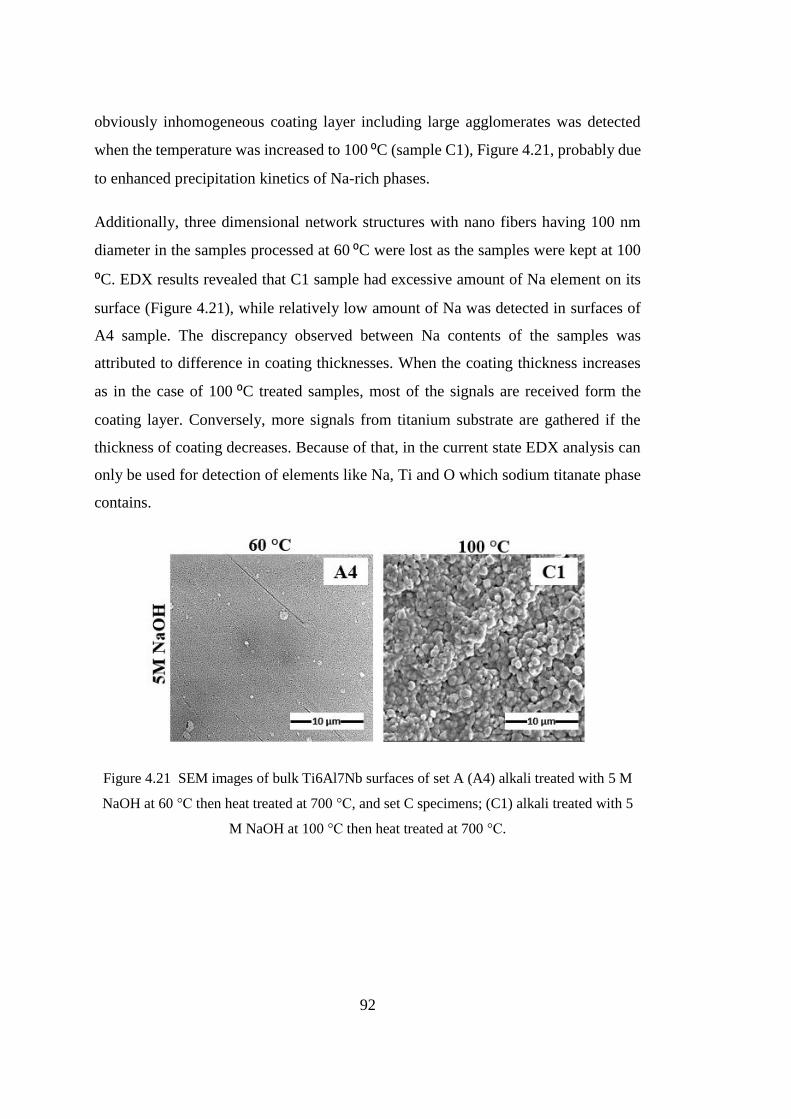
92
obviously inhomogeneous coating layer including large agglomerates was detected
when the temperature was increased to 100 ⁰C (sample C1), Figure 4.21, probably due
to enhanced precipitation kinetics of Na-rich phases.
Additionally, three dimensional network structures with nano fibers having 100 nm
diameter in the samples processed at 60 ⁰C were lost as the samples were kept at 100
⁰C. EDX results revealed that C1 sample had excessive amount of Na element on its
surface (Figure 4.21), while relatively low amount of Na was detected in surfaces of
A4 sample. The discrepancy observed between Na contents of the samples was
attributed to difference in coating thicknesses. When the coating thickness increases
as in the case of 100 ⁰C treated samples, most of the signals are received form the
coating layer. Conversely, more signals from titanium substrate are gathered if the
thickness of coating decreases. Because of that, in the current state EDX analysis can
only be used for detection of elements like Na, Ti and O which sodium titanate phase
contains.
Figure 4.21 SEM images of bulk Ti6Al7Nb surfaces of set A (A4) alkali treated with 5 M
NaOH at 60 °C then heat treated at 700 °C, and set C specimens; (C1) alkali treated with 5
M NaOH at 100 °C then heat treated at 700 °C.
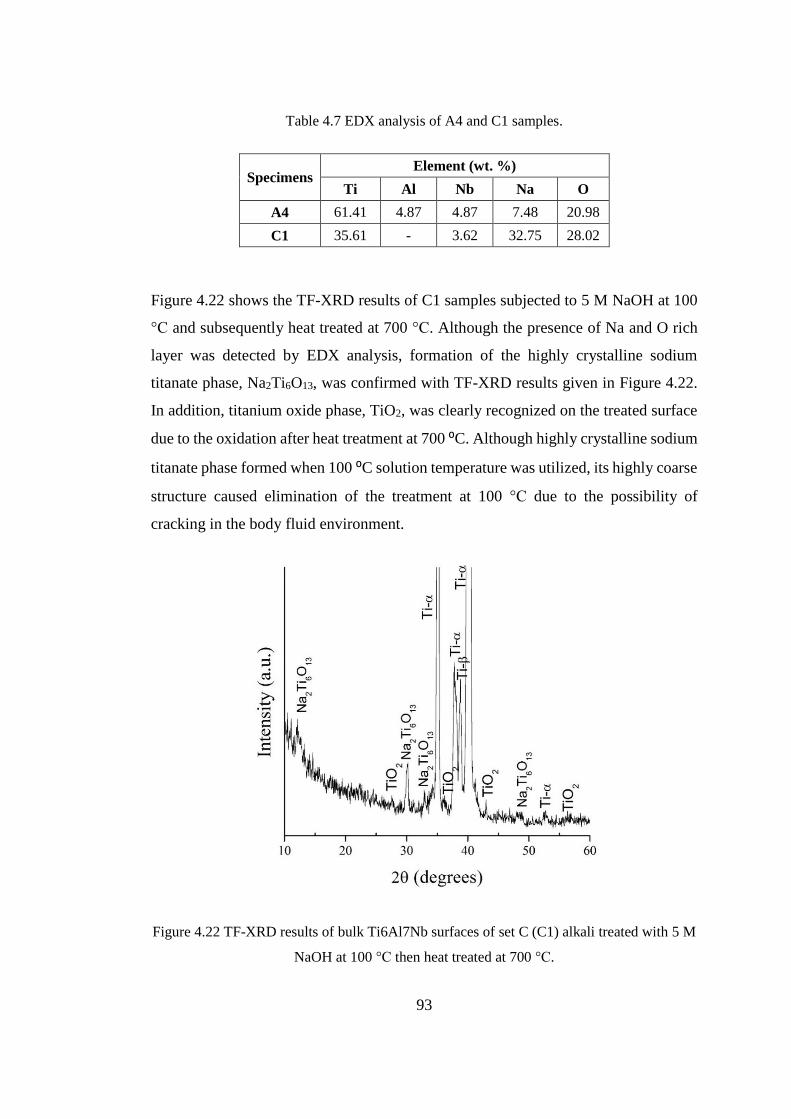
93
Table 4.7 EDX analysis of A4 and C1 samples.
Specimens Element (wt. %)
Ti Al Nb Na O
A4 61.41 4.87 4.87 7.48 20.98
C1 35.61 - 3.62 32.75 28.02
Figure 4.22 shows the TF-XRD results of C1 samples subjected to 5 M NaOH at 100
°C and subsequently heat treated at 700 °C. Although the presence of Na and O rich
layer was detected by EDX analysis, formation of the highly crystalline sodium
titanate phase, Na2Ti6O13, was confirmed with TF-XRD results given in Figure 4.22.
In addition, titanium oxide phase, TiO2, was clearly recognized on the treated surface
due to the oxidation after heat treatment at 700 ⁰C. Although highly crystalline sodium
titanate phase formed when 100 ⁰C solution temperature was utilized, its highly coarse
structure caused elimination of the treatment at 100 °C due to the possibility of
cracking in the body fluid environment.
Figure 4.22 TF-XRD results of bulk Ti6Al7Nb surfaces of set C (C1) alkali treated with 5 M
NaOH at 100 °C then heat treated at 700 °C.
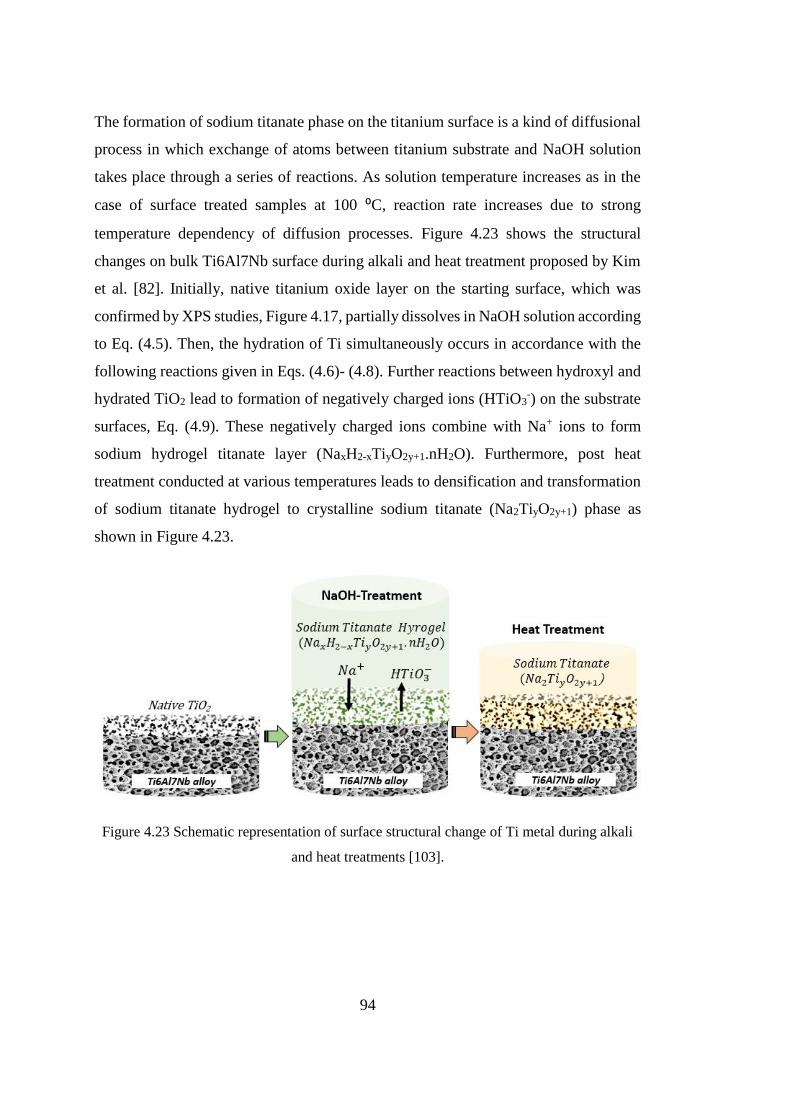
94
The formation of sodium titanate phase on the titanium surface is a kind of diffusional
process in which exchange of atoms between titanium substrate and NaOH solution
takes place through a series of reactions. As solution temperature increases as in the
case of surface treated samples at 100 ⁰C, reaction rate increases due to strong
temperature dependency of diffusion processes. Figure 4.23 shows the structural
changes on bulk Ti6Al7Nb surface during alkali and heat treatment proposed by Kim
et al. [82]. Initially, native titanium oxide layer on the starting surface, which was
confirmed by XPS studies, Figure 4.17, partially dissolves in NaOH solution according
to Eq. (4.5). Then, the hydration of Ti simultaneously occurs in accordance with the
following reactions given in Eqs. (4.6)- (4.8). Further reactions between hydroxyl and
hydrated TiO2 lead to formation of negatively charged ions (HTiO3-) on the substrate
surfaces, Eq. (4.9). These negatively charged ions combine with Na+ ions to form
sodium hydrogel titanate layer (NaxH2-xTiyO2y+1.nH2O). Furthermore, post heat
treatment conducted at various temperatures leads to densification and transformation
of sodium titanate hydrogel to crystalline sodium titanate (Na2TiyO2y+1) phase as
shown in Figure 4.23.
Figure 4.23 Schematic representation of surface structural change of Ti metal during alkali
and heat treatments [103].

95
TiO2 + NaOH → HTiO3− + Na+ (4.5)
Ti + 3OH− → Ti(OH)3+ + 4e− (4.6)
Ti(OH)3
+ + e− → TiO2. H2O + 1
2H2 ↑
(4.7)
Ti(OH)3+ + OH− ↔ Ti(OH)4 (4.8)
TiO2. H2O + OH− ↔ HTiO3−. nH2O (4.9)
To sum up, fine homogenous and uniform sodium rich coating layers were obtained
under some specific conditions which were defined as optimum processing
parameters. As stated previously, increasing the NaOH solution concentration from 5
M to 10 M resulted in large deep surface cracks and non-homogenous coating layers.
On the other hand, solution temperature strongly changed precipitation tendency of
sodium rich layer such that Na-rich phases formed as large agglomerates and three
dimensional network structures were lost as solution temperature increased from 60
⁰C to 100 ⁰C. Post processing heat treatment which was performed to stabilize and
crystallize the Na-rich phase also changed the surface structure. Although Na-
containing network structure was relatively finer as the heat treatment temperature
changed between 500 ⁰C and 600 ⁰C, the coating layer become coarser in samples heat
treated at 700 ⁰C mainly due to excessive oxidation. The effects of holding time in
solution and heat treatment time were not considered since their influences on
formation and structure of Na-rich phases were thought to be considerably small
compared to the effect of solution temperature.
As a result of preliminary studies, 5 M, 60 °C, 24 h were chosen as optimum solution
concentration, solution temperature and holding time, respectively. Suitable heat
treatment temperature and time were assigned as 600 °C and 1 h which were the
possible lowest temperature and time that enabled the formation of sodium titanate
phase without undesirable excessive oxide phases.
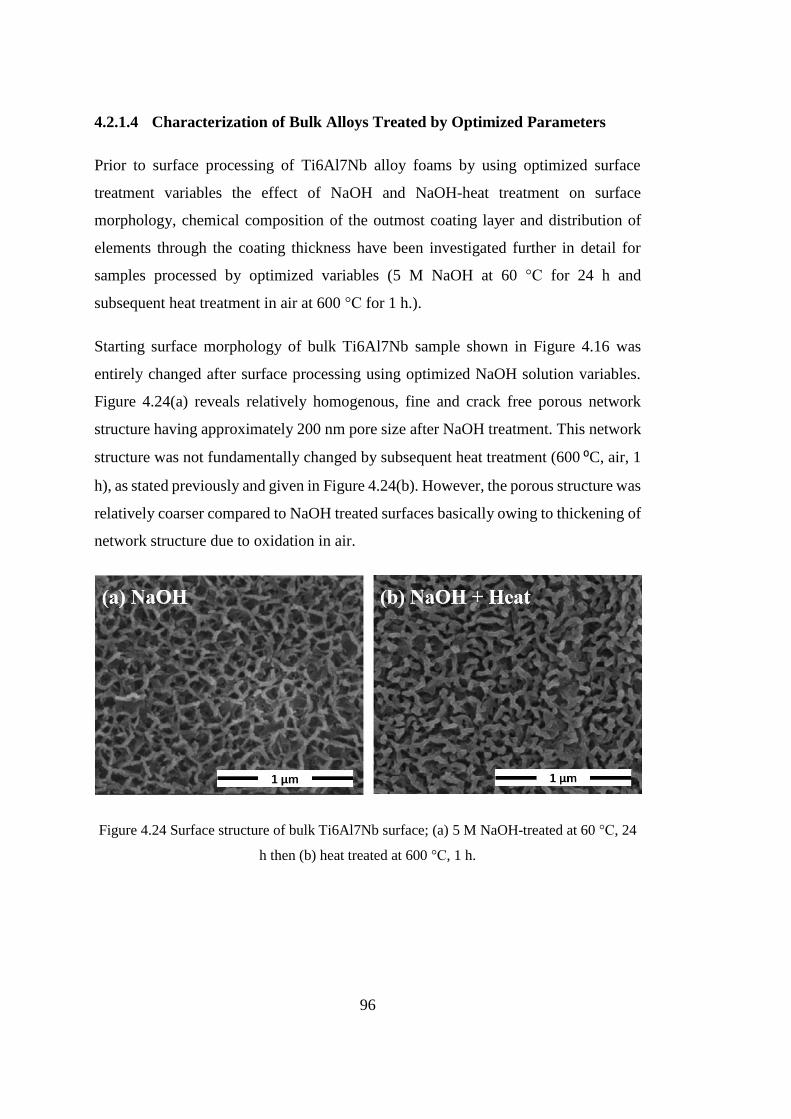
96
4.2.1.4 Characterization of Bulk Alloys Treated by Optimized Parameters
Prior to surface processing of Ti6Al7Nb alloy foams by using optimized surface
treatment variables the effect of NaOH and NaOH-heat treatment on surface
morphology, chemical composition of the outmost coating layer and distribution of
elements through the coating thickness have been investigated further in detail for
samples processed by optimized variables (5 M NaOH at 60 °C for 24 h and
subsequent heat treatment in air at 600 °C for 1 h.).
Starting surface morphology of bulk Ti6Al7Nb sample shown in Figure 4.16 was
entirely changed after surface processing using optimized NaOH solution variables.
Figure 4.24(a) reveals relatively homogenous, fine and crack free porous network
structure having approximately 200 nm pore size after NaOH treatment. This network
structure was not fundamentally changed by subsequent heat treatment (600 ⁰C, air, 1
h), as stated previously and given in Figure 4.24(b). However, the porous structure was
relatively coarser compared to NaOH treated surfaces basically owing to thickening of
network structure due to oxidation in air.
Figure 4.24 Surface structure of bulk Ti6Al7Nb surface; (a) 5 M NaOH-treated at 60 °C, 24
h then (b) heat treated at 600 °C, 1 h.
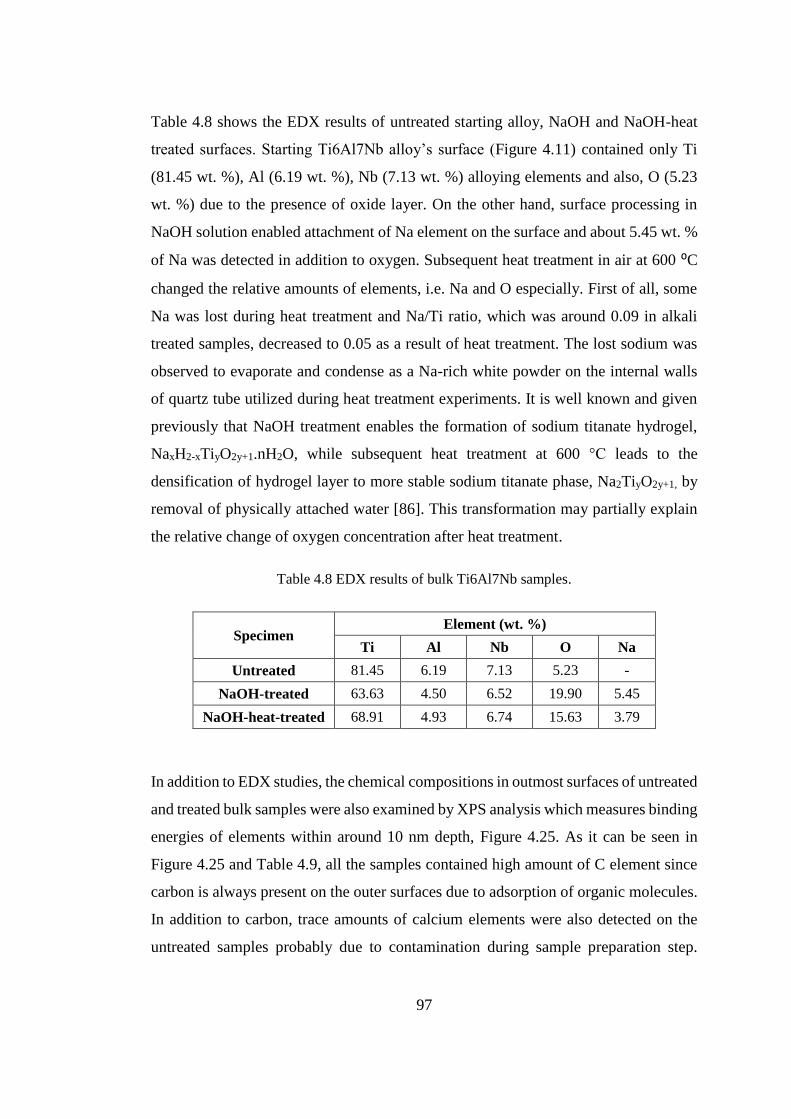
97
Table 4.8 shows the EDX results of untreated starting alloy, NaOH and NaOH-heat
treated surfaces. Starting Ti6Al7Nb alloy’s surface (Figure 4.11) contained only Ti
(81.45 wt. %), Al (6.19 wt. %), Nb (7.13 wt. %) alloying elements and also, O (5.23
wt. %) due to the presence of oxide layer. On the other hand, surface processing in
NaOH solution enabled attachment of Na element on the surface and about 5.45 wt. %
of Na was detected in addition to oxygen. Subsequent heat treatment in air at 600 ⁰C
changed the relative amounts of elements, i.e. Na and O especially. First of all, some
Na was lost during heat treatment and Na/Ti ratio, which was around 0.09 in alkali
treated samples, decreased to 0.05 as a result of heat treatment. The lost sodium was
observed to evaporate and condense as a Na-rich white powder on the internal walls
of quartz tube utilized during heat treatment experiments. It is well known and given
previously that NaOH treatment enables the formation of sodium titanate hydrogel,
NaxH2-xTiyO2y+1.nH2O, while subsequent heat treatment at 600 °C leads to the
densification of hydrogel layer to more stable sodium titanate phase, Na2TiyO2y+1, by
removal of physically attached water [86]. This transformation may partially explain
the relative change of oxygen concentration after heat treatment.
Table 4.8 EDX results of bulk Ti6Al7Nb samples.
Specimen Element (wt. %)
Ti Al Nb O Na
Untreated 81.45 6.19 7.13 5.23 -
NaOH-treated 63.63 4.50 6.52 19.90 5.45
NaOH-heat-treated 68.91 4.93 6.74 15.63 3.79
In addition to EDX studies, the chemical compositions in outmost surfaces of untreated
and treated bulk samples were also examined by XPS analysis which measures binding
energies of elements within around 10 nm depth, Figure 4.25. As it can be seen in
Figure 4.25 and Table 4.9, all the samples contained high amount of C element since
carbon is always present on the outer surfaces due to adsorption of organic molecules.
In addition to carbon, trace amounts of calcium elements were also detected on the
untreated samples probably due to contamination during sample preparation step.
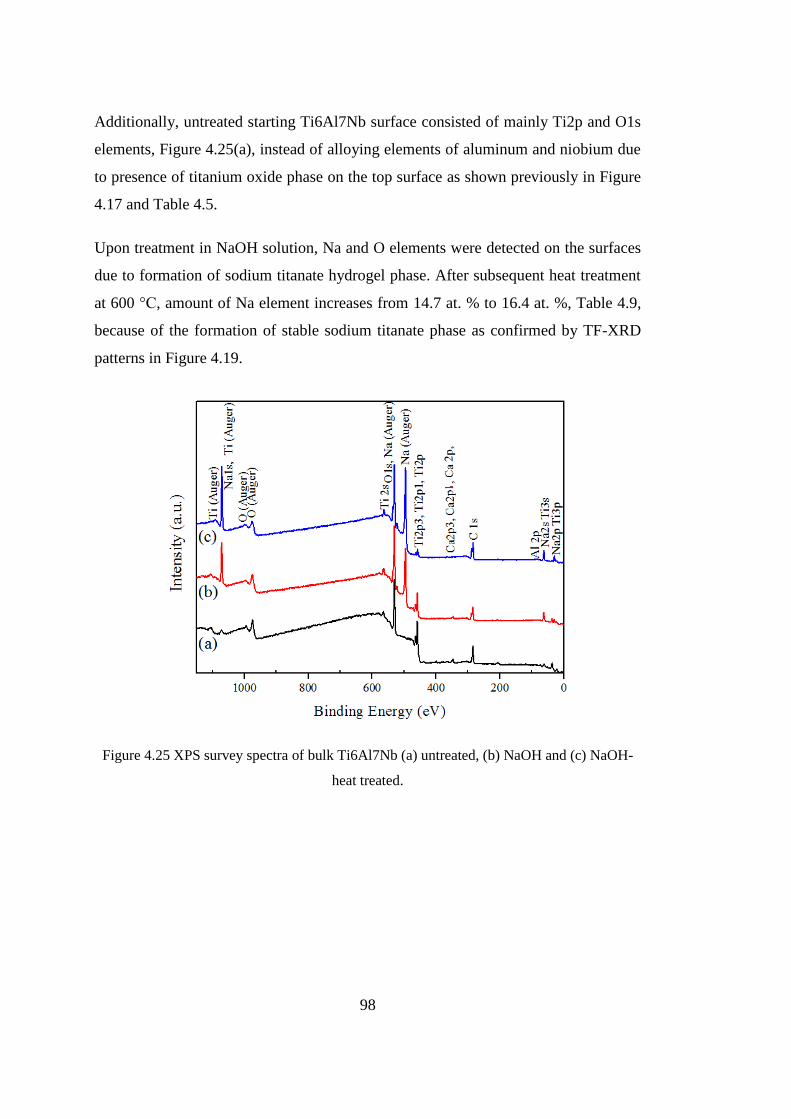
98
Additionally, untreated starting Ti6Al7Nb surface consisted of mainly Ti2p and O1s
elements, Figure 4.25(a), instead of alloying elements of aluminum and niobium due
to presence of titanium oxide phase on the top surface as shown previously in Figure
4.17 and Table 4.5.
Upon treatment in NaOH solution, Na and O elements were detected on the surfaces
due to formation of sodium titanate hydrogel phase. After subsequent heat treatment
at 600 °C, amount of Na element increases from 14.7 at. % to 16.4 at. %, Table 4.9,
because of the formation of stable sodium titanate phase as confirmed by TF-XRD
patterns in Figure 4.19.
Figure 4.25 XPS survey spectra of bulk Ti6Al7Nb (a) untreated, (b) NaOH and (c) NaOH-
heat treated.
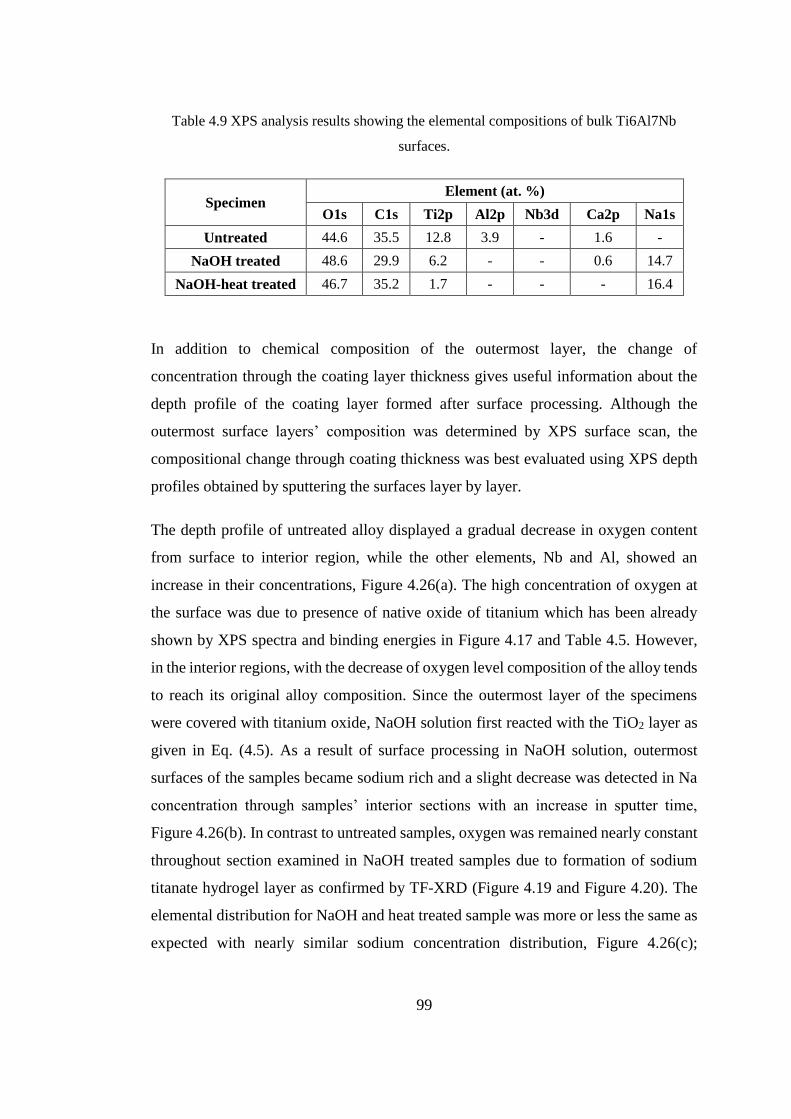
99
Table 4.9 XPS analysis results showing the elemental compositions of bulk Ti6Al7Nb
surfaces.
Specimen Element (at. %)
O1s C1s Ti2p Al2p Nb3d Ca2p Na1s
Untreated 44.6 35.5 12.8 3.9 - 1.6 -
NaOH treated 48.6 29.9 6.2 - - 0.6 14.7
NaOH-heat treated 46.7 35.2 1.7 - - - 16.4
In addition to chemical composition of the outermost layer, the change of
concentration through the coating layer thickness gives useful information about the
depth profile of the coating layer formed after surface processing. Although the
outermost surface layers’ composition was determined by XPS surface scan, the
compositional change through coating thickness was best evaluated using XPS depth
profiles obtained by sputtering the surfaces layer by layer.
The depth profile of untreated alloy displayed a gradual decrease in oxygen content
from surface to interior region, while the other elements, Nb and Al, showed an
increase in their concentrations, Figure 4.26(a). The high concentration of oxygen at
the surface was due to presence of native oxide of titanium which has been already
shown by XPS spectra and binding energies in Figure 4.17 and Table 4.5. However,
in the interior regions, with the decrease of oxygen level composition of the alloy tends
to reach its original alloy composition. Since the outermost layer of the specimens
were covered with titanium oxide, NaOH solution first reacted with the TiO2 layer as
given in Eq. (4.5). As a result of surface processing in NaOH solution, outermost
surfaces of the samples became sodium rich and a slight decrease was detected in Na
concentration through samples’ interior sections with an increase in sputter time,
Figure 4.26(b). In contrast to untreated samples, oxygen was remained nearly constant
throughout section examined in NaOH treated samples due to formation of sodium
titanate hydrogel layer as confirmed by TF-XRD (Figure 4.19 and Figure 4.20). The
elemental distribution for NaOH and heat treated sample was more or less the same as
expected with nearly similar sodium concentration distribution, Figure 4.26(c);
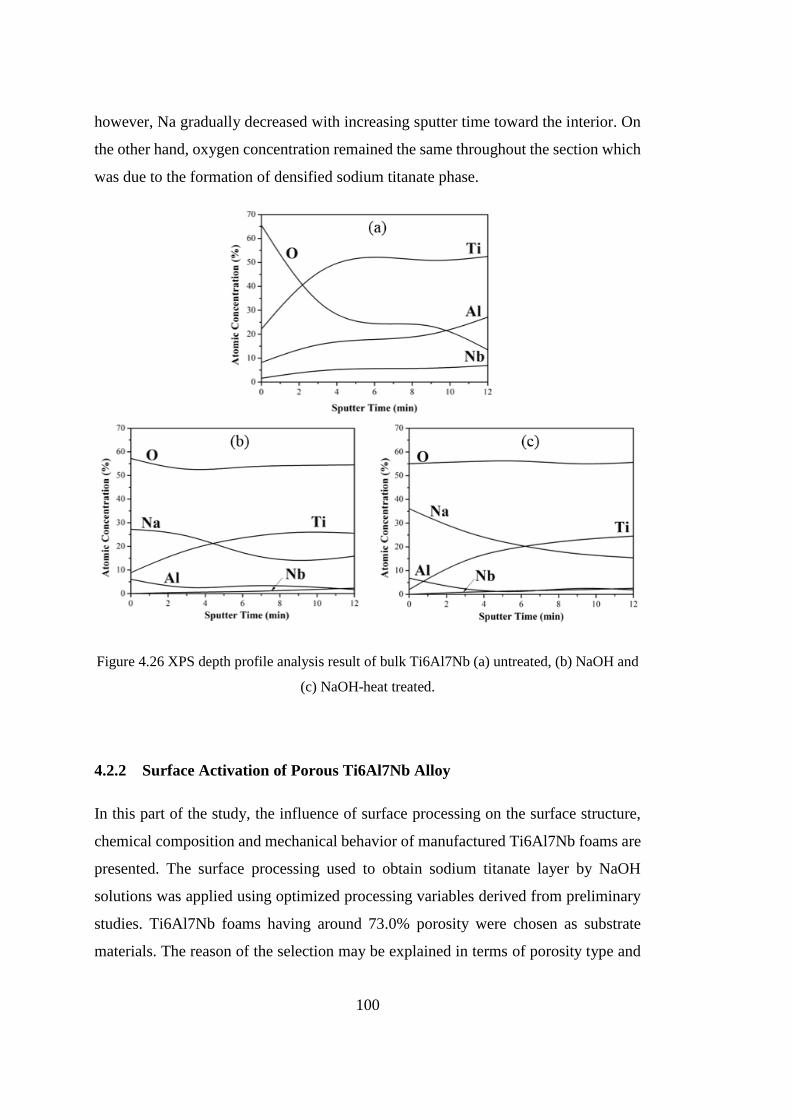
100
however, Na gradually decreased with increasing sputter time toward the interior. On
the other hand, oxygen concentration remained the same throughout the section which
was due to the formation of densified sodium titanate phase.
Figure 4.26 XPS depth profile analysis result of bulk Ti6Al7Nb (a) untreated, (b) NaOH and
(c) NaOH-heat treated.
4.2.2 Surface Activation of Porous Ti6Al7Nb Alloy
In this part of the study, the influence of surface processing on the surface structure,
chemical composition and mechanical behavior of manufactured Ti6Al7Nb foams are
presented. The surface processing used to obtain sodium titanate layer by NaOH
solutions was applied using optimized processing variables derived from preliminary
studies. Ti6Al7Nb foams having around 73.0% porosity were chosen as substrate
materials. The reason of the selection may be explained in terms of porosity type and
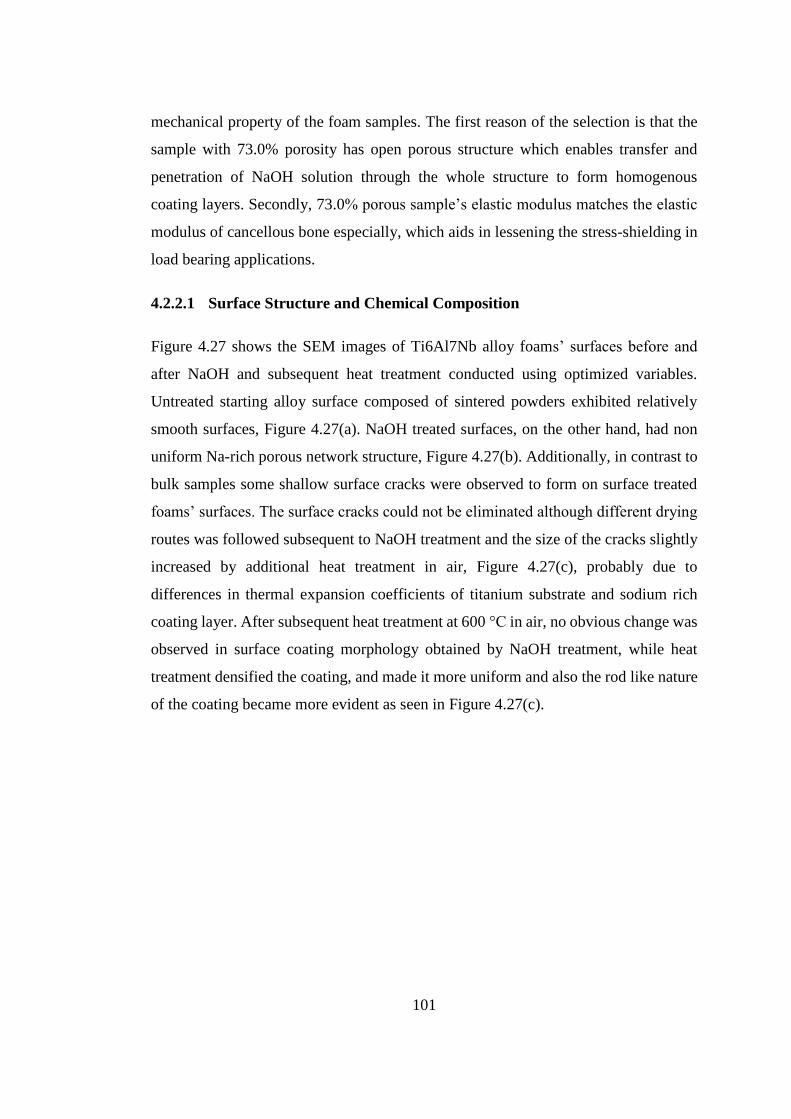
101
mechanical property of the foam samples. The first reason of the selection is that the
sample with 73.0% porosity has open porous structure which enables transfer and
penetration of NaOH solution through the whole structure to form homogenous
coating layers. Secondly, 73.0% porous sample’s elastic modulus matches the elastic
modulus of cancellous bone especially, which aids in lessening the stress-shielding in
load bearing applications.
4.2.2.1 Surface Structure and Chemical Composition
Figure 4.27 shows the SEM images of Ti6Al7Nb alloy foams’ surfaces before and
after NaOH and subsequent heat treatment conducted using optimized variables.
Untreated starting alloy surface composed of sintered powders exhibited relatively
smooth surfaces, Figure 4.27(a). NaOH treated surfaces, on the other hand, had non
uniform Na-rich porous network structure, Figure 4.27(b). Additionally, in contrast to
bulk samples some shallow surface cracks were observed to form on surface treated
foams’ surfaces. The surface cracks could not be eliminated although different drying
routes was followed subsequent to NaOH treatment and the size of the cracks slightly
increased by additional heat treatment in air, Figure 4.27(c), probably due to
differences in thermal expansion coefficients of titanium substrate and sodium rich
coating layer. After subsequent heat treatment at 600 °C in air, no obvious change was
observed in surface coating morphology obtained by NaOH treatment, while heat
treatment densified the coating, and made it more uniform and also the rod like nature
of the coating became more evident as seen in Figure 4.27(c).

102
Figure 4.27 SEM images of Ti6Al7Nb foams’ surfaces at x25.000 and x100.000
magnifications.
Unlike the bulk samples, additional heat treatment after NaOH treatment did not cause
a decrease in Na concentration on porous coating layers. Calculated Na/Ti ratio of
around 0.08 in NaOH treated samples was increased to 0.15 by additional heat
treatment, Table 4.10. The relative differences in surface compositions of bulk and
foam samples after surface processing were attributed to structural differences between
two types of samples. In bulk samples, sodium probably escaped from the free surfaces
easily during heat treatment while in foam samples Na lost was minimized or escape
of Na became difficult due to wavy porous nature of the foams.
Table 4.10 EDX results of porous Ti6Al7Nb surfaces before and after various treatments.
Specimen Element (wt. %)
Ti Al Nb O Na
Untreated 83.11 4.98 8.53 3.38 -
NaOH-treated 70.41 2.61 4.77 16.63 5.59
NaOH-heat treated 55.28 3.75 8.21 24.19 8.58
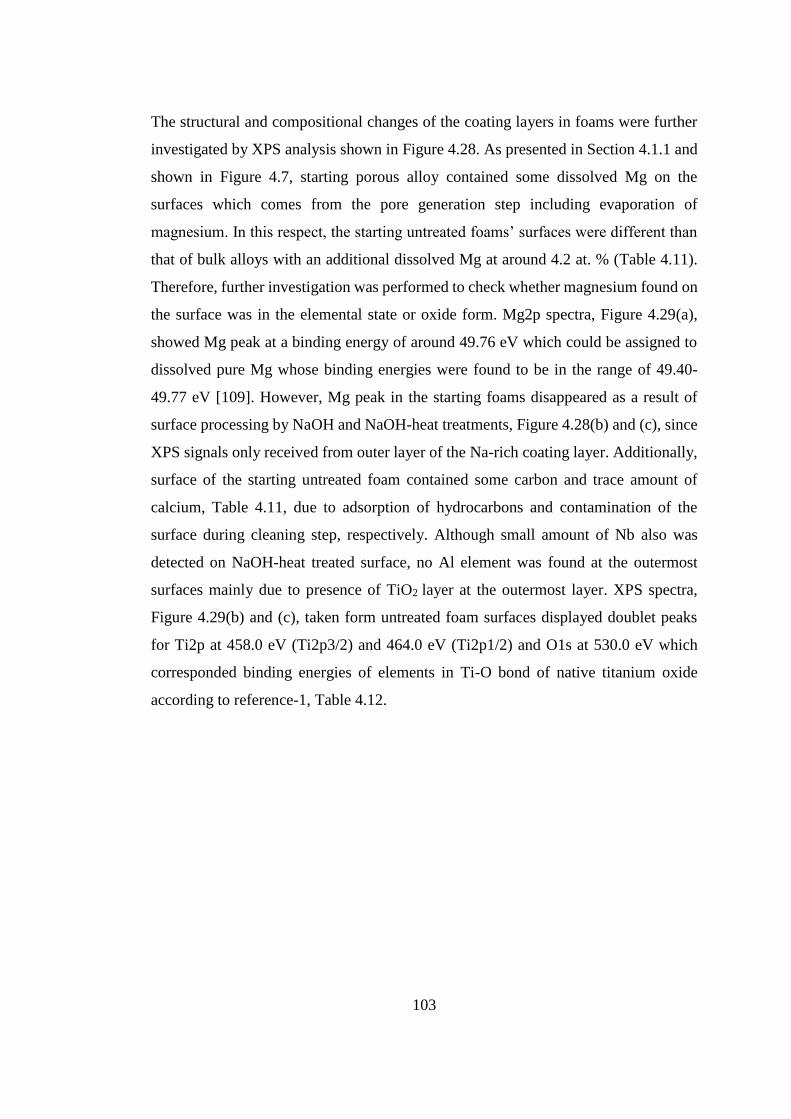
103
The structural and compositional changes of the coating layers in foams were further
investigated by XPS analysis shown in Figure 4.28. As presented in Section 4.1.1 and
shown in Figure 4.7, starting porous alloy contained some dissolved Mg on the
surfaces which comes from the pore generation step including evaporation of
magnesium. In this respect, the starting untreated foams’ surfaces were different than
that of bulk alloys with an additional dissolved Mg at around 4.2 at. % (Table 4.11).
Therefore, further investigation was performed to check whether magnesium found on
the surface was in the elemental state or oxide form. Mg2p spectra, Figure 4.29(a),
showed Mg peak at a binding energy of around 49.76 eV which could be assigned to
dissolved pure Mg whose binding energies were found to be in the range of 49.40-
49.77 eV [109]. However, Mg peak in the starting foams disappeared as a result of
surface processing by NaOH and NaOH-heat treatments, Figure 4.28(b) and (c), since
XPS signals only received from outer layer of the Na-rich coating layer. Additionally,
surface of the starting untreated foam contained some carbon and trace amount of
calcium, Table 4.11, due to adsorption of hydrocarbons and contamination of the
surface during cleaning step, respectively. Although small amount of Nb also was
detected on NaOH-heat treated surface, no Al element was found at the outermost
surfaces mainly due to presence of TiO2 layer at the outermost layer. XPS spectra,
Figure 4.29(b) and (c), taken form untreated foam surfaces displayed doublet peaks
for Ti2p at 458.0 eV (Ti2p3/2) and 464.0 eV (Ti2p1/2) and O1s at 530.0 eV which
corresponded binding energies of elements in Ti-O bond of native titanium oxide
according to reference-1, Table 4.12.
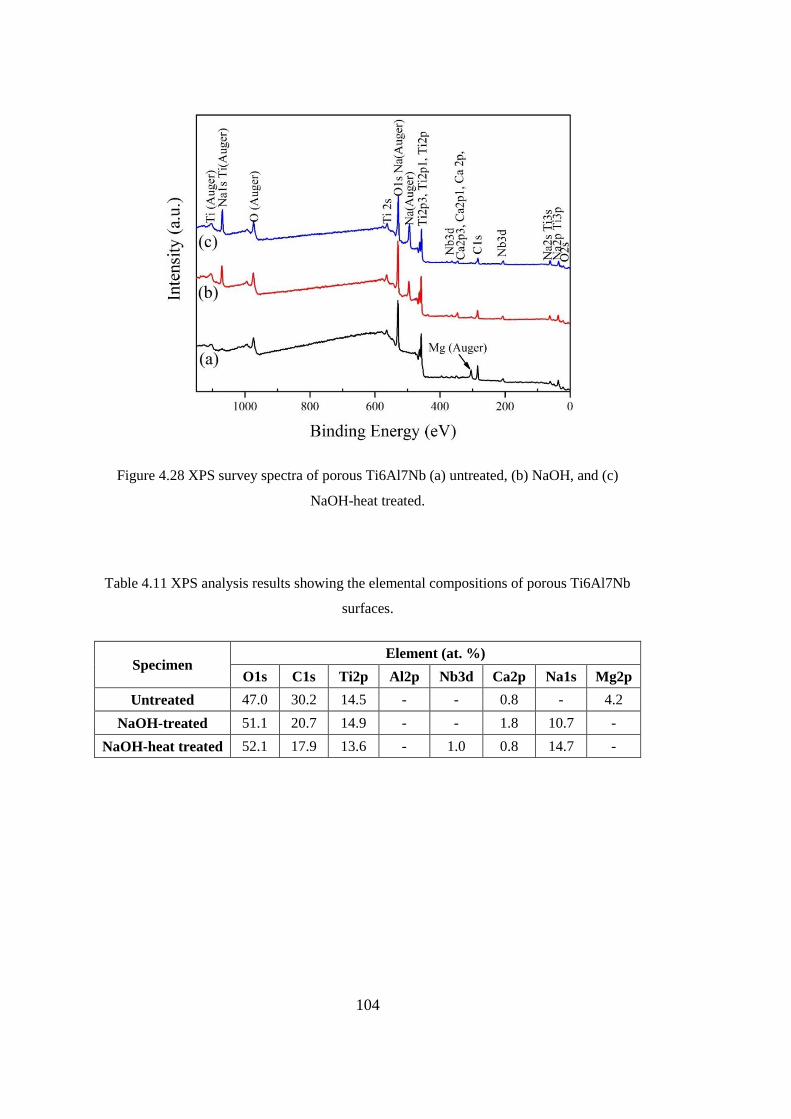
104
Figure 4.28 XPS survey spectra of porous Ti6Al7Nb (a) untreated, (b) NaOH, and (c)
NaOH-heat treated.
Table 4.11 XPS analysis results showing the elemental compositions of porous Ti6Al7Nb
surfaces.
Specimen Element (at. %)
O1s C1s Ti2p Al2p Nb3d Ca2p Na1s Mg2p
Untreated 47.0 30.2 14.5 - - 0.8 - 4.2
NaOH-treated 51.1 20.7 14.9 - - 1.8 10.7 -
NaOH-heat treated 52.1 17.9 13.6 - 1.0 0.8 14.7 -
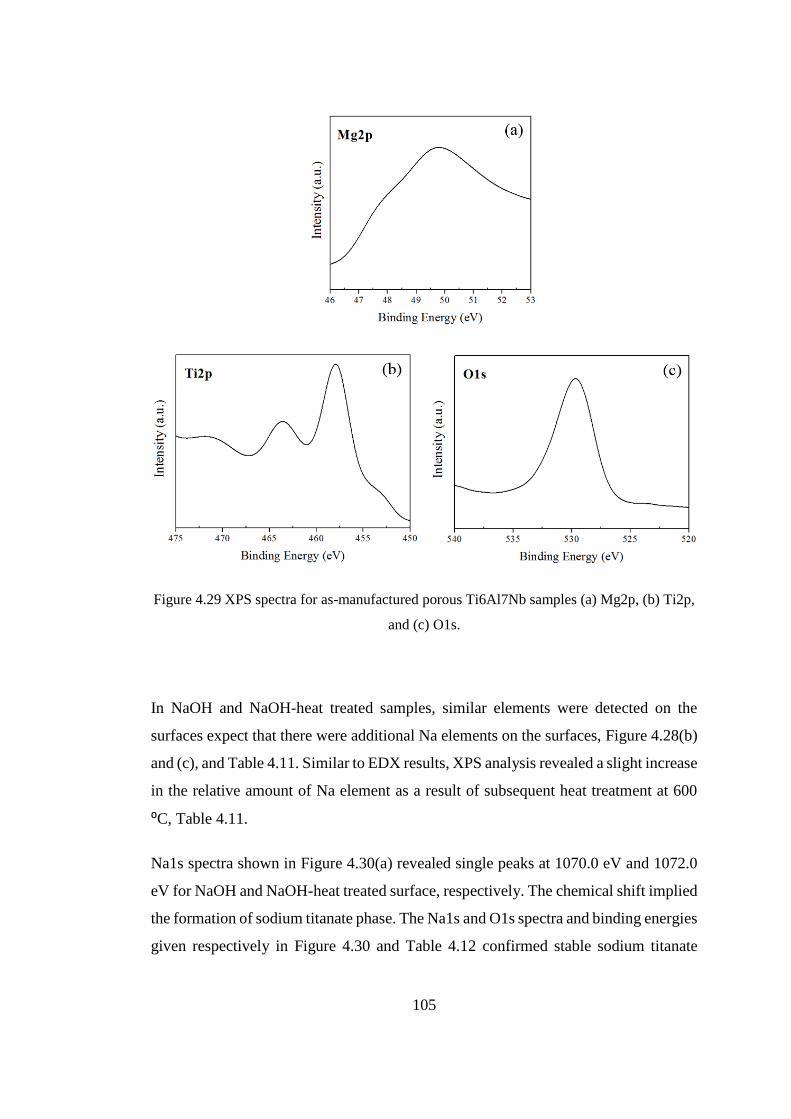
105
Figure 4.29 XPS spectra for as-manufactured porous Ti6Al7Nb samples (a) Mg2p, (b) Ti2p,
and (c) O1s.
In NaOH and NaOH-heat treated samples, similar elements were detected on the
surfaces expect that there were additional Na elements on the surfaces, Figure 4.28(b)
and (c), and Table 4.11. Similar to EDX results, XPS analysis revealed a slight increase
in the relative amount of Na element as a result of subsequent heat treatment at 600
⁰C, Table 4.11.
Na1s spectra shown in Figure 4.30(a) revealed single peaks at 1070.0 eV and 1072.0
eV for NaOH and NaOH-heat treated surface, respectively. The chemical shift implied
the formation of sodium titanate phase. The Na1s and O1s spectra and binding energies
given respectively in Figure 4.30 and Table 4.12 confirmed stable sodium titanate
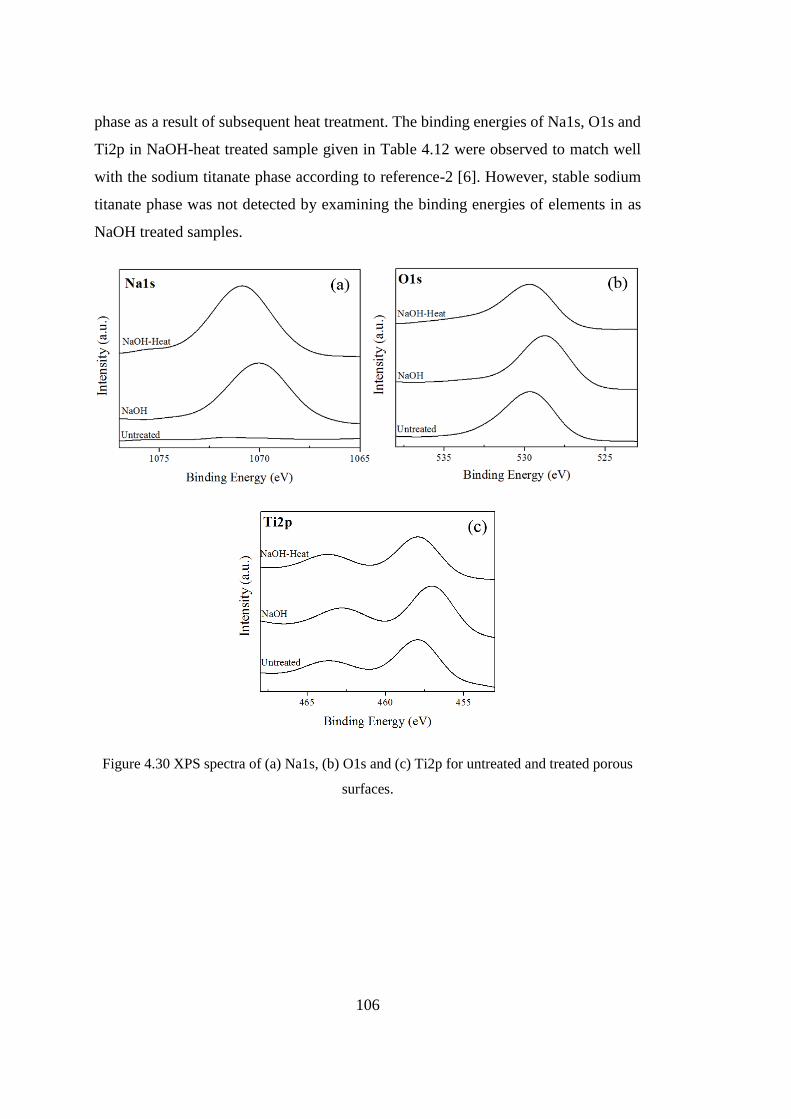
106
phase as a result of subsequent heat treatment. The binding energies of Na1s, O1s and
Ti2p in NaOH-heat treated sample given in Table 4.12 were observed to match well
with the sodium titanate phase according to reference-2 [6]. However, stable sodium
titanate phase was not detected by examining the binding energies of elements in as
NaOH treated samples.
Figure 4.30 XPS spectra of (a) Na1s, (b) O1s and (c) Ti2p for untreated and treated porous
surfaces.
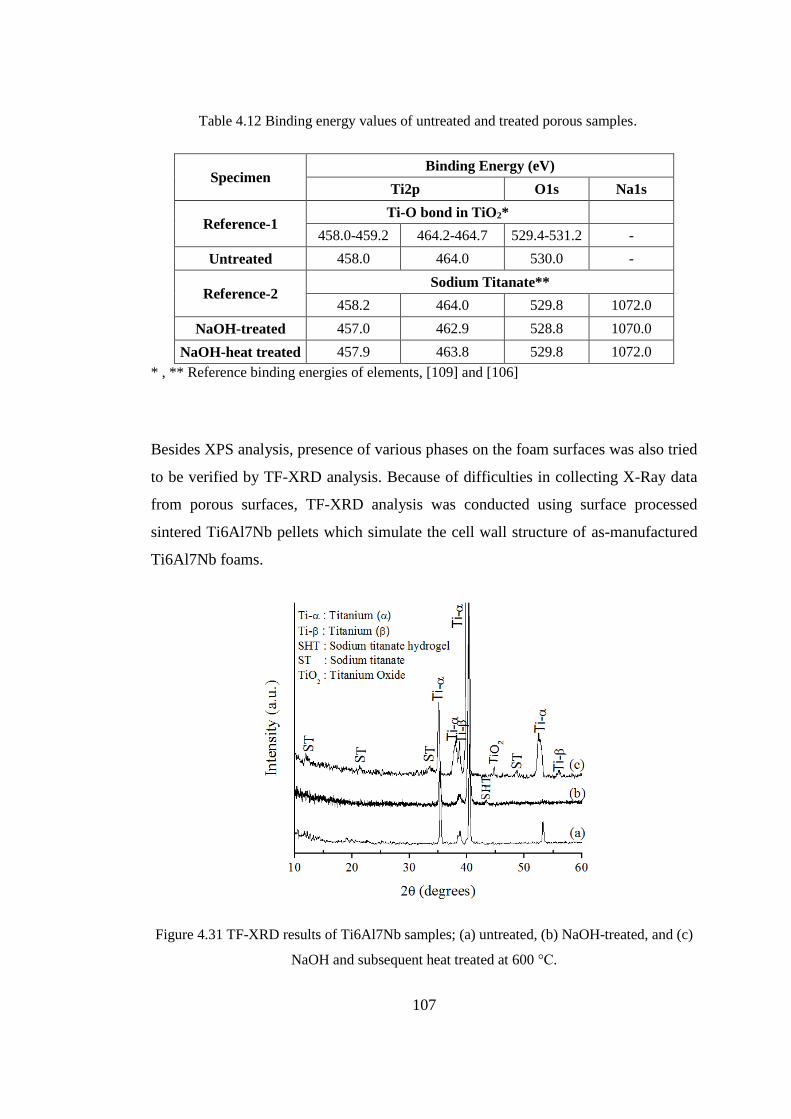
107
Table 4.12 Binding energy values of untreated and treated porous samples.
Specimen Binding Energy (eV)
Ti2p O1s Na1s
Reference-1 Ti-O bond in TiO2*
458.0-459.2 464.2-464.7 529.4-531.2 -
Untreated 458.0 464.0 530.0 -
Reference-2 Sodium Titanate**
458.2 464.0 529.8 1072.0
NaOH-treated 457.0 462.9 528.8 1070.0
NaOH-heat treated 457.9 463.8 529.8 1072.0
* , ** Reference binding energies of elements, [109] and [106]
Besides XPS analysis, presence of various phases on the foam surfaces was also tried
to be verified by TF-XRD analysis. Because of difficulties in collecting X-Ray data
from porous surfaces, TF-XRD analysis was conducted using surface processed
sintered Ti6Al7Nb pellets which simulate the cell wall structure of as-manufactured
Ti6Al7Nb foams.
Figure 4.31 TF-XRD results of Ti6Al7Nb samples; (a) untreated, (b) NaOH-treated, and (c)
NaOH and subsequent heat treated at 600 °C.

108
Figure 4.31 shows the TF-XRD results before and after NaOH and subsequent heat
treatment. Although untreated Ti6Al7Nb foam contained only main peaks of α-Ti,
Figure 4.31(a), NaOH treated foam surfaces were observed to consist of sodium
titanate hydrogel, NaxH2-xTiyO2y+1.nH2O, (SHT) phases, Figure 4.31(b), as expected.
Additional heat treatment at 600 °C allowed the formation of crystalline sodium
titanate phase, Na2TiyO2y+1, (ST) by removal of physically bond water, Figure 4.31(c),
as also confirmed by XPS studies. Relatively low amount of TiO2 phase was also
observed owing to oxidation of Ti6Al7Nb foams. As shown in Figure 4.31(c), relative
intensities of sodium titanate (ST) layer were very small compared to that of α-Ti
because of its relatively thin structure.
4.2.2.2 Mechanical Properties of Coating Layer and Surface Processed
Ti6Al7Nb Foams
In this part of the study, some experiments were conducted to measure the mechanical
stability of the sodium titanate coating layer obtained by NaOH-heat treatment via
crush tests and the effect of surface processing on the compression mechanical
properties of foams was examined through a series of compression tests.
The sodium titanate coating layer obtained as a result of NaOH-heat treatment was
very thin, around 500 nm, and homogenous as shown in Figure 4.32. Although the
outer layer of the titanate layer contained some surface cracks, Figure 4.27(c), fracture
in the coating did not follow these preexisting surface cracks during crush tests and
conversely, fracturing in the coating layer occurred in the same plane of substrate
fracture. Accordingly, the coating was classified as a mechanically stable layer
because it preserved its integrity after crushing the surface treated samples.
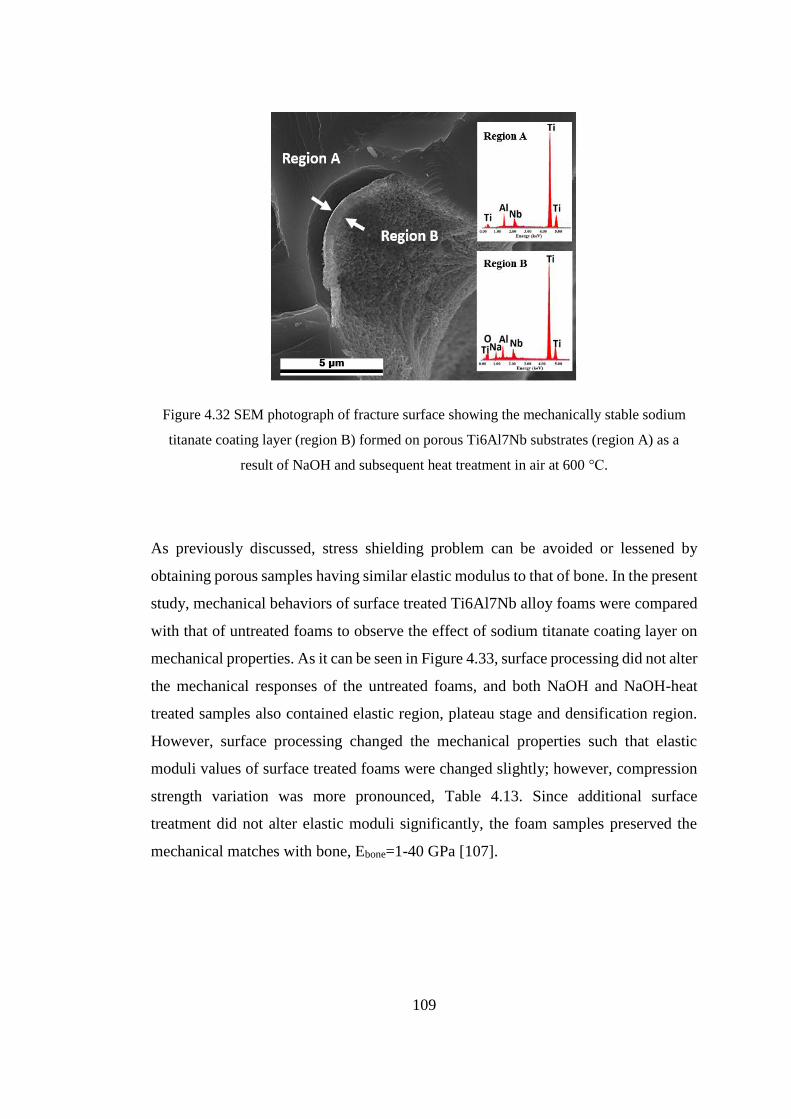
109
Figure 4.32 SEM photograph of fracture surface showing the mechanically stable sodium
titanate coating layer (region B) formed on porous Ti6Al7Nb substrates (region A) as a
result of NaOH and subsequent heat treatment in air at 600 °C.
As previously discussed, stress shielding problem can be avoided or lessened by
obtaining porous samples having similar elastic modulus to that of bone. In the present
study, mechanical behaviors of surface treated Ti6Al7Nb alloy foams were compared
with that of untreated foams to observe the effect of sodium titanate coating layer on
mechanical properties. As it can be seen in Figure 4.33, surface processing did not alter
the mechanical responses of the untreated foams, and both NaOH and NaOH-heat
treated samples also contained elastic region, plateau stage and densification region.
However, surface processing changed the mechanical properties such that elastic
moduli values of surface treated foams were changed slightly; however, compression
strength variation was more pronounced, Table 4.13. Since additional surface
treatment did not alter elastic moduli significantly, the foam samples preserved the
mechanical matches with bone, Ebone=1-40 GPa [107].
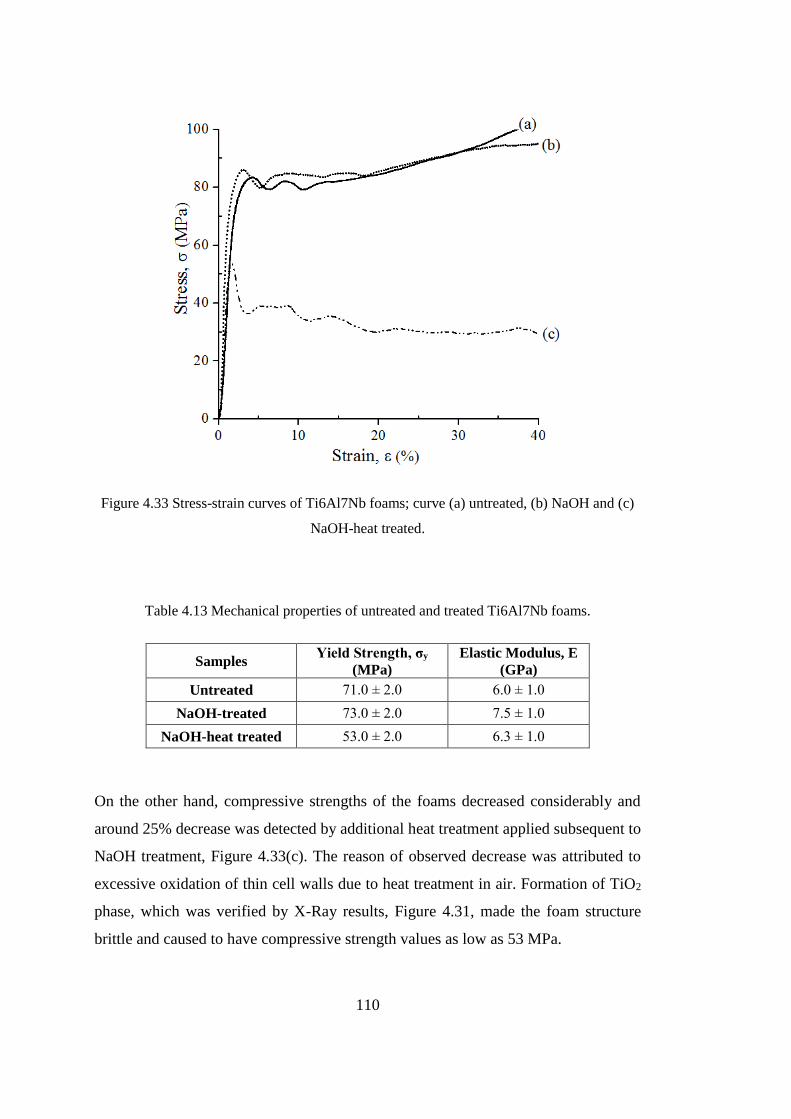
110
Figure 4.33 Stress-strain curves of Ti6Al7Nb foams; curve (a) untreated, (b) NaOH and (c)
NaOH-heat treated.
Table 4.13 Mechanical properties of untreated and treated Ti6Al7Nb foams.
Samples Yield Strength, σy
(MPa)
Elastic Modulus, E
(GPa)
Untreated 71.0 ± 2.0 6.0 ± 1.0
NaOH-treated 73.0 ± 2.0 7.5 ± 1.0
NaOH-heat treated 53.0 ± 2.0 6.3 ± 1.0
On the other hand, compressive strengths of the foams decreased considerably and
around 25% decrease was detected by additional heat treatment applied subsequent to
NaOH treatment, Figure 4.33(c). The reason of observed decrease was attributed to
excessive oxidation of thin cell walls due to heat treatment in air. Formation of TiO2
phase, which was verified by X-Ray results, Figure 4.31, made the foam structure
brittle and caused to have compressive strength values as low as 53 MPa.
111
To sum up, more uniform and continuous coating layer was obtained after subsequent
heat treatment in air but, NaOH treated foams displayed better mechanical properties.
However, in terms of mechanical stability of the coating and the bioactivity, which
will be presented in the following parts, NaOH-heat treated samples exhibited superior
performance. Use of different heat treatment atmospheres such as heat treatment under
argon may minimize the degradation of compressive strength caused due to oxidation
in NaOH-air heat treated samples.
4.3 In vitro Studies with SBF
Functional properties, i.e. bioactivities, of untreated and surface treated Ti6Al7Nb
alloy foams were tested and compared using SBF at 36.5 0.5oC (pH=7.4). As it is
known, during interaction with SBF, biologically active materials’ surfaces have
ability to form apatite layer which is the main requirement for an artificial implant to
bond to living bone [102]. Therefore, bioactivities of various samples were tested by
evaluating the apatite formation on the surfaces in different periods of time, i.e. one
day, 5 and 15 days in SBF.
Figure 4.34 shows the surface morphologies of porous samples before and after
immersion in SBF for different periods. It is easy to see the effect of SBF on surface
morphology of porous Ti6Al7Nb surfaces, namely, untreated (sample S-A-0), NaOH
treated (sample S-B-0) and NaOH-heat treated (sample S-C-0), Figure 4.34. Surface
morphologies of all porous samples were slightly changed after immersion in SBF for
one day (S-A-1, S-B-1 and S-C-1, Figure 4.34) and precipitation of white particles has
been observed rarely. The frequency and size of the precipitates were largely
dependent on whether surfaces were subjected to NaOH treatment or not. The bright
particles on untreated sample’s surface were relatively small, Figure 4.34 (S-A-1),
while surface treated samples led to the formation of relatively coarser particles as seen
in Figure 4.34 (S-B-1) and (S-C-1). According to EDX results presented in Table 4.14,
the precipitated particles observed after one day were rich in Ca and P elements.
112
As it is known, biological apatite found in bone and synthetic hydroxyapatite contain
mainly Ca and P elements and the Ca/P atomic ratios in both apatite are found to be
1.655 and 1.667, respectively [100]. However, Ca/P ratios calculated in one day tested
samples were observed to change between 2.1 and 2.3, Table 4.14, which is far from
the ideal Ca/P ratio seen in biological apatite. Accordingly, it was concluded that the
surfaces were only supersaturated with Ca element within one day of immersion.
The sizes and chemical compositions of precipitated particles in 5 and 15 days were
completely different. After soaking for 5 days, although the precipitated particles’
morphologies did not change considerably, their sizes increased and agglomerated
particles were observed at specific regions of NaOH and NaOH-heat treated samples,
Figure 4.34. Likewise, at the end of 15 days, precipitated particles become coarser in
NaOH and NaOH-heat treated samples. Moreover, almost all the surfaces of NaOH
treated samples were covered with the precipitated particles which turned into hemi-
spherical shape with around 1 m in diameter. Although the frequency of the
precipitated particles in NaOH treated samples was not as high as seen in NaOH-heat
treated samples, it was relatively higher compared to untreated samples’ particles.
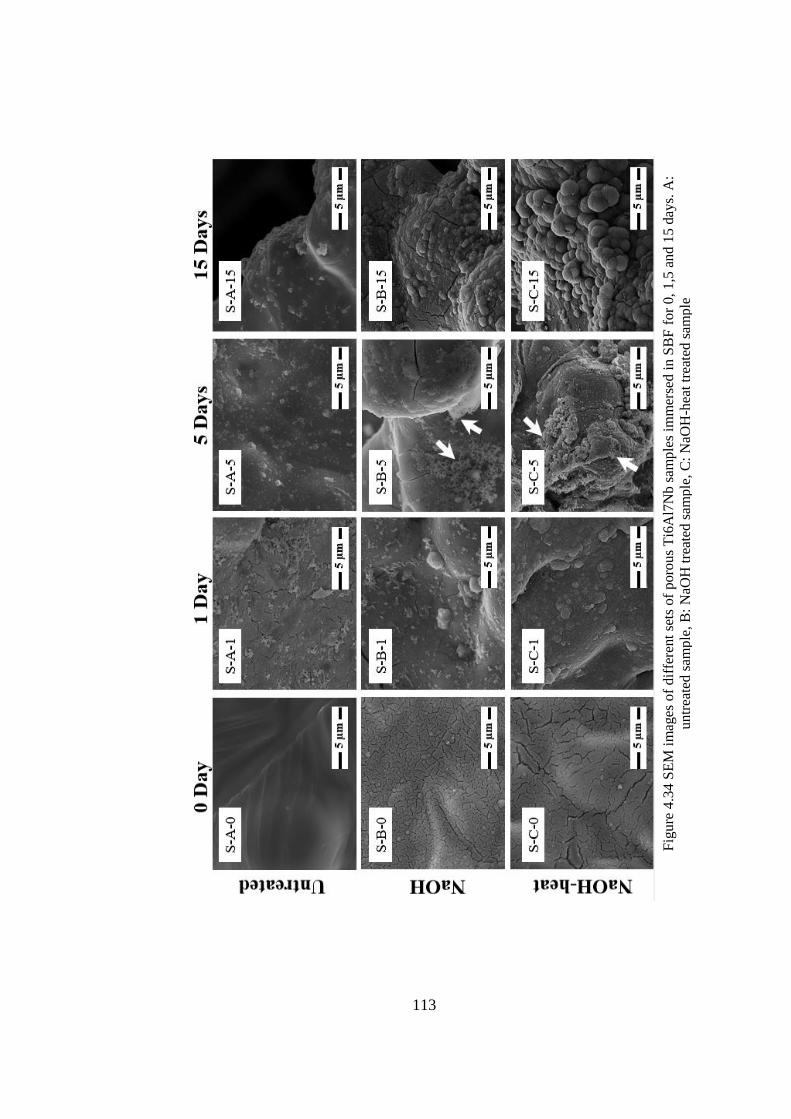
113
Fig
ure
4.3
4 S
EM
im
ages
of
dif
fere
nt
sets
of
poro
us
Ti6
Al7
Nb s
ample
s im
mer
sed
in
SB
F f
or
0,
1,5
an
d 1
5 d
ays.
A:
untr
eate
d s
ample
, B
: N
aOH
tre
ated
sam
ple
, C
: N
aOH
-hea
t tr
eate
d s
amp
le
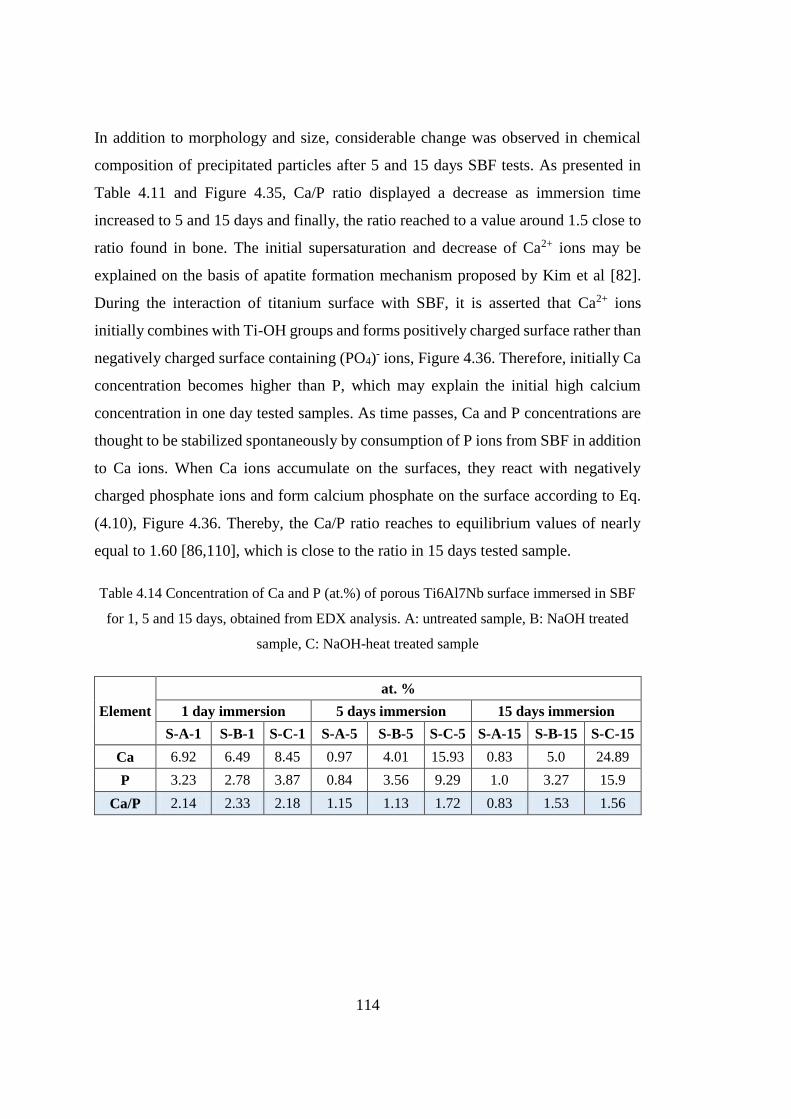
114
In addition to morphology and size, considerable change was observed in chemical
composition of precipitated particles after 5 and 15 days SBF tests. As presented in
Table 4.11 and Figure 4.35, Ca/P ratio displayed a decrease as immersion time
increased to 5 and 15 days and finally, the ratio reached to a value around 1.5 close to
ratio found in bone. The initial supersaturation and decrease of Ca2+ ions may be
explained on the basis of apatite formation mechanism proposed by Kim et al [82].
During the interaction of titanium surface with SBF, it is asserted that Ca2+ ions
initially combines with Ti-OH groups and forms positively charged surface rather than
negatively charged surface containing (PO4)- ions, Figure 4.36. Therefore, initially Ca
concentration becomes higher than P, which may explain the initial high calcium
concentration in one day tested samples. As time passes, Ca and P concentrations are
thought to be stabilized spontaneously by consumption of P ions from SBF in addition
to Ca ions. When Ca ions accumulate on the surfaces, they react with negatively
charged phosphate ions and form calcium phosphate on the surface according to Eq.
(4.10), Figure 4.36. Thereby, the Ca/P ratio reaches to equilibrium values of nearly
equal to 1.60 [86,110], which is close to the ratio in 15 days tested sample.
Table 4.14 Concentration of Ca and P (at.%) of porous Ti6Al7Nb surface immersed in SBF
for 1, 5 and 15 days, obtained from EDX analysis. A: untreated sample, B: NaOH treated
sample, C: NaOH-heat treated sample
Element
at. %
1 day immersion 5 days immersion 15 days immersion
S-A-1 S-B-1 S-C-1 S-A-5 S-B-5 S-C-5 S-A-15 S-B-15 S-C-15
Ca 6.92 6.49 8.45 0.97 4.01 15.93 0.83 5.0 24.89
P 3.23 2.78 3.87 0.84 3.56 9.29 1.0 3.27 15.9
Ca/P 2.14 2.33 2.18 1.15 1.13 1.72 0.83 1.53 1.56
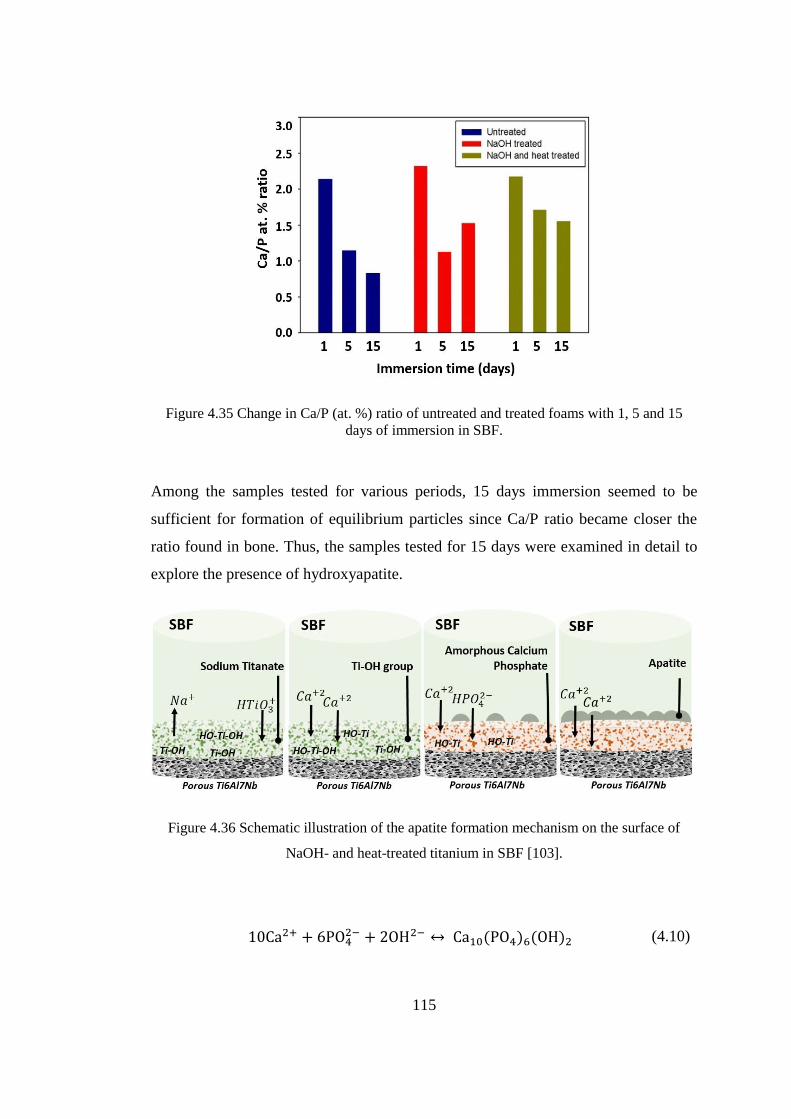
115
Figure 4.35 Change in Ca/P (at. %) ratio of untreated and treated foams with 1, 5 and 15
days of immersion in SBF.
Among the samples tested for various periods, 15 days immersion seemed to be
sufficient for formation of equilibrium particles since Ca/P ratio became closer the
ratio found in bone. Thus, the samples tested for 15 days were examined in detail to
explore the presence of hydroxyapatite.
Figure 4.36 Schematic illustration of the apatite formation mechanism on the surface of
NaOH- and heat-treated titanium in SBF [103].
10Ca2+ + 6PO42− + 2OH2− ↔ Ca10(PO4)6(OH)2 (4.10)
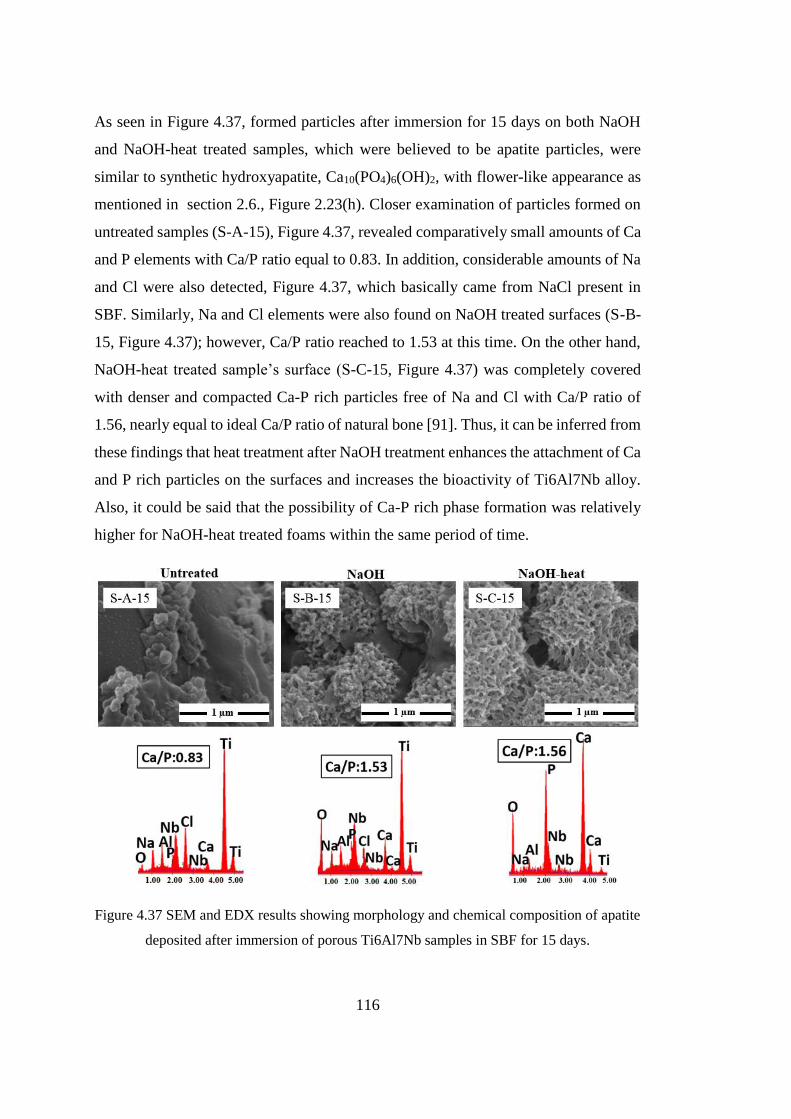
116
As seen in Figure 4.37, formed particles after immersion for 15 days on both NaOH
and NaOH-heat treated samples, which were believed to be apatite particles, were
similar to synthetic hydroxyapatite, Ca10(PO4)6(OH)2, with flower-like appearance as
mentioned in section 2.6., Figure 2.23(h). Closer examination of particles formed on
untreated samples (S-A-15), Figure 4.37, revealed comparatively small amounts of Ca
and P elements with Ca/P ratio equal to 0.83. In addition, considerable amounts of Na
and Cl were also detected, Figure 4.37, which basically came from NaCl present in
SBF. Similarly, Na and Cl elements were also found on NaOH treated surfaces (S-B-
15, Figure 4.37); however, Ca/P ratio reached to 1.53 at this time. On the other hand,
NaOH-heat treated sample’s surface (S-C-15, Figure 4.37) was completely covered
with denser and compacted Ca-P rich particles free of Na and Cl with Ca/P ratio of
1.56, nearly equal to ideal Ca/P ratio of natural bone [91]. Thus, it can be inferred from
these findings that heat treatment after NaOH treatment enhances the attachment of Ca
and P rich particles on the surfaces and increases the bioactivity of Ti6Al7Nb alloy.
Also, it could be said that the possibility of Ca-P rich phase formation was relatively
higher for NaOH-heat treated foams within the same period of time.
Figure 4.37 SEM and EDX results showing morphology and chemical composition of apatite
deposited after immersion of porous Ti6Al7Nb samples in SBF for 15 days.

117
Figure 4.38 shows the XRD patterns of untreated and treated porous surfaces after
interaction with SBF solution for 15 days. Formation of hydroxyapatite phase on
untreated sample’s surface could not be recognized, Figure 4.38(A). Although apatite
peaks were hardly resolved for NaOH treated surfaces, subsequent heat treatment
induced the crystalline hydroxyapatite phase, Figure 4.38(C). Since XRD
characterized surfaces contained macropores and had high roughness, detected signals
which came from outermost layers were relatively weak. Thus, XRD results did not
give sufficient information about the formation of hydroxyapatite phase. Because of
that XPS analysis was also conducted so as to ensure the presence of hydroxyapatite
on activated surfaces.
Figure 4.38 XRD patterns of porous samples after immersion in SBF for 15 days; (A)
untreated, (B) NaOH treated, and (C) NaOH and subsequent heat treated at 600 °C.

118
Figure 4.39 shows the XPS analysis results of SBF tested samples for 15 days and
Table 4.15 summarizes the calculated binding energies of Ca2p, P2p and O1s
elements. Although Ca2p spectra of untreated sample was quite weak, both treated
surfaces contained main Ca2p peaks at 347.0 and 348.0 eV and shoulders at around
~350.0 eV, respectively. These bonding energies were observed to match with the
bonding energies between Ca-P in hydroxyapatite, Ca10(PO4)6(OH)2 [111]. Presence
of the hydroxyapatite phase was also confirmed by P2p peaks detected at 132.8 and
133.6 eV (Table 4.15) for NaOH and NaOH-heat samples, respectively, which also
belongs to Ca-P bonds in hydroxyapatite phase [111].
Figure 4.39 XPS spectra of (a) Ca2p, (b) P2p, and (c) O1s for untreated and treated porous
surface after immersion in SBF for 15 days
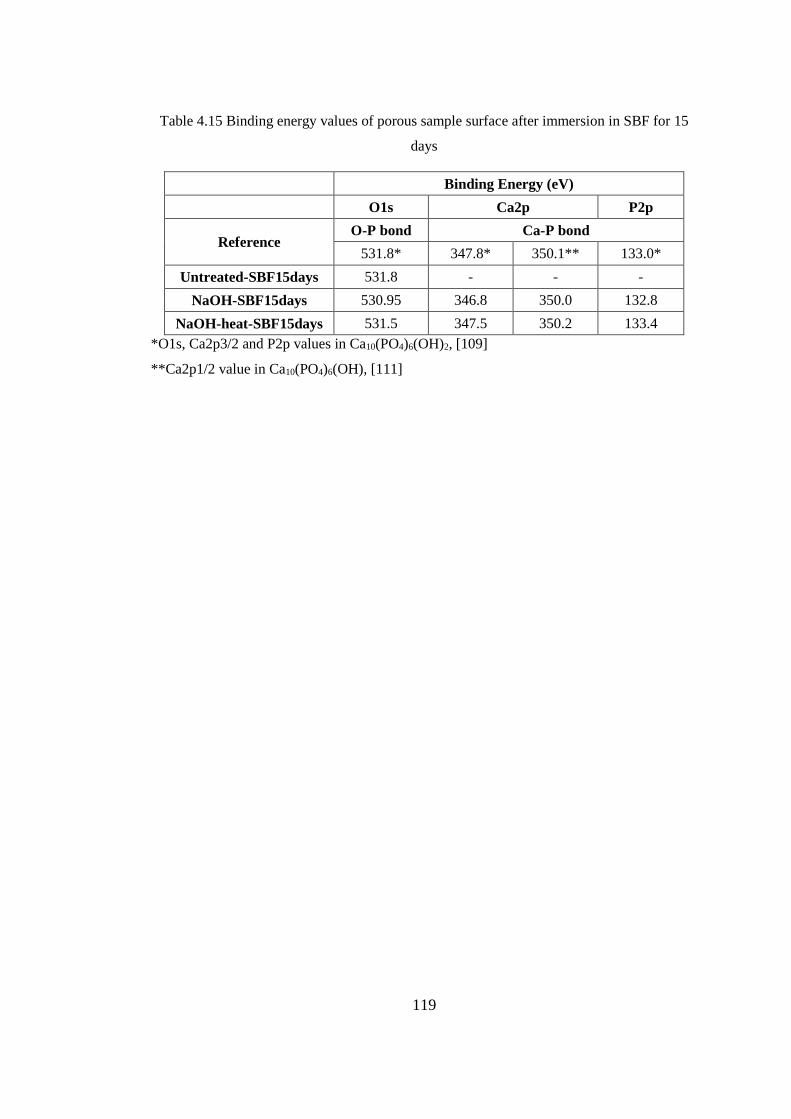
119
Table 4.15 Binding energy values of porous sample surface after immersion in SBF for 15
days
*O1s, Ca2p3/2 and P2p values in Ca10(PO4)6(OH)2, [109]
**Ca2p1/2 value in Ca10(PO4)6(OH), [111]
Binding Energy (eV)
O1s Ca2p P2p
Reference O-P bond Ca-P bond
531.8* 347.8* 350.1** 133.0*
Untreated-SBF15days 531.8 - - -
NaOH-SBF15days 530.95 346.8 350.0 132.8
NaOH-heat-SBF15days 531.5 347.5 350.2 133.4

120
121
CHAPTER 5
CONCLUSION
5. CONCLUSION
The most obvious findings and conclusions of the current study are listed as follows;
1. The manufactured Ti6Al7Nb alloy foams with varying porosities between 53.0
and 73.0% were observed to contain two types of pores, namely, macropores
formed by evaporation of magnesium and micropores left in the cell walls due
to insufficient sintering. The interconnectivity of pores was observed to be
achieved mainly by both macro and micropores in high porosity samples, while
in low porosity foams only micropores provided the interconnectivity.
2. Although no additional compounds like titanium oxides or nitrides were
detected in foams due to the high oxidation affinity of magnesium which
prevented excessive oxidation of titanium, XPS revealed around 4.2 at. %
dissolved elemental magnesium. However, almost all the magnesium was
removed from the samples except the dissolved quantity.
3. The structure and chemical composition of the sodium rich coating was largely
affected from solution temperature, solution concentration and post heat
treatment temperature during alkali treatment. Although high solution
temperature, i.e. 100 °C, increased the precipitation tendency and the
crystallinity of sodium rich phase, nonhomogeneous and coarse coating layers
were obtained. On the other hand, increasing the solution concentration from 5
M to 10 M, caused the formation of deep cracks on Na-rich coating layer
probably due to increased mismatch between thermal expansion coefficients of
122
coating layer and the substrate. Moreover, a significant change in the structure
of Na-rich phase was only observed by post heat treatment at 600 °C, while no
remarkable changes were detected at lower or higher temperatures.
4. Alkali treatment with 5 M NaOH solution at 60 °C for 24 h and subsequent
heat treatment at 600 °C for 1 h was selected as optimum processing parameters
since they provided fine, uniform and homogenous sodium titanate coating
layer.
5. Heat treatment at 600 °C applied subsequent to NaOH alkali treatment induced
transformation of sodium titanate hydrogel, NaxH2-xTiyO2y+1.nH2O, into a more
uniform, dense and mechanically stable sodium titanate, Na2TiyO2y+1, layer co-
existing with TiO2.
6. As-manufactured foams, especially with 63.0% and 73.0% porosities matched
the mechanical needs of implant material due to their elastic moduli (5-18 GPa)
closer to that of bone (1-40 GPa), which may lessen the stress shielding
problem. Although the surface processing did not affect the elastic moduli of
the samples significantly, compressive yield strength of NaOH-heat treated
foams decreased remarkably due to oxidation of thin cell walls after heat
treatment in air at 600 °C.
7. Mechanical properties of foams were observed to be dependent on macro
porosity fraction, pmacro, and micro porous cell wall properties, A, and the
relation was found to obey a power law in the form of M*=A(1-pmacro)n, where
M* and the exponent ‘’n’’ were assumed to display foam mechanical property,
and cell wall and porosity character, respectively.
8. It was observed that compressive yield strength change of the foams matched
well with the empirical power law relation; however, elastic modulus change
calculated by MSA model deviated from the experimentally measured elastic
modulus values probably due to foams having different pore morphologies, i.e.
open and closed porosity, within the tested porosity range.
123
9. Surface processing enhanced the bioactivities of foam samples such that apatite
formation on surfaces having sodium titanate, Na2TiyO2y+1, phase was better
compared to untreated surfaces and the surfaces with sodium titanate hydrogel,
NaxH2-xTiyO2y+1.nH2O phase. Although, the surfaces of NaOH and NaOH-heat
treated foams were covered with flower like hydroxyapatite phase,
Ca10(PO4)6.(OH)2, with Ca/P ratio of 1.53 and 1.56, respectively, close to ratio
found in natural bone, untreated surfaces allowed only precipitation of Ca-P
rich particles other than hydroxyapatite within 15 days.
10. After immersion the foam samples in SBF for one day, the surfaces were
observed to be supersaturated with Ca elements with high Ca/P ratio; however
as time passes, the ratio was decreased and finally reached to an equilibrium
value of around 1.5 close to the ratio seen in bone. The relative change of Ca/P
ratio was attributed to spontaneous attachment of (PO4)- ions from SBF to the
surfaces as previous studies suggested.
In order to enhance the performance of NaOH alkali and heat treatment method, and
to characterize the structure of Na-rich coating and apatite layer more efficiently, the
followings future studies are recommended;
It would be interesting to investigate the effect of protective heat treatment
environment, i.e. argon, on sodium titanate formation. By doing this, excessive
oxidation of thin cell wall may be eliminated and also it would be possible to
change the structure of sodium titanate, thereby in vitro responses of surfaces
possibly change.
It was though that hydroxyapatite formation could be affected by the structure
of the sodium titanate phase since there is an ion exchange between surface and
SBF. Therefore, detailed study about the effect of sodium titanate phase
crystallinity may be conducted.
Although XPS analysis gives valuable information about chemical
composition and binding energies of elements, detailed research should be

124
done to understand the chemical state of elements. For this purpose, practical
curve fitting software may be used to clarify the backgrounds and shoulders of
XPS curves more precisely.
Although sodium titanate coating layer formed after NaOH-treatment was
defined as mechanically stable layer, crush test did not give sufficient
information about how well the coating layer was attached to Ti6Al7Nb
substrate. Because of that, scratch test should be performed to determine the
adhesive strength of the coating layer.
Sodium titanate phase forms on the substrate’s surface with a gradual change
in composition through its thickness. Thus, there is neither a sharp change in
coating structure nor a clear interface between substrate and the coating.
Accordingly, it is hard to detect the coating thickness by examining the fracture
surfaces. In this regard, auger electron spectroscopy (AES) analysis should be
carried out to determine the depth profile of sodium titanate coating.
In addition to in vitro studies, apatite formation mechanisms on Ti6Al7Nb
foams should be further investigated by measuring the pH changes of the
solution and ion concentration change in SBF in different time intervals. By
this way, it would be possible to understand the ion exchange mechanisms
between SBF solution and foams more clearly.
.
125
REFERENCES
[1] K. H. Kim, R. Narayanan, T.R. Rautray, Surface Modification of Titanium for
Biomaterial Applications, New York, 2010.
[2] B. D. Ratner, A Perspective on Titanium Biocompatibility, in: Titan. Med.,
Springer Berlin Heidelberg, 2001: pp. 2–51.
[3] I. Breme, E. Eisenbarth, V. Biehi, Titanium and its Alloys for medical
applications, in: C. Leyens, P. Manfred (Eds.), Titan. Titan. Alloy., Weinheim:
Wiley-VCH Verlag, 2003: pp. 423–451.
[4] M. Peters, J. Hemptenmacher, J. Kumpfert, C. Leyens, Structure and Properties
of Titanium and Titanium Alloys, in: C. Leyens, M. Peters (Eds.), Titan. Titan.
Alloy., Weinheim: Wiley-VCH Verlag, 2003.
[5] G. Lütjering, J.. Williams, Titanium, 2nd ed., Weinheim: Wiley-VCH Verlag,
2007.
[6] M. Long, H.J. Rack, Titanium alloys in total joint replacement--a materials
science perspective., Biomaterials. 19 (1998) 1621–39.
[7] X. Liu, P. Chu, C. Ding, Surface modification of titanium, titanium alloys, and
related materials for biomedical applications, Mater. Sci. Eng. R Reports. 47
(2004) 49–121. doi:10.1016/j.mser.2004.11.001.
[8] A. Nouri, P.D. Hodgson, C. Wen, Biomimetic Porous Titanium Scaffolds for
Orthopedic and Dental Applications, in: A. Mukherjee (Ed.), Biomimetics
Learn. From Nat., InTech, Australia, 2010: pp. 415–451.
[9] M. Geetha, a. K. Singh, R. Asokamani, a. K. Gogia, Ti based biomaterials, the
ultimate choice for orthopaedic implants – A review, Prog. Mater. Sci. 54
(2009) 397–425. doi:10.1016/j.pmatsci.2008.06.004.
[10] S. Izman, M.R. Abdul-kadir, M. Anwar, E.M. Nazim, R. Rosliza, A. Shah, et
al., Surface Modification Techniques for Biomedical Grade of Titanium
Alloys : Oxidation , Carburization and Ion Implantation Processes, (2006).
126
[11] totaljoints.info, http://www.bananarepublican.info/Stress_shielding.htm, last
visited on December 2014.
[12] K. Alvarez, H. Nakajima, Metallic Scaffolds for Bone Regeneration, Materials
(Basel). 2 (2009) 790–832. doi:10.3390/ma2030790.
[13] A. Nouri, P.D. Hodgson, C. Wen, Biomimetic Porous Titanium Scaffolds for
Orthopedic and Dental Applications, in: A. Mukherjee (Ed.), Biomimetics
Learn. From Nat. From Nat., 2010: pp. 415–451.
[14] J.W. Schultze, M.M. Lohrengel, Stability, reactivity and breakdown of passive
films. Problems of recent and future research, Electrochim Acta. 45 (2005)
2499–2513.
[15] P. Schmuki, Bacon to barriers: a review on the passivity of metals and alloys, J
Solid State Electrochem. 6 (2002) 145–164.
[16] I. Milošev, H.-H. Metikoš-Huković, M. Strehblow, Passive film on orthopaedic
TiAlV alloy formed in physiological solution investi- gated by X-ray
photoelectron spectroscopy, Biomaterials. 21 (2000) 2103–213.
[17] I. Milošev, H.-H. Strehblow, The behavior of stainless steels in physiological
solution containing complexing agent studied by X- ray photoelectron
spectroscopy, J Biomed Mater Res. 52 (2000) 404–412.
[18] I. Milošev, H.-H. Strehblow, The composition of the surface passive film
formed on CoCrMo alloy in simulated physiological solution, Electrochim
Acta. 48 (2003) 2767–2774.
[19] A.C. Fraker, Corrosion of metallic implants and prosthesis devices, in: ASTM
Met. Handb., Corrosion. Metals Park, OH: ASM International, 1987: pp. 1324–
1335.
[20] M.F. Leclerc, Surgical implants, in: ASTM Met. Handb., 9th ed., Metals Park,
OH: ASM International, 1987: pp. 164–180.
[21] J.J. Jacobs, J.L. Gilbert, R.M. Urban, Corrosion of metal orthopaedic implants,
J Bone Jt. Surg. 80-A (1990) 268–282.
[22] S.G. Steinemann, Metal implants and surface reactions, Injury. 27 (1996) 16–
22.
[23] B. Kasemo, Biological Surface Science, Surf. Sci. 500 (2002) 656–677.
[24] D. Scharnweber, Metals as biomaterials, John Wiley and Sons Ltd, 1998.
127
[25] J.E. Ellingsen, A study on the mechanism of protein adsorption to TiO2,
Biomaterials. 12 (1991) 593–596.
[26] T. Hanawa, K. Asami, K. Asaoka, Repassivation of titanium and surface oxide
film regeneration in simulated bioliquid, J Biomed Mater Res1. 40 (1998) 530–
538.
[27] R. Thull, Implantatwerkstoffe für die Endoprothetik, Berlin: Fachverlag Schiele
and Schön GmbH, 1978.
[28] K. Schenk-Meuser, H. Duschner, V. Biehl, E. Eisenbarth, B. J.J., nfluence of
titanium-vanadium alloys on cell morphology: electron microscopy and ESCA
studies, Surf Interface Anal. 30 (2000) 29–31.
[29] P.A. Mäusli, P.R. Bloch, V. Geret, S.G. Steinemann, Biological and
biomechanical performance of biomaterials, Elsevier Science Publishers B.V,
1986.
[30] P.A. Mäusli, J.P. Simpson, G. Burri, S.G. Steinemann, Implant materials in
biofunction advances in biomaterials, Elsevier Science Publishers B.V, 1988.
[31] J. Lausmaa, M. Ask, U. Rolander, B. Kasemo, Preparation and Analysis of Ti
and Alloyed Ti Surfaces, Mater Res Soc Symp Proc. 110 (1989) 647–653.
[32] B.F. Miller, C.B. Keane, Miller-Keane Encyclopedia & Dictionary of Medicine,
Nursing, and Allied Health, Philadelphia: Saunders, 1992.
[33] J. Banhart, Manufacture, characterisation and application of cellular metals and
metal foams, Prog. Mater. Sci. 46 (2001) 559–632. doi:10.1016/S0079-
6425(00)00002-5.
[34] L.J. Gibson, M.F. Ashby, Cellular Solids: structures and properties, second edi,
Cambridge University Press, 1997.
[35] A. Kennedy, Porous Metals and Metal Foams Made from Powders, in: K.
Kondoh (Ed.), Powder Metall., InTech, 2012.
[36] G. Ryan, A. Pandit, D.P. Apatsidis, Fabrication methods of porous metals for
use in orthopaedic applications., Biomaterials. 27 (2006) 2651–70.
doi:10.1016/j.biomaterials.2005.12.002.
[37] Zimmer Dental, http://www.zimmerdental.com/Home/zimmerDental.aspx,
December 2014, (n.d.).
[38] D.C. Dunand, Processing of Titanium Foams, Adv. Eng. Mater. 6 (2004) 369–
376. doi:10.1002/adem.200405576.
128
[39] Z. Esen, E.T. Bor, Characterization of loose powder sintered porous titanium
and Ti6Al4V alloy, 33 (2009) 207–219. doi:10.3906/muh-0906-41.
[40] J. Li, L. SH, K. de Groot, P. Layrolle, Preparation and characterization of porous
titanium, Key Eng. Mater. 218 (2002) 51–54.
[41] G. Rausch, J. Banhart, Making cellular metals from metals other than
aluminum, in: B. Kriszt, H.-P. Degischer (Eds.), Handb. Cell. Met., Weinheim:
Wiley-VCH Verlag, 2002.
[42] I. Oh, N. Nomura, N. Masahashi, S. Hanada, Mechanical properties of porous
titanium compacts prepared by powder sintering, Scr. Mater. 49 (2003) 1197–
1202.
[43] Z. Esen, Ş. Bor, Processing of titanium foams using magnesium spacer particles,
Scr. Mater. 56 (2007) 341–344. doi:10.1016/j.scriptamat.2006.11.010.
[44] K.R. Wheeler, M.T. Karagianes, K.R. Sump, Porous titanium alloy for
prosthesis attachment, in: H.A. Luckey, F. Kubli (Eds.), Titan. Alloy. Surg.
Implant., ASTM, Philadelphia, 1983: pp. 241–254.
[45] C.. Wen, M. Mabuchi, Y. Yamada, K. Shimojima, Y. Chino, T. Asahina,
Processing of biocompatible porous Ti and Mg, Scr. Mater. 45 (2001) 1147–
1153. doi:10.1016/S1359-6462(01)01132-0.
[46] J.L. Murray, The Mg-Ti (Magnesium-Titanium) System 24.305 47.88, Natl.
Bur. Stand. 7 (1986) 245–248.
[47] M.F. Ashby, A. Evans, N.A. Fleck, L.J. Gibson, J.W. Hutchinson, H.N.G.
Wadley, Metal Foams, Oxford Stress Cambridge, 2000.
[48] Z. Esen, Ş. Bor, Characterization of Ti–6Al–4V alloy foams synthesized by
space holder technique, Mater. Sci. Eng. A. 528 (2011) 3200–3209.
doi:10.1016/j.msea.2011.01.008.
[49] X. Wang, J. Li, R. Hu, H. Kou, L. Zhou, Mechanical properties of porous
titanium with different distributions of pore size, Trans. Nonferrous Met. Soc.
China. 23 (2013) 2317–2322. doi:10.1016/S1003-6326(13)62735-1.
[50] Z. Esen, Production and characterization of porous titanium alloys, Middle East
Technical university, 2007.
[51] X. Cui, H.M. Kim, M. Kawashita, L. Wang, T. Xiong, T. Kokubo, et al.,
Preparation of bioactive titania films on titanium metal via anodic oxidation.,
Dent. Mater. 25 (2009) 80–6. doi:10.1016/j.dental.2008.04.012.
129
[52] J. Xiong, Y. Li, X. Wang, P. Hodgson, C. Wen, Mechanical properties and
bioactive surface modification via alkali-heat treatment of a porous Ti-18Nb-
4Sn alloy for biomedical applications., Acta Biomater. 4 (2008) 1963–8.
doi:10.1016/j.actbio.2008.04.022.
[53] J. Lausmaa, Mechanical, Thermal, Chemical and Electrochemical Surface
Treatment of Titanium, in: Titan. Med., Springer Berlin Heidelberg, 2001: pp.
231–266.
[54] X. Liu, P.K. Chu, C. Ding, Surface nano-functionalization of biomaterials,
Mater. Sci. Eng. R Reports. 70 (2010) 275–302.
doi:10.1016/j.mser.2010.06.013.
[55] L. Le Guéhennec, a Soueidan, P. Layrolle, Y. Amouriq, Surface treatments of
titanium dental implants for rapid osseointegration., Dent. Mater. 23 (2007)
844–54. doi:10.1016/j.dental.2006.06.025.
[56] L.-D. Piveteau, Sol-Gel Coating on Titanium, in: Titan. Med., Springer Berlin
Heidelberg, 2001: pp. 268–281.
[57] R. Thull, D. Grant, Pysical and Chemical Vapor Deposition and Plasma-assisted
Techniques for Coating Titanium, in: Titan. Med., Springer Berlin Heidelberg,
2001: pp. 283–341. doi:10.1007/978-3-642-56486-4_10.
[58] S.-J. Xiao, G. Kenausis, M. Textor, Biochemical Modification of Titanium
Surfaces, in: Titan. Med., Springer Berlin Heidelberg, 2001: pp. 418–449.
[59] H. Garg, G. Bedi, A. Garg, Implant Surface Modifications : A Review, (2012)
319–324.
[60] H. Gruner, Thermal Spray Coating on Titanium, in: Titan. Med., Springer
Berlin Heidelberg, 2001: pp. 375–416. doi:10.1007/978-3-642-56486-4.
[61] H.B. Wen, Q. Liu, J.R. de Wijn, K. de Groot, F.Z. Cui, Preparation of bioactive
microporous titanium surface by a new two-step chemical treatment, 9 (1998)
121–128.
[62] H.-E. Cheng, M.-H. Hon, Texture formation in titanium nitride films prepared
by chemical vapor deposition, J. Appl. Phys. 79 (1996) 8047–8053.
[63] H.-W. Kim, Y.-H. Koh, L.-H. Li, S. Lee, H.-E. Kim, Hydroxyapatite coating on
titanium substrate with titania buffer layer processed by sol–gel method,
Biomaterials. 25 (2004) 2533–2538. doi:10.1016/j.biomaterials.2003.09.041.
130
[64] J.-X. Liu, D.-Z. Yang, F. Shi, Y.-J. Cai, Sol–gel deposited TiO2 film on NiTi
surgical alloy for biocompatibility improvement, Thin Solid Films. 429 (2003)
225–230. doi:10.1016/S0040-6090(03)00146-9.
[65] C. Trapalis, V. Kozhukharov, B. Samuneva, P. Stefanov, Sol-gel processing of
titanium-containing thin coatings, J. Mater. Sci. 28 (1993) 1276–1282.
[66] L. Panjian, I. Kangasniemi, K. de Groot, Bonelike Hydroxyapatite Induction by
a Gel-Derived Titania on a Titanium Substrate, J. Am. Ceram. Soc. 7 (1994)
255–260.
[67] P. Li, K. de Groot, Calcium phosphate formation within sol-gel prepared titania
in vitro and in vivo, J. Biomed. Mater. Res. 27 (1993) 1495–1500.
[68] K. Cheng, G. Shen, W. Weng, G. Han, Synthesis of
hydroxyapatite/fluoroapatite solid solution by a sol–gel method, Mater. Lett.
(2001) 0–4.
[69] E. Milella, F. Cosentino, A. Licciulli, C. Massaro, Preparation and
characterisation of titania / hydroxyapatite composite coatings obtained by sol
} gel process, 22 (2001) 1425–1431.
[70] P.A. Ramires, A. Romito, F. Cosentino, E. Milella, The influence of titania /
hydroxyapatite composite coatings on in vitro osteoblasts behaviour,
Biomaterials. 22 (2001) 1467–1474.
[71] W. Zhang, W. Liu, C. Wang, Characterization and tribological investigation of
sol-gel Al 2 O 3 and doped Al 2 O 3 films, 22 (2002) 2869–2876.
[72] F. Liu, Y. Song, F. Wang, T. Shimizu, K. Igarashi, L. Zhao, Formation
characterization of hydroxyapatite on titanium by microarc oxidation and
hydrothermal treatment., J. Biosci. Bioeng. 100 (2005) 100–4.
doi:10.1263/jbb.100.100.
[73] R.K. Alla, K. Ginjupalli, N. Upadhya, M. Shammas, R. Krishna, R. Sekhar,
Surface Roughness of Implants : A Review, 25 (2011) 112–118.
[74] D. Quintero, O. Galvis, J. a. Calderón, J.G. Castaño, F. Echeverría, Effect of
electrochemical parameters on the formation of anodic films on commercially
pure titanium by plasma electrolytic oxidation, Surf. Coatings Technol. (2014).
doi:10.1016/j.surfcoat.2014.06.058.
[75] R. Metals, Standard Guide for Descaling and Cleaning Titanium and Titanium
Alloy, (n.d.) 3–5. doi:10.1520/B0600-11.anodic.
131
[76] C. Sittig, M. Textor, N.D. Spencer, M. Wieland, P.H. Vallotton, Surface
characterization of implant materials c.p. Ti, Ti-6Al-7Nb and Ti-6Al-4V with
different pretreatments., J. Mater. Sci. Mater. Med. 10 (1999) 35–46.
[77] S. Cho, K. Park, The removal torque of titanium screw inserted in rabbit tibia
treated by dual acid etching, Biomaterials. 24 (2003) 3611–3617.
[78] K. Yokoyama, T. Ichikawa, H. Murakami, Y. Miyamoto, K. Asaoka, Fracture
mechanisms of retrieved titanium screw thread in dental implants, Biomaterials.
23 (2002) 2459–2465.
[79] S. Hayakawa, Y. Liu, K. Okamoto, K. Tsuru, A. Osaka, Formation of Titania
Submicron-Scale Rod Arrays on Titanium Substrate and In Vitro
Biocompatibility, Mater. Res. Soc. Symp. Proc. 845 (2006).
[80] J. Pan, H. Liao, C. Leygraf, D. Thierry, J. Li, Variation of oxide films on
titanium induced by osteoblast-like cell culture and the influence of an H 2 O 2
pretreatment, Biomed. Mater. Res. 30 (1997).
[81] G. Shi, L. Ren, L. Wang, H. Lin, S. Wang, Y. Tong, H2O2/HCl and heat-treated
Ti-6Al-4V stimulates pre-osteoblast proliferation and differentiation, Oral
Surgery, Oral Med. Oral Pathol. Oral Radiol. Endodontology. 108 (2009) 368–
375. doi:10.1016/j.tripleo.2009.05.033.
[82] H.M. Kim, M. F., T. Kokubo, N. T., Preparation of bioactive Ti and its alloy
via simple chemical surface treatment, J. Biomed. Mater. Res. 32 (1996) 409–
417.
[83] D. Yang, Z. Zheng, Y. Yuan, H. Liu, Sorption induced structural deformation
of sodium hexa-titanate nanofibers and their ability to selectively trap
radioactive Ra ( II ) ions from water w, (2010) 1271–1277.
doi:10.1039/b911085b.
[84] M. Choi, K. Yong, crystalline brookite TiO 2 nanoarrays and their, (2014)
13900–13909. doi:10.1039/c4nr04735d.
[85] H.M. Kim, F. Miyaji, T. Kokubo, S. Nishiguchi, T. Nakamura, Graded surface
structure of bioactive titanium prepared by chemical treatment., J. Biomed.
Mater. Res. 45 (1999) 100–7.
[86] T. Kokubo, S. Yamaguchi, Novel Bioactive Titanate Layers Formed on Ti
Metal and Its Alloys by Chemical Treatments, Materials (Basel). 3 (2009) 48–
63. doi:10.3390/ma3010048.
132
[87] T. Kizuki, H. Takadama, T. Matsushita, T. Nakamura, T. Kokubo, Preparation
of bioactive Ti metal surface enriched with calcium ions by chemical treatment.,
Acta Biomater. 6 (2010) 2836–42. doi:10.1016/j.actbio.2010.01.007.
[88] F. a. Müller, L. Jonášová, P. Cromme, C. Zollfrank, P. Greil, Biomimetic
Apatite Formation on Chemically Modified Cellulose Templates, Key Eng.
Mater. 254-256 (2004) 1111–1114. doi:10.4028/www.scientific.net/KEM.254-
256.1111.
[89] H. Hsu, S. Wu, Surface modification of commercially pure Ti treated with
aqueous NaOH treatment and ethyl alcohol aging, J. Med. 33 (2013) 331–336.
doi:10.5405/jmbe.1021.
[90] X.J. Wang, Y.C. Li, J.G. Lin, Y. Yamada, P.D. Hodgson, C.E. Wen, In vitro
bioactivity evaluation of titanium and niobium metals with different surface
morphologies., Acta Biomater. 4 (2008) 1530–5.
doi:10.1016/j.actbio.2008.04.005.
[91] A. Rakngarm, Y. Miyashita, Y. Mutoh, Formation of hydroxyapatite layer on
bioactive Ti and Ti-6Al-4V by simple chemical technique., J. Mater. Sci. Mater.
Med. 19 (2008) 1953–61. doi:10.1007/s10856-007-3285-1.
[92] S. Tamilselvi, H.B. Raghavendran, P. Srinivasan, N. Rajendran, In vitro and in
vivo studies of alkali- and heat-treated Ti-6Al-7Nb and Ti-5Al-2Nb-1Ta alloys
for orthopedic implants., J. Biomed. Mater. Res. A. 90 (2009) 380–6.
doi:10.1002/jbm.a.32099.
[93] S. Spriano, M. Bosetti, M. Bronzoni, E. Vernè, G. Maina, V. Bergo, et al.,
Surface properties and cell response of low metal ion release Ti-6Al-7Nb alloy
after multi-step chemical and thermal treatments., Biomaterials. 26 (2005)
1219–29. doi:10.1016/j.biomaterials.2004.04.026.
[94] X. Wang, Y. Li, P.D. Hodgson, C. Wen, Biomimetic modification of porous
TiNbZr alloy scaffold for bone tissue engineering., Tissue Eng. Part A. 16
(2010) 309–16. doi:10.1089/ten.TEA.2009.0074.
[95] Y. Zhou, Y.B. Wang, E.W. Zhang, Y. Cheng, X.L. Xiong, Y.F. Zheng, et al.,
Alkali-heat treatment of a low modulus biomedical Ti-27Nb alloy., Biomed.
Mater. 4 (2009) 044108. doi:10.1088/1748-6041/4/4/044108.
[96] C.E. Wen, Y. Yamada, K. Shimojima, Y. Chino, H. Hosokawa, M. Mabuchi,
Novel titanium foam for bone tissue engineering, (2002) 2633–2639.
[97] S. Spriano, M. Bronzoni, E. Vernè, G. Maina, V. Bergo, M. Windler,
Characterization of surface modified Ti-6Al-7Nb alloy., J. Mater. Sci. Mater.
Med. 16 (2005) 301–12. doi:10.1007/s10856-005-0628-7.
133
[98] X.P. Fan, Preparation of Porous Titanium with High Porous Titanium and
Surface Modification with High Concentration Alkaline Treatment, Adv.
Mater. Res. 834-836 (2013) 211–214.
doi:10.4028/www.scientific.net/AMR.834-836.211.
[99] L. Jonášová, F. a. Müller, A. Helebrant, J. Strnad, P. Greil, Biomimetic apatite
formation on chemically treated titanium, Biomaterials. 25 (2004) 1187–1194.
doi:10.1016/j.biomaterials.2003.08.009.
[100] M. Sadat-Shojai, M.-T. Khorasani, E. Dinpanah-Khoshdargi, A. Jamshidi,
Synthesis methods for nanosized hydroxyapatite with diverse structures., Acta
Biomater. 9 (2013) 7591–621. doi:10.1016/j.actbio.2013.04.012.
[101] H. Pan, X. Zhao, B.W. Darvell, W.W. Lu, Apatite-formation ability--predictor
of “bioactivity”?, Acta Biomater. 6 (2010) 4181–8.
doi:10.1016/j.actbio.2010.05.013.
[102] T. Kokubo, H. Takadama, How useful is SBF in predicting in vivo bone
bioactivity?, Biomaterials. 27 (2006) 2907–15.
doi:10.1016/j.biomaterials.2006.01.017.
[103] T. Kokubo, S. Yamaguchi, Novel Bioactive Titanate Layers Formed on Ti
Metal and Its Alloys by Chemical Treatments, Materials (Basel). 3 (2009) 48–
63. doi:10.3390/ma3010048.
[104] X.J. Wang, Y.C. Li, J.G. Lin, Y. Yamada, P.D. Hodgson, C.E. Wen, In vitro
bioactivity evaluation of titanium and niobium metals with different surface
morphologies., Acta Biomater. 4 (2008) 1530–5.
doi:10.1016/j.actbio.2008.04.005.
[105] T. Alloys, F. Technique, Standard Specification for Wrought Titanium-
6Aluminum-7Niobium Alloy for Surgical Implant Applications (UNS R56700
) 1, (2014) 5–8. doi:10.1520/F1295-05.2.
[106] H. Takadama, H. Kim, T. Kokubo, T. Nakamura, Advanced XPS study of the
process of apatite formation on bioactive Ti-6Al-4V alloy in simulated body
fluid, Sci. Technol. Adv. Mater. 2 (2001) 389–396.
[107] H.H. Bayraktar, E.F. Morgan, G.L. Niebur, G.E. Morris, E.K. Wong, T.M.
Keaveny, Comparison of the elastic and yield properties of human femoral
trabecular and cortical bone tissue, J. Biomech. 37 (2004) 27–35.
doi:10.1016/S0021-9290(03)00257-4.
[108] L. Tretyachenko, Aluminium – Niobium – Titanium, (1990) 334–379.
[109] NIST Standard Reference Database 20, Version 4.1, n.d.

134
[110] H. Takadama, H.M. Kim, T. Kokubo, T. Nakamura, TEM-EDX study of
mechanism of bonelike apatite formation on bioactive titanium metal in
simulated body fluid., J. Biomed. Mater. Res. 57 (2001) 441–8.
[111] B.H. Lee, Y. Do Kim, K.H. Lee, XPS study of bioactive graded layer in Ti–In–
Nb–Ta alloy prepared by alkali and heat treatments, Biomaterials. 24 (2003)
2257–2266. doi:10.1016/S0142-9612(03)00034-6.