production and evaluation of …2015)/p.641-652.pdf · production and evaluation of biodegradable...
TRANSCRIPT

CELLULOSE CHEMISTRY AND TECHNOLOGY
Cellulose Chem. Technol., 49 (7-8), 641-652 (2015)
PRODUCTION AND EVALUATION OF BIODEGRADABLE COMPOSITES
BASED ON POLYHYDROXYBUTYRATE AND POLYLACTIC ACID
REINFORCED WITH SHORT AND LONG PULP FIBERS
HAO REN,* YAN ZHANG,** HUAMIN ZHAI,* and JINXIANG CHEN***
*Jiangsu Provincial Key Lab of Pulp and Paper Science and Technology, Nanjing Forestry University,
Nanjing 210037, China **
UPM-Kymnene (ChangShu) Research & Development Co., Ltd, Changshu, 215536, China ***
International Institute for Urban Systems Engineering & School of Civil Engineering,
Southeast University, Nanjing, 210096, China ✉Corresponding author: Hao Ren, [email protected]
In this study, two biodegradable polymers, polylactic acid (PLA) and polyhydroxybutyrate (PHB), were mixed with
short and long fiber pulps using a torque rheometer. PLA/PHB-fiber composites consisting of up to 40 wt% paper pulp
were produced through a unique procedure and evaluated using various techniques including thermogravimetric
analysis (TGA), scanning electron microscopy (SEM), X-ray diffraction (XRD) and dynamic mechanical analysis
(DMA). Changes in the matrix polymers and pulp fibers were analyzed using gel permeation chromatography (GPC)
and Fiber Lab microscopy. The results showed that the composites reinforced with pulps showed significantly
increased tensile stiffness and impact strength; the addition of a coupling agent did not improve the mechanical
performance of PHB biocomposites. The degradation of PLA and PHB observed during the heating process is thought
to be caused by the release of acidic organic compounds, such as crotonic and lactic acids, which chemically enhance
the existing interface between the pulps and the matrix polymers. The storage modulus and loss modulus of the
composites decreased as the pulp fiber content increased, and the damping capability (increase in dimensional stability)
decreased with increasing pulp fiber content.
Keywords: polyhydroxybutyrate, polylactic acid, fiber pulps, mechanical properties
INTRODUCTION UPM-Kymmene Corporation, one of several
well known multinational corporations that use
forest resources, has significant natural fiber
reserves (e.g., 930,000 hectares of private forests
producing 3.2 million tons of pulp out of an
annual output of 9.7 million tons). As the global
demand for paper decreases, the use of natural
fiber raw materials to develop new products could
serve as an alternative source of revenue for
companies such as UPM.
Bio-based plastics have been available on the
European market for a decade. Initially developed
for medical purposes,1 packing applications (e.g.
biodegradable bags, loose fill and packaging of
ecologically produced food) were later found,2
and today bio-based plastics are commonly used
in structural components. In several common
composite materials, biopolymers can substitute
for crude oil in matrix fabrication; however, such
biogenous matrices must be reinforced in order to
achieve satisfactory mechanical performance. Full
“biocomposites” can be produced using only
natural fibers (NFs), one of their main advantages
being their light weight. NFs (0.3-0.5 g/cm3) have
significantly lower densities than glass fiber (GF)
(2.5-2.7 g/cm3), which allows for the construction
of parts that are comparatively lighter than those
reinforced with GF or filled with minerals.
Polylactic acid (PLA) is a biodegradable and
biocompatible crystalline polymer that can be
produced from renewable resources; due to its
availability and low cost, it is of great interest to
the packaging industry.3-6 The properties of PLA
are dependent on the ratio between the D and L
enantiomers. Another typical biodegradable
thermoplastic polymer is polyhydroxybutyrate
(PHB), a highly crystalline polyester (80%) that is
produced by microorganisms; it has a high
melting point (173-180 ºC) and a glass transition
temperature (Tg) of approximately 1-5 ºC.7-9
HAO REN et al.
642
However, because of their unsatisfying impact
resistance and low heat distortion temperature,
neither PLA nor PHB has found meaningful
market acceptance as an engineering resin,
although there is current interest within the
automotive and electrical industries for the
development of high impact resistance, light-
weight parts based on one or the other of these
substances.
Owing to their low cost and acceptable
mechanical properties, polypropylene (PP)-based
composites continue to constitute the major
engineering resins used in the automotive and
electrical industries. If biocomposites are to
become viable alternatives to existing materials,
they will need to be competitively priced and to
have comparable or improved mechanical
properties.
Natural fiber (including cellulose and
lignocellulosic fibers) has significant potential to
fulfill such requirements. In general, cellulose
fibers consist only of cellulose, whereas
lignocellulosic fibers such as bamboo, abaca, jute,
bagasse are composites of cellulose,
hemicelluloses, and lignin and have fibers that are
long and well-knit. Natural cellulose is a basic
component of plants and is, accordingly, a nearly
inexhaustible source of raw material;
manufactured or “regenerated” cellulose fibers
can be produced in chemical-technical viscose
processes in which raw cellulose is modified into
cellulose fibers and derivatives. The study centers
on the use of natural fibers consisting of bleached
Eucalyptus pulps (short fiber) or bleached Botnia-
90 (long fiber) used by UPM at their Changshu
Mill for paper making.
In recent years, there has been intensive
research on reinforcing common polymers such as
PP, polyvinyl chloride (PVC), or polyethylene
(PE) with natural and cellulose spun fibers.10,11
Some of this research has focused on the idea of
combining two inexpensive commodity materials,
such as polypropylene and natural fibers or
Rayontyre cord,12
into a polymer composite in
order to produce stronger components. The
mechanical properties of PLA and PHB
composites reinforced with natural fibers have
also been investigated by fabricating composites
in single and twin extruder steps.13
In this study, a
mixed type torque rheometer (RJL 200, ShenZhen
NewSans Materials Co. Ltd.) was used to prepare
composites through mixing mill compounding.
PLA/PHB–cellulose fiber composites with 20, 30,
and 40% cellulose content were prepared and
their mechanical properties investigated.
EXPERIMENTAL Materials ■Matrix (PLA): PolyL-lactic acid (PLA), PLA
4042D, from NatureWorks LLC (USA), D-lactid
content 4-8%. The Melting Flow Index (MFI) for PLA
is between 5.7 g/10 min (190 ºC, 2.16 kg).
■Matrix (PHB): Polyhydroxybutyrate (PHB),
Solvay Advanced Polymer. The MFI for PHB is
between 2 and 3 g/10 min (170 ºC, 2.16 kg).
■Additive: KH550 was bought from Sigma-
Aldrich, molecular formula: NH2(CH2)3Si(OC2H5)3;
molecular weight: 221; density: 0.941-0.950; it was
tested for use as plasticizer for PHB.
■Pulp fiber reinforcements: oven dried bleached
Eucalyptus short fiber (SF) pulps and oven dried
bleached Botnia-90 long fiber (LF) pulps from UPM
(Changshu Mill), which are used for papermaking.
Compounding of composite materials
The composite materials were manufactured using
a mixed type torque rheometer (RJL-200, ShenZhen
NewSans Materials Co. Ltd.). The pulp fiber content
was 20, 30, 40 wt%. The fiber and the matrix particles
were fed into the mixing tank together, the fiber
content in the composite was calculated according to
the oven dried weight of the pulp, the moisture content
in the pulps could be evaporated using the high mixing
temperature. The processing parameters are machine
speed 50 rpm, temperature zone 1: 190 ºC, zone 2: 200
ºC, zone 3: 190 ºC, feeding and mixing time was 10
minutes in total.
Compression moulding Test samples for mechanical testing were injection
moulded with a conventional injection moulding press
(Mini Injection Machine SZ-15, WuHan RuiMing
Machinery Manufacturing Co. Ltd.) with a maximum
injection capacity of 15 g. The mould temperature was
190 ºC and the pressure was 0.3 MPa.
Mechanical testing Tensile testing was performed according to ASTM
3039 standard for tensile testing on a WDW-1
Electronic Tensile Testing Machine, ShenZhen
NewSans Materials Co.Ltd. Charpy impact testing was
performed according to ISO 179 unnotched Charpy
standard for fiber reinforced composite materials on a
JB-300 Pendulum Lamented Impact Testing Machine,
ShenZhen NewSans Materials Co. Ltd. At least 5
specimens were tested for every material.
Fiber size distribution The fiber size was determined microscopically on a
Metso FiberLab microscope supported with VHX
analysis software. Approximately 500 measurements
of the fibre length and 100 of the fiber diameter were
taken. The fiber distributions in composites were also

Biodegradable composites
643
measured using the same method after the fibers were
dissolved out from composites using chloroform
stirring for 6 hours.
Electron microscopy Fractured surfaces of the materials were studied
with a JEOL (JSM-6490A) scanning electron
microscope (SEM) with an acceleration voltage of 30
kV. The cut down sample surfaces were sputter coated
with gold to avoid charging.
X-ray diffraction The diffraction patterns were obtained from
radiation generated by the copper target of a Rigaku
Ultima IV (Rigaku Corporation, Japan) set at 40 kV
and 30 mA with the detector placed on a goniometer.
Data was acquired on a 2θ scale from 5º to 70º.
Thermogravimetric analysis (TGA)
Thermogravimetric analysis (TGA) of PLA, PHB
and their composites were conducted on a Mettler-
Toledo TGA/SDTA 851e machine at a heating rate of
10 ºC/min and over a temperature range of 30-600 ºC.
A plot of weight percentage against temperature was
obtained for each specimen.
Dynamic mechanical analysis (DMA) Dynamic mechanical properties of the composites
were evaluated using a Perkin-Elmer DMA Diamond
system. A 15 mm knife-edge, three-point platform with
a 5 mm probe tip was used and DMA tests were
performed in a temperature range from 30 ºC to 130 ºC
with a heating rate of 4 ºC/min. Nitrogen was used as
the purge gas. Assuming the physiological frequency
was 1 Hz, all measurements were conducted at this
frequency. Dimensions of DMA specimens were 22
mm×5 mm×1.5 mm.
GPC Number and weight average molecular weights
before and after the injection moulding of the PHB and
PLA were determined by gel permeation
chromatography on a Waters GPC system with
Styragel columns (HR3THF, HR4THF, HR4ETHF) and
a refractive index detector. Tetrahydrofuran was used
as effluent, and the analysis was done at room
temperature. Universal calibration was used for the
calculation of the molecular weights, using the
polystyrene standard (4.3×10⁴, 1.1×10
5, 1.8×10
5,
4.3×10⁵, 7.8×10⁵).
RESULTS AND DISCUSSION Mechanical testing
Using an electronic tensile testing machine and
a Charpy impact testing machine, statistical
tensile and impact tests were carried out in which
the mechanical properties of PHB/SF, PHB/LF,
PLA/SF, and PLA/LF composites were compared
to those of both pure PHB and PLA.
Fig. 1 shows tensile strength and Charpy
unnotched impact strength results for PHB
reinforced with both short and long fibers. Both
reinforcement types result in an increase in the
tensile strength of PHB as the fiber content is
increased to 40 wt%. The tensile E-modulus and
tensile strength increase to the respective maxima
of 175% and 158% relative to unreinforced PHB
(Table 1). No significant difference in these
properties can be seen between samples
reinforced with long and short fibers. The
increase in E-modulus indicates the transfer of
stress to fibers, which have a much higher
stiffness than the overall matrix. Fig. 1 also
indicates that the impact strength of the
composites with wood fiber content increases to
up to 131% of unreinforced PHB, and the addition
of coupling agent KH550 has no obvious effect
on tensile strength and actually causes a decrease
in the impact strength to only 122% of that of
unreinforced PHB. The lack of a noticeable
improvement from adding coupling agent is most
likely caused by the fact that KH550 is not well-
suited for this kind of composite, and although
fiber smoothness may be improved by using the
coupling agent, it is likely that the impact strength
decreases owing to the reduction in chemical
bonding between the fibers and matrix.
Fig. 2 shows the tensile strength and Charpy
unnotched impact strength of PLA-wood fiber
composites. Both short and long fiber-reinforced
PLA composites show an increase in tensile
strength as the fiber content increases to 40 wt%.
Table 1 shows that the tensile E-modulus and
tensile strength increase to 160 and 154% of the
respective unreinforced PLA characteristics. Once
again, there was no significant difference between
long and short fiber characteristics, and the
increased E-modulus indicates that stress is
transferred to the fibers, which have a much
higher stiffness than the matrix.
By adding 30 wt% of man-made cellulose, an
increase in tensile strength of up to 50% can be
achieved in PLA and PHBV [poly(3-
hydroxybutyrate-co-3-hydroxyvalerate)]
composite.13
For instance, Bax et al.14
achieved an
improvement in tensile strength of approximately
30% in PLA/man-made cellulose fiber.

HAO REN et al.
644
Figure 1: Mechanical properties of PHB composites reinforced with different pulp fiber contents; dark
triangles: long fiber (LF) + 2%KH550; light triangles: LF without coupling agent; dark squares: short fiber
(SF) + 2%KH550; light squares: SF without coupling agent
Figure 2: Mechanical properties of different pulp fiber contents reinforced PLA composites; light diamonds:
short fiber (SF); light squares: long fiber (LF)
Table 1
Mechanical parameters of tested composites
Matrix Fiber content Tensile E-modulus (GPa) Tensile strength (MPa)
PHB
-
SF20%
SF30%
SF40%
LF20%
LF30%
LF40%
1.02±0.08
1.73±0.12
1.76±0.05
1.78±0.09
1.75±0.03
-
-
52.30
70.51
80.25
82.52
69.44
80.10
81.46
PLA
-
SF20%
SF30%
SF40%
LF20%
LF30%
LF40%
1.31±0.17
-
1.99±0.15
2.10±0.12
1.75±0.23
-
2.07±0.15
54.98
72.01
78.52
84.44
70.21
79.75
83.81
In this study, it was shown that adding 40 wt%
of pulp fiber can result in a significantly higher
mechanical strength (Figs. 1 and 2), a finding that
could have implications for industries in which
such composites could be produced with pulp
fibers instead of petroleum polymers on industrial
scale. In addition, this study demonstrated that a
torque rheometer can be much more effective than
an extruder in creating cellulose fiber-plastic
composites.
In the findings above, there was no significant
difference in the tensile strength of long and short
fiber reinforced PHB and PLA. As reported in the
literature,13 most natural fibers are composed of

Biodegradable composites
645
so-called ‘fiber bundles’ whose properties differ
depending on fiber bundle geometry. In this study,
both the long and short fibers used were formed
of pure cellulose fiber used for papermaking and
therefore comprised bundles with relatively
constant aspect ratios (fiber length/fiber width)
(Fig. 3). As such, both types of fiber may have
been dispersed into the matrix in similar patterns,
resulting in similar stress transfer characteristics,
which made it difficult to see significant
differences between long and short fiber-
reinforced composites. Nevertheless, the
measured impact strengths of the long fiber-PHB
composites were noticeably higher than those of
the composites made with short fibers. As has
been previously shown,13
the much lower
diameter (higher aspect ratio) and smoother
surface of pulp fiber determines the performance
characteristics of a composite under impact stress.
The fiber/matrix interaction is affected by fiber
pull out and movement within the matrix. As is
seen in Fig. 4, fiber pull-outs appear in each
composite sample. Fiber movement causes
enlarging in the path length of propagated cracks,
which in turn increases the amount of energy
needed to break a sample.15 The cell wall
thickness (CWT) of long fiber is higher than that
of the short fibers (Table 2); this means that the
aspect ratios of the long fibers are higher and, in
the case of fiber-PHB composites, the long fibers
have higher impact strengths than the short fibers,
although no significant difference is observed in
PLA-fiber composites (this may be the result of
similarities in the distribution patterns of fibers
within the matrix following the mixing process).
From our data, it can be seen that adding pulp
fibers without coupling agent into PHB and PLA
clearly improves the mechanical properties of the
composites. Tensile strength is improved through
the transfer of stress to the added fiber, and
impact strength is improved by fiber pull-out and
movement within the matrix, which propagate
energy and increase ductility and flexibility.
Fibers partially interwoven into the meshes within
the composites can also absorb more impact
energy.
Fiber size distribution An investigation of the long and short fiber
parameters prior to their mixing into the matrix
was performed. Fiber features are shown in Fig. 3
and Tables 2 and 3, from which it is clear that the
length distribution of the long fibers is much
broader than that of the short fibers. Although the
spectrum of long fiber width (Fig. 3) is also much
broader than that of short fiber, there is no large
difference between the two absolute data ranges.
The slightly lower calculated fiber aspect ratio for
short fiber helps explain the slightly lower
mechanical values obtained for PLA/short fiber
composites. Furthermore, because the fiber
bundles have not undergone complete
defibrillation, no significant difference is seen
between the short and long fiber reinforced
composites which indicates that, although single
fibers are different, the sizes and distributions of
the fiber bundles are relatively unvarying.
Table 2
Fiber width and cell wall thickness (CWT) of original and dissolved fibers
SF LF SF30%-PHB LF30%-PHB SF30%-PLA LF30%-PLA
Fiber width (µm) 14.4 23.6 13.8 21.9 15.0 22.5
Fiber CWT (µm) 4.6 8.0 4.4 6.1 5.0 7.9
Table 3
Length weighted fractions of original and dissolved fibers
Fraction percentage (%) Length
(mm) SF LF SF30%-PHB LF30%-PHB SF30%-PLA LF30%-PLA
0.00-0.20 3.50 5.38 11.37 8.51 14.66 19.39
0.20-0.50 38.99 9.39 48.75 34.79 46.37 39.49
0.50-1.20 56.01 19.75 38.04 47.04 36.97 36.79
1.20-2.00 1.31 25.27 1.66 7.59 1.82 4.33
2.00-3.00 0.19 27.54 0.13 2.07 0.18 0.00
3.00-7.60 0.00 12.66 0.06 0.00 0.00 0.00

HAO REN et al.
646
Fiber length-weighted distribution
Width distribution
LF
SF dissolved from SF30%-PHB composites
LF dissolved from LF30%-PHB composites
SF dissolved from SF30%-PLA composites
Biodegradable composites
647
LF dissolved from LF30%-PLA composites
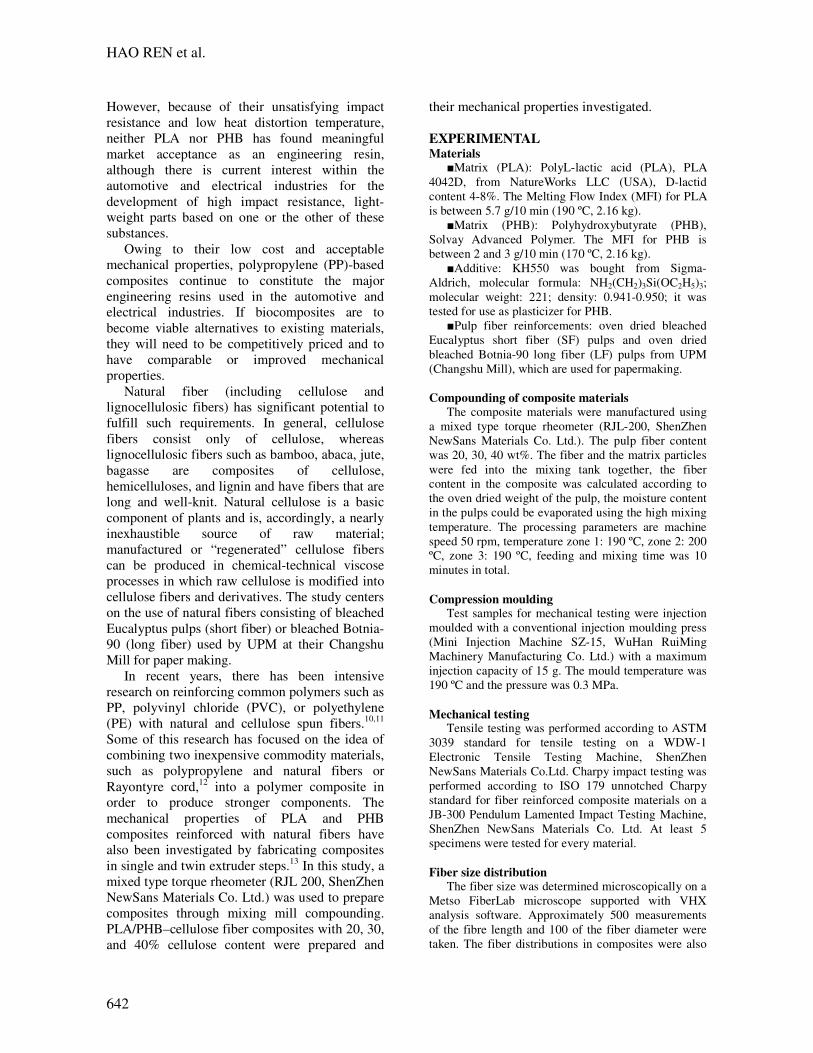
Figure 3: Fiber size distribution of original short fiber (SF), long fiber (LF) and dissolved SF from composites
Along with initial fiber distributions, the
distributions of fibers dissolved from PHB-
30%SF and PHB-30%LF composites are shown
in Fig. 3 and Table 3. In the PHB-30%SF, the
fiber length-weighted distribution L(l) decreases
from 0.56 to 0.48 mm and the fine content
increases from 13.66 to 34.62%. Although fiber
width decreases from 14.4 to 13.8 µm, the cell
wall thickness (CWT) of fiber decreases only
slightly, from 4.6 to 4.4 µm. In the PHB-30%LF,
the fiber length-weighted distribution L(l)
decreases from 1.75 to 0.65 mm and the fine
content decreases from 39.48 to 30.30%. The
fiber width decreases from 23.6 to 21.9 µm, but
the CWT of fiber decreases from 8.0 to 6.1 µm.
The data in Table 3 indicate that the fibers are
slightly degraded by the acid released during the
mixing process, the interphase is likely fortified
by the formation of chemical connections
between fibers and matrix. In both composites,
the LF and SF contribute 0-1 µm to the overall
length, confirming that the fibers are dispersed
uniformly within the matrix in both cases and that
there are no significant differences in mechanical
strength between the LF and SF-reinforced
composites.
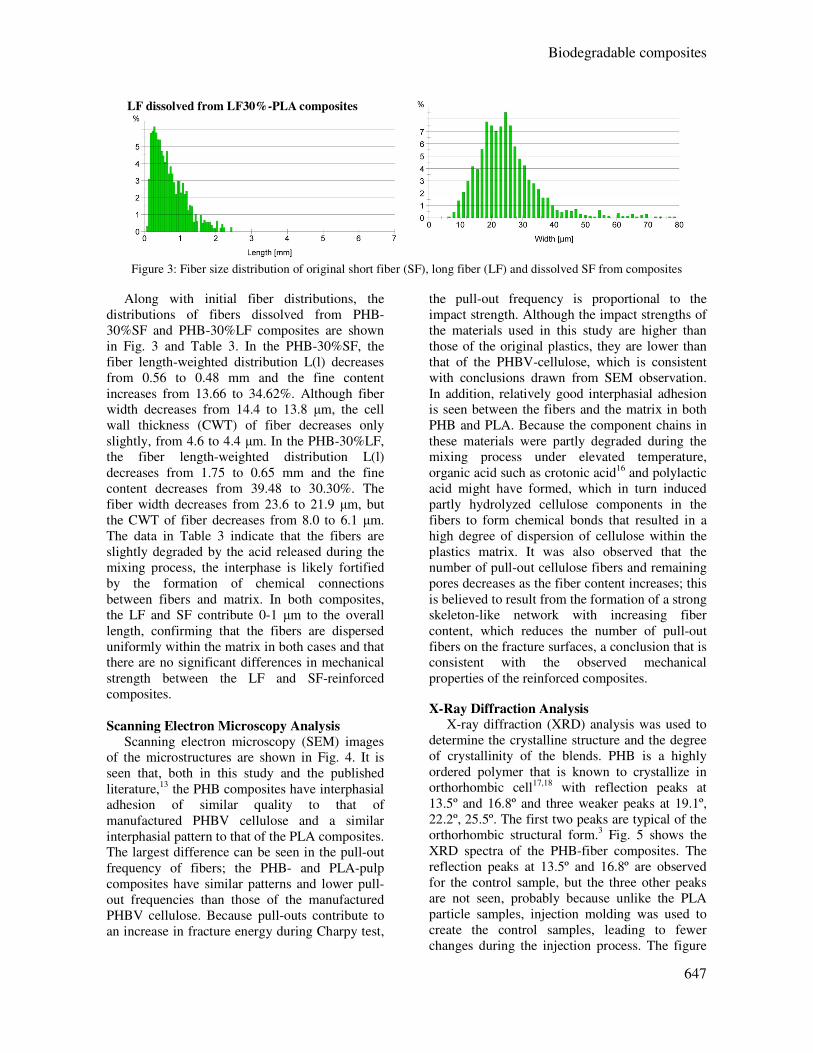
Scanning Electron Microscopy Analysis
Scanning electron microscopy (SEM) images
of the microstructures are shown in Fig. 4. It is
seen that, both in this study and the published
literature,13
the PHB composites have interphasial
adhesion of similar quality to that of
manufactured PHBV cellulose and a similar
interphasial pattern to that of the PLA composites.
The largest difference can be seen in the pull-out
frequency of fibers; the PHB- and PLA-pulp
composites have similar patterns and lower pull-
out frequencies than those of the manufactured
PHBV cellulose. Because pull-outs contribute to
an increase in fracture energy during Charpy test,
the pull-out frequency is proportional to the
impact strength. Although the impact strengths of
the materials used in this study are higher than
those of the original plastics, they are lower than
that of the PHBV-cellulose, which is consistent
with conclusions drawn from SEM observation.
In addition, relatively good interphasial adhesion
is seen between the fibers and the matrix in both
PHB and PLA. Because the component chains in
these materials were partly degraded during the
mixing process under elevated temperature,
organic acid such as crotonic acid16 and polylactic
acid might have formed, which in turn induced
partly hydrolyzed cellulose components in the
fibers to form chemical bonds that resulted in a
high degree of dispersion of cellulose within the
plastics matrix. It was also observed that the
number of pull-out cellulose fibers and remaining
pores decreases as the fiber content increases; this
is believed to result from the formation of a strong
skeleton-like network with increasing fiber
content, which reduces the number of pull-out
fibers on the fracture surfaces, a conclusion that is
consistent with the observed mechanical
properties of the reinforced composites.
X-Ray Diffraction Analysis X-ray diffraction (XRD) analysis was used to
determine the crystalline structure and the degree
of crystallinity of the blends. PHB is a highly
ordered polymer that is known to crystallize in
orthorhombic cell17,18 with reflection peaks at
13.5º and 16.8º and three weaker peaks at 19.1º,
22.2º, 25.5º. The first two peaks are typical of the
orthorhombic structural form.3 Fig. 5 shows the
XRD spectra of the PHB-fiber composites. The
reflection peaks at 13.5º and 16.8º are observed
for the control sample, but the three other peaks
are not seen, probably because unlike the PLA
particle samples, injection molding was used to
create the control samples, leading to fewer
changes during the injection process. The figure
HAO REN et al.
648
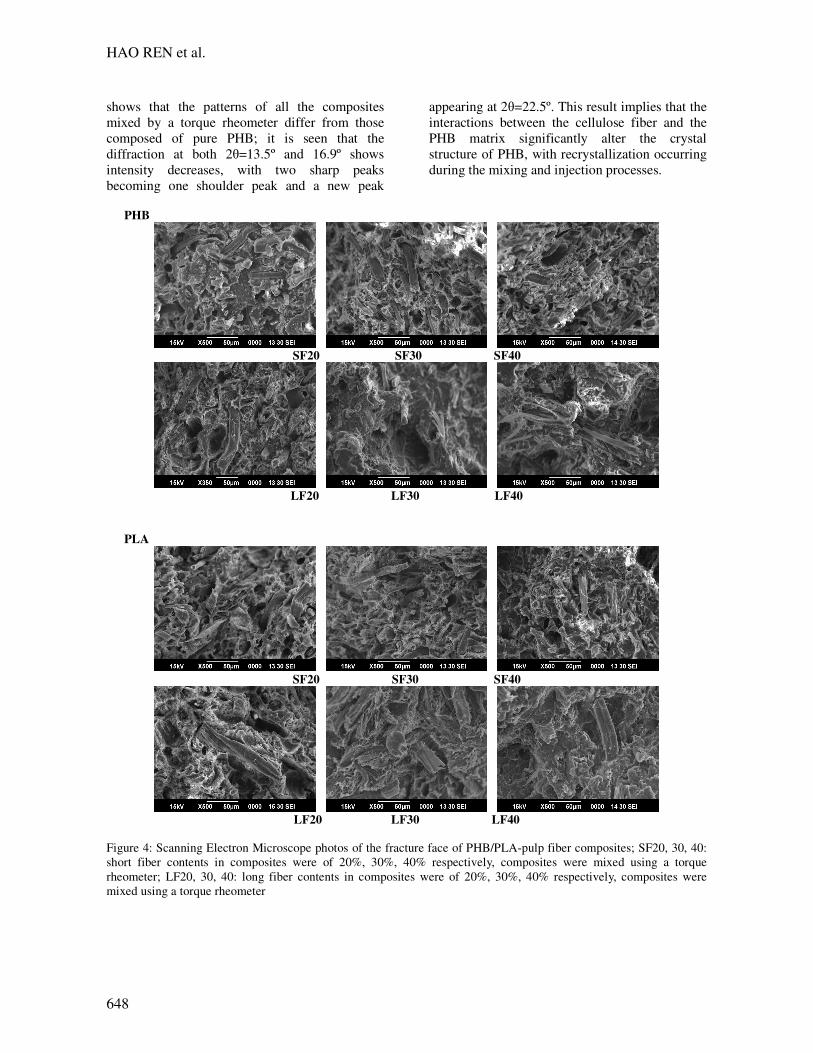
shows that the patterns of all the composites
mixed by a torque rheometer differ from those
composed of pure PHB; it is seen that the
diffraction at both 2θ=13.5º and 16.9º shows
intensity decreases, with two sharp peaks
becoming one shoulder peak and a new peak
appearing at 2θ=22.5º. This result implies that the
interactions between the cellulose fiber and the
PHB matrix significantly alter the crystal
structure of PHB, with recrystallization occurring
during the mixing and injection processes.
PHB
SF20 SF30 SF40
LF20 LF30 LF40
PLA
SF20 SF30 SF40
LF20 LF30 LF40
Figure 4: Scanning Electron Microscope photos of the fracture face of PHB/PLA-pulp fiber composites; SF20, 30, 40:
short fiber contents in composites were of 20%, 30%, 40% respectively, composites were mixed using a torque
rheometer; LF20, 30, 40: long fiber contents in composites were of 20%, 30%, 40% respectively, composites were
mixed using a torque rheometer

Biodegradable composites
649
PHB
0 5 10 15 20 25 30 35 40 45 50 55 60 65 70 75
Inte
nsit
y
2θθθθ (°)
PLA
0 5 10 15 20 25 30 35 40 45 50 55 60 65 70 75
Inte
nsit
y
2θ θ θ θ (°)
Figure 5: X-ray diffraction patterns of PHB and PLA composites; SF30-K: short fiber 30% and PHB were mixed using
a kneader; SF20, 30, 40: short fiber contents in composites were of 20%, 30%, 40% respectively, composites were
mixed using a torque rheometer; LF20, 30, 40: long fiber contents in composites were of 20%, 30%, 40% respectively,
composites were mixed using a torque rheometer
The fourth image from the top in Fig. 5 (1) is
taken of a PHB-30% short fiber sample mixed
with a kneader. It is seen that the crystallinity of
this sample is not as altered as those of the
samples mixed using a torque rheometer, as in the
former case the fibers can only rest on the surface
during mixing rather than becoming fully
immersed in the matrix. As a result of this, the
mechanical strength is not as high as in other
samples.
The XRD spectra of the PLA-composites are
also shown in Fig. 5, from which it is seen that
injected neat PLA has two main peaks at 2θ=14º
and 16º. Again, the XRD patterns of the
composites differ greatly from that of the control
sample, with intensity decreases in the two sharp
peaks and a new peak at 2θ=22.5º, indicating that
interactions between the PLA and the fibers have
changed the crystallinity of PLA, with
recrystallization occurring during the mixing and
injection processes. When the fiber content of
both short and long fibers is increased to 40%, the
crystallinity of the composites changes externally
and the peaks at 2θ=14º and 16º reappear,
although these changes had no negative effect on
the composite strength.
Thermogravimetric analysis
Because the polymerization degree of fibers
and fiber bundles is lower than that of the matrix,
the thermal degradation temperature of PHB- and
PLA-fiber composites decreases gradually as the
fiber content is increased (Fig. 6). When heated,
therefore, fibers and fiber bundles act as
plasticizers of the composite, resulting in
increased polymer plasticity.
LF40
LF30
LF20
SF40
SF30
SF20
PLA
LF40
LF30
LF20
SF30-K
SF30 SF20
PHB
SF30

HAO REN et al.
650
Dynamic Mechanical Analysis Dynamic mechanical tests were run to
characterize the composites. Fig. 7 shows the
dynamic modulus and tan delta curves of
PLA/PHB and their composites. Because PLA
and PHB are viscoelastic materials, they both
have the capability of storing mechanical energy
without dissipation (measured using the storage
modulus, E’) and the ability to dissipate energy
without storage (measured using the loss
modulus, E”). In a polymeric material, the
dissipation of energy manifests as internal friction
or damping, and in a polymer matrix composite
energy dissipation may also arise from inter-
material friction at the filler-matrix interface. This
internal friction can be quantified by tanδ, the
ratio of the energy dissipated per cycle to the
energy stored during the cycle (i.e. E”/E’), and a
high dissipation factor is accompanied by a
decrease in dimensional stability. Our results
seem to show that, in the 40-80 ºC temperature
range, the addition of pulp fibers increases the
mobility of the amorphous phase of the matrix
polymer and thus reduces damping in the
composites (the degree to which this effect is seen
depends upon pulp fiber weight percentage). It is
seen that as fiber content is increased, E’ and E”
both decrease, as the smoothness of the pulp fiber
surfaces allows the interfacial bonds between the
fibers and matrix to tend to move together. The
energy dissipation ratio, tanδ, is also observed to
decrease owing to the network of fibers dispersed
in the polymer matrix improving the hardness of
the composites. Because both PHB and PLA are
highly viscoelastic materials, the addition of
fibers decreases their viscosity and increases their
dimensional stability.
0 100 200 300 400 500 6000
20
40
60
80
100
TG
(%
)
Temperature O
C
PHB
SF20
SF30
SF40
LF20
LF30
LF40
0 100 200 300 400 500 6000
20
40
60
80
100
TG
(%
)
Temperature O
C
PLA
SF20
SF30
SF40
LF20
LF30
LF40
Figure 6: Thermogravimetry charts of PHB and PLA composites; SF20, 30, 40: short fiber contents in
composites were of 20%, 30%, 40% respectively, composites were mixed using a torque rheometer; LF20, 30,
40: long fiber contents in composites were of 20%, 30%, 40% respectively, composites were mixed using a
torque rheometer
40 60 80 100 120
0.00E+000
2.00E+007
4.00E+007
6.00E+007
8.00E+007
Sto
rag
e M
od
ulu
s (
Pa
)
Temperature O
C
PHB
SF20
SF30
SF40
LF20
LF30
LF40
40 60 80 100 120
0
4000000
8000000
12000000
16000000
20000000
Lo
ss M
od
ulu
s (
MP
a)
Temperature O
C
PHB
SF20
SF30
SF40
LF20
LF30
LF40
(b) (a)

Biodegradable composites
651
40 60 80 100 1200.0
0.2
0.4
0.6
0.8T
an δ
Temperature O
C
PHB
SF20
SF30
SF40
LF20
LF30
LF40
40 60 80 100 120
2.00E+007
4.00E+007
6.00E+007
8.00E+007
1.00E+008
Sto
rage M
odulu
s (
Pa)
Temperature O
C
PLA
SF20
SF30
SF40
LF20
LF30
LF40
40 60 80 100 120
0
10000000
20000000
30000000
40000000
Loss M
odulu
s (
Pa)
Temperature O
C
PLA
SF20
SF30
SF40
LF20
LF30
LF40
40 60 80 100 120
0.0
0.5
1.0
Tan
δ
Temperature O
C
PLA
SF20
SF30
SF40
LF20
LF30
LF40
Figure 7: Dynamic mechanical analysis runs for PHB-fiber composites; (a) storage modulus, (b) loss modulus, (c) tan
delta, PLA-fiber composites, (d) storage modulus, (e) loss modulus, (f) tan delta; SF20, 30, 40: short fiber contents in
composites were of 20%, 30%, 40% respectively, composites were mixed using a torque rheometer; LF20, 30, 40: long
fiber contents in composites were of 20%, 30%, 40% respectively, composites were mixed using a torque rheometer
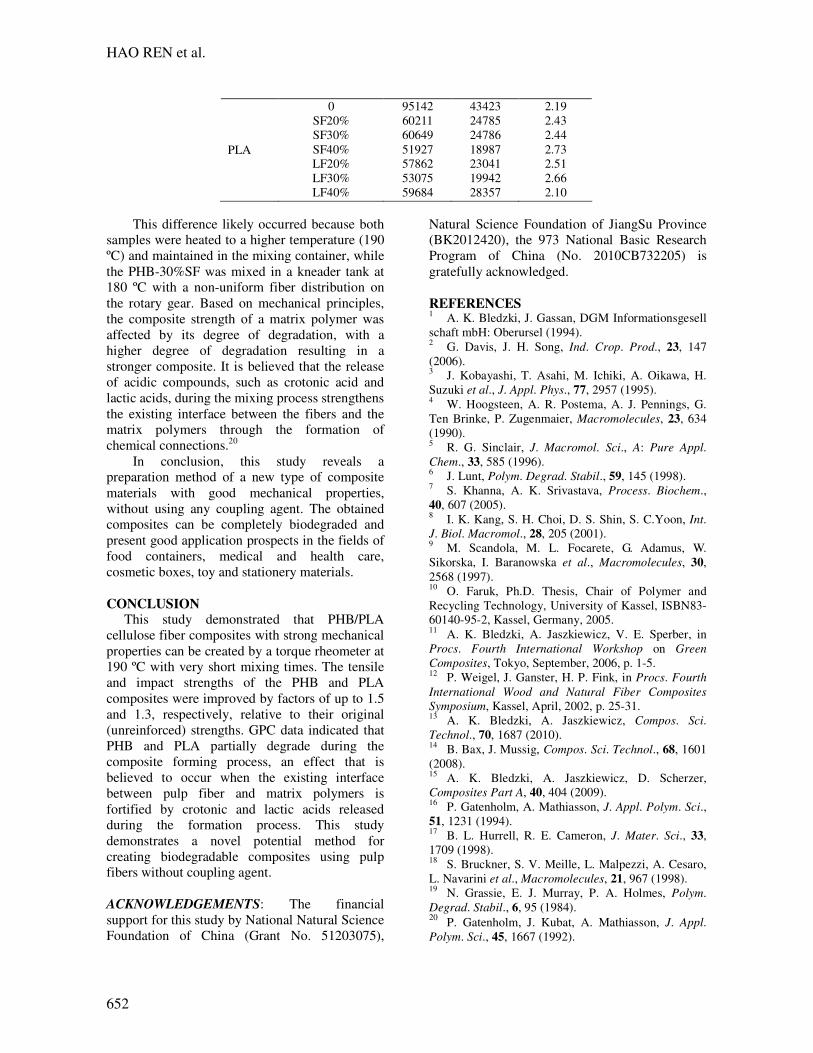
Gel Permeation Chromatography Analysis The melting point instability of PHB and its
copolymers owing to thermal degradation is well
documented.19 The molecular weight of pure
polymers and pulp fiber filled composites were
investigated with gel permeation chromatography
(GPC). Table 4 shows the molecular weight of
pure polymers and of the composites with
different fiber content, the results indicating that
the pure polymers clearly degraded during the
mixing process, while the composites with
increased fiber content showed a less obvious
degree of degradation.
Table 4
Molecular weight of matrix polymers
Matrix Fiber contents Mw Mn Mw/Mn
PHB
0
SF30%-Kneader
SF20%
SF30%
SF40%
LF20%
LF30%
LF40%
102967
98991
84205
72761
79056
74025
69061
71196
46721
49090
42107
28793
43960
35001
26780
29135
2.20
2.02
1.99
2.53
1.79
2.11
2.58
2.44
(c) (d)
(e) (f)
HAO REN et al.
652
PLA
0
SF20%
SF30%
SF40%
LF20%
LF30%
LF40%
95142
60211
60649
51927
57862
53075
59684
43423
24785
24786
18987
23041
19942
28357
2.19
2.43
2.44
2.73
2.51
2.66
2.10
This difference likely occurred because both
samples were heated to a higher temperature (190
ºC) and maintained in the mixing container, while
the PHB-30%SF was mixed in a kneader tank at
180 ºC with a non-uniform fiber distribution on
the rotary gear. Based on mechanical principles,
the composite strength of a matrix polymer was
affected by its degree of degradation, with a
higher degree of degradation resulting in a
stronger composite. It is believed that the release
of acidic compounds, such as crotonic acid and
lactic acids, during the mixing process strengthens
the existing interface between the fibers and the
matrix polymers through the formation of
chemical connections.20
In conclusion, this study reveals a
preparation method of a new type of composite
materials with good mechanical properties,
without using any coupling agent. The obtained
composites can be completely biodegraded and
present good application prospects in the fields of
food containers, medical and health care,
cosmetic boxes, toy and stationery materials.
CONCLUSION This study demonstrated that PHB/PLA
cellulose fiber composites with strong mechanical
properties can be created by a torque rheometer at
190 ºC with very short mixing times. The tensile
and impact strengths of the PHB and PLA
composites were improved by factors of up to 1.5
and 1.3, respectively, relative to their original
(unreinforced) strengths. GPC data indicated that
PHB and PLA partially degrade during the
composite forming process, an effect that is
believed to occur when the existing interface
between pulp fiber and matrix polymers is
fortified by crotonic and lactic acids released
during the formation process. This study
demonstrates a novel potential method for
creating biodegradable composites using pulp
fibers without coupling agent.
ACKNOWLEDGEMENTS: The financial
support for this study by National Natural Science
Foundation of China (Grant No. 51203075),
Natural Science Foundation of JiangSu Province
(BK2012420), the 973 National Basic Research
Program of China (No. 2010CB732205) is
gratefully acknowledged.
REFERENCES 1 A. K. Bledzki, J. Gassan, DGM Informationsgesell
schaft mbH: Oberursel (1994). 2 G. Davis, J. H. Song, Ind. Crop. Prod., 23, 147
(2006). 3 J. Kobayashi, T. Asahi, M. Ichiki, A. Oikawa, H.
Suzuki et al., J. Appl. Phys., 77, 2957 (1995). 4 W. Hoogsteen, A. R. Postema, A. J. Pennings, G.
Ten Brinke, P. Zugenmaier, Macromolecules, 23, 634
(1990). 5 R. G. Sinclair, J. Macromol. Sci., A: Pure Appl.
Chem., 33, 585 (1996). 6 J. Lunt, Polym. Degrad. Stabil., 59, 145 (1998). 7 S. Khanna, A. K. Srivastava, Process. Biochem.,
40, 607 (2005). 8 I. K. Kang, S. H. Choi, D. S. Shin, S. C.Yoon, Int.
J. Biol. Macromol., 28, 205 (2001). 9 M. Scandola, M. L. Focarete, G. Adamus, W.
Sikorska, I. Baranowska et al., Macromolecules, 30,
2568 (1997). 10 O. Faruk, Ph.D. Thesis, Chair of Polymer and
Recycling Technology, University of Kassel, ISBN83-
60140-95-2, Kassel, Germany, 2005. 11 A. K. Bledzki, A. Jaszkiewicz, V. E. Sperber, in
Procs. Fourth International Workshop on Green
Composites, Tokyo, September, 2006, p. 1-5. 12 P. Weigel, J. Ganster, H. P. Fink, in Procs. Fourth
International Wood and Natural Fiber Composites
Symposium, Kassel, April, 2002, p. 25-31. 13 A. K. Bledzki, A. Jaszkiewicz, Compos. Sci.
Technol., 70, 1687 (2010). 14 B. Bax, J. Mussig, Compos. Sci. Technol., 68, 1601
(2008). 15 A. K. Bledzki, A. Jaszkiewicz, D. Scherzer,
Composites Part A, 40, 404 (2009). 16 P. Gatenholm, A. Mathiasson, J. Appl. Polym. Sci.,
51, 1231 (1994). 17 B. L. Hurrell, R. E. Cameron, J. Mater. Sci., 33,
1709 (1998). 18 S. Bruckner, S. V. Meille, L. Malpezzi, A. Cesaro,
L. Navarini et al., Macromolecules, 21, 967 (1998). 19 N. Grassie, E. J. Murray, P. A. Holmes, Polym.
Degrad. Stabil., 6, 95 (1984). 20 P. Gatenholm, J. Kubat, A. Mathiasson, J. Appl.
Polym. Sci., 45, 1667 (1992).