production and marketing reports -...
TRANSCRIPT
An Economic Analysis of Two GraftedTomato Transplant Production Systemsin the United States
Cary L. Rivard1,5, Olha Sydorovych2,6, Suzanne O’Connell3,5,
Mary M. Peet3,4,7, and Frank J. Louws1,7,8
ADDITIONAL INDEX WORDS. soilborne diseases, organic, IPM, propagation, grafting,rootstock, Solanum lycopersicum
SUMMARY. The grafting of herbaceous vegetables is an emerging development in theUnited States. This report provides an estimate of the variable costs of graftingwithin U.S. tomato (Solanum lycopersicum) transplant production systems. Graftedand nongrafted plants were propagated at two commercial farming operations inIvanhoe, NC (NC) and Strasburg, PA (PA) and the farm in NC produced certifiedorganic transplants. Detailed economic production sequences were generated foreach site, and grafted and nongrafted transplant production costs were $0.59 and$0.13 in NC, and $1.25 and $0.51 in PA, respectively. Direct costs associated withgrafting (e.g., grafting labor, clips, chamber, etc.) accounted for 37% to 38% of theadded cost of grafting, and grafting labor was 11.1% to 14.4% of the cost of graftedtransplant production. Seed costs represented 52% and 33% of the added cost ofgrafting at the two sites, and indirect costs (e.g., soil, trays, and heating) accountedfor 10% and 30% of the added cost of grafting. Our findings suggest that undercurrent seed prices and with similar production practices, the feasibility of graftingin the United States is not disproportionately affected by domestic labor costs.Additionally, the economic models presented in this report identify the cost ofproduction at various transplant stages, and provide a valuable tool for growersinterested in grafted tomato transplant production and utilization.
Recently, grafting has gainedincreased attention for U.S. to-mato production systems (King
et al., 2008; Kubota et al., 2008). Fieldtrials in the southeastern U.S. showedthat resistant rootstocks can be used tomanage site-specific soilborne diseasessuch as bacterial wilt (Ralstonia sola-nacearum) (Freeman et al., 2009;Rivard et al., 2008a; Rivard and Louws,2008), Fusarium wilt (F. oxysporum f.sp. lycopersici) (Rivard and Louws,2008), southern blight (Sclerotiumrolfsii) (Rivard et al., in press), androot-knot nematodes (Meloidogyne
spp.) (Kokalis-Burelle et al., 2008;Rivard et al., in press). Furthermore,grafting has been proposed worldwideas a component in integrated pestmanagement programs that are not
dependent on the soil fumigant methylbromide (Besri, 2003, 2007; Minutoand Causarano, 2008). Methyl bro-mide has been an integral part of to-mato production in the United States,but is being phased out according tothe Montreal Protocol (Martin, 2003;Noling and Becker, 1994; Sydorovychet al., 2008).
With the exception of the hydro-ponic greenhouse industry, few to-mato growers in the United States usegrafted transplants for fruit produc-tion (Kubota et al., 2008). There aretwo primary assumptions used to jus-tify the lack of grafting in the UnitedStates. The first is that U.S. labor costsare too high for manual grafting to be afeasible component of transplant pro-duction. Second, U.S. tomato fruitproduction systems may not generatethe necessary per plant revenue to usegrafted plants in a profitable way. Dueto the recent regulatory issues associ-ated with soil fumigants and the shifttoward more intensive production sys-tems among the organic sector, tomatogrowers are interested in producinggrafted plants grown on the farm orpurchased from specialized propaga-tion facilities. Tomato grafting mayprovide an emerging niche for com-mercial propagators wishing to captureretail or wholesale markets, includingorganic and heirloom tomato plantsales (Rivard and Louws, 2006).
The most common tomatografting technique for commercialpropagation worldwide is tube graft-ing (Oda, 1999; Rivard and Louws,2006). This technique is highly effec-tive and can be performed when theplants are very small, thereby increas-ing throughput (Lee, 2003). Thetube grafting procedure is relativelyquick, and manual grafting ratesrange from 300 to 500 plants/h perworker (Kubota et al., 2008).
Even with the advent of tubegrafting, legitimate concerns in theUnited States have been raised regard-ing the cost of labor required for thegrafting procedure (Kubota et al.,
UnitsTo convert U.S. to SI,multiply by U.S. unit SI unit
To convert SI to U.S.,multiply by
0.4047 acre(s) ha 2.47110.0929 ft2 m2 10.76393.7854 gal L 0.26422.54 inch(es) cm 0.3937
25.4 inch(es) mm 0.0394
Productionand Marketing
Reports
794 • August 2010 20(4)
2008). Grafting robots have been pro-posed as one alternative to reduce thecost of grafting labor worldwide (Lee,2003), but their current use for tomatois relatively low (Kubota et al., 2008).
In addition to manual graftinglabor, grafted production requiresother direct costs such as graftingsupplies and healing chamber mate-rials (Rivard and Louws, 2006). Ad-ditionally, rootstock seed must bepurchased and excess seed must beplanted (oversowing) to account forless than 100% grafting success. Graft-ing also increases variable costs indi-rectly as it adds about 7 d onto thetransplant production cycle and re-quires a complementary seedling cropof scion material before grafting (Rivardand Louws, 2006). This increases ma-terials, labor, and heating costs beforegrafting of the rootstock and scionseedling crops.
Although interest in grafting ishigh among U.S. growers and re-searchers, little work has been doneto determine the economic costs andpotential benefits of grafted transplantproduction for retail and commercialsale, or on-farm use. Furthermore, thefirst step in development of tomatoproduction budgets with and withoutthe use of grafting is to determine thecost of comparable grafted and non-grafted plants. Therefore, it is criticalto identify the specific cost or range ofcosts that growers may experience as
they produce grafted plants or im-plement grafting into their farmingoperations.
Published reports on the cost ofgrafted tomato transplants are rare. InMorocco, nongrafted and grafted to-mato plants were produced for $0.19and $0.38, respectively (Besri, 2003).In a recent review article, the use ofgrafted plants was estimated to add$0.60 to $0.90 per transplant (exclud-ing seed costs) for U.S. production(Kubota et al., 2008). Currently, about40 million grafted transplants areimported into the United States forlarge greenhouse operations (Kubotaet al., 2008), and the cost of theCanadian transplants is $2.00 per plantin addition to seed costs (C. Powell,personal communication). A prelimi-nary report from North Carolina sug-gested that the utilization of graftedplants would increase fruit produc-tion costs by $2275/acre (O’Connellet al., 2009b), and a more in-depthdescription of transplant productionmethods as well as the subsequentanalysis of the variable costs of pro-duction is provided here.
To identify the relevance of graft-ing for domestic tomato production, itis essential to determine the cost ofgrafted transplants propagated in theUnited States. Therefore, the goal ofthis study was to identify growers inthe United States who successfullyproduced grafted tomato transplantsand report their production modelsand any corresponding variable costsassociated with grafted and nongraftedpropagation; to dissect the variablecosts of grafted production and exam-ine grafting labor and other key com-ponents that could be importantconsiderations for propagation inthe United States; and to determineif tomato grafting can provide aneconomic benefit to local propaga-tion facilities by adding value to to-mato transplant production.
Materials and methodsGrafted and nongrafted tomato
plants were produced at Black RiverOrganic Farm (Ivanhoe, NC) andGood Harvest Farms (Strasburg,PA). Rootstock and scion cultivarswere chosen based on the needs ofeach individual farm and market withgrafting and healing chamber man-agement conducted by farm per-sonnel (Rivard and Louws, 2006).Three batches of grafted plants were
produced throughout the spring ateach site. Detailed transplant produc-tion sequences were formulated in-dependently based on the experiencesof each on-farm collaborator, and thevariable costs associated with graftedand nongrafted transplant productionwere calculated. The specific trans-plant production methods varied ateach location and are described below.
ON-FARM GRAFTING: NORTH
CAROLINA SITE. In 2008, �1000 cer-tified organic grafted transplants wereproduced at Black River OrganicFarm to determine the feasibility andutility of grafting for a small-scaleorganic farming operation (O’Connellet al., 2009b). Transplants were pro-duced in three batches of about 350plants (three to five true leaf stage).‘Celebrity’ (Harris Seeds, Rochester,NY) was grafted as scion onto ‘RST-04–105-T’ (DP Seeds, Yuma, AZ)rootstock. In this case, the growerwas producing grafted plants solelyfor use on the farm and transplantswere produced in a greenhouse thatwas used in the late spring and sum-mer for vegetable production (Fig.1A and 1B). Therefore, heating costswere low and no mark-up was in-cluded in the final production cost.Grafted transplants were produced inaccordance with organic certification.Organic fertilizers were used, pot-ting media was listed by the OrganicMaterials Review Institute (OMRI),and rootstock and scion seed wereuntreated.
Rootstock and scion seeds weregerminated in 512-cell plug trayswithin a small, heated germinationchamber. After 7 d, rootstock andscion seedlings (one true leaf stage)were transplanted into 50-cell trays(4.5 cm cell diameter) and allowed togrow for 14 d. Grafting was carriedout when the plants had two to threetrue leaves. Once grafting had oc-curred, the plants were placed intoa healing chamber (30 · 48 inches)constructed from rebar, concreteblocks, plastic sheeting, and a cool-mist vaporizer (Fig. 1A). The vapor-izers were refilled twice daily and thechamber was managed for optimumhealing conditions (Rivard andLouws, 2006). After the plants spent7 d in the healing chamber, they weremoved back into the greenhouse en-vironment for 7 d to re-acclimate andfinish healing before field planting(three to five true leaf stage).
The mention of a trademark, proprietary product, orvendor does not constitute a guarantee or warranty ofthe product and does not imply its approval to theexclusion of other products or vendors that also maybe suitable.
We would sincerely like to thank Stefan Hartmann(Black River Organic Farm), Chris Powell (GoodHarvest Farms), Steve Groff (Cedar Meadow Farm),Dr. Michael Orzolek (Pennsylvania State University),and Penn State Extension for cooperation on this pro-ject. Special thanks to Noel Mooney, Kaitlin Dye, andDana Groff. Funding provided by the Organic FarmingResearch Foundation, Northeast Region SAREFNE09-658, Southern Region SARE LS06-193 andGS07-060, and USDA-NIFA 2007-51106-03794.
1Department of Plant Pathology, North CarolinaState University, Raleigh, NC 27695
2Department of Agricultural and Resource Econom-ics, North Carolina State University, Raleigh, NC27695
3Department of Horticultural Science, North Caro-lina State University, Raleigh, NC 27695
4Current address: U.S. Department of Agriculture,National Institute of Food and Agriculture, Wash-ington, DC 20250.
5Graduate Research Assistant.
6Researcher.
7Professor.
8Corresponding author. E-mail: [email protected].
• August 2010 20(4) 795

ON-FARM GRAFTING:PENNSYLVANIA
SITE. In 2009,�10,000 grafted trans-plants were produced at Good Har-vest Farms to investigate the use ofgrafted tomato plants for high tunneltomato production at Cedar MeadowFarm (Holtwood, PA) (Groff, 2009a,2009b). Good Harvest Farms housesa 40,000 ft2 transplant productionfacility for local commercial and retailornamental and vegetable plant sales.Grafted tomato transplants were pro-duced in three batches of about 3300grafted plants. ‘BHN 589’ (BHNSeed, Immokalee, FL) was grafted asscion onto ‘Maxifort’ (De RuiterSeeds, Bergschenhoek, The Nether-lands) rootstock. In this case, theclient was using decreased plantingdensities for fruit production andrequested that the plants were prunedinto a ‘‘twin-leader’’ and grown inlarger 18-cell trays [8 · 8 cm cell (Fig.1D)]. Because the grafted plants at thePA location were being sold to a localtomato grower, a wholesale mark-up(50%) was included at the end of theeconomic production sequence.
Rootstock and scion seedlingswere germinated by a local customplug producer (York, PA) in 288-celltrays and were allowed to grow for3 d upon arrival at Good HarvestFarms. The seedlings (1 true leaf stage)were transplanted into 50-cell traysand were allowed to grow for 21 d inthe greenhouse before being grafted(two to three true leaf stage). Oncegrafted, the plants were moved intoa healing chamber for 7 d. The healingchamber was built on top of an ‘‘ebb-and-flow’’ greenhouse bench usingwire hoops, plastic sheeting, shadefabric, and four cool-mist vaporizers(Fig. 1C). Similar to the other location,the grafted plants were monitoredtwice daily, and light and humiditylevels were maintained in accordancewith current grafting protocols (Rivardand Louws, 2006). Once the plants(three to five leaf stage) were movedback into the greenhouse, they weretransplanted into an 18-cell tray,pruned, and grown for 14 d beforebeing hardened off in an unheatedgreenhouse for 7 d before sale (Fig.1D). At the time of sale, the plants hadtwo leaders, and each leader had threeto five true leaves (6–10 true leaf stage).
METHODOLOGY OF ECONOMIC
ANALYSIS. A detailed grafted and non-grafted production sequence wasgenerated for each location based on
the data and experiences gained ateach facility. Line items included allvariable costs associated with graftedand nongrafted transplant production,and were specific to each location.Material prices used for transplantproduction and grafting are shown inTables 1 and 2, and were used duringthe calculation of the variable produc-tion costs. Summaries of the variableper plant production costs are shownin Fig. 2A and 2B with the accumula-tion of variable production costs plot-ted on the y-axis. The discrete andcontinuous costs of each productionstage are illustrated in the figures bythe height of the rectangles and theslopes of the corresponding triangles,respectively (see Table 3). The trans-plant production sequence was plottedalong the x-axis to illustrate the costsof specific transplant stages. A categor-ical summary of the variable costs foreach location is shown in Tables 4 and5, and the proportional cost of cate-gorical line items in relation to thetotal cost of transplant production isshown in Table 6 (ITEM O TOTAL).The distribution of the added costs ofgrafting is shown in Fig. 3, and thisapproach describes the proportion ofeach factor (e.g., seed costs) in relationto the added cost of grafting [(SEED-graft – SEEDnon) O (TOTALgraft –TOTALnon)].
ASSUMPTIONS OF THE ECONOMIC
MODEL. The production sequencesdid not consider fixed costs such asland value and initial costs of green-house structure. The objectives ofthe study were to determine thevariable costs of grafted versus non-grafted transplant propagation andto ascertain any economic costsand benefits of integrating graftingin an existing tomato propagationfacility.
Two base wage rates were used inthe development of the budgets. Itwas assumed that $10.08/h was paidto hired labor and $14.00/h was paidto skilled/managerial labor at bothlocations (U.S. Department of Agri-culture, 2009), but rates of $11.79/hto $16.39/h were used to accountfor workers’ compensation, unem-ployment, FICA taxes, and other in-direct costs in addition to the basewage rate. Reusable materials such asthe healing chamber and cool-mistvaporizers were depreciated accord-ing to the number of batches ofgrafted plants that could be produced
(Tables 1 and 2). Similarly, variablecosts incurred for healing chambermaterials and construction corre-spond to the size of the batches thatwere grafted at each location (Tables1 and 2).
Grafting clips were not reused androotstock and scion seed costs werebased on current market prices at thetime of budget development. All plantand seed numbers were calculated toreflect plant and seed loss that mayoccur during germination, propaga-tion, and grafting. Rootstock and scionseed were oversown by 20% to accountfor germination rate and uniformity,and grafting success was assumed tobe 90%, consistent with grower expe-rience. Grafting speed was 200 and100 plants per person per hour at theNC and PA locations, respectively, andgrafting labor was paid $10.08/h inNC and $14.00/h in PA.
At the PA location, graftedplants were sold to a local tomatogrower. However, no market hadbeen established for locally raisedgrafted transplants, thus the imposedprice was based on typical wholesalemark-up for commercial vegetableplant sales at Good Harvest Farms.The collaborating propagator indi-cated that a 50% mark-up was theirtypical ‘‘goal’’ and this value was usedto calculate a selling price.
Results and discussionC O S T O F N O N G R A F T E D
TRANSPLANT PRODUCTION. The costof nongrafted plants (TOTALnon) atthe NC and PA locations was $0.13and $0.51 per plant, respectively (Fig.2A and 2B). At both locations, mate-rial costs (excluding seeds) comprisedthe highest expense, and ranged from44.0% to 48.8% (Table 6). Duringproduction of nongrafted plants, la-bor costs ranged from 28.8% to 36.9%(Table 6). Although nongrafted seedprices were higher at the PA locationthan in NC (Tables 1 and 2), theoverall seed costs were 14.3% of thetotal transplant costs in PA comparedwith 27.1% in NC (Table 6). Laborand materials added $0.10 per trans-plant at the NC site and $0.42 perplant on top of initial seed costs (Fig.2A and 2B). Continuous costs (Table3) accumulated more quickly in thePA production sequence (Fig. 2B)compared with the NC site (Fig.2A) and this is illustrated by the in-creased slope of the triangles on the
796 • August 2010 20(4)
PRODUCTION AND MARKETING REPORTS

economic timelines. The PA facilityused hourly and skilled labor duringdaily transplant care and watering andheating costs were higher than in NC(Tables 4 and 5).
Across the two locations, therewas a distinct difference in plant sizethat was required for use/sale. Thetransplant production methods re-quired to produce the transplants inNC (three to five true leaf stage)compared with the ones in PA(twin-leader, six to 10 true leaf stage)had a strong influence on variablecosts. At the PA site, plants weregrown for 2.5 weeks longer than inNC, and were transplanted into an18-cell tray 3 weeks before sale (Fig.2A and 2B). This production stage
Fig. 1. Healing chambers used for grafted tomatoproduction at (A) Black River Organic Farm, Ivanhoe, NC,and (C) Good Harvest Farms, Strasburg, PA. (B) Seedlingpropagation at Black River Organic Farm. (D) ‘‘Twin-leader’’ transplant 2 weeks before sale/planting.
Fig. 2. Economic timeline of a grafted and nongraftedtomato transplants at (A) Black River Organic Farm,Ivanhoe, NC, and (B) Good Harvest Farms, Strasburg, PA.Rectangles and triangles scaled to represent discrete (e.g.,transplanting labor, materials, grafting labor, clips, etc.) andcontinuous (e.g., overhead, daily watering labor, fertilizer,etc.) expenses, respectively.
Fig. 3. Distribution of the added cost of grafting at theIvanhoe, NC (NC) and Strasburg, PA (PA) locations.Additional per plant cost of grafting was $0.46 in NC and$0.74 in PA. The distribution represents the proportion ofeach factor in relation to the added cost of grafting [e.g., seedcosts = (SEEDgraft – SEEDnon) O (TOTALgraft –TOTALnon)].
Fig. 4. Newly grafted plants (A) and organic tomatoproduction area adjacent to propagation greenhouses (B) atBlack River Organic Farm, Ivanhoe, NC. (C) Manualgrafting at Good Harvest Farms, Strasburg, PA. (D) ‘‘Twin-leader’’ transplants in production at Cedar Meadow Farm,Holtwood, PA (Photo courtesy: Steve Groff).
• August 2010 20(4) 797
added transplanting labor and mate-rials and also substantial heating costsas each plant in an 18-cell tray re-quired about three times as muchspace in the greenhouse as one ina 50-cell tray. The 18-cell productionstage in PA added $0.23 per plant(Fig. 2B), which accounts for themajority of the per plant differencebetween the cost of nongrafted pro-duction at the two locations.
ADDITIONAL COSTS OF GRAFTED
TRANPLANT PRODUCTION. The addi-tional cost of producing a graftedplant (TOTALgraft – TOTALnon)was $0.46 and $0.74 per plant at theNC and PA sites, respectively (Table 4and 5). These costs reflect additionalrootstock and scion seed costs, thedirect costs of grafting (e.g., graftinglabor, clips, healing chamber, etc.),and the indirect costs associated withgrowing a rootstock and scion cropbefore grafting. At the NC location,finished transplants had three to fivetrue leaves, and additional seed costs(52%), grafting materials (24%), andgrafting labor (14%) were the three
most important variable expenses re-lated to grafted transplant production(Fig. 3). At the PA location, finishedtransplants had six to 10 true leaves,and seed costs (33%), combined in-direct costs (30%), and grafting labor(24%) were the three most importantvariable expenses in relation to graft-ing (Fig. 3).
SEED COSTS ASSSOCIATED WITH
GRAFTING. At both locations, the ad-ditional seed costs required forgrafted transplant production werethe most important single compo-nent in relation to the added costs ofgrafting (Fig. 3). The proportionalseed costs of grafted plants accountedfor 46.5% and 25.6% of the total costof production at the NC and PAfacilities, respectively, and were nearlydouble those of nongrafted plants atboth locations (Table 6). The root-stock seed used in this study is rela-tively expensive ($0.17–$0.20 perseed) compared with the prices ofcomplementary scion seed or seedfor nongrafts ($0.03–$0.07 per seed).Currently, very few rootstock cultivars
are available to U.S. growers, and thecost of rootstock seed could go downif a market develops in the UnitedStates. Overseeding and the assumed90% grafting success had negligibleimpacts on scion seed costs but fur-ther amplified the increased price ofrootstock (Tables 4 and 5).
DIRECT COSTS ASSOCIATED WITH
GRAFTING. The direct costs of graftinginclude line items that were addedinto the production sequence of thegrafted plants, but were not listed inthe nongrafted budget. These costscomprised 37% to 38% of the addi-tional costs of grafting at the twolocations (Fig. 3). The ‘‘grafting/healing stage’’ added $0.18 and$0.31 per plant at the NC and PAsites, respectively (Fig. 2A and 2B).
Grafting labor accounted for 14%to 24% of the added cost of grafting(Fig. 3) and represented 11.1% to14.4% of the total cost of production(Table 6). Per plant labor costs aredependent on grafting speed, success,and the hourly wage of trained em-ployees. In PA, a more conservative
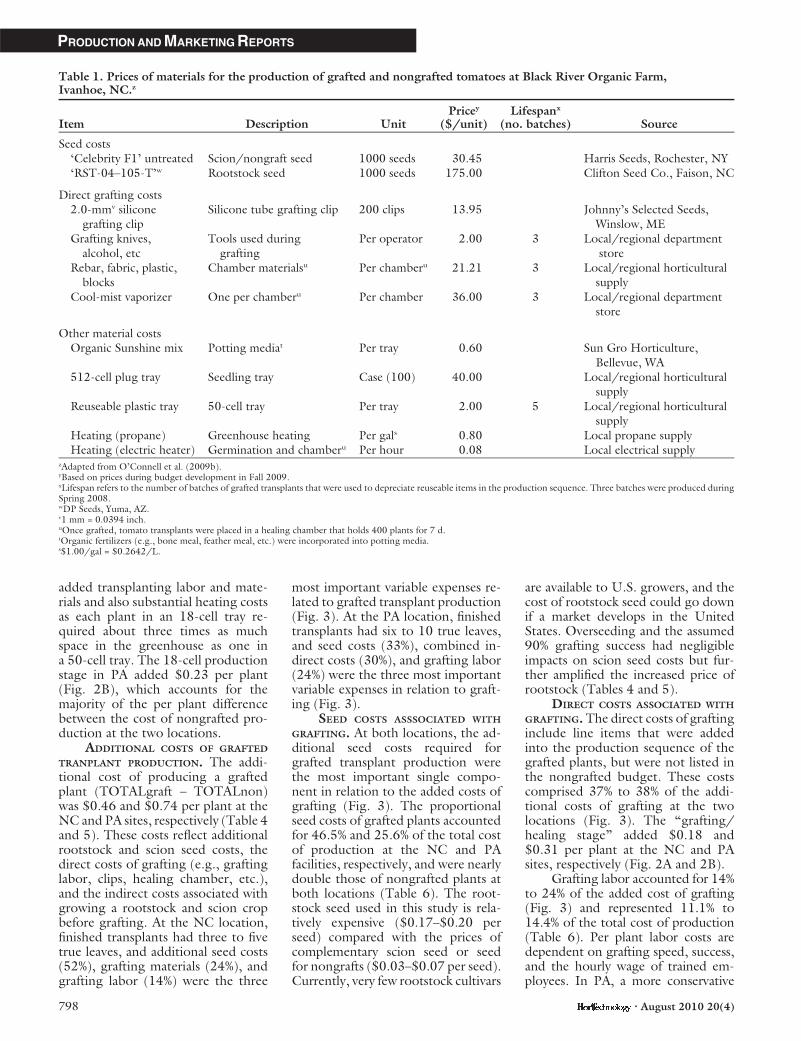
Table 1. Prices of materials for the production of grafted and nongrafted tomatoes at Black River Organic Farm,Ivanhoe, NC.z
Item Description UnitPricey
($/unit)Lifespanx
(no. batches) Source
Seed costs‘Celebrity F1’ untreated Scion/nongraft seed 1000 seeds 30.45 Harris Seeds, Rochester, NY‘RST-04–105-T’w Rootstock seed 1000 seeds 175.00 Clifton Seed Co., Faison, NC
Direct grafting costs2.0-mmv silicone
grafting clipSilicone tube grafting clip 200 clips 13.95 Johnny’s Selected Seeds,
Winslow, MEGrafting knives,
alcohol, etcTools used during
graftingPer operator 2.00 3 Local/regional department
storeRebar, fabric, plastic,
blocksChamber materialsu Per chamberu 21.21 3 Local/regional horticultural
supplyCool-mist vaporizer One per chamberu Per chamber 36.00 3 Local/regional department
store
Other material costsOrganic Sunshine mix Potting mediat Per tray 0.60 Sun Gro Horticulture,
Bellevue, WA512-cell plug tray Seedling tray Case (100) 40.00 Local/regional horticultural
supplyReuseable plastic tray 50-cell tray Per tray 2.00 5 Local/regional horticultural
supplyHeating (propane) Greenhouse heating Per gals 0.80 Local propane supplyHeating (electric heater) Germination and chamberu Per hour 0.08 Local electrical supply
zAdapted from O’Connell et al. (2009b).yBased on prices during budget development in Fall 2009.xLifespan refers to the number of batches of grafted transplants that were used to depreciate reuseable items in the production sequence. Three batches were produced duringSpring 2008.wDP Seeds, Yuma, AZ.v1 mm = 0.0394 inch.uOnce grafted, tomato transplants were placed in a healing chamber that holds 400 plants for 7 d.tOrganic fertilizers (e.g., bone meal, feather meal, etc.) were incorporated into potting media.s$1.00/gal = $0.2642/L.
798 • August 2010 20(4)
PRODUCTION AND MARKETING REPORTS

speed (100 plants/h) combined withthe higher pay rate ($14/h) increasedthe per plant costs of manual graftingcompared with the NC study. It isestimated that an experienced workercould graft >250 plants/h with >95%success (C.L. Rivard and F.J. Louws,unpublished data), and others havereported manual grafting rates from300 to 500 plants/h for tube grafting(Kubota et al., 2008).
Grafting clips and healing cham-ber materials accounted for 24% and13% of the added cost of grafting atthe NC and PA sites, respectively(Fig. 3). The price of the siliconegrafting clips ranged from $0.04 to$0.07 per clip (Tables 1 and 2).Grafting clips may be collected, ster-ilized, and re-used (Rivard andLouws, 2006), but the cost effective-ness of this practice is unknown.
Healing chamber materials and laborrepresented a relatively small portion(3.7%–5.1%) of the total cost ofgrafted transplant production (Table6). Cool-mist vaporizers were used toincrease the humidity within the heal-ing chambers (Figs. 1A and 4A), andalthough they represent a relativelyinsignificant source of material costs(Table 6), these devices may not beneeded in larger healing chambers.
INDIRECT COSTS ASSOCIATED
WITH GRAFTING. Indirect costs associ-ated with grafting represent lineitems that were increased (per plant)in the grafted production sequencecompared with the nongrafted plants.Indirect costs such as additional soil,trays, labor, and heating were 46%and 51% higher during the produc-tion of the grafted plants in NC andPA, respectively (Tables 4 and 5).These costs were particularly impor-tant in the PA study, and the com-bined indirect costs (miscellaneousmaterials, heating, transplant labor)accounted for 10% and 30% of theadded costs of grafting in NC and PA,
Table 2. Prices of materials for the production of grafted and nongrafted tomatoes at Good Harvest Farms, Strasburg, PA.
Item Description UnitPricez
($/unit)Lifespany
(no. batches) Source
Seed costs‘BHN 589’x Scion/nongraft seed 1000 seeds 62.50 Siegers Seed Co., Holland, MI‘Maxifort’w Rootstock seed 1000 seeds 194.46 Johnny’s Selected Seeds,
Winslow, MEDirect grafting costs
2.0-mmv siliconegrafting clip
Silicone grafting clip 200 clips 8.40 Hydro-gardens, CO Springs, CO
Grafting knives,alcohol, etc
Grafting tools Per operator 2.00 3 Local/regional department store
Wire hoops, fabric,plastic
Chamber materialsu Per chamberu 29.50 3 Local/regional horticultural supply
Cool-mist vaporizer Four per chamberu Per chamber 320.00 5 Local/regional horticultural supplyEbb-and-flood bench Chamber materials ft2 t 3.50 10 Local/regional horticultural supply
Other material costsCustom plug costs Seedling germination Per seed 0.05 Local custom propagatorPotting media Per 50-cell tray Per tray 0.28 Local/regional horticultural supplyPotting media Per 18-cell tray Per tray 0.45 Local/regional horticultural supply50-cell trays 50-cell tray Case (100) 45.00 Local/regional horticultural supply1801 deep tray 18-cell tray Case (100) 66.00 Local/regional horticultural supplyWeb trays 18-cell tray only Case (100) 36.00 Local/regional horticultural supplyWater-soluble
fertilizerApplied through
injectorPer tray per week 0.03 Local/regional horticultural supply
Heating All greenhouse heat Per tray per day 0.07zBased on prices during budget development in Fall 2009.yLifespan refers to the number of batches of grafted transplants that were used to depreciate reuseable items in the production sequence. Three batches were produced duringSpring 2009.xBHN Seed, Immokalee, FL.wDe Ruiter Seeds, Bergschenhoek, The Netherlands.v1 mm = 0.0394 inch.uOnce grafted, tomato transplants were placed in a healing chamber that holds 3300 plants for 7 d.t$1.00/ft2 = $10.7639/m2.
Table 3. List of variable costs during grafted and nongrafted tomato transplantproductionz.
Discretey Continuousx
Plug costs (PA only) Daily wateringPotting mix Heating costsSeedling trays Transplant care/scoutingTransplanting labor Weekly fertilizer (PA only)Grafting facility Healing chamber costsGrafting equipment Humidifier costsGrafting clips Healing chamber careGrafting laborzVariable costs were itemized in production sequences from two commercial farms in North Carolina andPennsylvania (PA). Discrete and continuous expense categories were used for the development of Figs. 2A and B.yDiscrete variable costs include line items that add to production costs as individual items or events.xContinuous variable costs include line items that accumulate over time during transplant production.
• August 2010 20(4) 799

respectively (Fig. 3). The majority ofindirect costs of grafting were man-ifested as waste during the graftingprocedure (Fig. 4C). These expensescould be reduced through innovative
production techniques. Micrograft-ing has been recently introduced intothe arena of tomato grafting and thistechnique uses micropropagated sciongrafted onto 3-week-old rootstock
seedlings (Grigoriadis et al., 2005).For propagators unable to carryoutthis type of advanced procedure, sim-ilar principles of reducing indirectcosts could be used.
LA B O R C O S T S O F G R A F T E D
TRANSPLANT PRODUCTION. Laborplays an important role in graftedand nongrafted transplant produc-tion budgets (Table 6) and contrib-utes to the added cost of graftingdirectly and indirectly. In these casestudies, manual grafting labor costswere $0.07 to $0.18 per plant (Tables4 and 5). Using the same formulaas in the PA sequence [($16.39/h)O (grafting rate · 90% success)]combined with current manual graft-ing rates (Kubota et al., 2008), thecost of the manual grafting procedurecould be as low as $0.03 to $0.06 perplant.
Although the per-plant cost ofmanual grafting in our studies wasrelatively high, it did not increase theproportional labor costs of produc-tion in comparison with nongraftedplants. Interestingly, the proportionallabor costs were lower in the graftedsequence in NC and similar in the PAstudy (Table 6). This effect is due tothe additional material and seed costsassociated with grafting in both ofthese studies (Tables 4 and 5). Theseresults suggest that at current seedprices and under similar productionmethods, labor prices would havelittle or no effect on the feasibility oftomato grafting in U.S. transplantproduction systems compared withother factors such as rootstock seedand other indirect costs.
Although the price of labor inthe United States may not havea strong proportional effect on thevariable costs incurred for domesticproduction, the sheer volume of man-ual labor required for tomato graftingcould be difficult to obtain. In the PAstudy, grafting wages were increasedto $14/h to coincide with skilledlabor wages. This may be one way tomake labor more available for grafting.It could also be useful for propagatorsto market their clientele in a way thatenables numerous moderately sizedbatches of grafted plants rather thanattempting to produce one or severallarge batches in a given season.
COSTS OF ORGANIC TRANSPLANT
PRODUCTION. At the NC location, thegrower produced certified organictransplants for use on the farm while
Table 4. Variable costs of tomato transplants at Black River Organic Farm,Ivanhoe, NC.z
Description
Nongrafted Grafted
Materialsy Laborx Materials Labor
($/1000 plants) ($/1000 plants)
Seed costsw Rootstock (‘RST-04–105-T’)v 233.35Scion (‘Celebrity F1’)u 36.00 40.00
Transplantproduction
Potting mix and fertilizert 15.84 29.76Plastic trays 10.56 19.84Heating 32.00 32.00Transplanting 21.65 43.30Transplant care 16.56 16.56
Grafting Manual graftings 65.07Grafting clips 77.23Miscellaneous supplies 2.00
Healing chamberr Chamber supplies 20.21 8.28Total 94.40 38.21 454.38 133.21Total (materials and labor) 132.61 587.59Cost ($/plant) 0.13 0.59zAdapted from O’Connell et al. (2009b).yBased on prices during budget development in Fall 2009.xBased on average hourly agricultural wages (U.S. Department of Agriculture, 2009).wSeed costs were calculated to reflect the total cost required for 20% oversowing and 90% grafting success (whereapplicable).vInterspecific rootstock cultivar (DP Seeds, Yuma, AZ).uDeterminate fresh-market variety (Harris Seeds, Rochester, NY).tBone meal, feather meal, and other organic amendments were incorporated into potting mix.sGrafting rate was 200 plants/worker/h and grafting wage was $10.08/h. Grafting success rate was 90%.rOnce grafted, tomato transplants were placed in a healing chamber that holds 400 plants for 7 d.
Table 5. Variable costs of tomato transplants at Good Harvest Farms, Strasburg, PA.
Description
Nongrafted Grafted
Materialsz Labory Materialsz Labory
($/1000 plants) ($/1000 plants)
Seed costsx Rootstock (‘Maxifort’)w 242.69Scion (‘BHN 589’)v 72.92 78.13
Transplantproduction
Custom plug costsu 57.60 1.38 124.80 2.95Potting mix 30.65 37.37Plastic trays 65.78 76.58Heating 88.41 138.04Transplanting 73.69 104.15Transplant care 5.68 112.30 6.96 166.77
Grafting Manual graftingt 180.29Grafting clips 46.20Miscellaneous supplies 1.33
Healing chambers Chamber supplies 42.11 3.93Total 321.04 187.36 794.20 458.08Total (materials and labor) 1525.20 1252.28Cost ($/plant) 0.51 1.25Selling price (50% mark-up) 0.76 1.88zBased on prices during budget development in Fall 2009.yBased on average hourly agricultural wages (U.S. Department of Agriculture, 2009).xSeed costs were calculated to reflect the total cost required for 20% oversowing and 90% grafting success (whereapplicable).wInterspecific rootstock (De Ruiter Seeds, Bergschenhoek, The Netherlands).vDeterminate fresh-market variety (BHN Seed, Immokalee, FL).uSeedlings were germinated by a local custom plug propagator (York, PA).tGrafting rate was 100 plants/h per worker and grafting wage was $14.00/h. Grafting success rate was 90%.sOnce grafted, tomato transplants were placed in a healing chamber that holds 3300 plants for 7 d.
800 • August 2010 20(4)
PRODUCTION AND MARKETING REPORTS

the grower in PA did not. Interest-ingly, the introduction of organiccertification into the NC productionsequence made a negligible effect onthe overall cost of transplant produc-tion. Management of a large-scalecommercial organic transplant pro-duction facility may require addedfixed and variable expenses that werenot seen at Black River Organic Farm.In this example, the greenhouse waspreviously certified, and many of thevariable expenses related to propaga-tion were unaffected by organic cer-tification (e.g., labor, heating, plasticmaterials). Exceptions to this includepotting media, fertilizer, and certifiedor untreated seed. In this case, un-treated seed was used and the cost oforganic fertilizers was similar to thoseused in the PA study. Assuming theprice of the ‘‘conventional’’ pottingmedia used in the PA study (Table 2)in comparison with the price of theOMRI-listed potting media used forthe NC study (Table 1), the addi-tional soil costs associated with theorganic potting media in the NCsequence added about $0.01 to$0.02 per transplant.
B E N E F I T S O F G R A F T E D
TRANSPLANT PRODUCTION IN THE
UNITED STATES. At the NC location,plants were raised for on-farm tomatofruit production (Fig. 4A and 4B) andthe benefit of grafted propagationtranslated to advantages associatedwith the utilization of the graftedplants. This grower had experiencedrepeated crop failures due to soilbornedisease problems. The fruit produc-tion and economic benefits associatedwith the utilization of the graftedplants from this study have been pro-vided in a recent report (O’Connellet al., 2009b). The deployment of re-sistant rootstocks to manage thesediseases resulted in substantially higherper acre profit and ultimately allowedthis grower to retain organic tomatofruit sales for retail and wholesale mar-kets (O’Connell et al., 2009b).
The case study from PA providesa better perspective of how graftingmay benefit specialized plant propa-gators that are interested in the pro-duction and sales of grafted plants.Grafting could provide a new niche forpropagators to explore through retailand commercial sales, but the marketwill ultimately dictate the amount ofprofit recovered by their sale.
At the PA location, the graftedplants provided a more profitable use
of greenhouse space to the transplantgrower than the nongrafts. In thisproduction sequence, heating costswere directly related to the amountof space needed for the crop (Table 2).For every $1.00 the grower invested ingreenhouse heating, nongrafted plantsand grafted plants yielded $2.88 and$4.54 in wholesale mark-up, respec-tively (Table 5). Therefore, the graftedplants provided a more efficient use ofgreenhouse space. Although this trendwould be similar regardless of thespecific mark-up value (%), it is reliantupon the assumption that mark-up ofgrafted and nongrafted plants is equal.Currently, there is little market supplyof grafted transplants in the UnitedStates, but this new specialty marketmay help U.S. propagators retain prof-itability through wholesale and retailsales.
E C O N O M I C M O D E L S A S
A PRACTICAL TOOL. Models similar tothe ones presented in Fig. 2A and 2Bcan be used to compare the cost ofgrafted plants at various productionstages, and therefore serve as a tool topredict the cost of grafted transplantsfor a variety of fruit production sys-tems. In the southeastern U.S., smallertransplants (three to five true leafstage) are used for open-field produc-tion compared with the larger plants(six to 10 true leaf stage) used fortunnel production in the PA study.By omitting the 18-cell growth stagein the PA sequence, equivalently sizedgrafted plants (three to five leaf stage)at the PA location were $1.02 whilethose at the NC location were $0.59per plant (Fig. 2A and 2B). The rangeof values ($0.59–1.02) seen in thesecase studies represent a fair estimate oftransplant costs a grower might expe-rience in the United States for pro-duction of a similar-sized, graftedtransplant (about 6 weeks old), beforemark-up.
This approach to illustratingcosts of seedling production can alsobe used to identify areas along thetransplant production sequence thatcould be considered for reducing thecost of grafting. For example, the dis-crete and continuous costs of graftedtransplant production were twice thatof the nongrafted plants before graftingand this can be visually observed in thePA sequence (Fig. 2B). Similar analysesof other production sequences may beused to determine areas where theadditional costs of grafting could be
Table 6. Distribution of variable costs for tomato transplant production at BlackRiver Organic Farm, Ivanhoe, NC (NC) and Good Harvest Farms, Strasburg,PA (PA).
Description
NC PA
Nongrafted Grafted Nongrafted Grafted
Variable costs (%) Variable costs (%)
Seedz Scion 27.1 6.8 14.3 6.2Roostock 39.7 19.4Total seed costs 27.1 46.5 14.3 25.6
Labory Transplanting 16.3 7.4 14.8 8.6Transplant care 12.5 2.8 14.5 13.3Manual graftingx 11.1 14.4Chamber construction 1.4 0.3Total labor costs 28.8 22.7 36.9 36.6
Materialsw Plug costsv 11.3 10.0Heating costs 24.1 5.4 17.4 11.0Potting mix 11.9 5.1 6.0 3.0Plastic trays 8.0 3.4 12.9 6.1Grafting clips 13.1 3.7Grafting tools 0.3 0.1Chamber materials 3.4 3.4Total material costs 44.0 30.8 48.8 37.8
zSeed costs were calculated to reflect the total cost required for 20% oversowing and 90% grafting success (whereapplicable).yBased on average hourly agricultural wages (U.S. Department of Agriculture, 2009).xGrafting speed was 200 and 100 plants/h per worker at the NC and PA locations, respectively. Grafting wageswere $10.08/h in NC and $14.00/h in PA.wBased on prices during budget development in Fall 2009 (see Tables 1 and 2 for details).vSeedlings were germinated by a local custom plug propagator (York, PA).
• August 2010 20(4) 801

addressed. Furthermore, such modelscould be adopted to help growersconceptualize profitable transplant pro-duction systems.
ConclusionsThe case studies presented here
are the first report of the variable costsof grafted transplant production inthe United States and they representtwo contrasting models of transplantproduction. Our results show thatbefore mark-up, the utilization ofgrafting for tomato production couldadd $0.46 to $0.74 per plant, andincluding a 50% mark-up, this addi-tional cost could be $1.12 per plant.Our findings are generally higher thanthose found in Morocco (Besri, 2003),but are consistent with the estimatedadditional costs provided in a recentreview (Kubota et al., 2008).
U.S. stakeholders are concernedabout the high cost of labor and itsrelevance on grafting. However, it isimportant to note that many of thecommercial propagation facilities us-ing manual grafting worldwide arelocated in countries where laborprices are similar or only slightly lessthan in the United States. The averagewages of Canadian agricultural fieldworkers in 2003–08 ranged from$10.85 to $13.04 per hour (Interna-tional Labor Office Department ofStatistics, 2010) and other industrial-ized countries like Japan, Spain, andItaly currently produce grafted trans-plants without grafting robots (Besri,2003, 2007; Kubota et al., 2008; Lee,2003; Minuto and Causarano, 2008).In these case studies, we found thatgrafting labor costs made up a rela-tively small portion of the added costof grafting, and labor costs wereproportionally lower or similar amonggrafted plants as compared with non-grafted ones. These results do notsuggest that the per plant cost ofmanual tomato grafting labor in theUnited States is negligible. However,they show strong evidence that laborprices in the United States may not beas important as previous speculationshave suggested and that efforts toreduce the immediate cost of graftedplants may be better suited elsewhere.In both of these case studies, seedcosts represented the highest addi-tional cost of grafting and other factorssuch as grafting supplies and indirectcosts played important roles in theadditional cost of grating.
An important consideration forgrowers wishing to implement graft-ing for tomato fruit production iswhether plants will be purchased orgrown on the farm. In the PA casestudy, the per plant mark-up cost thata tomato fruit grower would pay wasabout 150% higher using graftedplants than nongrafted ones, and thisfactor could deter growers from buy-ing grafted plants. Similarly, the initialexpense of grafted transplants mayreduce the likelihood of adoption insome growing systems, and our re-sults showed that the total per plantincrease in transplant cost rangedfrom 64% to 354%. Clearly, furtherwork that ascertains any economicbenefits of grafting in tomato fruitproduction will be of value to growersin the United States.
The objectives of this studywere not to design an optimum prop-agation system or to criticize currentones. Conversely, the goal was toexplore two examples of successfulgrafted transplant propagation facili-ties and report their results. Thespecific cost a propagator may en-counter is dependent not only onthe level of care given, but also onenvironmental conditions at the facil-ity and current seed and labor costs.In a similar way, the benefit of graft-ing for commercial propagators willultimately be driven by market de-mand for grafted plants. Worldwide,grafting has been used particularlyin greenhouses and high tunnels(Kubota et al., 2008; Lee, 1994),and preliminary reports suggest thattunnel growers in the United Stateswould benefit from grafted plants(Groff, 2009a, 2009b; O’Connellet al., 2009a; Rivard et al., 2008b).The adoption of high tunnels in theUnited States (Carey et al., 2009)and the expansion of retail marketsfor grafted plants could be a valu-able avenue for propagators look-ing to establish grafted transplantsales.
Literature citedBesri, M. 2003. Tomato grafting as analternative to methyl bromide in Morocco.12 May 2010. <http://mbao.org/2003/012%20besrimgraftingmbao2003sd.pdf>.
Besri, M. 2007. Current situation of to-mato grafting as alternative to methyl bro-mide for tomato production in Morocco.
12 May 2010. <http://mbao.org/2007/Proceedings/062BesriMGraftingSD07.pdf>.
Carey, E.E., L. Jett, W.J. Lamont, T.T.Nennich, M.D. Orzolek, and K.A. Williams.2009. Horticultural crop production in hightunnels in the United States: A snapshot.HortTechnology 19:37–43.
Freeman, J., S. Rideout, and A. Wimer.2009. Performance of grafted tomatoseedlings in open-field production. 12May 2010. <http://mbao.org/2009/Proceedings/045FreemanJGrafted%20tomato%20MBAO.pdf>.
Grigoriadis, I., I. Nianiou-Obeidat, andA.S. Tsaftaris. 2005. Shoot regenerationand micrografting of micropropagatedhybrid tomatoes. J. Hort. Sci. Biotechnol.80:183–186.
Groff, S. 2009a. Grafting in multi-bay hightunnels as a way to overcome soilbornediseases. 12 May 2010. <http://www.sare.org/MySare/ProjectReport.aspx?do=viewRept&pn=FNE08-636&y=2009&t=1>.
Groff, S. 2009b. An economic compari-son of grafted tomato transplant produc-tion and utilization in multi-bay hightunnels. 12 May 2010. <http://www.sare.org/MySare/ProjectReport.aspx?do=viewRept&pn=FNE09-658&y=2009&t=2>.
International Labor Office Department ofStatistics. 2010. ILO-LABORSTA data-base. 12 May 2010. <http://laborsta.ilo.org/STP/guest#2193AA/>.
King, S.R., A.R. Davis, W.G. Liu, and A.Levi. 2008. Grafting for disease resis-tance. HortScience 43:1673–1676.
Kokalis-Burelle, N., E.N. Rosskopf, M.Bausher, G. McCollum, and C. Kubota.2008. Alternative fumigants and graftingfor tomato and double-cropped muskmelonproduction in Florida. 12 May 2010.<http://mbao.org/2008/Proceedings/063BurelleNMBAOAbstractoralpresentation2008Final.pdf>.
Kubota, C., M.A. McClure, N. Kokalis-Burelle, M.G. Bausher, and E.N. Rosskopf.2008. Vegetable grafting: History, use,and current technology status in NorthAmerica. HortScience 43:1664–1669.
Lee, J.M. 1994. Cultivation of graftedvegetables: Current status, graftingmethods, and benefits. HortScience29:235–239.
Lee, J.M. 2003. Advances in vegetablegrafting. Chron. Horticult. 43:13–19.
Martin, F.N. 2003. Development of al-ternative strategies for management ofsoilborne pathogens currently controlledwith methyl bromide. Annu. Rev. Phyto-pathol. 41:325–350.
802 • August 2010 20(4)
PRODUCTION AND MARKETING REPORTS

Minuto, A. and G. Causarano. 2008. Theadoption of grafted plants in Italy: High-lights and critical aspects. 12 May 2010.<http://mbao.org/2008/Proceedings/127MinutoAandCausaranoG.pdf>.
Noling, J.W. and J.O. Becker. 1994. Thechallenge of research and extension to de-fine and implement alternatives to methyl-bromide. J. Nematol. 26:573–586.
O’Connell, S., M.M. Peet, C.L. Rivard,F.J. Louws, and C.D. Harlow. 2009a.The grafted heirloom tomato system fororganic production in high tunnels: Arethere advantages in the absence of dis-eases? HortScience 44:1056. (Abstr.).
O’Connell, S., S. Hartmann, C.L. Rivard,M.M. Peet, and F.J. Louws. 2009b. Graftingtomatoes on disease resistant rootstocks forsmall-scale organic production. 12 May2010. <http://ofrf.org/funded/highlights/oconnell_07f30.html>.
Oda, M. 1999. Grafting of vegetables toimprove greenhouse production. 12 May2010. <http://www.agnet.org/library/eb/480/>.
Rivard, C.L. and F.J. Louws. 2006. Graft-ing for disease resistance in heirloomtomatoes. 12 May 2010. <http://www4.ncsu.edu/;clrivard/TubeGraftingTechnique.pdf>.
Rivard, C.L. and F.J. Louws. 2008. Graft-ing to manage soilborne diseases in heir-loom tomato production. HortScience43:2104–2111.
Rivard, C.L., F.J. Louws, M.M. Peet, andS. O’Connell. 2008b. High tunnels andgrafting for disease management in or-ganic tomato production. Phytopathol-ogy 98:S133. (Abstr.).
Rivard, C.L., F.J. Louws, S. O’Connell,and M.M. Peet. 2010. Grafting tomato
with inter-specific rootstock provides ef-fective management against diseasescaused by S. rolfsii and southern root-knot nematodes. Plant Dis. 94:1015–1021.
Rivard, C.L., S. O’Connell, M.M. Peet,and F.J. Louws. 2008a. Grafting as a viabletool to manage major tomato diseases inthe southeastern USA. 12 May 2010.<http://mbao.org/2008/Proceedings/061LouwsFGraftingMBAO-08.pdf>.
Sydorovych, O., C.D. Safley, R.M.Welker, L.M. Ferguson, D.W. Monks,K. Jennings, J. Driver, and F.J. Louws.2008. Economic evaluation of methylbromide alternatives for the productionof tomatoes in North Carolina. Hort-Technology 18:705–713.
U.S. Department of Agriculture. 2009.USDA-NASS quick stats. 20 Dec. 2009.<http://www.nass.usda.gov/>.
• August 2010 20(4) 803