production and optimization of citric acids from … · nigeria is a major utiliser of citric acid...
TRANSCRIPT

Ajala et al. World Journal of Engineering Research and Technology
www.wjert.org
187
PRODUCTION AND OPTIMIZATION OF CITRIC ACIDS FROM
CASSAVA PEELS USING ASPERGILLUS NIGER
*Ajala A. S., Olaniyan S. A., Fasonyin O. T. and Adeoye A. O.
Department of Food Science and Engineering, Ladoke Akintola University of Technology,
Ogbomoso, Oyo State.
Article Received on 10/01/2019 Article Revised on 30/01/2019 Article Accepted on 20/02/2019
ABSTRACT
In this study, cassava peels were hydrolyzed using Hydrochloric acid
(HCl) and fermented with Aspergillus niger (LAU111) to get citric
acid. The optimization of the citric acid was carried out using Central
Composite Experimental Design (CCED). Design Expert 6.8 version
was used as software. The variables used for the optimization include:
A- inoculum concentration (7-11 %), B- fermentation time (1-4 days),
C- temperature (23-39 o C) and D-ethanol concentration (0-4 %),. The optimization results
showed that the linear model had good fit with experimental data. Analysis of variance
results showed that the model had R2, adjusted R
2 and predicted R
2 value of 0.8733, 0.8521
and 0.8280, respectively. F-value of the model was 41.34 and this was significant because the
model had the probability chance of 0.0001 of noise. Adequate precision value was as high as
24.37; this was greater than 4 which is the minimum required value. The lowest and highest
values of citric acid recorded were 2.5 and 7.6 g/l. The optimum value of citric acid recorded
was obtainable through the combination factors of inoculum concentration and fermentation
time. Therefore, cassava peels have a good potential to produce enough citric acid needed for
local consumption if properly harnessed. This will reduce the cost of importation into the
country and boost local economy.
KEYWORDS: Cassava-peel, citric acid, energy, cost, enzyme, acid.
wjert, 2019, Vol. 5, Issue 2, 187-199.
World Journal of Engineering Research and Technology
WJERT
www.wjert.org
ISSN 2454-695X Original Article
SJIF Impact Factor: 5.218
*Corresponding Author
Ajala A. S.
Department of Food
Science and Engineering,
Ladoke Akintola University
of Technology, Ogbomoso,
Oyo State.

Ajala et al. World Journal of Engineering Research and Technology
www.wjert.org
188
1. INTRODUCTION
Nigeria is the highest producer of cassava worldwide (FAO, 2008) with approximation of
more than 45 million metric ton yearly (Egesi et al., 2006). Cassava is a root crop which has
peels as the outer cover of the roots and is often removed manually using knives or can be
mechanically peeled by machines. These peels constitute about 15-25% of the roots (Aro et
al., 2010, Fakir et al., 2012). By this estimate, over 9 million metric tons of peels are annually
generated as wastes from processing cassava roots. Most often, these wastes have constituted
an environmental problem and posed challenges to the health of millions of people. The peels
are frequently left to litter the ground or are sometimes spread on the roadside fermenting
making the roads impassable. The wastes are sometimes heaped on dung hills and usually left
to rot away or burnt to create space for the accumulation of more wastes. The wastes emit
carbon dioxide and produce a strong offensive smell (Aro et al., 2008; Adebayo, 2008).
Besides, the wastes constitute a breeding ground for flies and mosquitoes which are carriers
of diseases (Omotosho and Sangodoyin, 2013) and Eze (2010) has linked adverse health
respiratory problems with offensive gas smell emanated from the heaps of cassava peels. This
challenge needs to be overcome by creating a means through which such cassava peels can be
turned into useful products and thereby reducing various cassava waste centres across the
country.
Nigeria is a major utiliser of citric acid in Africa. The production of citric acid in Nigeria is
still at the primitive level and has to depend on importation from other countries. The soared
exchange rate from naira to dollar has brought unpleasant experience to the importers of the
product to the country. Therefore, conversion of cassava peels could be considered a better
alternative because the materials are abundantly available and considered as wastes.
Secondly, local production will go a long way in improving the local technology for
industrial use and economy will also be improved. Therefore, the main objective of this paper
is to produce and optimize citric acids from cassava peels using Aspergillus niger
2. MATERIALS AND METHODS
The following materials were used for the production of citric acid: cassava peels, Sodium
Hydroxide, D-glucose, Calcium chloride, distilled water, Benedict reagent, Sodium carbonate
and Hydrochloric acid.

Ajala et al. World Journal of Engineering Research and Technology
www.wjert.org
189
2.1 Hydrolysis of Cassava Peel Substrates
Fresh cassava peels were obtained from Ladoke Akintola University of Technology
Ogbomoso, Nigeria processing factory. The peels were fermented for three days and dried in
a tunnel dryer at temperature of 60 o
C. The peels were then milled into flour and packaged
for further analysis.
HCl concentrations range from 0.5- 1.5% were prepared and were mixed with 100 ml
distilled water to form solution. About 20 g of cassava peels’ substrates were mixed with the
solution containing the acid. The mixtures were allowed for 2 hrs. for proper mixing to take
place. The substrate obtained was heated at temperature range of 50-100 o C in 20 minutes.
2.2 Solid State Fermentation of Cassava Peels and Inoculation of Aspergillus niger into
Substrates
Conical flask method was used for the solid-state fermentation. Standard experiments was
conducted in 250ml sterilized flask, each containing 20g of treated cassava peels with 60%
moisture level. Samples from previous hydrolyses were used to prepare the citric acid
production experiments. In Central Research Laboratory of Ladoke Akintola University of
Technology, Ogbomoso, a full grown Aspergillus niger was collected. This was further sub
cultured at interval of 7 weeks to obtain pure culture of microbes on potato dextrose agar.
These cultures were incubated at 32 o
C for 72 hours and were then stored on agar slant at 4 o
C until needed. The culture of Aspergillus niger (LAU 111) was added to the substrate within
the range of 7-11 % and ethanol at the range of 0-4 %. The substrate was fermented within 1-
4 days at temperatures 23-39 o C. Citric acid production of each of the samples was done
using titrimetric method and the process was as follows: 10 g of the mixture was dissolved in
100 ml of distilled water and was titrated with NaOH to determine the acidity level using
phenolphthalein as indicator. Table 1 shows the experimental design used for the process.
Design Expert 6.8 was used as software and central composite experimental design was used
for all the experiments. The equation to determine the citric acid concentration in the
substrate is as given in Equation 1
1
Where acid factor =0.061.
Ajala et al. World Journal of Engineering Research and Technology
www.wjert.org
190
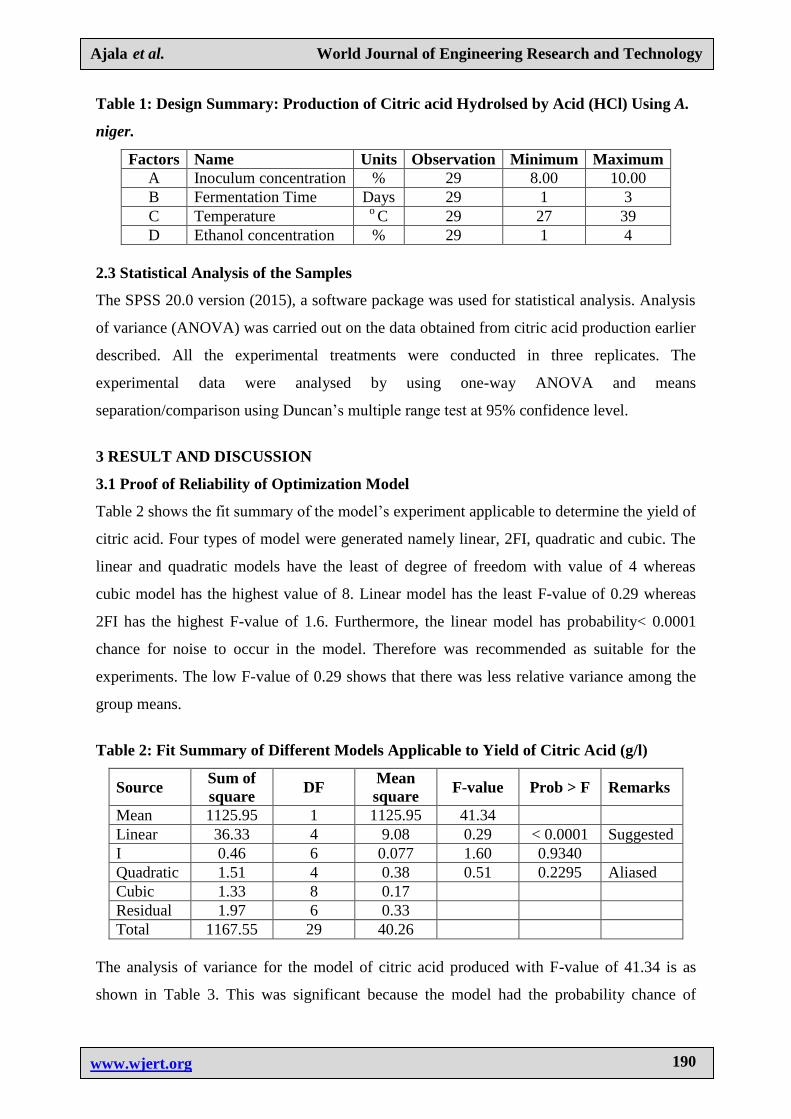
Table 1: Design Summary: Production of Citric acid Hydrolsed by Acid (HCl) Using A.
niger.
Factors Name Units Observation Minimum Maximum
A Inoculum concentration % 29 8.00 10.00
B Fermentation Time Days 29 1 3
C Temperature o C 29 27 39
D Ethanol concentration % 29 1 4
2.3 Statistical Analysis of the Samples
The SPSS 20.0 version (2015), a software package was used for statistical analysis. Analysis
of variance (ANOVA) was carried out on the data obtained from citric acid production earlier
described. All the experimental treatments were conducted in three replicates. The
experimental data were analysed by using one-way ANOVA and means
separation/comparison using Duncan’s multiple range test at 95% confidence level.
3 RESULT AND DISCUSSION
3.1 Proof of Reliability of Optimization Model
Table 2 shows the fit summary of the model’s experiment applicable to determine the yield of
citric acid. Four types of model were generated namely linear, 2FI, quadratic and cubic. The
linear and quadratic models have the least of degree of freedom with value of 4 whereas
cubic model has the highest value of 8. Linear model has the least F-value of 0.29 whereas
2FI has the highest F-value of 1.6. Furthermore, the linear model has probability< 0.0001
chance for noise to occur in the model. Therefore was recommended as suitable for the
experiments. The low F-value of 0.29 shows that there was less relative variance among the
group means.
Table 2: Fit Summary of Different Models Applicable to Yield of Citric Acid (g/l)
Source Sum of
square DF
Mean
square F-value Prob > F Remarks
Mean 1125.95 1 1125.95 41.34
Linear 36.33 4 9.08 0.29 < 0.0001 Suggested
I 0.46 6 0.077 1.60 0.9340
Quadratic 1.51 4 0.38 0.51 0.2295 Aliased
Cubic 1.33 8 0.17
Residual 1.97 6 0.33
Total 1167.55 29 40.26
The analysis of variance for the model of citric acid produced with F-value of 41.34 is as
shown in Table 3. This was significant because the model had the probability chance of

Ajala et al. World Journal of Engineering Research and Technology
www.wjert.org
191
0.0001 of noise. Therefore, the model in Equation 2 can represent the data well in 95%
confidence limit. The lack of fit was not significant, meaning that, the outliers had little effect
on the model. It also shows that the experimental and predicted values have good correlation
as shown in Table 5. Moreover, the high values of R2, adjusted R
2 and predictive R
2 of
0.8733, 0.8521 and 0.8280, respectively, are evidences of reliability of the model. The high
value of adequate precision of 24.37 which is greater than 4 proves further the reliability of
the model. Furthermore, the low value of 7.6 of CV means that the size of the standard
deviation is as low as 7.6% of the size of the mean. This implies that there were small
differences among data. Also, the value of 7.15 for Predicted Residual Error Sum of Squares
(PRESS) in the table is satisfactory with the model. PRESS value is to cross-validate data for
regression analysis to provide a summary measure of the fit of a model to a sample of
observations (Shu-Ping, 2016). Since lack of fit is not significant, then the model is reliable.
Citric acid =6.22+1.19 A+0.19B -0.056C+ 0.17D 2
Table 3: Analysis of Variance for Yield of Citric Acid Using Linear Model.
Source Sum of
square DF
Mean
square
F-
value Prob > F Remarks
Model 36.33 4 9.08 41.34 < 0.0001 Significant
A 33.50 1 33.50 152.51 < 0.0001
B 0.90 1 0.90 4.08 0.0546
C 0.075 1 0.075 0.34 0.5655
D- 0.69 1 0.69 3.12 0.0898
Residual 5.27 24 0.22
Lack of
fit 3.96 19 0.21 0.80 0.6762 Not Significant
Pure
Error 1.31 5 0.26
Cor.
Total 41.60 28
Std Dev Mean CV Press R2 Adj-R
2 Pre R
2
Adequate
Precision
0.47 6.23 7.52 7.15 0.8733 0.8521 0.8280 24.37
Table 4 shows the coefficient of the models for the yield of citric acid, factor A (inoculum
concentration) has the highest coefficient with the value of 1.19 while C has the lowest value
of -0.056. This was translated into equation and is as written in Equation 2. The values of
Variance Inflation Factor (VIF) are as presented in the table. The minimum and maximum
value are 1.01 and 1.02, respectively. The low value of VIF indicates good multicollinearity
in the model.

Ajala et al. World Journal of Engineering Research and Technology
www.wjert.org
192
Table 4: Estimated Coefficients for the Models for the Yield of Citric Acid (g/l).
Factor Coefficient Estimate Standard error 95% C.I Low 95% C.I High VIF
Intercept 6.22 0.087 6.04 6.40 -
A 1.19 0.096 0.99 1.38 1.01
B 0.19 0.096 -4.1E-03 0.39 1.01
C -0.056 0.096 -0.25 0.14 1.01
D 0.17 0.097 -0.029 0.37 1.02
Table 5: Diagnostics Case Statistics for Citric Acid Experiements.
Runs Actual value Predicted values Residuals Outliers
1 5.10 4.72 0.38 0.886
2 7.70 7.10 0.60 1.478
3 5.30 5.11 0.19 0.441
4 7.80 7.48 0.32 0.756
5 5.20 4.61 0.59 1.434
6 7.10 6.98 0.12 0.275
7 5.10 5.00 0.100 0.236
8 7.90 7.71 0.19 0.430
9 5.10 5.07 0.033 0.078
10 7.80 7.44 0.36 0.860
11 5.40 5.45 -0.055 -0.129
12 8.10 7.83 0.27 0.641
13 5.10 4.95 0.15 0.340
14 7.70 7.33 0.37 0.882
15 5.10 5.34 -0.24 -0.568
16 8.10 7.71 0.39 0.905
17 3.80 3.85 -0.048 -0.112
18 7.80 8.59 -0.79 -2.006
19 5.30 5.83 -0.53 -1.285
20 6.80 6.61 0.19 0.453
21 6.40 6.33 0.069 0.161
22 6.40 6.11 0.29 0.692
23 5.30 5.88 -0.58 -1.419
24 6.40 6.56 -0.16 -0.378
25 5.40 6.22 -0.82 -1.869
26 5.30 6.22 -0.92 -2.140
27 5.40 6.22 -0.82 -1.869
28 6.40 6.22 0.18 0.386
29 6.40 6.22 0.18 0.386
3.2 Effect of Input Parameters on the Yield of Citric Acid Using Interactive Graphs
The yield of citric acid as affected by fermentation time and innoculum concentration is as
shown in Figure 1. Inoculum concentration which ranged from 8 to 10 % of the broth played
a significant role in the production of citric acid than fermentation time as displayed by the
slope of the figure. The values of citric acid produced ranged from 3.8 to 7.6 g/l and are

Ajala et al. World Journal of Engineering Research and Technology
www.wjert.org
193
significantly different as shown in Table 6. The values were lesser than those reported by
Adeoye et al. (2015) but in the same range with those reported by Rivas et al., (2008).
Furthermore, Adeoye et al. (2015) reported the influence of fermenting time on the
production of citric acid, the ferment times used were between 84 and 114 hours to get
considerable amout of citric acid range 16.1-88.73 g/l. However, in the present study, the
maximum time used was 72 hours. Also, Bekir et al. (2009) observed that incraese in
fermentation period up to 7 days increased citric acid production and then decreased
afterward. The reason for the decrease in citric acid after 7 day was due to the depletion in
sugar content of the substrates (Ali et al., 2002).
DESIGN-EXPERT Plot
g/l acid
X = A: organism conc
Y = B: fermentation time
Actual Factors
C: temperature = 31.00
D: ethanol conc = 2.00
4.8
5.5
6.2
6.9
7.6
Citr
ic ac
id (g
/l)
8.0
8.5
9.0
9.5
10.0
1.0
1.5
2.0
2.5
3.0
Inoculum conc. (%)
Time (day)
Figure 1: Effect of Fermentation Time and Inoculum Concentration on the Yield of
Citric Acid.
The yield of citric acid as affected by temperature and fermentation time is as shown in
Figure 2. The maximum value of citric acid produced was 6.5 g/l while the minimum was 5.8
g/l and were significantly different as shown in Table 6. The value is greater than the values
reported by Anbuselvi (2015) which was 0.76 g/l. The reason for the lower value in his work
could be due to different carbon source the author used. The increase in temperature did not
significantly increased the production of citric acid in this study as shown in the figure. This
was earlier observed by Bekir et al., (2009), that increase in temperature above 30 o C would
not increase the production of citric acid but rather decrease it.

Ajala et al. World Journal of Engineering Research and Technology
www.wjert.org
194
The effect of ethanol and inoculum concentration on the production of citric acid is as
displayed in Figure 3. The values ranged from 3.32 to 7.57 g/l and significantly different as
shown in Table 6. The values were greater than those values reported by Mansor et al.,
(2017) in which date-extract byproduct was used to produce citric acid. The effect of ethanol
on citric acid production has been studied by researchers; Hauka et al., (2005) reported that
addition of ethanol slightly boosted citric acid production up to 33.61g/l whereas the
experiment without ethanol was 33.05 g/l. Rugsaseel et al. (1995a) discovered that addition
of methanol changed the activity of some enzyme relating to citric acid cycle and thereby
increased the production of citric acid. Ethanol also prevents spore formation on the cell
thereby allowing cell to secret citrate into the solution which favoured the production of citric
acid (Hauka et al. , 2005). Also, Ana et al. (2011) also observed that adddition of methanol
was detrimental to the production of citric acid in solid state fermentation of orange peels.
Mannomani and Sreekantiah (1987) observed that addition of ethanol to substrate in citric
acid production provided two fold activities; it doubles citrate activities and reduces aconitase
activity by 75%. Furthermore Ogbonnaya (2015) observed that addition of methanol up to
3% produced 7.8 g/l whereas 4% methanol addition decreased the value to 7.1 g/l. Further
increase of methanol to 5% dropped the citric acid vale to 4.9 g/l. Therefore, it could be
deduced that addition of methanol/ethanol must not exceed 4% to get sufficient citric acid.
DESIGN-EXPERT Plot
g/l acid
X = A: fermentation
Y = B: temperature
Actual Factors
C: org conc = 9.00
D: ethanol conc = 2.00
6.0
6.1
6.2
6.3
6.5
Citr
ic ac
id (g
/l)
1.0
1.5
2.0
2.5
3.0
27
29
31
33
35
Time (day)
Temperarure (o C)
Figure 2: Effect of Temperature and Fermentation Time on the Yield of Citric Acid.

Ajala et al. World Journal of Engineering Research and Technology
www.wjert.org
195
DESIGN-EXPERT Plot
g/l acid
X = A: organism conc
Y = B: ethanol conc
Actual Factors
C: temperature = 31.00
D: fermentation = 2.00
4.86
5.54
6.22
6.90
7.58
C
itric a
cid
(g/l)
8.00
8.50
9.00
9.50
10.00
1.00
1.50
2.00
2.50
3.00
Inoculum conc. (%)
Ethanol conc. (%)
Figure 3: Effect of Ethanol and Inoculum Concentration on the Yield of Citric Acid.
Factors of temperature and inoculum concentration were used to produce citric acid as shown
in Figure 4. The minimum and maximum values of citric acid produced were 2.5 and 7.5 g/l,
respectively and were significantly different as shown in Table 6. These values were greater
than those reported by Chirova et al., (2016) using potato and rice extracts. Increase in
inoculum concentration was observed to have produced more citric acid as shown in the
inclined sharp slope of the figure than increase in temperature with a mild slope in the figure.
This suggests that inoculum concentration had a predominant effect on the production of
citric acid in this study. As inoculum concentration increased up to 10%, the value of citric
acid increased, but further increase in inoculum concentration would not further increase the
citric acid as Adeoye et al. (2015) noted that increase in inoculum size above 8% decreased
the production of citric acid. This is because increase in population of Aspergillus niger led to
competition due to insufficient substrate from the organisms thus led to the reduction in citric
acid.

Ajala et al. World Journal of Engineering Research and Technology
www.wjert.org
196
DESIGN-EXPERT Plot
g/l acid
X = A: organism conc
Y = B: temperature
Actual Factors
C: fermentation = 2.00
D: ethanol conc = 2.00
5.0
5.6
6.2
6.8
7.5
Citr
ic ac
id (g
/l)
8.0
8.5
9.0
9.5
10.0
27
29
31
33
35
Inoculum conc. (%)
Temperature (o C)
Figure 4: Effect of Temperature and Inoculum Concentration on the Yield of Citric
Acid.
4. CONCLUSION
From the study, linear model has good fit for the modelling of citric acid; the values of R2 is
as high as 0.8733 and the lack of fit is not significant. Inoculum concentration played a major
role in the conversion of cassava peels to citric acid more than other factors. The high value
of adequate precision also proves the reliability of model. Inoculum concentration has the
highest coefficient in the model. The actual values are close to predicted values in the
diagnostic case statistics. The highest value of 7.6 g/l citric acid was achievable using
combination factors of inoculum concentration and time while the lowest value was 2.5 g/l
citric acid was achieved using combination factors of inoculum concentration and
temperature.

Ajala et al. World Journal of Engineering Research and Technology
www.wjert.org
197
Table 6: Production of citric acid.
Coded Factors Actual Factors
Runs A (%) B
(days)
C
(oC)
D
(%)
A
(%)
B
(days)
C
(oC)
D
(%)
Citric
acid (g/l)
1 1 -1 -1 -1 10.00 1 27 1.00 4.7±0.91b
2 -2 0 0 0 7.00 2 31 2.00 3.8±0.61a
3 2 0 0 0 11.00 2 31 2.00 7.8±2.01g
4 -1 -1 1 1 8.00 1 35 3.00 5.1±0.71b
5 0 0 0 -2 9.00 2 31 0.00 5.3±0.15c
6 1 1 -1 1 10.00 3 27 3.00 4.3±0.73b
7 -1 1 1 1 8.00 3 35 3.00 5.1±0.83b
8 0 0 0 0 9.00 2 31 2.00 5.3±0.83c
9 1 1 1 1 10.00 3 35 3.00 8.1±1.11i
10 -1 -1 1 -1 8.00 1 35 1.00 5.2±0.13c
11 -1 -1 -1 -1 8.00 1 27 1.00 5.11±0.33b
12 0 0 0 0 9.00 2 31 2.00 5.42±0.89c
13 1 1 1 1 10.00 3 35 3.00 7.91±0.97g
14 -1 1 -1 1 8.00 3 27 3.00 5.42±0.66c
15 0 0 0 2 9.00 2 31 4.00 6.41±0.56d
16 1 -1 -1 1 10.00 1 27 3.00 7.80±0.67g
17 0 0 0 0 9.00 2 31 2.00 5.47±0.81i
18 1 1 -1 -1 10.00 3 27 1.00 7.85±1.03g
19 0 -2 0 0 9.00 1 31 2.00 5.31±0.33h
20 1 -1 1 -1 10.00 1 35 1.00 7.14±0.56f
21 -1 -1 -1 1 8.00 1 27 3.00 5.13±0.46h
22 1 -1 1 1 1.00 1 35 3.00 7.72±0.51g
23 0 0 2 0 9.00 2 39 2.00 6.43±0.71d
24 0 0 0 0 9.00 2 31 2.00 6.43±0.69d
25 0 0 0 0 9.00 2 31 2.00 6.42±0.48d
26 -1 1 1 -1 8.00 3 35 1.00 5.15±0.51b
27 0 2 0 0 9.00 4 31 2.00 6.82±0.54e
28 0 0 -2 0 9.00 2 23 2.00 6.44±0.54d
29 -1 1 -1 -1 8.00 3 27 1.00 5.32±0.84c
Key: A – Inoculum concentration (%); B- Fermentation time (days); C- Fermentation
temperature (o C), D- Ethanol concentration (%).
5. ACKNOWLEDGMENT
This research work was supported by a scholarship to Ajala, A.S. by Tertiary Education Trust
Fund, Nigeria.
6. REFERENCES
1. Adebayo, A. O., Using cassava waste to raise goats. Project 2008-4345. World Bank
Development Market place found at http://wbi.worldbank.org/ developmentmarket
place/idea/using-cassava-waste-raise-g, 2008.

Ajala et al. World Journal of Engineering Research and Technology
www.wjert.org
198
2. Adeoye, A.O., Lateef, A. and Gueguim-Kana, E.B. Optimization of citric acid production
using a mutant strain of Aspergillus nigeron cassava peel substrate. Biocatalysis and
Agricultural Biotechnology, 2015; 4: 568-574.
3. Ali, S.; Ashraf, H.; Ikram, U. Enhancement in citrate production by alcoholic
limitation. Journal of Biological Science, 2002; 2: 70-72.
4. Anbuselvi, S. Optimization and production of citric acid from cassava using Aspergillus
niger. Der Pharmacia Lettre, 2015, 7(10): 270-272.
5. Aro, S. O., Aletor, V. A., Tewe, O. O.and Agbede, J. O. Nutritional potentials of cassava
tuber wastes: A case study of a cassava starch processing factory in south-western
Nigeria. Livestock Research and Rural Development, 2010; 22(11): 1-10.
6. Bekirs. Ç., Ergin, K. and Harun,Ç. Effects of Fermentation conditions on citric acid,
production from beet molasses by Aspergillus niger. Asian Journal of Chemistry, 2009;
21(4): 3211-3218.
7. Chirova, T.K., Kumar, A. and Panwar, A. Citric acid production by Aspergillus niger
using different substrates. Malaysian Journal of Microbiology, 2015; 12(3): 199-204.
8. Egesi, C., Mbanaso, E., Ogbe, F., Okogbenin, E. and Fregene, M. Development of
cassava varieties with high value root quality through induced mutations and marker-
aided breeding. NRCRI, Umudike Annual Report, 2006; 2006: 2-6.
9. Eze, J. I. Converting cassava (Manihot spp) waste from gari processing industry to energy
and bio-fertilizer. Global Journal of Researches in Engineering, 2010; 10(4): 113-117.
10. Fakir, M.S.A., Jannat, M., Mostafa, M.G. and Seal, H. Starch and flour extraction and
nutrient composition of tuber in seven cassava accessions. Journal of Bangladesh
Agricultural Universal, 2012; 10(2): 217–222.
11. FAO, Corporate Document Repository. [Online]. The impact of HIV/AIDS on the
agricultural sector.:://www.fao.org/DOCREP/005/Y4636E/y4636e05.htm Fakir et al,
2012.
12. Hauka, F. I. A., El-Sawah, M. M. A., Kassem, M. M. and El-Kady, S. M. Some factors
affecting citric acid production from sugar cane molasses by Aspergillus niger.
Proceeding of the 2nd Arab Mansoura Conference on Food and Dairy Science &
Technology, 2005; 20-30.
13. Manonmani, H. K. and K. R. Sreekantiah Studies on the conversion of cellulose
hydrolysate into citric acid by Aspergillus niger. Process Biochemistry, 1987; 22: 92-94.
14. Mansor, S. Mostafa, B., Kutaiba, I.A., Ünal, S. and Karadeniz, M. An experimental study
on citric acid production by Aspergillus niger using Date extract by-product as a

Ajala et al. World Journal of Engineering Research and Technology
www.wjert.org
199
substrate. International Journal of Science and Research Methodology Human, 2017;
6(3): 52-64.
15. Ogbonnaya, N. Studies on the production of citric acid by Rhizopus stolonifer. American
Chemical Science Journal, 2015; 6(4): 205-212.
16. Omotosho, O. A. and Sangodoyin, A. Y. Production and utilization of cassava peel
Activated carbon in treatment of effluent from cassava processing industry. Water
Practice and Technology, 2013; 8(12): 215-224.
17. Rivas, B., Torrado, A., Torre, P., Converti, A. Domínguez, J.M. Submerged citric acid
fermentation on orange peel auto-hydrolysate. Journal of Agriculture and Food
Chemistry, 2008; 56: 2380-2387.
18. Rugsaseel, R., S. Morikawa, K. Kirimura and S. Usami. Stimulation of citric acid
production in Aspergillus niger by addition of viscous substances in shake culture. Appl.
Microbiol. Biotechnol, 1995; 42: 839-843.
19. Rugsaseel, R., Morikawa, S. Kirimura, K. and Usami, S. Stimulation of citric acid
production in Aspergillus niger by addition of viscous substances in shake culture.
Applied Microbiological Biotechnology, 1995; 42: 839-843.
20. Shu-Ping, H. Develop PRESS for non-linear equations. Paper presented at the ICEAA
professional development and training workshop, available at www.iceaaonline.com/
atlanta2016, 2016.