production data and annual report, short version data and annual report, short version quartz...
TRANSCRIPT

Publication no. 2 2010
MINERAL RESOURCES IN NORWAY 2009
Production data and annual report, short version

Quartz production from Norwegian Crystallites, AS. Drag in Tysfjord commune, Nordland. Photo: Gemini

3
Foreword 4
1. Abstract 5
2. Introduction 7
3. Web sites and databases 9
4. Developments in the mining and quarrying industry 11
5. Mining and quarrying industry in 2009 13
Appendix:Tables 1 - 14 14-23
TABLE OF CONTENTS
Outside cover: Larvikite production, Larvik, Vestfold.Photo: Lundhs AS

4
FOREWORD
This report on industrial mineral production was prepared by the Geological Survey of Norway (NGU) and the Directorate of Mining with the Commissioner of Mines at Svalbard (DMF) based on the mining industry’s own production and sales fi gures for 2009.The response deadline was set at May 28th , 2010.
In all, 1060 producing quarries/mines have submitted data on the various types of mineral resource, as presented in a number of fi gures and tables in the report. Compared to previous reports ”Norwegian mineral production” from the Directorate of Mining and ”Mineral resources in Norway” from NGU, the results presented here for 2009 have never been better, even though production data from a number of smaller deposits are still lacking.
The mineral production data for 2009 have been compiled by Peer-Richard Neeb, Gunn Sandvik, Knut Riiber and Geir Strand (NGU) and by Peter J. Brugmans and Brit Kaasbøll DMF. The fi gures have been prepared by Arnhild Ulvik and Helge Hugdahl, NGU.
Trondheim 10.12.2010
Morten Smelror Per Zakken BrekkeDirector Commissioner of Mines, Geological Survey of Norway Directorate of Mining with Commissioner of Mines at Svalbard
5
1. ABSTRACT
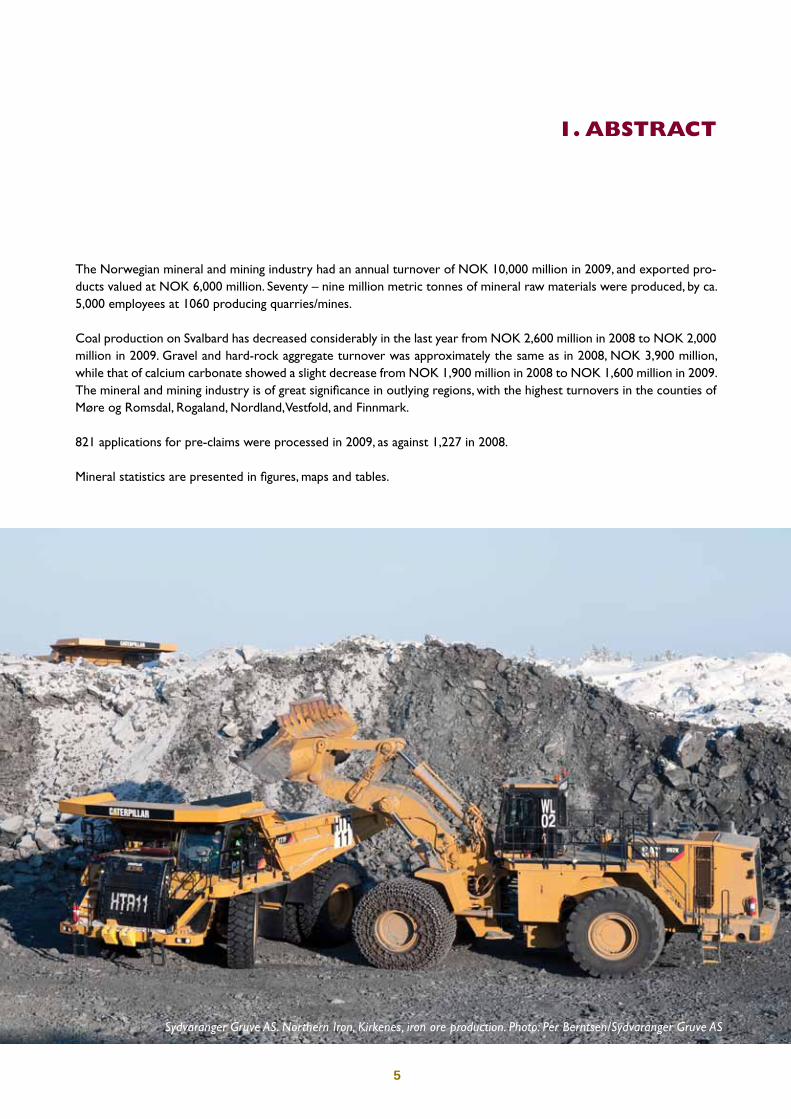
The Norwegian mineral and mining industry had an annual turnover of NOK 10,000 million in 2009, and exported pro-ducts valued at NOK 6,000 million. Seventy – nine million metric tonnes of mineral raw materials were produced, by ca. 5,000 employees at 1060 producing quarries/mines.
Coal production on Svalbard has decreased considerably in the last year from NOK 2,600 million in 2008 to NOK 2,000 million in 2009. Gravel and hard-rock aggregate turnover was approximately the same as in 2008, NOK 3,900 million, while that of calcium carbonate showed a slight decrease from NOK 1,900 million in 2008 to NOK 1,600 million in 2009.The mineral and mining industry is of great signifi cance in outlying regions, with the highest turnovers in the counties of Møre og Romsdal, Rogaland, Nordland, Vestfold, and Finnmark.
821 applications for pre-claims were processed in 2009, as against 1,227 in 2008.
Mineral statistics are presented in fi gures, maps and tables.
Sydvaranger Gruve AS. Northern Iron, Kirkenes, iron ore production. Photo: Per Berntsen/Sydvaranger Gruve AS

6
CONCRETE- LIMESTONE/CEMENT SAND/GRAVEL
SAND/GRAVEL
SCHIST
QUARTZ
GRANITE
NATURAL STONE
LARVIKITE
Ice cream: TITANIUM DIOXIDE
WEARING COURSE
COVER}
�WEIGHT FILLER
CONCRETE SLEEPERS FROM LIMESTONE/
CEMENT SAND/GRAVEL
SAND/GRAVEL
AGGREGATE
AGGREGATE
AGGREGATE AGGREGATE
FILTERLAYER
BASE
BASEMENT
Minerals A/S
CONCRETE LIMESTONE/CEMENT SAND/GRAVEL
ALUMINIUM STEEL, TITANIUM
BRICKS FROM CLAY AND OLIVINE
A/S CONCRETE A/S CONCRETE
LIGHTWEIGHT FILLER
(ASPHALT, AGGREGATE OR GRAVEL)
LECA
Light bulb:QUARTZ
Car/train: IRON
ALUMINIUM LEAD,COPPER
ZINC MAGNESIUM
SAND
Glas: FELDSPAR
NEPHELINE SYENITE QUARTZ
Rubber: DOLOMITE LIMESTONE
TALC GRAPHITE
Paintwork: LIMESTONE
TALC MICA
TITANIUM DIOXIDE FROM ILMENITE
RUTILE
BASE COURSE
BEDROCK
TILL TILL
SAND/GRAVEL
OR
LECA
OR
FINE AGGREGATE
LECA SAND/GRAVEL AGGREGATE
TIGHT WEIGHT FILLER
IRON HEMATITE
BEDROCK
SAND LECA/CLAY ROCKWOOL
ROOFING SLATE
CONCRETE ROOFTILES
Paper: LIMESTONE DOLOMITE TITANIUM
TALC KAOLIN
Paint: LIMESTONE
TALC,KAOLIN TITANIUM
FROM ILMENITE/RUTILE
Pencil: GRAPHITE
CLAY
Tiles:
PC: COPPER
Floor:
MARBLE
Porcelain: LIMESTONE NEPHELINE SYENITE DOLOMITE
Peer R. Neeb 2006
Environmental liming
Limestone:LIMESTONEDOLOMITE
ANORTHOSITE FELDSPAR
Everyday use of mineral resources.
Export value(mill. 2008 NOK)

7
2. INTRODUCTION
The mineral and mining industry comprises companies involved in extraction and processing of minerals and rocks, from bedrock and/or superfi cial deposits. Five main groups of materials can be distinguished:
Industrial minerals (e.g. calcium carbonate rock (marble and limestone), olivine, nepheline syenite, quartz and dolomite) Natural and dimension stone (e.g. larvikite, granite, marble, slate/fl agstone and building stone) Building materials (sand, gravel, hard-rock aggregate, rock for ballast and clay) Metallic ores (e. g. iron, nickel, molybdenum and ilmenite - titanium) Energy minerals (e. g. coal and peat)
All of the above materials are essential for every-day life: modern society cannot exist without using mineral raw materials such as iron ore for production of steel, limestone for cement and paper, aggregate for road-building, sand and gravel for concrete, and coal for metallurgical processes and for energy production. Per capita annual consumption of minerals and mineral products in 2009 amounted to 12 metric tonnes, which over an average life-time, adds up to c. 1.000 tonnes/person.
Initially, production data from mineral producers were collected by the Directorate of Mining (DMF) and the Geological Survey of Norway ( NGU) and were published annually in ’Norway’s mining production’ and ’Mineral resources in Norway’, respectively. Since 2006, the annual overview has been published in collabora-tion between NGU and DMF. The primary goals in publishing mineral production data include:
To demonstrate the importance of the mineral industry to the Ministry of Trade and Industry, to other minis-tries and public authorities and to the general public.
To assist county and local authorities, and industry in ensuring optimal land-use planning, including appro-priate attention to mineral reserves in production and to resources which may be important in the future.
To provide an up-to-date annual overview of the mineral industry by the end of June the following year.
NGU and the Directorate of Mining have compiled the overview of mineral production data based on the response to enquiries to producers. The producers of gravel and aggregate contacted are mainly taken from the NGU Gravel and Aggregate Database, and from lists of producers registered in the Directorate of Mining database.
Where fewer than three companies are involved, NGU and the DMF have come to an agreement with the producers on how the fi gures can be presented in fi gures and tables. Data on total production tonnage, an-nual turnover and employment are given priority. Data on health, environment and safety are presented in a specifi c table. Data on mineral resources of national importance have been collated by NGU and are revised annually.
Peer-Richard Neeb, Team leaderNGU
Peter Johannes Brugmans, Senior EngineerDMF

www.ngu.no
www.dirmin.no
www.prospecting.nowww.ngu.no/grusogpukk
www.ngu.no/kart/mineralressurser
Mineral resource web sites

9
3. WEB SITES AND DATABASES
Overview of the number of Norwegian mineral deposits for which NGU has information which is adapted for internet access.
Resource type Adapted for internet access
Industrial Minerals 2319Metals 4566Natural stone 1167Aggregates 1661Sand/gravel 9205
Total 18918
Overview of the Directorate ofMinings information
Valid pre-claims:
4047
Number of areas reserved forresource extraction in municipal:
2314
NGU maintains and continuously expands its national databases on Norway’s mineral resources. Data on sand and gravel, hard-rock aggregate, natural stone, ore and industrial mineral deposits are all freely accessible at www.ngu.no, under the links: Resources and maps & data.
DMF’s web site (www.dirmin.no) gives information on the Directorate as such and about the mining industry and related activity. The site also provides information on relevant regulations and has links to the actual law texts. The site also has information on mining on Svalbard and the regulations which apply there.
NGU and the DMF have developed an English-language internet portal (www.prospecting.no) in order to provide access to geological maps and data on deposits of industrial minerals, ores and natural stone, and data on mining claims and protected areas, etc. The site provides an overview of approved claims and pre-claims, with the exception of older claims according to legislation pre-1972 and applications being processed but not yet approved.The overview is updated every Monday.
NGU has developed an overview of mineral resources of national signifi cance. These are deposits which have a substantial value, and which must be given appropriate attention in land-use planning processes.

!(
!(
!(!(
!( !(
!(
!(
!(
!(
!(
!(
#*#*
#*#*
#*
#*
#*
#*
#*
#*
#*
#*
#*
#*
#*
#*
#*
#*
#*
#*#*
#*
!(
!(
!(
!(
!(!(
!(!(
!(
!(!(
!(
!(
!(
!(
!(!(
!(
!(
!(
!(
!(!(
!($+$+
$+
$+
$+
$+
$+
$+$+
$+
$+
$+
$+
$+
$+
")
")
#*
#*
#*
#*
#*
#*
#*
!(
#*
!(
")
!(
#*
#*
#*
#*
#*
#*
#*
#*
10
coalcoal
coal
Reference:
Producers and NGU
June 2010
P.R.N.

11
4. DEVELOPMENTS IN THE MINING AND QUARRYING INDUSTRY
Production of Norway’s most important mineral productsValues in mill. NOK (2009)
The past 30 years have seen substantial structural changes in the industry. Production of metallic ores has experienced a heavy reduction while production of industrial minerals has increased considerably and produc-tion of natural stone has increased moderately, whereas production of sand and gravel and hard rock- aggregate has increased signifi cantly in the last year. Coal production on Svalbard has decreased last year.
Twenty years ago the state was a major owner in the mining industry, especially in metal mining, through its ownership of Norsk Jernverk/Rana Gruber and AS Sydvaranger and its subsidiaries. The state, after the sale of AS Olivin, no longer has ownership in the mineral industry on mainland Norway. Most of the large, export-oriented companies in the mineral industry today are partly or wholly owned by international companies. At current rates, the total production value of the mining and quarrying industry has seen approximately the same positive development as other land-based industries in recent years. The mineral and mining industry is capital intensive, requiring a higher investment per employee than industry in general.
Approximately 60% of the total mineral production (calculated on the basis of turnover) is exported, and thedomestic share of production is the basis for an important mineral processing industry. Profi tability varies between different branches throughout the industry, and between individual companies within each branch.

204
756
1648
613
281
3314
20083149
471
230
269
8273
65
NEPHELINE SYENITE
SLATE/ FLAGSTONE
DOLOMITE
PEAT
BUILDING STONE
NICKEL
FELTSPAR
460
IRON
GRAPHITE
CLAY
259
Construction materials
Industrial minerals
Natural stone
Metallic ores
Total 10038 mill.kr
Coal and peat
COAL
CARBONATE
SAND AND GRAVEL
AGGREGATE
PRODUCTION OF NORWAY’S MOST IMPORTANTMINERAL PRODUCTS
(2009, FOB MILL NOK)Total 10.4 BILLION NOK
ILMENITE
NATURAL STONE
OLIVINE
QUARTZ- QUARTZITE
TALCMOLYBDENUM16
Reference: Producers and NGU/Directorate of MiningMay 2010P. R.N./ P. J.B.
2
DIRECTORATE OF MININGWITH COMMISSIONER OF MINES AT SVALBARD
3911 mill.kr
2466 "
2081 "
810 "
770 "
352
259
426
95
49
78
23 2
623
OLIVINE
141
108
NEPHELINE SYENITE
304
DOLOMITE
TALC
MOLYBDENUM
440
QUARTZ-QUARTZITE
FELTSPAR
72
43CLAY
PEAT
BUILDING STONE
GRAPHITE
1667
COAL
SLATE/ FLAGSTONE
ILMENITE/ NICKEL
EMPLOYEES IN THE MINERAL INDUSTRY2009
IRON
18
SAND AND GRAVEL
AGGREGATE
NATURAL STONE
Construction materials 2362
Industrial minerals 900
Metallic ores 604
Coal and peat 469
Natural stone 641
Total 4976
CARBONATE
250
27
Reference: Producers and NGU/Directorate of MiningMay 2010P. R.N./ P. J.B.
DIRECTORATE OF MININGWITH COMMISSIONER OF MINES AT SVALBARD
STEINSTEIN
13.0
PRODUCTION OF NORWAY’S MOST IMPORTANT MINERAL PRODUCTS
(2009, MILL. METRIC TONNES)
51.4
NEPHELINE SYENITE
SLATE/ FLAGSTONE
BUILDING STONE
NICKEL
DOLOMITE
QUARTZ/ QUARTZITE
FELDSPAR
PEAT
1.30.90
IRON0.67
0.55
0.23
0.0080.00001
GRAPHITE0.005
2.4
0.220.078
0.31
0.048
0.29
0.27
0.77
ILMENITE
NATURAL STONE
6.2
TALC MOLYBDENUM
CLAY
Construction materials
Industrial materials
Metallic ores
Natural stone
Total 78.66 mill. tonn
Coal and peat
0.002
COAL
OLIVINE
CARBONATE
SAND AND GRAVEL
AGGREGATE
64.65 mill. tonn
9.09 "
2.73 "
1.57 "
0.62 "
Reference: Producers and NGU/Directorate of MiningMay 2010P. R.N./ P. J.B.
DIRECTORATE OF MININGWITH COMMISSIONER OF MINES AT SVALBARD
386386
9292
581581
180180
269269505505
236236189189 166166
152152
1841843434136136273273
178178
73733535702702
181181
EMPLOYEES IN THE MINERAL INDUSTRY BY COUNTIES
2009: 4976 employed,
and at Svalbard 426
June 2010
Reference: Producers and NGU/Directorate of MiningMay 2010P. R.N./ P. J.B.
DIRECTORATE OF MININGWITH COMMISSIONER OF MINES AT SVALBARD
12

13
5. MINING AND QUARRYING INDUSTRY IN 2009
Extraction of various mineral resources:79 million tonnes
Production value:10.000 million NOK
Export:6.000 million NOK60 per cent
Number of aggregates companies:927
Other companies:132
Number of employees:5000
General overview
Approximately 79 million tonnes of mineral resources were extracted in Norway in 2009, representing a total value of NOK 10,000 million. Turnover of industrial minerals was decreased from 2008 to 2009 from NOK 2,900 million to NOK 2,400 million and turnover of natural stone was also decreased from NOK 900 million to NOK 800 million. Turnover of metallic ores decreased from NOK 900 to NOK 600 million. Turnover of gravel and hard-rock aggregate for the building industry was unchanged at NOK 3,900 million in 2009.Turnover of coal decreased from NOK 2,700 to NOK 2,000 million, and of peat from NOK 77 to NOK 67 million.
The total export value for the industry in 2009 was NOK 6,000 million, representing 60 % of the overall turnover.The export value for industrial minerals was NOK 2,200 million, of which calcium carbonate slurry, olivine and nepheline syenite are the most important products. The natural stone industry exported stone blocks for NOK 440 million (of which NOK 407 million relates to larvikite), and slate/fl agstone and building stone for NOK 70 million. Similar data for hard-rock aggregate, rock for ballast and gravel indicate an export value of NOK 767 million, whereas exports from ore production amounted to NOK 597 million, consisting of ilmenite, iron and nickel. Finally, export of coal to Europe represented a value of NOK 1,900 million.
The mining and quarrying industry is a typical regional industry, especially strongly represented along the coast. The industry gives employment to about 5,000 full-time employees at a total of 1060 producing quarries/mines. Measured ac-cording to turnover, the most important mineral-producing counties are Møre og Romsdal, Rogaland, Nordland, Vestfold and Finnmark.
The individual products are shown collectively and according to the producing county in Tables 1 - 14.

Norwegian Crystallites AS, Drag in Tysfjord commune. Photo: Gemini

INDUSTRIAL MINERALS
Industrial minerals are defi ned as mineral and rocks with economic value,
which are produced because of their non-metallic, physical and chemical pro-
perties, except for fossil fuels, water and gemstones. Industrial minerals are
used in many products, such as fi ller in paint, paper and plastic and as major
constituents in ceramics, glass and cement.
NATURAL STONE
Natural stone is defi ned as all stone that can be cut, split or hewn into slabs or
blocks for outside use, as building material, and for ornamental or decoration
purposes. There is further distinction between slate/fl agstone and dimension
stone. Slate/fl agstone comprises a group of rock types, which have a naturally
occurring platy cleavage. Common types of slate/fl agstone include shale, phyl-
lite, mica schist, and fl agstone. Dimension stone is extracted as large blocks,
which are then sawn or cleaved into slabs or other forms. Important types of
dimension stone include larvikite, marble, granite, limestone and sandstone.
Building stone is produced from slate, fl agstone, gneiss and granite which can
be cleaved along a plane of schistosity.
CONSTRUCTION MATERIALS
These materials include sand, gravel, hard-rock aggregate and clay. Sand and
gravel are terms used interchangeably for surfi cial materials used in building
and construction. Particle size fraction determines the nomenclature used in
a geological context: 0.06-2 mm sand, 2-64 mm gravel, and 64-256 mm is de-
signated as stone.
HARD-ROCK AGGREGATE
The most common rock types suitable for production of hard-rock aggregate
include: gneiss, granite, quartzite, gabbro, sandstone and syenite.
METALLIC ORES
Metallic ores comprise all rock types containing minerals and metals with a
specifi c gravity higher than 5 g/cm3 occurring in large enough amounts to make
extraction economically feasible. Norway has a long-standing tradition of ore
extraction, dating back to the1600s, with Røros (copper) and Kongsberg (sil-
ver) among the best-known historical mining centres.
ENERGY MINERALS
Energy minerals comprise all rock types and minerals that release energy on
combustion coal, which occurs on Svalbard, and peat, found throughout Nor-
way, belong here. Coal is used in the metallurgical industry and in the manufac-
ture of cement. Peat is mainly used in gardening and in agriculture.

17
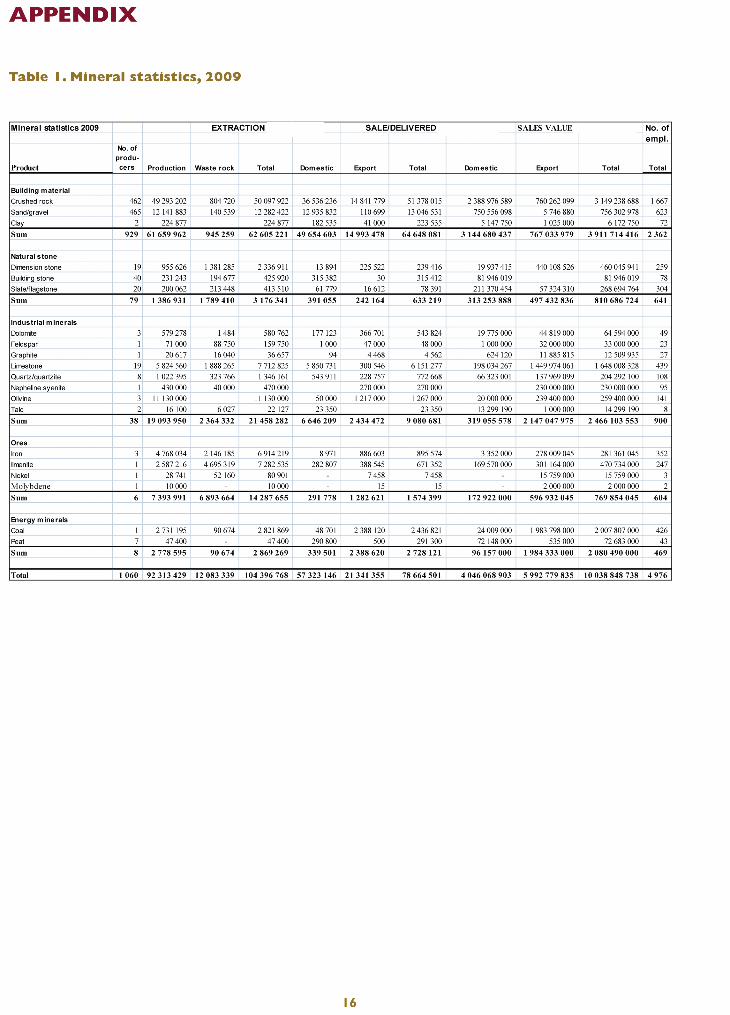
Table 3 Tonnage produced 2009
COUNTY/REGIONConstruction
materialNatural stone
Industrial minerals Ores
Energy - minerals Total
01 Østfold 2 939 370 5 423 - 7 700 2 952 493 02 Akershus 5 462 893 - 200 5 463 093 03 Oslo 996 561 400 - - 996 961 04 Hedmark 2 765 547 850 14 498 - 40 900 2 821 795 05 Oppland 2 447 736 24 986 38 829 - - 2 511 551 06 Buskerud 3 496 343 4 838 2 562 - - 3 503 743 07 Vestfold 2 261 859 215 638 387 184 - 9 000 2 873 681 08 Telemark 2 238 627 950 1 727 927 - - 3 967 504 09 Aust-Agder 787 095 2 280 68 000 - - 857 375 10 Vest-Agder 982 236 15 - 982 251 11 Rogaland 16 282 867 79 250 700 618 - 17 062 735 12 Hordaland 5 344 188 68 670 - - 5 412 858 14 Sogn og Fjordane 4 627 960 59 195 200 000 - - 4 887 155 15 Møre og Romsdal 3 067 834 60 879 1 921 971 - - 5 050 684 16 Sør-Trøndelag 2 896 542 86 471 - - 2 983 013 17 Nord-Trøndelag 2 836 329 7 019 680 655 - 9 500 3 533 503 18 Nordland 2 811 359 5 3 276 203 804 766 224 000 7 116 333 19 Troms 1 053 261 1 866 4 562 - - 1 059 689 20 Finnmark 1 349 474 14 499 758 290 69 000 - 2 191 263 21 Svalbard - 2 436 821 2 436 821 Total 64 648 081 633 219 9 080 681 1 574 399 2 728 121 78 664 501
Table 2 Value of production sold (NOK)
COUNTY/REGIONConstruction
material Natural stoneIndustrial minerals Ores
Energy - minerals Total
01 Østfold 190 323 586 3 000 000 - 5 005 000 198 328 586 02 Akershus 365 147 118 - 400 000 365 547 118 03 Oslo 76 756 000 1 700 000 - - 78 456 000 04 Hedmark 185 736 027 925 000 9 218 000 - 47 928 000 243 807 027 05 Oppland 155 631 292 76 474 800 14 663 953 - - 246 770 045 06 Buskerud 263 974 920 4 035 000 140 000 - - 268 149 920 07 Vestfold 156 668 611 411 571 129 12 397 888 - 5 000 000 585 637 628 08 Telemark 158 680 785 1 060 000 87 171 830 - - 246 912 615 09 Aust-Agder 46 690 709 1 355 000 47 000 000 - - 95 045 709 10 Vest-Agder 74 519 760 2 000 000 - 76 519 760 11 Rogaland 842 170 044 49 380 000 492 740 000 - 1 384 290 044 12 Hordaland 300 952 084 32 914 670 - - 333 866 754 14 Sogn og Fjordane 283 870 227 21 340 000 31 000 000 - - 336 210 227 15 Møre og Romsdal 201 178 092 7 200 000 1 692 867 340 - - 1 901 245 432 16 Sør-Trøndelag 155 731 161 113 354 500 - - 269 085 661 17 Nord-Trøndelag 147 463 190 21 196 000 46 587 147 - 1 350 000 216 596 337 18 Nordland 168 406 011 110 000 220 888 460 269 116 000 13 000 000 671 520 471 19 Troms 68 067 016 3 434 812 12 509 935 - - 84 011 763 20 Finnmark 69 747 783 61 635 813 291 659 000 5 998 045 - 429 040 641 21 Svalbard - - 2 007 807 000 2 007 807 000 Total 3 911 714 416 810 686 724 2 466 103 553 769 854 045 2 080 490 000 10 038 848 738
Table 2.Value (NOK) of production sold in 2009 by county
Table 3. Tonnage produced in 2009 by county

18
Table 4. Number of employees in 2009
Table 4 Number of employees 2009
COUNTY/REGIONConstruction
materialNatural stone
Industrial minerals Ores
Energy - minerals Total
01 Østfold 103 29 - 4 136 02 Akershus 184 - 1 184 03 Oslo 33 1 - - 34 04 Hedmark 141 4 2 - 19 166 05 Oppland 98 84 6 - - 189 06 Buskerud 146 5 1 - - 152 07 Vestfold 71 183 14 - 5 273 08 Telemark 122 1 55 - - 178 09 Aust-Agder 37 4 32 - - 73 10 Vest-Agder 32 2 - 35 11 Rogaland 415 29 258 - 702 12 Hordaland 144 38 - - 181 14 Sogn og Fjordane 199 15 21 - - 236 15 Møre og Romsdal 132 6 367 - - 505 16 Sør-Trøndelag 144 125 - - 269 17 Nord-Trøndelag 114 31 31 - 4 180 18 Nordland 140 3 222 206 10 581 19 Troms 58 7 27 - - 92 20 Finnmark 50 76 122 138 - 386 21 Svalbard - 426 426 Total 2 362 641 900 604 469 4 976

19
Table 5. Tonnage produced, 2000 - 2009
Tonnage produced, 2000-2009, 1000 tonnes
Rock/mineral 2000 2001 2002 2003 2004 2005 2006 2007 2008 2009
Olivine 3 600 3 200 3 100 3 300 3 400 3 100 2 923 2 562 2 554 1 267 Nephelinesyenite 330 340 330 320 330 320 330 312 346 270 Quartz/quartzite 1 530 1 290 1 140 1 100 1 200 1 100 834 1 041 1 025 773 Talc - 47 43 48 32 34 57 66 38 23 Feldspar/anorthosite 126 160 210 530 510 270 65 65 62 48 Graphite 9 9 14 - 6 9 9 3 4 5 Limestone 6 100 5 500 5 500 6 300 6 300 6 300 6 221 7 521 6 601 6 151 Dolomite 950 810 570 570 600 610 762 750 741 544 Sum industrial minerals 12 645 11 356 10 907 12 168 12 378 11 743 11 201 12 320 11 371 9 081
Ilmenite 691 777 827 859 870 810 850 882 915 671 Nickel concentrate 17 21 14 8 8 8 8 6 9 7 Iron 470 380 480 390 590 700 620 630 746 896 Molybdene concentrate - - - - - - - - - 0 Sum metallic ores 1 178 1 178 1 321 1 257 1 468 1 518 1 478 1 518 1 670 1 574
Coal 630 1 720 2 200 2 800 2 900 1 620 2 359 3 223 3 429 2 437 Peat - - - - - - 78 159 497 291 Sum energy minerals 630 1 720 2 200 2 800 2 900 1 620 2 437 3 382 3 926 2 728
Dimension stone 230 210 380 330 340 390 800 299 286 230 Slate/flagstone 100 180 160 250 260 470 99 206 85 78 Building stone - - - - - - 166 104 271 315 Sum natural stone 330 390 540 580 600 860 1 065 609 642 633
Crushed rock 34 000 38 000 35 000 36 000 37 000 38 000 45 947 52 910 53 931 51 378 Sand/gravel 19 000 15 000 15 000 15 000 15 000 15 000 13 418 15 325 15 090 13 047 Clay 410 440 450 370 230 230 320 319 279 224 Sum construction materials 53 410 53 440 50 450 51 370 52 230 53 230 59 685 68 554 69 300 64 649
Total 68 193 68 084 65 418 68 175 69 576 68 971 75 866 86 383 86 909 78 665

20
Table 6.Value of production, 2000 - 2009
Value of production, 2000-2009, million NOK
Rock/mineral 2000 2001 2002 2003 2004 2005 2006 2007 2008 2009
Olivine 297 270 278 297 377 398 391 301 361 259 Nephelinesyenite 220 232 219 221 211 235 247 229 231 230 Quartz/quartzite 145 148 140 135 158 143 137 170 184 204 Talc 76 50 48 54 53 50 120 76 25 14 Feldspar/anorthosite 46 51 52 73 79 51 35 35 35 33 Graphite 23 19 19 - 13 19 17 6 8 12 Limestone 1 927 1 571 1 488 1 731 1 925 1 877 1 874 1 873 1 947 1 648 Dolomite 93 68 57 51 60 61 115 133 74 65 Sum industrial minerals 2 827 2 409 2 301 2 562 2 876 2 834 2 936 2 823 2 866 2 466
Ilmenite 345 345 470 472 473 508 533 523 563 471 Nickel concentrate 109 109 93 8 17 15 25 27 39 16 Iron 94 94 91 74 131 185 562 232 329 281 Molybdene concentrate - - - - - - - - - 2 Sum metallic ores 548 548 654 554 621 708 1 120 782 931 770
Coal 122 378 654 938 1 021 615 1 095 1 936 2 645 2 009 Peat - - - - - - 59 67 77 73 Sum energy minerals 122 378 654 938 1 021 615 1 154 2 003 2 722 2 081
Dimension stone 699 787 836 722 842 788 601 640 554 429 Slate/flagstone 209 200 234 219 233 275 281 291 297 269 Building stone - - - - - - 76 68 82 82 Sum natural stone 908 987 1 070 941 1 075 1 063 958 999 933 811
Crushed rock 1 825 1 980 1 950 1 960 2 040 2 300 2 390 3052* 3 222 3 149 Sand/gravel 760 600 590 590 600 720 645 875* 810 756 Clay 6 6 10 9 8 7 9 9 8 6 Sum construction materials 2 591 2 586 2 550 2 559 2 648 3 027 3 044 3 936 4 040 3 911
Total 6 996 6 908 7 229 7 554 8 241 8 247 9 212 10 543 11 491 10 039

21
Table 7. Number of employees, 2000 - 2009
Rock/mineral2000 No. of empl.
2001 No. of empl.
2002 No. of empl.
2003 No. of empl.
2004 No. of empl.
2005 No. of empl.
2006 No. of empl.
2007 No. of empl.
2008 No. of empl.
2009 No. of empl.
Olivine 298 218 205 199 225 210 184 199 175 141 Nephelinesyenite 112 114 107 105 97 100 91 91 92 95 Quartz/quartzite 80 92 94 92 94 84 88 100 113 108 Talc - 101 102 75 67 67 67 35 22 18 Feldspar/anorthosite 33 37 34 43 45 42 22 23 21 23 Graphite 36 32 - - 26 26 25 25 27 27 Limestone 446 398 401 417 421 479 513 475 465 439 Dolomite 61 60 51 63 68 70 78 86 53 49 Sum industrial minerals 1 066 1 052 994 994 1 043 1 078 1 068 1 034 968 900
Ilmenite 212 203 236 247 246 245 277 245 248 247 Nickel concentrate 90 102 2 - - - 3 2 3 3 Iron 165 160 160 160 160 178 188 197 213 352 Molybdene concentrate - - - - - - - - - 2 Sum metallic ores 467 465 398 407 406 423 468 444 464 604
Kull 223 248 225 233 362 430 411 396 464 426 Torv - - - - - - 48 45 82 43 Sum energimineraler 223 248 225 233 362 430 459 441 546 469
Dimension stone 532 459 465 474 470 465 367 358 323 244 Slate/flagstone 309 350 357 378 325 347 359 328 313 304 Building stone - - - - - - 75 58 72 77 Sum natural stone 841 809 822 852 795 812 801 744 708 641
Crushed rock 1 200 1 200 1 242 1 340 1 205 1 312 1 291 1563* 1 618 1 661 Sand/gravel 1 482 1 343 1 353 1 178 1 333 1 355 571 532* 512 617 Clay 188 180 - - 78 59 40 92 38 72 Sum construction materials 2 870 2 723 2 595 2 518 2 616 2 726 1 902 92 2 168 2 362
Total 5 467 5 297 5 034 5 004 5 222 5 469 4 698 2 755 4 853 4 976

22
Table 8. Production of gravel and sand by county, 2009
Table 9. Production of hard-rock aggregate by county, 2009
No of empl.
County/region Total No sale Production wasterock Total Domestic Export Total Domestic Export Total Total
01 Østfold 10 - 623 852 7 800 631 652 605 811 460 606 271 27 555 669 32 700 27 588 369 14 02 Akershus 7 - 741 416 741 416 826 416 826 416 46 730 484 46 730 484 24 03 Oslo 1 1 04 Hedmark 46 8 746 410 746 410 792 220 1 050 793 270 42 888 151 35 000 42 923 151 54 05 Oppland 56 8 1 013 376 1 148 1 014 524 1 011 250 1 011 250 57 456 455 57 456 455 46 06 Buskerud 37 4 1 390 091 41 978 1 432 069 1 556 176 22 068 1 578 244 115 908 848 782 630 116 691 478 76 07 Vestfold 4 2 28 700 28 700 30 101 30 101 1 407 215 1 407 215 2 08 Telemark 27 3 471 215 9 604 480 819 594 101 100 594 201 36 884 397 5 000 36 889 397 37 09 Aust-Agder 12 3 593 758 1 450 595 208 468 547 468 547 22 037 404 22 037 404 21 10 Vest-Agder 3 - 29 792 29 792 29 792 29 792 2 127 760 2 127 760 1 11 Rogaland 28 3 2 202 892 3 680 2 206 572 2 293 810 77 071 2 370 881 137 424 400 4 228 800 141 653 200 77 12 Hordaland 15 1 773 734 3 906 777 640 742 349 742 349 41 511 743 41 511 743 27 14 Sogn og Fjordane 20 2 218 658 14 988 233 646 286 879 286 879 19 255 870 19 255 870 30 15 Møre og Romsdal 21 - 912 376 5 085 917 461 716 569 1 950 718 519 51 785 457 102 750 51 888 207 41 16 Sør-Trødelag 34 3 613 123 38 300 651 423 800 195 800 195 40 068 078 40 068 078 40 17 Nord-Trødelag 34 4 892 529 892 529 1 020 007 8 000 1 028 007 43 614 025 560 000 44 174 025 50 18 Nordland 25 - 111 455 1 010 112 465 235 302 235 302 16 085 376 16 085 376 20 19 Troms 33 3 305 678 2 050 307 728 430 704 430 704 22 670 726 22 670 726 31 20 Finnmark 52 25 472 828 9 540 482 368 495 603 495 603 25 144 040 25 144 040 32 21 Svalbard - - - Total 465 70 12 141 883 140 539 12 282 422 12 935 832 110 699 13 046 531 750 556 098 5 746 880 756 302 978 623
Extraction metric tonnes Sale/delivered metric tonnes Sales value FOB NOKExtraction sites
No of empl.
County/region Total No sale Production wasterock Total Domestic Export Total Domestic Export Total Total 01 Østfold 23 - 2 264 217 161 532 2 425 749 2 128 507 204 592 2 333 099 150 843 612 11 891 605 162 735 217 89 02 Akershus 21 2 4 561 151 2 860 4 564 011 4 432 477 4 432 477 313 316 634 313 316 634 121 03 Oslo 4 1 640 927 640 927 996 561 996 561 76 756 000 76 756 000 33 04 Hedmark 29 5 1 906 414 42 965 1 949 379 1 972 148 129 1 972 277 142 805 374 7 502 142 812 876 88 05 Oppland 33 4 1 476 398 552 1 476 950 1 436 486 1 436 486 98 174 837 98 174 837 52 06 Buskerud 28 - 2 004 204 5 675 2 009 879 1 918 099 1 918 099 147 283 442 147 283 442 70 07 Vestfold 17 2 2 153 836 2 153 836 1 971 634 260 124 2 231 758 132 461 396 22 800 000 155 261 396 70 08 Telemark 18 2 1 526 366 11 673 1 538 039 994 891 630 000 1 624 891 70 950 638 49 768 000 120 718 638 52 09 Aust-Agder 9 1 318 468 3 950 322 418 318 548 318 548 24 653 305 24 653 305 15 10 Vest-Agder 14 1 969 254 30 020 999 274 839 278 113 166 952 444 64 492 000 7 900 000 72 392 000 32 11 Rogaland 34 2 13 976 333 220 310 14 196 643 5 192 993 8 718 993 13 911 986 327 378 190 373 138 654 700 516 844 338 12 Hordaland 17 - 3 803 101 80 530 3 883 631 3 632 618 969 221 4 601 839 211 789 951 47 650 390 259 440 341 116 14 Sogn og Fjordane 29 2 3 911 492 38 091 3 949 583 989 993 3 351 088 4 341 081 57 984 357 206 630 000 264 614 357 169 15 Møre og Romsdal 32 4 2 047 505 65 920 2 113 425 2 110 593 238 722 2 349 315 128 567 885 20 722 000 149 289 885 91 16 Sør-Trødelag 35 3 1 978 066 24 910 2 002 976 2 090 880 5 467 2 096 347 115 393 135 269 948 115 663 083 103 17 Nord-Trødelag 38 5 2 359 472 18 514 2 377 986 1 808 322 1 808 322 103 289 165 103 289 165 64 18 Nordland 44 3 2 111 034 56 250 2 167 284 2 225 780 350 277 2 576 057 132 836 635 19 484 000 152 320 635 120 19 Troms 19 6 461 899 31 500 493 399 622 557 622 557 45 396 290 45 396 290 27 20 Finnmark 18 4 823 065 9 468 832 533 853 871 853 871 44 603 743 44 603 743 18 21 Svalbard - - - Total 462 47 49 293 202 804 720 50 097 922 36 536 236 14 841 779 51 378 015 2 388 976 589 760 262 099 3 149 238 688 1 667
Extraction metric tonnes Sale/delivered metric tonnes Sales value FOB NOKExtraction sites

23
Table 10. Size and royalty distribution for gravel producers based on tonnage sold in 2009
Table 11. Size and royalty distribution for hard-rock aggregate producers based on tonnage sold in 2009
Royality (NOK/tonnes)
Size (metric tonnes) Number % Number % Total tonnes % Average Producers Min Max Average Median
1 - 10000 217 54.9 22 5.6 746 128 5.7 3 438 120 1.00 27.20 7.66 6.55 10001 - 50000 116 29.4 40 10.1 2 666 021 20.4 22 983 93 0.35 28.00 7.31 6.50 50001 - 100000 27 6.8 13 3.3 1 953 190 15.0 72 340 22 1.40 13.00 6.83 6.16 100001 - 250000 26 6.6 15 3.8 4 162 490 31.9 160 096 24 3.00 13.00 7.35 7.67 250001 - 500000 8 2.0 5 1.3 2 621 897 20.1 327 737 5 4.50 11.00 9.00 10.50 500001 -1000000 1 0.3 1 0.3 896 805 6.9 896 805 1 7.10 7.10 7.10 7.101000001 - - 0.0 - 0.0 - 0.0 - 0 Total 395 96 24 13 046 531 33 029 265 0.35 28.00 7.46 6.60
CE-markingProducersTonnes
Royality (NOK/tonnes) %-
Size (metric tonnes) Number % Number % Total tonnes % Average Producers Min Max Average Median
1 - 10000 111 26.7 11 2.7 544172 1.1 4902 38 1.00 22.00 4.29 3.00 10001 - 50000 133 32.0 38 9.2 3295869 6.4 24781 89 1.00 30.00 3.74 3.00 50001 - 100000 59 14.2 21 5.1 4481365 8.7 75955 47 0.24 12.88 3.36 3.00 100001 - 250000 60 14.5 37 8.9 9619358 18.7 160323 44 0.96 9.00 2.68 2.44 250001 - 500000 34 8.2 28 6.7 11655788 22.7 342817 26 0.25 11.00 3.07 2.59 500001 -1000000 12 2.9 6 1.4 8458327 16.5 704861 8 0.15 3.50 1.81 1.651000001 - 6 1.4 3 0.7 13323136 25.9 2220523 4 0.38 1.45 0.77 0.63Total 415 - 144 35 51 378 015 256 0.15 30.00 3.40 2.70
Producers CE-markingTonnes
24
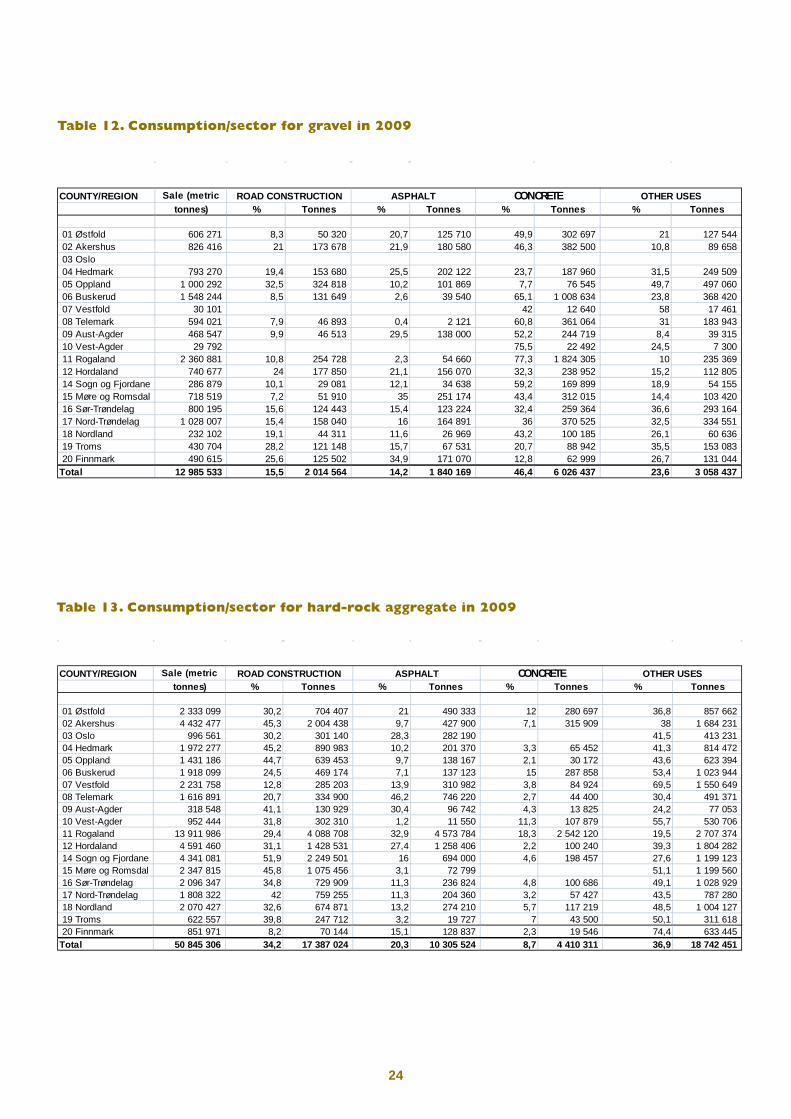
Table 12. Consumption/sector for gravel in 2009
Table 13. Consumption/sector for hard-rock aggregate in 2009
COUNTY/REGION Sale (metric
tonnes) % Tonnes % Tonnes % Tonnes % Tonnes
01 Østfold 606 271 8,3 50 320 20,7 125 710 49,9 302 697 21 127 544 02 Akershus 826 416 21 173 678 21,9 180 580 46,3 382 500 10,8 89 658 03 Oslo 04 Hedmark 793 270 19,4 153 680 25,5 202 122 23,7 187 960 31,5 249 509 05 Oppland 1 000 292 32,5 324 818 10,2 101 869 7,7 76 545 49,7 497 060 06 Buskerud 1 548 244 8,5 131 649 2,6 39 540 65,1 1 008 634 23,8 368 420 07 Vestfold 30 101 42 12 640 58 17 461 08 Telemark 594 021 7,9 46 893 0,4 2 121 60,8 361 064 31 183 943 09 Aust-Agder 468 547 9,9 46 513 29,5 138 000 52,2 244 719 8,4 39 315 10 Vest-Agder 29 792 75,5 22 492 24,5 7 300 11 Rogaland 2 360 881 10,8 254 728 2,3 54 660 77,3 1 824 305 10 235 369 12 Hordaland 740 677 24 177 850 21,1 156 070 32,3 238 952 15,2 112 805 14 Sogn og Fjordane 286 879 10,1 29 081 12,1 34 638 59,2 169 899 18,9 54 155 15 Møre og Romsdal 718 519 7,2 51 910 35 251 174 43,4 312 015 14,4 103 420 16 Sør-Trøndelag 800 195 15,6 124 443 15,4 123 224 32,4 259 364 36,6 293 164 17 Nord-Trøndelag 1 028 007 15,4 158 040 16 164 891 36 370 525 32,5 334 551 18 Nordland 232 102 19,1 44 311 11,6 26 969 43,2 100 185 26,1 60 636 19 Troms 430 704 28,2 121 148 15,7 67 531 20,7 88 942 35,5 153 083 20 Finnmark 490 615 25,6 125 502 34,9 171 070 12,8 62 999 26,7 131 044 Total 12 985 533 15,5 2 014 564 14,2 1 840 169 46,4 6 026 437 23,6 3 058 437
OTHER USESROAD CONSTRUCTION ASPHALT CONCRETE
COUNTY/REGION Sale (metric
tonnes) % Tonnes % Tonnes % Tonnes % Tonnes
01 Østfold 2 333 099 30,2 704 407 21 490 333 12 280 697 36,8 857 662 02 Akershus 4 432 477 45,3 2 004 438 9,7 427 900 7,1 315 909 38 1 684 231 03 Oslo 996 561 30,2 301 140 28,3 282 190 41,5 413 231 04 Hedmark 1 972 277 45,2 890 983 10,2 201 370 3,3 65 452 41,3 814 472 05 Oppland 1 431 186 44,7 639 453 9,7 138 167 2,1 30 172 43,6 623 394 06 Buskerud 1 918 099 24,5 469 174 7,1 137 123 15 287 858 53,4 1 023 944 07 Vestfold 2 231 758 12,8 285 203 13,9 310 982 3,8 84 924 69,5 1 550 649 08 Telemark 1 616 891 20,7 334 900 46,2 746 220 2,7 44 400 30,4 491 371 09 Aust-Agder 318 548 41,1 130 929 30,4 96 742 4,3 13 825 24,2 77 053 10 Vest-Agder 952 444 31,8 302 310 1,2 11 550 11,3 107 879 55,7 530 706 11 Rogaland 13 911 986 29,4 4 088 708 32,9 4 573 784 18,3 2 542 120 19,5 2 707 374 12 Hordaland 4 591 460 31,1 1 428 531 27,4 1 258 406 2,2 100 240 39,3 1 804 282 14 Sogn og Fjordane 4 341 081 51,9 2 249 501 16 694 000 4,6 198 457 27,6 1 199 123 15 Møre og Romsdal 2 347 815 45,8 1 075 456 3,1 72 799 51,1 1 199 560 16 Sør-Trøndelag 2 096 347 34,8 729 909 11,3 236 824 4,8 100 686 49,1 1 028 929 17 Nord-Trøndelag 1 808 322 42 759 255 11,3 204 360 3,2 57 427 43,5 787 280 18 Nordland 2 070 427 32,6 674 871 13,2 274 210 5,7 117 219 48,5 1 004 127 19 Troms 622 557 39,8 247 712 3,2 19 727 7 43 500 50,1 311 618 20 Finnmark 851 971 8,2 70 144 15,1 128 837 2,3 19 546 74,4 633 445 Total 50 845 306 34,2 17 387 024 20,3 10 305 524 8,7 4 410 311 36,9 18 742 451
ROAD CONSTRUCTION ASPHALT CONCRETE OTHER USES
25
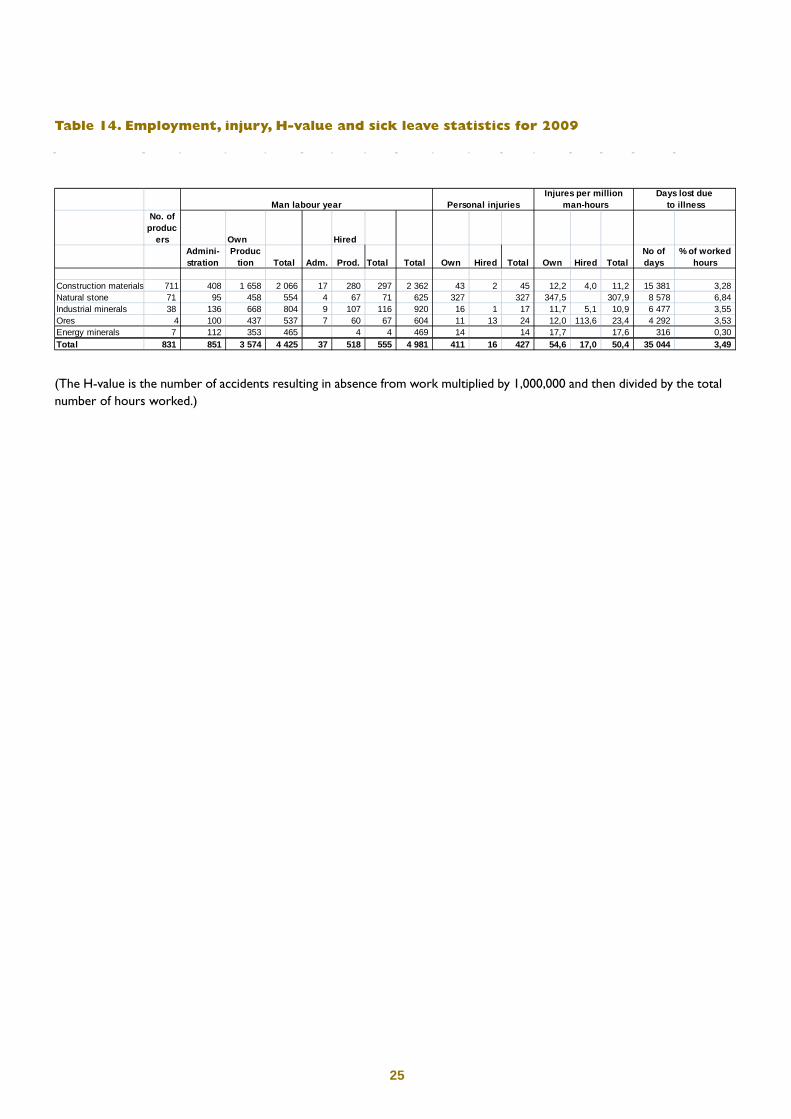
Table 14. Employment, injury, H-value and sick leave statistics for 2009
No. of
producers Own Hired
Admini- stration
Production Total Adm. Prod. Total Total Own Hired Total Own Hired Total
No of days
% of worked hours
Construction materials 711 408 1 658 2 066 17 280 297 2 362 43 2 45 12,2 4,0 11,2 15 381 3,28 Natural stone 71 95 458 554 4 67 71 625 327 327 347,5 307,9 8 578 6,84 Industrial minerals 38 136 668 804 9 107 116 920 16 1 17 11,7 5,1 10,9 6 477 3,55 Ores 4 100 437 537 7 60 67 604 11 13 24 12,0 113,6 23,4 4 292 3,53 Energy minerals 7 112 353 465 4 4 469 14 14 17,7 17,6 316 0,30 Total 831 851 3 574 4 425 37 518 555 4 981 411 16 427 54,6 17,0 50,4 35 044 3,49
Man labour year Personal injuriesInjures per million
man-hoursDays lost due
to illness
(The H-value is the number of accidents resulting in absence from work multiplied by 1,000,000 and then divided by the total number of hours worked.)


The statue of the lion in front of the Parliament building was sculpted out of a pale red, Permian, Grefsen syenite by inmates of the Akershus Prison in 1865.Photo: Peer-Richard Neeb
Leiv Eiriksons vei 39Pb 3021 Lade7441 Trondheim
Phone: +47 73 90 40 50Fax: +47 73 92 14 80
Svalbard offi ce:Phone: +47 79 02 12 92Fax: +47 79 02 14 24
E-mail: [email protected]
NGUPb. 6315 Sluppen7491 Trondheim
Visiting adress:Leiv Eirikssons vei 39
Phone: +47 73 90 40 00Fax: +47 73 92 16 20
E-mail: [email protected]