production of traditional salami using the meat of ... · polyunsaturated fatty acids (pufa)...
TRANSCRIPT

PRODUCTION OF SALAMI FROM MEAT OF
AQUATIC AND TERRESTRIAL MAMMALS
by
KARIN SARAH COLES KOEP
Thesis in partial fulfilment for the degree of
MASTER OF SCIENCE IN AGRICULTURE
(ANIMAL SCIENCE)
at Stellenbosch University
Supervisor: Prof. L.C. Hoffman
Co-supervisors: Prof. E. Slinde and Prof. L.M.T. Dicks
April 2005
Stellenbosch

ii
DECLARATION
I, the undersigned, hereby declare that the work contained in this thesis is my own original work
and that I have not previously in its entirety or in part submitted it at any other university for a
degree.
Signature:______________ Date:___________________
iii
SUMMARY
The aim of this study was to develop a product using alternative red meat species, aquatic and
terrestrial mammals, which would be acceptable to the consumer and suitable from a food safety
aspect. Many of these alternative species are harvested seasonally. A product which is shelf
stable needs to be developed to provide a supply of this meat all year round. The species used in
this investigation were the Cape fur seal (Arctocephalus pusillus pusillus), the Grey seal
(Halichoerus grypus) from the northern hemisphere, the Minke whale (Balaenoptera
acutorostrata), horse, beef, mutton, blesbok (Damaliscus dorcas phillipsi) and springbok
(Antidorcas marsupialis).
Muscle (m. pectoralis) of Cape fur seal pups has a higher percentage fat (4.2g/100g) than the
bulls (2.4g/100g), but similar levels of protein (23.2g/100g). Bull blubber samples have a higher
percentage protein (26.6g/100g) than the pups (14.6g/100g), but a lower fat percentage
(67.1g/100 g) compared with the pups (77.2g/100g). In the Cape fur seal bull meat, saturated
fatty acids (SFA) contribute 33mg/100g, monounsaturated fatty acids (MUFA) 29mg/100 g and
polyunsaturated fatty acids (PUFA) 38mg/100g of the total fatty acid content. In pups, the three
fractions are 39, 30 and 31 mg/100g for SFA, MUFA and PUFA, respectively.
Salami,prepared using exclusively seal meat, or seal meat with beef and pork, was produced in a
pilot study, using two commercially available starter cultures. The pH values of all three
batches started off at ca. 5.6, and dropped to 4.3. Water activity readings started off at 0.96 and
dropped to 0.91 after 21 days. Salami produced from the meat of the Grey (Havert) seal and
Minke whale, using three starter cultures, had recorded pH values (in both species), which started
off between 5.68 and 5.92, and dropped to between 4.5 and 4.8 over the 21 days. Water activity
showed an initial value of 0.96, which dropped to 0.90 after 21 days. The final force (N/cm2)
that was needed to compress the salami samples was double that of the initial force required for
the same species and starter culture combination. The raw seal meat contained 349.6 (mg/100 g
sample) SFA, 271.6 (mg/100g sample) MUFA and 175.8 (mg/100g sample) PUFA, whilst the
raw whale meat contained 312.3, 251.9 and 179.6 (mg/100g sample) SFA, MUFA and PUFA
respectively.
Fifteen batches of salami were made from horse, beef, mutton, blesbok and springbok,
respectively, and starter cultures of Lactobacillus curvatus DF 38 (batch I), active bacteriocin

iv
producing Lactobacillus plantarum 423 (batch II) and then a mutant variation of Lactobacillus
plantarum 423m, which did not produce the bacteriocin (batch III). Batch I had a higher final
pH value (4.66), after 23 days, whereas the values for batches II and III were similar (4.42 and
4.46 respectively). On day 23 the water activity value was 0.90 for all starter cultures. Horse
salami, in batch I, was the leanest in terms of fat content (34.34g/100g salami), with mutton
salami having the highest fat content (37.52g/100g salami). Blesbok salami had the highest fat
content in batch II (42.77g/100g meat), with beef the leanest (35.71g/100g meat). Salami made
from horse and springbok proved to be the most desirable in terms of chemical composition,
especially fatty acid profiles, with regard to P: S and n-6: n-3 ratios.
Similar growth patterns in colony forming units (cfu) were recorded for L. plantarum 423, L.
plantarum 423m and L. curvatus DF38 in MRS broth (Merck) at 30oC, although batch I reached
asymptotic growth earlier. The percentage of L. plantarum 423 compared with the total
population of microflora in mutton salami remained almost the same (80-95% variety) during the
entire fermentation and maturation process. In horse salami, L. plantarum 423 was present at
relatively low cell numbers (55-50% on day 1 and before smoking), but increased to 70% after
smoking and stabilized to 70-80% for the remaining fermentation period. In beef salami, cell
numbers in batch II decreased slightly during the first five days (from 95 to 70%), followed by an
increase to 90%. In springbok salami, cell numbers in batch II remained fairly stable at 80-90%.
In blesbok salami, batch II slowly decreased during the first three days, from 88% to 70%, then
increased to 92% after 12 days and stabilized for the rest of the fermentation period. Similar
results were recorded for batch I.
Analytical sensory evaluation concluded that the salami prepared using starter culture I resulted
in end products with lower sensory qualities. Salami prepared using blesbok and mutton also
resulted in end products with lower sensory qualities and was perceived as significantly lower in
salami flavour (P≤0.05) and higher in venison-like and mutton-like flavour respectively. The
blesbok samples were rated significantly higher (P≤0.05) in sour meat aroma, sour meat flavour
and venison-like flavour than the rest of the samples. The blesbok salami was rated significantly
lowest for colour compared with the rest of the samples. The tastes of the springbok and horse
salami were significantly (P≤0.05) more acceptable than those of the beef and blesbok salami.

v
OPSOMMING
Die doel van die studie was om, deur gebruik te maak van alternatiewe rooivleisspesies
afkomstig van die see en land, ’n produk te ontwikkel wat beide dieetveilig en vir die verbruiker
aanvaarbaar is. Aangesien van hierdie spesies seisonaal geoes word, moes die produk ook stabiel
wees om voorraad dwarsdeur die jaar te voorsien. Die spesies wat tydens die studie ondersoek
is, het die Kaapse pelsrob (Arctocephalus pusillus pusillus), die Grysrob (Halichoerus grypus)
van die noordelike halfrond, die Minke-walvis (Balaenoptera acutorostrata), perd, bees, skaap,
blesbok (Damaliscus dorcas phillipsi) en springbok (Antodircas marsupialis) ingesluit.
Spiere (m. pectoralis) van Kaapse pelsrobkalfies het ’n betekenisvolle (P≤0.05) hoër persentasie
vet (4.2g/100g) bevat as dié van pelsrobbulle (2.4g/100g), maar dieselfde hoeveelheid proteïen
(23.2g/100g). Spekmonsters van pelsrobbulle het egter ’n betekenisvolle (P≤0.05) hoër
proteïeninhoud (26.6g/100g) gehad as dié van die kalfies (14.6g/100g), maar ’n betekenisvolle
laer vetinhoud (67.1g/100g vs 77.2g/100g). In die bulsvleis van die Kaapse pelsrob het die totale
vetsuurinhoud bestaan uit 33mg/100g versadigde vetsure (VVS), 29mg/100g mono-onversadigde
vetsure (MOVS), en 38mg/100g poli-onversadigde vetsure (POVS). In die geval van kalfies was
hierdie waardes onderskeidelik 39, 30 en 31mg/100g.
In ’n loodsondersoek is tradisionele salami voorberei deur gebruik te maak van robvleis alleenlik
of robvleis gekombineer met bees- of varkvleis en twee kommersiële aanvangskulture. pH-
waardes van al drie produkgroepe het vanaf ’n aanvangswaarde van 5.6 afgeneem tot 4.3.
Wateraktiwiteitswaardes was aanvanklik 0.96 en het afgeneem tot 0.91 na 21 dae. In die geval
van salami wat van Grysrob en die Minke-walvis gemaak is, het die pH-waardes vanaf die
aanvanklike 5.68 en 5.92 na 21 dae afgeneem tot 4.5 en 4.8 respektiewelik. Die finale krag (N)
wat nodig was om die salamimonsters saam te pers was dubbel die aanvanklike waardes vir
dieselfde kombinasie van spesie en aanvangskultuur. Rou robvleismonsters het onderskeidelik
349.6mg/100g VVS, 271.6mg/100g MOVS en 175.8mg/100g POVS bevat teenoor 312.3, 239.9
en 179.6mg/100g in die geval van rou walvisvleis.
In ’n daaropvolgende studie is drie groepe van vyf verskillende tradisionele salamis gebruik wat
bestaan het uit die vleis van vyf verskillende spesies, naamlik perd, bees, skaap, blesbok en
springbok, terwyl drie verskillende aanvangskulture gebruik is, naamlik Lactobacillus curvatus
DF38 (groep I), aktiewe bakteriosienproduserende Lactobacillus plantarum 423 (groep II) asook
’n muteerde variasie van Lactobacillus plantarum 423 wat nie bakteriosien produseer nie (groep

vi
III). Na 23 dae het groep I ’n hoër finale pH-waarde gehad (4.66) teenoor groepe II en III wat
bykans dieselfde was (pH 4.42 en 4.46 onderskeidelik). Op dag 23 na vervaardiging was die
wateraktiwiteitswaarde 0.90 vir al die aanvangskulture. Perdesalami van groep I het die laagste
vetinhoud gehad (34.34g/100g) teenoor skaapsalami wat die hoogste was (37.52g/100g). In
groep II het blesboksalami die hoogste vetinhoud vertoon (42.77g/100g) terwyl beessalami die
laagste was (35.71g/100g). Springbok- en perdesalami het die gewenste chemiese samestelling
gehad, veral ten opsigte van vetsuurprofiele, met verwysing na P:S en n-6:n-3 verhoudings.
Dieselfde groeipatrone ten opsigte van kolonie-vormende eenhede (kve) is waargeneem vir L.
plantarum 423, L. plantarum 423m en L. curvatus DF38 in MRS-kragsop by 30oC alhoewel
groep I vroeër eksponensiële groei bereik het. In skaapsalami het die persentasie van L.
plantarum 423 ten opsigte van die totale mikro-flora populasie bykans dieselfde (varierend
tussen 80% en 95%) gebly tydens die volle fermentasie- en maturasieproses. In die geval van
perdesalami het L. plantarum 423 aanvanklik lae selgetalle getoon (55% op dag een en voor
beroking). Dit het egter tot 70% toegeneem na beroking en op 70-80% gestabiliseer vir die res
van die fermentasieperiode. In beessalami van groep II het die persentasie kultuurselle effens
afgeneem tydens die eerste vyf dae (van 90% tot 74%) waarna dit tot 90% toegeneem het. By
die springboksalami van groep II het die selpersentasie redelik stabiel gebly – tussen 80-90%. In
die geval van blesboksalami van groep II het die selpersentasie tydens die eerste drie dae stadig
van 88% tot 70% afgeneem, waarna dit tot 92% op dag 12 toegeneem en op hierdie vlak
gestabiliseer het vir die res van die fermentasieperiode. Soortgelyke resultate is vir groep I
aangeteken.
Volgens die analitiese sensoriese evaluasie is vasgestel dat die salami wat met aanvangskultuur I
voorberei is, die swakste sensoriese kwaliteit vertoon het. Dieselfde waarneming is gedoen ten
opsigte van salami wat van blesbok- en skaapvleis berei is. In laasgenoemde twee gevalle was
die waarnemings ook dat die produkte ’n betekenisvolle (P≤0.05) swakker salamigeur gehad het
en ’n sterker skaap- en wildsvleisgeur as die res van die monsters. Die blesbokmonsters is ook
die laagste geëvalueer ten opsigte van kleur in vergelyking met die res van die monsters
(P≤0.05). Die smaak van springbok- en perdesalami was meer aanvaarbaar (P≤0.05) teenoor dié
van bees- en blesboksalami.

vii
ACKNOWLEDGEMENTS
On the completion of this thesis I would like to express my sincere appreciation to the following
people and institutions:
Prof. L.C. Hoffman, my supervisor, for providing professional and friendly guidance throughout
my study, as well as for providing the opportunity to attend the International Congress of Meat
Science and Technology in Helsinki, Finland in 2004.
Mr Erik Slinde, my co-supervisor, the driving force behind this research, for his constant support
and financial assistance. He made it possible to conduct some of the research in Norway, and for
this I am extremely grateful.
Mr Hans Blom, my supervisor at Matforsk, Norway, for all his assistance and friendship.
The technical staff at Stellenbosch University, and the Matforsk Food Research Institute in
Norway. Special thanks to Resia van der Watt and Marvin Marais.
Gail Jordaan, for advice on the statistical analysis possibilities of this trial.
Mr Willem Burger, concession holder for harvesting of seals in Namibia, for his endless advice
and answering of questions.
My parents, Monica and Peter, for their never-ending support, emotional as well as financial.
Without their belief in my capabilities and me, I would never have come this far.
Vincent den Ouden, for his understanding and patience during the two years of trials and
tribulations.
All my friends, especially Liezel, Greg, Steven and Jacques, for their ongoing encouragement,
humour, friendship and occasional invaluable assistance.

viii
LIST OF CONTENTS
Chapter 1: Introduction 1 Chapter 2: Literature review 8
1. Introduction 8 2. Potential production of salami using the meat of alternative red meat
species 10
2.1. Background to salami 10 2.2. Ingredients 10 2.3. Use of starter cultures 12 2.4. Preparation of fermented sausage batter 14 2.5. Fermentation of sausage 15 2.6. Drying and maturation of sausage 15 2.7. Chemical and physical changes during production of fermented
sausage 17
2.8. Composition and nutritive value of salami 19 3. Alternative red meat species 21 3.1. Aquatic mammals 21 3.2. Terrestrial mammals 30 4. Aim of this study 37 5. References 38
Chapter 3: Chemical properties of the meat and blubber of the Cape fur seal
(Arctocephalus pusillus pusillus) 46
1. Abstract 46 2. Introduction 46 3. Materials and methods 48 3.1. Proximate analysis 49 3.2. Amino acid determination 49 3.3. Mineral determination 50 3.4. Fatty acid determination 50 3.5. Toxin evaluation 50 3.6. Statistical analysis 51 4. Results and discussion 51 4.1. Proximate analysis 52
4.2. Amino acid determination 52 4.3. Mineral determination 53 4.4. Fatty acid determination 54 4.5. Toxin evaluation 58 5. Conclusion 59 6. Acknowledgements 60
7. References 60 Chapter 4: Production of salami from meat of the Cape fur seal (Arctocephalus
pusillus pusillus) 64
1. Abstract 64 2. Introduction 64

ix
3. Materials and methods 66 3.1. Starter cultures and growth conditions 66 3.2. Meat preparation and fermentation 66 3.3. Recorded parameters 67 4. Results and discussion 68 4.1. Water activity and pH correlation 69 4.2. Colour variation between the three different batches of salami 72 4.3. Weight loss 78 5. Conclusion 79 6. Acknowledgements 80 7. References 80
Chapter 5: Production of salami from the Grey seal (Halichoerus grypus) and Minke whale (Balaenoptera acutorostrata) meat
82
1. Abstract 82 2. Introduction 82 3. Materials and methods 84 3.1. Raw materials 84 3.2. Starter cultures and growth conditions 84 3.3. Meat preparation and fermentation 85 3.4. Recorded parameters 85 3.5. Chemical analysis 86 3.6. Myoglobin content and dissociation of heme from myoglobin 86 3.7. Fatty acid determination 87 3.8. Statistical analysis 88 4. Results and discussion 88 4.1. pH, water activity, colour and microbiological measurements 88 4.2. Chemical analysis 99 4.3. Weight loss and texture 99 4.4. Fatty acid determination 102 5. Conclusion 109 6. Acknowledgements 110 7. References 111
Chapter 6: Production of salami from beef, mutton, horse, blesbok and springbok
a) Chemical and physical parameters 114
1. Abstract 114 2. Introduction 114 3. Materials and methods 116 3.1. Raw materials 116 3.2. Starter cultures and growth conditions 116 3.3. Meat preparation and fermentation 116 3.4. Recorded parameters 118 3.5. Statistical analysis 119 4. Results and discussion 119 4.1. pH and water activity 119 4.2. Colour evaluation 123 4.3. Chemical analysis 127 4.4. Fatty acid determination 129 5. Conclusion 137 6. Acknowledgements 137 7. References 137

x
Chapter 6: Production of salami from beef, mutton, horse, blesbok and springbok
b) Microbiological investigation 140
1. Abstract 140 2. Introduction 141 3. Materials and methods 142 3.1. Starter cultures 142 3.2. Growth of starter cultures and bacteriocin production 143 3.3. Monitoring of changes in bacteria cell numbers during fermentation 143 3.4. Determining the percentage bacteriocin-producing strains 143 3.5. Growth of Listeria innocua 143 F 143 3.6. The effect of smoke on starter cultures 144 4. Results and discussion 144 4.1. Growth production 144 4.2. Microbiology 145 5. Conclusion 152 6. Acknowledgements 152 7. References 152
Chapter 6: Production of salami from beef, mutton, horse, blesbok and springbok c) Sensory evaluation
156
1. Abstract 156 2. Introduction 157 3. Materials and methods 158 3.1. Sensory analysis by a trained panel 158 3.2. Statistical analysis 159 3.3. Sensory analysis by a consumer panel 159 4. Results and discussion 160 4.1. Sensory analysis by a trained panel 161 4.2. Sensory analysis by a consumer panel 164 5. Conclusions 167 6. Acknowledgements 168 7. References 168
Chapter 7: General conclusions 170

xi
NOTES
The language and style used in this thesis are in accordance with the requirements of the
scientific journal, Meat Science. This thesis comprises a compilation of manuscripts, where each
chapter is an individual entity and some repetition between the chapters has, therefore, been
unavoidable.
Papers emanating from results of this study have been presented at the following symposia and
congresses:
1. K.S.C. Koep, L.C. Hoffman, E. Slinde & L. Dicks (2004). Chemical properties of the
meat and blubber of the Cape fur seal (Arctocephalus pusillus pusillus). Annual joint
GSSA – SASAS, June 2004, Goudini Spa, Western Cape, South Africa.
2. K.S.C. Koep, L.C. Hoffman, E. Slinde & L. Dicks (2004). Chemical properties of the
meat and blubber of the Cape fur seal (Arctocephalus pusillus pusillus). International
Congress of Meat Science and Technology (ICoMST), August 2004, Helsinki, Finland.

1
Chapter 1
Introduction
1.1. Introduction
The South African and international meat market is presently experiencing a substantial increase
in the demand for game and other exotic meat types as healthier alternatives to traditional red
meat species. Over time, economic and social changes in civilisations have led to the
transformation and modification of nutritional demands in many societies. Nowadays consumers
favour meat that is authentic, tasty, rich in protein and low in lipid and cholesterol content.
Therefore, the purchase of alternative sources of red meat, as opposed to products from the
traditional species of red-meat-producing animals, is becoming more acceptable.
Growing consumer interest in non-traditional meat products underlies the purpose of this
investigation into the processing potential of species such as seal, horse and certain species of
game animals (blesbok and springbok). Five of the seven species (Cape fur seal, Grey seal,
Minke whale, blesbok and springbok) used in this study are not farmed intensively, and are
therefore considered as wild game (either aquatic or terrestrial). Such animals have had no direct
daily contact with humans and therefore contain minimal chemical substances in their bodies
usually administered by man. Given these differences, comparisons in terms of suitability for
processing can be drawn between these wild species and conventional red meat species such as
beef and mutton. Therefore, this study focuses on a comparative analysis of the following
species: Cape fur seal, the Grey seal, the Minke whale, beef, mutton, horse, blesbok and
springbok.
The Cape fur seal (Arctocephalus pusillus pusillus) is harvested commercially in Namibia, on the
south western coast of Africa. At present, there is a large demand for the hides of the pups and
bulls, but the rest of the carcass is processed to carcass meal, traditionally used to supplement the
diets of ruminants. Due to the occurrence of BSE (Bovine spongiform encephalopathy), there
has been a decrease in the use of animal by-products in any animal feed. An alternative use for
the meat is thus desirable.
As the meat has been shown to be healthy, it is lean meat that contains high concentrations of the
macro-minerals calcium, phosphorous, iron and selenium (Robinson, 1996), the possibility of
processing the meat into a food source presents itself. This would make seal harvesting a more

2
acceptable practice, as it would entail optimal utilisation of the entire carcass of the animal and
would provide a supply of nutritious meat to the consumer. Due to the fact that seal harvesting is
a seasonal occurrence, shelf-stable products need to be developed that will ensure that the
ongoing demand for this meat type is met by a regular supply.
As regards wild game species, Eloff (2002) reported that the annual gross profit of the South
African game industry amounted to R843 million in the year 2000. Game meat sales contributed
only R20 million (2.4%) to this amount, with non-commercial hunting delivering the highest
gross profit, followed by live-game sales and trophy hunting. Since the contribution of game
meat production (jerky hunters and game meat sales) constitutes 67.5% of the total income of the
game industry of South Africa (Potgieter, 2001), research is required to investigate the possibility
of utilising wild game species in processed products, such as salami.
Salami has a long shelf life and is a fairly safe product. Salami may be defined as a mixture of
meat and fat particles, combined with a mixture of NaCl, curing agents and spices that have been
stuffed into either artificial or natural casings. Starter cultures are often used to aid in the
fermentation and maturation of the sausage. An appropriate selection of meat ingredients is very
important for the production of sausages of uniform quality. Fermented sausages traditionally
contain 50-70% lean meat. Any meat species may be used, and the raw meats generally used for
the production of salami are usually the higher valued meat cuts that are free from collagen.
Pork is favoured in countries such as Europe, the USA and China. Elsewhere in the world,
mutton and beef are the preferred species. Chicken and other poultry meat is also used in the
production of fermented sausages.
After drying of the mixture, the final product may contain up to 50% fat, which makes fat an
important ingredient of fermented sausage (Campbell-Platt, 1987). This may lead to problems
such as rancidity, with a direct effect on the shelf life of the product. This plays a key role when
considering the use of seal meat, as the diet of aquatic mammals consists mainly of fish and their
tissue contains more polyunsaturated fatty acids than that of their terrestrial counterparts.
Although these fatty acids are very popular amongst health conscious consumers, they are a
challenge in the food industry when it comes to preventing the rancidity of products.
The most common species of starter cultures used in the fermentation of beef and pork sausages
are strains of Lactobacillus, Pediococcus and non-pathogenic Staphylococcus and Micrococcus
spp. (Lücke, 1986). The major role of lactic acid bacteria in the sausage is to produce organic
acids, primarily lactic acid, from carbohydrates via the Embden-Meyerhof pathway (Campbell-

3
Platt, 1987). This results in a decreased pH and contributes to the retardation of the development
of undesirable micro-organisms.
As the consumer nowadays demands access to ready-to-eat foods and fast foods, processed foods
are becoming evermore popular and the use of alternative red meat species in these processed
products is of particular interest to the food industry. Due to the fact that some similar meat
products often use the lower valued cuts of a carcass, optimal and cost-effective carcass
utilisation can therefore be realised. This is especially important when considering non-
traditional meat species, such as the seal.
1.2. Objectives
No literature could be found on the nutritional value of the meat of the Cape fur seal, and
therefore a baseline investigation into its chemical composition (Trial 1, Fig. 1) was undertaken.
The viability of using seal meat for processing into meat products, such as salami, could open up
the possibility of a more optimal utilisation of the carcass (Trial 2, Fig. 1).
Similarly, the Grey seal (Halichoerus grypus) and the Minke whale (Balaenoptera acutorostrata)
are found in the oceans of the northern hemisphere and are harvested seasonally, as the Cape fur
seal is in the southern hemisphere. The chemical properties of the meat of these two aquatic
mammals needed to be determined prior to assessing the suitability of using these animals in the
production of salami (Trial 3, Fig. 2).
Lastly, the suitability of using non-conventional terrestrial mammals, such as blesbok and
springbok, and more conventional species such as beef, mutton and horse, in the production of
salami was investigated (Trial 4, Fig. 3). The reactions of specific starter cultures in the different
meat types were analysed concurrently, and researched more specifically under controlled
laboratory conditions, to identify the individual reactions relevant to the processing conditions
under which traditional salamis are produced (Trial 5, Fig. 3). An aim of this study was,
therefore, to be able to pin-point starter cultures (which would optimise the production of salami)
utilising different non-traditional meat species. The conditions under which the research was
done were strictly monitored and controlled to eliminate any external factors, which could
influence the study.

4
1.3. Methodology
Cape fur seal (Arctocephalus pusillus pusillus)
Trial 1 Trial 2
Chemical composition
Total moisture
Total proteins and amino acids
Total fat and fatty acids
Mineral content
Production of salami using meat of the Cape fur seal
three batches:
A: pure seal meat
B: seal and pork
C: seal and beef
Two different starter cultures
Parameters
pH
Water activity
Weight
Colour, L*, a*, b*
Chemical composition
Fatty acid composition of the
batter and final product
Figure 1. Investigation of the meat of the Cape fur seal and its potential for the production of
traditional salami.

5
Grey seal
(Halichoerus grypus)
and Minke whale
(Balaenoptera acutorostrata)
Trial 3
Meat Salami
Meat characteristics
Myoglobin content
Total moisture
Total proteins
Total fat and fatty acids
Specifications
Three batches per species,
using different starter cultures
All other ingredients identical
Parameters
pH
Water activity
Colour L*, a*, b*
Texture
Heme dissociation
Viable counts
Chemical composition
Total moisture
Total proteins
Total fat and fatty acids
Figure 2. Investigation of the meat of the Grey seal and Minke whale and their potential for the
production of traditional salami.

6
Production of salami using
beef, mutton, horse, blesbok
and springbok
Trial 4 (meat) Trial 5 (salami)
Meat characteristics
Total moisture
Total proteins
Total fat and fatty acids
Specifications
Three batches per species
using three different starter
cultures
All other ingredients identical
Parameters
pH
Water activity
Weight
Colour L* a* b*
Microbiological evaluation
Chemical analysis
Total moisture
Total proteins
Total fat and fatty acids
Sensory characteristics
Salami aroma & flavour
Sour meat aroma & flavour
Colour & texture
Venison- and muttonlike
flavour
Oily mouthfeel
Structure
Figure 3. Investigation of the meat of horse, beef, mutton, blesbok and springbok and the
potential for the production of salami.

7
2. References
Campbell-Platt, G. (1987). Fermentation Foods of the World. 1st edition, (pp. 87-92).
Cambridge..
Eloff, T. (2002). The economic realities of the game meat industry in South Africa. In H.
Ebedes, B. Reilly, W. van Hoven & B. Penzhorn (ed.), Sustainable utilization –
Conservation in Practice (pp. 78-86). Pretoria, South Africa.
Lücke, F-K. (1986). Microbiological processes in the manufacture of dry sausage and raw ham.
Fleischwirtschaft, 66, 1505-1509.
Potgieter, L. (2001). Many-game – few hunters (Afrikaans). Landbouweekblad, 5 January,
pp. 34-37.
Robinson, P.H. (1996). Evaluation of a seal by-product meal as a feedstuff for dairy cows.
Animal Feed Science and Technology, 63, 51-62.

8
Chapter 2
Literature review
1. INTRODUCTION
Judging by archaeological findings and cave paintings across the globe, as well as orally
transmitted accounts of religious ceremonies and legends from numerous cultures, meat seems to
have formed part of mankind’s staple diet since pre-historic times. Humans have consumed a
very wide range of animals in one form or another, drawing on both wild and domestic groups of
mammals, poultry and fish to fulfill their essential requirements for protein, calories and fats.
Over time, mans’ consumption of this natural resource has evolved considerably; and agricultural
activity has impacted on the production, management and storage of the food sources, resulting
in a proliferation of meat products. In recent times, as the processing of animal flesh has become
more sophisticated, varied and complex, it is becoming more difficult to identify specific species
in meat products. Cuts are either displayed as fresh or frozen, processed to varying degrees
(sous-vide, marinated, dried, smoked, salted, etc.), and prepared ready-to-eat products are
becoming increasingly available.
Over time, economic and social changes across civilisations have led to nutritional demands
being transformed and modified substantially. As a result it is becoming more acceptable to
purchase alternative sources of red meat as opposed to products from traditional red meat
animals. Tastes and preferences have changed and nowadays consumers favour meat that is
genuine, tasty, rich in protein and low in lipid and cholesterol content. Various alternatives are
being explored to meet this new set of consumer demands.
This presents a challenge to meat producers and scientists, as meat production potential, in
general, depends on the growth and development of an animal, whereas carcass quality is mainly
influenced by the distribution of muscle, fat and bone in the body. Muscle, and to a lesser extent
fat, are the major edible tissues of the carcass; bone being a non-edible tissue, with its
proportions in the carcass affecting the proportions of muscle and fat (Mahgoub & Lu, 1998).
Increasing consumer interest in non-traditional meat has shifted the interest to investigating the
production potential and processing ability of species such as seal, horse and certain game
animals, e.g. blesbok and springbok. Some of these animals are not farmed intensively, and have

9
had no direct contact with humans. This implies that their bodies do not contain chemical
substances that could have been administered by human beings. Comparisons need to be drawn
between the meat of these species and that of conventional red meat species, such as beef and
mutton, with regard to quality, palatability and desirability in terms of changing consumer tastes.
Consumers nowadays also demand access to ready-to-eat, fast foods, resulting in processed foods
becoming increasingly popular, and thus the use of alternative red meat species in these
processed products is of additional and particular interest to the meat industry. As processed
meat products usually contain the lower valued cuts of a carcass, optimal carcass utilisation can
be realised by making use of these sections of meat. This fact also addresses cost-related
concerns of meat producers.
In response to these changing expectations and desires from the side of the end-user, cured,
fermented and dried products from different species (Paleari et al., 2000) have recently appeared
on the market and are being sold, alongside traditional red meat products. Venison products are
being sold worldwide. However, the supply of this meat source is dependent to some extent on
the seasonal hunting and harvesting times in different parts of the globe.
Commercial harvesting of game within South Africa is an annual occurrence, and alternative
products need to be researched in utilising this meat. The harvesting of seals in Namibia is set to
continue, and an alternative use of the carcass is called for. At present, not all the meat of these
animals is being utilised. The abundance of seals in their territorial Norwegian waters is leading
to the legalisation of commercial harvesting of these animals and the controlled harvesting of the
Minke whale has been resumed (Björndal & Conrad, 1998). Most of these mammalian species
are harvested seasonally, and therefore the meat is only available for limited periods of time.
Products need to be developed that are shelf stable, to provide a year-round supply of the meat.
Salami, a fermented sausage, is such a product.
Traditional salami has a pH of less than 5.0 and a water activity of less than 0.9, which results in
it being shelf stable at ambient temperatures.
10
2. POTENTIAL PRODUCTION OF SALAMI FROM ALTERNATIVE RED MEAT
Comminuted raw meats, which are fermented into various sausages, require the addition of salt,
nitrate/nitrite, and specific lactic-acid bacteria as starter cultures. If fermented correctly,
pathogens will be destroyed or their numbers decreased to improve the quality of the product and
increase its shelf life. In addition, desirable sensory properties develop, such as the cured pink
colour, distinct flavour and firm texture, characteristic of this type of product (Holzapfel, 1998).
2.1. Background to salami
Salami is defined as a mixture of meat and fat particles containing salt (NaCl), curing agents, and
spices stuffed into either artificial or natural casings. Starter cultures are used to aid in the
fermentation and maturation of the sausage. Fermentation processes were developed to enhance
the production of dried meats at a time when drying was the only means of preservation. It is
thought that fermentation was first used by the Chinese approximately 2 000 years ago, with salt
and nitrate being introduced around the 13th century. The name salami is derived from the Latin
word – sale, meaning salt (Campbell-Platt, 1995).
A large variety of salami has been developed worldwide. A common basis for classifying
fermented sausages is the length of processing, final water content and water activity (aw) level.
Based on these criteria, salami is divided into the following categories: spreadable; sliceable,
short processed; and sliceable, long processed (Table 1).
Table 1
Classification of fermented sausages adapted from Campbell-Platt (1987)
Spreadable Sliceable, short processed
Sliceable, long processed
Process lggength 3-5 days 1– 4weeks 12-14 weeks Final water content 34-42% 30–40% 20-30% Final aw level 0.95 – 0.96 0.92 – 0.94 0.82 – 0.86 Examples Teewurst,
Mettwurst (Germany)
Summer sausage (US), Thuringer (Germany)
Salami, Saucisson (France), Chorizo (Spain)
2.2. Ingredients
An appropriate selection of meat ingredients is very important for the production of sausages of
uniform quality. Salami traditionally contains 50-70% lean meat, and any meat species can be
used for the production of sausages. Pork is favoured in countries such as Europe, the USA and
China. Elsewhere in the world, mutton and beef are the preferred meat species. Chicken and

11
other poultry meat is also used in the production of fermented sausages. Meat used in the
production of salami should be suitable in terms of water-holding capacity, pH value and colour.
When pork is used, the initial pH value should be between 5.6 and 6.0, which is lower than that
of other red meat species.
After drying, the final product may contain up to 50% fat, which makes fat an important
ingredient of fermented sausages. This may lead to problems such as rancidity, which has a
direct effect on the shelf life of the product. As cited by Morrissey et al. (1998), the relative
oxidation rates of fatty acids containing 1, 2, 3, 4, 5 or 6 double bonds are 0.025, 1, 2, 4, 6 and 8,
respectively (Horwitz, 1986). Therefore, both palmitoleic and stearic acid would be more
susceptible to oxidation than would fatty acids containing no double bonds. The changes in
quality are realised by adverse changes in flavour, colour, texture as well as nutritive value, and
the possible production of toxic compounds (Gray, Goma & Buckley, 1996; Morrissey, et al.,
1998). However, oxidation is vital in developing desirable flavours of dry cured ham or
fermented sausages (Chizzolini, Novelli & Zanardi, 1998; Ladikos & Lougovois, 1990). During
sausage processing a few factors influence the rate of lipid oxidation. These are the actual
composition of raw meats, the grinding action and the addition of exogenous components such as
salt, nitrite, spices and antioxidants (Kanner, 1994).
Many substances can be added to act as anti-oxidants. These include ascorbic acid/ascorbate,
which also acts as a curing agent and stabilises the colour, and tocopherol, used due to its
different properties compared to ascorbic acid.
Eight vitamins of vitamin E occur in nature, of which four are tocopherols. The other four are
tocotrienols (Ball, 1996). These compounds consist of substituted ring systems linked to a phytyl
side chain. The four main forms are designated alpha, beta, delta and gamma, depending on the
number and position of the methyl groups on the chromanol ring. The acetate ester of
α-tocopherol, instead of the free alcohol, is used in food products due to its greater stability (Ball,
1996).
The alkyl radical (R) is overactive in an aerobic environment for any competing species to
successfully reduce R to RH before oxygen is added to establish the peroxy radical (ROO). In
this form, ROO is quite a stable free radical, which reacts slowly with target polyunsaturated
fatty acids (PUFA). This is the accepted point of action for free-radical scavenging antioxidants
such as phenolic tocopherol. Tocopherol is able to reduce ROO to ROOH so easily that
tocopherol is competitive with biologically sensitive targets such as the unsaturated lipids, RH,
12
even at levels 10 000 times lower (Branen et al., 2002). Tocopherols are soluble in lipids and in
aqueous solutions. Therefore, tocopherol is an important tool in controlling rancidity in products
with a high fat (PUFA) content.
As the diet of aquatic mammals consists mainly of fish, their tissues contain more PUFA than the
tissues of their terrestrial counterparts. Although these fatty acids are very popular in health
conscious consumers, they are a challenge in the food industry when it comes to preventing
rancidity of products and thereby increasing the shelf life of products.
Salt (NaCl) is generally added to the batter at a concentration of 2.5 – 3.0%, salt being the single
most critical non-meat ingredient. Salt is added to extract the soluble proteins from the meat
particles, thereby forming an adhesive film which aids in the cohesion with the other ingredients
of the sausage. Nitrite is also added regularly and is an important factor in the formation of the
colour of many fermented meat products and the retarding of lipid oxidation. The maximum
level of nitrite allowed in sausages is between 120 and 150ppm (Campbell-Platt, 1987). Both
NaCl and nitrite play vital roles in creating a favourable environment for the development of
lactic acid bacteria in the early stages of fermentation and retard the growth of undesirable micro-
organisms.
Commonly used spices in the production of salami globally are cumin seed, fennel seed, dried
garlic, mustard, and pepper. In some countries, producers may also use other ingredients such
as: red wine, berry extracts, and artificial flavourants to influence flavour and mask unpleasant
flavours (Arboles & Julia, 1992).
Commercially produced starter cultures from various bacterial strains are used in the production
of fermented sausages, and are usually added to the batter shortly after the salt, in a liquid form,
to ensure equal distribution of the bacteria.
2.3. Use of starter cultures
The first commercially used meat starter culture in the United States, in 1957, comprised a single
strain of Pediococcus acidilactici (Niven et al., 1959; Everson et al., 1970). The first starter
culture in Europe was also made up of a single strain of Kocuria, named M53 (Niinivaara et al.,
1964). Thereafter, a variety of combinations of starter cultures were developed to produce a
broad spectrum of metabolic properties.

13
At present almost all commercial production of fermented sausages is carried out with the use of
selected starter cultures or inoculants. Starter cultures are available as either a frozen
concentrates or lyophilised dry powder. Commercially used starter cultures are usually cocktails
of two or more different micro-organisms and sometimes even different strains of the same
species. The most commonly used cultures are strains of homofermentative Lactobacillus spp.,
Pediococcus spp., Lactococcus spp., and Micrococcus spp. (used to reduce nitrate to nitrite).
Specific examples are Lactobacillus plantarum, Pediococcus acidilactici and Lactococcus lactis
subspp. lactis (Xiong & Mikel, 2001).
i) Lactic acid bacteria
The two Lactobacillus spp. most commonly used are Lactobacillus sakei and Lactobacillus
curvatus. These are psychotrophic, with optimal growth at approximately 30oC, which makes
them favourable in European conditions. L. plantarum and Pediococcus spp. are mesophilic,
with optimal growth temperatures between 30 and 35oC, which renders them more favourable in
countries with a warmer climate.
There are certain criteria that lactic acid bacteria starter cultures should meet when being
included in food products (see Table 2). Various species have been, and are, used as inoculants
in sausage fermentations, of which L. plantarum, L. curvatus, Pediococcus damnosus and P.
acidilactici are the most popular (Campbell-Platt, 1987).
The fermentation of carbohydrates leads to the following desirable results: (a) production of
organic acids, which lead to the reduced pH value; (b) production of favourable organoleptic
compounds; (c) coagulation of meat proteins, thereby decreasing the water holding capacity and
thus, facilitating the drying process, which affects the texture and firmness of the end product,
and (d) red colour formation due to the reaction of nitrogen monoxide with the heme group in
myoglobin (pH 5.4 to 5.5).
The synthesis of bacteriocins acting against undesirable micro-organisms is a vital property,
which is desired when selecting starter cultures for the fermentation of meat products.
Bacteriocinogenic strains of L. sakei, L. curvatus, L. plantarum, and Pediococcus spp. are
known, but are not extensively used in commercial practices.

14
Table 2
Criteria characteristic of lactic acid bacteria starter cultures used in sausage fermentations
(Campbell-Platt, 1987)
1 Compete effectively with indigenous lactic acid bacteria.
2 Produce adequate quantities of lactic acid.
3 Grow in the presence of up to 6% NaCl.
4 Tolerate NaNO2 at concentrations of up to 100mg/kg.
5 Grow between 15 oC and 40oC, with an optimum between 30 oC and 37oC.
6 Homo-fermentative.
7 Non-proteolytic.
8 Do not produce large quantities of H2O2.
9 Catalase-positive.
10 Reduce nitrate.
11 Enhance flavour of the finished sausage.
12 Do not produce biogenic amines.
13 Do not produce slime.
14 Antagonistic to pathogenic and other undesirable micro-organisms.
15 Tolerant of, or synergistic with, other starter components.
ii) Micrococcaceae
Selected strains of Kocuria and Staphylococcus spp are used as starter cultures. Due to the
metabolic activity of Staphylococcus under anaerobic conditions, it is more competitive than
Kocuria. Colour formation and stabilisation, as well as aroma development, are the primary
effects these bacteria have on fermenting sausages. This is due to their catalase and nitrate and
nitrite reductase activities, a process that has been researched by Neubauer & Goetz (1996).
However, micrococcacea are not proteolytically active and play a more active role in lipid
metabolism and the generation of volatile aromatic components (Johansson et al., 1993; Stahnke,
1995).
2.4. Preparation of fermented sausage batter
There are two main factors that need to be taken into account in the preparation of the batter of
these sausages: 1) the need for the sausage to lose water easily during drying, and 2) the high fat
content of the batter.

15
Lean meat is usually cut to an average diameter of 3mm at temperatures between –4oC and
slightly above 0oC, to prevent water from binding. The fat is cut while still frozen, at a
temperature of ca. -8oC. This temperature is required to prevent smearing and the coating of the
meat particles with a layer of fat, which would lead to a decreased water loss from the particles.
Salts, spices and other additives are then added, with special attention being given to the equal
distribution of each into the batter.
The batter is then stuffed into casings, which can be of varying diameters and made from
different materials such as artificial cellulose or natural intestine. The casing must allow
evaporation of water, penetration of smoke and shrinkage during drying. It is advisable to keep
the temperature of the batter during stuffing below 1oC, to avoid smearing of the fat (Price &
Schweigert, 1987).
2.5. Fermentation of sausage
During fermentation, active growth and metabolism of lactic acid bacteria is encouraged, and this
leads to a decrease in pH. The major role of lactic acid bacteria in the sausage is to produce
organic acids, primarily lactic acid, from carbohydrates, via the Embden-Meyerhof pathway
(Campbell-Platt, 1987). This results in a decrease in pH and contributes to the retardation of the
development of undesirable micro-organisms. The decreased pH also leads to a reduced water-
holding capacity of proteins and ensures correct desiccation of the product. To achieve this, ca.
5% of a carbohydrate source, e.g. dextrose, is added to the mixture to serve as an energy source
(Campbell-Platt, 1987).
When fermentation proceeds correctly, growth of lactic acid bacteria is rapid, and levels of
106–108 cfu (colony forming units)/g are reached after 2–5 days of fermentation. The decrease in
pH leads to the destruction of Pseudomonas and other acid-sensitive Gram-negative bacteria
within 2–3 days, although more acid tolerant genera, including Salmonella, can persist for longer
periods. The amount of lactic acid bacteria found in the sausage declines after reaching the peak.
The course of fermentation due to inoculations of starter cultures of lactic acid bacteria is
essentially the same as that of natural fermentation, the one advantage being that lactic acid
bacteria may dominate earlier in the process (Campbell-Platt, 1987).
2.6. Drying and maturation of sausage
The ripening and drying time of fermenting sausage depends on the type of starter cultures used,
as well as the type of product. The period allowed for the product to ripen also depends on the
diameter of the sausage, and can take anything from 20 days to 3 months. There are three
16
distinct groups of fermented sausages (Flores, 1997): (a) rapid (<7 days), (b) regular
(approximately 3 weeks), and (c) slow (up to 3 to 4 months).
Rapid ripening systems, which use controlled drying chambers and improved starter cultures, are
increasingly replacing traditional fermentation technology. Although the reduced fermentation
time is of advantage to the producer, rapidly ripened sausages tend to have an intense acid
flavour (Sanz et al., 1998), which is not acceptable to all consumers (Arboles & Julia, 1992).
The physio-chemical and sensory qualities of fermented sausage rely heavily on the extent of
drying of the product. An important factor when drying sausage is that the rate of moisture loss
from the surface should be equal to the rate at which moisture moves from the sausage interior.
Rapid drying is only possible when the pH value is low and the correspondingly low solubility of
proteins enables moisture loss. The drying of a sausage also depends on the diameter of the
sausage. Drying is executed at low temperatures, normally below 20oC (Flores, 1997).
Smoke is applied to many types of semi-dry sausages during the drying stage. The results of
smoke application to meat products can be summed up as: improved flavour and colour
enhancement, antimicrobial, and anti-oxidising actions (Price & Schweigert, 1987). The main
reason for smoking meat is to preserve it, but smoking also provides flavour and colour. Smoke
is also applied to inhibit mould growth by drying the surface and by the deposition of
antimicrobial phenols, carbonyls and low molecular weight organic acids. Phenolic compounds
decrease the extent of fat oxidation. Smoking also affects the organoleptic qualities of the
sausage. The pyrolysis of cellulose and hemicellulose in the casing of the fermenting sausage
produces carbonyls (Price & Schweigert, 1987). These are important in the development of
colour of the meat when smoked, as the carbonyls are absorbed into the surface of the sausage.
The reaction between carbonyls and amino groups is similar to the Maillard reaction, and is
enhanced by the increase in temperature and dryness of the product (Gilbert & Knowles, 1975).
Two types of smoking are considered in the production of fermented sausages, i.e. hot and/or
cold smoke application. During the hot smoke application, smoke is applied during the thermal
processing of the product. Cold smoking is usually used for products that have undergone
thermal processing or require only low levels of thermal processing. Salami, which falls under
the category of a dry fermented sausage, undergoes low levels of thermal processing (Campbell-
Platt, 1978).

17
2.7. Chemical and physical changes during production of fermented sausages
Lactic acid production and the consequent drop in pH influence the organoleptic properties of
fermented sausages. Lactic acid results in a ‘tangy’, acidic characteristic. Lactic acid has the
potential of enhancing saltiness and the low pH values may change flavour by restricting
proteolytic and lipolytic enzyme activity (Lücke, 1986).
As the consistency of the sausage relies upon the pH and the water activity (aw) level, these
factors need to be closely monitored to ensure optimum consistency. A pH value below 5.4 and
aw level of less than 0.9 are required. The aw is a measure of the partial vapour pressure of the
foodstuffs, compared to that of pure water at its surface. Water molecules are loosely orientated
in pure liquid water and can easily rearrange. When solutes such as NaCl are introduced to aid in
the reduction of water activity, they orientate the water molecules around them and make them
less available for use by micro-organisms. Reduction of the aw level during drying is a function
of water loss and increase in solute concentration (Campbell-Platt & Cook, 1995). A decrease in
aw will inhibit the growth of undesirable micro-organisms, and therefore rapid drying of the
product is desirable. Lu & Townsend (1973), for example, removed as much water as possible
from meat prior to fermentation by freeze-drying it. As water is required for fermentation, this
strategy did not produce suitable sausage. Other strategies to reduce water activity levels are by
reducing the water binding capacity of the batter by adding Pale, Soft, Exudative (PSE) meat
(Townsend et al., 1980). Chin et al. (1995) reduced the drying time period by up to 30%,
regardless of environmental temperatures (17, 19 and 22oC), by drying pepperoni sausages under
vacuum.
The aw level of fresh sausage batter is high, dependant on solute concentration and fat content.
This condition is favourable for the development of Micrococcus or Staphylococcus in the first
stages of fermentation, but is enough to inhibit other micro-organisms. A decrease in the aw level
during drying is caused by loss of water and an increased solute content (Campbell-Platt, 1978).
Decreased solubility of proteins is due to pH decrease, leading to an increased gel forming
ability, which is enhanced by the addition of NaCl. Myofibrillar proteins show the largest
decline in solubility at low pH values and can be considered more important with regards to
consistency than sarcoplasmic proteins (Gilbert & Knowles, 1975).
The flavour of fermented sausages is most likely due to the free fatty acids and carbonyl
compounds. Formation of these is aided by lipases. In many sausages intense lipolysis occurs
during ripening. As lipolysis continues, a decrease in triacylglycerol fatty acids corresponds to
18
an increase in diacylglycerols, free fatty acids and, to a lesser extent, monoacylglycerols. Higher
temperatures increase lipolytic activity, although apparent lipolytic activity drops. This is
brought about by temperature dependant feedback inhibition of lipases by free fatty acids (Lücke,
1986).
Unsaturated fatty acids are exclusively involved in oxidative changes in the fat of fermented
sausages. Oxidation leads to the formation of lipid peroxides and carbonyl compounds, which
are linked to an increased peroxide value. An increased peroxide value is highest when
Lactobacillus is present (Horwitz, 1986).
An increased rate of auto oxidation of myoglobin to metmyoglobin is brought about by the low
pH value, which destabilises myoglobin. The heme group of the pigment dissociates at the low
pH of fermented sausages and the observed colour is primarily due to the formation of
nitrosomyoglobin or nitroso-heme (Slinde & Nordal, 1978).
According to Verplaetse (1994) there are internal and external factors influencing flavour
development. Internal factors are said to be chemical or microbiological, the external being the
physical, such as the climatic conditions throughout the process.
Apart from the effects of spices and salts, carbohydrate, lipid and protein catabolism results in
the flavour associated with fermentative sausages due to the action of microbial and endogenous
meat enzymes (Toldra et al., 1998). Other reactions, such as auto oxidation, also form flavour
components without direct enzymatic participation (Toldra et al., 1998).
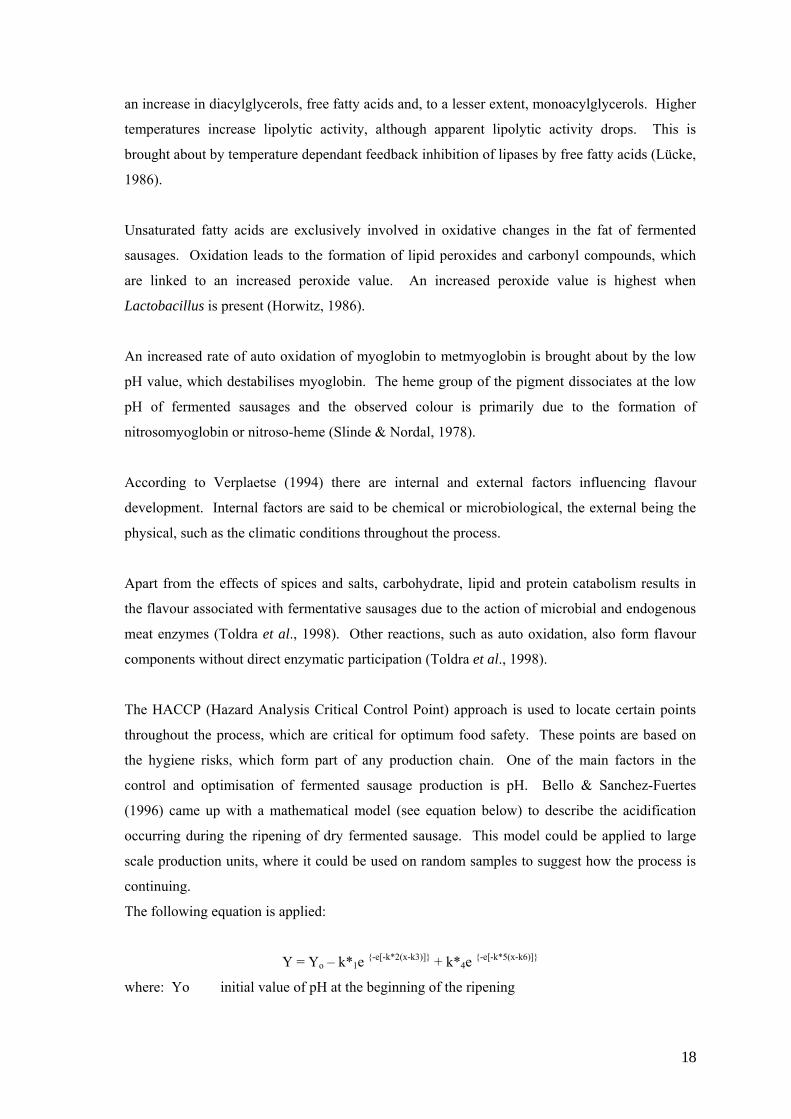
The HACCP (Hazard Analysis Critical Control Point) approach is used to locate certain points
throughout the process, which are critical for optimum food safety. These points are based on
the hygiene risks, which form part of any production chain. One of the main factors in the
control and optimisation of fermented sausage production is pH. Bello & Sanchez-Fuertes
(1996) came up with a mathematical model (see equation below) to describe the acidification
occurring during the ripening of dry fermented sausage. This model could be applied to large
scale production units, where it could be used on random samples to suggest how the process is
continuing.
The following equation is applied:
Y = Yo – k*1e {-e[-k*2(x-k3)]} + k*4e {-e[-k*5(x-k6)]}
where: Yo initial value of pH at the beginning of the ripening

19
x time of curing process (days)
k1 reduction of pH from an initial level to minimum value reached
k2 rate of reduction with relation to pH
k3 time at which the decline of pH is maximum
k4 increase of pH from the minimum value to the level at which the sausage
experiences last day of ripening
k5 rate of relative increment to pH
k6 time in which the increment of velocity of pH is maximum
Dry fermented sausage is a very popular product on the international market and differences exist
in each country as to which type of fermented sausage is preferred. However, the main
production factors,, i.e. pH, water activity and sensory qualities, remain the same (Arboles &
Julia, 1992).
Technological advances are constantly being made to ensure a product that is safe and acceptable
to the consumer. The development of new techniques, such as the measurement of pH, water
activity, colour and microbiological assessments of any meat product, lead to ongoing
improvements in this industry. At the same time, however, the many meat-product recipes and
methods that originated many years ago have to be taken into consideration when producing a
traditional product. Considerably more scientific research is required with regard to the
suitability of particular meat types for certain processing systems, and how these can be
improved, to secure a continuous supply of consistently high quality meat products.
2.8. Composition and nutritive value of salami
Campbell-Platt (1987) suggested that salami should have the composition and nutritive values as
listed in Table 3. These values are, however, dependant on the type and quantity of ingredients
used in the processing of the products.
Table 3 shows that the moisture, protein and fat are the three most abundant ingredients in
traditional salami. All these ingredients, but in particular the latter two, are determined by the
type of meat and lard used. Pork fat is preferred as a fat source. Meat types may vary in quality
(cut) and species. Alternative animal species are being used more often in the new millennium.
Some species that have been identified in this investigation as having potential value are seal,
whale, blesbok and springbok. These species are discussed in detail in the following section, as
well as the more commonly used beef, horse and mutton.

20
Table 3
Suggested composition and nutritive value (per 100g) of traditional salami (Campbell-Platt,
1987)
Component Mass Moisture 24-35g Protein 23-27g Fat 53-57g Carbohydrate 2-3g Fiber 0 NaCl 5-7g Energy 660-700kcal or 2.6-2.9MJ Na 2500mg K 210mg Ca 70mg Mg 18mg P 220mg Fe 1mg Cu 0.3mg Zn 2mg S 170mg Thiamin 0.3mg Riboflavin 0.3mg Niacin 6mg Vitamin E 0.4mg Vitamin C 0 Vitamin B6 0.2mg Pantothenic acid 1mg Vitamin B12 1μg Biotin 4μg Free folic acid 3μg Total folic acid 4μg

21
3. ALTERNATIVE RED MEAT SPECIES
3.1. Aquatic mammals
3.1.1) Seals and sea lions
During the previous century many control programmes, aimed at reducing or limiting the
numbers of seals or cetaceans, were implemented around the world. These activities took
various forms, from bounties and culls, lasting several decades (e.g. a bounty on harbour seals
Phoca vitulina in eastern and western Canada), to once-off hunts sponsored by governments (an
open season on New Zealand fur seals Arctocephalus forsteri in 1946). Culls were implemented
through existing commercial hunts. Authorities would subsidise a hunt to encourage it to take
more animals than it otherwise would have, or a marine mammal harvest was managed with the
aim of reducing, rather than merely maintaining, the marine mammal population. However,
increasingly, these practices came under criticism from animal rights groups during the second
half of the twentieth century (Vogel & Koch, 1992).
Seal products have traditionally comprised food delicacies and fur products made mainly from
pelts. Oils have also been produced and used largely in commercial/industrial applications.
However, this utilisation is changing, and presently a stronger emphasis is being placed on seal
oils for human consumption and various uses are being found for seal meat. In the fashion
industry a broader range of fur, leather and suede products is being manufactured from the pelts.
This is a strong indication of the growing interest in the full utilisation of the animal.
In the late 1970’s, it became apparent that many commercial fish stocks were being seriously
endangered and suggestions were made to reduce populations perceived as competing with
fisheries, to improve fisheries’ yields. This occurred despite the influence of strong
internationally based anti-harvesting groups. However, conservation and animal welfare
organisations objected to such culls on ecological and ethical grounds, and there is still an
ongoing difference of opinion among scientists about their potential effect (Butterworth et al.,
1995).
As a result of these controversies, “sustainable utilisation” is presently defined as harvesting only
the natural annual growth of a population, without depleting it to such a low level that the growth
is greatly reduced (Butterworth et al., 1995). “Culling” is the term used when the aim is to
reduce the population size. In both processes, animals of both sexes and all ages may be killed,
but females may be targeted especially to achieve the fastest reduction in numbers.
22
According to Shahidi & Synowiecki (1993), the quality of seal meat is comparable to or better
than that of other sources of animal protein, with its intramuscular lipids. The latter are present
in the blubber and are an excellent source of omega-3 fatty acids. A myoglobin content of up to
10% provides the opportunity to utilise seal meat as a colour contributor in meat products
utilising meats of lesser colour quality or potential (Synowiecki et al., 1992).
The level of iron in the meat is also especially high (Shahidi & Synowiecki, 1993), which makes
it an even more desirable commodity, especially in countries where meat constitutes a large part
of the population’s diet. The main contributors to this absorbable dietary iron are haemoglobin
and myoglobin. Heme iron is the form in which the human body most easily absorbs iron, as the
availability of nonheme iron is affected by promoting and inhibiting components in the diet
(Conrad et al., 1967). As seal meat is very rich in myoglobin and haemoglobin (Synowiecki et
al., 1992), due to the need of the seal’s body to carry more oxygen in the muscle than terrestrial
mammals, it can be deduced that seal meat is a rich source of heme iron. One of the main
hemoproteins in muscle is myoglobin, which serves as an oxygen reservoir in live animals. It is
not only a source of iron, but also functions as a catalyst in the auto-oxidation of lipids (Shahidi
& Hong, 1991).
Seal oil is very high in omega-3 fatty acids, which make it a valuable health commodity. In
countries where the refining and purification of seal oil is not undertaken, it is used in industrial
applications. Seal meat is very high in protein and is used in a variety of ways – including the
manufacture of food products for human consumption (Shahidi & Synowiecki, 1993).
One of the major concerns regarding the utilisation of marine mammal tissue is the increasing
threat of persistent organic pollutants (POPs) in many of the world’s seal populations, such as in
the Californian sea lions (Zalophus californianus), Wadden Sea harbour seals (Phoca vitulina),
Baltic ringed seals (Phoca hispida) and Grey seals (Halichoerus grypus) (DeLong et al., 1973;
Reijnders, 1986).
POPs comprise a group of synthetic organic compounds, produced for industrial and agricultural
purposes, or are by-products of other industrial processes. Many of these compounds are found
in the high-lipid organs of animals, as they are fat-soluble (lipophilic) and continual; they
therefore accumulate efficiently in the thick blubber layers of marine mammals (Tanabe et al.,

23
1988). Large amounts of POPs are also transferred to young via the very rich milk of their
mothers (Addison & Brodie, 1987).
Polychlorinated biophenyls (PCBs) and 1,1,1-trichloro-2,2,-bis[p-chlorophenyl] ethanes (DDTs),
especially, are regarded as environmental pollutants due to their chemical stability and
persistence in the environment. The levels of these undesirable compounds are especially high in
marine mammals, as these are situated at the apex of the aquatic food web and the concentrations
of these compounds increase along the food chain (Nyman et al., 2002). This accumulation of
POPs along the food chain is highly dependent on the ability of the various organisms to
metabolise them. Marine mammals are thought to be less efficient in metabolising POPs than
other aquatic organisms (Tanabe et al., 1988). In humans, these chemicals have been known to
cause genetic mutations and therefore defects and abnormalities in appearance and behaviour.
Pathological changes and various abnormalities, such as an increased disposition to infectious
disease, have been associated with abnormally high POP levels in wild marine mammal
populations (Bergman et al., 1992; Mortensen et al., 1992; Olssen et al., 1994; Jepson et al.,
1999). Literature studies on harbour seals have revealed that, although there is no evidence that
contaminants directly cause mortality in any marine mammal population, there are negative
effects on reproduction, the immune system, hormonal and vitamin A status (Reijnders, 1986;
Brouwer et al., 1989).
In the aquatic environment, trace elements such as mercury and cadmium, derived from natural
or anthropogenic sources, are known to bioaccumulate along the food chain (Dietz et al., 1996).
High levels of these metals have been observed in marine mammals, while levels of other metals
are usually low (AMAP, 1998).
Many metals occur in large quantities in biota, and many of these are essential for the organism.
Others have no known biological function, and some of these may be harmful to the exposed
organism. In studies on metals in marine mammals, mercury, cadmium and lead have been a
major focus due to their known danger and toxicity to humans and other mammals (AMAP,
1998; O’Shea, 1999). However, their concentrations have been below levels that are
toxicologically relevant or no associated effects have been observed (AMAP, 1998).
However, since the ban of PCBs and DDTs in countries around the Baltic Sea, their levels,
especially those of DDTs, have decreased in this ecosystem (Bignert et al., 1998) and the

24
concentration of these chemicals in marine animals has decreased accordingly, contributing
towards its quality and desirability as a potential source of protein.
i) The Cape fur seal (Arctocephalus pusillus pusillus)
Arctocephalus pusillus pusillus, the South African fur seal, is found along the coasts of Southern
Africa and Namibia only. It is the sole resident seal species in Southern Africa. Breeding
colonies are distributed from Black Rocks (33o50’S, 26o16E) in Algoa Bay, on the southeast
coast near Port Elizabeth in South Africa, all the way to Cape Cross (21o46’S, 13o58E) in
Namibia. The species range does, however, extend further north to Cape Frio (18o26’S,
12 o00E), near the northern border of Namibia with Angola.
The Cape fur seal is a marine mammal that is equally at home on land or sea. Males of this
species are an average of 2.3m in length and weigh from 200 to 350kg. Their coat is grey or
black in colour and lighter on the underside (Schliemann, 1990). Female Cape fur seals are
smaller, weighing an average of 120kg and measuring an average of 1.8m long. Their coats are
brown with lighter shading on the underside (Schliemann, 1990).
Fur seal harvesting is one of the oldest ‘fishing’ practices in South Africa. The Dutch were the
first commercial sealers and killed approximately 45 000 Cape fur seals in 1610 alone
(Shaughnessy & Best, 1981). The European settlement at the Cape in 1652 resulted in most of
the seals in and around Table Bay being destroyed (Shaughnessy & Best, 1982). British and
American sealers moved in around the late 18th and early 19th centuries and exploited west coast
seal herds (Best & Shaughnessy, 1979; Shaughnessy & Best, 1982). Up to and including the turn
of the 20th century, Arctocephalus pusillus pusillus were almost extinct, as about 23 colonies had
been exterminated and the total number of animals on the colonial islands was reduced to
approximately 20 000 (Shaughnessy & Best, 1982).
In the early 1980s, four mainland colonies, out of a total of 53 colonies around Southern Africa’s
vast coastline, remained and consequently produced 75% of all pups presently born in Southern
Africa. This was due to extensive culling of the animals, which then moved and re-established
themselves elsewhere. Whilst the mass movement of hundreds of thousands of seals was taking
place, 54% of the known breeding colonies became extinct. At this time, seal pup fur was a most
profitable commodity and the well-known Cape Fur seal officially became the South African fur
seal. This has meant that 20 out of an original 37 offshore island colonies have become entirely
extinct over the past 60 years. Currently, 97% of all Southern African Fur seals are found on the

25
west coast and a mere 3% on the east coast of South Africa. Cape fur seals in South Africa are
protected by Appendix II of CITES.
The population is thought to be 1.5–2 million animals, of which 67% are found along the coast of
Namibia (Butterworth & Wickens, 1990). Of the 25 breeding colonies, six are on the mainland
and the others on small islands. Of the ten haul-out sites, only four are on islands (Oosthuizen,
1991). According to Butterworth et al. (1988), the population increases at a rate of 4% per
annum.
Harvesting is an economically driven activity, by which specific age classes are selected for use
in the manufacture of products. In the case of seals, adult cows have no economic value, leaving
only pups and bulls to be killed, the pups for their pelts and the bulls primarily for their genitals,
which fetch high prices in the Far East as aphrodisiacs, as well as for their leather and their oil.
‘Common-sense’ arguments that culling seals will benefit the fisheries are based on mythological
views of predators, which have been unsubstantiated by most scientific evidence. Research
conducted in other fisheries has indicated that the complexity of marine food webs, as well as the
diversity of seal diets, could mean that increased seal numbers may lead to positive effects on
commercial fish stocks.
In the South Atlantic, South African fisheries biologists and the fishing industry were concerned
that Cape fur seals were depleting the hake Merluccius spp. stock. Initially, there was a call for
the culling of seals. The policy was reversed, however, when it was realised that the seals were
involved in a complex relationship which could well be increasing hake production (Butterworth
et al. 1988; Anonymous, 1991; Punt, 1994).
For the past five years, the annual Namibian quota for the culling of the Cape fur seal has been
30 000 pups and 3 500 bulls. The harvesting season extends from September to the end of
November, when the pups are at the point of being weaned from their mothers, who are pregnant
with the next pups at that time. These quotas are scientifically reviewed every five years, and are
based on annual seal population counts. Many more seals are hunted, illegally, by fishermen,
and these approximate numbers are also taken into consideration in the annual quota. As the
harvesting is destined to continue, research is required in order to make it a more acceptable
practice (W. Burger PO Box 955, Luderitz, Namibia, personal communication).

26
ii) The Grey (Havert) seal (Halichoerus grypus)
The Grey seal is classified as being a part of the Mammalia class, of the order pinnipedia and
belongs to the family phocidae. It is a large seal, whose diet consists primarily of fish and which
lives in the coastal seas of the temperate North Atlantic. It is believed that approximately fifty
percent of the global Grey seal population is found in British waters, and the western North Sea
(De Jong et al., 1997).
Adult males in the eastern population can measure up to 2.5m in length, and have a weight of up
to 310kg. The females measure up to 2.1m and weigh up to 180kg. Males are known to reach
sexual maturity between 4 and 6 years, and females between 3 and 5 years.
This seal species was, in historical times, indigenous to the south-eastern North Sea, but
population numbers gradually decreased from the early middle ages, due to increased human
predation (Reijnders et al., 1995). It occurs on both sides of the Atlantic Ocean, and is divided
into three populations. The western Atlantic population occurs in the Canadian Maritime
Provinces, the eastern Atlantic population is found around the coasts of the UK and Ireland, and
on the coasts of the Faroe Islands, Iceland, Norway, and northwestern Russia as far as the White
Sea. The third population is located in the Baltic Sea and is quite distinct from the Atlantic
population (Seal Conservation Society, 2000).
Estimated numbers of these populations are: 150 000 in the western Atlantic population,
130 000-140 000 in the eastern Atlantic population, and approximately 75 000 in the Baltic Sea.
This produces a total estimate of 290 000-300 000 Grey seals. This seal species is listed as an
Appendix III species under the Bern convention.
The Grey seal is closely related to the Harbour seal (Phoca v. vitulina), with one major difference
being that the pups of the Harbour seal are born and reared on temporarily flooded ground,
whereas those of the Grey seal are more like the pups of the ice-breeding arctic phocids that bear
immature, white-coated pups, which require a permanently dry area to mature (McLaren, 1975).
Grey seals breed most frequently on sandy or rocky shores, but can also be found on various
kinds of sea ice (Riedman, 1990).
One factor which is extremely relevant to the survival and ecology of these seals in the south-
eastern North Sea, specifically, is the shortage of adequate breeding habitat, an area which is
undisturbed, permanently dry and in close proximity to open water. At present, pups are born
and reared in areas that are prone to being flooded (t’Hart et al., 1988; Vogel & Koch, 1992).

27
The Grey seal is not known to travel far distances; most of its travel is directed towards haul-out
sites and following food (McConnell et al., 1999).
This species is also regarded as being responsible for depleting fish stocks in its habitat.
Although large-scale commercial harvesting of the seal has not occurred in recent years, there are
frequent calls for the culling of Grey seals, particularly in Canada, the UK and Ireland, based
primarily on commercial fishing interests. Another argument in favour of the culling of these
animals is the fact that the Grey seal is a known host to the codworm parasite, causing large-scale
codworm infestation in cod and flatfish stocks (McLaren, 1975).
Apart from this, Grey seals are frequently shot by fishermen to prevent them from doing damage
to nets, traps and catch, and this form of shooting is legal in most countries within the Grey seal’s
domain. Marine debris also causes major problems to the seals due to entanglement.
Furthermore, seals are prone to sporadic disease outbreaks, for example, many hundreds of seals
died due to the epizootic of Phocine Distemper Virus in 1988, resulting in a 12% reduction in
Grey seal pup production (Seal Conservation Society, 2000).
3.1.2) Minke whale (Balaenoptera acutorostrata)
According to Rice (1998), there are two species of Minke whale: the Northern Minke whale
Balaenoptera acutorostrata, and the Antarctic Minke whale Balaenoptera bonaerensis. At least
two subspecies of the Northern Minke whale occur: the North Atlantic form B. acutorostrata
acutorostrata and the North Pacific form B. acutorostrata scammoni. The common name is
derived from the Norwegian ‘Minkehval’.
The Minke whale is the smallest member of the rorquals, with a body length of between 8 and
10m and a weight of 8-13.5t. It is stocky, but slender, with a small, narrow triangular head and
pointed, paddle-like flippers. The dorsal fin is relatively tall, and sickle-shaped, and is set about
two thirds of the way along the back. The body colour is dark slate-grey, with paler grey to
white on the undersides and throat, on which there are between 50-70 grooves. Each flipper
usually bears a bright white band, which is noticeably absent in the subspecies acutorostrata
bonaerensis. There are 460-720 baleen plates per animal, the longest of which is 30cm in length
(Stewart & Leatherwood, 1985).
The Minke whale is found along the polar ice-edge to the tropics, and is frequently encountered
quite close to the coast. It is a non-migratory species, known to follow its food source, both
inshore and offshore. This aquatic mammal inhabits polar, tropical and temperate waters,

28
moving according to the seasons to and from the North Atlantic in search of food, at times
segregated into sexes (Stewart & Leatherwood, 1985).
Minke whales seem to feed very little in warm waters. In both the northern and the southern
hemisphere, the preferred diet is euphausiids, although those in the former will also take shoaling
fish and free-swimming molluscs. In the North Pacific, the whale also feeds on sand lance, sand
eel, krill, salmon, capelin, mackerel, cod, herring and a number of other fish species. In the
Antarctic, their main diet consists of krill (Stewart & Leatherwood, 1985).
The gestation period of the Minke whale is approximately 10 months. Calves are about 2.4-2.7m
at birth. Sexual maturity in females takes place when they reach a length of 7.3m and in males
when their body length is 6.7-7.0m, with the exact age at sexual maturity being unknown.
Females can give birth every year and they will suckle their young for 4-5months.
This species of whale is seen as one of the more abundant ones, although exact stock sizes are
disputed. The following estimates are available (Bjorndal & Conrad, 1998):
o North Pacific: 17 000-28 000. This stock is considered a Protection Stock by the
International Whaling Commission (IWC), due to the high uncertainties in these
estimates.
o Northeast Atlantic: 70 000-186 000. The IWC estimated this population at 90 000-
135 000 in 1996. The central Atlantic stock in 1995 was estimated at 60 000, whilst
a 1990 survey only estimated this same population at 28 000. The difference was
attributed to a population increase, as well as improved census methods.
o Southern Hemisphere: 200 000-416 700.
Minke whales have been hunted in the North Atlantic, since the Middle Ages, when they were
captured using nets. Modern whaling for Minke whales began in the 1920s, and between this
time and 1973, the Norwegian fleet harvested approximately 94 000 animals. In the 1980s, a
quota was set at 2 500 whales in the North Atlantic (Klinowska, 1991). Since the moratorium on
commercial whaling was introduced in the 1985-1986 season, they have been harvested in
reduced numbers under scientific permission. In June 1993, the commercial hunt for Minke
whale by the Norwegians recommenced. The following table (Table 4) indicates actual numbers
culled over the last 60 years:

29
Table 4
Annual harvest of Minke whales from the Northeast Atlantic stock, 1938-1997 (High North
Alliance, 1998)
Year Harvest Year Harvest Year Harvest 1938 1345 1958 4338 1978 1383 1939 915 1959 3062 1979 1786 1940 539 1960 3233 1980 1807 1941 2109 1961 3092 1981 1770 1942 2133 1962 2975 1982 1782 1943 1612 1963 3059 1983 1688 1944 1348 1964 2463 1984 630 1945 1782 1965 2114 1985 634 1946 1833 1966 1902 1986 298 1947 2556 1967 1758 1987 279 1948 3487 1968 1986 1988 29 1949 3840 1969 2014 1989 17 1950 1990 1970 1890 1990 5 1951 2751 1971 1799 1991 0 1952 3324 1972 2175 1992 92 1953 2433 1973 1558 1993 217 1954 3499 1974 1410 1994 273 1955 4309 1975 1426 1995 217 1956 3654 1976 1884 1996 388 1957 3624 1977 1698 1997 503
The hunt in 1993 involved the Minke whale stock in the Northeast Atlantic, which migrates
along the coast into the Barents Sea. The average weight of these animals ranged from 1263.5kg
to 1772.5kg. However, these whales were not specifically chosen for their size (Bjorndal &
Conrad, 1998). The resumption of the harvest resulted from long discussions with the IWC that
had met in Iceland (1991), in Scotland (1992) and in Japan (1993), resulting in the votes being in
favour of the continuation of the moratorium on commercial whaling (Bjorndal & Conrad, 1998)
on each occasion. The issue of whaling has become a managerial rather than an environmental
one for the Norwegians.
As a result, interested countries such as Norway, Iceland and Japan have all undertaken
programmes with regards to the science of whaling. This is done in accordance with the IWC
schedule, in terms of which age, sex and the pregnancy status of the whale females which need to
be determined. This type of information is vital to estimate mortality rates, age of sexual
maturity, and the calving intervals of the females. The species under most scrutiny in these
discussions was the Minke whale. Due to its high population numbers, it is regarded as a prime
candidate for commercial harvesting (Bjorndal & Conrad, 1998).

30
In 1996, the IWC appointed an international group of scientists who reached a decision on the
estimate, based on a total stock in 1995, of 112 000 Minke whales in the Northeast Atlantic, with
confidence limits of 90 000 to 135 000 (High North Alliance, 1998). This study provided key
information to the Norwegian government with regard to the decision to resume whaling and it
rested on two assumptions:
1) that the Minke whale stock was abundant, and
2) that whaling could be undertaken on the basis of sustainable harvesting, which
would eliminate the risk of extinction of the species.
The export of any whale products has been prohibited by Norway, as the Minke whale is a
member of CITES Appendix II, and therefore all the meat has to be sold on the domestic market.
This restriction has considerably reduced revenues, due to the higher price that meat, and
especially the blubber, would have brought in Japan. There has been evidence to suggest that
increases in the supply of whale meat would lead to a decrease in price, unless effective
marketing strategies are employed. However, this situation would change dramatically, if the
export market were to be reinstated.
3.2. Terrestrial mammals
3.2.1) Blesbok & springbok
Game farming in South Africa is becoming extremely popular, largely due to the increased
popularity of ecotourism, and the high costs of feeding commercial livestock species. Many
farmers have decided to move towards the farming of game species such as springbok,
Antidorcas marsupialis, the blesbok, Damaliscus dorcas phillipsi, and the impala, Aepyceros
melampus. There are various reasons for the fact that the South African meat market and export
industry are experiencing an increasing demand for game meat, including: the different tastes of
game meat (Pauw, 1993), the decline per capita supply of other high quality red meat (Onyango,
Izumimoto & Kutima, 1998), and the low fat content of game meat (Schönfeldt, 1993).
According to Berry (1986), various uses are made of the wildlife present on farms through a
number of activities, such as trophy hunting, non-trophy recreational hunting, live animal sales
and venison (game meat) production. It is estimated that trophy hunting provides the greatest
net return, followed by live animal sales, non-trophy recreational hunting and venison
production. Since the contribution of game meat production (jerky hunters and game meat
sales) constitutes 67.5% of the total income of the game industry of South Africa (Potgieter,
2001), research is required to investigate the possibility of utilising these species in processed
products as well. Due to the increase of game farming and ecotourism, farmers invest in many

31
game species, but due to the absence of natural predators, population numbers have increased to
such an extent that culling often becomes a necessity, as grazing and space are limiting factors
on many farms.
The fat content of many red meat types is associated with health risks, projecting a negative
image of meat to the consumer. There has been a global decrease in the per capita consumption
of red meat, compared to that of white meat and other non-meat proteins (Schönfeldt, 1993). As
the meat of wild animals, game, has a lower fat content (2-3g per 100g meat) compared to
traditional red meat species, it may provide a suitable alternative for health conscious consumers
(Schönfeldt, 1993). Seasonal harvesting of surplus animals of a specific species could provide a
constant source of the meat on a larger and economically more profitable scale (Hoffman &
Bigalke, 1999).
The springbok is a game animal of considerable importance with regard to its harvesting
potential and, therefore, its impact on the meat industry (Rautenbach, 1980). It is presently the
game animal that is the most extensively cropped in South Africa and, therefore, most research
relating to South African game meat has been undertaken on this species. Their habitat
preference is dry woodland and forest, montane communities, moist lowland, swamps, lakes and
river edges (Talbot et al., 1965). Springbok are not often found in dense bushveld like impala,
making their cropping easier than that of other ungulates.
Despite the ease of obtaining game, it is important to consider that producing meat from wild
ungulates or domestic livestock requires that the same factors, such as yield, chemical
composition and meat quality, are taken into account, especially with regard to the demands
related to potential export markets (Hoffman, 2000).
In 1996, for example, the sale of red meat in the U.K decreased by 11%. This might have been
triggered by an increased general consumer awareness of the quality attributes of the red meat
being purchased, and an increased specific awareness with regards to consuming infected or
contaminated meat (Viljoen, 1999). Bovine spongiform encephalopathy (BSE), a chronic,
degenerative disease that attacks the central nervous system of cattle, causing death in cattle and
in humans, was a main contributor to this awareness. BSE is a disease transmitted to humans via
the consumption of red meat. Another incident in Europe that led to a decrease in red meat
consumption resulted from meat tainted with dioxin ending up in the food chain and on the
consumer’s table (Windhorst, 2001).

32
In the light of the above, and because South African wildlife holds no threat of possible BSE
infection, it is also free of possible contaminates caused by pollution, and, can be classified as
organic meat, the commercial potential of South African game products is very high.
According to van Zyl and Ferreira (2003), the ratio of protein in the carcass of blesbok and
springbok antelope is higher than that of commercially-farmed species such as beef and mutton.
It was also found that, compared to the meat of traditional red meat species, these game species
have a better dressing percentage and more desirable lean meat production.
A dressing percentage of 56% can be attained by springbok of 12 weeks of age, of which
approximately 83% of the carcass is lean, 13% bone and 4% fat. The growth curve of springbok
begins to decrease at 28 weeks, but compared to domestic stock, it shows a continuous increase
in carcass lean up to maturity, which peaks at 84% and 82% of the mature body weight in males
and females respectively (Von la Chevallerie & Van Zyl, 1971). Maximum growth rate is
attained before the animal is one year old, at which stage the mean mature body masses of
31.5kg and 27.1kg for males and females, respectively, are achieved.
The influence of the fat content on meat quality is of critical importance to the consumer.
Springbok meat is low in saturated and high in poly-unsaturated fatty acids, and has low
concentrations of two saturated fatty acids, namely myristic (C14:0) and palmitic (C16:0), which
contain attributes contributing to increased serum cholesterol levels (Viljoen, 1999).
According to Smit (2004), blesbok meat has a mean fat content of 1.42g/100g, a mean protein
content of 22.39g/100g and a mean collagen content of 1.67g/100g. This indicates that the meat
should be considered as a healthy alternative source of protein (Smit, 2004).
3.2.2) Horse
Horsemeat was a main part of the human diet in many European countries during pre-Christian
times, except in Islamic or Jewish countries. Horsemeat is considered unclean under Mosaic
Law, as it does not conform to the requirements for an animal to be cloven-hoofed and cud-
chewing at the same time. In pre-Christian times, the consumption of horsemeat in northern
Europe was an integral feature of Teutonic religious ceremonies, especially those worshiping the
god Odin (Martuzzi et al., 2001).
In 732 A.D., Pope Gregory III made great attempts to put an end to the pagan practices of
horsemeat consumption, and some nations, such as the people of Iceland, were reluctant to

33
welcome Christianity due to this prohibition. In a few countries, the repercussions of this edict
by the Catholic Church have remained even now, and the prejudice towards horsemeat has
developed from taboos to avoidance or abhorrence. From the year 1928 onward, legislation in
Italy prohibited the sale of horsemeat together with other meat sources from the same store. But
since 1999, law 526 (12th paragraph), abolished this legislation, permitting the conventional sale
of horsemeat (Martuzzi et al., 2001).
Despite all such attempts from religious leaders to curb the practice, horsemeat has been a part of
the diets of many European countries for centuries. Countries such as Italy, France, Belgium and
the Netherlands, have always regarded the consumption of horsemeat as part of their culture.
Horsemeat is one of the two food-animal species under mandatory USDA (United States
Department of Agriculture Food Safety and Inspection) inspection in the USA, the other species
being goat (http://www.igha.org/USDA.html).
One of the distinguishing features of horses as red-meat-producing animals is that they are not
specifically and systematically bred for the purpose of producing meat for human consumption in
many countries of the world, but are slaughtered after they have served their purpose, be it racing
or breeding. This results in variations in the quality of the meat, as their diets differ according to
their age, breed, and temperament, and the work which they were required to perform.
According to Martuzzi et al. (2001), the breeding of horses solely for the purpose of meat
production is not considered convenient by Italian breeders, and, therefore, Italy imports many
horses from countries such as Poland for slaughtering purposes. Horses in Italy are normally
slaughtered as foals of approximately six months of age, with a weight of 250-300kg. Compared
with a beef carcass of the same weight and degree of fatness, a horse carcass has a higher
percentage of subcutaneous and body cavity fat and a lower percentage of intermuscular and
intramuscular fat. An Italian survey showed that the meat derived from sport horses seemed to
be regarded more favourably by the consumer. This was due to the more intense colour, subtler
muscle fibres and a lower fat content. The organoleptic characteristics of the meat from older
horses were no different to those animals 30 months old (Martuzzi et al., 2001).
Commercial retail cuts from a horse carcass are comparable to those of beef. The meat is leaner,
with a sweet flavour and aroma. Good quality horsemeat is very tender, but highly variable, due
to the high variation in this species. The most popular cuts of horsemeat are taken from the
hindquarters, the tenderloin, sirloin, fillet steak, rump steak and rib. Less tender cuts are ground
and used in the production of sausages or pet food (http://www.igha.org/USDA.html).

34
In countries with a large racing industry, e.g. South Africa, there are many surplus horses, which
are ideally suited for slaughter, due to their physiological age, and, therefore, possess optimal
meat quality characteristics. Many of these horses are now abandoned and end up in
shantytowns in front of carts and are not optimally cared for. If there was a suitable,
economically beneficial alternative for breeders, such as specialised horse abattoirs, then South
Africa could become a net exporter of horsemeat to countries where there is a high demand for it.
This would be economically beneficial to the country, as well as the racing industry.
In the USA, as in many other western countries, the general public has an aversion to the
consumption of horsemeat. However, presently, the horsemeat industry is competing with the
beef and pork industries, in terms of the quantities of fresh meat exported. In 1994, 109 353
pounds of horsemeat was exported from the USA. In Sweden, more horsemeat is sold than lamb
and mutton combined (http://www.igha.org/USDA.html). According to Badiani et al (1997), the
chemical composition of horsemeat, including cholesterol, as listed in Table 5, supports Bodwell
and Anderson’s contention (1986), that 100g raw horsemeat would provide 40% of the
recommended daily protein requirements for adults of both genders on a varied diet.
Table 5
Approximate composition, cholesterol content, and energy value of raw horsemeat (per 100g)
(Badiani et al., 1997, USDA, 1997)
Component Average amount
Moisture, g 70.9
Protein, g 19.8
Lipids, g 6.63
Ash, g 0.98
Cholesterol, mg 61
Energy value, kcal 140
Calories 175
Fe, mg 5
Na, mg 55

35
Badiani et al (1997) showed that the PUFA/MUFA/SFA ratio for horsemeat was 0.54/1.34/1,
compared to that of beef (0.12/1.1/1), lamb (0.07/0.9/1), and veal (0.2/1.3/1) (AA.VV, 1987).
3.2.3) Beef and mutton
Beef, mutton and pork, are regarded as the traditional meat species consumed all over the world
and, despite religious beliefs in certain places that prohibit their use as food, are eaten to a
certain extent in every country. South Africa is viewed as one of the countries consuming large
amounts of red meat per capita per year (Table 6).
Beef production systems vary; they include those based on free-range conditions, as well as
semi-intensive and intensive production methods. Consumer demand has dictated that the meat
be lean, with a minimum of fat cover, tender, nutritious, palatable and, not least importantly, be
relatively cheap (Barge, 2004).
According to Barge (2004), beef is still marketed internationally as an undifferentiated product.
The protein content of beef is approximately 21%. Much of the fat in beef is found
intramuscularly, which is commonly known as marbling, a fat deposition that makes beef highly
acceptable to the consumer.
The United States Department of Agriculture (USDA) (http://www.igha.org/USDA.html) has
released the following nutritional facts about beef. The meat is low in sodium, with high
amounts of iron, zinc as well as manganese. It contains adequate amounts of protein, vitamin A,
riboflavin, niacin, vitamin B6, folate, vitamin B12, pantothenic acid, phosphorous, copper and
selenium. It is one of the red meat species that has a high cholesterol concentration of
approximately 275mg in a 100g portion of raw meat.
Table 6
Per capita annual consumption (kg) of red meat and pork in South Africa (Hallowell, 2001)
Year Beef Pork Mutton 1970 24.5 3.5 9.6 1980 21.5 2.9 11.2 1991 18.1 3.4 14.4 2000 13.5 3.0 19.4
Sheep were probably amongst the first animals to be domesticated by man. They can be found
living under a wide range of environments throughout the world and, as with goats, their system
of husbandry has changed very little over the centuries in most countries, which, in the main, can

36
be classed as an extensive grazing system. The latter is the most natural for two of the three
main species of meat animals, these being cattle, sheep and pigs, with cattle and sheep benefiting
from extensive grazing systems.
Presently, the principal sheep-producing countries in the world are (in millions): China 127.2;
Australia 126.3; Iran 51.5; New Zealand 48.8; India 45.5; Turkey 33.8; Pakistan 29.8; South
Africa 29; UK 28.8; Sudan 23.4; Ethiopia 21.7; Spain 21.3 (FAO Production Yearbook, 1996).
The desirable features required in both lamb and mutton carcasses of any breed are short stocky
plump legs, a thick full loin, and broad full back, thick fleshy ribs with a wide breast and
shoulder, a good depth of chest cavity, a short plump neck, and overall lean content (Bouton et
al., 1978).
The quality of lamb meat is dependent on key characteristics of the animals from which the
products are derived, such as chronological age (Bouton, Harris, Ratcliff, & Roberts, 1978; Ono
et al., 1984), slaughter weight (Jeremiah, Tong, & Gibson, 1998) as well as sex (Butler-Hogg,
Francombe, & Dransfield, 1984; Dransfield et al., 1990).
According to Hoffman et al. (2002), since 2000 there has been a rapidly decreasing per capita
consumption of mutton in South Africa. This provides a challenge to the producers, processors
and retailers, as they have to meet changing consumer demands and follow global trends, such as
leanness, organic meat production and traceability of animals.
Salami usually contains beef and pork as main meat ingredients. However, mutton is used in the
production of sausages, especially in Scandinavian countries.

37
4. MOTIVATION FOR THIS STUDY
It is apparent that there is an ever-increasing demand for the provision of a variety of high quality
meat and meat products. Therefore, research is needed to determine whether species of animals
other than the traditionally used mutton, beef and pork might serve as alternatives in red meat
production systems in order to meet this demand. If the meat of non-traditional animals could be
utilised optimally, there would be increased public acceptance of controlled culling systems.
Many of these are naturally living animals, which have had little or no experience with man, and
they are therefore untreated in terms of antibiotics and/or hormones and their flesh is
uncontaminated. As consumers are becoming more aware of chemical residues in meat, as well
as the manner in which the animal they eat lived prior to dying, these alternative species could
become highly sought after in terms of quality and safety.
Producers are constantly striving for products with an increased shelf life and stability, securing
economic advantages due to the continuous supply, of the amount and type required by the
consumer. Therefore, this study was undertaken to obtain more information on the possibility of
using alternative terrestrial mammalian species, as well as to investigate the feasible utilisation of
aquatic mammalian species in the production of a stable and safe product such as traditional
salami. Factors such as pH, water activity, microbiology and sensory evaluation were examined
to establish facts about these meat types and their adaptability to this type of processing. Salami
is a dry fermented sausage, which has pH values as well as water activity too low for harmful
bacteria to develop.
Most of the species used in these investigations are harvested according to season, which usually
implies a non-continuous supply of meat and meat products from these animals. However, if
products which would be acceptable from a food safety perspective could be developed using
these species, the harvesting of these animals would serve additional purposes other than for only
the trophy or skin. This would make harvesting more acceptable ethically, and providing
economic benefits to producers and the countries involved in such production.

38
5. REFERENCES
AA.VV. (1987). The nutrient composition of Australian meats and poultry. Food Technology
Australia. 39, 181-240.
Addison, R.F. & Brodie, P.F. (1987). Transfer of organochlorine residues from blubber through
the circulatory system to milk in the lactating grey seal Halichoerus grypus. Canadian
Journal of Fisheries and Aquatic Science, 44, 782-786.
AMAP (1998). AMAP Assessment Report: Arctic Pollution Issues. Chapter 7: Heavy metals.
Arctic Monitoring and Assessment Program (AMAP), Oslo, Norway.
Anon, (1991). Report on the Benguela Ecology Programme workshop on seal-fishery biological
interactions. Report on Benguela Ecology Programme. South Africa, 22.
Arboles, J. & Julia, E. (1992). Aroma in cured meat products. In: Smulders, F.J.M., Toldra, F.,
Flores, J., Prieto, M. (Eds.), New Technologies for Meat and Meat products. Audet,
Nijmegen, pp. 109-123.
Badiani, A., Nanni, N., Gatta, P.P., Tolomelli, B. & Manfredini, M. (1997). Nutrient profile of
horsemeat. Journal of Food Composition and Analysis, 10, 254-269.
Ball, G. (1996). Determination of the fat-soluble vitamins in foods by high-performance liquid
chromatography. In: Handbook of Food Analysis, Vol. 1, Physical Characterisation and
Nutrient Analysis, Nollet, L.M.L. (Ed.). Marcel Dekker, New York, pp. 602-604.
Barge, M.T., Destefanis. G. Barge, P. & Brugiapaglia, A. (2004). Beef characteristics of three
muscles from cow and young bull. Proceedings from the 50th International Congress of
Meat Science and Technology. Pp. 69.
Bello, J. & Sanchez-Fuertes, A. (1996). Development of mathematical model to describe the
acidification occurring during the ripening of dry fermented sausage. Food Chemistry, 59,
101-105.
Bergman, A., Olsson, M. & Reiland, S. (1992). Skull-bone lesions in the Baltic grey seal
(Halichoerus grypus). Ambio, 21, 517-519.
Berry, M.P.S. (1986). A comparison of different wildlife production enterprises in the Northern
Cape Province. South African Journal of Wildlife Resources. 16, 124-128.
Best, P. B. & Shaughnessy, P. D. (1979). An independent account of Benjamin Morrell’s sealing
voyage to the south-west coast of Africa in the Antarctic, 1828/29. Fisheries Bulletin South
Africa, 12, 1-19.
Bignert, A., Olsson, M., Persson, W., Jensen, S., Zakrisson, S., Litzén, K., Eriksson, U.,
Häggberg, L. & Alsberg, T. (1998). Temporal trends of organochlorines in Northern Europe,
1967-1995. Relation to global fractionation, leakage from sediments and international
measures. Environmental Pollution, 99, 177-198.

39
Björndal, T. & Conrad, J.M. (1998). A report on the Norwegian Minke whale hunt. Marine
Policy, 22, 161-174.
Bodwell, C.E. & Anderson, B.A. (1986). Nutritional composition and value of meat and meat
products. In Muscle as Food (P.J. Bechtel, Ed.), Academic Press, Orlando, FL. 321-369.
Bouton, P.E., Harris, P.V., Ratcliff, D. & Roberts, D.W. (1978). Shear force measurements in
cooked meat from sheep of various ages. Journal of Food Science, 43, 1038-1039.
Branen, A.L., Davidson, P.M., Salminen, S. & Thorngate, J.H. (2002) (Eds.). Antioxidants. In:
Food Additives, 2nd edition, Marcel Dekker, New York, pp. 528-529.
Brouwer, A., Reijnders, P.J.H. & Koeman, J.H. (1989). Polychlorinated biphenyl (PCB)-
contaminated fish induces vitamin A and thyroid hormone deficiency in the common seal
Phoca vitulina. Aquatic Toxicology, 15, 99-106.
Butler-Hogg, B.W., Francombe, M.A. & Dransfield, E. (1984). Carcass and meat quality of ram
and ewe lambs. Animal Production, 39, 107-113.
Butterworth D.S., Duffy, D.C., Best, P.B. & Bergh, M.O. (1988). On the scientific basis for
reducing the South African fur seal population. South African Journal of Science, 84, 179-
188.
Butterworth, D.S. & Wickens, P.A. (1990). Annex 2. Modelling the dynamics of the Cape fur
seals population. In: Report of the Subcommittee of the Sea Fisheries Advisory Committee
appointed by the Minister of Environment Affairs and of Water Affairs Ministry of National
Education and Environment Affairs. Cape Town. Pp. 33-57.
Butterworth, D.S., Punt A. E., Oosthuizen W. H. & Wickens P. A. (1995). The effects of future
consumption by the Cape fur seal on catches and catch rates of the Cape hakes. 3. Modelling
the dynamics of the Cape fur seal Arctocephalus pusillus pusillus. South African Journal of
Marine Science, 16, 161– 183.
Campbell-Platt, G. (1987). Fermentation foods of the World. 1st edition, Cambridge, pp 81-92.
Campbell-Platt, G. (1995). Fermented Foods – a world perspective. In: G. Campbell-Platt and
P.E. Cook, Editors, Fermented meats, Blackie Academic and Professional, Glasgow, pp. 39-
52
Campbell-Platt, G. & Cook, P.E. (1995). Fermented Meats. 1st edition, Chapman & Hall, .pp..
39-52.
Chin, K.B., Keeton, J.T. & Lacey, R.E. (1995). Proceedings of the 41st International Congress
of Meat Science and Technology, pp. 501.
Chizzolini, R., Novelli, E. & Zanardi, E. (1998). Oxidation in traditional Mediterranean meat
products. Meat Science, 49, S87-S89.
Conrad, M.E., Benjamin, B.J., Williams, H.L. & Foy, A.L. (1967). Human absorption of
haemoglobin – iron. Gastroenterology, 53, 5.

40
Conrad, J.M. & Bjorndal, T. (1993). On the resumption of commercial whaling in the case of the
Minke whale in the Northeast Atlantic. Arctic, 48(2), 164-171.
De Jong, G.D.C., Brasseur, S.M.J.M. & Reijnders, P.J.H. (1997). Grey seal Halichoerus grypus.
In: Reijnders, P.J.H., Verriopoulos, G., Brasseur, S.M.J.M. (Eds.), Status of pinnipeds
relevant to the European Union. IBN Scientific contributions, vol. 8, Wageningen (DLO
Institute for Forestry and Nature Research), NL, pp. 58-75.
DeLong, R.L., Gilmartin, W.G. & Simpson, J.G. (1973). Premature births in Californian seal
lions: association with high organochlorine pollutant residue levels. Science, 181, 1168-
1170.
Dietz, R., Riget, F. & Johansen, P. (1996). Lead, cadmium, mercury and selenium in ringed
seals (Phoca hispida) from the Baltic Sea and from Svalbard. Environmental Pollution, 111,
493-501.
Dransfield, E., Nute, G.R., Hogg, B.W. & Walters, B.R. (1990). Carcass and eating quality of
ram, castrated ram and ewe lambs. Animal Production, 50, 36-41.
Everson, C.W., Danner, W.E. & Hammes, P.A. (1970). Bacterial starter cultures in sausage
products. Journal of Agricultural Food Chemistry, 18, 570-571.
FAO production yearbook (1996). Volume 50. Pp. 235
Flores, J. (1997). Mediterranean vs. northern European meat products. Processing technologies
and main differences. Food Chemistry, 59, 505-510.
Gilbert, J. & Knowles M.E. (1975). The chemistry of smoked foods: a review. Journal of Food
Technology, 10 (3), 245-157.
Gray, J.I., Gomaa, E.A. & Buckley, D.J. (1996). Oxidative quality and shelf-life of meats. Meat
Science, 43, S111-S123.
Hallowell, G.J. (2001). Skaaprasse en –tipes vir voerkrale. Animal Improvement Institute, Irene,
South Africa (Unpublished data).
Hammes, W.P., Bantleon, A. & Min, S. (1994). Lactic acid bacteria in meat fermentation.
FEMS Microbiology Review, 87, 165-174.
High North Alliance (1998): http://www.highnorth.no/th-mi-w2.html.
Hoffman, L.C. & Bigalke, R. (1999). Utilizing wild ungulates from southern Africa for meat
production: potential research requirements for the new millennium. Congress of the Wildlife
Management Association of South Africa: George, pp. 1-14.
Hoffman, L.C. (2000). The yield and carcass chemical composition of impala (Aepyceros
melampus), a southern African antelope species. Journal of Science in Food Agriculture. 80,
752-756.

41
Hoffman, L.C., Muller, M., Cloete, S.W.P. & Schmidt, D. (2002). Comparison of six crossbred
lamb types: sensory, physical and nutritional meat quality characteristics. Meat Science, 65,
1265-1274.
Holzapfel, W.H. (1998). The Gram-positive bacteria associated with meat and meat products.
In: A. Davies and R. Board (Ed.) The Microbiology of Meat and Poultry. Blackie Academic
& Professional, New York. Pp. 35-84.
Horwitt, M.K. (1986). Interpretations of the requirements for thiamin, riboflavin, niacin-
tryptophan; and vitamin E plus comments on balance studies and vitamin B-6. American
Journal of Clinical Nutrition, 44, 973-982.
Jepson, P.D., Bennett, P.M., Allchin, C.R., Law, R.J., Kuiken, T., Baker, J.R., Rogan, E. &
Kirkwood, J.K. (1999). Investigating potential associations between chronic exposure to
polychlorinated biphenyls and infectious disease mortality in harbour porpoises from
England and Wales. Science of Total Environment, 243/244, 339-348.
Jeremiah, L.E., Tong, A.K.W. & Gibson, L.L. (1998). The influence of lamb chronical age,
slaughter weight, and gender on cooking properties and palatability. Sheep and Goat
Research Journal, 14, 156-166.
Johansson, G., Berdague, J-L., Larsson, M., Tran, N. & Borch, E. (1993). Lipolysis, proteolysis
and formation of volatile components during ripening of a fermented sausage with
Pediococcus pentosaceous and Staphylococcus xylosus. Meat Science, 38, 203-218.
Kanner, J. (1994). Oxidative processes in meat and meat products: quality implications. Meat
Science, 36, 169-189.
Klinowska, M. (1991). Dolphins, Porpoises and Whales of the World. The IUCN Red Data
Book. IUCN, Gland, Switzerland. Pp. 243-246.
Ladikos, D. & Lougovois, V. (1990). Lipid oxidation in muscle foods: a review. Food
Chemistry, 35, 295-314.
Lu, J. & Townsend, W.E. (1973). Feasibility of adding freeze-dried meat in the preparation of
fermented dry sausage. Journal of Food Science, 38, 837-840.
Lücke, F-K. (1986). Microbiological processes in the manufacture of dry sausage and raw ham.
Fleischwirtschaft, 66, 1505-1509.
Mahgoub, O. & Lu, C.D. (1998). Growth, body composition and carcass distribution in goats of
large and small sizes. Small Ruminant Research, 27, 267-278.
Martuzzi, F., Catalano, A.L. & Sussi, C. (2001). Characteristics of horsemeat consumption and
production in Italy. Book of Abstracts of the 52nd Annual Meeting of EAAP, 7, 323.
McConnell, B.J., Fedak, M.A., Lovell, P. & Hammond, P.S. (1999). Movements and foraging
areas of grey seals in the North Sea. Journal of Applied Ecology, 36, 573-590.

42
McLaren, I.A. (1975). A speculative overview of phocid evolution. Rapport P.V. Reun.
Conservation International Exploration, 169, 43-48.
Morrissey, P.A., Sheehy, P.J.A., Galvin, K., Kerry, J.P. & Buckley, D.J. (1998). Lipid stability
in meat and meat products. Meat Science, 49, S73-S86.
Mortensen, P., Bergman, A., Bignert, A., Hansen, H-J., Härkönen, T. & Olsson, M. (1992).
Prevalence of skull lesions in harbour seals (Phoca vitulina) in Swedish and Danish Museum
collections: 1835-1988. Ambio, 21, 520-524.
Neubauer, H. & Goetz, F. (1996). Physiology and interaction of nitrate and nitrite reduction in
Staphylococcus carnosus. Journal of Bacteriology, 128, 2005-2009.
Niinivaara, F.P., Pohja, M.S. & Komulainen, S.E. (1964). Some aspects about using bacterial
pure cultures in the manufacture of fermented sausages. Food Technology, 18, 147-153.
Niven, C.F., Deibel, R.H. & Wilson, G.D. (1959). Production of fermented sausage. U.S. Patent,
2, 907.
Nyman, M., Koistinen, J., Fant, M.L., Vartiainen, T. & Helle, E. (2002). Current levels of DDT,
PCB and trace elements in the Baltic ringed seals (Phoca hispida baltica) and grey seals
(Halichoerus grypus). Environmental pollution, 119, 399-412.
Olsson, M., Karlsson, B. & Ahnland, E. (1994). Diseases and environmental contaminants in
seals from the Baltic and the Swedish West Coast. Science of Total Environment, 154, 217-
227.
Ono, K., Berry, B.W., Johnson, E., Russek, E., Parker, C.F., Cahill, V.R. & Althouse, P.G.
(1984). Nutrient composition of lamb of two age groups. Journal of Food Science, 49,
1233-1239.
Onyango, C.A., Izumimoto, M. & Kutima, P.M. (1998). Comparison of some physical and
chemical properties of selected game meats. Meat Science, 49, 117-125.
Oosthuizen, W.H. (1991). General movements of South African (Cape) fur seals Arctocephalus
pusillus pusillus from analysis of recoveries of tagged animals. South African Journal of
Marine Science, 11, 21–29.
O’Shea, T. (1999). Environmental contaminants and Marine Mammals. In: Reynolds III, J.E.,
Rommel, S.A. (Eds.), Biology of Marine Mammals, Smithsonian Institution Press, USA.
Paleari, M.A., Beretta, G., Colombo, F., Foschini, S., Bertolo, G. & Camiasca, S. (2000).
Buffalo meat as a salted and cured product. Meat Science, 54, 565-567.
Pauw, J. (1993). The development of venison marketing. Forum: The venison Industry. Irene
Animal Production Institute: Agricultural Research Council, pp. 41-48.
Potgieter, L. (2001). Many-game – few hunters (Afrikaans) Landbouweekblad, 5 January, pp.
34-37.

43
Price, J.F. & B.S. Schweigert. The Science of Meat and Meat products. Westport, Conn: Food
and Nutrition Press, Inc., 1987. Pp. 153.
Punt, A. (1994). Placing odds on sustainable catch using virtual population analysis and survey
data. Canadian Journal of Fish Aquatic Science, 51(4), 946-958.
Rautenbach, I.L. (1980). Ageing Criteria in the Springbok, Antidorcas marsupialis. MSc thesis.
University of Pretoria, Pretoria.
Reijnders, P.J.H. (1986). Reproductive failure in common seals feeding on fish from polluted
coastal waters. Nature, 324, 456-457.
Reijnders, P.J.H., Van Dijk, J. & Kuiper, D. (1995). Recolonization of the Dutch Wadden Sea
by the grey seal Halichoerus grypus. Biological Conservation, 71, 231-235.
Rice, D.W. (1998). Marine Mammals of the world – Systematics and distribution. Society of
Marine Mammalogy Special Publication Number, 4, 231.
Riedman, M. (1990). The Pinnipeds: Seals, Sea Lions and Walruses. University California
Press, Berkeley. Pp. 34.
Sanz, B., Selgas, D., Parejo, I. & Ordonez, J.A. (1998). Characteristics of lactobacilli isolated
from dry fermented sausages. International Journal of Food Microbiology, 6(3), pp. 199-205.
Schliemann, H. (1990). Eared seals and walruses. Pp. 168-203 in Bernhard Grzimek, ed.,
Grzimek’s Encyclopedia of Mammals. McGraw-Hill, New York.
Schönfeldt, H. (1993). Nutritional content of venison. Forum: The venison Industry. Irene
Animal Production Institute: Agricultural Research Council, 51-56.
Seal Conservation Society (2000). http://www.pinnipeds.org/species/grey.htm
Shahidi, F. & Hong, C. (1991). Role of metal ions and heme pigments in autooxidation of heat-
processed meat products. Food Chemistry, 23, 137-139.
Shahidi, F. & Synowiecki, J. (1993). Nutrient composition of mechanically separated and
surimi-like seal meat. Food Chemistry, 47, 41.
Shaughnessy, P. D. & P. B. Best. (1982). A discrete population model for the South African fur
seal (Arctocephalus pusillus pusillus). In Mammals in the seas, small cetaceans, seals,
sirenians, and otters. Food and Agriculture Organization Fisheries Series, Rome 4:1–531.
Pp. 163–176.
Shaughnessy, P.D., Semmelink, A., Cooper, J. & Frost, P.G.H. (1981). Attempts to develop
acoustic methods of keeping cape fur seals from fishing nets. Biological Conservation, 21,
141-158.
Slinde, E. & Nordal, J. (1978). Formation of nitrosoheme and heme in dry sausages using
catalase positive strains of lactic acid bacteria as starter cultures. Proc. 24th Meeting of
European Meat Research and Work. Bundesanstalt fuer Fleischforschung, Kulmbach, West
Germany, 2:G11.
44
Smit, K. (2004). Meat quality characteristics of Blesbok (Damaliscus dorcas phillipsi) and red
Hartebeest (Alcephalus busephalus caama) meat. MSc thesis, University of Stellenbosch,
South Africa.
Stahnke, L.H. (1995). Aroma components from dried sausages fermented with Staphylococcus
xylosus. Meat Science, 38, 39-53.
Stewart, B.S. & Leatherwood, S. (1985). Minke whale. In: S.H. Ridgway and R.J. Harrison
(Eds): Handbook of Marine mammals, Vol. 3: The Sirenians and Baleen Whales. Pp. 91-
136. Academic Press.
Synowiecki, J., Heeley, D.H. & Shahidi, F. (1992). Purification and characterization of
myoglobin from Harp seal (Phoca groenlandica). Journal of Agricultural Food Chemistry,
40, 714-718.
Talbot, L.M., Payne, W.J.A., Ledger, H.P. & Lorna, D. (1965). Meat production potential of
wild animals in Africa. Pp 1 –2.
Tanabe, S., Watanabe, S., Kan, H. & Tatsukawa, R. (1988). Capacity and mode of PCB
metabolism in small cetaceans. Marine Mammal Science, 4, 103-124.
t’Hart, L., Moesker, A., Vedder, L. & Van Bree, P.J.H. (1988). On the pupping period of Grey
seals, Halichoerus grypus (Fabricius, 1791), reproducing on a shoal near the island of
Terschelling, the Netherlands. Zoologische. Saeugetierkartei, 53, 59-60.
Toldra, F. & Flores, M. (1998). The role of muscle proteases and lipases in flavour development
during the processing of dry-cured ham. Critical Review of Food Science and Nutrition, 38,
331-352.
Townsend, W.E., Davis, C.E., Lyon, C.E. & Mescher, S.E. (1980). Effect of pork quality on
some chemical, physical, and processing properties of fermented dry sausage. Journal of
Food Science, 45, 622-626.
Van Zyl, L. & Ferreira, A.V. (2003). Physical and chemical carcass composition of springbok
(Antidorcas marsupialis), blesbok (Damaliscus dorcas phillipsi) and impala (Aepyceros
melampus). Small Ruminant Research, 53, 103-109.
USDA (1997). USDA promotes horse and goat meat. http://www.igha.org/USDA.html
USDA SR16 (2004). Nutrition Facts and Food composition Analysis for Beef, variety meats and
by-products, liver, raw. http://www.nutritiondata.com/facts-001-02s02oc.html
Verplaetse, A. (1994). Influence of raw meat properties and processing technology on aroma
quality of raw fermented meat products. Proceedings 40th International Congress of Meat
Science and Technology, The Hague, the Netherlands, pp. 45.
45
Viljoen, J.J. (1999). ’n Vergelyking van lipiedkomponente van Springbok vleis met die van
beesvleis en die verwante belangrikheid en aspekte van die menslike gesondheid. Suid-
Afrikaanse Tydskrif vir Natuurwetenskap en Tegnologie, 18, 50 – 52.
Vogel, S. & Koch, L. (1992). Report on occurrence of grey seals (Halichoerus grypus, Fabricius
1791) in the Schleswig-Holstein Wadden Sea. Saeugetierkartei Information, 16, 449-459.
Von la Chevallerie, M. & Van Zyl, J.H.M. (1971). Growth and carcass development of the
Springbok – Antidorcas marsupialis. Agroanimalia, 3, 115 – 121.
World Health Organization (1980). Hazard Analysis and critical control point. Application to
food safety and quality assurance in developed and developing countries. Report on a
meeting held June 9-10 at the WHO Headquarters in Geneva, pp. 27.
Windhorst, H-W. (2001). Global patterns of pork production and pork trade. 2nd International
Virtual Conference on Pork Quality. November 05 to December 06 – 2001 – Via Internet.
Xiong, Y.L. & Mikel, W.B. (2001). Meat and meat products, In: Y.H. Hui, W.K. Nip, R.W.
Rogers, and O.A. Young, Eds. Meat Sciences and Applications. Marcel Dekker Inc., New
York. Chapter 15, pp. 352-369.

46
Chapter 3
CHEMICAL COMPOSITION OF THE MEAT AND BLUBBER OF THE CAPE FUR
SEAL (Arctocephalus pusillus pusillus)
3.1. Abstract
The aim of this study was to investigate the chemical composition of the meat and blubber of the
Cape fur seal (Arctocephalus pusillus pusillus), to establish whether it would be fit for human
consumption. Meat and blubber samples were taken from the Pectoralis muscle of freshly culled
carcasses of ten Cape fur seal pups and ten Cape fur seal bulls, and fat, protein, moisture and
fatty acid content were determined. The muscle of the pups contained a higher percentage of fat
(4.2g/100g) than that of the bulls (2.4g/100g), but a very similar percentage of protein
(23.2g/100g). The blubber samples of the bulls contained a higher percentage of protein
(26.6g/100g) than that of the pups (14.6g/100g), but a lower fat percentage (67.1g/100g) than
that of the pups (77.2g/100g). In the Cape fur seal bull muscle, saturated fatty acids (SFA)
contributed 33% and monounsaturated fatty acids (MUFA) 29% to the total fat content.
Polyunsaturated fatty acids (PUFA) contributed 38%. In the muscle of the pups, the different
fractions were calculated to be 39, 30, and 31% for SFA, MUFA and PUFA, respectively. In the
seal muscle and blubber the n-6:n-3 ratio was much higher in the tissue of the bulls (2.10 and
2.69, respectively) than that of the pups (0.59 and 0.84, respectively). The polyunsaturated:
saturated fatty acid ratio (P:S ratio) of the muscle and blubber of bulls and pups was >0.70, with
the muscle of the pups having a value of 0.80, and that of the bulls 1.15. The blubber of pups and
bulls had a P:S ratio of 1.44 and 1.19 respectively. The toxin content for the Cape fur seal, in
terms of organochlorine components, was considerably lower than that of the Canadian seal.
Both have PCB#153 as the highest PCB congener. No organochlorine component of the Cape fur
seal was found in quantities higher than 13.7ng/g oil, whereas the maximum amount for the same
PCB was 87.2ng/g in Canadian seal oil. The results of this trial revealed that the meat of the
Cape fur seal could be considered fit for human consumption.
Keywords: Cape fur seal, sustainable harvesting, protein, fat, organochlorines
3.2. Introduction
The Cape fur seal (Arctocephalus pusillus pusillus) is harvested commercially in Namibia on the
south-western coast of Africa. There is a large demand for the hides of the pups and bulls. The
remainder of the carcass is processed to carcass meal. Due to the occurrence of BSE (Bovine

47
spongiform encephalopathy), there has been a decrease in the use of animal by-products in any
animal feed. Therefore, finding an alternative use for the meat is desirable.
The meat is healthy and lean containing high amounts of the macro-minerals calcium,
phosphorous, iron and selenium (Robinson, 1996), which would make it suitable for further
processing into products for the human food chain. This would make harvesting a more
acceptable occurrence, as it would mean that more of the carcass of the animal would be utilised
as a source of nutritious meat to the consumer.
Little research has been conducted on the meat qualities of marine mammal meat and none
whatsoever could be sourced on the meat of the Cape fur seal. Some literature is available on
other pinnipeds, their physiology, geography, environment and life cycles, some comparable to
the Cape fur seal. As the Cape fur seal is a sub-species of the sea lion, there are characteristics
which distinguish it from other marine mammals.
The Cape fur seal is harvested commercially each year in Namibia, and this sustainable
harvesting is destined to continue. The current culling numbers are 30 000 pups and 3 000 bulls
per year. The harvesting is conducted in a scientific manner and is strictly monitored. As
mentioned, the meat is no longer utilised; it is presently discarded. Information is therefore
needed on the dress out percentages and chemical characteristics of the meat and blubber, as
these would influence the potential processing methods used in any commercial production line.
The age and gender of the animals used for these purposes could also play a role, and this too,
requires research.
Namibia exports most of its pup skins to the Far East, where they are used in the clothing
industry. Fish oil capsules are successfully sold in the pharmaceutical industry and are a well-
established supplement in the diet of many people around the world. The omega-3 fatty acids in
fish oil have a prophylactic action on thrombosis, and the hardening of arteries. The consumption
of whale and seal oils benefits the immune system and improves the viscosity and coagulative
properties of blood (NAMMCO, 1998). However, very little information exists on the fatty acid
composition of the Cape fur seal.
One of the major concerns regarding the utilisation of marine mammal tissue is the increasing
threat of persistent organic pollutants (POPs) contaminating the tissue in many of the world’s
seal populations (DeLong et al., 1973; Reijnders, 1986), such as in the Californian sea lions

48
(Zalophus californianus), Wadden Sea harbour seals (Phoca vitulina), Baltic ringed seals (Phoca
hispida) and Grey seals (Halichoerus grypus).
POPs consist of a group of synthetic organic compounds produced for industrial and agricultural
purposes, or are by-products of other industrial processes. Many of these compounds are found in
the high-lipid organs of animals as they are fat-soluble (lipophilic) and continual, thereby
accumulating efficiently in the thick blubber layers of marine mammals (Tanabe et al., 1988),
making them especially vulnerable to POP contamination. Large amounts of POPs are also
transferred to the young seals via the milk of their mothers (Addison & Brodie, 1987).
In an article by Vetter et al. (1999), PCB levels accounted for almost 20-75% of the chlorinated
hydrocarbon levels found in the blubber of Cape fur seals. PCB# 153 was found to be the most
abundant PCB congener, accounting for approximately 40% of the PCB congeners analysed.
Monitoring the organochlorine levels of marine mammals from Africa has not been extensively
researched (Henry & Best, 1983; Cockcroft et al., 1989; Borrell et al., 1997). Aucamp et al.
(1972) confirmed that DDT and other organochlorines have been used in South Africa since the
1950s. Reports indicate that DDT has been used in Namibia (<10 tons) and lindane in South
Africa (10-100 tons) (Voldner & Li, 1995).
The aim of this study was to determine the chemical composition of the meat and blubber of the
Cape fur seal. The potential exists to use a larger percentage of the animal than just the hides.
Before this can be realised, baseline information on the chemical composition of its meat and
blubber is required.
3.3. Materials and methods
Ten Cape fur seal pups, approximately eight months old, of both sexes, and ten Cape fur seal
bulls, between two and four years of age, were used. As selective harvesting is not allowed, the
pups were not differentiated by gender. All pups were of similar age, all at point of weaning. The
bulls were estimated to be between 2 and 4 years old, none being sexually mature.
The animals were harvested using standard procedures; the pups were hit on the head once to
result in loss of consciousness, and the bulls were shot with a .22-calibre rifle with a silencer.
Thereafter, all animals were stuck in the heart to bleed within 30 seconds of being stunned. They
were then transported to a skinning shed where they were eviscerated and the hide removed. At
this point, samples of muscle were collected from the Pectoralis muscle, and samples of blubber
from the ventral side of the carcass. Samples were stored in separate vacuum bags and identified

49
according to the specific animals, vacuum packed and frozen at -5oC (once the meat samples had
all reached room temperature).
3.3.1. Proximate analysis
The moisture and protein contents (g/100g meat) of all the samples were determined according to
the Association of Official Analytical Chemist’s Standard Techniques (AOAC, 1997). The
moisture content was determined by drying at 105°C for 24 hours. To establish the protein
content, dried and defatted samples were used; samples were ground with a pestle in a mortar
until a fine powder was obtained. 0.100mg of the powder was taken per animal and inserted into
a foil wrap designed for the Leco protein analyser (Leco Fp-528). The protein was determined as
Nitrogen, which was multiplied by 6.25 to determine the protein concentration in the sample. For
fat determination, samples were homogenised in a blender and a chloroform:methanol (2:1)
extraction used (Lee et al., 1996).
3.3.2. Amino acid determination
The amino acid composition was determined, using a modification of the method of
Bidlingmeyer, Cohen & Tarvin (1984), on a defatted, dried meat sample, using a Waters high
performance liquid chromatography (HPLC) system.
The meat sample was defatted by solvent extraction, according to the method of Lee et al.
(1996). The sample was hydrolysed with 6 N HCl in a vacuum-sealed tube for 24 hours at
110°C. Thereafter, the sample was centrifuged (15 000 rpm for 5 minutes) and dried under
vacuum for 90 minutes to two hours. The pH was adjusted by adding 20μl solution of 2:2:1
ethanol:water:triethylamine and the sample was dried for a further 90 minutes to two hours.
The resulting sample was derivatised by adding 20μl of 7:1:1:1 ethanol:water:triethylamine:
phenylisothiocyanate derivatising solution which was allowed to react at room temperature
(26°C) for 10 minutes prior to drying under vacuum (minimum of 3 hours). The sample was
resuspended in 200μl of Picotag sample diluent (Waters, Millford, MA, USA) and an 8μl sub-
sample was then injected for separation by HPLC under gradient conditions using two buffers.
Buffer A was a sodium acetate buffer (pH 6.4) containing 5000ppm ethylenediaminetetraacetic
acid (EDTA), 1:2000 triethylamine and 6% acetonitrile. Buffer B comprised 60% acetonitrile
with 5000ppm EDTA. Other conditions were:1525 HPLC with a binary gradient delivery, 717
auto-sampler and Injector, 1500 column heater, 2487 dual wavelength UV detector). The data
were analysed using Breeze software (Waters, Millford, MA, USA).

50
3.3.3. Mineral determination
The samples used for mineral analysis were ashed, before being dissolved in 3 N HCl and diluted
to appropriate concentrations required for mineral analysis by the AOAC method No. 968.08
(AOAC, 1997). Three macroelements (Na, K, and Mg) and two trace elements (Fe and Zn) were
determined, using a Varian, spectra AA 250, plus atomic absorption spectrophotometer equipped
with hollow cathode lamps specific to each element and an air-acetylene flame. The instrument
settings, as well as all other experimental conditions, were in accordance with the manufacturer’s
specifications. The wavelengths (nm) used for the detection of each mineral were: K, 766.4; Na,
588.9 or 330.2; Mg, 285.2; Fe, 248.3; Zn, 213.9.
3.3.4. Fatty acid determination
The fatty acid content was determined using the method described by Tichelaar et al. (1998).
After thawing the meat, the lipids in a 2g sample were extracted with chloroform/methanol (CM
2:1; v/v). All the extraction solvents contained 0.01% butylated hydroxytoluene (BHT) as an
antioxidant. A polytron mixer (Kinematica, type PT 10-35, Switzerland) was used to homogenise
the sample for 30 seconds within the extraction solvent. Heptadecanoic acid (C17:0) was used as
an internal standard to quantify the individual fatty acids.
A sub-sample of the extracted lipids was transmethylated for two hours at 70°C, using
methanol/sulphuric acid (19:1; v/v). After cooling, the resulting fatty acid methyl esters (FAME)
were extracted with water and hexane. The top hexane phase was transferred to a spotting tube
and dried under nitrogen.
The FAME were purified by TLC (silica gel 60 plates) and analysed by GLC (Varian Model
3300 equipped with flame ionisation detection), using a 60 m BPX70 capillary column of
0.25mm internal diameter (SGE, Australia). The hydrogen gas flow rate was 25ml/min; and the
hydrogen carrier gas rate 2-4ml/min. Temperature programming was linear at 3°C/min, with an
initial temperature of 150°C, a final temperature of 220°C, an injector temperature of 240°C and
a detector temperature of 250°C. The FAME in the total lipids were identified by comparison of
the retention times with those of a standard FAME mixture (Nu-Chek-Prep Inc., Elysian,
Minnesota).
3.3.5. Toxin evaluation
Seal oil was collected from the processing plant in Namibia, and taken for analysis to the
Institute of Marine Research in Bergen, Norway. This oil had been extracted from the blubber,
with heat. Additional blubber samples had been collected from ten Phoca vitulina seals

51
(harvested in Canada for another study), in order to investigate the toxins present in these
animals at the Institute of Marine Research in Bergen, Norway (unpublished data).
Chlorinated dioxins and furans, as well as non-ortho- and mono-ortho- substituted
polychlorinated biphenyls (NO- and MO-PCB, respectively) were analysed, using procedures
described previously (MacDonald et al., 1997; Addison, Ikonomou & Stobo, 1999). The
procedures involved a succession of column chromatographic extraction and clean-up steps,
followed by high resolution gas chromatography/high resolution mass spectrometry
(HRGC/HRMS) analysis. Results are presented as ng/g oil.
3.3.6. Statistical analysis
The two-sample T-test was used on SAS (statistical analysis systems, 1990) to compare the
chemical and fatty acid values of the bulls and pups.
3.4. Results and discussion
It was noted that the carcasses of seal pups dress out to very low percentages (49%), compared
with the carcasses of other species such as cattle, sheep and pigs. The dress out percentage in this
case included the head, and the flippers. All viscera and the hide were removed. This is because
at present, the whole carcass is either used for the production of carcass meal or discarded and no
particular cuts are required. If the head and flippers were removed, as is done with these other
species, this dress out percentage would decrease even further.
On dissecting the relevant animals, it was noticeable that the meat of the pups was a lot lighter in
colour than that of the bulls. However, the meat of the pups was darker than that of traditional
domestic animals. It was also noted that the blubber, present as a subcutaneous fat layer in both
age groups, came in the form of a thick, snow-white layer. There was a predominant fat depot
around the tail. Most of the excess dietary energy is stored subcutaneously as a form of
insulation. The pups used for this investigation were all at the point of being weaned and none of
them would have had to dive deep or swim far to find food. Therefore, their bodies had not yet
been required to maintain high levels of oxygen in their muscles, and this might explain the
lighter colour of the meat. Their staple diet had to date consisted of milk, and no other food
sources, e.g. fish, would have been consumed to affect the colour or flavour of blubber or meat.
The myoglobin content of up to 13.4mg/g (Synowiecki et al., 1992) provides the opportunity to
utilise seal meat as a colour contributor in meat products utilising meats of lesser colour quality
or potential.

52
3.4.1. Proximate analysis
Table 1
Mean (±standard deviation) and P values indicating differences between the chemical
composition (g/100g sample) of the meat (predominantly the m.pectoralis) and blubber of ten
Cape fur seal pups and ten Cape fur seal bulls
Meat Blubber Moisture Protein Fat Moisture Protein Fat Pups 73.0±1.6 23.3±1.6 4.2±1.8 8.0±2.0 14.6±3.0 77.2±1.9 Bulls 74.3±1.6 23.6±1.5 2.4±0.9 6.0±1.6 26.6±4.4 67.1±4.8 P- value 0.0023 0.4825 0.0000 0.0001 0.0000 0.0000
Chemical analysis of tissues of the Cape fur seal (Table 1) revealed a high protein concentration
in the blubber, especially that of the bulls (26.6g/100g) when compared to that of the pups
(14.6g/100g), but a lower fat content, of 67.1g/100g and 77.2g/100g respectively. The meat
(consisting mostly of the m. pectoralis) of the pups contained a higher level of fat (4.2g/100g)
than that of the bulls (2.4g/100g), but had a very similar protein content (23.2g/100g).
As the seal is a marine mammal, it mainly stores fat subcutaneously. The protein content in the
blubber is not consistent with that of superficial muscle, but rather of connective tissue. On
drying, the blubber became rubbery rather than brittle. As connective tissue increases with age of
the animal, the protein content in the blubber of the bulls would be higher than that of the pups.
As seen from the P values in Table 1, all components of the tissues differed (P<0.05), except the
protein concentration in the muscle.
3.4.2. Amino acid determination
Table 2
Mean values (g/100g meat sample) of the amino acid profile of the m. pectoralis of ten Cape fur
seal bulls
Essential amino acids
Mean ± std. dev Non-essential amino acids
Mean ± std. dev
Histidine 0.7 ± 0.1 Alanine 2.1 ± 0.2 Isoleucine 0.6 ± 0.1 Arginine 1.0 ± 0.1 Leucine 1.8 ± 0.2 Aspartic acid 2.0 ± 0.2 Lysine 1.5 ± 0.2 Glutamic acid 3.0 ± 0.3 Methionine 0.6 ± 0.1 Glycine 2.0 ± 0.3 Cystine 0.2 ± 0.0 Proline 1.1 ± 0.1 Phenylalanine 0.7 ± 0.0 Serine 1.3 ± 0.1 Threonine 1.2 ± 0.1 Tyrosine 0.5 ± 0.1 Valine 1.0 ± 0.1

53
There are eight amino acids (isoleucine, lysine, methionine, phenylalanine, threonine, tryptophan
and valine) essential for maintaining the nitrogen balance in young adults (Rose, Wixom,
Lockhart & Lambert, 1955). The proportion of essential amino acids determines the nutritional
quality of a food protein. In light of recently adjusted estimates of the amino acid requirements
for human adults proposed by Pellett & Young (1990), seal meat would be a valuable source of
essential amino acids, especially leucine and histidine, but seems to contain little cystine.
Table 2 shows that the four major amino acids noted were glutamic acid, alanine, aspartic acid
and glycine, which contributed 3.0, 2.1, 2.0 and 2.0g/100g meat respectively. Leucine (1.8g/100g
meat) was the major essential amino acid in seal meat, followed by lysine (1.5g/100g meat). The
table shows data for bulls only, as no samples were analysed for the pups.
3.4.3. Mineral determination
Meat is known to play an important role in a balanced human diet, as it contains higher
concentrations of minerals, especially Fe and Zn, compared to plants (Lin et al., 1989; Simonsen,
Hamm & Rogowski, 1988; Williams, 1987). According to literature published by the American
Meat Institute Foundation (1960), K appears to be the most important mineral, followed by P and
Fe. As seen in Table 3, Mg was found to be the most predominant mineral present (634mg/100g
meat) in the seal meat analysed. This value was approximately five times higher than K
(174mg/100g meat). The concentration of sodium (49.9mg/100g meat) was also higher compared
to that of iron (4.1mg/100g meat) and zinc (2.9mg/100g meat).
Table 3
The mean mineral composition (mg/100g meat) of the m. pectoralis of ten Cape fur seal bulls
Mineral Mean ± std. devIron (Fe) 4.1 ± 0.2Magnesium (Mg) 634.0 ± 6.0Potassium (K) 174.0 ± 2.4Sodium (Na) 49.9 ± 0.5Zinc (Zn) 2.9 ± 0.2
The best sources of zinc in the human diet are meat, poultry and seafood. Approximately 20-40%
of zinc is absorbed from a meat source, which makes it the main contributor to dietary zinc
intake in developed countries (Higgs, 2000). According to Lawrie (1998), the zinc contents of
pork, beef and mutton are 2.4, 4.3 and 2.1mg/100g respectively.

54
Red meat is considered one of the best sources of iron in the human diet, with 50-60% being in
the heme form (Higgs, 2000). Seal meat can, therefore, be considered a rich meat in terms of
heme iron content. Heme-iron is absorbed by a more efficient mechanism than non-heme iron,
which is common in plants. Absorption of iron from meat sources is 15-25%, as to 1-7% from
plant sources (Higgs, 2000).
The iron content in seal meat, as seen in Table 3, is much higher than that of any traditional red
meat species, being 4.1mg/100g, compared with that of pork, beef and mutton, with values of
1.4, 2.3 and 1.0mg/100g respectively (Lawrie, 1998).
The standard deviations for the different mineral contents are quite large (Table 3), which might
be caused by the fact that body mineral composition is affected by age, feeding regimen,
breeding season and geographical differences. In the animals used for this trial, possible slight
age differences within the group of bulls sampled, as well as differences in their body conditions,
might have contributed to these variations. These factors are also known to influence the mineral
and chemical composition of muscles.
3.4.4. Fatty acid determination
As stated by Shahidi, Synowiecki, Amarowicz & Wanasundara (1994), the deposition of lipids in
the seal, is found subcutaneously, in the form of blubber. This consists mostly of neutral lipids
(98.9%), and small quantities of polar lipids. According to Shahidi & Synowiecki (1993), seal
meat is comparable to, or better than, other sources of animal protein in terms of its
intramuscular lipids. Furthermore, those lipids present in the blubber are excellent sources of
omega-3 fatty acids (Shahidi et al., 1994a). This was substantiated by the results in this trial (see
Tables 4 and 5).
Table 4 shows the mean values in mg/100g of the fatty acids in the m. pectoralis and blubber of
Cape fur seal bulls, and pups. In muscle, palmitic acid was the most dominant fatty acid,
followed by eicosapentanoic (EPA) and then palmiteleidic and oleic acids, in similar
concentrations. One major difference between the blubber of the bulls and pups was that the pups
had a much higher concentration of docosohexaenoic (DHA) acid.

55
Table 4
Mean values ± SD of the fatty acid composition (mg/100g muscle or blubber) of the m.
pectoralis and blubber of ten Cape fur seal bulls and pups
Bulls Pups Fatty acid
muscle blubber muscle blubber
SFA 16:0 194.4± 0.6 1326.7±5.6 626.9±1.8 2213.7±5.9 18:0 119.9± 0.2 377.9±1.4 214.1±0.5 405.8±0.9 20:0 34.2± 0.2 58.1±0.4 25.1±0.1 37.1±0.2 22:0 nd 93.2±1.8 5.6±0.1 57.6±1.0 24:0 40.5±0.6 52.1±0.3 12.7±0.1 51.2±0.1MUFA 16:1 n-7 39.7±0.2 819.5±4.0 164.7±0.7 943.5±2.4 18:1 n-9 213.0±0.8 813.8±8.7 395.8±4.0 2204.0±14.6 20.1 n-9 34.2±0.2 239.1±2.0 58.6±0.4 299.8±1.5 22:1 n-9 29.8±0.1 246.7±2.0 44.8±0.4 148.6±1.0 24:1 n-9 27.7±0.3 38.6±0.2 19.8±0.1 33.0±0.2PUFA 18:2 n-6 70.1±0.2 296.1±2.6 232.6±0.8 176.7±0.3 18:3 n-3 9.2±0.1 60.8±0.1 17.1±0.1 71.2±0.2 18:3 n-6 18.7±0.2 23.2±0.2 13.0±0.06 17.5±0.1 20:2 n-6 16.3±0.1 35.2±0.1 14.1±0.1 26.4±0.1 20:3 n-3 51.5±0.3 96.4±0.7 109.9±0.4 200.9±0.7 20:4 n-6 22.4±0.3 67.8±0.7 25.3±0.4 8.9±0.1 20:5 68.5±0.4 898.8±4.5 171.3±0.7 811.3±1.4 22:2 nd 28.0±0.1 9.8±0.08 14.60±0.1 22:5 69.3±1.0 573.5±4.3 71.6±1.1 446.6±4.9 22:6 120.0±0.7 187.0±9.2 45.7±2.1 2208.0±4.7Total ΣSFA 389.0 1908.0 884.4 2765.4 ΣMUFA 344.4 2157.7 683.7 3628.9 ΣPUFA 446.0 2266.8 710.4 3982.1 ΣTUFA 790.4 4424.5 1394.1 7611.0 DFA 910.3 4802.4 1608.2 8016.8 P:S 1.15 1.19 0.80 1.44 n-6 127.5 422.3 75 229.5 n-3 60.7 157.2 127 272.1 n-6: n-3 2.10 2.69 0.59 0.84
SFA = Saturated Fatty Acids; MUFA = Monounsaturated Fatty Acids; PUFA = Polyunsaturated
Fatty Acids; TUFA = Total Unsaturated Fatty Acids; DFA = Desirable Fatty Acids (C18:0 +
TUFA); P: S = PUFA: SFA; nd = not detected
Table 5 is a representation of the same data from Table 4, but in percentage format. Table 5 also
incorporates the P values of the muscle and blubber when compared between the two age groups.
There are highly significant differences in the muscle fatty acid values between bulls and pups.
The only fatty acids not significantly different in the muscles are behenic (22:0), oleic (18:1 n-9),
erucic (22:1 n-9), linoleic (18:2 n-6), α-linolenic (18:3 n-3), γ-linolenic (18:3 n-6), (20:2 n-6),
and DPA (22:5) fatty acids.

56
Table 5
Percentage composition of the fatty acid composition (% of total fatty acids identified) of the m.
pectoralis and blubber of ten Cape fur seal bulls and ten pups
Bulls Pups P value P value Fatty acid
muscle blubber muscle blubber muscle blubber
SFA 16:0 16.9 17.3 24.0 22.0 0.00 0.11 18:0 10.8 5.7 8.4 4.1 0.00 0.81 20:0 2.8 1.1 1.0 0.4 0.05 0.29 22:0 0.4 1.0 0.2 0.5 0.42 0.04 24:0 2.9 0.9 0.5 0.5 0.03 0.22 MUFA 16:1 n-7 3.3 9.5 6.1 9.4 0.07 0.63 18:1 n-9 18.1 8.8 13.7 18.8 0.80 0.35 20.1 n-9 3.0 2.7 2.0 2.6 0.00 0.19 22:1 n-9 2.5 3.3 1.7 1.6 0.10 0.22 24:1 n-9 2.1 0.6 0.8 0.3 0.06 0.09 PUFA 18:2 n-6 6.3 4.7 8.9 1.8 0.95 0.44 18:3 n-3 0.7 1.1 0.7 0.7 0.41 0.06 18:3 n-6 1.6 1.1 0.5 0.4 0.18 0.42 20:2 n-6 1.3 0.6 0.5 0.3 0.61 0.90 20:3 n-3 4.5 1.4 4.5 2.0 0.05 0.01 20:4 n-6 1.9 1.5 1.0 0.1 0.00 0.13 20:5 5.4 10.4 6.3 8.4 0.00 0.16 22:2 1.4 0.5 0.4 0.2 0.00 0.24 22:5 4.6 6.4 2.2 3.9 0.12 0.26 22:6 9.5 22.2 16.7 22.4 0.00 0.32
Significant differences (P<0.05) were found in the meat fatty acid composition when comparing
pups and bulls (Table 5). Significant differences (P<0.05) were found in the fatty acids of both
the muscle and blubber, although the differences were higher in the muscle. The fatty acids
found to differ, were mainly polyunsaturated and mono-unsaturated acids. As the diet between
adults (fish) and young (milk) differs, this could be the main contributor to this result.
In the blubber fatty acid values, there were fewer significant differences (P>0.05). The only fatty
acids significantly different (P<0.05) in the blubber of the pups and bulls, were behenic (22:0),
20:3 n-3 and γ-linolenic (18:3 n-6) acid. The bulls had the higher concentration of all three,
compared with the pups.
In the bull m. pectoralis, the SFA contributed 33%, the MUFA 29%, and the PUFA 38%, to the
total fatty acid composition. However, in the pups, the PUFA was lower (31%) and the SFA
(39%) higher than the MUFA (30%), which was similar to that of the bulls. This is explained by
the diet of the young seals, which were all on the point of being weaned. One major difference
between the blubber of the bulls and pups was that the latter had a higher concentration of
docosohexaenoic (DHA) fatty acid, which has been found to be vital for optimal development of

57
the central nervous system and visual performance in humans (Kim & Edsall, 1999). Once again,
this could be related to their diet of mother’s milk. As pups need to gain weight and blubber to
protect them against the cold water, the milk can be assumed to be extremely rich in lipids.
The fatty acid composition of red meat has little or no influence on the market value of a carcass
at present, as carcasses of domestic livestock species are valued according to a specific grade or
classification, taking into consideration age of the animal and degree of fatness of the carcass.
However, there is an increasing demand for meat products with a certain fatty acid profile. The
actual qualities (chemical and physical) of the fatty acids affect the sensory and storage qualities
of meat (Banskalieva et al., 2000), and it is known that the flavour of meat is also influenced by
its fatty acid composition (Melton, 1990). Unsaturated fatty acids have an increased expectation
for oxidation and thus rancidity, which influences shelf life.
PUFA, such as the omega-3 fatty acids, have recently become increasingly popular in human
diets, due to their apparent health benefits. The ratio of PUFA to SFA (P:S ratio) was higher in
the blubber of the pups than the bulls (1.44 and 1.15). However, in the m. pectoralis, the bulls
had a higher value than the pups (1.15 compared to 0.80). From a human dietary perspective, the
aim is to bring the P:S ratio of meat closer to >0.70, and the n-6:n-3 ratio to <5.0 (Raes et al.,
2004; Sanudo et al., 2000). According to Enser et al. (1998), the meat from ruminant animals
usually has a lower P:S ratio. As seen in Table 4, the P:S ratio of both the muscle and blubber of
the bulls and pups was >0.70. The n-6:n-3 ratio was higher in the tissue of the bulls (2.10 and
2.69 respectively), than that of the pups (0.59 and 0.84 respectively).
Human plasma cholesterol levels are correlated to the fatty acid composition of their diet (Flynn
et al., 1985). In general, MUFA and PUFA do not result in increased cholesterol levels, but high
levels of long-chain SFAs do (Grundy & Denke, 1990). It has been reported that palmitic acid
(C16:0) increases cholesterol levels, but that stearic acid (C18:0) does not (Rowe et al., 1999).
The importance of these particular fatty acids is becoming ever more evident in their utilisation
for value-added application in the food and pharmaceutical domains. The n-3 fatty acids decrease
serum triacylglycerol (TAG) and cholesterol levels (Kim & Edsall, 1999). They have been used
in the treatment and prevention of arthritis, rheumatism, hypertension, inflammatory and immune
disorders (Senanayake & Shahidi, 2001). Guidelines for consumers suggest the reduction in
intake of n-6 PUFA to n-3 PUFA and the intake of short- and medium- chain SFA (Gibney,
1993).

58
3.4.5. Toxin evaluation
Seal oil samples (ca. 50ml) were taken from 200-litre barrels and sent away for analysis of the
organochlorines in Bergen, Norway. The values obtained for the Canadian seal oil were results
from an independent study, obtained from the laboratory in Bergen. The organochlorine content
of the Namibian cape fur seal and the Canadian seal are depicted in Table 6.
Table 6
Organochlorine components of seal oil from the Namibian Cape fur seal and Canadian seal (ng/g
oil) (Institute of Marine Research, Bergen, Norway)
Component Cape fur seal Canadian seal* PCB#28 0.8 13.4 PCB#52 1.1 14.6 PCB#101 2.5 17.5 PCB#105 1.2 2.0 PCB#118 4.9 23.5 PCB#138 8.3 53.2 PCB#153 13.7 87.2 PCB#156 0.7 2.6 PCB#180 4.2 18.6 ppDDD 13.1 17.3 ppDDT 16.2 23.8 Dieldrin 1.0 1.7 HCB 0.6 61.3 a-HCH 0.1 79.1 b-HCH 8.6 16.5 g-HCH 1.0 5.5 Transnonachlor 18.5 165.5
*unpublished data
According to Nyman et al. (2002), the liver: blubber ratio in seals is equal to one, which implies
that the PCB and DDT burden is at equilibrium in the body. PCB#28 is the most prevalent PCB
in humans, and is known to have a neurotoxic effect. PCB#52 is found in the environment and is
metabolised rapidly in the mammalian body (Promochem, 1999). As can be seen in Table 6, the
Cape fur seal has very low levels of toxins in its oil compared with the oil from the Canadian
seal. This is consistent with results reported by Vetter et al. (1999). No organochlorine
component of the Cape fur seal was found in larger quantities than 13.7ng/g oil, whereas the
maximum amount for the same PCB was 87.2ng/g in the Canadian seal. The lowest
concentration of an organochlorine component in the oil of the Cape fur seal was 0.8ng/g
(PCB#28), whereas the lowest value for the Canadian seals was 2.0ng/g (PCB#105). According
to Vetter et al. (1999), the reason for such low organochlorine levels in the Namibian Cape fur
seal might be due to the fact that the Benguela current dries out the coastline, resulting in a belt
of non-arable land, 100-150km wide. This implies that there is no direct organochlorine input

59
except for rivers, which is also unlikely, since the regional input would remain limited mainly to
the Orange River in South Africa.
The amount of toxins found in the blubber of the Cape fur seal from Namibia (175μg/kg) used in
this study, were lower than the mean values reported in the blubber of harbour seals from Iceland
(1546μg/kg), ringed seals from Spitsbergen/Arctic (1226μg/kg), and only slightly higher than
those reported for Weddell seals (Leptonychotes weddellii) from the Antarctic (105μg/kg)
(Luckas et al., 1990).
3.5. Conclusion
Seal meat can be regarded as an exotic red meat species. No information on the chemical
composition of the meat of the Cape fur seal could be sourced. The results of this investigation
indicate that the seal is an animal whose meat and blubber characteristics make it suitable for use
in the human food chain. It can be regarded as an aquatic venison species, which has had no
artificial additives in its feed or administered otherwise, and can, thus, be viewed as organic
meat. As people are becoming increasingly aware of the origins of any meat they eat, the fact that
the seal has had no contaminating human contact whatsoever counts heavily in its favour.
This research has shown that, potentially, the seal can be regarded as an important contributor
toward the mineral, amino acid and polyunsaturated fatty acid requirements of humans. The
research findings show that seal meat is lean, with very high protein content, with most of the fat
being stored subcutaneously as blubber. It can therefore be viewed as a healthy, low fat
alternative to other traditional red meat species such as beef, mutton and pork.
With its low toxin content the oil could be processed into capsules and sold commercially for
human consumption, providing another potential alternative use for this animal. As also seen in
this investigation, seal blubber has optimum ratios of n-6:n-3, P:S and high levels of desirable
fatty acids. This indicates that the oil produced from this blubber would be a healthy alternative
for the consumer.
Countries with concessions to harvest seals, such as Namibia, could benefit from the full
utilisation of the animal. More research is needed with regard to the processing of the meat, as
well as the blubber, into products suitable for human consumption, because harvesting is
currently carried out in line with the main interests of the hide and animal feed industries and no
regard is presently paid to the cleanliness and hygiene of these operations. However, if

60
harvesting were to become more orientated towards producing meat for the human food industry,
there would be a need for a comprehensive design of a processing plant specifically geared
towards seal utilisation. Apart from this, commercialisation of seal meat harvesting would have
substantial ramifications in terms of job opportunities and increased economic returns and
foreign exchange revenues for the countries involved.
3.6. Acknowledgements
I would hereby like to acknowledge the help of the following persons, without whom this trial
would not have succeeded: Mr. Willem Burger, concession holder in Luederitz, Namibia, who
was extremely forthcoming with information and showed great interest in this research. He
allowed us to slow down or change any of the processes during the procedures related to seal
carcass processing at his plant, in order to make full use of our visit; and Steven Payne, fellow
student and friend, who came to Namibia with me and helped with the collection of samples.
3.7. References
Addison, R.F. & Brodie, P.F. (1987). Transfer of organochlorine residues from blubber through
the circulatory system to milk in the lactating grey seal Halichoerus grypus. Canadian
Journal of Fisheries and Aquatic Science, 44, 782-786.
Addison, R.F., Ikonomou, M.G. & Stobo, W.T. (1999). Polychlorinated dibenzo-p-dioxins and
furans and non-ortho and mono-ortho chlorine substituted polychlorinated biphenyls in grey
seals (Halichoerus grypus) from Sable Island, Nova Scotia, in 1995. Marine Environmental
Research, 47, 225-240.
American Meat Institute Foundation (1960). The Science of meat and meat products. American
Meat Institute Foundation, New York: Reinhold Publishing Corporation. Pp. 12.
AOAC (1997). Official Methods of Analysis. 16th Edition. Arlington, Virginia. Association of
Official Analytical Chemists Inc. Washington, DC. USA.
Aucamp, P.J., Henry, J.L. & Stander, G.H. (1972). Pesticide residues in South African marine
animals. Marine Pollution Bulletin, 2, 190-191.
Banskalieva, V. (2000). Fatty acid composition of goat muscles and fat depots: a review. Small
Ruminant Research, 37, 255-268.
Bidlingmeyer, B.A., Cohen, S.A. & Tarvin, T.L. (1984). Rapid analysis of amino acids using
pre-column derivatisation. Journal of Chromatography – Biomedical Applications, 336, 93-
104.
Borrell, A., Aguilar, A. & Pastor, T. (1997). Organochlorine pollutant levels in mediterranean
monk seals from the western Mediterranean and the Sahara coast. Marine Pollution Bulletin,
34, 505-510.

61
Cockcroft, V.G., De Kock, A.C., Lord, D.A. & Ross, G.J.B. (1989). Organochlorines in
bottlenose dolphins Tursiops truncates from the east coast of South Africa. South African
Journal of Marine Science, 8, 207-217.
DeLong, R.L., Gilmartin, W.G. & Simpson, J.G. (1973). Premature births in Californian seal
lions: association with high organochlorine pollutant residue levels. Science, 181, 1168-
1170.
Enser, M., Hallett, K.G., Hewett, B., Fursey, G.A.J., Wood, J.D. & Harrington, G. (1998). Fatty
acid content and composition of UK beef and calf muscle in relation to production systems
and implications for human nutrition. Meat Science, 49, 3, 329-341.
Flynn, M.A., Naumann, H.D., Nolph, G.B., Krause, G. & Ellersieck, M. (1985). The effect of
meat consumption on serum lipids. Food Technology, 39, 58-64.
Gibney, M.J. (1993). Fat in Animal Products: facts and perceptions. In: Safety and Quality of
Food from Animals. British Society of Animal Production Occasional Publication, Volume
XV11 (Edited by J.D. Wood & T.L.J. Lawrence). Pp. 57-61. Edinburgh: BSAP (As cited by
Wood & Enser, 1997).
Grundy, S.M. & Denke, S.A. (1990). Dietary influences on serum lipids. Journal of Lipid
Research, 31, 1149-1172.
Henry, J. & Best, P.B. (1983). Organochlorine residues in whales landed at Durban, South
Africa. Marine Pollution Bulletin, 14, 223-227.
Higgs, J.D. (2000). The changing nature of red meat: 20 years of improving nutritional quality.
Trends in Food Science and Technology, 11, 85-95.
Kim, H.Y. & Edsall, L., (1999). Lipase-catalysed modification of rice bran oil incorporate capric
acid. Journal of the Agricultural and Food Chemistry, 48, 4439-4443.
Lawrie, R.A. (1998). In Lawrie’s Meat Science. Woodhead Publishing Limited, Cambridge,
England. Pp. 261.
Lee, C.M., Trevino, B. & Chaiyawat, M. (1996). A simple and rapid solvent extraction method
for determining total lipids in fish tissue. Journal of the Association of Official Analytical
Chemists International, 79, 487-492.
Lin, K.C., Cross, H.R., Johnson, H.K., Bernstein, B.C., Randecker, V. & Field, R.A. (1989).
Mineral composition of lamb carcasses from the United States and New Zealand. Meat
Science, 24, 47-59.
Luckas, B., Vetter, W., Fischer, P., Heidemann, G. & Plötz, J. (1990). Characteristic chlorinated
hydrocarbon pattern in the blubber of seals from different marine regions. Chemosphere, 21,
13-19.
MacDonald, D.D., Ikonomou, M.G., Rantalainen, A.-L., Rogers, I.H, Sutherland, D. & Van
Oostdam, J. (1997). Contaminants in white sturgeon (Acipenser transmontanus) from the

62
Upper Fraser River, British Columbia, Canada. Environmental Toxicology and Chemistry,
16, 479-490.
Melton, S.L. (1990). Effects of feeds on flavour of red meat: a review. Journal of Animal
Science, 68, 4421-4435.
NAMMCO, (1998). North Atlantic Marine Mammal Commission, c/ - University of Tromso, N-
9037 Tromso, Norway.
Nyman, M., Koistinen, J., Fant, M.L., Vartiainen, T. & Helle, E. (2002). Current levels of DDT,
PCB and trace elements in the Baltic ringed seals (Phoca hispida baltica) and grey seals
(Halichoerus grypus). Environmental pollution, 119, 399-412.
Pellett, P.L. & Young, V.R. (1990). Role of meat as a source of protein and essential amino
acids in human protein nutrition. In Meat and Health (A.M. Pearson, and T.R. Dutson, Eds.).
Elsevier Publishers Ltd., Barking, UK. Pp. 329-370.
Promochem (2002). Reference Materials for Organic Analytes in Industrial, Foodstuff and
Environmental Analysis (Promochem).
Raes, K., De Smet, S. & Demeyer, D. (2004). Effect of dietary fatty acids on incorporation of
long chain polyunsaturated fatty acids and conjugated linoleic acid in calf, beef and pork
meat: a review. Animal Food Science and Technology, 113, 199-221.
Reijnders, P.J.H. (1986). Reproductive failure in common seals feeding on fish from polluted
coastal waters. Nature, 324, 456-457.
Robinson, P.H. (1996). Evaluation of a seal by-product meal as a feedstuff for dairy cows.
Animal Feed Science Technology, 63, 51-62.
Rose, W.C., Wixom, R.L., Lockhart, H.B. & Lambert, G.F. (1955). The amino acids
requirements of Man. XV: The valine requirement, summary and final observations. Journal
of Biological Chemistry, 217, 987.
Rowe, A., Macedo, F.A.F., Visentainer, J.V., Souza, N.E. & Matsushita, M. (1999). Muscle
composition and fatty acid profile in lambs fattened in drylot or pasture. Meat Science, 51,
283-288.
SAS (1990). SAS/STAT User’s Guide. Version 6. (4th Edition). Cary, NC: SAS Institute Inc.
Senanayake, S.P.J.N. & Shahidi, F. (2001). Enzyme-catalyzed synthesis of structured lipids via
acidolysis of seal (Phoca groenlandica) blubber oil with capric acid. Food Research
International, 35, 745-752.
Shahidi, F. & Synowiecki, J. (1993). Nutrient composition of mechanically separated and
surimi-like seal meat. Food Chemistry, 47, 41.
Shahidi, F., Synowiecki, J., Amarowicz, R. & Wanasundra, U. (1994). Omega-3 fatty acid
composition and stability of seal lipids. In C. -T. Ho, & T.G. Hartman (Eds.), Lipids in food

63
flavours (ACS Symposium Series 558) Washington, DC: American Chemical Society. Pp.
233-243.
Simonsen, B., Hamm, R. & Rogowski, B. In H,R. Cross, & A.J. Overby (Eds.), World Animal
Science, Meat Science, Milk Science and Technology. New York: Elsevier Science
Publishers, (1988). Pp. 141-165.
Synowiecki, J., Heeley, D.H. & Dhahidi, F. (1992). Purification and characterization of
myoglobin from Harp seal (Phoca groenlandica). Journal of Agricultural Food Chemistry,
40, 714-718.
Tichelaar, H.Y., Smuts, C.M., van Stuiivenberg, M.E., Faber, M. & Benadé, A.J.S. (1998). The
fatty acid composition of rural school children with helminth infections. Asia Pacific Journal
Clinical Nutrition, 7, 196-197.
Vetter, W., Weichbrodt, M., Scholz, E., Luckas, B. & Oelschläger, H. (1999). Levels of
Organochlorines (DDFT, PCBs, Toxaphene, Chlordane, Dieldrin, and HCHs) in Blubber of
South African Fur Seals (Arctocephalus pusillus pusillus) from Cape Cross/Namibia.
Marine Pollution Bulletin, 38, 830-836.
Voldner, E.C. & Li, Y. -F. (1995). Global usage of selected persistent organochlorines. The
Science of the Total Environment, 160/161, 201-210.
Williams, J.C. (1987). Contribution of red meat to the US diet. Food and Nutrition News, 59,
37-40.
Tanabe, S., Watanabe, S., Kan, H., Tatsukawa, R. (1988). Capacity and mode of PCB
metabolism in small cetaceans. Marine Mammal Science, 4, 103-124.
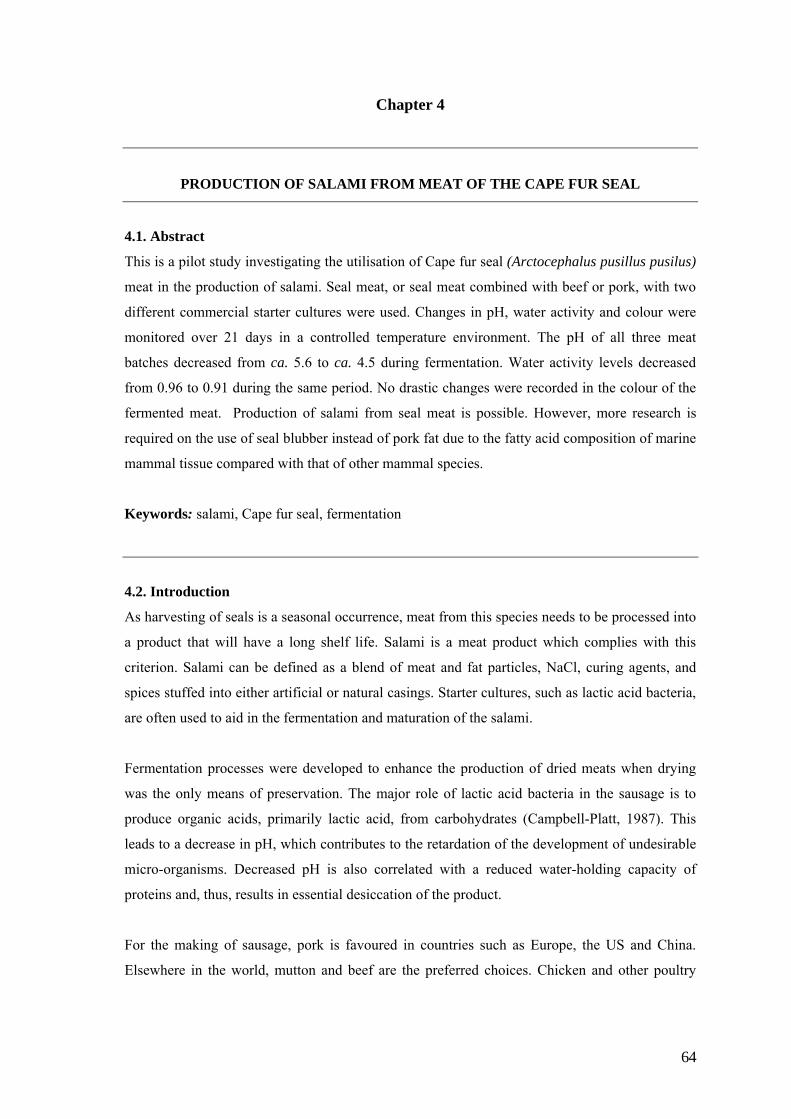
64
Chapter 4
PRODUCTION OF SALAMI FROM MEAT OF THE CAPE FUR SEAL
4.1. Abstract
This is a pilot study investigating the utilisation of Cape fur seal (Arctocephalus pusillus pusilus)
meat in the production of salami. Seal meat, or seal meat combined with beef or pork, with two
different commercial starter cultures were used. Changes in pH, water activity and colour were
monitored over 21 days in a controlled temperature environment. The pH of all three meat
batches decreased from ca. 5.6 to ca. 4.5 during fermentation. Water activity levels decreased
from 0.96 to 0.91 during the same period. No drastic changes were recorded in the colour of the
fermented meat. Production of salami from seal meat is possible. However, more research is
required on the use of seal blubber instead of pork fat due to the fatty acid composition of marine
mammal tissue compared with that of other mammal species.
Keywords: salami, Cape fur seal, fermentation
4.2. Introduction
As harvesting of seals is a seasonal occurrence, meat from this species needs to be processed into
a product that will have a long shelf life. Salami is a meat product which complies with this
criterion. Salami can be defined as a blend of meat and fat particles, NaCl, curing agents, and
spices stuffed into either artificial or natural casings. Starter cultures, such as lactic acid bacteria,
are often used to aid in the fermentation and maturation of the salami.
Fermentation processes were developed to enhance the production of dried meats when drying
was the only means of preservation. The major role of lactic acid bacteria in the sausage is to
produce organic acids, primarily lactic acid, from carbohydrates (Campbell-Platt, 1987). This
leads to a decrease in pH, which contributes to the retardation of the development of undesirable
micro-organisms. Decreased pH is also correlated with a reduced water-holding capacity of
proteins and, thus, results in essential desiccation of the product.
For the making of sausage, pork is favoured in countries such as Europe, the US and China.
Elsewhere in the world, mutton and beef are the preferred choices. Chicken and other poultry

65
meat is also used in the production of fermented sausages. The meat used in the production of
salami should be suitable in terms of water-holding capacity, pH value and colour.
After drying of the salami, it may now contain up to 50% fat, which makes fat an important
ingredient of fermented sausage. This can lead to problems such as rancidity, which has a direct
effect on the shelf life of the product. There are many substances that can be added to act as anti-
oxidants, one of which is ascorbic acid, which may also act as a curing agent and in stabilising
the colour.
Common salt (NaCl) is generally added to the batter at a concentration of 2.5-3.0%, making it
the single most critical non-meat ingredient. Salt extracts soluble proteins from meat particles,
thus forming an adhesive film to aid in cohesion of the different ingredients in the sausage.
Nitrite is important in the determination of colour of many fermented meat products, and in
retarding lipid oxidation. The maximum level of nitrite allowed in sausages is between 120 and
150ppm (Campbell-Platt, 1987). Both NaCl and nitrite play vital roles in creating a favourable
environment for the development of lactic acid bacteria in the early stages of fermentation and to
retard the growth of undesirable micro-organisms.
Commonly used spices are cumin seed, fennel seed, dried garlic, mustard, and pepper. In some
countries, producers also use other ingredients to influence taste as well as mask unpleasant
flavours: red wine, berry extracts, as well as artificial flavourants .
Fermented sausages are generally produced as dry or semi-dry products, although some are
intermediate (Jay, 1978). There is a continuous spectrum of reduced moisture contents between
different products, with drier products having a water activity of approximately 0.8, which
increases the shelf life of the product, this being a great advantage in the hotter regions of the
world, such as South Africa (Campbell-Platt, 1987).
The most common starter culture species used in the fermentation of beef and pork sausages are
strains of Lactobacillus, Pediococcus, non-pathogenic Staphylococcus and Micrococcus (Lücke,
1986). The organic acids produced by these bacteria prevent the development of pathogenic
micro-organisms (Schillinger & Lücke, 1987), aid the cohesion of meat particles (Townsend et
al., 1980) and contribute to the colour change of fermented sausages.
According to Shahidi & Synowiecki (1993), seal meat is comparable with or better than that of
other sources of animal protein, in terms of its intramuscular lipid composition (fatty acids). The

66
fatty acids also present in the blubber are excellent sources of omega-3 fatty acids (Shahidi et al.,
1994). A myoglobin content of up to 13.4mg/g provides the opportunity to utilise seal meat as a
colour contributor in meat products using meats of lesser colour quality or potential (Synowiecki
et al., 1992).
As the harvesting of seals is seasonal, a product such as salami needs to be developed with a
shelf life that would allow a year-round supply of this commodity. The aim of this study was to
determine whether seal meat could lend itself to the production of traditional salami. This had to
be researched with regard to the ability of a particular starter culture reacting favourably with the
meat. Chemical reactions within the meat, including change in pH and water activity (aw), and
colour and moisture loss, also had to be monitored.
4.3. Materials and methods
The seal meat used in this trial was obtained from a cull commissioned by the Department of
Nature Conservation of the Western Cape.
The seals were shot with a .22 calibre rifle by a professional hunter, and stuck to bleed within 30
seconds of being shot. Evisceration occurred on site. The carcasses were subsequently taken to a
commercial meat processing plant, where the production of the salami took place. This process
took place under the same conditions applying to the production of commercial salami.
4.3.1. Starter cultures and growth conditions
The starter culture LS 25 (Freddy Hirsch, P.O. Box 2554, Cape Town, 8000, South Africa), used
in two of the three batters (namely the salami produced from pure seal meat and the one made
with seal and beef), is a cocktail consisting of Lactobacillus spp. L110 and Staphylococcus.
The other starter culture, called ‘OPTIstart PLUS’ from Raps in Germany (Freddy Hirsch, P.O.
Box 2554, Cape Town, 8000, South Africa), was used in the seal and pork salami. It consists of a
mixture of Lactobacillus spp. L110, Micrococcus Varians M86 and Debaryomyces hansenii.
The starter cultures came in powder form and were suspended in water, according to the sizes of
the relevant batches, before being added to the batter during preparation.
4.3.2. Meat preparation and fermentation
In this trial, the frozen seal meat was chopped to a particle size of 3-4mm in diameter in a
commercial, two-speed 25-litre bowl cutter. Curing salt was added to the mixture before frozen

67
pork back fat was added. After chopping to a particle size of 5-8mm diameter, a mixture of
spices was added. The three batches were prepared in succession, so as to minimise the variation
in the production environmental conditions.
The three batches differed (see Table 1); batch A contained mostly seal meat, using starter
culture LS 25, batch B contained some pork, using ‘OPTIstart’ starter culture, and batch C
contained some beef, using the same standard starter culture, LS 25, as batch A.
The batter was stuffed into collagen casings (60mm diameter), using a commercial sausage
stopper. The different batters were treated in the same way and sausages were stuffed at 15cm
intervals. Ca. 21 sausages per batter were produced.
The salami was fermented for 24 hours at 20-22oC and 97-99 % RH, and cold smoked for two
days at 18-24oC and 45-60 % RH. It was then ripened for a further 20 days at 16-18 oC and 40-
60% RH. Samples were taken from the batter (day 1), and subsequently at three-day intervals
during the fermentation period, and the relevant parameters measured (see 4.3.3). The sausages
were also weighed every three days, to observe moisture loss.
4.3.3. Recorded parameters
In this investigation, pH values were taken, in triplicate, using an insertion probe (Crison model
507, Crison instruments, South Africa). The instrument was calibrated using standard calibration
solutions of pH 4 and 7. The probe was cleaned with distilled water between each reading, to
ensure that no fat particles from the sausage batter were left in the nozzle to affect further
readings.
Water activity values were measured, using a Novasina ms1-aw (Labotec, P.O. Box 790, Howard
Place, 7450, South Africa) handheld instrument. This instrument was calibrated according to the
manufacturer’s instructions. Approximately 5g of sample was placed into a 2.5cm-diameter
plastic dish, which was then inserted into an enclosed space.
Colour measurements (L*, a*, b* values) were recorded, using a CIELab Colorimeter (Gardner,
Columbia, USA). The salami was cut into sections, 2.5cm thick, and colour readings were taken
from the sliced surfaces. Readings were collected from three different areas on each slice to
obtain an approximate value for each factor. In the L*a*b* colour space, colour difference can
be expressed as a single numerical value, ΔE*ab. The ΔE*ab value was calculated according to the
following equation:

68
ΔE*ab = √(ΔL*)2+(Δa*)2+(Δb*)2
The chroma and hue angles were also calculated as psychometric correlates of perceived chroma
and hue, using the a* and b* colour values (Hunter and Harold, 1987; Setser, 1984):
Chroma = (a*2 + b*2)1/2
Hue angle = tan-1(b*/a*)
The readings were taken in triplicate from the first section, the centre and the end of the sausage
respectively. The orientation was determined by the position of the sausage during hanging on
the rack in the chamber. In terms of this, the first section was attached to the loop from which the
sausage hangs. The readings were taken from these different positions, in order to note if there
were any changes resulting from the orientation. As no differences were found, the values were
pooled for further comparisons.
Weights were recorded up to a three decimal point accuracy, and the same scale was used
throughout the trial. The same pH probe, and water activity instrument, were used to ensure
consistency of results, and to minimise variation due to possible instrumental error.
Table 1
Quantities (g) of various constituents used to make the seal salami
Batches Constituents A B C
Seal meat 6000 3000 3000 Pork fat 3000 1600 1600 Fresh beef mince 500 500 800 Commercial starter culture 18 18 OPTI start starter culture 15.6 Salt 200 200 Spice (pepper, paprika) and salt 312 Spices (pepper, paprika) 128 128 Pork meat 3000 Beef meat 3000 Mustard seed 50 Red wine 250 Total 9846 8477.6 7996 4.4. Results and discussion
As this was an exploratory investigation, the three salami batches had no common main effect
and no statistical analysis was therefore applied to the results to test for differences between

69
batches. However, standard regression equations using SAS (1990) were used to try and quantify
changes with time.
4.4.1. Water activity and pH correlation
From a food safety aspect, food is regarded as safe and shelf-stable at either a water activity (aw)
of <0.9 or pH values of <5.0. Both aw and pH values should be below the stated values to prevent
bacteria from developing any further. With regard to collected data, pH is the most important and
readily obtained variable used to monitor fermentation progress in salami (Acton et al., 1977; De
Ketelaere et al., 1974). Production of lactic acid results in a decrease of meat pH to a final pH of
between 4.8 and 4.9, and stimulating the aggregation of muscle proteins, which forms the typical
texture of salami sausage due to this coagulation (Campbell-Platt, 1987). The content of lactate
in meat used for the processing of salami varies in meat with different meat characteristics: pale,
soft and exudative meat is acidic, whereas dark, firm and dry meat is more alkaline. These are
important variables to take into account when selecting ingredients for the production of
fermented sausages (Nordal & Slinde, 1980).
Inoculant bacteria, such as Micrococci and Staphylococcus carnosus are vital in the initial stages
of fermentation, as they are active in reducing nitrate to nitrite and also stabilise the colour of the
product. The presence of lactic acid bacteria helps in decreasing the pH of the meat and thus
making conditions unfavourable for other Gram-negative bacteria (Campbell-Platt, 1987).
The consistency of fermented sausage is also determined by the pH value of the product, and the
aw level, the consistency being ideal at a pH value <5.4 and aw level <0.9. Therefore, the pH
value is seen to be the major determinant of consistency in high-acid, semi-dry sausages, and the
aw level in low-acid, dry sausages (Campbell-Platt & Cook, 1995).
The water activity is a measure of the partial vapour pressure of the foodstuffs compared to that
of pure water at its surface. Water molecules are loosely orientated in pure liquid water and can
easily rearrange. When solutes are introduced, these orient the water molecules around them and
make them much less available for use by micro-organisms (Gracey et al., 1999). Reduction of
the aw level during drying is largely a function of water loss and consequent increase in solute
concentration (Campbell-Platt & Cook, 1995).
The rate of the pH drop in all three batches, prepared using different starter cultures, was similar.
At day 10, there was a slight increase in the aw levels in all batches, but they all evened out again
by day 13. In all batches, the initial pH was approximately 5.6, with an ultimate pH value of 4.4

70
(see Figs. 1, 2, 3). Linear regression lines were found to give the best goodness of fit, and the
intercept and gradient of these equations are depicted in Table 2.
The sudden increase in aw shown in Figs. 1-3 might have been due to a malfunctioning of the
maturation chambers at the plant, such as a power failure or a system fault. A change in the aw
level would not rectify itself immediately, and could take three days. This would correspond with
the data collected. However, records from the processing plant did not show any technical
problems during that particular time.Alternatively, the water activity meter may have
malfunctioned, although it was the same instrument, used in exactly the same manner.
Another possibility is that at this pH level, muscle proteins are near their iso-electric point and
could be releasing more water from their structure. This would be indicated by an immediate
increase in aw after a decline, due to the released water around the cells, which is recorded by the
water activity meter when the measurement is taken. This water will remain there, as the cells are
not able to reabsorb the water which they have released due to the pH value at that point. This
would result in an increased level of aw, which would then gradually decrease again, due to the
standard drying procedures involved in the production of fermented sausages. Another possibility
is that the salt added on the day of production of the sausages absorbs water, which is released as
it dissolves, thus resulting in a surge in the water activity. This phenomenon could not be
substantiated, as no aw information could be sourced from the available scientific literature.
0
1
2
3
4
5
6
7
1 4 7 10 13 16 19 21days
pH
0.87
0.89
0.91
0.93
0.95
0.97
0.99
a w
phaw
Figure 1. Water activity and pH values in salami made from seal meat (batch A) over 21 days

71
0
1
2
3
4
5
6
7
1 4 7 10 13 16 19 21days
pH
0.87
0.89
0.91
0.93
0.95
0.97
0.99
a w
phaw
Figure 2. Water activity and pH values in salami made from seal and pork meat (batch B) over 21 days
0
1
2
3
4
5
6
7
1 4 7 10 13 16 19 21days
pH
0.87
0.89
0.91
0.93
0.95
0.97
0.99
a wphaw
Figure 3. Water activity and pH values in salami made from seal and beef (batch C) over 21 days

72
Table 2
Regression line data for the pH values of all three seal salami batches over 21 days
Batch Intercept (a) Gradient (b) R2 value A 5.1975 -0.1107 0.4095 B 5.1286 -0.1084 0.4566 C 4.9983 -0.0866 0.2567
A= pure seal meat B= seal meat with pork C= seal meat with beef
4.4.2. Colour variation between the three different batches of salami
From the selection of ingredients, it can be assumed that batch A will appear the darkest, due to
the high level of seal meat in it. Batch C should also be darker than batch B, as beef has a darker
colour than pork. The CIELab colour space was used to determine colour change in the sausages.
Measurements were taken on the batter prior to stuffing and then at regular intervals. As times
between the preparation of the batter to the time of stuffing differed between batches, there could
be discrepancies in the colour measurements due to the action of nitrite on the product and the
time it had to have an effect. Therefore, it was decided to omit the first colour value of the batter.
In this colour space, L* (Fig. 4) indicates lightness and a* (Fig. 5) and b* (Fig. 6) are the
chromaticity coordinates, a* being sensitive to red and green, whereas b* is sensitive to yellow
and blue chroma/hues. As the colour parameters indicate linear changes, linear regression
equations were fitted to the data (Table 3).
Formation of heme-containing pigments in fermented sausages follows the same pathways as in
other nitrite-containing meat products. The low pH value has a strong influence, initially
destabilising myoglobin and increasing the rate of auto-oxidation to metmyoglobin. The heme
group dissociates at the pH value of many fermented sausages and colour is primarily attributed
to nitrosomyoglobin (Slinde & Nordal, 1978). Previous studies on dissociation curves for
myoglobin and haemoglobin in citric acid buffer showed that the heme group dissociates from
the proteins at lower pH values comparable with those normally found in dry sausages during
fermentation (Slinde & Nordal, 1978). There was a decrease in absorbance values, due to the
dissociation of the heme from myoglobin or haemoglobin.
Hutchings (1994) suggested that a decrease in the L* value corresponds to a decrease in
whiteness, or lightness. According to Slinde & Nordal (1978), the dissociation of the heme group
would result in a decreased lightness, i.e. darkening, and thus an L* value decline. It can be seen
that batch B showed a slight decline at day ten. This would correlate with a pH value <5, which

73
would indicate that dissociation of heme had occurred, and which would be more visible in the
lighter salami, such as the one with pork, which is batch B.
Fig. 4 shows that all three batches showed a decrease in lightness over time. Batches A and C
had very similar gradients, -0.2674 and –0.278 respectively (Table 3), indicating that they had a
similar degree of darkening. As pork is a lighter meat to begin with, its rate of darkening was
less, as less pigment is available to oxidise to a darker state. Thus, this batch (B) had a gradient
of –0.2286, less than that of the other two batches. The L* value of batch A was much lower than
that of B and C, as was the intercept. This would correlate positively with the higher content of
seal meat in this batch, which contained very high concentrations of hemoprotein (average
60mg/g-1) (Synowiecki et al., 1992).
According to Slinde (1987), the black colour found in salami is due to a hydrophobic component,
and as seal meat is such a rich source of pigment, haemoglobin would be such a component. The
dissociation of heme from haemoglobin and myoglobin would result in the L* value changing. A
pH decline would result in the dissociation of these components. The red core found in many
salami, at pH <5, would indicate the reductiveness of this part of the sausage, and thus the heme
group would be less likely to dissociate from the haemoglobin or myoglobin, and not form the
darker colour. The L* value also represents the reflection and absorbance as the surface changes
due to the loss of water, which leads to decreased reflectance and absorbance on the surface of
the sample.
The a* value is usually the value which is the most accurate when relating values to actual visual
experience by the observer (Precise Colour Communication, 1998). A difference of 1-1.5 is taken
to be able to be recognised as a difference visually. Fig. 5 shows that the a* value of all three
batches decreased over time, with batch C showing the fastest decline, with a gradient of -
0.5315, and batch B showing very little change, with a gradient close to 0 (-0.0631). Batch A, the
batch containing the highest concentration of seal meat, showed a slight decrease over time, with
a gradient of –0.1046 per time unit. According to Hutchings (1994), an increase in the a* value is
correlated to an increase in the red colour of what it is being measured. The negative gradient in
these batches would therefore indicate that the red colour was changing to a darker, browner
colour, due to formation of metmyoglobin.
Fig. 6 illustrates the behaviour of the b* values of all three batches. The trend of all three batches
appeared similar over the first four days. Thereafter, batch B increased slightly, while the other
two batches decreased. This indicates that the yellow fraction of batch B was more prominent.

74
Batch B’s b* value continued to increase throughout maturation, whereas the other two batches
had decreasing b*-values, correlating with an increase in the blue fraction. Batch C showed
nearly no change at all, with a gradient of 0.0042, indicating very little change in the yellow
fraction over time. However, due to its high intercept, 7.9896, it contained a greater
concentration of yellow than the other two batches, A and B, with intercept values of 4.8927 and
7.1129 respectively. Batch A had the largest rate of change over time, with an upward trend of
0.1359.
20222426283032343638
1 4 7 10 13 16 19 21
days
L* v
alue
s
A
B
C
Linear (A)
Linear (B)
Linear (C)
Figure 4. L*-values of batches (A, B, C) over time, as well as linear regression lines of the data
5
7
9
11
13
15
17
1 4 7 10 13 16 19 21
days
a* v
alue
s
A
B
C
Linear (A)
Linear (B)
Linear (C)
Figure 5. a*-values of batches (A, B, C) over time, as well as linear regression lines of the data

75
3
4
5
6
7
8
9
10
1 4 7 10 13 16 19 21
days
b* v
alue
s
A
B
C
Linear (A)
Linear (B)
Linear (C)
Figure 6. b*-values of batches (A, B, C) over time, as well as linear regression lines of the data
In the L*a*b* colour space, colour difference can be expressed as a single numerical value,
ΔE*ab. This indicates the size of the colour difference, but not how the colours differ (Fig. 7)
(Precise Colour Communication, 1998). High ΔE*ab values are indicative of greater colour
difference. It is evident that all three batches were similar in behaviour regarding colour
difference across the three-week time interval. As ΔE*ab values are a combination of a* and b*
values, it can be expected that batch C will show the largest gradient, and batch B the smallest.
All three batches showed a decreasing trend over time, with the largest decrease being seen in
batch C (-0.4358), and the least in batch B (-0.2551), whilst that of batch A (-0.2679) was
intermediate.
Hue (Fig. 8) is the term used to describe the attribute of a visual perception, according to a
specific area, or proportions of two of the primary colours for the classifications of red, yellow,
green and blue (Precise Colour Communication, 1999; Hutchings, 1994). An increase in hue
indicates a slight shift towards the yellow spectrum, which would be interpreted as an increase in
the brown colour in terms of visual appearance. Accordingly, batch C would be the batch
showing a shift towards the yellow spectrum, which would agree with Fig. 6. The other two
batches showed a decrease, with a gradient of -6.2363 and -3.3063 for batches A and B
respectively, and with both batches having a similar intercept (98.05 and 94.577 respectively).

76
An increase in chroma is indicative of a trend away from greyish colour, and increased
saturation, being visually interpreted as a more vivid red (Hoffman & Mellett, 2003), or it can be
described as the colourfulness of an object relative to its brightness (Hutchings, 1994). Fig. 9
depicts the change of chroma over time. Batch B shows a smooth increase (gradient 4.0911) over
21 days. The line moves smoothly along the L-plane, which correlates to the L*value in Fig. 4.
This would correlate to the R2 value of batch B (Table 3), of 0.9977, which indicates a nearly
perfectly linear rate of change over time. However, batch B had a much larger rate of change
than batch C, which has a gradient of only 1.9379. Batch A shows little variation over time, but
remains fairly even, with a gradient of –0.0302. Thus, it can be said that batches B and C became
less grey, and redder in colour. This would be due to the action of nitrite on the colour of the
sausage, which would be clearer in the lighter meat types, pork and beef. As pork is the lightest
meat, it showed the most rapid increase in chroma over time.
25
27
29
31
33
35
37
39
41
1 4 7 10 13 16 19 21
days
E*ab
A
BCLinear (A)Linear (B)Linear (C)
Figure 7. ΔE*ab value of batches A, B, C over time, as well as linear regression lines of the data

77
30
40
50
60
70
80
90
100
1 4 7 10 13 16 19 21
days
HU
E
A
B
C
Linear (A)
Linear (B)
Linear (C)
Figure 8. Hue values of batches A.B,C over time, as well as linear regression lines of the data
0
5
10
15
20
25
30
35
1 4 7 10 13 16 19 21
days
CH
RO
MA
A
B
C
Linear (A)
Linear (B)
Linear (C)
Figure 9. Chroma values of batches A, B, C over time, as well as linear regression lines of the data

78
Table 3
Regression line data for the L*, a*, b*, ΔE*ab, hue and chroma values of all three salami batches
containing some degree of seal meat, over a period of 21 days
Parameter Batch Intercept (a) Gradient (b) R2 value L* values A 31.033 -0.2674 0.2906 B 35.387 -0.2286 0.1063 C 36.763 -0.2780 0.4377 a* values A 11.263 -0.1046 0.0690 B 9.047 -0.0631 0.0173 C 15.468 -0.5315 0.7691 b* values A 4.893 0.1359 0.2183 B 7.113 -0.1070 0.2807 C 7.990 0.0042 0.0002 ΔE*ab values A 33.401 -0.2679 0.2721 B 37.219 -0.2551 0.1084 C 40.466 -0.4358 0.6272 Hue A 98.050 -6.2363 0.9115 B 94.577 -3.3063 0.9977 C 42.972 1.3646 0.7960 Chroma A 12.264 -0.0302 0.0056 B -2.273 4.0911 0.9977 C 8.489 1.9379 0.9520
4.4.3. Weight loss
Fig. 10 shows every third consecutive day’s weight loss over a period of 20 days. All three
batches showed similar weight losses over time, although batch A had a slightly lower weight
loss during the first four days. This similarity in weight loss could be ascribed to the environment
in the chamber (being set at fixed % RH) dominating any potential variation within the different
salamis and thus over-riding their potential effect.
02468
10121416
4 8 12 16 20
days
%w
eigh
t los
t
ABC
Figure 10. Percentage weight loss over time of all three salami batches A, B and C over 21 days

79
4.5. Conclusion
The results presented in this investigation show that the production of fermented, processed
products is possible using the meat of the Cape fur seal. As this was a pilot study, some variables
were omitted, such as microbiological examination of the batter and the finished product. As the
seal is a wild animal, found under extensive conditions, its meat may have contained and
attracted micro-organisms other than those found in the meat of intensively produced, traditional
red meat producing species. It is vital to incorporate starter cultures into products produced from
these species, as these could eliminate any resident bacteria. Further research is required into the
microbiological characteristics of seal meat.
Significantly, these findings regarding the quality and palatability of seal meat products open up
the possibility of using seal meat on a larger, commercial scale, leading to the more effective
utilisation of this species, as seals are momentarily only hunted for their skins and genitalia. This
opportunity for potential revenue generation, in turn, might make the harvesting of these animals
a more acceptable practice globally, especially if it were known that the whole animal was being
utilised fully and that proper use was being made of the meat.
Certainly, such an undertaking is not without challenges:
a) Seal flesh is dark in colour, which would require investigation into consumer acceptance
of a product containing such dark meat. Consumers need to be completely satisfied with
the sensory characteristics of a product before any other quality variables enjoy priority
(Chambers & Bowers, 1993).
b) Presently, the supply of meat is seasonally dependent, as concessions to harvest seals are
regulated strictly. Although this means in effect that securing a regular supply of meat
throughout the year would be less likely, this in turn might well increase the desirability
and value of the available meat.
It is possible that these potential drawbacks might also be offset by the fact that seal meat is
regarded as healthy and wholesome, due to its lean meat content and high concentration of
polyunsaturated fatty acids (see Chapter 3). Using seal meat in salami form would also ensure a
continuous supply of this meat to the consumer, as it is shelf stable. In a world populated by
people who are increasingly aware of the quality, purity and naturalness of their diets and the
meat they consume, these features could be used as strategic factors in any campaign to market
seal meat products commercially.

80
4.6. Acknowledgements
I would hereby like to thank the following persons and/or companies for their assistance in this
trial: The company Roelcor and Roers, who supplied the materials other than the seal meat, as
well as staff and their expertise in the production and continued fermentation of the salami; Mr.
Herman Jonker, professional hunter contracted by Nature Conservation in the Western Cape,
who realised the importance of this project and assisted in obtaining the seals, whose meat was
used for this investigation; and Liezel and Greg, fellow students, for dissecting a seal, which was
deemed not suitable for human consumption due to advanced decomposition.
4.7. References
Acton, J.C., Dick, R.L. & Norris, E.L. (1977). Utilization of various carbohydrates in fermented
sausage. Journal of Food Science, 42, 174-178.
Campbell-Platt, G. (1987). Fermentation foods of the World. 1st edition, Cambridge. Pp. 82-91.
Campbell-Platt, G. & Cook, P.E. (1995). Fermented meats.1st edition, Chapman & Hall.
Chambers, I.V.E. & Bowers, J. (1993). Consumer perception of sensory quality in muscle foods:
sensory characteristics of meat influence consumer decisions. Food Technology, 47, 116-120.
De Ketelaere, A., Demeyer, D., Vanderkerckhove, P. & Vervaeke, J. (1974). Stoichiometry of
carbohydrate fermentation during dry sausage ripening. Journal of Food Science, 39, 297-
300.
Hoffman, L.C. & Mellett, F.D. (2003). Quality characteristics of low fat ostrich meat patties
formulated with pork lard or modified cornstarch, soya isolates and water. Meat Science, 65,
869-875.
Hunter, R.S. & Harold, R.W. (1987). The Measurement of Appearance. John Wiley & Sons,
NewYork. Pp. 62-74.
Hutchings, J.B. (1994). Food colour and appearance. 1st edition. Blackie Academic and
Professional. Pp. 23-25.
Jay, J.M. (1978). Modern Food Microbiology. 2nd edition. Pp. 266-269.
Lücke, F-K. (1986). Microbiological processes in the manufacture of dry sausage and raw ham.
Fleischwirtschaft, 66, 1505-1509
Nordal, J. & Slinde, E. (1980). Characteristics of some lactic acid bacteria used as starter
cultures in dry sausage production. Applied and Environmental Microbiology, 40, 472-475.
Precise Color communication. (1998). Minolta Co., Ltd.
Schillinger, U. & Lücke, F.K. (1987). Identification of lactobacilli from meat and meat products.
Food Microbiology, 4, 199-208.
Setser, C.S. (1984). Colour: reflections and transmissions. Journal of Food Quality, 6, 183-187.

81
Shahidi, F. & Synowiecki, J. (1993). Nutrient composition of mechanically separated and surimi-
like seal meat. Food Chemistry, 47, 41.
Shahidi, F., Synowiecki, J., Amarowicz, R. & Wanasundara, U. (1994). In Lipids in Food
Flavors, Eds C. -T. Ho and T.G. Hartman. American Chemical Society, Washington, DC.
Pp. 233
Slinde E. & Nordal, J. (1978). Formation of nitrosoheme and heme in dry sausages using
catalase positive strains of lactic acid bacteria as starter cultures, p. G11: 1-G 11:6. In K.O.
Honikel (ed.), Proceedings of the 24th meeting of European meat Research Work, vol. 2.
Bundesanstalt fuer Fleischforschung, Kulmbach, West Germany.
Slinde E. (1987). Colour of black salami sausage: Dissociation of heme from myoglobin and
haemoglobin. Journal of Food Science, 52(5), 1152-1154.
Synowiecki, J., Heeley, D.H. & Shahidi, F. (1992). Purification and characterization of
myoglobin from Harp seal (Phoca groenlandica). Journal of Agricultural Food Chemistry,
40, 714.
Townsend, W.E., Davis, C.E., Lyon, C.E. & Mescher, S.E. (1980). Effect of pork quality on
some chemical, physical, and processing properties of fermented dry sausage. Journal of
Food Science, 45, 622-626.

82
Chapter 5
PRODUCTION OF SALAMI FROM GREY SEAL (Halichoerus grypus) AND
MINKE WHALE (Balaenoptera acutorostrata) MEAT
5.1. Abstract
Salami was produced from the meat of the Grey (Havert) seal and Minke whale. Three different
starter cultures (Lactobacillus curvatus HJ5, Lactobacillus plantarum L-74 and Gilde MF 1115,
which consists of Lactobacillus sakei) were used in separate meat fermentations. Changes in pH,
water activity, colour, cell numbers, weight loss and texture were recorded over 21 days. The
initial pH of the salami was between 5.68 and 5.92 and decreased to between 4.5 and 4.8 after 21
days. Water activity decreased from 0.96 to an average of 0.90 during the fermentation period.
The texture of the salami doubled over this period, as recorded by an increase in force (N)
required to compress the meat. The raw seal meat contained 349.6mg saturated fatty acids (SFA),
271.6mg monounsaturated fatty acids (MUFA) and 175.8mg polyunsaturated fatty acids (PUFA)
per 100g meat, whilst the raw whale meat contained 312.3mg SFA, 251.9mg MUFA and
179.6mg PUFA in the same sample size. The polyunsaturated:saturated fatty acid (P:S ratio)
recorded for seal and whale raw meat was 0.503 and 0.575, respectively, whilst the n-6:n-3 ratio
was 1.458 and 3.010, respectively. The seal salami had P:S ratios of 0.580, 0.649 and 0.618, and
the whale salami P:S ratios of 0.679, 0.659 and 0.697 for starter cultures A, B and C,
respectively. The n-6: n-3 ratios of both salami types were much higher than the ideal of <0.5.
The results indicate that meat from both the Grey seal and the Minke whale is suitable for the
production of salami. However, more research is required to investigate the use of seal and whale
blubber instead of pork fat to develop an unique seal- or whale-only product.
Keywords: salami, Grey seal, Minke whale, fermentation, fatty acid, chemical composition
5.2. Introduction
The harvesting of seals and whales is a seasonal exercise and products need to be developed that
will provide a year-round supply of meat. Salami is a meat product that has a long shelf life.
According to Campbell-Platt (1987), products with a decreased water activity (aw) level show
decreased rates of mould development, bacteria and yeast growth. Products with aw levels of <0.9
and with pH values of <5.0 are generally assumed to be safe from a health point of view in terms

83
of microbiological and bacterial contamination (Campbell-Platt, 1995). Salami can be defined as
a blend of meat and fat particles, NaCl, curing agents, and spices stuffed into either artificial or
natural casings. Salami traditionally contains 50-70% lean meat. The meat used in the production
of salami should be suitable in terms of water-holding capacity, pH value and colour.
After drying of the mixture, the final product may contain up to 50% fat, which makes fat an
important ingredient of fermented sausage. This can lead to problems such as rancidity, which
has a direct effect on the shelf life of the product. Substances that can be added to act as anti-
oxidants, one of which is ascorbic acid (Campbell-Platt, 1995), may also act as a curing agent
and in stabilising the colour. Tocopherol can also be used, due to its different properties
compared to ascorbic acid. Tocopherol is hydrophobic and is soluble in lipids, which makes it
suitable for use in products with a high fat content.
The most common starter culture species used in the fermentation of beef and pork sausages are
strains of Lactobacillus, Pediococcus, non-pathogenic Staphylococcus and Micrococcus (Lücke,
1986). Organic acids produced by these bacteria prevent the development of pathogenic micro-
organisms (Schillinger & Lücke, 1987), aid the cohesion of meat particles (Townsend et al.,
1980) and contribute to the colour change of fermented sausages.
The major role of lactic acid bacteria in the sausage is to produce organic acids, primarily lactic
acid, from carbohydrates (Campbell-Platt, 1987). This results in a decrease in pH and contributes
to the retardation of the development of undesirable micro-organisms. The decreased pH also
results in a reduced water-holding capacity of proteins and, thus, results in correct desiccation of
the product.
As the diet of aquatic mammals consists mainly of fish, their tissues contain more
polyunsaturated fatty acids than those of their terrestrial counterparts. Although these fatty acids
are very popular amongst health-conscious consumers, they are a challenge in the food industry
when it comes to preventing rancidity of products and, therefore, increasing the shelf life of
products.
The Grey (Havert) seal (Halichoerus grypus) is classified as being a part of the Mammalia class,
of the order pinnipedia and belonging to the family of the phocidae. It is a large seal that lives in
the coastal seas of the temperate North Atlantic. It is believed that approximately fifty percent of
the world population is found in British waters (De Jong et al., 1997).

84
According to Shahidi & Synowiecki (1993), in terms of nutritional quality, seal meat is
comparable or better than that of other sources of animal protein suitable for human
consumption. Its intramuscular lipids and those present in the blubber, are excellent sources of
omega-3 fatty acids (Shahidi et al., 1994). A myoglobin content of up to 10% provides the
opportunity to utilise seal meat as a colour contributor in meat products utilising meats of lesser
colour quality or potential (Synowiecki et al., 1992).
The Minke whale (Balaenoptera acutorostrata) is found from along the North polar ice-edge to
the tropics, and is frequently encountered quite close to the coast. Since the middle ages, Minke
whales have been hunted in the North Atlantic, when they were captured using nets. Modern
whaling for Minke whales began in the 1920’s, and between this time and 1973, the Norwegian
fleet harvested approximately 94 000 whales. In the 1980’s, a quota was set at 2 500 whales in
the North Atlantic (Klinowska, 1991). Since the moratorium on commercial whaling was
introduced in the 1985-1986 season, these whales have been harvested in reduced numbers with
scientific permission. In 1996, the commercial hunt for Minke whale by the Norwegians
recommenced.
Little research has been done on the meat quality parameters and processing attributes of aquatic
mammal species. The aim of this study was, therefore, to determine if seal and whale meat would
be suitable for the production of salami. Factors monitored included the ability of starter cultures
to react favourably with the meat, pH, aw, microbiology, colour development and moisture loss.
5.3. Materials and methods
5.3.1. Raw materials
The seal and whale meat required for this trial were obtained through commercial sources in
Tromsø, northern Norway. The meat was frozen and packed before being sent to Oslo. The pork
fat was obtained from a local slaughtering plant near Oslo.
5.3.2. Starter cultures and growth conditions
The starter cultures used were Lactobacillus curvatus HJ5 (batch A), Lactobacillus plantarum L-
74 (batch B) and Gilde MF 1115 (batch C), which consists of Lactobacillus sakei. The bacteria
were grown in MRS Broth (Merck), where they were incubated for 24 hours at 30oC. The cells
were harvested at an optical density (OD600nm) of 1.6-1.9 and resuspended in 10ml sterile distilled
water. An aliquot of 0.3ml cell suspension (105 to 106 cells/g salami mixture) was used as an
inoculum.

85
5.3.3. Meat preparation and fermentation
Frozen lean meat (7kg) of either seal or whale, was added to a 20-litre KILIA bowl cutter, and
chopped to a particle size of approximately 3-4mm at low speed. Thereafter, tocopherol (0.4g),
dextrose (120g), 15g spices (pepper, paprika and garlic), 20g herbs (rosemarine, thyme and sage)
and ascorbic acid (2g) were added and mixed at low speed for approximately 30 seconds. The
starter cultures, salt (150g) and NO2- (nitrite) were added to the mixture prior to the fat (3kg),
which was then added and chopped at low speed for approximately two minutes to result in fat
particles of approximately 2-4mm in diameter.
The batter was then stuffed into 7mm-diameter cellulose casings, using an automated FATOSA
sausage stopper able to hold 15 litres. The temperature of the batter immediately prior to stuffing
was between -0.8 and 0oC. The sausages were made in lengths of 20.0-25.5cm, with weights
between 610g and 911g. All sausages were marked with regard to species and starter culture.
Three sausages of each batch were marked and placed on the rack, in order to ascertain the
average weight loss during the process. These sausages were weighed (in grams) at the start (day
0) and then regularly on days 6, 9, 13 and 21 of the trial. The sausages were left at room
temperature for the first 18 hours after preparation, to allow the surfaces to dry.
On the morning of day two, a sample of each batch was taken to test for pH and aw. The
remaining sausages were placed into a controlled chamber (22oC and 95% RH) to allow the
starter cultures to develop. Samples were analysed each day for the first seven days, with regards
to pH and aw.
On day five, the sausages were cold smoked (18oC at 60% RH) with oak chips. Thereafter, the
sausages were allowed to mature. During the first week of maturation, the temperature remained
at 18oC, with the RH at 88%. During the second week, the temperature remained constant, but
the RH decreased to 80%. During the last week of maturation, the RH decreased to 75%.
5.3.4. Recorded parameters
Readings were collected on specific days throughout maturation. The acidification of the blend,
due to lactic acid bacterial growth, was recorded by measuring the pH using a Beckman 31
insertion probe.
The aw readings were recorded with an AquaLab CX-2 water activity analysing apparatus.
Colour measurements were taken from slices of the salami from days 7, 13 and 21, using the

86
Chroma magic program, with a Minolta CR 300 OG hand-piece attached to a computer.
Readings were collected as L*, a* and b* values.
Cell numbers were monitored from the first day, by using plating procedures on MRS Biolab
agar growth media. Viable cell numbers were recorded immediately following incubation at
25oC, and at three-day intervals thereafter.
Texture analysis was recorded on days 6, 9, 12 and 21 using a TX-XT2 texture analyser. Slices
of each salami, approximately 1.5cm thick, were used.
5.3.5. Chemical analysis
The moisture and protein content (g/100g meat sample) of the raw materials, batter and final
salami were determined for all the samples according to the Association of Official Analytical
Chemist’s Standard Techniques (AOAC, 1997). The moisture content was determined by drying
samples at 105oC for 24 hours. To determine the protein content, dried and defatted samples were
grounded with a pestle in a mortar until a fine powder was obtained. 0.100mg of powder per
animal was inserted into a foil wrap designed for the Leco protein analyser (Leco Fp-528, Leco
Corporation). The protein was determined as Nitrogen, which was multiplied by 6.25 to calculate
the protein concentration in the sample. Total fat content was determined by the method of Lee et
al. (1996) using chloroform: methanol (2:1) as solvent.
5.3.6. Myoglobin content and dissociation of heme from myoglobin
Myoglobin extraction was conducted on thawed meat samples. This was done to ascertain the
percentage myoglobin present in the muscle of these animals. According to the method described
by Krzywicki (1982), thawed meat was cut into small (3mm cube) pieces, of which 5g was
weighed out in duplicate per sample, and placed into 50ml polypropylene centrifuge tubes. 25ml
ice cold sodium phosphate buffer (pH 6.8, 0.04M) was added to the tube containing the sample
and homogenised for 40-45 seconds at low speed, ensuring that the meat was mixed thoroughly
in the solution. The sample was stored at 4oC for one hour. Thereafter, the sample was
centrifuged at 9000 rpm for 45 minutes at 4oC, and the supernatant filtered through Whatman no.
1 filter paper. Individual absorbances were read at 700 (A700) and 525 (A525) nanometer, using
phosphate buffer as the blank. The following equation was used to calculate the % myoglobin
present in the sample:
Myoglobin (mg/ml) = (A525-A700) x 2.303 x dilution factor

87
In the case of the whale meat, the absorbance reading was acceptable (<1) without any further
dilution. The seal solution, however, was opaque, and a dilution had to be made until an
acceptable reading was found. This dilution was 20% seal filtrate and 80% phosphate buffer as
diluent.
The dissociation of heme from myoglobin and haemoglobin was also monitored throughout the
processing of the salami on days 1, 5, 13 and 20. Extraction of the hydrophilic colour
components was undertaken as by Slinde & Nordal (1978); 10g substrate was homogenised with
40ml 50mM sodium phosphate buffer (pH 6.9) and the solution cleared by centrifugation at
15 000 rpm (4oC) for 10 minutes. Thereafter, the supernatant beneath the lipid layer was
extracted once, using a pipette. The pigment concentration was determined by using a
spectrophotometer to scan the Soret region (360-430nm).
5.3.7. Fatty acid determination
The fatty acid content of the samples was determined using the method described by Tichelaar et
al. (1998). After thawing the raw meat, batter and salami samples, the lipids in a 2g sample were
extracted with chloroform/methanol (2:1; v/v). All the extraction solvents contained 0.01%
butylated hydroxytoluene (BHT) as an antioxidant. A polytron mixer (Kinematica, type PT 10-
35, Switzerland) was used to homogenise the sample within the extraction solvent.
Heptadecanoic acid (C17:0) was used as an internal standard to quantify the individual fatty
acids.
A sub-sample of the extracted lipids was transmethylated for two hours at 70°C, using
methanol/sulphuric acid (19:1; v/v). After cooling, the resulting fatty acid methyl esters (FAME)
were extracted with water and hexane. The top hexane phase was transferred to a spotting tube
and dried under nitrogen.
The FAME were purified by TLC (silica gel 60 plates) and analysed by GLC (Varian Model
3300 equipped with flame ionisation detection), using a 60 m BPX70 capillary column of
0.25mm internal diameter (SGE, Australia). The hydrogen gas flow rate was 25ml/min; and the
hydrogen carrier gas rate 2-4ml/min. Temperature programming was linear at 3°C/min, with an
initial temperature of 150°C, a final temperature of 220°C, an injector temperature of 240°C and
a detector temperature of 250°C. The FAME in the total lipids was identified by comparison of
the retention times to those of a standard FAME mixture (Nu-Chek-Prep Inc., Elysian,
Minnesota).

88
5.3.8. Statistical analysis
The non-linear procedure (Proc NLIN) of SAS (1990) was used to fit exponential decay
regression models to the rate of salami pH decline over time. The model fitted was of the form:
y = a + be (ct),
where y is the dependant variable (pH) and t the time (day), a the intercept and b the gradient.
The two-sample T-test was used on SAS (Statistical Analysis Systems, 1990), to compare the
chemical and fatty acid values of the seal and whale salami, using the three different starter
cultures. Various regression lines were fitted to the relevant data to determine which type would
suit the specific data set best. Linear regression lines had the best goodness of fit, and were,
therefore, used for most data sets. Gradient, intercept and R2 values were then calculated for
these regression equations.
5.4. Results and discussion
5.4.1. pH, water activity, colour and microbiological measurements
pH is the most important as well as most readily-obtained variable used to monitor fermentation
progress in salami (Acton et al., 1977; De Ketelaere et al., 1974). The production of lactic acid
results in a decrease of meat pH to a final pH of between 4.8-4.9, as well as stimulating the
aggregation of protein, which forms the typical texture of sausage due to this coagulation
(Campbell-Platt, 1987). The presence of lactic acid bacteria help in decreasing the pH of the meat
and thus making conditions unfavourable for other Gram-negative bacteria (Campbell-Platt,
1987).
The consistency of fermented sausage is largely determined by the pH value of the product, as
well as the aw level, the consistency being ideal at a pH value <5.4 and an aw level <0.9. The pH
value is the major determinant of consistency in high-acid, semi-dry sausages, and the aw level in
low-acid, dry sausages (Campbell-Platt & Cook, 1995).
The pH and aw levels were always recorded on the same day, in order to correlate the values
more accurately. In both the seal (Fig. 1) and the whale salami (Fig. 2), starter culture A
(Lactobacillus curvatus HJ5) had the highest final (21 days) pHs of 4.72 and 4.70 respectively.
Starter culture B (Lactobacillus plantarum L-74) had the lowest ultimate pH values in the seal
and whale salami (4.58 and 4.52 respectively). Starter culture C (Gilde MF 1115) showed a more
rapid pH decline in the seal salami than in that of the whale.

89
4
4.2
4.4
4.6
4.8
5
5.2
5.4
5.6
5.8
6
0 5 10 15 20 25
days
pH
L. curvatusL. plantarumGilde
Figure 1. pH values of seal salami batches A (L. curvatus), B (L. plantarum) and C (Gilde) over
21 days
4
4.2
4.4
4.6
4.8
5
5.2
5.4
5.6
5.8
6
0 5 10 15 20 25
days
pH
L. curvatus
L. plantarum
Gilde
Figure 2. pH values of whale salami batches A (L. curvatus), B (L. plantarum) and C (Gilde)
over 21 days
Research done on Felino salami by Dellaglio et al. (1996) showed that the maximum pH of their
salami was 6.36, with the minimum value being 5.40. These final pH values of their sausages
were too high; they should ideally be less than 4.5, which the seal and whale salami were.
The conversion criteria were met for all the exponential decay models fitted for the pH decline of
the salami with time. The probability values (Pr > F) for the equations were all <0.0001, and the

90
various equations for the two mammal species and three starter cultures are given in Table 1. As
expected, the initial pH readings were all very similar, whilst the calculated initial pH values did
not differ greatly from the actual values measured.
For both species, starter culture B had a slower rate of pH decrease (Table 1) although this effect
was more pronounced in the seal salami (-0.290 vs -0.477 units per day). This also resulted in the
whale salami with starter culture B having the lowest calculated ultimate pH (4.478), which was
similar to the actual pH measured.
Table 1
The calculated constants for the exponential equations fitted to the pH decline of the seal and
whale salami made from three different starter cultures (A: L. curvatus, B: L. plantarum and C:
Gilde) over 21 days
Measured pH (ave)
y = a +bect Species Starter Culture
Day 0 Day 21 a b c
Seal 4.662 ± 0.021 1.824 ± 0.077 -0.438 ± 0.029
A 5.91 4.72 4.743 ± 0.024 1.832 ± 0.108 -0.539 ± 0.045
B 5.85 4.61 4.541 ± 0.031 1.860 ± 0.074 -0.290 ± 0.022
C 5.84 4.69 4.677 ± 0.010 2.221 ± 0.071 -0.631 ± 0.025
Whale 4.611 ± 0.127 1.982 ± 0.086 -0.577 ± 0.032
A 5.69 4.70 4.703 ± 0.004 1.979 ± 0.042 -0.645 ± 0.017
B 5.69 4.51 4.478 ± 0.010 2.001 ± 0.047 -0.477 ± 0.016
C 5.71 4.69 4.645 ± 0.011 2.048 ± 0.082 -0.636 ± 0.031
The aw patterns of the three starter cultures in the seal salami were very similar (Figs. 3 and 4),
although starter culture B generally showed a lower aw than the other two. In the whale salami
(Fig. 4) starter culture B was slightly lower at the beginning, and starter culture A had the highest
values over the first two days. Thereafter, the aw of all starter cultures followed a similar pattern.
Starter B showed a very rapid decline in aw after day 15. This corresponds with the day after the
RH was decreased from 80 to 75% in the chamber. However, the other two starter cultures did
not show such a rapid decline.

91
0.89
0.9
0.91
0.92
0.93
0.94
0.95
0.96
0.97
0 5 10 15 20 25
days
wat
er a
ctiv
ity
L. curvatusL. plantarumGilde
Figure 3. Mean aw values of seal salami batches A (L. curvatus), B (L. plantarum) and C
(Gilde) over 21 days
0.89
0.9
0.91
0.92
0.93
0.94
0.95
0.96
0.97
0 5 10 15 20 25
days
wat
er a
ctiv
ity
L. curvatus
L. plantarum
Gilde
Figure 4. Mean aw values of whale salami batches A (L. curvatus), B (L. plantarum) and C
(Gilde) over 21 days
For the change in aw with time, linear regression equations were calculated, as they gave the best
goodness of fit according to the R2 values. It can be seen that the rate of change, gradient (b),
over time was identical in both species (Table 2) using starter culture A (-0.020). For all the
salamis (species and starter culture), the intercept values, i.e. initial aw levels, were similar, as
they reflect the values on day 0, and the different starter cultures would not have had sufficient
time to show an effect at this point. The R2 values for the aw and the pH values were all close to
1, indicating a good representation of the fit of the linear regression to the data.

92
Table 2
Linear regression line data, intercept (a), gradient (b) and goodness of fit (R2) for salami water
activity data for both mammal species and all three starter cultures (A: L. curvatus, B: L.
plantarum and C: Gilde)
Species Measurement Starter culture
a b R2
Seal aw A 0.9605 -0.0020 0.8717
B 0.9586 -0.0019 0.8880
C 0.9614 -0.0026 0.9351
Whale aw A 0.9646 -0.0020 0.9487
B 0.9672 -0.0026 0.8421
C 0.9636 -0.0021 0.9314
Formation of heme-containing pigments in fermented sausages follows the same pathways as in
other nitrite-containing meat products. The low pH-value has a strong influence, initially
destabilising myoglobin and increasing the rate of auto-oxidation to metmyoglobin (Slinde &
Nordal, 1978). The heme group is dissociated at the pH value of many fermented sausages and
colour is primarily attributed to nitrosomyoglobin (Slinde & Nordal, 1978). Previous studies of
the dissociation curves for myoglobin and haemoglobin in citric acid buffer show that the heme
group dissociates from the proteins at lower pH values comparable to those normally found in
dry sausages during fermentation.
According to Slinde (1987), the black colour found in salami is due to a hydrophobic component,
and, as seal meat is a rich source of pigment, myoglobin would be regarded as such a component.
The dissociation of heme from haemoglobin and myoglobin would result in the L* value
changing. A pH decline would cause the dissociation of these components. The red core
frequently found in many salami (at a pH <5) would indicate the reductiveness of this part of the
sausage, and thus the heme group would be less likely to dissociate from the haemoglobin or
myoglobin, and thereby causing the darker colour. It was observed that the whale salami had
such a red core, indicating that it has fewer reductive properties than the seal.
Hutchings (1994) suggests that an increase in the L* value corresponds to an increase in
lightness. A low L* value would, therefore, indicate a darker substrate. It is also suggested that a
decrease in the L* value could be correlated to a pH value of less than 5, which would be
indicative of the dissociation of heme from myoglobin or haemoglobin. Whale meat, being a
lighter meat than seal meat, would have a more pronounced effect than the darker meat of the

93
seal, which contains a higher concentration of haemoprotein levels (average 60mg/g-1)
(Synowiecki et al., 1992).
Figs. 5 and 6 show the L* values of the seal and whale salami respectively. Whale meat has a
lighter, redder colour than seal meat, and as the L* value correlates to lightness, the lighter whale
meat had higher L* values ranging between 33.94 and 37.02, whereas the darker seal meat had
lower L* values, ranging between 26.24 and 32.88. It can be expected that colour changes in the
whale salami would differ from that of the seal, and be more visible to the human eye, due to
these high L* values.
As seen in Fig. 5, starter cultures B (L. plantarum) and C (Gilde) showed a decrease in the L*
value over time. In starter culture A (L. curvatus) the L* value fluctuated over time. Furthermore,
in the second week of maturation, both starter culture A and C showed a slight increase, whereas
culture B showed a decrease in the seal salami. In the third week it was observed that the L*
value of starter culture A increased, whereas both starter cultures B and C showed a decrease.
In Fig. 6, for the whale salami, all three starter cultures showed an increase in their L*values in
the second week of maturation. During the third week, both A and B showed a very definite
decrease, but C showed a continued increase in L* value, until day 21.
15
20
25
30
35
40
7 13 21days
L* v
alue
s
L. curvatus
L. plantarum
Gilde
Figure 5. L* values of salami batches A (L. curvatus), B (L. plantarum) and C (Gilde) made of
seal meat, over a period of 21 days

94
15
20
25
30
35
40
7 13 21
days
L* v
alue
s
L. curvatusL. plantarumGilde
Figure 6. L* values of salami batches A (L. curvatus), B (L. plantarum) and C (Gilde) made of
whale meat, over a period of 21 days
The a* value is usually the objective value which most easily depicts the actual (subjective)
visual experience of the human eye. A difference of 1-1.5 units is commonly recognised as a
visual difference. Figs. 7 and 8 show clearly that the a* value is higher and more variable in the
whale meat than in the seal. The values for the seal salami were very low, between 2.3 and 4.3,
whereas the values for the whale were higher, between 2.5 and 5.7. This is probably due to the
initial lighter colour of the whale meat, with greater potential to show colour changes visible to
the human eye.
Starter culture A (L. curvatus) showed a slight decrease in a* value over time in the seal and
whale salami. Starter culture B (L. plantarum) also showed a decrease over time in both species,
although the decrease was somewhat greater than for starter culture A. Starter culture C (Gilde)
showed an increase in both seal and whale salami over the first two weeks and then decreased in
the seal, but continued to increase in the whale salami.

95
0
2
4
6
8
10
12
14
16
18
7 13 21
days
a*va
lue
L. curvatusL. plantarumGilde
Figure 7. a* values of salami batches A (L. curvatus), B (L. plantarum) and C (Gilde) made of
seal meat, over a period of 21 days
0
2
4
6
8
10
12
14
16
18
7 13 21
days
a*va
lue
L. curvatusL. plantarumGilde
Figure 8. a* values of salami batches A (L. curvatus), B (L. plantarum) and C (Gilde) made of
whale meat, over a period of 21 days
Figs. 9 and 10 present the b* values for the salamis; the values for seal were lower than for
whale. L. curvatus (starter culture A) showed a decrease in the first two weeks for both species,
then plateaued in whale (Fig. 10) and increased slightly in the seal salami (Fig. 9). L. plantarum
(starter culture B) decreased throughout the trial period of 21 days in both species. The Gilde
starter culture (C) decreased steadily over time in the seal salami, but increased in the first two
weeks in the whale salami, before decreasing substantially in the last week. The whale had
higher b* values than the seal (Figs. 9 and 10), which indicated more yellow in the whale meat
than the seal, or, due to the lighter colour of the whale meat, that it was easier to detect the

96
yellowness. Once again, starter culture B showed the same pattern in both species, with a gradual
decrease over time. Starter culture A showed the same trend as for the a* values, and starter
culture C had a different pattern in both species.
0
1
2
3
4
5
6
7 13 21
days
b* v
alue
L. curvatusL. plantarumGilde
Figure 9. b* values of salami batches A (L. curvatus), B (L. plantarum) and C (Gilde) made of
seal meat, over a period of 21 days
0
1
2
3
4
5
6
7 13 21
days
b* v
alue
L. curvatusL. plantarumGilde
Figure 10. b* values of salami batches A (L. curvatus), B (L. plantarum) and C (Gilde) made of
whale meat, over a period of 21 days
The myoglobin extraction resulted in whale muscle having a myoglobin content of 1.5%, and
seal having a much higher content of 14.2%. This result for the seal is consistent with a report by
Synowiecki et al. (1992), who found the myoglobin concentration of mechanically separated seal
meat to be 13.2%.

97
Fig. 11 shows the change in absorption of myoglobin (408nm) in both seal and whale salami
using starter culture A over 21 days, and how it decreased, as the heme dissociates over time
from the myoglobin molecule. During the first five days there was a rapid decline in the
absorption. This correlates with a rapid decline in pH (Figs. 1 and 3), due to the rapid increase in
lactic acid bacteria numbers over the same period (Figs. 12 and 13). This decline, as stated by
Slinde & Nordal (1978), is due to dissociation of the heme and nitrosoheme from the myoglobin
molecule, caused by the pH decrease as discussed. As seal meat has a higher myoglobin content
than whale, it would show a lower absorbance than the whale, even when processed into salami.
0
0.1
0.2
0.3
0.4
0.5
0.6
0.7
0.8
0.9
1
1 5 13 21
days
abso
rban
ce
sealwhale
Figure 11. Absorbance (408nm) of myoglobin of seal and whale salami using starter culture A,
over 21 days
The development of lactic acid bacteria (on MRS-agar plates) in the salami made of the two
species, using the same three starter cultures, was observed throughout the production period. In
Figs. 12 and 13, the viable counts of lactic acid bacteria over 21 days are shown. There was a
rapid increase in bacterial activity over the first five days. This correlates positively with a
decrease in pH over the same time period (Figs. 1 and 2). After the peak at five days, there was a
decrease in bacterial numbers, which gradually evened out, and then remained at the that level. In
both species it was apparent that starter culture B had the highest number of colony forming
units, and starter culture C, the lowest. This remained consistent throughout in both species. This
initial increase in lactic acid bacteria, followed by a decrease, has been noted by Dicks et al.

98
(2004). This change is ascribed to the initial multiplication of bacteria, and as the carbohydrate
source is utilised, the numbers start to decrease.
0
0.5
1
1.5
2
2.5
3
0 4 7 11 15 20
days
Log
10 C
fu/g
on
MR
S-ag
ar
L. curvatusL. plantarumGilde
Figure 12. Viable counts of lactic acid bacteria in seal salami batches A (L. curvatus), B (L.
plantarum) and C (Gilde) over 21 days
0
0.5
1
1.5
2
2.5
3
0 4 7 11 15 20days
Log
10 C
fu/g
on
MR
S-ag
ar
L. curvatusL. plantarumGilde
Figure 13. Viable counts of lactic acid bacteria in whale salami batches A (L. curvatus), B (L.
plantarum) and C (Gilde) over 21 days

99
5.4.2. Chemical analysis
Chemical analysis of the raw materials, the salami batter, and the final product, showed that seal
meat is similar in fat to, and slightly higher in protein than, whale meat. This corresponds to the
values of the relevant salami batters and sausages (Table 3), as exactly the same additives were
added to both to produce sausages. As the sausages ferment, and dry out, moisture is lost. The
moisture lost over the 21 days was higher in the whale salami (20.6% vs 17.0%), which also had
the higher protein content (Table 3) than the seal salami in the final product. When calculated on
a dry matter (DM) basis, whale salami contained 94.23% protein, and seal salami 95.49%.
Table 3
Chemical analysis values of the raw materials used during the making of the salami and the final
salami, using starter culture A
Species Sample type Moisture % Protein % Fat % Ash % Seal meat 71.2 27.5 0.3 1.0 batter (day 1) 54.5 19.4 24.6 1.0 salami (day 21) 54.3 23.5 30.3 1.0 Whale meat 74.0 24.5 0.6 1.0 batter (day 1) 57.5 18.0 23.5 1.1 salami (day 21) 54.2 26.2 27.3 1.0
5.4.3. Weight loss and texture
Weights of allocated sausages were recorded on specific days and cumulative weight losses
calculated. As seen in Figs. 14 and 15, the seal salami showed a lower cumulative weight loss
than the whale: the highest weight loss was 26% for the seal salami, and 31% for the whale
salami. However, the seal and whale salami were very similar in their moisture content (Table 3)
on day 21, although there was a larger discrepancy in the batter. This is ascribed to the forced
drying conditions, which lead to more homogenous products after the fermentation period. The
tempo of weight loss of the different starter cultures within a species run nearly parallel to each
other (Figs. 14 and 15), and therefore one can assume that weight loss was not influenced by
starter culture. All sausages lost more moisture in the last week. This could be due to the change
in RH of the maturation chamber, resulting in increased desiccation of the salami.
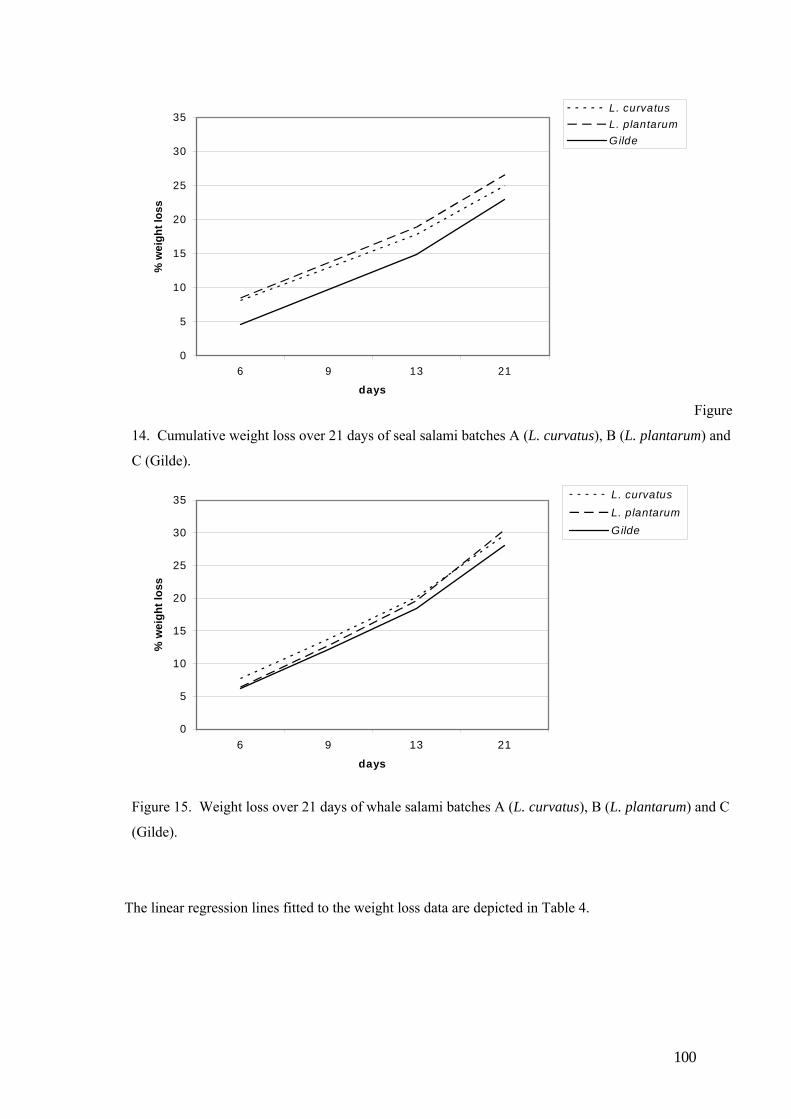
100
0
5
10
15
20
25
30
35
6 9 13 21
days
% w
eigh
t los
s
L. curvatusL. plantarumGilde
Figure
14. Cumulative weight loss over 21 days of seal salami batches A (L. curvatus), B (L. plantarum) and
C (Gilde).
0
5
10
15
20
25
30
35
6 9 13 21
days
% w
eigh
t los
s
L. curvatusL. plantarumGilde
Figure 15. Weight loss over 21 days of whale salami batches A (L. curvatus), B (L. plantarum) and C
(Gilde).
The linear regression lines fitted to the weight loss data are depicted in Table 4.

101
Table 4
Weight loss data of the salami batches A (L. curvatus), B (L. plantarum) and C (Gilde) of both
species, expressed as a linear regression with intercept (a), gradient (b) and goodness of fit (R2
value)
Species Starter culture a b R2 value Seal L. plantarum 893.10 -50.70 0.99
L. curvatus 795.14 -47.90 0.99
Gilde 885.23 -46.69 0.99
Whale L. plantarum 768.96 -51.47 0.99
L. curvatus 847.10 -57.96 0.99
Gilde 934.66 -59.33 0.99
Figs. 16 and 17 portray the force required to compress slices of salami, approximately 1cm thick,
over 30 seconds. Texture of the sausages was analysed by the amount of force required to
compress equal slices of the different sausages. As with weight loss, this parameter also
corresponds to aw. The higher the force required to compress a sample, the lower the moisture
content of the sample. The force needed was nearly identical for the seal and the whale salamis.
All starter cultures showed an increase in force required over the same period of time, with
starter culture A (L. curvatus) requiring an initial force of 60N and a force of >100N after 21
days. This is due to a decreased water activity and accompanied loss of moisture (Figs. 2, 4, 14
and 15).
In the seal salami (Fig. 16) on day 6, prepared with starter culture B (L. plantarum), required less
force than starter culture C (Gilde). On day 13 this changed, and the salami with starter culture B
required more force than for starter culture C. This continued up to the last measurement on day
21. In the whale salami (Fig. 17), starter culture B (L. plantarum) consistently required the most
force, starter culture C (Gilde) required slightly less, and starter culture A (L. curvatus) the least,
to compress similar pieces of salami. This can be linked to the aw values, where starter culture B
sausages showed a lower aw than the others, whilst starter culture A sausages showed higher aw
levels.

102
0
20
40
60
80
100
120
140
160
6 12 21
days
Forc
e (N
)
L. curvatusL. plantarumGilde
Figure 16. Force (N) used to compress seal salami batches A (L. curvatus), B (L. plantarum)
and C (Gilde) over 21 days
0
20
40
60
80
100
120
140
160
6 12 21
days
Forc
e (N
)
L. curvatus
L. plantarum
Gilde
Figure 17. Force (N) used to compress whale salami batches A (L. curvatus), B (L. plantarum)
and C (Gilde) over 21 days
5.4.4. Fatty acid determination
Polyunsaturated fatty acids (PUFA), such as the omega-3 fatty acids, have recently become
increasingly popular, due to their apparent health benefits. Plasma cholesterol levels are
correlated to the fatty acid composition of the diet (Flynn et al., 1985). In general,

103
monounsaturated fatty acids (MUFA) and PUFA do not result in increased cholesterol levels, but
high levels of long-chain saturated fatty acids (SFA) do (Grundy & Denke, 1990). It has been
reported that palmitic acid (C16:0) increases cholesterol levels, but that stearic acid (C18:0) does
not (Rowe et al., 1999).
The importance of these particular fatty acids is becoming evermore evident in their utilisation
for value-added application in the food, and pharmaceutical, domains. The n-3 fatty acids have
been found to decrease serum triacylglycerol and cholesterol levels (Kim & Edsall, 1999). They
have been used in the treatment and prevention of arthritis, rheumatism, hypertension,
inflammatory and immune disorders (Senanayake & Shahidi, 2001).
Guidelines for consumers suggest the reduction in intake of n-6 PUFA to n-3 PUFA, and the
intake of short- and medium-chain SFA (Gibney, 1993). As the fatty acid composition of human
food sources is becoming increasingly important in terms of human health, the aim is to bring the
P:S ratio of meat closer to the recommended value of >0.70, and the n-6: n-3 ratio of <5.0 (Raes
et al., 2003).
In Table 5, the whale and seal meat used in the production of the salami have similar fatty acid
compositions (mg/100g). The SFA, MUFA and PUFA values (mg/100g) are 349.2, 271.6 and
175.8 for raw seal meat respectively, and 312.3, 251.9 and 179.6 for raw whale meat
respectively. When comparing seal and whale meat, they have similar desirable fatty acid (DFA)
values (516.84 and 500.91mg/100g respectively).
The P:S ratio is also similar for both the seal and the whale, being 0.50 and 0.58 respectively.
This would place both species close to the recommended value of >0.70. Similarly, the n-6:n-3
ratio of 1.46 and 3.01 respectively falls within the recommended limits (<5.0) (Raes et al., 2003).
Pork fat has a SFA content of 4116.9 mg/100g, which is much higher than that of seal or whale
meat, and will therefore result in a higher SFA content of the final salami. The P:S ratio of the
pork fat used was 0.6, with an n-6: n-3 ratio of 8.3, which was also much higher than that of seal
or whale meat. These ratios make both seal and whale meat a desirable alternative red meat in
terms of fatty acid composition.

104
Table 5
Fatty acid composition of major raw materials (mg/100g sample) used in the production of the
salami
Fatty acid Seal meat Whale meat Pork fat 16:0 Palmitic 115.6 115.6 2599.718:0 Stearic 69.5 69.5 1276.820:0 Arachidic 13.6 22.7 27.622:0 Behenic 28.3 4.9 1.924:0 Lignoceric 122.2 99.7 210.916:1 n-7 Palmitelaidic 40.7 19.2 282.218:1 n-9 Oleic 165.0 186.7 5228.320.1 n-9 Gondoic 29.6 21.7 106.222:1 n-9 Erucic 24.0 8.2 26.324:1 n-9 Nervonic 12.2 16.1 6.418:2 n-6 Linoleic 46.9 47.4 2072.818:3 n-3 a-Linolenic 6.5 6.3 209.218:3 n-6 y-Linolenic 7.0 2.8 7.920:2 n-6 2.3 7.0 83.520:3 n-3 Mead 33.4 20.6 54.120:4 n-6 Arachidonic 22.3 23.8 27.720:5 Eicosapentaenoic 44.9 45.9 12.322:2 5.1 4.0 4.622:5 27.3 21.8 15.022:6 Docosahexaenoic 39.6 35.5 31.3ΣSFA 349.2 312.3 4116.9ΣMUFA 271.6 251.9 5649.4ΣPUFA 235.4 179.6 2486.9ΣTUFA 507.0 431.5 8136.3DFA 576.5 501.0 9413.2P: S 0.5 0.6 0.6n-6 78.4 80.9 2191.8n-3 40.0 26.9 263.3n-6: n-3 2.0 3.0 8.3SFA = Saturated Fatty Acids; MUFA = Monounsaturated Fatty Acids; PUFA = Polyunsaturated Fatty Acids; TUFA = Total Unsaturated Fatty Acids; DFA = Desirable Fatty Acids (C18:0 + TUFA) Few fatty acids show differences between species, these being behenic acid (C22:0), erucic acid
(C22:1 n-9) and arachidonic acid (C20:4 n-6). This could be due to the different diets of seal and
whale. Seals consume primarily fish, and whale mainly krill and small crustaceans (Klinowska,
1991).
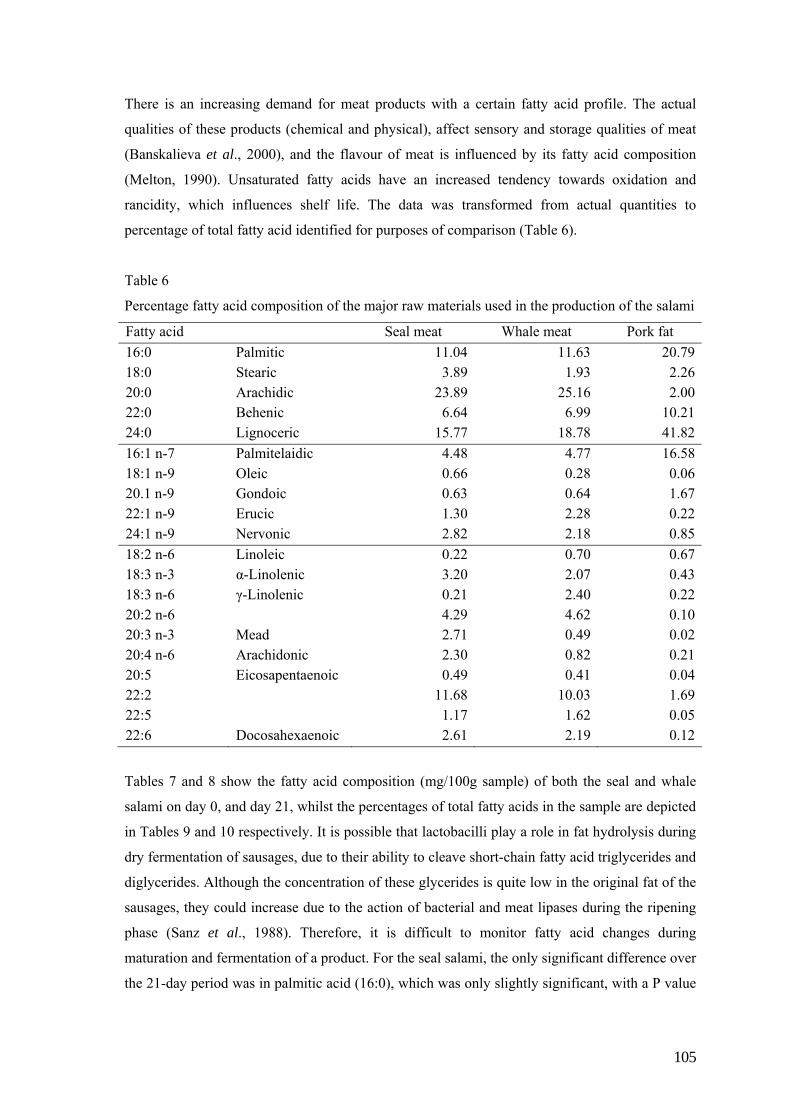
105
There is an increasing demand for meat products with a certain fatty acid profile. The actual
qualities of these products (chemical and physical), affect sensory and storage qualities of meat
(Banskalieva et al., 2000), and the flavour of meat is influenced by its fatty acid composition
(Melton, 1990). Unsaturated fatty acids have an increased tendency towards oxidation and
rancidity, which influences shelf life. The data was transformed from actual quantities to
percentage of total fatty acid identified for purposes of comparison (Table 6).
Table 6
Percentage fatty acid composition of the major raw materials used in the production of the salami
Fatty acid Seal meat Whale meat Pork fat 16:0 Palmitic 11.04 11.63 20.7918:0 Stearic 3.89 1.93 2.2620:0 Arachidic 23.89 25.16 2.0022:0 Behenic 6.64 6.99 10.2124:0 Lignoceric 15.77 18.78 41.8216:1 n-7 Palmitelaidic 4.48 4.77 16.5818:1 n-9 Oleic 0.66 0.28 0.0620.1 n-9 Gondoic 0.63 0.64 1.6722:1 n-9 Erucic 1.30 2.28 0.2224:1 n-9 Nervonic 2.82 2.18 0.8518:2 n-6 Linoleic 0.22 0.70 0.6718:3 n-3 α-Linolenic 3.20 2.07 0.4318:3 n-6 γ-Linolenic 0.21 2.40 0.2220:2 n-6 4.29 4.62 0.1020:3 n-3 Mead 2.71 0.49 0.0220:4 n-6 Arachidonic 2.30 0.82 0.2120:5 Eicosapentaenoic 0.49 0.41 0.0422:2 11.68 10.03 1.6922:5 1.17 1.62 0.0522:6 Docosahexaenoic 2.61 2.19 0.12
Tables 7 and 8 show the fatty acid composition (mg/100g sample) of both the seal and whale
salami on day 0, and day 21, whilst the percentages of total fatty acids in the sample are depicted
in Tables 9 and 10 respectively. It is possible that lactobacilli play a role in fat hydrolysis during
dry fermentation of sausages, due to their ability to cleave short-chain fatty acid triglycerides and
diglycerides. Although the concentration of these glycerides is quite low in the original fat of the
sausages, they could increase due to the action of bacterial and meat lipases during the ripening
phase (Sanz et al., 1988). Therefore, it is difficult to monitor fatty acid changes during
maturation and fermentation of a product. For the seal salami, the only significant difference over
the 21-day period was in palmitic acid (16:0), which was only slightly significant, with a P value

106
of P=0.06. For the whale salami, the fatty acids showing significant differences were behenic
(22:0) and gondoic (20:1n-9) fatty acids.
Table 7
Fatty acid composition (mg/100g sample) of the seal batter and the final seal salami (day 21) for
batches A (L. curvatus), B (L. plantarum) and C (Gilde)
Batter (day 1) Salami (day 21) Fatty acid A B C A B C 16:0 2008.8 1287.5 1611.5 1970.3 1612.7 1658.118:0 1178.0 652.0 805.3 1079.0 786.1 810.120:0 78.7 14.5 21.3 23.9 21.4 24.622:0 9.2 11.0 3.9 64.4 6.6 14.924:0 29.0 38.7 132.0 38.4 83.1 253.716:1 n-7 14.0 201.4 5.8 196.7 234.6 187.418:1 n-9 3426.3 2292.3 2822.1 3644.7 3114.8 2866.820.1 n-9 93.2 71.2 108.7 97.1 84.3 87.022:1 n-9 48.7 11.9 13.9 35.4 20.9 54.624:1 n-9 10.2 7.3 7.4 5.9 18.9 27.618:2 n-6 1251.7 864.4 1196.7 1454.6 1264.0 1218.518:3 n-3 122.8 93.2 123.7 134.8 137.7 127.518:3 n-6 9.8 4.2 4.7 5.0 4.3 7.220:2 n-6 60.4 36.4 54.6 54.8 53.3 59.020:3 n-3 26.8 43.2 33.3 61.7 61.7 75.720:4 n-6 44.7 10.9 42.5 7.1 17.0 19.520:5 10.6 32.8 29.1 26.8 26.3 58.622:2 12.5 2.3 21.1 14.0 4.4 9.722:5 26.4 13.6 6.8 9.6 18.9 77.222:6 61.6 41.6 14.2 73.5 41.1 52.5ΣSFA 3303.8 2003.6 2574.0 3175.9 2509.8 2761.4ΣMUFA 3592.4 2584.1 2957.9 3979.7 3473.4 3223.4ΣPUFA 1627.3 1142.5 1506.7 1841.2 1628.8 1705.3ΣTUFA 5219.7 3726.6 4464.6 5820.9 5102.1 4928.7DFA 6397.7 4378.6 5269.9 6899.9 5888.2 5738.8P: S 0.5 0.6 0.6 0.6 0.6 0.6n-6 1366.7 915.8 1298.4 1521.5 1338.6 1304.2n-3 149.5 136.4 157.0 196.5 199.4 203.2n-6: n-3 9.1 6.7 8.3 7.7 6.7 6.4SFA = Saturated Fatty Acids; MUFA = Monounsaturated Fatty Acids; PUFA = Polyunsaturated Fatty Acids; TUFA = Total Unsaturated Fatty Acids; DFA = Desirable Fatty Acids (C18:0 + TUFA)

107
Table 8
Fatty acid composition (mg/100g meat) of the whale batter and the final whale salami (day 21)
made from three starter cultures (A: L. curvatus, B: L. plantarum and C: Gilde)
Starter culture Batter (day 1) Salami (day 21)
Fatty acid
A B C A B C 16:0 1410.4 1566.9 1865.1 1653.9 1530.7 1942.418:0 731.2 888.8 1045.0 773.9 783.9 783.920:0 12.8 21.4 20.3 14.9 13.2 19.622:0 2.7 3.7 55.5 4.1 3.2 19.524:0 30.4 31.1 36.7 43.4 61.4 46.416:1 n-7 141.8 152.5 166.2 195.5 168.7 208.718:1 n-9 2416.7 3058.4 3668.4 3095.8 3108.8 3700.920.1 n-9 64.1 75.9 92.2 81.8 69.4 90.222:1 n-9 18.7 30.3 30.3 22.3 15.5 26.724:1 n-9 9.3 6.4 10.8 7.6 13.9 9.818:2 n-6 909.1 1088.7 1429.9 1337.9 1173.0 1555.318:3 n-3 87.6 110.5 132.5 138.7 118.4 163.318:3 n-6 3.8 6.6 5.2 6.1 6.2 7.220:2 n-6 32.2 41.7 64.8 56.8 51.4 67.020:3 n-3 37.2 43.8 52.3 51.8 76.8 58.420:4 n-6 11.9 16.9 19.3 20.1 2.8 22.520:5 37.1 78.2 34.0 34.0 43.1 35.022:2 5.5 4.5 5.8 3.4 8.6 6.522:5 9.3 45.0 5.4 5.3 8.5 6.222:6 37.2 47.2 20.6 37.0 88.8 38.9ΣSFA 2187.4 2511.8 3022.6 2490.2 2392.5 2811.8ΣMUFA 2650.7 3323.5 3967.8 3403.0 3376.3 4036.2ΣPUFA 1171.0 1483.0 1769.8 1691.2 1577.6 1960.3ΣTUFA 3821.6 4806.5 5737.6 5094.3 4954.0 5996.5DFA 4552.8 5695.3 6782.6 5868.2 5737.9 6780.4P: S 0.5 0.6 0.6 0.7 0.7 0.7n-6 957.0 1153.9 1519.2 1421.0 1233.3 1652.0n-3 124.8 154.2 184.7 190.5 195.2 221.7n-6: n-3 7.7 7.5 8.2 7.5 6.3 7.5SFA = Saturated Fatty Acids; MUFA = Monounsaturated Fatty Acids; PUFA = Polyunsaturated Fatty Acids; TUFA = Total Unsaturated Fatty Acids; DFA = Desirable Fatty Acids (C18:0 + TUFA)
In the seal salami, the P:S ratio increased over the 21 days, whilst the n-6:n-3 ratio decreased. As
a P:S value of >0.70 is regarded as desirable, the seal salami with P:S ratios of 0.58, 0.65 and
0.62 for starter cultures A, B and C respectively, could be viewed as an excellent alternative to
more traditional species of salami on the market. The whale salami showed the same trend in

108
P:S ratios, and n-6:n-3 ratios, showing final P:S ratios of 0.68, 0.66 and 0.70 for starter cultures
A, B and C respectively. The n-6:n-3 ratios of both species of salami were higher than the ideal
of <0.5, due to the high amount of pork fat in the mixture, with a much higher n-6: n-3 ratio than
the raw meat of both species (Table 5).
Tables 9 and 10 show the percentage values of the fatty acid content of the batter and final salami
of both the seal and the whale salami respectively. Student’s T-test (SAS, 1990) was done on
these percentage values, to compare the batter fatty acid composition with that of the final
salami. There were few significant differences (P<0.05) between the fatty acid values of the
batter and the final salami of either the seal or whale. In Table 9, only palmitic acid (16:0) was
significantly different after 21 days (P=0.06). In Table 10, there were two fatty acids that differed
significantly after 21 days, these being behenic (22:0) and gondoic (20:1 n-9) fatty acids.
Table 9
Percentage fatty acid composition of the seal batter and the final seal salami (day 21)
(T-test executed irrespective of starter culture, to compare results for day 1 and day 21)
Starter culture Batter (day 1) Salami (day 21)
Fatty acid
A B C A B C
T-test (P-value)
16:0 23.06 21.68 22.09 21.48 20.62 21.02 0.06 18:0 0.16 3.39 0.08 2.14 3.00 2.38 0.31 20:0 2.87 4.21 3.43 2.73 3.20 3.17 0.32 22:0 13.52 10.98 11.04 11.76 10.05 10.27 0.31 24:0 39.33 38.60 38.69 39.73 39.83 36.35 0.85 16:1 n-7 14.37 14.55 16.41 15.86 16.16 15.45 0.36 18:1 n-9 0.11 0.07 0.06 0.05 0.06 0.09 0.47 20:1 n-9 1.41 1.57 1.70 1.47 1.76 1.62 0.65 22:1 n-9 0.90 0.24 0.29 0.26 0.27 0.31 0.40 24:1 n-9 1.07 1.20 1.49 1.06 1.08 1.10 0.24 18:2 n-6 0.69 0.61 0.75 0.60 0.68 0.75 0.88 18:3 n-3 0.31 0.73 0.46 0.67 0.79 0.96 0.11 18:3 n-6 0.51 0.18 0.58 0.08 0.22 0.25 0.14 20:2 n-6 0.12 0.55 0.40 0.29 0.34 0.74 0.63 20:3 n-3 0.11 0.18 0.05 0.70 0.08 0.19 0.34 20:4 n-6 0.56 0.20 0.19 0.39 0.27 0.69 0.50 20:5 0.14 0.04 0.29 0.15 0.06 0.12 0.58 22:2 0.33 0.65 1.81 0.42 1.06 3.22 0.54 22:5 0.12 0.12 0.10 0.06 0.24 0.35 0.28 22:6 0.30 0.23 0.09 0.10 0.24 0.98 0.45

109
Table 10
Percentage fatty acid composition of the whale batter and the final whale salami (day 21)
(T-test executed irrespective of starter culture, to compare results for day 1 and day 21)
Starter culture Batter (day 1) Salami (day 21)
Fatty acid
A B C A B C
T-test (P-value)
16:0 22.67 20.83 20.75 21.21 20.39 21.09 0.4918:0 2.28 2.03 1.85 2.51 2.25 2.27 0.1320:0 4.02 3.32 2.78 3.21 3.33 2.71 0.5122:0 11.75 11.82 11.63 9.92 10.44 10.57 0.0024:0 38.84 40.66 40.81 39.70 41.41 40.19 0.7116:1 n-7 14.61 14.48 15.91 17.16 15.62 16.89 0.0818:1 n-9 0.06 0.09 0.06 0.08 0.08 0.08 0.3220:1 n-9 1.41 1.47 1.47 1.78 1.58 1.77 0.0222:1 n-9 0.21 0.28 0.23 0.19 0.18 0.21 0.1624:1 n-9 1.03 1.01 1.03 1.05 0.92 0.98 0.3718:2 n-6 0.52 0.55 0.72 0.73 0.68 0.73 0.1418:3 n-3 0.60 0.58 0.58 0.66 1.02 0.63 0.2118:3 n-6 0.19 0.22 0.21 0.26 0.04 0.24 0.7020:2 n-6 0.60 1.04 0.38 0.44 0.57 0.38 0.3620:3 n-3 0.04 0.05 0.62 0.05 0.04 0.21 0.5320:4 n-6 0.30 0.40 0.34 0.29 0.21 0.29 0.1020:5 0.09 0.06 0.06 0.04 0.12 0.07 0.8222:2 0.49 0.41 0.41 0.56 0.82 0.50 0.1322:5 0.15 0.09 0.12 0.10 0.18 0.11 0.7622:6 0.15 0.60 0.06 0.07 0.11 0.07 0.33
5.5. Conclusion
From this research it may be deduced that the production of salami is possible by utilising the
meat of these aquatic mammal species, namely the Grey seal and the Minke whale. Both seal and
whale meat are rich in desirable fatty acids. This, together with their other chemical properties,
such as protein and fat content, make them healthier than traditional red meat species. However,
as these animals are protected species, concessions for harvesting them will determine how much
meat will be readily available for processing.
Although there were obvious and expected differences between the two species in terms of
chemical and physical properties, vital parameter values were found to be favourable in both
species, using all three starter cultures. The largest differences between starter cultures A (L.
plantarum), B (L. curvatus) and C (Gilde) were between starter culture C and the others. This

110
indicates that starter culture C influenced the colour and other physical parameters and it can
therefore be used to manipulate colour in such products if required.
The favourable results of this investigation regarding the potential and the quality of seal and
whale meat products, opens up the possibility of using these species on a larger, commercial
scale, resulting in more effective utilisation of both, especially seals, which are presently only
hunted for their skins and genitalia. The possibility of manufacturing a product such as salami,
using the meat of these species, could mean a continuous supply of a highly nutritious and
healthy product to the consumer. The fact that the carcasses of these animals can be fully and
effectively utilised might make the harvesting of these animals a more acceptable practice
globally, especially in countries that have concessions, as does Namibia.
Certainly, such an undertaking is not without challenges: seal flesh is dark in colour, which
would require investigation into consumer acceptance of a product containing such dark meat.
Customers need to be completely satisfied with the sensory characteristics of a product before
any other quality variables enjoy priority (Chambers & Bowers, 1993). Presently, the supply of
meat is also seasonal as concessions to harvesting these animals are regulated strictly. Although
this means, in effect, that securing a regular supply of meat throughout the year would be less
likely, this, in turn, might well increase the desirability and value of the available meat.
However, it is possible that any potential drawbacks might be overcome by the fact that seal and
whale meat are regarded as healthy and wholesome, due to their lean meat content and high
concentration of PUFA. Certainly, the desirability by the customer of products made from these
species would have to be determined before large-scale production can commence, with
consumer perception and acceptance being the key to the success of any product.
5.6. Acknowledgements
I would hereby like to thank the following persons and/or companies for their assistance in this
investigation: The Norwegian Institute for Food Research, for giving me the opportunity to visit,
and for the assistance and facilities to conduct this research; Erik Slinde, Aquaforsk, Bergen
Norway, who made the visit to Norway possible, and who liaised with the Norwegian Food
Research Institute for their collaboration and assistance in the realisation of this project and
which was of great assistance in obtaining the meat required for this trial; Mr. Hans Blom, who
was a great mentor and friend during the time at Matforsk and who ensured help was given by
the relevant persons at the institute at the appropriate times; and all the technical staff at

111
Matforsk, who were so patient and helpful while I was conducting all the necessary experiments
involved in this trial.
5.7. References
Acton, J.C., Dick, R.L. & Norris, E.L. (1977). Utilization of various carbohydrates in fermented
sausage. Journal of Food Science, 42, 174-178.
AOAC (1997). Official Methods of Analysis. 16th Edition. Arlington. Virginia. Association of
Official Analytical Chemists Inc. Washington, DC. USA.
Banskalieva, V. (2000). Fatty acid composition of goat muscles and fat depots: a review. Small
Ruminant Research, 37, 255-268.
Campbell-Platt, G. (1987). Fermentation foods of the World. 1st edition, Cambridge. Pp. 82-91.
Campbell-Platt, G. (1995). Fermented Foods – a world perspective. In: G. Campbell-Platt and
P.E. Cook, Editors, Fermented meats, Blackie Academic and Professional, Glasgow (1995),
pp. 39-52
Campbell-Platt, G. & Cook, P.E. (1995). Fermented meats.1st edition, Chapman & Hall. Pp. 40-
226.
Chambers, E. IV. & Bowers, J.R. (1993). Consumer perceptions of sensory qualities in meat.
Food Technology, 46:11, 116-120.
De Jong, G.D.C., Brasseur, S.M.J.M. & Reijnders, P.J.H. (1997). Grey seal Halichoerus grypus.
In: Reijnders, P.J.H., Verriopoulos, G., Brasseur, S.M.J.M. (Eds.), Status of pinnipeds
relevant to the European Union. IBN Scientific contributions, vol. 8, Wageningen (DLO
Institute for Forestry and Nature Research), NL, pp. 58-75.
Dicks, L.M.T., Mellett, F.D. & Hoffman, L.C. (2004). Use of bacteriocin-producing starter
cultures of Lactobacillus plantarum and Lactobacillus curvatus in production of ostrich meat
salami. Meat Science, 66, 703-708.
De Ketelaere, A., Demeyer, D., Vanderkerckhove, P. & Vervaeke, J. (1974). Stoichiometry of
carbohydrate fermentation during dry sausage ripening. Journal of Food Science, 39, 297-
300.
Dellaglio, S., Casiraghi, E. & Pompei, C. (1996). Chemical, Physical and Sensory attributes for
the Characterization of an Italian Dry-cured Sausage. Meat Science, 42, 25-35.
Flynn, M.A., Naumann, H.D., Nolph, G.B., Krause, G. & Ellersieck, M. (1985). The effect of
meat consumption on serum lipids. Food Technology, 39, 58-64.
Gibney, M.J. (1993). Fat in Animal Products: facts and perceptions. In: Safety and Quality of
Food from Animals. British Society of Animal Production Occasional Publication, Volume
XV11 (Edited by J.D. Wood & T.L.J. Lawrence). Pp. 57-61. Edinburgh: BSAP (As cited by
Wood & Enser, 1997).

112
Grundy, S.M. & Denke, S.A. (1990). Dietary influences on serum lipids. Journal of Lipid
Research, 31, 1149-1172.
Hutchings, J.B. (1994). Food colour and appearance. 1st edition. Blackie Academic and
Professional. Pp. 187.
Kim, H. Y. & Edsall, L. (1999). Lipase-catalyzed modification of rice bran oil incorporate
capric acid. Journal of the Agricultural and Food Chemistry, 48, 4439-4443.
Klinowska, M. (1991). Dolphins, Porpoises and Whales of the World. The IUCN Red Data
Book. IUCN, Gland, Switzerland. Pp. 23-24.
Krzywicki, K. (1982). The determination of heme pigment in meat. Meat Science, 7, 29.
Lee, C.M., Trevino, B. & Chaiyawat, M. (1996). A simple and rapid solvent extraction method
for determining total lipids in fish tissue. Journal of the Association of Official Analytical
Chemists International, 79, 487-492.
Lücke, F-K. (1986). Microbiological processes in the manufacture of dry sausage and raw ham.
Fleischwirtschaft, 66, 1505-1509
Melton, S.L. (1990). Effects of feeds on flavour of red meat: a review. Journal of Animal
Science, 68, 4421-4435.
Raes, K., De Smet, S. & Demeyer, D. (2003). Effect of dietary fatty acids on incorporation of
long chain polyunsaturated fatty acids and conjugated linoleic acid in calf, beef and pork
meat: a review. Animal Food Science and Technology, 113, 199-221.
Rowe, A., Macedo, F.A.F., Visentainer, J.V., Souza, N.E. & Matsushita, M. (1999). Muscle
composition and fatty acid profile in lambs fattened in drylot or pasture. Meat Science, 51,
283-288.
Sanz, B., Selgas, D., Parejo, I. & Ordonez, J.A. (1988). Characteristics of lactobacilli isolated
from dry fermented sausages. International Journal of Food Microbiology, 6(3), 199-205.
SAS (1990). SAS/STAT User’s Guide. Version 6. (4th Edition). Cary, NC: SAS Institute Inc.
Schillinger, U. & Lücke, F.K. (1987). Identification of lactobacilli from meat and meat products.
Food Microbiology, 4, 199-208.
Senanayake, S.P.J.N. & Shahidi, F. (2001). Enzyme-catalyzed synthesis of structured lipids via
acidolysis of seal (Phoca groenlandica) blubber oil with capric acid. Food Research
International, 35, 745-752.
Shahidi, F. & Synowiecki, J. (1993). Nutrient composition of mechanically separated and
surimi-like seal meat. Food Chemistry, 47, 41-48.
Shahidi, F., Synowiecki, J., Amarowicz, R. & Wanasundara, U. (1994). In Lipids in Food
Flavors, Eds C. -T. Ho and T.G. Hartman, pp.233. American Chemical Society, Washington,
DC.

113
Slinde, E. & Nordal, J. (1978). Formation of nitrosoheme and heme in dry sausages using
catalase positive strains of lactic acid bacteria as starter cultures. Proc. 24th Meeting of
European Meat Research and Work. Bundesanstalt fuer Fleischforschung, Kulmbach, West
Germany, 2:G11.
Slinde E. (1987). Colour of black salami sausage: Dissociation of heme from myoglobin and
haemoglobin. Journal of Food Science, 52(5), 1152-1154.
Synowiecki, J., Heeley, D.H. & Shahidi, F. (1992). Purification and characterization of
myoglobin from Harp seal (Phoca groenlandica). Journal of Agricultural Food Chemistry,
40, 714-718.
Tichelaar, H.Y., Smuts, C.M., van Stuiivenberg, M.E., Faber, M. & Benadé, A.J.S. (1998). The
fatty acid composition of rural school children with helminth infections. Asia Pacific Journal
Clinical Nutrition, 7, 196-197.
Townsend, W.E., Davis, C.E., Lyon, C.E. & Mescher, S.E. (1980). Effect of pork quality on
some chemical, physical, and processing properties of fermented dry sausage. Journal of
Food Science, 45, 622-626.

114
Chapter 6
Production of salami using meat from beef, mutton, horse, blesbok and springbok
a) Chemical composition and physical measurements
6a.1. Abstract
Salamis were was produced by using meat from horse, beef, mutton, blesbok and springbok.
Three different starter cultures were used: Lactobacillus curvatus DF 38 (batch I); Lactobacillus
plantarum 423 (batch II), which produces plantarin 423, a bacteriocin; and a bacteriocin-negative
mutant of Lactobacillus plantarum, strain 423m, (batch III). Changes in cell numbers, pH, aw,
colour (L* a* b* values), colony forming units (cfu), fatty acid profiles, and chemical analysis
were recorded over a period of 23 days. A difference in pH and aw values was seen between
starter cultures; batch I had a higher final pH value (4.66), whereas batches II and III were
similar (4.42 and 4.46 respectively). On day 23, the aw value was 0.90 for all fermented salami.
The L* and a* values did not differ greatly for the three starter cultures, nor between species. The
b* values, however, did show a distinct difference on day 6. Salami fermented with starter
cultures II and III showed a dramatic decline in b* value, whereas a more gradual decline was
recorded in batch I. Horsemeat was the leanest with only 1.38g fat/100g, whereas blesbok
contained 4.12g fat/100g. The highest desirable fatty acid (DFA) content was recorded in the
salami made from horsemeat. The polyunsaturated:saturated fatty acid (P:S) ratios were highly
variable on day 23, compared with the batter (day 0), with horse salami having the highest ratio
(0.08) and blesbok salami the lowest (0.05). The n-6:n-3 fatty acid ratios also changed, with
mutton having the highest ratio, and horse the lowest after 23 days.
Keywords: fermented sausage, game species, horsemeat, starter cultures
6a.2. Introduction
The harvesting of game animals, such as blesbok and springbok, is a seasonal occurrence and
products such as salami need to be developed to extend the shelf life of these, and thereby
supplying a continuous supply of a specific product.
Suitable meat ingredients are vital to produce blends of meat and fat particles, resulting in
sausages that are consistent in quality. Usually, salami contains between 50-70% lean meat, often
a combination of different species.

115
The most commonly used starter culture species in the fermentation of beef and pork sausages
are strains of Lactobacillus, Pediococcus, non-pathogenic Staphylococcus and Micrococcus
(Lücke, 1986). The major role of lactic acid bacteria in the sausage is to produce organic acids,
primarily lactic acid, from carbohydrates (Campbell-Platt, 1987). This leads to a decrease in pH
and contributes to the retardation of the development of undesirable micro-organisms
(Schillinger & Lücke, 1987). The decreased pH is also correlated with a reduced water-holding
capacity of the proteins, resulting in correct desiccation of the product, and also aids in the
cohesion of meat particles (Townsend et al., 1980) as well as contributes to the colour change of
the fermented sausages.
Economic and social changes in civilisations have led to nutritional demands being transformed
and modified. It is becoming more acceptable to purchase alternative sources of red meat, as
opposed to meat of only the traditional species of red meat producing animals. Further, modern
consumers like to be informed of the nutritional make-up of the food they consume (Horbańczuk
et al., 1998).
Increasing consumer interest in non-traditional meat products provides a reason for the
investigation into the production possibility of species such as seal, horse and certain species of
game animals (blesbok & springbok). Three of these species are not farmed intensively, and
therefore can be considered as wild game animals. This implies that they have had no direct
contact with humans, or contain any chemical substances in their bodies, which could have been
administered by human beings. Comparisons need to be drawn between these species and
conventional red meat species, such as beef and mutton, with regards to the production
possibilities of utilising these meat species in commercial plants producing traditional salami.
Since the contribution of game meat production (jerky hunters and game meat sales) constitutes
67.5% of the total income of the game industry of South Africa (Bothma, 2002), research is
required into the possibility of utilising these species in processed products, too. As many
alternative red meat species are harvested seasonally, salami made from these species would
provide a continuous supply of meat products of these species.
As the consumer nowadays prefers to have ready-to-eat, fast foods, processed foods are
becoming evermore popular, and the use of alternative red meat species in these processed
products is of particular interest to the industries. The objective of this investigation was,
therefore, to assess the potential of the five different meat species in the production of traditional
salami, and the suitability of three different starter cultures in the production thereof.

116
6a.3. Materials and methods
6a.3.1. Raw materials
Meat from horse, beef, mutton, blesbok (Damaliscus dorcas phillipsi) and springbok (Antidorcas
marsupialis), was sourced from commercial suppliers a week prior to production of the salami.
The batch sizes were approximately 7.5kg each, comprising lean meat (5.0kg), and pork fat
(2.5kg).
The spices (128g), salts (200g), the anti-oxidant and ascorbic acid (2.5g) were obtained from a
local supplier (Freddy Hirsch, P.O. Box 2554, Cape Town, 8000, South Africa). Fifteen batches
were produced from the five species and three starter cultures within one day so as to ensure that
environmental effects were similar.
6a.3.2. Starter cultures and growth conditions
Lactobacillus curvatus DF38 (batch I), Lactobacillus plantarum 423 (batch II) (Van Reenen et
al., 1998), and a mutant cured from plasmid p423 and unable to produce plantaricin 423 (strain
423m) (batch III) (Dicks et al., 2003), were used as starter cultures. Curing of strain 423 from its
plasmid was undertaken by incubation in the presence of 0.125-8μg/ml novobiocin, according to
the method described by Ruiz-Barba et al. (1991). Strains 423, 423m and DF38 were cultured in
MRS broth (Biolab, Biolab Diagnostics, Midrand, South Africa). Cultures were stored at -80°C
in MRS or BHI broth, supplemented with 15% (v/v) sterile glycerol.
Starter cultures were prepared by inoculating 2 l MRS broth with 5% (v/v) of a 12 hour-old
culture. Incubation was for 24 hours at 30oC, without shaking. The cells were harvested (8000 x
g, 20 minutes, 4oC), washed twice with sterile physiological salt (0.85% m/v NaCl) and
resuspended in 200 ml of the same solution. Cell suspensions were stored at 4°C until used.
6a.3.3. Meat preparation and fermentation
Five kilograms of horse, beef, mutton, blesbok and springbok were mixed with 2.5kg pork back
fat, and minced to a particle size of 3mm. The meat and fat were kept at -4°C to -8°C and minced
while still frozen.
Half of the quantity of lean meat was added to a “Scharfen” 3-litre bowl cutter, and cut for 15
revolutions (120 seconds) with the salt and curing salt having been added, until the meat had a
consistency of approximately 2mm. Thereafter, the speed was increased for another 60 seconds.
The remaining half of the lean meat was then added and cut for 15 revolutions (120 seconds).

117
The fat, and spices, were added next and cut until the fat particles were no larger than 8mm. At
low speed, the inoculum (105-106cells/g) was added into the mixture as a fluid, using a pipette.
Ascorbic acid was also added separately to the batter. The entire mixture was then mixed for a
further 30 seconds at slow speed, to ensure maximal mixing of ingredients.
The batches were prepared in the order of all species per one starter culture, to ensure that no
contamination of starter cultures occurred. After each batch, all the apparatus were cleaned and
after each starter culture, the apparatus were sterilised.
The batch was then stuffed into 6mm cellulose casings, using an automated stopper. Sausages of
approximately 10cm were produced. One batch resulted in an average of 18 sausages. To ensure
consistency of the product, one person was responsible for preparation of the batter, and another
for stuffing the salami.
All salami was clearly marked, indicating species and starter culture. Samples were taken from
the initial lean meat of each species, the pork fat and from each salami batch for fatty acid
analysis, proximate chemical analysis and microbiological assessment. The pH and water activity
readings were taken from each batter.
It was decided that colour measurements would not be taken on the first day, as the time between
preparations of the batters and stuffing varied between batches, which resulted in the varying of
the level of nitrite-induced colour change.
The sausages were sweated for two days, at 95% RH and 21oC, in a chamber with controlled
airflow and climate. Thereafter, they were smoked using cold smoke (18°C and 60% RH), from
commercial oak shavings, for 2 hours. Salami samples were taken prior to smoking, as well as
immediately after smoking. These samples were then taken to the laboratory for pH, water
activity, colour and microbial growth determinations.
After smoking, the salami was once again exposed to high humidity (95% RH and 21oC), to
activate bacterial fermentation. A week thereafter, the sausages were placed into a maturation
chamber at 70% RH and 10oC. Before going into maturation, samples were taken for data
analysis. Over the next 14 days, samples were collected every three days for analysis. Thereafter,
the salami was deemed suitable for human consumption (23 days after the initial mixing of the
batters); it was vacuum packed and stored at 4 oC until used for further analysis.

118
6a.3.4. Recorded parameters
In this investigation, pH values were recorded, in triplicate, using an insertion probe (Crison
model 507, Crison instruments, South Africa). The instrument was calibrated using standard
calibration solutions of pH 4 and pH 7. The probe was cleaned with distilled water between each
reading, to ensure that no fat particles from the sausage batter were left in the nozzle to affect
further readings.
Water activity (aw) values were measured using a Novasina ms1-aw handheld instrument
(Labotec, P.O. Box 790, Howard Place, 7450, South Africa). This instrument was calibrated
according to the manufacturer’s instructions. For the readings, approximately 5g of sample was
placed into a 2.5-cm plastic dish, which is inserted into an enclosed space.
Colour measurements were recorded, using a CIELab Colorimeter (Gardner, Columbia, USA).
(L*, a*, b* values). This instrument was calibrated using the standard white tile, according to the
manufacturer’s instructions. The salami was cut into 2.5cm-thick slices, and the colour taken
from the sliced surface. Readings were collected as L*, a* and b* values from three different
areas on the slice, to obtain an approximate value for each measurement.
The moisture, protein and ash content (g/100g meat) were determined according to the
Association of Official Analytical Chemist’s Standard Techniques (AOAC, 1997). Moisture
content was determined by drying samples at 105oC for 24 hours. Thereafter, the remaining
sample was placed into an oven at 400 oC for six hours, to cremate it for ash determination. To
determine the protein content, dried and defatted samples were used. They were ground by
means of a pestle in a mortar, until a fine powder was obtained. Per animal, 0.100mg was
weighed off and inserted into a foil wrap designed for the Leco protein analyser (Leco Fp-528,
Leco Corporation). Protein was determined as nitrogen, multiplied by 6.25, to determine the
protein concentration in the sample. For fat (g/100g meat) determination, samples were
homogenised in a blender using the chloroform: methanol (2:1) extraction procedure of Lee et al.
(1996).
The fatty acid content was determined using the method described by Tichelaar et al. (1998).
After thawing the meat, the lipids in a 2g sample were extracted with chloroform/methanol (2:1;
v/v). All the extraction solvents contained 0.01% butylated hydroxytoluene (BHT) as an
antioxidant. A polytron mixer (Kinematica, type PT 10-35, Switzerland) was used to homogenise

119
the sample within the extraction solvent. Heptadecanoic acid (C17:0) was used as an internal
standard to quantify the individual fatty acids.
A sub-sample of the extracted lipids was transmethylated for two hours at 70°C, using
methanol/sulphuric acid (19:1; v/v) as transmethylating agent. After cooling, the resulting fatty
acid methyl esters (FAME) were extracted with water and hexane. The top hexane phase was
transferred to a spotting tube and dried under nitrogen.
The FAME were purified by TLC (silica gel 60 plates) and analysed by GLC (Varian Model
3300 equipped with flame ionisation detection), using a 60 m BPX70 capillary column of
0.25mm internal diameter (SGE, Australia). Gas flow rates for hydrogen were 25ml/min; and
hydrogen carrier gas 2-4ml/min. Temperature programming was linear at 3°C/min, with an initial
temperature of 150°C, a final temperature of 220°C, an injector temperature of 240°C and a
detector temperature of 250°C. The FAME in the total lipids was identified by comparing the
retention times with those of a standard FAME mixture (Nu-Chek-Prep Inc., Elysian,
Minnesota).
6a.3.5. Statistical Analysis
Linear and non-linear regressions were fitted to all data and the gradient (b), intercept (a) and
goodness of fit (R2 value) calculated (Statistical Analysis Systems, 1990). It was found that the
goodness of fit was highest for the linear regression lines. Linear regressions were therefore used,
and are discussed further.
6a.4. Results and discussion
6a.4.1. pH and water activity
Maturation of the sausages over approximately 23 days lowered the aw and pH of the product
significantly. The texture changed from a soft batter to a hard, sliceable salami, and salami-
specific flavour compounds were formed during this period (Dainty & Blom, 1995). With regard
to collected data, pH is the most important and most readily obtained variable used to monitor
fermentation progress in salami (Acton et al., 1977; De Ketelaere et al., 1974).
Figs. 1 and 2 show the pH and aw for starter culture II only. Rates of change were similar for all
three starter cultures. As seen in Fig. 1, the pH values and their decline over 23 days were similar
(starter culture I) for all five species, except for the horse salami, whose pH decline had a less
steep gradient than that of the other species. Similar patterns were observed (Table 1) using
starter cultures II and III. As in starter culture I, horse salami had higher pH values than salami
120
made from the other species. The final (23 day) pH values were 4.45 and 4.55 for starter cultures
II and III respectively, whilst the pH values for the other species ranged between 4.18 and 4.22.
Table 1 shows the linear regressions for pH and aw. Most of the R2 values indicated a good fit for
the linear regressions to the data. The rate of pH change for mutton was the greatest (all three
starter cultures), and that of the horse salami the smallest. The rate of change in aw was similar
between both the starter cultures and the species used in producing the salami. However, the
mutton salami made with L. curvatus DF38 (batch I) showed a very low rate of desiccation.
The average final pH (day 23) value of L. curvatus (salami I) was 4.66. Using L. plantarum as
inoculant (salami II) resulted in an end pH of 4.42. The mutant strain (salami III) had a final pH
of 4.45. These values corresponded favourably with the fact that starter cultures II and III were
the same, as the pHs of their sausages were similar, where starter culture I resulted in a higher
end pH. With all three starter cultures, the sausages containing horsemeat showed the highest pH
throughout the trial period. In Table 1 the intercept values were highest for the horse salami, and
lowest for the blesbok salami.
As expected, the aw values of starter cultures II and III were similar (Tables 1 and 2), as the
mutation of the bacteriocin should not have an effect on this value. L. curvatus produced a
slightly higher ultimate aw than L. plantarum. In Table 1, the gradient values were all very
similar, although those for starter culture I were slightly higher than those for starter cultures II
and III.
A sudden increase in aw was seen in all the salamis between days three and seven, irrespective of
species or starter culture. The reason for this is not clear, but might be attributed to a
malfunctioning of the maturation chambers at the plant, such as a power failure or a system fault.
A change in the aw level would not rectify itself immediately, and could take up to three days.
This would correspond with the data collected. However, records from the processing plant did
not show any technical problems during that particular time. Alternatively, the water activity
meter may have malfunctioned, although it was the same instrument, used in exactly the same
manner, for these and the subsequent readings.
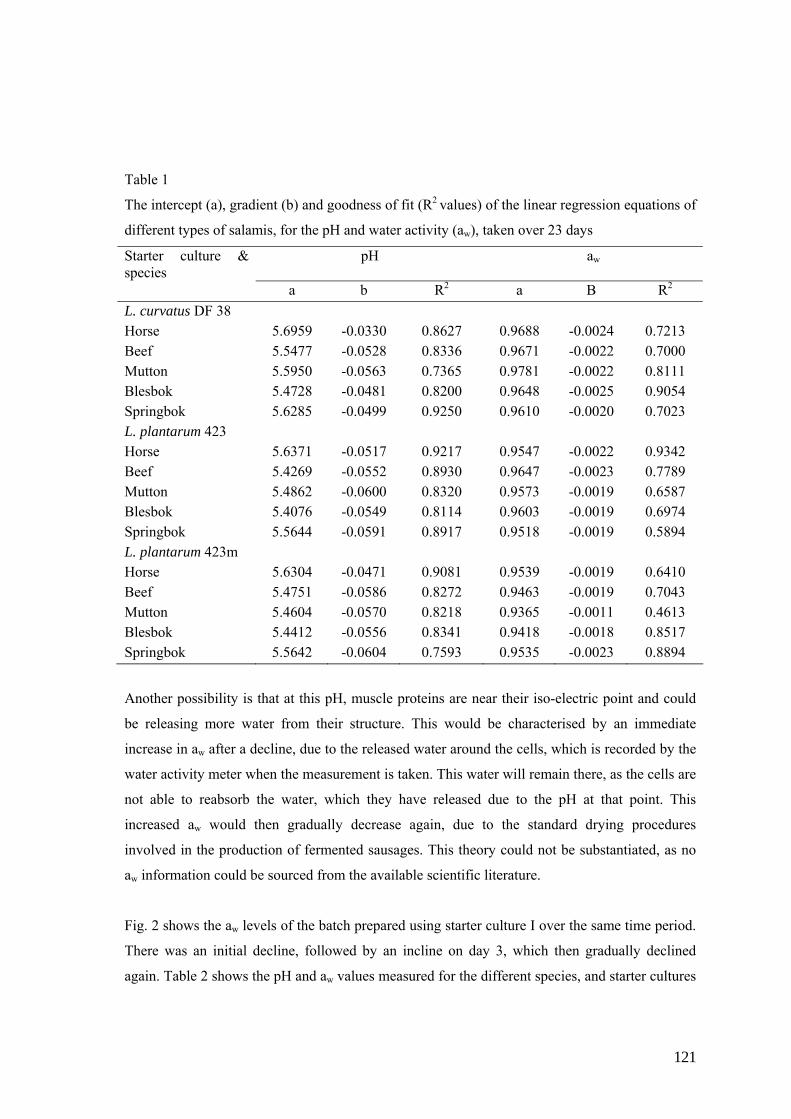
121
Table 1
The intercept (a), gradient (b) and goodness of fit (R2 values) of the linear regression equations of
different types of salamis, for the pH and water activity (aw), taken over 23 days
Starter culture & species
pH aw
a b R2 a B R2 L. curvatus DF 38 Horse 5.6959 -0.0330 0.8627 0.9688 -0.0024 0.7213 Beef 5.5477 -0.0528 0.8336 0.9671 -0.0022 0.7000 Mutton 5.5950 -0.0563 0.7365 0.9781 -0.0022 0.8111 Blesbok 5.4728 -0.0481 0.8200 0.9648 -0.0025 0.9054 Springbok 5.6285 -0.0499 0.9250 0.9610 -0.0020 0.7023 L. plantarum 423 Horse 5.6371 -0.0517 0.9217 0.9547 -0.0022 0.9342 Beef 5.4269 -0.0552 0.8930 0.9647 -0.0023 0.7789 Mutton 5.4862 -0.0600 0.8320 0.9573 -0.0019 0.6587 Blesbok 5.4076 -0.0549 0.8114 0.9603 -0.0019 0.6974 Springbok 5.5644 -0.0591 0.8917 0.9518 -0.0019 0.5894 L. plantarum 423m Horse 5.6304 -0.0471 0.9081 0.9539 -0.0019 0.6410 Beef 5.4751 -0.0586 0.8272 0.9463 -0.0019 0.7043 Mutton 5.4604 -0.0570 0.8218 0.9365 -0.0011 0.4613 Blesbok 5.4412 -0.0556 0.8341 0.9418 -0.0018 0.8517 Springbok 5.5642 -0.0604 0.7593 0.9535 -0.0023 0.8894
Another possibility is that at this pH, muscle proteins are near their iso-electric point and could
be releasing more water from their structure. This would be characterised by an immediate
increase in aw after a decline, due to the released water around the cells, which is recorded by the
water activity meter when the measurement is taken. This water will remain there, as the cells are
not able to reabsorb the water, which they have released due to the pH at that point. This
increased aw would then gradually decrease again, due to the standard drying procedures
involved in the production of fermented sausages. This theory could not be substantiated, as no
aw information could be sourced from the available scientific literature.
Fig. 2 shows the aw levels of the batch prepared using starter culture I over the same time period.
There was an initial decline, followed by an incline on day 3, which then gradually declined
again. Table 2 shows the pH and aw values measured for the different species, and starter cultures

122
on days 0 and 23. As the starter cultures should not yet have had an effect on pH or aw values on
day 0, any differences could be attributed to species. The horse salami had the highest initial aw
(0.98). With the exception of horse I, the salamis all had low pH values (<4.65) on day 23. Due
to forced drying conditions, all the salamis had similar aw levels after 23 days (either 0.91 or
0.90). The beef salami showed a delay in final decline between day 17 and 21, but did end up
with a similar value at day 23.
4.00
4.20
4.40
4.60
4.80
5.00
5.20
5.40
5.60
5.80
6.00
0 3 3 7 10 14 17 21 24
days
pH
horse
beef
mutton
blesbok
springbok
Figure 1. Salami pH values taken from five species over 23 days, using starter culture I
0.86
0.88
0.90
0.92
0.94
0.96
0.98
1.00
0 3 3 7 10 14 17 21 24days
wat
er a
ctiv
ity
Horse
Beef
Mutton
Blesbok
Springbok
Figure 2. Salami aw values of all species over 23 days, using starter culture I

123
Table 2
Average pH and water activity measurements taken on day 0 and day 23 for the five species of
salami, prepared using three different starter cultures
pH aw Starter culture & species Day 0 Day 23 Day 0 Day 23 L. curvatus DF 38 Horse 5.50 5.00 0.98 0.91 Beef 5.63 4.56 0.97 0.90 Mutton 5.86 4.46 0.96 0.91 Blesbok 5.60 4.52 0.96 0.90 Springbok 5.68 4.62 0.96 0.91 L. plantarum 423 Horse 5.56 4.55 0.96 0.90 Beef 5.47 4.35 0.97 0.90 Mutton 5.56 4.36 0.96 0.91 Blesbok 5.39 4.38 0.97 0.91 Springbok 5.50 4.39 0.97 0.90 L. plantarum 423m Horse 5.57 4.65 0.97 0.90 Beef 5.48 4.36 0.96 0.90 Mutton 5.39 4.32 0.95 0.91 Blesbok 5.40 4.35 0.94 0.90 Springbok 5.51 4.41 0.96 0.90
6a.4.2. Colour evaluation
Regression lines were fitted to the colour data; the linear regression line had the highest R2 value,
but was still too low to be acceptable as an appropriate representation of the data (Table 3).
Meat colour is known to change during the ageing, curing and ripening period in salami (Ruiz de
Huidobro et al., 2003). The colour of meat is a vital point of judgment for the consumer
(Clydesdale, 1991) and is dependent on the concentration and oxidation state of myoglobin, and
on the meat structure. A higher L* value indicates increased lightness. Horse had the lowest L*
values throughout and beef and mutton the highest. This is due to the innate characteristic of the
meat, where horsemeat is a darker meat than beef and mutton. The game meat showed
intermediate lightness, with the blesbok being lighter than the springbok. The change in L*
values (over 23 days) of all five species salami using starter culture I (Fig. 3), indicated definite
differences in lightness between species. Horse was the darkest meat with the lowest L* values,
whilst beef was the lightest. Springbok salami showed the largest fluctuations over time, with
beef being most stable.

124
Table 3
Regression line parameters, intercept (a), gradient (b) and goodness of fit (R2 value) for colour
values of the five species of salami, prepared using three starter cultures
Parameter Batch Intercept (a) Gradient (b) R2 value L. curvatus DF38 L*value Horse 39.123 0.0689 0.0239 Beef 50.470 0.0106 0.0019 Mutton 48.378 0.0950 0.1089 Blesbok 47.242 0.1140 0.1705 Springbok 43.823 0.0350 0.0033 a* value Horse 14.798 -0.0475 0.0410 Beef 12.789 0.0388 0.6060 Mutton 13.984 0.0149 0.0067 Blesbok 13.478 -0.0230 0.2228 Springbok 12.952 0.1046 0.2056 b* value Horse 10.919 -0.0942 0.3506 Beef 12.889 -0.1805 0.4771 Mutton 12.072 -0.1118 0.3299 Blesbok 12.091 -0.1845 0.4276 Springbok 11.538 -0.0994 0.3608 L. plantarum 423 L* value Horse 41.683 -0.0480 0.0060 Beef 49.912 0.0881 0.1974 Mutton 48.080 0.1053 0.0555 Blesbok 44.875 0.2407 0.2446 Springbok 44.180 0.1970 0.3252 a* value Horse 14.787 -0.0569 0.2466 Beef 13.15 0.0714 0.3652 Mutton 13.988 -0.0135 0.0068 Blesbok 15.732 -0.0878 0.1773 Springbok 14.558 -0.0471 0.2316 b* value Horse 10.696 -0.1202 0.4226 Beef 13.419 -0.2437 0.4760 Mutton 12.339 -0.1999 0.4747 Blesbok 12.744 -0.2117 0.6057 Springbok 11.865 -0.1739 0.6432 L. plantarum 423m L* value Horse 44.789 -0.0928 0.2110 Beef 50.331 0.0817 0.0274 Mutton 50.498 -0.0251 0.0069 Blesbok 49.659 -0.0068 0.0008 Springbok 47.267 -0.0778 0.0663 a* value Horse 13.610 0.0652 0.2010 Beef 14.111 0.0333 0.3220 Mutton 13.597 0.0373 0.1597 Blesbok 12.576 0.1033 0.2173 Springbok 12.424 0.0347 0.0528 b* value Horse 10.225 -0.0544 0.1583 Beef 12.458 -0.1688 0.3470 Mutton 12.680 -0.1639 0.5368 Blesbok 12.589 -0.1528 0.3782 Springbok 11.333 -0.1327 0.8255

125
Table 3 shows that for starter culture II, all species, except beef, showed a negative trend in rate
of change over time, whereas for starter culture III, all had a positive gradient.
Fig. 4 shows the a* values of the same sausages, indicating that the horse salami had the greatest
fluctuations in red-green colour tones, probably due to the dark nature of the meat type. The a*
values were lowest for the beef salami, except in starter culture III. As this intercept is a
reflection of the batter on day 0, an average could be taken of all a* values of the different
species, as starter culture would not yet have resulted in a change in colour. When averages were
calculated, beef and springbok were the least red meat, with average a* values of 13.35 and
13.31 respectively. Horse was the most red, with an average a* value of 14.40. According to
Strange, Benedict, Gugger, Metzger & Swift (1974), meat quality is positively related to the a*
value.
Fig. 5 shows the b* values of the five species, prepared using starter culture I. All species
displayed a definite negative trend over the same time period. The R2 values for the b* values
higher than for the L* and a* values, but still not high enough to consider a linear or non-linear
regression as suitable fit to the relevant data. The goodness of fit of the linear regressions could
be low due to the high variability in colour measurements, caused by the high variability within a
specific sample measured. This variability is probably caused by fat and muscle pieces that make
up the intricate colour mosaic of salami. Horse salami had the lowest b* value throughout,
whereas beef had the highest, similar to Fig. 3. Some salami, for instance the mutton, had smaller
fat particles and, thus, a smoother surface than the other species. No literature could be sourced
which describes the change in L*a*b* colour during the fermentation of salami.

126
30.00
35.00
40.00
45.00
50.00
55.00
1 3 3 7 10 14 17 21
days
L*va
lue
HorseBeefMuttonBlesbokSpringbok
Figure 3. L* values of the five species used for the production of salami, using L. curvatus
DF38, over 23 days
10.00
11.00
12.00
13.00
14.00
15.00
16.00
17.00
18.00
1 3 3 7 10 14 17 21
days
a*va
lue
HorseBeefMuttonBlesbokSpringbok
Figure 4. a* values of the five species used for the production of salami, using L. curvatus
DF38, over 23 days

127
8.00
9.00
10.00
11.00
12.00
13.00
14.00
15.00
16.00
1 3 3 7 10 14 17 21
days
b*va
lue
HorseBeefMuttonBlesbokSpringbok
Figure 5. b* values of the five species used for the production of salami, using L. curvatus
DF38, over 23 days
6a.4.3. Chemical analysis
In the proximate chemical analysis of the major raw materials used, horsemeat was the leanest,
with only 1.38g fat/100g meat, whereas blesbok, with 4.12g fat/100g meat, had the most fat.
Blesbok meat had the highest protein content, 22.15g/100g, whilst horse meat had the second
highest protein concentration, 21.40g/100g. As neither of these animals is bred intensively for
meat production, they would not be expected to have a high fat content. Game meat is known to
be a lean meat, and the blesbok meat used in this study could have been from animals shot during
the rainy season when their condition would have been at its optimum and the animals at their
fattest, which would explain the chemical composition. When compared with the species
normally used for salami production in South Africa, mainly beef, these other meat species
would compare favourably and could be expected to be suitable for the production of salami. As
fat is added in the preparation of the batter, the fat content of the actual raw (lean) meat used is
not of that much relevance. Rather it is the physical attributes, such as water holding capacity and
pH, which would determine the ultimate suitability of the meat of a certain species.
Proximate analysis of the raw materials used in the production of the salami was undertaken to
evaluate the qualities of the individual species. Chemical composition in terms of moisture,
protein, fat and ash of the five different meat types, and the pork fat used in the production of the
sausages are depicted in Table 4.

128
Table 4
Means for the proximate chemical composition of the raw materials (g/100g) used in the
production of the salami
Species Moisture Protein Fat Ash Horse 75.10 21.40 1.38 1.46 Beef 75.32 20.84 2.67 1.27 Mutton 74.78 20.25 2.87 1.26 Blesbok 71.56 22.15 4.22 2.04 Springbok 74.75 19.94 3.14 1.42 Pork fat 14.50 6.79 78.01 0.64
Table 5 indicates the mean, and standard deviation of the species salami as pertaining to
proximate chemical composition. This table also indicates the difference in chemical parameters
within the salami between day 0 (batter) and day 23 (salami). Due to the drying conditions of the
processing chambers, the final moisture values were more similar between species than they
were on day 1. The protein and fat content increased relative to the moisture lost over this period.
During the chemical analysis of the batter and the finished product, it was noticed that the batch
using starter culture I lost an average of 39.46% moisture over 23 days, batch II lost an average
of 40.28%, and batch III 40.66%. The moisture content of the final salami varied from 29.2%
(blesbok) to 34.6% (springbok), which corresponded with results reported by Meynier et al.
(1999), whose salami’s moisture content range from 26.0 to 45.5%. These researchers attribute
the large variation in moisture content to differences in ripening between species (beef and
mutton). The protein and fat contents of their sausages ranged from 22.7 to 30.8% and from 26.4
to 36.0% respectively. In this investigation, the protein content varied between 20.9 (springbok)
and 24.2% (horse) and the fat content from 35.6% (horse) to 40.4% (blesbok).
Due to the high fat content of the blesbok meat, its moisture content was lower than that of the
other species. As the pork fat used was subcutaneous fat, it contained some skin and connective
tissue, which would result in relatively high protein and low fat content measured in the initial
raw ingredient.

129
Table 5
Mean (g/100g) ± standard deviation of the proximate analysis results of the species on day 0
(batter) and 23 (salami)
Species Batter (day 0) Salami (day 23)
Moisture Ash Fat Protein Moisture Ash Fat Protein
Horse 52.4
±0.9
4.3
±1.6
26.7
±4.3
14.5
±3.2
31.9
±1.5
4.7
±0.1
35.6
±1.1
24.2
±0.5
Beef 53.4
±1.0
3.2
±0.1
28.7
±4.0
13.1
±3.0
30.1
±1.9
4.9
±0.1
36.6
±0.8
23.5
±2.3
Mutton 55.0
±1.0
3.6
±0.1
25.1
±0.1
14.2
±0.2
33.6
±1.2
4.9
±0.1
36.4
±1.0
22.3
±0.5
Blesbok 51.9
±0.1
3.9
±0.5
27.3
±0.2
14.4
±0.8
29.2
±2.1
5.4
±0.7
40.4
±2.7
21.2
±1.1
Springbok 53.3
±0.7
3.4
±0.1
26.9
±0.7
15.4
±3.0
34.6
±3.2
3.9
±0.8
36.3
±0.1
20.9
±1.9
6a.4.4. Fatty acid determination
The fatty acid composition of meat has little or no influence on the market value of a carcass at
present, as carcasses of traditional red-meat-producing species are valued according to a specific
grade. There is an increasing demand for meat products with a certain fatty acid profile, as the
actual fatty acid qualities (chemical and physical) affect the sensory and storage qualities of meat
(Banskalieva et al., 2000). It is also known that the flavour of meat is influenced by its fatty acid
composition (Melton, 1990). Unsaturated fatty acids have an increased susceptibility for
oxidation and thus rancidity, which influence shelf life.
It is possible that lactobacilli play a role in fat hydrolysis during dry fermentation of sausages,
due to their ability to cleave short-chain fatty acid triglycerides and diglycerides. Although the
concentration of these glycerides is quite low in the original fat of the sausages, they could
increase due to the action of bacterial and meat lipases during the ripening phase of the sausages
(Sanz et al., 1988). It is therefore difficult to monitor fatty acid changes during maturation and
fermentation of a product.

130
Table 6
The fatty acid content of the raw materials (mg/100g meat) used in the production of the various
species of salami
Fatty acid Pork fat Horse Beef Mutton Blesbok SpringbokSFA 16:0 2878.8 336 276.5 391 364.2 414.6
18:0 351.8 183.3 201.6 288 274.7 327.5 20:0 1480.5 4.1 7.2 3.4 8.6 3.4 22:0 4.4 21.1 47.2 5.0 6.4 67.0 24:0 18.8 2.5 25.5 86.2 36.7 2.3
MUFA 16:1 n-7 6.6 28.4 47.2 25.3 22.2 35.6 18:1 n-9 101.3 304.3 364.2 583.5 572.6 536.3 20.1 n-9 24.8 7.2 14.1 11.4 10.4 3.4 22:1 n-9 83.7 4.1 7.2 14.8 11.3 3.7 24:1 n-9 60.7 2.1 3.0 13.1 13.5 9.0
PUFA 18:2 n-6 64.1 344.1 175.3 136.2 132. 8 265.1 18:3 n-3 20.2 72.9 21.8 33.9 35.3 31.8 18:3 n-6 14.7 2.7 3.0 1.7 3.3 1.8 20:2 n-6 18.8 16.4 20.0 12.1 14.1 12.1 20:3 n-3 7.5 63.5 7.6 44.3 89.1 88.5 20:4 n-6 2.1 8.7 8.0 1.7 2.1 9.3 20:5 18 15.3 30.1 18.1 21 30.3 22:2 4.9 2.3 2.4 17.5 3.0 8.3 22:5 1.0 24.7 5.3 1.2 9.7 3.5 22:6 20.6 33.5 9.0 7.0 6.3 2.9
Total ΣSFA 4734.3 547.0 558.0 773.6 690.6 814.8 ΣMUFA 277.1 346.1 435.7 648.1 630.0 588.0 ΣPUFA 171.9 584.1 282.5 273.7 183.9 453.6 ΣTUFA 449.0 930.2 718.2 921.8 813.9 1041.6 DFA 800.8 1113.5 919.8 1209.8 1088.6 1369.1 P: S 0.04 1.1 0.5 0.4 0.3 0.6 n-6 99.7 371.9 206.3 151.7 152.3 288.3 n-3 27.7 136.4 29.4 78.2 124.4 120.3 n-6: n-3 3.6 2.7 7.0 1.9 1.2 2.4
SFA = Saturated Fatty Acids; MUFA = Monounsaturated Fatty Acids; PUFA = Polyunsaturated Fatty Acids; TUFA = Total Unsaturated Fatty Acids; DFA = Desirable Fatty Acids (C18:0 + TUFA)
Table 6 shows the fatty acid compositions (mg/100g meat) of the major raw materials used.
Springbok showed the highest SFA content (814.8mg/100g meat) of all five species, and mutton
the highest overall MUFA content (648.1mg/100g meat), with horse showing the highest
concentration of PUFA (584.1mg/100g meat). Horsemeat also contained the lowest amount of
SFA (547.0mg/100g meat) and lowest amount of MUFA (346.1mg/100g meat). Fatty acid
analyses were conducted on the raw materials (meat samples and pork fat) and results are shown
in Table 6, according to species and degree of saturation. Table 7 shows the percentage fatty acid
values of the raw materials used. Palmitic acid (C16:0) was the dominant fatty acid present in all
five species. Horsemeat had the highest PUFA:SFA (P:S) ratio (1.1) of all the raw materials

131
used, whereas pork fat had the lowest (0.04). Beef was seen to have the highest n-6:n-3 ratio of
the meat used, with blesbok having the lowest value. In terms of DFA content, springbok meat
had the highest concentration, and pork fat the lowest.
Table 7
Percentage values of the raw materials used in the production of traditional salami
Fatty acid Pork fat Horse Beef Mutton Blesbok SpringbokSFA 16:0 55.5 22.7 21.7 23.1 24.2 22.3
18:0 6.8 12.4 15.8 17.0 18.3 17.6 20:0 28.6 0.3 0.6 0.2 0.6 0.2 22:0 0.1 1.4 3.7 0.3 0.4 3.6 24:0 0.4 0.2 2.0 5.1 2.4 0.1
MUFA 16:1 n-7 0.1 1.9 3.7 1.5 1.5 1.9 18:1 n-9 2.0 20.6 28.5 34.4 38.1 28.9 20.1 n-9 0.5 0.5 1.1 0.7 0.7 0.2 22:1 n-9 1.6 0.3 0.6 0.9 0.8 0.2 24:1 n-9 1.2 0.1 0.2 0.8 0.9 0.5
PUFA 18:2 n-6 1.2 23.3 13.7 8.0 8.7 14.3 18:3 n-3 0.4 4.9 1.7 2.0 2.3 1.7 18:3 n-6 0.3 0.2 0.2 0.1 0.2 0.1 20:2 n-6 0.4 1.1 1.6 0.7 0.9 0.7 20:3 n-3 0.1 4.3 0.6 2.6 5.9 4.8 20:4 n-6 0.0 0.6 0.6 0.1 0.1 0.5 20:5 0.3 1.0 2.4 1.1 1.4 1.6 22:2 0.1 0.2 0.2 1.0 0.2 0.4 22:5 0.0 1.7 0.4 0.1 0.6 0.2 22:6 0.4 2.3 0.7 0.4 0.4 0.2
Tables 8 and 9 represent the fatty acid composition (mg/100g sample) of the batter (day 0) and
finished product (day 23). As the same amount of pork lard was added to each batter, all species
of meats would be affected in the same way due to the dilution effect of the fat. The high SFA
content of pork fat (Table 6) increased the SFA content of each batter, influencing the DFA and
P:S ratios. The batter containing the horsemeat had the highest SFA content, and mutton the
lowest (Table 8). The blesbok batter had the most DFA content and mutton the least. In terms of
P:S ratios, all batters were between 0.4 and 0.5. The n-6:n-3 ratio for horse salami was the
highest, whilst mutton had the lowest ratio. None of the samples of batter or salami conformed to
the ideal P:S ratio of >0.70. This is possibly due to the high amount of pork fat in the mixture,
giving it undesirable properties (Table 8). All species in the final salami had n-6: n-3 values of
<5.0, indicating that these products are beneficial with regards to food healthy standards. The
lowest n-6:n-3 ratio, i.e. the best one, was noted in the horse salami prepared using starter culture
II (0.65). This would be considered the healthiest salami in terms of beneficial fatty acids.

132
As the fatty acid composition of human food sources is becoming increasingly important in terms
of human health, the aim is to bring the P:S ratio of meat closer to the recommended value >0.70,
and the n-6:n-3 ratio of <5.0 (Raes et al., 2004). The ideal P:S ratio is >0.70, but as very few
species conform to this ideal, the recommended value for P:S ratio has thus been adjusted to 0.45
(Wood & Enser, 1997). According to Enser et al. (1998), the meat from ruminant animals
usually has a low P:S ratio, whereas game meat is known to have a higher and more positive one,
due to a high PUFA content (Girolami et al., 2003). In Table 6, the P:S ratio of the ruminants
was lower than that of horse (1.1). The n-6:n-3 ratio of the horsemeat, mutton, blesbok and
springbok were <5.0, which make them highly suitable for human consumption. The beef,
similarly, had an n-6:n-3 ratio of >5.0.
The fatty acid content of the salami after 23 days is shown in Table 9. A comparison between
Tables 8 and 9 indicates how the fatty acids changed due to oxidation in the fermenting sausage.
Springbok salami contained the highest concentration of SFA after 23 days, whilst the sausage
containing horsemeat had the second highest. The highest DFA concentration was found in the
salami made from horsemeat. The P:S ratios were more variable after 23 days than they were on
day 0, with horse salami having the highest ratio (0.08) and blesbok salami the lowest (0.05). The
n-6:n-3 ratios also changed, with mutton having the highest n-6:n-3 ratio, and horse the lowest.
This was in direct contrast with day 0, where the opposite was seen (Table 8).
According to Knapp & Melly (1986), PUFA have bactericidal effects and their toxicity increases
with increasing unsaturation. The susceptibility and severity of lipid oxidation depends on the
degree and amount of unsaturated fatty acids present (Kanner, 1994; Gray et al., 1996). Talon et
al. (2000) substantiated this, by suggesting that the rate of oxidation decreased in the order
linolenic, linoleic and oleic fatty acids. In sausage, free fatty acids increase during maturation.
Johansson, Molley, Geenen & Demeyer (1996) suggest that linolenic and linoleic acids represent
approximately 1 and 12 % respectively of the total free fatty acids, and, therefore, account for a
significant percentage that will oxidise during sausage processing. In Tables 10 and 11, the
percentage values of linolenic and linoleic fatty acids on day 0 in the batter and day 23 in the end
product, indicate that linoleic acid (18:2 n-6) and both α- and γ linolenic acids (18:3 n-6 and n-3)
showed an increase over time. Both had similar values to begin with, which were closer to 1%
than 12%. This might be due to a variation in ingredients used in the making of the sausages in
this investigation, compared with those used by Johansson, Molley, Geenen & Demeyer (1996).
Tables 10 and 11 show the same fatty acids as in Tables 8 and 9, but are expressed as a
percentage of the total fatty acids identified.

133
Table 8
The fatty acid content (mg/100g meat) of the batter used in the production of the different species salami Fatty acid H I B I M I BB I SB I H II B II M II BB II SB I H III B III M III BB III SB III 16:0 1754 1769 1583 1747 1862 1710 1820 1780 2108 1666 1897 1891 1804 2021 1772 18:0 180 186 161 169 207 200 182 180 217 202 208 201 191 200 197 20:0 951 968 804 1022 957 865 968 939 1109 825 938 1017 908 1156 926 22:0 3488 2969 2702 3318 3593 3394 3001 2521 3560 3506 3599 2877 2741 3211 3441 24:0 11 10 6 4 8 11 10 4 4 11 12 3 3 6 11 16:1 n-7 2 7 6 6 6 4 4 6 6 6 5 2 7 5 4 18:1 n-9 53 63 8 126 59 59 61 3 124 64 56 64 3 95 125 20.1 n-9 21 21 17 16 23 23 23 11 17 21 24 17 18 24 24 22:1 n-9 158 72 8 68 132 136 62 10 63 133 148 57 9 65 133 24:1 n-9 130 17 9 45 69 123 29 11 71 75 134 27 12 51 72 18:2 n-6 97 93 35 32 83 92 125 30 109 75 86 58 21 92 94 18:3 n-3 27 17 74 88 19 25 14 73 21 18 22 13 87 19 16 18:3 n-6 15 23 42 51 49 13 13 42 57 43 20 21 60 52 42 20:2 n-6 39 27 20 48 33 47 25 35 32 41 25 28 45 36 22 20:3 n-3 11 12 10 14 11 13 20 12 19 19 10 6 30 12 14 20:4 n-6 3 5 4 4 1 3 4 3 11 2 4 1 6 7 5 20:5 44 21 3 40 37 40 19 2 40 33 61 22 22 29 51 22:2 7 5 5 7 9 5 4 4 5 6 9 4 4 4 6 22:5 21 20 28 33 20 23 21 33 45 21 38 14 2 26 21 22:6 19 14 26 24 9 23 12 29 30 13 13 8 27 17 17 ΣSFA 6384 5902 5256 6260 6632 6180 5981 5424 6998 6210 6659 5989 5647 6594 6997 ΣMUFA 364 180 48 261 289 345 179 41 281 299 367 167 49 240 358 ΣPUFA 283 237 247 341 271 284 257 263 369 271 288 175 304 294 288 ΣTUFA 647 417 295 602 560 629 436 304 650 570 655 342 353 534 646 DFA 827 603 456 771 767 829 618 484 867 772 863 543 544 734 843 P: S 0.04 0.04 0.05 0.05 0.04 0.05 0.04 0.05 0.05 0.04 0.04 0.03 0.05 0.04 0.04 n-6 154 148 101 135 152 155 167 110 209 161 135 108 132 187 163 n-3 38 29 84 102 30 38 34 85 40 37 32 19 117 31 30 n-6: n-3 4.05 5.10 1.20 1.32 5.08 4.08 4.91 1.29 5.23 4.35 4.22 5.68 1.13 6.03 5.43 SFA = Saturated Fatty Acids; MUFA = Monounsaturated Fatty Acids; PUFA = Polyunsaturated Fatty Acids; TUFA = Total Unsaturated Fatty Acids; DFA = Desirable Fatty Acids (C18:0 + TUFA) H = horse, B = beef, M = mutton, BB = blesbok, SB = springbok, I, II and III = starter cultures I, II and III
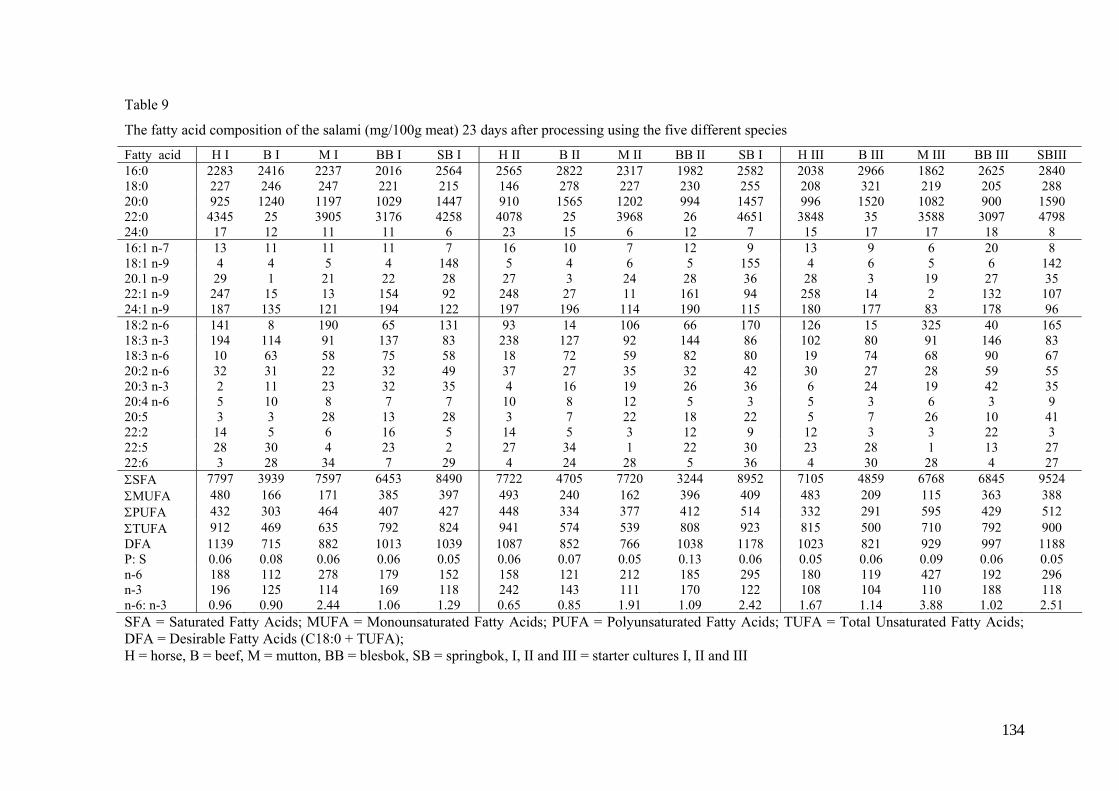
134
Table 9
The fatty acid composition of the salami (mg/100g meat) 23 days after processing using the five different species
Fatty acid H I B I M I BB I SB I H II B II M II BB II SB I H III B III M III BB III SBIII 16:0 2283 2416 2237 2016 2564 2565 2822 2317 1982 2582 2038 2966 1862 2625 2840 18:0 227 246 247 221 215 146 278 227 230 255 208 321 219 205 288 20:0 925 1240 1197 1029 1447 910 1565 1202 994 1457 996 1520 1082 900 1590 22:0 4345 25 3905 3176 4258 4078 25 3968 26 4651 3848 35 3588 3097 4798 24:0 17 12 11 11 6 23 15 6 12 7 15 17 17 18 8 16:1 n-7 13 11 11 11 7 16 10 7 12 9 13 9 6 20 8 18:1 n-9 4 4 5 4 148 5 4 6 5 155 4 6 5 6 142 20.1 n-9 29 1 21 22 28 27 3 24 28 36 28 3 19 27 35 22:1 n-9 247 15 13 154 92 248 27 11 161 94 258 14 2 132 107 24:1 n-9 187 135 121 194 122 197 196 114 190 115 180 177 83 178 96 18:2 n-6 141 8 190 65 131 93 14 106 66 170 126 15 325 40 165 18:3 n-3 194 114 91 137 83 238 127 92 144 86 102 80 91 146 83 18:3 n-6 10 63 58 75 58 18 72 59 82 80 19 74 68 90 67 20:2 n-6 32 31 22 32 49 37 27 35 32 42 30 27 28 59 55 20:3 n-3 2 11 23 32 35 4 16 19 26 36 6 24 19 42 35 20:4 n-6 5 10 8 7 7 10 8 12 5 3 5 3 6 3 9 20:5 3 3 28 13 28 3 7 22 18 22 5 7 26 10 41 22:2 14 5 6 16 5 14 5 3 12 9 12 3 3 22 3 22:5 28 30 4 23 2 27 34 1 22 30 23 28 1 13 27 22:6 3 28 34 7 29 4 24 28 5 36 4 30 28 4 27 ΣSFA 7797 3939 7597 6453 8490 7722 4705 7720 3244 8952 7105 4859 6768 6845 9524 ΣMUFA 480 166 171 385 397 493 240 162 396 409 483 209 115 363 388 ΣPUFA 432 303 464 407 427 448 334 377 412 514 332 291 595 429 512 ΣTUFA 912 469 635 792 824 941 574 539 808 923 815 500 710 792 900 DFA 1139 715 882 1013 1039 1087 852 766 1038 1178 1023 821 929 997 1188 P: S 0.06 0.08 0.06 0.06 0.05 0.06 0.07 0.05 0.13 0.06 0.05 0.06 0.09 0.06 0.05 n-6 188 112 278 179 152 158 121 212 185 295 180 119 427 192 296 n-3 196 125 114 169 118 242 143 111 170 122 108 104 110 188 118 n-6: n-3 0.96 0.90 2.44 1.06 1.29 0.65 0.85 1.91 1.09 2.42 1.67 1.14 3.88 1.02 2.51 SFA = Saturated Fatty Acids; MUFA = Monounsaturated Fatty Acids; PUFA = Polyunsaturated Fatty Acids; TUFA = Total Unsaturated Fatty Acids; DFA = Desirable Fatty Acids (C18:0 + TUFA); H = horse, B = beef, M = mutton, BB = blesbok, SB = springbok, I, II and III = starter cultures I, II and III

135
Table 10
Percentage values of the batter (mg/100g meat) used in the production of the salami
Fatty acid H I B I M I BB I SB I H II B II M II BB II SB I H III B III M III BB III SBIII
16:0 21.5 28.0 28.5 25.5 23.2 21.5 28.4 31.1 27.6 21.0 22.1 29.9 30.1 28.4 21.9 18:0 2.2 2.9 2.9 2.5 2.6 2.5 2.8 3.1 2.8 2.6 2.4 3.2 3.2 2.8 2.4 20:0 11.6 15.3 14.5 14.9 11.9 10.9 15.1 16.4 14.5 10.4 10.9 16.1 15.1 16.2 11.4 22:0 42.7 47.0 48.7 48.4 44.8 42.6 46.8 44.0 46.5 44.3 41.9 45.4 45.7 45.0 42.5 24:0 14.1 0.2 0.1 0.1 10.5 14.6 0.2 0.1 0.1 14.5 15.0 0.0 0.1 0.1 13.8 16:1 n-7 0.0 0.1 0.1 0.1 0.1 0.1 0.1 0.1 0.1 0.1 0.1 0.0 0.1 0.1 0.0 18:1 n-9 0.6 1.0 0.1 1.8 0.7 0.7 1.0 0.1 1.6 0.8 0.7 1.0 0.1 1.3 1.5 20.1 n-9 0.3 0.3 0.3 0.2 0.3 0.3 0.4 0.2 0.2 0.3 0.3 0.3 0.3 0.3 0.3 22:1 n-9 1.9 1.1 0.1 1.0 1.6 1.7 1.0 0.2 0.8 1.7 1.7 0.9 0.2 0.9 1.6 24:1 n-9 1.6 0.3 0.2 0.7 0.9 1.5 0.5 0.2 0.9 0.9 1.6 0.4 0.2 0.7 0.9 18:2 n-6 5.5 5.3 2.2 1.8 4.5 5.4 6.9 1.7 5.2 4.5 4.5 3.1 1.2 4.6 5.3 18:3 n-3 0.3 0.3 1.3 1.3 0.2 0.3 0.2 1.3 0.3 0.2 0.3 0.2 1.5 0.3 0.2 18:3 n-6 0.2 0.4 0.8 0.7 0.6 0.2 0.2 0.7 0.7 0.5 0.2 0.3 1.0 0.7 0.5 20:2 n-6 0.5 0.4 0.4 0.7 0.4 0.6 0.4 0.6 0.4 0.5 0.3 0.4 0.8 0.5 0.3 20:3 n-3 0.1 0.2 0.2 0.2 0.1 0.2 0.3 0.2 0.2 0.2 0.1 0.1 0.5 0.2 0.2 20:4 n-6 0.0 0.1 0.1 0.1 0.0 0.0 0.1 0.1 0.1 0.0 0.0 0.0 0.1 0.1 0.1 20:5 0.5 0.3 0.1 0.6 0.5 0.5 0.3 0.0 0.5 0.4 0.7 0.3 0.4 0.4 0.6 22:2 0.1 0.1 0.1 0.1 0.1 0.1 0.1 0.1 0.1 0.1 0.1 0.1 0.1 0.1 0.1 22:5 0.3 0.3 0.5 0.5 0.2 0.3 0.3 0.6 0.6 0.3 0.4 0.2 0.0 0.4 0.3 22:6 0.2 0.2 0.5 0.3 0.1 0.3 0.2 0.5 0.4 0.2 0.2 0.1 0.5 0.2 0.2

136
Table 11
The fatty acid profile of the salami 23 days after initial processing
Fatty acid H I B I M I BB I SB I H II B II M II BB II SB I H III B III M III BB III SBIII
16:0 26.2 54.8 27.2 27.8 27.5 29.6 53.5 28.1 48.9 26.1 25.7 55.3 24.9 34.4 27.2 18:0 2.6 5.6 3.0 3.1 2.3 1.7 5.3 2.7 5.7 2.6 2.6 6.0 2.9 2.7 2.8 20:0 10.6 28.1 14.5 14.2 15.5 10.5 29.6 14.6 24.5 14.8 12.6 28.4 14.5 11.8 15.3 22:0 49.9 0.6 47.4 43.8 45.7 47.1 0.5 48.0 0.6 47.1 48.6 0.7 48.0 40.6 46.0 24:0 0.2 0.3 0.1 0.2 0.1 0.3 0.3 0.1 0.3 0.1 0.2 0.3 0.2 0.2 0.1 16:1 n-7 0.1 0.2 0.1 0.2 0.1 0.2 0.2 0.1 0.3 0.1 0.2 0.2 0.1 0.3 0.1 18:1 n-9 0.0 0.1 0.1 0.1 1.6 0.1 0.1 0.1 0.1 1.6 0.1 0.1 0.1 0.1 1.4 20.1 n-9 0.3 0.0 0.3 0.3 0.3 0.3 0.1 0.3 0.7 0.4 0.4 0.1 0.3 0.4 0.3 22:1 n-9 2.8 0.3 0.2 2.1 1.0 2.9 0.5 0.1 4.0 1.0 3.3 0.3 0.0 1.7 1.0 24:1 n-9 2.1 3.1 1.5 2.7 1.3 2.3 3.7 1.4 4.7 1.2 2.3 3.3 1.1 2.3 0.9 18:2 n-6 6.2 0.3 8.5 3.2 5.1 3.6 0.5 4.6 3.3 6.6 6.2 0.5 17.5 1.5 5.8 18:3 n-3 2.2 2.6 1.1 1.9 0.9 2.7 2.4 1.1 3.6 0.9 1.3 1.5 1.2 1.9 0.8 18:3 n-6 0.1 1.4 0.7 1.0 0.6 0.2 1.4 0.7 2.0 0.8 0.2 1.4 0.9 1.2 0.6 20:2 n-6 0.4 0.7 0.3 0.4 0.5 0.4 0.5 0.4 0.8 0.4 0.4 0.5 0.4 0.8 0.5 20:3 n-3 0.0 0.2 0.3 0.4 0.4 0.0 0.3 0.2 0.6 0.4 0.1 0.4 0.3 0.5 0.3 20:4 n-6 0.1 0.2 0.1 0.1 0.1 0.1 0.2 0.1 0.1 0.0 0.1 0.1 0.1 0.0 0.1 20:5 0.0 0.1 0.3 0.2 0.3 0.0 0.1 0.3 0.4 0.2 0.1 0.1 0.3 0.1 0.4 22:2 0.2 0.1 0.1 0.2 0.1 0.2 0.1 0.0 0.3 0.1 0.2 0.1 0.0 0.3 0.0 22:5 0.3 0.7 0.0 0.3 0.0 0.3 0.6 0.0 0.5 0.3 0.3 0.5 0.0 0.2 0.3 22:6 0.0 0.6 0.4 0.1 0.3 0.0 0.5 0.3 0.1 0.4 0.1 0.6 0.4 0.1 0.3

137
6a.5. Conclusion
The five species used in this trial, and the three different starter cultures, all responded
favourably to the conditions to which they were subjected. Differences were observed between
species and between starter cultures, this being indicative of the unique properties of the various
parameters. Greater differences were recorded between starter cultures I and II, and I and III.
This is not surprising, as starter cultures II and III were both L. plantarum, whilst starter culture I
was L. curvatus. According to Dicks et al. (2003), L. plantarum is a good starter culture,
functioning especially well in meat with high initial pH values. This investigation substantiates
this observation.
Of the species used, horsemeat responded most favourably to the expectations in the production
of traditional salami. Blesbok showed the least favourable characteristics, from the chemical
analysis, and fatty acid content point of view.
The species researched, especially the horse and springbok, would lend themselves well to the
production of a processed meat product such as salami. In this way, especially the springbok,
which is harvested seasonally, can provide a year-round supply of meat to the consumer. The
species researched are healthy species alternatives to other more conventional red meat species
products.
6a.6. Acknowledgements
I would hereby like to thank the following persons and/or companies for their assistance in this
trial: The technical staff at the Animal Science Department at Stellenbosch University for
assisting in the chemical analysis of research materials, as well as the company Roers, who made
available their smoking and maturation chambers for the purposes of this investigation.
6a.7. References
Acton, J.C., Dick, R.L. & Norris, E.L. (1977). Utilization of various carbohydrates in fermented
sausage. Journal of Food Science, 42, 174-178.
AOAC (1997). Official Methods of Analysis. 16th Edition. Arlington. Virginia. Association of
Official Analytical Chemists Inc. Washington, DC. USA.
Banskalieva, V. (2000). Fatty acid composition of goat muscles and fat depots: a review. Small
Ruminant Research, 37, 255-268.
Bothma, J du P. (2002). Some economics of wildlife ranching. Proceedings of a Symposium on
Game Ranch Planning and Management. Ed BL Penzhorn. Onderstepoort, South Africa.

138
Campbell-Platt, G. (1987). Fermentation foods of the World. 1st edition, Cambridge. Pp. 82-91.
Campbell-Platt, G. (1995). Fermented Foods – a world perspective. In: G. Campbell-Platt and
P.E. Cook, Editors, Fermented meats, Blackie Academic and Professional, Glasgow (1995),
pp. 39-52.
Clydesdale, F.M. (1991). Colour perception and food quality. Journal of Food Quality, 14, 61-
74.
Dainty, R. & Blom, H. (1995). In Fermented Meats, ed. P. Cook & G. Campbell-Platt.
Chapman & Hall, London, p. 176.
De Ketelaere, A., Demeyer, D., Vanderkerckhove, P. & Vervaeke, J. (1974). Stoichiometry of
carbohydrate fermentation during dry sausage ripening. Journal of Food Science, 39, 297-
300.
Dicks, L.M.T., Mellett, F.D. & Hoffman, L.C. (2003). Use of bacteriocin-producing starter
cultures of Lactobacillus plantarum and Lactobacillus curvatus in production of ostrich meat
salami. Meat Science, 66(3), 703-708.
Enser, M., Hallett, K.G., Hewett, B., Fursey, G.A.J., Wood, J.D. & Harrington, G. (1998). Fatty
acid content and composition of UK beef and calf muscle in relation to production systems
and implications for human nutrition. Meat Science, 49, 3, 329-341.
Girolami, A., Marsico, I., D’Andrea, G., Braghieri, A., Napolitano, F. & Cifuni, G.F. (2003).
Fatty acid profile, cholesterol content and tenderness of ostrich meat as influenced by age at
slaughter and muscle type. Meat Science, 64, 3, 309-315.
Gray, J.I., Gomaa, E.A. & Buckley, D.J. (1996). Oxidative quality and shelf-life of meats. Meat
Science, 43, S111.
Horbańczuk, J., Sales, J., Celeda, T., Konecka, A., Ziêba, G. & Kawka, P. (1998). Cholesterol
content and fatty acid composition of ostrich meat as influenced by subspecies. Meat
Science, 50, 385-388.
Johansson, G., Molly, K., Geenen, I. & Demeyer, D. (1996). Lipolysis and proteolysis in meat
fermentation. In M. Raemaekers, & D. Demeyer, Proceedings of a workshop at the 42nd
International Congress of Meat Science and Technology, (pp. 6-17) Lillehammer.
Kanner, J. (1994). Oxidative processes in meat and meat products: quality implications. Meat
Science, 36, 169-189.
Knapp, H.R. & Melly, M.A. (1986). Bactericidal effects of polyunsaturated fatty acids. Journal
of Infectious Diseases, 154, 84-94.
Lee, C.M., Trevino, B. & Chaiyawat, M. (1996). A simple and rapid solvent extraction method
for determining total lipids in fish tissue. Journal of the Association of Official Analytical
Chemists International, 79, 487-492.

139
Lücke, F-K. (1986). Microbiological processes in the manufacture of dry sausage and raw ham.
Fleischwirtschaft, 66, 1505-1509.
Melton, S.L. (1990). Effects of feeds on flavour of red meat: a review. Journal of Animal
Science, 68, 4421-4435.
Meynier, A., Novelli, E., Chizzolini, R., Zanardi, E. & Gandemer, G. (1999). Volatile
compounds of commercial Milano salami. Meat Science, 51, 175-183.
Raes, K., De Smet, S. & Demeyer, D. (2004). Effect of dietary fatty acids on incorporation of
long chain polyunsaturated fatty acids and conjugated linoleic acid in calf, beef and pork
meat: a review. Animal Food Science and Technology, 113, 199-221.
Ruiz-Barba, J.L, Piard J.C, & Jiménez-Díaz R. 1991. Plasmid profiles and curing of plasmids in
Lactobacillus plantarum strains isolated from green olive fermentations. Journal of
Applied.Bacteriology, 71, 417-421.
Ruiz de Huidobro, F., Miguel, E., Onega, E. & Blazquez, E. (2003). Changes in meat quality
characteristics of bovine meat during the first 6 days post mortem. Meat Science, 65:4,
1439-1446.
Sanz, B., Selgas, D., Parejo, I. & Ordonez, J.A. (1988). Characteristics of lactobacilli isolated
from dry fermented sausages. International Journal of Food Microbiology, 6(3), 199-205.
SAS (1990). SAS/STAT User’s Guide. Version 6. (4th Edition). Cary, NC: SAS Institute Inc.
Schillinger, U. & Lücke, F.K. (1987). Identification of lactobacilli from meat and meat products.
Food Microbiology, 4, 199-208.
Strange, E.D., Benedict, R.C., Gugger, R.E., Metzger, V.G. & Swift, C.E. (1974). Simplified
methodology for measuring meat colour. Journal of Food Science, 39, 988.
Talon, R., Walter, D. & Montel, M.C. (2000). Growth and effect of staphylococci and lactic acid
bacteria on unsaturated free fatty acids. Meat Science, 54, 41-47.
Tichelaar, H.Y., Smuts, C.M., van Stuiivenberg, M.E., Faber, M. & Benadé, A.J.S. (1998). The
fatty acid composition of rural school children with helminth infections. Asia Pacific Journal
Clinical Nutrition, 7, 196-197.
Townsend, W.E., Davis, C.E., Lyon, C.E. & Mescher, S.E. (1980). Effect of pork quality on
some chemical, physical, and processing properties of fermented dry sausage. Journal of
Food Science, 45, 622-626.
Van Reenen, C.A., Dicks, L.M.T., Chikindas, M.L. (1998). Isolation, purification and partial
characterization of plantaricin 423, a bacteriocin produced by Lactobacillus plantarum.
Journal of Applied Microbiology, 84, 1131-1137.
Wood, J.D. & Enser, M. (1997). Factors influencing fatty acids in meat and the role of
antioxidants in improving meat quality. British Journal of Nutrition, 78(1), S49-S60.

140
Chapter 6
Production of salami using meat from beef, mutton, horse, blesbok and springbok
b) Microbiological investigation
6b.1. Abstract
Salami was produced using meat from horse, beef, mutton, blesbok and springbok. Three
different starter cultures were used: Lactobacillus curvatus DF 38 (batch I), Lactobacillus
plantarum 423 (batch II), which produces plantarin 423, a bacteriocin, and a bacteriocin-negative
mutant of Lactobacillus plantarum, strain 423m, (batch III). Similar growth patterns were
recorded for L. plantarum 423, L. plantarum 423m and L. curvatus DF38 in MRS broth (Merck)
at 30oC, although batch I reached exponential growth earlier. Production of plantaricin 423 and
curvacin DF38 (400 and 200 AU/ml, respectively) was recorded after 3 hours. The activity of
plantaricin 423 increased from 400 to 3200AU/ml as the pH decreased from 6.3 to 4.2 during
logarithmic growth. The percentage of L. plantarum 423, compared with the total population of
microflora in mutton salami, remained constant (80-95% variation) during the entire
fermentation and maturation process. In horse, L. plantarum 423 was present at relatively low
cell numbers (55-50% on day 1 and before smoking), but increased to 70% after smoking, and
stabilised at 70-80% for the remaining fermentation period. In beef, batch II decreased slightly
during the first 5 days (from 95 to 70%), followed by an increase to 90%. In springbok salami,
batch II remained fairly stable at 80-90%. In blesbok salami, batch II slowly decreased during
the first three days from 88% to 70%, then increased to 92% after 12 days and stabilised for the
rest of the fermentation period. Similar results were recorded for batch I. The cell numbers of
batch I remained stable in all five salami types (between 75 and 95%). A slow decrease in cell
numbers was recorded in mutton, beef and springbok salami at 48 days (68, 70 and 80%,
respectively), followed by stabilisation. A difference in one log cycle was recorded between the
latter salami and a control sample (no bacteriocin present). Results recorded for horse salami did
not show a reduction in viable cell numbers of L. innocua F when compared to the control
sample.
Key words: L. plantarum and L. curvatus, salami

141
6b.2. Introduction
Lactic acid bacteria are found in a variety of natural and fermented food products (De Vuyst &
Vandamme, 1994). Many of these strains produce desirable organoleptic compounds and, in the
case of meat, facilitate cohesion of the meat particles and contribute to colour change (Zeuthen,
1995). The organic acids and other secondary metabolites do not only enhance the aroma of the
fermented meat, but also extend its shelf life (De Vuyst & Vandamme, 1994). Some lactic acid
bacteria produce bacteriocins, i.e. small peptides with antibacterial properties (Tagg et al., 1976;
Klaenhammer, 1988; De Vuyst & Vandamme, 1994). A few reports on bacteriocin-like peptides
with anti-mould and anti-yeast properties have also been published (Girafa, 1995; Atanassova et
al., 2003; Fazeli et al., 2004; Mäyrä-Mäkinen & Suomalainen, 1995).
The fermentation of beef, pork, turkey and ostrich meat by strains of Lactobacillus, Pediococcus,
and non-pathogenic Staphylococcus and Micrococcus spp. are well documented (Lücke, 1996;
Böhme et al., 1996; Dicks et al., 2004). In a previous study (Böhme et al., 1996), ostrich meat
salami was produced with a mixed starter culture of Lactobacillus curvatus, Lactobacillus sakei
and Micrococcus spp., with single cultures of Lactobacillus plantarum and Lactobacillus
curvatus (Dicks et al., 2004). In these two studies, the control of Listeria monocytogenes and
Listeria inocua was clearly demonstrated.
Listeria monocytogenes is a major concern in fermented meat (Aymerich et al., 1998; Johnson et
al., 1990); it is commonly found in cold-smoked products, usually in low numbers. Salting and
cold smoking, used to prevent the growth of spoilage and pathogenic organisms, have proved
ineffective in the control of Listeria monocytogenes (Guyer & Jemmi, 1991). Some strains
survive at pH values as low as 4.5 (Ahmad & Marth, 1990), grow between 1oC and 45oC
(Seeliger & Jones, 1986), in the presence of salts as high as 12%, (McClure et al., 1989), and at a
water activity between 0.93 and 0.96 (Guyer & Jemmi, 1991). Infection with Listeria
monocytogenes may lead to listeriosis, which is fatal to 20-30% of all patients diagnosed with the
disease (Rocourt, 1996). In this investigation, Listeria innocua F was used. According to Vaz-
Velho et al. (in press) this strain can be used to replace Listeria monocytogenes (due to
laboratory constraints), if the latter pathogen cannot be used.
Several bacteriocin-producing strains of Lactobacillus (Hugas et al., 1995; Böhme et al., 1996;
Dicks et al., 2004), Pediococcus (Bhunia et al., 1988; Harris et al., 1989), Leuconostoc (Coffey
et al., 1998), and Carnobacterium (Vaz-Velho et al., 2005; Duffes et al., 1999) have been used
as starter cultures in fermented meat.

142
In the present study, L. plantarum 423, isolated from sorghum beer (Van Reenen et al., 1998),
and L. curvatus DF38, isolated from Italian salami, were used as starter cultures in the
fermentation of beef, horse, mutton and game (blesbok and springbok) meat. Strain 423 produces
plantaricin 423, which is active against several Lactobacillus spp. and a few food spoilage
organisms, including Listeria monocytogenes (Van Reenen et al., 1998). Strain DF38 produces
the bacteriocin curvacin DF38, which has also proved to be effective in the preservation of
ostrich meat salami (Dicks et al., 2004).
Increasing consumer interest in non-traditional meat products motivates the investigation into the
processing potential of species such as horse, mutton, beef and certain species of game animals
(blesbok & springbok). Two of these species are not farmed intensively, and therefore can be
considered as wild game animals. Comparisons need to be drawn between these species and the
conventional red meat species such as beef and mutton with regards to the potential of utilising
these meat species in the commercial meat producing industry. Since the contribution of game
meat production (jerky hunters and game meat sales) constitutes 67.5% of the total income of the
game industry of South Africa (Bothma, 2002), research is required to investigate the possibility
of utilising these species in processed products. As many alternative red meat species are
harvested seasonally, traditional salami made from these species would ensure a continuous
supply of a form of this meat from these species.
The aim of this investigation was therefore to determine the performance and growth of L.
plantarum 423 and L. curvatus DF38 in the different meat types and evaluate plantaricin 423 and
curvacin DF38 as preservatives in these salami.
6b.3. Materials and methods
The sourcing of the ingredients and processing of the salamis prepared for this investigation are
discussed in detail in Chapter 6a.
6b.3.1. Starter cultures
Lactobacillus plantarum 423 (batch II) (Van Reenen et al., 1998), a mutant cured from plasmid
p423 and unable to produce plantaricin 423 (strain 423m) (batch III), and Lactobacillus curvatus
DF38 (batch I) (Dicks et al., 2004) were used as starter cultures. Curing of strain 423 from its
plasmid was undertaken by incubation in the presence of 0.125-8μg/ml novobiocin, according to
the method described by Ruiz-Barba et al. (1991). Listeria innocua strain F was used as indicator
organism. Strains 423, 423m and DF38 were cultured in MRS broth (Biolab, Biolab Diagnostics,

143
Midrand, South Africa). Listeria innocua was cultured in BHI broth (Biolab). Cultures were
stored at -80°C in MRS or BHI broth, supplemented with 15% (v/v) sterile glycerol.
Starter cultures were prepared by inoculating 2L MRS broth with 5% (v/v) of a 12 hour-old
culture. Incubation was for 24 hours at 30oC, without shaking. The cells were harvested (8000 x
g, 20min, 4oC), washed twice with sterile physiological salt (0.85% m/v NaCl) and resuspended
in 200 ml of the same solution. Cell suspensions were stored at 4°C until used.
6b.3.2. Growth of starter cultures and bacteriocin production
In vitro production of plantaricin 423 and curvacin DF38 was studied by growing L. plantarum
423, L. plantarum 423m and L. curvatus DF38, respectively, in 250 ml MRS broth at 30oC. At
specific time intervals, samples were taken to determine the optical density (OD 600) and pH of
the culture. At the same time, 10ml of the culture was centrifuged (8000 x g, 20min, 4oC,) and
the activity of the bacteriocins in the cell-free supernatants expressed in arbitrary units (AU)/ml,
as described by Todorov et al. (1999). Listeria innocua F was used as target organism.
6b.3.3. Monitoring of changes in bacterial cell numbers during fermentation
At selected time intervals (every three days), a salami of each animal species and starter culture
was removed from the maturation chamber and a section of meat aseptically sampled to represent
the outer and inner sections of the salami. A sample of 10g was suspended in 90ml sterile
physiological salt and blended for two minutes. The suspension was serially diluted and plated
onto MRS agar (Biolab), supplemented with Delvocid (Gist-Brocades B.V., Delft, The
Netherlands) to prevent yeast growth. The plates were incubated for 48 hours at 30oC and the
number of viable cells determined. All cell counts were conducted in triplicate.
6b.3.4. Determining the percentage bacteriocin-producing strains
Plates with colonies between 50 and 300 were overlaid with 10ml BHI agar (Biolab), inoculated
with 1x10⁶cfu Listeria innocua F per ml. The plates were incubated at 37oC for 24 hours.
Colonies surrounded with inhibition zones were counted separately and the bacteriocin-
producing cells calculated as a percentage of the total number of cells per gram meat.
6b.3.5. Growth of Listeria innocua F
A sample of salami (4.5g) was suspended in sterile physiological salt (4.5 ml) inoculated with
1.0ml Listeria innocua F (1x10⁶ cfu/ml) and blended for two minutes. The suspension was
incubated for 24 hours at 20oC. The samples were serially diluted, plated onto LEB and the

144
number of viable cells of Listeria innocua determined from colony counts after 48 hours of
incubation at 37oC.
6b.3.6. The effect of smoke on starter cultures
Strains 423, 423m and DF38 were cultured in 20 ml MRS broth (Biolab) for 24 hours at 30oC.
The cells were harvested (8000 x g, 20min, 4oC) and washed twice with sterile physiological
water. The cells were re-suspended in sterile physiological salt to approximately 106 cfu/ml. The
cell suspensions were subjected to smoke produced by commercial oak wood chips for one hour
at 20oC. The number of viable cells was determined before and after smoking. Cell suspensions
treated with filter-sterilised air served as controls.
6b.4. Results and discussion
6b.4.1. Growth production
Lactic acid bacteria’s major role in the production of salami is related to carbohydrate source
metabolism, which results in the acidification of the meat batter. This reaction leads to hygienic
stability, due to the reduced pH value, and results in the characteristic taste of the final product.
Meat proteins coagulate at low pH and water holding capacity is decreased, which aids the
drying process, affecting texture and firmness of the end product, as well as leading to the typical
red colour of salami by favouring the reaction of nitrogen monoxide with myoglobin (pH 5.4 to
5.5).
Similar growth patterns were recorded for L. plantarum 423, L. plantarum 423m and L. curvatus
DF38 in MRS broth (Merck) at 30oC (Fig. 1). All three strains started going into stationary
growth after approximately 12 hours. Production of plantaricin 423 and curvacin DF38 (400 and
200 AU/ml, respectively) was recorded after three hours (Fig. 1). After 12 hours, the bacteriocin
activity of the latter two strains had increased to 3 200 and 1 600 AU/ml respectively (Fig. 1).
The culture pH of all three strains decreased from 6.3 to 3.6 during the first 12 hours of
fermentation (Fig. 1). Similar results for bacterial growth, bacteriocin production and changes in
pH have been reported for the bacteriocin-producers Enterococcus faecium RZS C5 (Leroy & De
Vuyst, 2002), L. plantarum ST13BR (Todorov & Dicks, 2004), and L. pentosus ST151BR
(Todorov & Dicks, 2004).
The activity of plantaricin 423 increased from 400 to 3200 AU/ml, as the pH decreased from 6.3
to 4.2 (Fig. 1). This is most probably due to a less stringent binding of the bacteriocin to the cell
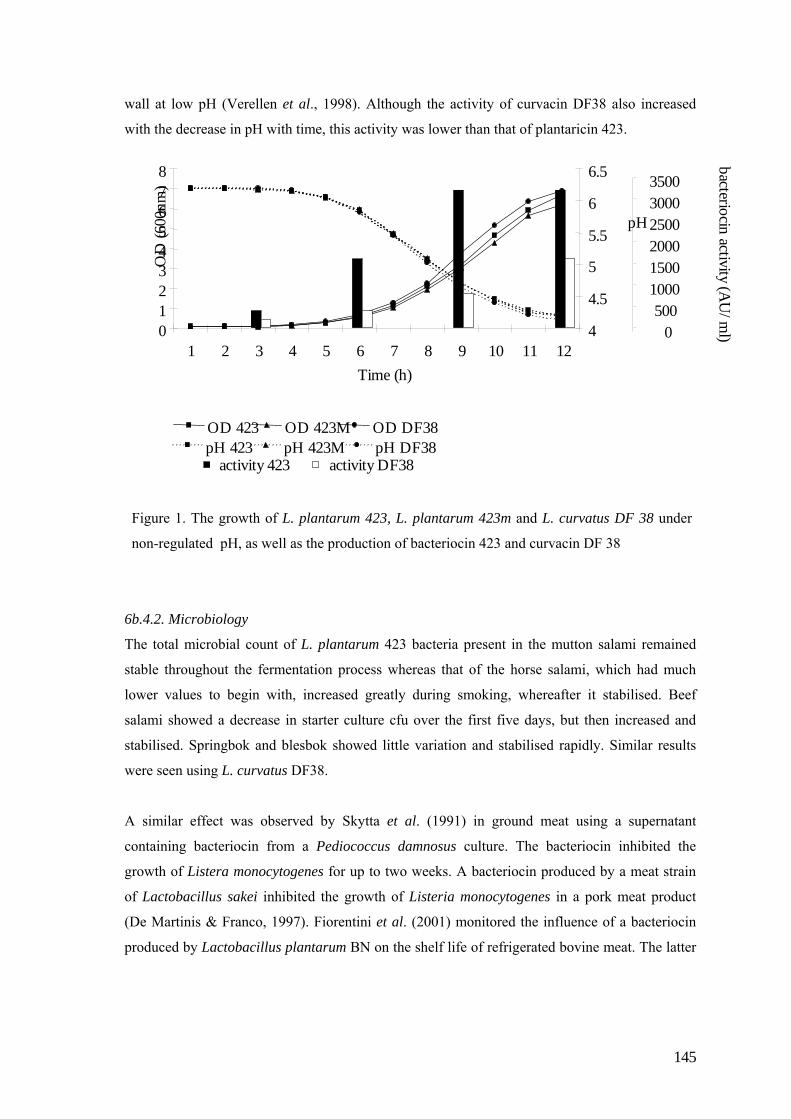
145
wall at low pH (Verellen et al., 1998). Although the activity of curvacin DF38 also increased
with the decrease in pH with time, this activity was lower than that of plantaricin 423.
Figure 1. The growth of L. plantarum 423, L. plantarum 423m and L. curvatus DF 38 under
non-regulated pH, as well as the production of bacteriocin 423 and curvacin DF 38
6b.4.2. Microbiology
The total microbial count of L. plantarum 423 bacteria present in the mutton salami remained
stable throughout the fermentation process whereas that of the horse salami, which had much
lower values to begin with, increased greatly during smoking, whereafter it stabilised. Beef
salami showed a decrease in starter culture cfu over the first five days, but then increased and
stabilised. Springbok and blesbok showed little variation and stabilised rapidly. Similar results
were seen using L. curvatus DF38.
A similar effect was observed by Skytta et al. (1991) in ground meat using a supernatant
containing bacteriocin from a Pediococcus damnosus culture. The bacteriocin inhibited the
growth of Listera monocytogenes for up to two weeks. A bacteriocin produced by a meat strain
of Lactobacillus sakei inhibited the growth of Listeria monocytogenes in a pork meat product
(De Martinis & Franco, 1997). Fiorentini et al. (2001) monitored the influence of a bacteriocin
produced by Lactobacillus plantarum BN on the shelf life of refrigerated bovine meat. The latter
012345678
1 2 3 4 5 6 7 8 9 10 11 12Time (h)
OD
(600
nm)
4
4.5
5
5.5
6
6.5
pH
OD 423 OD 423M OD DF38pH 423 pH 423M pH DF38
0500
100015002000250030003500
bacteriocin activity (AU
/ml)
activity 423 activity DF38

146
bacteriocin was also found to be effective against several pathogens in culture media (Skytta et
al., 1991; De Martinis & Franco, 1997; Fiorentini et al., 2001).
The number of viable cells recorded for the three starter cultures are shown in Figs. 2a, b and c.
Batch II (Fig. 2a) revealed a different pattern from that recorded for batches I and III (Figs. 2b
and c) in that the cell numbers declined over the first three days, followed by a rapid increase and
stabilisation after day eight. Batch I showed an increase in cell numbers, especially in the
blesbok salami on day 5, followed by stabilisation after day 12 (Fig. 2b). Batch III did not show a
drastic increase in cell numbers, although the cell numbers in the blesbok salami increased after
the third day. The other species did not show much of an increase and remained between 6.0 x
106 and 8.0 x 10⁶ cfu/g.
Figure 2a. Dynamics of the microbial population in salami during fermentation and maturation,
using starter culture II, Lactobacillus plantarum 423
Figure 2b. Dynamics of the microbial population in salami during fermentation and maturation,
using starter culture I, Lactobacillus curvates DF38
3.5
4.5
5.5
6.5
7.5
8.5
9.5
0 10 20 30 40 50 60 70 80
Time (days)
M1H1B1SB1BB1Lo
g 10
CFU
/g
3.5
4.5
5.5
6.5
7.5
8.5
9.5
0 10 20 30 40 50 60 70 80
Time (days)
Log
10 C
FU/g
M2
H2
B2
SB2
BB2

147
Figure 2c. Dynamics of the microbial population in salami during fermentation and maturation,
using starter culture III, Lactobacillus plantarum 423m
The percentage of L. plantarum 423, compared with the total population of microflora in mutton
salami, remained almost the same (80-95% variation) during the entire fermentation and
maturation process. In horse salami, L. plantarum 423 was present at relatively low cell numbers
(55-50% on day 1 and before smoking), but increased to 70% after smoking and stabilised to 70-
80% for the remaining fermentation period. In beef salami, strain 423 decreased slightly during
the first five days (from 95 to 70%), followed by an increase to 90%. In springbok salami, strain
423 remained fairly stable at 80-90%. In blesbok salami, strain 423 slowly decreased during the
first three days from 88% to 70%, increased to 92% after 12 days and stabilised for the rest of the
fermentation period (Fig. 3a).
Similar results were recorded for L. curvatus DF38. The cell numbers of strain DF38 remained
stable in all five salami types (between 75 and 95%). A slow decrease in cell numbers was
recorded in mutton, beef and springbok salami at 48 days (68, 70 and 80% respectively),
followed by stabilisation (Fig. 3b).
3.5
4.5
5.5
6.5
7.5
8.5
9.5
0 10 20 30 40 50 60 70 80
Time (days)
Log
10 C
FU/g
M3
H3
B3
SB3
BB3

148
Figure 3a. Percentage of the bacteriocin produced against L. inocua F as compared with the total
lactic acid microflora in batch II using starter culture Lactobacillus plantarum 423
Figure 3b. Percentage of the bacteriocin produced against L. inocua F as compared with the total
lactic acid microflora in batch I using starter culture Lactobacillus curvates DF38
40
50
60
70
80
90
100
0 10 20 30 40 50 60 70 80
Days
% b
acte
rioci
n pr
oduc
ing
M2%H2%B2%SB2%BB2%
40
50
60
70
80
90
100
0 10 20 30 40 50 60 70 80
Days
% b
acte
rioci
n pr
oduc
ing
M1%H1%B1%SB1%BB1%

149
Survival of Listeria innocua F in the different types of salami is indicated in Figs. 4a, b and c.
Mutton, beef, springbok and blesbok salami fermented with L. plantarum 423 inhibited the
growth of Listeria innocua F. A difference in one log cycle was recorded between the latter
salami and a control sample (no bacteriocin present). Results recorded for horse salami did not
show a reduction in viable cell numbers of Listeria innocua F, when compared with the control
sample.
Figure 4a. Survival of Listeria inocua F in salami of five species using starter culture
Lactobacillus plantarum 423 (batch II)
Figure 4b. Survival of Listeria inocua F in salami of five species using starter culture
Lactobacillus curvates DF38 (batch I)
3.5
4.5
5.5
6.5
7.5
8.5
5 days 34 days 72 days
Time
log
10(C
FU/m
l) BBSBHMBcontrol
3.5
4.5
5.5
6.5
7.5
8.5
5 days 34 days 72 days
Time
log
10(C
FU/m
l)
BBSBHMBcontrol

150
Figure 4c. Survival of Listeria inocua F in salami of five species using starter culture
Lactobacillus plantarum 423m (batch III)
Care should be taken with the incorporation of bacteriocins in meat, since intrinsic characteristics
may influence the activity of the bacteriocin. It has been shown that bacteriocins may be
inactivated by adsorption to meat and lipid particles (De Martinis & Franco, 1997).
In sausages fermented by bacteriocin-producing P. acidilactici JDI-23, P. acidilactici PAC 1.0
and L. plantarum MSC, the numbers of Listeria monocytogenes per gram dry sausages (pH >
5.0) were 1-2 log units lower than in the control sausages (Berry et al., 1990; Campanini et al.,
1993; Foegeding et al., 1992). Työppönen et al. (2003) reported that L. monocytogenes could be
reduced by 3 log cfu/g.
However, a reduction of Listeria innocua F growth in salami produced with L. plantarum 423m
suggests that inhibition was not only due to the presence of bacteriocins, but that it is a more
complex process, which may include lowering of pH. More research is required into the actual
functioning of different organisms when exposed to factors such as smoke, temperature and
relative humidity.
Treatment of cell suspensions of L. plantarum 423, L. plantarum 423m and L. curvatus DF38
with smoke yielded a reduction of one log cycle. The controls (without treatment or treated with
sterile-filtered air) showed no decrease in bacterial count. The reduction in total bacterial cell
numbers after smoking was also one log (Fig. 5). This antimicrobial activity of smoke as been
reported previously (Price & Schweigert, 1987).
3.5
4.5
5.5
6.5
7.5
8.5
5 days 34 days 72 days
Time
log
10 (C
FU/m
l) BBSBHMBcontrol

151
0.00
2.00
4.00
6.00
8.00
without treatment with smoke with air
log
(cfu
/ml)
Figure 5a. Dynamics of Lactobacillus plantarum 423 in the presence of smoke produced by
wood chips. The control was untreated and aerated with a 0.22μm filter (solid block = at 0 hours,
and open block = at 1 hour).
0.00
2.00
4.00
6.00
8.00
without treatment with smoke with air
log
(cfu
/ml)
Figure 5b. Dynamics of Lactobacillus curvatus DF 38 in the presence of smoke produced by
wood chips. The control was untreated and aerated with a 0.22μm filter (solid block = at 0 hours,
and open block = at 1 hour).
0.00
2.00
4.00
6.00
8.00
without treatment with smoke with air
log
(cfu
/ml)
Figure 5c. Dynamics of Lactobacillus plantarum 423m in the presence of smoke produced by
wood chips. The control was untreated and aerated with a 0.22μm filter (solid block = at 0 hours,
and open block = at 1 hour).

152
6b.5. Conclusion
From this trial it can be seen that the production of salami using these starter cultures is feasible.
All three starter cultures yielded similar acceptable results comparable to those of salami
produced elsewhere and cited in literature, for instance in the use of ostrich meat and similar
starter cultures (Dicks et al., 2004). All species used in this trial are acceptable in terms of
suitability, with only the blesbok salami meat showing differences when compared to the other
species. This might be due to the different chemical composition of this species (see Chapter 6a).
Therefore, the manufacture of a product such as salami would satisfy a year-round demand for
meat from these species seems viable.
However, more research is needed to determine the exact functioning of the reduction of Listeria
innocua F growth in salami produced with L. plantarum 423m.
6b.6. Acknowledgements
I would hereby like to thank Mr Todorov of the Department Microbiology at the University of
Stellenbosch for his assistance in executing the necessary microbiological tests required for this
investigation.
6b.7. References
Ahmad N & Marth E.H. (1990). Acid-injury of Listeria monocytogenes. Journal of Food
Protection, 53, 26-29.
Atanassova M., Choiset Y., Delgalarrondo M., Chobert J.-M., Dousset X., Ivanova I. & Haertle
T. (2003). Isolation and partial biochemical characterization of a proteinaceous anti-bacteria
and anti-yeast compound produced by Lactobacillus paracasei subsp. paracasei M3.
International Journal of Food Microbiology, 87, 63-73.
Aymerich M.T, Hugas M. & Monfort J.M. (1998). Bacteriocinogenic lactic acid bacteria
associated with meat products. International Journal of Food Science and Technology,, 4,
141-158.
Berry, M.P.S. (1990). A comparison of different wildlife production enterprises in the northern
Cape Province. South Africa. South African Journal of Wildlife resources, 16, 124-128.
Bhunia A.K., Johnson M.C.& Ray B. (1988). Purification, characterization, and antimicrobial
spectrum of a bacteriocin produced by Pediococcus acidilactici. Journal of Applied
Bacteriology, 62, 261-268.
Böhme H.M., Mellett F.D., Dicks L.M.T. & Basson D.S. (1996). Production of salami from
ostrich meat with strains of Lactobacillus sake, Lactobacillus curvates and Micrococcus sp.
Meat Science, 44, 173-180.
153
Bothma, J. du P. (2002). Some economics of wildlife ranching. Proceedings of a Symposium on
Game Ranch Planning and Management. Ed. BL. Penzhorn. Onderstepoort, South Africa.
Campanini M., Pedrazzoni I., Barbuti S. & Baldini P. (1993). Behaviour of Listeria
monocytogenes during the maturation of naturally and artificially contaminated salami: effect
of lactic-acid bacteria starter cultures. International Journal of Food Microbiology, 20, 169-
175.
Coffey A., Ryan M., Ross R P, Hill C., Arendt E. & Schwarz G. (1998). Use of a broad host-
range bacteriocin-producing Lactococcus lactis transconjugant as an alternative starter for
salami manufacture. International Journal of Food Microbiology, 43, 231-235.
De Martinis E.C.P. & Franco B.D.G.M. (1997). Inhibition of food borne pathogens by
bacteriocin producing Leuconostoc sp. and Lactobacillus sake isolated from linguica frescal.
Revista Microbiologia, 28, 284-287
De Vuyst L. & Vandamme E.J. (1994). Bacteriocins of lactic acid bacteria: Microbiology,
genetics and applications. London: Blackie Academic and Professional.
Dicks L.M.T., Mellett F.D. & Hoffman L.C. (2004). Use of bacteriocin-producing starter
cultures of Lactobacillus plantarum and Lactobacillus curvates in production of ostrich meat
salami. Meat Science, 66, 703-708.
Duffes F., Leroi F., Boyaval P. & Dousset X. (1999). Inhibition of Listeria monocytogenes by
Carnobacterium spp. strains in a simulated cold-smoked fish system stored at 4oC.
International Journal of Food Microbiology, 47, 33-42.
Fazeli M.R., Shahverdi A.R., Sedaghat B., Jamalifar H. & Samadi N. (2004). Sourdough-
isolated Lactobacillus fermentum as a potent anti-mould preservative of traditional Iranian
bread. European Food Research and Technology, 218:554-556.
Fiorentini A.M., Sant’Anna E.S., Porto A.C.S., Mazo J Z. & Franco B.D.G.M. (2001). Influence
of bacteriocins produced by Lactobacillus plantarum BN in the shelf life of refrigerated
bovine meat. Brazilian Journal of Microbiology, 32, 42-46.
Foegeding P., Thomas A., Pilkington D. & Klaenhammer T. (1992). Enhanced control of Listeria
monocytogenes by in situ produced pediocin during dry fermented sausage production.
Applied and Environmental Microbiology, 58, 884-890.
Girafa, G. (1995). Enterococcal bacteriocins: their potential as anti-Listeria factors in dairy
technology. Food Microbiology, 12, 291-299.
Guyer S. & Jemmi T. (1991). Behaviour of Listeria monocytogenes during fabrication and
storage of experimentally contaminated smoked salmon. Applied and Environmental
Microbiology, 57, 1523-1527.
Harris L.J., Daeschel M.A., Stiles M.E. & Klaenhammer T.R. (1989). Antimicrobial activity of
lactic acid bacteria against Listera monocytogenes. Journal of Food Protection, 52,384-387.

154
Hugas M., Garriga M., Aymerich M. & Monfort J. (1995). Inhibition of Listeria in dry
fermented sausages by the bacteriocinogenic Lactobacillus sakei CTC 494. Journal in
Applied Bacteriology, 79, 322-330.
Johnson J.L., Doyle M.P. & Cassens R.G. (1990). Listeria monocytogenes and other Listeria
spp. in meat products. Journal of Food Protection, 53, 81-91.
Klaenhammer T.R. (1988). Bacteriocins of lactic acid bacteria, Biochemistry, 70, 37-49.
Leroy, F. & De Vuyst, L. (2002). Bacteriocin production by Enterococcus faecium RZS C5 is
cell density limited and occurs in the very early growth phase. International. Journal of Food
Microbiology, 72, 155-164.
Lücke F.K. (1996). Microbial processes in the manufacture of dry sausages and raw ham.
Fleischwirtschaft, 66, 1505-1509.
Mäyrä-Mäkinen A. & Suomalainen T. (1995). Lactobacillus casei ssp. rhamnosus, bacterial
preparations comprising said strain, and use of said strain and preparations for the controlling
of yeast and moulds. Patent US5378458, http://fi.espacenet.com
Mäyrä-Mäkinen A. & Suomalainen T. (1996). Inhibition of clostridium with lactic acid bacteria.
Patent EP0698347. http://fi.espacenet.com
McClure P.J., Roberts T.A. & Oguru O. (1989). Comparison of the effects of sodium chloride,
pH and temperature on the growth of Listeria monocytogenes on gradient plate and in liquid
medium. Letters in Applied Microbiology, 9, 95-99.
Price, J.F. & B.S. Schweigert. The Science of Meat and Meat products. Westport, Conn, Food
and Nutrition Press, Inc., 1987.
Rocourt J. (1996). Risk factors for listeriosis. Food Control, 7, 195-202.
Ruiz-Barba JL, Piard JC, & Jiménez-Díaz R. (1991). Plasmid profiles and curing of plasmids in
Lactobacillus plantarum strains isolated from green olive fermentations. Journal of
Applied.Bacteriology. 71, 417-421.
Seeliger H.P. & Jones D. (1986). Genus Listeria Pirie 1940. Bergey’s manual of systematic
bacteriology (Vol. 2). London: Williams and Wilkins.
Skytta E., Hereijgers. & Mattila-Sandholm W. (1991). Broad-spectrum antibacterial activity of
Pediococcus damnosus and Pediococcus pentosaceus in minced meat. Food Microbiology, 8,
231-237.
Tagg J.R., Dajani A.S. & Wannamaker L.W. (1976). Bacteriocins of Gram-positive bacteria.
Bacteriological Reviews, 40:722-56.
Todorov, S.D., Dicks, L.M.T. (2004a). Effect of medium components on bacteriocin production
by Lactobacillus pentosus ST151BR, a strain isolated from beer produced by the
fermentation of maize, barley and soy flour. World Journal of Microbiological &
Biotechnology. 20, 643-650.

155
Todorov, S.D., Van Reenen, C.A. & Dicks, L.M.T. (2004). Optimization of bacteriocin
production by Lactobacillus plantarum ST13BR, a strain isolated from barley beer. The
Journal of General and Applied Microbiology. 50. (3) 149-157.
Työppönen S., Markkula A., Petäjä E., Suihko M. -L. & Mattila-Sandholm T. (2003). Survival
of Listera monocytogenes in North European type dry sausages fermented by bioprotective
meat starter culture. Food Control, 14, 181-185.
Van Reenen, C.A., Dicks, L.M.T., Chikindas, M.L. (1998). Isolation, purification and partial
characterization of plantaricin 423, a bacteriocin produced by Lactobacillus plantarum.
Journal of Applied Microbiology, 84, 1131-1137.
Vaz-Velho M., Todorov S., Ribeiro J. & Gibbs P. (2005). Growth control of Listeria innocua
2030c during processing and storage of cold-smoked salmon-trout by Carnobacterium
divergens V41 culture and supernatant. Food Contro ( in press).
Verellen T.L.J., Bruggeman G., Van Reenen C.A., Dicks L.M.T. & Vandamme E.J. (1998).
Fermentation optimisation of plantaricin 423, a bacteriocin produced by Lactobacillus
plantarum 423. Journal of Fermentation and Bioengineering. 86, 174-179.
Zeuthen P. (1995). Historical aspects of meat fermentations. In G. Campbell-Platt, & PE Cook
(Eds.), Fermented meats (pp. 53-68). Glasgow: Blackie Academic and Professional
Publishers.

156
Chapter 6
Production of salami from beef, mutton, horse, blesbok and springbok
c) Sensory evaluation
6c.1. Abstract
Fifteen batches of traditional salami, comprising five different species: horse, beef, mutton,
blesbok and springbok, and using three different starter cultures: Lactobacillus curvatus DF38,
(batch I), active bacteriocin producing Lactobacillus plantarum 423 (batch II) and then a mutant
variation of Lactobacillus plantarum 423m, which did not produce the bacteriocin (batch III),
were made. From analytical sensory evaluations it was concluded that the salami prepared using
starter culture resulted in end products with lower sensory qualities. These samples were rated
significantly lower (P≤0.05) for salami aroma, salami flavour and compact structure, and
significantly higher for sour meat aroma, sour meat flavour and oily mouth feel, than samples
prepared using starter cultures II and III. Salami prepared using horse, beef and springbok meat
gave samples with significantly higher mean values for salami aroma and salami flavour, and
significantly lower values(P≤0.05) for sour meat aroma, sour meat flavour, venisonlike flavour
and muttonlike flavour, whilst salami prepared using blesbok and mutton also resulted in end
products with lower sensory qualities and was perceived as significantly lower in salami flavour
(P≤0.05) and higher in venisonlike and muttonlike flavour respectively. The blesbok samples
were rated significantly higher (P≤0.05) in sour meat aroma, sour meat flavour and venisonlike
flavour than the rest of the samples. Consumer (n=97) sensory analysis of the salami was tested
for acceptability and degree of liking using a nine-point hedonic scale. The colours of the
springbok and mutton salami were rated significantly (P≤0.05) higher than those of the beef and
horse salami. The blesbok salami was rated significantly the lowest for colour compared to the
rest of the samples. The tastes of the springbok and horse salami were significantly (P≤0.05)
more acceptable than those of the beef and blesbok salami.
Keywords: consumer panel, fermented sausage, alternative red meat species, game meat,
sensory evaluation

157
6c.2. Introduction
As the harvesting of game animals such as blesbok and springbok is a seasonal occurrence,
products need to be developed that will provide a year-round supply of the meat. Salami is a
meat product with a long shelf life. Salami can be defined as a mixture of meat and fat particles,
NaCl, curing agents, and spices stuffed into either artificial or natural casings. Starter cultures are
often used to aid in the fermentation and maturation of the sausage.
Smoke is applied to many types of semi-dry sausage during the drying stage. Smoke application
to meat products affects the product with regards to flavour, colour, antimicrobial, and
antioxidant properties (Price & Schweigert, 1987). Although the historical purpose of smoking
meat was as a preservative, at present the importance of smoke is to rather provide flavour and
colour to the meat and meat products. Smoke is also applied to inhibit mould growth, by drying
the surface and by the deposition of antimicrobial phenols, carbonyls and low molecular weight
organic acids. Phenolic compounds decrease the extent of fat oxidation Smoking also affects the
organoleptic qualities of the sausage. The pyrolysis of cellulose and hemicellulose in the casing
of the fermenting sausage produces carbonyls (Price & Schweigert, 1987). These are important
in the development of colour of the meat when smoked, as the carbonyls are absorbed into the
surface of the sausage. The reaction between carbonyls and amino groups is similar to the
Maillard reaction, and is enhanced by the increase in temperature and dryness of the product
(Gilbert & Knowles, 1975).
After drying of the salami, the final product may contain up to 50% fat, which makes fat an
important ingredient of fermented sausage. This can lead to problems such as rancidity, which
has a direct effect on the shelf life of the product. There are many substances that can be added to
act as anti-oxidants, one of which is ascorbic acid, which may also act as a curing agent and in
stabilising the colour.
The most common culture starter species used in the fermentation of beef and pork sausages are
strains of Lactobacillus, Pediococcus, non-pathogenic Staphylococcus and Micrococcus (Lücke,
1986). The organic acids produced by these bacteria prevent the development of pathogenic
micro-organisms (Schillinger & Lücke, 1987), aid the cohesion of meat particles (Townsend et
al., 1980) and contribute to the colour change of fermented sausages. The major role of lactic
acid bacteria in the sausage is to produce organic acids, primarily lactic acid, from carbohydrates
(Campbell-Platt, 1987). This results in a decrease in pH and contributes to the retardation of the
development of undesirable micro-organisms.

158
Economic and social changes in civilisations have led to nutritional demands being transformed
and modified. It is becoming more acceptable to purchase alternative sources of red meat as
opposed to that of only the traditional species of meat-producing animals. Nowadays, there is an
ever-increasing demand by consumers for foods perceived as natural, fresh-tasting, healthy and
more nutritious, which is reflected in the results of a pan-European Union (EU) survey. This
study revealed that the five most important factors influencing consumer food choice were:
quality/freshness, price, taste, trying to eat healthy and family preferences (Lennarnäs et al.,
1997). One of the main factors that limit the quality and acceptability of meat and meat products
is lipid oxidation.
Increasing consumer interest in meat products (salami) containing non-traditional species such as
horse, beef, mutton and certain species of game animals (Blesbok and Springbok) motivated this
investigation. The latter two species are not being farmed intensively and are therefore
considered as wild game animals. Comparisons need to be drawn between the suitability of these
species and the conventional red meat species such as beef and mutton in the production of
traditional products such as salami.
6c.3. Materials and methods
The sourcing and processing of the salami prepared for this study are discussed in detail in
Chapter 6a and b.
6c.3.1. Sensory analysis by a trained panel
Descriptive sensory analyses were performed on the fifteen samples (AMSA, 1995). A trained,
six-member panel evaluated the meat in nine sessions for the following sensory attributes: salami
aroma, sour meat aroma, colour, texture, salami flavour, venisonlike flavour, muttonlike flavour,
sour meat flavour and oily mouthfeel, and structure, by means of an unstructured 100mm line
scale. Table 1 depicts the definitions of the attributes used in the sensory analysis. Roers Italian
salami was used as the standard – Roers being the commercial company where the salami for this
investigation were smoked and fermented, as well as being the suppliers of the spices used. The
panelists were seated in individual booths in a temperature- and light-controlled room, receiving
a set of five samples served in a complete randomised order. The samples were served at room
temperature on a plate covered with a lid. Crackers, apple slices and distilled water were used to
cleanse the palate between samplings.

159
Table 1
Verbal definitions of sensory attributes evaluated on the salami
Attribute Verbal definition Salami aroma Take a few short sniffs as soon as you remove the lid
0 = no salami aroma, 100 = strong salami aroma Sour meat aroma Aroma associated with meat where excessive amount of lactic acid has
been produced by bacteria 0 = no sour meat aroma, 100 = strong sour meat aroma
Colour The colour perceived in comparison with the standard (Roers Italian salami) 0 = light salami red colour, 100 = dark salami red colour
Texture Evaluate the size of the fat particles by looking at the samples 0 = fine, 100 = coarse
Salami flavour Taste the samples and evaluate the typical salami flavour 0 = no salami flavour, 100 = strong salami flavour
Venisonlike flavour
Taste the samples and evaluate the flavour as associated with venison 0 = no venisonlike flavour, 100 = prominent venisonlike flavour
Muttonlike flavour Taste the samples and evaluate the flavour as associated with mutton 0 = no muttonlike flavour, 100 = prominent muttonlike flavour
Sour meat flavour Taste the samples and evaluate the sour meat flavour as associated with meat where an excessive amount of lactic acid has been produced 0 = no sour meat flavour, 100 = prominent sour meat flavour
Oily mouthfeel Taste the samples and detect the oiliness as associated with liquid oil after 5 seconds 0 = no oily mouthfeel, 100 = prominent oily mouthfeel
Structure Taste the samples and evaluate the compactness 0 = Soft, open structure, 100 = solid, compact structure
6c.3.2. Statistical analysis
The experiment consisted of a 3x5 factorial design, with three starter cultures and five animal
species as factors. The samples were evaluated in nine sessions (three sessions per starter culture)
by six trained panelists, controlling individual starter cultures per session. The data were pooled
to test for the main effects of starter culture and animal species. Analysis of variance was
performed on the data. The Shapiro-Wilk test was performed to test for non-normality (Shapiro
& Wilk, 1965). In some cases, deviations from normality were the cause of one or two outliners,
which were removed before the final analysis. Student’s t-Least Significant Difference (LSD)
was calculated at the 5% significance level to compare treatment means (SAS, 1990).
6c.3.3. Sensory analysis by consumer panel
Consumer sensory analysis was performed on the five samples of salami prepared, using all five
species, but using only starter culture II (Lactobacillus plantarum 423). A nine-point hedonic
scale was used to test for degree of liking (AMSA, 1995). The questionnaire was completed by
97 target consumers (69% female; 31% male) between the ages of 18 and 55. Consumers were

160
asked to indicate their preference on the colour and the taste of the five samples of salami
presented to them. The samples were served at room temperature in glass ramekins coded with a
random three-digit code. The five samples were served in a completely randomised order. Due to
ethical considerations, the consumers were informed that one of the samples was produced using
horsemeat (this species is not readily consumed in South Africa).
The data was subjected to ranks before analysis of variance was performed. The Tukey’s
Studentized Range (LSD) Test was used to test for significant differences between treatments at
the 5% level (SAS, 1990).
6c.4. Results and discussion
As the salamis were all produced under the same environmental conditions, it was assumed that
any differences were due to the main effects of starter culture and species. Fermented meat
products such as salami have a flavour which is product-specific i.e. derived from the different
ingredients used in the production thereof. The formation of aroma and taste is based on
enzymatic, as well as non-enzymatic, reactions, both contributing to the wealth of components
which all together make up the characteristic flavour of a fermented meat product (Dainty &
Blom, 1995). The flavour is composed of volatiles with odour properties and non-volatiles with
taste and tactile properties, together with enhancers and synergists (Dwivedi, 1975).
Apart from the contribution of spices employed, flavour components are derived from protein,
fat and carbohydrate breakdown, a process dependent on endo- as well as exogenous enzyme
activities. Endogenous enzyme activities, together with the lactic acid produced by the starter
culture, are believed to be the most important factors in the development of the fermented meat
flavour (Blom et al., 1996). However, the contribution from non-lactic acid bacteria both to
colour and flavour formation is recognised, as demonstrated by the abundant use of non-acid-
producing starter cultures of the family Micrococcacae (Hammes & Knauf, 1994).
Salami has a specific image among consumers, related to its sensory attributes (macroscopic
appearance, texture, colour, flavour, taste, etc.). Its quality depends on the quality of the raw
materials used, as well as the technology of production (Meynier et al., 1999).
Formation of heme-containing pigments in fermented sausages follows the same pathways as in
other nitrite-containing meat products. However, the low pH-value has a strong influence,
initially destabilising myoglobin and increasing the rate of auto-oxidation to metmyoglobin

161
(Slinde & Nordal, 1978). The heme group is dissociated at the pH value of many fermented
sausages and colour is primarily attributed to nitrosomyoglobin (Slinde & Nordal, 1978).
6c.4.1. Sensory analysis by a trained panel
When comparing the starter cultures, significant differences (P≤0.05) were perceived for the
following attributes: salami aroma, sour meat aroma, salami flavour, sour meat flavour, oily
mouthfeel and structure. No significant difference (P>0.05) between the three starter cultures was
found for the attributes colour and venisonlike flavour. Mean values for the attributes evaluated
are given in Table 2.
Table 2
Mean values for the sensory attributes evaluated by starter culture using Tukey’s LSD (least
significant difference) (data pooled for species)
Attribute Starter culture I II III
Tukey’s LSD (5%)
Salami aroma 56.09b 64.06a 67.73a 3.914 Sour meat aroma 10.51a 4.25b 3.39b 2.698 Colour 71.68 70.40 70.60 2.004 Texture 63.94a 63.35a 58.80b 3.844 Salami flavour 53.40b 60.98a 63.31a 3.614 Venisonlike flavour 19.99 17.61 14.93 5.396 Muttonlike flavour 9.82a 6.52b 8.98ab 2.460 Sour meat flavour 8.49a 5.47b 4.49b 2.341 Oily mouthfeel 21.03a 15.42b 16.07b 2.804 Structure 59.22b 65.91a 67.02a 4.367
a-d values in the same row with different superscripts differ significantly (P≤0.05)
The horse salami had the highest mean value for colour, significantly higher than the rest of the
samples. This indicated that the horse salami was perceived as being the darkest, while the
mutton salami was rated the lowest (P≤0.05), indicating a light red salami colour. The mean
values for the colour of the blesbok and springbok samples were higher than that of the beef
sample, indicating that these samples were perceived to be darker than the beef sample. This is
correlated to the colour measured in Chapter 6a, where it was measured mechanically, not
visually. Thus, it can be assumed that horse and the game species have meat which is higher in
myoglobin than that of beef and mutton. This feature could be attributed to the levels of activity
the specific animals have experienced in their lives. Animals bred intensively will have lower

162
levels of activity than wild animals such as game, or sport animals such as a horse. This would
influence the muscle type and influence colour, as higher activity levels will require the muscle
to be able to carry more oxygen, thus pigment, and, therefore, appear darker.
The textures of the blesbok and beef samples were perceived as being significantly coarser than
the rest of the samples, while the mutton salami had the lowest mean value for texture, indicating
a finer product (P≤0.05). This could be due to the fact that mutton has a higher fat content
(Chapter 6a) than the other species used, and, therefore, its texture would be smoother and less
coarse. The duration of cutting of the raw materials during processing can also influence the size
of the meat and fat particles, as length of cutting will influence the size. When evaluating texture,
panelists were asked to look at the particle size of the fat in the salami. It was noted that the fat
particles in the mutton salami were much smaller and finer than in for instance the beef salami,
which was perceived to have a coarser texture. This would also correlate with the chemical
proximate composition of the raw meat used and its fat content, which would either facilitate or
make it more difficult to reach a specific particle size in the same time, i.e. the higher the fat
content in the raw meat, the less resistance there would be during the cutting process, and the
particle size would be reduced.
The springbok, horse and beef samples were rated significantly higher (P≤0.05) for salami
flavour than the blesbok and mutton samples were. The blesbok salami was rated significantly
higher for venisonlike flavour, as was the mutton sample rated significantly higher for muttonlike
flavour than the rest of the samples (P≤0.05). Consequently, samples which were perceived as
being more venisonlike or muttonlike, were rated lower for salami flavour. As salami contains
such high amounts of pork fat, it can be assumed that the taste of the fat would dilute the species
specific tastes and result in a more evenly distributed taste among the five different species used.
As these results show, this was not the case, and definite differences were perceived as to
venisonlike and muttonlike flavour, which would have an influence on consumer perception and
acceptance of these products.
The blesbok sample had the highest mean value for sour meat flavour, significantly higher than
the rest of the samples (P≤0.05). The beef and horse samples were rated lowest for this attribute
(P≤0.05). The sour meat flavour could be attributed to degree of rancidity in the salami.
Aldehydes are often reported to be responsible for the rancid odours of foods (Asghar et al.,
1988). Rancidity is also sometimes attributed to 2-methylbutanal (Arctander, 1994b). This
compound arises from amino acid catabolism. As the blesbok salami had the highest significant
rating for venisonlike flavour, as well as sour meat flavour, there could be a correlation between

163
the two. As the blesbok had a high protein content in the meat (Chapter 6a), there would be more
amino acid catabolism, and thus more 2-methylbutanal produced to give rise to rancidity
(Arctander, 1994b).
The panel perceived the horse salami to be significantly oilier than the other samples (P≤0.05),
while the springbok sample was also rated higher for oily mouthfeel than the mutton, blesbok
and beef samples. The latter three samples did not differ significantly for this attribute (P>0.05).
The beef salami was perceived as being solid and compact, significantly more so than the rest of
the samples (P≤0.05). The horse salami had the lowest mean value for this attribute, indicating
that the panel perceived this sample as being less compact and more soft and open. As seen in
Chapter 6, the salami containing horse meat did show a different pattern in pH as well as a water
activity decline, over the maturation period. This could result in the texture being less compact,
and more open and soft. These characteristics can be directly correlated to the fatty acid
composition, especially the SFA and UFA components of the different meats types (Chapter 6a).
The higher the SFA content, for instance in beef, the less fluid these fats would be compared to
those fats are less saturated at the same temperature, resulting in a more open, soft structure.
When comparing the means of the attributes of the pooled data (Table 2), it was observed that
starter culture I (L. curvatus) was rated significantly lower (P≤0.05) for salami aroma, salami
flavour and compact structure and significantly higher (P≤0.05) for sour meat aroma, sour meat
flavour and oily mouthfeel than starter cultures II and III (L. plantarum 423 and 423m). The
same starter culture also showed different rates of change when observing pH and water activity
decline (Chapter 6a and b). Therefore, it can be assumed that the different bacterial action of this
starter culture did have an influence on the sensory characteristics of the salami as well.
Table 3
Mean values for the sensory attributes evaluated by species using Tukey’s LSD (least significant
difference) (data pooled for starter culture)
Attribute Animal species Beef Blesbok Horse Mutton Springbok
Tukey’s LSD (5%)
Salami aroma 61.54b 63.65ab 67.17 a 55.04 c 65.48 ab 5.054 Sour meat aroma 3.21c 8.90 a 5.28 bc 5.20 bc 7.71 ab 3.482 Colour 64.74 c 74.02 b 83.28 a 58.44 d 73.54 b 2.588 Texture 73.86a 74.40 a 57.79 b 45.40 c 58.60 b 4.962 Salami flavour 63.19 a 53.43 b 64.17 a 49.26 b 66.26 a 4.666 Venisonlike flavour 15.74 b 31.53 a 10.50 b 15.25 b 14.49 b 6.966 Muttonlike flavour 3.46 b 4.20 b 1.17 b 36.30 a 1.54 b 3.184 Sour meat flavour 3.42 c 12.33 a 3.30 c 7.23 b 4.34 bc 3.023 Oily mouthfeel 12.89 c 14.11 c 27.51 a 14.17 c 19.14 b 3.621 Structure 75.96 a 65.96bc 44.28d 69.85 b 64.14 c 5.639
a-d values in the same row with different superscripts differ significantly (P≤0.05)

164
The mean values for the attributes evaluated (between species) are provided in Table 3. The
blesbok salami was rated the highest for sour meat aroma, while the beef sample was rated the
lowest. These differences were significant (P≤0.05). No significant difference in sour meat aroma
was found between the springbok, horse and mutton salami (P>0.05).
6c.4.2. Sensory analysis by consumer panel
When interpreting the colour of the salami, no correlation between the results of the analytical
sensory analysis and the consumer sensory analysis could be found. The analytical panel found
the colour of the horse salami to be significantly darker (P≤0.05) than the rest of the samples and
the mutton salami to be significantly lighter (P≤0.05) than the rest of the samples. This could be
attributed to the fact that the horse is not intensively farmed, whereas the mutton was probably
from a feedlot. When measured using a colour meter, the same trend was observed between the
different species of raw meat samples, as well as the salami produced from each one (Chapter
6a).
Significant differences (P≤0.05) in the acceptability of the colour of the five samples of salami
were found. Consumers found the colour of the springbok and mutton salami to be significantly
(P≤0.05) more acceptable than that of the beef and horse salami, which was again rated
significantly (P≤0.05) higher than the blesbok salami. Table 4 indicates the rank means for the
different salamis.
The mean values for the colour of the blesbok and springbok samples were higher than that of
the beef sample, indicating that these samples were perceived to be darker than the beef meat.
The absence of any correlation between the colour perception of the analytical panel and the
consumer panel could indicate that the consumers not only evaluated the colour of the product,
but also looked at the size and distribution of the fat particles. As the beef salami had higher L*
values (Chapter 6a) than blesbok and springbok, this observation could be substantiated.
However, as beef had a higher SFA content than springbok and blesbok, the fat contained in the
actual meat component of the salami would be firmer than that of the other two species, and
therefore less oily and lighter in colour to the eye of a consumer.

165
Table 4
Degree of liking of the five species of salami with regards to colour as well as taste as evaluated
by the consumer
Rank means (with actual means) for total group of consumers Treatment Colour Taste
Springbok 3.58a (7.23) a 3.75 a (7.06) a Mutton 3,48 a (6.98) a b 3.19 b (6.37) a Beef 2.93 b (6.32) b c 2.49 c (5.31) b Horse 2.77 b (5.80) c d 3.57 a b (6.89) a Blesbok 2.20 c (5.22) d 1.97 c (4.73) b LSD* 0.54 (0.71) 0.52 (0.75)
*LSD Least significant difference at the 5% level of significance a-d Values in the same column with different superscripts differ significantly (P≤0.05) The frequency scores in Tables 5 and 6 and Figs. 1 and 2 give an indication of the distribution of
preferences over the nine classes of the hedonic scale. According to Table 5, the colour of the
springbok salami was described as “Like moderately”, “Like very much” and “Like extremely”
by 75.3% of the total group of consumers, while 72.2% of the consumers used the same positive
classes to describe their opinion of the taste of the springbok salami (Table 6).
Table 5 Distribution of preference for colour of the salami of the total group of consumers (N=97)
Hedonic classes Springbok %
Mutton %
Beef %
Horse %
Blesbok %
Dislike extremely (1) 1.03 0.00 1.03 2.08 6.25 Dislike very much (2) 0.00 0.00 3.09 11.46 9.38 Dislike moderately (3) 3.09 4.17 4.12 7.29 8.33 Dislike slightly (4) 3.09 5.21 9.28 14.58 14.58 Neither like nor dislike (5) 6.19 7.29 9.28 7.29 11.46 Like slightly (6) 11.34 15.63 18.56 8.33 16.67 Like moderately (7) 21.65 21.88 27.84 13.54 13.54 Like very much (8) 34.02 31.25 18.56 25.00 16.67 Like extremely (9) 19.59 14.58 8.25 10.42 3.13
A significant number of consumers found the taste of the springbok and horse salami to be more
acceptable than that of the beef and blesbok salami. The results did not show a significant
difference between preference for horse and mutton salami. When an analytical panel evaluated
the same samples, the springbok, horse and beef samples were rated significantly higher (P≤0.05)
for salami flavour than the blesbok and mutton salami. The analytical panel rated the blesbok
sample significantly higher (P≤0.05) for venisonlike flavour and for sour meat flavour than the
rest of the samples (Table 6).

166
Table 6
Distribution of preference for taste of the salami of the total group of consumers (N=97)
Hedonic classes Springbok %
Mutton %
Beef %
Horse %
Blesbok %
Dislike extremely (1) 0.00 1.03 5.15 0.00 7.29 Dislike very much (2) 6.19 7.22 8.25 3.09 14.58 Dislike moderately (3) 0.00 5.15 10.31 3.09 10.42 Dislike slightly (4) 8.25 6.19 19.59 8.25 14.58 Neither like nor dislike (5) 5.15 5.15 4.12 4.12 10.42 Like slightly (6) 8.25 13.40 14.43 14.43 15.63 Like moderately (7) 14.43 28.87 19.59 19.59 17.71 Like very much (8) 35.05 23.71 11.34 30.93 7.29 Like extremely (9) 22.68 9.28 7.22 16.49 2.08
Figs. 1 and 2 indicate that the preference of the consumers was distributed over all nine classes of
the hedonic scale when evaluating the colour and taste of the blesbok salami. This shows that
38.6% of the 97 consumers tested, had a negative opinion of the colour (Fig. 1) of the blesbok
salami and 46.9% a negative attitude towards the taste (Fig. 2) of the blesbok salami.
0
5
10
15
20
25
30
35
40
Springbok Mutton Beef Horse Blesbok
Salami type
%
Dislike extremely
Dislike very much
Dislike moderately
Dislike slightly
Neither like nor dislike
Like slightly
Like moderately
Like very much
Like extremely
Figure
1. Distribution (%) of consumers preference for the colour of five types of salami

167
0
5
10
15
20
25
30
35
40
Springbok Mutton Beef Horse Blesbok
Salami type
%
Dislike extremely
Dislike very much
Dislike moderately
Dislike slightly
Neither like nor dislike
Like slightly
Like moderately
Like very much
Like extremely
Figure
2. Distribution (%) of consumers preference for the taste of five types of salami
6c.5. Conclusion
When comparing the mean values of the pooled data for the different types of salamis, the
samples could be divided into two groups, those acceptable for salami aroma, flavour and those
less acceptable for sour meat flavour and aroma. Salami prepared using horse, beef and
springbok meat provided samples with high mean values for salami aroma and salami flavour
and low values for sour meat aroma, sour meat flavour, and venisonlike flavour and muttonlike
flavour. The salami prepared with horsemeat was perceived as dark in colour but also as oily,
with a soft and open structure. The beef salami was perceived as having a solid, compact
structure.
The salami prepared using meat from beef, horse and springbok resulted in end products with a
higher sensory quality than the salami prepared using meat from blesbok and mutton. Although
the salami prepared with horsemeat was rated high for salami flavour and aroma, consumers
perceived the oily mouthfeel of this product negatively.
When comparing the overall rank means for the consumer evaluation of the salami, it is clear that
consumers preferred the colour and taste of the springbok salami. The salami prepared using
blesbok meat had the lowest rank means for colour and taste, indicating that this sample was
least preferred by this group of consumers. When an analytical panel evaluated the same salami

168
samples, the blesbok sample was rated highest for sour meat aroma, and sour meat and venison
like flavour.
The results from this investigation indicate that salami produced using the meat from alternative
species, such as horse, springbok and blesbok is possible and acceptable to the consumer. The
blesbok, also being a game animal, was expected to be regarded similarly to the springbok, but
salami produced using its meat was not as successful as that from springbok. It would seem as if
the blesbok was more rancid than the springbok. Research needs to be done on reducing rancidity
in the product using blesbok, as well as possibly using meat from less fat animals, to ensure a
leaner product, less inclined to oxidation over time.
6c.6. Acknowledgements
I would hereby like to thank the following persons and/or companies for their assistance in this
trial: The technical staff at the Animal Science Department, Microbiology Department and Food
Science Department at Stellenbosch University, who were all helpful in running tests and
evaluations, especially Mrs. Erika Moellich.
6c.7. References
AMSA (1995). Research guidelines for cookery, sensory evaluation and instrumental tenderness
measurements of fresh meat. National Livestock and Meat Board, Chicago.
Asghar, A., Gray, J.I., Buckley, D.J., Pearson, A.M., Booren, A.M. (1988). Perspective on
warmed-over flavour. Food Technology, 42, 102-108.
Arctander, S. (1994a). Perfume and flavour chemicals (Aroma chemical), Vol. I. Allured
Publishing Corporation, Carol Stream, IL, USA.
Arctander, S. (1994b). Perfume and flavour chemicals (Aroma chemical), Vol. II. Allured
Publishing Corporation, Carol Stream, IL, USA.
Blom, H., Hagen, B.F., Pedersen, B.O., Holck, A.L., Axelsson, L. & Naes, H. (1996).
Accelerated production of dry fermented sausage. Meat Science, 43, S229-S242.
Campbell-Platt, G. (1987). Fermentation foods of the World. 1st edition, Cambridge. Pp. 82-91.
Dainty, R. & Blom, H. (1995). In Fermented Meats, ed. P. Cook & Campbell-Platt. Chapman &
Hall, London, p. 176.
Dwivedi, B. K. (1975). Meat Flavour. CRC Critical Review of Food Technology, 5, 487.
Gilbert, J. & M.E. Knowles (1975). The chemistry of smoked foods: a review. Journal of Food
Technology 10 (3), 245-157.
Hammes, W. P. & Knauf, H.J. (1994). Starters in the processing of meat products. Meat
Science, 36, 155.

169
Lennarnäs. M., Fjellström, Becker, W., Giachetti, I. Schmitt, A., Remant de Winter, A.M. &
Kearney, M. (1997). European Journal of Clinical Nutrition, 51, S8.
Lücke, F-K. (1986). Microbiological processes in the manufacture of dry sausage and raw ham.
Fleischwirtschaft, 66, 1505-1509.
Meynier, A., Novelli, A., Chizzolini, R., Zanardi, E. & Gandener, G. (1999). Volatile
compounds of commercial Milano salami. Meat Science, 51, 175-183.
Price, J.F. & B.S. Schweigert. (1987). The Science of Meat and Meat products. Westport, Conn,
Food and Nutrition Press, Inc.,
SAS (1990). SAS/STAT User’s Guide. Version 6. (4th Edition). Cary, NC: SAS Institute Inc.
Schillinger, U. & Lücke, F.K. (1987). Identification of lactobacilli from meat and meat products.
Food Microbiology, 4, 199-208.
Shapiro, S. S. & Wilk, M. B. (1965). An analysis of variance test for normality (complete
samples). Biometrika, 52, 591-611.
Slinde E. & Nordal, J. (1978). Formation of nitrosoheme and heme in dry sausages using
catalase positive strains of lactic acid bacteria as starter cultures, p. G11: 1-G 11:6. In K.O.
Honikel (ed.), Proceedings of the 24th meeting of European Meat Research Work, vol. 2.
Bundesanstalt fuer Fleischforschung, Kulmbach, West Germany.
Townsend, W.E., Davis, C.E., Lyon, C.E. & Mescher, S.E. (1980). Effect of pork quality on
some chemical, physical, and processing properties of fermented dry sausage. Journal of
Food Science, 45, 622-626.

170
Chapter 7
General Conclusions
The global increase in the human population, resulting in an ever-growing demand for a larger
variety of nutritional, high quality food, especially for sources of protein, makes it necessary to
research alternatives to traditional red meat, such as aquatic mammals and various game species,
and to investigate their potential as alternative, safe food providers. However, knowledge needs
to be gained regarding the chemical composition and physical behaviour of these meat types
under certain conditions, to investigate whether they could become acceptable sources of protein
in the future. In conducting such studies, it is necessary to consider all the conventional,
consumer-driven criteria (palatability, safety, purity, affordability, availability) relevant to the
production of traditional red meat species, as they are equally valid for game species (Skinner,
1984). To date, however, only scant information is available on the chemical composition, and
the viability, of products made from these alternative red meat species in this quest to address the
increasing demand for healthy food products (Aidoo & Haworth, 1995). From the information
presently available, it is apparent that some red meat types, such as mutton, have a fat content of
between 20 and 25%, which is considered to be relatively high, while, game meat generally has a
much lower fat content (2-3g per 100 g meat). Certainly, this factor alone already makes game
meat an attractive alternative for the health-conscious consumer (Schönfeldt, 1993).
As most game and wild animal species, which are culled annually, are harvested in specifically
allocated hunting seasons only, there are times of the year where there is very little or no supply
to meet the demand for products made from these particular species. It is, therefore, of
fundamental importance to the supplier, as well as the consumer, that a product be made
available from such alternative red meats that is shelf-stable (pH <5.0 and aw <0.9), nutritious
and meets food safety standards all year round. This product should be acceptable to the
consumer in terms of appearance as well as taste.
Therefore, the primary aim of this study was to investigate the meat of the Cape fur seal, the
Grey seal and Minke whale, with regard to their chemical compositions and suitability as
potential human food sources. Apart from this, the study investigated the possibility of producing

171
salami from the meat of these aquatic mammals, using three different starter cultures. The
cultures used were primarily Lactobacillus curvatus and Lactobacillus plantarum. As a means of
comparison, the same investigation was repeated, using horse, beef, mutton, blesbok and
springbok meat, in order to evaluate the potential of similar products made from these animals.
Chemical analysis showed that both seal and whale meat are highly nutritious in terms of protein,
fat and moisture content, especially in terms of the fatty acid content. This can be ascribed to the
fact that their diet is primarily of aquatic origin, consisting mainly of fish and crustaceans. As the
meat of these animals is high in terms of polyunsaturated fatty acid contents, their predators, in
turn, will ingest these properties through their diet. A pilot study was undertaken to assess the
possibility of producing seal-only and seal-pork, seal-beef combinations, using various starter
cultures. It was found that it was possible to produce a product that conforms to all the
conventionally required quality standards mentioned above. Similar findings were made for the
meat of the Grey seal and the Minke whale, in products using pork lard and based on three
different starter cultures.
With regard to the meat of the terrestrial mammals used in this investigation, i.e. beef, mutton,
horse, blesbok and springbok, the horsemeat and meat of the springbok proved to be the
healthiest in terms of chemical proximate analysis, as well as fatty acid composition, using P:S
and n-6:n-3 ratios.
The production of salami in this study included the use of meat from all the above species. Use
was made of pork lard and three primary starter cultures. The two common starter culture strains
used in the study were Lactobacillus plantarum and Lactobacillus curvatus. Results showed that
salami made using Lactobacillus curvatus consistently had a higher pH after fermentation than
salami made from Lactobacillus plantarum. Products were also made with two other starter
cultures (Lactobacillus sakei and a mutant of Lactobacillus plantarum 423). These starter
cultures were used to test the efficiency of the antioxidant properties of the L. sakei, and the
effect of a negative-bacteriocin producing strain L. plantarum 423m. L. plantarum was more
suited in the production of traditional salami using the alternative species described above.
As salami is supposed to have a low pH value (<4.5) after fermentation, L. plantarum is more
reliable in decreasing the pH levels of the sausages to the desired value. As sensory evaluation is
such a crucial factor when regarding consumer perception of a product, it is important to note
that the sensory testing panel expressed a very definite negative attitude towards the salami made
using L. curvatus.

172
In respect of the terrestrial mammal species used in this trial, the horse and springbok were the
two species that reacted most favourably throughout, in terms of the various parameters
measured, namely: pH, fatty acid analysis and sensory analysis. The salami produced from the
meat of the blesbok was deemed unsatisfactory throughout, especially with regard to the sensory
analysis. As stated by Smit (2004), there are differences in these parameters within the species
with regard to sex, region and age. It is possible, therefore, that the blesbok used for this
investigation was not the most suitable in terms of the measured parameters so important in the
development of a shelf-stable product meant for human consumption.
In conclusion, it can therefore, be claimed that salami made from a wide range of animals,
including non-traditional terrestrial and aquatic meat-producing species, is a product that might
well be able to provide a year-round supply of these meat types in the future, irrespective of the
fact that most of these alternative red meat species are harvested in specified seasons only. In
addition, this study has shown that meat products manufactured from the meat of some non-
traditional animals, using particular starter cultures and under certain controlled conditions are
able to meet key requirements set by the meat industry and satisfy consumer perceptions and
needs.
In order to build on these research findings, and to expand on the knowledge gained in this pilot
study, follow-up investigations need to be undertaken, to control for variables, such as age,
geographic area and sex, in certain species, and to further fine-tune the process of using
particular kinds of meat, with particular starter cultures, under particular salami manufacturing
conditions.

173
References
Aidoo, K.E. & Haworth, R. J. P. (1995). Nutritional and chemical composition of farmed
venison. Journal of Human Nutrition and Dietetics, 8, 441-446.
Schönfeldt, H. (1993). Nutritional content of venison. Forum: the venison industry. Irene
Animal Production Institute: Agricultural Research Council, pp. 51-56.
Skinner, J.D. (1984). Selected species of ungulates for game farming in southern Africa. Acta
Zoologica Fennica, 172, 219-221.
Smit, K. (2004). Meat quality characteristics of blesbok (Damaliscus dorcas phillipsi) and red
hartebeest (Alcelaphus buselaphus caama) meat. MSc thesis, University of Stellenbosch,
South Africa.