productivity and efficiency of small and...
TRANSCRIPT

PRODUCTIVITY AND EFFICIENCY OF SMALL AND LARGE FARMS IN MOLDOVA
Zvi Lerman Department of Agricultural Economics and Management,
The Hebrew University of Jerusalem, Israel [email protected]
William R. Sutton Europe and Central Asia Region, The World Bank, Washington, DC
Selected Paper prepared for presentation at the American Agricultural Economics Association Annual Meeting, Long Beach, California, July 23-26, 2006
Copyright 2006 by Zvi Lerman and William R. Sutton. Readers may make verbatim copies of this document for non-commercial purposes by any means, provided that this copyright notice appears on all such copies.

PRODUCTIVITY AND EFFICIENCY OF SMALL AND LARGE FARMS IN MOLDOVA Zvi Lerman and Willian R. Sutton Abstract
The paper presents a comparative analysis of the productivity of small and large farms in
Moldova based primarily on cross-section data from three farm surveys conducted by the World
Bank and USAID in 2000 and 2003. The survey data are supplemented where feasible with time
series from official national-level statistics. We calculate partial land and labor productivity, total
factor productivity, and technical efficiency scores (using Stochastic Frontier and Data
Envelopment Analysis algorithms) for the two categories of small individual farms and large
corporate farms. Our results demonstrate with considerable confidence that small individual
farms in Moldova are more productive and more efficient than large corporate farms. This
finding is not restricted to Moldova, as a similar result has been obtained by other authors in
Russia (2005) and in the U.S. (2002), where a recent study has found that an increase of farm
size reduces, rather than increases, agricultural productivity. Policies encouraging a shift from
large corporate farms to smaller individual farms, rather than the reverse, can be expected to
produce beneficial results for Moldovan agriculture and the economy in general. The
government of Moldova should abandon its inherited preference for large-scale corporate farms
and concentrate on policies to improve the operating conditions for small individual farms. At
the very least, the government should ensure a level playing field for farms of all sizes and
organizational forms, and desist from biasing its policies in favor of large farms.
Keywords: family farms, corporate farms, comparative performance, technical efficiency, total
factor productivity, agrarian reforms, transition countries.
JEL classification: D24, J24, P27, P31, P32, Q12, Q15, R14
1
Introduction
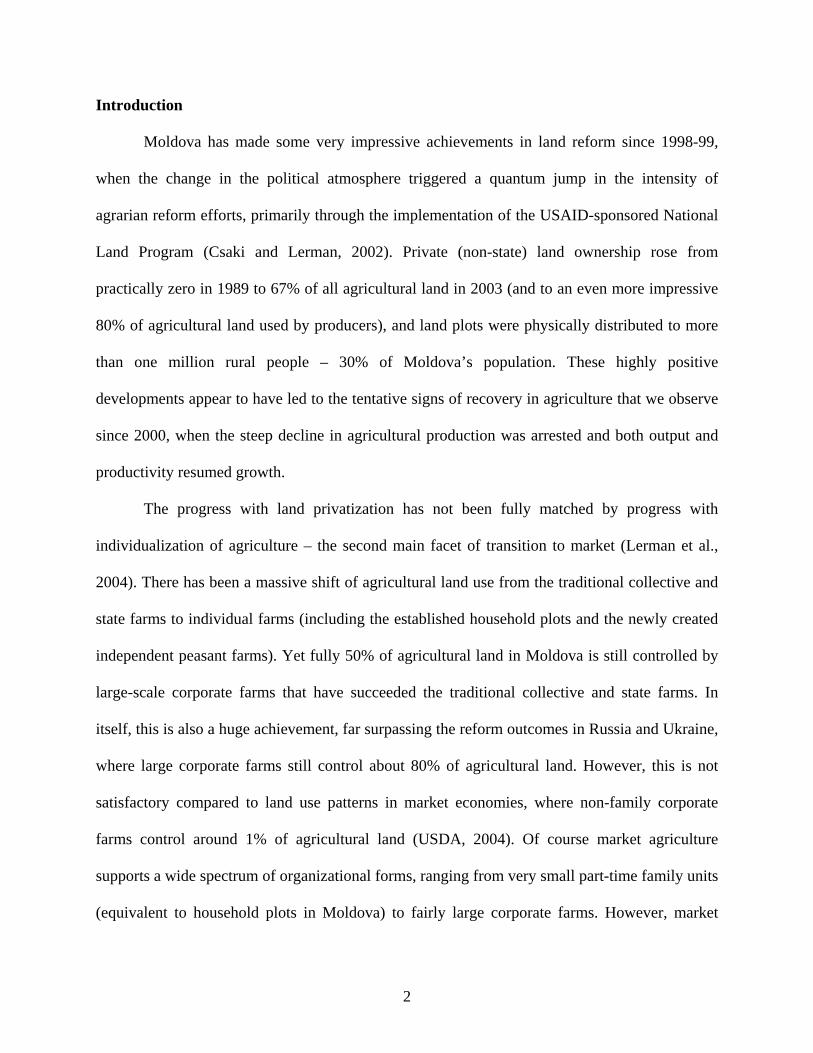
Moldova has made some very impressive achievements in land reform since 1998-99,
when the change in the political atmosphere triggered a quantum jump in the intensity of
agrarian reform efforts, primarily through the implementation of the USAID-sponsored National
Land Program (Csaki and Lerman, 2002). Private (non-state) land ownership rose from
practically zero in 1989 to 67% of all agricultural land in 2003 (and to an even more impressive
80% of agricultural land used by producers), and land plots were physically distributed to more
than one million rural people – 30% of Moldova’s population. These highly positive
developments appear to have led to the tentative signs of recovery in agriculture that we observe
since 2000, when the steep decline in agricultural production was arrested and both output and
productivity resumed growth.
The progress with land privatization has not been fully matched by progress with
individualization of agriculture – the second main facet of transition to market (Lerman et al.,
2004). There has been a massive shift of agricultural land use from the traditional collective and
state farms to individual farms (including the established household plots and the newly created
independent peasant farms). Yet fully 50% of agricultural land in Moldova is still controlled by
large-scale corporate farms that have succeeded the traditional collective and state farms. In
itself, this is also a huge achievement, far surpassing the reform outcomes in Russia and Ukraine,
where large corporate farms still control about 80% of agricultural land. However, this is not
satisfactory compared to land use patterns in market economies, where non-family corporate
farms control around 1% of agricultural land (USDA, 2004). Of course market agriculture
supports a wide spectrum of organizational forms, ranging from very small part-time family units
(equivalent to household plots in Moldova) to fairly large corporate farms. However, market
2

agriculture is predominantly agriculture of family farms, not corporate farms: corporate farms
are few in number and control a very small share of agricultural land. In Moldova, on the other
hand, a relatively small number of large corporate farms control a much greater share of
agricultural land than in established market economies, including the U.S., Canada, and the EU-
15. The high concentration of land in a small number of large corporate farms, which exist
alongside a very large number of small family farms, is a manifestation of the dual farm structure
that Moldova inherited from the Soviet era and still retains despite the generally successful
reforms (World Bank, 2006).
Although the decline of agricultural output in Moldova was arrested following the
implementation of the National Land Program in 2000, agriculture contracted again in 2003 due
to a combination of factors, including frost and drought, and has generally lagged behind other
sectors of the economy (World Bank, 2005). This, combined with the persistence of a dual farm
structure in the country, has generated renewed debate about the merits of land privatization and
farm restructuring. This debate took on new urgency with the coming to power of the
Communist Party in 2001. Ever since, driven by the Soviet-era ideology of economies of scale in
agriculture, the government of Moldova has pushed for the re-creation of large corporate farms –
agricultural enterprises – through consolidation (some would say “re-collectivization”) of
privatized individual holdings (MinAg, 2005).
The farm structure conundrum has two dimensions: (a) the organizational-form
dimension – individual farms versus corporate farms; and (b) the size dimension – small farms
versus large farms. With regard to organizational form, world experience clearly indicates that
agricultural production cooperatives are less efficient than individual farms and market-oriented
corporate farms. This is suggested by the well-developed theory of cooperatives, but more
3

importantly, this is proved by the almost total nonexistence of production cooperatives in market
economies (Lerman et al., 2004, p. 47). We cannot make the same statement regarding the
comparison of market-oriented corporate farms with family farms. The plain fact is that
corporate farms do exist in market economies (especially in the United States and Canada, much
less so in the EU-15), which proves that they are able to compete with individual farms.
Furthermore, the small numbers of corporate farms that do exist in market economies appear to
be even more efficient than individual farms as a group: in the United States, non-family
corporate farms control 1% of agricultural land and generate close to 7% of output (USDA,
2004). In Moldova, on the other hand, the relation is reversed: corporate farms control 50% of
land and generate less than 30% of output. Similarly, in Russia and Ukraine, corporate farms
generate 40% of output on 80% of agricultural land. This effectively implies that in many (if not
all) transition countries the large corporate farms use land less efficiently than the small
individual farms. The market economies have achieved an equilibrium farm structure, which
includes a mix of individual farms (the dominant majority) and corporate farms (a small
minority) determined by resource availability, managerial capacity, and personal preferences of
farmers and investors. A similar process can unfold in Moldova through the natural action of
market forces, without government intervention and programming.
The second dimension of the farm structure conundrum involves farm sizes – small
versus large. There is a voluminous literature on the farm-size effect in developed and
developing countries. The results are inconclusive: there is no clear proof that large farms are
more productive and more efficient than small farms. A similar result is generally obtained for
the transition countries, where studies do not detect any advantage of large corporate farms
4

relative to small individual farms (the best that can be said is that large farms are not inferior to
small farms in transition countries).
In this paper we present a comparative analysis of the productivity of small and large
farms in Moldova based primarily on three farm surveys conducted by the World Bank and
USAID in 2000 and 2003. The survey analysis is supplemented with official national-level
statistics, which are used to calculate productivity measures of individual and corporate farms.
Both nationally and in the available surveys, corporate farms are large farms, whereas individual
farms are small farms. The two dimensions of the farm structure conundrum actually overlap for
Moldova, and the organizational-form dichotomy in the national-level analysis is therefore a
good proxy for the farm-size dichotomy in the analysis of the surveys. For purposes of analysis
we calculate partial and total productivity measures (from both the surveys and the national
statistics), as well as technical efficiency scores (from survey data only). The national statistics
provide time-series data, whereas the surveys lend themselves to cross-sectional analysis.
Furthermore, the national statistics include both household plots and peasant farms in the
individual sector; in the analysis based on survey data we only used peasant farms as the
representatives of the small-farm individual sector, because the data collected for household
plots were inadequate for productivity calculations (on differences between household plots and
peasant farms in Moldova, see, e.g., Lerman et al., 1998).
Our analysis demonstrates with considerable confidence that small farms in Moldova are
more productive and more efficient than large farms. This finding is not restricted to Moldova, as
a similar result was obtained in Russia (Uzun, 2005). Moreover, a recent study of U.S. farms has
found that an increase of farm size reduces, rather than increases, agricultural productivity
(Ahearn et al., 2002). The accumulating empirical evidence thus lends support to the “counter-
5

intuitive stylized fact [that] generally family farmers use resources more efficiently than large,
commercial farmers who depend primarily on hired labor” (van den Brink et al., 2006, pp. 18-
19). The discussion of the farm-structure issue suggests that the government of Moldova should
abandon its preference for large-scale corporate farms and concentrate on improving the
operating conditions for small individual farms. At the very least, the government should ensure
a level playing field for farms of all sizes and organizational forms, and desist from biasing its
policies in favor of large farms.
Partial productivity measures: changes in productivity of land and labor over time
The continuing shift of agricultural land from corporate to individual farms has produced
a dramatic change in the structure of land use by agricultural producers. Particularly notable is
the shrinking share of former state and collective farms and a corresponding increase in land
used by the individual sector. Back in the early 1990s, corporate farms (collective and state
farms at that time) controlled 90% of the agricultural land used by agricultural producers
(excluding various components of reserve land). The individual sector (which consisted entirely
of household plots at that time) managed the remaining 10% (Table 1). Since 1999-2000, the
agricultural land resources are evenly divided between individual farms (which now consists of
household plots and peasant farms) and large-scale corporate farms, mostly new organizational
forms (joint stock companied, limited liability companies, agricultural cooperatives) with private
ownership of land and assets. Each sector now controls approximately 50% of agricultural land
(excluding reserve land).
The significant changes in land use have naturally affected the production structure of
agriculture (Table 1). While the output of large collective and corporate farms declined through
a complex combination of factors that included loss of land and disruption of the old economic
6

order, the output of the individual sector (including the traditional household plots and the newly
created peasant farms) has been growing (Figure 1). In 1998, the individual sector overtook the
collective and corporate sector by volume of production. As of 2003, the individual sector, with
about 50% of total agricultural land, produces more than 70% of agricultural output (Table 1).
Table 1. Land, output, and labor by farm type 1990-2003
Agricultural land used by farms* Gross Agricultural Output Employed in agriculture
‘000 ha Corporate,
% Individual,
%
Million lei, 2000
pricesCorporate,
%Individual,
%‘000
workers Corporate,
% Individual,
%1990 2545.8 91.5 8.5 17757 79.6 20.4 678 83.2 16.81991 2544.9 89.6 10.4 15749 76.3 23.7 743 75.8 24.21992 2509.5 89.0 11.0 13311 70.6 29.4 749 74.1 25.91993 2187.3 86.8 13.2 14647 62.5 37.5 730 73.1 26.91994 2196.6 82.7 17.3 11086 58.1 41.9 767 69.6 30.41995 2196.4 81.9 18.1 10293 55.5 44.5 771 69.2 30.81996 2191.3 78.9 21.1 9071 53.8 46.2 711 67.4 32.61997 2181.2 75.1 24.9 10108 54.4 45.6 684 63.2 36.81998 2177.8 70.1 29.9 8935 42.8 57.2 750 48.5 51.51999 2173.8 56.6 43.4 8184 32.8 67.2 731 33.8 66.22000 2146.7 47.1 52.9 7917 29.0 71.0 766 23.1 76.92001 2076.0 46.0 54.0 8427 28.0 72.0 764 20.7 79.32002 2069.2 48.7 51.3 8717 29.0 71.0 747 20.6 79.42003 2059.8 50.7 49.3 7535 25.0 75.0 583 23.9 76.1
*End of year data; land used by farms is agricultural land excluding the areas not allocated to agricultural producers (the state reserve, miscellaneous state lands, and part of the municipal land not allocated to agricultural producers). Source: Statistical Yearbook of Moldova, various years; Agriculture (2004).
The discrepant shares of the individual sector in land and output can be applied to
calculate the so-called relative productivity of individual farms. Taking the average sector
productivity as 1.0 (with 100% of land producing 100% of output), we obtain 1.4 (=70%/50%)
for the relative productivity of land used by individual farms, compared with only 0.6
(=30%/50%) for corporate farms. Already these rough calculations show that the small
individual farms use their land more productively than the large corporate farms. This
phenomenon has persisted since 1990, as the share of individual output has always been greater
than the share of land in individual tenure (Table 1).
7
1990 1992 1994 1996 1998 2000 2002 20040
2
4
6
8
10
12
14
16million lei, constant prices (2000)
CorporateIndividual
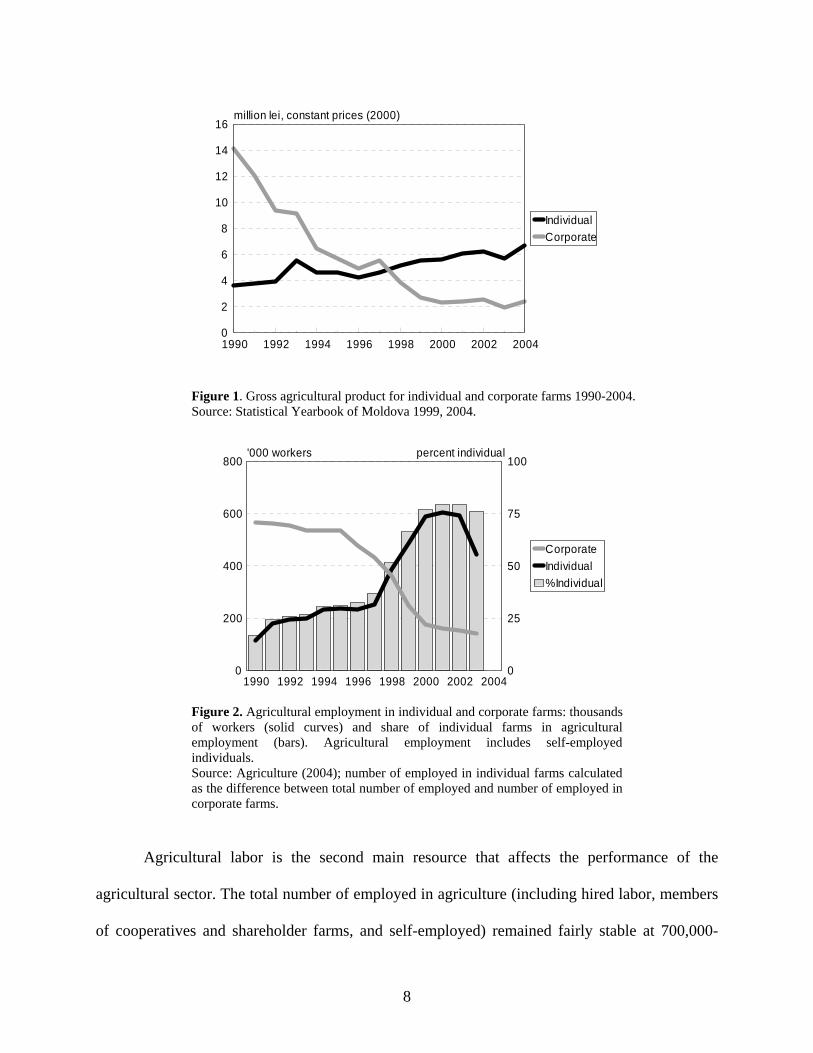
Figure 1. Gross agricultural product for individual and corporate farms 1990-2004. Source: Statistical Yearbook of Moldova 1999, 2004.
1990 1992 1994 1996 1998 2000 2002 20040
200
400
600
800'000 workers
0
25
50
75
100percent individual
CorporateIndividual%Individual
Figure 2. Agricultural employment in individual and corporate farms: thousands of workers (solid curves) and share of individual farms in agricultural employment (bars). Agricultural employment includes self-employed individuals. Source: Agriculture (2004); number of employed in individual farms calculated as the difference between total number of employed and number of employed in corporate farms.
Agricultural labor is the second main resource that affects the performance of the
agricultural sector. The total number of employed in agriculture (including hired labor, members
of cooperatives and shareholder farms, and self-employed) remained fairly stable at 700,000-
8

750,000 between 1990 and 2002 (Table 1; the reported number of employed in agriculture
dropped by more than 20% in 2003, but the reasons for this may be purely technical and
forthcoming revisions will hopefully clarify the situation). Yet the steady overall picture of
agricultural employment hides dramatic changes in farms of different types (Figure 2). The
agricultural labor in corporate farms decreased precipitously, especially between 1995 and 2001,
while that in individual farms increased sharply, especially after 1996, following the influx of
agricultural land into the individual sector. In farms of both types the changes in agricultural
labor use are strongly correlated with the changes in agricultural land use (the coefficient of
correlation is greater than 0.95 for 1990-2003). The opposite employment trends in corporate and
individual farms have resulted in a sharp increase of the share of agricultural labor in the
individual sector – from 25% in the early 1990s to more than 75% in 2000-2003 (Table 1).
Table 2. Land and labor productivity for corporate and individual farms
Productivity of land, ‘000 lei/ha Productivity of labor, ‘000 lei/worker Year Corporate Individual Corporate Individual1990 6.1 16.8 25.0 32.01991 5.3 14.2 21.3 20.81992 4.2 14.2 16.9 20.21993 4.8 18.9 17.2 27.91994 3.5 12.2 12.1 19.91995 3.2 11.5 10.7 19.31996 2.8 9.0 10.2 18.11997 3.4 8.5 12.7 18.31998 2.5 7.9 10.5 13.21999 2.2 5.8 10.9 11.42000 2.3 4.9 13.0 9.52001 2.5 5.4 14.9 10.02002 2.5 5.8 16.5 10.42003 1.8 5.5 13.5 12.7
Ave 1990-2003 3.4* 10.1* 14.7 17.4Ave 1990-1996 4.3* 13.8* 16.2* 22.6*Ave 1997-2003 2.4* 6.3* 13.1 12.2
*The differences between corporate and individual farms significant at p < 0.1 by both parametric and non-parametric tests. Source: Calculated from Table 1.
9

Given the value of agricultural output in constant 2000 lei (Table 1), we can calculate the
partial productivity of land and labor in absolute terms. The results are presented in Table 2. The
productivity of land and the productivity of labor decrease over time in both corporate and
individual farms. However, despite the similar trends, the productivity of individual farms is
generally higher than the productivity of corporate farms. The land productivity of individual
farms is higher in each and every year between 1990 and 2003. The labor productivity is higher
in 11 of the 14 years: the exception is the period 2000-2003, when the labor productivity of
corporate farms increased due to signs of increasing output (Figure 1) combined with continuing
decrease of labor in these years (Figure 2).
The land productivity of individual farms is statistically significantly higher than that of
corporate farms.1 The difference in labor productivity, on the other hand, is not statistically
significant, although the mean for the entire period 1990-2003 is observed to be higher for
individual farms (Table 2). In other transition countries we also observe that the productivity of
land is higher for individual farms, but the productivity of labor is actually higher for corporate
farms. For Moldova the labor productivity of corporate farms is indeed higher in the later
subperiod 1997-2003, but again the difference is not statistically significant (Table 2). Thus, the
two partial productivity measures for land and labor do not give a consistent picture: while land
productivity is definitely higher for individual farms, the results for labor productivity are
ambiguous (and furthermore do not fit the results in other transition countries, where labor
productivity is typically lower for individual farms). To resolve the ambiguity, we have to
1 A caveat is in order in connection with land productivity calculations: the land data cover all of Moldova, including the breakaway provinces in Transnistria (for the entire period 1990-2003); the agricultural output data are reported for Moldova without Transnistria (since 1995). To correct for the resulting bias, we recalculated the land productivity using the agricultural land series without Transnistria since 1995 (a rough approximation due to lack of authoritative data for Transnistria). The new results did not differ much from the original numbers: the mean productivity of land for corporate farms increased from 3.4 to 3.7, and that for individual farms from 10.1 to 10.2
10

calculate a measure of Total Factor Productivity (TFP), which is the ratio of total output
produced (in money units) to the total bundle of inputs used (also in money units). TFP
calculations using various databases are presented in the following sections.
A feature that clearly emerges from Table 2 is the general decline of agricultural
productivity since 1990 for farms of all types. The ongoing reforms have not produced
significant productivity improvements after the initial shock. The labor productivity index
constructed for the entire agricultural sector (combining both corporate and individual farms –
Figure 3, thick black curve) shows signs of slight recovery after 2000, when the reforms
accelerated during the implementation of the National Land Program. The labor productivity
index bottomed out in 2000 at 40% of 1990, increasing to 50% of 1990 in 2003.
1990 1992 1994 1996 1998 2000 20020
20
40
60
80
100
120
140
1601990=100
MoldovaCISCEE
Figure 3. Agricultural labor productivity for Moldova, CIS, and CEE (index numbers, percent of 1990). Source: Authors’ calculations based on Table 2 for Moldova, CIS (2004) for CIS, and country statistical yearbooks for CEE.
This pattern for Moldova is not different from the pattern observed for the CIS countries
as a group, where agricultural labor productivity declined up to 1998 and showed slight signs of
recovery thereafter (Figure 3, thick gray curve). However, the productivity loss in Moldova was
initially greater than the CIS average, largely due to the political deadlock that prevented
11

decisive implementation of reforms (Lerman et al., 1998; Csaki and Lerman, 2002), and the
recent recovery still lags behind the average, due in large part to undeveloped and distorted
markets for products and factors (World Bank, 2005). The productivity recovery in Moldova is
attributable to the reported gains in agricultural production since 2000 (see Table 1), which in
turn appear to be associated with the intensification of land reform after the introduction of NLP.
The behavior of agricultural labor productivity over time in Moldova and CIS is totally
different from what we observe in Central Eastern Europe, where labor productivity has been
increasing since 1994 through a combination of dramatic reduction of agricultural labor (at least
in some countries) and a certain (though by no means dramatic) growth in agricultural output
(Figure 3, thin black curve). In established market economies, such as the United States,
Canada, and the European Union, agricultural labor productivity shows a steady growth over
time as agricultural employment shrinks while output grows due to technological change. Thus,
USDA data show that between 1990 and 1999 agricultural labor in U.S. farms decreased by 4%
while agricultural output increased by 20%, producing an increase of 24% in agricultural labor
productivity (USDA, 2000). The CEE countries in fact matched this productivity growth during
the corresponding period, while CIS dropped to 60% of the 1990 level and Moldova’s
productivity declined even more to an abysmal 40% of the 1990 level (see Figure 3).
Total Factor Productivity
Partial productivity measures reflect the use of a single input (land or labor) taken
separately. They often present an ambiguous picture, as some farms may have a higher
productivity of land (say) and a lower productivity of labor. The ambiguity is resolved by
switching from partial productivity to total factor productivity (TFP), which is calculated as the
ratio of the value of output to the aggregated cost of input use. In the absence of market prices
12

for valuing the cost of inputs (such as the price of land), TFP can be determined by estimating a
production function and then using the estimated input coefficients as the weights to calculate the
value of the bundle of inputs (for an application of this approach to 12 former Soviet republics
see Lerman et al., 2003). The ratio of the observed output to the estimated bundle of inputs is the
TFP.2
In principle, the production function can be estimated for any number of observed inputs.
In practice, the physical data available for land and labor (area in hectares and number of
workers, respectively) are usually much more reliable and consistent than the accounting figures
for other factors of production, such as the cost of purchased inputs and the value of fixed assets.
Due to the technical considerations of data reliability and availability, we have decided to
estimate two-input production functions with land and labor as the explanatory variables for the
aggregated value of output. This decision may be justified by the observation that in the
economic productivity literature TFP is typically calculated assuming only two inputs: capital
and labor (see, e.g., Jones, 1998, pp. 41-42, or the extensive productivity tables for Canada and
the U.S. in CSLS, 2005). In our two-input production functions, land alone is a proxy for capital,
as we ignore the extremely deficient cost data on farm machinery and buildings.
TFP from national-level time-series data
The national-level database for Moldova contains information on the value of agricultural
output (in constant 2000 lei) and the quantities of two main inputs: agricultural land and
agricultural labor. These data are available for 14 years 1990-2003 for individual and corporate
farms separately (see Table 1). Unfortunately, our attempt to estimate a two-input production
function of Moldovan agriculture from these data has failed due to relative shortness of the time
2 For a calculation of TFP as the ratio of output to the accounting cost of inputs see Dudwick et al. (2005), Table 5.
13

series: the coefficients of both land and labor turned out statistically not significant. To get a
qualitative picture of TFP changes over time despite the failure of rigorous estimation, we
assumed a conventional Cobb-Douglas production function with stylized factor shares of 0.7 for
land and 0.3 for labor (these are the factor shares that we consistently obtained in production
functions estimated using various farm surveys in Moldova – see Table 6 below). Figure 4
presents the TFP results calculated with these land and labor weights. The TFP for individual
farms (household plots and peasant farms combined) is higher than for corporate farms over the
entire period 1990-2003. The respective means for 1990-2003 are 11.5 for individual farms and
4.4 for corporate farms (the difference is statistically significant).
1990 1992 1994 1996 1998 2000 20020
5
10
15
20
25lei output per unit aggregated inputs
IndividualCorporate
Figure 4. Total factor productivity for individual and corporate farms 1990-2003 (inputs from Table 1 aggregated using hypothetical factor shares of 0.7 to land and 0.3 to labor).
TFP from survey data
To substantiate these simulated findings, we turned to the data collected in various farm
surveys in Moldova since 2000. These surveys provide fairly large samples that allow reliable
estimation of production functions. Yet the survey data are inherently cross-sections observed at
14

a certain point in time and do not generate the time-series perspective afforded by national-level
statistics.
Extensive data for small and large farms are available from four surveys: the World Bank
2003 survey conducted as part of a cross-country study of reform impacts; the USAID-sponsored
survey of corporate farms carried out in 2003 by the Private Farmers’ Aid Program (PFAP); the
PFAP 2003 survey of individual farms; and the World Bank 2000 survey conducted as part of
the preparation work for the World Bank Moldova Agricultural Strategy. The sample structure of
the four surveys is shown in Table 3. General analyses of these surveys can be found in
Dudwick et al. (2005) for the WB 2003 survey, Muravschi et al. (2004) for the two PFAP 2003
surveys, and Lerman (2001) for the WB 2000 survey.
Table 3. Structure of recent farm surveys in Moldova Small individual farms Large corporate farms Large individual farms WB 2003 survey 176 22 -- PFAP 2003 surveys 1,166 521 -- WB 2000 survey 170 84 96
Table 4 presents the size characteristics and the partial productivity measures for small
and large farms in the four surveys. While the large farms as a group are substantially larger than
the small farms by all measures – output, land, and labor, the partial productivities show a mixed
picture:
(a) The partial productivity of land (output per hectare) is higher for small individual farms
than for large corporate farms;
(b) The partial productivity of labor (output per worker) is lower for small individual farms
than for large corporate farms;
15
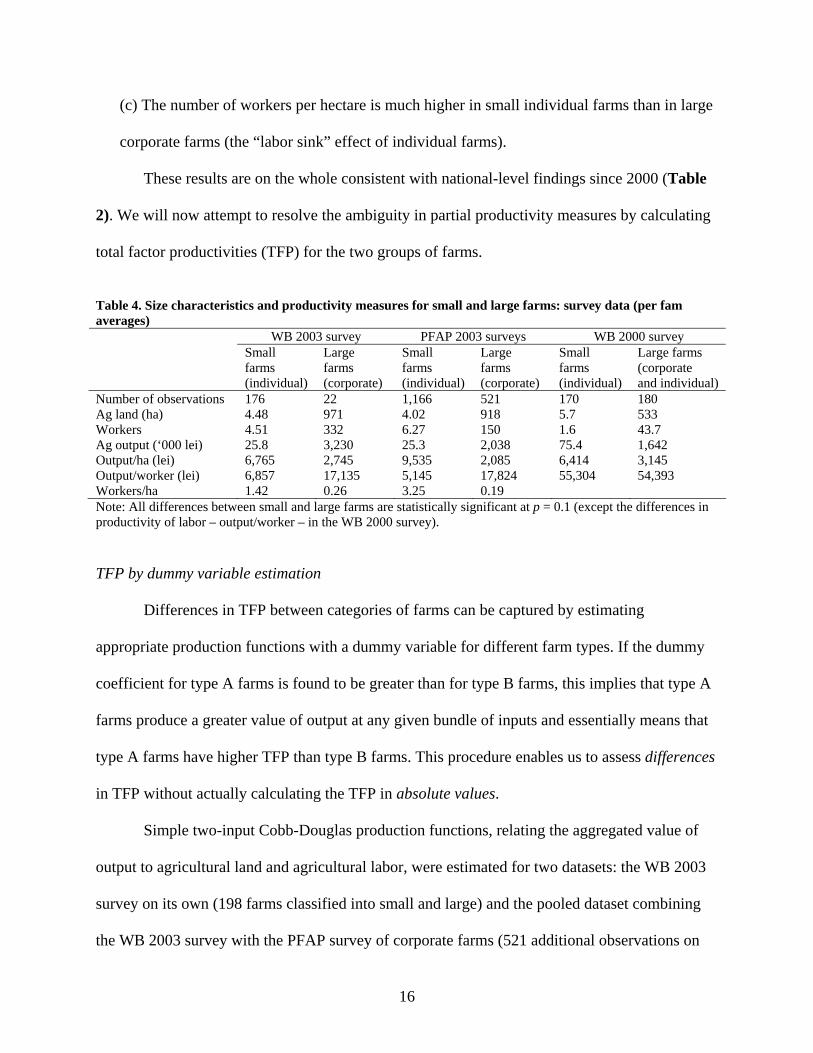
(c) The number of workers per hectare is much higher in small individual farms than in large
corporate farms (the “labor sink” effect of individual farms).
These results are on the whole consistent with national-level findings since 2000 (Table
2). We will now attempt to resolve the ambiguity in partial productivity measures by calculating
total factor productivities (TFP) for the two groups of farms.
Table 4. Size characteristics and productivity measures for small and large farms: survey data (per fam averages)
WB 2003 survey PFAP 2003 surveys WB 2000 survey Small farms (individual)
Large farms (corporate)
Small farms (individual)
Large farms (corporate)
Small farms (individual)
Large farms (corporate and individual)
Number of observations 176 22 1,166 521 170 180 Ag land (ha) 4.48 971 4.02 918 5.7 533 Workers 4.51 332 6.27 150 1.6 43.7 Ag output (‘000 lei) 25.8 3,230 25.3 2,038 75.4 1,642 Output/ha (lei) 6,765 2,745 9,535 2,085 6,414 3,145 Output/worker (lei) 6,857 17,135 5,145 17,824 55,304 54,393 Workers/ha 1.42 0.26 3.25 0.19 Note: All differences between small and large farms are statistically significant at p = 0.1 (except the differences in productivity of labor – output/worker – in the WB 2000 survey).
TFP by dummy variable estimation
Differences in TFP between categories of farms can be captured by estimating
appropriate production functions with a dummy variable for different farm types. If the dummy
coefficient for type A farms is found to be greater than for type B farms, this implies that type A
farms produce a greater value of output at any given bundle of inputs and essentially means that
type A farms have higher TFP than type B farms. This procedure enables us to assess differences
in TFP without actually calculating the TFP in absolute values.
Simple two-input Cobb-Douglas production functions, relating the aggregated value of
output to agricultural land and agricultural labor, were estimated for two datasets: the WB 2003
survey on its own (198 farms classified into small and large) and the pooled dataset combining
the WB 2003 survey with the PFAP survey of corporate farms (521 additional observations on
16
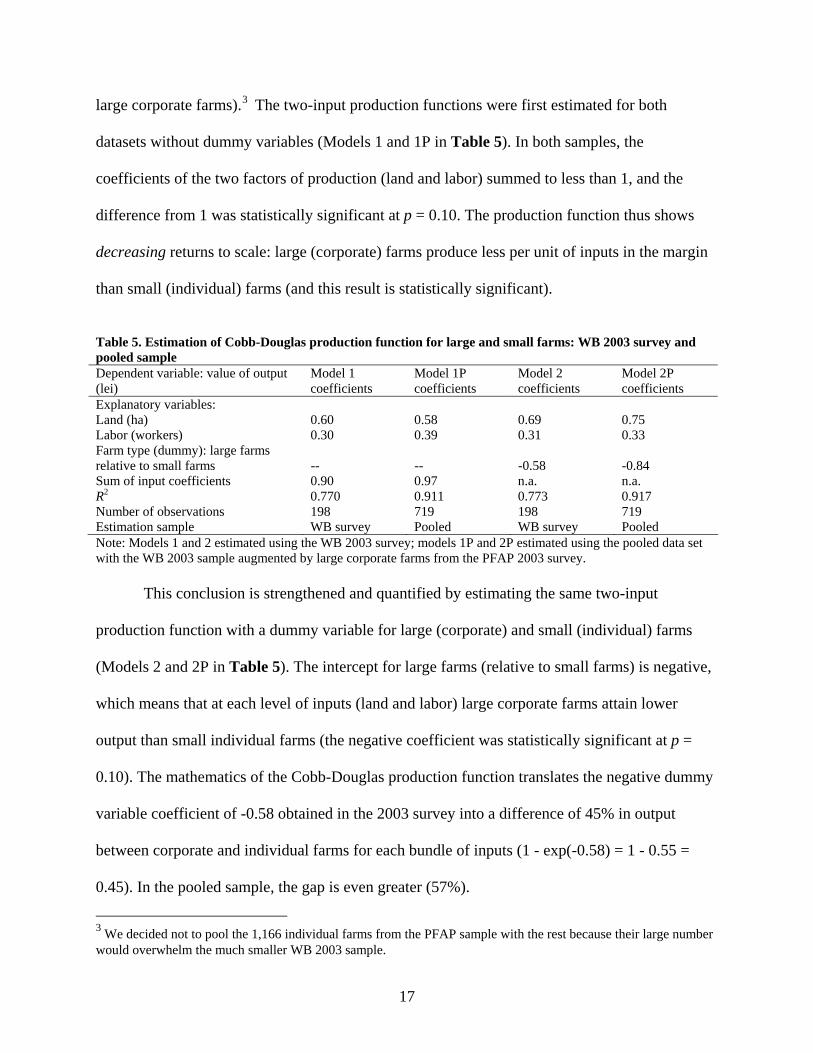
large corporate farms).3 The two-input production functions were first estimated for both
datasets without dummy variables (Models 1 and 1P in Table 5). In both samples, the
coefficients of the two factors of production (land and labor) summed to less than 1, and the
difference from 1 was statistically significant at p = 0.10. The production function thus shows
decreasing returns to scale: large (corporate) farms produce less per unit of inputs in the margin
than small (individual) farms (and this result is statistically significant).
Table 5. Estimation of Cobb-Douglas production function for large and small farms: WB 2003 survey and pooled sample Dependent variable: value of output (lei)
Model 1 coefficients
Model 1P coefficients
Model 2 coefficients
Model 2P coefficients
Explanatory variables: Land (ha) 0.60 0.58 0.69 0.75 Labor (workers) 0.30 0.39 0.31 0.33 Farm type (dummy): large farms relative to small farms -- -- -0.58 -0.84 Sum of input coefficients 0.90 0.97 n.a. n.a. R2 0.770 0.911 0.773 0.917 Number of observations 198 719 198 719 Estimation sample WB survey Pooled WB survey Pooled Note: Models 1 and 2 estimated using the WB 2003 survey; models 1P and 2P estimated using the pooled data set with the WB 2003 sample augmented by large corporate farms from the PFAP 2003 survey.
This conclusion is strengthened and quantified by estimating the same two-input
production function with a dummy variable for large (corporate) and small (individual) farms
(Models 2 and 2P in Table 5). The intercept for large farms (relative to small farms) is negative,
which means that at each level of inputs (land and labor) large corporate farms attain lower
output than small individual farms (the negative coefficient was statistically significant at p =
0.10). The mathematics of the Cobb-Douglas production function translates the negative dummy
variable coefficient of -0.58 obtained in the 2003 survey into a difference of 45% in output
between corporate and individual farms for each bundle of inputs (1 - exp(-0.58) = 1 - 0.55 =
0.45). In the pooled sample, the gap is even greater (57%).
3 We decided not to pool the 1,166 individual farms from the PFAP sample with the rest because their large number would overwhelm the much smaller WB 2003 sample.
17

TFP calculated from production function coefficients
The estimated production function provides another technique for calculating the TFP in
absolute values for different groups of farms. As we move from the small individual farms to the
large corporate farms, the agricultural product increases, but so do the land endowment and the
labor force per farm (see Table 4). The production function is a mathematical relationship that
links the increase in agricultural product with the increase in aggregated input use. The inputs are
aggregated by applying the weights (or factor shares) from the corresponding production
function to specific values of the inputs (land and labor in our case). TFP is calculated as the
aggregated value of output divided by the aggregated value of inputs. This differs from the
partial productivity measures, in which the aggregated value of output is divided by the quantity
of a single input (land or labor).
Table 6. Regression coefficients and input weights in production functions estimated for three samples WB 2003 survey
(n = 198) PFAP individual farms (n = 1166)
PFAP corporate farms (n = 521)
WB 2000 survey (n = 268)
Estimated coefficients: Ag land 0.6007 0.5247 0.8150 0.6305 Workers 0.2993 0.1865 0.3068 0.2325 Sum of coefficients 0.90 0.71 1.12 0.86 R2 0.77 0.40 0.84 0.89 Input weights: Ag land 0.67 0.74 0.73 0.73 Workers 0.33 0.26 0.27 0.27 Note: The estimated coefficients are significantly different from zero (p< 0.01); all sums of coefficients significantly different from 1.
Table 6 presents the estimated production function coefficients and the weights used in
TFP calculations. Two features are worth highlighting in these numbers. First, in all two-input
production functions agricultural land accounts for around 70% of input use and labor for 30%
(see the rows for input weights). These results have suggested the specific weights applied to the
synthetic analysis of national time series at the beginning of this section (see Figure 4). Second,
mixed samples of individual and corporate farms (WB 2003 and WB 2000) as well as the sample
18

of pure individual farms (PFAP) reveal decreasing returns to scale (the sum of the estimated
coefficients is significantly less than 1). Corporate farms taken on their own (PFAP sample of
corporate farms) reveal increasing returns to scale (the sum of the estimated coefficients is
significantly greater than 1). These issues are discussed in some detail in a separate section.
The mean TFP values obtained by this method for small and large farms in the four
survey samples are presented in Table 7. Small individual farms attain consistently higher TFPs
than large corporate farms. The differences are statistically significant at p = 0.1. The TFP
calculations thus eliminate the ambiguity between the partial productivities of land and labor for
large and small farms and conclusively show that small farms use their resources more
productively than large farms.4 This finding is consistent with the indication of decreasing
returns to scale in the production function.
Table 7. TFP (lei per aggregated unit of inputs) Small (individual) farms Large (corporate) farms Large-to-small ratio WB 2003 survey 6,426 4,745 0.74 PFAP surveys 7,424 3,464 0.47 WB 2000 survey 8,420 4,010 0.48
The conclusions of the dichotomized productivity comparison between large and small
farms in Table 7 were strengthened by checking the relationship of TFP with farm size as a
continuous variable (measured in hectares of agricultural land). This analysis was carried out
only in the WB 2000 survey, where individual farms span the entire spectrum of farm sizes and
are not limited to the small-size range as in the other samples (the corporate farms in this sample
are all in the large-size range). Consistently with the previous findings, TFP decreases with
4Our results for the relative TFP of corporate and individual farms are not too far from the result of Dudwick et al. (2005), who calculate the TFP as the ratio of the value of output to the accounting value of total costs. The TFP of corporate farms in Dudwick et al. (Table 5) is 30% of the TFP for individual farms, whereas our results give around 45% (by dummy variable analysis for the WB 2003 sample and by input aggregation for the pooled sample).
19

increasing farm size (see the regression line for TFP in Figure 5; the relationship is highly
significant). These results corroborate the previous conclusion of decreasing returns to scale.
Figure 5. Total factor productivity versus farm size for individual and corporate farms combined (WB 2000 survey).
Our findings that TFP is higher for small farms (Table 7) and that TFP decreases with
increasing farm size (Figure 5) are reinforced by recent results for U.S. farms (Ahearn et al.,
2002). Using a time series of labor and capital in U.S. farms for 1978-1996, the researchers have
found that an increase of farm size reduces, rather than increases, agricultural productivity (as
measured by TFP). “This suggests that on average a type of diseconomies of size is operating [in
U.S. farms]” (ibid., p. 20).
Technical Efficiency of Small and Large Farms
Our approach to total factor productivity has relied on estimation of production functions.
As noted above, production function estimation with farm-type dummy variables is a standard
econometric technique for assessing the relative productivity of different organizational forms
without actually calculating absolute TFP values. A different approach that focuses on farm
20

efficiency (rather than TFP) relies on the construction of production frontiers (not production
functions). A production frontier is the locus of efficient or “best attainable” points, i.e., points
where the maximum output is achieved for every given bundle of inputs, or alternatively every
given output is achieved by the consumption of a minimum bundle of inputs. The production-
frontier approach provides an alternative view that generally reinforces the TFP results obtained
with production functions.
The production frontier is constructed on the basis of available empirical data, and the
efficient points are the “best attainable” in the sample, not in the entire conceivable population.
Once the production frontier has been constructed, the technical efficiency of each farm is
calculated by measuring its relative distance from the frontier. Points on the frontier are
technically efficient; their distance from the frontier is 0, and their technical efficiency (TE)
score is 1. As the distance of a particular point from the frontier increases, its TE score decreases.
Each TE score is a number indicating the output that a particular farm achieves with a given
bundle of inputs as a fraction (or a percentage) achieved by the “best performer” with the same
bundle of inputs. For a comprehensive discussion of technical efficiency and the methodology of
constructing production frontiers see Coelli et al. (1998).
Stochastic Frontier Analysis (SFA) is a production frontier technique that is conceptually
close to production function estimation. This is an econometric method that starts with the
production function and then iteratively shifts it outward by a certain algorithm until a
production frontier is obtained. The actual observed points generally fall below the frontier (in
this sense they are inefficient). The deviation of the observed points from the frontier also
contains a random error component because of which some points may actually fall above the
estimated frontier (if the error component exceeds the estimated inefficiency component). The
21
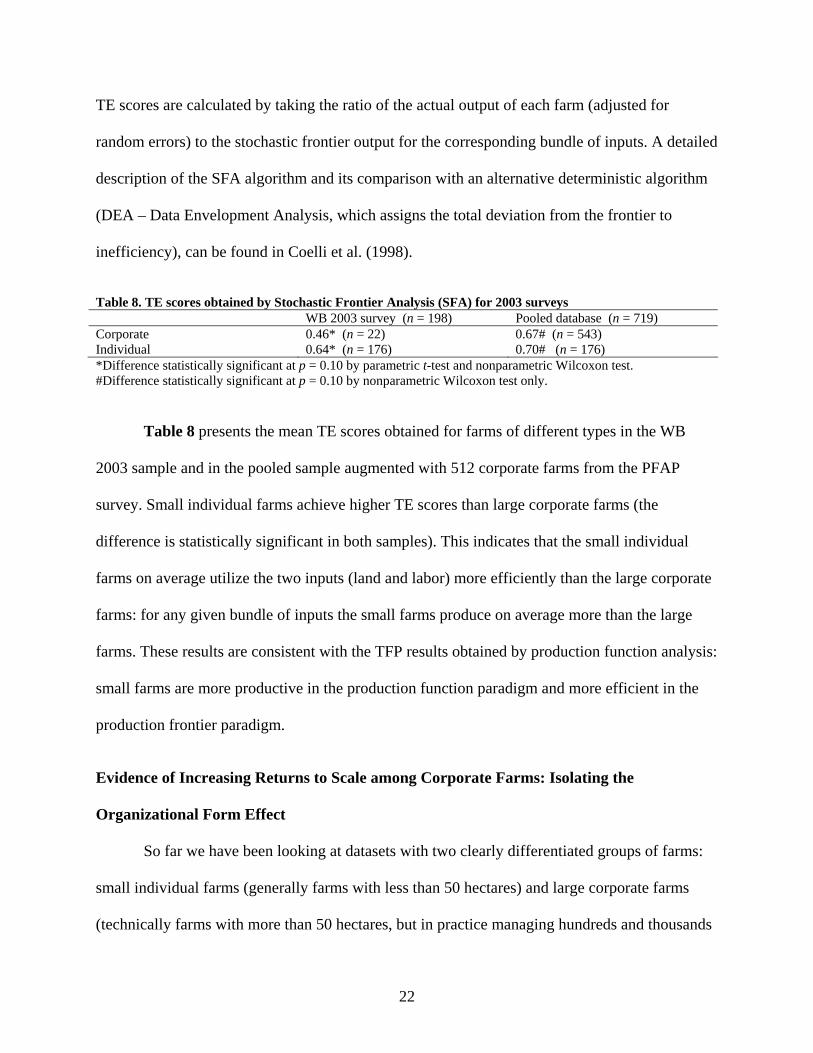
TE scores are calculated by taking the ratio of the actual output of each farm (adjusted for
random errors) to the stochastic frontier output for the corresponding bundle of inputs. A detailed
description of the SFA algorithm and its comparison with an alternative deterministic algorithm
(DEA – Data Envelopment Analysis, which assigns the total deviation from the frontier to
inefficiency), can be found in Coelli et al. (1998).
Table 8. TE scores obtained by Stochastic Frontier Analysis (SFA) for 2003 surveys WB 2003 survey (n = 198) Pooled database (n = 719) Corporate 0.46* (n = 22) 0.67# (n = 543) Individual 0.64* (n = 176) 0.70# (n = 176) *Difference statistically significant at p = 0.10 by parametric t-test and nonparametric Wilcoxon test. #Difference statistically significant at p = 0.10 by nonparametric Wilcoxon test only.
Table 8 presents the mean TE scores obtained for farms of different types in the WB
2003 sample and in the pooled sample augmented with 512 corporate farms from the PFAP
survey. Small individual farms achieve higher TE scores than large corporate farms (the
difference is statistically significant in both samples). This indicates that the small individual
farms on average utilize the two inputs (land and labor) more efficiently than the large corporate
farms: for any given bundle of inputs the small farms produce on average more than the large
farms. These results are consistent with the TFP results obtained by production function analysis:
small farms are more productive in the production function paradigm and more efficient in the
production frontier paradigm.
Evidence of Increasing Returns to Scale among Corporate Farms: Isolating the
Organizational Form Effect
So far we have been looking at datasets with two clearly differentiated groups of farms:
small individual farms (generally farms with less than 50 hectares) and large corporate farms
(technically farms with more than 50 hectares, but in practice managing hundreds and thousands
22

of hectares on average). Given this dichotomy, we obtained evidence of decreasing returns to
scale and clear proof of higher total factor productivity in small individual farms.
The PFAP database taken on its own (without pooling with the WB 2003 survey)
provides 512 observations of large corporate farms only. The coefficients of the production
function estimated for this sample of large corporate farms are 0.81 for land and 0.31 for labor.
They sum to more than 1, and the difference from 1 is statistically significant at p = 0.01 (see
Table 6). The production function thus shows increasing returns to scale within the sample of
corporate farms. This result is consistent with previous findings for corporate farms in Russia,
where several researchers have observed increasing returns to scale specifically among corporate
farms (Uzun, 2002; Epshtein, 2003, 2005).
The TFP calculations were repeated for the PFAP sample of corporate farms considered
on its own. Here, we keep the farm type constant (corporate farms) and examine the TFP scores
as a function of farm size. The coefficient of correlation between the TFP scores of corporate
farms and land (taken as a continuous variable) is positive (0.2) and statistically significant at p <
0.01. This implies that for corporate farms TFP indeed increases with farm size.
To visualize the results more clearly, we additionally classified the 521 corporate farms
in the PFAP survey into three size groups (up to 500 hectares, between 500 and 2000 hectares,
more than 2000 hectares). The productivity of land clearly increases with farm size, whereas the
productivity of labor does not. Total factor productivity calculated by aggregating land and labor
with appropriate weights from the production function shows a definite increase with farm size
(all pairwise differences in TFP are statistically significant by standard simultaneous comparison
tests). This behavior is illustrated in Table 9.
23

The TFP results were verified by carrying out Stochastic Frontier Analysis for the PFAP
sample of corporate farms and testing for significant differences in TE scores across the three
size categories. The mean TE scores by size group are presented in Table 10. The lowest TE
score is observed for the smallest corporate farms with up to 500 hectares; the highest TE score
is observed for the largest corporate farms with more than 2,000 hectares. These results were
found to be highly significant by standard simultaneous pairwise-comparison methods.
Table 9. TFP of corporate farms by land size categories: PFAP 2003 survey
<500 ha
(1) 500-2000 ha
(2) >2000 ha
(3) Number of farms 238 225 58Land productivity (output/ha, lei) 1,927 2,162 2,430Labor productivity (output/worker, lei) 18,660 16,580 19,219TFP (lei per unit of aggregated inputs) 3,162 3,603 4,167 Table 10. TE scores obtained by Stochastic Frontier Analysis for the PFAP sample of corporate farms (n= 521) Farm size category SFA scores <500 ha 0.64* 500-2000 ha 0.76* >2000 ha 0.84*
On balance, we do find evidence of increasing returns to scale in the homogeneous
sample of corporate farms, while farms in a larger mixed sample of different types (both
individual and corporate) on the whole show decreasing returns to scale. The different behavior
may be understood if we recall that in our samples scale is a proxy for farm type. Small farms are
typically individual farms, and they do better than large corporate farms not necessarily because
of a size effect, but because of an organizational form effect: individual farms outperform
corporate farms. This conclusion is consistent with general theoretical arguments on comparative
performance of different organizational forms (see, e.g., Allen and Lueck, 2003) and with the
stylized facts described by van den Brink et al. (2006).
24

Conclusion
The large corporate farms in Moldova are a carryover from the Soviet era. The Soviet
agricultural ideology was driven, among other factors, by expectations of economies of scale.
This ideology is still deeply implanted in the minds of many agricultural decision makers in the
country, regardless of their dedication to market economy principles. It is also at the root of the
persistent complaints about fragmentation of agricultural holdings in the process of privatization
and the need to achieve consolidation by transition to large cooperatives or corporations. Yet the
policy makers in Moldova should realize that all attempts to preserve large-scale corporate
structures in former Soviet republics (whether as agricultural cooperatives or as new corporations
with market-sounding names) have not produced any positive results. The Russian and Ukrainian
dream of “horizontal transformation”, making persistently inefficient corporate farms suddenly
efficient, apparently does not work. On the contrary, it is the three small countries that resolutely
abandoned the large-scale structures and made a clean shift to small-scale individual agriculture
– Armenia, Georgia, and Azerbaijan – that demonstrate the most impressive recovery record
among the CIS countries in recent years. Moldova has much in common with these three small,
densely populated countries, much more than with Russia and Ukraine, and the Moldovan policy
makers will do well to study the experience with small farms in Armenia, Georgia, and
Azerbaijan.
Comparison of farm structure in Moldova and the EU-15 (as representatives of a market
economy) shows that Moldova is characterized by much greater land concentration in large
farms than any of the EU-15 countries. Even in countries most similar to Moldova, such as
Portugal and Greece, the large-farm sector controls a much smaller proportion of land and small
farms achieve much greater dominance. To move closer to the farm-structure pattern typical of
25

market economies, Moldova should allow land to flow from large corporate farms to small
individual farms, rather than in the opposite direction. This will reduce the concentration of land
in large farms, while at the same time increasing the share of land controlled by the small
individual farms, and thus bring Moldova in closer conformity with the market pattern of land
concentration. At the same time it may correct, at least partially, one of the two manifestations of
land fragmentation in Moldova: the average size of the very small individual farms will increase
somewhat as they acquire more land at the expense of large corporate farms. More importantly,
it should also result in increased agricultural productivity.
Fragmentation of holdings due to land privatization and the advisability of implementing
administrative measures to encourage consolidation and re-creation of large-scale corporate
farms are at the center of the ongoing policy debate in Moldova. Our results show convincingly
that small individual farms in Moldova achieve higher productivity and efficiency than large
corporate farms – a result which is obtained also in other countries (see, e.g., Uzun (2005) for
Russia and Ahearn et al. (2002) for the United States). Therefore policies encouraging a shift
from large corporate farms to smaller individual farms, rather than the reverse, can be expected
to produce beneficial results for Moldovan agriculture and the economy in general.
References Agriculture (2004). Agriculture in the Republic of Moldova 2004, Department of Statistics,
Chisinau.
M. Ahearn, J. Yee, and W. Huffman (2002). “The Effect of Contracting and Consolidation on Farm Productivity,” paper presented at the Economics of Contracting in Agriculture Workshop, Annapolis, MD (July).
D. W. Allen and D. (2003). The Nature of the Farm: Contracts, Risk, and Organization in Agriculture, MIT Press, Cambridge, MA.
26

CIS (2004). Official Statistics of CIS Countries, CD-ROM 2004-9, Goskomstat SNG, Moscow.
CSLS (2005). “Aggregate Income and Productivity Tables for Canada and the United States” and “Labour, Capital and Total Factor Productivity Tables”, Centre for the Study of Living Standards, Ottawa [www.csls.ca]
T. Coelli, D. S. P. Rao, and G. Battese (1998). An Introduction to Efficiency and Productivity Analysis, Kluwer, Boston.
C. Csaki and Z. Lerman (2002). “Land Reform and Farm Restructuring in Moldova: A Real Breakthrough?” Problems of Post-Communism, Vol. 49, No. 1, pp. 42-52.
N. Dudwick, K. Fock, and D. Sedik (2005). A Stock-Taking of Land Reform and Farm Restructuring in Bulgaria, Moldova, Azerbaijan, and Kazakhstan, ECSSD, World Bank, Washington, DC (mimeo, February).
D. Epshtein (2003). “Efficiency and Stability of Large Agricultural Enterprises,” Eastern European Economics, Vol. 41, pp. 70-92.
D. Epshtein (2005). “Financial Performance and Efficiency of Corporate Farms in Northwest Russia,” Comparative Economic Studies, Vol. 47, No. 1, pp. 188-199.
C. I. Jones (1998). Introduction to Economic Growth, Norton, New York.
Z. Lerman (2001). Moldova: Baseline Farm Survey October-November 2000, ECSSD, World Bank, Washington, DC (mimeo, April).
Z. Lerman, C. Csaki, and V. Moroz (1998). Land Reform and Farm Restructuring in Moldova: Progress and Prospects, World Bank Discussion Paper 398, World Bank, Washington, DC.
Z. Lerman, Y. Kislev, A. Kriss, and D. Biton (2003). “Agricultural Output and Productivity in the Former Soviet Republics,” Economic Development and Cultural Change, Vol. 51, No. 4, pp. 999-1018.
Z. Lerman, C. Csaki, and G. Feder (2004). Agriculture in Transition: Land Policies and Evolving Farm Structures in Post-Soviet Countries, Lexington Books, Lanham, MD.
MinAg (2005). State Program for Farm Land Consolidation, draft, Ministry of Agriculture and Food Industry, Chisinau.
A. Muravschi and others (2004). Efficiency of the Agricultural Sector in the Post-Privatization Period, USAID/PFAP, Chisinau (mimeo).
V. Uzun (2002). “Organizational Types of Agricultural Production in Russia,” in: Factor Markets in Russia’s Agri-Food Sector: Framework for Further Analysis, Analytical Centre of Agri-Food Economics and USAID/IRIS, Moscow.
27
V. Uzun (2005). “Large and Small Business in Russian Agriculture: Adaptation to Market,” Comparative Economic Studies, Vol. 47, No. 1, pp. 85-100.
USDA (2000). “U.S. Level Tables: Inputs, Outputs, and Productivity, 1948-99,” USDA/ERS, Washington, DC [www.ers.usda.gov/Data/AgProductivity/]
USDA (2004). 2002 Census of Agriculture, USDA/NASS, Washington, DC [www.usda.gov/nass]
R. Van den Brink, G. Thomas, H. Binswanger, J. Bruce, and F. Byamugisha (2006). Consensus, Confusion, and Controversy: Selected Land Reform Issues in Sub-Saharan Africa, World Bank Working Paper No. 71, World Bank, Washington, DC.
World Bank (2005). Moldova: Opportunities for Accelerated Growth, A Country Economic Memorandum for the Republic of Moldova, Report No. 32876-MD, World Bank, Washington, DC.
World Bank (2006). Moldova Agricultural Policy Notes: Agricultural Land, World Bank, Washington, DC (forthcoming).
28