productivity in financial and insurance services - staff ... · pdf fileproductivity in...
TRANSCRIPT

Productivity in Financial
and Insurance ServicesProductivity CommissionStaff Research Note
February 2016
Shiji Zhao Paula Barnes Jenny GordonMarcelo MunozJames Hunter
The views expressed in
this research note are those of the
staff involved and do not
necessarily reflect the views of the
Productivity Commission.

Commonwealth of Australia 2016
Except for the Commonwealth Coat of Arms and content supplied by third parties, this copyright work is licensed under a Creative Commons Attribution 3.0 Australia licence. To view a copy of this licence, visit http://creativecommons.org/licenses/by/3.0/au. In essence, you are free to copy, communicate and adapt the work, as long as you attribute the work to the Productivity Commission (but not in any way that suggests the Commission endorses you or your use) and abide by the other licence terms.
Use of the Commonwealth Coat of Arms For terms of use of the Coat of Arms visit the ‘It’s an Honour’ website: http://www.itsanhonour.gov.au
Third party copyright Wherever a third party holds copyright in this material, the copyright remains with that party. Their permission may be required to use the material, please contact them directly.
An appropriate reference for this publication is: Zhao, S., Barnes, P., Gordon, J., Munoz, M. and Hunter, J. 2016, Productivity in Financial and Insurance Services, Productivity Commission Staff Research Note, Canberra, February.
Publications enquiries Media and Publications, phone: (03) 9653 2244 or email: [email protected]
The Productivity Commission
The Productivity Commission is the Australian Government’s independent research and advisory body on a range of economic, social and environmental issues affecting the welfare of Australians. Its role, expressed most simply, is to help governments make better policies, in the long term interest of the Australian community.
The Commission’s independence is underpinned by an Act of Parliament. Its processes and outputs are open to public scrutiny and are driven by concern for the wellbeing of the community as a whole.
Further information on the Productivity Commission can be obtained from the Commission’s website (www.pc.gov.au).

PRODUCTIVITY IN FINANCIAL AND INSURANCE SERVICES 1
Key points • The Finance insurance and superannuation (FIS) services industry has historically
experienced strong measured productivity growth, averaging 2.2 per cent a year compared with 0.8 per cent for the market sector over the period 1989-90 to 2012-13.
• The main driver of FIS MFP growth was output growth, which grew at 4.6 per cent over the period, while labour input growth averaged 0.6 per cent and capital 3.9 per cent per year.
• Over the shorter period 1994-95 to 2011-12, MFP growth in FIS averaged 1.9 per cent per year. But this masks considerable differences in the growth rates of the sub-divisions:
– MFP growth in Finance averaged 0.6 per cent per year compared with 2.0 per cent per year for Insurance, superannuation and auxiliary services (ISA).
• The average growth rates also mask considerable volatility:
– MFP growth in Finance has been cyclical (following the business cycle). Over the period 1998-99 to 2007-08 MFP declined by an annual average of 1.0 per cent, but grew by an average of 0.9 per cent a year from 2007-08 to 2011-12
– MFP growth in ISA grew at an annual rate of 7.2 per cent over 1989-90 to 2007-08, then fell by an annual rate of 7.4 per cent over the current cycle 2007-08 to 2011-12.
• Production (gross output) is usually measured by sales of goods and services (and changes in inventories). But in FIS, many outputs have to be imputed:
– Financial Intermediation Services Indirectly Measured (FISIM) is based on the interest margin. In 2011-12, it contributed around 77 per cent to gross output in Finance, reflecting a substantial increase in share since 2007-08.
– The Insurance services charge, measured as premiums plus premium supplements less claims, was around 95 per cent of total Insurance output in 2011-12. Non-life insurance accounted for 71 per cent (50 percentage points general insurance and 21 percentage points health insurance) while life insurance accounted for 29 per cent of the insurance service charge in 2011-12.
– Imputed income (administrative and investment costs) forms the majority of gross output for Superannuation, contributing 98 per cent in 2011-12.
• Auxiliary services, which accounted for 20 per cent of FIS production in 2011-12, is the only subdivision which directly measures output on the basis of fees and charges.
• Intermediate inputs made up 37 per cent of the value of FIS production in 2011-12, a decline from 44 per cent in 1994-95. Reliance on intermediate inputs is highest for Insurance and superannuation (66 per cent of production), and lowest for the Finance subdivision (25 per cent).
• The imputed nature of gross output poses challenges for the interpretation of productivity statistics. Lack of capital data at sub-division level also restricts the scope of analysis. Further work is required to understand the real underlying productivity of the industries that make up the FIS sector.

2 STAFF RESEARCH NOTE
Introduction and background
For more than two decades, productivity in the Financial, insurance and superannuation (FIS) services industry has increased ahead of average multifactor productivity (MFP) growth in the market sector of the Australian economy — 2.2 per cent per year compared with 0.8 per cent per year over the 23-year period to 2012-13. Productivity growth for other market sector industries (combined) averaged 0.5 per cent per year and has been declining since 2003-04 (figure 1).
Figure 1 MFP in FIS services and the market sectora
Index 1989-90 = 100
90
100
110
120
130
140
150
160
170Financial and insurance services
Market sector (12)
Other market sector (12) industries combined
a The market sector in this paper includes 12 industry divisions: Agriculture, forestry & fishing; Mining; Manufacturing; Electricity, gas, water & waste services; Construction; Wholesale trade; Retail trade; Accommodation & food services; Transport, postal & warehousing; Information, media & telecommunications; Financial & insurance services; and Arts & recreation services. Other market sector industries combined is estimated based on Parham (2012) methodology.
Source: ABS (Estimates of Industry Multifactor Productivity, 2012-13, Cat. no. 5260.0.55.002).
This strong performance compares with a decline in MFP growth for many other market sector industries since 2003-04, most notably Mining, Electricity, gas, water and waste services (Utilities), and Manufacturing (PC 2014). Commission analysis found that temporary factors could explain part of the decline.1 But there were other factors — resource depletion in Mining and a shift toward more input intensive higher quality output, such as with artisan baking — that reflected longer-term trends (PC 2013).
1 Including major investment programs that acted to increase input growth ahead of output growth in
Mining and Utilities, and the effect of natural disasters, including drought and floods, on output in Agriculture (2003-04 to 2009-10) and Utilities.
PRODUCTIVITY IN FINANCIAL AND INSURANCE SERVICES 3
The example of artisan baking in Manufacturing (Barnes et al. 2013) raises questions about how well productivity statistics capture improvements in the quality of output, while the depletion effect points to issues of unmeasured inputs, such as natural resources in the case of Mining and Utilities, and how productivity is affected if the quality of these inputs declines. These insights into measurement and into more fundamental drivers of productivity have provided a better understanding of the challenges facing these industries in improving their productivity performance.2
This staff research note continues the Commission’s work of examining industry productivity statistics to better understand what they mean. As the first service sector to be examined, there are new questions as to what is actually being measured and how well it reflects the underlying concept of productivity.
What is the FIS services industry?
FIS covers a diverse range of activities providing financial, insurance and supporting auxiliary services to industries, consumers and exports. The industry is defined to include:
… units mainly engaged in financial transactions involving the creation, liquidation, or change in ownership of financial assets, and/or in facilitating financial transactions.
The range of activities include raising funds by taking deposits and/or issuing securities and, in the process, incurring liabilities; units investing their own funds in a range of financial assets; pooling risk by underwriting insurance and annuities; separately constituted funds engaged in the provision of retirement incomes; and specialised services facilitating or supporting financial intermediation, insurance and employee benefit programs.
Also included in this division are central banking, monetary control and the regulation of financial activities. (ABS 2006, p. 71)
The ABS Australian and New Zealand Standard Industrial Classification (ANZSIC) divides this range of activities into three subdivisions: Finance; Insurance and superannuation funds (hereafter ‘Insurance and superannuation’); and Auxiliary finance and insurance services (hereafter ‘Auxiliary services’) (table 1).
For productivity analysis, these subdivisions are comprised of all the activities of ‘business units’ predominantly engaged in providing services primary to these industry subdivisions.3
2 See Topp et. al. (2008) on Mining, Topp and Kulys (2012) on Electricity, gas, water and waste services,
and Barnes et. al, (2013) on Manufacturing. 3 In some cases different parts of a business will be allocated to multiple subdivisions. For more detail see
ABS (2014a).

4 STAFF RESEARCH NOTE
Table 1 ANZSIC classification of FIS services Subdivision/group/class Primary Activities
62 Finance 621 Central banking • Central banking and financial regulatory service 622 Depository financial intermediation 6221 Banking • Operation of: savings, development and trading banks 6222 Building society operation • Building society operation 6223 Credit union operation • Credit union operation 6224 Other depository
financial intermediation • Bill of exchange discounting or financing • Operation of: commercial finance company, merchant banking • Money market dealing • Depository financial intermediation nec
623 Non-depository intermediation • Cooperative housing society operation • Credit card issuing operation • Non-depository financing, home and money lending
624 Financial asset investing • Operation of: charitable/educational trust or foundation, friendly society, holding company, investment (own account), mutual fund and unit trust
63 Insurance and superannuation funds 631 Life insurance • Life insurance and reinsurance provision 632 Health and general insurance 6321 Health insurance • Provision of: funeral benefits, dental, and health insurance 6322 General insurance • Provision of insurance for: accident, all risks, fire, general,
household, mortgage, motor vehicle, owner’s liability, reinsurance, third party, travel and worker's compensation
633 Superannuation funds • Operation of : approved deposit (superannuation); pension fund (separately constituted), and superannuation fund (separately constituted)
64 Auxiliary finance and insurance services 641 Auxiliary finance and investment services 6411 Financial asset broking
services • Commodity futures broking or dealing • Financial asset and stock broking or trading • Trading of mortgages operation
6419 Other auxiliary financial and investment services
• Services (on a commission or fee basis) of: arranging home loans for others; cooperative housing society management; insurance fund management; portfolio, investment, management; superannuation fund management
• Operation of: clearing house, share registry, stock exchange • Services of: credit card administration; executor; finance
consultant; financial asset investment consultant; nominee; security valuation; trustee; and money changing (non-bank)
642 Auxiliary insurance services • Actuarial, claim adjustment and assessment, insurance agency, broking and consultant services
Source: ABS (2006).
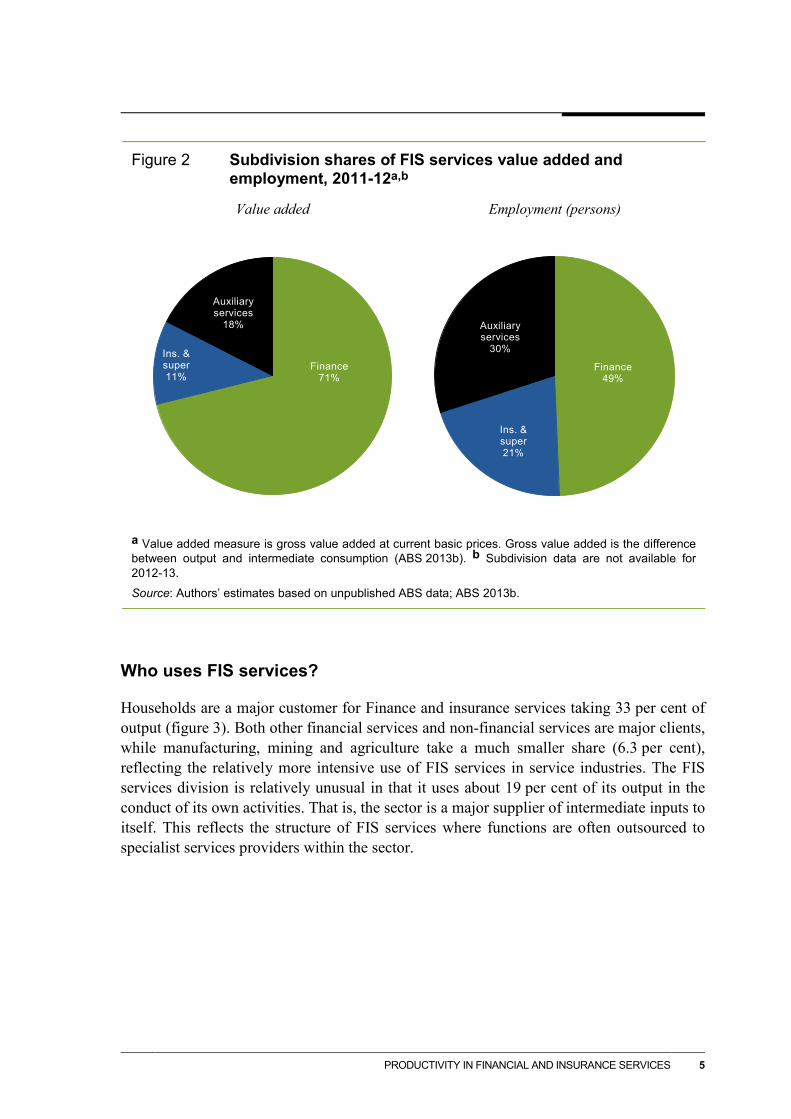
The Finance subdivision accounts for around 70 per cent of divisional value added (figure 2, left-hand panel). FIS accounted for 4 per cent of national employment in 2011-12 and 9 per cent of GDP. Finance is the largest employer but its share of division employment is only around 50 per cent. (figure 2, right-hand panel). Labour and capital make up nearly 70 per cent of FIS inputs, with roughly equal shares of capital and labour (figure 3, left-hand panel).
PRODUCTIVITY IN FINANCIAL AND INSURANCE SERVICES 5
Figure 2 Subdivision shares of FIS services value added and
employment, 2011-12a,b
Value added Employment (persons)
Finance 71%
Ins. & super 11%
Auxiliary services
18%
Finance 49%
Ins. & super 21%
Auxiliary services
30%
a Value added measure is gross value added at current basic prices. Gross value added is the difference between output and intermediate consumption (ABS 2013b). b Subdivision data are not available for 2012-13.
Source: Authors’ estimates based on unpublished ABS data; ABS 2013b.
Who uses FIS services?
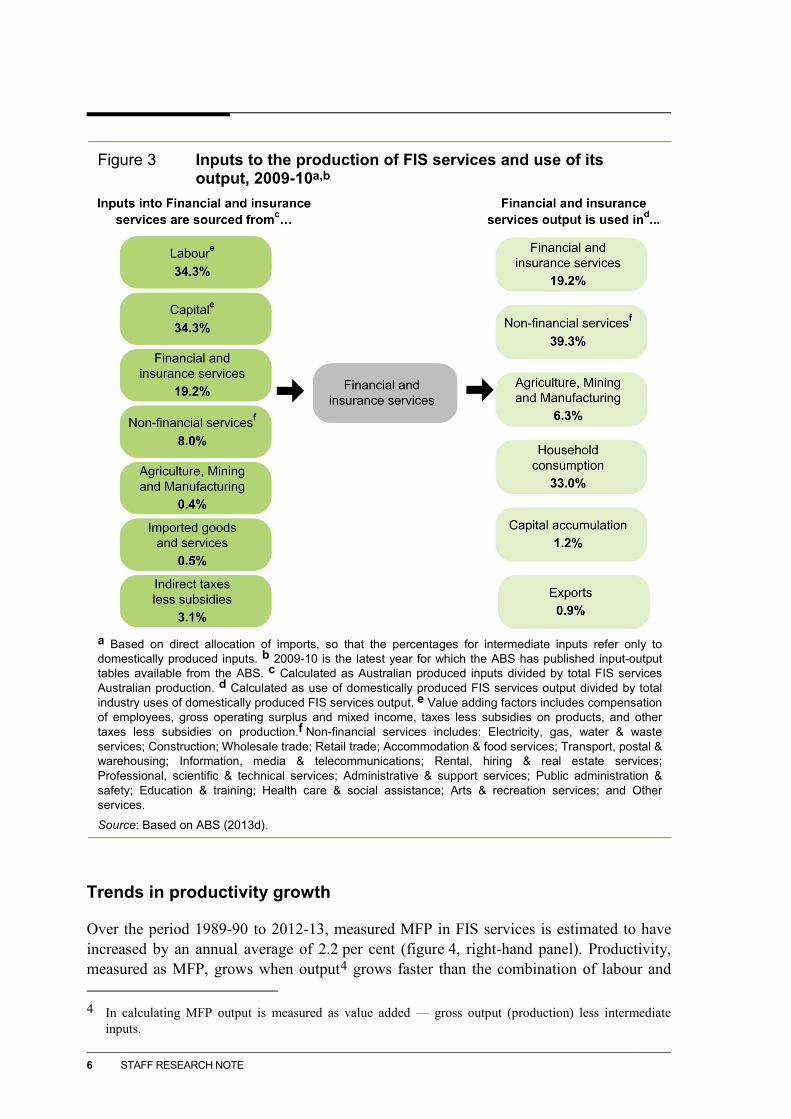
Households are a major customer for Finance and insurance services taking 33 per cent of output (figure 3). Both other financial services and non-financial services are major clients, while manufacturing, mining and agriculture take a much smaller share (6.3 per cent), reflecting the relatively more intensive use of FIS services in service industries. The FIS services division is relatively unusual in that it uses about 19 per cent of its output in the conduct of its own activities. That is, the sector is a major supplier of intermediate inputs to itself. This reflects the structure of FIS services where functions are often outsourced to specialist services providers within the sector.
6 STAFF RESEARCH NOTE
Figure 3 Inputs to the production of FIS services and use of its
output, 2009-10a,b
a Based on direct allocation of imports, so that the percentages for intermediate inputs refer only to domestically produced inputs. b 2009-10 is the latest year for which the ABS has published input-output tables available from the ABS. c Calculated as Australian produced inputs divided by total FIS services Australian production. d Calculated as use of domestically produced FIS services output divided by total industry uses of domestically produced FIS services output. e Value adding factors includes compensation of employees, gross operating surplus and mixed income, taxes less subsidies on products, and other taxes less subsidies on production.f Non-financial services includes: Electricity, gas, water & waste services; Construction; Wholesale trade; Retail trade; Accommodation & food services; Transport, postal & warehousing; Information, media & telecommunications; Rental, hiring & real estate services; Professional, scientific & technical services; Administrative & support services; Public administration & safety; Education & training; Health care & social assistance; Arts & recreation services; and Other services.
Source: Based on ABS (2013d).
Trends in productivity growth
Over the period 1989-90 to 2012-13, measured MFP in FIS services is estimated to have increased by an annual average of 2.2 per cent (figure 4, right-hand panel). Productivity, measured as MFP, grows when output4 grows faster than the combination of labour and 4 In calculating MFP output is measured as value added — gross output (production) less intermediate
inputs.

PRODUCTIVITY IN FINANCIAL AND INSURANCE SERVICES 7
capital inputs (figure 4, left-hand panel). From 1989-90 to 2012-13 output increased by an average 4.6 per cent per year, while labour and capital inputs increased by 0.6 per cent and 3.9 per cent per year, respectively.
The changes, however, were not uniform over the period. In the early 1990s, strong growth in MFP reflected rising output despite declining labour inputs. Since the global financial crisis (GFC) growth in both output and employment paused while capital employed in the industry continued to grow, resulting in a temporary decline in productivity (figure 4, right-hand panel).
Figure 4 Financial and insurance services MFP and its proximate
causesa Index 1989-90 = 100
50
100
150
200
250
300
Value added Labour Capital
50
100
150
200
MFP
a Value added and capital are chain volume measures. Labour is hours worked.
Source: ABS 2014b.
The overall trend masks very different trends across the subdivisions
Drawing together additional data on inputs (capital and labour), outputs, and intermediate inputs, the Commission estimated the growth of MFP in two sub-divisions — Finance and Insurance, superannuation and auxiliary services (ISA)5. A more detailed disaggregation was not possible as capital series are only available for the sector as a whole and for Finance, and the series is only available from 1994-95 to 2011-12.
5 ISA corresponds to subdivisions 63 and 64 in Table 1.

8 STAFF RESEARCH NOTE
Figure 5 MFP and its proximate causes for Finance, and Insurance,
superannuation and auxiliary services subdivisionsa Index 1994-95 = 100
Finance
Insurance, superannuation and auxiliary services
a Value added and capital are chain volume measures. Labour is hours worked.
Source: Authors’ estimates.
For the whole sector, the average annual MFP growth over this shorter period was 1.9 per cent, but averaged 0.6 per cent per year for Finance compared with 2.0 per cent per year for ISA (figure 5, top and bottom right panels). While MFP for Finance has been relatively flat, MFP for ISA has been much more volatile. This volatility reflects volatility in output more than inputs, as input growth has tended to change more smoothly over the period (figure 5, top and bottom left panels). This dominance of changes in output growth on
50
100
150
200
250
300
350
50
100
150
200
250
300
350
50
100
150
200
250
300
350
50
100
150
200
250
300
350
Value added Labour Capital MFP
PRODUCTIVITY IN FINANCIAL AND INSURANCE SERVICES 9
productivity growth is less apparent in the sector level growth, in part as Finance is such a large share of FIS and in part as the movements across the subdivisions have been in opposite directions (see below).
While output volatility has dominated, there are also some fairly clear patterns in the growth rates of both capital and labour in the two sub-divisions. Capital growth was strong in Finance over the whole period, but accelerated from around 2002-03 until the GFC. It was the reverse for Insurance, superannuation and auxiliary services, as capital growth was strong until about 2003-04, before slowing considerably. Growth in labour inputs (measured as hours worked) declined for Finance from 1994-95 to 2001-02 then flattened out again after experiencing several years of growth. ISA services experienced almost the opposite pattern in labour input growth, declining during the period of stronger labour input growth in Finance, and growing in the other periods. This apparent inverse relationship in input growth raises questions about the pattern of intermediate input use within the sector.
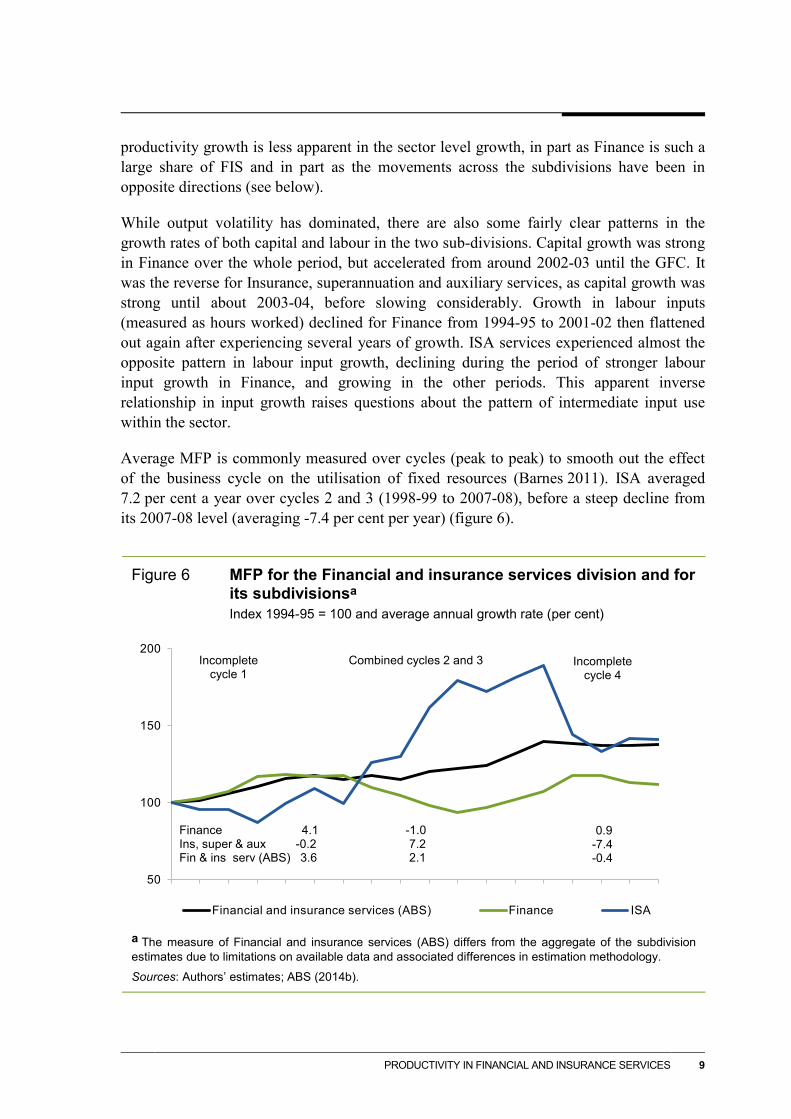
Average MFP is commonly measured over cycles (peak to peak) to smooth out the effect of the business cycle on the utilisation of fixed resources (Barnes 2011). ISA averaged 7.2 per cent a year over cycles 2 and 3 (1998-99 to 2007-08), before a steep decline from its 2007-08 level (averaging -7.4 per cent per year) (figure 6).
Figure 6 MFP for the Financial and insurance services division and for
its subdivisionsa Index 1994-95 = 100 and average annual growth rate (per cent)
a The measure of Financial and insurance services (ABS) differs from the aggregate of the subdivision estimates due to limitations on available data and associated differences in estimation methodology.
Sources: Authors’ estimates; ABS (2014b).
50
100
150
200
Financial and insurance services (ABS) Finance ISA
Incomplete cycle 1
Combined cycles 2 and 3 Incompletecycle 4
Finance 4.1Ins, super & aux -0.2Fin & ins serv (ABS) 3.6
-1.07.22.1
0.9-7.4-0.4

10 STAFF RESEARCH NOTE
Finance, on the other hand, had the reverse pattern, but with more modest growth rate averaging 0.9 per cent a year from 2007-08, following an average decline of 1.0 per cent a year over the 1998-99 to 2007-08 period. The large swings in ISA productivity are muted in the FIS estimates as ISA is a much smaller share of the sector than Finance. These patterns raise questions about what has driven these very different movements in MFP across the industries that make up FIS. A first step is to understand what these measurements actually represent.
What is being measured?
MFP growth is measured as the growth in valued added (output) that is not explained by growth in capital or labour inputs.6 Value added is a measure of total production less intermediate inputs. The estimates are made in current prices, and deflated by a price index to give a real value added. Hence MFP statistics depend on the measurement of the:
• current value production — also referred to as gross output
• intermediate inputs — inputs that are purchased from other firms in the industry and from other industries
• price index — reflecting price inflation in the industry — the ABS derives FIS output volumes by deflating with the consumer price index (all groups), because much of the output of the FIS sector does not have an explicit producer price7
• capital and labour — labour is measured in terms of hours worked, but capital measurement is more complex8.
Measuring production
Production (gross output) is usually measured on the basis of the industry sales of goods and services adjusted for changes in inventories. However, for FIS the fees for intermediation services provided by the industry are often partly or fully embedded in margins. This is the case, for example, for banks and finance companies that charge an interest rate margin on loans. The problem of measuring output also applies for insurance services, as premiums cover both a return to the insurer for managing the risk, and a payment to buy into the risk sharing pool. In both Finance and Insurance a value for output has to be ‘imputed’ from available data. Where there is no other information on output, such as in the case of the output of the Reserve Bank and in Superannuation, a measure of
6 For a detailed description of productivity measurement and some of the general measurement issues see
Gordon, Zhao and Gretton (2015). 7 This assumes that the quality improvements in Financial and insurance services are represented by the
characteristic improvements, as measured, across the bundle of goods and services included in the CPI. 8 ABS (2006) provides more details about the measurement of capital.

PRODUCTIVITY IN FINANCIAL AND INSURANCE SERVICES 11
the cost of production is used to impute output. Hence measured output in FIS is a combination of explicit fees, charges and sales, imputed output, and other income (table 2).
Table 2 Components of production of Financial and insurance
services
Subdivision Components of production
Finance Imputed output • Financial intermediation services indirectly measured (FISIM) (which is based on the
margin between deposit and lending interest rates) • Imputed output of financial intermediaries not elsewhere classified (which is the cost
of running the business, that is, total administrative and investment expenses, less any income derived directly)
• Imputed output of the Reserve Bank of Australia (which is based on costs)
Explicit charges • Fees levied such as loan establishment fees, loan account service fees and cheque
account fees
Other income • Gross non-land rental income, mainly from commercial buildings • Other service income such as income from trading in securities excluding holding
gains/losses
Own-account computer software and R&D
Insurance and superannuation funds
Insurance service charge • Administrative costs incurred (including labour and investment costs) plus a profit
margin for life insurance companies • Premiums earned plus investment income on technical reserves less expected claims
for non-life insurance companies • Administrative costs incurred (including labour and investment costs) for
superannuation funds
Explicit charges • Fees from stock lending activities for Insurance and superannuation
Other income • Gross non-land rental income, mainly from commercial buildings • Other service income such as income from trading in securities excluding holding
gains/losses
Own-account computer software and R&D
Auxiliary finance and insurance services
Sales of Auxiliary service goods and services (including rent, leasing and hiring income)
Own-account computer software and own-account R&D
Source: Based on ABS (2013a).
Imputed output makes up over 65 per cent of measured production in FIS
The main imputed output measure for the Finance sub-division is ‘Financial intermediation services indirectly measured’ (FISIM). FISIM accounted for around 45 per cent of FIS

12 STAFF RESEARCH NOTE
production in 2011-12 (figure 7). This estimate is based on the margin between lending and deposit rates.
Figure 7 Components of production of Financial and insurance
services, 2011-12a
FISIM 45%
Other imputed Finance
production 1%
Insurance service charge 20%
Explicit charges for Finance, Ins. &
super 10%
Other income of Finance, Ins. &
super 4%
Auxiliary services production 20%
b
a Detailed data are not available for 2012-13. b Includes own-account computer software and R&D of Finance, and Insurance and superannuation.
Source: Authors’ estimates based on unpublished ABS data.
The Insurance service charge is also an imputed output measure. It includes both the difference between insurance premiums and claims for non-life insurance companies, and the direct costs of service provision for life insurance companies and for superannuation funds. The imputed Insurance service charge accounted for 20 per cent of Financial and insurance services production in 2011-12 (figure 7).
The final part of imputed production relates to the cost of services provided by the Reserve Bank of Australia and financial intermediaries not elsewhere classified, which are estimated on the basis of direct costs (1 per cent of production).
Banking and finance companies as well as insurance and superannuation funds impose explicit charges for some services and derive other income from building rent, securities trading and other activities — collectively, 14 per cent of production in 2011-12. Auxiliary services is the only subdivision in Financial and insurance services for which all output is measured directly rather than imputed. These services accounted for around 20 per cent of division production in 2011-12.

PRODUCTIVITY IN FINANCIAL AND INSURANCE SERVICES 13
Imputed output has grown faster than other sources of production after 2007-08
Over the period 1994-95 to 2006-07, FISIM grew at 4.2 per cent a year and other imputed income at 5.1 per cent a year, compared with an average growth of 7.1 per cent in explicit charges and other income. From 2006-07, and particularly after the GFC, FISIM increased by around 6.9 per cent per year, while production from other activities is estimated to have remained fairly flat or to have declined (figure 8).9
Figure 8 Components of real production of Financial and insurance
servicesa,b
a Other imputed income includes imputed output of financial intermediaries nec, and of the RBA; and the insurance service charge. ‘Explicit charges and other income’ includes the components listed in table 2 under the headings of explicit charges and other income plus sales of goods and services for Auxiliary services plus own account software and R&D. b Deflated by CPI (All groups).
Source: Authors’ estimates based on unpublished ABS data.
Intermediate inputs and real value added
MFP statistics use real value added (so called as it reflects the value added by capital and labour inputs used in production) as a measure of output rather than gross output. Hence the production (gross output) estimates have to be adjusted for intermediate inputs to get a net output or value added measure. For the FIS sector, real value added grew at an average 5.1 per cent per year over the period 1994-95 to 2011-12. This was faster than the growth
9 Detailed data on the components of production were available only from 1994-95 to 2011-12.
0
20000
40000
60000
80000
100000
120000
140000
160000
180000
2000002011-12 $m
FISIM Other imputed income Explicit charges and other income

14 STAFF RESEARCH NOTE
in production as intermediate inputs grew by 3.5 per cent per year compared with growth of 4.4 per cent per year in FIS production (figure 9, left-hand panel).
Figure 9 Trends in production and intermediate input use of Financial
and insurance servicesa,b Trends (index 1994-95 = 100) Input compositionc (2011-12 $m)
a Chain volume measures. b Production can be decomposed into intermediate inputs used in producing output, and value added. c Value added is double deflated — derived as the difference between real production and real intermediate inputs. The value of production is deflated by CPI (All groups). Intermediate inputs is deflated by the implicit price deflator for intermediate inputs for Financial and insurance services division.
Source: Authors’ estimates based on unpublished ABS data.
Intermediate inputs in FIS declined from 44 per cent in 1994-95 to 37 per cent of the value of production in 2011-12 (figure 9, right-hand panel). However, the mix of inputs varies between activities so once again the aggregate masks significant differences at the sub-division level. In 2011-12 intermediate input use in Finance was around 25 per cent of gross output, compared with 66 per cent in Insurance and superannuation, and 45 per cent in Auxiliary services (figure 10).
100
120
140
160
180
200
220
Production Intermediate inputs
020000400006000080000
100000120000140000160000180000200000
Value added Intermediate inputs

PRODUCTIVITY IN FINANCIAL AND INSURANCE SERVICES 15
Figure 10 Input structure of Financial and insurance services
subdivisionsa,b Index 1994-95 = 100 (left-hand panel); 2011-12 $m (right-hand panel)
Trends (index 1994-95 = 100) Input compositionc (2011-12 $m)
Finance
Insurance and superannuation
Auxiliary services
a Chain volume measures. b Production can be decomposed into intermediate inputs used in producing output, and value added. c Value added is double deflated — derived as the difference between real production and real intermediate inputs. The value of production is deflated by CPI (All groups). Intermediate inputs is deflated by the implicit price deflator for intermediate inputs for Financial and insurance services division. Source: Authors’ estimates based on unpublished ABS data.
90
110
130
150
170
190
210
230
0
20000
40000
60000
80000
100000
120000
90
110
130
150
170
190
210
0
10000
20000
30000
40000
50000
60000
90110130150170190210230250270290310
0
10000
20000
30000
40000
50000
60000
Production Intermediate inputs Value added Intermediate inputs

16 STAFF RESEARCH NOTE
Impacts on the measurement of MFP
The very different rates of intermediate input use mean that the shares of value added (figure 11, right panel) differ considerably from gross output shares across the sub-divisions (figure 11, left panel). Superannuation and Insurance contributed similar shares of divisional production (each around 10 per cent to total 21 per cent), but together accounted for a much smaller share of the division’s value added (11 per cent) because of their higher share of intermediate input use. It was not possible to separately estimate valued added for Insurance and Superannuation.
Figure 11 Productiona and value added of Financial and insurance
services subdivisions/groups, 2011-12
Production Value added
a Includes own-account software and R&D.
Source: Authors’ estimates based on unpublished ABS data.
As noted, MFP is measured as the growth in value added less growth in capital and labour inputs and by construction, it reflects changes in the shares of intermediate inputs in production change value added. However, as intermediate inputs are substitutable for capital and labour inputs, changes in intermediate inputs should be mirrored by a change in capital and labour inputs. Hence, to the extent that there is a shift toward or away from outsourcing (where the activity is undertaken) measured MFP should not change. As changes in outsourcing should be a response to there being a less costly way of undertaking a particular activity, it would be expected that such shifts should be associated with productivity gains (relative to the counterfactual).
Finance 59%
Auxiliary services
20%
Insurance11%
Super10%
Ins.&super 21%
Finance 71%
Ins. & super 11%
Auxiliary services
18%

PRODUCTIVITY IN FINANCIAL AND INSURANCE SERVICES 17
Imputed output measures in more detail
There are three main types of imputed measures: FISIM is derived from the gap between lending and deposit rates; the insurance service charge, (which for non-life insurance is based on the difference between insurance premiums and pay-outs) and the cost of production, which draws on the cost of providing the service.10
FISIM makes up a major share of production in Finance
In 2011-12, FISIM contributed around 76 per cent to gross output in the Finance subdivision (figure 12). The relative shares of the various output components in the Finance subdivision remained fairly constant during the period from 1994-95 to 2007-08. However, since 2007-08 the share of FISIM has increased substantially (it averaged 67 per cent over 1994-95 to 2006-07).
Figure 12 Gross output components of the Finance subdivisiona,b
Current $m
a Does not include own-account software and R&D. b Other income includes rental income and other service income from activities such as trading securities, and a small proportion of other imputed income from financial intermediaries not elsewhere classified and the RBA. In 2011-12 the latter imputed component contributed around 3 per cent of gross output in the Finance subdivision.
Source: Authors’ estimates based on unpublished ABS data.
10 The insurance service charge estimate includes both the premium based measure for non-life insurance
and the direct cost based measure for life insurance and superannuation. In this section these approaches are discussed separately.
0
20000
40000
60000
80000
100000
120000
1994-95 1998-99 2002-03 2006-07 2010-11
FISIM Explicit charges Other income
18 STAFF RESEARCH NOTE
It is worth noting that FISIM makes up a higher share of value added than gross output. This is because value added is smaller than gross output (by the level of intermediate services). Consequently any measurement bias or instability in FISIM will have a bigger effect on estimates of the growth in value added (and hence MFP) than on growth in gross output.11
Some issues in measuring FISIM
There is a substantial literature on the estimation of FISIM involving a wide range of complicated conceptual and technical issues. For the purposes of exposition the explanation below relates only to banks. FISIM captures the value of banks’ services associated with deposit taking (such as taking, managing and transferring deposits and facilitating withdrawal of funds etc.) and services associated with loan making (such as assessing risks of borrowers; screening investment projects; monitoring loan performance; transforming deposits into loans to meet required size; and pricing the risk characteristics, terms to maturity, repayment schedule and other conditions).
Part of this difference relates to financial risks. The bank is exposed to the risk of depositors wishing to withdraw their funds (liquidity risk), and the borrower failing to meet the repayment obligations on loans (late payment and default risks). These risks vary with specific borrowers and lenders (idiosyncratic risk), but also with market conditions (market risk). The margin between deposit and lending rates includes this market risk premium as well as the return to the bank’s intermediation and risk management activities. The difference is explained in box 1.
This inclusion of the market risk premium in the formulation of FISIM suggests that FISIM, and by extension the size of the Finance industry, has been systematically overestimated. Estimates for the United States and European Union are that FISIM is overestimated by around 40 per cent (Basu et al. (2011) and Colangelo and Inklaar (2012)).
Nevertheless, growth rates of output and value added, and by extension estimates of MFP, are robust to the overestimate of FISIM if:
• the market risk premium remains a stable share of FISIM over time
• FISIM is a stable share of value added.
11 This effect on MFP will be bigger than the effect on a measure of total factor productivity (TFP) as TFP
statistics include intermediate inputs on both sides of the growth equation.

PRODUCTIVITY IN FINANCIAL AND INSURANCE SERVICES 19
Box 1 Stylised representation of FISIM and risk premium estimation In the figure for the ‘Current method’ (left panel), in each period, total value of FISIM is defined as the difference between the rate received on loans (𝑟𝑟𝐴𝐴) and interest payable on deposits (𝑟𝑟𝐷𝐷) multiplied by outstanding loan (𝐴𝐴) and deposit (D) balances, respectively. In this method, the ABS uses the average of the effective loan and deposit rates, known as the ‘midpoint reference rate’ (rMP), to divide FISIM into banks’ services associated with loan-making (Loan FISIM) and deposit-taking activities (Deposit FISIM). Other statistical agencies use an ‘exogenous’ reference rate, usually a short-term ‘risk-free’ rate (rF) such as an interbank loan rate, to achieve the separation.
Current method – where risk premium is not explicitly recognised
An alternative view – where a risk premium would be explicitly recognised
In the graph for an ‘Alternative view’ (right panel), a component, known as ‘risk premium’ is recognised and the remaining represents the value of ‘pure’ FISIM. Under this view, a value for the ‘risk premium’ would be defined as the difference between the risk-bearing rate (rM) and a risk-free rate (rF’) multiplied by outstanding loan balances (A). It should be noted that empirical analysis often focuses on the risk premium associated with loan-making, because deposits are usually guaranteed. In Australia, prudential regulation and the supervision system has worked effectively to protect depositors from default risk (Turner 2011). It is important to note that these figures are a ‘stylised’ representation of the FISIM methods. It abstracts from many technical issues for the purpose of illustrating the concept of risk premium in the measure of FISIM.
Loan FISIM (associated with banks’ loan-making)
Loan balance (A)
Deposit FISIM (associated with banks’ deposit-taking)
Interest expenseInterest expense
Deposit balance (D)
0
rD
rF’
rMP
rA rA
Pure FISIM (associated with banks’ loan making
Risk premiumRisk premium
Pure Deposit FISIM (associated with banks’ deposit-taking)
Interest expenseInterest expense
Loan balance (A)
Deposit balance (D)
rM
rF’
rD
0
Yet, as figure 12 shows, in Australia FISIM has risen over time as a share of gross output (and hence also value added). Moreover, the market risk premium particularly affects banking output during periods of financial or economic turmoil, suggesting that FISIM is a less reliable measure of output in these situations. As Haldane (2010) explains, in this situation, financial institutions:
20 STAFF RESEARCH NOTE
…will rationally respond by increasing interest rates to cover the rise in expected losses. FISIM will score this increased compensation for expected losses on lending as a rise in output. In other words, at times when risk is rising, the contribution of the financial sector to the real economy may be overstated. (p. 7)
The insurance service charge
Insurance is a form of financial intermediation in which funds are paid by policy-holders and invested in assets to meet future claims arising from the events specified in insurance policies. These assets (which can be financial or other assets) are known as technical reserves and the ability to earn investment income from these assets will affect the price charged for insurance (APRA 2010). Typically, insurance companies do not have a separate charge for the service of arranging the financial protection or security which insurance is intended to provide — it is included in the premium. The implicit charge for this service is known as the insurance service charge and has to be indirectly estimated (ABS 2013a, p. 112).12
The insurance service charge was around 95 per cent of total insurance output in 2011-12 (figure 13). Most, but not all of this is related to the premium based estimate. Rental income, other service income and explicit charges made up the remaining 5 per cent.
Non-life insurance accounted for 71 per cent of the insurance service charge in 2011-12 (50 percentage points general insurance and 21 percentage points health insurance), while life insurance was 29 per cent (figure 13). The volatility in the non-life insurance seen in figure 13 points to the insurance service charge as a major source of the volatility in insurance value added and hence the ISA MFP.
The insurance service charge is sensitive to external events
Variability in claims over time likely plays a major role in driving the variation in gross output — an increase in claims will result in lower output (since output is premiums plus premium supplements less claims). The ABS measure of gross output is smoother than that derived directly from published APRA data because the ABS smooths the claims measure it uses in its estimation of insurance output.
12 SNA08 measures insurance output as premiums less claims, however it has been argued that it should be
measured as just premiums (see Triplett and Bosworth (2004)). The difference in the conceptual framework between the two measures is that the first is based on insurance being risk pooling, while the second is based on insurance companies assuming the risk. In both approaches, income on reserves or premium supplements are included in output — although again with different rationales. Both approaches to measuring gross output of the insurance industry will lead to the same level of value added as in the ‘premiums’ approach to gross output, claims are deducted when estimating value added.

PRODUCTIVITY IN FINANCIAL AND INSURANCE SERVICES 21
Figure 13 Gross output components of Insurancea
Current $m
a Does not include own-account software and R&D. Data source: Authors’ estimates based on unpublished ABS data.
As premium adjustments tend to lag claims, trends in the pattern of natural disasters over time and other major events, like the collapse of HIH, can lead to volatility in output. To the extent that claims also require greater inputs (claim assessment and processing), productivity statistics are even more likely to be negatively affected with high claims following natural disasters or other insured events. Box 2 illustrates the effect that natural disaster patterns can have on the output of the insurance industry.
Drilling down further, the components of non-life insurance have also varied considerably (figure 14). Insurance of health, motor vehicles; public and product liability and professional indemnity; fire and industrial special risks; and insurance not elsewhere classified (nec) (which includes house building insurance and mortgage insurance, amongst others) were the main contributors to the strong growth in the 2001-02 to 2003-04 period. While total non-life insurance output was relatively stable from 2003-04 to 2007-08, there was offsetting growth and contraction in the different types of insurances — such as high growth in health but a decline in motor vehicle insurance output. The decline in total output in 2008-09 was largely attributable to declines in employer liability, fire and industrial special risks insurances, and insurance nec (mainly lenders mortgage insurance).
0
2000
4000
6000
8000
10000
12000
14000
1994-95 1997-98 2000-01 2003-04 2006-07 2009-10
Ins. service charge (non-life – general) Ins. service charge (non-life – health)
Ins. service charge (life) Explicit, other service and rental income
22 STAFF RESEARCH NOTE
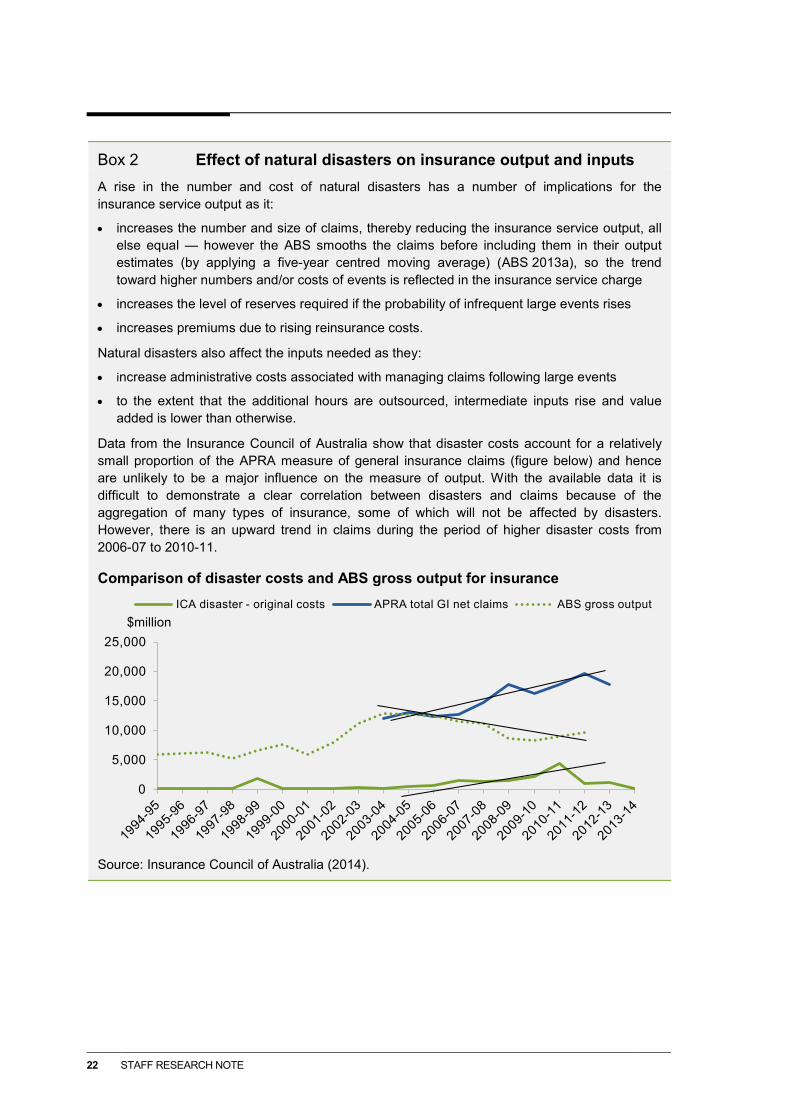
Box 2 Effect of natural disasters on insurance output and inputs A rise in the number and cost of natural disasters has a number of implications for the insurance service output as it:
• increases the number and size of claims, thereby reducing the insurance service output, all else equal — however the ABS smooths the claims before including them in their output estimates (by applying a five-year centred moving average) (ABS 2013a), so the trend toward higher numbers and/or costs of events is reflected in the insurance service charge
• increases the level of reserves required if the probability of infrequent large events rises
• increases premiums due to rising reinsurance costs.
Natural disasters also affect the inputs needed as they:
• increase administrative costs associated with managing claims following large events
• to the extent that the additional hours are outsourced, intermediate inputs rise and value added is lower than otherwise.
Data from the Insurance Council of Australia show that disaster costs account for a relatively small proportion of the APRA measure of general insurance claims (figure below) and hence are unlikely to be a major influence on the measure of output. With the available data it is difficult to demonstrate a clear correlation between disasters and claims because of the aggregation of many types of insurance, some of which will not be affected by disasters. However, there is an upward trend in claims during the period of higher disaster costs from 2006-07 to 2010-11.
Comparison of disaster costs and ABS gross output for insurance
Source: Insurance Council of Australia (2014).
0
5,000
10,000
15,000
20,000
25,000
ICA disaster - original costs APRA total GI net claims ABS gross output$million

PRODUCTIVITY IN FINANCIAL AND INSURANCE SERVICES 23
Figure 14 Gross output (insurance service charge) by type of non-life
insurance Current $million
a Insurance nec (not elsewhere classified) includes household building insurance, reinsurance, consumer credit insurance, mortgage insurance, travel insurance, and other insurance.
Data source: Authors’ estimates based on unpublished ABS data.
A subsequent fall in public and product liability, and professional indemnity insurance contributed to output remaining at that lower level in 2009-10. The recovery in output after this year was driven by fire and industrial special risks, insurance nec (mainly house insurance), and health insurance.
The economic slowdown in 2008-09 also impacted on the insurance service charge through increased claims costs for underwriters of professional indemnity and director's and officer's policies (APRA 2014a, p. 101). And claims related to GFC events (such as corporate collapses) can take a number of years to appear (KPMG 2008). Figure 15 shows that there was some increase in (nominal) claims on other professional indemnity insurance
-1000
0
1000
2000
3000
4000
5000Health
-1000
0
1000
2000
3000
4000
5000Motor vehicle
-1000
0
1000
2000
3000
4000
5000Employer liability
-1000
0
1000
2000
3000
4000
5000Home contents
-1000
0
1000
2000
3000
4000
5000Marine and aviation
-1000
0
1000
2000
3000
4000
5000Public and product liability, and professional indemnity
-1000
0
1000
2000
3000
4000
5000
94-9
596
-97
98-9
900
-01
02-0
304
-05
06-0
708
-09
10-1
1
Fire and industrial special risks
-1000
0
1000
2000
3000
4000
5000
94-9
596
-97
98-9
900
-01
02-0
304
-05
06-0
708
-09
10-1
1
Insurance nec a
-5000
0
5000
10000
15000
20000
25000
94-9
596
-97
98-9
900
-01
02-0
304
-05
06-0
708
-09
10-1
1
Total non-life insurance

24 STAFF RESEARCH NOTE
policies in the period following the GFC. This broadly coincides with a period of lower measured output for ‘public and product liability and professional indemnity insurance’.13
Figure 15 Gross claims on professional indemnity insurance policies
‘000 current dollars
a Other professional indemnity products include policies that provide cover for a professional for actions taken against that person in tort and/or statute law in respect of advice or services provided as part of their professional practice.
Source: APRA (2014b).
Earnings on reserves are included in output
Insurance services output is also affected by reserves held, with a minimum mandated by regulation. Regulatory responses to events like the collapse of HIH and the GFC can result in higher output as the funds are required to hold higher reserves. Working in the other direction, the GFC also reduced the earnings on reserves held.
Different segments of the industry are prone to different shocks and so their reserves also respond differently. For example, there was an increase in mortgage defaults during 2008-09, although default levels remained at relatively low levels (APRA 2014a, p. 101). A fall in the gross output of lenders mortgage insurers accounted for around 8 per cent of the total fall in the ABS measure of general insurance output in 2008-09.14
13 APRA (2014, p. 101) noted that a large portion of reinsurance costs for professional indemnity insurance
were passed on to reinsurers — which if they are overseas reinsurers will not show up as an effect on ABS gross output measure for the Australian industry.
14 Based on authors’ estimates derived from unpublished ABS data.
0
100
200
300
400
500
600
2003 2004 2005 2006 2007 2008 2009 2010 2011 2012 2013
Directors' and off icers' liability & employment practices Other professional indemnity productsa

PRODUCTIVITY IN FINANCIAL AND INSURANCE SERVICES 25
Cost-based imputed outcome measures
Cost based measures are used for estimating several elements of FIS, including the services of the Reserve Bank. The largest cost-based element in production is Superannuation.
Growth in aggregate contributions to superannuation drive industry output
In Superannuation, imputed income is measured as operating costs (investment and administrative costs — which is mainly labour), while explicit charges and other income are directly measured. Imputed income contributed 98 per cent of gross output in 2011-12 (figure 16). Of this, administrative costs were relatively high in the lead up to the GFC (2002-03 to 2007-08) while investment costs drove imputed income growth in the subsequent period. The relative share of explicit charges and other income has declined over time.
Figure 16 Gross output components of Superannuation fundsa
Current $million
a Does not include own-account software and R&D. Source: Authors’ estimates based on unpublished ABS data.
There has been a fivefold increase in Superannuation gross output between 1994-95 and 2011-12. Growth rates slowed after the GFC following a period of high growth from 2003-04 to 2007-08 (figure 16).
0
2,000
4,000
6,000
8,000
10,000
12,000
14,000
16,000
18,000
20,000
1996-97 1999-00 2002-03 2005-06 2008-09 2011-12
Administrative costs Investment costs Explicit charges Other income

26 STAFF RESEARCH NOTE
Production is highly related to assets under management
The rise in superannuation administrative and investment costs are closely related to the assets under management. Administrative costs are also related to the movement of funds into and out of the superannuation funds. Figure 17 shows the rapid growth in superannuation assets (left panel) and the flows into and out of superannuation (right panel).
Figure 17 Superannuation assets and superannuation fund activitya
Current $million
Total assetsa Flows in and out of Superannuation fundsb
a Total assets under management at the end of financial year. Excludes pooled superannuation trusts. b Flows exclude operating expenses and other charges.
Source: (APRA 2013).
Contributions to superannuation peaked in 2006-07 with temporary concessions during the transition phase of the Simplified Superannuation System reforms.15 The compounding nature of investment income has also influenced asset growth. In 2006-07, prior to the GFC, investment income was greater than contributions, but total assets declined in 2007-08 and 2008-09 because negative income growth was greater than the contributions made to Superannuation. Benefit payments, which are assets flowing out of the Superannuation industry, have increased steadily, with a one off increase around the onset of the GFC in 2007-08. Assets are now staying within the Superannuation system longer, as the share of benefit payments being provided as an income stream has grown from
15 The Simplified Superannuation reforms included the introduction of tax free income stream payments for
those over the age of 60, the removal of limits to lifetime concessional superannuation benefits and the streamlining of the transfer of assets between funds. It also included transitional arrangements for those under 65 who could bring forward two years of concessional contributions (Commonwealth of Australia 2006).
0
200000
400000
600000
800000
1000000
1200000
1400000
1600000
1800000
-200000
-100000
0
100000
200000
300000
400000
Contributions Investment income
Benefit payments

PRODUCTIVITY IN FINANCIAL AND INSURANCE SERVICES 27
around 21 per cent in 1996-97 to 51 per cent in 2012-13, at least in part due to concessional tax treatments afforded to income streams as well as the ageing of the population (APRA 2012).
Asset allocation changes affect costs
The cost of production is also affected by asset allocation. Asset allocation in Superannuation changes with preferences over risk and return. Structural changes, like the shift from defined benefit to defined contribution plans, also influence asset allocation trends.16 Defined benefits plans were more prominent during the late 1980s and early 1990s. These plans were not linked to investment returns, and were typically invested in low-risk index funds. As superannuation developed, defined benefit plans were closed to new members in response to changing employment patterns and a desire by employers to reduce their exposure to investment risk (ASFA 2014). Assets under defined contribution plans have been increasing and represented around 83 per cent of all APRA-regulated fund assets in 2012-13 (APRA 2013). Generally, defined contribution plans invest in a broader range of growth-based assets, including overseas equities and direct investments in infrastructure.
In 2012-13, the majority of superannuation assets were held in Australian equities, followed by deposits, bonds and other financial assets (figure 18). Just prior to the GFC (2003-04 to 2007-08), the share of equities increased as the Australian share market index rose. Proportionally, investment in deposits, bonds and other financial assets all declined during this period. In the subsequent period (2007-08 to 2011-12), the proportion of assets in defensive assets, like deposits, bonds and other financial assets, increased, while the share in equities declined marginally. This trend reflects changes in consumer risk preferences — around 30 per cent of surveyed self-managed superannuation fund (SMSF) trustees said they would be more likely to favour cash and fixed interest in their portfolio allocation following the GFC (CPA Australia 2009).
The shift to high-growth potential assets, like equities and overseas assets, increased superannuation costs as these asset classes are generally more expensive to access and manage compared with deposits, bonds and other financial assets. The growth of direct investment in infrastructure, private equity and hedge funds has also contributed to costs (Warner 2014). This has been complemented by the prevalence of active management strategies in Australia, which increase investment costs as fund managers undertake research in an effort to outperform the market average. However, since the GFC, there is evidence to suggest that passively managed portfolios, which invest in indexed products, have increased in popularity due to their lower costs for given risk/return combinations (Warner 2012).
16 Defined benefit plans provide members with a predetermined income benefit which is generally based on
the member’s final salary and length of service. Defined contribution plans invest the member’s contributions, with investment returns credited to the members account.

28 STAFF RESEARCH NOTE
Figure 18 Asset allocation has varieda
Percentage of total assets
0
5
10
15
20
25
30
35
40
45
Deposits, bonds and other financial
assets
Equities Life office reserves
Non-financial assets
Assets overseas
1994-95 to 1998-99 1998-99 to 2003-04 2003-04 to 2007-08 2007-08 to 2011-12
a Life office reserves is the net equity of pension funds in life office reserves. Non-financial assets include land, buildings, equipment and other non-financial assets. Assets overseas include all physical assets located outside of Australia and financial claims on non-residents.
Source: Based on ABS (Managed Funds, Australia, March 2014, Cat. no. 5655.0).
To the extent that active asset management delivers higher returns to the investors in superannuation, the industry production can be considered to increase. But additional management effort, as reflected in costs, is only warranted (and will improve productivity) if it is matched (or exceeded) by an increase in risk adjusted returns to investors.17
Fee based outputs and derived demand
The Auxiliary services industry, provides:
• alternative channels or avenues to banks and other established financial intermediaries, for consumers to access a wider range of investment opportunities
• direct assistance (through outsourcing) to other finance intermediaries in the process of undertaking investment transactions, through for example, broking, share registry, and fund management services
17 A recent study by the Grattan Institute suggests that the increased returns from active management (to the
extent they do occur) are outweighed by the additional costs of production (Minifie 2015). This suggests that this is not an ‘artisan baker’ effect where problems with measuring quality lead to productivity being underestimated by MFP statistics. In the case of artisan bread, the consumer is happy to pay more for a higher quality product that involves more inputs to produce (Barnes et al 2013).
PRODUCTIVITY IN FINANCIAL AND INSURANCE SERVICES 29
• advice to consumers in dealing with complex financial products, especially products that require individuals to play a more active role in their investment decisions (for example, self-managed superannuation products).
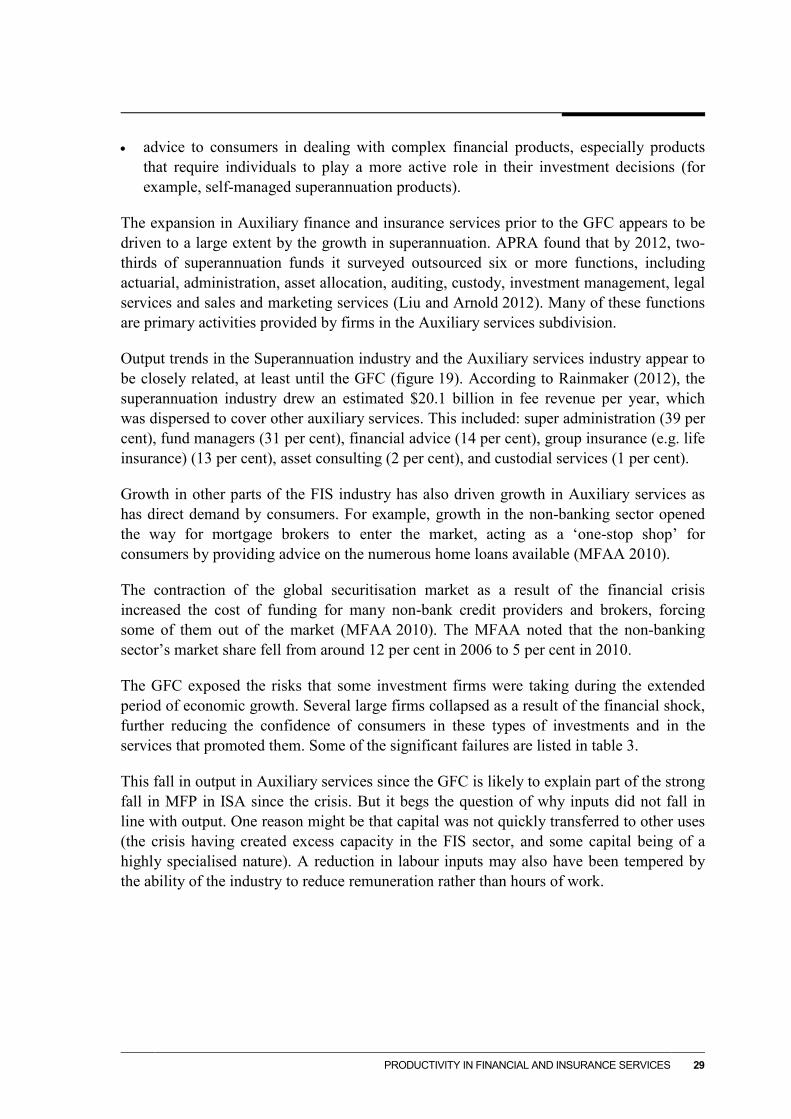
The expansion in Auxiliary finance and insurance services prior to the GFC appears to be driven to a large extent by the growth in superannuation. APRA found that by 2012, two-thirds of superannuation funds it surveyed outsourced six or more functions, including actuarial, administration, asset allocation, auditing, custody, investment management, legal services and sales and marketing services (Liu and Arnold 2012). Many of these functions are primary activities provided by firms in the Auxiliary services subdivision.
Output trends in the Superannuation industry and the Auxiliary services industry appear to be closely related, at least until the GFC (figure 19). According to Rainmaker (2012), the superannuation industry drew an estimated $20.1 billion in fee revenue per year, which was dispersed to cover other auxiliary services. This included: super administration (39 per cent), fund managers (31 per cent), financial advice (14 per cent), group insurance (e.g. life insurance) (13 per cent), asset consulting (2 per cent), and custodial services (1 per cent).
Growth in other parts of the FIS industry has also driven growth in Auxiliary services as has direct demand by consumers. For example, growth in the non-banking sector opened the way for mortgage brokers to enter the market, acting as a ‘one-stop shop’ for consumers by providing advice on the numerous home loans available (MFAA 2010).
The contraction of the global securitisation market as a result of the financial crisis increased the cost of funding for many non-bank credit providers and brokers, forcing some of them out of the market (MFAA 2010). The MFAA noted that the non-banking sector’s market share fell from around 12 per cent in 2006 to 5 per cent in 2010.
The GFC exposed the risks that some investment firms were taking during the extended period of economic growth. Several large firms collapsed as a result of the financial shock, further reducing the confidence of consumers in these types of investments and in the services that promoted them. Some of the significant failures are listed in table 3.
This fall in output in Auxiliary services since the GFC is likely to explain part of the strong fall in MFP in ISA since the crisis. But it begs the question of why inputs did not fall in line with output. One reason might be that capital was not quickly transferred to other uses (the crisis having created excess capacity in the FIS sector, and some capital being of a highly specialised nature). A reduction in labour inputs may also have been tempered by the ability of the industry to reduce remuneration rather than hours of work.

30 STAFF RESEARCH NOTE
Figure 19 Output in Superannuation and Auxiliary services
Index 1994-95 = 100
0
100
200
300
400
500
600
Auxiliary Services
Superannation
Source: Authors’’ estimates based on unpublished ABS data.
Table 3 Financial collapses between 2006 to 2010
Company Year Scheme Total losses
Westpoint 2006 Margin lending $388 million
Bridgecorp 2007 Property investment $459 million
Fincorp 2007 Property investment $201 million
Opes Prime 2008 Non-standard margin loan or ‘equity finance scheme’
Up to $1 billion
Storm Financial 2009 Margin lending/ Financial planning
$830 million
Timbercorp/Great Southern
2009 Managed investment scheme $3 billion +
Trio/Astarra 2009 Corporate and retail super $176 million
Commonwealth Financial Planning Ltd
2009-2010 Financial planning $50 million in compensation. Actual losses unknown
Source: Industry Super Australia (2014, pp. 3–4).
Implications for productivity measurement
The challenges in estimating productivity for the FIS sector are considerable. This note has described the way in which output is estimated, pointing to the need to rely on imputed output estimates for much of the sector. To summarise:
PRODUCTIVITY IN FINANCIAL AND INSURANCE SERVICES 31
• almost 70 per cent of Finance output is imputed, and the inclusion of the risk premium in the estimate of FISIM suggests that the level of real gross output is systematically overstated
• over 90 per cent of the output of Insurance is estimated as the insurance service charge, which is sensitive to volatility in claims and investment returns
• Superannuation output is estimated based almost entirely on expenditure, which is closely related to the size of assets under management, but also to the level of active asset management
• Auxiliary services output is mostly estimated by actual fees and charges. High rates of outsourcing of investment services by superannuation and insurance funds explain the strong common trend in output up to the GFC.
One of the challenges in interpreting these output estimates for productivity analysis is that many of these measures do not reflect what is commonly thought of as a supply response to demand. FISIM reflects market conditions that affect interest rate spreads as well as the volume of assets. The insurance service charge is affected by changes in tort law and natural disasters as well as the overall level of insurance services consumed. Growth in superannuation output reflects the compulsory nature of superannuation, as well as various policy incentives. Expenditure based measures render MFP estimates effectively meaningless (expenditure divided by estimates of inputs is by definition equal to one).
With imputed output it is easy to conceive of ways that measured output will increase that would not relate to what is usually considered to be a productivity promoting activity. For example, increasing payments to investment managers would boost superannuation output, even if no additional service (or even lower levels of service) was provided. Markets becoming more risk averse leading to a rise in the risk premium increases FISIM, even though this does not necessarily raise the service level provided by a bank. A natural disaster raises claims, which reduces the margins between premiums and claims, reducing measured output while delivering much the same service customers buy insurance for. These complex relationships make interpretation of measured trends challenging.
An additional complexity is that, to the extent to which gross output is over/under estimated, productivity, both labour and MFP will be over/under stated. However, as long as such over/under estimation is consistent (remains a constant share of gross output) growth rates, which are the focus of productivity analysis, are unaffected. Given the trends in FISIM, it may well be the case that both the level and the growth in productivity may be overestimated in Finance, at least since the GFC, suggesting additional caution is required in interpreting Finance productivity statistics.
Reliable measurement of gross output is only the first step in measuring productivity. The second step is measurement of value added (gross output less intermediate inputs). This requires estimating intermediate inputs for each industry. Such estimates are available for three sub-divisions — Finance, Insurance and Superannuation, and Auxiliary services. One of the distinctive features of FIS is the relatively high use of its own output as input into
32 STAFF RESEARCH NOTE
the sector. Changes in the extent of outsourcing of services to other sub-divisions can mean considerable shifts in value added at the sub-division level, that are masked at the sector level. However, changes in value added arising from changes in outsourcing shares should not affect productivity estimates directly as a rise (fall) in outsourcing should be accompanied by a matching fall (rise) in labour and capital inputs. A rise in intra-sector outsourcing should raise FIS productivity (as it should be motivated by profit and so require less inputs per unit output), but to the extent that outsourcing is motivated by a shift to cheaper rather than less, labour productivity (output per hour worked) does not improve. Separation off intermediate inputs into Insurance and Superannuation would assist in interpreting these trends.
The third step in estimating productivity is measurement of capital and labour inputs. As discussed, MFP can only be estimated for two sub-divisions — Finance, and ISA. This is because capital can only be reliably estimated at the sector level and for Finance — capital for ISA is the difference between the two. The very different trends in gross output for the each of the industries that make up ISA suggest that productivity patterns could be very different across these industries. Without capital data at the sub-division level this cannot be investigated.
These measurement issues make the interpretation of productivity statistics in the FIS sector a complex task. The relatively strong productivity performance of FIS over a considerable period is largely due to strong output growth combined with considerable labour saving at various points in time. This aligns with the growth of the sector from 6 per cent in the early 1990s to 9 per cent of Australia’s GDP in 2012-13. However, the measurement issues do raise a number of questions about the real performance of the individual industries in the FIS sector, and just what value they have delivered to consumers and the economy.
PRODUCTIVITY IN FINANCIAL AND INSURANCE SERVICES 33
References ABS (Australian Bureau of Statistics), —— 2006, Australian and New Zealand Standard
Industrial Classification, 2006, Cat. no. 1292.0, ABS, Canberra.
—— 2013a, Australian System of National Accounts: Concepts, Sources and Methods 2013, Cat. no. 5216.0, ABS, Canberra.
—— 2013b, Labour Force, Australia, Detailed, Quarterly, November 2013, Cat. no. 6291.0.55.003, ABS Canberra.
—— 2013c, Australia System of National Accounts, 2012-13, Cat. no. 5204.0, ABS, Canberra.
—— 2013d, Australian National Accounts: Input-Output Tables, 2009-10, Cat. no. 5209.0.55.001)
—— 2014a, ‘Explanatory Notes’, Counts of Australian Businesses, including Entries and Exits , Jun 2009 to Jun 2013, Cat. no. 8165.0.
—— 2014b, Estimates of Industry Multifactor Productivity, 2012-13, Cat. no. 5260.0.55.002, ABS, Canberra.
APRA (Australian Prudential Regulation Authority) 2012, APRA Insight, Issue 1, Sydney.
—— 2013, Annual Superannuation Bulletin, June, APRA, Sydney.
2014a, APRA’s Submission to the 2014 Financial System Inquiry (Murray Inquiry), http://www.apra.gov.au/Submissions/Pages/14_01.aspx (accessed 30 September 2014).
—— (Australian Prudential Regulation Authority) 2014b, National Claims and Policy Database, http://www.apra.gov.au/GI/Publications/Pages/NCPD-Reports.aspx (accessed 11 September 2014).
ASFA (Association of Superannuation Funds of Australia) 2014, First round submission to the Financial System Inquiry, Sydney.
Barnes, P. 2011, Multifactor Productivity Growth Cycles At the Industry Level, Productivity Commission Staff Working Paper, Canberra.
——, Soames, L., Li, C. and Munoz, M. 2013, Productivity in Manufacturing: Measurement and Interpretation, Productivity Commission Staff Working Paper, Canberra.
Basu, S., Inklaar, R. and Wang, J.C. 2011, ‘The Value of Risk: Measuring the Service Output of U.s. Commercial Banks’, Economic Inquiry, vol. 49, no. 1, pp. 226–245.
Colangelo, A. and Inklaar, R. 2012, ‘Banking sector output measurement in the Euro Area: A modified approach’, Review of Income and Wealth, vol. 58, no. 1, pp. 142–165.
Commonwealth of Australia 2006, Simplified Superannuation - Final Decisions, 5 September, Canberra, http://www.simplersuper.treasury.gov.au/documents/decision/ html/final_decision_full.asp (accessed 29 October 2014).
CPA Australia 2009, Self-managed super funds insights, November, Melbourne.

34 STAFF RESEARCH NOTE
Gordon, J., Zhao, S. and Gretton, P. 2015, On productivity: concepts and measurement, Staff Research Note, Productivity Commission, Canberra.
Haldane, A., Brennan, S, and Madouros, V. (2010), 'What is the contribution of the financial sector: Miracle or mirage?', in Turner et al (2010), The Future of Finance: The LSE Report, London School of Economics and Political Science, available at http://harr123et.files.wordpress.com/2010/07/futureoffinance-chapter21.pdf.
Industry Super Australia 2014, ISA Submission: Exposure Draft: Corporations Amendment (Streamlining of Future of Financial Advice) Bill 2014, February, Industry Super Australia, Melbourne.
Insurance Council of Australia 2014, Disaster statistics, http://www.insurancecouncil.com.au/industry-statistics-data/disaster-statistics/historical -disaster-statistics (accessed 12 September 2014).
KPMG 2008, General Insurance Industry Survey 2008, http://www.kpmg.com/ AU/en/IssuesAndInsights/ArticlesPublications/Financial-Institutions-Peformance-Survey/Insurance/Pages/General-Insurance-Industry-Survey-2008.aspx.
Liu, K. and Arnold, B. 2012, Australian superannuation – the outsourcing landscape, Working paper, July, APRA, Sydney.
MFAA (Mortgage and Finance Association of Australia) 2010, Submission to the Senate Economics References Committee inquiry into competition within the banking Sector, November, MFAA, Neutral Bay, NSW.
Minifie, J., Cameron, T., and Savage, J. 2015, Super savings, Grattan Institute, April.
Parham, D. 2012, Australia’s Productivity Growth Slump: Signs of Crisis, Adjustment or Both?, Visiting Researcher Paper, Productivity Commission, Canberra.
PC (Productivity Commission) 2009, Submission to the House of Representatives Standing Committee on Economics: Inquiry into Raising the Level of Productivity Growth in Australia, Productivity Commission, Canberra.
—— 2013, PC Productivity Update, May, Canberra.
—— 2014, PC Productivity Update, April, Canberra.
Rainmaker 2012, Superannuation Industry Revenue Report 2012, http://www.rainmaker.com.au/research/industry_reports/superannuation
Topp, V. and Kulys, T. 2012, Productivity in Electricity, Gas and Water: Measurement and Interpretation, Productivity Commission Staff Working Paper, Canberra.
——, Soames, L., Parham, D. and Bloch, H. 2008, Productivity in the Mining Industry: Measurement and Interpretation, Productivity Commission Staff Working Paper, Canberra.
Triplett, J. E. and Bosworth, B. 2004, Productivity in the U.S. Services Sector: New Sources of Economic Growth, Brookings Institution Press.

PRODUCTIVITY IN FINANCIAL AND INSURANCE SERVICES 35
Turner, G. 2011 Depositor protection in Australia, Reserve Bank of Australia Bulletin, December Quarter 2011, pp. 45-55.
Warner, R. 2012, Superannuation Fees Research, Prepared for the Financial Services Council, Sydney.
—— 2014, FSC Superannuation Fees Report 2013, Prepared for the Financial Services Council, Sydney.