productivity management in an organization - toknowpress
TRANSCRIPT

Productivity Management in an OrganizationMeasurementand Analysis
kongkiti phusavat
ToKnowPress


Productivity Managementin an OrganizationMeasurement and Analysis
Kongkiti Phusavat

Productivity Management in an Organization:
Measurement and Analysis
Dr. Kongkiti Phusavat
Published by ToKnowPressBangkok · Celje · Lublin
Editor-in-Chief
Dr. Nada Trunk Širca
Editors
Dr. Pornthep AnussornnitisarnDr. Zbigniew Pastuszak
Editorial Board
Dr. Valerij DermolDr. Dušan LesjakDr. Anna RakowskaDr. Bordin RassameethesDr. Punnamee SachakamolDr. Agnieszka Sitko-Lutek
Senior Adviser
Dr. Kongkiti Phusavat
ToKnowPress is a Joint Imprint of
Kasetsart University, 50 NgamWongWan Rd. LadyaoChatuchak Bangkok 10900,Thailand
International School for Social and Business StudiesMariborska cesta 7, 3000 Celje, Slovenia
Maria Curie-Skłodowska UniversityPl. Marii Curie-Skłodowskiej 5, 20-031 Lublin, Poland
Distributed by
Kasetsart University, 50 NgamWongWan Rd. LadyaoChatuchak Bangkok 10900,Thailand
www.toknowpress.net
1st Edition · 2013© 2013 Kongkiti Phusavat
cip – Kataložni zapis o publikacijiNarodna in univerzitetna knjižnica, Ljubljana
005.61
phusavat, KongkitiProductivity management in an organization : measurement and analysis /
Kongkiti Phusavat. – 1st ed. – Bangkok ; Celje ; Lublin : ToKnowPress, 2013
Dostopno tudi na: http://www.toknowpress.net/ISBN/978-961-6914-05-5.pdfDostopno tudi na: http://www.toknowpress.net/ISBN/978-961-6914-06-2/flipbook.html
isbn 978-961-6914-04-8isbn 978-961-6914-05-5 (pdf)isbn 978-961-6914-06-2 (html)
268600320

Contents
List of Figures · 7
List of Tables · 9
Foreword · 13
Preface · 17
Opening Remarks to Students · 21
1 Productivity Overview · 23
Introduction · 23
Historical Development and Current Business Practices · 24
Overview onMeasuring Productivity · 30
Value-Added and Productivity Measurement · 39
Productivity Measurement in Emerging Business Environment · 43
Exercises · 46
References and Further Reading · 47
2 Creating aManagement System · 49
Building a Management System · 52
Learning from Integrating Productivity/Performance Measurement
in a Management System · 57
Performance Measurement and Management Process · 62
Exercises · 72
References and Further Reading · 72
3 Creating Productivity Network through an Integrated
Approach · 75
Introduction to Productivity Network Concept · 76
Case Demonstration · 79
Key Application Consideration for Productivity Network · 91
Exercises · 93
References and Further Reading · 93
4 Multi-Factor Productivity Measurement Model · 97
Introduction · 98
mfpmm Formulations and Case Study · 101
mfpmm Illustration · 113
Exercises · 127
References and Further Reading · 128
5

6 Contents
5 Multi-Criteria PerformanceMeasurement/Analysis
Technique · 131
Introduction and Illustration · 132
mcpmt Application · 134
Use of mcpmt to Interpret Productivity · 137
Exercises · 143
References and Further Reading · 144
6 Ratio Development as Productivity Surrogates · 145
Applications of Input/Output Analysis · 147
Productivity Surrogates · 148
Audit to Verify and Improve Proposed Ratios · 154
Exercises · 154
References and Further Reading · 157
7 Productivity Analysis through Case Demonstrations · 159
Productivity Analysis with Trends · 160
Productivity Analysis with Benchmarking · 162
Productivity Analysis within the Context of Strategy Map · 166
Business Process Reengineering:
Illustration of the One-Stop Services · 174
Exercises · 180
References and Further Reading · 181
8 Research in Productivity Measurement · 183
Productivity Measurement and Business Strategies · 184
Designing Productivity Measurement: Key Consideration Factors · 193
Value added Productivity Measurement: Applications and Insights · 197
References and Further Reading · 204
Conclusion · 207
Final Remarks · 211
Biographical Notes · 213

List of Figures
1.1 Customer Satisfaction of lccs (Southwest Airlines) · 29
1.2 Labor Productivity’s International Comparison by Bureau of Labor
Statistics · 32
1.3 Impacts from Productivity Improvement on Unit Cost by Bureau
of Labor Statistics · 32
1.4 Indicators Reflecting a Plant’s Productivity Level with the
Percentage of Rework and of Return · 35
1.5 Interrelationships between Productivity and Other Performance
Areas · 35
1.6 Surrogate of Productivity Measurement for White-Collar
and KnowledgeWork · 38
1.7 Computation of Value Added · 43
2.1 Input and Output Viewpoints from aManager · 52
2.2 Input and Output Viewpoints from Domain of Responsibility · 53
2.3 Input and Output Viewpoints from Organization’s ict · 53
2.4 Illustration of a Management System · 53
2.5 msm with Consideration into External Environment · 55
2.6 Key Factors for an Effective msm · 57
2.7 Productivity Information in the Graphical Format · 60
2.8 Quality Information in the Graphical Format · 60
2.9 Quality of Work Life Information in the Graphical Format · 60
2.10 Performance Measurement and Management’s Roles · 63
2.11 Increasing Levels of Complexity from Performance
Measurement · 67
2.12 Shift towards External Use · 69
3.1 Use of a Ratio-format Indicator for a Network · 76
3.2 Illustration of Productivity Network for a Service Provider
(Bus Company) · 77
3.3 Illustration of the First Rule · 77
3.4 Illustration of the Second Rule · 77
3.5 Demonstration of Input-Output Analysis and Productivity
Networks · 80
3.6 Illustration of Productivity Network #1 · 82
3.7 Illustration of Productivity Network #2 · 83
3.8 Illustration of Productivity Network #3 · 84
3.9 Illustration of Productivity Network #4 · 85
3.10 Illustration of Productivity Network #5 · 86
7

8 List of Figures
3.11 Driving Factors for Labor Productivity · 90
3.12 Performance Network of the Company (Exercise 3.3) · 94
4.1 Scope of the mfpmm in a Management Process · 98
4.2 Background of the mfpmm Development · 100
4.3 Graphical Presentation on Productivity, Price-Recovery
and Profitability · 110
4.4 Identification of the Inputs and Outputs for Boat Production · 117
5.2 Illustration of Preference Curve for il1 · 137
5.3 Scope of the Case on Productivity Analysis · 139
5.4 Preference for the Productivity and qwl Ratios · 141
5.5 Scattering Plot for Productivity—qwl Relationships · 143
5.6 Impacts from qwl on Productivity with the mcpmt
Application · 143
6.1 Extended Input/Output Analysis · 148
6.2 Details of the Extended Input/Output Analysis
at Various Levels · 151
6.3 Details of the Extended Input/Output Analysis
for a Public University · 156
7.1 Benchmarking Parameters for Supplier Improvement · 165
7.2 Interrelationships among bsc’s Perspectives · 170
7.3 Productivity and Strategy Map Development forThree
Suppliers · 175
7.4 Entry to the Branch Office at the Big C Hypermarket · 180
8.1 Research Methodology · 185
8.2 Scattering Plot between Delivery and Quality · 192
8.3 Illustration of Scattering Plot between Delivery and Productivity
for Circumstance 1 · 192
8.4 Illustration of Scattering Plot between Quality and Productivity
for Circumstance 1 · 192
8.5 Prioritized Design Criteria for Productivity Measurement · 197
8.6 Interrelationships between Capital Share (x8)
and Profitability (y) · 202

List of Tables
1.1 Demonstration of Productivity Information from us Bureau
of Labor Statistics · 31
1.2 Summary of Productivity Measurement · 39
1.3 Value Added Definitions · 43
2.1 Measuring Productivity, Quality, and Quality of Work Life · 59
2.2 Productivity Information in the Tabular Format · 61
2.3 Quality Information in the Tabular Format · 61
2.4 Quality of Work Life Information in the Tabular Format · 61
2.5 Past and Present Viewpoints on Performance Measurement · 66
2.6 Future Viewpoints on Performance Measurement · 68
2.7 Performance Measurement Summary · 71
3.1 Illustration of Initial Network’s Statistical Analysis · 87
3.2 Illustration of Revised Network’s Statistical Analysis · 88
3.3 Final Regression Equations derived from stt’s Productivity
Network · 89
3.4 Data for Developing a Productivity Network (Exercise 3.4) · 93
4.1 Demonstration of Key Features in the mfpmm · 102
4.2 Base and Current Periods for the mfpmm Implementation · 104
4.3 Dimensional Units for the mfpmm Application · 105
4.4 Overall Results on Productivity, Price recovery, and
Profitability · 109
4.5 Demonstration of Statistical Analysis · 110
4.6 gpo’s mfpmm Demonstration · 114
4.7 Initial mfpmm with Quantity, Unit Price and Cost, and Financial
Value · 118
4.8 mfpmm’s Applications—Weight Change and Cost-to-Revenue
Ratios · 119
4.9 mfpmm’s Applications—Productivity Change and Dynamic
Ratios · 121
4.10 Opportunity Concept in the mfpmm · 125
4.11 Base Period and Current Period for the mfpmm · 128
4.12 Units of Measurement for the mfpmm Application · 128
4.13 Productivity, Price-Recovery and Profitability Values from
2004–2009 · 129
4.14 Summary of the Outputs in terms of anova Table · 129
5.1 Productivity Ratios for the mcpmt Applications · 133
5.2 Demonstration of the Values from the Scale of 0 to 100 · 134
9

10 List of Tables
5.3 Determination of Overall Productivity Levels from the 0–100
Scale · 135
5.4 Illustration of the Results from Individual Innovation Ratios · 136
5.5 Preference Curve Formulation · 137
5.6 Conversion to a Common Performance Scale of 0–100 · 138
5.7 Overall Level of Innovation · 138
5.8 Productivity and qwl Ratios · 140
5.9 Partial Demonstration of the Performance Scale and the Value
from the Preference Curve for a Productivity Ratio · 140
5.10 Partial Demonstration of the Performance Scale and the Value
from the Preference Curve for a qwl Ratio · 141
5.11 Weighted Average Scores for Productivity (Scale 0–100) · 142
5.12 Weighted Average Scores for qwl (Scale 0–100) · 142
5.13 Data for Applying the mcpmt · 144
6.1 Quality Measurement as a Productivity Surrogate for a Service
Delivery Firm Description · 149
6.2 Overall Framework when Identifying the Ratios · 155
6.3 Demonstration of Audit to Ratio Verification and
Improvement · 155
6.4 Ranking Comparisons of 5th Pillar, 12th Pillar, and Overall Global
Competitiveness Index or GCI during 2009-2010 · 156
7.1 Benchmarking Parameters for Supplier Improvement · 164
7.2 Common Ratios for Strategy Map Development · 168
7.3 Demonstration of the Results from Supplier 1’s Innovation
and Learning Perspective · 170
7.4 Preference Curve Formulation for Supplier 1’s Innovation
and Learning Perspective · 171
7.5 Demonstration of Common Performance Scale of 0–100 · 172
7.6 Classifying Common Ratios into Ten Focus Areas · 173
8.1 Survey Questions on Manufacturing Strategies · 186
8.2 Survey Questions on Supplier-Selection Strategies for
Maintenance Services · 188
8.3 Survey Questions on Perceived Importance of Productivity · 189
8.4 Results on Manufacturing Strategies · 189
8.5 Results on Supplier-Selection Strategy for Maintenance
Service · 190
8.6 Correlation Analysis between Manufacturing and Supplier
Selection Strategies · 190
8.7 Circumstances between Manufacturing and Supplier-Selection
Strategies · 190
8.8 Correlation Analysis between Circumstances and Productivity · 191
8.9 Summary onWhen-to-Measure Productivity · 192

List of Tables 11
8.10 Profiles of Participants · 193
8.11 Prioritization on Design Criteria · 195
8.12 impl Results · 195
8.13 Weight Assigned on the Set of Design Criteria · 196
8.14 Partial Illustration of Data for the Company under Study · 200
8.15 Illustrations of Value Added and Profits from the Company
under Study · 200
8.16 Key Variables for Examining the Interrelationships between
Productivity and Profitability · 200
8.17 Information from Key Indicators (Variables) · 201
8.18 Results from the Pearson Correlations · 201
8.19 Results of Regression Analysis · 202
8.20 Demonstration of the Quadratic Equation Model · 202


Foreword
As a professor of Industrial Engineering and Management, I’m de-
lighted to see that this book or dossier has been written. Productivity
and quality have been the two major driving forces behind the Indus-
trial Engineering discipline through past decades and those will be the
main issues in the coming decades as well. The book/dossier covers
in well thought form major issues of performance and productivity
measurement and analysis. The presented ideas and examples are ap-
plicable equally in industrial companies as they are in public sector
organizations like universities. This book/dossier gives certainly the
reader new ideas how to use variousmethods to improve performance
and productivity in organisations both private and public. What I par-
ticularly like about the book/dossier is that the examples aren’t trivial
ones designed to illustrate a simple point, but are potentially useful in
their own right. The way that different approaches are considered will
reward the reader who wants to develop a deeper understanding of
how address the challenge of performance measurement and analysis.
This book/dossier is resulted from collaboration between academic
professionals around the world. Dr. Kongkiti Phusavat has been the
centre point in this work and I have been very fortunate to have the op-
portunity to be part of his network. This collaboration will not end by
the publishing this book butwill get extra energy from this publication.
The ideas fromthis book/dossierwill beutilized in various forms inFin-
landwhen looking for improvements in performance and productivity.
Themost obvious customers will be the teachers, researchers and stu-
dents of Industrial Engineering and Management in the Finnish uni-
versities.The ideas give also a good boost to further academic research
in the areas of covered in the book.
I would like to use this opportunity to thank and congratulate my
dear friendKongkiti for his extra efforts to put this publication together
and at the same time all those who have contributed in the various re-
search projects and articles that part of this book/dossier.
Dr. Pekka Kess
Department of Industrial Engineering and Management
Faculty of Engineering, University of Oulu, Finland
13

14 Foreword
Kongkiti Phusavat’s text/dossier on productivitymanagement is highly
useful material for any manager working within service and opera-
tions. This set of re-printed articles, published in international aca-
demic journals, introduces the concept of productivity from both anal-
ysis and measurement point of view. Practical tools and case studies
arepresentedwith illustrativenumerical examples.Dr. Phusavat shows
how the productivity concept can unleash hidden performance in dif-
ferent organizations, from local SME’s to large multinationals, from
manufacturing and outsourced operations to service business, r&d
organizations, and public services. The dossier is a continuum in ad-
vances of productivity management, and clearly pushes the frontier in
this important field of industrial engineering.
For scholars or researchers, this dossier can assist their academic
teaching and research interests in the areas of performance/produc-
tivity measurement and analysis. Dr. Phusavat’s text is great material
used in advanced level executive education, and based on my past ex-
periences it is very useful for consultants when developing a manage-
ment system—especially performance/productivitymeasurement and
analysis—to an organization. This text will make it easier for practi-
tioners to apply performance/productivity measurement and analysis.
Frommyviewpoint, the dossier dealswith a topic issue, and comeupat
the time when the knowledge on performance/productivity measure-
ment and analysis is needed.
Dr. Petri Helo
Logistics Systems Program, Department of Production
Faculty of Technology, University of Vaasa, Finland

Foreword 15
TheManagementSystemsEngineeringbalances andblends thehuman
and technical elements of the organization applies tools and skills to
work processes, and transforms data into information for its users. A
well-designedmanagement systemallowsmanagers andother users to
navigate and control complex organizations and their processes, from
manufacturing toknowledge-based enterprises. Aspart of themanage-
ment systems framework, performancemeasurement is a key element
providing input on the performance of the workforce.
In their early days, industrial engineers were known for time-motion
studies. The field of industrial engineering has moved far beyond the
mere observation of humanmotion in theworkplace. In today’s service
andknowledge-based economy,measuringperformanceof thehuman,
white collar workforce is an inherently difficult challenge.
The followingworkwill provide anoverviewanddiscusses recent de-
velopments inmanagement systems theory. Dr. Kongkiti Phusavat has
advanced the theory and practice ofmanagement systems engineering
in general and performance measurement in particular. His academic
papers document his contribution to the academic world. Numerous
organizations in Thailand and beyond have benefited from his work.
Good theories find their way into practice.
Dr. Christian Wernz
Management Systems Engineering Program
Grado Department of Industrial and Systems Engineering
College of Engineering, VirginiaTech, usa

Preface
As one of the four traditional engineering disciplines (in addition to
Civil, Mechanical, and Electrical Engineering), Industrial Engineering
or ie has gradually evolved since the introductionof ScientificManage-
ment by Frederick Taylor, and Frank and Lillian Gilbreths in late 1800s
and early 1900s. At the beginning, the focuswas onhow to improve pro-
ductivity at the individual level, especially those who were refereed to
as blue-collar. At that time, theymade up themajority of theworkforce.
Given the continuous growth in global population in the early 1900s, in-
dustrial engineers constantly involved with the task of increasing pro-
ductivity. This was accomplished mostly by better designs on motion,
movement, and supporting tools and instruments in assembly or pro-
duction lines.
DuringWorldWar ii, industrial engineerswere called to extend their
knowledge from the individual to operational levels (i.e., assembly line,
plants, production, etc.). Applied mathematics and statistics to opti-
mize production and to minimize resource consumption were one of
many highlights of ie as the us was fighting the war in two fronts—
Europe and Asia. Standardization efforts were extended from individ-
ual work into system design and development. After World War ii, in-
dustrial engineers began to focusmore efforts on the areas ofmanufac-
turing and production as economic growth and prosperity helped con-
tribute to the higher international demands. Research into new ma-
terials for industrial and consumer products, and applied technology
in manufacturing systems represented some of the primary tasks un-
dertaken by industrial engineers then. Included were the design issues
relating to assembly lines, production systems, scheduling, forecasting,
inventory, layouts, and workflows.
In 1970s, the service sector began to increase its share in economic
wealth and employment. As a result, industrial engineerswere required
to adapt their backgrounds for this new challenge. Systematic think-
ing became the norm of industrial engineers as they had to deal with
complex situations. Furthermore, the concerns relating to productivity
losses and poor quality attracted a lot of attention among scholars and
researchers in the field of ie. At the same time, more calls were made
to ensure that productivity at the functional and organizational lev-
17
18 Preface
els continued to improve.This was highlighted by the establishment of
American Productivity Center in late 1970s and its initiatives in devel-
oping several productivity-measurement techniques. These initiatives
had led to several ongoing practices such as benchmarking and best
practices. To reflect that high performance was attributed to produc-
tivity and quality, the center is now known as American Productivity
and Quality Center.
Since 1980s, industrial engineers have been a champion in promot-
ing effective process management in two areas, operation and man-
agement. The emerging importance of knowledge-intensive business
units, widely used in Finland and Scandinavian countries, has high-
lighted the need of excellent management processes with timely per-
formance information, decisions, and improvement interventions. As
a result, several well-knownuniversities such asVirginia Tech’s Depart-
ment of Industrial and Systems Engineering generally have four major
areas for academic teaching and research focus. They are human fac-
tors, operation research, manufacturing, and management systems.
A management process has become more important due to some
of the following reasons. In the past, personal experiences may over-
shadow the importance of performance information when making
decisions or taking actions. Given the comprehensive integration of
knowledge management in an organization, the use of information
for managerial decisions and actions has become more prominent.
Furthermore, due to the improvement in information and communi-
cation technology, databases have become more flexible and robust.
Information generated from these databases has become more user-
friendly. Moreover, the pressure on good governance and accountabil-
ity has resulted in the increasing use of performance measurement—
continuously generating information based on decisionsmade and ac-
tions taken to improve operational and organizational performance.
A management process helps describe the foremost responsibility
for all managers. It illustrates that a manager should be accountable
for his/her decisions and actions as their impacts need to be con-
tinuously measured. More importantly, a management process helps
drive organizational missions, policies, and objectives. In addition, a
management process strengthens organizational capability to over-
come current competition and to better prepare for future endeavors
in the globalization era. Therefore, an effective management process
should benefit any organization operating under financial limitations,
Preface 19
demographic changes, changing expectations of customers and/or
citizens.
Finally, thanks to the three famous statements (“you cannot man-
age what you cannot measure, you cannot measure what you cannot
define, and you cannot define what you do not understand”) made
by Deming (1986), people have recognized the roles and contributions
of ie for this aspect. It is nevertheless important to recognize that
the management system areas are still emerging and developing as an
organizational system continues to be more complex. Other research
subjects in the management system consist of system design and de-
velopment, new product development, quality management, applied
decision theories, process reengineering, and ownership and life-cycle
management, self-managed and autonomous work teams, knowledge
management, others.


Opening Remarks to Students
Thebookaims tobuild the foundationandunderstandingof productiv-
itymanagementwhichhas remained critical for anorganization’s long-
term competitiveness. It has several components, including histori-
cal development, contemporary management issues, research, tools
and techniques, and case demonstrations. The textbook should help
the students visualize several pertinent issues such as what to mea-
sure, where to measure, how to measure, and when to measure perfor-
mance/productivity.
This textbook is based on a series of research completed by doctoral
and master-degree students over the years with strong collaboration
from private firms, state enterprises, and relevant public agencies, in
particularThailand’s Ministry of Industry and Office of the Public Sec-
tor Development Commission. In addition, the case demonstrations
are derived from the academic articles that have been published in the
journals which employ vigorous double-blind reviews. These publica-
tions had taken place during 2006–2013.
The textbook is designed for the fourth-year undergraduate and the
graduate students. It has been used at Thailand’s Kasetsart University,
especially 206447 (Productivity Measurement and Management) and
206557 (Productivity Management), and Engineering Management’s
222531 (Performance Measurement, Assessment, and Analysis). In ad-
dition,most subjects in the text have been part of the lectures taught at
Finland’s VaasaUniversity andOuluUniversity, India’s Institute ofMan-
agement Technology—Ghaziabad, Poland’s Maria Curie-Skłodowska
University, Slovenia’s International School of Social and Business Stud-
ies, Taiwan’s National Chung Hsing University, USA’s Virginia Polytech-
nic Institute and State University or Virginia Tech.
21


Chapter One
Productivity Overview
Introduction
The chapter deals with the historical development and current busi-
ness practices. From its inception in late 1800s, as a result of the global
industrial revolution, the term productivity has been recognized for its
contribution to operational, organizational, industrial, and national
competitiveness. It implies how well the resources are utilized for
goods and service generation (and, from the national perspective, the
wealth generation). The use of productivity as a strategic objective in
a business is illustrated through the growing importance of low-cost
carriers.The chapter continues to focus on productivitymeasurement.
The overview on current practices relating to productivity measure-
ment is described. The illustrations on how productivity is measured
are provided. The following section focused on the term value added
which has been recently popular for productivity measurement, espe-
cially at the organizational level. The definitions are clearly described.
Finally, the last discussion section describes the emerging trends relat-
ing to an organization’s productivitymanagement within the emerging
business environment. Specifically, the roles of knowledgework in con-
tributing to organizational productivity are discussed.
The term productivity measurement has examined in various fields
of study including Economics, Accounting, Management, Psychology,
Human Resource Management, and Industrial Engineering. When fo-
cusing on the industrial, national, and international levels, the term
productivity is used to indicate the level of industrial competitiveness
and the ability tomaintain low inflationwithout extensive governmen-
tal support. In fact, in the us, Bureau of Labor Statistics monthly re-
leases an overall productivity level which is regarded as one of themost
closely watched information. The accountants, human resource man-
agers, and executives alike are always concerned about the organiza-
tional productiveness as it indicates the ability raise the salary and
wages without a great deal of effects on the selling price.
The higher productivity level implies the lower operating cost. In
other words, being productive is equivalent to being competitive. In-
23

24 Chapter One
dustrial engineers have always been associated with productivity since
its key founding members invented this term back in the late 1800s.
From the individual and system level, industrial engineers are expected
to look for a better way to reduce the use of resources while increasing
the outputs that one generates. For individual workforce, the motion
and efforts need to be used wisely while, at the system level, the wastes
(of time and others) should be minimized.
Productivity measurement and analysis have gained more recogni-
tion from researchers and higher acceptance from practitioners over
the past three decades. It has evolved from merely linking individual
and accounting-related to more comprehensive information that con-
tains both financial and non-financial information. “You cannot man-
age what you cannot measure,” by Deming (1986), have been continu-
ously repeated over the past three decades by the shakers and movers
in the field of engineering and management. This is due to the general
belief that the selection of productivity (as well as other performance
aspects) measures is one of the greatest single determiners of an orga-
nization’s effectiveness as a system.
The need to improve productivity measurement is apparent in both
manufacturing and service industries. For examples, the Master Plan
for Thai Automotive Industry for 2006–2010 by Thailand Automotive
Institute in cooperation with the Federation of Thai Industries (pub-
lished on February 28th, 2006) highlighted the continuous productiv-
ity improvement through comprehensive measurement and analysis.
Many organizations have used productivitymeasurement as a primary
tool for communicating future directions, establishing functional and
project accountability, defining the roles and responsibilities, allocat-
ing the limited resources, monitoring and evaluating the activities,
linking among key organizational processes, establishing the targets
and benchmarks, and initiating necessary changes to ensure continu-
ous improvement.
Historical Development and Current Business Practices
Productivity is defined as outputs divided by inputs (Taylor, 1911; and
Barnes, 1980). It has always been recognized this way since the term
was first mentioned in the late 1800s. The outputs represent products
and goods (and later services) generated while the inputs include key
resources used for this generation, especially in the immediate fac-
tors such as labors,materials, andmachines. Productivity indicates the

Productivity Overview 25
ability of all related activity to produce. Instead of independently and
separately focusing on the input and output sides, productivity repre-
sented a major philosophical shift in how a work system (including a
workstation, an assembly line, a process, and a plant) would be ana-
lyzed for continuous improvement.
When dividing the outputs by the inputs, the implications show how
well the inputs (which can be described as the resources) are utilized in
order to generate the outputs. These implications help shape the anal-
ysis from the improvement perspective. Simply put, improving the use
of the resources must show the impacts on the outputs. It is impor-
tant to note that if the definition is reserved (i.e., indicating howmuch
resources needed in order to generate one output unit), the analysis
could be looked at from the control viewpoint—to control the use of
resources during the production.
Initially, productivity measurement and analysis focused on the in-
dividual level, especially at the assembly and production lines (Takala,
Suwansaranyu, & Phusavat, 2006). The pressure to increase the prod-
uct volumes while lowering and/or maintaining the production cost
helped underline the importance of productivity and the linkage with
business planning. Individualistic viewpoint (in reference to craft or
skill production—uniqueness) needed to be transformed into what is
known today as mass production—uniformity. After the improvement
in medical treatments in the early 1800s, the world population had in-
creased rapidly. This increase resulted in the higher demands for the
basic goods, fueling the growth in the textile, tobacco, and ship build-
ing industries.
Coupled with the Industrial Revolution, the advancement and ap-
plications in machinery for production and transport resulted in the
increase of large-scale ormass production lineswhich could be catego-
rized as labor intensive. Often, the colonization period in Africa, Asia,
and South America represented an example which highlights the at-
tempt to secure natural resources, rawmaterials, and labors in order to
assure theability toproduce thegoods inamassive scalewith little cost.
These large-scale production lines, which consisted of labors and ma-
chines, underlined two important needs. The first need dealt with the
product uniformity for consumers across the countries and continents.
This uniformity requirement, under the mass production scheme, led
to the need to have work standards to be followed and practiced by all
workers alike. Standardization was associated with this attempt.

26 Chapter One
Because ofmore international trades and economic liberalization in
the early 1900s, the competition forced the companies to constantly fo-
cuson the ability tomaintain and/or lower their production cost. At the
same time, due to past exploitation and suppression (e.g., poor and un-
safe working conditions, and unfair labor wages and practices), labor
unionswere formed to counterbalance the owner side. Relying primar-
ily on cost control (e.g., labor wages) has greatly contributed to produc-
tion stoppages, labor strikes and unrests. As a result, new regulatory re-
quirements were passed to protect the workers’ rights. By then, a new
philosophy begins to emerge.
The new philosophy was based on the premise that the labor wage
could be substantially increased without the increase in the product
price—which meant that a firm could still retain and/or increase its
market share. To achieve the higher production rate did not necessar-
ily suggest that more labors and machinery will be needed. The good
design based on the scientific study (i.e., the use of human motions
and theunderstandingof humancapability and limitations) can lead to
higher production’s outputs. This eventually became the essential part
ofmotionand time studywhichhas later beenusedalongwith the term
Scientific Management.
The term productivity became a permanent footprint in an organi-
zation during the World War ii in which there was a need to increase
the volume of war-fighting machines produced (e.g., aircrafts, tanks,
and ships) under limited resources (as a result of enlisting the fighting
workforce). Productivity was widely used as the feedback to determine
howwell and effective the limited resources (e.g., labors,materials,ma-
chineries, and facilities) had been utilized to produce the outputs to
help fight the wars in the Atlantic and Pacific theatres simultaneously.
Key terms and tasks relating to productivity such as work manu-
als, standardization, interchangability, workspace, production stop-
pages, machines’ set up, inventory, inbound and outbound, and quan-
titative analysis emerged. This productivity improvement has contin-
ued after the war as the Marshall Plan requires massive reconstruc-
tion to ensure peaceful transition in the western part of Europe and
Japan. The us industries used productivity as a yardstick to monitor
the progress in their production and operational systems (i.e., by re-
porting the yield and inventory turnover information as well as ma-
chine downtime and system availability). The efforts on eliminating
the wastes such as waiting time, rejects, returns, rework, and work-in-

Productivity Overview 27
process constantly linked to productivity improvement. From the past
to the present, the business practices have often focused on productiv-
ity as one of the key strategic objectives. Cost competitiveness in the
globalization era has contributed to long term business success. Boe-
ing (www.boeing.com) has been able to sustain its business success
and global footprint through various strategies, and mergers and ac-
quisitions (e.g.,McDonnell Douglas’s take over in 1997).Throughout the
years, productivity has been an integral part of its business strategy.
Specifically, for new product development, the focus is on the life-
cycle design which considers commonality and interchangeability.
These twoconsideration factorshavehelped ensure: (1) less design time
due to familiarity of parts, (2) less production set up, (3) larger order
quantities from suppliers and contractors resulting, (4) less time for
users to learn and operate new aircraft, (5) more availability of spares
in the marketplace, etc. It is part of the win-win strategies for Boeing
and its customers and suppliers/contractors. Boeing’s assembly plants
have becomemore productivewhile the aircrafts are productively used
by the airlines. Many of the support aircrafts for military operations
have also adapted this practice (Blanchard, 208).
For examples, newBoeing 737s have over 60% commonparts to each
other which results in less cost for Boeing and the airlines, improved
productivity at Boeing’s assembly line and the airlines’ aircraft utiliza-
tion, less time for production for Boeing, and airport turnaround time
for the airlines. The same design practice has been applied for Boeing
777 and 787. In addition, Boeing’s military versions of the Boeing 767
model have served prominently in many applications. The Boeing kc-
767 is a military aerial refueling and strategic transport aircraft which
was earlier developed from the Boeing 767-200 Extended Range or er.
The Boeing E-767 is an Airborne Early Warning and Control aircraft.
It was specifically designed in response to the Japan Air Self-Defense
Force’s requirements.This aircraft is essentially based on a Boeing 767-
200 platform.
The term productivity has been frequently used to highlight the
breakthrough into the aviation industry. The low cost carriers or lccs
started with the overall aim to ensure the productive use of two critical
assets, namely aircrafts and employees. For aircraft acquisition, lccs
have largely employed a single model strategy. It means that they only
acquire one aircraft model for the entire fleet.This decision has helped
logistics footprint (e.g., spares, technician services, training for pilots

28 Chapter One
and technicians, databases and software, handling, test and support,
etc.) and subsequently lower operating and maintenance costs. In ad-
dition, because of the high level of familiarity, the time fromacquisition
to utilization becomes less. In addition, the aircraft turnaround time
when landing and departure has been greatly reduced. This has re-
sulted in higher productivity which results in the ability to lower ticket
price for passengers.
It is important to note that Boeing 737-series (of classic such as Boe-
ing 737-300, 400, and 500, and new generations such as Boeing 737-700,
800, 900, and max) aswell as Airbus 319- and 320-family are themodels
commonly selected for lccs. Southwest Airlines (us), Lion Air (Asia),
Ryan Air (Europe), and Norwegian Air Shuttle (Europe) demonstrate
the examples of lccs which have selected Boeing 737. On the other
hand, Air Asia Group (Asia), IndiGo (Asia), and easy Jet (Europe) rep-
resent the lccs which have acquired Airbus 319 or 320 for their opera-
tions. Each of the aforementioned airlines has its fleet size ofmore than
100 aircrafts with large orders placed for future expansion of routes.
Particularly in Thailand (based on the report published by Bangkok
Post on May 13, 2013), there are two major lccs; i.e., Thai Air Asia
(which is currently using Airbus 320-family) and Nok Air (which has
selected Boeing 737-800 as its workhorse). By 2014, Nok Air expects to
haveBoeing737-800 in itsfleet inorder toaccommodatewith thegrow-
ing demands for domestic travelers. Due to the ability of consumers to
afford local air travels (thanks largely to the productivity focus and
open competition), the number of passengers flying domestic routes
have doubled from 2005–2012. Out of 17 millions domestic passengers,
lccsmakes up ofmore than 53.5%. In fact, approximately 53%of airline
seats available in Southeast Asia belong to lccs. Given the upcoming
Association of Southeast Asian Nations or asean Economic Commu-
nity in 2015, the competition among lccs (e.g., Cebu Pacific, Tigers Air,
Lion Air, etc.) in the region is expected to intensify. The airline which
exhibits the high level of productivenesswill have a competitive advan-
tage.
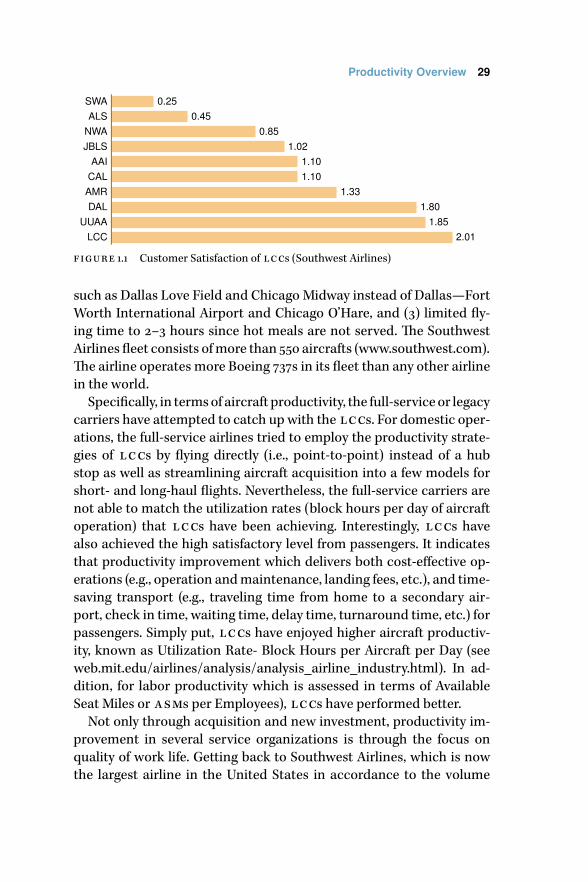
Note that there are four strategiesdeployedby theworld’s first lcc—
Southwest Airlines. They are: (1) a single aircraft model for acquisition
to reduce operating andmaintenance cost, (2) utilization of secondary
airport to help reduce landing fees and save time for passengers—since
secondary airports (more efficient and less costly as no delay on taxi-
way and during an approach) tend to be located near the city center
Productivity Overview 29
SWA 0.25ALS 0.45
NWA 0.85JBLS 1.02
AAI 1.10CAL 1.10AMR 1.33DAL 1.80
UUAA 1.85LCC 2.01
figure 1.1 Customer Satisfaction of lccs (Southwest Airlines)
such as Dallas Love Field and Chicago Midway instead of Dallas—Fort
Worth International Airport and Chicago O’Hare, and (3) limited fly-
ing time to 2–3 hours since hot meals are not served. The Southwest
Airlines fleet consists ofmore than 550 aircrafts (www.southwest.com).
The airline operates more Boeing 737s in its fleet than any other airline
in the world.
Specifically, in termsof aircraft productivity, the full-service or legacy
carriers have attempted to catch up with the lccs. For domestic oper-
ations, the full-service airlines tried to employ the productivity strate-
gies of lccs by flying directly (i.e., point-to-point) instead of a hub
stop as well as streamlining aircraft acquisition into a few models for
short- and long-haul flights. Nevertheless, the full-service carriers are
not able to match the utilization rates (block hours per day of aircraft
operation) that lccs have been achieving. Interestingly, lccs have
also achieved the high satisfactory level from passengers. It indicates
that productivity improvement which delivers both cost-effective op-
erations (e.g., operation andmaintenance, landing fees, etc.), and time-
saving transport (e.g., traveling time from home to a secondary air-
port, check in time, waiting time, delay time, turnaround time, etc.) for
passengers. Simply put, lccs have enjoyed higher aircraft productiv-
ity, known as Utilization Rate- Block Hours per Aircraft per Day (see
web.mit.edu/airlines/analysis/analysis_airline_industry.html). In ad-
dition, for labor productivity which is assessed in terms of Available
Seat Miles or asms per Employees), lccs have performed better.
Not only through acquisition and new investment, productivity im-
provement in several service organizations is through the focus on
quality of work life. Getting back to Southwest Airlines, which is now
the largest airline in the United States in accordance to the volume

30 Chapter One
of domestic passengers, it has always attempted to maintain the work
and life balance, positive feeling and attitude at the workplace, sense
of belongingness and ownership, continuous gathering of front-line
staffs’ feedback, and corporate support on strong community involve-
ment. As a result, Southwest Airlines has enjoyed higher labor produc-
tivity and, more importantly, higher customer satisfaction than legacy
or full-service carriers (see http://www.jdpower.com/content/press-
release/aOGunkG/2012-north-america-airline-satisfaction-study.htm).
Overview on Measuring Productivity
Attempts to measure profitability have come from various disciplines.
There have been many recognized approaches designed and devel-
oped by the field of economics such as the Total Factor Productivity
(also known as tfp) technique. At the organizational and functional
levels, there are several productivity measurement approaches devel-
oped such as Multi-factor Productivity Measurement Model. Included
are also financial indicators; namely Return on Assets and Return
on Investment. At the group and individual levels, there are diverse
concepts and methods, ranging from motivational approach (by in-
dustrial psychologists) and appraisals for salary structure/job assign-
ments/workload analysis (by human resource specialists), to piece-
rate and standard times (by industrial engineers) which deals with
productivity measurement and assessment (Zigon, 1998).
To highlight the importance of productivity measurement, the dis-
cussion underlines the roles of Bureau of Labor Statistics (www.bls.gov
/bls/productivity.htm). This bureau is part of the us’s Department of
Labor. Itsmain task is the collect the data for the us government in the
areas of economics, an industrial and labor-related statistics. The in-
formation frommeasuring the broad productivity levels as well as rel-
evant costmeasures have been used for economic analysis, and public-
and private-sector policy planning and initiatives. This information is
also used to assess the current and potential changes in the produc-
tion’s unit cost, selling prices, labor wages, and impacts from technol-
ogy investment. One of the bureau’s objectives is to promote produc-
tivity improvement. This improvement means the ability to produce
morewith the same or less inputwhich results an increase in an overall
national income. For the past three decades, the us economy in gen-
eral has been able to produce more goods and services with less con-
sumed resources. It does not call for proportional increased of labor

Productivity Overview 31
table 1.1 Demonstration of Productivity Information from us Bureau of Labor
Statistics
Category 1987
2011
1987
1990
1990
1995
1995
2000
2000
2007
2007
2011
2010
2011
Multifactor Productivity 0.9 0.5 0.5 1.3 1.4 0.4 1.0
Output per hour of all persons 2.2 1.4 1.6 2.7 2.6 1.9 0.7
Output per unit of capital service –0.7 –0.4 –0.4 –1.0 –0.5 –1.2 1.9
notes Multi-factor productivity information: Compound annual growth rates for
productivity, output, and inputs in the private nonfarm business and private business
sectors for selected periods from 1987–2011 (%).
time which subsequently causes a unit labor cost to decline and thus
maintain the competitiveness (Table 1.1).
The bureau primarily measures productivity in two ways:
1. Labor productivity measures output per hour of labor.The pro-
ductivity information is available for thenon-farmand theman-
ufacturing sectors, includingmining, utilities, wholesale and re-
tail trade, and services.Note thatBureauof Labor Statistics con-
ducts extensive international comparisons in regard to the out-
put per hour and unit labor costs in key manufacturing sectors
between the us and important trading partners.
2. Multifactor productivity measures output per unit of combined
inputs, which consist of labor and capital, and, in some cases,
intermediate inputs such as fuel. The productivity informa-
tion is available for 18 groups of manufacturing industries, 86
detailed manufacturing industries, line-haul railroads and air
transportation
The bureau establishes the Division of Productivity Research and
Program Development to help conducts research in order to ensure
new knowledge in existing productivity measurement concepts and
techniques as well as how to better analyze productivity information.
Newsletters, technical notes, and reports on productivity analysis and
possible future implications forAmericanbusinesses are regularly pub-
lished. These documents have also provided a comprehensive cov-
erage into four regions: northeast, south, midwest, and west. For ex-
amples, the implications include the changes in the managerial skills,
the changes in the production and operations, the changes in the re-
source allocation, and the direct and indirect impacts from research
and development and investments in new technology. Bureau of Labor

32 Chapter One
United States 5.6Canada 2.5
Australia 2.9Japan 4.8Korea 9.1
Taiwan 5.7Denmark 1.7
France 4.2Germany 3.2
Italy 0.5The Netherlands 2.5
Nowway 2.3Sweden 6.5
United Kingdom 2.7
figure 1.2 Labor Productivity’s International Comparison by Bureau of Labor
Statistics
United States–1.0Canada 0.5
Australia 2.0Japan–4.1Korea–3.5Taiwan–4.7
Denmark 2.4France–0.7
Germany 0.0Italy 2.8
The Netherlands 1.4Nowway 2.9
Sweden–1.0United Kingdom 3.5
figure 1.3 Impacts from Productivity Improvement on Unit Cost by Bureau
of Labor Statistics
Statistics has continued to release the information from productivity
measurement based on national and international studies (especially
among key trading partners around the world; see Figures 1.2 and 1.3).
For the organizational level, measuring productivity deals with both
financial and non-financial aspects. There have been several interna-
tional well-known institutions dedicated the research and study in
advancing productivity measurement and analysis. Namely, they are
American Productivity and Quality Center which was originally called
American Productivity Center (www.apqc.org), Michigan Manufactur-

Productivity Overview 33
ing Technology Center (www.mmtc.org), National Center for Public
Performance which was formally called National Center for Public
Productivity (www.spaa.newark.rutgers.edu), Asian Productivity Or-
ganization (www.apo-tokyo.org), and Singapore’ spring (www.spring
.gov.sg).
Traditionally, productivity management includes an attempt to cap-
ture and collect the output data focuses on physical quantity (e.g.,
units, pieces, and m2) and financial value. Specifically, for the physical
quantity, when the products generated and/or services provided are
generally identical, the outputs can be measured in physical units. It
is important to note that, for this circumstance, these physical units
are largely independent from price fluctuations—part of the push-
production system.On theotherhand,when theoutputs arenothomo-
geneous,many firms choose tomeasure them in terms of themonetary
aspect such as sales and/or output value (sales subtracted by inventory
on-hand for finished products).
For the input side, it by and large includes the resources used to gen-
erate the outputs. The most common inputs measured are labor, cap-
ital, materials, and others categorized as the intermediate factors. In
regard to the labor input, the data includes headcount (i.e., persons),
cost which includes wages and all fringe benefits, and time which is
typically collected in terms of hours. For the capital input, it includes
all related physical or tangible assets used to generate the outputs; e.g.,
machinery and equipment/instrument, and land and buildings. It is
commonlymeasured in ether the physical quantity (e.g. number ofma-
chines, equipment hours, and facility space) or the financial value (e.g.,
depreciation value to production equipments).
For thematerial inputs, it is normally collected the data in either the
physical unit (e.g., pieces, m2, and m3) or the financial value (e.g., pur-
chased cost). Finally, the intermediate input factors are energy, and re-
lated business and technical services (e.g., inspection, calibration, and
certification) required for generating the outputs. These inputs can be
captured in terms of the physical units (e.g. kilowatts and m3) or the
financial value (e.g. cost of energy and testing service purchased for
product release).
Generally, financial measures reflecting productivity have included
inventory turnover, Return on Investment, Return onAssets, etc. At the
same time, for technical or non-financial aspect, the measures include
production yield, labor productivity, capital productivity, equipment

34 Chapter One
utilization, machine downtime, and plant availability. During the past
two decades, productivity measurement tends to incorporate the term
downtime—includingactivemaintenance, logistics delays, andadmin-
istrative delays. Higher downtime indicates the lower level of produc-
tiveness on equipments due to a lack of utilization or usage. Availability
is also often interpreted as the proportion between operating time and
total time. For some, this term links with Mean Time between Failures
and Mean Time between Maintenance as they relate to operational
time of a machine, an assembly line, and/or a plant.
The measures, examining the waste (which is considered as the un-
desirable outputs and unwanted use of the inputs, the terms replace-
ments, returns, reworks, and rejects) are part of productivity. For ex-
amples, when a rework has to be performed, it means that a company
has one output unit while having to consume the inputs or resources
at least twice. It shows productivity decline. The similar argument can
be made for replacements, returns, and rejects. Manufacturing firms
likely pay lots of attention to these measures as they indicate the pro-
ductiveness (as well as quality). In addition to the “R” terms, the wastes
sometimes include the inventory as a result of overproduction, the de-
lay and waiting time, and the unnecessary motions of staffs and em-
ployees (Helo, Takala, & Phusavat, 2009).
Because of waste consideration, current practices in measuring or-
ganizational (as well as plant) productivity have included quality. Both
terms are widely recognized today for their interrelationships. If qual-
ity is lower (more rejects, rework, returns, and recalls), it consequently
indicates the lower level of productivity and higher unit cost of prod-
ucts.This recognition isunderlinedby thenamechange fromAmerican
Productivity Center (1977–1988) to American Productivity and Quality
Center (1988–present). In fact, the Malcolm Balrige National Quality
Award was developed in 1985 under the supervision of then American
Productivity Center.
Being productive shows that an organization is able to compete
based cost. In other words, productivity increase means a decline in
a unit cost. This decline should help strengthen a market share which
will have positive effects on future investment in labors (through train-
ing and skill development), capital (through upgrade and scheduled
upkeep), materials (through quality improvement and long-term part-
nershipwith suppliers), and intermediate factors (throughmore efforts
on reducing utility usage). Specifically, productivity deals simultane-
Productivity Overview 35
0.0
2
4
6
8
10
12
14
16
Rework ÷ OutputsReturn ÷ Outputs
1 2 3 4 5 6 7 8 9 10 11 12 13
%
Months
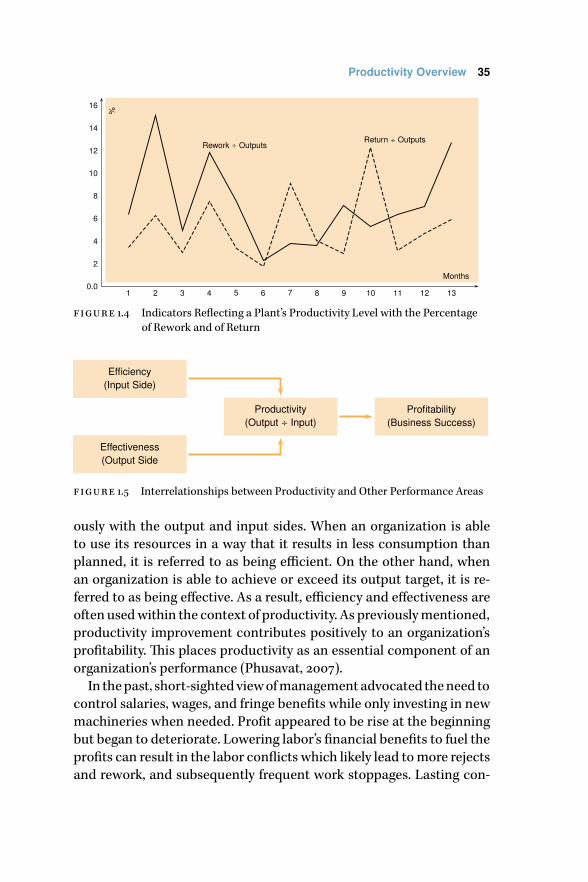
figure 1.4 Indicators Reflecting a Plant’s Productivity Level with the Percentage
of Rework and of Return
Efficiency(Input Side)
Effectiveness(Output Side
Productivity(Output ÷ Input)
Profitability(Business Success)
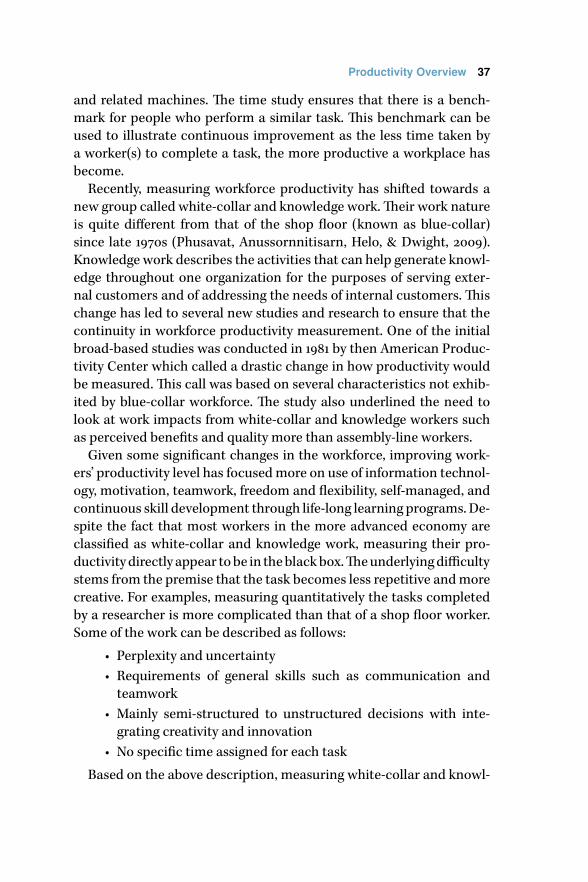
figure 1.5 Interrelationships between Productivity and Other Performance Areas
ously with the output and input sides. When an organization is able
to use its resources in a way that it results in less consumption than
planned, it is referred to as being efficient. On the other hand, when
an organization is able to achieve or exceed its output target, it is re-
ferred to as being effective. As a result, efficiency and effectiveness are
often usedwithin the context of productivity. As previouslymentioned,
productivity improvement contributes positively to an organization’s
profitability. This places productivity as an essential component of an
organization’s performance (Phusavat, 2007).
In thepast, short-sightedviewofmanagementadvocated theneed to
control salaries, wages, and fringe benefits while only investing in new
machineries when needed. Profit appeared to be rise at the beginning
but began to deteriorate. Lowering labor’s financial benefits to fuel the
profits can result in the labor conflicts which likely lead tomore rejects
and rework, and subsequently frequent work stoppages. Lasting con-

36 Chapter One
frontation andmutual distrust between labor andmanagement should
not take place. A lack of capital investment needed for upgrade and
upkeep contributed to production slowdowns, longer downtimes, and
higher costs in operation and maintenance. This negative effect will
ensure production inefficiency ( from consuming more resources than
needed) and will eventually result in a lower profit level. The only sus-
tainable way to raise profits on the continuous basis is through higher
productivity. As a firm continues to share the financial gain with staffs
and employees, to constantly invest in new technology andmachinery,
and to explore newways to reducewaste; productivitywill, without any
doubt, improve. In other words, productivity plays the key role to sus-
taining the profit level in the long run (Sink, 1985).
The initial productivity study was on the blue-collar workers. In the
early 1900s, work study attempted to combine the time study (advo-
cated by Taylor, 1911) and themotion study (promoted by Frank and Lil-
lian Gilbreth). In other words, the motion study searched for the best
way to perform an assigned task-reducing unnecessary motions and
better design of a workstation. An overall aim of the motion study was
to help maximize the outputs while inserting the least amount of ef-
forts and time by better methods. For the time study, the focus was
on establishing a standard time as a result of motion improvement.
This standard time could be used to provide the feedback on the ef-
fectiveness of motion improvements, to set production targets for a
workplace, and to determine an appropriate level of incentives for a
worker.Nowadays, both are the integral part of the termscientificman-
agement.
Today, the concept is being applied to manufacturing as well as ser-
vice firms, including banks, hotels, hospitals, and airlines. For exam-
ples, the standard times are for cleaning a guest or a patient room, and
for loading and unloading passenger’s belongings to help achieve an
aircraft turnaround time between landing and taking off. Hotels and
other businesses (especially sports) have also employed themotion and
time study in order to reduce time and fatigue.
The impact from the motion study is on matching a worker with
his/her workstation and related instruments. Matching implies a bal-
ance among a worker’s characteristics (e.g., age, height, weight, and
past injuries), the efforts inserted to complete a task, and the locations
of required instruments/equipments. The balance indicates the least
possible fatigue level and the minimized ideal time for both a worker
Productivity Overview 37
and related machines. The time study ensures that there is a bench-
mark for people who perform a similar task. This benchmark can be
used to illustrate continuous improvement as the less time taken by
a worker(s) to complete a task, the more productive a workplace has
become.
Recently, measuring workforce productivity has shifted towards a
new group called white-collar and knowledge work.Their work nature
is quite different from that of the shop floor (known as blue-collar)
since late 1970s (Phusavat, Anussornnitisarn, Helo, & Dwight, 2009).
Knowledge work describes the activities that can help generate knowl-
edge throughout one organization for the purposes of serving exter-
nal customers and of addressing the needs of internal customers. This
change has led to several new studies and research to ensure that the
continuity in workforce productivity measurement. One of the initial
broad-based studies was conducted in 1981 by then American Produc-
tivity Center which called a drastic change in how productivity would
be measured. This call was based on several characteristics not exhib-
ited by blue-collar workforce. The study also underlined the need to
look at work impacts from white-collar and knowledge workers such
as perceived benefits and quality more than assembly-line workers.
Given some significant changes in the workforce, improving work-
ers’ productivity level has focusedmore on use of information technol-
ogy, motivation, teamwork, freedom and flexibility, self-managed, and
continuous skill development through life-long learning programs. De-
spite the fact that most workers in the more advanced economy are
classified as white-collar and knowledge work, measuring their pro-
ductivitydirectly appear tobe in theblackbox.Theunderlyingdifficulty
stems from the premise that the task becomes less repetitive andmore
creative. For examples, measuring quantitatively the tasks completed
by a researcher is more complicated than that of a shop floor worker.
Some of the work can be described as follows:
• Perplexity and uncertainty
• Requirements of general skills such as communication and
teamwork
• Mainly semi-structured to unstructured decisions with inte-
grating creativity and innovation
• No specific time assigned for each task
Based on the above description, measuring white-collar and knowl-

38 Chapter One
High level of quality of work lifeProductive workforce for white-collar
and knowledge work
Productive workforce for white-collarand knowledge work
Outcomes (or quality of) of the outputside – since focusing on the time
is meaningless
figure 1.6 Surrogate of Productivity Measurement for White-Collar
and KnowledgeWork
edge workers’ productivity has to rely more on the outcomes and due
to the difficulty to quantify the outputs. Typically, knowledge workers
are researchers, instructors, financial analysts, managers and execu-
tives, etc. The outcomes can be the impacts, contributions, and con-
sequences. For examples, a researcher’s output cannot be measured in
termsof one ideaunit but should be captureddifferently; e.g., perceived
potential benefits froma research idea given the 1–5 scale, and satisfac-
tory level given the 1–5 scale. On the other hand, it is difficult to quan-
tify a specific amount of time taken to come upwith one idea since it is
subject to experiences, creativity, educational background, and others.
Given the nature of white-collar and knowledge work, several at-
tempts have been made in the past to look for the productivity’s ap-
propriate surrogate or proxy. For instance, it is probably to substitute
productivity measurement with quality of work life. It is based on a
presumption that if knowledge workers have positive feeling (e.g., mo-
tivation, energy, freedom, and happiness) about their workplace, they
become inevitably more productive. Due to its high proportion of the
entire workforce as well as growing numbers of knowledge-intensive
businesses or knowledge enterprises (e.g., software development, mar-
ket survey, testing andcertification, business advisory, and engineering
design, research, etc.), possible applications of a surrogate for produc-
tivity measurement is deemed more prominent. Indeed, the focus on
measuring white-collar or knowledge workforce productivity has been
about quality and/or the output side—on-time submission with satis-
factory of the outcomes. The argument for this premise is that, due to
the uncertainty and challenge of work as well as more flexible and au-
tonomous working hours, focusing primarily on the input sidemay not
be meaningful.

Productivity Overview 39
table 1.2 Summary of Productivity Measurement
Level Productivity Measurement Approach Sources
Industry/Nation (1) Use of Gross Domestic Products or
gdp.
(2) Integration of labor and capital as the
key inputs.
Duke and Torres
(2005)
Meyer and Harper
(2005)
Organization and
function
(1) Multi-factor productivity with the fo-
cus on labor, capital, materials, and inter-
mediate inputs.
(2) Proxy or surrogate (e.g., quality and
quality of work life).
Sink and Tuttle
(1989)
Dixon, Nanni, and
Vollman, (1990)
Sumanth (1998)
Individual ( for all
workforce types)
(1) Motion and Time (Work ) Study with
direct capture of outputs and inputs.
(2) Proxy or surrogate (e.g., quality of work
life, innovation, work outcomes, output
quality, customer satisfaction, etc.).
Hodgetts (1998)
Zigon (1998)
In summary, productivity is commonly defined as a quantitative ra-
tio of outputs generated to input consumed.While there is no disagree-
menton this general premise,measuringproductivity atdifferent levels
of domain (e.g., national, industrial, organizational, and individual) re-
quires in-depth understanding of howproductivity information should
be analyzed and the measurement limitations (i.e., dealing with defi-
nitions, data collection, and analysis frequency). For examples, when
focusing on the raw materials as the inputs, one may encounter about
a suitablemeasurement dimension—unit cost (i.e., $) or a physical unit
(i.e., pieces orm2). In addition, if a unit cost dimension is chosen,which
period should this rawmaterial be considered—when itwas purchased
or it is about to be used. In addition, for the labor input, a company
has to clarify whether only full-time workers are to be considered or
an inclusion should be made to contracted and/or temporary work-
ers.Therefore, measuring productivity needs various approaches since
there is no single productivity measure that can comprehensively pro-
vide the entire information. The summary of productivity measure-
ment is presented in Table 1.2.
Value-Added and Productivity Measurement
Productivitymeasurement generally dealswith three perspectiveswith
the primary focus on the input side. The first one is called total factor
in which an organization’s outputs is divided by a total input. Partial or
multi factor productivity measurement involves the relationships be-
40 Chapter One
tween total output and two or more input factors. The last perspec-
tive is called single factor productivity measurement—indicating a to-
tal output divided by a single input factor. Each perspective represents
different challenges for a measurement effort (Phusavat, Fankham-ai,
Haapasalo, & Lin, 2011).
For instance,whenusing the rawmaterial, the debate earlier focused
on whether the unit cost incurred when they were purchased or the
present unit costwhen they are used should be used to reflect their use.
When a company begins to contract out certain tasks such as packag-
ing, how this circumstance should be considered for productivity mea-
surement (since the direct headcounts become less).More importantly,
the issues relating to time-lag effects (e.g., when investing in anew tech-
nology, a firm has to deal with the learning curve before the expected
outputs can be realized. If a traditional approach for productivity mea-
surement is used, a firmmay be resistant to productivity improvement
through future investment upgrade.Then, dealingwith the unit dimen-
sion difference (e.g., hours, $, etc.) can be difficult when attempting to
merge the data for a report to management.
Emerging trends (e.g., human capital brand value and global sourc-
ing) have contributed greatly to several significant changes in produc-
tivity measurement. New product development time becomes shorter.
Constant changes in output requirements due to the regulations and
the pressure from consumer protection groups have resulted in the
need to comeupwith newproducts and services. Specifically, the ques-
tion on how to capture the output side more accurately is more promi-
nent since a firm no longer produces the same products or offers the
similar product portfolios over the years. The competition has accel-
erated new product developments and shortened a product’s useful
life. In addition, recent mergers and acquisitions have been repeatedly
used as a strategy formarket expansions. As a result of rapid changes in
product portfolios, the attention has shifted more on the output side.
Given the trends in themore significant roles from the intangible as-
sets, the attention has turned to how much value a firm is able to gen-
erate (instead of merely the products and/or services). Based on the
statistics of S&P 500 Market Value (in reference to www.OceanTomo
.com), the intangible assets represent approximately 80% of a firm’s
value. The intangible assets such as human capital and intellectual
properties have replaced the tangible assets when assessing and evalu-
ating a firm’s market value and brand.The term value added is used to

Productivity Overview 41
reflect howwell a firm is able to utilize both tangible and intangible as-
sets which represent its input factors.This is because an output should
not only represent what a firm produces but also reflects the value-
added into the products and/or services to be used by customers—
indicating the importance of knowledge and innovation. Currently,
the key challenge is to ensure that a company’s intangible assets are
productively utilized.
The contemporary view, derived from Asian Productivity Organiza-
tion (see www.apo-tokyo.org/productivity/pmtt_015.htm), states the
following in regard to the value-added.The value added represents the
value which a firm is able to add to the materials in order to create its
sale revenue or value of output turnover. It reflects the ability for a firm
to generate the value that meets customer requirements and needs.
Perceived value shows that customers are satisfied with the products
and services received, given the amount of money paid. Because of
the importance of intangible assets (e.g., knowledge, human capital,
etc.), measuring the value added has been widely practiced to reflect
an organization’s outputs. This is the case for most small and medium
enterprises that have prioritized the innovation and creativity for their
operations, including new product development and process improve-
ment. In addition, due to the constant changes in a company’s oper-
ations such as shifting from a “push” to “pull” approach, use of infor-
mation and communication technology, constant changes in product
portfolio, capital, and more intense business competition; measuring
a company’s value added appears inevitable.
The value added can be measured in several ways. It is generally de-
fined as how well a firm is able to transform the rawmaterials into the
products that areneededbycustomers.Asa result, the valueadded rep-
resents by the difference between the value of outputs (e.g., expected
sale price multiplied by number of products) and the combination
of purchased value of raw materials, services needed for production
(e.g., external inspections or certifications), and utilities (e.g., electric-
ity and water). This difference represents the value added in which a
typical company aims to increase continuously. Based on this defini-
tion, the ability to learn and understand customer needs and blend
them into new product and service development (including product
functionality, life time service support, new product generation, etc.)
is essential. The ability to minimize utility usages for production and
operations is also critical. Understanding the markets so that a firm

42 Chapter One
is able to acquire needed raw materials at the right cost is important.
Many leadingmanufacturers and even service providers have begun
to consider the value-added as their outputs (instead of an actual out-
put in the physical unit or financial term). Then, the value-added is to
be divided by key inputs such as labor, and equipment and machin-
ery. They are known as value-added labor and machinery productivity
respectively. Specifically, value-added labor productivity reflects how
well a person (or one hour or one Baht used by labor) is able to gener-
ate value added (which is measured in terms of Baht).The information
from this indicator shows whether a firm is able to utilize its work-
force in several areas such as production and other operational pro-
cesses (e.g., customer relations, new production development, inspec-
tion, etc.). Simply put, the substitute of value added for a company’s
outputs has been widely adapted and is commonly used presently.
In summary, the term value added represents an overall wealth cre-
ated through a firm’s operational process and/or provision of services
(e.g., certification and calibration).Thiswealth is generated by the com-
bined efforts of those who work in the firm (employees) and those who
provide needed capital and investments (e.g., managers, executives,
and investors).The consideration into outsourced services during out-
put generation needs to be included. A firm’s long-term business de-
pends on its ability to create what is known as utility value (i.e., fitness
of use, functionality, value for money.)
Value added can be quantitatively computed as follows. It is popu-
larly referred to as the subtract method. The value added can be com-
puted by using data from a company’s financial statements (i.e., profit
and loss statement, balance sheet). The analysis of value-added infor-
mation focuses on howwell a firm is able to increase the sales by better
integrating customer requirements into product functionality and ser-
vice delivery—adding the value into the raw materials). It also helps
a firm focus on listening to the voice of its customers, building core
competency, and search for ways to purchase the raw materials at the
optimal price. Creativity and innovation in translating customer needs
into product and service development become critical.
Value added=Net Sales (or Output Value)−Cost of Outside Purchases.*
* E.g., materials, energy, and outsourced services such as calibration
and certification for output generation.
The term value added has also been measured in different ways. For

Productivity Overview 43
Net Sales(or Output Valuewhich represents
total operatingrevenues)
Value of OutsidePurchases
Value added
Labor and management:personnel cost, interests,
depreciation, rent and lease,taxes, and profit
−=
figure 1.7 Computation of Value Added (adapted from
www.apo-tokyo.org/productivity/pmtt_015.htm)
some, the value-added is the revenue subtracted by the cost of goods
sold and depreciation:
Value added= Sales− (Cost of Goods Sold + Depreciation).
Another popular usage is known as Economic Value Added or eva.
The eva indicates the financial value derived from a firm’s economic
profit—a profit earned by the firm after taxes and also subtracted by
less the cost of financing the firm’s capital.Themanagement has to en-
sure that the return on the firm’s economic capital employed is greater
than the cost of that capital.
eva=Net Operating Profit after Taxes−Capital Charge
Other definitions are illustrated in Table 1.3.
Productivity Measurement in Emerging Business Environment
Interestingly, based on the report published by the us-based National
Association of Manufacturers (www.nam.org), the significance of pro-
ductivity and value-added can be summarized as follows. Worker pro-
ductivity is consideredas akey variable in attractingmore interests and
investments from foreign manufacturers. Despite the increase in labor
table 1.3 Value Added Definitions
Source Formula
Bank of Japan Value added = Ordinary income + Personal costs + Finan-
cial costs + Rent + Taxes and Public imposts + Deprecia-
tion costs
Mitsubishi Research
Institute Japan
Value added = Personal costs + Rent + Depreciation costs
+ Financing cost + Taxes and public imports
Small and Medium
Enterprise Institute
Value added = Production value – (Direct material costs
+ Cost of parts purchased + Payments to subcontractors
+ Indirect material costs)
44 Chapter One
cost, us workers have been among the world’s most productive work-
force. The use of the value-added concept helps indicate both produc-
tivity and quality which are suitable to today changing business envi-
ronments.
Both productivity and quality are an integral part of the term per-
formance. Furthermore, the us has the most value added per worker
than any other of the top ten economies in the world. This high level
of value-added labor productivity helps the manufacturing sector re-
main competitive against low-wage nations.Themost recent numbers
published in 2009 by the Bureau of Labor Statistics indicate that the
value added per worker in the United States was over $118,000, slightly
$25,000 more Japan.
The benefit of shifting to the value added productivity measurement
contributes toanother importantdevelopment in the recent years.This
trend is known as near-sourcing. The essential belief is based on the
need to decrease the distance between the source of supplies and the
markets will be critical for future competition. Because of continuous
increases in value-added productivity (especially labor and capital in
the us), coupled with higher labor and other business costs in tradi-
tionally low-wage or developing countries, it will eventually become
necessary to produce the products near a firm’s largest customer bases
or markets. According to Michigan Manufacturing Technology Center
(www.mmtc.org), there are several indicators being adapted today in
the us and other countries with respect to productivity measurement:
• Value-added ($) per full-time employees (persons)
• Value-added ($) per machinery value ($)
• Value-added ($) per capital and labor expenses ($)
• Value-added ($) per production floor space ( ft2)
The need for integrating human capital, knowledge, and other in-
tellectual capital for productivity management continues. Knowledge-
based organizations or enterprises have recently enjoyed more promi-
nent roles in the society. Today the financial performance of many
companies depends heavily on their ability to introduce new prod-
ucts and/or services, and make applications from new technologies.
The time dimension has been recognized as the foundation for long-
term business success and it indicates the productive use of resources
by eliminating the wastes. The importance of this has been perceived
in particular by telecommunication and electronics industries where

Productivity Overview 45
the product life cycles have shortened to only a few months. As a re-
sult, many companies attempt to obtain high performance from their
knowledge-work unit or function, such as r&d teams, sales engineer-
ing and other activities related to product development. This devel-
opment has also taken place in other traditional industries such as
automobiles and textiles as time management becomes essential for
manufacturers, customers, and suppliers.
When performing knowledge-intensive work, one of the most diffi-
cult tasks for measurement is to define, estimate, quantify, and collect
the data relating the value of inputs and outputs. In addition, an or-
ganization’s value has depended on intangible assets than tangible as-
sets. Generally, there are two types of a company’s asset. The first one
is classified as tangible: tangible assets represent the assets that can
depreciate and are easily estimated as part of a company’s accounting
system. They have both book and market values. They are, for exam-
ple, building, vehicles, equipment, machines, etc. On the other hand,
intangible assets represent the knowledge used for work and project
completion.This asset type cannot be depreciated by employing tradi-
tional accounting methods (e.g., straight-line, etc.).
The intangible assets deal with knowledge (e.g., data and informa-
tion, expertise and skills, and experience), intellectual properties (e.g.,
copyrights, trademarks, trade secrets, and patents), brand recogni-
tion, customer loyalty, etc. In general, it is not possible to assign the
book value. The value of the intangible assets cannot be depreciated
by applying traditional methods. Moreover, knowledge work accom-
plishment and success depend largely on human capital. If using a
traditional productivity approach, there is a danger of only captur-
ing human resources in terms of $, time spent on work, and/or head-
counts which are not entirely applicable in today workforce. Mostly,
knowledge-work outputs, e.g. r&d and customer services, are consid-
ered as labor-intensive in the contemporary sense. Financial advisory
team does not depend on large buildings. They can work from home
or from anywhere. Since a financial deal is not identical, the ability to
learn frompastmistakes andexperiences is critical for becomingapro-
ductive work unit. The level of productiveness is perceived as how well
it is able to respond to customer needs, requests, and requirements in
a timely fashion while achieving the satisfaction—also known as the
responsiveness.
Nowadays, productivity is no longer a standalone term. It has been

46 Chapter One
used in associationwithmany contemporary terms. For examples, pro-
ductivity is often described as a prerequisite for becoming resilient in
today economy and competition. Productivity also contributes to the
term sustainability.The ability for an organization to utilize the limited
resources and tominimize (or even to reuse) the wastes from its opera-
tions represents the sustainability’s foundation. Productivity is usually
discussed when focusing on building a robust organization. A robust
organization reflects the ability to adapt to continuous changes in busi-
ness environment. Time management is essential in this ability.
In conclusion, productivity has evolved over the past century and is
now a permanent fixture when focusing on an organization of the fu-
ture. Becoming productive is part of achieving excellent performance.
At the organizational level, productivity has been an integral part of
business success and strategies. Both financial and non-financial data
has been adapted to help measure and manage productivity. Recently,
the use of value-added is advocated in conjunction with the increas-
ing importance of the intangible assets. On the other hand, the use of
proxy or surrogatemeasures reflects the impacts on performance from
productivity such as the outcomes or the cause on productivity such as
quality of work life.
Exercises
1.1 In your own words, describe the development and movement in
regard to productivity measurement and management in accor-
dance to the American Productivity andQuality Center’s history (see
www.apqc.org/history).
1.2 Examine the roles ofThailand Productivity Institute (or a productiv-
ity organization in your country) and identify the past key activities
and/or initiatives to help increase public awareness on the impor-
tance of productivity.
1.3 It is quite common for an organization not being able to measure
r&d productivity directly (using outputs dividedby inputs due to the
time-lag). Suggest twoalternatives thatmaypresent thepossibility to
achieve this task.
1.4 For some, there are at least two key goals for a successful organi-
zation such as better product/service quality with lower cost, and
higher market share. Discuss what you have learned from lccs in
integrating productivity into these goals. Provide some specific ex-
amples.
1.5 According to the recentUnitedNations report, the average us worker
Productivity Overview 47
produces $63,885 of wealth per year, more than their counterparts in
all other countries, the International Labor Organization said in its
report. Ireland comes in second at $55,986, followed by Luxembourg
at $55,641, Belgium at $55,235 and France at $54,609. The productiv-
ity figure is found by dividing the country’s gross domestic product
by the number of people employed. The un report is based on the
2006figures formany countries, or themost recent available. Review
the reports, technical notes, and newsletters published by Bureau of
Labor Statistics, and summarize the level of importance on the term
productivity in the us from your opinion.
References and Further Reading
Barnes, R. (1980).Motion and time study: Design andmeasurement of work.
New York, ny: Wiley.
Blanchard, B. (2008). System engineering andmanagement. Singapore:Wi-
ley.
Dixon, J., Nanni, A., & Vollman, T. (1990). The new performance challenge:
Measuring operations for world class competition. Homewood, il: Ir-
win.
Duke, J., & Torres, V. (2005,March).Multifactor productivity change in the
air transportation industry.Monthly Labor Review, pp. 32–45.
Harper, J. (1984). Measuring business performance. Brookfield, England:
Gower.
Helo, P., Takala, J., & Phusavat, K. (2009). Productivity measurement for
knowledge work in research and development. International Journal
of Productivity and Quality Management, 4(1), 39–54.
Hodgetts, R. (1998). Measures of quality and high performance. New York,
ny: amacom.
Meyer, P., & Harper, M. (2005, June). Preliminary estimates of multifactor
productivity growth.Monthly Labor Review, pp. 32–43.
Phusavat, K. (2007). Roles of performance measurement in smes’ man-
agement processes. International Journal of Management and Enter-
prise Development, 4(4), 441–458.
Phusavat, K., Anussornnitisarn, P., Helo, P., & Dwight, R. (2009). Perfor-
mance measurement: Roles and challenges. Industrial Management
& Data Systems, 109(5), 646–664.
Phusavat, K., Fankham-ai, K., Haapasalo, H., & Lin, B. (2011). Achieving en-
terprise competitiveness through an effective management process.
Human Systems Management, 30(1), 115–124.
Sink,D. (1985).Productivitymanagement: Planning,measurement and eval-
uation, control and improvement. New York, ny: Wiley.

48 Chapter One
Sink,D.,&Tuttle, T. (1989).Planningandmeasurement in your organization
of the future. Norcross, ga: ie Press.
Sumanth, D. (1998). Total productivity management. Delray Beach, fl: St
Lucie Press.
Takala, J., Suwansaranyu, U., & Phusavat, K. (2006). A proposed white-
collar workforce performance measurement framework. Industrial
Management & Data Systems, 106(5), 644–662.
Taylor, F. (1911). Principles of scientificmanagement.NewYork, ny:Harpers
& Brothers.
Zigon, J. (1998). Measuring the hard stuff: Teams and other hard-to-
measure work. Retrieved from http://www.zigonperf.com

Chapter Two
Creating a Management System
The chapter deals with the subjects relating to performance measure-
ment and its roles in a management process. There are a total of five
sections in the chapter.The first section focuses on building amanage-
ment system. The description of a management process which links
different components within a management system is discussed. The
second section demonstrates with the roles of productivity and perfor-
mance measurement within the context of a management system—
ensuring its effectiveness. Included is a case demonstration which
highlights productivity measurement in a small firm.The third section
summarizes how performance measurement (in which productivity is
part of) contributes to a strong management process. The remaining
sections are the exercises and the references
As a graduate level at Virginia Polytechnic Institute and State Uni-
versity’s or Virginia Tech’s Department of Industrial and Systems Engi-
neering, one can choose to enroll in one of the four available options
is called the Management Systems. The Management System option
is expected to address ongoing problems relating to complex and dy-
namic organizational systems. Thanks largely to Professors Benjamin
Blanchard, D. Scott Sink, Harold Kurstedt, Paul Torgersen, C. Patrick
Koelling, and Paul Rossler; the term Management Systems Engineer-
ing or mse is clearly defined. They should be regarded as pioneers in
mse.
There are two ways to interpret what mse implies. The first one is
to engineer a management system. To engineer a management system
means to design, develop, and deploy. It has been proven that an ef-
fective management system is critical for a high-performance organi-
zation. A strongmanagement system can drive organizational policies
and achieve stated objectives. Secondly, it is to use an engineering ap-
proach to assess a management system. As an industrial engineer, it
is often brought up that all system (regardless whether it is primar-
ily a hardware, software, or humanware) consists of the terms “in” and
“out.” In addition to input and output, an industrial engineer often en-
counters the terms cash inflow and outflowwhen dealingwith the Dis-
49
50 Chapter Two
counted Cash Flow Analysis for Engineering Economy. The terms in-
bound and outbound involve with the flows of finished goods and raw
materials during logistic support planning. This essentially represents
the fundamental viewpoint for building and analyzing a management
system.
Dealingwith the termsbusiness processes andprocessmanagement
has often been on operational and technical aspects such as produc-
tion, services and delivery. Not until in 1990s, researchers and scholars
have begun to recognize the importance of a management process. To
help highlight its roles for continuous performance improvement in
an organization, the American Productivity and Quality Center or the
apqc has suggested and classified business processes into operating
and management/support categories. This initiative later resulted in
the concept known as Process Classification Framework. Within this
framework, operating processes include someof the following—design
and develop products/services, market and sell products/services,
deliver products/services, and manager customer services. On the
other hand, the management and support processes deal with man-
aging knowledge, improvement, and change; developing and manag-
ing human capital; and managing information technology. Measuring
performance and analyzing performance information are an integral
part embedded in the management and support processes (Phusavat,
Fankham-ai, Haapasalo, & Lin, 2011).
The need tomeasure performance is underlined by the popularity of
a quality management system. In fact, not only performance measure-
ment; analyzing, learning from performance information, and contin-
uous improving the performance level represent a critical process for
an organization’s management (Deming, 1986). iso 9001: 2008 specif-
ically mentions measurement, analysis, and improvement as one of its
requirements to ensure an effective quality management system.
Commonly, the Malcolm Baldrige National Quality Award or the
mbnqa in the us highlights the linkages among performance mea-
surement, information analysis, and knowledge management for sus-
taining quality excellence. For the mbnqa, clear emphasis is made
on the primary responsibility of a firm’s management. In addition to a
traditional description of planning, coordination, and execution; the
focal point is the need to measure the results relating to customer,
workforce, and processmanagement.Measuring howwell relevant key
processes have performed over a specific period such as daily, weekly,

Creating a Management System 51
monthly, and quarterly. (Please examine the apqc’s Process Classifi-
cation Framework for further usages.) As a result, productivity is often
singled out as a crucial aspect of the term performance. More impor-
tantly, merely measuring the performance levels is no longer enough
(Dixon, Nanni, & Vollman, 1990).
An effective mbnqa cannot be sustained without continuous per-
formance improvement. As a result, the description relating to perfor-
mance measurement includes information analysis and use of knowl-
edge from past poor performance for continuous improvement in all
key processes mentioned earlier (Neely, 1998). Therefore, applications
of information technology, statistical analysis, quality tools (such as
Cause-and-Effect Diagram, Process Flow Diagram, Bar Chart, Check
Sheet, Scattering Plot, and Paretro Diagram), and brainstorming and
other team building are important for this linkage. Even successful
benchmarking efforts depend on having common performance indi-
cators for process analysis and improvement (Phusavat, Anussornni-
tisarn, Helo, & Dwight, 2009). Often, this is a foundation for business
process reengineering.
Some of contemporary management tools such as the Capability
Maturity Model or cmm openly recognize the need for performance
measurement and analysis in order to reflect a company’s long-term
survivability. cmm illustrates a step-by-step framework that reflects
the evolution of process improvement. cmm was proposed after the
examination of the data collected from primary contractors of us De-
partment of Defense. Due to the long useful life of many aerospace and
defense systems, contractor risk (e.g., ability to provide life-time service
support, ability to redesign and upgrade a system, etc.) was deemed
critical for sustaining war readiness. Therefore, the terms capability
andmaturity indicate the degree of standardization, formality, and op-
timization of all key processes. It is important to note that cmm is a
registered service mark of Carnegie Mellon University.
Specifically, the cmm Level 4 indicates all processeshave tobequan-
titatively measured and controlled while its Level 5 highlights the need
to use this information to help redesign existing processes or develop
new processes. This is essential for continuous performance improve-
ment (Neely, 2002). In other words, the process is quantitatively man-
aged in accordance with agreed set of performance indicators (also
referred to as metrics, ratios, indexes, etc.). By adapting performance
measurement with quantitative data, a firm’s management can assess

52 Chapter Two
Inputs
PerformanceInformation from
Management Reports
Manager OutputsDecisions and Actions
figure 2.1 Input and Output Viewpoints from aManager
process capability, and also monitor whether this capability is stable
and predictable. This ensures that a decision or an action to intervene
deals with common causes in order to achieve continuous process im-
provement.
Building a Management System
The vital component of any management system is always a manager
(Kurstedt, 1992). Generally, a manager can be anybody regardless of his
or her levels of managerial responsibility in an organization. In other
words, a manager can be a managing director, a plant manager, an op-
eration manager, a project manager, and a team leader. Based on the
in-out framework (known as the system approach), the primary input
for performing managerial tasks is performance information from a
management report. Then, the major output from a manager can be
described as managerial decisions and/or actions, sometimes referred
to as improvement interventions (Figure 2.1).
Extending the system approach further, the output from a manager
becomes an input into his or her domain of responsibility. According to
the goodgovernance conceptwhich emphasizes accounting and trans-
parency, he or she is obligated to measure the performance of his or
her domain responsibility and the impacts from improvement inter-
ventions. It is part of follow-up responsibilities and of learning from
the mistakes and/or successes. Typically, productivity constitutes the
performance to be measured.The key component frommeasuring the
performance levels is the data as it is derived directly from a set of per-
formance indicators identified earlier (Figure 2.2).
By stretching the system approach further by looking at the Perfor-
mance Measurement and Data on Performance Results as the input,
the next component to receive this input is an organization’s informa-
tion and communication technology or ict. This ict plays a critical
role in translating andconverting thedata ona set of performance indi-
cators into management information and report. Therefore, this man-
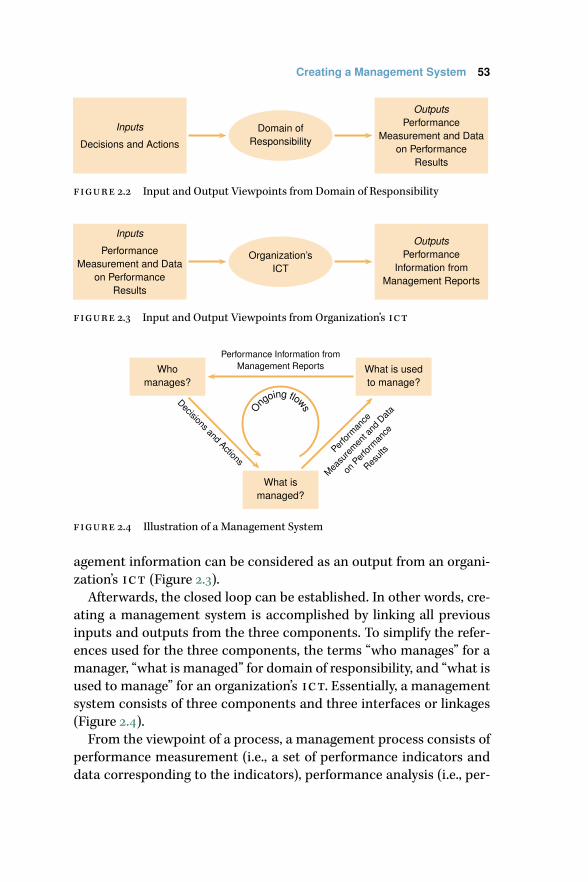
Creating a Management System 53
Inputs
Decisions and Actions
Domain ofResponsibility
OutputsPerformance
Measurement and Dataon Performance
Results
figure 2.2 Input and Output Viewpoints from Domain of Responsibility
Inputs
PerformanceMeasurement and Data
on PerformanceResults
Organization’sICT
OutputsPerformance
Information fromManagement Reports
figure 2.3 Input and Output Viewpoints from Organization’s ict
What ismanaged?
What is usedto manage?
Whomanages?
Ongoing flows
Perfor
mance
Measu
remen
t and
Data
onPer
forman
ce
Result
s
Performance Information fromManagement Reports
Decisions and Actions
figure 2.4 Illustration of a Management System
agement information can be considered as an output from an organi-
zation’s ict (Figure 2.3).
Afterwards, the closed loop can be established. In other words, cre-
ating a management system is accomplished by linking all previous
inputs and outputs from the three components. To simplify the refer-
ences used for the three components, the terms “who manages” for a
manager, “what is managed” for domain of responsibility, and “what is
used to manage” for an organization’s ict. Essentially, a management
system consists of three components and three interfaces or linkages
(Figure 2.4).
From the viewpoint of a process, a management process consists of
performance measurement (i.e., a set of performance indicators and
data corresponding to the indicators), performance analysis (i.e., per-

54 Chapter Two
formance information, management report, and evaluation on a re-
port’s information), and performance improvement (i.e., making de-
cisions, taking actions, and learning from past performance interven-
tions). As a result, regardless of the type of a management (e.g., quality
and safety), these three key tasks always appear as its integral part.
Building a management system helps highlight the need to have
better understanding on how to measure and analyze performance,
what to measure, and where to improve (Phusavat, 2007). Other ex-
tended studies relating to a management system have included deci-
sion science (e.g., cognitive engineering, decision quality andmethods,
etc.), knowledge management, and benchmarking and business pro-
cess reengineering through best-practice cases.
To ensure that a management system becomes open and dynam-
ics, there is a need to consider and integrate with potential external
linkages. As a result, the integration of external knowledge can pro-
vide a manager with a complete view of the current situation and fu-
ture business circumstances. Competitions from existing and unfore-
seeable competitors (see the airlines and electronics industries) and
regulations highlight the need of a manager to be proactive and en-
gaged with external environment. This indicates the long-term ability
to dealwith various stakeholder groups (e.g., customers, suppliers, con-
tractors, regulators, and consumer advocacy groups). Thereby, a more
open management system is developed.
Building an effective management system is needed for both private
firms and public agencies (Phusavat, 2008). The effectiveness depends
on how well a management process (in accordance to a management
system) fits into strategic management of an organization. For exam-
ples, a strategic objective of a lcc is to maintain low operating and
maintenance cost of an aircraft fleet.Thus, measuring aircraft produc-
tivity such as utilization, turnaround time, delays, downtime, available
seat miles (or kilometers), and actual passenger miles (or kilometers)
flown is critical; in addition to typical financial statements. The pro-
ductivity analysis needs to linkwith relevant processes such as training
and skill development, acquisition, contract management with suppli-
ers so that suitable improvement interventions can be made.
For the public sector, the need to build an effectivemanagement sys-
tem has been brought up repeatedly since 1980s. There have been a
series of requirements and regulations to ensure public accountabil-
ity among public agencies in various countries. Being accountable im-

Creating a Management System 55
What ismanaged?
What is usedto manage?
Whomanages?
Informationand knowledgefrom external
sources
Knowledge, including experiences, expertise, and skills
Providers(e.g., suppliers) Customers
Inputs Outputs
Ongoing flows
(2) Per
forman
ce
Measu
remen
t and
Data
onPer
forman
ce
Result
s
(3) Performance Informationfrom Management Reports
(1) Decisions
and Actions
figure 2.5 msm with Consideration into External Environment
plies performancemeasurement as ameans to demonstrate value-for-
money of services provided by public agencies. For examples, there are
twomajor regulations passed in early 1990s as part of the global public-
sector reformmovement in the us; i.e., Government Performance and
Results Act of 1993 and Government Management Reform Act of 1994.
Under these acts, all federal agencies are required tomeasure their per-
formance which primarily includes productivity and quality and to re-
port their performance levels to the general public. Performance agree-
ment is also used to reaffirmcommitment, responsibility, and account-
ability.
By using the system approach in building a management system, it
is now possible to assess whether it functions effectively. Simply, by
following the flows, the ability to visualize a management system is
created. Key questions can be raised. What are the measurement ar-
eas that reflect a manager’s decisions and actions? How often does a
manager receive performance information?Does amanager receive re-
quired information that corresponds to his or her domain of responsi-
bility?What is the knowledge learned from amanagement report? De-
spite an improving trend, have we improved fast enough relatively to
our competitors?
To learn more about the applications of a management system, a
case demonstration is to be discussed. Extensive interviews have been
made with a managing director of a company during an attempt to
help visualize and evaluate the effectiveness of a management system.
Founded in 1987, the company under study is part of a large indus-
trial group—an important food producer group inThailand.The com-
56 Chapter Two
pany has exported 70% of its products to internationalmarkets such as
Japan, Taiwan andHongKong.These key products include readymixed
flour, corn starch, rice flour, rice starch, glutinous rice flour, tapioca
starch, and modified starch. In 1997, the company became the first op-
erator in SoutheastAsia to be certifiedwith both haccp and iso 9001:
1994.Thecompanyhasmore than 500 employees and is nowexpanding
into the areas of food warehouses and distributions.
The company’s managing director is familiarized with current man-
agement tools, businessprocesses, business competitiveness, andmar-
ket competitors. First of all, the company is constantly striving for in-
ternational awards and recognition so the issues relating to amanage-
ment process are of the managing director’s interests. From the inter-
views, there were several subjects that had received a lot of attention.
They were as follows:
• Anongoingflow issues suchas the contents, continuality, speed,
and frequency
• How well information and knowledge from external sources
flow into an organization
• How effective the lessons learned are accumulated and shared
throughout an organization
Generally, the above subjects deal with the roles of a management
process in sustaining high performance and business successes. For
specific feedback, a company that relies on exports, it has to be pre-
pared constantly for customer audits and on-site visits. More or less,
an on-site customer audit has focused more on process management
than product quality. Client representatives typically pay a lot of atten-
tion on information awareness and communication across an organi-
zation and the level of control within key processes such as produc-
tion, storage, warehouses, delivery, sales, purchasing, and human re-
source development. The managing director believes that an effective
management process represents one of the critical prerequisites for
this achievement.Moreover, a goodperformancemeasurement system
with vigorousmanagerial reviews createsmore positive impression for
the company’s customers (Phusavat, Manaves, & Takala, 2007).
Visualizing a management system helps identify key problems or
challenges facing the company’s managing director. First of all, the
msm underlines the need to have appropriate performance infor-
mation for individual departments within bif. Production manager

Creating a Management System 57
What ismanaged?
What is usedto manage?
Whomanages?
Providers(e.g., suppliers) Customers
Inputs Outputs
Ongoing flows
1. Inflows of ExternalKnowledge
2. Knowledge Sharingand transfer
1. ICT Risk and Security2. ICT Investment
1. Management Report Frequency2. Quality of Management Report
3. Fitness of PerformanceInformation
figure 2.6 Key Factors for an Effective msm
should be provided relevant information relating to plant’s operations.
Furthermore, procurement, human resource, marketing, local sales,
international sales, information technology managers should have
performance information on their respective departments. Only pro-
duction manager appears to have needed information; i.e., technical
and financial information. This is probably due to its location which
is separated from the company’s headquarters. The additional con-
cerns expressed by the managing director include: (1) quality of man-
agement report as it probably influences decision quality bymanagers,
(2) database capability as the company is facedwith the risk issues such
as security and backup, and (3) channels that allow external informa-
tion to enter individual managers, especially customer and competitor
information.
Learning from Integrating Productivity/Performance Measurementin a Management System
In this section, a case application of the msm is described and dis-
cussed. The company under study is classified as a small-medium en-
terprise or sme.The case illustrates the attempt to apply the msm and
to develop suitable performance measures for analysis and improve-
ment at the production level. The sentiment among the owners was
the need to have a separate set of performance measures for a plant
manager who would not be familiar with accounting information. In
other words, the study’s focus was on the issues relating to the com-
pany’s management processes and its business competitiveness. Fur-

58 Chapter Two
thermore, it was agreed that, in the beginning, the company’s manage-
ment systemneeded to be assessed and evaluated prior to the develop-
ment of performance measures.
The company under study was founded in 1995 and is located near
Bangkok. During its first year of operation, the company mainly man-
ufactured parts such as Punch and Die Insert for electronic industries.
Given a strong financial opportunity in the automotive industry, the
company shifted its aim to further provide tooling and spare parts, jig
and fixture, and mold for stamping parts for both electronic and au-
tomotive industries. In the early 2000s, the number of its entire staffs
stood at 60 persons. The company’s overall policy was to continuously
develop, enhance, and improve our knowledge, skills, expertise, tech-
nology, and innovation throughout the organization in order to achieve
the advancement of and to satisfy the needs from the employees, cus-
tomers, and surrounding communities.
After a few extensive reviews, there was one serious weaknesses
identified within the company’s management system. It was the inter-
faces of Performance Measurement and Data on Performance Results.
This weakness was on the lack of performance measurement that pro-
vided comprehensive and insightful information. Apparently, a current
accounting system was not suitable in giving information that helped
tackle ongoing problems such as customer complaints and rising oper-
ational cost. In addition, the managing director and production man-
ager also relied heavily on their judgment and experienceswhichmight
not be appropriate, given the fact that the companywas expanding and
attracting new customers.
Then, the study attempted design and develop productivity, quality,
and quality of work life for the company. It was hopeful that this effort
would lead to a better flow among the three components of the msm
and more suitable performance information for a plant manager (in-
stead of sharing the same financial report which is weekly reviewed by
the company’s owners). By ensuring the flow exists and continues, an
effective msm can be established. Due to the company’s inability to
capture its outputs in a physical unit (e.g., piece or batch), it was de-
cided to use the output value (i.e., piece or batch multiplied by unit
prices).
As a result, there were three productivitymeasures, two qualitymea-
sures, and two measures for quality of work life proposed for a plant
manager. In this study, due to a relative short inventory turnover time

Creating a Management System 59
table 2.1 Measuring Productivity, Quality, and Quality of Work Life
Performance criteria Measures
Productivity* Output value ÷ Labor cost
Output value ÷Materials
Output value ÷ Utility
Quality Rework ÷ Outputs in %
Return ÷ Outputs in %
Quality of Work Life Unplanned absent period ÷Working period in %
Work stoppage period ÷Working period in %
notes *Due to the data limitation, the term revenue would be used to reflect the
value of organizational outputs.
for finished products, the term revenue would be used for the output
value (Table 2.1).
The next step in the study would involve data collection and the de-
velopment of a management report. This exercise aimed to assist the
redesign of data collection and reporting processes. Both tabular and
graphical portrayals of performance information were included dur-
ing the study. It was agreed that the data for these proposed measures
would later be collected on the monthly basis. Previous data was reor-
ganized for the demonstration of a month report. Performance infor-
mation relating to productivity, quality, and quality of work life is illus-
trated in Tables 2.2, 2.3, and 2.4 (p. 61), and in Figures 2.7, 2.8, and 2.9
(p. 60).
Note that the companyunder study produced several productswhile
using the samemachines and equipment, andworkers. As a result, one
problem emerged when using the physical unit such as pieces to mea-
sure the output side. The reason was that not all outputs had an equal
weight. For examples, a company which produces one motorcycle and
one truck cannot simply add the two products together to become two
pieces. Despite that both motorcycle and truck can be measured in
terms of the physical unit, the consideration of the weight difference
(as a result of different selling prices). The same reason can be implied
when focusing on the input side. Instead of focusing on the number of
aircrafts available, the airlines adapt the seat available (or the availabil-
ity of seat-miles). This is due to different aircraft sizes.
In the study, a further task involved performance analysis. For the
analysis, two examples can be discussed. The first analysis example
deals with examining individual measures and understanding their
corresponding trends.The immediate task for the company’s manage-

60 Chapter Two
0.0
2.5
5.0
7.5
10.0
12.5
15.0
17.5
20.0
22.5
25.0
Revenue ÷ Material Cost
Revenue ÷ Utility CostRevenue ÷ Labor Cost
1 2 3 4 5 6 7 8 9 10 11 12 13
Bah
tper
Bah
t
Months
figure 2.7 Productivity Information in the Graphical Format
0.0
2
4
6
8
10
12
14
16 Rework ÷ Outputs
Return ÷ Outputs
1 2 3 4 5 6 7 8 9 10 11 12 13
%
Months
figure 2.8 Quality Information in the Graphical Format
0.0
0.5
1.0
1.5
2.0
2.5
3.0
Unplanned absent period ÷ Working period
Work stoppage period ÷ Working period
1 2 3 4 5 6 7 8 9 10 11 12 13
%
Months
figure 2.9 Quality of Work Life Information in the Graphical Format

Creating a Management System 61
table 2.2 Productivity Information in the Tabular Format
Item Month
1 2 3 4 5 6 7 8 9 10 11 12 13
(1) 8.03 7.37 9.67 9.40 9.50 8.80 9.12 9.29 8.58 6.76 7.64 6.79 6.22
(2) 8.48 20.29 17.09 8.05 9.29 15.82 22.36 12.32 18.40 10.88 11.05 20.95 18.58
(3) 7.38 9.38 5.81 9.66 12.92 9.78 12.16 15.56 11.36 9.06 9.82 8.64 6.53
notes Row headings are as follows: (1) Revenue ÷ Labor Cost, (2) Revenue ÷Mate-
rial Cost, (3) Revenue÷Utility Cost.The term revenue is used as a proxy for the output
value.
table 2.3 Quality Information in the Tabular Format
Item Month
1 2 3 4 5 6 7 8 9 10 11 12 13
(1) 6.31 15.13 4.94 11.86 7.46 2.26 3.76 3.59 7.11 5.33 6.32 7.09 12.73
(2) 3.47 6.29 3.02 7.51 3.35 1.73 9.12 4.05 2.87 12.23 3.19 4.65 5.93
notes Row headings are as follows: (1) Rework÷Outputs (%), (2) Return÷Outputs
(%). Data is based on the financial value of Baht.
table 2.4 Quality of Work Life Information in the Tabular Format
Item Month
1 2 3 4 5 6 7 8 9 10 11 12 13
(1) — 1.96 2.55 1.02 2.04 1.59 0.70 1.01 1.79 1.22 0.92 0.90 1.18
(2) — 0.75 0.96 0.60 0.63 1.61 0.86 0.78 0.98 1.31 0.82 1.90 2.18
notes Row headings are as follows: (1) Unplanned absent period÷Working period
(%), (2) Work stoppage period ÷Working period (%).
ment, including the plant manager, would be to determine the targets
for the annual, quarterly, and monthly basis. It was clear that having
the indicators alone was not sufficient. More efforts would be needed,
especially in the areas of management report, target setting, and staff
communication. For the first example, it appeared to be quite simple
initially but failed to provide an integrated picture. Analyzing individ-
ual indicators pointed to a specific improvement or decline. For exam-
ples, the revenue-to-labor cost indicator illustrated a declining trend
which would require immediate attention from the management. On
the other hand, the unplanned absent period-to-working period (in %)
showed an improvement sign.
For the second analysis example, the focus was on examining mul-
tiple indicators simultaneously. For productivity, to the surprise of the

62 Chapter Two
company’smanagement, labor productivity had declined despite a sta-
ble sign from thematerial side. Training and retrainingmight not have
beenasuseful as once thought.This simultaneous examination showed
the need for more in-depth waste analysis during production. Aging
machinery and a lack of conservation on energy and water usages
could be cited as two primary contributors to poor utility productivity
as well as possible work stoppages which was part of the assessment
of quality of work life. For quality, the concern was on the inspection
process in which the reasons contributing to both rework and return
had to be identified. The rework and return problems should not have
taken placed at the same time. The general feeling was as follows. If
there was any rework, no return would have been necessary.
Finally, the study highlighted the effort to strengthen the company’s
management system and to rely more on quantitative information for
decision-making—integration of performance measurement. By be-
coming more familiar with performance measurement, several ben-
efits could be expected. At the time of the study, the company was
preparing for the iso 9001: 2000—certification process, especially
when the Requirement 8 explicitly addresses the issues of measure-
ment, analysis, and improvement. This certificate would be necessary
for smes in competitive industries such as food, furniture, electronic,
and automobile. It would help the company gradually move up the
confident level of its customers. This will be beneficial when audited
by major end-of-the-chain customers such as Toyota Motors. Other
key lessons learned included the recognition of the database and the
reliance on accounting information when analyzing the performance
levels. At the plant level, given the limited availability of data, combin-
ing performance information with experiences underscored the roles
of a manager. Communication and maintaining visibility when initi-
ating performance measurement were highly critical as some misun-
derstandings had taken place at the company. The plant workers were
concerned about the reduction of overtime pay and the revision on a
previous pay-for-performance agreement.
Performance Measurement and Management Process
Performance measurement provides feedback to the following three
questions. Howwell an organization is performing? Is the organization
achieving its objectives? How much has the organization improved
from a last period? Performance measurement helps create feedback
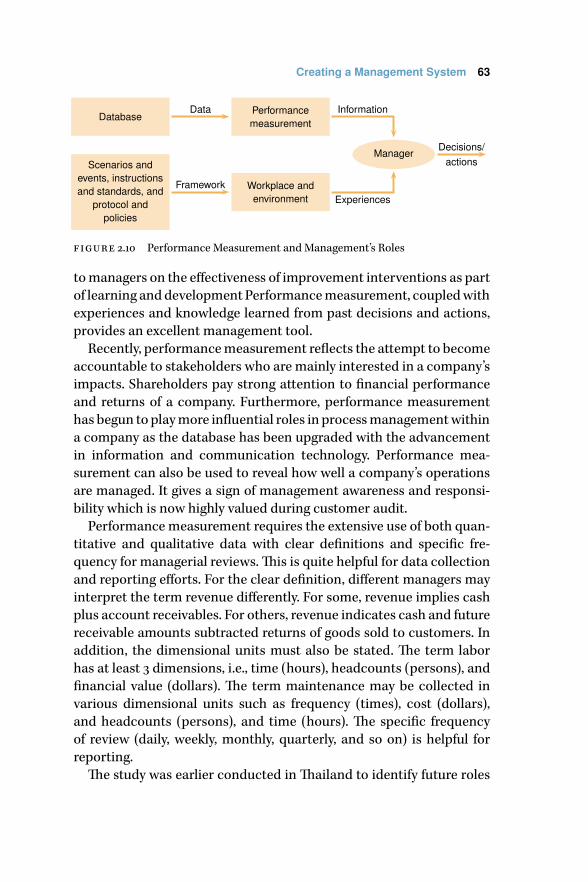
Creating a Management System 63
Database
Scenarios andevents, instructionsand standards, and
protocol andpolicies
Performancemeasurement
Workplace andenvironment
Manager
Data
Framework
Information
Experiences
Decisions/actions
figure 2.10 Performance Measurement and Management’s Roles
tomanagers on the effectiveness of improvement interventions as part
of learning anddevelopment Performancemeasurement, coupledwith
experiences and knowledge learned from past decisions and actions,
provides an excellent management tool.
Recently, performancemeasurement reflects the attempt to become
accountable to stakeholders who are mainly interested in a company’s
impacts. Shareholders pay strong attention to financial performance
and returns of a company. Furthermore, performance measurement
has begun to playmore influential roles in processmanagementwithin
a company as the database has been upgraded with the advancement
in information and communication technology. Performance mea-
surement can also be used to reveal how well a company’s operations
are managed. It gives a sign of management awareness and responsi-
bility which is now highly valued during customer audit.
Performance measurement requires the extensive use of both quan-
titative and qualitative data with clear definitions and specific fre-
quency for managerial reviews.This is quite helpful for data collection
and reporting efforts. For the clear definition, different managers may
interpret the term revenue differently. For some, revenue implies cash
plus account receivables. For others, revenue indicates cash and future
receivable amounts subtracted returns of goods sold to customers. In
addition, the dimensional units must also be stated. The term labor
has at least 3 dimensions, i.e., time (hours), headcounts (persons), and
financial value (dollars). The term maintenance may be collected in
various dimensional units such as frequency (times), cost (dollars),
and headcounts (persons), and time (hours). The specific frequency
of review (daily, weekly, monthly, quarterly, and so on) is helpful for
reporting.
The study was earlier conducted in Thailand to identify future roles

64 Chapter Two
of performance measurement within an organization. Six leading pri-
vate firms and six well-recognized public agencies participated in this
study. The discussions focused on their viewpoints, and past and cur-
rent policies, objectives, and initiatives relating to performance mea-
surement.Their comments are recorded and later categorized into key
groups or codes—in accordance to the Grounded Theory. Based on
their responses, the following terms represent the descriptions of per-
formance measurement: (1) management responsibility, (2) manage-
ment tool, (3) a component for a qualitymanagement system, and (4) a
foundation for a knowledge-based organization. This code represents
repeated assertions during the interviews.
For the private sector, the interview involved the senior level in an
organization. The official title of the interviewees included managing
directors, accounting managers, and production/operation managers.
The company’s backgrounds were as follows.
1. Service provider: software solutions for accounting and finan-
cial systems with 80 staffs
2. Service provider: transportation services (raw materials) with
60 staffs
3. Service provider:warehouse anddistribution services (finished
products) with 90 staffs
4. Manufacturer: food (cooking starch) products with 450 staffs
5. Manufacturer: automotive parts with 200 staffs
6. Manufacturer: high voltage equipment for adistribution system
with 250 staffs
All six participating companies were certified with iso 9001:2000
and/or 2008 and had previously applied the Thailand Quality Award
(which resembles the mbnqa).These companies weremembers of the
Federation of Thai Industries and were recognized as a leading com-
pany in their respectively industries. They had also operated in their
businesses for more than 15 years. This selection criterion was impor-
tant so that performance measurement had been deployed for quite
some time.
For the public sector, the official title of the interviewees included
deputy director generals, deputy commissioners, and senior advisors.
The agency’s backgrounds were as follows.
1. Agency in charge of research policies and funding. This agency
belongs to Office of the PrimeMinister.

Creating a Management System 65
2. Agency in charge of the entire public sector’s budget prepara-
tion and allocation. This agency belongs to Office of the Prime
Minister.
3. Agency in charge of updating and revising the regulations for
accounting practices and financial management among public
agencies. It belongs to Ministry of Finance.
4. Agency inchargeof researchonscienceandmathematics teach-
ing and learning for primary and secondary students as well as
training and skill development of teachers.This agency belongs
to Ministry of Education.
5. Agency in charge of improving social welfares among citizens
(e.g., a lack of affordable homes, poverty, and healthcare). This
agency belongs to Ministry of Interior.
6. Agency in charge of inspection of industrial factories to ensure
health and safety of their workforce as well as pollution control.
This agency belongs to Ministry of Industry.
All six participating agencies were considered to be leading candi-
dates for the upcoming event for the Public Sector Quality Manage-
ment Award (adapted from Thailand Quality Award for public agen-
cies). They had also received a high satisfactory mark from their stake-
holders and have maintained good reputations and images among
their peers. For the opinions expressed by participants from the pri-
vate sector, performance measurement was a necessary tool for suc-
cessful management. They perceived this term as a representation of a
newmanagerial style in theworkplace. Performancemeasurement un-
derlined the change towards management by information and knowl-
edge instead of primarily relying on experiences and judgment. It sig-
nified one of the desirable outcomes from recent investment in infor-
mation and communication technology. Performance measurement
was strongly related to knowledge management as Learning from past
mistakes is made possible with performance measurement.
For the public sector, performance measurement was mandated
as part of a performance agreement between an agency’s head and
his/her superior. This requirement was part of an effort to integrate a
4-year strategic plan with annual performance goals and targets into
a management process within individual agencies. Performance mea-
surement helped bring new terms and concepts such as efficiency, pro-
ductivity, and quality into day-to-day operations. In addition, both the

66 Chapter Two
table 2.5 Past and Present Viewpoints on Performance Measurement
Examples of the comments on performance measure-
ment from the interviews
Past-to present categories
Highlighting the requirements and responsibility of
management.
Representing a milestone of effective management—
implying a serious management failure without per-
formance measurement.
Reflecting management re-
sponsibility
Being considered as an information provider.
Representing a more systematic mechanism for feed-
back and information.
Reflecting a more systematic decision-making pro-
cess.
Being utilized with accounting information for better
insights into a company’s operations.
Providing feedback for planning and strategic
decisions—how productive an agency is, how well an
agency provides the services to citizens.
Linking database with managerial decisions.
Benchmarking efforts in an organization.
Representing a manage-
ment tool (e.g., a decision-
making process that is
based on performance in-
formation)
Increasing more acceptances from staffs when mak-
ing policy initiatives and decisions.
Improving communications between management
and workforce with greater visibility.
Being required by iso 9001: 2000 as well as the 2008
version as a means to help make better and timely de-
cisions.
Indicating a strength of a
quality management sys-
tem ( for both iso 9001:
2000 and 2008, andThai-
land Quality Award).
Representing a foundation of knowledge manage-
ment as required byThailand Quality Award.
Enhancing a learning capability of an organization as
there is more visibility for everyone.
Being part of how information should be made avail-
able and accessible to staffs.
Supporting an effort on
becoming a Learning or
knowledge-based organiza-
tion.
Budget Bureau and Ministry of Finance had encouraged public agen-
cies to develop performance measurement that is unique in order to
monitor and evaluate the progress of an organization. The summary
of the viewpoints on past and present descriptions in regard to perfor-
mance measurement is presented in Table 2.5.
It should be noted that, based on the first part of the interviews,
the level of complexity on the roles of performancemeasurement from
the past to the present appeared to increase gradually. Performance
measurement-related tasks such as identifying an appropriate set of

Creating a Management System 67
Management Responsibility
Management Tool
Quality Management System
Learning or Knowledge-based Organization
Personal level
Organizational level
figure 2.11 Increasing Levels of Complexity from Performance Measurement
key performance indicators, revising and modifying this set at least
on the annual basis, and setting and communicating the target lev-
els based on these indicators represented the fundamental respon-
sibilities of top management. It was also regarded as an important
management tool to help direct an organization and/or an operation.
Progressively, it became an integral part of a quality management sys-
tem. Finally, it was considered as a foundation for a learning organi-
zation. Based on the interviews, performance measurement had be-
come broader and complex with stronger relationships to manage-
ment responsibility.
The next stage of the interview was more challenging. It involved fu-
ture viewpoints on the roles of performance management. This repre-
sented the attempt to capture what the interviewees perceived as the
future trends in performance measurement in the workplace and an
organization.The interviews, with the same group of topmanagement,
revealed many remarkable thoughts on the emerging importance and
future roles of performance measurement. Despite the fact that some
commentsmight be conceptual and abstract in nature, they were help-
ful in visualizing the future shape and form of performance measure-
ment. In fact, for the interviews with senior executives from the public
sector, this study represented an initial step in gainingmore knowledge
on the concept of Government 2.0 (Eggers, 2005). Interestingly, their
viewpoints were not as diverse as anticipated. It appeared that partici-
pants center their opinions, based on past experiences and familiarity
with international practices.
It is important to note that participants generally agreed that per-
formancemeasurementwould becomemore important andwould im-
ply how well an organization or a functional unit was managed—high

68 Chapter Two
table 2.6 Future Viewpoints on Performance Measurement
Examples of the comments on performance measurement
from the interviews
Future categories
Symbolizing good governance in the era of globalization and
social responsibility.
Demonstrating management commitment towards contin-
uous performance improvement. High performance public
agency needs to include productivity, quality, and value-for-
money from the viewpoint of taxpayers.
Strengthening a company’s execution capability on its strate-
gies, policies, and objectives.
Indicating a strong evidence for good control and
supervision-oversight. Performance measurement, with
two-way communication, will indicate transparency, partici-
patory governance, and check-and-balance mechanism.
Reflecting good
governance, trans-
parency, and over-
sight.
Serving as a reminder of future responsibility for managerial
decisions made today.
Answering the call for more effective mechanism on monitor-
ing and evaluation.
Enhancing organizational flexibility and responsiveness as
performance information becomes available faster.
Strengthening ac-
countability.
Being foundation for a more complex audit on value for
money or budget spent.
Supporting the need to audit outputs and outcomes of a
project or a program (instead of focusing on a budget and
processes of spending money).
Influencing the shift the viewpoint from compliance to
soundness (impacts and desirable outcomes) of management
in an organization.
Assisting in the en-
largement of the au-
dit scope to be per-
formed by external
parties (e.g., gov-
ernmental agencies
and/or citizens).
Representing groundwork for making operations in an orga-
nization more repeatable and predictable (as the focus is on
variations—root causes of a problem instead of random at-
tributes).
Strengthening working environment that focuses improve-
ment such as a use of benchmarking practices.
Symbolizing competency of top management and capability
of an organization.
Attaining desirable
characteristics from
external parties—
competency and ca-
pability.
performance with openness to all stakeholders. Any future reforms to
become more open and mobile government would need performance
measurement. Performance measurement would become one of the
focal points in an organization for external stakeholders (as part of
audits—manufacturers and suppliers for contractual partnership, and
citizen groups and agencies for public spending). Apparently, perfor-

Creating a Management System 69
Good governance
Accountability
Audit
Competency and capabilityE
xter
nalu
seIn
tern
alus
e
figure 2.12 Shift towards External Use
mance measurement largely would reflect professionalism and com-
petency of top management in the near future.
Given the opinions expressed by leading managers and administra-
tors, a relatively consistent perspective on performance measurement
began to emerge. Past and present points of view indicate that perfor-
mance had gradually moved from merely a management tool to be-
come an integral part of a quality management system. The perceived
importance highlighted performance measurement as a prerequisite
for attaining a learning behavior. This behavior became critical in the
era of globalization and limited resources with more challenging goals
and objectives for continuous performance improvement.
The participants’ future anticipation on performance measurement
appeared to be more complex as it symbolized ongoing and future
trends on transparency, accountability, empowerment of staffs, and
public participation in governmental affairs. It also represented as a
surrogate or a proxy for desirable characteristics of organizational ca-
pability and competent management. It reflected a sought-after evi-
dence of how an organization or a functional unit should be managed.
More importantly, the participants agreed that the extensive use of in-
formation and communication technology would contribute greatly to
an effective performance measurement.
Document reviews support the above findings on performancemea-
surement. Probably, one of the clearest examples is the series of the reg-
ulations passed by the us government.They require all public agencies
to establish performance measurement by focusing on several aspects
such asproductivity, quality, and value formoney.These regulations are
namely: (1) Government Performance Results Act of 1993 or gpra, (2)
Government Management Reform Act of 1994 or gmra, (3) Informa-
70 Chapter Two
tion Technology Management Reform Act of 1996 or itmra, and (4)
Executive Order 12862 on Setting Customer Service Standards. These
regulations aim to: (1) inspire the confidence of citizens on the perfor-
mance levels, especially quality, standards, and consistency of services
that they receive, (2) to ensure that public agencies are responsive to
citizens, and are operationally effective, efficient, and productive while
maintaining fiscal responsibilities, and (3) to shift the focus from the
operational processes and inputs to the outputs and outcomes of im-
pacts from an agency.
To ensure that all public agencies would be accountable with good
governance practices, the Office of Management and Budget of the
us government earlier developedaperformancemeasurement-related
tool in the early 2000s. This initiative was called Program Assessment
Rating Tool or part. Information from performance measurement
represented effective management practices. Moreover, performance
measurement played a crucial role in implementing value-for-money
or performance audits. There were several regions and countries that
have performed value-for-money audits such as EuropeanCourt of Au-
ditors for European countries, Hong Kong, and Singapore.The aimwas
to ensure the public’s confidence and trust in governmental spending.
Simply put, performance measurement underlines management’s re-
sponsibilitieswhich includemeasuring, learning, and improving (Kess,
Phusavat, Torkko, & Takala, 2008).
From 1980s until 2010s, there have been somany concepts developed
relating to performance measurement (Kaplan and Norton, 2004). It
has included several attempts to measure specific areas such as pro-
ductivity, quality, innovation, and profitability. On the other hand, var-
ious comprehensive frameworks have been proposed so that the entire
performance can be measured. Despite the fact that an organization’s
objective is different, many proposed performance measurement con-
cepts allow individual organizations to adapt. Sink and Tuttle (1989)
suggested that measuring performance would include seven criteria
(i.e., profitability, productivity, quality, quality of work life, efficiency, ef-
fectiveness, and innovation).
For a public agency, the term budgetability was to be a substitute
for profitability. Nowadays, the inclusion of stakeholders was the focus
instead of the shareholders when adapting by a public agency. Based
on the 1996Guidelines for PerformanceMeasurement published byOf-
fice of Policy, us Department of Energy and the 2001 oecd Manual on

Creating a Management System 71
table 2.7 Performance Measurement Summary
Subject Description
Research
disciplines
(1) International/national/industrial levels: Economics
(2) Organizational/functional levels: Business Administration (espe-
cially Accounting), Engineering (especially Industrial Engineering),
Social Science (especially Industrial Psychology)
(3) Group/individual levels: Business Administration (especially Hu-
man Resources Management), Engineering (especially Industrial En-
gineering), Social Science (especially Industrial Psychology)
Components Many concepts and frameworks (which contain the term produc-
tivity):
(1) Harper (1984): (i) productivity, (ii) unit cost, (iii) price, (iv) factor
proportion, (v) cost proportion, (vi) product mix, and (vii) input allo-
cation
(2) Sink and Tuttle (1989): (i) profitability, (ii) productivity, (iii) inno-
vation, (iv) quality of work life, (v) quality, (vi) effectiveness, and (vii)
efficiency
(3)Thor (1994): (i) profitability, (ii) productivity, (iii) external quality,
(iv) internal quality, and (v) other quality
(4) Kaplan and Norton (1996): (i) finance, (ii) customer, (iii) internal
business process, and (vi) innovation and learning
(5) Neely (2002): (i) customers, (ii) employees, (iii) suppliers, (iv) reg-
ulators and communities, and (v) investors
MeasuringProductivitypublishedbyOrganisation forEconomicCoop-
eration and Development, the summary of performancemeasurement
is presented in Table 2.7.
Performancemeasurement should reflect howmuchknowledge and
understanding there is in all necessary areas, processes, and activities.
Good performance measurement needs to include both outputs and
inputs—indicating productivity. Effective performance measurement
needs to incorporate the outcomes and processes. Imagine a person
walks into a building in the late nightwithout the lights. It is almost im-
possible not to stumble on anything. Turing one light onmay be helpful
on the spot. Having an entire floor brighten may be useful when walk-
ing around in that floor. Still, it is not possible to walk to all floors with-
out any incident.This is an analogy of performancemeasurement. Too
few performance measures may not provide a clear picture of how an
organization has performed. Then, poor decisions (without proper in-
formation) can occur, just like a person walks without the lights in a
dark building.
Finally, performancemeasurement is shown to be a critical part of a
72 Chapter Two
management system. Measuring performance provides feedback that
a manager needs in order to properly make decisions or take actions.
This step requires good database with a timely report for evaluation
and analysis.This chapter help underscore the important remarkmade
by Deming (1986) which has been widely used since “you cannot man-
age what you cannot measure.”
Exercises
2.1 Review the quality management system (iso 9000 series) from the
1987, 1994, 2000, and 2008 versions. In your own words, describe the
roles of and the importance of performance measurement in assur-
ing the effectiveness of the iso 9001 certified company. You should
try to look at the required quality records and others within the con-
text of management reviews.
2.2 Review the mbnqa and the European Foundation for Quality Man-
agementAward. Identifywhat constitutes performance information.
In other words, what areas should a company attempt to measure?
2.3 Examine any management system that you are used to. Look closely
and determine whether there is a gap between performance mea-
surement and the “what is managed” component. Hint: The gap in-
cludes financial performance for amanager at the assembly line level
whomayneedmoreproductivity andother technical information for
evaluation and analysis.
2.4 Examine Standards, Productivity, and Innovation Board from Singa-
pore (www.spring.gov.sg/Pages/homepage.aspx) and highlight how
the term performance measurement has been promoted.
2.5 Compare and contrast Thailand Productivity Institute (www.ftpi.or
.th) andMalaysia Productivity Corporation (www.mpc.gov.my/home
/index.php) and describe the implementation of performance mea-
surement among small and medium enterprises.
References and Further Reading
Deming,W. (1986).Out of crisis.Cambridge, ma: mit Center forAdvanced
Engineering Study.
Dixon, J., Nanni, A., & Vollman, T. (1990). The new performance challenge:
Measuring operations for world class competition. Homewood, il: Ir-
win.
Eggers, W. (2005). Government 2.0: Using technology to improve education,
cut red tape, reduce gridlock, and enhance democracy. New York, ny:
Rowman & Littlefield.

Creating a Management System 73
Harper, J. (1984). Measuring business performance. Brookfield, England:
Gower.
Kaplan, R., & Norton, D. (1996).The balanced scorecard: Translating strat-
egy into action. Boston, ma: Harvard Business School Press.
Kaplan, R., & Norton, D. (2004). The strategy maps. Boston, ma: Harvard
Business School Press.
Kess, P., Phusavat, K., Torkko, M., & Takala, J. (2008). External knowl-
edge: Sharing and transfer for outsourcing relationships. Interna-
tional Journal of Business and Systems Research, 2(2), 196–213.
Kurstedt, H. (1992).Management system theory and practices (Course lec-
tures for ise 4015 and 4016). Department of Industrial and Systems
Engineering at Virginia Tech, Blacksburg, va.
Neely, A. (1998).Measuring business performance. London, England: Econ-
omist Books.
Neely, A. (2002). Business performance management theory and practice.
Cambridge, England: Cambridge University Press.
Phusavat, K. (2007). Roles of performance measurement in smes’ man-
agement processes. International Journal of Management and Enter-
prise Development, 4(4), 441–458.
Phusavat, K. (2008).University reforms: Roles of classificationon resource
allocation andmanagement. International Journal of Management in
Education, 2(3), 318–339.
Phusavat, K., Manaves, P., & Takala, J. (2007). Proposed model for perfor-
mancemeasurement standards. International Journal of Services and
Standards, 3(3), 326–351.
Phusavat, K., Anussornnitisarn, P., Helo, P., & Dwight, R. (2009). Perfor-
mance measurement: Roles and challenges. Industrial Management
& Data Systems, 109(3), 646–664.
Phusavat, K., Fankham-ai, K., Haapasalo, H., & Lin, B. (2011). Achieving en-
terprise competitiveness through an effective management process.
Human Systems Management, 30(1), 115–124.
Sink,D.,&Tuttle, T. (1989).Planningandmeasurement in your organization
of the future. Norcross, ga: ie Press.
Thor, C. (1987). 10 rules for building a measurement system (White paper).
American Productivity and Quality Center, Houston, tx.


ChapterThree
Creating Productivity Networkthrough an Integrated Approach
An organizational system consumes several types of the resources for
generating the intended outputs. Traditionally, due to the fact that
manpower is the key organizational input, labor productivity is often
used when measuring an overall productivity level. Given the com-
plexity of and the reliance on other input factors as value-added ac-
tivities for production, a single indicator does not apparently pro-
vide a complete picture of the productivity level within an organiza-
tion. To a certain extent, an integrated approach that relates various
productivity-related measures should be adopted. Dealing with cus-
tomers to understand their needs prior to partnering with appropri-
ate suppliers or contractors (just in case, services after sales as well
as technical services for production and operations are needed) until
providing such products and services to satisfy those needed require
a comprehensive view on performance. This comprehensiveness also
indicates cause-and-effect relationships among productivity-related
measures. Relating labor to capital and materials as well as to prod-
ucts and value-added is important for a complete view of the per-
formance levels. Acquiring productivity information, especially value-
added productivity, requires a systematic approach which can inte-
grate individual measures into a bigger picture (see A Guide to Produc-
tivity Measurement, 2011).
The chapter consists of five sections. The first one deals with the
concept of productivity network.This network concept was first intro-
duced by Harper (1984). Despite its inception in the early 1980s, the
practices are still popular today (based on A guide to productivity mea-
surement, 2011). An integrated approach by simultaneously consider-
ing various productivity-related indicators provides several benefits.
They include the underlined interrelationships which allow amanager
to better analyze the factors that contribute to the productivity level,
an instantaneous viewpoint on productivity, and to enable an organi-
zation to organize the data for supporting productivity measurement
efforts.
75

76 Chapter Three
Value-Added ($)
Labor (persons)
Sales Revenue ($)
Labor (persons)
Value-Added ($)
Sale Revenue ($)×
figure 3.1 Use of a Ratio-format Indicator for a Network
The second section presents the case study. The extensive applica-
tions from the productivity network are illustrated. The third section
discusses key consideration when adapting the network concept for
productivity measurement. The last two sections deal with the exer-
cises and the references.
Introduction to Productivity Network Concept
Harper (1984) developed a comprehensive productivity measurement
framework that integrated productivity-related indicators into a net-
work. Harper (1984) advocated the use of a ratio-format indicator. It
should be noted that Harper (1984) recognized that the ratios had been
used extensively, especially in the areas of financial management (e.g.,
liquidity, debt-equity, inventory turnover, profit margin, return on in-
vestment, return on assets, etc.). However, it was necessary to explore
away to explicitly connect and integrate these ratios together.With the
use of a ratio as an indicator, it is possible to formulate a network. Once
a network is established, it would also contribute to productivity anal-
ysis.
For the network in the Figure 3.1, a decline in value-added labor pro-
ductivity could be attributed by lower sale revenue per a worker ( from
a new competitor) or a lower margin on sales ( from higher product
cost). The cause-and-effect analysis should help lead to a better deci-
sion. Harper (1984) further suggested that a system analysis would be
needed in order to derive the ratios. The number of the ratios in a net-
workwoulddependon thedesirable development of network complex-
ity (e.g., network layers) for productivity analysis, and data availability
(Figure 3.2).
There are generally two rules when attempting to develop a net-
work (Harper, 1984).Thefirst one is knownas themore-than-one-factor
rule. In a production or operational system, more than one input fac-

Creating Productivity Network through an Integrated Approach 77
Distance travelled (bus-miles)
Total cost ($)
Distance travelled (bus-miles)
Labor wages ($)
Labor wages ($)
Total cost ($)×
Distance travelled (bus-miles)
Labor headcounts (persons)
Labor wages ($)
Labor headcounts (persons)÷
figure 3.2 Illustration of Productivity Network for a Service Provider
(Bus Company)
Outputs (pieces)
Labor cost ($)
Outputs (pieces)
Material cost ($)
Material cost ($)
Labor cost ($)×
figure 3.3 Illustration of the First Rule
Labor wages ($)
Output (pieces)
Labor cost ($)
Labor headcounts (persons)
Output (pieces)
Labor headcounts (persons)÷
figure 3.4 Illustration of the Second Rule
tor is needed. At least, three factors should be considered; i.e., labor,
materials, and capital. The second one is referred to as the pay-and-
productivity rule. The cost per unit is a function of productivity and
how much a company pays for input consumption (Figures 3.3 and
3.4).
The ratios in the Harper’s framework can be classified into seven
groups. They are as follows.

78 Chapter Three
1. Productivity
Productivity= Output(s) (in physical quantity)
Input(s) (in physical quantity)
Example:Output (pieces)
Labor Headcount (persons)
2. Unit cost (indicating how much a firm has to pay in order to pro-
duce one output)
Unit Cost= Input(s) (in financial value)
Output(s) (in physical quantity)
Example:Labor Cost ($)
Output (pieces)
3. Unit price (indicating howmuch a firm has to pay for a consump-
tion of one input)
Unit Price= Input (in financial value)
Input (in physical quantity of the same type)
Example:Labor Cost ($)
Labor Headcount (persons)
4. Factor Proportion
Factor Proportion= Input(s)
Input(s)
Note: Physical quantity or financial value of one input over an-
other type input.
Example:Material Cost ($)
Labor Cost ($)
5. Cost Proportion
Cost Proportion= Input
Total Inputs
Note: Financial value of one input over the total financial value
of an entire input.
Example:Labor Cost ($)
Total Cost ($)
6. Product Mix
Product Mix= Output
Output
Creating Productivity Network through an Integrated Approach 79
Note: Physical quantity or financial value of one output over an-
other output (or in some cases, one output can be broken into
smaller categories).
Example:Value of Product A ($)
Value of Product B ($)
7. Input Allocation
Input Allocation= Input
Input
Note: To be applied when one input can be broken into smaller
categories for both physical quantity and financial value.
Example:Workers Responsible for Quality Inspection ($)
Production LineWorkers ($)
It is strongly recommended that an input/output analysis should be
applied to help identify both input and output factors of either an orga-
nizational or a functional system (Phusavat & Kingpadung, 2008). The
next step is to categorize input and output factors into physical quan-
tity (e.g., kilograms, meters, m2, m3, etc.) as well as financial values ($).
It should be noted that Harper (1984) recognized that the ratios had
been used extensively, especially in the areas of financial management
(e.g., liquidity, debt-equity, inventory turnover, profit margin, return on
investment, return on assets, etc.). However, itwas necessary to explore
a way to explicitly connect and integrate the combination of financial
and non-financial ratios together. See Figure 3.5 on page 80.
Case Demonstration
Theprimary objective of the study was to improve current productivity
measurement at the plant level by applying the Harper’s performance
network concept.The application was at oneThai ElectronicManufac-
turing Plant (to be referred to as stt). The study also explored the in-
terrelationships among productivity and other performance areas as
advocated byHarper (1984) such as factor proportion, cost proportion,
etc. As stated in Harper (1984), the key productivity-related indicators
need to be in the ratio format. They reflect both outputs and inputs of
the processes with regard to production and other critical operations.
In this study, the term productivity is defined as value-added divided
by total cost. For this company, the term value-added is total revenue
subtracted by material cost (Saengchote, Phusavat, & Takala, 2006).
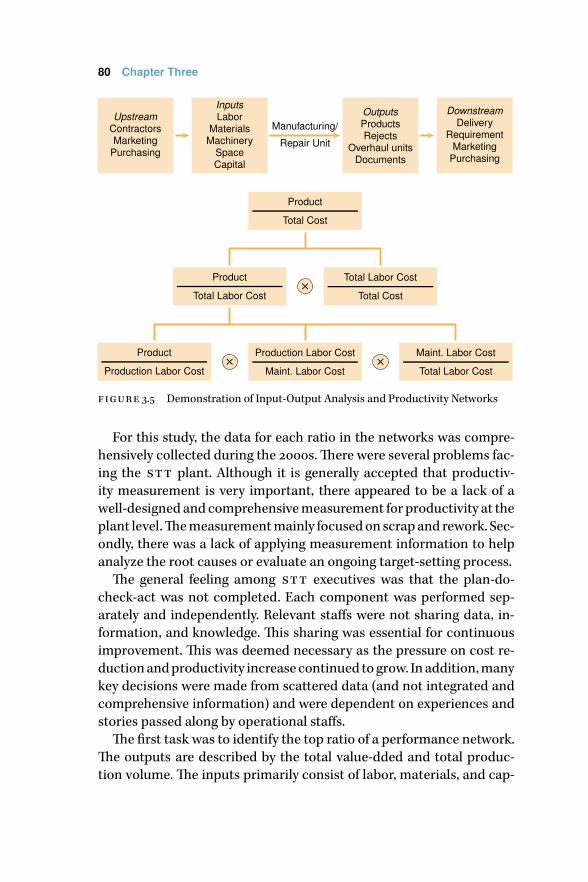
80 Chapter Three
UpstreamContractorsMarketing
Purchasing
InputsLabor
MaterialsMachinery
SpaceCapital
OutputsProductsRejects
Overhaul unitsDocuments
DownstreamDelivery
RequirementMarketing
Purchasing
Product
Total Cost
Product
Total Labor Cost
Total Labor Cost
Total Cost×
Product
Production Labor Cost
Production Labor Cost
Maint. Labor Cost
Maint. Labor Cost
Total Labor Cost× ×
Manufacturing/
Repair Unit
figure 3.5 Demonstration of Input-Output Analysis and Productivity Networks
For this study, the data for each ratio in the networks was compre-
hensively collected during the 2000s.There were several problems fac-
ing the stt plant. Although it is generally accepted that productiv-
ity measurement is very important, there appeared to be a lack of a
well-designed and comprehensivemeasurement for productivity at the
plant level.Themeasurementmainly focusedon scrapand rework. Sec-
ondly, there was a lack of applying measurement information to help
analyze the root causes or evaluate an ongoing target-setting process.
The general feeling among stt executives was that the plan-do-
check-act was not completed. Each component was performed sep-
arately and independently. Relevant staffs were not sharing data, in-
formation, and knowledge. This sharing was essential for continuous
improvement. This was deemed necessary as the pressure on cost re-
ductionandproductivity increase continued togrow. Inaddition,many
key decisions were made from scattered data (and not integrated and
comprehensive information) and were dependent on experiences and
stories passed along by operational staffs.
The first task was to identify the top ratio of a performance network.
The outputs are described by the total value-dded and total produc-
tion volume. The inputs primarily consist of labor, materials, and cap-

Creating Productivity Network through an Integrated Approach 81
ital. In this study, the focus is on measuring productivity. As a result,
for this study, the ratio reflecting productivity is defined as total value-
added/total cost. To be consistent with the term used in the company
under study, total value-added is referred to as sale turnover or revenue
subtracted by material cost. Then, the two rules (Harper, 1984) to help
further identify were applied. Some of the results from the network de-
velopment are as follows.
(1)Total value-added
Total cost= Operation cost
Total cost× Total value-added
Operation cost
(1.1)Total value-added
Operation cost= Variable cost
Operation cost× Total value-added
Variable cost
(1.1.1)Total value-added
Variable cost= Direct labor wage
Variable cost× Total value-added
Direct labor wage
(1.1.1.1)Direct labor wage
Variable cost= Direct labor wage
Production volume× Production volume
Variable cost
(2)Total value-added
Total cost= Total value-added
Direct material cost× Direct material cost
Total cost
(2.1)Total value-added
Direct material cost× Total value-added
Material overhead× Material overhead
Direct material cost
(2.1.1)Total value-added
Material overhead= Total value-added
Operation cost× Operation cost
Material overhead
(2.1.1.1)Total value-added
Operation cost= Total value-added
Other production cost× Other production cost
Operation cost
There were altogether five productivity networks established. These
networks had been made possible by breaking down the term produc-
tivity into key aspects. As advocated by Harper (1984), all indicators
are in a ratio format. The first network (Figure 3.6 on page 82) focused
on the material-cost aspect. The second network (Figure 3.7 on page
83) concentrated on the variable-cost aspect.The direct-labor cost was
the key consideration of the third network (Figure 3.8 on page 84). The
indirect-labor cost was explored and integrated for the fourth network
(Figure 3.9 on page 85). The fifth network attempted to understand
the impacts from productivity from the production-related cost (Fig-
ure 3.10 on page 86).
Themultiple regressionmethodwas applied to identify the interrela-
tionships for each productivity network. The variance inflation factor
(vif) was also utilized to help further refine the following five equa-
tions.This taskwas important so that the ratios, at the lower level of the

82 Chapter Three
Valu
eA
dded
Tota
lCos
t
Valu
eA
dded
Dir.
Mat
.Cos
t
Dir.
Mat
.Cos
t
Tota
lCos
t
Valu
eA
dded
Ope
ratio
nC
ost
Ope
ratio
nC
ost
Tota
lCos
t
Valu
eA
dded
Oth
erP
rod.
Cos
t
Oth
erP
rod.
Cos
t
Tota
lCos
t
Valu
eA
dded
Mat
.Ove
rhea
d
Mat
.Ove
rhea
d
Dir.
Mat
.Cos
t
Valu
eA
dded
Varia
ble
Cos
t
Varia
ble
Cos
t
Ope
ratio
nC
ost
Valu
eA
dded
Fixe
dO
verh
ead
Fixe
dO
verh
ead
Ope
ratio
nC
ost
Oth
erP
rod.
Cos
t
Scr
apC
ost
Scr
apC
ost
Tota
lCos
t
Valu
eA
dded
Ope
ratio
nC
ost
Ope
ratio
nC
ost
Mat
.Ove
rhea
d
Valu
eA
dded
DL
Wag
e
DL
Wag
e
Varia
ble
Cos
t
Valu
eA
dded
IDL
Wag
e
IDL
Wag
e
Fixe
dO
verh
ead
Valu
eA
dded
Rew
ork
Cos
t
Rew
ork
Cos
t
Oth
erP
rod.
Cos
t
Valu
eA
dded
Oth
erP
rod.
Cos
t
Oth
erP
rod.
Cos
t
Ope
ratio
nC
ost
Valu
eA
dded
Exp
ense
Equ
ip.
Exp
ense
Equ
ip.
Varia
ble
Cos
t
Valu
eA
dded
Dep
reci
atio
n
Dep
reci
atio
n
IDL
Wag
e
Valu
eA
dded
Pro
d.Vo
lum
e
Pro
d.Vo
lum
e
Rew
ork
Cos
t
DL
Wag
e
Pro
d.Vo
lum
e
Pro
d.Vo
lum
e
Varia
ble
Cos
t
fig
ure3.6
IllustrationofProductivityNetwork
#1

Creating Productivity Network through an Integrated Approach 83Va
lue
Add
ed
Tota
lCos
t
Valu
eA
dded
Dir.
Mat
.Cos
t
Dir.
Mat
.Cos
t
Tota
lCos
t
Valu
eA
dded
Ope
ratio
nC
ost
Ope
ratio
nC
ost
Tota
lCos
t
Valu
eA
dded
Oth
erP
rod.
Cos
t
Oth
erP
rod.
Cos
t
Tota
lCos
t
Valu
eA
dded
Mat
.Ove
rhea
d
Mat
.Ove
rhea
d
Dir.
Mat
.Cos
t
Valu
eA
dded
Varia
ble
Cos
t
Varia
ble
Cos
t
Ope
ratio
nC
ost
Valu
eA
dded
Fixe
dO
verh
ead
Fixe
dO
verh
ead
Ope
ratio
nC
ost
Oth
erP
rod.
Cos
t
Scr
apC
ost
Scr
apC
ost
Tota
lCos
t
Valu
eA
dded
Ope
ratio
nC
ost
Ope
ratio
nC
ost
Mat
.Ove
rhea
d
Valu
eA
dded
DL
Wag
e
DL
Wag
e
Varia
ble
Cos
t
Valu
eA
dded
IDL
Wag
e
IDL
Wag
e
Fixe
dO
verh
ead
Valu
eA
dded
Rew
ork
Cos
t
Rew
ork
Cos
t
Oth
erP
rod.
Cos
t
Valu
eA
dded
Oth
erP
rod.
Cos
t
Oth
erP
rod.
Cos
t
Ope
ratio
nC
ost
Valu
eA
dded
Exp
ense
Equ
ip.
Exp
ense
Equ
ip.
Varia
ble
Cos
t
Valu
eA
dded
Dep
reci
atio
n
Dep
reci
atio
n
IDL
Wag
e
Valu
eA
dded
Pro
d.Vo
lum
e
Pro
d.Vo
lum
e
Rew
ork
Cos
t
DL
Wag
e
Pro
d.Vo
lum
e
Pro
d.Vo
lum
e
Varia
ble
Cos
t
fig
ure3.7
IllustrationofProductivityNetwork
#2

84 Chapter Three
Valu
eA
dded
Tota
lCos
t
Valu
eA
dded
Dir.
Mat
.Cos
t
Dir.
Mat
.Cos
t
Tota
lCos
t
Valu
eA
dded
Ope
ratio
nC
ost
Ope
ratio
nC
ost
Tota
lCos
t
Valu
eA
dded
Oth
erP
rod.
Cos
t
Oth
erP
rod.
Cos
t
Tota
lCos
t
Valu
eA
dded
Mat
.Ove
rhea
d
Mat
.Ove
rhea
d
Dir.
Mat
.Cos
t
Valu
eA
dded
Varia
ble
Cos
t
Varia
ble
Cos
t
Ope
ratio
nC
ost
Valu
eA
dded
Fixe
dO
verh
ead
Fixe
dO
verh
ead
Ope
ratio
nC
ost
Oth
erP
rod.
Cos
t
Scr
apC
ost
Scr
apC
ost
Tota
lCos
t
Valu
eA
dded
Ope
ratio
nC
ost
Ope
ratio
nC
ost
Mat
.Ove
rhea
d
Valu
eA
dded
DL
Wag
e
DL
Wag
e
Varia
ble
Cos
t
Valu
eA
dded
IDL
Wag
e
IDL
Wag
e
Fixe
dO
verh
ead
Valu
eA
dded
Rew
ork
Cos
t
Rew
ork
Cos
t
Oth
erP
rod.
Cos
t
Valu
eA
dded
Oth
erP
rod.
Cos
t
Oth
erP
rod.
Cos
t
Ope
ratio
nC
ost
Valu
eA
dded
Exp
ense
Equ
ip.
Exp
ense
Equ
ip.
Varia
ble
Cos
t
Valu
eA
dded
Dep
reci
atio
n
Dep
reci
atio
n
IDL
Wag
e
Valu
eA
dded
Pro
d.Vo
lum
e
Pro
d.Vo
lum
e
Rew
ork
Cos
t
DL
Wag
e
Pro
d.Vo
lum
e
Pro
d.Vo
lum
e
Varia
ble
Cos
t
fig
ure3.8
IllustrationofProductivityNetwork
#3

Creating Productivity Network through an Integrated Approach 85Va
lue
Add
ed
Tota
lCos
t
Valu
eA
dded
Dir.
Mat
.Cos
t
Dir.
Mat
.Cos
t
Tota
lCos
t
Valu
eA
dded
Ope
ratio
nC
ost
Ope
ratio
nC
ost
Tota
lCos
t
Valu
eA
dded
Oth
erP
rod.
Cos
t
Oth
erP
rod.
Cos
t
Tota
lCos
t
Valu
eA
dded
Mat
.Ove
rhea
d
Mat
.Ove
rhea
d
Dir.
Mat
.Cos
t
Valu
eA
dded
Varia
ble
Cos
t
Varia
ble
Cos
t
Ope
ratio
nC
ost
Valu
eA
dded
Fixe
dO
verh
ead
Fixe
dO
verh
ead
Ope
ratio
nC
ost
Oth
erP
rod.
Cos
t
Scr
apC
ost
Scr
apC
ost
Tota
lCos
t
Valu
eA
dded
Ope
ratio
nC
ost
Ope
ratio
nC
ost
Mat
.Ove
rhea
d
Valu
eA
dded
DL
Wag
e
DL
Wag
e
Varia
ble
Cos
t
Valu
eA
dded
IDL
Wag
e
IDL
Wag
e
Fixe
dO
verh
ead
Valu
eA
dded
Rew
ork
Cos
t
Rew
ork
Cos
t
Oth
erP
rod.
Cos
t
Valu
eA
dded
Oth
erP
rod.
Cos
t
Oth
erP
rod.
Cos
t
Ope
ratio
nC
ost
Valu
eA
dded
Exp
ense
Equ
ip.
Exp
ense
Equ
ip.
Varia
ble
Cos
t
Valu
eA
dded
Dep
reci
atio
n
Dep
reci
atio
n
IDL
Wag
e
Valu
eA
dded
Pro
d.Vo
lum
e
Pro
d.Vo
lum
e
Rew
ork
Cos
t
DL
Wag
e
Pro
d.Vo
lum
e
Pro
d.Vo
lum
e
Varia
ble
Cos
t
fig
ure3.9
IllustrationofProductivityNetwork
#4

86 Chapter Three
Valu
eA
dded
Tota
lCos
t
Valu
eA
dded
Dir.
Mat
.Cos
t
Dir.
Mat
.Cos
t
Tota
lCos
t
Valu
eA
dded
Ope
ratio
nC
ost
Ope
ratio
nC
ost
Tota
lCos
t
Valu
eA
dded
Oth
erP
rod.
Cos
t
Oth
erP
rod.
Cos
t
Tota
lCos
t
Valu
eA
dded
Mat
.Ove
rhea
d
Mat
.Ove
rhea
d
Dir.
Mat
.Cos
t
Valu
eA
dded
Varia
ble
Cos
t
Varia
ble
Cos
t
Ope
ratio
nC
ost
Valu
eA
dded
Fixe
dO
verh
ead
Fixe
dO
verh
ead
Ope
ratio
nC
ost
Oth
erP
rod.
Cos
t
Scr
apC
ost
Scr
apC
ost
Tota
lCos
t
Valu
eA
dded
Ope
ratio
nC
ost
Ope
ratio
nC
ost
Mat
.Ove
rhea
d
Valu
eA
dded
DL
Wag
e
DL
Wag
e
Varia
ble
Cos
t
Valu
eA
dded
IDL
Wag
e
IDL
Wag
e
Fixe
dO
verh
ead
Valu
eA
dded
Rew
ork
Cos
t
Rew
ork
Cos
t
Oth
erP
rod.
Cos
t
Valu
eA
dded
Oth
erP
rod.
Cos
t
Oth
erP
rod.
Cos
t
Ope
ratio
nC
ost
Valu
eA
dded
Exp
ense
Equ
ip.
Exp
ense
Equ
ip.
Varia
ble
Cos
t
Valu
eA
dded
Dep
reci
atio
n
Dep
reci
atio
n
IDL
Wag
e
Valu
eA
dded
Pro
d.Vo
lum
e
Pro
d.Vo
lum
e
Rew
ork
Cos
t
DL
Wag
e
Pro
d.Vo
lum
e
Pro
d.Vo
lum
e
Varia
ble
Cos
t
fig
ure3.10
IllustrationofProductivityNetwork
#5

Creating Productivity Network through an Integrated Approach 87
table 3.1 Illustration of Initial Network’s Statistical Analysis
Predictor Coefficient se coeff. t p vif
Constant –0.2806 0.2000 –1.40 0.184
va/exp eq 0.014612 0.006686 2.19 0.048 36.4
exp eq/var c 0.5954 0.2258 2.64 0.021 21.5
var c/opc 0.1410 0.1683 0.84 0.417 9.0
opc/ttl c 0.92435 0.04626 19.98 0.000 1.2
notes s = 0.00908823, R2 = 97.6%, R2 (adj.) = 96.8%.
Analysis of variance
Source df ss ms f p
Regression 4 0.042813 0.010703 129.59 0.000
Residual error 13 0.001074 0.000083
Total 17 0.043887
va/exp eq 1 0.001025
exp eq/var c 1 0.007168
var c/opc 1 0.001641
opc/ttl c 1 0.032980
network, were verified without their duplicative effects at the higher
level. For this study, if the vif value is greater than 5, then the ratios
were removed under the condition of correlation coefficient greater
than 0.80 by using the pair-wise method. To illustrate how the equa-
tion is developed and refined, the focus is on Productivity Network #2.
For the initial Productivity Network #2, the regression equation is:
va/ttl c = −0.281+0.0146 va/exp eq +0.595 exp eq/var c
+ 0.141 var c/opc +0.924 opc/ttl c.
In the above initial productivity network #2, the vifs that are greater
than the value of 5 are 36.4 and 21.5. Therefore, a multi-collinearity
problem exists. In order to reduce the multi-collinearity, the variables
va/exp eq (x1) and exp eq/var c (x2) are removed. Notes: va/exp
eq (x1), vif1 = 36.4; exp eq/var c (x2), vif2 = 21.5; var c/opc (x3),
vif3 = 9.0; opc/ttl c (x4), vif4 = 1.2.
The new simpler equation is established. The revised performance
network #2 shows that Ra2 is 95.1%. This implies that 95.1 percent of
the value of va/ttl c (y) had been determined when the two regres-
sor variables var c/opc (x1) and opc/ttl c (x2) were involved. Given
that vif1 = vif2 = 1.1, this indicates that the ratios of var c/opc (x1)

88 Chapter Three
table 3.2 Illustration of Revised Network’s Statistical Analysis
Predictor Coefficient se coeff. t p vif
Constant 0.14364 0.05790 2.48 0.025
var c/opc –0.15531 0.07348 –2.11 0.052 1.1
opc/ttl c 0.92138 0.05615 16.41 0.000 1.1
notes s = 0.0112016, R2 = 95.7%, R2 (adj) = 95.1%.
Analysis of variance
Source df ss ms f p
Regression 2 0.042005 0.021003 167.38 0.000
Residual error 15 0.001882 0.000125
Total 17 0.043887
var c/opc 1 0.008218
opc/ttl c 1 0.033787
and opc/ttl c (x2) are not highly correlated between themselves.
Therefore, the removal of the ratios of va/exp eq and exp eq/var
c appeared to reduce the multi-collinearity problem and improve the
regression model or equation.
For the revised productivity network #2, the regression equation is:
va/ttl c= 0.144−0.155var c/opc+0.921opc/ttl c.
Thefinal results of the regressionquestions fromthefiveproductivity
network are presented in Table 3.3.
To further verify the usefulness of the networks and their informa-
tion, a discussion sessionwas heldwith stt executives andplantman-
agers. The aim was to gather their feedback and comments within the
context of the usefulness of new productivity information.The suitable
networks for this plant should at the minimum contain the ratios of
variable cost-to-operation cost, and operation cost-to-total cost. Other
ratios that are partially helpful include the ratios of material cost-to-
total cost, material overhead cost-to-material cost, etc. In particular,
the following discussion provides key observations as a result from the
meeting.
• All five networks were apparently suitable for stt productivity
measurement. Specifically, Productivity Networks #2, #3, and #4
with the predictability (adjusted R2) at 95.1%, 95.1% and 95.0%
had receivedmore attention from the executive and plantman-
ager relatively Productivity Networks #1 and #5.
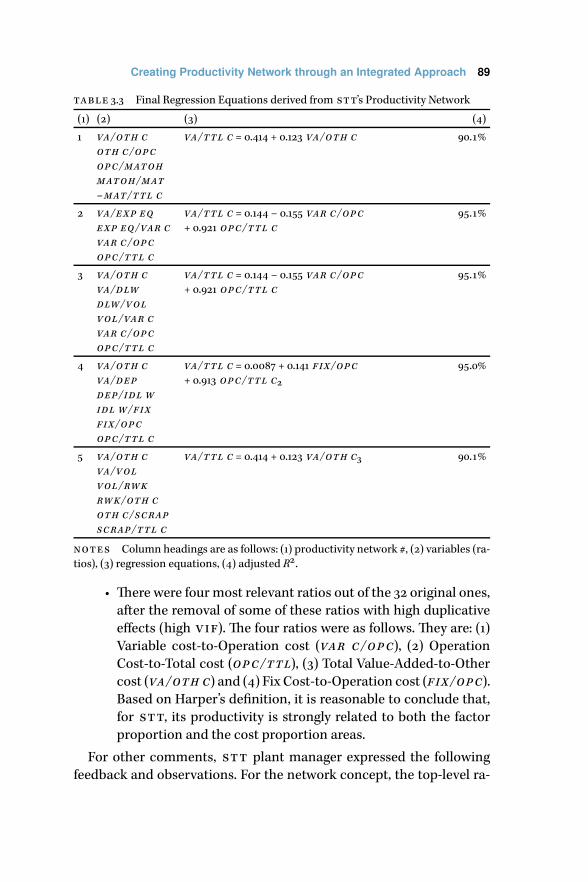
Creating Productivity Network through an Integrated Approach 89
table 3.3 Final Regression Equations derived from stt’s Productivity Network
(1) (2) (3) (4)
1 va/oth c
oth c/opc
opc/matoh
matoh/mat
–mat/ttl c
va/ttl c = 0.414 + 0.123 va/oth c 90.1%
2 va/exp eq
exp eq/var c
var c/opc
opc/ttl c
va/ttl c = 0.144 – 0.155 var c/opc
+ 0.921 opc/ttl c
95.1%
3 va/oth c
va/dlw
dlw/vol
vol/var c
var c/opc
opc/ttl c
va/ttl c = 0.144 – 0.155 var c/opc
+ 0.921 opc/ttl c
95.1%
4 va/oth c
va/dep
dep/idl w
idl w/fix
fix/opc
opc/ttl c
va/ttl c = 0.0087 + 0.141 fix/opc
+ 0.913 opc/ttl c2
95.0%
5 va/oth c
va/vol
vol/rwk
rwk/oth c
oth c/scrap
scrap/ttl c
va/ttl c = 0.414 + 0.123 va/oth c3 90.1%
notes Column headings are as follows: (1) productivity network #, (2) variables (ra-
tios), (3) regression equations, (4) adjusted R2.
• There were four most relevant ratios out of the 32 original ones,
after the removal of some of these ratios with high duplicative
effects (high vif). The four ratios were as follows. They are: (1)
Variable cost-to-Operation cost (var c/opc), (2) Operation
Cost-to-Total cost (opc/ttl), (3) Total Value-Added-to-Other
cost (va/oth c) and (4) Fix Cost-to-Operation cost (fix/opc).
Based on Harper’s definition, it is reasonable to conclude that,
for stt, its productivity is strongly related to both the factor
proportion and the cost proportion areas.
For other comments, stt plant manager expressed the following
feedback and observations. For the network concept, the top-level ra-
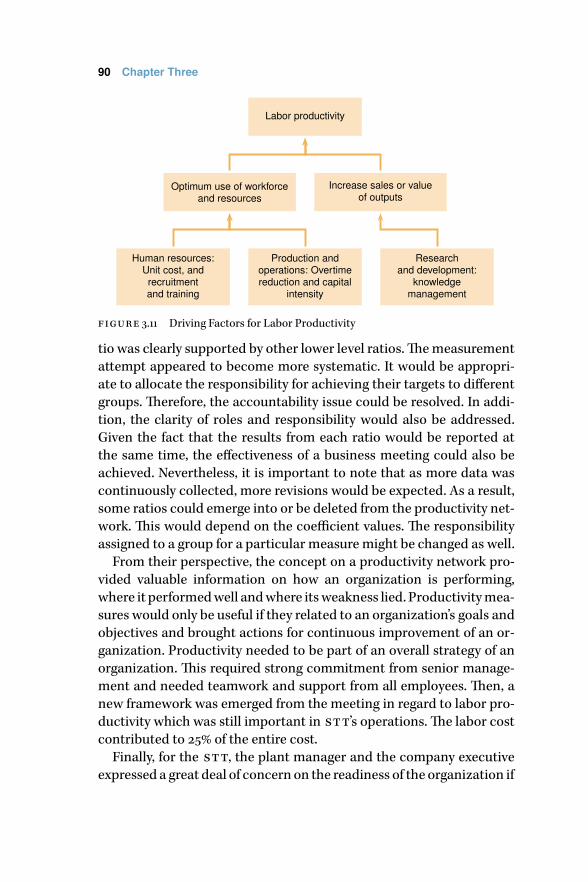
90 Chapter Three
Labor productivity
Optimum use of workforceand resources
Increase sales or valueof outputs
Human resources:Unit cost, andrecruitmentand training
Production andoperations: Overtimereduction and capital
intensity
Researchand development:
knowledgemanagement
figure 3.11 Driving Factors for Labor Productivity
tio was clearly supported by other lower level ratios.Themeasurement
attempt appeared to become more systematic. It would be appropri-
ate to allocate the responsibility for achieving their targets to different
groups. Therefore, the accountability issue could be resolved. In addi-
tion, the clarity of roles and responsibility would also be addressed.
Given the fact that the results from each ratio would be reported at
the same time, the effectiveness of a business meeting could also be
achieved. Nevertheless, it is important to note that as more data was
continuously collected, more revisions would be expected. As a result,
some ratios could emerge into or be deleted from the productivity net-
work. This would depend on the coefficient values. The responsibility
assigned to a group for a particular measure might be changed as well.
From their perspective, the concept on a productivity network pro-
vided valuable information on how an organization is performing,
where it performedwell andwhere itsweakness lied. Productivitymea-
sures would only be useful if they related to an organization’s goals and
objectives and brought actions for continuous improvement of an or-
ganization. Productivity needed to be part of an overall strategy of an
organization. This required strong commitment from senior manage-
ment and needed teamwork and support from all employees. Then, a
new framework was emerged from the meeting in regard to labor pro-
ductivity which was still important in stt’s operations. The labor cost
contributed to 25% of the entire cost.
Finally, for the stt, the plant manager and the company executive
expressed a great deal of concern on the readiness of the organization if
Creating Productivity Network through an Integrated Approach 91
the conceptwere to be fully implemented. In particular, the investment
on upgrading and linking the databases from other functional units for
real time and reliable data would be necessary as a prerequisite to pro-
ductivity measurement. This was due to the same frequency of data to
be collected for the ratios developed (Saengchote et al., 2006).The cul-
ture of “show me” instead of “trust or believe me” was still prevailing.
By relying heavily on the quantitative feature, the impacts on working
culture would have to be considered. Simply put, it appears there were
two issues to be addressed prior to the deployment the productivity
network concept at the stt; i.e., the database readiness and the staff
preparation.
Key Application Consideration for Productivity Network
The productivity concept’s application is illustrated. It provides use-
ful productivity information which is based on cause-and-effect rela-
tionships among key ratios. To support its use in an organization, the
summary on what an organization needs to consider when adapting
the network concept for productivity measurement can be described
briefly as follows (Phusavat, 2003).
• Unit dimension:There aremany dimensions formeasuring ratio
such as person, unit, $, m2, m3, and mile. The determination of
measuring an output or an input side in terms of a physical or a
financial value needs to be initially clarified.
• Level of network complexity:There is no specific requirement on
the network level. It depends on an organization whether the
network provides sufficient information on an overall produc-
tivity and performance level.
• Data availability: The definition of terms and the preparation
for data collection need to be first thought out. The data fre-
quency (e.g., daily, weekly, monthly, and quarterly) within a net-
work needs to be the same. The definition clarity is needed to
ensure the consistency of the data to be collected.
• Process stability and product portfolio:Anorganization planning
to adapt the Harper (1984) network concept should have stan-
dardized operations which indicate resource consumption for
each output unit generated. In addition, the products/services
offered should be stable over time so that a comparison and in-
formation analysis can be made.
92 Chapter Three
• Inflation: A primary assumption for the Harper (1984) network
concept is low inflation which does not create a great deal im-
pact on either unit cost or price during purchases and sales re-
spectively. For a company with a long lead time during a pur-
chase and a usage of the materials, when faced with high infla-
tion, would have some difficulty in choosing which price to be
used in a network.
The use of the productivity-network concept is still popular today,
especially with an organization that is classified as labor intensive, and
has stable product portfolios over the years with standardized oper-
ational processes (Bouckaert, 1990; Mondal, Maiti, & Ray, 2010). De-
spite a lot of flexibility in identifying productivity-related ratios, Harper
(1984), including the 2011 spring’s A guide to productivity measure-
ment, strongly suggested a network needs to contain some of the fol-
lowing indicators.
• Return on capital: Profit ÷ Capital employed
• Capital turnover: Sales ÷ Capital employed
• Share of profit in value-added: Profit ÷ Value added
• Profit margin: Profit ÷ Sales
• Efficient use of purchased materials and services: Value-added
÷ Sales
• Value-added labor productivity: Value-added ÷ Labor
• Value-added capital productivity: Value-added ÷ Capital em-
ployed
• Capital intensity: Capital employed ÷ Labor
• Labor contributions: Sales ÷ Labor
• Unit labor cost: Labor cost ÷ Labor headcounts
In conclusion, the applications of the Harper (1984) network allow
an organization to focus on the significant factor(s) that impact on the
performance levels. Key attributes to productivity should bemeasured
such as capital and materials in an integrated way (Stainer, 1997). The
network concept also concentrates on information usefulness which
contributes directly to decisions and actions by an organization’s man-
agement. The top level ratio should reflect the policy objectives of an
organization.Whenproperly developed, a network should help explain
interrelationships among its ratios’ information, and related trends

Creating Productivity Network through an Integrated Approach 93
table 3.4 Data for Developing a Productivity Network (Exercise 3.4)
(1) (2) (3) (4) (5) (6) (7)
1 1.4100 18.6713 1.5904 0.0755 2.4270 0.0832
2 1.2691 12.8669 1.0374 0.0986 2.7700 0.0755
3 1.3842 17.9452 1.5667 0.0771 2.3666 0.0804
4 1.6357 20.8282 2.4507 0.0785 2.2391 0.0845
5 1.3815 17.3014 1.7629 0.0798 2.6596 0.0879
6 1.4309 17.9953 1.4290 0.0795 2.3444 0.0782
7 1.4186 18.6279 1.4801 0.0762 2.3490 0.0721
8 1.3795 24.1876 2.0785 0.0570 2.4719 0.0891
9 1.2381 17.4569 1.3779 0.0709 2.0925 0.0806
notes Column headings are as follows: (1) Ratio/Period, (2) Revenue/Total Cost, (3)
Revenue/Labor Cost, (4) Revenue/Material Cost, (5) Labor Cost/Total Cost, (6) Prod-
uct/Utility, (7) Product/Material.
and patterns. Several recommended ratios above are part of an indus-
try’s standards so possible further comparisons exist. Monitoring in-
dustrial standards represents a foundation for long-term continuous
improvement in productivity and performance.
Exercises
3.1 Conduct the Input-output Analysis of a company of your choice. De-
velop a productivity network.
3.2 Based on the case discussion in the third section, examine and pro-
vide your comments whether the non-linear relationships should be
established. Why and why not.
3.3 Analyze the case demonstration (Figure 3.12 on page 94). Examine a
firmoperating in anagricultural business andprovide your feedback.
3.4 Develop a productivity network based on Table 3.4. Apply the Scat-
tering Plot to analyze the interrelationships among different ratios.
Hint: You may develop more than one network.
References and Further Reading
A guide to productivity measurement. (2011). Singapore: Standard, Produc-
tivity, and Innovation Board.
Bouckaert, G. (1990). The history of the productivity movement. Public
Productivity and Management Review, 14(1), 53–81.
Harper, J. (1984). Measuring business performance. Brookfield, England:
Gower.
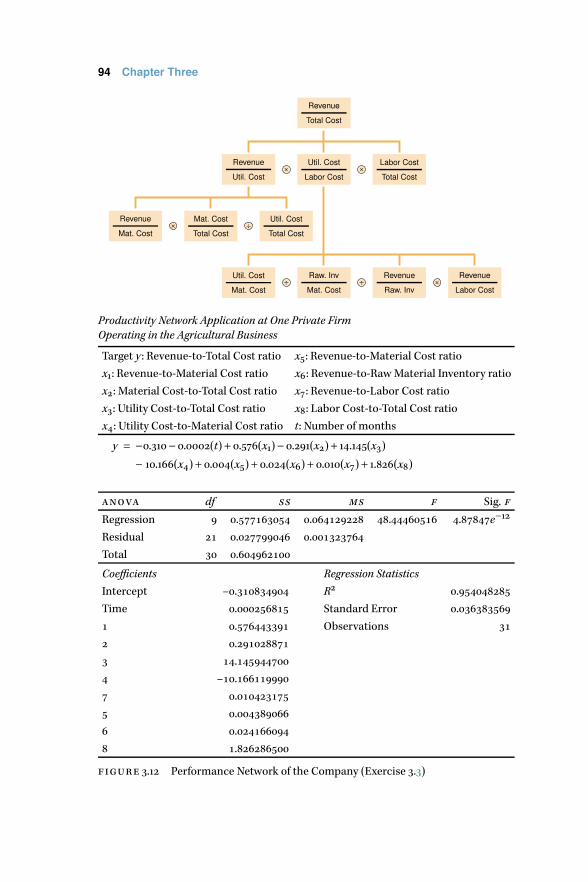
94 Chapter Three
Revenue
Total Cost
Revenue
Util. Cost
Util. Cost
Labor Cost
Labor Cost
Total Cost× ×
Revenue
Mat. Cost
Mat. Cost
Total Cost
Util. Cost
Total Cost× ÷
Util. Cost
Mat. Cost
Raw. Inv
Mat. Cost
Revenue
Raw. Inv
Revenue
Labor Cost÷ ÷ ×
Productivity Network Application at One Private Firm
Operating in the Agricultural Business
Target y : Revenue-to-Total Cost ratio x5: Revenue-to-Material Cost ratio
x1: Revenue-to-Material Cost ratio x6: Revenue-to-RawMaterial Inventory ratio
x2: Material Cost-to-Total Cost ratio x7: Revenue-to-Labor Cost ratio
x3: Utility Cost-to-Total Cost ratio x8: Labor Cost-to-Total Cost ratio
x4: Utility Cost-to-Material Cost ratio t: Number of months
y = −0.310−0.0002(t)+0.576(x1)−0.291(x2)+ 14.145(x3)
− 10.166(x4)+0.004(x5)+0.024(x6)+0.010(x7)+ 1.826(x8)
anova df ss ms f Sig. f
Regression 9 0.577163054 0.064129228 48.44460516 4.87847e−12
Residual 21 0.027799046 0.001323764
Total 30 0.604962100
Coefficients Regression Statistics
Intercept –0.310834904 R2 0.954048285
Time 0.000256815 Standard Error 0.036383569
1 0.576443391 Observations 31
2 0.291028871
3 14.145944700
4 –10.166119990
7 0.010423175
5 0.004389066
6 0.024166094
8 1.826286500
figure 3.12 Performance Network of the Company (Exercise 3.3)

Creating Productivity Network through an Integrated Approach 95
Mondal, S., Maiti, J., & Ray, P. (2010). Development of ameasurementmet-
ric for manufacturing process robustness. International Journal of
Productivity and Quality Management, 6(2), 156–181.
Phusavat, K., & Kingpadung, K. (2008). Application of performance net-
work for target setting. Journal of Research and Development, 19(1),
43–52.
Saengchote, P., Phusavat, K., & Takala, J. (2006). The performance net-
work concept for productivity measurement: Case application at
One ElectronicManufacturing Plant inThailand. Journal of Research
in Engineering and Technology, 3(1), 18–29.
Phusavat, K. (2003). Integration of a logistic support system into quality
assurance effort and for organizational performance measurement.
Logistics Spectrum, 36(4), 8–18.
Stainer, A. (1997). Capital input and total productivitymanagement.Man-
agement Decision, 35(3), 224–232.


Chapter Four
Multi-Factor ProductivityMeasurement Model
The importance and popularity of performance (especially productiv-
ity) measurement had continuously increased during 1990s. According
to Neely (1998), there had been new reports and articles on this topic
appearing at a rate of one for everyfivehours of everyworkingday since
1994. In 1996 alone, one new book on this subject appeared every two
weeks. For the same year, the survey found that 64% of American busi-
nesses were actively experimenting with new ways of measuring and
utilizing non-financial data. Even in the United Kingdom, the govern-
ment issued the statement calling formore vigorous research infinding
better ways to capture the performance of an organization regardless
whether it operates as a private firm or a public agency.
The chapter focuses on one of the most important techniques for
productivity measurement. Measuring productivity represents a sys-
tematic attempt to understand both inputs and outputs of an orga-
nization and/or a production system. The Multi-factor Productivity
Measurement Model or mfpmm was developed in the 1970s during
the apqc’s initial efforts in promoting productivity measurement at
an organizational and/or plant level. Since then, the mfpmm has
long been implemented for assessment of profitability for several well-
known corporations such as Phillips Petroleum, General Foods, and so
on (Phusavat, Anussornnitisarn, Sujitwanit, & Kess, 2009). The chap-
ter aims to describe the mfpmm’s computational and information
analysis frameworks. One specific case is to be illustrated with the ad-
vantages, disadvantages, and consideration factors the model’s appli-
cations.
The essential premise for the mfpmm is that the increase in prof-
itability is based on the improvement of two specifically areas: produc-
tivity and price-recovery. The mfpmm is widely regarded because it
portrays a comprehensive picture with forward-looking information.
The mfpmm represents one of the earlier efforts in explicitly linking
productivity and performance measurement with information analy-
sis (Phusavat, 2010). The model contains a combination of financial
97

98 Chapter Four
Performance (Productivity)Management
Measurement Analysis Improvement
Level Criteria Methodology
figure 4.1 Scope of the mfpmm in a Management Process
and non-financial information which is helpful when communicating
with technical staffs at a plant level as well as management staffs and
executives. The mfpmm is applicable at both an organization and a
plant level with three main criteria; i.e., profitability, productivity, and
price recovery. The methodology is regarded as quantitative. The mf-
pmm uses primarily accounting data with the unit cost standards (Fig-
ure 4.1).
Introduction
The mfpmm was developed by the apqc in 1977 for measuring pro-
ductivity and price recovery, and for explicitly relating these results
with profitability at the organizational/functional levels (Sink, Tuttle,
& DeVries, 1984). The mfpmm’s primary focus is on a manufactur-
ing/productionunitwith tangible outputs and inputs. It is suitable for a
process that is stablewhich implies that there are not-so-often changes
in products being offered (Sink & Tuttle, 1989). The mfpmm can eas-
ily adapt the data from a typical accounting system. The mfpmm is
also knownas the “Profitability =Productivity +PriceRecovery” or ppp
model in some literatures (Rao & Miller, 2004). The mfpmm was ini-
tiated under the urgency of integrating productivity information into
all levels within an organization. In the late 1970s, many businesses in
the us were faced with the gradual decline in productivity which had
caused negative impacts on profitability.
Instead of having individual indicators reflecting pieces of perfor-
mance information, some forms of aggregate measurement should

Multi-Factor Productivity Measurement Model 99
be promoted (Sink, 1985). The mfpmm attempts to expand routine
accounting information by incorporating several ideas and concepts
suchasproductivity, price recovery, opportunity gain/loss, and forward-
looking information. Profit depends on the revenue generated and the
cost to be paid by an organization.The level of revenue is derived from
the amount of products produced and the unit price that an organiza-
tion is able to charge. The similar description can be explained for the
cost level.
The mfpmm is regarded as a dynamic and comprehensive approach
to track the performance in the areas of profitability, productivity, and
price-recovery (Phusavat, Jaiwong, Sujitwanit, & Kanchana, 2008). Its
focus is on changes in the inputs with respect to the outputs from the
system under study. This focus includes the aspects of quantity, price
and cost per unit, and the values of revenues and costs. The model’s
application is designed to be at the organizational level. The essential
premise of the model is that profitability is a function of productivity
and price-recovery (Sumanth, 1998).
The data requirement for the mfpmm can be found from tradi-
tional accounting and standard-costing systems. The set of required
data needs to be periodic for all outputs and inputs, such as annually,
semi-annually, quarterly,monthly, and so on.The fundamental concept
for the analysis is the comparison of data from one period (known as
the base period) with data from the next period (the current period).
Different ratios in the model communicate a set of information about
the system under investigation.
Specifically, the term productivity is defined as the relationship of
the input-quantity used with respect to the output-quantity generated
from the system. In other words, when dealing with the changes in the
quantities of products generated and the resources consumed (i.e., out-
puts and inputs), it corresponds to the termproductivity (Kaydos, 1991).
The price-recovery indicates the relationship between the unit price
of outputs and the unit cost of inputs. The term, price-recovery, can
be perceived as the extent to which the increases in unit of inputs are
passed on to the customers in terms of the higher unit price of outputs.
Simply out, the ability for an organization to raise its unit price as a re-
sult of an increase in a unit cost of resources consumed for production
is referred to as price recovery.
If the organization has been productive and has performed well on
its price-recovery, it should be profitable. The term, profitability, im-

100 Chapter Four
Change in outputquantity
Change in revenuesChange in output price
(unit price)
Change in productivity Change in profitsChange in price andcost (price recovery)
Change in inputquantity
Change in costsChange in input cost
(unit cost)
figure 4.2 Background of the mfpmm Development (adapted from Sink, 1985)
plies the relationship between the two rates of change- revenue gen-
erated and cost incurred. The firm is profitable when its revenue has
increased at a faster rate than that of its cost. As a result, there are four
ways that can directly influence an organization’s profit level.They are:
revenue, cost, productivity, and price-recovery (Figure 4.2).
One of the key contributors to the mfpmm’s popularity is the for-
ward-looking integration by blending with the opportunity concept. In
addition, there are two viewpoints on productivity; i.e., static and dy-
namic. See the following demonstration.
Year 2011 2012
Output Value Generated ($) 5,000,000 6,000,000
Input Value Consumed ($) 1,000,000 1,500,000
Based on the above example, the following implications can be sum-
marized.
1. Surplus from the difference between the output and input val-
ues:
• Year 2011: $4,000,000
• Year 2012: $4,500,000
2. Productivity level, from the static viewpoint, implying the out-
put value divided by the input value:
• Year 2011: 5.0
• Year 2012: 4.0

Multi-Factor Productivity Measurement Model 101
3. Productivity level from the dynamic perspective is as follows:
• The rate of change in output values is 1.20 ( from 6,000,000
÷ 5,000,000) or the output value has gone up by 20%.
• Rate of change in input values is 1.50 ( from 1,500,000 ÷1,000,000) or the output value has gone up by 50%.
• Therefore, the rate of change in productivity is only 0.80
due to the fact that the rate of input consumption has in-
creased faster than the rate of output generation ( from 1.20
÷ 1.50). If this trend continues, the profit level will gradually
decline.
From the opportunity viewpoint, to quantify this loss, the model’s
calculation is based on two scenarios—cost or profit center. For the
cost center’s viewpoint, the opportunity loss is derived from the follow-
ing rationale. This viewpoint is suitable for plant or production man-
agers. A company generates the output of $5,000,000 with the con-
sumption of $1,000,000 worth of the inputs. If a company is able to
generate up to $6,000,000 of the output, the input consumption should
havebeenonly $1,200,000 ( from(6,000,000× 1,000,000)÷ 5,000,000). It
means that this company has consumed the input more than it should
have consumed by $300,000. This represents the opportunity loss (not
a financial loss) of $300,000.
For the profit center’s point of view, a company consumes the inputs
worth of $1,000,000 to generate the output value of $5,000,000. This
point of view is suitable for managing director or chief executive offi-
cer. If a company actually consumes $1,500,000 of the input, the output
value that should have been generated is $7,500,000 ( from (5,000,000×1,500,000) ÷ 1,000,000). It means that this company has generated the
output less than it should have generated by $1,500,000.This represents
the opportunity loss of $1,500,000.
Typically, the information on the opportunity gain/loss is not made
available. However, this information is very useful because it provides a
futurewarning sign to an organization. Given the integration of the op-
portunity concept ( for forward-looking information) and the two pro-
ductivity viewpoints, the mfpmm is shown in Table 4.1.
MFPMM Formulations and Case Study
This section demonstrates the case application of the mfpmm at the
gpo (Phusavat and Photaranon, 2006). The critical problem at the

102 Chapter Four
table 4.1 Demonstration of Key Features in the mfpmm
Category 2011 2012 Note
Output Value ($) 5,000,000 6,000,000
Input Value ($) 1,000,000 1,500,000
Surplus 4,000,000 4,500,000
Productivity in a static format 5.0 4.0
Productivity in a dy-
namic format
(6,000,000÷5,000,000)
÷ (1,500,000÷ 1,000,000)
= 1.2÷ 1.5= 0.80
Rate of change in output value
vs. rate of change in input value
Opportunity Loss
in $ ( from a profit-
center point of view)—
typically opportunity
gain/loss not included
in the performance or
accounting report
–1,500,000 If maintaining the ratio 5.0
from year 2011, the system
should have generated the
output value of $7,500,000 in
2012. Therefore, the system
has earned less than it should
have by $1,500,000 (based on
7,500,000 – 6,000,000). How-
ever, this number does not rep-
resent a financial loss as shown
by the accounting system.
Opportunity Loss in $
( from a cost-center
point of view)—to be
used in this project
computation
–300,000 If maintaining the ratio
5.0 from year 2011, the sys-
tem should have consumed
$1,200,000 in 2012. There-
fore, the system consumed
more than it should have by
$300,000 (based on 1,500,000 –
1,200,000).
gpo’s production department was a lack of a comprehensive produc-
tivity and performance measurement at the production level. Perfor-
mance information is primarily at an organizational level. During the
time of the study, the accounting department had beenmostly respon-
sible for collecting production-related data, and for reporting perfor-
mance information. The production department had merely been in-
formed of its performancewhile the staffs from the accounting depart-
ment routinely conducted performance analysis and recommended
possible improvement actions.
Before deploying the mfpmm, a discussion session was held with
the production department’s management team.This session focused
on a selection of a suitablemeasurement technique Such as roa. Even,
the termEconomic Value-Added (eva)was brought up. Eventually, the

Multi-Factor Productivity Measurement Model 103
mfpmm was selected due to the need to capture an overall produc-
tivity level as well as to relate this information with financial implica-
tions. Further, the information on opportunity gain/loss attracted a lot
of attention. Since it would be unwise to launch the mfpmm through-
out the production department, one production unit was selected and
tested—the tablet-productionunit (the third section)was chosen. Sim-
ply, the objectives of this project were to test whether the mfpmm was
a suitable tool to help initiate productivity/performancemeasurement
for the gpo’s production department, and to assess and evaluate its
performance-analysis capability.
It is important to note that the third section unit did not experience
lowperformance levels. It was selected because it represented a typical
production unit. Further, the gpo was not in any immediate business
danger. It is a state enterprise under the Ministry of Public Health.The
gpo has produced over 200 basic drugs in a complete range of dosage
forms (tablets, capsules, creams, ointments, liquids, syrups, dry syrups,
powders, and injections) for household consumption. Its overall goal
has always been to produce pharmaceutical products that support the
public-health policy on the availability (implying large volumes) and
the accessibility (implying low prices) of basic medicines for the poor
and the general public.
There were several steps that had been taken for project completion.
Some of the key tasks included the determination of the periods to be
tested, the unit dimensions of the required data, and the actual compu-
tation.Thedata of each period, for the third section,was separated into
two major groups, namely outputs and inputs. It should be noted that
not all input factors could be captured or included in the mfpmm. Top
production administrators were explained that the focus needed to be
on the input factors that directly resulted in the outputs under study.
The outputs to be examined were 3 package sizes of Paracetamol or
“Para” tablet (10’s, 100’s and 1000’s). The listed price (not considering
retailers’ discounts) represented the unit price to be charged. For the
input side, the unit cost, based on the purchasing contracts, was used.
For its quantity, the inputs were divided into 5 categories as follows.
• Labor was divided into 4 groups; i.e., manager, pharmacist, of-
ficers, and casual workers. Each group was broken down into
regular- and over-time.
• Materials included rawmaterials and packing materials.

104 Chapter Four
table 4.2 Base and Current Periods for the mfpmm Implementation
(1) (2) (1) (2)
July 2002 August 2002 October 2003 November 2003
August 2002 September 2002 November 2003 December 2003
September 2002 October 2002 December 2003 January 2004
October 2002 November 2002 January 2004 February 2004
November 2002 December 2002 February 2004 March 2004
December 2002 January 2003 March 2004 April 2004
January 2003 February 2003 April 2004 May 2004
February 2003 March 2003 May 2004 June 2004
March 2003 April 2003 June 2004 July 2004
April 2003 May 2003 July 2004 August 2004
May 2003 June 2003 August 2004 September 2004
June 2003 July 2003 September 2004 October 2004
July 2003 August 2003 October 2004 November 2004
August 2003 September 2003 November 2004 December 2004
September 2003 October 2003
notes Columnheadings are as follows: (1) base period (period 1), (2) current or com-
paring period (period 2).
• Energy was represented by water and electricity.
• Serviceswere represented by the cost ofmaintenance and spare
parts.
• Miscellaneous category includedother costs suchaswelfare, of-
fice materials, etc.
The collected data, organized together with the gpo’s production
administrators is presented in Table 4.3.
There are a total of 19 columns within the mfpmm when simultane-
ously measuring productivity, price-recovery, and profitability which
blend both the opportunity concept, and the static/dynamic view-
points (Table 4.6, see p. 114). In addition, the mfpmm resolves the
issues regarding to the unit dimensions and the weight problems in
the input and output sides. The formulations for each column can be
illustrated as follows. Based on Sink (1985), the formulas for the mf-
pmm can be shown as follows.
Column 1 Representing the quantities of outputs produced and/or
sold and the quantities of input consumed in order to produce those
outputs for period 1 (Qi1).The term “i” indicates the different categories
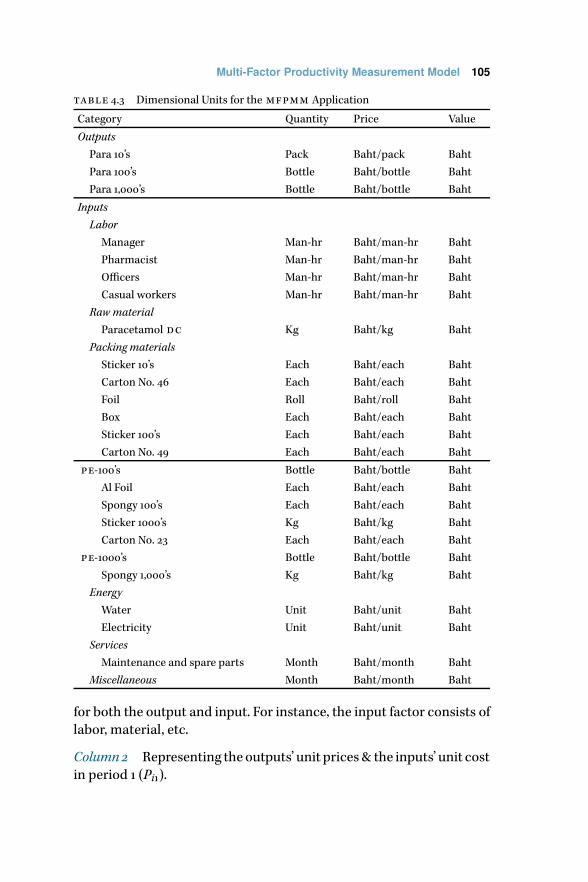
Multi-Factor Productivity Measurement Model 105
table 4.3 Dimensional Units for the mfpmm Application
Category Quantity Price Value
Outputs
Para 10’s Pack Baht/pack Baht
Para 100’s Bottle Baht/bottle Baht
Para 1,000’s Bottle Baht/bottle Baht
Inputs
Labor
Manager Man-hr Baht/man-hr Baht
Pharmacist Man-hr Baht/man-hr Baht
Officers Man-hr Baht/man-hr Baht
Casual workers Man-hr Baht/man-hr Baht
Raw material
Paracetamol dc Kg Baht/kg Baht
Packing materials
Sticker 10’s Each Baht/each Baht
Carton No. 46 Each Baht/each Baht
Foil Roll Baht/roll Baht
Box Each Baht/each Baht
Sticker 100’s Each Baht/each Baht
Carton No. 49 Each Baht/each Baht
pe-100’s Bottle Baht/bottle Baht
Al Foil Each Baht/each Baht
Spongy 100’s Each Baht/each Baht
Sticker 1000’s Kg Baht/kg Baht
Carton No. 23 Each Baht/each Baht
pe-1000’s Bottle Baht/bottle Baht
Spongy 1,000’s Kg Baht/kg Baht
Energy
Water Unit Baht/unit Baht
Electricity Unit Baht/unit Baht
Services
Maintenance and spare parts Month Baht/month Baht
Miscellaneous Month Baht/month Baht
for both the output and input. For instance, the input factor consists of
labor, material, etc.
Column2 Representing the outputs’ unit prices& the inputs’ unit cost
in period 1 (Pi1).

106 Chapter Four
Column 3 Reflecting the value (quantity unit price or unit cost) of pe-
riod 1.
Column 3 = Column 1 × Column 2
Column 4 Representing the quantities of outputs produced and/or
sold and the quantities of input consumed in order to produce those
outputs for period 2 (Qi2).
Column 5 Representing the outputs’ unit prices& the inputs’ unit cost
in period 1 (Pi2).
Column 6 Reflecting the value (quantity unit price or unit cost) of pe-
riod 2.
Column 6 = Column 4 × Column 5
Column 7 Price-weighted and base period price indexed changes—
quantities (both unit price and cost remained constant at period 1).∑ni=1Qi2Pi1∑ni=1Qi1Pi1
Column 8 Quantity-weighted & current period indexed changes—
unit prices and costs (both output and input quantities remained con-
stant at period 2)∑ni=1Qi2Pi2∑ni=1Qi2Pi1
Column 9 Examining the impact of changes in price and quantity
fromperiod 1 to2—quantity ( for outputs and inputs) andunit price/cost
not held constant.∑ni=1Qi2Pi2∑ni=1Qi1Pi1
Note that there is a need to separate the term “Qi” or quantity into
“Oi” reflecting specifically the outputs produced, and “Ii” represent-
ing only the inputs consumed. This is necessary since the computa-
tion for the remaining columns will focus on both the output and in-
put sides simultaneously. In addition, it is often that the input side
be further divided into different categories and sub-categories respec-
tively. On the contrary, for the output side, it seldom contains at the
sub-category level. For example, the labor input canhavemanagement,

Multi-Factor Productivity Measurement Model 107
supervisors, and operation categories. The operational-labor category
can be separated into assembly-line, warehouse, and quality inspec-
tion sub-categories. As a result, the term “Ii” is to be denoted as “Iij .” It
should be noted that it is possible that each output category can have
several corresponding sub-categories.However, the formulas, provided
by Sink (1985), don’t reflect this need for the output side.
Column 10 Examining the cost-to-revenue for period 1.
Iij1∑ni=1Oi1Pi1
Column 11 Examining the cost-to-revenue for period 2.
Iij2∑ni=1Oi2Pi2
Column 12 Examining the output-to-input ratios for period 1.∑ni=1Oi1Pi1
Iij1Pij1
Column 13 Examining the output-to-input ratios for period 2.∑ni=1Oi2Pi1
Iij2Pij1
Column 14 Reflecting price-weighted productivity indexes.∑ni=1Oi2Pi1∑ni=1Oi1Pi1
}Rate of Change on Output Quantity
Iij2Pi1Iij1Pi1
}Rate of Change on Input Quantity
Column 15 Representing quantity-weighted price recovery indexes.∑ni=1Oi2Pi2∑ni=1Oi2Pi1
}Rate of Change on Output’s Unit
Iij2Pi2Iij2Pi1
}Rate of Change on Input’s Unit Cost
Column 16 Depictingprofitability indexes, reflecting the ratesof chan-
ge on both the quantity produced/consumed and unit price/cost.∑ni=1Oi2Pi2∑ni=1Oi1Pi1
}Rate of Change on Output
Iij2Pi2Iij1Pi1
}Rate of Change on Input Value

108 Chapter Four
Column 17 Indicating the impacts (opportunity gain/loss) from a pro-
ductivity change.
Iij1Pi1
[∑ni=1Qi2Pi1∑Qi1Pi1
− Iij2Pi1
Iij1Pi1
]
Column 18 Indicating the impact from a price recovery change.
Column 18 = Column 19 − Column 17
Column 19 Indicating the total impact on profits from productiv-
ity/price recovery.
Iij1Pi1
[∑ni=1Qi2Pi2∑Qi1Pi1
− Iij2Pi2
Iij1Pi1
]
The results from Columns 14 to 19 are illustrated in Table 4.4.
From the departmental management team’s perspective, it was im-
portant to understand the impacts from productivity and price-re-
covery on profitability. Essentially, the key concern was the required
magnitude on the overall productivity improvement that needed to be
achieved in order tomake up for or offset the gpo inability to increase
a unit price of its products. Given the use of Minitab, the regression
equation, based on the columns 14, 15, and 16—representing the overall
results on productivity, price-recovery, and profitability was computed
and can be demonstrated as follows. Also see the graphical illustration
(Figure 4.3 on page 110).
Profitability = –0.989 + 1.00 (Productivity) + 0.987 (Price Recovery)
The computation for the above equation is based on the following
statistical analysis.
Column 16 = –0.989 + 1.00 Column 14 + 0.987 Column 15 or
Profitability = –0.989 + 1.00 (Productivity) + 0.987 (Price Recovery)
Some of the key lessons that were taken from this study can be sum-
marized as follows. The first lesson stems from the results based on
the third section unit. If the unit plans tomaintain (not improving) the
profitability level of 1.0, both the overall values of productivity and price
recovery needed to be approximately 1.0. Given the circumstance fac-
ing the gpo, the overall value of productivity needed to continuously
achieve a level higher than 1.0 in order to compensate for the negative

Multi-Factor Productivity Measurement Model 109
table 4.4 Overall Results on Productivity, Price recovery, and Profitability
Period Productivity Price Recovery Profitability
Value Baht Value Baht Value Baht
07.02–08.02 0.9909 –7,6594.32 1.0020 16,414.37 0.9928 –60,179.95
08.02–09.02 1.0021 18,324.52 1.0100 83,422.66 1.0122 101,747.18
09.02–10.02 0.9689 –25,5510.91 1.0921 702,267.08 1.0581 446,756.17
10.02–11.02 1.0607 51,1374.19 1.0060 54,772.54 1.0671 566,146.72
11.02–12.02 0.9497 –317,140.50 0.9798 –125,113.13 0.9304 –442,253.62
12.02–01.03 1.0469 348,863.17 0.9891 –81,021.77 1.0354 267,841.40
01.03–02.03 1.0233 141,569.29 1.0094 56,527.99 1.0329 198,097.27
02.03–03.03 1.0072 42,550.77 0.9468 –323,855.84 0.9537 –281,305.07
03.03–04.03 1.0335 157,424.74 1.0082 39,057.81 1.0420 196,482.56
04.03–05.03 0.9475 –310,361.91 1.0234 133,882.42 0.9697 –176,479.48
05.03–06.03 0.9722 –200,184.11 1.0312 217,649.26 1.0025 17,465.15
06.03–07.03 1.0020 13,459.08 0.9530 –341,545.79 0.9548 –328,086.71
07.03–08.03 1.0548 377,551.22 1.0549 351,886.65 1.1127 729,437.87
08.03–09.03 0.9624 –187,776.53 0.9605 –199,998.34 0.9244 –387,774.87
09.03–10.03 0.9071 –374,743.29 1.0468 177,168.32 0.9496 –197,574.97
10.03–11.03 1.1634 1,040,355.42 0.9539 –321,070.29 1.1098 719,285.13
11.03–12.03 0.9052 –406,850.94 1.0856 337,892.78 0.9827 –68,958.15
12.03–01.04 1.0625 285,255.42 1.0185 76,974.67 1.0821 362,230.10
01.04–02.04 0.9519 –255,173.00 0.9785 –119,195.30 0.9315 –374,368.30
02.04–03.04 0.9842 –85,540.81 1.0021 10,703.79 0.9863 –74,837.01
03.04–04.04 1.0290 167,544.27 0.9962 –23,367.83 1.0251 144,176.44
04.04–05.04 1.0106 73,638.74 0.9528 –345,968.01 0.9630 –272,329.27
05.04–06.04 0.9893 –87,047.65 0.9918 –65,856.62 0.9813 –152,904.27
06.04–07.04 1.0136 105,254.80 1.0152 118,323.54 1.0290 223,578.33
07.04–08.04 0.9636 –201,995.54 0.9304 –414,418.58 0.8965 –616,414.12
08.04–09.04 0.9410 –297,669.54 1.0984 451,439.08 1.0336 153,769.54
09.04–10.04 1.0035 19,818.15 1.0110 62,454.46 1.0145 82,272.61
10.04–11.04 1.0235 107,189.68 1.0349 156,166.46 1.0592 263,356.14
11.04–12.04 1.0082 26,826.10 0.8173 –718,744.06 0.8240 –691,917.96
constant value of 0.989. This was again due to the gpo’s inflexibility
and restriction on price-recovery.
The second issue is the consideration into the impacts from the re-
cent governmental policy for universal-health coverage. This policy
placed the primary responsibility of producing affordable and basic
medicines under the gpo.Therefore, productivity improvement prob-
ably would represent the only viable alternative to achieve a profitable
status. It should be noted that a profitable operation for a state enter-
prise’s perspective does not represent the for-profit goal but reflects
the ability to rely on oneself without financial assistance from the cen-

110 Chapter Four
table 4.5 Demonstration of Statistical Analysis
Predictor Coefficient se Coefficient t p
Constant –0.98946 0.01520 –65.08 0.000
Column 14 1.00203 0.00978 102.45 0.000
Column 15 0.986690 0.00930 106.07 0.000
notes s = 0.002607, R2 = 99.8%, R2 (adjusted) = 99.8%.
Analysis of Variance
Source df ss ms f p
Regression 2 0.116547 0.058273 8572.15 0.000
Residual Error 26 0.000177 0.000007
Total 28 0.116724
Column 14 1 0.040064
Column 15 1 0.076483
Unusual Observations
Obs. Col. 14 Col. 16 Fit se Fit Residual St. Res.
16 1.16 1.1098 1.11750 0.00162 –0.00770 –3.77rx
17 0.91 0.9827 0.98873 0.00115 –0.00603 –2.57r
29 1.01 0.8240 0.82720 0.00175 –0.00320 –1.66x
notes rAn observation with a large standardized residual. xAn observation whose
x value gives it large influence.
0.80
0.85
0.90
0.95
1.00
1.05
1.10
1.15
1.20
1.25
1.30
Price RecoveryProfitability
Productivity
1 2 3 4 5 6 7 8 9 10 11 12 13 14 15 16 17 18 19 20 21 22 23 24 25 26 27 28 29
Wei
ghte
dPe
rform
ance
Period, from July 2002–August 2002 to November 2004–December 2004
figure 4.3 Graphical Presentation on Productivity, Price-Recovery and
Profitability (adapted from Phusavat & Photaranon, 2006)
tral government (while fulfilling itsmissions and goals).The third issue
deals with the opportunity loss. This information created a lot of con-
cern. The opportunity losses (not necessary implying actual financial

Multi-Factor Productivity Measurement Model 111
losses) surprisedmost seniormanagers at the production department,
especially from the productivity side (where most of improvement in-
terventions from the organization were intended to focus). The gpo
had earlier attempted to improve its operations through inventory, de-
livery, and maintenance.
The fourth issue relates to the material inputs. The materials rep-
resented the most important input component. Therefore, the tasks
relating to price forecasting, contracting, production planning, inven-
tory control, and exchange rate estimation would have to be exam-
ined more carefully. A plan was also being considered on experiment-
ingwith an e-procurement system.This could possibly result in a lower
purchasing cost. Further, a task for seasonal demandand its impacts on
material management and production was discussed.
The follow-up review sessions took place after the review of the mf-
pmm information. Generally, the use of mfpmm was perceived to
be useful and provided helpful information for policy- and decision-
making. It helped stimulate the discussion on potential improvement
interventions andprocess improvement (as previously described in the
third and fourth implications respectively). Simply put, the mfpmm by
and large fulfilled the requirement set forth by the gpo andproduction
department’s management on measuring productivity and financially
quantifying its impacts on the profit/loss.
Based on these review sessions with the management team and line
supervisors, the challenges that the gpo would need to overcome in
order to integrate the mfpmm can be summarized as follows.The mf-
pmm practicality was the central issue of the debate. It was agreed that
its sustainability and acceptance would depend on the ability of the
management team to analyze performance information. However, the
confidence on information interpretations, analysis skills, and knowl-
edge on analysis tools (e.g., use of the Pareto Diagram to help portray
the results from Columns 10 and 11, the regression analysis to show the
different interrelationships among productivity, price-recovery, and
profitability in terms of the time-lag effects, etc.) was not high, espe-
cially among line supervisors.
The next critical aspect was the database readiness for a future use
of the mfpmm or other productivity/performancemeasurement tech-
niques. Since the relevant data had been recorded and stored at two lo-
cations (i.e., the accounting and production departments), it was nec-
essary that a change would have to be made. It was important that the
112 Chapter Four
data needed to be standardized in terms of output and input classifi-
cations, and to be uniformlymaintained. Otherwise, themeasurement
effort would only represent merely a monitoring effort (or lagging ef-
fort) without much usefulness for analysis and improvement (imply-
ing forward-looking or leading effort). It should be noted that, for this
experiment, a special effort had to be made in order to obtain neces-
sary data for the mfpmm. The reason was that there was a time over-
lap between the two departments’ data collection frequencies. Some
data was collected on the daily basis while others were recorded on
the weekly, monthly, and quarterly basis.
For the possibility of a departmental or organizational-wide imple-
menting the mfpmm, it would require additional preparations from
the gpo. Based on the lessons learned and the limitations from this
experiment, the future preparations need to be made in two aspects.
The first one is on technical preparations. Some of the key considera-
tion factors for the mfpmm implementation are as follows.
1. Clarity on inputs to be captured
2. Standardization of data to be collected—outputs and inputs
3. Verification of data accuracy
4. Assignment of a responsible team for these collection and veri-
fication tasks,
5. Identification of information-review frequency
6. Developingamanagement report for analysis anddecisions/ac-
tions,
7. Recording such decisions for further follow-ups.
8. Readiness assessment of the staffs to be assigned a task of con-
ducting performance analysis such as knowledge and experi-
ence on quality tools (e.g., Pareto and Cause-and-Effect Dia-
grams)
Assurance on skills and expertise of a management team on select-
ing appropriate productivity/ performance improvement techniques.
In addition, a clearer policy is likely needed on a lag-time effect from
improvement interventions. Unrealistic expectation of immediate im-
provement may discourage the continuous use of the mfpmm and
other possible future performance measurement techniques.
Finally, these difficulties confronting an effort on performancemea-
surement at the gpo’s production department are typical andusual for

Multi-Factor Productivity Measurement Model 113
any organization—not a discouraging sign for the participating man-
agement team. Furthermore, the ability to continuously manage the
performance,with the focuson linkingwith analysis and improvement,
is essential for sustaining and ensuring the success of performance
measurement. Otherwise, it is possible that performance measure-
ment subsequently becomes another stand-alone management tool.
As a result, sustaining the use of performancemeasurement requires a
great deal of attention on both technical and managerial aspects.
MFPMM Illustration
For the mfpmm illustration, the following example is discussed in Sink
(1985). The purpose of this section is to show how each formula is ap-
plied.The interpretations are also provided. In other words, the details
on the formulas’ applications are described. There are three key issues
to be considered.
1. The mfpmm focuses on primary inputs (but not all).That’s the
reason why it is called multi and not total factors.
2. There are the different unit dimensions when considering mul-
tiple inputs and outputs. For instance, the labor input can be
measured in persons while the material input can be assessed
in pieces. Note that the two inputs can be combined when col-
lecting the data in different unit dimensions.
3. Despite sharing the same unit dimension, the weight differ-
ence still imposes a great deal of the difficult for multi factor
measurement. For instance, when a manufacturer produces a
truck, a container, a car, and amotorcycle, theweight difference
should be recognized as a selling price is not the same.
The mfpmm applies the unit cost (when using the inputs for out-
put generation and the unit price (when selling a product) as a key
mechanism in adjusting the weight and unit dimension differences. It
is important to note that dealing with productivity only focuses on the
changes in the quantity of both inputs and outputs. Dealing with price
recovery only looks at the unit cost and unit price. On the other hand,
for profitability, the formulation include the changes in the quantity (of
inputs and outputs), and the unit cost and unit price (of inputs and out-
puts respectively).
In general, the first step in using the mfpmm involves the identifi-
cation of the inputs and outputs of a system to be examined. It can be
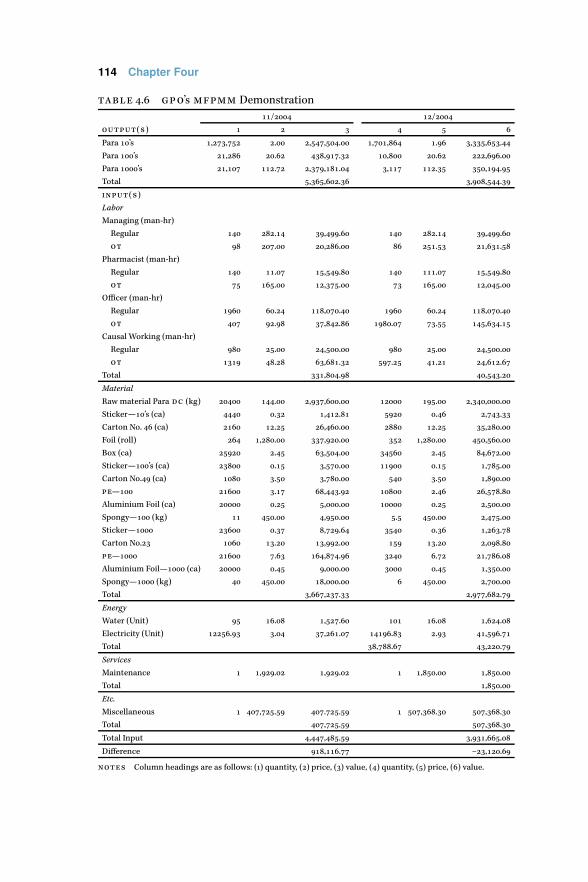
114 Chapter Four
table 4.6 gpo’s mfpmm Demonstration
11/2004 12/2004
output(s) 1 2 3 4 5 6
Para 10’s 1,273,752 2.00 2,547,504.00 1,701,864 1.96 3,335,653.44
Para 100’s 21,286 20.62 438,917.32 10,800 20.62 222,696.00
Para 1000’s 21,107 112.72 2,379,181.04 3,117 112.35 350,194.95
Total 5,365,602.36 3,908,544.39
input(s)
Labor
Managing (man-hr)
Regular 140 282.14 39,499.60 140 282.14 39,499.60
ot 98 207.00 20,286.00 86 251.53 21,631.58
Pharmacist (man-hr)
Regular 140 11.07 15,549.80 140 111.07 15,549.80
ot 75 165.00 12,375.00 73 165.00 12,045.00
Officer (man-hr)
Regular 1960 60.24 118,070.40 1960 60.24 118,070.40
ot 407 92.98 37,842.86 1980.07 73.55 145,634.15
Causal Working (man-hr)
Regular 980 25.00 24,500.00 980 25.00 24,500.00
ot 1319 48.28 63,681.32 597.25 41.21 24,612.67
Total 331,804.98 40,543.20
Material
Raw material Para dc (kg) 20400 144.00 2,937,600.00 12000 195.00 2,340,000.00
Sticker—10’s (ca) 4440 0.32 1,412.81 5920 0.46 2,743.33
Carton No. 46 (ca) 2160 12.25 26,460.00 2880 12.25 35,280.00
Foil (roll) 264 1,280.00 337,920.00 352 1,280.00 450,560.00
Box (ca) 25920 2.45 63,504.00 34560 2.45 84,672.00
Sticker—100’s (ca) 23800 0.15 3,570.00 11900 0.15 1,785.00
Carton No.49 (ca) 1080 3.50 3,780.00 540 3.50 1,890.00
pe—100 21600 3.17 68,443.92 10800 2.46 26,578.80
Aluminium Foil (ca) 20000 0.25 5,000.00 10000 0.25 2,500.00
Spongy—100 (kg) 11 450.00 4,950.00 5.5 450.00 2,475.00
Sticker—1000 23600 0.37 8,729.64 3540 0.36 1,263.78
Carton No.23 1060 13.20 13,992.00 159 13.20 2,098.80
pe—1000 21600 7.63 164,874.96 3240 6.72 21,786.08
Aluminium Foil—1000 (ca) 20000 0.45 9,000.00 3000 0.45 1,350.00
Spongy—1000 (kg) 40 450.00 18,000.00 6 450.00 2,700.00
Total 3,667,237.33 2,977,682.79
Energy
Water (Unit) 95 16.08 1,527.60 101 16.08 1,624.08
Electricity (Unit) 12256.93 3.04 37,261.07 14196.83 2.93 41,596.71
Total 38,788.67 43,220.79
Services
Maintenance 1 1,929.02 1,929.02 1 1,850.00 1,850.00
Total 1,850.00
Etc.
Miscellaneous 1 407,725.59 407.725.59 1 507,368.30 507,368.30
Total 407,725.59 507,368.30
Total Input 4,447,485.59 3,931,665.08
Difference 918,116.77 –23,120.69
notes Column headings are as follows: (1) quantity, (2) price, (3) value, (4) quantity, (5) price, (6) value.

Multi-Factor Productivity Measurement Model 115
table 4.6 Continued from the previous page
Weighted Change Ratios Cost/Revenue Ratio Productivity Ratios
output(s) 7 8 9 10 11 12 13
Para 10’s 1.3361 0.9800 1.3094
Para 100’s 0.5074 1.0000 0.5074
Para 1000’s 0.1477 0.9967 0.1472
Total 0.7413 0.9826 0.7284
input(s)
Labor
Managing (man-hr)
Regular 1.000 1.000 1.000 0.0074 0.0101 135.8394 100.7041
ot 0.8776 1.2151 1.0663 0.0038 0.0055 264.4978 223.4452
Pharmacist (man-hr)
Regular 1.0000 1.0000 1.0000 0.0029 0.0040 345.0593 255.8086
ot 0.9733 1.0000 0.9733 0.0023 0.0023 433.5840 330.2426
Officer (man-hr)
Regular 1.0000 1.0000 1.0000 0.0220 0.0302 45.4441 33.6898
ot 4.8650 0.7910 3.8484 0.0071 0.0373 141.7864 21.6058
Causal Working (man-hr)
Regular 1.0000 1.0000 1.0000 0.0046 0.0063 219.0042 162.3581
ot 0.4528 0.8536 0.3865 0.0119 0.0063 84.2571 137.9483
Total 1.3273 0.9118 1.2102 0.0618 0.1027 16.1710 9.0320
Material
Raw material Para dc (kg) 0.5882 1.3542 0.7966 0.5475 0.5987 1.8265 2.3020
Sticker—10’s (ca) 1.3333 1.4563 1.9418 0.0003 0.0007 3797.8284 2111.6310
Carton No. 46 (ca) 1.3333 1.0000 1.3333 0.0049 0.0090 202.7816
Foil (roll) 1.3333 1.0000 1.3333 0.0630 0.1153 15.8783 112.7486
Box (ca) 1.3333 1.0000 1.3333 0.0118 0.0217 84.4924 8.8285
Sticker—100’s (ca) 0.5000 1.0000 0.5000 0.0007 0.0005 1502.9698 46.9786
Carton No. 49 (ca) 0.5000 1.0000 0.5000 0.0007 0.0005 1419.4715 2228.4438
pe—100 0.5000 0.7767 0.3883 0.0128 0.0068 78.3941 2104.6414
Aluminium Foil (ca) 0.5000 1.0000 0.5000 0.0009 0.0006 1073.1205 116.2345
Spongy—100 (kg) 0.1500 1.0000 0.5000 0.0009 0.0006 1083.9601 1591.1089
Sticker—1000 0.1500 0.9651 0.1448 0.0016 0.0003 614.6419 1607.1807
Carton No. 23 0.1500 1.0000 0.1500 0.0026 0.0005 383.4764 3037.7520
pe—1000 0.1500 0.8809 0.1321 0.0307 0.0056 32.5435 1895.2603
Aluminium Foil—1000 (ca) 0.1500 1.0000 0.1500 0.0017 0.0003 596.1780 160.8400
Spongy—1000 (kg) 0.1500 1.0000 0.1500 0.0034 0.0007 298.0890 2946.4980
Total 0.6478 1.2535 0.8120 0.6835 0.7618 1.4631 1473.2490
Energy
Water (Unit) 1.0632 1.0000 1.0632 0.0003 0.0004 3512.4394 2449.2465
Electricity (Unit) 1.1583 0.9638 1.1164 0.0069 0.0106 144.0002 92.1669
Total 1.1545 0.9651 1.1143 0.0072 0.0111 138.3291 88.8244
Services
Maintenance 1.0000 0.9590 0.9590 0.0004 0.0005 2781.5172 2062.0689
Total 1.0000 0.9590 0.9590 0.0004 0.0005 2781.5172 2062.0689
Etc.
Miscellaneous 1.0000 1.2444 1.2444 0.0760 0.1298 13.1598 9.7560
Total 1.0000 1.2444 1.2444 0.0760 0.1298 13.1598 9.7560
Total Input 0.7353 1.2022 0.8840 0.8289 1.0059 1.2064 1.2163
Difference
notes Column headings are as follows: (12) period 1, (13) period 2. Continued on the next page

116 Chapter Four
table 4.6 Continued from the previous page
Weighted Performance Indexes Bath Effects On Profits
output(s) 14 15 16 17 18 19
Para 10’s
Para 100’s
Para 1000’s
Total
input(s)
Labor
Managing (man-hr)
Regular 0.7413 0.9826 0.7284 (10,216.70) (509.63) (10,726.33)
ot 0.8448 0.8086 0.6831 (2,763.04) (4,091.31) (6,854.35)
Pharmacist (man-hr)
Regular 0.7413 0.9826 0.7284 (4,022.01) (200.63) (4,222.63)
ot 0.7617 0.9826 0.7484 (2,870.83) (159.66) (3,030.50)
Officer (man-hr)
Regular 0.7413 0.9826 0.7284 (30,539.28) (1,523.36) (32,062.65)
ot 0.1524 1.2422 0.1893 (156,052.00) 37,984.51 (118,067.72)
Causal Working (man-hr)
Regular 0.7413 0.9826 0.7284 (6,337.00) (316.10) (6,653.11)
ot 1.6372 1.1512 1.8847 18,374.71 3,400.93 21,775.65
Total 0.5585 1.0777 0.6019 (194,426.37) 34,584.74 (159,841.63)
Material
Raw material Para dc (kg) 1.2603 0.7256 0.9145 449,780.41 (649,901.38) (200,120.97)
Sticker—10’s (ca) 0.5560 0.6747 0.3751 (877.81) (877.81) (1,714.18)
Carton No. 46 (ca) 0.5560 0.9826 0.5463 (341.39) (341.39) (16,005.35)
Foil (roll) 0.5560 0.9826 0.5463 (4,359.90) (4,359.90) (204,403.98)
Box (ca) 0.5560 0.9826 0.5463 (819.34) (819.34) (38,412.85)
Sticker—100’s (ca) 1.4827 0.9826 1.4569 (46.06) (46.06) 815.55
Carton No. 49 (ca) 1.4827 0.9826 1.4569 (48.77) (48.77) 863.52
pe—100 1.4827 1.2652 1.8758 6,760.09 6,760.09 23,278.81
Aluminium Foil (ca) 1.4827 0.9826 1.4569 (64.51) (64.51) 1,142.22
Spongy—100 (kg) 1.4827 0.9826 1.4569 (63.87) (63.87) 1,130.80
Sticker—1000 4.9423 1.0181 5.0318 (66.97) (66.97) 5,095.28
Carton No. 23 4.9423 0.9826 4.8563 (180.53) (180.53) 8,093.60
pe—1000 4.9423 1.1154 5.5128 817.92 817.92 98,316.20
Aluminium Foil—1000 (ca) 4.9423 0.9826 4.8563 (116.12) (116.12) 5,206.00
Spongy—1000 (kg) 4.9423 0.9826 4.8563 (232.24) (232.24) 10,412.00
Total 1.1445 0.7839 0.8971 (649,540.87) (649,540.87) (306,303.34)
Energy
Water (Unit) 0.6973 0.9826 0.6852 (491.60) (19.71) (511.31)
Electricity (Unit) 0.6400 1.0195 0.6525 (15,534.99) 1,080.90 (14,454.09)
Total 0.6421 1.0181 0.6537 (16,026.59) 1,061.19 (14,965.39)
Services
Maintenance 0.7413 1.0246 0.7596 (498.95) 54.13 (444.82)
Total 0.7413 1.0246 0.7596 (498.95) 54.13 (444.82)
Etc.
Miscellaneous 0.7413 0.7896 0.5854 (105,459.52) (140,903.25) (210,362.77)
Total 0.7413 0.7896 0.5854 (105,459.52) (140,903.25) (210,362.77)
Total Input 1.0082 0.8173 0.8240 26,826.10 (718,744.06) (691,917.96)
Difference
notes Column headings are as follows: (14) change in productivity, (15) change in price recovery, (16) change inprofitability, (17) change in productivity, (18) change in price recovery, (19) change in profitability.

Multi-Factor Productivity Measurement Model 117
Inputs
LabourMaterialsUtilities
Processes
PlanningManufacturingProcurement
Administration
Outputs
Boat ABoat B
figure 4.4 Identification of the Inputs and Outputs for Boat Production
shown as followed. The mfpmm focuses on the inputs that immedi-
ately result in the outputs.These inputs typically include labor, materi-
als, and utilities. For this illustration, there are two types of the plant’s
outputs.They areBoatsAandB.Theplant utilizes various inputswhich
contribute directly to the boat production. They include labor, materi-
als, and utilities. For labor, there are three groups; i.e., assembly, fiber-
glass, and plant management. For materials, there are two key cate-
gories; i.e., woods and fiberglass. Finally, for utilities, the usage focuses
on natural gas and electricity. Finally, when applying the mfpmm, the
computation and analysis need to at least cover two periods. The first
period can be considered as a base while the second period is a com-
parison (Figure 4.4).
Columns 1–6 For the case illustration, the first six columns represent
basic datawhich involves the quantity, the unit price and unit cost, and
the value (Table 4.7). The value (or the financial value), in $us, is com-
puted bymultiplying the quantity with the unit price (or the unit cost).
Column 7 The details for the Column 7 computations are as follows.
Notice that the unit price and cost remains constant at Period 1 since
the focus is on the quantity change. Also note that the weight adjust-
ment and unit dimension conversion are made.
Output quantities (Boats A and B): 27.27%more outputs from the pe-
riod 1 to 2 with the unit price/cost remains constant at period 1 to re-
flect the true changes in the quantity.
70×5,000+35× 10,000
50×5,000+30× 10,000= 1.2727
Input quantities: 5% less total labor consumed from the period 1 to 2
with the unit price/cost remains constant at period 1 to reflect the true
changes in the quantity:
304×20+760×8+ 1,064×6
320×20+800×8+ 1,120×6= 0.95

118 Chapter Four
table 4.7 Initial mfpmm with Quantity, Unit Price and Cost, and Financial Value
Category Period 1 Period 2
(1) (2) (3) (4) (5) (6)
Boat A 50 5,000 250,000 70 5,500 385,000
Boat B 30 10,000 300,000 35 12,000 420,000
Outputs 550,000 805,000
Mgt. 320 20 6,400 304 22 6,688
Glass 800 8 6,400 760 9 6,840
Assembly 1,120 6 6,720 1,064 7 7,448
Labor 19,520 20,976
Fiberglass 2,200 50 110,000 3,000 85 255,000
Wood 750 3 2,250 1,000 3 3,000
Materials 112,250 258,000
Electricity 8000 0.10 800 8,200 0.10 820
Natural gas 100 4 400 90 4 260
Energy 1,200 1,180
Inputs 132,970 280,156
notes Column headings are as follows: (1) quantity, (2) price/cost, (3) value, (4)
quantity (5) price/cost, (6) value.
Input quantities: 36.3%more total materials consumed from the pe-
riod 1 to 2 with the unit price/cost remains constant at period 1 to re-
flect the true changes in the quantity:
3,000×50+ 1,000×3
2,200×50+750×3= 1.363
Input quantities: 29.9% more total inputs consumed from the pe-
riod 1 to 2 with price/cost remains constant at period 1 to reflect true
changes in quantity:
304×20+760×8+ 1,064×6+3,000×50+ 1,000×3+8,200×0.1+90×4
320×20+800×8+ 1,120×6+2,200×50+750×3+8,000×0.1+ 100×4= 1.299
Column 8 The details for the Column 8 computations are as follows.
Notice that the quantity used or produced is held constant at Period 2
since the focus is on the change in the unit price and cost.
Alsonote that theweight adjustment andunit dimensionconversion
are made.
Output prices (Boats A and B): 15% higher price per unit of outputs
from the period 1 to 2 with the quantity remains constant at period 2 to
reflect the true changes in the unit price/cost:

Multi-Factor Productivity Measurement Model 119
table 4.8 mfpmm’s Applications—Weight Change and Cost-to-Revenue Ratios
Category Weighted Change Ratios Period 2
(7) (8) (9) (10) (11)
Boat A 1.4000 1.1000 1.540
Boat B 1.1667 1.2000 1.400
Outputs 1.2727 1.1500 1.464
Mgt. 0.9500 1.1000 1.045 0.0116 0.0083
Glass 0.9500 1.1225 1.069 0.0116 0.0085
Assembly 0.9500 1.1667 1.108 0.0122 0.0093
Labor 0.9500 1.3110 1.075 0.0355 0.0261
Fiberglass 1.3636 1.7000 2.318 0.2000 0.3168
Wood 1.3330 1.0000 1.330 0.0041 0.0037
Materials 1.3630 1.6863 2.298 0.2041 0.3205
Electricity 1.0250 1.0000 1.025 0.0015 0.0010
Natural gas 0.9000 1.0000 0.900 0.0007 0.0004
Energy 0.9833 1.0000 0.983 0.0022 0.0015
Inputs 1.2990 1.622 2.107 0.2418 0.3480
notes Column headings are as follows: (7) quantity, (8) price/cost, (9) value, (10)
period 1, (11) period 2.
70×5,500+35× 12,000
70×5,500+35× 10,000= 1.15
Input costs: 13.11% higher cost per unit of the overall labor from the
period 1 to 2 with quantity remains constant at period 2 to the reflect
the true changes in the unit price/cost:
304×22+760×9+ 1,064×7
304×20+760×8+ 1,064×6= 1.1311
Input costs: 68.63% higher cost per unit of the overall materials from
the period 1 to 2 with quantity remains constant at period 2 to reflect
the true changes in the unit price/cost:
3,000×85+ 1,000×3
3,000×50+ 1,000×3= 1.6863
Input costs: 62.20% higher cost per unit of the inputs from the pe-
riod 1 to 2 with quantity remains constant at period 2 to reflect the true
changes in the price/cost:
304×22+760×9+ 1,064×7+3,000×85+ 1,000×3+8,200×0.1+90×4
304×20+760×8+ 1,064×6+3,000×50+ 1,000×3+8,200×0.1+90×4= 1.622

120 Chapter Four
Column 9 The details for the Column 9 computations are as follows.
Notice that, since this column deals with the financial value, there is
no need to hold the quantity, and the unit cost and price constant. Also
note that the weight adjustment and unit dimension conversion are
made.
Output value or revenues (Boats A and B): 46.36% higher financial
value from Boats A and B from the period 1 to 2:
70×5,500+35× 12,000
50×5,000+30× 10,000= 1.4636
Input value or costs: 7.46% higher cost of the overall labor from the
period 1 to 2:
304×22+760×9+ 1,064×7
320×20+800×8+ 1,120×6= 1.0746
Input value or costs: 129.8% higher cost of the overall materials from
the period 1 to 2:
3,000×85+ 1,000×3
2,200×50+750×3= 2.298
Input value or costs: 110.7% higher cost of the inputs from the period
1 to 2:304×22+760×9+ 1,064×7+3,000×85+ 1,000×3+8,200×0.1+90×4
320×20+800×8+ 1,120×6+2,200×50+750×3+8,000×0.1+ 100×4= 2.107
For Columns 10 and 11, the details can be described as follows.
Column 10 The computation for Column 10 is simple as it uses the
data from the first period. Note that the ParetoDiagram should be used
to reflect the proportion of the inputs.
• Total labor cost represents 3.55%of the total output value ( from
19,520 ÷ 550,000).
• Total material cost represents 20.41% of the total output value
( from 112,250 ÷ 550,000).
• Total cost represents 24.18% of the total output value ( from,
132,970 ÷ 550,000).
Column 11 For Column 11, the computation is the same as of the 10th
column. This computation is based on the data from Column 6. Note
that the Pareto Diagram should again be used and analyzed in con-
junction with the results from the 10th column. Which cost factor(s)
consistently appear in the highest contributors’ group should receive
the attention from a plant or a company management.

Multi-Factor Productivity Measurement Model 121
table 4.9 mfpmm’s Applications—Productivity Change and Dynamic Ratios
Category Productivity Ratios Weighted Performance
(12) (13) (14) (15) (16)
Boat A
Boat B
Outputs
Mgt. 85.94 115.13 1.340 1.045 1.401
Glass 85.94 115.13 1.340 1.022 1.369
Assembly 81.85 109.65 1.340 0.986 1.321
Labor 28.18 37.75 1.340 1.017 1.362
Fiberglass 5.00 4.67 0.933 0.676 0.631
Wood 244.44 233.33 0.955 1.150 1.098
Materials 4.90 4.58 0.934 0.682 0.637
Electricity 687.50 835.66 1.242 1.150 1.428
Natural gas 1375.00 1944.44 1.414 1.150 1.626
Energy 458.33 593.22 1.294 1.150 1.488
Inputs 4.14 4.05 0.980 0.709 0.695
notes Column headings are as follows: (12) period 1, (13) period 2, (14) productivity,
(15) price-recovery, (16) profitability.
• Total labor cost represents 2.61% of the output value ( from
20,976 ÷ 805,000). When comparing with the 10th column, the
burden on the labor cost has come down.
• Total material cost represents 32.05% of the output value ( from
258,000÷ 805,000).When comparingwith the 10th column, the
burden on the material cost has gone down.
• Total cost represents 34.8% of the output value ( from 280,156 ÷805,000). When comparing with the 10th column, the burden
on the total cost has gone up.
For the next five columns, the computations will become more dif-
ficult as the mfpmm attempts to focus on the change in productivity
and to introduce the dynamic features into the ratios involving produc-
tivity, price recovery, and profitability.
Column 12 For Column 12, it is important to revisit the term produc-
tivity used in the mfpmm. Productivity deals with the change in quan-
tity of the outputs produced relatively to the change in the quantity of
the inputs consumed when producing the outputs. As a result, when
computing the productivity change, the practice on holding the unit

122 Chapter Four
price and cost constant is still applied. This computation is based on
the first period (or the base period).
For the total labor productivity, the result based on the data from the
third column is as follows.50×5,000+30× 10,000
320×20+800×8+ 1,120×6= 550,000
19,520= 28.18
For the total material productivity, the result based on the data from
the third column is as follows.50×5,000+30× 10,000
2,200×50+750×3= 550,000
112,250= 4.90
For the overall productivity in the first period, the result based on the
data from the third column as follows.50×5,000+30× 10,000
320×20+800×8+ 1,120×6+2,200×50+750×3+8,000×0.1+ 100×4= 4.14
Column 13 For Column 13, in order to reflect the true in productivity,
the unit price and cost needs to be held as a constant value at the first
period so that the focus on the quantity change can be made.
For the total labor productivity, the result is as follows.
70×5,000+35× 10,000
304×20+760×8+ 1,064×6= 700,000
189,544= 37.75
For the total material productivity, the result is as follows.
70×5,000+35× 10,000
3,000×50+ 1,000×3= 700,000
153,00= 4.58
For the overall productivity, the result is as follows.
70×5,000+35× 10,000
304×20+760×8+ 1,064×6+3,000×50+ 1,000×3+8,200×0.1+90×4= 4.05
The overall change shows a small decline in productivity. It indicates
that the use of the input quantity is more than an increase in the out-
puts generated.
For Columns 14–17, the computation becomes more complex as the
mfpmm introduces the dynamic ratios. In general, the dynamic ratio
represents the comparison of two ratios. In this case, the focus is on
comparing the ratios relating to the outputs with the input-related ra-
tios.
Column 14 Specifically for Column 14, the dynamic measures on pro-
ductivity imply the comparison between a rate of change in the output
quantity produced and a rate of change in the input quantity used.

Multi-Factor Productivity Measurement Model 123
Theoverall labor productivity level is computed as follows.When the
value is greater than 1.0, it implies that the rate of the output quantity
generated is faster than the rate of the input quantity consumed from
the first to second period.
70×5,000+35×10,00050×5,000+30×10,000
304×20+760×8+1,064×6320×20+800×8+1,120×6
= 1.2727
0.95= 1.34
The overallmaterial productivity level is computed as follows.When
the value is less than 1.0, it implies that the rate of the output quantity
generated is slower than the rate of the input quantity consumed from
the first to second period.
70×5,000+35×10,00050×5,000+30×10,0003,000×50+1,000×32,200×50+750×3
= 1.2727
1.363= 0.933
The overall productivity level is computed as follows.
70×5,000+35×10,00050×5,000+30×10,000
304×20+760×8+1,064×6+3,000×50+1,000×3+8,200×0.1+90×4320×20+800×8+1,120×6+2,200×50+750×3+8,000×0.1+100×4
= 1.2727
1.299= 0.98
Column 15 Specifically for Column 15, the dynamicmeasures on price
recovery imply the comparison between a rate of change in the unit
price and a rate of change in the unit cost. A firm is able recover well if
it can raise its unit price as fast as an increase in a unit cost.
The overall price recovery for the labor factor is as follows.When the
value is greater than 1.0, it implies that the rate of the unit price change
is higher than the change in the unit cost of the input factors.
70×5,500+35×12,00070×5,000+35×10,000
304×22+760×9+1,064×7304×20+760×8+1,064×6
= 1.15
1.10= 1.045
The overall price recovery for thematerial factor is as follows.When
the value is less than 1.0, it implies that the rate of the unit price change
is lower than the change in the unit cost of the input factors.
70×5,500+35×12,00070×5,000+35×10,0003,000×85+1,000×33,000×50+1,000×3
= 1.15
1.6863= 0.682
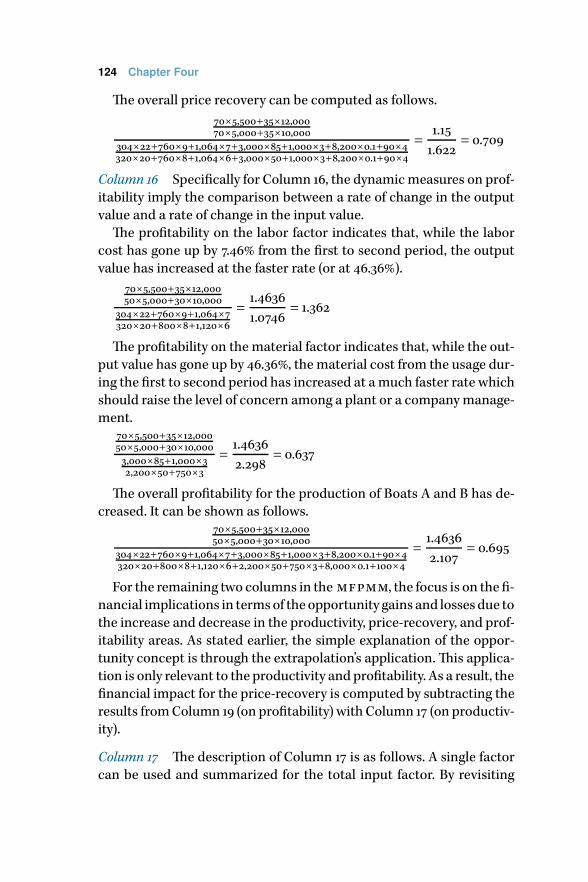
124 Chapter Four
The overall price recovery can be computed as follows.
70×5,500+35×12,00070×5,000+35×10,000
304×22+760×9+1,064×7+3,000×85+1,000×3+8,200×0.1+90×4320×20+760×8+1,064×6+3,000×50+1,000×3+8,200×0.1+90×4
= 1.15
1.622= 0.709
Column 16 Specifically for Column 16, the dynamicmeasures on prof-
itability imply the comparison between a rate of change in the output
value and a rate of change in the input value.
The profitability on the labor factor indicates that, while the labor
cost has gone up by 7.46% from the first to second period, the output
value has increased at the faster rate (or at 46.36%).
70×5,500+35×12,00050×5,000+30×10,000
304×22+760×9+1,064×7320×20+800×8+1,120×6
= 1.4636
1.0746= 1.362
The profitability on the material factor indicates that, while the out-
put value has gone up by 46.36%, the material cost from the usage dur-
ing the first to second period has increased at amuch faster rate which
should raise the level of concern among a plant or a companymanage-
ment.70×5,500+35×12,00050×5,000+30×10,0003,000×85+1,000×32,200×50+750×3
= 1.4636
2.298= 0.637
The overall profitability for the production of Boats A and B has de-
creased. It can be shown as follows.70×5,500+35×12,00050×5,000+30×10,000
304×22+760×9+1,064×7+3,000×85+1,000×3+8,200×0.1+90×4320×20+800×8+1,120×6+2,200×50+750×3+8,000×0.1+100×4
= 1.4636
2.107= 0.695
For the remaining two columns in the mfpmm, the focus is on the fi-
nancial implications in termsof theopportunity gains and losses due to
the increase and decrease in the productivity, price-recovery, and prof-
itability areas. As stated earlier, the simple explanation of the oppor-
tunity concept is through the extrapolation’s application.This applica-
tion is only relevant to the productivity and profitability. As a result, the
financial impact for the price-recovery is computed by subtracting the
results fromColumn 19 (on profitability) with Column 17 (on productiv-
ity).
Column 17 The description of Column 17 is as follows. A single factor
can be used and summarized for the total input factor. By revisiting
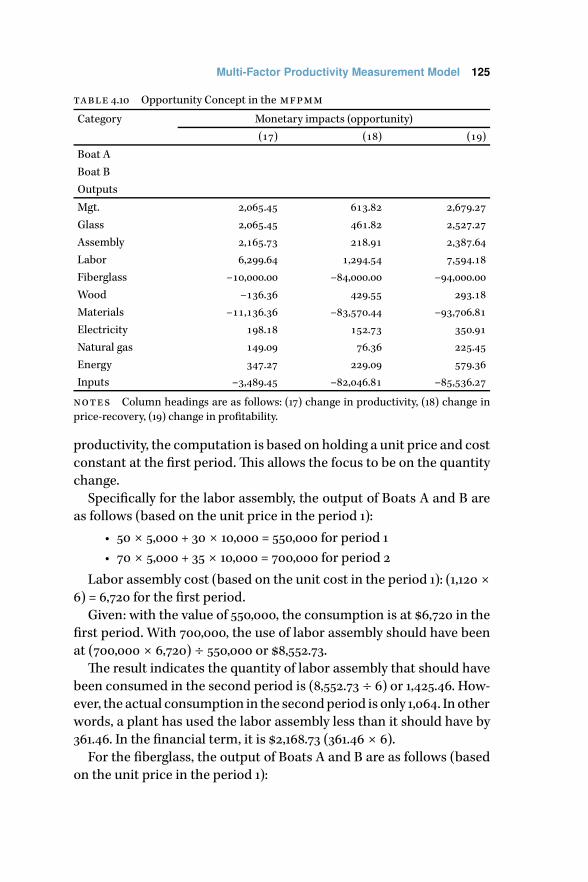
Multi-Factor Productivity Measurement Model 125
table 4.10 Opportunity Concept in the mfpmm
Category Monetary impacts (opportunity)
(17) (18) (19)
Boat A
Boat B
Outputs
Mgt. 2,065.45 613.82 2,679.27
Glass 2,065.45 461.82 2,527.27
Assembly 2,165.73 218.91 2,387.64
Labor 6,299.64 1,294.54 7,594.18
Fiberglass –10,000.00 –84,000.00 –94,000.00
Wood –136.36 429.55 293.18
Materials –11,136.36 –83,570.44 –93,706.81
Electricity 198.18 152.73 350.91
Natural gas 149.09 76.36 225.45
Energy 347.27 229.09 579.36
Inputs –3,489.45 –82,046.81 –85,536.27
notes Column headings are as follows: (17) change in productivity, (18) change in
price-recovery, (19) change in profitability.
productivity, the computation is based on holding a unit price and cost
constant at the first period.This allows the focus to be on the quantity
change.
Specifically for the labor assembly, the output of Boats A and B are
as follows (based on the unit price in the period 1):
• 50 × 5,000 + 30 × 10,000 = 550,000 for period 1
• 70 × 5,000 + 35 × 10,000 = 700,000 for period 2
Labor assembly cost (based on the unit cost in the period 1): (1,120 ×6) = 6,720 for the first period.
Given: with the value of 550,000, the consumption is at $6,720 in the
first period. With 700,000, the use of labor assembly should have been
at (700,000 × 6,720) ÷ 550,000 or $8,552.73.
The result indicates the quantity of labor assembly that should have
been consumed in the second period is (8,552.73 ÷ 6) or 1,425.46. How-
ever, the actual consumption in the secondperiod is only 1,064. In other
words, a plant has used the labor assembly less than it should have by
361.46. In the financial term, it is $2,168.73 (361.46 × 6).
For the fiberglass, the output of Boats A and B are as follows (based
on the unit price in the period 1):

126 Chapter Four
• 50 × 5,000 + 30 × 10,000 = 550,000 for period 1
• 70 × 5,000 + 35 × 10,000 = 700,000 for period 2
Fiberglass cost (based on the unit cost in the period 1): (2,200 × 50)
= 110,000 for the first period.
Given: with the value of 550,000, the consumption is at $110,000 in
the first period. With 700,000, the use of labor assembly should have
been at (700,000 × 110,000) ÷ 550,000 or $140,000.
The result indicates the quantity of fiberglass that should have been
consumed in the second period is (140,000÷ 50) or 2,800. However, the
actual consumption in the second period is 3,000. In other words, a
plant has used the fiberglass more than it should have by 200. In the
financial term, it is $10,000 (200 × 50).
Column 18 Thedata for Column 18 is derived from the subtraction be-
tween Columns 19 and 17.
Column 19 ForColumn 19, the computationon the labor assembly fac-
tor from the opportunity concept is as follows. Note that when dealing
with the term profitability, there is no need to hold either the quantity
or the unit price and cost constant.
The output value from the first period is 550,000with the use of labor
assembly of during the same period is 6,720.
Given the actual output from period 2 of 805,000, the financial value
of labor assembly input should have been during the second period at
9,835.64. This is derived from: 805,000 × 6,720 ÷ 550,000.
However, the actual consumption value is 7,448. As a result, a plant
has consumed $2,387.64 (i.e., 9,835.64 – 7,448) less the labor assembly
value than it should have.
Specifically for the fiberglass, the output value from the first period
is 550,000with the consumption value of fiberglass of 110,000.Given the
actual output from the second period of 805,000, the value of fiberglass
input that should have been consumed is 161,000.This is derived from:
805,000 × 110,000 ÷ 550,000 = 161,000.
However, the actual consumption value is 255,000.As a result, a plant
has used $94,000 (i.e., 255,000 – 161,000) more fiberglass value than it
should have.
Finally, for the total input, the output value from the first period
is 550,000 with the value consumption of the total inputs is 132,970.
Given the actual output from the second period of 805,000, the value
of total inputs should have been 194,619.7.This is derived from: 805,000

Multi-Factor Productivity Measurement Model 127
× 132,970 ÷ 550,000 = 194,619.7. Since the actual consumption value
is 280,156; a plant has consumed $85,536.3 (i.e., 280,156,000 – 194,619)
more the input value than it should have.
Exercises
4.1 From the mfpmm model, what are the roles of productivity in con-
tributing to profitability?
4.2 From the case application below, provide your own insights on per-
formance analysis and recommend the future improvement inter-
ventions of the company under study. Hint: You need to examine a
furniture-making firm.
Case Description: The mfpmm has been applied at one furniture-
making company, known as vch. The company is currently pro-
ducing wood-related products such as chairs, office furniture, office
floor, and so on.Theobservation and careful examinationweremade
in regard to the level of impacts fromproductivity andprice-recovery
on the termprofitability. Toaccomplish this task, themultiple regres-
sion method was employed. In this examination, the set of data for
the mfpmm was collected from the company’s accounting system
during 2004 to 2009. Specifically for this paper, the period 1 will be
designated as a base period while the period 2 will be referred to as
a current period as illustrated in Table 4.11.
For the vch, there are eight output categories. They are: (1) parquet
flooring, (2) mosaic flooring, (3) timber flooring, (4) wood skirt, (5)
lumber, (6) installation, (7) door, window, frame, and stair, and (8)
sandpaper, sawdust, glue, and other materials. On the other hand,
this study focuses on four types of input (based on data availability
and its weight on the total company’s cost). They are (1) labor, (2)
materials, (3) energy, and (4) miscellaneous.
The statistical technique to be used for finding the interrelationship
amongproductivity, price-recovery andprofitability is the regression
model. It should be noted that due to the fact that there are one de-
pendent variable and two independent variables, a multiple regres-
sion model is to be applied for this study. For this case study, only
three values in regard to productivity, price-recovery, and profitabil-
ity are utilized.The results from themultiple-linear regressionmodel
in which the impacts from productivity and price-recovery are inte-
grated into the profitability equation illustrated in Table 4.13.
By using themultiple-linear regressionmodel, the interrelationships
among profitability, productivity, and price-recovery can be demon-
strated as follows: Profitability = –0.97568 + 1.14011 (Productivity)
+ 0.83116 (Price-Recovery).

128 Chapter Four
table 4.11 Base Period and Current Period for the mfpmm
Base Period 2004 2005 2006 2007 2008
Current Period 2005 2006 2007 2008 2009
table 4.12 Units of Measurement for the mfpmm Application
Outputs/inputs Quantity Unit Price Value
Outputs
1. Parquet flooring Square Meter Baht/m2 Baht
2. Mosaic flooring Square Meter Baht/m2 Baht
3. Timber flooring Cubic Foot Baht/ft3 Baht
4. Skirt Meter Baht/m Baht
5. Lumber Cubic Foot Baht/ft3 Baht
6. Installation Square Meter Baht/m2 Baht
7. Door, window, frame, and stair Year Baht/year Baht
8. Sandpaper, sawdust, glue, etc. Year Baht/year Baht
Inputs
1. Labor Baht
1.1. Management Day Baht/day Baht
1.2. Controller Day Baht/day Baht
1.3. Workers Day Baht/day Baht
1.4. InstallationWorkers Square Meter Baht/m2 Baht
2. Materials Baht
2.1. Wood Year Baht/year Baht
2.2. Glue, Rope, Sandpaper, and Paint Year Baht/year Baht
3. Energy Baht
3.1. Electricity Year Baht/year Baht
3.2. Water Year Baht/year Baht
4. Miscellaneous Baht
4.1. Transportation Year Baht/year Baht
4.2. Gas Year Baht/year Baht
4.3. Maintenance/spares Year Baht/year Baht
4.4. Miscellaneous Year Baht/year Baht
References and Further Reading
Kaydos,W. (1991).Measuring, managing, andmaximizing performance.At-
lanta, ga: Productivity Press.
Neely, A. (1998).Measuring business performance. London, England: Econ-
omist Books.

Multi-Factor Productivity Measurement Model 129
table 4.13 Productivity, Price-Recovery and Profitability Values from 2004–2009
Period Productivity Price Recovery Profitability
2004–2005 0.6609 1.4163 0.9361
2005–2006 0.8798 1.1327 0.9965
2006–2007 0.7861 1.1426 1.3698
2007–2008 05639 1.2199 0.6880
2008–2009 0.9980 0.8737 0.8716
table 4.14 Summary of the Outputs in terms of anova Table
Regression Statistics anova Df ss ms f Sig. f
Multiple R 0.99712 Regression 2 0.24941 0.12470 173.06734 0.00574
R2 0.99426 Residual 2 0.00144 0.00072
Adj. R2 0.98851 Total 4 0.25085
Std. Error 0.02684
Observations 5
Coeff. Std. Err. t p Lower
95%
Upper
95%
Lower
90.0%
Upper
90.0%
(1) –0.97568 0.11025 –8.85007 0.01253 –1.45003 –0.50133 –1.29760 –0.65377
(2) 1.14011 0.08807 12.94557 0.00591 0.76118 1.51904 0.88295 1.39727
(3) 0.83116 0.04659 17.84163 0.00313 0.63072 1.03161 0.69514
notes Row headings are as follows: (1) intercept, (2) productivity, (3) price recovery.
Phusavat, K and Photaranon, W. (2006). Productivity/performance mea-
surement: Case application at the Government Pharmaceutical Or-
ganization. IndustrialManagement&Data Systems, 106(9), 1272–1287.
Phusavat, K., Jaiwong, P., Sujitwanit, S., & Kanchana, R. (2008). When to
measure productivity: Lessons from manufacturing and supplier-
selection strategies. Industrial Management & Data Systems, 109(3),
425–442.
Phusavat, K., Anussornnitisarn, P., Sujitwanit, S., & Kess, P. (2009). Profile-
based circumstances for productivitymeasurement. Industrial Man-
agement & Data Systems, 109(6), 825–839.
Phusavat, K. (2010, February). Improving a management process at Trane
Thailand. Paper presented at the International Conference on Busi-
ness and it: Contemporary Research andDevelopment, Ghaziabad,
India.
Rao, M., & Miller, D. (2004). Expert systems applications for productivity
analysis. Industrial Management & Data Systems, 104(9), 776–785.
Sink, D., Tuttle, T., & DeVries, S. (1984). Productivity measurement and

130 Chapter Four
evaluation: What is available? National Productivity Review, 3(3),
265–287.
Sink,D. (1985).Productivitymanagement: Planning,measurement and eval-
uation, control and improvement. New York, ny: Wiley.
Sink,D.,&Tuttle, T. (1989).Planningandmeasurement in your organization
of the future. Norcross, ga: ie Press.
Sumanth, D. (1998). Total productivity management. Delray Beach, fl: St
Lucie Press.

Chapter Five
Multi-Criteria PerformanceMeasurement/Analysis Technique
The Multi-Criteria Performance Measurement/Analysis Technique or
mcpmt represents an attempt to measure and analyze key perfor-
mance areas, especially productivity. The mcpmt helps link between
measurement and analysis (Sink & Tuttle, 1989). This technique can
assist during an attempt to identify the overall performance level (by
converting into a non-dimensional scale information). This technique
is based on the concept of the multi-attribute decisions (Phusavat &
Kingpadung, 2005).
Strengthening an organization’s management process has increas-
ingly become more important since it is part of continuous perfor-
mance improvement efforts (Anussornnitisarn, Phusavat, Jaiwong,
Pennanen, & Helo, 2009). Given constant changes and complexity of
business environments (due to globalization and information technol-
ogy’s applications in the workplace), the urgency to improve a man-
agement process is even more demanding. An improved management
process can result in better decisions’ quality and timeliness.This gives
a company’s management a more strategic focus by incorporating all
necessary information with respect to financial and non-financial in-
formation, competitor-centered and customer-focused.
A typicalmanagement process has five important activities: (1)mea-
surement, (2) evaluation and analysis, (3) improvement interventions,
(4) deployment and monitoring, and (5) sharing lessons, experiences,
and knowledge to ensure constant learning and development. In gen-
eral, without a strong management process, it would be difficult to
plan and deploy organizational policies and objectives, and tomonitor
and evaluate performance levels (Sink&Tuttle, 1989). Improvement in-
terventions stems from better information visibility, management by
facts, staffs’ acceptance of changes, shifts in organizational paradigm
or problem perception, and likelihood to achieve stable work and op-
eratonal processes.
It is important to note that performance measurement and analy-
sis are different. They require different skills for successful implemen-
131

132 Chapter Five
tation and applications (Sink, 1985). Performancemeasurement should
derive frombusiness needs and strategy, and provides critical informa-
tion on key processes, outputs, and results. On the other hand, perfor-
mance analysis focuses on extracting larger meaning from existing in-
formation to support evaluation and improvement.This analysis needs
to rely on using quantitative data in order to anticipate future trends
and to understand causes and effects that may not otherwise be evi-
dent.
Performance analysis deals with two issues simultaneously: (1) cur-
rent performance levels or “as is” fromperformancemeasurement, and
(2) expected performance levels and their interrelationships or “should
be.”The performance analysis should link the as-is and should-be com-
ponents.
In reference to the msm, amanaging director’s domain was an orga-
nizationwhile a plantmanager’s domainwould be a factory.The msm’s
flow revealedmany crucial behaviors which are important for effective
performance measurement and analysis. They were as follows.
• Decisions/actions from a management team needed to be pri-
marily based on amanagement report.These decisions/actions
needed to focus on current and/or potential problems facing
the domain of responsibility. Knowing an overall performance
level is critical. The mcpmt helps resolve this aspect.
• Therewas the need to have a specific set ofmeasures represent-
ing the feedback on decisions/actions. These measures needed
to consider a database capability such as data availability, accu-
racy, and timeliness (i.e., frequency of management review).
• The informationcontained ina reportneeded tobeuser-friendly.
Introduction and Illustration
The mcpmt has been widely adapted and used for performance mea-
surement at the functional and organizational levels. This technique
can assist during an attempt to identify the overall performance level
or the overall level of each of the seven performance criteria (given that
each criterion ismeasuredby several ratios).This technique is based on
the concept of the multi-attribute decisions. The primary mechanism
for this technique involves the use of the performance scale and the
preference curve. In other words, the mcpmt can be implemented in
the following sequence (Phusavat & Kingpadung, 2005).

Multi-Criteria Performance Measurement/Analysis Technique 133
table 5.1 Productivity Ratios for the mcpmt Applications
Output Value ÷ Indirect Labor (denoted as ilab) in Baht per Hour
Output Value ÷ Direct Labor (denoted as dlab) in Baht per Hour
Output Value ÷Material (denoted as mat) in Baht per Piece
Output Value ÷ Utility (denoted as uti) in Baht per Baht
1. Identification of performance measures, especially in a ratio
format
2. Collection of data
3. Selection of a performance scale to be used by all ratios, e.g., the
0–1.00, 0–10.00, or 0–100.00 scale
4. Analysis of data for better understanding on what represents
high and poor performance from each ratio
5. Development of a preference curve for each ratio—each ratio
can have a different preference curve
6. Collection of the latest data and integration it to individual ra-
tios’ preference curve
7. Retrieval of an actual performance level from the preference
curve
8. Assign the weights for each ratio
9. Identification of an overall performance level
A case demonstration is shown in Table 5.1. There are four produc-
tivity ratios. Note that, since the company under study has a quick
turnaround time for its products, it is acceptable to use the term rev-
enue for the output value. Then, the data for each productivity ratio
was collected over the period of 12 months.
For the applicationof the mcp/mt, theperformance scale of 0 to 100
is to be used for all productivity ratios.Thebest result over the one-year
duration from each ratio is to receive the score of 100 while the worst
number is to be assigned the score of 0.The score of 50 is for the average
value. Then, other results in each month can be assigned the numeri-
cal scores between the score 0 to 100 (since the three points, namely
the maximum, minimum, and average values, form the so-called pref-
erence curve) by the interpolation (Table 5.2).
The scores shown on Table 5.2 are derived from the interpolation
which isbasedon thepreferencecurves for theoutput value-to-indirect
labor ratio. When initially attempting to apply the mcpmt, at least
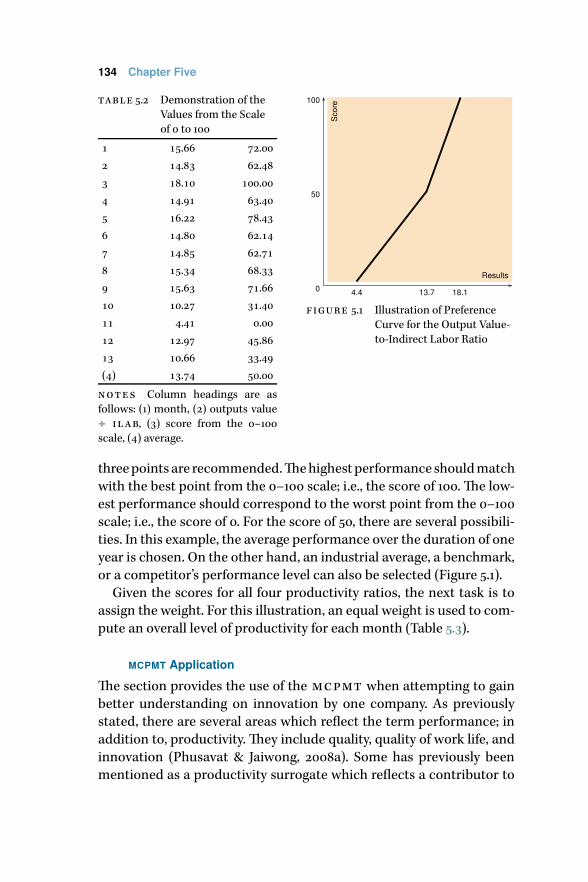
134 Chapter Five
table 5.2 Demonstration of the
Values from the Scale
of 0 to 100
1 15.66 72.00
2 14.83 62.48
3 18.10 100.00
4 14.91 63.40
5 16.22 78.43
6 14.80 62.14
7 14.85 62.71
8 15.34 68.33
9 15.63 71.66
10 10.27 31.40
11 4.41 0.00
12 12.97 45.86
13 10.66 33.49
(4) 13.74 50.00
notes Column headings are as
follows: (1) month, (2) outputs value
÷ ilab, (3) score from the 0–100
scale, (4) average.
0
50
100
4.4 13.7 18.1
Sco
re
Results
figure 5.1 Illustration of Preference
Curve for the Output Value-
to-Indirect Labor Ratio
threepoints are recommended.Thehighestperformance shouldmatch
with the best point from the 0–100 scale; i.e., the score of 100. The low-
est performance should correspond to the worst point from the 0–100
scale; i.e., the score of 0. For the score of 50, there are several possibili-
ties. In this example, the average performance over the duration of one
year is chosen. On the other hand, an industrial average, a benchmark,
or a competitor’s performance level can also be selected (Figure 5.1).
Given the scores for all four productivity ratios, the next task is to
assign the weight. For this illustration, an equal weight is used to com-
pute an overall level of productivity for each month (Table 5.3).
MCPMT Application
The section provides the use of the mcpmt when attempting to gain
better understanding on innovation by one company. As previously
stated, there are several areas which reflect the term performance; in
addition to, productivity. They include quality, quality of work life, and
innovation (Phusavat & Jaiwong, 2008a). Some has previously been
mentioned as a productivity surrogate which reflects a contributor to
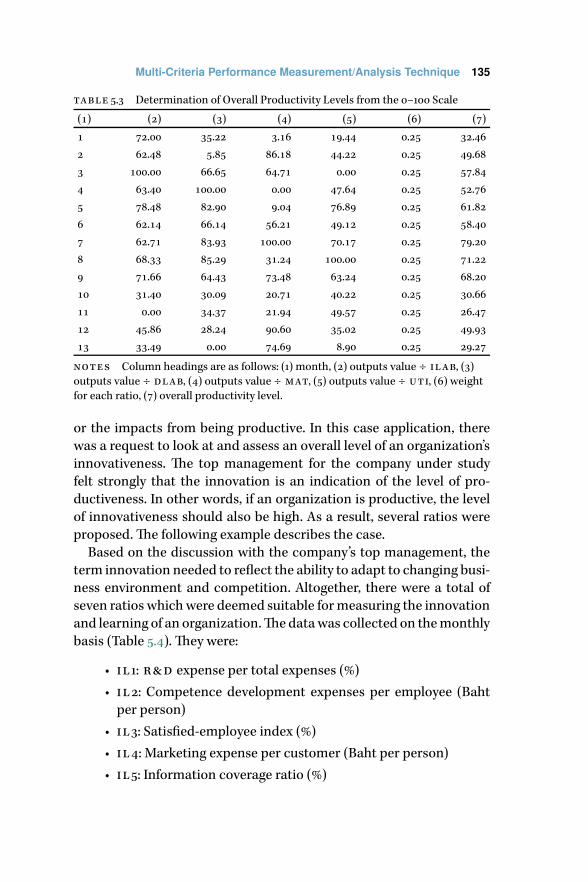
Multi-Criteria Performance Measurement/Analysis Technique 135
table 5.3 Determination of Overall Productivity Levels from the 0–100 Scale
(1) (2) (3) (4) (5) (6) (7)
1 72.00 35.22 3.16 19.44 0.25 32.46
2 62.48 5.85 86.18 44.22 0.25 49.68
3 100.00 66.65 64.71 0.00 0.25 57.84
4 63.40 100.00 0.00 47.64 0.25 52.76
5 78.48 82.90 9.04 76.89 0.25 61.82
6 62.14 66.14 56.21 49.12 0.25 58.40
7 62.71 83.93 100.00 70.17 0.25 79.20
8 68.33 85.29 31.24 100.00 0.25 71.22
9 71.66 64.43 73.48 63.24 0.25 68.20
10 31.40 30.09 20.71 40.22 0.25 30.66
11 0.00 34.37 21.94 49.57 0.25 26.47
12 45.86 28.24 90.60 35.02 0.25 49.93
13 33.49 0.00 74.69 8.90 0.25 29.27
notes Column headings are as follows: (1) month, (2) outputs value ÷ ilab, (3)
outputs value ÷ dlab, (4) outputs value ÷ mat, (5) outputs value ÷ uti, (6) weight
for each ratio, (7) overall productivity level.
or the impacts from being productive. In this case application, there
was a request to look at and assess an overall level of an organization’s
innovativeness. The top management for the company under study
felt strongly that the innovation is an indication of the level of pro-
ductiveness. In other words, if an organization is productive, the level
of innovativeness should also be high. As a result, several ratios were
proposed.The following example describes the case.
Based on the discussion with the company’s top management, the
term innovation needed to reflect the ability to adapt to changing busi-
ness environment and competition. Altogether, there were a total of
seven ratios whichwere deemed suitable formeasuring the innovation
and learning of an organization.Thedatawas collected on themonthly
basis (Table 5.4). They were:
• il1: r&d expense per total expenses (%)
• il2: Competence development expenses per employee (Baht
per person)
• il3: Satisfied-employee index (%)
• il4: Marketing expense per customer (Baht per person)
• il5: Information coverage ratio (%)

136 Chapter Five
table 5.4 Illustration of the Results from Individual Innovation Ratios
Period il1 il2 il3 il4 il5 il6 il7
1 2.11 45.28 79.00 566.04 80.00 71.43 0.00
2 4.29 43.17 79.00 539.57 80.00 71.43 0.95
3 4.93 42.11 79.00 526.32 80.00 71.43 0.48
4 4.47 40.68 82.00 593.22 80.00 68.81 0.00
5 2.00 39.34 82.00 573.77 80.00 68.81 0.46
6 1.97 38.09 82.00 555.57 80.00 114.68 0.00
7 1.92 38.71 82.00 580.66 87.00 114.68 0.00
8 3.80 36.92 82.00 1,461.59 87.00 114.68 0.00
9 1.95 36.47 82.00 547.11 87.00 109.65 0.00
10 2.00 35.82 85.00 537.31 87.00 65.79 0.00
11 1.92 35.82 85.00 1,432.84 87.00 65.79 0.00
12 2.17 35.82 85.00 1,492.54 87.00 65.79 0.00
13 1.92 45.46 85.00 576.37 90.00 90.91 0.87
14 3.79 45.46 85.00 1,424.51 90.00 90.91 0.00
15 1.95 45.46 85.00 418.99 90.00 75.76 0.00
16 2.01 45.46 90.00 417.83 90.00 75.76 0.00
17 1.92 45.46 90.00 831.02 90.00 75.76 0.00
18 2.17 45.46 90.00 1,388.89 90.00 75.76 0.00
• il6: Investment in new product support and training per total
employees (Baht per person)
• il7: Staff turnover (%)
The performance scale of 0 to 100 was selected for all ratios. Fur-
thermore, there were three points that would form a preference curve
like the previous example. For a ratio with a desirable increasing trend,
the highest result over the 18-period duration received the score of 100
while the lowest result was assigned the value of 0. On the other hand,
for a ratio with a desirable decreasing trend (such as rejection and re-
work rates), the highest result received the score of 0 while the lowest
result was assigned the value of 100.The score of 50 was for the average
result over the 18-period duration. Then, the next task was to convert
the results from each ratio into a common 0–100 scale. Afterward, the
following task was to derive an overall performance result on an or-
ganization’s innovation by assigning an equal weight to individual ra-
tios.This overall resultwould later be computedbymultiplying individ-
ual results from the interpolations of the 0–100 scale with the assigned
weight (Figure 5.2).

Multi-Criteria Performance Measurement/Analysis Technique 137
figure 5.2 Illustration of
Preference Curve
for il1 0
50
100
1.92 2.63 4.93
Sco
re
Results
table 5.5 Preference Curve Formulation
Period il1 il2 il3 il4 il5 il6 il7
1 2.11 45.28 79.00w 566.04 80.00w 71.43 0.00b
2 4.29 43.17 79.00 539.57 80.00 71.43 0.95w
3 4.93b 42.11 79.00 526.32 80.00 71.43 0.48
4 4.47 40.68 82.00 593.22 80.00 68.81 0.00
5 2.00 39.34 82.00 573.77 80.00 68.81 0.46
6 1.97 38.09 82.00 555.57 80.00 114.68b 0.00
7 1.92w 38.71 82.00 580.66 87.00 114.68 0.00
8 3.80 36.92 82.00 1,461.59 87.00 114.68 0.00
9 1.95 36.47 82.00 547.11 87.00 109.65 0.00
10 2.00 35.82w 85.00 537.31 87.00 65.79w 0.00
11 1.92 35.82 85.00 1,432.84 87.00 65.79 0.00
12 2.17 35.82 85.00 1,492.54w 87.00 65.79 0.00
13 1.92 45.46b 85.00 576.37 90.00b 90.91 0.87
14 3.79 45.46 85.00 1,424.51 90.00 90.91 0.00
15 1.95 45.46 85.00 418.99 90.00 75.76 0.00
16 2.01 45.46 90.00b 417.83b 90.00 75.76 0.00
17 1.92 45.46 90.00 831.02 90.00 75.76 0.00
18 2.17 45.46 90.00 1,388.89 90.00 75.76 0.00
Average 2.63 41.17 83.83 803.56 85.67 82.66 0.15
notes b Best performance level. wWorst level of performance.
Use of MCPMT to Interpret Productivity
Thesection illustratesonecase study that earlier employed the mcpmt.
This case is based on the attempt to gain better understanding on
cause-and-effect relationships between productivity and quality of

138 Chapter Five
table 5.6 Conversion to a Common Performance Scale of 0–100
Period il1 il2 il3 il4 il5 il6 il7
1 13.24 98.00 0.00 80.79 0.00 16.72 100.00
2 86.05 73.32 0.00 84.22 0.00 16.72 0.00
3 100.00 60.96 0.00 85.94 0.00 16.72 29.79
4 90.13 45.44 31.03 77.26 0.00 8.95 100.00
5 5.46 32.97 31.03 79.79 0.00 8.95 30.88
6 3.59 21.28 31.03 82.15 0.00 100.00 100.00
7 0.00 27.03 31.03 78.89 65.38 100.00 100.00
8 75.43 10.31 31.03 2.25 65.38 100.00 100.00
9 1.77 6.11 31.03 83.24 65.38 92.15 100.00
10 5.46 0.00 59.46 84.51 65.38 0.00 100.00
11 0.00 0.00 59.46 4.33 65.38 0.00 100.00
12 17.80 0.00 59.46 0.00 65.38 0.00 100.00
13 0.00 100.00 59.46 79.45 100.00 62.89 5.18
14 75.43 100.00 59.46 4.94 100.00 62.89 100.00
15 1.77 100.00 59.46 99.85 100.00 29.55 100.00
16 5.46 100.00 100.00 100.00 100.00 29.55 100.00
17 0.00 100.00 100.00 48.01 100.00 29.55 100.00
18 17.80 100.00 100.00 7.52 100.00 29.55 100.00
table 5.7 Overall Level of Innovation
(1) (2) (1) (2) (1) (2)
1 44.11 7 57.48 13 58.14
2 37.19 8 54.92 14 71.82
3 41.92 9 54.24 15 70.09
4 50.40 10 44.97 16 76.43
5 27.01 11 32.74 17 68.22
6 48.29 12 34.66 18 64.98
notes Column headings are as follows: (1) period, (2) overall score from the 0–100
scale.
work life. As previously mentioned on an emerging importance of the
intangible assets, the roles of human capital are expected to become
a factor for sustaining the high productivity level in an organization
(Phusavat & Jaiwong, 2008a). Investing in newmachinery and technol-
ogy alone is no longer sufficient. The study is derived from the inter-
relationships among seven performance criteria proposed by Sink and
Tuttle (1989).They even suggested that continuous improvement in the
productivity level depends on quality of work life or qwl. This term

Multi-Criteria Performance Measurement/Analysis Technique 139
Efficiency
Efficiency
Efficiency
QWL
Productivity
Innovation(Product/Processes)
Profitability
QWL Productivity+ (?)
figure 5.3 Scope of the Case on Productivity Analysis
represents general feeling and attitude towards a workplace by staffs
which may include working environment, safety, peer relationships,
career development, etc (Phusavat & Jaiwong, 2008b). The premise for
the study is that high level of qwl should contribute positively to pro-
ductivity. The mcpmt is employed for the analysis (Figure 5.3).
There were many ratios identified for both productivity and qwl.
Altogether, therewere seven ratios for productivity and four ratios used
for measuring qwl.
The data collection was made for the 12-month period. To apply the
mcpmt, the performance scale of 0 to 100 was to be used for all eleven
ratios. The maximum result over this duration from each ratio would
receive the score of 100while theminimumoutcomewouldbe assigned
the score of 0. The score of 50 was assigned for the average value. The
other results could be assigned the numerical scores (within the 0–100
scale) since the three points (the maximum, minimum, and average)
formed the so-called preference curve. Therefore, in this research, the
preference curves were in the linear shape (Tables 5.9 and 5.10 and Fig-
ure 5.4 on page 141).
Then, all ratios (i.e., seven ratios for an overall productivity level and
four ratios for anoverall qwl level)were assigned the scores.Theequal

140 Chapter Five
table 5.8 Productivity and qwl Ratios
Productivity qwl
1. Product ÷ Labor
(Kilograms per person in one month)
1. Training ÷ Labor
(Hours per person in one month)
2. Product ÷ Total labor cost
(Kilograms per Baht in one month)
2. Job turnover
(Person per person in one month)
3. Product ÷ Total production labor cost
(Kilograms per Baht in one month)
3. Compensation cost ÷ Labor
(Baht per person in one month)
4. Product ÷ Total cost for utility in production
(Kilograms per Baht in one month)
4. Total benefits for labor ÷ Labor
(Baht per person in one month)
5. Product ÷ Total utility cost
(Kilograms per Baht in one month)
6. Product ÷ Total material cost
(Kilograms per Baht in one month)
7. Product ÷ Total production cost
(Kilograms per Baht in one month)
table 5.9Partial Demonstration of
the Performance Scale and
the Value from the
Preference Curve for a
Productivity Ratio
notes Column
headings are as follows:
(1) month, (2) product
quantity (kilogram),
(3) production cost (Baht),
(4) result (kg/Baht),
(5) score from the scale of
0–100.
(1) (2) (3) (4) (5)
1 3,759,330 60,617,398 0.0620 53.57
2 4,789176 81,363690 0.0588 40.62
3 3,580,156 58,267,128 0.0614 50.01
4 2,960,450 45,050,045 0.0657 76.51
5 3,955,924 57,157,662 0.0692 98.21
6 3,463,664 56,128,735 0.0617 51.66
7 3,173,232 56,220,960 0.0564 31.84
8 4,096,096 58,987,297 0.0695 100.00
9 2,438,338 41,025,687 0.0594 42.71
10 2,999,212 47,471,134 0.0632 60.78
11 4,142,824 61,555,639 0.0673 86.37
12 3,554,552 63,186,932 0.0562 31.15
13 2,451,552 51,418,508 0.0477 0.00
Average 0.0614 50.00
weight was assigned for each ratio within productivity and qwl (Ta-
bles 5.11 and 5.12 on page 142).
After the statistical tests, the following findings were discovered.
Given the integration of the time factor into the examination, the in-
terrelationships becamemuchmore robust and explicit.Thesefindings
explained that gradually over time, the qwl would impact the level of
productivity. The higher level of qwl would result in the increasing
level of productivity. The opposite relationships could also be stated.

Multi-Criteria Performance Measurement/Analysis Technique 141
table 5.10Partial Demonstration of the
Performance Scale and the Value from
the Preference Curve for a qwl Ratio
notes Column headings are as
follows: (1) month, (2) employees who
resign from work, (3) current
employees, (4) results, (5) score from
the scale of 0–100.
(1) (2) (3) (4) (5)
1 44 482 0.091 26.87
2 48 520 0.092 26.12
3 60 470 0.128 0.00
4 26 462 0.056 55.19
5 14 446 0.031 90.06
6 12 494 0.024 100.00
7 18 492 0.037 82.78
8 18 518 0.035 85.35
9 32 518 0.062 48.68
10 34 536 0.063 47.45
11 20 550 0.036 83.09
12 40 526 0.076 38.13
13 26 546 0.048 67.32
0
50
100
0.048 0.061 0.069
Sco
re
Results
0
50
100
0.024 0.060 0.128
Sco
re
Results
figure 5.4 Preference for the Productivity and qwl Ratios
Further examinations also showed that if the level of qwl were to be
constant, the level of productivity would without doubt decline. This
was due to time-lag effects. The interrelationships from the statistical
analyses can be illustrated as follows. The interrelationships between
the overall levels of the two criteria (y = a+bx+ ct, where y and x are
the overall levels of productivity and qwl respectively, and the term t
represents the number of months to be incorporated.)
y = 0.945(x)−4.220(t)
The interrelationships are depicted in Figure 5.6 on page 143.
Finally, the key lessons learned from this study can be summarized

142 Chapter Five
table 5.11 Weighted Average Scores for Productivity (Scale 0–100)
(1) p1 p2 p3 p4 p5 p6 p7 (2) (3)
1 68.79 82.79 86.62 52.38 75.07 46.89 53.57 1/7 66.59
2 100.00 91.66 100.00 94.84 100.00 34.56 40.62 1/7 80.24
3 64.76 60.77 71.93 44.48 13.56 53.20 50.01 1/7 51.25
4 38.97 49.86 49.43 27.42 32.97 76.44 76.51 1/7 50.23
5 92.47 100.00 99.57 81.18 74.87 97.29 98.21 1/7 91.94
6 51.35 45.22 49.23 41.51 39.76 49.54 51.66 1/7 46.90
7 39.82 49.62 0.00 42.13 60.43 31.50 31.84 1/7 36.48
8 71.18 62.52 71.93 57.93 60.43 100.00 100.00 1/7 74.86
9 4.41 0.00 6.48 7.78 31.80 69.11 42.71 1/7 23.18
10 22.47 24.23 31.40 29.83 1.73 69.11 60.78 1/7 34.22
11 62.88 75.22 84.27 100.00 99.37 79.49 86.37 1/7 83.94
12 46.08 35.15 41.72 58.68 48.88 29.34 31.15 1/7 41.57
13 0.00 8.77 16.94 0.00 0.00 0.00 0.00 1/7 3.67
notes Column headings are as follows: (1) month, (2) weight, (3) weighted score.
table 5.12Weighted Average
Scores for qwl (Scale
0–100)
notes Column
headings are as follows:
(1) month, (2) weight, (3)
weighted score.
(1) qwl1 qwl2 qwl3 qwl4 (2) (3)
1 0.00 26.87 98.64 48.15 0.25 43.42
2 5.97 26.12 64.34 100.00 0.25 49.11
3 6.61 0.00 0.00 70.74 0.25 19.34
4 33.61 55.19 92.72 28.96 0.25 52.62
5 93.87 90.06 44.99 72.99 0.25 75.48
6 100.00 100.00 47.64 65.75 0.25 78.35
7 0.00 82.78 90.50 31.13 0.25 51.10
8 67.77 85.35 78.80 82.69 0.25 78.65
9 15.99 48.68 95.45 28.59 0.25 47.18
10 42.49 47.45 100.00 31.90 0.25 55.46
11 98.12 83.09 64.34 46.24 0.25 72.95
12 75.71 38.13 83.74 73.26 0.25 67.71
13 45.50 67.32 99.27 0.00 0.25 53.02
as follows. The development of the ratios should also be comprehen-
sive. Initially, there were some of the proposed ratios planned to be
utilized such as: (1) Lateral transfer rate, (2) Unplanned absent hours
working hours, (3) Work Stoppage hours due to injuries and occupa-
tional safety issues working hours, and (4) % of new recruits resigned
within 6-month period after admission due to work-related reasons.
Due to the lack of data, they were omitted which would affect the com-

Multi-Criteria Performance Measurement/Analysis Technique 143
00
10
10
20
20
30
30
40
40
50
50
60
60
70
70
80
80
90
90
100
100
�
�
� �
�
�
�
�
�
�
�
�
�
Ove
rall
Pro
duct
ivity
Leve
l
Overall QWL Level
figure 5.5 Scattering Plot for Productivity—qwl Relationships
QWL ProductivityDirectly Impacts on
Time Consideration
figure 5.6 Impacts from qwl on Productivity with the mcpmt Application
prehensiveness of qwl. Simply put, the data availability plays an im-
portant role in the mcpmt success.
Thedevelopment of a preference curve is also critical for the mcpmt
applications.Thepreferencecurvedevelopments arebasedonaclosed-
system approach in which the best and worst performance levels are
selected from the past data. The preference curve is unique from one
ratio to the next (unlike the performance scale). The values on this
curve should be controllable as well as challenging and measurable
(numerical figures). The weight assignment should also reflect an or-
ganization’s policies and objectives.
Exercises
5.1 Basedon the following case companywhichoperates as apartmaker
in an automotive industry, develop at least five ratios and apply the
mcpmt to provide an overall performance level. Hint: You may
adapt the ratio development from the network concept by Harper
(1984) earlier discussed. The company’s top management aims to
further reduce the subcontractor expenses as forecasting and pro-
duction planning should gradually be improved. All data is in Baht
(Thai currency; see Table 5.13).

144 Chapter Five
table 5.13 Data for Applying the mcpmt
(1) (2) (3) (4) (5) (6) (7)
January 78,762,000 24,547,000 7,963,000 98,000 1,583,000 874,000
February 60,134,000 23,334,000 6,227,000 112,000 2,127,000 912,000
March 82,277,000 23,870,000 6,455,000 85,000 1,855,000 989,000
April 47,556,000 10,619,000 4,852,000 78,000 846,000 652,000
May 31,467,000 12,055,000 4,047,000 51,000 997,000 545,000
June 20,425,000 11,457,000 3,398,000 54,000 785,000 516,000
July 28,064,000 12,141,000 3,352,000 65,000 1,005,000 576,000
August 24,974,000 12,379,000 3,751,000 45,000 998,000 544,000
September 33,449,000 14,327,000 4,274,000 49,000 776,000 512,000
October 51,325,000 18,177,000 4,912,000 56,000 1,056,000 743,000
notes Column headings are as follows: (1) month, (2) output value, (3) raw materi-
als, (4) direct labor, (5) injury/compensation, (6) subcontractors, (7) utility.
References and Further Reading
Anussornnitisarn, P., Phusavat, K., Jaiwong, P., Pennanen, M., & Helo, P.
(2009). Environmental consideration and small and medium enter-
prises’ competitiveness improvement. International Journal of Man-
agement and Enterprise Development, 6(1), 18–37.
Harper, J. (1984). Measuring business performance. Brookfield, England:
Gower.
Phusavat, K., & Kingpadung, K. (2005). Examination and development of
the interrelationships among quality of work life, productivity, and
profitability. Journal of Research and Development 16(4), 36–51.
Phusavat, K., & Jaiwong, P. (2008a). Formulating the strategy map: Case
studies on smes in Thailand. International Journal of Management
and Enterprise Development, 5(1), 1–17.
Phusavat, K., & Jaiwong, P. (2008b). Strategy map with an integration of
time-lag effects. International Journal of Management and Enterprise
Development, 5(3), 370–392.
Sink,D. (1985).Productivitymanagement: Planning,measurement and eval-
uation, control and improvement. New York, ny: Wiley.
Sink,D.,&Tuttle, T. (1989).Planningandmeasurement in your organization
of the future. Norcross, ga: ie Press.

Chapter Six
Ratio Development as ProductivitySurrogates
The ratio development is important when attempting to measure pro-
ductivity. The primary reason stems from the need to have the surro-
gates in order to gain better insights into the level of productivity.There
are several steps and key consideration factorswhen identifyingmean-
ingful ratios.The ability to come upwith new ratios and/or to revise an
existing set of the ratios is critical for sustaining the effectiveness of
productivity (as well as performance) measurement. This is because a
poorly designedmeasurement system likely will have several problems
during use. They are as follows.
1. Failure to use information from productivity measurement for
improvement interventions
2. Failure to obtain necessary data for the given ratios
3. Failure to continuously measure the productivity and other
productivity-related areas
4. Failure to revise, adjust, delete, or add the ratioswhennecessary
In general, during the attempt to derive the ratios as productivity
surrogates, the consideration be given the ability to collect, store, and
retrieve. Otherwise these ratios will have no value to decision-makers.
In other words, for productivity surrogates to be effective and utilized,
data consideration must be simultaneously included. The data avail-
ability includes whether data is generated at the frequency required. If
a productivity surrogates is to be used on the monthly basis, its corre-
sponding data must be generated every month.
The unit dimensions (e.g., hours, persons, m2, m3, $, and so on) must
be clarified during the design.This issue can be a challenge as a team in
charge of data collection has to be included with a management team
who determines the ratios and analyze this information. For example,
a facility space can be measured in s or m2. The unit dimensions for
delivery service can include distance (in kilometers), cost (in $), and
quantity (in tons).
145

146 Chapter Six
Clear description on what to be measured is also important. For ex-
ample, the term labor must be clarified whether it includes all classifi-
cations of theworkforce or one specific level such as direct and indirect
staffs.When focusing onmaintenance cost, a company needs to clarify
whether it focuses on only in-house maintenance or a combination of
in-house and contracted-outmaintenance services. Even the term rev-
enue when using it for the output value can be defined in many ways
within an organization. The term can indicate only a combination of
cash and account receivable, or this combination subtracted with re-
turns from customers.
The ratio development helps ensure the ability to gain better knowl-
edge and insights into the productivity (as well as performance) levels
within an organization. The ratio implies quantifiable measurement—
meaning that a ratio can be calculated and compared over time. The
ratio format is necessary for future benchmarking which is critical for
adapting external knowledge to help improve the productivity levels.
This is referred to as the need to normalize productivity information.
In addition, the use of a ratio which needs to use verified data can lead
to less confrontational and obstructive by staffs. In addition, when de-
veloping the ratios, there are many consideration factors which can be
described as follows (Muhos, Kess, Phusavat, & Sanpanich, 2010).
The data-processing capability also involves the issues in regard to
sorting, dissemination, and retrieval. This capability which reflects
the flexibility and robustness of the organization’s information sys-
tem must be considered. The term robustness addresses the speed in
which the conversion of the unit dimensions and of the report format
for the system’s user is made. The dimension of labor should be easily
adjusted from persons to person-hours or person-$. In addition, the
team, formed for the task on productivity measurement, should have
in-depth knowledge on the type and the level of accuracy of data, the
capability for dimension conversion, and the programming of the re-
port formats for the system’s user.
It is also important that a user be considered at the ratio identifica-
tion stage. The user of the system must be clearly identified. His/her
background with respect to cognitive style and preference on informa-
tion portrayal and perception must be determined. This also includes
past experience and educational background. In other words, the per-
sonal preference on the specific characteristic of information (e.g., tab-
ular, descriptive, and/or graphical format) must be known. Further-

Ratio Development as Productivity Surrogates 147
more, the need for training on interpreting the information from pro-
ductivity surrogates must be identified. Otherwise, the user may not
accept or use the system.
Theconsiderationmust also be given to the objectives andpolicies of
the organization. Without these two elements, an attempt to measure
productivity will become meaningless. The reason is that they cannot
provide feedback in regard to the accomplishment of organizational
objectives, or the determination of the area of weaknesses.The useabil-
ity consideration should also include those who could be impacted by
decisions/actions made after having implemented productivity mea-
surement. Involving them at the design stage is important. The sense
of ownership to the productivity measurement system should encom-
pass its users and people whommay be impacted by its presence.
It is important that the proposed productivity surrogates be tested
before their implementation (Phusavat, Nilmaneenava, Kanchana,
Wernz, &Helo, 2012). Testing can be arranged tomake it similar to past
situations and/or can be completed through simulated circumstances.
This testing is to ensure that the readiness of the information system.
Furthermore, the effort to design and develop productivity measure-
ment incurs cost. As a result, understanding of and knowledge with
respect to cost resulted from this effort is critical. Such cost categories
are, for example, data collection, documentation, reporting, and so
on. Although top managers tend to accept it as a necessary decision-
making tool, high cost for data collection and information reporting
cannot be overlooked.
Finally, the issues relating to how to revise or adjust the proposed
ratios when needed should be considered (Phusavat & Chansa-ngavej,
2007). The need to schedule a review on these ratios should be made.
In other words, the usermust review the suitability of the ratios as they
still reflect the productivity level. Furthermore, there are changes in
business strategies, technologies employed in the organization, an in-
centive system, the user must reviewwhether these surrogates are still
applicable or suitable.
Applications of Input/Output Analysis
TheInput/OutputAnalysis has beenwidely used to help identify the set
of ratios needed to reflect the productivity level, and to assess and in-
dicate the performance level of an organization. This analysis is based
on a systematic viewpoint. It stresses that an active system needs to

148 Chapter Six
Up-stream
Inputs (i.e.,resources
consumed byall operational
processes
Processes(or throughput)
Outputs (i.e.,products and/
or servicesgenerated
by a system)
Down-stream
Organizational System
figure 6.1 Extended Input/Output Analysis
generate outputs and to consume inputs or resources. Traditionally,
the inputs include labor, materials, capital, machinery, utility, facility
space, and information. It is important to recognize that one of the on-
going issues relating to the input side is how to incorporate outsourced
work (or the tasks that need to be contracted out to other firms) into
consideration. As a result, On the other hand, for the output side, it re-
flects all products and/or services generated by a system to serve cus-
tomers and users such as finished products. It is critical to note that
even undesirable outputs such as wastes, and rejects should be consid-
ered when measuring productivity (Phusavat, Anussornnitisarn, Ras-
sameethes, Helo, & Kess, 2009).
The contemporary perspective today highlights the need to extend
the input-process-output chain with upstream prior to the input and
with downstream after the output (Lee et al., 2011). The term upstream
deals with the providers of the inputswhich typically include suppliers,
contractors, and regulators. On the other hand, the term downstream
focuses on the impacts from the outputs inmany areas.They are: finan-
cial impacts such as profit from selling the product, customer impacts
suchas satisfactory level as a result of productusage, andother impacts
such as higher income for trainees who take part in in-house training
provided to surrounding communities (as part of a company’s corpo-
rate social responsibility policy). In addition toupstream, various terms
have also been referred to such as the outcomes, the impacts, etc.
Productivity Surrogates
Often, measuring productivity directly is not entirely possible. Past
research has advocated the use of surrogates which can be used to
substitute a key component in the term productivity and to reflect
the productivity level (Phusavat, Anussornnitisarn, Rassameethes, &
Kess, 2009). As previously mentioned, it is common to replace the out-
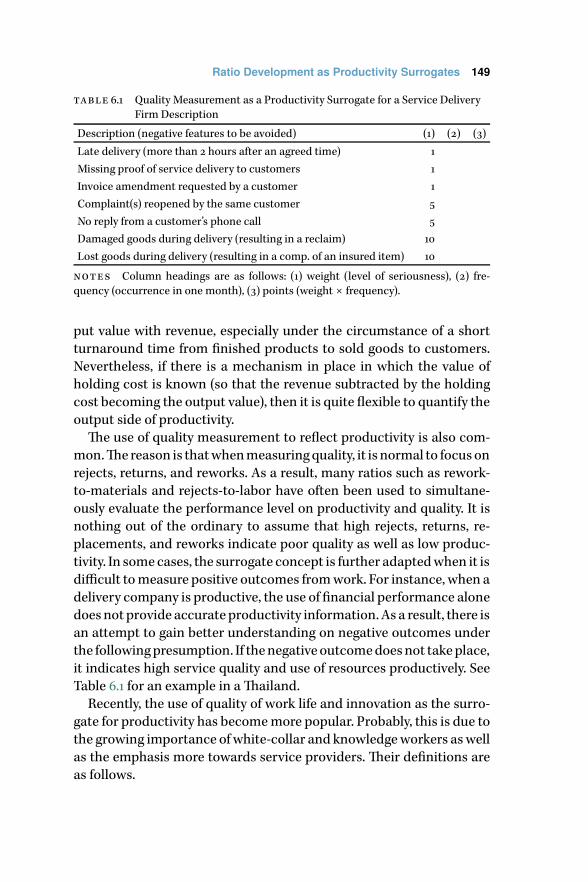
Ratio Development as Productivity Surrogates 149
table 6.1 Quality Measurement as a Productivity Surrogate for a Service Delivery
Firm Description
Description (negative features to be avoided) (1) (2) (3)
Late delivery (more than 2 hours after an agreed time) 1
Missing proof of service delivery to customers 1
Invoice amendment requested by a customer 1
Complaint(s) reopened by the same customer 5
No reply from a customer’s phone call 5
Damaged goods during delivery (resulting in a reclaim) 10
Lost goods during delivery (resulting in a comp. of an insured item) 10
notes Column headings are as follows: (1) weight (level of seriousness), (2) fre-
quency (occurrence in one month), (3) points (weight × frequency).
put value with revenue, especially under the circumstance of a short
turnaround time from finished products to sold goods to customers.
Nevertheless, if there is a mechanism in place in which the value of
holding cost is known (so that the revenue subtracted by the holding
cost becoming the output value), then it is quite flexible to quantify the
output side of productivity.
The use of quality measurement to reflect productivity is also com-
mon.Thereason is thatwhenmeasuringquality, it is normal to focuson
rejects, returns, and reworks. As a result, many ratios such as rework-
to-materials and rejects-to-labor have often been used to simultane-
ously evaluate the performance level on productivity and quality. It is
nothing out of the ordinary to assume that high rejects, returns, re-
placements, and reworks indicate poor quality as well as low produc-
tivity. In some cases, the surrogate concept is further adaptedwhen it is
difficult tomeasure positive outcomes fromwork. For instance, when a
delivery company is productive, the use of financial performance alone
doesnot provide accurate productivity information. As a result, there is
an attempt to gain better understanding on negative outcomes under
the followingpresumption. If thenegativeoutcomedoesnot takeplace,
it indicates high service quality and use of resources productively. See
Table 6.1 for an example in aThailand.
Recently, the use of quality of work life and innovation as the surro-
gate for productivity has becomemore popular. Probably, this is due to
the growing importance ofwhite-collar and knowledgeworkers aswell
as the emphasis more towards service providers. Their definitions are
as follows.

150 Chapter Six
Innovation Ability to change over time within processes or opera-
tions, and products/services offered in themarket.The term inno-
vation focuses on the ability to understand customers’ needs and
want by offering new products and services on the continuous ba-
sis. At the same time, when focusing on operational processes, the
innovativeness reflects how simple and how fast an improvement
(i.e., change and modification) can take place.
qwl Reflecting on how people feel toward their workplace. Feeling
in drivenby factors such as pay, compensation, recognition, safety,
culture, relationships with co-workers and supervisors, flexibility,
autonomy, etc. The negative feeling likely impacts on quality and
subsequently productivity. In addition, financial performance is
expected to suffer if poor qwl continues.
In general, measuring innovation incorporates new products and
services recently offering to the markets and how well they have been
received or greeted by customers. On the other hand, for process in-
novation, the focus has been the suggestions made by staffs and cus-
tomers, and whether these suggestions have been considered and de-
termined their suitability. It is based on the presumption that if a firm is
able to utilize available time from its staffs and resources productively,
then it should also be innovative.
For qwl, the feeling of a staff to a workplace is critical. Negative
feeling probably will result in poorer quality at the beginning. If this
negative feeling persists, work stoppage likely follows. In some cases,
this can lead to workplace thief and sabotage. As a result, the attention
on occupational safety and health is important, especially continuous
feedback from staffs and assessments on a workplace. Sink (1985) used
the cockpit analogy to highlight the importance of performance dash-
board analogy, and also to underline the interrelationships between
productivity and innovation as well as qwl. These interrelationships
allow both to reflect the productivity level.
To identify the ratios, there is aneed toagainobserve the results from
the Input/Output Analysis.Thefirst step is to depict a boxwhich repre-
sents all key processes. Then, an agreement needs to be made on what
constitutes the output side (i.e., what comes out from the box). After-
wards, a focus on what resources to be consumed by the box should be
undertaken.Thenext step is to describe the outputs’ expected impacts.
Finally, what constitutes the upstreamcanbe identified. It is important

Ratio Development as Productivity Surrogates 151
Up-stream
Inputs (i.e.,resources
consumed byall operational
processes
Processes(or throughput)
Outputs (i.e.,products and/
or servicesgenerated
by a system)
Down-stream
Organizational System
Functional System: Call Center
SuppliersContractorsRegulators
StaffsRaw materialsMachinery and
equipmentsCapitalFacilityUtility
Information
PlanningDesign
MarketingProcurementProductionInspectionStorageDelivery
ProductsServices
Reports anddocuments
Suggestions
Revenues andprofits
Service qualityCustomer
satisfactionRegulatorycompliance
IT networkcontractorCustomers
StaffsIncoming callsIT network and
databaseFacilityUtility
TrainingListening
Datagathering,
analysis, andretrieval
RespondingRecording
ResponsesData and
information
Quality ofresponses
(e.g., clarity,and timeliness)
Customersatisfaction
figure 6.2 Details of the Extended Input/Output Analysis at Various Levels
to note that this analysis can be applicable at any organizational level.
See the call center from one firm operating inThailand (Figure 6.2).
After a completion of the Input/Output Analysis, a ratio can be easily
identified. For both innovation and qwl, some of the ratios reflecting
the productiveness in an organization are as follows.
Innovation The ability to generate the revenue from new products
and services displays an organization’s productiveness in utilizing
available resources and exercising effective time management.
1. Product innovation:
• Revenue fromnewproducts and services÷Total revenue
• Revenue from new products and services ÷ Staffs
• Revenue fromnewproducts and services÷Total value of
equipment and machinery
2. Process innovation:
• Suggestions proposed ÷ Staffs
• Suggestions implemented ÷ Suggestions proposed
152 Chapter Six
qwl Positive feeling towards the workplace ultimately results in
productive workforce and subsequently cohesive units which will
positively contribute to an organization’s productivity.
• Accidents ÷ Staffs
• Training cost ÷ Staffs
• Compensation cost due to injuries from occupational safety
and health ÷ Staffs
• Lateral transfers requested ÷ Staffs
• Terminated staffs ÷ Staffs
• Unplanned absent hours ÷ Staffs
• Work stoppage hours ÷ Staffs
• Financial losses due to stolen and damaged properties ÷Staffs
For a company’s call center, the focus narrows on the quality of a
staff ’s reply to an inquiry and a complaint made by a customer. In this
case, it is the presumption that the reply quality and customer satisfac-
tion represent the sign of a call center’s productivity.The reason is that
if the customer satisfaction level is high, there is no need to add unnec-
essary staffs and other resources. The ratios used for this case are as
follows.
• Incoming calls from the same phone number within a 2-hour
period ÷ Incoming calls
• Incoming calls going through an operator within one minute ÷Incoming calls
Note:The samephone numberwhich calls within two hoursmay not
entirely reflect a reply’s quality (i.e., clarity of a response) since other
subject matters may prompt a call. Nevertheless, the company’s man-
agement still preferred to measure this aspect.
Then, there are three issues to be considered.Thefirst one deals with
the data for the set of ratios.This consideration include: (1) unit dimen-
sions, (2) frequency, (3) data accuracy and reliability, and (4) defini-
tion for data collection. For the first issue, there are three possible unit
dimensions for the staffs; i.e., headcounts, bath (Thai currency), and
working hours. For the frequency, a decision needs to bemadewhether
the data will be collected on the weekly, monthly, quarterly, or annual
basis. It is important to work with a team in charge of data collection

Ratio Development as Productivity Surrogates 153
to ensure the accuracy and timeliness of the data for a management
report.
For the definition of the staffs, it is important to clarify whether a
company focuses only on full-time workers, full- and part-time work-
ers, or full-time and contracted-out workers, etc. Without this clarity,
the staff headcounts are not accurate. The second issue relates to the
information usefulness for future decisions and actions. Understand-
ing of a ratio’s trend is important to avoid overreaction on uncontrol-
lable events. The last issue is to ensure that the selected ratios have
strong linkage with organizational policies and objectives. It is impor-
tant that a ratio is consistent with an organization’s business goals and
supports its long-term competitiveness.
Finally, there are two guidelines to follow when developing a ratio.
The first guideline is referred to as an absolute rule. This rule implies
an attempt to quantify a number and later compare it with a target. For
instance, to ensure a productive operation for a repair service, a com-
pany may choose to measure the following ratio—an average waiting
time for a customer which is computed by having a total waiting time
divided by a number of customers.
The second guideline is called a frequency rule. This second rule is
based on the premise that a target has already been established.There-
fore, a company attempts to gain better understanding on how well it
achieves this target. For example, if the same company has determined
the target for a repair service to be no more than 90 minutes for one
customer, a ratio can be % repair services completed less than 90min-
utes.This is computed by a total repair services completed less than 90
minutes divided by a total repair services completed, and then multi-
plied the result by 100. Both guidelines are helpful when applying the
ratios for information analysis.
It should be noted that other ratios for profitability, effectiveness,
and efficiency can be identified. In general, the term profitability can
be represented by having the downstream divided by the inputs (also
known as a cross ratio) such as the revenue-to-cost and profit-to-cost
ratios. On the other hand, it has been widely practiced to evaluate the
profitability level with having the downstream divided by the down-
stream as a self ratio. Some of the profitability ratios include the profit-
to-revenue and revenue from rework-to-revenue ratios.
For the term effectiveness, any ratio should relate to the output side
such as the actual product produced-to-planned products to be pro-
154 Chapter Six
duced, and the unplanned products produced-to-actual products pro-
duced ratios. The reason is that the effectiveness indicates the degree
to which a system achieves the right thing.
For the efficiency, any ratio should focus on the input side since this
term implies a systemwhich utilizes its resources in the right way. Typ-
ical ratios relating to efficiency include planned materials consumed-
to-actual use of materials, and planned labor headcounts-to-actual la-
bor headcounts hired ratios.
Audit to Verify and Improve Proposed Ratios
The audit task is critical before data collection, staff communication,
and information reporting processes can be undertaken. The audit is
typically used to ensure the quality of a set of ratios to be used by a
company’s management (Phusavat, Manaves, & Takala, 2007). It is im-
portant that an overall framework is created and shared with relevant
groups dealingwithmeasurement and analysis efforts.This framework
is illustrated in Table 6.2.
Thevigorousaudit on the set of identified ratios shouldbe conducted
in a constructive way as it is likely that some ratios may be discarded.
As a result, a new set of ratios may have to be developed to ensure that
the awareness on theproductivity level canbemade. See the audit table
example. The answer of either yes or no is expected. In the past, when
a ratio receives a no answer, a decision needs to be made on whether
it should be discarded. For instance, if the suggestions implemented-
to-suggestions proposed corresponds to an organization’s attempt to
engage more with staffs but is not accepted by most staffs, it should
not be deployeduntil further communication canbemade. In this case,
staffs feel that the suggestions could be used as a criterion for dismissal
fromaworkplace. In addition, a lack of training (especially on problem-
shooting skills) would hinder the quality of suggestions. Despite, the
ratio is perceived to be useful and has available data for information
analysis, imposing it onto the staffs is not recommended until the con-
cerns from staffs are addressed (Table 6.3).
Exercises
6.1 Based on the Input/Output Analysis of one public university inThai-
land, develop productivity, innovation, and qwl ratios. Examine the
policies and objectives of this university (of your choice) and conduct
the audit to verify the identified ratios (based on what you will have
reviewed). Hint: You are not expected to have data availability in one

Ratio Development as Productivity Surrogates 155
table 6.2 Overall Framework when Identifying the Ratios
Organizational system analysis
1.1 Specific business (products and services) the organization that it is operating
1.2 Description of overall organizational strategy, policies, and objectives
1.3 Primary and secondary customers and their needs
1.4 Primary and secondary suppliers and what the organization needs from them
1.5 Key or critical processes for providing the above outputs
1.6 Current and desirable behavior of organizational personnel
1.7 Shared values and cultures embedded in the organization
1.8 Organizational staffing and structure
1.9 Threats from external environment
Information suitability
2.1 Types of data currently collected and location where data is stored
2.2 Dimensions which this set of data is kept
2.3 Capability for the information system to convert to different data dimensions
2.4 Frequency of performance report for management review
2.5 Widely used and applied by benchmarking partners or being referred to as
industrial average
Analysis on Measurement Acceptance
3.1 Current awareness on productivity measurement
3.2 Sharing of productivity information at the organizational and divisional levels
3.3 Setting of productivity targets at the organizational and divisional levels
3.4 Who would analyze and make improvement interventions?
table 6.3 Demonstration of Audit to Ratio Verification and Improvement
Ratio/Audit Items (1) (2) (3) (4) (5)
Ratio 1: Suggestions proposed ÷ Staffs Yes Yes Yes Yes No
Ratio 2: Suggestions implemented
÷ Suggestions proposed
Yes Yes Yes No No
notes Column headings are as follows: (1) alignment with policies and objectives,
(2) information usefulness, (3) data availability and timeliness, (4) use as an industrial
average or by partners, (5) acceptance by relevant groups.
of your audit items. Be sure to include the frequency, definitions, and
unit dimensions when completing your set of proposed ratios.
The overall future environment facing this public university can be
summarized as follows (see Table 6.4 and Figure 6.3).
• Need to strengthen quality of university education for better
qualified workforce for an emerging economy—creative and
knowledge-based.

156 Chapter Six
table 6.4 Ranking Comparisons of 5th Pillar, 12th Pillar, and Overall Global
Competitiveness Index or GCI during 2009-2010
Country (1) (2) (3) (4)
Rank Rank Score Rank Score Rank Score
Switzerland 2 1 5.60 6 5.60 2 5.56
United States 1 2 5.59 7 5.57 1 5.77
Singapore 5 3 5.55 5 5.62 8 5.09
Sweden 4 4 5.51 3 5.76 5 5.39
Denmark 3 5 5.46 2 5.90 10 5.04
Finland 6 6 5.43 1 5.97 3 5.53
Germany 7 7 5.37 22 5.07 7 5.11
Japan 9 8 5.37 23 5.06 4 5.51
Canada 10 9 5.33 9 5.50 12 4.80
Netherlands 8 10 5.32 10 5.49 13 4.79
notes Column headings are as follows: (1) Overall GCI 2008–2009, (2) Overall GCI
2009–2010, (3) 5thpillarHigher Education andTraining Index 2009–2010, (4) 12thpillar
Innovation Index 2009–2010.
Up-stream
Inputs (i.e.,resources
consumed byall operational
processes
Processes(or throughput)
Outputs (i.e.,products and/
or servicesgenerated
by a system)
Down-stream
Public University
Bureau of theBudget
SuppliersContractorsRegulators
(e.g., Office ofCommission of
HigherEducation, etc)Donors (from
formerstudents)
High schoolsPrivate firms
Stateenterprises
StaffsStudents
Materials forexperimentsLaboratoryequipmentsCapital and
budgetFacilityUtility
Informationsuch as
curriculumrequirements,
contracts,grants
PlanningProcurement
TeachingQuality
assuranceExperiment
Recordkeeping
Studentsgraduated
PublicationsResearch
reportsProject reports
SeminarsIntellectualproperties
RevenuesRecognition
andacceptanceSatisfaction
figure 6.3 Details of the Extended Input/Output Analysis for a Public University

Ratio Development as Productivity Surrogates 157
• Need to work together with international partners for better
peer recognition and higher global ranking position.
• Need to focus on research, innovation, and intellectual proper-
ties for strengthening the global country’s competitiveness.
• Need to focus on better financial management to ensure the
long-termcapability to survive afiscal constraint tobe expected
in the near future.
• Need to focus on the aging population trend in which there will
be less incoming 1t-year students.
References and Further Reading
Lee, T.-R., Helo, P., Siriwatchrakit, Z., Comepa, N., Chuancharoen, S., &
Phusavat, K. (2011). Applying intellectual capital for sustaining or-
ganisational learning. International Journal of Sustainable Economy,
3(3), 328–340.
Muhos, M., Kess, P., Phusavat, K., & Sanpanich, S. (2010). Business growth
models: Reviewof past 60 years. International Journal ofManagement
and Enterprise Development, 8(3), 296–315.
Phusavat, K., Anussornnitisarn, P., Rassameethes, B., Helo, P., & Kess, P.
(2009). Organisational learning anddevelopment: Lessons frompro-
ductivity analysis. International Journal of Innovation and Learning,
6(4), 406–421.
Phusavat, K., Anussornnitisarn, P., Rassameethes, B., & Kess, P. (2009).
Productivity improvement: Impacts from quality of work life. Inter-
national Journal of Management and Enterprise Development, 6(4),
465–478.
Phusavat, K., & Chansa-ngavej, C. (2007).The role of university classifica-
tion on developing standards in education. International Journal of
Management in Education, 1(4), 318–334.
Phusavat, K., Manaves, P., & Takala, J. (2007). Proposed model for perfor-
mancemeasurement standards. International Journal of Services and
Standards, 3(3), 326–351.
Phusavat, K., Nilmaneenava, S., Kanchana, R., Wernz, C., & Helo, P. (2012).
Identifying productivity indicators frombusiness strategies’ surveys.
International Journal of Productivity and Quality Management, 9(2),
158–176.
Sink,D. (1985).Productivitymanagement: Planning,measurement and eval-
uation, control and improvement. New York, ny: Wiley.


Chapter Seven
Productivity Analysis throughCase Demonstrations
The chapter focuses on extending productivity measurement into in-
formation analysis, business strategies, andprocess improvement. Tra-
ditionally, there are three common questions under examination when
analyzingproductivity (and evenperformance) information. Is our pro-
ductivity level improving? Is our productivity level good enough? How
does productivity interact with and impact on others? The first one
needs to be addressed by applying statistical analysis and to evaluate
a possible trend as a result of productivity information. This is some-
times referred to as internal information analysis. It deals with process
variation and capability. Understanding the implications of common
and special causes is important for effective decisions and actions.This
Understanding contributes to a shift in an average value is important
for this first approach. The second questions needs to compare pro-
ductivity information with a result from benchmarking partners and
an industrial average value. In the past decade, apqc has extended
its benchmarking initiative to incorporate performance improvement
though learningandadapting frombest-practice cases.This secondap-
proach is often mentioned as external information analysis. Any im-
provement that stems from internal and external information analy-
ses is referred to as business process reengineering.The third approach
deals with extending productivity information by linking it with strat-
egymap, and business planning on strategy and process improvement.
The sections in this chapter highlight the importance of productivity
analysis within the context of business decisions and planning. In the
first section, the focus is on productivity analysis by understanding the
trends. The second section deals with the application of benchmark-
ing. In the third sectin, the discussion highlights the development of a
strategy map which shows the interrelationships between productiv-
ity and other strategic objectives. A strategy map is a critical feature
of management analysis on the productivity and performance levels of
an organization. The last section demonstrates how understanding of
productivity has played a role in service improvement even for a public
159

160 Chapter Seven
agency. This section shows the service improvement based on blend-
ing productivity and quality. This case is recognized as one of the most
outstanding service improvement efforts undertaken by the RoyalThai
Government.
Productivity Analysis with Trends
Effective productivity measurement benefits internal and external in-
formation analyses (Phusavat, 2008). Internal analysis focuses on a
trend with closer attention on root-cause analysis when detecting a
shift in an average value (Phusavat, Ketsarapong, Ranjan, & Lin, 2011).
It is important that common and special causes are identified.The rea-
son is that better understanding on what constitutes controllable and
uncontrollable factors needs to be established. Otherwise, a decision
may lead to a more destabilized operational process. For instance, a
natural disaster may cause a delay in in-house technical services for a
plant’s machinery. If a plant’s management team decides to outsource
maintenance tasks, it may not lead to an expected reduction of delay
time. Typically, internal performance analysis involves the application
of statistics for understanding the trends and process variations. It pri-
marily focuses on whether a productivity level has improved.
Given the above description, when developing a set of ratios for pro-
ductivity and performance measurement, it is important that a desir-
able trend has to be determined.
1. Productivity indicator: Value-added labor productivity
Formula: Value added ÷ Labor.
Unit dimensions: $ per person.
Definition:
• Value-added is defined as sales subtracted by cost of pur-
chased goods and services.
– Sales indicate the revenue earned from products sold
and/or services delivered by the firm.This revenue for
the term value added needs to exclude non-operating
incomes.
– Note that, in a manufacturing firm, not all goods or
products sold are produced in the same period. The
change in inventory level should be subtracted from
sales for a better reflection of the value of output pro-
duced during that period.

Productivity Analysis through Case Demonstrations 161
– Purchased goods and services traditionally include
raw materials, supplies, and utilities and services (e.g.
insurance, security, professional services) bought from
external suppliers.
• Labor is defined as full-time workers.
Frequency:Monthly.
Desirable trend: Increasing.
Implications when increasing:
• Optimumuse of labor for skills, knowledge, and intellectual
capital during the transformation of raw materials to fin-
ished products
2. Productivity indicator: Value-added capital productivity
Formula: Value added ÷ Fixed assets
Unit dimensions: $ per $
Definition:
• Value-added is defined as sales subtracted by cost of pur-
chased goods and services.
• Fixed assets indicates a net book value
Frequency:Monthly
Desirable trend: Increasing
Implications when increasing:
• Optimum use of machinery and equipment in a firm for
the transformation of raw materials to finished products.
Be aware of the proportion of the leased tools, equipments,
instruments, and machines relatively to the book value of
fixed assets during productivity analysis.
The use of two trends to simultaneously analyze productivity infor-
mation can also be applied in an approach called a cross-examination
trend (Helo, Takala,&Phusavat, 2009)). For instance, there are three ra-
tios under study. They are: (1) output value-to-labor, (2) work stoppage
time-to-labor, and (3) training cost-to-labor. For these ratios, a desir-
able trend is clearly defined and understood.The output value-to-labor
ratio’s trend should continuously increase. The similar trend (but with
a more stable direction) is also expected for the training cost-to-labor
ratio. However, the declining trend should be for the second ratio since
the work stoppage should be avoided.

162 Chapter Seven
For a cross-examination trend, the three trends should be scruti-
nized simultaneously. A desirable trend for each of the three ratios as
well as expected caused-and-effect relationships should be first de-
scribed. If the training cost-to-labor is gradually upward, thework stop-
page time-to-labor should decrease while the output value-to-labor is
expected to increase. If this condition does not take place, then more
in-depth analysis through the use of root-cause analysis tools (e.g., fish-
bone diagram, 5-why, scattering plot, process flow diagram, etc.). The
cross-examination approach is quite helpful when there is a need to
concurrently consider several ratios for information analysis instead
of analyzing individual ratios (Phusavat, Ketsarapong, et al., 2011).
Productivity Analysis with Benchmarking
External productivity analysis generally includes benchmarking and
involves the adaptation from best-practice cases. In the previous dis-
cussion, it is important that the ratios being used by the industry or
benchmarked partners should be consideredwhenmeasuring produc-
tivity and performance. Tracking information based on the ratios cur-
rently being used by other organizations and/or an industry helps facil-
itate productivity analysis. As a result, it is important for a manager to
realize whether the performance levels of a firm, a functional unit, or a
process is improving and is good enough. Comparing the information
from productivity measurement, learning from partners, and improv-
ing operational process (i.e., reengineering) have been practiced over
the past two decades. This is primarily due to the more active roles of
the apqc as a benchmarking clearinghouse and a promoter of best
practices.
Benchmarking canbeperformed inmanyways. Several leadingfirms
have consistently applied benchmarking for internal comparison of
similar operations or functions. Aerospace and defense, automotive,
and electronic firms as well as service providers have used bench-
marking to strive for continuous improvement in productivity and
other performance areas. This is often referred to as process bench-
marking. Benchmarking can be performed by comparing the results
with the industrial competitors. This practice is known as competitive
benchmarking. Recently, benchmarking is performed as a way for an
organization to learn fromworld-class or best-practice companies.The
apqc has been the leader in creating a clearinghouse where the use of
generic benchmarking can be applied. In other words, for the private
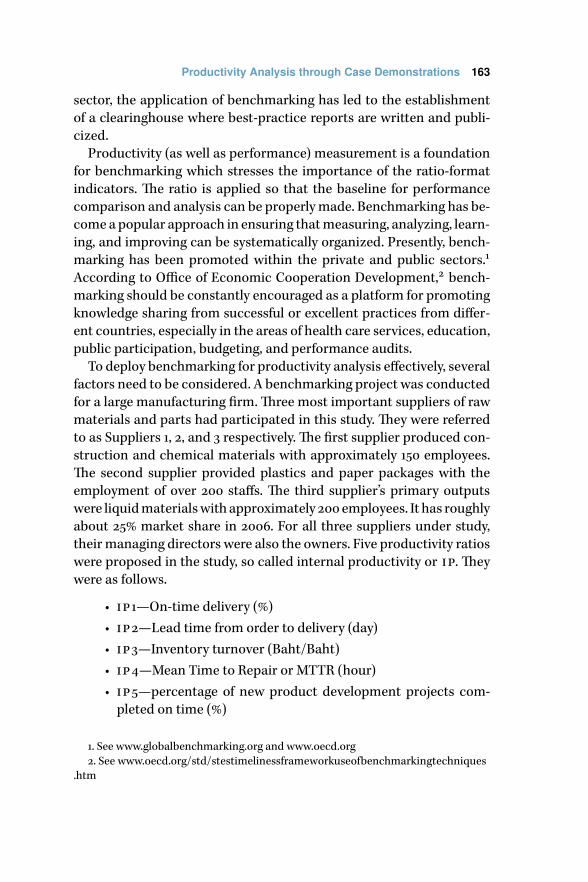
Productivity Analysis through Case Demonstrations 163
sector, the application of benchmarking has led to the establishment
of a clearinghouse where best-practice reports are written and publi-
cized.
Productivity (as well as performance) measurement is a foundation
for benchmarking which stresses the importance of the ratio-format
indicators. The ratio is applied so that the baseline for performance
comparison and analysis can be properlymade. Benchmarking has be-
come a popular approach in ensuring thatmeasuring, analyzing, learn-
ing, and improving can be systematically organized. Presently, bench-
marking has been promoted within the private and public sectors.1
According to Office of Economic Cooperation Development,2 bench-
marking should be constantly encouraged as a platform for promoting
knowledge sharing from successful or excellent practices from differ-
ent countries, especially in the areas of health care services, education,
public participation, budgeting, and performance audits.
To deploy benchmarking for productivity analysis effectively, several
factors need to be considered. A benchmarking project was conducted
for a large manufacturing firm.Three most important suppliers of raw
materials and parts had participated in this study. They were referred
to as Suppliers 1, 2, and 3 respectively. The first supplier produced con-
struction and chemical materials with approximately 150 employees.
The second supplier provided plastics and paper packages with the
employment of over 200 staffs. The third supplier’s primary outputs
were liquidmaterialswith approximately 200 employees. It has roughly
about 25% market share in 2006. For all three suppliers under study,
their managing directors were also the owners. Five productivity ratios
were proposed in the study, so called internal productivity or ip. They
were as follows.
• ip1—On-time delivery (%)
• ip2—Lead time from order to delivery (day)
• ip3—Inventory turnover (Baht/Baht)
• ip4—Mean Time to Repair or MTTR (hour)
• ip5—percentage of new product development projects com-
pleted on time (%)
1. See www.globalbenchmarking.org and www.oecd.org
2. See www.oecd.org/std/stestimelinessframeworkuseofbenchmarkingtechniques
.htm
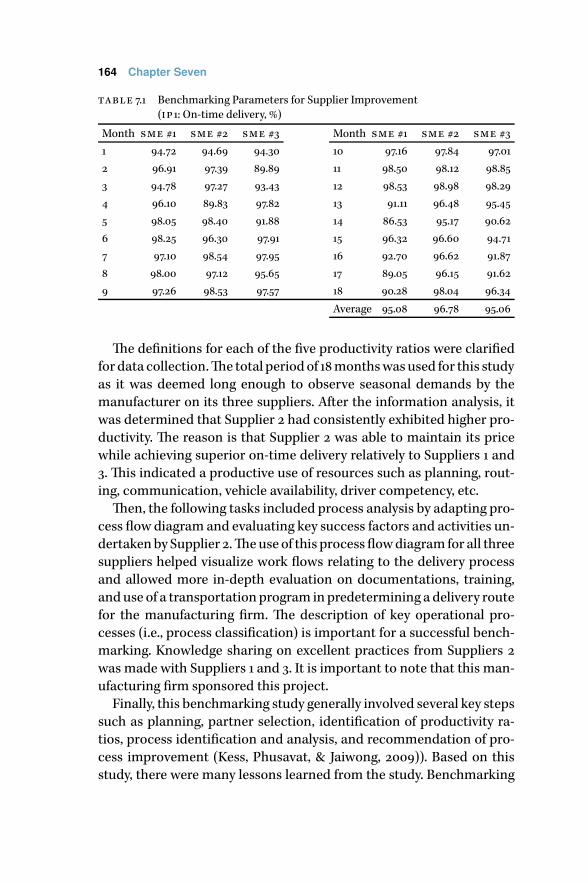
164 Chapter Seven
table 7.1 Benchmarking Parameters for Supplier Improvement
(ip1: On-time delivery, %)
Month sme #1 sme #2 sme #3 Month sme #1 sme #2 sme #3
1 94.72 94.69 94.30 10 97.16 97.84 97.01
2 96.91 97.39 89.89 11 98.50 98.12 98.85
3 94.78 97.27 93.43 12 98.53 98.98 98.29
4 96.10 89.83 97.82 13 91.11 96.48 95.45
5 98.05 98.40 91.88 14 86.53 95.17 90.62
6 98.25 96.30 97.91 15 96.32 96.60 94.71
7 97.10 98.54 97.95 16 92.70 96.62 91.87
8 98.00 97.12 95.65 17 89.05 96.15 91.62
9 97.26 98.53 97.57 18 90.28 98.04 96.34
Average 95.08 96.78 95.06
The definitions for each of the five productivity ratios were clarified
for data collection.The total periodof 18monthswasused for this study
as it was deemed long enough to observe seasonal demands by the
manufacturer on its three suppliers. After the information analysis, it
was determined that Supplier 2 had consistently exhibited higher pro-
ductivity. The reason is that Supplier 2 was able to maintain its price
while achieving superior on-time delivery relatively to Suppliers 1 and
3. This indicated a productive use of resources such as planning, rout-
ing, communication, vehicle availability, driver competency, etc.
Then, the following tasks included process analysis by adapting pro-
cess flow diagram and evaluating key success factors and activities un-
dertakenby Supplier 2.Theuse of this process flowdiagram for all three
suppliers helped visualize work flows relating to the delivery process
and allowed more in-depth evaluation on documentations, training,
anduse of a transportation program inpredetermining a delivery route
for the manufacturing firm. The description of key operational pro-
cesses (i.e., process classification) is important for a successful bench-
marking. Knowledge sharing on excellent practices from Suppliers 2
was made with Suppliers 1 and 3. It is important to note that this man-
ufacturing firm sponsored this project.
Finally, this benchmarking study generally involved several key steps
such as planning, partner selection, identification of productivity ra-
tios, process identification and analysis, and recommendation of pro-
cess improvement (Kess, Phusavat, & Jaiwong, 2009)). Based on this
study, there were many lessons learned from the study. Benchmarking

Productivity Analysis through Case Demonstrations 165
80.0
82.5
85.0
87.5
90.0
92.5
95.0
97.5
100.0
#3 #2
#1
1 2 3 4 5 6 7 8 9 10 11 12 13 14 15 16 17 18
%
Period
figure 7.1 Benchmarking Parameters for Supplier Improvement
(ip1: On-time delivery, %)
was part of productivity analysis andwas perceived to be amechanism
for continuous productivity (as well as performance) improvement in
an organization. Benchmarking helped build knowledge on improve-
ment. Benchmarking represented an effort to become a learning or
knowledge-based organization. It enhanced innovation within an or-
ganization since the changes in key processes such as new product de-
velopment, customer complaint handlings, and supplier development
are inevitable. In other words, benchmarking could be applied in con-
junction with iso 9001: 2008, the mbnqa, and the efqm.
Bundled with the apqc’s Process Classification Framework (pcf),
productivity analysis through benchmarking can strengthen continu-
ous improvement in an organization. The pcf highlights the impor-
tance of process management and stresses continuous improvement
through benchmarking.3 In addition to operations (e.g., production,
manufacturing, delivery, new product/service development, market-
ing and sale of products/services, etc.), the pcf also focuses on the
term management process. Some of the key activities in the pcf’s
managementprocess includemanagingknowledge, improvement, and
changes (Phusavat, Songnisai, Rassameethes, & Kekale, 2008).
There are many reasons for benchmarking and the pcf’s emerg-
ing importance (Phusavat, 2010). First of all, iso 9001:2000 drastically
changed its structure from the 1987 and 1994 versions with the focus
3. See www.apqc.org/pcf

166 Chapter Seven
more on an effective management process. The specific requirement
dealing directly with this issue was established and was referred to as
Measurement, Analysis, and Improvement in its 2000 version. It is im-
portant to point out that the most recent version of 2008 maintains
this requirement as part of management responsibility.4 Even in the
public sector, benchmarking had constantly been encouraged. For the
uk, the Public Sector Benchmarking Service, launched in November
2000, aimed topromote effective benchmarking and tohelp share good
practices across the public sector.5 It enabled organizations to share
knowledge and learn from the best (Phusavat et al., 2008).
Productivity Analysis within the Context of Strategy Map
Productivity analysis generally involves the use of a strategy map to
highlight what affect productivity and how productivity contributes
to an overall higher performance level of an organization (Phusavat
& Jaiwong, 2008b). A strategy map typically associates with two fea-
tures: (1) current productivity and performance levels or “as is,” and (2)
expected productivity and performance levels and their interrelation-
ships or “to-be.” A strategy map should help link both as-is and to-be
features. It reflects the hypothetical interrelationships among strate-
gic objectives of an organization (Kaplan and Norton, 1996; 2004). In
most literatures, the term strategy map is closely related to the use
of Balanced Scorecard (bsc) which highlights the interrelationships
among four performance perspectives; i.e., customers (how do cus-
tomers see us?), finance (how do we look to shareholders?), internal
business (what must we excel at?), and innovation and learning (can
we continue to improve and create value?). Productivity is part of the
internal business perspective (Phusavat & Jaiwong, 2008a).
The following study was an extension from the initial benchmark-
ing study (in reference to the second section).Themanufacturing firm’s
management team decided to extend the study by developing a strat-
egy map in which three key suppliers exhibited. These three suppliers
were considered as the firm’s first tier and top performer. The strat-
egy map represented an attempt for this manufacturing firm to work
with its important suppliers. This attempt was part of the firm’s pro-
gram on improving its supply chain management. From the firm’s top
management, the strategy map reflected a road map to achieve excel-
4. See www.iso.org/iso/management_standards.htm
5. See www.archive.cabinetoffice.gov.uk/servicefirst/.../benchmarkingservice.htm

Productivity Analysis through Case Demonstrations 167
lent performance. If a supplier could excel, it would benefit the firm in
two ways: (1) less inspection cost and staffs, and (2) higher capability
tomaintain competitive price for materials and parts to be purchased.
This strategy map could also provide a firm with a general framework
of what needs to be focused first if it decided to send an engineering
team for management and technical support in other suppliers.
The bsc was chosen to ensure the level of familiarity among the
three suppliers’ teammembers. As a result, the subject of internal pro-
ductivity was modified to internal business process perspective (but
the firm’s management team opted to maintain the term ip). In this
study, the first step involves the identification of ratios relating to each
of the four perspectives within the bsc. The firm’s management team
and the three suppliers were working together on the definition and
common ratio that they would agree on. The results are presented
in Table 7.2. It should be pointed out that the financial and internal-
processes perspectives have received most of their attention during
this step.
Then, the mcpmt was then applied for the bsc verification and the
development, based on the results of the three suppliers over the 18-
month period. See the results from the first supplier (Table 7.3).
The performance scale of 0 to 100was selected for all ratios. Further-
more, there were three points that formed a preference curve for indi-
vidual ratios. For a ratio with a desirable increasing trend, the highest
result over the 18-period duration would receive the score of 100 while
the lowest result was assigned the value of 0. On the other hand, for
a ratio with a desirable decreasing trend, the highest result would re-
ceive the score of 0 while the lowest result was assigned the value of
100. The score of 50 would be for the average result over the 18-period
duration.Then, the next task was to convert the results from each ratio
into a common 0–100 scale. Afterward, the following taskwas to derive
an overall result from one perspective by assigning an equal weight to
related ratios.This overall result could be computed bymultiplying the
individual results fromeach kpi by the assignedweight. In this demon-
stration, each kpi was assigned a weight of 1/7.
Then, for each supplier, the interrelationshipswere computed on the
following: (1) finance and customer perspectives, (2) finance and inter-
nal business process perspectives, (3) finance and innovation/learning
perspectives, (4) customer and internal business process perspectives,
(5) customer and innovation/learning perspectives, and (6) internal
business process and innovation/learning perspectives. The use of the

168 Chapter Seven
table 7.2 Common Ratios for Strategy Map Development
f1. Current rate
(Baht/Baht)
c1. New customers
per total customers
(%)
ip1. On-time deliv-
ery (%)
il1. r&d expense
per total expenses
(%)
f2. Interest ex-
pense per sales
(Baht/Baht)
c2. Customer lost
(%)
ip2. Average lead
time (day)
il2. Compe-
tence develop-
ment expenses
per employee
(Baht/employee)
f3. Revenues per
total assets (%)
c3. Satisfied-
customer index (%)
ip3. Lead time,
from order to deliv-
ery (day)
il3. Satisfied-
employee index (%)
f4. Revenues
per employee
(Baht/employee)
c4. Customer-
loyalty index (%)
ip4. Lead time,
production (day)
il4. Market-
ing expense
per customer
(Baht/customer)
f5. Profits
per employee
(Baht/employee)
c5. Number of cus-
tomer complaints
(record)
ip5. Average time
for decision-
making (day)
il5. Information
coverage ratio (%)
f6. Market value
(Baht)
c6. Customer pay-
ment on-time (%)
ip6. Inven-
tory turnover
(Baht/Baht)
il6. Investment in
new product sup-
port and training
per total employees
(Baht/employee)
f7. Return on capi-
tal employed (%)
c7. Average di-
rect communica-
tions to customers
(time/customer)
ip7. Maintenance
cost per revenue
(%)
il7. Staff turnover
(%)
f8. Profit margin
(%)
ip8. Supplier on-
time delivery (%)
f9. Cash flow
(Baht)
ip9. Mean Time be-
tween Failure or
mtbf (hour)
Continued on the next page
regression analysis was applied in conjunction with the mcpmt. The
partial demonstration of the regression analysis from Supplier 1 is as
follows.The applications f the mcpmt and regression equations were
applied to all three suppliers.
• Finance vs. Internal Business Process: f = 22.1 + 0.5(ip) at the
p-value at 0.006.
• Innovation and Learning vs. Finance: il = 21.9 + 0.6(f) at the
p-value at 0.005.
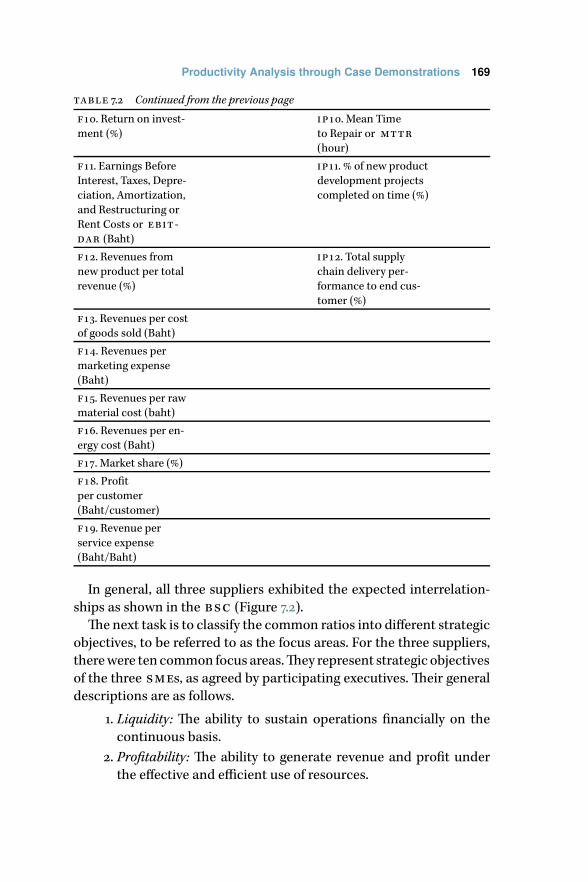
Productivity Analysis through Case Demonstrations 169
table 7.2 Continued from the previous page
f10. Return on invest-
ment (%)
ip10. Mean Time
to Repair or mttr
(hour)
f11. Earnings Before
Interest, Taxes, Depre-
ciation, Amortization,
and Restructuring or
Rent Costs or ebit-
dar (Baht)
ip11. % of new product
development projects
completed on time (%)
f12. Revenues from
new product per total
revenue (%)
ip12. Total supply
chain delivery per-
formance to end cus-
tomer (%)
f13. Revenues per cost
of goods sold (Baht)
f14. Revenues per
marketing expense
(Baht)
f15. Revenues per raw
material cost (baht)
f16. Revenues per en-
ergy cost (Baht)
f17. Market share (%)
f 18. Profit
per customer
(Baht/customer)
f19. Revenue per
service expense
(Baht/Baht)
In general, all three suppliers exhibited the expected interrelation-
ships as shown in the bsc (Figure 7.2).
The next task is to classify the common ratios into different strategic
objectives, to be referred to as the focus areas. For the three suppliers,
therewere ten common focus areas.They represent strategic objectives
of the three smes, as agreed by participating executives. Their general
descriptions are as follows.
1. Liquidity: The ability to sustain operations financially on the
continuous basis.
2. Profitability: The ability to generate revenue and profit under
the effective and efficient use of resources.

170 Chapter Seven
table 7.3 Demonstration of the Results from Supplier 1’s Innovation and Learning
Perspective
Month il1 il2 il3 il4 il5 il6 il7
1 2.11 45.28 79.00 566.04 80.00 71.43 0.00
2 4.29 43.17 79.00 539.57 80.00 71.43 0.95
3 4.93 42.11 79.00 526.32 80.00 71.43 0.48
4 4.47 40.68 82.00 593.22 80.00 68.81 0.00
5 2.00 39.34 82.00 573.77 80.00 68.81 0.46
6 1.97 38.09 82.00 555.57 80.00 114.68 0.00
7 1.92 38.71 82.00 580.66 87.00 114.68 0.00
8 3.80 36.92 82.00 1,461.59 87.00 114.68 0.00
9 1.95 36.47 82.00 547.11 87.00 109.65 0.00
10 2.00 35.82 85.00 537.31 87.00 65.79 0.00
11 1.92 35.82 85.00 1,432.84 87.00 65.79 0.00
12 2.17 35.82 85.00 1,492.54 87.00 65.79 0.00
13 1.92 45.46 85.00 576.37 90.00 90.91 0.87
14 3.79 45.46 85.00 1,424.51 90.00 90.91 0.00
15 1.95 45.46 85.00 418.99 90.00 75.76 0.00
16 2.01 45.46 90.00 417.83 90.00 75.76 0.00
17 1.92 45.46 90.00 831.02 90.00 75.76 0.00
18 2.17 45.46 90.00 1,388.89 90.00 75.76 0.00
Customer Perspective
Finance Perspective
Innovation andLearning Perspective
Internal BusinessProcess Perspective
figure 7.2 Interrelationships among bsc’s Perspectives
3. Corporate Competency: The embedded ability of a company to
overcome competition and changes in its business environ-
ment.
4. ServiceQuality:Theability to respond to andpossibly exceed the
expectation of a company’s customers.

Productivity Analysis through Case Demonstrations 171
table 7.4 Preference Curve Formulation for Supplier 1’s Innovation and Learning
Perspective
Month il1 il2 il3 il4 il5 il6 il7
1 2.11 45.28 79.00w 566.04 80.00w 71.43 0.00b
2 4.29 43.17 79.00 539.57 80.00 71.43 0.95w
3 4.93b 42.11 79.00 526.32 80.00 71.43 0.48
4 4.47 40.68 82.00 593.22 80.00 68.81 0.00
5 2.00 39.34 82.00 573.77 80.00 68.81 0.46
6 1.97 38.09 82.00 555.57 80.00 114.68b 0.00
7 1.92w 38.71 82.00 580.66 87.00 114.68 0.00
8 3.80 36.92 82.00 1,461.59 87.00 114.68 0.00
9 1.95 36.47 82.00 547.11 87.00 109.65 0.00
10 2.00 35.82w 85.00 537.31 87.00 65.79w 0.00
11 1.92 35.82 85.00 1,432.84 87.00 65.79 0.00
12 2.17 35.82 85.00 1,492.54w 87.00 65.79 0.00
13 1.92 45.46b 85.00 576.37 90.00b 90.91 0.87
14 3.79 45.46 85.00 1,424.51 90.00 90.91 0.00
15 1.95 45.46 85.00 418.99 90.00 75.76 0.00
16 2.01 45.46 90.00b 417.83b 90.00 75.76 0.00
17 1.92 45.46 90.00 831.02 90.00 75.76 0.00
18 2.17 45.46 90.00 1,388.89 90.00 75.76 0.00
Average 2.63 41.17 83.83 803.56 85.67 82.66 0.15
notes bwas noted the best performance level; w reflected the worst level of perfor-
mance.
5. Customer Relation:The attempt by a company to communicate
and understand its customers for future growth.
6. Productivity and Process Efficiency: The relationship between
a company’s outputs and inputs with the ability to utilize re-
sources and time in themanner inwhichacompanycanachieve
its policies and objectives.
7. Partnership: The ability to work with suppliers for operational
excellence.
8. Operational and Technical Quality:The ability to achieve opera-
tional excellence and produce quality products.
9. Product Innovation:The ability of a company to change accord-
ing to timebybeing able to anticipate futureneedsorwant from
its customers.
10. qwl:Thefeelingsofworkers, staffs, andemployeesonmany fac-
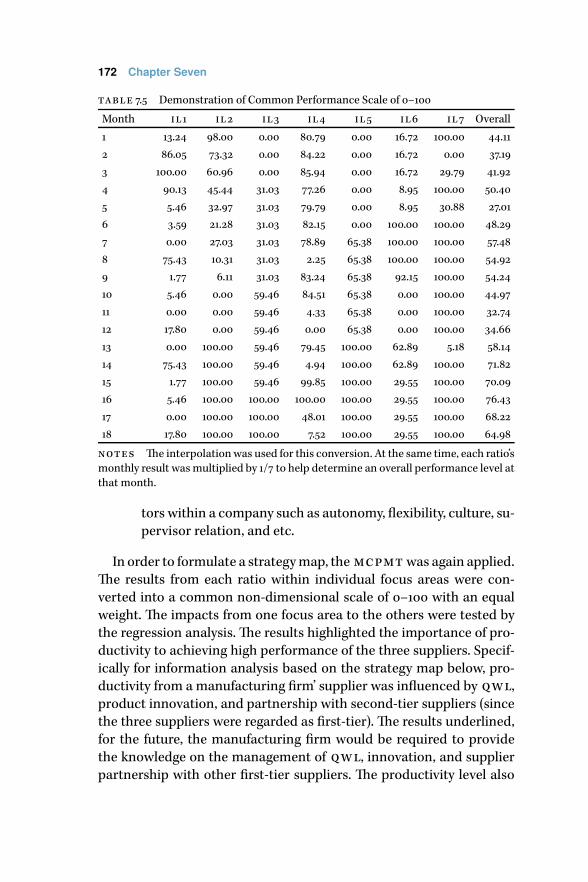
172 Chapter Seven
table 7.5 Demonstration of Common Performance Scale of 0–100
Month il1 il2 il3 il4 il5 il6 il7 Overall
1 13.24 98.00 0.00 80.79 0.00 16.72 100.00 44.11
2 86.05 73.32 0.00 84.22 0.00 16.72 0.00 37.19
3 100.00 60.96 0.00 85.94 0.00 16.72 29.79 41.92
4 90.13 45.44 31.03 77.26 0.00 8.95 100.00 50.40
5 5.46 32.97 31.03 79.79 0.00 8.95 30.88 27.01
6 3.59 21.28 31.03 82.15 0.00 100.00 100.00 48.29
7 0.00 27.03 31.03 78.89 65.38 100.00 100.00 57.48
8 75.43 10.31 31.03 2.25 65.38 100.00 100.00 54.92
9 1.77 6.11 31.03 83.24 65.38 92.15 100.00 54.24
10 5.46 0.00 59.46 84.51 65.38 0.00 100.00 44.97
11 0.00 0.00 59.46 4.33 65.38 0.00 100.00 32.74
12 17.80 0.00 59.46 0.00 65.38 0.00 100.00 34.66
13 0.00 100.00 59.46 79.45 100.00 62.89 5.18 58.14
14 75.43 100.00 59.46 4.94 100.00 62.89 100.00 71.82
15 1.77 100.00 59.46 99.85 100.00 29.55 100.00 70.09
16 5.46 100.00 100.00 100.00 100.00 29.55 100.00 76.43
17 0.00 100.00 100.00 48.01 100.00 29.55 100.00 68.22
18 17.80 100.00 100.00 7.52 100.00 29.55 100.00 64.98
notes The interpolationwas used for this conversion. At the same time, each ratio’s
monthly result wasmultiplied by 1/7 to help determine an overall performance level at
that month.
tors within a company such as autonomy, flexibility, culture, su-
pervisor relation, and etc.
In order to formulate a strategymap, the mcpmt was again applied.
The results from each ratio within individual focus areas were con-
verted into a common non-dimensional scale of 0–100 with an equal
weight. The impacts from one focus area to the others were tested by
the regression analysis. The results highlighted the importance of pro-
ductivity to achieving high performance of the three suppliers. Specif-
ically for information analysis based on the strategy map below, pro-
ductivity from a manufacturing firm’ supplier was influenced by qwl,
product innovation, and partnership with second-tier suppliers (since
the three suppliers were regarded as first-tier). The results underlined,
for the future, the manufacturing firm would be required to provide
the knowledge on the management of qwl, innovation, and supplier
partnership with other first-tier suppliers. The productivity level also

Productivity Analysis through Case Demonstrations 173
table 7.6 Classifying Common Ratios into Ten Focus Areas
Perspective Focus Areas or
Strategic Objectives
Ratios
Financial Liquidity f1 Current rate
f7 Return on capital employed
f9 Cash flow
f10 Return on investment
Profitability f2 Interest expense per sales
f3 Revenues per total assets
f4 Revenues per Employee
f5 Profits per employee
f6 Market value
f8 Profit margin
f11 ebitdar
f12 Revenues from new product per total
revenue
f13 Revenues per cost of goods sold
f14 Revenues per marketing expense
f15 Revenues per rawmaterial cost
f16 Revenues per energy cost
Corporate
Competency
f17 Market share
f18 Profit per customer
f19 Revenue per service expense
Customer Service Quality c3 Satisfied-customer index
c4 Customer-loyalty index
c5 Number of customer complaints
c6 Customer payment on-time
Customer Relation c1 New customers per total customers
c2 Customer lost
c7 Average direct communications to
customers
Continued on the next page
impacted directly on service quality and customer relation (Figure 7.3).
Finally, the strategy map helped explain the need to focus on mul-
tiple areas and the anticipated outcomes when working with other
first-tier supplies. In other words, the results from product innova-
tion and qwl should be consistent with productivity and process effi-
ciency. If product innovation and/or qwl begin to experience poorer
results, more attention needs to be made on productivity and process
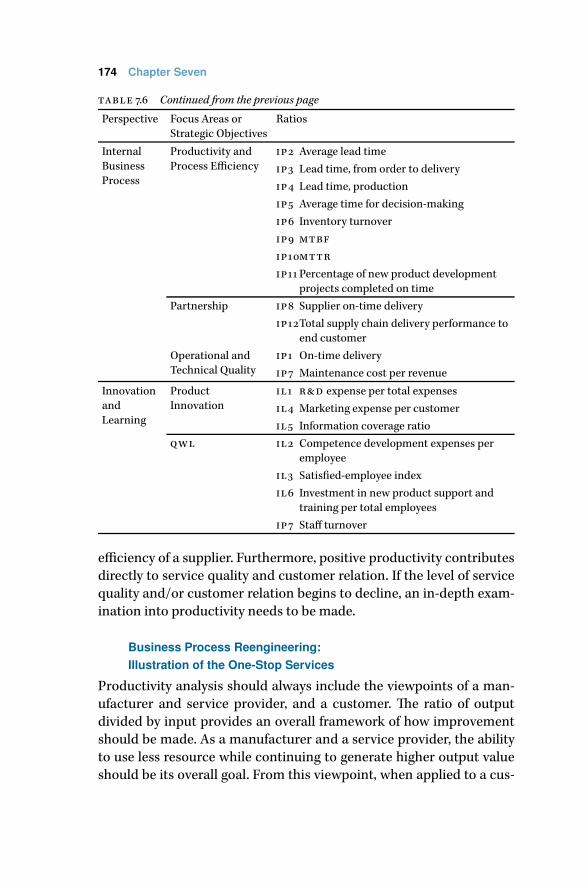
174 Chapter Seven
table 7.6 Continued from the previous page
Perspective Focus Areas or
Strategic Objectives
Ratios
Internal
Business
Process
Productivity and
Process Efficiency
ip2 Average lead time
ip3 Lead time, from order to delivery
ip4 Lead time, production
ip5 Average time for decision-making
ip6 Inventory turnover
ip9 mtbf
ip10mttr
ip11 Percentage of new product development
projects completed on time
Partnership ip8 Supplier on-time delivery
ip12Total supply chain delivery performance to
end customer
Operational and
Technical Quality
ip1 On-time delivery
ip7 Maintenance cost per revenue
Innovation
and
Learning
Product
Innovation
il1 r&d expense per total expenses
il4 Marketing expense per customer
il5 Information coverage ratio
qwl il2 Competence development expenses per
employee
il3 Satisfied-employee index
il6 Investment in new product support and
training per total employees
ip7 Staff turnover
efficiency of a supplier. Furthermore, positive productivity contributes
directly to service quality and customer relation. If the level of service
quality and/or customer relation begins to decline, an in-depth exam-
ination into productivity needs to be made.
Business Process Reengineering:Illustration of the One-Stop Services
Productivity analysis should always include the viewpoints of a man-
ufacturer and service provider, and a customer. The ratio of output
divided by input provides an overall framework of how improvement
should be made. As a manufacturer and a service provider, the ability
to use less resource while continuing to generate higher output value
should be its overall goal. From this viewpoint, when applied to a cus-

Productivity Analysis through Case Demonstrations 175
Innovation and Learning Perspective
Int. Business Process Perspective
Customer Perspective
Financial Perspective
Liquidity Profitability Corporate Competency
Service Quality Customer Relation
Productivity andProcess Efficiency
PartnershipOperational andTechnical Quality
Product Innovation QWL
figure 7.3 Productivity and Strategy Map Development forThree Suppliers
tomer, the productivity application indicates the ability for amanufac-
turer and/or a service provider to save time and cost for its customers.
For instance, the design of Boeing 737 (in reference to the first chap-
ter) which underlines the commonality and interoperability helps im-
prove the productivity at the assembly line while benefiting an airline
in terms of reduced training time and cost, minimizing inventory, and
lowering other logistics footprint. It is so called a win-win situation.
The case demonstration below shows how the analysis and applica-
tion of productivity to achieve this situation. This is the case of one
public agency in Thailand where productivity was clearly integrated
into service design and delivery.The impacts from this productivity im-

176 Chapter Seven
provement cover both governmental officers, citizens and the general
public.
The citizen-centered approach represents amonumental shift in the
latest public-sector reform efforts, especially in Thailand (Phusavat,
Anussornnitisarn, Comepa, Kess, & Lin, 2010). The 1997 economic cri-
sis in Asia accelerated the need to reform governmental operations.
Internal-related reforms focused on the improvement of accounting
(e.g., internal control) and human resource management (e.g., fast-
track career). In addition, the use of information and communication
technology became more integrated to daily tasks. Furthermore, ser-
vice improvement through process analysis was part of the quality and
value-for-money movements. Several regulatory requirements were
passed to ensure accountability (e.g., performance agreement) and fis-
cal responsibility (e.g., public and private partnership) in the public
sector.The use of international comparisons such as United Nations’ e-
Government Readiness and Transparency International’s Corruption
Perception has been widely integrated into planning and budget allo-
cations (Phusavat, Anussornnitisarn, Rassameethes, & Janssens, 2011).
This shift underlines the importance of performance and value cre-
ated to the citizens by public agencies. The Office of the Public Sec-
tor Development Commission (opdc), as a host agency to promote
public-sector reforms inThailand, aims to assist public agencies in this
transformation. Nowadays, the public sector is faced with new chal-
lenges such as financial constraints, demographic changes, techno-
logical innovations, productive operations, and citizens’ demands and
expectations of quality and value-for-money services. Furthermore, a
public agency is required to provide better services while maintaining
or reducing cost (Phusavat, Kruaithong, Ranjan, & Lin, 2012). For in-
stance,whenpeople canpay their credit card invoices on-line, they also
expect a similar service when paying public fees, fines, and taxes elec-
tronically. Due to free flows of information under the internet economy
and a political trend towards globalization, they reinforce the need for
public agencies to change and become more innovative.
Service improvement in the public sector inThailandhas been accel-
erated from the external influences. The context analysis, conducted
by the opdc, shows that the changes have occurred and will continue
to take place in many areas such as geography (e.g., declining and ag-
ing populations), social (e.g., migrations and life styles), economic (e.g.,
industrial growth and income distributions), and political (e.g., decen-

Productivity Analysis through Case Demonstrations 177
tralization and public-private partnership). Life styles and declining
populations in the country have inevitably results in changes in how
public services are delivered to citizens. The service satisfaction of city
dwellers is likely based on speed and convenience with more extensive
applications of information and communication technology or ict.
In Thailand, some of already-adapted examples that have been widely
practiced in private firms include on-line tax payments (i.e., 24-hour
services) and home-delivery services for passports.
The opdc was established in 2000 to help promote public-sector
reforms in Thailand. It has worked closely with Organization for Eco-
nomic Co-operation and Development or oecd Asian Centre for Pub-
lic Governance and the World Bank in the recent years in order to en-
sure continuous improvements in the Thai public sector. The opdc
has introduced contemporary concepts, tools, techniques, and prac-
tices to all public agencies. The goals for this improvement focus on
productivity, quality, and value-for-money. For the enterprise develop-
ment’s efforts within the public sector, in 2005, the opdc promoted
two important initiatives.They are knownas: (1) Service Link or sl, and
(2) Governmental Counter Service or gcs. They were intended to in-
crease convenience and comfort for citizens as well as to improve how
individual agencies could work together. Productive operations mean
that delay and waiting times for both governmental staffs and citizens
should be reduced. Service quality will subsequently achieved.
Essentially, the sl aimed to ensure citizens were no longer required
to stop at various public agencies for information and documents, and
for submitting their requests. Many agencies assigned their staffs to
ensure the realization of this one-stop concept. On the other hand,
the gcs aimed to increase service satisfaction by relocating public
agencies closer to citizens such as shopping complexes and elevated
train/subway stations.Ministry ofCommercewas thepioneer and tried
to experiment with the sl. This is due to its roles in granting licenses
and permits to private firms. Several agencies relating to operating li-
censes such as Departments of Export Promotion and of International
Trades had stationed their staffs in one location. This was expected to
help reduce thenumberof service stops that aprivatefirmhad tomake.
Thecasedemonstrationdealswith theNakhonPrathomCityDistrict
Officeor npcdo.There are several basic services beingprovidedby the
npcdo: (1) identification cards, (2) copies of household certificates,
(3) updating household members—births, deaths, move-in, (4) mar-
178 Chapter Seven
ried certificates, (5) sale licenses of fired arm and alcohols, (6) hand-
gun license, (7) temporary gambling license, and (8) building permits.
Nakhon Prathom province is regarded as an important industrial area
whereworkers have usuallymigrated fromother regions andneighbor-
ing countries.Given its proximity toBangkok,many factorieshavebeen
built for foods and agricultural-related products. Due to economic de-
velopment and urbanizations, the npcdo has had to serve a large
number ofmigrants and illegal immigrants while its registered city res-
ident had continued to grow. Previous complaints and dissatisfaction
were a lack of facility space, long waiting time, unfriendly atmosphere,
and inconvenient operating hours.
It is important to further recognize that public demands for gov-
ernmental services are generally not stable and can be unpredictable
from time to time. In fact, for some, managing the demands is proba-
blymore difficult thanmany private firms since a public agency cannot
turn down a citizen’s request. For examples, the demands for identifi-
cation cards canbehighduring election cycles at the local andnational
levels as well as during long public holidays. Furthermore, the need for
copies of household certificates appears to be high onMonday and Fri-
day. Adding to the problems on the quality of services, an increase in
budget from the Bureau of Budget has not been possible as the coun-
try’s infrastructure, education, and healthcare are more critical.
During the interview with Mr. Chokchai Dejamorntan, a former
Chief of Nakhon Prathom City District, Ministry of Interior, he men-
tioned that paradigm shift on how the public services needed to be
made in order for public agencies to become more citizen-centered.
This paradigm shift resulted in the following mindsets and changes.
1. Focus on time when citizens have to spend inside and outside
an office (e.g., parking, waiting before and after a submission of
documents, collecting all document and photos for a submis-
sion of an identification card request, etc.) represents an im-
provement in enterprise development within a public agency.
This is essential since public agencies cannot reduce fees for cit-
izens.
2. Learning from private firms such as banks, restaurants, and
hotels represents an organizational development from public
agencies. This is to ensure more proactive to ongoing changes
and expectation such as city life styles.

Productivity Analysis through Case Demonstrations 179
3. Working together with a private firm(s) for service improve-
ment is critical under the financial and resource restrictions. It
will be shown later that, in all three cases, these public agencies
opened and have operated their branch offices the shopping
malls and the private hospital without office rental fees.
Here is the summary of some of the key service improvements relat-
ing to productivity that weremade during the tenure of Mr. Dejamorn-
than at the npcdo.
• Reservation service for people who needed the public services
on Tuesday, Wednesday, andThursday. This initiative aimed to
balance the demands which were usually high on Monday and
Friday. People could call andmade an appointment.They could
go to the counter directly at the appointed time. The produc-
tivity benefits have included the better use of the district’s re-
sources (i.e., avoiding hiring additional staffs to handle high de-
mands on Monday and Friday while less work is expected on
Tuesday,Wednesday, andThursday), and the time reduction for
the general public.
• Home delivery service for people who needed to be back at
work. This initiative aimed to help people who took the lunch
break off for governmental services. Typically, they would sub-
mit the documents and waited to ensure that the submitted
document were correct. Then, they had to wait for the officers
to process their requests. It was difficult for them to wait until
their requests were completed. As a result, the home delivery
service was initiated to reduce waiting time. The productiv-
ity improvement centers on better resource allocation during
lunch hours in the officewhile reducing thewaiting time for the
general public.
• Branch office at the Big C hypermarket. This initiative aimed to
provide more convenience and to reduce the time for looking
a parking space. The branch office opened seven days in accor-
dance to the operating hours of the hypermarket. By partnering
with aprivate operator, thedistrict becomesmoreproductive in
using existing space (instead of a budget request for a newoffice
building) to provide more convenient services. In addition, the
district strengthens the ability servemore people by not having
to invest a new construction.

180 Chapter Seven
figure 7.4 Entry to the Branch Office at the Big C Hypermarket
Finally, by becoming more productive operations, one of the most
important benefits for the general public is the reduction of service
time. Mr. Dejamorntan agreed that a public agency could not reduce
the fees but could help reduce the time that citizens had to wait for
services. For examples, the time that citizens had to gather documents
before a request submission had to be taken into consideration. At the
city district office, there was a call center to help explain the docu-
ments needed for renewing a vehicle registration. The time that citi-
zens looked for a parking was also important. Contacting the city dis-
trict was not time-consuming as citizens did not have to search or wait
for an available parking.
Exercises
7.1 Visit the apqc and summarize the roles of a benchmarking clear-
inghouse in productivity and performance analysis.
7.2 Examine the importance of a strategymap and explain how it would
help strengthen productivity and performance analysis.
7.3 Study the us Government Performance and Results Act of 1993 and
the Government Management Reform Act of 1994, and outline the
requirements on performance measurement and analysis for public
agencies in the us.

Productivity Analysis through Case Demonstrations 181
7.4 Study the Skytrax (www.airlinequality.com) and compare the results
of the rating of airlines and airports. Suggest how an airline or an
airport of your choice can learn from better practices.
References and Further Reading
Helo, P., Takala, J., & Phusavat, K. (2009). Productivity measurement for
knowledge work in research and development. International Journal
of Productivity and Quality Management, 4(1), 39–54.
Kaplan, R., & Norton, D. (1996).The balanced scorecard: Translating strat-
egy into action. Cambridge, ma: Harvard Business School Press.
Kaplan, R., & Norton, D. (2004).The strategy maps. Cambridge, ma: Har-
vard Business School Press.
Kess, P., Phusavat, K., & Jaiwong, P. (2009). External knowledge:The view-
points from smes on organisational life cycles. International Journal
of Innovation and Learning, 6(1), 1–14.
Phusavat, K. (2008).University reforms: Roles of classificationon resource
allocation andmanagement. International Journal of Management in
Education, 2(3), 318–339.
Phusavat, K. (2010). Process management. In M. Pomffyova (Ed.), Process
management. In-Tech. Retrieved from http://www.intechopen.com/
articles/show/title/process-management
Phusavat, K., Anussornnitisarn, P., Comepa, N., Kess, P., & Lin, B. (2010).
Service innovation and organisational development through public-
private partnership. International Journal of Management and Enter-
prise Development, 8(4), 383–397.
Phusavat, K., Anussornnitisarn, P., Devahastin-Suthapreda, V., Kuljittipr-
asit, P. and Thamsatitdej, P. (2008). Service satisfaction through ex-
ternal knowledgemanagement. International Journal of Services and
Standards, 4(2), 182–193.
Phusavat, K., Anussornnitisarn, P., Rassameethes, B., & Janssens, G. K.
(2011). Success factors of a networked government: Learning from
Thai Health Promotion Foundation. Electronic Government, 8, (1),
103–117.
Phusavat, K., & Jaiwong, P. (2008a). Formulating the strategy map: Case
studies on smes in Thailand. International Journal of Management
and Enterprise Development, 5(1), 1–17.
Phusavat, K., & Jaiwong, P. (2008b). Strategy map with an integration of
time-lag effects. International Journal of Management and Enterprise
Development, 5(3), 370–392.
Phusavat, K., Ketsarapong, S., Ranjan, J., & Lin, B. (2011). Developing a
university classificationmodel from performance indicators. Perfor-
mance Measurement and Metrics, 12(3), 183–213.

182 Chapter Seven
Phusavat, K., Kruaithong, P., Ranjan, J., & Lin, B. (2012). Social infrastruc-
ture investments: Accounting and information systems’ roadblocks.
Electronic Government, 9(3), 277–290.
Phusavat, K., Songnisai, S., Rassameethes, B., & Kekale, T. (2008). Sustain-
ing quality management: Case study at Sanyo Semiconductor (Thai-
land). International Journal of Sustainable Economy, 1(1), 85–99.

Chapter Eight
Research in ProductivityMeasurement
The chapter focuses on potential research areas relating to productiv-
ity management. Productivity subjects have always gathered a great
deal of interests among several researchers. Productivity and business
strategies have been advocated so that long-term business competi-
tiveness can be achieved. Past research has concentrated on how pro-
ductivity information could be used and analyzed to strengthen oper-
ational and organizational competitiveness. Previous research on pro-
ductivity measurement has often dealt with new approaches and sur-
rogates to ensure the accuracy and reliability of information (Phusa-
vat, Anussornnitisorn, Sujitwanit, & Kess 2009). Exploring a new alter-
native for productivity measurement which is more cost effective and
user friendly has been one of the primary objectives for the academic
studies.
Despite the usefulness of current accounting ratios such as return
on assets, the need for better information under changing business
environment continues (Phusavat, Jaiwong, Sujitwanit, & Kanchana
2009). The trends such as outsourcing, near-sourcing, brand value, in-
tellectual capital have highlighted more studies on how to better cap-
ture productivity information within an organization (Phusavat, Nil-
maneenava, Kanchana, Wernz, & Helo 2012). Several surrogates have
been testedwithin the context of productivity such as innovation, qual-
ity work life, and profitability.
Three research studies are presented in this chapter.The first one re-
lates to the interrelationships betweenproductivity and organizational
strategies. In this research, the surveys are applied to help gather the
opinions from the executives. These opinions relate suitable measure-
ment areas with organizational strategies on operations and supplier
selection. In other words, this study describes when to measure pro-
ductivity. The second research shows the study on key consideration
factor when attempting to identify productivity measures for an orga-
nization. The last research deals with the implications of value-added
productivity measurement in an organization. The interpretations of
183

184 Chapter Eight
information from value-added productivity are highlighted with the
lessons learned in the sugar business.
In conclusion, the term productivity constantly receives a lot of at-
tentions from researchers and practitioners alike due to its impacts on
short-and long-term business competitiveness. From the national to
individual level, productivity has been an integral part of an organiza-
tion’s policy and strategic objective. Cost-effective operations through
productivity improvement continue to be a firm’s business aspiration
(Phusavat, 2010; Phusavat, Fankham-ai, Haapasalo, & Lin, 2011. Given
the continuous increase in labor cost, fuel price, taxes, expenses re-
lating to regulatory compliance, and fluctuation in a foreign exchange
rate which influence a price of a rawmaterial, becomingmore produc-
tiveness is often used as a business objective for many organizations.
The simple ratio of output divided by inputwhichwas introducedmore
than one hundred years old will continue to play an important role in
importantbusinessdecisions fromnewproductdevelopment, location
selection, expansion, partnership development, investment, human re-
source management, sequencing and scheduling, layout design, and
service delivery.
Productivity Measurement and Business Strategies
The research aims to increase fundamental knowledge on productiv-
ity management. The objective is to increase the knowledge on when
to measure productivity in addition to existing awareness on what-to-
measure, where-to-measure, and how-to-measure (Phusavat, Rapee, &
Lin, 2009). This is expected to improve an understanding on produc-
tivity measurement by linking it with organizational strategies. In ad-
dition, the key question representing the research’s premise is whether
there is a specific circumstance that productivity becomes more im-
portant than other business objectives. The primary expected benefit
is to strengthen existing knowledge on productivity measurement—
what, how, and where to measure.
Several steps were completed for this study which took place in
2007 (Figure 8.1). There were a survey development, survey distribu-
tions, analysis, and follow-up discussion on the findings. The devel-
opment of a survey focused on three main areas. The first area rep-
resented six strategic objectives for manufacturing operations; i.e.,
quality, customer-focus, delivery, flexibility, know-how, and costs. The
second area addressed the set of strategies perceived to be critical for

Research in Productivity Measurement 185
ManufacturingStrategies
Supplier-Selection Strategiesfor Maintenance Services
ProductivityMeasurement
SurveyDevelopment
Literaturereview
Circumstances
Grouping: Circumstanceand Productivity
Conclusion
– One-way ANOVA TestCorrelation Analysis –
– Correlation Analysis
– Review and Discussion
figure 8.1 Research Methodology
successful supplier selection in the maintenance services. The reason
was that these services directly impact the levels of operational perfor-
mance. In other words, the strategies for supplier selection indicated
the perceived high-impact areas which had contributed a success or
failure ofmanufacturing strategies.Therewere a total of seven strategic
criteria for this second part (i.e., quality, cost, delivery, responsiveness,
management, technical services, and environment/safety). The third
area concentrated on the perception of top executives on the impor-
tance of productivity when they deploy manufacturing and supplier-
selection strategies. Productivity ratios included an average lead time,
inventory turnover,mean time to repair, andmean timebetweenmain-
tenance.
The next step involved a survey distribution to companies. To com-
plete the survey, top executives were asked to respectively rank the im-
portanceof strategic objectives for theirmanufacturingoperations and
supplier selection. In addition, theywere asked to rate their opinionson
productivity relatively to the level of criticality when deploying man-
ufacturing and supplier-selection strategies. The survey was designed

186 Chapter Eight
table 8.1 Survey Questions on Manufacturing Strategies
Strategies Rating*
Quality
Low defect rate 5 4 3 2 1
Product performance 5 4 3 2 1
Reliability 5 4 3 2 1
Environmental aspect 5 4 3 2 1
Certification 5 4 3 2 1
Cost 5 4 3 2 1
Low costs 5 4 3 2 1
Value added costs 5 4 3 2 1
Quality costs 5 4 3 2 1
Activity based measurement 5 4 3 2 1
Continuous improvement 5 4 3 2 1
Delivery
Fast delivery 5 4 3 2 1
On agreed time 5 4 3 2 1
Right quality 5 4 3 2 1
Right amount 5 4 3 2 1
Dependable promises 5 4 3 2 1
Flexibility 5 4 3 2 1
Design adjustments 5 4 3 2 1
Volume change 5 4 3 2 1
Mix changes 5 4 3 2 1
Broad product line 5 4 3 2 1
Customer-focus
After-sales service 5 4 3 2 1
Product customization 5 4 3 2 1
Product support 5 4 3 2 1
Customer information 5 4 3 2 1
Measurement of satisfaction 5 4 3 2 1
Dependable promises 5 4 3 2 1
Continued on the next page
with a five-point scale from 1 (least importance) to 5 (extremely impor-
tance). The following step was to analyze the surveys’ responses sta-
tistically with a correlation analysis. The correlation analysis is carried
out to examine both manufacturing and supplier-selection strategies.
At this stage, possible circumstances between both strategies would

Research in Productivity Measurement 187
table 8.1 Continued from the previous page
Strategies Rating*
Know-how
Knowledge management 5 4 3 2 1
Creativity 5 4 3 2 1
Continuous learning 5 4 3 2 1
Problem solving skills 5 4 3 2 1
Training/education 5 4 3 2 1
r&d 5 4 3 2 1
notes * 5—high, 1—low.
emerge. For this study, the positive correlation implied that both strate-
gies were complimentary—indicating that the perception by top exec-
utives that strategic criteria chosen for supplier selection would pos-
itively influence the ability to achieve strategic objectives for manu-
facturing operations. Afterwards, the correlation analysis was again
applied to determine the relationship between the circumstances and
productivity—the secondstage.Then, the follow-upsessionswith some
of survey participants were conducted to help confirm the study’s find-
ings.
The surveys were distributed to 100 companies in early 2007. They
operated within four major industrial clusters; i.e., automotive, elec-
tronics, food, and petro-chemical. Forty surveyswere returned. Among
them, 32.50 % of responses belonged to the automotive and auto parts
industry, while 27.50%, 22.50%, and 17.50% were from food, electrical
and electronics, and petrochemical industries respectively. 57.5% of re-
spondents had more than 500 full-time employees. A majority of re-
spondents were locally owned. 75% of participating executives had
more than 25 years of business experiences. The titles of the respon-
dents are General Manager (30.00%), Factory Manager (27.50%), Man-
agingDirector (20.00%), PurchasingManager (12.50%), andProduction
Manager (10.00%).
For manufacturing strategies, the respondents were asked to rank
the importance of six strategic objectives and their respective dimen-
sions. The findings showed that the top three competitive priorities
are: (1) delivery, (2) quality, and (3) customer-focus.They indicated that
faster and reliabledeliveriesbecome themost importance. Better prod-
uct/service quality and superior in customer service follow this deliv-
ery.These initial results on manufacturing strategies were further sub-

188 Chapter Eight
table 8.2 Survey Questions on Supplier-Selection Strategies for Maintenance
Services
Strategies Rating*
Quality
Product performance 5 4 3 2 1
Product reliability 5 4 3 2 1
Product conformance 5 4 3 2 1
Cost
Competitive prices 5 4 3 2 1
Payment terms flexibility 5 4 3 2 1
Price adjustment provisions 5 4 3 2 1
Delivery
Delivery lead-time 5 4 3 2 1
Delivery staff performance 5 4 3 2 1
Shipment condition 5 4 3 2 1
Responsiveness
Prompt response to request 5 4 3 2 1
Labor flexibility 5 4 3 2 1
Machine flexibility 5 4 3 2 1
Management
Quality management system 5 4 3 2 1
Performance history 5 4 3 2 1
Warranties and claims polices 5 4 3 2 1
Flexible contracts terms and conditions 5 4 3 2 1
Technical Service
Technical support available 5 4 3 2 1
Design Capability 5 4 3 2 1
Technical problem solving ability 5 4 3 2 1
Environmental and Safety Aspects
Environmental management systems 5 4 3 2 1
Insurance provision 5 4 3 2 1
notes * 5—high, 1—low.
jected to the one-way anova test. This task helped assess whether
there was a significant difference among the four industrial types with
the Alphas value of 0.01.
h0 The results on the ranking among strategic objectives had no
significant difference among the industries.
h1 The results on the ranking among strategic objectives had
significant differences at least two industries.

Research in Productivity Measurement 189
table 8.3 Survey Questions on Perceived Importance of Productivity
Productivity Rating*
Average lead time 5 4 3 2 1
Inventory turnover 5 4 3 2 1
Mean time to repair (mttr) 5 4 3 2 1
Mean time between failures (mtbf) 5 4 3 2 1
notes * 5—high, 1—low.
table 8.4 Results on Manufacturing Strategies
Strategic objectives Mean Std. dev. Rank p-value
Delivery 4.460 0.693 1 0.935
Quality 4.340 0.676 2 0.992
Customer-focus 4.133 0.848 3 0.402
Cost 4.130 0.829 4 0.951
Know-how 4.029 0.850 5 0.959
Flexibility 3.950 0.759 6 0.975
notes Significant at the 0.05 levels.
The test showed that therewas no significant difference among com-
panies across the four industries. For instance, the statistical results in-
dicated that there was no significant difference on the delivery priority
among the four industries (i.e., p-value = 0.935 which was greater than
Alpha of 0.01—so it failed to reject h0).
Thesupplier-selection strategiesonmaintenance services supported
the efforts on manufacturing operations. Respondents were asked to
rank the importance of their supplier selection in when outsourcing
their maintenance services. The top priorities were delivery and qual-
ity.Theone-way anova was also applied to testwhether the responses
were significantly different among participating firms across the four
industries. The results showed that there was no difference.
For the identification of possible circumstances derived ( from the
interrelationships betweenmanufacturing and supply-selection strate-
gies), the correlation analysis was adopted. For this study, a positive
correlation implied the complimentary perceived by top executives
among these strategies. Due to the ordinal data (i.e., opinions and per-
ception), the Spearman Rank correlation was used at the significant
level of 0.05—reflecting a wider area for acceptance than the 0.01 level.
Altogether, there were a total of nine circumstances.
The next important task was to match the nine circumstances with
the level of importance on productivity measurement perceived by top

190 Chapter Eight
table 8.5 Results on Supplier-Selection Strategy for Maintenance Service
Strategic objectives Mean Std. dev. Rank p-value
Delivery 4.375 0.841 1 0.493
Quality 4.358 0.719 2 0.939
Responsiveness 4.250 0.770 3 0.363
Management 4.163 0.708 4 0.529
Cost 4.050 0.829 5 0.119
Environment & safety 4.013 0.907 6 0.059
Technical-service 3.992 0.921 7 0.528
notes Significant at the 0.05 levels.
table 8.6 Correlation Analysis between Manufacturing and Supplier Selection
Strategies
Manufacturing Maintenance services
(1) (2) (3) (4) (5) (6) (7)
(1) Delivery 0.264 0.404* 0.095 0.344* 0.095 0.144 –0.054
(2) Quality 0.280 0.407* 0.242 0.282 0.169 0.062 –0.076
(3) Customer-focus 0.405* 0.410* 0.243 0.374* 0.428* 0.258 0.217
(4) Cost 0.286 0.281 0.241 0.281 0.199 0.028 0.078
(5) Know-how 0.236 0.357* 0.240 0.316* 0.246 0.085 0.216
(6) Flexibility 0.087 0.267 0.003 –0.116 0.149 0.041 –0.105
notes Column headings are as follows: (1) delivery, (2) quality, (3) responsiveness,
(4) management, (5) cost, (6) environment/safety, (7) technical service.
table 8.7Circumstances between
Manufacturing and
Supplier-Selection Strategies
notes Column headings
are as follows: (1) Circum-
stances with complimentary
relationships, (2) manufactur-
ing, (2) maintenance services.
(1) (2) (3)
1 Delivery Quality
2 Delivery Management
3 Quality Quality
4 Customer-focus Delivery
5 Customer-focus Quality
6 Customer-focus Management
7 Customer-focus Cost
8 Know-how Quality
9 Know-how Management
executives. The correlation analysis was again applied. The results in-
dicated that all nine circumstances had a strong correlation with. The
explanation of when tomeasure productivity, based onmanufacturing
and supplier-selection strategies, is illustrated in Table 8.8.

Research in Productivity Measurement 191
table 8.8Correlation Analysis
between Circumstances
and Productivity
notes *Correlation
significance at 0.05.
Circumstances Productivity
1 Manufacturing: Delivery 0.344*
Supplier-selection: Quality 0.342*
2 Manufacturing: Delivery 0.344*
Supplier-selection: Management 0.551*
3 Manufacturing: Quality 0.274*
Supplier-selection: Quality 0.405*
4 Manufacturing: Customer-focus 0.433*
Supplier-selection: Delivery 0.611*
5 Manufacturing: Customer-focus 0.433*
Supplier-selection: Quality 0.405*
6 Manufacturing: Customer-focus 0.433*
Supplier-selection: Management 0.551*
7 Manufacturing: Customer-focus 0.433*
Supplier-selection: Cost 0.580*
8 Manufacturing: Know-how 0.388*
Supplier-selection: Quality 0.405*
9 Manufacturing: Know-how 0.388*
Supplier-selection: Management 0.551*
The illustrations of the scattering plots of the first circumstance: (1)
delivery frommanufacturing strategies and productivity, and (2) qual-
ity from supplier-selection strategies and productivity is shown in Fig-
ures 8.2, 8.3, and 8.4.
In summary, this study revealed the following. There were nine cir-
cumstances that productivity measurement was needed. These find-
ings were derived from two strategic objectives—manufacturing oper-
ations and supplier-selection for maintenance services. They were an-
alyzed in a two-stagemanner by the correlation analysis.Thefirst stage
was to identify a circumstance that illustrated the complimentary
relationships between manufacturing and supplier-selection strate-
gies. They were a total of nine circumstances. The second stage was to
match each circumstance with productivity. Apparently, all nine cir-
cumstances appeared to correlate strongly with the perceived impor-
tanceonproductivity. For instance, basedon thefirst circumstance, the
description from the study is as follows. When delivery was selected
as a manufacturing strategy and quality was chosen as a supplier-
selection strategy for maintenance services, productivity measure-
ment was needed for an effective management process.

192 Chapter Eight
11
2
2
3
3
4
4
5
5
� �
�
�
��
��
��
��
�
�
�
�
�
�
�
�
�
figure 8.2 Scattering Plot between
Delivery and Quality
11
2
2
3
3
4
4
5
5
�
� �
�
�
�
�
�
�
�
�
�
�
�
�
�
�
�
�
�
�
�
�
�
�
�
�
figure 8.3 Illustration of Scattering
Plot between Delivery and
Productivity for
Circumstance 1
11
2
2
3
3
4
4
5
5
�
��
�
�
�
�
�
�
�
�
�
�
�
�
�
�
�
�
�
�
�
�
figure 8.4 Illustration of Scattering
Plot between Quality and
Productivity
for Circumstance 1
table 8.9 Summary onWhen-to-Measure Productivity
Manufacturing Supplier Selection for Maintenance Services
(1) (2) (3) (4) (5) (6) (7)
(1) Delivery — ] — ] — — —
(2) Quality — ] — — — — —
(3) Customer-focus ] ] — ] ] — —
(4) Cost — — — — — — —
(5) Know-how — ] — ] — — —
(6) Flexibility — — — — — — —
notes Column headings are as follows: (1) delivery, (2) quality, (3) responsiveness,
(4) management, (5) cost, (6) environment/safety, (7) technical service.
For the follow-up sessions, participating executives agreed with the
findings, especially those who rated that a customer-focus as their im-
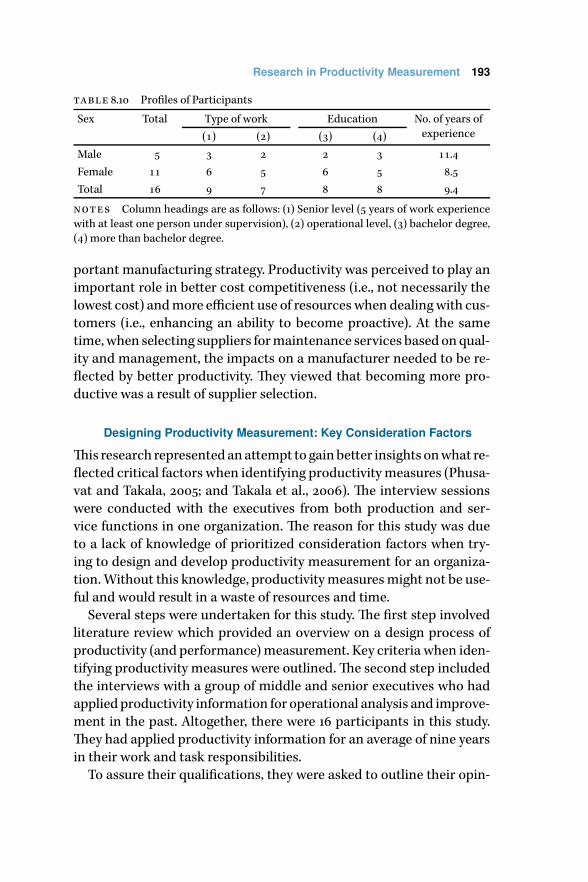
Research in Productivity Measurement 193
table 8.10 Profiles of Participants
Sex Total Type of work Education No. of years of
experience(1) (2) (3) (4)
Male 5 3 2 2 3 11.4
Female 11 6 5 6 5 8.5
Total 16 9 7 8 8 9.4
notes Column headings are as follows: (1) Senior level (5 years of work experience
with at least one person under supervision), (2) operational level, (3) bachelor degree,
(4) more than bachelor degree.
portant manufacturing strategy. Productivity was perceived to play an
important role in better cost competitiveness (i.e., not necessarily the
lowest cost) andmore efficient use of resourceswhen dealingwith cus-
tomers (i.e., enhancing an ability to become proactive). At the same
time,when selecting suppliers formaintenance services based onqual-
ity and management, the impacts on a manufacturer needed to be re-
flected by better productivity. They viewed that becoming more pro-
ductive was a result of supplier selection.
Designing Productivity Measurement: Key Consideration Factors
This research representedanattempt to gainbetter insights onwhat re-
flected critical factors when identifying productivitymeasures (Phusa-
vat and Takala, 2005; and Takala et al., 2006). The interview sessions
were conducted with the executives from both production and ser-
vice functions in one organization. The reason for this study was due
to a lack of knowledge of prioritized consideration factors when try-
ing to design and develop productivity measurement for an organiza-
tion.Without this knowledge, productivitymeasuresmight not be use-
ful and would result in a waste of resources and time.
Several steps were undertaken for this study. The first step involved
literature review which provided an overview on a design process of
productivity (and performance)measurement. Key criteria when iden-
tifying productivity measures were outlined.The second step included
the interviews with a group of middle and senior executives who had
applied productivity information for operational analysis and improve-
ment in the past. Altogether, there were 16 participants in this study.
They had applied productivity information for an average of nine years
in their work and task responsibilities.
To assure their qualifications, they were asked to outline their opin-

194 Chapter Eight
ions on what constituted effective productivity measures. The results
were as follows: (1) reliability, (2) ability to point out strength andweak-
ness, (3) easy to understand, (4) ability to cover various processes, (5)
ability to provide information for the comparisons with others, (6) ac-
ceptance ofmanagement, (7) transparent, (8) ability to link to financial
management, (9) ability to reflect efficiency and effectiveness, (10) abil-
ity to link with other relevant subjects such as quality of work life, (11)
cost-effective data collection process.
The third step dealt with the application of the Analytic Hierarchi-
cal Process or ahp. It is important to note the following. The ahp is
a multi-attribute decision tool. It integrates the results (in this case,
theopinions fromtheparticipants)withpair-wise comparisons. Essen-
tially, there are three principles underlying the ahp: (1) the principle of
constructing hierarchy, (2) the principle of establishing priorities, and
(3) the principle of logical consistency.The ahp dependsmainly on the
experience of theparticipants. Finally, the last stepwas to interpret and
describe the ahp results inorder toprioritizedesign consideration fac-
tors.The Sand Cone Concept was adapted for this step.This concept is
based on the analogy of a sand cone in which consists of three layers.
The bottom layer represents the most important foundation while the
top andmiddle layers become less significant respectively (Phusavat et
al., 2011).
Based on the literature reviews, there were seven criteria commonly
cited for key consideration when identifying productivity measures
(Helo, Takala, & Phusavat, 2009). The reliability of a measure indicates
that the information accurately reflect what it intends to capture. The
term strategic congruence implies that a measure supports a business
strategy of a company. The term measurement coverage shows that a
measure provides a broad picture that reflects key features in an op-
eration. The ability to support different types of work illustrates that a
measure can provide useful information for managers and staffs alike.
The user acceptance is highly important for executives (to referred to
as a measurer) and for staffs who are responsible for operations (to be
referred to as a measure). The last design criterion involved the sim-
plicity when deploying a measure.
All seven design criteria were presented to all 16 participants. This
task involved the use of the ahp to help prioritize the seven design
criteria. Note that the ahp helped arrange these criteria into a hier-
archic order, assisted in assigning the numerical values to subjective

Research in Productivity Measurement 195
table 8.11 Prioritization on Design Criteria
Design criteria (1) (2) (3)
1. Reliability 24% 18% 35%
2. Strategic congruence 16% 18% 13%
3. Measurement coverage 14% 14% 13%
4. Ability to support different type of work 13% 13% 13%
5. User acceptance—measurer 13% 13% 11%
6. User acceptance—measuree 13% 15% 10%
7. Measurement simplicity 7% 8% 5%
Total 100% 100% 100%
Consistency ratio 0.8% 1.1% 3.4%
notes Column headings are as follows: (1) overall, (2) senior staff, (3) operational
staff.
table 8.12 impl Results
Design criteria (1) (2) (3)
1. Reliability 0.43 0.29 0.30
2. Strategic Congruence 0.30 0.27 0.38
3. Measurement coverage 0.72 0.81 0.67
4. Ability to support different type of work 0.50 0.56 0.43
5. User acceptance—measurer 0.80 0.72 1.06
6. User acceptance—measuree 0.58 0.54 0.63
7. Measurement simplicity 1.59 1.69 0.92
notes Column headings are as follows: (1) overall, (2) senior staff, (3) operational
staff.
judgments on the relative importance of each criterion, and finally syn-
thesized this judgment to determine which design criterion would re-
ceive the highest priority (Table 8.11).
In regard to the consistency of the surveys, these priorities (or pri-
oritized design criteria) were obtained with the 0.8% consistency ratio.
This was considered to be excellent to the standard of 20% for the size
of 10–30 participants. Furthermore, Saaty (2001) stated that the 10% or
less was acceptable. The implementation index (impl) was also used.
The impl was derived by dividing standard deviation by the priority of
that aspect (also known as a variability coefficient). The lower the in-
dex represented to the higher the reliability of the priority of that char-
acteristic. All impls were lower than the acceptable level of 1.0 with
the lowest indexes placed on reliability and strategic congruence (Ta-
ble 8.12).

196 Chapter Eight
table 8.13 Weight Assigned on the Set of Design Criteria
Design criteria Weight
1. Reliability 24%
2. Strategic Congruence 16%
3. Measurement coverage 14%
4. Ability to support different type of work 13%
5. User acceptance—measurer 13%
6. User acceptance—measuree 13%
7. Measurement simplicity 7%
The discussion sessions were held with the research’s participants.
The Sand Cone analogy was clearly explained. It was decided that the
first two design criteria which received the highest priority would be
the foundation—so called the must-have group. Then, the lowest pri-
oritized criterion would be classified as the option. It was referred to
as the nice-to-have group. The remaining four design criteria would
be categorized as the support group. It was called as the should-have
group.
To ensure that the results from the sand cone analogy were applica-
ble, four interviewswith themanufacturing firms in bothThailand and
Finland were conducted. These firms were part of small and medium
enterprises which required an effective productivity measurement sys-
tem. First of all, they shared the similar opinions on the importance
of design consideration. They believed that the terms reliability and
strategic congruence were indeed critical when identifying productiv-
ity measures.
The managing directors and executives from these four firms also
agreed that implementing ready-to-make measures would not be very
helpful despite their suitability for large firms. As a result, an identifica-
tion of productivity measures was important to their businesses. New
products, new technology, and new staffs were one of many reasons
that their companies had constantly reviewed productivity measures.
They found that by classifying the design criteria into the sand cone
model, theywould be able to identify productivitymeasures thatwould
benefit a company’s operations (Figure 8.5).
Finally, the research enhances an understanding on productivity
measurement by addressing the issues relating to design consideration
when identifying productivity ratios. The proposed design criteria are
prioritized from the premise that productivitymeasurement should be
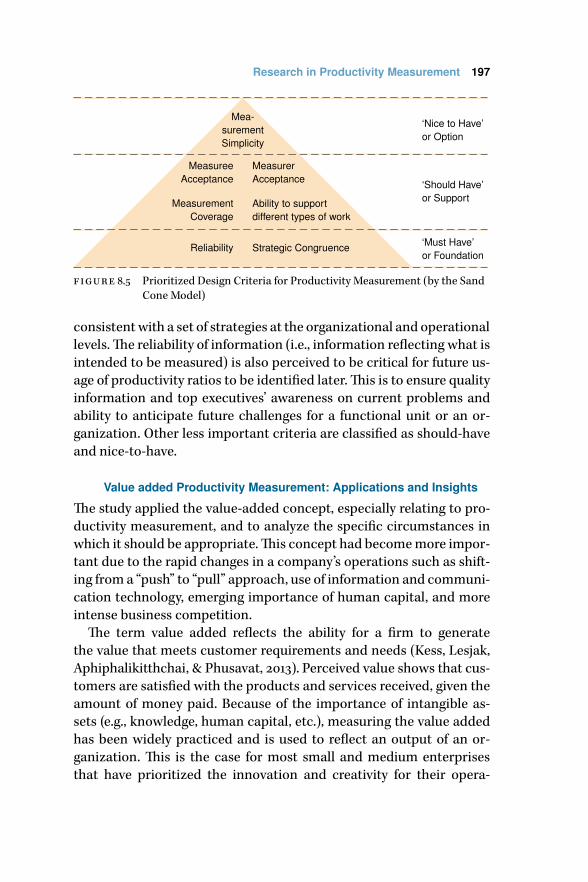
Research in Productivity Measurement 197
Mea-surementSimplicity
MeasurerAcceptance
MeasureeAcceptance
Ability to supportdifferent types of work
MeasurementCoverage
Strategic CongruenceReliability
‘Nice to Have’or Option
‘Should Have’or Support
‘Must Have’or Foundation
figure 8.5 Prioritized Design Criteria for Productivity Measurement (by the Sand
Cone Model)
consistentwith a set of strategies at the organizational and operational
levels.The reliability of information (i.e., information reflecting what is
intended to be measured) is also perceived to be critical for future us-
age of productivity ratios to be identified later.This is to ensure quality
information and top executives’ awareness on current problems and
ability to anticipate future challenges for a functional unit or an or-
ganization. Other less important criteria are classified as should-have
and nice-to-have.
Value added Productivity Measurement: Applications and Insights
The study applied the value-added concept, especially relating to pro-
ductivity measurement, and to analyze the specific circumstances in
which it should be appropriate.This concept had becomemore impor-
tant due to the rapid changes in a company’s operations such as shift-
ing from a “push” to “pull” approach, use of information and communi-
cation technology, emerging importance of human capital, and more
intense business competition.
The term value added reflects the ability for a firm to generate
the value that meets customer requirements and needs (Kess, Lesjak,
Aphiphalikitthchai, & Phusavat, 2013). Perceived value shows that cus-
tomers are satisfied with the products and services received, given the
amount of money paid. Because of the importance of intangible as-
sets (e.g., knowledge, human capital, etc.), measuring the value added
has been widely practiced and is used to reflect an output of an or-
ganization. This is the case for most small and medium enterprises
that have prioritized the innovation and creativity for their opera-

198 Chapter Eight
tions, including new product development and process improvement.
Due to the constant changes in a company’s operations such as shift-
ing from a “push” to “pull” approach, use of information and communi-
cation technology, emerging importance of human capital, and more
intense business competition; measuring a company’s value added ap-
pears inevitable. The reason is that it indicates its innovativeness and
long-term competitiveness (Lee et al., 2011). In general, value-added
productivity measurement has been widely utilized in the competitive
markets over thepast decades.On theother hand, for those conducting
the businesses in a less-openmarket (e.g., regulated or semi-controlled
markets), the problem remains whether the value added productivity
measurement should be used.
Given the circumstance aforementioned, the overall objectives of
this researchwere to apply the value added (especially value addedpro-
ductivitymeasurement) and toanalyze the specific conditions inwhich
the measurement information can be analyzed. This analysis focused
on the usefulness of the value added concept and value added pro-
ductivity information for the executives and what conditions it should
be further applied. Simply put, this research dealt the following ques-
tions.When the value- added productivity measurement should be ap-
plied? What conditions would be suitable for its applications? More-
over, the researchhighlighted the importanceof the value addedwithin
themanagement process and its emergingneed topromote innovation
and creativity within an organization.
For the company under study, it is the large sugar refinery plant
which is located in the northeast region of Thailand. This company
is currently trading in the Stock Exchange of Thailand. It is part of the
large conglomerate which has expanded its business areas covering
agriculture, foods, and energy areas. ForThailand’s agricultural sector,
the cane and sugar industry is one of the largest in terms of size and
export value. Due to the growing competition from neighboring coun-
tries such as India, Vietnam, and Indonesia, there is an urgent need to
ensure that the industry remains productive and competitive for the
foreseeable future.
For this study, the value added was measured the effectiveness of
production activities and dealt with the fairness in distribution eco-
nomic gains brought about by the gains in efficiency. It had been an
integral part of a company since the value added could blend the data
from current accounting practices. In other words, the value added

Research in Productivity Measurement 199
would indicate how well a firm could add positive value its outputs.
The value added equation for the research was that as follows.
Value added= Sales−Cost of Goods Sold−Depreciation.
The research involved company selection, data collection ( from
Stock Exchange of Thailand), regression and statistical analyses, the
discussion of the findings with the company executive, and the con-
clusion. The company under study was a large sugar refinery plant lo-
cated in the Northeast region of Thailand. This selection was based
on the strong growth of Thailand’ sugar industry which has to deal
with emerging competition from neighboring countries such as Viet-
nam and Indonesia. There were several statistical techniques applied;
namely Pearson Correlation, Factor Analysis, andMultiple Regression.
The interpretation of the findings was part of this step. Then, the in-
terview was to be conducted with the company’s executive to evaluate
how productivity information was viewed.
The company under study had been successfully in the sugar indus-
try and enjoyed the business growth over the past decade.Thedatawas
collected though the company’s financial reports released by the Stock
Exchange ofThailand.The following information was value-added and
the profit from Year 2005 (representing the first year of the company’s
entry into the Stock Exchange ofThailand) until 2011.The company un-
der study is a large sugar refinery plant located in the northeastern,
western, and eastern region ofThailand, is based on the strong growth
of Thailand’ sugar industry which has to deal with emerging competi-
tion from neighboring countries such as Cambodia, Vietnam and In-
donesia.
Then, an attempt was made to examine the interrelationships be-
tweenproductivity andprofitability. Indicators tobeused in this exami-
nationwerebasedon several studies andwere similar to the framework
suggested by Asian Productivity Organization andThailand Productiv-
ity Institute.
The primary aim for applying the regression analysis was to examine
the possible impacts from achieving high value-added productivity on
the company’s financial performance.
The next step involved the use of Pearson Correlation Test which
helps assess the linear relationships between the two variables—how
individual variableswould relate to theprofitability and interact among
themselves. If the relationship between two variables was linear, the

200 Chapter Eight
table 8.14 Partial Illustration of Data for the Company under Study (mio Baht)
Description 2005 2006 2007
Sales 5,213 6,086 8,468
Cost of goods sold 4,046 4,681 6,629
Depreciation 162 232 317
Net profit 459.11 678.95 835.86
Annual expense 4,897.66 5,441.66 7,428.15
Rawmaterials cost 3,396.50 4116.15 4,972.60
Labor cost 488 544 636
Selling and administrative expense 549.79 301.00 834.64
Average number of employees* 2,577 2,885 3,391
Average total capital 8,288.58 9,732.82 12,365.22
Average tangible fixed asset 5,586 6,494 8,351
notes *Persons.
table 8.15 Illustrations of Value Added and Profits from the Company under Study
Indicators* 2005 2006 2007 2008 2009 2010 2011
Value added 1,006.00 1,173.00 1,523.00 2,306.00 2,400.00 2,437.00 4,134.00
% change — 16.61 29.85 51.37 4.08 1.53 69.67
Profit 495.11 678.95 835.86 859.53 900.70 76.81 2032.20
% change — 37.13 23.11 2.83 4.79 –91.47 2545.71
notes *Million Baht.
table 8.16 Key Variables for Examining the Interrelationships between
Productivity and Profitability
Variables Formulation
x1; Labor Productivity = Value Added ÷ Number of Employees
x2; Wage Level = Personal Cost ÷ Number of Employees
x3; Labor Share = Personal Cost ÷ Value Added
x4; Total Capital Productivity = Value Added ÷ Average Total Capital
x5; Capital Intensity = Average Total Capital ÷ Number of Employees
x6; Value Added Ratio = Value Added ÷ Sale
x7; Capital Utilization Ratio = Sale ÷ Average Total Capital
x8; Capital Shares = Profit ÷ Value Added
y ; Profitability = Profit ÷ Average Total Capital
correlation would approach the value of one or 1.0. Two variables with
the non-zero value would be described as having the correlations. The
PearsonCorrelationCoefficient used in this studywas set at 0.70 due to
the limited data. In other words, if the Pearson Correlation Coefficient

Research in Productivity Measurement 201
table 8.17 Information from Key Indicators (Variables)
Variables* 2005 2006 2007 2008 2009 2010 2011
x1 0.39 0.41 0.45 0.66 0.56 0.73 1.23
x2 0.40 0.29 0.43 0.49 0.43 0.47 0.67
x3 103.1 71.99 96.51 64.53 76.34 64.88 54.25
x4 12.14 12.05 12.32 14.94 12.78 11.18 16.73
x5 3.22 3.37 3.65 4.43 4.40 6.53 7.35
x6 19.30 19.28 17.99 21.41 20.87 20.39 25.39
x7 62.90 62.53 68.49 69.78 61.25 54.85 65.91
x8 49.22 57.88 54.87 37.28 37.53 3.15 49.16
y 5.97 6.98 6.76 5.57 4.80 0.35 8.23
notes * See Table 8.16.
table 8.18 Results from the Pearson Correlations
x1 x2 x3 x4 x5 x6 x7 x8 y
y 0.11 0.13 0.12 0.58 [0.24] 0.23 0.76 0.94 1.00
between the two variables happened to be less than 0.70, the two vari-
ables would be described as having a low level of the co-relationship. If
the Pearson Correlation Coefficient between two variables was greater
than or is equal to the value of 0.70, these variables would have a linear
relationship. Note that the results only show the absolute value.
Based on the findings, the results clearly demonstrated the relation-
ship between x7 and y , and x8 and y . In other words, the Capital Utiliza-
tion and Capital Share appeared to have the linear relationships with
the profitability level of the company under study.The next task was to
develop a regression to determine which variable influences the prof-
itability level more. This step was critical as the study aimed to extend
information fromvalueaddedproductivitymeasurement into theanal-
ysis stage. In this case, it appeared that Capital Share significantly im-
pacted the profitability level. The value added was also embedded in
both the Capital Share and Profitability. It showed that the value added
played an important role in ensuring business success.
The above results showed that blending the value added concept
with productivity and financial performance of an organization was
possible. In addition, the information from having blended the value
added (including value added productivity) pointed to useful insights
into how the company’s performance would be managed.
Interestingly, during the discussion, the company’s executive sug-

202 Chapter Eight
table 8.19 Results of Regression Analysis
Parameter Regression model p-value Adj-R2
y = −0.0456+0.0495x7+0.130x8 0.001*** 98.40%
Predictor Coefficient p-value vif
Constant –0.0456 0.112 —
Capital utilization ratio (x7) 0.0495 0.279 2.034
Capital’s share (x8) 0.1300 0.001*** 2.178
notes *** Significance at the 0.001 level.
table 8.20 Demonstration of the Quadratic Equation Model
Parameter Relationships p-value Adj-R2
y = −0.0030+0.1968x8−0.114x28 0.009** 85.70%
86%
8.12%
0%
1%
2%
3%
4%
5%
6%
7%
8%
9%
10% 20% 30% 40% 50% 60% 70% 80% 90% 100%�
�
�
�
�
�
�
�� �
�
figure 8.6 Interrelationships between Capital Share (x8) and Profitability (y)
gested a possible extension of information analysis. As a result, the
Quadratic Regression Model was applied. Note that, when adding 1%
of capital’s share, the profitability level was expected to be increased by
0.13%.The quadratic equation model showed the maximum profitabil-
ity would be at 8.12% when the capital share’s value was at 86%. This
extension pointed to the need to apply statistical analysis more com-
prehensive so that information can be help for managerial evaluation
and decision (Figure 8.6).
The interview session was conducted with the company’s major
boardmember. Fromthis interviewsession,many lessonswerepointed
out and learned, especially with respect to the use of value-added pro-
ductivity measurement. Essentially, the concept of value-added pro-
ductivity was needed for all companies operating in the competitive

Research in Productivity Measurement 203
and open markets. It was also agreed that, regardless of the products
or and services, the concept value-added became prevalent among
the companies today. It indicated how well a firm was able to keep
up with customer requirements and expectation which explicitly im-
plied intensive use of human capital and other technology for con-
stant changes and improvement in its products, services, and work
processes.
By combining the valueaddedwithproductivity (i.e., substituting the
outputs with the value added while dividing it with key input factors),
it could help underline the importance of both terms to business oper-
ations, especially from the financial standpoint. Simply put, measuring
value-added productivity provided useful feedback and information,
and needed to be encouraged more in the future. Despite a strong en-
dorsement by the company’s executive, there were more insights into
and careful consideration during the deployment of the value-added
productivity in a firm.
Whenoperating in a regulated or controlledmarket, the significance
of measuring value-added productivity can become less. The reason is
that, from the company viewpoint, the sugar is subjected to price con-
trol jointly managed by the farmer groups (associations and coopera-
tives), sugar producers, and Office of the Cane and Sugar Board (under
Ministry of Industry). As a result, cost control and management (a.k.a.
cost reduction) plays more critical roles than an attempt to add value
to the sugar products.
It is the nature of the sugar industry that the attempt to add more
value toby-products fromthe sugarproductionhasbeenmadeover the
years, includingmolasses ( for beverages andalcohols), ethanol for fuel,
bagasse for bio fuel and electricity generation,Monosodium glutamate
or msg for common food additive, and inulin for dietary fibers.There-
fore, measuring the value-added productivity in one factory which is
part of the agriculture-foods-nutrition chain may not yield useful in-
formation.
The study concludes together with this executive the following. The
concept of the value-added (especially value-added productivity) is
generally important for all firms and can provide useful information
for a company management. The reason is that the value added has
significant relationship with the profitability level. However, it is im-
portant to note that the value-added concept may not be helpful in
all circumstance.The concept may not be applied under some specific

204 Chapter Eight
scenarios: (1) regulated and controlled markets, (2) a company oper-
ating in a supply chain in which it has several business partners or
spin-off firms using (or purchasing) its products for other production
and operations.
For the company under study, it has extended its business scope
through spin-offs, and joint ventureswith local and international firms.
They have formed inter-dependent supply chains in which an output
from one company becomes an input for another such as by-products
from sugar refinery for the msg production. In conclusion, the spe-
cific conditions to be considered before use for value-added produc-
tivity measurement are stated, based on one case study. More studies
and comparisons with other industries as well as supply chains need
to be conducted in order to provide a future guideline for use. In sum-
mary, it is now inevitable that measuring a company’s performance in-
volves the value-added concept.Theconcept of value-addedproductiv-
itymeasurementmaynot behelpful under someof the aforementioned
circumstance: (1) regulated and controlled markets, (2) a company op-
erating in a supply chain in which it has several business partners or
spin-off firms using (or purchasing) its products for other production
and operations.
References and Further Reading
Helo, P., Takala, J., & Phusavat, K. (2009). Productivity measurement for
knowledge work in research and development. International Journal
of Productivity and Quality Management, 4(1), 39–54.
Kess, P., Lesjak, D., Aphiphalikitthchai, C., & Phusavat, K. (2013). Value-
added concept, productivity, and profitability: Applications and in-
sights. International Journal of Business and Development Research,
1(1), 73–83.
Lee, T.-R., Helo, P., Siriwatchrakit, Z., Comepa, N., Chuancharoen, S., &
Phusavat, K. (2011). Applying intellectual capital for sustaining or-
ganisational learning. International Journal of Sustainable Economy,
3(3), 328–340.
Phusavat, K. (2010, February) Improving a management process at Trane
Thailand. Paper presented at the International Conference on Busi-
ness and it: Contemporary Research andDevelopment, Ghaziabad,
India.
Phusavat, K., Anussornnitisorn, P., Sujitwanit, S., & Kess, P. (2009). Profile-
based circumstances for productivitymeasurement. Industrial Man-
agement & Data Systems, 109(6), 825–839.

Research in Productivity Measurement 205
Phusavat, K., Fankham-ai, K., Haapasalo, H., & Lin, B. (2011) Achieving en-
terprise competitiveness through an effective management process.
Human Systems Management, 30(1), 115–124.
Phusavat, K., Jaiwong, P., Sujitwanit, S., & Kanchana, R. (2009). When
to measure productivity: Lessons learned from manufacturing and
supplier-selection strategies. IndustrialManagement&Data Systems,
109(3), 425–442.
Phusavat, K., Rapee, K., & Lin, B. (2009). Information requirements for
managerial decisions in manufacturing. Business Process Manage-
ment Journal, 15(2), 267–285.
Phusavat, K., Nilmaneenava, S., Kanchana, R., Wernz, C., & Helo, P. (2012).
Identifying productivity indicators frombusiness strategies’ surveys.
International Journal Productivity andQualityManagement, 9(2), 158–
176.
Phusavat, K., & Takala, J. (2005, August). Managing and sustaining out-
sourcing activities: Case discussion in Thailand with comparisons to
case studies in Finland. Paper presented at the 18th International
Conference on Production Research, Salerno, Italy.
Saaty, T. (2001).Creative thinking, problem solving & decisionmaking.Pitts-
burgh, pa: rws Publications.
Takala, J, Suwansaranyu, U., & Phusavat, K. (2006). A proposed white-
collar workforce performance measurement framework. Industrial
Management & Data Systems, 106(5), 644–662.

Conclusion
The book aims to extend the knowledge on productivity measurement
and management. In this book, several issues relating to productivity-
related researchhavebeenaddressed: (1)what tomeasure (e.g., produc-
tivitymeasurement ratios and techniques such as value-addedproduc-
tivity), (2) how to measure (e.g., a linkage with databases and decision-
making processes, productivity measurement model such as the mf-
pmm, and productivity formulas), and (3) where tomeasure (e.g., at the
operational and organization levels). In general, productivity measure-
menthas generally covered various levelswithin andbeyondanorgani-
zationaswell ashasbeen studiedbymanydisciplines (e.g., engineering,
economics, business administration, and psychology). For Industrial
Engineering (ie), the studies on productivitymeasurement initially be-
gan in 1870s when Frederick Taylor, and Frank and Lilian Gilbreth fo-
cused their improvement interventionsonblue-collarworkerswith the
use of motion and time studies.
Gradually, thework from industrial engineering in productivitymea-
surement and management has started to expand and move towards
the functional and organizational levels as productivity information
was needed to effectively manage production and operation within a
firm. Many models and formulas have been developed to help man-
agers and engineers alike capture productivity in amore accurateman-
ner. As the service sector emerged as the key contributor to the eco-
nomic wealth and growth, industrial engineers embarked on applying
and adapting engineering concepts to help develop productivity mea-
surement tools for service providers. This can be highlighted by the
surrogate concept.The use of input/output analysis remains critical as
an industrial engineer use the analysis results for ratio identification
and information analysis. Trend evaluation and benchmarking main-
tain their prominent role after productivity measurement.
The continued acceptance of iso 9001: 2008, the mbnqa, and the
European Foundation for Quality Management ExcellenceModel have
helped strengthen the importance of performance/productivity mea-
surement and analysis. Recent studies have called for a better linkage
with information and communication technology design, especially in
the areas of database robustness, cognitive styles of managers, qual-
207

208 Conclusion
ity of a management report. For examples, the Control Objectives for
Information and related Technology (cobit) is a set of best practices
( framework) for it management.1 cobit was earlier developed by the
Information Systems Audit and Control Association and the it Gov-
ernance Institute in 1996. cobit helps address several critical issues
relating to performance/productivity measurement and analysis, in-
cluding the accuracy of data on the performance levels and the inte-
gration of performance information and reports into decision-making
processes at all levels within an organization.
The Information Technology Infrastructure Library (itil) is a set
of recommended practices for managing the Information and com-
munication technology services during design, planning, deployment,
operations, and upkeep. itil is a registered trademark of the United
Kingdom’s Office of Government Commerce. itil can benefit perfor-
mance/productivitymeasurement and analysis in severalways as it ad-
dresses the risk involving data security2 and focuses on howadatabase
is managed, ranging from data collection, data storage, data release
and retrieval, and information report.
Currently, performance/productivity measurement and analysis
symbolize and reflect good governance and transparency in an orga-
nization. Performance/productivitymeasurement and analysis under-
line that amanager shouldbeaccountable for his/her decisions andac-
tions. More importantly, performance/productivity measurement and
analysis can be used to drive organizational missions, policies, and ob-
jectives. In addition, they strengthen organizational capability to over-
come current competition and to better prepare for future endeavors
in the globalization era.Therefore, effective performance/productivity
measurement and analysis should benefit any organization operating
under financial limitations, demographic changes, changing expecta-
tions of customers and/or citizens.
Finally, ensuring that the public sector is accountable with good
governance practices with a great deal of congressional oversights,
the Office of Management and Budget of the us government devel-
oped a performance measurement-related tool in the early 2000s,
known as Program Assessment Rating Tool or part. Moreover, per-
formance/productivity measurement also plays a crucial role in im-
1. See www.isaca.org/cobit
2. See www.itil-officialsite.com/home/home.asp

Conclusion 209
plementing value-for-money or performance audits, especially among
European countries (as a result of European Court of Auditors), Hong
Kong, and Singapore. Furthermore, the practices of audits in the public
sector have gradually changed from internal (i.e., control, financial and
compliance) to performance (sometimes known as value-for-money)
audits. For examples, in Finland, Ministry of Finance’s Financial Con-
troller advocates the need to demonstrate performance of a public
agency in terms of its quality on service delivery, efficiency in costman-
agement, and effectiveness relating to the ability to solve or address
citizens’ needs.3
3. See www.vm.fi/vm/en/02_ministry/02_organisation_and_functions/12
_controller/index.jsp

Final Remarks
The book is based on my academic work and research in the areas of
performance/productivity measurement and analysis during the last
18 years at Department of Industrial Engineering, Kasetsart University.
During this time, I have been fortunate to work with wonderful aca-
demicians, scholars, and colleagues from various places within Thai-
land and around the world. Nevertheless, I probably need to limit to
only a handful of people whom have had lasting influences in my life.
First of all, Iwould like to thankmymother (SanpangPhusavat) for hav-
ing the will and the vision to send me to the us in order to complete
my high school diploma there. Otherwise, I might not have had an op-
portunity to pursue a career in Industrial Engineering or ie. Without
the powerful recommendation written by my academic advisor from
Foothill High School in Bakersfield, California, Mr. Robert Norwood, I
probably could not have begun my undergraduate endeavor at Texas
Tech University. As I started my undergraduate study, I became inter-
ested and had learned a lot about the historical development and the
contributions of ie. I always knew thatDr. RichardDudek’s recommen-
dation, my undergraduate advisor, was so crucial for my acceptance at
Virginia Tech. Virginia Tech was a wonderful place to study. I am not
surprised to hear that it is now ranked in the top five ie programs in
the us.
I have always consideredmyself to be fortunate to earnboth themas-
ter and doctoral degrees in Industrial and Systems Engineering from
Virginia Tech. I met many outstanding professors who had shown me
the importance of ie in the society. Productivity had always been and
would continue to be the ie’s trademark. I also became familiar with
the work published or performed by three ie founding members—
Frederick Taylor, and Frank and Lillian Gilbreths. The more I studied
their work, the more I was proud to be an ie. As I chose to enroll in the
mse as one of the four available options for a graduate study, I realized
how privileged and fortunate I was. I worked with exceptional profes-
sors and innovators such as Benjamin Blanchard, D. Scott Sink, Harold
Kurstedt, Paul Torgersen, C. Patrick Koelling and Paul Rossler. Specif-
ically for Professor Blanchard, your insights into Systems Engineering
really helpedmakemanagement system design or analysis so captivat-
211

212 Final Remarks
ingly. Lastly, I could not complete this paragraph without the special
appreciation to my dear friend at Virginia Tech, Dr. William Hoehn.
Since 1995, I have been blessed fromworking at one of themost pres-
tigious universities inThailand, Kasetsart University. With strong sup-
port from the administration; I have been able to conduct, apply, and
adapt the knowledge I learned from both Texas Tech and Virginia Tech
very freely. Having workedwith several firms and agencies such asThai
Flour Group, Provincial Electricity Authority, tris, and Office of Pub-
lic Sector Development Commission help me realize how critical per-
formance/productivity measurement and analysis are to an organiza-
tion from both short- and long-term viewpoints. These opportunities
have assisted me in broadening the applications of mse knowledge. I
have often recalled one of the last conversations I had as a doctoral stu-
dent with Dr. Paul Torgersen and Dr. C. Patrick Koelling to help sustain
my enthusiasm in this field. My two advisors gave me their advice that
when I completedmy doctoral work, I would everlastingly be obligated
to promote andmove ie knowledge forward—making sure that people
would recognize the importance of and have a high regard for the con-
tributions from ie, especially in theManagement Systems Engineering
areas. To both, I have tried to uphold these commitment and respon-
sibility throughout my life. Finally, this dossier would not be possible
without the support and understanding frommywife (Kanlada Phusa-
vat) and the love of our two children (Kiranapa and Kasidhad Phusa-
vat).

Biographical Notes
Dr. Kongkiti Phusavat
Department of Industrial Engineering
Faculty of Engineering
Kasetsart University
Bangkok,Thailand
Dr. Kongkiti Phusavat has earned his bachelor degree in Industrial En-
gineering fromTexas TechUniversity, andmaster and doctoral degrees
in Industrial and Systems Engineering from Virginia Polytechnic In-
stitute and State University (Virginia Tech) in the us He is currently
working at Department of Industrial Engineering, Kasetsart Univer-
sity, which is considered as one ofThailand’s prestigious programs. His
present administrative positions are Director of Center of Advanced
Science in Industrial Technology (under the National Research Univer-
sity scheme) andDirector of International Graduate Program in Indus-
trial Engineering.
His current research studies and academic work are in the areas of
productivity and qualitymeasurement, performancemanagement, ac-
quisition logistics, and anetworked government. Dr. Phusavat has pub-
lished more than 80 articles in the referred international journals over
the past decade. Dr. Phusavat has been a manager for more than 30
projects relating to public-sector reforms and good governance, or-
ganizational structure for state enterprises, service improvement in
healthcare and education, and productivity improvement in private
firms. He has contributed to book chapters published inThailand and
Europe. Dr. Phusavat is presently an executive advisor to Thai-Finnish
Chamber of Commerce. He is also a committee on national education
forThailand’s Board of Trade.
Dr. Phusavat has served as Editor in Chief and editorial board mem-
bers for several leading international journals such as International
Journal of Innovation andLearning.Hehas acted as a reviewer for a few
research agencies in Thailand and Europe, namely Thailand Research
213

214 Biographical Notes
Funds, National Research Council of Thailand, Czech Science Foun-
dation, and Austrian Science Funds. Finally, Dr. Phusavat has given a
keynote speech in many international conferences held in Finland, In-
dia, Indonesia, Poland, Taiwan roc, andThailand; and has conducted
the lectures for the universities in Australia, Finland,Malaysia, Poland,
Slovenia, Taiwan roc,Thailand, and the us.

ToKnowPressbangkok · celje · lublinwww.toknowpress.net
Productivity has survived for more than one century due to the recognition of its impacts on long-term business competitiveness. From a simple definition of output divided by input established in the late 1800s, productivity has continuously gathered a lot of interests from researchers and practitioners alike. Interestingly, productivity has been studied by sev-eral academic disciplines in business administration, economics, engineering, and psychology. Nowadays, being productive implies cost effectiveness and excel-lent performance.
Despite the changes and uncertainties in global business environment, productivity has continued to evolve. In fact, the focus on productivity has played the key role in the expansion of low-cost airlines and the emerging product design which emphasizes com-monality and interoperability. The text highlights the issues relating to productivity measurement and anal-ysis at the organizational levels. These issues include what to measure, where to measure, how to measure, and when to measure productivity/performance. The recent development in productivity measurement which uses the term value added as a surrogate for a firm’s output is also included.
30 e
ur50
0 th
b