productivity (oecd & bis & more)
TRANSCRIPT

Productivity Puzzle
OECD (9 July 2015)
BIS (28 June 2015)


http://www.iie.com/events/event_detail.cfm?EventID=399

THE FUTURE OF PRODUCTIVITY
Peterson Institute for International Economics, Washington D.C., 9 July 2015
Catherine L. Mann OECD Chief Economist
… productivity isn't everything, but in the long run it is almost everything.
Paul Krugman, 1994
Launch of the book: Adalet McGowan, M., D. Andrews, C. Criscuolo and G. Nicoletti (2015), The Future of Productivity OECD, Paris.
http://www.iie.com/publications/papers/mann20150709.pdf

• Productivity: Why does it matter?– Potential growth– Labour productivity/Income per capita
• Productivity: What is wrong?– Broken diffusion machine– Misallocated resources, esp. skills
• Policies to revive productivity growth
Road Map
2
http://www.iie.com/publications/papers/mann20150709.pdf

A peek at policy channels Framework Policies, Demand Conditions and..
3
Productivity growth
Skills Mismatch
Innovation and Diffusion
Wages and Income
Distribution
Investment KBC

Productivity is about: Working smarter, not working harder
More output by better combining inputs, via:new ideastechnological innovationsnew business modelsmore efficient resource allocation.
Productivity crucial for potential growth
Productivity: What is it, Why it Matters
http://www.iie.com/publications/papers/mann20150709.pdf

6
Potential Growth: Who cares? What’s wrong? Promises, Promises
Source: June 2015 OECD Economic Outlook database.
Contributions to average annual percentage change of potential GDP per capita
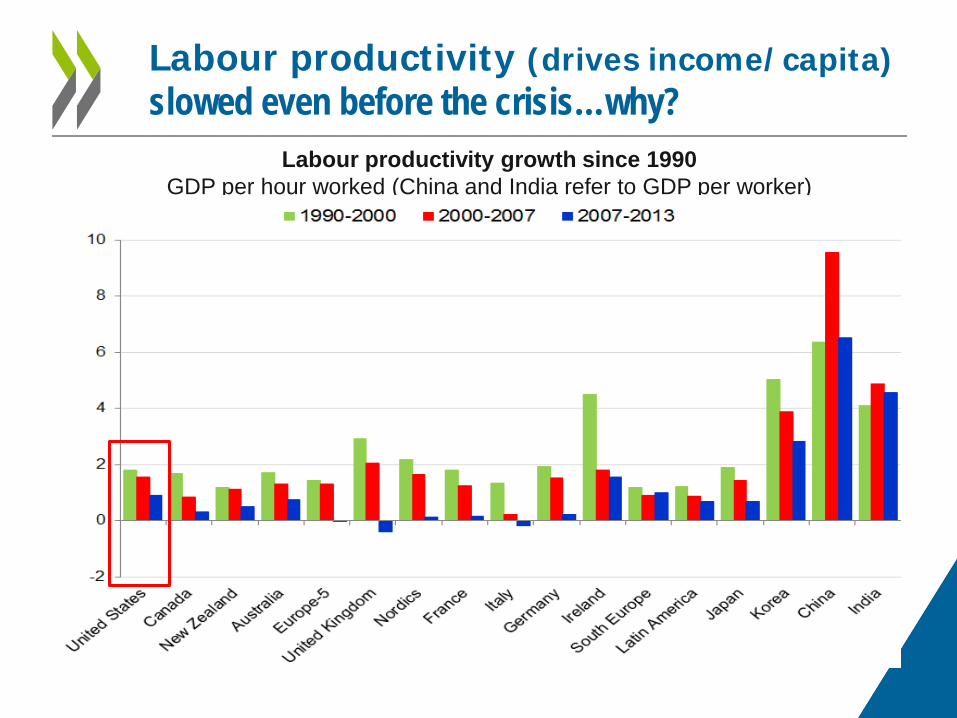
Labour productivity (drives income/capita) slowed even before the crisis…why?
Labour productivity growth since 1990 GDP per hour worked (China and India refer to GDP per worker)

Slowing investment in KBC
8
Investment in Knowledge Based Capital Annual average growth

Declining business dynamism
Share of start-up firms in total Per cent; average over the periods
9
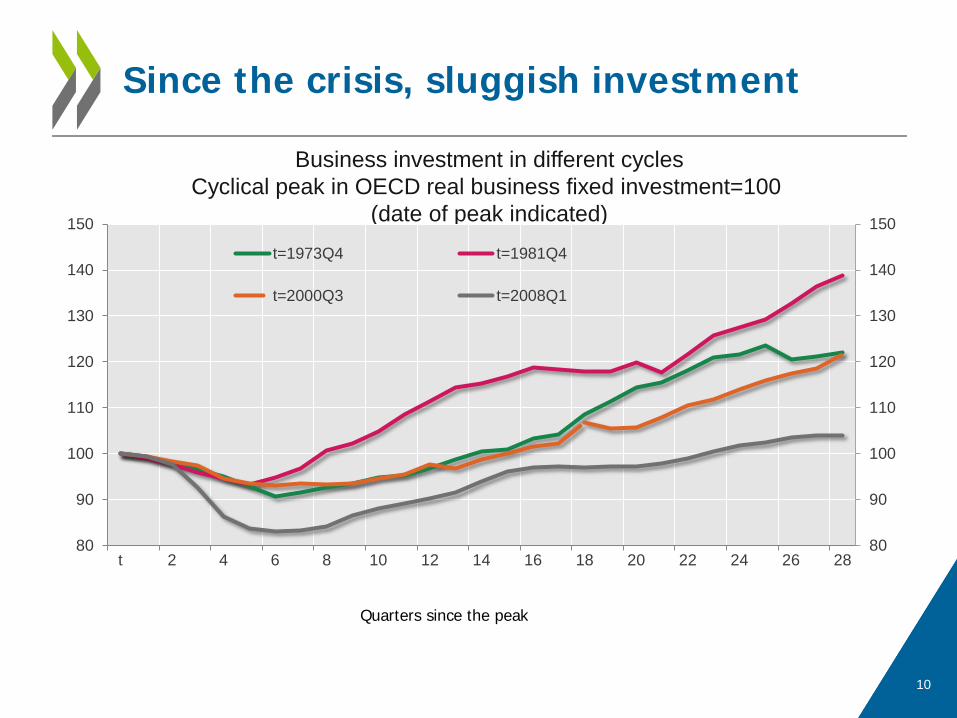
Since the crisis, sluggish investment
Business investment in different cycles Cyclical peak in OECD real business fixed investment=100
(date of peak indicated)
10
80
90
100
110
120
130
140
150
80
90
100
110
120
130
140
150
t 2 4 6 8 10 12 14 16 18 20 22 24 26 28
t=1973Q4 t=1981Q4
t=2000Q3 t=2008Q1
Quarters since the peak

Prospects going forward?
11
Economic odd couple Robert Gordon, left, and Joel Mokyr encapsulate the debate on the future of innovation. ROB HART FOR THE WALL STREET JOURNAL “”Economists Debate: Has All the Important Stuff Already Been Invented? By Timothy Aeppel, June 15, 2014 10:38 p.m. ET
http://www.iie.com/publications/papers/mann20150709.pdf

THE BREAKDOWN OF THE DIFFUSION MACHINE
http://www.iie.com/publications/papers/mann20150709.pdf

Problem is not innovation, it’s diffusion
Solid growth at the global productivity frontier but spillovers disappointed Labour productivity; index 2001=0
13
“Frontier firms” corresponds to the average labour productivity of the 100 globally most productive firms in each 2-digit sector. “Non-frontier firms” is the average of all other firms. “All firms” is the sector total. The average annual growth rate is shown in parentheses.
Manufacturing Sector Services Sector
0.0
0.1
0.2
0.3
0.4
0.5
2001 2002 2003 2004 2005 2006 2007 2008 2009
Frontier firms(3.5% per annum) All firms
(1.7% per annum)
Non-frontier firms(0.5% per annum)
-0.1
0.0
0.1
0.2
0.3
0.4
0.5
2001 2002 2003 2004 2005 2006 2007 2008 2009
Frontier firms(5.0% per annum)
All firms(0.3% per annum)
Non-frontier firms(-0.1% per annum)

Thinking about diffusion: global frontier to national frontier to laggards
Global frontier
National Frontier
Laggards
A stylised depiction of how productivity spreads matter for policy

Structural policies shape diffusion
Estimated frontier spillover (% pa) associated with a 2% point increase in MFP growth at the global productivity frontier
Global connections Reallocation Knowledge-Based Capital
15

Global frontier to national frontier: different countries, different issues
How much higher would be overall manufacturing sector labour productivity if national frontier (NF) firms were as productive and large as global frontier (GF) firms?
NF firms in Italy have productivity levels close to the GF but they are relatively small
16
NF firms in US have productivity levels 10% lower than the GF but they are relatively big

Frontier to average firm Old & small are less productive, trap resources
17

19
Survival, growth, or Out the dynamics of creative destruction
Firm growth and survival rates, by firm age

POLICIES TO REVIVE PRODUCTIVITY GROWTH

Keep the innovation engine running
22
Est. frontier spillover (% p.a.) associated with 2% point increase
in MFP growth at the frontier
Average across selected OECD countries Index 1992=100

Revive the diffusion machine
Estimated frontier spillover (% p.a.) associated with a 2% point increase in MFP growth at the global productivity frontier
24

Reallocate resources to most productive firms and support worker transition
The probability of skill mismatch and public policies
26
Entry and Exit Labour mobility Education

Reducing skill mismatch is a win-win: raises productivity and wages too
27

Future growth depends on productivity Framework policies are the key
Contribution to growth in GDP per capita, 2000-2060 (annual average)

• OECD (2015), “The Future of Productivity”. OECD, Paris • Adalet McGowan, M. and D. Andrews (2015a), “Labour Market Mismatch and
Labour Productivity: Evidence from PIAAC Data”, OECD Economics Department Working Papers, No. 1209.
• Adalet McGowan, M. and D. Andrews (2015b), “Skill Mismatch and Public Policy in OECD Countries”, OECD Economics Department Working Papers, No. 1210.
• Andrews, D., C. Criscuolo and P. Gal (2015), “Frontier Firms, Technology Diffusion and Public Policy: Micro Evidence from OECD Countries”, OECD Mimeo, forthcoming.
• Calvino, F., C. Criscuolo and C. Menon (2015), “Cross-country Evidence of Start-Up Dynamics”, OECD Science, Technology and Industry Working Paper.
• Criscuolo, C., P. Gal and C. Menon (2014), “The Dynamics of Employment Growth: New Evidence from 18 Countries”, OECD Science, Technology and Industry Policy Papers, No. 14.
• Saia, A., D. Andrews and S. Albrizio (2015), “Public Policy and Spillovers From the Global Productivity Frontier: Industry Level Evidence”, OECD Economics Department Working Papers, No. 1238.
The following reports detail the results:
29

https://twitter.com/schulte_stef/status/617665366706286592
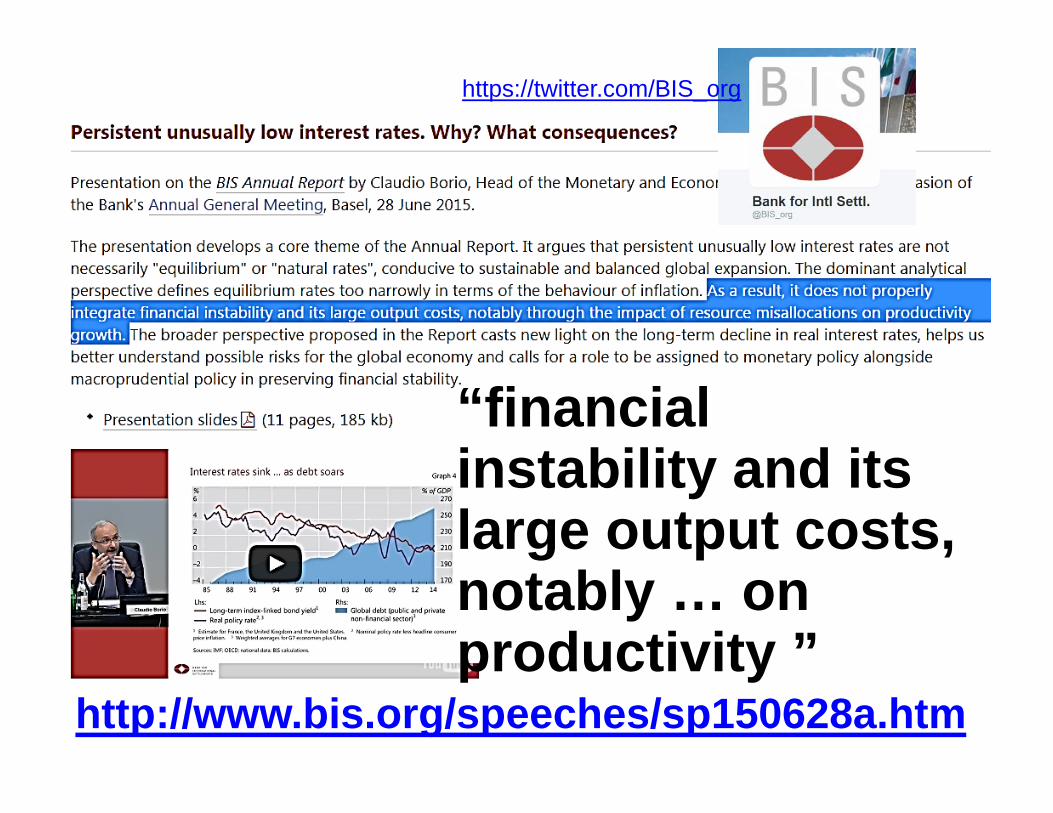
http://www.bis.org/speeches/sp150628a.htm
“financial instability and its large output costs, notably … on productivity ”
https://twitter.com/BIS_org

Persistent unusually low interest rates.Why? What consequences?
Claudio BorioHead of the Monetary and Economic Department
85th Annual General Meeting
http://www.bis.org/speeches/sp150628a.htm

5
Interest rates have been exceptionally and persistently low
G3 real policy rates1 Bond yields2
–4
–2
0
2
4
70 75 80 85 90 95 00 05 10 15
%
1 Nominal policy rate less consumer price inflation excluding food and energy. Weighted averages for the euroarea (Germany), Japan and the United States based on rolling GDP and PPP exchange rates. 2 Yield permaturity; for each country, the bars represent the maturities from one to 10 years.
Sources: Bloomberg; national data.
–1.50
–0.75
0.00
0.75
1.50
United Japan Germany France Switzerland SwedenStates
%
Trough 29 May 2015
Graph 1
http://www.bis.org/speeches/sp150628a.htm

6
Financial booms, resource misallocations and productivity
Financial boom-busts do not cause damage just through demand They also have a sizeable impact through supply Three findings of BIS research (Graph 2)
Financial booms sap productivity growth as they occur ... … mainly through resource misallocations … … that have an even larger impact if a crisis occurs later on
Three implications Money is not neutral Misallocations cause another form of hysteresis Misallocations weaken the effectiveness of demand
management- Premium on balance sheet repair and structural policies
http://www.bis.org/speeches/sp150628a.htm
7
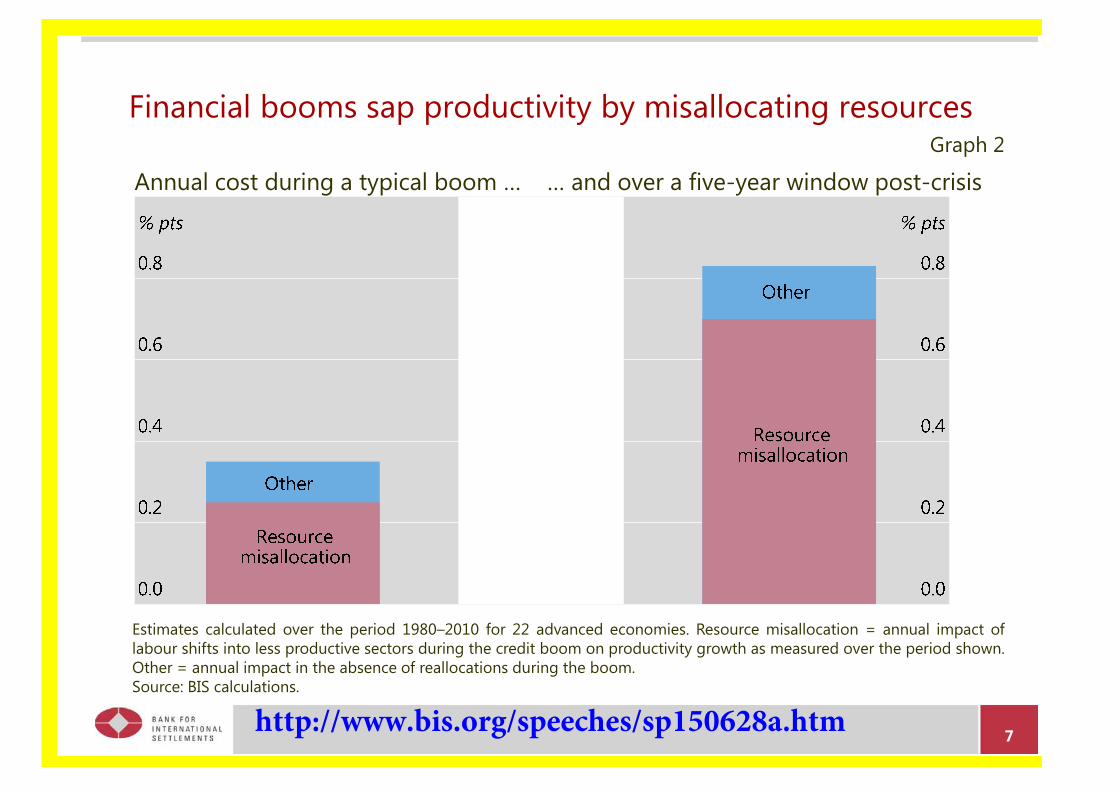
Financial booms sap productivity by misallocating resourcesGraph 2
Annual cost during a typical boom … … and over a five-year window post-crisis
Estimates calculated over the period 1980–2010 for 22 advanced economies. Resource misallocation = annual impact oflabour shifts into less productive sectors during the credit boom on productivity growth as measured over the period shown.Other = annual impact in the absence of reallocations during the boom.Source: BIS calculations.
http://www.bis.org/speeches/sp150628a.htm

https://twitter.com/billjaneway/status/616981362944421888

https://twitter.com/mattyglesias/status/619298526749687808