productivity revisited: shifting paradigms in analysis and
TRANSCRIPT


Productivity Revisited


Productivity Revisited Shifting Paradigms in Analysis and Policy
Ana Paula Cusolito and William F. Maloney
© 2018 International Bank for Reconstruction and Development / The World Bank
1818 H Street NW, Washington, DC 20433
Telephone: 202-473-1000; Internet: www.worldbank.org
Some rights reserved
1 2 3 4 21 20 19 18
This work is a product of the staff of The World Bank with external contributions. The fi ndings, interpretations, and conclusions expressed in this work do not necessarily refl ect the views of The World Bank, its Board of Execu-tive Directors, or the governments they represent. The World Bank does not guarantee the accuracy of the data included in this work. The boundaries, colors, denominations, and other information shown on any map in this work do not imply any judgment on the part of The World Bank concerning the legal status of any territory or the endorsement or acceptance of such boundaries.
Nothing herein shall constitute or be considered to be a limitation upon or waiver of the privileges and immu-nities of The World Bank, all of which are specifi cally reserved.
Rights and Permissions
This work is available under the Creative Commons Attribution 3.0 IGO license (CC BY 3.0 IGO) http:// creativecommons.org/licenses/by/3.0/igo. Under the Creative Commons Attribution license, you are free to copy, distribute, transmit, and adapt this work, including for commercial purposes, under the following conditions:
Attribution—Please cite the work as follows: Cusolito, Ana Paula, and William F. Maloney. 2018. Productivity Revisited: Shifting Paradigms in Analysis and Policy. Washington, DC: World Bank. doi:10.1596/978-1-4648-1334-4. License: Creative Commons Attribution CC BY 3.0 IGO.
Translations—If you create a translation of this work, please add the following disclaimer along with the attribution: This translation was not created by The World Bank and should not be considered an offi cial World Bank translation. The World Bank shall not be liable for any content or error in this translation.
Adaptations—If you create an adaptation of this work, please add the following disclaimer along with the attribution: This is an adaptation of an original work by The World Bank. Views and opinions expressed in the adap-tation are the sole responsibility of the author or authors of the adaptation and are not endorsed by The World Bank.
Third-party content—The World Bank does not necessarily own each component of the content contained within the work. The World Bank therefore does not warrant that the use of any third-party-owned individual component or part contained in the work will not infringe on the rights of those third parties. The risk of claims resulting from such infringement rests solely with you. If you wish to reuse a component of the work, it is your responsibility to determine whether permission is needed for that reuse and to obtain permission from the copyright owner. Examples of components can include, but are not limited to, tables, fi gures, or images.
All queries on rights and licenses should be addressed to World Bank Publications, The World Bank Group, 1818 H Street NW, Washington, DC 20433, USA; e-mail: [email protected].
ISBN (paper): 978-1-4648-1334-4
ISBN (electronic): 978-1-4648-1362-7
DOI: 10.1596/978-1-4648-1334-4
Cover image: Remedios Varo, Fenómeno de ingravidez (The Phenomenon of Weightlessness) (1963). Used with permission of the artist’s estate. Further permission required for reuse.
Cover design: Bill Pragluski, Critical Stages
Library of Congress Cataloging-in-Publication Data has been requested.
v
Contents
Preface ........................................................................................................................... xi
Acknowledgments .....................................................................................................xiii
Abbreviations ............................................................................................................... xv
Executive Summary: The Elusive Promise of Productivity ...............................xvii
1. The Elusive Promise of Productivity ...................................................................1
The Twin Productivity Puzzles .......................................................................1
The Current Productivity Conjuncture .........................................................3
The Mechanisms of Productivity Growth: Second-Wave Analysis ............15
Plan of the Volume ........................................................................................19
Notes ..............................................................................................................20
References ......................................................................................................22
2. Enhancing Firm Performance ............................................................................27
New Thinking about Within-Firm Productivity .........................................27
Firm Performance: Beyond Efficiency .........................................................29
Concluding Remarks .....................................................................................40
Annex 2A. Quality and Physical Total Factor Productivity Estimation .....41
Notes ..............................................................................................................41
References ......................................................................................................42
3. Misallocation, Dispersion, and Risk ................................................................45
Reconsidering the Hsieh-Klenow Model .....................................................47
What Else Could Be Driving Dispersion? ....................................................50
Dynamic Effects of Distortions ....................................................................58
Concluding Remarks .....................................................................................65
Notes ..............................................................................................................65
References ......................................................................................................66
4. Entry and Exit: Creating Experimental Societies ...........................................69
Drivers of Entry and Exit .............................................................................70
Moving from Opportunity to Entrepreneurship.........................................79
Operating Environment ...............................................................................79

vi Contents
Capabilities of Entrepreneurs .......................................................................88
Concluding Remarks ..................................................................................104
Notes ............................................................................................................105
References ....................................................................................................106
5. Productivity Policies .........................................................................................115
Summary of Main Lessons from the Second Wave of Productivity Analysis ..........................................................................116
The National Productivity System .............................................................126
Government Productivity and Policy Making ...........................................130
Concluding Remarks ...................................................................................139
Annex 5A. Policy Coherence and Effectiveness Supporting Productivity Growth: A Proposal for World Bank Productivity Public Expenditure Reviews ..............................................................141
Notes ............................................................................................................142
References ....................................................................................................143
Appendix A. Measuring the Productivity Residual: From Theory to Measurement .....................................................................................147
Boxes1.1 Are the Current Productivity Lags Just the Calm before the Next
Productivity Storm? ..................................................................................................8
1.2 Structural Transformation Decompositions ..........................................................16
4.1 Successful Industrializers “Got Out” Early and Often ...........................................77
4.2 Capital Market Development and the Facilitation of Exit—Novo Mercado in Brazil ...............................................................................86
4.3 Is Inherited Culture Stymying Experimentation? ..................................................89
4.4 Changing Culture, Plugging In: Start-Up Chile and Followers ...........................92
4.5 The Nanoeconomics of Entrepreneurial Strategy in Meiji-Era Cotton Spinning: Evidence from Japan’s First Manufacturers .............................99
4.6 Industrial Retrogressions: Insights from Chile and Brazil into the Relative Roles of Learning and the Culture and Business Climate .....................102
5.1 Structural Transformation: What Are the Conclusions for Policy? ....................125
5.2 The Role of a Modern and Efficient Quality Infrastructure Ecosystem in Enhancing Competitiveness and Increasing Productivity ..................................128
5.3 How Do Microenterprises and Informal Firms Unplugged from the National Productivity System Affect Overall Productivity? ................................131
5.4 Regulatory Uncertainty: A Barrier to Productivity Growth ...............................135

Contents vii
5.5 Examples of National Productivity Agencies: Ensuring Coherence across the National Productivity System ..............................................................136
5.6 Industrial or Productivity Policies? Natural Resource Blessings and High-Tech Disappointments .........................................................................138
Figures1.1 The Rate of Growth of Output per Worker Has Been Falling in Both
Industrial and Developing Countries for Decades ..................................................4
1.2 Decomposition of the Slowdown in Labor Productivity Growth into Two Components: Total Factor Productivity and Capital Deepening....................5
1.3 The United States Experienced Long Swings in Productivity Growth ...................6
1.4 The Number of Global Researchers Has Doubled since 1995, with Most Growth in the Developing World ....................................................................9
1.5 Most of the U.S. Patent and Trademark Office Patents in China and India Have Been Co-invented and Sponsored by Multinational Firms ................9
1.6 There Is No Obvious Relationship between the Productivity Slowdown and the Prominence of Information Technology ..................................................11
1.7 Industrial Concentration Has Not Increased in a Sample of Emerging Markets ..............................................................................................12
1.8 Labor Markets Are Becoming More Polarized in Advanced Economies, but Not in Developing Countries ...........................................................................13
1.9 Are Robots Displacing or Creating Manufacturing Jobs? .....................................14
B1.2.1 The Percentage of Productivity Growth Contributed by Structural Transformation Varies Widely by Country and over Time ..................................16
1.10 There Are Three Main Sources of Productivity Growth .......................................17
1.11 Which Dimension Contributes Most to Productivity Growth? ............................18
2.1 Decomposing Firm Performance ...........................................................................28
2.2 The Price of Wines Is Clearly Related to the Price of Materials and the Quality Rating They Receive .....................................................................33
2.3 TFPQ Estimations Exhibit a Downward Bias When Quality Is Not Controlled For ........................................................................................................34
2.4 Average Product Quality Increases with the Level of Development .....................35
2.5 Demand Is More Important than TFPQ at Mature Stages: Colombia .................36
2.6 Demand Is More Important than TFPQ at Mature Stages: Malaysia ...................37
2.7 Firms Hire More Skilled Labor and Use Higher-Quality Inputs as They Raise Quality during Their Life Cycle ..........................................................37
2.8 Increased Demand from Trade Causes Firms to Concentrate on Their Best-Performing Products but Has Little Impact on Product Price ..........39
2.9 Firm Size Increases with the Level of Development ..............................................39

viii Contents
3.1 More Misallocation (Higher TFP Dispersion) May Partly Explain Lower GDP .......................................................................................... 46
3.2 What Does Total Factor Productivity Dispersion Really Tell Us? .........................47
3.3 Pass-Through Is Imperfect in Malaysia ..................................................................49
3.4 Between One-Quarter and One-Half of the Dispersion in the Average Revenue Product of Capital Can Potentially Be Explained by Heterogeneity in Firm-Level Technologies ............................................................50
3.5 Sixty Percent to Ninety Percent of Dispersion May Reflect Adjustments to Shocks ...........................................................................................51
3.6 Higher Country Product Quality Is Associated with Higher Dispersion of Quality ..............................................................................................53
3.7 Faster Quality Growth Is Riskier Quality Growth .................................................54
3.8 Is Dispersion Correlated with Higher GDP? Without Common Data Cleaning Methods, It Is Impossible to Know ...............................................56
3.9 Potential Drivers of TFPR Dispersion ....................................................................57
3.10 Distortions Have Larger Impacts in Developing Countries ..................................60
3.11 Higher Productivity Elasticity of Distortions Is Correlated with Lower GDP Per Capita and Smaller Firm Size .......................................................62
3.12 TFP and Investment-Output Ratio during Acceleration Episodes and Postliberalization Transitions ..........................................................63
3.13 Variations in Size Dynamics during Acceleration Episodes and Postliberalization Transitions ..........................................................................64
4.1 Employment Shares for Young U.S. Firms Have Declined Steadily since the Early 1980s in Most Sectors .......................................................71
4.2 Unlike in the United States, the Proportion of Young Firms in Developing Countries Appears Not to Be Declining .............................................72
4.3 Measures of Entrepreneurial Dynamism in Developing Countries Show No Clear Pattern of Reduced Entrepreneurial Dynamism, 1997–2012 ................73
4.4 Despite Higher Opportunities from Technological Adoption, Productive Entrepreneurship Is Not Higher in Developing Countries ...................................75
4.5 Determinants of Entrepreneurial Experimentation and Productive Entrepreneurial Activity ..........................................................................................80
4.6 How Well Plugged In to the Knowledge Frontier Are Developing-Country Students? .................................................................................................................81
4.7 Entry and Exit Costs Are Higher in Follower Countries than in Frontier Countries .................................................................................................................83
4.8 Weak Contracting Mechanisms and Low Trust Diminish Investments in Managerial Capabilities .................................................................85
4.9 There Is a Clear Correlation between Engineering Densities in 1900 and Rates of Adoption of Technologies since 1900 ...............................................97

Contents ix
4.10 U.S. States with Higher Engineering Densities in 1900 Had Higher Rates of Adoption of Home Computers in the 1990s .........................................................98
5.1 Drivers of Productivity Growth ............................................................................119
B5.1.1 Average Productivity Gaps between Manufacturing and Agriculture Persist over Time, Suggesting That Segmenting Labor Market Distortions Are Probably Not the Main Barrier to Structural Transformation .....................125
5.2 The National Productivity System ........................................................................127
5.3 More Developed Countries Have More Effective Bureaucracies ........................132
Tables3.1 How Data Are Cleaned Dramatically Affects the Measure of Misallocation ......55
3.2 India and the United States Have Similar Levels of Dispersion after Data Are Similarly Cleaned ....................................................................................................56
4.1 Immigrants Dominated Industrialization during the Second Industrial Revolution in Latin America ...................................................................................76
A.1 Estimated Input Coefficients: Results of Different Approaches..........................157
A.2 Firm Performance and Trade Reforms: The Case of India ................................165

xi
Preface
Productivity accounts for half of the differences in GDP per capita across countries.
Identifying policies to stimulate it is thus critical to alleviating poverty and fulfilling the
rising aspirations of global citizens. Yet productivity growth has slowed globally in
recent decades, and the lagging productivity performance in developing countries con-
stitutes a major barrier to convergence with advanced-economy levels of income.
The World Bank Productivity Project seeks to bring frontier thinking on the mea-
surement and determinants of productivity, grounded in the developing-country con-
text, to global policy makers. Each volume in the series explores a different aspect of the
topic through dialogue with academics and policy makers and through sponsored
empirical work in our client countries. The Productivity Project is an initiative of the
Vice Presidency for Equitable Growth, Finance, and Institutions.
The current volume, Productivity Revisited, takes stock of recent advances in what it
refers to as the “second wave” of productivity analysis, which calls into question much
previous research in this area. At the same time, these new approaches provide a new
set of tools for navigating the debates surrounding the productivity slowdown and
convergence. The work here extends this analysis using international and developing-
country data sets and delineates how the findings imply important corresponding
shifts in recommendations for productivity policy.
This volume is dedicated to the memory of Jan Walliser (1969−2018), former Vice
President of the World Bank Group’s Equitable Growth, Finance, and Institutions
Practice Group.
William F. Maloney
Chief Economist
Equitable Growth, Finance, and Institutions Practice Group
World Bank Group

xii Preface
Other Titles in the World Bank Productivity Project
The Innovation Paradox: Developing-Country Capabilities and the Unrealized Promise of
Technological Catch-Up. 2017. Xavier Cirera and William F. Maloney. Washington, DC:
World Bank.
All books in the World Bank Productivity Project are available free at https://
openknowledge.worldbank.org/handle/10986/30560.

xiii
Acknowledgments
This volume was written by Ana Paula Cusolito (Senior Economist, World Bank
Finance, Competitiveness, and Innovation Global Practice) and William F. Maloney
(Chief Economist, World Bank Equitable Growth, Finance, and Institutions Practice
Group).
The authors thank Ceyla Pazarbasioglu (Vice President, Equitable Growth, Finance,
and Institutions Practice Group); Jan Walliser (former Vice President, Equitable Growth,
Finance, and Institutions Practice Group); Akihiko Nishio (Director, Strategy and
Operations, Equitable Growth, Finance, and Institutions Practice Group); Najy
Benhassine (Director, Finance, Competitiveness, and Innovation Global Practice); Paulo
G. Correa (Practice Manager, Finance, Competitiveness, and Innovation Global Practice);
Catherine Masinde (Practice Manager, Macroeconomics, Trade, and Investment Global
Practice); and Jose Ernesto López Córdova (Practice Manager, Finance, Competitiveness,
and Innovation Global Practice) for their support.
The work builds on a combination of analytical work by the authors from a series of
background papers carried out under the umbrella of the Equitable Growth, Finance,
and Institutions Productivity Project. The authors thank Francisco Buera (Washington
University in St. Louis), Joel David (University of Southern California), Jan De Loecker
(Katholieke Universiteit Leuven and Princeton University), Marcela Eslava (Universidad
de los Andes, Colombia), Alvaro García Marín (Universidad de los Andes, Chile), John
Haltiwanger (University of Maryland), Pravin Krishna (Johns Hopkins University),
Giordano Mion (University of Sussex), Carlos Molina (Massachusetts Institute of
Technology), Rafael Prado Proença (Harvard University), Diego Restuccia (University
of Toronto), Richard Rogerson (Princeton University), Martin Rotemberg (New York
University), Melissa Rubio (University of Gothenberg), Chad Syverson (University of
Chicago), Heiwai Tang (Johns Hopkins University), Venky Venkateswaran (Federal
Reserve Bank of Minneapolis), and T. Kirk White (U.S. Census Bureau’s Center for
Economic Studies).
For their contributions, we also thank our World Bank colleagues: Paulo G. Correa,
Tatiana Didier, Roberto Fattal, Ana Margarida Fernandes, Leonardo Iacovone, Daniel
Lederman, Norman Loayza, Hibret Maemir, Ha Minh Nguyen, Jorge Pena, Daniel
Rogger, Luis Sanchez, Joana Silva, and Gabriel Zaourak. Further, we would like to thank
Xavier Cirera, Jose Ernesto López Córdova, and Andrei Mikhnev for providing specific
inputs for the policy chapter.
xiv Acknowledgments
We acknowledge invaluable comments from the peer reviewers of this project:
Otaviano Canuto (World Bank), Mary C. Hallward-Driemeier (World Bank), Jan De
Loecker (Katholieke Universiteit Leuven and Princeton University), and Chad Syverson
(University of Chicago), as well as other World Bank colleagues, including Najy
Benhassine, César Calderón, Francesca de Nicola, Mark Dutz, Ivailo V. Izvorski,
Aart Kraay, Pablo Saavedra, and Sudhir Shetty.
We thank speakers at the World Bank Productivity Conference, who shared frontier
knowledge with us and therefore helped us shape the storyline for this book. Speakers
included Ufuk Akcigit (University of Chicago), Andrew Bernard (Dartmouth College),
Nick Bloom (Stanford University), Jan De Loecker (Katholieke Universiteit Leuven and
Princeton University), Romain Duval (International Monetary Fund), Marcela Eslava
(Universidad de los Andes, Colombia), Keith Owen Fuglie (U.S. Department of
Agriculture), Pinelopi Koujianou Goldberg (Yale University and World Bank Group),
John Haltiwanger (University of Maryland), Chang-Tai Hsieh (University of Chicago),
Joseph Kaboski (University of Notre Dame), Marc Melitz (Harvard University), Diego
Restuccia (University of Toronto), Richard Rogerson (Princeton University), Mark
Rosenzweig (Yale University), Esteban Rossi-Hansberg (Princeton University), Chad
Syverson (University of Chicago), and Jo Van Biesebroeck (Katholieke Universiteit
Leuven). Clearly, they bear no responsibility for the final product, and all interpreta-
tions and errors are our own. We also thank Filippo di Mauro (National University of
Singapore) for helpful discussions, and we acknowledge fruitful interactions and col-
laborations with the Competitiveness Network (CompNet).
Production of the volume was managed by Aziz Gökdemir, Michael Harrup, and
Susan Mandel of the World Bank’s Editorial Production team; Patricia Katayama, of
the Development Economics unit, was the acquisitions editor. Nancy Morrison edited
the volume.

xv
Abbreviations
AI artificial intelligence
CNP Mexican National Productivity Commission
ECA Eastern Europe and Central Asia
GDP gross domestic product
GVC global value chain
HS Harmonized System
ICT information and communication technology
IPUMS Integrated Public Use Microdata Series
IT information technology
LAC Latin American and the Caribbean
MENA Middle East and North Africa
NPS National Productivity System
OECD Organisation for Economic Co-operation and Development
OLS ordinary least squares
PER Public Expenditure Review
P-PER Productivity Public Expenditure Review
QI quality infrastructure
R&D research and development
SAR South Asia
SSA Sub-Saharan Africa
STI Science, Technology, and Innovation
TFP total factor productivity
TFPQ physical total factor productivity
TFPR revenue total factor productivity


xvii
Executive Summary: The Elusive Promise of Productivity
The growth of productivity—the efficiency with which societies combine their people,
resources, and tools—is the main driver of the development process. The appreciation
of the central role of productivity enjoys a long and distinguished pedigree. Paul
Krugman’s oft-repeated quip that “productivity isn’t everything, but, in the long run, it
is almost everything” (Krugman 1994) echoes the earlier reflections of the medieval
Arab social theorist Ibn Khaldun (1332–1406), who argued even more portentously in
his Muqaddimah (1377) that “civilization and its well-being as well as business pros-
perity, depend on productivity.”
Sustained increases in productivity are critical not only to the average denizen of
civilization but also to lifting those who share least in its benefits. Long-term increases
in earnings in industry or agriculture—the source of employment and livelihoods for
many of the poor—can be achieved only by increasing worker or farmer productivity.
Workers will leave informal self-employment only if earnings in the formal sector
merit the shift. Hence, the route to generating good jobs transits directly and inexora-
bly through a sustained agenda to raise productivity. In addition, productivity-driven
cost reductions reduce the prices of key products consumed by the poor and thereby
increase household purchasing power, helping poorer households get more for less.
New technologies reduce the cost and improve the efficiency and efficacy of service
delivery in all social spheres. Raising global productivity growth is thus arguably the
pivotal element of an integrated strategy to generate jobs—and good jobs—and
reduce poverty.
The Twin Productivity Puzzles
The central role of productivity has gained renewed salience in current policy debates
for two reasons. First, the global productivity engine that powered the advanced world
to prosperity has slowed, threatening to reduce the rate at which all countries grow and
with which global poverty is reduced. This slowdown in productivity1 is occurring
despite spectacular advances in computing power and a host of derivative technologies:
the promise of rapid advances through science and technology seems out of sync with
observed slower growth in productivity.

xviii Executive Summary: The Elusive Promise of Productivity
Second, the hoped-for natural convergence of follower countries in the developing
world to the global frontier remains elusive, and many countries remain seemingly
trapped at low- or middle-income levels. Both dimensions must be resolved to lift
global productivity growth rates and reduce poverty.
The Global Productivity Slowdown
There is little consensus as to what has slowed the productivity engine. One school
of thought argues that declining economic dynamism—the “churn” in the economy, in
the form of job reallocation, firm turnover, and entrepreneurial activity—is responsi-
ble for the slump, possibly driven by an increase in regulation or distortions, which are
gunking up the growth machinery. Poor regulation and anticompetitive practices are
documented to exert a powerful drag on total factor productivity, although to explain
the common trends across the diverse member countries of the Organisation for
Economic Co-operation and Development would require attributing the slowdown to
a type of coordination in driving policies that is not readily apparent. Furthermore, this
volume does not find such a decline in churn for a small sample of developing coun-
tries. Another view argues that the global financial crisis financially constrained many
firms; for those firms that depended more on outside financing, productivity had more
trouble bouncing back. Again, the work in this volume confirms that in developing
countries finance is generally more constrained, absolutely restricting investments in
innovation and productivity. These are, in some sense, manageable issues from a policy
point of view: regulation can be improved and the effects of the crisis should dissipate
with time.
However, a more profound concern is that the fundamental fuel of growth, techno-
logical progress, may be drying up and that while eye-catching advances are appearing
almost daily, they do not seem to add up to much in the productivity data, as Robert
Solow (1987) noted, raising questions about how truly transformative they are.
Furthermore, generating even these apparently lesser ideas is growing harder. Since
1950, the number of researchers needed to generate a unit of total factor productivity
has steadily increased (Bloom et al. 2017). Some pessimists, like Robert Gordon (2015,
2017), argue that the best fruits of the tree of knowledge have already been picked. The
new harvests are shinier, but far less nourishing to the process of growth.
More optimistic observers see the advent of artificial intelligence, DNA sequencing
and cell analysis, high-powered computing, and web connectivity, to name a few, as
constituting an entirely new set of tools for discovery or “reinventing inventing” that
potentially multiply the productivity of the new processes for generating ideas. As
Mokyr (2013, 2014) summarizes, “We ain’t seen nothing yet.” Furthermore, both the
scope and the efficiency of that effort are increasing. The number of global researchers
has doubled since 1995, with the largest contribution from developing countries, and

Executive Summary: The Elusive Promise of Productivity xix
information and communication technology facilitates collaboration across great dis-
tances. Like the fragmentation of production of goods in global value chains, a new
globalization of research effort is evolving in which different research tasks are distrib-
uted to countries where they can be done most cheaply.
Some of the resolution of Solow’s paradox likely resides in measurement issues.
Syverson (2016, 2017) suggests that it is unlikely that the missing productivity can be
accounted for by mismeasurement of information and communication technologies
or web-related products. However, it is also true that in general, diffusion of technolo-
gies takes decades and occurs in multifaceted ways, some of them hard to measure—or
even detect at first. Some technologies, like artificial intelligence, require substantial
complementary investments in nontangible assets that, on the books, statistically
depress productivity today but will appear as growth spikes in the future.
Though the pessimist’s viewpoint cannot be discarded out of hand, there is some-
thing incongruous about the simultaneous concerns in civilization’s discourse that
innovation-driven productivity growth is a thing of the past, on the one hand, and on
the other, that progress in robotics and artificial intelligence will displace masses of
workers through productivity gains. There is evidence of the latter effect in the hollow-
ing out of assembly jobs in the advanced economies thought to be due to automation.
As this volume shows, to date there is little evidence of this effect in the developing
world. In fact, robots per capita and the share of the labor force in assembly work seem
positively correlated.
In sum, there is no accepted view yet on either the sources of the global productivity
slowdown, or whether the causes are the same across groups of countries. This volume
does not find a pronounced fall in dynamism, increase in industrial concentration, or
shift toward lower productivity services in the follower countries that are considered
important in the advanced economies.
The Weakness of Economic Convergence
The lack of impact on developing country labor markets may point to a second area of
concern prompting new work on productivity: the continued failure of economic con-
vergence. The average person in an advanced economy produces in just over nine days
what the average person in the lowest-income countries produces in an entire year
(Restuccia 2013). Even were productivity to come to a halt in advanced economies, the
potential contribution to raising global productivity and reducing poverty by achiev-
ing convergence through technological catch-up is immense.
Yet despite early theoretical arguments for a natural force of convergence among the
now frontier countries, it has proven statistically elusive. With some important excep-
tions, the gap has widened, leading to a “Great Divergence” among nations over the

xx Executive Summary: The Elusive Promise of Productivity
past few centuries (see, among others, Pritchett 1997). This lack of convergence
prompted an examination of what the previous volume in this series called the innova-
tion paradox. The gains from adopting and using existing technologies, products, pro-
cesses, and management techniques from abroad are thought to be vast: the radiation
of ideas, technologies, products, and processes to developing countries represents a
positive externality of truly historic proportions. Yet countries and firms do not seem
to exploit these potential gains (Comin and Mestieri 2018). Cirera and Maloney’s
(2017) focus on missing complementarities—in financial markets, in firm capabilities,
and in the business climate—that lower the return to technology adoption offers one
possible piece of this second productivity puzzle, but it is far from an exhaustive
explanation.
In sum, there is no consensus on the first puzzle of the global productivity slowdown,
and the second puzzle remains a long-standing analytical challenge that goes to the
core of the World Bank’s mandate.
Second-Wave Productivity Analysis
While the literature has not offered a definitive explanation for why the productivity
engine has not regained its previous momentum, or why followers are so slow in
catching up to the leaders, it has, over the last 20 years, dramatically increased our
understanding of the underlying mechanisms and dynamics. More profoundly, it has
revolutionized the conceptual and analytical techniques for analyzing productivity and
its determinants.
This study pulls together the underlying shifts in paradigm and measurement
and terms them the “second wave” of productivity analysis. This new wave
has been facilitated by three critical evolutions. First, the access to detailed and
high-quality firm-level data has improved greatly in some economies. Second,
partly aided by this availability, an academic literature has emerged that critically
revisits many established approaches, in particular, the estimation of firm produc-
tion functions, and from there, the identification and measurement of the drivers
of productivity growth. Third, the quantification of human capital or “capabili-
ties” relevant to productivity improvements, in terms of both managerial skills
and, more fundamentally, necessary psychological characteristics, has permitted a
tentative opening of the black box of the role of entrepreneurship in productivity
gains.
This volume employs manufacturing production firm-level data for a variety
of developing economies—including Chile; China; Colombia; Ethiopia; India;
Indonesia; Malaysia; Mexico; Taiwan, China; Thailand; and Romania—to forward
this analytical agenda and ground it in the developing-country reality. The extensive
empirical work and conceptual synthesis presented in this volume offers new

Executive Summary: The Elusive Promise of Productivity xxi
guidance for productivity analysis and dictates a corresponding shift in how to
approach productivity policy in several areas.
1. Employing the new wave of productivity diagnostics and analytics is essential to
sound policy design and evaluation.
Many of the approaches commonly used in productivity diagnostics and analysis rest
on weak conceptual foundations or use databases that lack key variables. They can
lead to identification problems—an inability to distinguish among different potential
drivers—and potentially erroneous policy prescriptions, mistakes in the inferences of
welfare implications and distributional effects from policy reforms, and in the end, an
inability to prioritize the policy reform agenda and make it more effective. To mention
a few issues:
■ The most commonly used measure of productivity, which is revenue total factor
productivity (TFPR, or more commonly written, just TFP), is a flawed diagnostic
of efficiency; hence many analyses relating it to market failures or policy reforms are
correspondingly unreliable. TFPR backs out physical quantity measures by deflat-
ing firm revenues by industry-level price indexes. However, these measures are
contaminated by residual firm-level price effects that capture firm-specific input
costs, product quality, and market power considerations, all of which may be
correlated with policy changes as much as efficiency is.
■ Productivity analysis that does not account for market structure and power may
lead to false inferences about the impact of structural reforms and the channels
through which they work. As an example, the evidence from Chile and India
presented here shows that the impact of trade liberalization on productivity
can vary greatly depending on the structure of input and output markets.
More generally, as De Loecker (2017) stresses, the study of productivity and
market structure needs to be treated in an integrated fashion.
■ The commonly used metric of dispersion of TFPR proposed by Hsieh and
Klenow (2009) is not a reliable measure of distortions in an economy or bar-
riers to an efficient reallocation of factor resources between firms and sectors.
Conceptually, it depends on assumptions that are shown to be unsupported
by the data. Moreover, dispersion can be driven by technological and quality
differences, investment risk, adjustment costs, and markups. New evidence
presented here shows that half of dispersion can be explained by markups
and technological differences and thus are not related to misallocation at all.
Empirically, inferences about misallocation of factors of production prove
highly sensitive to how data are processed, rendering cross-country compari-
sons unreliable. Indeed, just using the raw U.S. data to calculate dispersion
instead of the Census-cleaned data reverses the relationship between the cal-
culated “gains from reallocation” and GDP, showing that the most advanced
econo mies have the most to gain from reallocation.

xxii Executive Summary: The Elusive Promise of Productivity
■ Entrepreneurs cannot be assumed to be similar in human capital, includ-
ing basic numeracy, managerial and technical skills, or psychological traits.
Traditionally, economics has shied away from opening the black box of the
entrepreneur—the individual who on the ground actually combines factors
of production or decides to launch a firm. However, the recent research on
management quality and on culture, and an emerging psychological liter-
ature on the characteristics of successful entrepreneurs, suggest that these
dimensions are almost in a definitional sense central to understanding pro-
ductivity differences.
2. Productivity policy needs to be comprehensive and integrate all three components
of productivity growth.
Aggregate physical total factor productivity (efficiency) growth can be decomposed
into three components or margins: the reallocation of resources from low-productivity
firms to high-productivity firms (the “between” component); increases in productivity
within existing firms due to technology adoption, innovation, and better managerial
skills (the “within” component); and entry of high-productivity and exit of low-
productivity firms (the “selection” component).
The new productivity decompositions presented in this volume confirm that
productivity growth occurs across all three margins. However, the within-firm margin
is relatively more important than the reallocation of the between-firm margin in four
out of six country cases, explaining roughly half or more of efficiency growth in these
economies. Thus, the evidence suggests reweighting the policy focus toward firm
upgrading.
This said, all three components are inextricably linked. On the one hand, barriers to
reallocation of resources driven by distortions—such as trade barriers, poor regulation,
or overbearing state-owned-enterprises that impede reallocation—can discourage
innovation by existing firms and entry by potentially innovative firms. Thus, policy
needs to go beyond standard static analysis and take into consideration dynamic effects.
On the other hand, without innovative firms introducing new products and processes,
even the cleanest economic system will cease to reap gains from reallocation, making
understanding how firms upgrade and where new firms come from as important as
eliminating distortions.
3. Policy needs to work on improving both the operating environment and human
capital and firm capabilities, two essential and complementary ingredients that cut
across all components.
Driving productivity across all three margins in a complementary way are both the
operating environment and a range of types of human capital: numeracy, personality,
managerial and organization skills, and technological capabilities, as well as firm
Executive Summary: The Elusive Promise of Productivity xxiii
organizational capabilities. Though policy approaches often weigh one significantly
more than the other, productivity growth requires progress on both fronts.
Operating environment. Recent work confirms that competition policy and the
reduction of distortions work on productivity through the reallocation channel by
facilitating the transfer of resources to more productive firms; through the within-firm
channel by stimulating incumbents to invest in productivity-enhancing innovation;
and through the entry and exit channel by facilitating the entry of more productive
firms and the exit of less productive ones. Hence, opening markets to international
trade, exposing state-owned industries to competition, and reducing their ability to
prevent the emergence of competitors are over the long term of central importance—
subject to the caveat above that the actual impact of these policies may depend substan-
tially on market structure.
Human capital. However, though the overall system may be crystalline—
undistorted and with all market failures resolved—if there are no entrepreneurs with
the necessary human capital to take advantage of it, there will be no growth. The
centrality of this point and the need for better measurement of human capital is high-
lighted in the World Bank’s recently launched Human Capital Project, which seeks to
better measure and demonstrate the critical contribution to development of a wide
range of skills. This volume documents that the vast majority of the self-employed in
the developing world have limited numeracy and literacy skills, which leads to the
non-productivity-increasing churning seen in much of the developing world. If the
managers inside firms or incipient start-ups lack the managerial capabilities to recog-
nize or respond to new technological opportunities or domestic and foreign competi-
tion, there will be no impetus to upgrade their firms or enter the market, and no
arbitraging of the technology gap between the advanced and follower countries. The
evidence presented here and elsewhere on immigrants makes this case. Some kind of
human capital—whether world experience, business training, risk appetite, or toler-
ance or openness to seeing the viability of a project—permitted them to thrive in the
same imperfect business climate and institutional setup in which locals did not.
Attracting foreign direct investment is an initial way of transferring technology and
driving reallocation, but over the longer term, the enhancement of human capital
along several dimensions—managerial capabilities, technological literacy, capabilities
in risk evaluation—becomes central for both within-firm performance upgrading
and new firm entry.
The two factors, operating environment and human capital, interact importantly.
On the one hand, the volume shows that even among the educated in developing coun-
tries, entrepreneurship rates are extremely low given the potential arbitrage of tech-
nologies to the developing world, perhaps reflecting the absence of these higher-order
skills, but also perhaps reflecting a difficult operating environment that makes it
unprofitable to start a business. On the other hand, recent work and evidence here

xxiv Executive Summary: The Elusive Promise of Productivity
suggest that response to policies to increase competition, such as trade liberalization,
depends on firms’ ability to develop a strategy to meet the competition—the capability
to diversify into other products or upgrade to a different market. This, in turn, depends
on higher-level firm capabilities that rest on core managerial competencies that devel-
oping countries lack.
4. Beyond efficiency: Policy needs to adopt a broader view of value creation in the
modern firm.
The firm is the main creator of value added and the ultimate driver of growth. However,
the work in this volume confirms and extends recent findings that firm performance or
profitability depends on a broader set of firm drivers than efficiency.
Raising product quality. The prices of many products—women’s shoes, cars, or even
fruit—can vary vastly, and much of that variation reflects differences in quality. Raising
quality may actually lower efficiency—because more labor or more expensive inputs
are required to produce higher quality—but increase product differentiation and raise
overall profits. These findings again suggest the need to model the demand side care-
fully when analyzing productivity. There is also a role for standard firm-upgrading
policies, such as extension services, but also a specific focus on meeting international
quality standards and then specialized research and development.
Expanding product demand. Relatedly, evidence from developing countries pre-
sented in this volume confirms recent advanced-economy findings that for firm prof-
itability and growth, efficiency concerns are important at market entry, but over the
life cycle of firms, cultivating a demand base is more important. Thus, the findings
suggest the need to reweight business support services toward helping firms build a
large customer base. Policies to support firm growth should therefore focus on scal-
ing up demand, mainly through innovative solutions that reduce buyer-seller trans-
action costs due to searching, matching, and informational frictions. Examples of
those policies include digital platform development or connection, business interme-
diation, and links to global value chains. Reducing matching costs has been high-
lighted as a major objective of export promotion agencies to facilitate access to
foreign markets.
Clearly, market power raises markups and profitability, although, as the volume dis-
cusses, the long-term implications for technology adoption and growth are theoreti-
cally ambiguous and empirically vary by context.
5. Creating experimental societies: Productivity policy needs to encourage risk taking
and experimentation.
Increasing productivity is fundamentally about placing bets under uncertainty—that a
new product will become popular, that a new technology will provide a competitive

Executive Summary: The Elusive Promise of Productivity xxv
edge, that an idea incarnated in a new firm is a good one and will generate enough busi-
ness to survive and grow. The volume provides a simple framework of entrepreneur-
ship as experimentation that integrates both considerations of operational environment
and a variety of types of human capital.
From the former point of view, minimizing policies that exacerbate risk, such as
erratic fiscal or exchange rate policies, is central, as is the establishment of institutions,
such as universities or public research institutions that underwrite exploration and
technological transfer, financial sectors to diversify risk, and government institutions to
enhance and protect the value of profitable ideas, such as research and development
(R&D) subsidies or patents.
On the human capital side, it requires individuals who, psychologically, are open to
new ideas, can tolerate risk, and are driven to achieve results. Furthermore, these entre-
preneurs need the particular human capital and exposure to the technological frontier
to identify new products and new techniques to improve efficiency or quality and new
markets to enter, and to evaluate and then manage the corresponding risks. They need
to develop the capabilities to incorporate information and adjust plans accordingly:
that is, to learn.
6. Raising government productivity is critical to raising overall productivity.
Government plays a key role in what can be called the National Productivity System
(NPS) by setting the right framework of economic incentives, eliminating distor-
tions, and resolving a broad set of potential market failures or distortions across
areas ranging from infrastructure to innovation to education. Like firms, govern-
ments make policy under uncertainty, in this case, about which market failures
or distortions are most important to address, and what the likely impact of any
policy is likely to be. Also, like firms, governments differ in the productivity and
quality of output. This “output” can be measured along at least four dimensions:
the rationale and design of policy, the efficacy of implementation, the coherence
of policies across the actors in the NPS, and policy consistency and predictability
over time.
In the same way that the volume documents that firms in follower countries tend
to have lower efficiency and produce lower-quality products, it presents evidence that
the same is true of public organizations, also with important consequences:
bureaucratic effectiveness declines with distance from the frontier precisely as the
number of missing markets, distortions, and market failures that need to be redressed
become larger. Thus, on the one hand, given finite resources, including the govern-
ment’s attention span (or bandwidth) and capacity, governments need to identify
some rough ranking of the policy space to prioritize productivity policies based on the
likelihood that they will have a large impact. On the other hand, increasingly the pro-
ductivity of government allows taking on more of these tasks, and doing them better
xxvi Executive Summary: The Elusive Promise of Productivity
and in more coordinated ways, and thus improving the operational context and
human capital essential to driving productivity growth.
Second-wave analytics are critical for ordering policy priorities. The limited produc-
tivity of the public sector dictates improving the ability of governments to identify
truly critical failures in the NPS, and then design and implement feasible policies to
remedy them. In undertaking this task, policy makers need to quantify the importance
of a given market failure or distortion and weigh it against others. The second-wave
analysis discussed in this volume has increased the uncertainty around the impacts of
some traditionally recommended policies and made the analysis to identify critical
policy areas more demanding. As this volume details, this analysis also requires a “sec-
ond generation” of more detailed firm-level data on prices, marginal costs, intangible
assets, quality, and management. Hence an effort at the global and country level to col-
lect such data is necessary.
Governments need to engage in disciplined experimentation. As with the rest of
society, in the absence of all the desired information on diagnostics and policies, gov-
ernments must also become more experimental in searching for the appropriate solu-
tions. Such experimentation requires nimbleness in adjusting to lessons learned and
flexibility in measuring performance, including a tolerance for failure. Continuous
well-designed evaluation of implemented policies, both as rapid follow up and as
sophisticated program evaluation, is a central feature of every relevant government
strategy to deal with a problem, as it both reveals information on what interventions
work and develops a performance and accountability mindset. It also requires anticor-
ruption policies to permit distinguishing corruption from simply a well-placed but
unfortunate bet, and thereby freeing functionaries to take risks. This, along with a
recent literature stressing the importance of giving well-intentioned and capable
bureaucrats the autonomy to experiment (Rasul and Rogger 2018), points to new paths
to rejuvenating the developmental state.
On the other side of the table, the experimentation also needs to be balanced against
the fourth dimension of quality government: the consistency of policy over time for
firms. Frequent policy reversals or changes in priorities with alternations of adminis-
trations adds to firms’ uncertainty about the operational environment and discourages
investments that could enhance productivity. Furthermore, productivity systems fre-
quently show evidence of undisciplined experimentation over many years that leads to
fragmentation of programs and duplication of mandates in many different ministries,
without evaluation of the efficacy of the programs or their best location within the
system.
Both consistency over time and the third dimension—coherence of policies across
the NPS—can be partly mitigated by overarching productivity councils that span
administrations, have legitimacy and weight within the public debate, and oversee the
overall functioning of the various parts of the system. In the realm of innovation policy,

Executive Summary: The Elusive Promise of Productivity xxvii
the World Bank’s Public Expenditure Reviews for Science, Technology, and Innovation
offer a first step by generating a map of government programs and documenting
the flow of resources among them. These can be enhanced to take a broader view of
government productivity programs that can incorporate all three margins of produc-
tivity growth and other dimensions more explicitly. Not only would they reveal the
implicit costs of tax write-offs or subsidies for R&D in existing firms, but they could
map the competitive structure that those firms face, or the degree of regulatory uncer-
tainty in the system.
Industrial policies need to be integrated into broader productivity policy. While much
of the global productivity discussion in this volume focuses on improving managerial,
technological, or innovation capabilities or removing distortions across the productiv-
ity system, industry-specific externalities—local industry-level knowledge spillovers,
input-output links, and labor pooling, for instance—feature prominently in the
literature on growth and trade and have been used to justify government support for
particular sectors.
Such policies can be thought of in the context of policy ranking by the degree of
certainty surrounding the market failure and the likelihood of implementing policy
that can make a positive difference. Such targeted policies are arguably not more prone
to poor execution than, for example, infrastructure or education; the real problem is
that such industry-related externalities have proved extremely difficult to document
and quantify, let alone permit a ranking of goods by their potential for productivity
growth. Furthermore, the vast heterogeneity in levels of productivity and quality docu-
mented in this volume within identical products across different contexts raises con-
cern that these within-product differences portend differences in magnitudes of
spillovers in different contexts as well. That is, just because a good might have externali-
ties does not imply that it automatically will; rather, how a good is produced is poten-
tially more important than what is produced. This volume offers a framework for
understanding the roots of this heterogeneity and how to address it.
Concluding Remarks
In sum, the tremendous effort behind advancing the second wave of productivity
analysis suggests that Ibn Kaldun’s assertion of productivity’s centrality to societal
progress is widely shared. This volume has extended this new literature, anchored it in
the reality of the developing world, and sketched out how it implies a corresponding
shift in policy approach. To date, however, the impact of the new analysis has been less
to definitively answer central questions in productivity growth than to reopen many
debates. Settling those debates will require greater investment in industrial surveys that
collect not only firm-level prices, but also measures of quality, market power, invest-
ments in intangible assets, and technology and managerial capabilities across all sectors
of the economy, including services. Similarly, efforts to understand the drivers of
xxviii Executive Summary: The Elusive Promise of Productivity
productive entrepreneurship must continue. This volume pulls together the first set of
analytical and policy lessons from second-wave thinking to date, but also aspires to lay
out the broad outlines of this ambitious analytical agenda going forward.
Note
1. This slowdown was characterized by a decline in labor productivity growth rates from 2.7 percent during the 1999–2006 period to 1.5 percent in 2015, and from 0.9 percent to −0.3 percent for total factor productivity for the same periods.
References
Bloom, N., C. I. Jones, J. Van Reenen, and M. Webb. 2017. “Are Ideas Getting Harder to Find?” NBER Working Paper 23782, National Bureau of Economic Research, Cambridge, MA.
Cirera, X., and W. Maloney. 2017. The Innovation Paradox: Developing-Country Capabilities and the Unrealized Promise of Technological Catch-Up. Washington, DC: World Bank Group.
Comin, D., and M. Mestieri. 2018. “If Technology Has Arrived Everywhere, Why Has Income Diverged?” American Economic Journal: Macroeconomics 10 (3): 137−78.
De Loecker, J. 2017. “Productivity Analysis Using Micro Data. Where Do We Stand?” Background paper for Productivity Revisited, World Bank, Washington, DC.
Gordon, R. 2015. “Secular Stagnation: A Supply-Side View.” American Economic Review 105 (5): 54–59.
———. 2017. The Rise and Fall of American Growth: The U.S. Standard of Living since the Civil War. Princeton, NJ: Princeton University Press.
Hsieh, C. T., and P. J. Klenow. 2009. “Misallocation and Manufacturing TFP in China and India.” Quarterly Journal of Economics 124 (4): 1403–48.
Khaldun, I. 1377. The Muqaddimah: An Introduction to History. Princeton, NJ: Princeton University Press. 2015 edition.
Krugman, P. R. 1994. The Age of Diminished Expectations: U.S. Economic Policy in the 1990s. Cambridge, MA: MIT Press.
Lederman, D., and W. Maloney. 2012. Does What You Export Matter? In Search of Empirical Guidance for Industrial Policies. Latin America Development Forum. Washington, DC: World Bank.
Mokyr, J. 2013. “Is Technological Progress a Thing of the Past?” Vox CEPR Policy Portal, September 8. https://voxeu.org/article/technological-progress-thing-past.
———. 2014. “Secular Stagnation? Not in Your Life.” In Secular Stagnation: Facts, Causes and Cures, edited by C. Teulings and R. Baldwin. VOX EU.
Pritchett, L. 1997. “Divergence, Big Time.” Journal of Economic Perspectives 11 (3-Summer): 3–17.
Rasul, I., and D. Rogger. 2018. “Management of Bureaucrats and Public Service Delivery: Evidence from the Nigerian Civil Service.” Economic Journal 128 (608): 413–46.
Restuccia, D. 2013. “Factor Misallocation and Development.” In The New Palgrave Dictionary of Economics, online edition, edited by Steven N. Durlauf and Lawrence E. Blume. Basingstoke, U.K.: Palgrave Macmillan.
Solow, Robert M. 1987. “We’d Better Watch Out.” New York Times Book Review, July 12, 36.
Syverson, C. 2016. “Has a Worldwide Productivity Slowdown Started?” Background paper for Productivity Revisited, World Bank, Washington, DC.
———. 2017. “Challenges to Mismeasurement Explanations for the U.S. Productivity Slowdown.” Journal of Economic Perspectives 31 (2): 165–86.

1
1. The Elusive Promise of Productivity
Productivity—the efficiency with which societies combine their people, resources, and
tools—is the central driver of the development process. The appreciation of the central
role of productivity enjoys a long and distinguished pedigree. Paul Krugman’s oft-
repeated quip that “productivity isn’t everything, but, in the long run, it is almost
everything” (Krugman 1994) echoes the earlier reflections of medieval Arab social
theorist Ibn Khaldun (1332–1406), who argued even more portentously in his
Muqaddimah (1377) that “civilization and its well-being as well as business prosperity
depend on productivity.”
Sustained increases in productivity are critical not only to the average denizen of
civilization but to those who share least in its benefits. Long-term incremental
improvements in earnings in industry or agriculture—the source of employment
and livelihoods for many of the poor—can be achieved only by increasing worker or
farmer productivity.1 Workers will leave informal self-employment only if earnings
in the formal sector merit it. Hence, the route to generating good jobs transits
directly and inexorably through the productivity reform agenda. In addition,
productivity-driven cost reductions reduce the prices of key products consumed by
the poor and thereby increase household purchasing power, helping poorer house-
holds get more for less. New technologies reduce the cost and improve the efficacy
of service delivery in all social spheres. Raising global productivity is thus arguably
the pivotal element of an integrated strategy to generate jobs—and good jobs—and
reduce poverty.
The Twin Productivity Puzzles
The central role of productivity has gained renewed salience in current policy debates
for two reasons. First, the global productivity engine appears to have stalled. The recent
productivity slowdown in advanced economies and, to a lesser extent, follower coun-
tries threatens to reduce the rate at which all countries are pulled ahead and global
poverty is alleviated. This slowdown is occurring despite spectacular advances in com-
puting power and a host of derivative technologies: the promise of rapid advance in
science and technology seems out of sync with observed slower growth in productivity.
2 Productivity Revisited
Second, the hoped-for natural convergence of follower countries in the developed
world to the global frontier has not materialized, and many countries remain seemingly
trapped at low- or middle-income levels. Both pieces of this puzzle must be resolved to
raise global productivity growth rates.
As this chapter documents, there is no consensus on why the engine of produc-
tivity growth has not regained its previous power, or why followers are so slow in
catching up to the leaders. However, over the past few decades, the analytical frame-
works through which these phenomena are viewed and their roots are analyzed have
experienced major shifts, both conceptually and empirically, dramatically increas-
ing our understanding of the functioning of the underlying mechanisms and
dynamics.
This volume pulls together the underlying shifts in paradigm and measurement and
terms them the “second wave” of productivity analysis. This new wave has been facili-
tated by three critical evolutions. First, the access to detailed and high-quality firm-
level data has increased across the world. Second, partly aided by this availability, an
academic literature has emerged that is critically revisiting many established approaches,
in particular, the estimation of firm production functions, and from there, the identifi-
cation and measurement of the drivers of productivity growth.2 Third, the quantifica-
tion of human capital or “capabilities” relevant to productivity improvements, in terms
of both managerial skills, and more fundamentally, psychological characteristics, has
permitted a tentative opening of the black box of entrepreneurship, the central driver
of productivity over the long run.
Each of these developments has important implications for how to think about
the challenge of raising productivity and for the corresponding policies that are
advanced. The relaxing of the assumptions of perfect competition and identical
firms allows researchers to reintroduce questions of market structure into produc-
tivity analysis and reopen long-standing questions about the impacts of trade liber-
alization and competition on innovation and productivity growth. The focus on
product quality and the evolution of product demand moves thinking about pro-
ductivity beyond the unique focus on efficiency as a determinant of firm perfor-
mance. An appreciation for the role of risk in all dimensions augments the customary
discussion of distortions in the business climate. The realization of the broad spec-
trum of capabilities required to start and run modern firms dictates a reconsidera-
tion of the importance of human capital relative to the environment in which
it operates.
These and other themes will be recurring leitmotifs across this volume, which syn-
thesizes and extends this literature and provides new evidence to ground it in the
developing- country reality. In particular, to illustrate the power of these approaches,
the volume employs firm-level data sets from several representative follower countries
that collect the variables needed to permit second-wave analysis.
The Elusive Promise of Productivity 3
The Current Productivity Conjuncture
Global labor productivity growth is showing signs of life after a 10-year period of
stagnation.3 Labor productivity—the additional output per worker—is projected to
grow at 2.3 percent in 2018, up from 2.0 percent in 2017 and 1.4 percent in 2016, the
Conference Board projects.4 Despite this positive news, the projected rates remain sub-
stantially below the precrisis (2000–07) rates of 3.0 percent per year, and most of the
recovery is driven by the advanced economies.
In the United States, aggregate labor productivity growth averaged only
1.3 percent per year from 2005 to 2015, less than half the average annual growth
rate of 2.8 percent sustained over 1995–2004. Similarly sized decelerations have
occurred in 28 of 29 other countries for which the Organisation for Economic
Co-operation and Development (OECD) has compiled productivity growth data,
as shown in panel a of figure 1.1. The unweighted average annual labor productiv-
ity growth rate across these countries was 2.3 percent from 1995 to 2004, but only
1.1 percent from 2005 to 2014.5
What Are the Drivers behind the Decline?
Panel b of figure 1.1 comes to the same conclusion, presenting a smoothed view over
time for a broader set of countries. While developing countries had a larger productiv-
ity “bounce” from 2000 to the start of the global financial crisis, they too experienced
downturns after 2007, leading to a significant slowdown in aggregate world labor pro-
ductivity. These trends, if permanent, are hugely consequential. The worldwide drop of
0.8 percent per year in average labor productivity growth that occurred after 2006, and
was sustained for 10 years, lowered gross world product in 2017 by about $8.3 trillion—
or $1,100 per person—compared with the level it would have been in the absence of the
decline (Syverson 2016).
Labor productivity growth has two sources: capital deepening (increases in the amount
of capital used by workers) and growth in total factor productivity (TFP). The latter is the
traditional measure of efficiency that captures the portion of output not explained by
intermediate inputs, labor, and capital.6 In general, comparable data on these inputs are
difficult to find; hence labor productivity, simply economic output divided by labor, is
used as a rough proxy. However, for the OECD member countries, where the necessary
data are available, for 18 of the 30 countries shown in figure 1.1, slower growth in TFP
appears to have been the principal driver of the overall labor productivity slowdown.
Figure 1.2 shows the breakdown of average deceleration in labor productivity across these
countries, which fell from 2.1 percent per year over 1995–2004 to only 1.0 percent annu-
ally over 2005–14. The OECD further splits capital deepening into two subcomponents:
the part related to information and communication technology (ICT) capital, and the part
tied to all other types of capital.

4 Productivity Revisited
The total change in labor productivity growth is the sum of three components: the
change in TFP growth, changes in ICT capital deepening, and changes in non-ICT
capital deepening. Most of the 1995–2004 to 2005–14 labor productivity growth
slowdown—about 0.9 percentage point of the total 1.1 percentage point drop—
reflects a reduction in TFP growth. Though not discernable from the figure, this
overwhelming contribution of TFP growth to movements in labor productivity holds
FIGURE 1.1 The Rate of Growth of Output per Worker Has Been Falling in Both Industrial and Developing Countries for Decades
–1
0
1
2
3
4
5
6
Aust
riaBe
lgiu
mCa
nada
Switz
erla
ndCh
ileCz
ech
Repu
blic
Germ
any
Denm
ark
Spai
nFi
nlan
dFr
ance
Unite
d Ki
ngdo
mGr
eece
Hung
ary
Irela
ndIc
elan
dIs
rael
Italy
Japa
nKo
rea,
Rep
.Lu
xem
bour
gM
exic
oNe
ther
land
sNo
rway
New
Zea
land
Pola
ndPo
rtuga
lSw
eden
Turk
eyUn
ited
Stat
es
Perc
ent
1995–2004 2005–14
a. Average annual labor productivity growth for 30 OECD countries, 1995–2004 and 2005–14
0
1
2
3
4
5
Tren
d pr
oduc
tivity
gro
wth
(% c
hang
e)
1950 1960 1970 1980 1990
b. Smoothed average annual labor productivity growth by region, 1970–2015
2000 2010 2020
United States Emerging markets and developing economiesOther advanced economies World
Sources: Syverson 2016 (panel a); Conference Board, Total Economy Data Base, 2018 (panel b).Note: Panel b plots the trend in the unweighted average rate of labor productivity growth across countries for four country groups between 1950 and 2018. Trends are obtained using a Hodrick-Prescott filter with smoothing parameter 100.

The Elusive Promise of Productivity 5
when measured at annual frequency as well, with a correlation between the two mea-
sures of 0.95. Overall, the ties between labor productivity and capital deepening are
substantially smaller.7
Hence, as suggested in the introduction, improvements in labor productivity, and
thus worker remuneration over the long run, appear to be largely a function of TFP
growth. The roots of this global (TFP) decline are thus of first-order importance.
However, there is little consensus on what they are, whether they are common to both the
advanced and developing countries, or to what extent, and how, they can be remedied.
Recent work for the United States (including Davis and Haltiwanger 2014 and Decker
et al. 2015) has definitively established a moderation in U.S. business dynamism: the
“churn” in the economy—job reallocations, firm turnover, and entrepreneurial
activity—has been declining for some time, including in what are thought by many to
be vibrant sectors, like ICT.8 If this decline is driven by increased rigidities or uncertainty
that prevent firms from adjusting to shocks or investing (Bloom 2007; Bloom, Bond,
and Van Reenen 2007; Gorodnichenko and Ng 2017), it can be reversed with reforms,
consistent application of policy, and time. Similarly, the global financial crisis financially
constrained many firms. Productivity in firms that depended more on outside financing
had more trouble bouncing back, as documented by Duval, Hong, and Timmer (2017).
This setback is unlikely to be permanent. Another explanation emphasizes the role of
technological change and fragmentation and internationalization of production in
making firms’ boundaries more permeable and changing how firms respond to
shocks (Doms, Jarmin, and Klimek 2004; Foster, Haltiwanger, and Krizan 2006).
Source: Syverson 2016. Note: ICT = information and communication technology; LP = labor productivity; TFP = total factor productivity.
Perc
ent p
er y
ear
0LP growth,
1995–2004TFP slowdown Slower ICT
capital deepeningFaster non-ICT
capital deepeningLP growth,2005–14
0.5
1.0
1.5
2.0
2.5
FIGURE 1.2 Decomposition of the Slowdown in Labor Productivity Growth into Two Components: Total Factor Productivity and Capital Deepening

6 Productivity Revisited
As chapter 4 suggests, new World Bank evidence based on the use of firm-level census
data for six developing countries (Chile, China, Colombia, Ethiopia, Indonesia, and
Mexico) since 1997 suggests some signs of declining business dynamism for some indi-
cators for some economies—but if real, this decline is far less pronounced than that in
the United States and does not appear to be generalizable.
However, the evidence suggests understanding productivity dynamics requires a lon-
ger historical view. The slowdown is not a new phenomenon or concern. Cette, Fernald,
and Mojon (2016) find that the global slowdown started before the onset of the Great
Recession, so it is not purely a result of cyclical factors; Baumol and McLennan (1985),
Wolff (1985), and Fischer (1988) document a slowdown in the 1970s and 1980s; and
Phelps (2013) asserts that America’s peak years of productivity gains ran from the 1820s
to the 1960s! Figure 1.3 presents Bureau of Labor Statistics estimates of TFP over the
past 119 years for the United States and documents that, in fact, productivity growth
swings are very long. It might be that the bunching of innovations from the two world
wars propelled the U.S. economy through the 1970s, but their contribution played out
by the 1990s. Viewed at this historical scale, the impacts of crisis, increased uncertainty,
or increased rigidities seem almost conjunctural. The overriding question is why pro-
ductivity growth since 1973 has been roughly half that from 1919 to 1973—or, put dif-
ferently, what drives these 50-year productivity booms? The pace of invention and
diffusion of new technologies would seem to be the primary candidate.
FIGURE 1.3 The United States Experienced Long Swings in Productivity Growth(Growth in U.S. total factor productivity, 1899–2018)
Source: Elaboration using Bakker, Crafts, and Woltjer, forthcoming, and Bureau of Labor Statistics.
0
0.5
1.0
1.5
2.0
2.5
1899
–190
9
1909
–19
1919
–29
1929
–41
1948
–60
1960
–73
1973
–89
1989
–200
0
2000
–07
2007
–18
Tota
l fac
tor p
rodu
ctivi
ty g
row
th (p
erce
nt p
er y
ear)

The Elusive Promise of Productivity 7
Technological Progress and the Case of Missing Productivity
If both the long-term decline since the 1970s and that since 2007 are being driven by
the increasing difficulty of generating new technological innovations, the problems
are more profound than implementing reforms or working through the recession.
The 2000s may represent a transient boomlet driven by ICT, but the overall trend
from the 1960s might support Gordon’s (2015) argument that the best fruits of the
tree of knowledge have already been picked. The new harvests are shinier, but far less
nourishing to growth. Bloom et al. (2017) show it takes progressively more research-
ers to generate a unit of TFP. The number of researchers has increased almost
25 times since 1950, suggesting that reaching fruit on the higher branches will
become increasingly challenging. If true, then the future growth of the world econ-
omy will be permanently slowed, with attendant consequences for reducing global
poverty and welfare.
However, the long-term deceleration in productivity growth has puzzled numer-
ous observers in light of the arrival of what does appear to be an impressive array
of new and powerful technologies and scientific tools. Mokyr (2013, 2014) argues
these herald another boom: DNA sequencing machines and cell analysis through
flow cytometry have revolutionized molecular microbiology; high-powered com-
puters are helping research across vast domains of knowledge; new tools in astron-
omy, nano chemistry, and genetic engineering have led to radical changes in
understanding in these fields. At the same time, the web and associated search
systems permit the curating and searching of vast amounts and types of emerging
knowledge.
Furthermore, as Aghion, Jones, and Jones (2017) argue, artificial intelligence (AI)
may also change the production of new ideas themselves, solving complex problems in
the near term, but also facilitating learning and imitation of technologies across firms,
sectors, and activities, thus increasing the scope for knowledge externalities. AI could
widen new product lines. For example, the recent boost in AI following the machine-
learning revolution has spurred the invention of flying drones and advances toward
self-driving cars. These tools of discovery multiply researcher’s efforts and, when they
lead to innovations brought to market, increase productivity.
Consistent with the idea that global growth was living off discoveries of the war
years into the 1960s, it may be that, as box 1.1 discusses for the information technol-
ogy (IT) industry, it takes time for new technologies to trickle through to the real
economy. Brynjolffsson, Rock, and Syverson (2017) argue that the most impressive
capabilities of AI, particularly those based on machine learning, have not been dif-
fused widely yet. Furthermore, like other general-purpose technologies of the past,
their full effects will not be realized until the necessary complementary innovations
are developed and implemented.

8 Productivity Revisited
And while it may well be the case, as Bloom et al. (2017) note, that it takes more
researchers per idea each year to advance the technological frontier, both the scope and
the efficiency of that effort are increasing. On the one hand, more researchers are com-
ing online globally who are capable of contributing new ideas that all economies can
use: South Africa’s early pioneering work in heart transplants, and Estonia’s develop-
ment of Skype, for example, are discoveries for all. The number of global researchers
has doubled since 1995, with a disproportionate contribution from the developing
world, which is rapidly converging to the level of the advanced economies (figure 1.4).
And these researchers can work progressively more efficiently than in the past. The
internet allows greater search for ideas, but also permits real-time collaborations the
likes of which Niels Bohr and far-flung colleagues exchanging ideas on the atom
through snail mail could not imagine a century ago. Finally, as Branstetter, Li, and
Veloso (2013) note in work supported by the World Bank, a new international division
of innovation effort—effectively trade in research tasks—is emerging, analogous to
standard international trade in goods. Figure 1.5 shows that while both India and
China are making great advances in innovative capabilities and patenting, the bulk of
patents registered with the United States Trademark and Patent Office are done under
the auspices of foreign multinationals that are outsourcing the relatively routine and
codified R&D segments of the knowledge production chain, while researchers in
BOX 1.1
Are the Current Productivity Lags Just the Calm before the Next Productivity Storm?
There is considerable evidence that information technologies (IT) were a key force behind produc-tivity acceleration episodes in the late twentieth century (see, for example, Jorgenson, Ho, and Stiroh 2008), but these growth spurts appeared with a long lag, after a 20-year period (roughly 1974–94) of brisk investment in IT. The absence of an impact of IT on productivity during this period prompted Robert Solow to make his famous observation, “You can see the computer age everywhere but in the productivity statistics” (Solow 1987, 36). Recent works like Fernald 2014 and Byrne, Oliner, and Sichel 2013 have presented evidence that these IT-based gains have slowed over the past decade. But perhaps this represents a respite between periods of fast productivity growth. This view implies that while highly effective new technologies are being created, there are implementation and adjustment costs that must be paid before they can be effectively deployed to obtain noticeable improvements in productivity (see, for example, van Ark 2016).
History may offer some guidance on the issue of productivity gains from general-purpose technologies like IT. Syverson (2013) shows that the productivity growth from “portable power” technologies like electrification and the internal combustion engine arrived in two waves sepa-rated by a decade-long slowdown. While this prior diffusion hardly implies that a second IT wave is imminent, it does show that productivity accelerations from general-purpose technologies do not have to be one-off events. Just because their resultant productivity growth sped up in the late 1990s and early 2000s does not mean it cannot speed up again.

The Elusive Promise of Productivity 9
FIGURE 1.4 The Number of Global Researchers Has Doubled since 1995, with Most Growth in the Developing World
Source: Elaborations using UNESCO data.
19950
2
4
6
8
Num
ber o
f res
earc
hers
(milli
ons)
2000 2005 2010 2015
World Developing countries Advanced economies
Source: Branstetter, Li, and Veloso 2013.
FIGURE 1.5 Most of the U.S. Patent and Trademark Office Patents in China and India Have Been Co-invented and Sponsored by Multinational Firms
Purely Chinese (panel a)/Indian (panel b) invented and assigned to other types of organizations
Purely Chinese (panel a)/Indian (panel b) invented and assigned to indigenous firms
Purely Chinese (panel a)/Indian (panel b) invented and assigned to multinational firms
Co-invented and assigned to multinational firms
Co-invented and assigned to indigenous firms
Co-invented and assigned to other types of organizations
3,000
2,000
Num
ber o
f pat
ents
1,000
01980 1990 2000
Grant year
a. China
2010
b. India
Grant year
1970 19901980 2000
Num
ber o
f pat
ents
2010
1,500
1,000
500
0
10 Productivity Revisited
advanced economies may provide more sophisticated, creative, and high-level intel-
lectual input. Hence, while new discoveries may be taking more and more research
effort, the size and global productivity of that effort is increasing.
Are Measurement Issues Obscuring True Productivity Growth?
Some analysts have suggested that the deceleration in productivity is substantially illu-
sory and represents a problem with measurement.9 This “mismeasurement hypothesis”
argues that products emerged in the mid-2000s, such as Google search, that are highly
valued, but whose contributions to economic activity are difficult to capture in stan-
dard economic statistics because they are consumed at a zero price—or at least at a very
low price relative to their social value. Hence the gains in true productivity are not
reflected in the prevailing economic output statistics.
However, this hypothesis starts to falter when confronted by its implications for
what can be measured in the data. Multiple recent systematic analyses using varied
approaches and data have found that the slowdown is not primarily a mismeasure-
ment phenomenon (see Cardarelli and Lusinyan 2015; Byrne, Fernald, and Reinsdorf
2016; Nakamura and Soloveichik 2015; and Syverson 2016). As one example, for the
OECD, figure 1.6 plots the relationship between the size of a country’s productivity
slowdown (on the vertical axis) and two measures of the importance of IT products
in that country’s economy: on the demand side, the fraction of the country’s house-
holds that have a broadband connection; and on the supply side, the share of
value added accounted for by ICT-producing industries. Figure 1.6 reveals no obvious
relationship to the eye, and a regression analysis confirms this.10
Brynjolfsson, Rock, and Syverson (2017) alternatively postulate that the delays in
building the necessary intangible complements to innovations such as AI—including
R&D, patents, trademarks and copyrights, or organizational or entrepreneurial capital—
can distort the measurement of TFP because these complements are not well counted in
the imperfect notion of gross domestic product (GDP). The early investments in labor
and capital for these complements, which are not yet counted in GDP and whose output
lies in the future, will appear as a decline in TFP. Brynjolfsson and his coauthors cite
Brookings Institution research that investments in autonomous vehicles exceeded $80
billion from 2014 to 2017, with little consumer adoption of these technologies yet. This
amounts to 0.44 percent of 2016 GDP (spread over three years). Adding in equally costly
labor inputs would lower estimated labor productivity by 0.1 percent per year over the
last three years.11
Another form of mismeasurement may arise from not taking important changes in
industrial organization into account in the estimation of productivity. De Loecker and
Eeckhout (2018) argue that the increase in industrial concentration of the U.S. econ-
omy (and in Europe as well) has increased markups and led to a corresponding fall in

The Elusive Promise of Productivity 11
FIGURE 1.6 There Is No Obvious Relationship between the Productivity Slowdown and the Prominence of Information Technology
AUS BELCAN
CHE
CZE
DEU
DNK
ESP
FIN
FRA
GBR
HUN
IRL
ISL
ITAJPN
KOR
LUX NLD
NOR
POL
PRT
SWETUR
USA
–3
–2
–1
0
1
Perc
enta
ge c
hang
e in
labo
r pro
duct
ivity
gro
wth
20 40 60 80 100Percentage of households with broadband
a. Productivity slowdown and household broadband usage
–3
–2
–1
0
1
Perc
enta
ge c
hang
e in
labo
r pro
duct
ivity
gro
wth
4 6 8 10 12
ICT percentage of value added
b. Productivity slowdown and share of value added from ICT production
BEL
CANCHE
CZE
DEUDNK
ESP
FIN
FRA
GBR
GRC
HUN
IRL
ISL
ITA
JPN
KOR
LUXNLD
NORPOL
PRT
SWE
USA
Source: Syverson 2016. Note: This figure plots the size of the measured productivity slowdown from 1995–2004 to 2005–14 in a country versus the share of the country’s households with a broadband connection (panel a) or the value-added share of information and communication technologies (ICT) producers in the country (panel b). All data are from the Organisation for Economic Co-operation and Development. See chapter text and Syverson 2016 for details.
the share of income going to labor and capital. Taking these into effect, they find that
productivity growth has increased since 1980 and has hovered around 3 percent–4 percent
since the 2007 crisis. This, however, cannot explain why labor productivity, defined as
output divided by number of workers, should also fall. Furthermore, De Loecker and
Eeckhout (2018) show that Latin American markups have remained high, but have not
increased over the last decades. Estimates from six representative countries do not sug-
gest an increase in industrial concentration (figure 1.7) (see also Díez, Leigh, and
Tambunlertchai 2018).

12 Productivity Revisited
Hence, on balance, there are some reasons to think that production data are under-
measuring at least the current and future impact of new technologies. In addition,
there is something incongruous about the simultaneous concerns, on the one hand,
that productivity growth is a thing of the past and on the other, that rapid progress in
robotics and AI will displace masses of workers through productivity gains. Across
the centuries, disruptive technologies have eliminated certain types of jobs (manual
weavers being the iconic example) while creating entirely new professions (computer
programmers, heart surgeons, automobile assemblers) that pay substantially better.
The labor data do suggest that important employment effects of automation and
technology-facilitated outsourcing are likely responsible for the polarization of
advanced-economy labor markets.12
However, evidence of this effect for developing countries is still scattered and weak,
perhaps partly because technology has not yet arrived in all these countries or because
the intensity of use of these technologies has diverged (Comin and Mestieri 2018).
Figure 1.8, using census data, confirms that for advanced economies, employment for
workers engaged as machinery operators or in crafts has declined or stagnated com-
pared with higher-end professional employment or lower-skilled clerks, service work-
ers, or elementary occupations. Figure 1.9 suggests that, in fact, in advanced economies,
more robots are associated with fewer jobs for manufacturing operators, although not
necessarily more total jobs.
FIGURE 1.7 Industrial Concentration Has Not Increased in a Sample of Emerging Markets
0.2
0.4
0.6
0.8
1.0To
p fo
ur s
hare
of i
ndus
try s
ales
1997 2000 2003 2006 2009 2012
ChileEthiopia
ChinaIndonesia
Côte d’IvoireMorocco
Source: Authors’ elaboration using census data. Note: The figure plots the average fraction of total manufacturing industry sales that is accounted for by the largest four firms within that industry in selected developing countries. Concentration ratios are calculated for each four-digit industry and then averaged across manufacturing using industry weights.
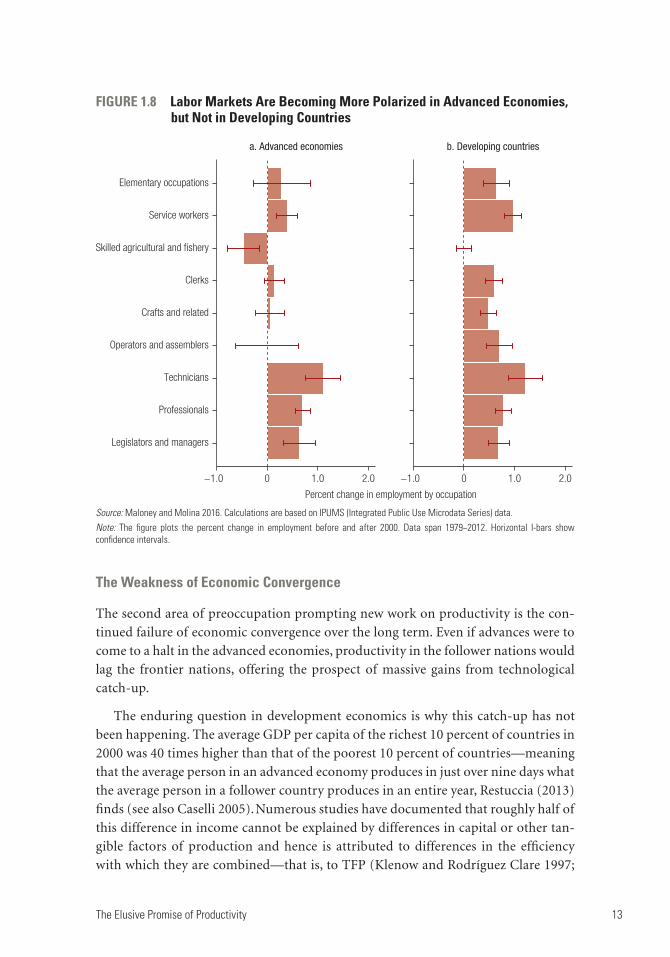
The Elusive Promise of Productivity 13
The Weakness of Economic Convergence
The second area of preoccupation prompting new work on productivity is the con-
tinued failure of economic convergence over the long term. Even if advances were to
come to a halt in the advanced economies, productivity in the follower nations would
lag the frontier nations, offering the prospect of massive gains from technological
catch-up.
The enduring question in development economics is why this catch-up has not
been happening. The average GDP per capita of the richest 10 percent of countries in
2000 was 40 times higher than that of the poorest 10 percent of countries—meaning
that the average person in an advanced economy produces in just over nine days what
the average person in a follower country produces in an entire year, Restuccia (2013)
finds (see also Caselli 2005). Numerous studies have documented that roughly half of
this difference in income cannot be explained by differences in capital or other tan-
gible factors of production and hence is attributed to differences in the efficiency
with which they are combined—that is, to TFP (Klenow and Rodríguez Clare 1997;
FIGURE 1.8 Labor Markets Are Becoming More Polarized in Advanced Economies, but Not in Developing Countries
Source: Maloney and Molina 2016. Calculations are based on IPUMS (Integrated Public Use Microdata Series) data.Note: The figure plots the percent change in employment before and after 2000. Data span 1979−2012. Horizontal I-bars show confidence intervals.
Legislators and managers
Professionals
Technicians
Operators and assemblers
Crafts and related
Clerks
Skilled agricultural and fishery
Service workers
Elementary occupations
−1.0 0 1.0 2.0 −1.0 0 1.0 2.0
a. Advanced economies b. Developing countries
Percent change in employment by occupation

14 Productivity Revisited
FIGURE 1.9 Are Robots Displacing or Creating Manufacturing Jobs?
0
2
4
6
8
10
Oper
ator
s an
d as
sem
bler
s pe
r 100
inha
bita
nts
20 40 60 80
Robots per 100,000 inhabitants
Advanced economies Less-developed countries
Source: Maloney and Molina 2016. Calculations are based on IPUMS (Integrated Public Use Microdata Series) data.
Easterly and Levine 2001). The potential contribution to raising global productivity
and reducing poverty of achieving convergence are immense.
Yet despite early arguments for a natural process of convergence among the now-
frontier countries (Baumol 1986), it has subsequently proven statistically elusive (see,
for example, De Long 1988). Furthermore, Pritchett (1997), among others, documents
a “Great Divergence” of the last two centuries where, instead of follower countries
catching up, advanced economies, with few exceptions, continue to pull ahead. The
emergence of different “convergence clubs” (Quah 1996; Maasoumi, Racine, and
Stengos 2007), in which follower countries converge to clumps of similar levels of
income far from the frontier, has been documented to be largely a matter of differences
in productivity growth. Convergence seems to be weakening even in the regions where
it was assumed. A recent World Bank study, “Growing United” (Ridao-Cano and
Bodewig 2018), shows that the productivity gap between southern and northern mem-
ber states of the European Union has been widening since the early 2000s. Convergence
is elusive at the subnational level as well.13 What is clear is that reducing the between-
country differences in productivity would contribute massively to global productivity
growth. Yet convergence does not appear to be an inevitable natural force, like gravity.
This fact underlies what the previous volume in this series (Ciera and Maloney
2017) called the innovation paradox, focusing on the puzzle of why rates of

The Elusive Promise of Productivity 15
technology adoption are low in developing countries, and how that inhibits con-
vergence. The gains from adopting existing products, processes, and management
techniques from abroad are thought to be large. Indeed, the radiation of ideas,
products, and technologies to developing countries represents an externality of
truly historic proportions. In fact, Comin and Hobijn (2004, 2010) and Comin and
Ferrer (2013) argue that it is precisely the differences in the rate and intensity of
adoption of new technologies that drives the magnitude of the Great Divergence.14
Comin and Mestieri (2018) argue that a reduction in the average adoption lag by
one year is associated with a 3.8 percent higher per capita income. Cutting the
adoption lag faced by a country from 50 years longer than the United States to the
U.S. level is associated with an increase in per capita income by a factor of seven!15
Recent estimates of the returns to one type of innovation investment, R&D, for the
United States and Spain put them at a striking 40 percent to 60 percent annually.16
Griffith, Redding, and Van Reenen (2004) and Goñi and Maloney (2017) show that
returns rise much higher (potentially to the triple digits) with increased distance
from the technological frontier for a while, reflecting the gains from Schumpeterian
catch-up afforded to follower countries. Yet countries do not seem to exploit these
potential gains.
Ironically, the lack of polarization observed in panel b of figure 1.8 for developing
countries may be due partly to this low rate of technological adoption. The underly-
ing data suggest perhaps incipient effects observed in more advanced economies like
Mexico and Brazil, but the majority of countries in the sample show nothing. In fact,
the exact reverse effect is observed in Vietnam and China, which may be because, as
figure 1.9 suggests, in developing countries, robot density is associated with higher
employment of operators and assemblers, in contrast to advanced economies. This
may arise in cases where large-scale offshoring also involves the introduction of auto-
mation. As Maloney and Molina (2016) discuss, there are many reasons why automa-
tion and robots would be adopted more slowly in the majority of developing
countries, ranging from the country’s technological absorptive capacity to the skill of
the workforce, its ability to mobilize resources for large capital investments, the
capacity for maintenance, and attention to tolerances. As these problems are
redressed, today’s advanced-economy problems may, in fact, become those of the
developing world tomorrow.
The Mechanisms of Productivity Growth: Second-Wave Analysis
In sum, there is no firm consensus on the first puzzle of the global productivity slow-
down and, in fact, the causes may differ between advanced economies and develop-
ing countries. There appears not to be a pronounced fall in dynamism or increase in
industrial concentration or shift toward lower-productivity services (see box 1.2) in
developing countries that have been forwarded as explanations, for instance,

16 Productivity Revisited
BOX 1.2
Structural Transformation Decompositions
Following in the spirit of economists from Kuznets to Chenery who have detailed the movement of labor from agriculture to manufacturing, McMillan and Rodrik (2011) and McMillan, Rodrik, and Verduzco-Gallo (2014) decompose labor productivity growth into two components: one that holds labor shares in different sectors constant but allows changes in average labor productivity, and another that holds sectoral productivity constant and allows for observed reallocation of labor. They find the latter component plays an important role in many high-growth countries.
Rogerson (2017), for this volume, examines data for Asia and broadly confirms their findings. Structural transformation—effectively the analog to the “between” dimension discussed earlier—does in some cases account for half of productivity growth (China, Thailand), although in many cases it accounts for less than 10 percent. Little structural transformation has occurred in high-growth Malaysia, and in both India and Indonesia structural transformation has been far less extensive than in China or Thailand (figure B1.2.1).
A second important takeaway is that the importance of reallocation diminishes with the level of income, accounting for very little in more advanced economies. In the United States, structural transformation never accounts for more than 0.1 percent of growth, while in Japan; Taiwan, China; and the Republic of Korea, the contribution is low or negative, despite having been important during their miracle periods. Baumol’s cost disease, in which progressively more spending goes into sec-tors such as services where productivity is lower and slower, may partly explain these rates.
As the following chapters demonstrate, the interpretation of these patterns is not clear for policy. They are neither obviously capturing movements from high- to low-productivity sectors nor illustrating the underlying drivers of such movements.
FIGURE B1.2.1 The Percentage of Productivity Growth Contributed by Structural Transformation Varies Widely by Country and over Time
Source: Rogerson 2017.
−50
0
50
100
150
Perc
enta
ge o
f pro
duct
ivity
gro
wth
cont
ribut
ed b
y st
ruct
ural
cha
nge
China
India
Indon
esia
Japa
n
Korea
, Rep
.
Malaysi
a
Philip
pines
Taiwan
, Chin
a
Thaila
nd
Unite
d Stat
es
1950s 1960s 1970s 1980s 1990s 2000s
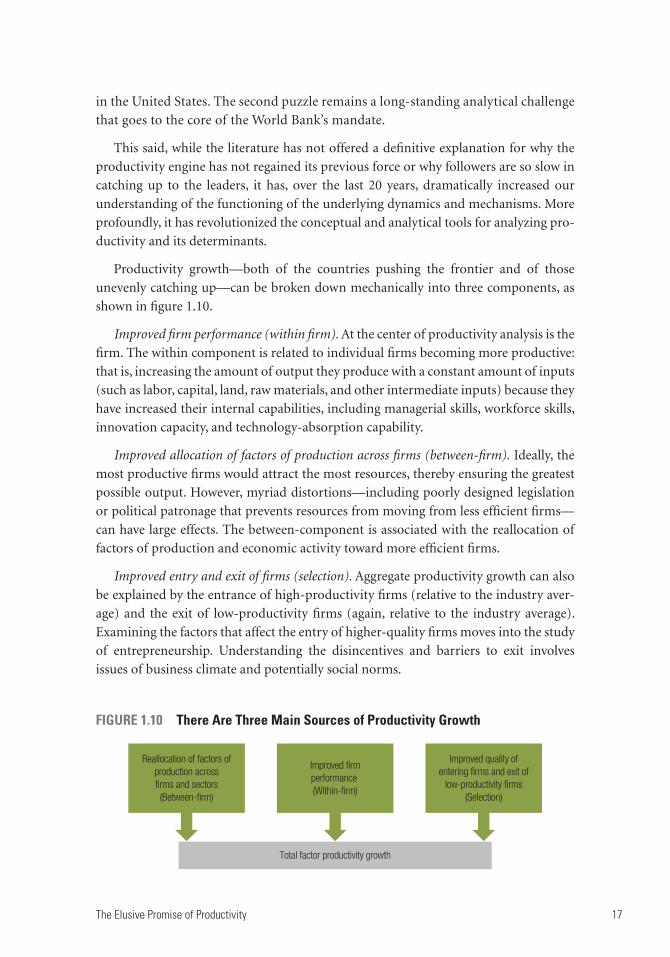
The Elusive Promise of Productivity 17
in the United States. The second puzzle remains a long-standing analytical challenge
that goes to the core of the World Bank’s mandate.
This said, while the literature has not offered a definitive explanation for why the
productivity engine has not regained its previous force or why followers are so slow in
catching up to the leaders, it has, over the last 20 years, dramatically increased our
understanding of the functioning of the underlying dynamics and mechanisms. More
profoundly, it has revolutionized the conceptual and analytical tools for analyzing pro-
ductivity and its determinants.
Productivity growth—both of the countries pushing the frontier and of those
unevenly catching up—can be broken down mechanically into three components, as
shown in figure 1.10.
Improved firm performance (within firm). At the center of productivity analysis is the
firm. The within component is related to individual firms becoming more productive:
that is, increasing the amount of output they produce with a constant amount of inputs
(such as labor, capital, land, raw materials, and other intermediate inputs) because they
have increased their internal capabilities, including managerial skills, workforce skills,
innovation capacity, and technology-absorption capability.
Improved allocation of factors of production across firms (between-firm). Ideally, the
most productive firms would attract the most resources, thereby ensuring the greatest
possible output. However, myriad distortions—including poorly designed legislation
or political patronage that prevents resources from moving from less efficient firms—
can have large effects. The between-component is associated with the reallocation of
factors of production and economic activity toward more efficient firms.
Improved entry and exit of firms (selection). Aggregate productivity growth can also
be explained by the entrance of high-productivity firms (relative to the industry aver-
age) and the exit of low-productivity firms (again, relative to the industry average).
Examining the factors that affect the entry of higher-quality firms moves into the study
of entrepreneurship. Understanding the disincentives and barriers to exit involves
issues of business climate and potentially social norms.
FIGURE 1.10 There Are Three Main Sources of Productivity Growth
Reallocation of factors ofproduction acrossfirms and sectors(Between-firm)
Improved firmperformance (Within-firm)
Improved quality ofentering firms and exit of
low-productivity firms(Selection)
Total factor productivity growth

18 Productivity Revisited
The Productivity Margins That Matter Most: New Evidence for Developing Countries
The contribution of each of these margins to productivity growth is a subject of ongo-
ing debate. Furthermore, as chapter 2 lays out, decompositions based on labor produc-
tivity or revenue-based TFP are misleading measures of efficiency. Backing out a
reliable measure requires firm-level price information, which to date has been scarce.
This volume has pulled together several unique databases from developing countries
that collect firm-level prices.
Figure 1.11 offers the first decompositions for a sample of developing countries and
emerging markets of one measure of efficiency, physical total factor productivity
(TFPQ), into its distinct components. The within-component is relatively more impor-
tant than the between-component in four of six cases, explaining roughly half or more
of efficiency growth in these economies, especially in Ethiopia and China.17 However,
depending on the country, the other components also play important roles. In Chile
and Colombia, the entry and exit of firms is the largest contributor. Reallocation is
marginally the dominant contributor in India and comes a close second in Colombia.
As this volume discusses, going forward, the policy conclusions from these decom-
positions are not straightforward. One message is clear: productivity analytics and
FIGURE 1.11 Which Dimension Contributes Most to Productivity Growth?
–0.2
0
Cont
ribut
ion
to p
hysi
cal t
otal
fact
or p
rodu
ctivi
ty g
row
th
0.2
0.4
0.6
0.8
1.0
Chile (
1996
–200
6)
China (
2000
–07)
Colombia
(199
3–20
12)
Ethiop
ia (20
00–0
7)
India
(2000
–08)
Malaysi
a (20
05–1
0)
WithinBetweenNet entry
Source: Physical total factor productivity decompositions using Melitz and Polanec’s (2015) methodology.

The Elusive Promise of Productivity 19
policy need to encompass all three dimensions. Each of them entails different policy
mixes. Productivity gains within firms may require a focus on firm management qual-
ity and technological learning and associated complements.18 Improving the efficiency
of entering firms may dictate focusing on factors particularly relevant to the incidence
and quality of entering entrepreneurs and the entrepreneurial ecosystem. Facilitating
reallocation requires structural reforms such as those associated with World Bank
Doing Business indicators.
However, these decompositions are backward-looking and may reflect a particular
stage in the reform or growth process. India’s high contribution of reallocation might,
for instance, reflect the effects of the far-reaching 1996 trade liberalization, while its
very small share in Chile may reflect the fact that its major reforms were in the distant
1970s and 1980s. In fact, box 1.2, using the simpler and less reliable decompositions
based on labor productivity characterizing the structural reform literature, suggests
that the within-component becomes small and even negative in the most advanced
economies. In addition, there are interactions among the three dimensions that dictate
an integrated approach to productivity policy. Barriers to reallocation may be a drag on
investments in new firms or firm upgrading; over the long term, further reallocation
depends on the introduction of new processes, products, and startups that challenge
existing firms for resources.
Plan of the Volume
Second-wave analysis has dramatically shifted how we analyze each of these margins.
Across the next three chapters, this volume pulls together this recent thinking, extends
it, and grounds it in the developing-country reality, using global trade and financial
data and the handful of available developing-country data sets with characteristics that
permit frontier estimation techniques. These span a representative cross-sample
including Chile, China, Colombia, Ethiopia, India, Indonesia, Malaysia, and Mexico.
The extensive empirical work and conceptual synthesis offers new guidance for pro-
ductivity analysis and dictates a corresponding shift in how to approach policy.
Chapter 2 focuses on firm performance (the “within” component), explaining why
conventional measures of productivity, like revenue-based total factor productivity
(TFPR), are compromised measures of efficiency, and why analyses to date seeking to
explain movements in productivity based on TFPR are correspondingly unreliable.
Central to this approach is the need to treat productivity analysis and market power in
an integrated way to disentangle them. The chapter also explores how the analysis of
the determinants of firm performance needs to go beyond considerations of efficiency
to incorporate broader aspects of product quality and demand.
Chapter 3 takes up the “between” margin, or reallocation component. It discusses
how conceptually and empirically a popular measure of misallocation and distortion,

20 Productivity Revisited
TFP dispersion, is not reliable. This measure conflates risk, adjustment rigidities, mark-
ups, and quality, among other factors, and overstates the development effect of reallo-
cation through reform. That said, the chapter argues that the effects of barriers to
reallocation through the channels of investment in upgrading within firms and the
entry of better firms are larger than previously thought.
Chapter 4 studies the “selection” margin and discusses four recent advances in
thinking around the generation of high-quality entrants. First, it presents some of the
earliest evidence on patterns of entry and exit in developing countries over time.
Second, it provides a simple framework of entrepreneurship as experimentation that
integrates both considerations of operational environment and a variety of types of
human capital. Third, it explores the new literature on the role of personality and
other characteristics of entrepreneurs that the emergence of detailed data sets has
made possible. Finally, it approaches issues of culture, human capital, and environ-
ment, taking a longer view using historical examples.
Chapter 5 distills lessons from the previous chapters and maps the shifts in thinking
around productivity policy that result. Chapter 6 concludes. A technical appendix lays
out many of the critiques discussed in the text in mathematical form.
Notes
1. See Ivanic and Martin 2010, which argues that agricultural productivity growth benefits the poor most.
2. Four of the most cited papers in this area together account for about 9,400 Google Scholar cites. The earliest paper is from 1995.
3. This section draws heavily on Syverson 2016.
4. Projections are from The Conference Board, 2018 Total Economy Database.
5. These slowdowns are statistically significant. The U.S. figures are computed from quarterly data; equality of the two periods’ productivity growth rates is rejected with a t-statistic of 2.7. The OECD values are from annual data across the 30 countries; the null hypothesis of equality is rejected with a t-statistic of 6.3. These slowdowns do not appear to reflect cyclical phenom-ena. Productivity decelerations are still observed in 25 of the 30 countries in the OECD data if growth rates from 2008–09, during the depths of the global financial crisis, are excluded from the totals. Furthermore, the average labor productivity growth across countries in the latter period (2005–14) remains a low 1.4 percent per year.
6. For example, if the production function is Cobb-Douglas with constant returns to scale Y = AKαL1−α, then Y/L = A(K/L)α, the relationship between labor productivity, TFP, and capital intensity is log-linear. More general production functions will imply a nonlinear relationship with (logged) capi-tal intensity. This analysis remains agnostic about the form of the production function, other than imposing linear separability of (logged) TFP and inputs.
7. The 0.2 percentage point drop in labor productivity growth unexplained by TFP decline results from a reduction in the rate of ICT capital deepening. By contrast, non-ICT capital deepening plays little role in the change in labor productivity growth in the OECD sample. Interestingly, within countries at an annual level, non-ICT deepening is considerably more correlated with labor productivity growth (the correlation coefficient is 0.45) than ICT capital deepening (the correlation coefficient is 0.21). However, because there was essentially no change in the average
The Elusive Promise of Productivity 21
rate of non-ICT capital deepening between the two periods of the slowdown, accumulations of these other capital types had little effect on labor productivity (and what effect they did have was to slightly increase labor productivity growth between the periods).
8. This empirical work has focused on the United States. Analogous facts have not yet been estab-lished for other countries.
9. Proponents of this view include Brynjolfsson and McAfee (2011); Mokyr (2014); Byrne, Oliner, and Sichel (2013); Feldstein (2015); and Hatzius and Dawsey (2015).
10. The coefficient on broadband penetration is −0.001 (standard error = 0.008), which is not just a statistical zero but an economic zero as well, as the point estimate implies that a one standard deviation difference in broadband penetration is associated with a one-fiftieth of a standard devi-ation difference in the magnitude of the slowdown. The visual is not as obvious with the supply-side-based measure of ICT prominence in panel b of figure 1.6, but a regression again reveals a statistically insignificant relationship. The coefficient on ICT intensity is −0.111 ( standard error = 0.095). Any economic relationship that might exist would be exclusively attributable to Ireland, which has an outlier ICT value-added share of 11.9 percent, double the sample average. Removing Ireland from the sample yields a regression coefficient of −0.030 (standard error = 0.123), which implies that a one standard deviation difference in ICT intensity corresponds to a one-sixteenth of a standard deviation change in the magnitude of the slowdown.
11. https://www.brookings.edu/research/gauging-investment-in-self-driving-cars/.
12. Autor, Katz, and Kearney (2006); Autor (2010); and Autor and Dorn (2013) document expand-ing job opportunities in both high-skill, high-wage occupations and low-skill, low-wage occu-pations, coupled with contracting opportunities in middle-wage, middle-skill white-collar and blue-collar jobs. In particular, job opportunities are declining in middle-skill white-collar cleri-cal, administrative, and sales occupations and in middle-skill, blue-collar production, craft, and operative occupations. This especially hits the earnings and labor force participation rates of workers without college education, and particularly men. Goos, Manning, and Salomons (2014) document that this phenomenon has appeared in each of 16 European countries from 1993 to 2006: middle-wage occupations decline as a share of employment in all 16 countries with an unweighted average of 8 percentage points, while high-wage and low-wage occupations increased in the vast majority.
13. See, for example, Aroca, Bosch, and Maloney 2005 for Mexico and Massoumi and Wang 2008 for China, among others. A future volume in this series will also address this issue.
14. Likewise, Aghion, Howitt, and Mayer-Foulkes (2005) and Feyrer (2008) argue that Quah’s (1996) finding that countries converge to “twin peaks” arises from diverging productivity as opposed to diverging physical capital or human capital accumulation, pointing again to knowledge-related barriers preventing catch-up. Numerous models (Aghion and Howitt 1990; Aghion, Howitt, and Mayer-Foulkes 2005) postulate situations in which countries enter a “stagnation equilibrium” far from the technological frontier because they are unable to incorporate new technologies.
15. Comin and Mestieri (2018) find that adoption lags between follower countries and advanced economies have recently converged; however, the intensity of use of adopted technologies of fol-lower countries relative to advanced economies has diverged. The evolution of aggregate pro-ductivity implied by these trends in technology diffusion resembles the actual evolution of the world income distribution in the last two centuries. Cross-country differences in adoption lags account for a significant part of the cross-country income divergence in the nineteenth century. The divergence in intensity of use accounts for the divergence during the twentieth century.
16. This positive impact of innovation on productivity can be seen in both country-level and firm-level data. Hall, Mairesse, and Mohnen (2010), for example, review the substantial evidence over the last quarter century and find that R&D expenditures increase TFP and growth. Using firm-level data, Hall and Mohnen (2013) find that introduction of product or process innovation also increases productivity. Bloom, Schankerman, and Van Reenen (2013) and Bloom et al. (2017)

22 Productivity Revisited
find social returns of 55.0–57.7 percent depending on the sample period, compared with a private return of 13.6–20.7 percent. Doraszelski and Jaumandreu (2013) find an average rate of return to R&D of 40 percent for Spain (1996–2000), roughly double that of, for instance, infrastructure.
17. Some researchers have argued that most productivity growth occurs within sectors and indus-tries and not in the reallocation of factors among them (see Caselli 2005). From a very micro view, other evidence—for example, for Bangladesh, parts of Sub-Saharan Africa, and Vietnam— suggests that poverty transitions have been dominated not by changes in income sources from farm to nonfarm income, but by higher productivity within the same sector and often within firms (Christiaensen, Demrey, and Kuhl 2011). In China, increasing labor productivity in agricul-ture has been a key factor in reducing poverty in lagging Chinese provinces (Christiaensen, Pan, and Wang 2013).
18. These issues are discussed in the first volume in this series, The Innovation Paradox (Cirera and Maloney 2017).
References
Aghion, P., and P. Howitt. 1990. “A Model of Growth through Creative Destruction.” NBER Working Paper 3223, National Bureau of Economic Research, Cambridge, MA.
Aghion, P., P. Howitt, and D. Mayer-Foulkes. 2005. “The Effect of Financial Development on Convergence: Theory and Evidence.” Quarterly Journal of Economics 120 (1): 173−222.
Aghion, P., B. F. Jones, and C. I. Jones. 2017. “Artificial Intelligence and Economic Growth.” NBER Working Paper 23928, National Bureau of Economic Research, Cambridge, MA.
Aroca, P., M. Bosch, and W. F. Maloney. 2005. “Spatial Dimensions of Trade Liberalization and Economic Convergence: Mexico 1985–2002.” World Bank Economic Review 19 (3): 345−78.
Autor, D. H. 2010. “The Polarization of Job Opportunities in the US Labor Market: Implications for Employment and Earnings.” Center for American Progress and The Hamilton Project, Washington, DC.
Autor, D. H., and D. Dorn. 2013. “The Growth of Low-Skill Service Jobs and the Polarization of the US Labor Market.” American Economic Review 103 (5): 1553−97.
Autor, D. H., L. F. Katz, and M. S. Kearney. 2006. “The Polarization of the US Labor Market.” American Economic Review Papers and Proceedings 96 (2): 189−94.
Bakker, G., N. Crafts, and P. Woltjer. Forthcoming. “The Sources of Growth in a Technologically Progressive Economy: the United States, 1899−1941.” Economic Journal.
Baumol, W. J. 1986. “Productivity Growth, Convergence, and Welfare: What the Long-Run Data Show.” American Economic Review 76 (5): 1072−85.
Baumol, W. J., and K. McLennan. 1985. Productivity Growth and US Competitiveness. New York: Oxford University Press for Committee for Economic Development.
Bloom, N. 2007. “Uncertainty and the Dynamics of R&D.” American Economic Review 97 (2): 250−55.
Bloom, N., S. Bond, and J. Van Reenen. 2007. “Uncertainty and Investment Dynamics.” Review of Economic Studies 74 (2): 391−415.
Bloom, N., C. I. Jones, J. Van Reenen, and M. Webb. 2017. “Are Ideas Getting Harder to Find?” NBER Working Paper 23782, National Bureau of Economic Research, Cambridge, MA.
Bloom, N., M. Schankerman, and J. Van Reenen. 2013. “Identifying Technology Spillovers and Product Market Rivalry.” Econometrica 81 (4): 1347−93.
Branstetter, L. G., B. M. Glennon, and J. B. Jensen. 2018. “The IT Revolution and the Globalization of R&D.” NBER Working Paper 24707, National Bureau of Economic Research, Cambridge, MA.
Branstetter, L. G., G. Li, and F. Veloso. 2013. The Globalization of R&D: China, India, and the Rise of International Co-invention. Draft Report. Washington, DC: World Bank.

The Elusive Promise of Productivity 23
Brynjolfsson, E., and A. McAfee. 2011. Race against the Machine. Lexington, MA: Digital Frontier.
Brynjolfsson, E., D. Rock, and C. Syverson. 2017. “Artificial Intelligence and the Modern Productivity Paradox: A Clash of Expectations and Statistics.” In Economics of Artificial Intelligence. Chicago: University of Chicago Press.
Byrne, D. M., J. G. Fernald, and M. B. Reinsdorf. 2016. “Does the United States Have a Productivity Slowdown or a Measurement Problem?” Brookings Papers on Economic Activity 2016 (1): 109−82.
Byrne, D. M., S. D. Oliner, and D. E. Sichel. 2013. “Is the Information Technology Revolution Over?” International Productivity Monitor 25 (Spring): 20−36.
Cardarelli, M. R., and L. Lusinyan. 2015. “US Total Factor Productivity Slowdown: Evidence from the US States.” Working Paper 15-116, International Monetary Fund, Washington, DC.
Caselli, F. 2005. “Accounting for Cross-Country Income Differences.” In Handbook of Economic Growth, vol. 1A, edited by P. Aghion and S. Durlauf, 679–741. Amsterdam: Elsevier.
Cette, G., J. Fernald, and B. Mojon. 2016. “The Pre-Great Recession Slowdown in Productivity.” European Economic Review 88: 3−20.
Christiaensen, L., L. Demery, and J. Kuhl. 2011. “The (Evolving) Role of Agriculture in Poverty Reduction—An Empirical Perspective.” Journal of Development Economics 96 (2): 239−54.
Christiaensen, L., L. Pan, and S. Wang. 2013. “Pathways out of Poverty in Lagging Regions: Evidence from Rural Western China.” Agricultural Economics 44 (1): 25−44.
Cirera, X., and W. F. Maloney. 2017. The Innovation Paradox: Developing-Country Capabilities and the Unrealized Promise of Technological Catch-Up. Washington, DC: World Bank.
Comin, D., and B. Hobijn. 2004. “Cross-Country Technology Adoption: Making the Theories Face the Facts.” Journal of Monetary Economics 51 (1): 39−83.
———. 2010. “An Exploration of Technology Diffusion.” American Economic Review 100 (5, December): 2031−59.
Comin, D., and M. Mestieri. 2018. “If Technology Has Arrived Everywhere, Why Has Income Diverged?” American Economic Journal: Macroeconomics 10 (3): 137−78.
Davis, S. J., and J. Haltiwanger. 2014. “Labor Market Fluidity and Economic Performance.” NBER Working Paper 20479, National Bureau of Economic Research, Cambridge, MA.
Decker, R., J. Haltiwanger, R. S. Jarmin, and J. Miranda. 2015. “Where Has All the Skewness Gone? The Decline in High-Growth (Young) Firms in the US.” NBER Working Paper 21776, National Bureau of Economic Research, Cambridge, MA.
De Loecker, J., and J. Eeckhout. 2018. “Global Market Power.” Working Paper 24768, National Bureau of Economic Research, Cambridge, MA.
De Long, J. B. 1988. “Productivity Growth, Convergence, and Welfare: Comment.” American Economic Review 78 (5): 1138−54.
Díez, F. J., D. Leigh, and S. Tambunlertchai. 2018. “Global Market Power and Its Macroeconomic Implications.” IMF Working Paper 18/137, International Monetary Fund, Washington, DC.
Doms, M. E., R. S. Jarmin, and S. D. Klimek. 2004. “Information Technology Investment and Firm Performance in US Retail Trade.” Economics of Innovation and New Technology 13 (7): 595−613.
Doraszelski, U., and J. Jaumandreu. 2013. “R&D and Productivity: Estimating Endogenous Productivity.” Review of Economic Studies 80 (4): 1338−83.
Duval, R. A., G. H. Hong, and Y. Timmer. 2017. “Financial Frictions and the Great Productivity Slowdown.” IMF Working Paper 17/129, International Monetary Fund, Washington, DC.
Easterly, W., and R. Levine. 2001. “What Have We Learned from a Decade of Empirical Research on Growth? It’s Not Factor Accumulation: Stylized Facts and Growth Models.” World Bank Economic Review 15 (2): 177−219.
24 Productivity Revisited
Feldstein, M. 2015. “The U.S. Underestimates Growth.” Wall Street Journal, May 18.
Fernald, J. 2014. “A Quarterly, Utilization-Adjusted Series on Total Factor Productivity.” Federal Reserve Bank of San Francisco.
Feyrer, J. D. 2008. “Convergence by Parts.” BE Journal of Macroeconomics 8 (1): 1−35.
Fischer, S. 1988. “Symposium on the Slowdown in Productivity Growth.” Journal of Economic Perspectives 2 (4): 3−7.
Foster, L., J. C. Haltiwanger, and C. J. Krizan. 2001. “Aggregate Productivity Growth: Lessons from Microeconomic Evidence.” In New Developments in Productivity Analysis, edited by Charles Hulten and Michael Parker, 303−72. Chicago: University of Chicago Press.
———. 2006. “Market Selection, Reallocation, and Restructuring in the US Retail Trade Sector in the 1990s.” Review of Economics and Statistics 88 (4): 748−58.
Goñi, E., and W. F. Maloney. 2017. “Why Don’t Poor Countries Do R&D? Varying Rates of Factor Returns across the Development Process.” European Economic Review 94: 126−47.
Goos, M., A. Manning, and A. Salomons. 2014. “Explaining Job Polarization: Routine-Biased Technological Change and Offshoring.” American Economic Review 104 (8): 2509−26.
Gordon, R. 2015. “Secular Stagnation: A Supply-Side View.” American Economic Review: Papers and Proceedings 105 (5): 54–59.
Gorodnichenko, Y., and S. Ng. 2017. “Level and Volatility Factors in Macroeconomic Data.” Journal of Monetary Economics 91: 52−68.
Griffith, R., S. Redding, and J. Van Reenen. 2004. “Mapping the Two Faces of R&D: Productivity Growth in a Panel of OECD industries.” Review of Economics and Statistics 86 (4): 883−95.
Hall, B. H., J. Mairesse, and P. Mohnen. 2010. “Measuring the Returns to R&D.” In Handbook of the Economics of Innovation, Vol. 2, 1033−82. North-Holland.
Hall, B. H., and P. Mohnen. 2013. “Innovation and Productivity: An Update.” Eurasian Business Review 3 (1): 47−65.
Hatzius, J., and K. Dawsey. 2015. “Doing the Sums on Productivity Paradox v2. 0.” Goldman Sachs US Economics Analyst 15 (30).
Ivanic, M., and W. Martin. 2010. “Poverty Impacts of Improved Agricultural Productivity: Opportunities for Genetically Modified Crops.” AgBioForum 13 (4): Article 3.
Jorgenson, D. W., M. S. Ho, and K. J. Stiroh. 2008. “A Retrospective Look at the US Productivity Growth Resurgence.” Journal of Economic Perspectives 22 (1): 3−24.
Khaldun, I. 1377. The Muqaddimah: An Introduction to History. Princeton, NJ: Princeton University Press. 2015 edition.
Klenow, P. J., and A. Rodríguez-Clare. 1997. “The Neoclassical Revival in Growth Economics: Has It Gone Too Far?” NBER Macroeconomics Annual 12: 73−103.
Krugman, Paul R. 1994. The Age of Diminished Expectations. Cambridge, MA: MIT Press.
Maasoumi, E., J. Racine, and T. Stengos. 2007. “Growth and Convergence: A Profile of Distribution Dynamics and Mobility.” Journal of Econometrics 136 (2): 483–508.
Maasoumi, E., and L. Wang. 2008. “Economic Reform, Growth and Convergence in China.” Econometrics Journal 11 (1): 128–54.
Maloney, W. F., and C. Molina. 2016. “Are Automation and Trade Polarizing Developing Country Labor Markets, Too?” Policy Research Working Paper 7922, World Bank, Washington, DC.
McMillan, M. S., and D. Rodrik. 2011. “Globalization, Structural Change and Productivity Growth.” NBER Working Paper 17143, National Bureau of Economic Research, Cambridge, MA.
McMillan, M., D. Rodrik, and Í. Verduzco-Gallo. 2014. “Globalization, Structural Change, and Productivity Growth, with an Update on Africa.” World Development 63: 11–32.

The Elusive Promise of Productivity 25
Melitz, M. J., and S. Polanec. 2015. “Dynamic Olley-Pakes Decomposition with Entry and Exit.” RAND Journal of Economics 46 (2): 362–75.
Mokyr, J. 2013. “Is Technological Progress a Thing of the Past?” Vox EU, September 8.
———. 2014. “Secular Stagnation? Not in Your Life.” Chapter 6 in Secular Stagnation: Facts, Causes and Cures, edited by C. Teulings and R. Baldwin. Vox EU e-book.
Nakamura, L., and R. Soloveichik. 2015. “Valuing ‘Free’ Media across Countries in GDP.” Working Paper 15-25, Federal Reserve Bank of Philadelphia, July.
Phelps, E. 2013. Mass Flourishing: How Grassroots Innovation Created Jobs, Challenge, and Change. Princeton, NJ: Princeton University Press.
Pritchett, L. 1997. “Divergence, Big Time.” Journal of Economic Perspectives 11 (3): 3−17.
Quah, D. T. 1996. “Twin Peaks: Growth and Convergence in Models of Distribution Dynamics.” Economic Journal 106 (437): 1045–55.
Restuccia, D. 2013. “Factor Misallocation and Development.” In The New Palgrave Dictionary of Economics, online edition, edited by S. N. Durlauf and L. E. Blume. Basingstoke, U.K.: Palgrave Macmillan.
Ridao-Cano, C., and C. Bodewig. 2018. Growing United: Upgrading Europe’s Convergence Machine. Washington, DC: World Bank.
Rogerson, R. 2017. “Structural Transformation and Productivity Growth: Cause or Effect?” Background paper for Productivity Revisited, World Bank, Washington, DC.
Solow, R. M. 1987. “We’d Better Watch Out.” New York Times Book Review, July 12, 36.
Syverson, C. 2013. “Will History Repeat Itself?” Comments on “Is the Information Technology Revolution Over?” International Productivity Monitor 25 (Spring): 37−40.
———. 2016. “Has a Worldwide Productivity Slowdown Started?” Background paper for Productivity Revisited, World Bank, Washington, DC.
van Ark, B. 2016. “The Productivity Paradox of the New Digital Economy.” International Productivity Monitor 31 (Fall): 3−18.
Wolff, E. 1985. “The Magnitude and Causes of the Recent Productivity Slowdown in the U.S.” In Productivity Growth and U.S. Competitiveness, edited by W. J. Baumol and K. McLennan, 29−57. New York: Oxford University Press for the Committee for Economic Development.


27
2. Enhancing Firm Performance
New Thinking about Within-Firm Productivity
The firm is the main creator of value added and productivity growth in the economy.
As chapter 1 discusses, perhaps half of observed productivity growth is due to improve-
ments within firms obtained by innovating, adopting new technologies, and imple-
menting best managerial practices. The rapid and extensive gains of countries like
Chile and China suggest that while removing distortions (such as imperfect financial
markets, labor market regulations, or taxes) may yield large gains during initial reform
periods, once the big distortions have been eliminated, productivity growth is more
likely to come from the process of upgrading products and processes within existing
firms and sectors, and from new firms.
How we conceive of and measure firm productivity has changed radically over the
last 20 years for two reasons (De Loecker 2017). The first is the greater access to detailed
individual firm–level data on output, intermediate inputs, workers, and capital—and,
in some cases, on innovation investments, management quality, and, particularly,
product prices. Second, the availability of this body of data has raised the bar in the
academic literature on the estimation and identification of production functions. This
has led to an expansion of the conception of firm performance beyond the standard
efficiency concerns to a second set of considerations related to product prices. Just as
importantly, it has led analysis to move away from the traditional simplification of
assuming identical competitive firms to analysis in which firms sell differentiated
products using differentiated inputs. In this way, it is bringing issues of market power
and industrial organization more explicitly into productivity analysis.
Traditionally, productivity—captured by the measure of total factor productivity
(TFP)—has been calculated as the part of firm-level revenue or sales that cannot be
explained by the contribution of capital, labor, energy, or other factors. If all firms are
assumed to be identical, then revenues can be deflated by industry-level price indexes
to derive quantities produced. However, when prices vary across firms within an
industry, industry-level deflation does not eliminate price influence. The literature
now calls this traditional measure revenue total factor productivity (TFPR) to capture
the fact that it is not free of price effects, and distinguishes it from physical total factor
productivity (TFPQ), which is free of price effects—but can only be derived with
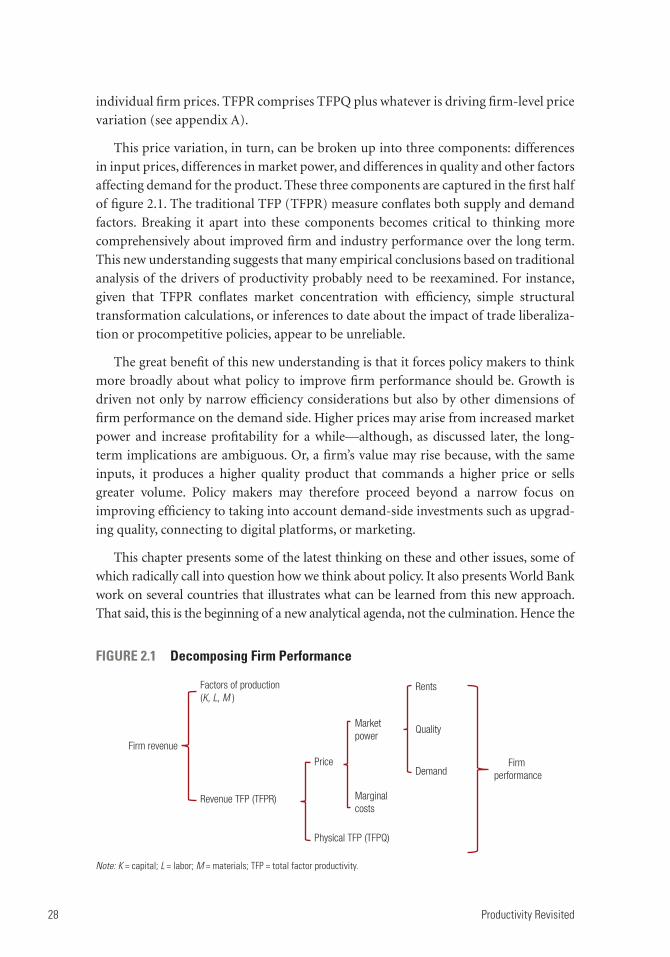
28 Productivity Revisited
individual firm prices. TFPR comprises TFPQ plus whatever is driving firm-level price
variation (see appendix A).
This price variation, in turn, can be broken up into three components: differences
in input prices, differences in market power, and differences in quality and other factors
affecting demand for the product. These three components are captured in the first half
of figure 2.1. The traditional TFP (TFPR) measure conflates both supply and demand
factors. Breaking it apart into these components becomes critical to thinking more
comprehensively about improved firm and industry performance over the long term.
This new understanding suggests that many empirical conclusions based on traditional
analysis of the drivers of productivity probably need to be reexamined. For instance,
given that TFPR conflates market concentration with efficiency, simple structural
transformation calculations, or inferences to date about the impact of trade liberaliza-
tion or procompetitive policies, appear to be unreliable.
The great benefit of this new understanding is that it forces policy makers to think
more broadly about what policy to improve firm performance should be. Growth is
driven not only by narrow efficiency considerations but also by other dimensions of
firm performance on the demand side. Higher prices may arise from increased market
power and increase profitability for a while—although, as discussed later, the long-
term implications are ambiguous. Or, a firm’s value may rise because, with the same
inputs, it produces a higher quality product that commands a higher price or sells
greater volume. Policy makers may therefore proceed beyond a narrow focus on
improving efficiency to taking into account demand-side investments such as upgrad-
ing quality, connecting to digital platforms, or marketing.
This chapter presents some of the latest thinking on these and other issues, some of
which radically call into question how we think about policy. It also presents World Bank
work on several countries that illustrates what can be learned from this new approach.
That said, this is the beginning of a new analytical agenda, not the culmination. Hence the
FIGURE 2.1 Decomposing Firm Performance
Firm revenue
Factors of production (K, L, M )
Revenue TFP (TFPR)
Price
Physical TFP (TFPQ)
Demand
Market power
Quality
Firm performance
Rents
Marginalcosts
Note: K = capital; L = labor; M = materials; TFP = total factor productivity.
Enhancing Firm Performance 29
results must be seen as grist for renewed policy debate, rather than the definitive word on
where policy should go.
Firm Performance: Beyond Efficiency
A firm’s performance on balance sheets is measured as revenues over costs. Figure 2.1
breaks this into constituent parts in finer detail than in the preceding discussion.
Beginning from the left, firm performance can increase through higher prices, higher
efficiency, or both. Prices are, in turn, a function of costs of production on the one
hand, and markups on the other. Markups, in turn, may both reflect product market
competition in the traditional sense and require investments like upgrading quality,
advertising, and marketing as well.
The Good and the Bad of Markups and Market Power
In the narrowest sense, higher markups, in which prices exceed marginal costs, may be
good for GDP. Exporters of scarce natural resources around the world receive prices
high above extraction costs, and these rents show up as higher GDP. Similarly, inven-
tors who hold a patent on their new ideas receive the temporary rents (quasi-rents)
from their innovations—again, with prices above costs. Schumpeter argued that higher
rents (higher markups) offer firms a greater incentive to innovate.
On the other hand, markups often signal market power arising from anticompeti-
tive behavior or barriers to entry that a long literature documents are likely to be a
disincentive to increasing productivity in existing firms1 or allow unproductive firms to
continue (see discussion in chapter 4). The radical restructurings of the economies of
Chile, India, and many Eastern European countries when opened to foreign competi-
tion illustrate how important this effect can be. Market power increases firm profits in
the short term, but may have detrimental long-term dynamic effects on investment by
destroying the incentives to invest in productivity-enhancing activities.
However, the impact of more competition and lower markups may be ambiguous.
Aghion et al. (2005) argue that the effect of competition on innovation has an inverted
U-shape: firms competing “neck and neck” with frontier firms will innovate seeking room
to “escape competition.” On the other hand, firms too far from the frontier may find profits
so low that they will not or cannot upgrade, and thus Schumpeter’s effect dominates.
The analysis of markups and efficiency has regained increased attention in recent
years for several reasons. Evidence on global market power shows that markups have
risen most in North America and Europe, and least in emerging markets in Latin
America and Asia, partly because in the latter markups were originally high and thus
there was limited scope for further increments (De Loecker and Eeckhout 2018).
Recent findings for India (De Loecker et al. 2016) and World Bank evidence
for Chile (Cusolito, García-Marin, and Maloney 2017), Malaysia (Zaourak 2018),

30 Productivity Revisited
and Mexico (Cusolito, Iacovone, and Sanchez 2018) show that firms that are highly
efficient charge higher markups. While the higher price-costs margins could be a result
of supply and demand complementarities, meaning that more efficient firms have an
advantage to vertically differentiate their products, they can also reflect imperfect
pass- through.
Moreover, empirically, the presence of market power can lead to faulty empirical
inferences (and thus faulty policy prescriptions) because measures of TFPR conflate
efficiency with markups. This issue was highlighted by Katayama, Lu, and Tybout in
2003. The authors show that the resultant revenue-based productivity indexes have
little to do with technical efficiency, product quality, or contributions to social welfare.
Nonetheless, they are likely to be correlated with policy shocks and managerial deci-
sions in misleading ways. Two examples from recent work sponsored by the World
Bank suggest why breaking these apart is essential for evidence-based policy inference
(Cusolito, García Marín, and Maloney 2017; Cusolito, Iacovone, and Sanchez 2018).
A Better Allocation of Resources or Increased Market Concentration?
Reallocation of resources from low-TFP to high-TFP firms may imply transferring
resources not to more efficient firms, but rather to firms with more market power. In
this case, a common measure used to suggest a healthy allocation of resources—a
higher covariance between TFPR and employment—may actually reflect the reverse. A
similar problem arises from the structural transformation exercises discussed in chap-
ter 1. Large differences in labor productivity among sectors can suggest that efficiency
can be gained by transferring workers to more productive sectors. To the degree that
labor productivity is capturing rents due to barriers to entry, this approach amounts to
arguing for transferring workers to the more distorted and inefficient parts of the econ-
omy. This may well be the explanation for the finding of McMillan and Rodrik (2011)
that the effect of structural transformation in Latin America was negative. Chile, before
liberalization, had tariffs on automobiles totaling hundreds of percent and had as many
assembly plants as the United States. In Argentina in 1980, virtually every car on the
street was an early 1960s model Ford Falcon built with 1960s technology, protected by
high tariffs and generating clear monopoly rents. Liberalization cut heavily into these
sectors and led to workers being transferred to what, on paper, looked like less produc-
tive sectors—but which, in reality, were a better growth bet over the long term.
Documenting the Benefits of Trade Liberalization
Similarly, regressions of TFPR on measures of competition or liberalization can be
misleading because an increase in upstream and downstream competition may have
two countervailing effects: lowering prices and markups, while increasing efficiency.
For instance, recent studies finding that tariff liberalization, increased imports
from China, and liberalized flows of foreign direct investment increase TFPR (see Ahn
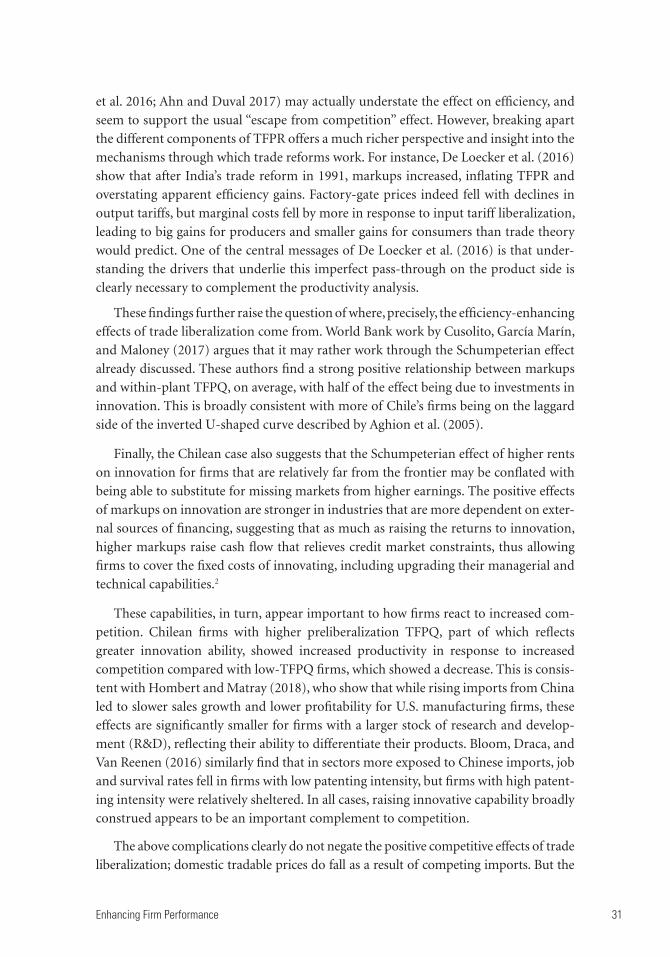
Enhancing Firm Performance 31
et al. 2016; Ahn and Duval 2017) may actually understate the effect on efficiency, and
seem to support the usual “escape from competition” effect. However, breaking apart
the different components of TFPR offers a much richer perspective and insight into the
mechanisms through which trade reforms work. For instance, De Loecker et al. (2016)
show that after India’s trade reform in 1991, markups increased, inflating TFPR and
overstating apparent efficiency gains. Factory-gate prices indeed fell with declines in
output tariffs, but marginal costs fell by more in response to input tariff liberalization,
leading to big gains for producers and smaller gains for consumers than trade theory
would predict. One of the central messages of De Loecker et al. (2016) is that under-
standing the drivers that underlie this imperfect pass-through on the product side is
clearly necessary to complement the productivity analysis.
These findings further raise the question of where, precisely, the efficiency- enhancing
effects of trade liberalization come from. World Bank work by Cusolito, García Marín,
and Maloney (2017) argues that it may rather work through the Schumpeterian effect
already discussed. These authors find a strong positive relationship between markups
and within-plant TFPQ, on average, with half of the effect being due to investments in
innovation. This is broadly consistent with more of Chile’s firms being on the laggard
side of the inverted U-shaped curve described by Aghion et al. (2005).
Finally, the Chilean case also suggests that the Schumpeterian effect of higher rents
on innovation for firms that are relatively far from the frontier may be conflated with
being able to substitute for missing markets from higher earnings. The positive effects
of markups on innovation are stronger in industries that are more dependent on exter-
nal sources of financing, suggesting that as much as raising the returns to innovation,
higher markups raise cash flow that relieves credit market constraints, thus allowing
firms to cover the fixed costs of innovating, including upgrading their managerial and
technical capabilities.2
These capabilities, in turn, appear important to how firms react to increased com-
petition. Chilean firms with higher preliberalization TFPQ, part of which reflects
greater innovation ability, showed increased productivity in response to increased
competition compared with low-TFPQ firms, which showed a decrease. This is consis-
tent with Hombert and Matray (2018), who show that while rising imports from China
led to slower sales growth and lower profitability for U.S. manufacturing firms, these
effects are significantly smaller for firms with a larger stock of research and develop-
ment (R&D), reflecting their ability to differentiate their products. Bloom, Draca, and
Van Reenen (2016) similarly find that in sectors more exposed to Chinese imports, job
and survival rates fell in firms with low patenting intensity, but firms with high patent-
ing intensity were relatively sheltered. In all cases, raising innovative capability broadly
construed appears to be an important complement to competition.
The above complications clearly do not negate the positive competitive effects of trade
liberalization; domestic tradable prices do fall as a result of competing imports. But the

32 Productivity Revisited
channels through which the distribution of firm performance changes appear more com-
plex than previously thought. Furthermore, the examples confirm the importance of
empirically separating efficiency effects from markup effects, and more importantly, the
need to conceptually treat productivity and market structure in an integrated way.
Quality
While the focus on firm performance has tended to be on efficiency, raising the quality
of a product also has the potential to boost firm profits and advance growth. Prices
within very narrowly defined product categories differ vastly and to an important
degree reflect quality. For instance, a bottle of “red wine, 750 ml” may sell for $2
(by Charles Shaw, known as Two Buck Chuck) or $40,000 (Domaine de la Romanée-
Conti Grand Cru). Within the category of “leather women’s shoes,” Manolo Blahnik’s
shoes can sell for $1,500—easily 100 times more expensive than basic Payless pumps.
In Japan, snips of Ruby Roman grapes can sell for $5,000; Densuke watermelons sell for
more than $2,000 each; and musk melons have sold for more than $10,000 apiece. Part
of this reflects the care in the growing process, and thus higher production costs. Sekai
ichi apples ($20 apiece) are individually pollinated. But part also reflects that fruit has
been elevated from mere nourishment to the status of a luxury product, and features
heavily in Japan’s gift-giving culture, along with other gourmet foodstuffs including
frozen steaks, whisky, and black tea.3 More generally, using data on exports to the
United States from the rest of the world, Schott (2008) shows that prices (proxied by
export unit values) of identically defined goods from different countries vary
enormously.4
In many cases, different qualities of products can be thought of as reflecting insuf-
ficient disaggregation in the prevailing systems of industrial classifications: a better-
quality product could be considered a different product and both quality levels could
be sold in different competitive markets. Steel comes in many different qualities that
are not registered at the 10-digit (HS-10) level of disaggregation in the Harmonized
System of industrial classification. On the other hand, many high-end products benefit
from investments in advertising and branding that create market power—and hence
positive markups. For such products, however, the markups are arising from invest-
ments in R&D, as Sutton (1998) terms them, and resulting product differentiation
rather than artificial barriers to entry, and thus contribute to growth. Chile aspires to
the day when its fine wines have the cachet of French Bordeaux, which would allow
them to earn higher profits per bottle, increasing firm performance and growth.
Quantifying quality also poses challenges. Some fraction of observed price differ-
ences may represent differences in the cost of production or inefficiency, rather than
quality (Khandelwal 2010). But a large fraction is due to desirable characteristics for
which consumers are willing to pay. To take one narrowly defined product—wine—
Combris, Lecocq, and Visser (1997) find that the information listed on the bottle of
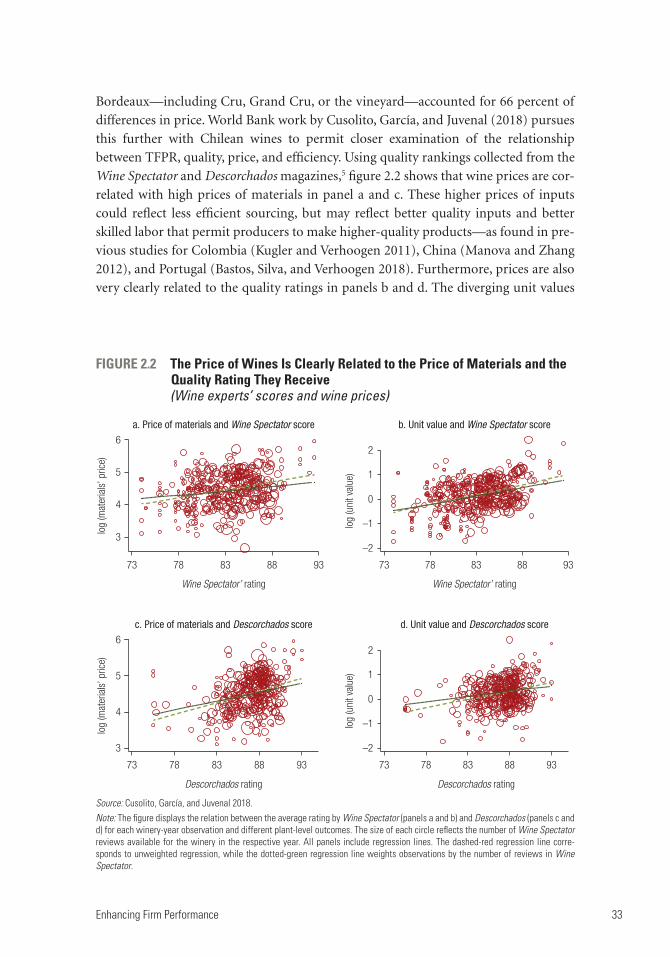
Enhancing Firm Performance 33
Bordeaux—including Cru, Grand Cru, or the vineyard—accounted for 66 percent of
differences in price. World Bank work by Cusolito, García, and Juvenal (2018) pursues
this further with Chilean wines to permit closer examination of the relationship
between TFPR, quality, price, and efficiency. Using quality rankings collected from the
Wine Spectator and Descorchados magazines,5 figure 2.2 shows that wine prices are cor-
related with high prices of materials in panel a and c. These higher prices of inputs
could reflect less efficient sourcing, but may reflect better quality inputs and better
skilled labor that permit producers to make higher-quality products—as found in pre-
vious studies for Colombia (Kugler and Verhoogen 2011), China (Manova and Zhang
2012), and Portugal (Bastos, Silva, and Verhoogen 2018). Furthermore, prices are also
very clearly related to the quality ratings in panels b and d. The diverging unit values
FIGURE 2.2 The Price of Wines Is Clearly Related to the Price of Materials and the Quality Rating They Receive
(Wine experts’ scores and wine prices)
a. Price of materials and Wine Spectator score b. Unit value and Wine Spectator score
c. Price of materials and Descorchados score d. Unit value and Descorchados score
3
4
5
6
log
(mat
eria
ls’ p
rice)
73 78 83 88 93
Wine Spectator’ rating
–2
–1
0
1
2
log
(uni
t val
ue)
73 78 83 88 93
Wine Spectator’ rating
3
4
5
6
log
(mat
eria
ls’ p
rice)
73 78 83 88 93
Descorchados rating
–2
–1
0
1
2
log
(uni
t val
ue)
73 78 83 88 93
Descorchados rating
Source: Cusolito, García, and Juvenal 2018.Note: The figure displays the relation between the average rating by Wine Spectator (panels a and b) and Descorchados (panels c and d) for each winery-year observation and different plant-level outcomes. The size of each circle reflects the number of Wine Spectator reviews available for the winery in the respective year. All panels include regression lines. The dashed-red regression line corre-sponds to unweighted regression, while the dotted-green regression line weights observations by the number of reviews in Wine Spectator.

34 Productivity Revisited
reflect not only differences in the ability to produce a vertically superior product, but
also all that the superior characteristic implies with it—from design capacity, to differ-
ent sets of inputs, to marketing and advertising (Sutton 1998).6
Figure 2.3 suggests that higher quality may come with an apparent cost in terms of
efficiency when efficiency measures do not take into consideration the quality of each
bottle; the number of bottles produced per worker declines with quality in this case.
However, better quality may allow product differentiation that permits higher overall
firm profitability and revenue productivity per worker. Again, simply looking at effi-
ciency may hide important gains in firm performance and value added, and further-
more, estimating TFPQ without controlling explicitly for quality can make high-quality
producers look unproductive (see annex 2A). And to the degree that quality upgrading
requires a higher level of skills in workers, captured in higher input and factor prices, a
better quality of jobs is generated.
This is not to say that the overall structure of the wine market may not make it as
profitable to produce a lower-quality good given a large mass market (Two Buck
Chuck), and high-performing firms may decide to produce goods at multiple price
points. However, Krishna, Levchenko, and Maloney (2018) for this report show that
there is a correlation between the level of a country’s development and price, suggest-
ing that the ability to generate higher quality increases with the stage of development
(figure 2.4).
In this sense, the broad co-evolution of average quality and underlying national
productivity offers another window on firm performance: despite the evidence from
FIGURE 2.3 TFPQ Estimations Exhibit a Downward Bias When Quality Is Not Controlled For
(Wine experts’ scores and TFPQ)
Source: Cusolito, García, and Juvenal 2018.Note: The figure displays the relation between Descorchados’ average rating for each winery-year observation and different plant-level outcomes. The size of each circle reflects the number of Wine Spectator reviews available for the winery in the respective year. The dashed-red regression line corresponds to unweighted regression, while the dotted-green regression line weights observations by the number of reviews in Wine Spectator. TFPQ = physical total factor productivity.
a. Wine Spectator b. Descorchados
–3–2–1
0123
log
(TFP
Q)
log
(TFP
Q)
73 78 83 88 93
Wine Spectator rating
–3–2–1
0123
73 78 83 88 93
Descorchados rating
Enhancing Firm Performance 35
the wine industry presented earlier, in the aggregate better managed, more sophisti-
cated firms could be expected to be better at quality and physical productivity.
In sum, though discussions of productivity tend to focus on efficiency, quality is an
integral part of firm performance and improving it is a core component of an overall
growth strategy.
Demand
Whether higher quality leads to higher prices depends on customers’ willingness to pay.
Thus, the preceding discussion sheds light on recently initiated debate about which is
more important for firm performance and growth: increasing demand for firms’ prod-
ucts or increasing efficiency. Focusing on one very homogeneous product, concrete,
with similar quality and production costs across firms, Foster, Haltiwanger, and
Syverson (2016) show that the growth of U.S. concrete firms is mostly due to the slow
process of building up demand through different types of “soft” investments, like
advertising, marketing, and development of a network of clients. Furthermore, they
show that new firms without a strong demand base enter with a lower price but higher
productivity. Here again, the conflation of the two in TFPR leads to the mistaken con-
clusion that entrants have lower efficiency.
FIGURE 2.4 Average Product Quality Increases with the Level of Development
United ArabEmirates
Argentina
Australia
Austria
Belgium and Luxembourg
Bangladesh
Brazil
Canada
Switzerland
China
ColombiaCosta Rica
Denmark
DominicanRepublic
Egypt,Arab Rep.
Spain
Finland
France
United Kingdom
Germany
GuatemalaHong Kong SAR, China
Honduras
Indonesia
IndiaIreland
Israel
Italy
Japan
Korea, Rep.
Sri Lanka
Macao SAR, China
Mexico
Malaysia
Netherlands
Norway
Pakistan
PeruPhilippines
Poland
Portugal
Singapore
El Salvador
Sweden
Thailand
Turkey
Venezuela, RB
South Africa
4
6
8
10
12Ln
of a
vera
ge q
ualit
y
6 7 8 9 10 11
Ln of GDP per capita
Source: Krishna, Levchenko, and Maloney 2018. Note: The figure plots average cross-good unit values standardized by the 90th value of HS-10 against log GDP per capita for countries with more than 50 products. Ln of average quality versus ln of gross domestic product per capita. Slope = 0.956 (t-statistic = 5.73). HS-10 = 10-digit level of disaggregation in the Harmonized System of industrial classification.
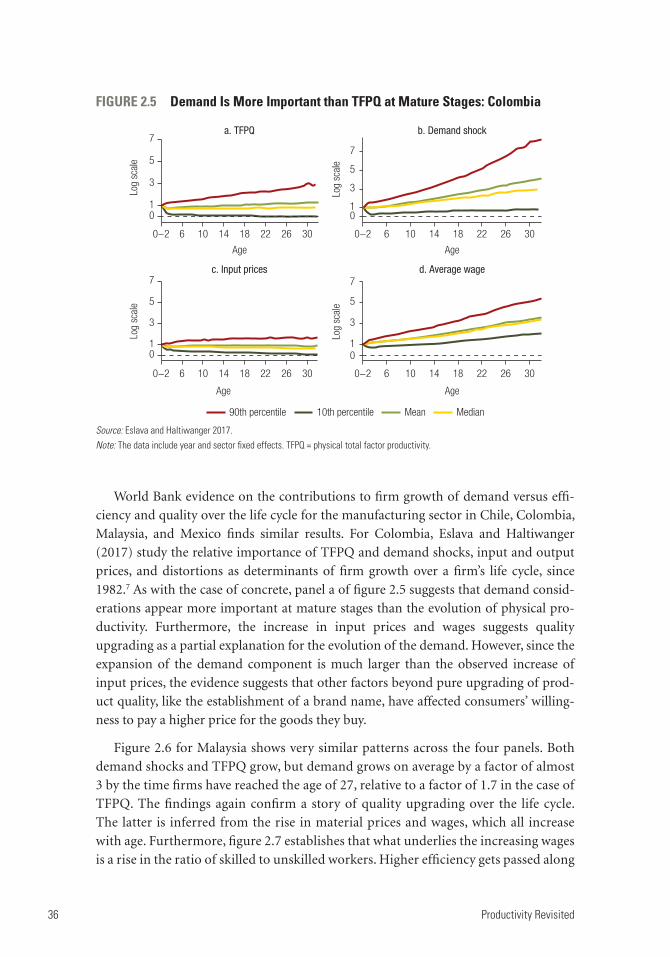
36 Productivity Revisited
World Bank evidence on the contributions to firm growth of demand versus effi-
ciency and quality over the life cycle for the manufacturing sector in Chile, Colombia,
Malaysia, and Mexico finds similar results. For Colombia, Eslava and Haltiwanger
(2017) study the relative importance of TFPQ and demand shocks, input and output
prices, and distortions as determinants of firm growth over a firm’s life cycle, since
1982.7 As with the case of concrete, panel a of figure 2.5 suggests that demand consid-
erations appear more important at mature stages than the evolution of physical pro-
ductivity. Furthermore, the increase in input prices and wages suggests quality
upgrading as a partial explanation for the evolution of the demand. However, since the
expansion of the demand component is much larger than the observed increase of
input prices, the evidence suggests that other factors beyond pure upgrading of prod-
uct quality, like the establishment of a brand name, have affected consumers’ willing-
ness to pay a higher price for the goods they buy.
Figure 2.6 for Malaysia shows very similar patterns across the four panels. Both
demand shocks and TFPQ grow, but demand grows on average by a factor of almost
3 by the time firms have reached the age of 27, relative to a factor of 1.7 in the case of
TFPQ. The findings again confirm a story of quality upgrading over the life cycle.
The latter is inferred from the rise in material prices and wages, which all increase
with age. Furthermore, figure 2.7 establishes that what underlies the increasing wages
is a rise in the ratio of skilled to unskilled workers. Higher efficiency gets passed along
FIGURE 2.5 Demand Is More Important than TFPQ at Mature Stages: Colombia
90th percentile 10th percentile MedianMean
01
3
5
7
0−2 6 10 14 18 22 26 30
Age
a. TFPQ
01
3
5
7
0−2 6 10 14 18 22 26 30
Age
b. Demand shock
01
3
5
7
0−2 6 10 14 18 22 26 30
Age
c. Input prices
01
3
5
7
0−2 6 10 14 18 22 26 30
Age
d. Average wage
Log
scal
e
Log
scal
e
Log
scal
e
Log
scal
e
Source: Eslava and Haltiwanger 2017.Note: The data include year and sector fixed effects. TFPQ = physical total factor productivity.

Enhancing Firm Performance 37
FIGURE 2.6 Demand Is More Important than TFPQ at Mature Stages: Malaysia
90th percentile 10th percentile MedianAverage
00
1
2
3
4
01234
0
1
2
3
4
0
0.5
1.0
1.5
2.0
56
3 6 9 12 15Age
Log
scal
e
Log
scal
e
Log
scal
e
Log
scal
e
a. TFPQ b. Demand shock
c. Material prices d. Wages
18 21 24 27 0 3 6 9 12 15Age
18 21 24 27
0 3 6 9 12 15Age
18 21 24 27 0 3 6 9 12 15Age
18 21 24 27
Source: Zaourak 2018.Note: Controlled by year and sector fixed effects. Outliers below the 3rd percentile and above the 97th percentile are trimmed. TFPQ = physical total factor productivity.
FIGURE 2.7 Firms Hire More Skilled Labor and Use Higher-Quality Inputs as They Raise Quality during Their Life Cycle
90th percentile 10th percentile MedianAverage
0
1
2
3
Log
scal
e
0
0.20.30.40.5
0.1
0.60.70.80.91.0
Leve
ls
b. Output pricea. Skilled-unskilled ratio
0 3 6 9 12 15Age
18 21 24 27 0 3 6 9 12 15Age
18 21 24 27
Source: Zaourak 2018.Note: Controlled by year and sector fixed effects. Outliers below the 3rd percentile and above the 97th percentile are trimmed.

38 Productivity Revisited
to workers in the form of higher earnings, but quality upgrading increases demand
for more skilled workers.
These results are confirmed for Mexico, where Cusolito, Iacovone, and Sanchez
(2018) find that TFPQ increases modestly over the life cycle, with markups explaining
most of the gains in firm performance at mature stages. A comparison between single
and multiproduct firms reveals that markups and changes in markups are higher for
multiproduct firms than for single-product ones. Thus, the evidence suggests a higher
scope for product differentiation for firms that sell more than one good and operate in
sectors with long quality ladders. Last, Canales and García Marín (2018) show that
across the life cycle of high-growth firms in Chile, roughly 20 percent of firm growth is
due to efficiency gains and about 80 percent is due to increased demand.
In fact, the evolution of demand and efficiency cannot be treated as independent.
Firms able to access foreign markets learn by exporting (De Loecker 2013; Atkin,
Khandelwal, and Osman 2017). Mayer, Melitz, and Ottaviano (2014) document how
demand shocks in export markets led French multiproduct exporters to shift their
product mix toward those with greater productivity. Cusolito, Fernandes, and Maemir
(2018) for this report find similar evidence for Romania. Broadly following Mayer,
Melitz, and Ottaviano (2016), they show that three different types of demand shocks,
at the country, industry, and firm levels, increase average exports per product and the
number of exported products. This increase causes multiproduct exporters to change
their export product mix toward their best-performing products, which, in turn,
increases both labor productivity and TFPR (figure 2.8). Although changes in TFPR
can reflect positive price variations due to the demand shock, the authors find little
evidence in this direction (figure 2.8), suggesting that improvements in TFPR are
mainly related to efficiency gains after the demand shock.
Suggesting another channel, Lederman et al. (2018), using linked employer-
employee data for Brazil, find that for large firms, higher export intensity increases the
margins of firm growth, including TFPQ, product appeal, markups, and production
scale, through the demand for more skilled workers.
Firm Size and Development
The preceding discussion offers some keys to unlocking the puzzle of the large differ-
ences in mature firm sizes viewed across countries and the development process. Hsieh
and Klenow (2014) document that in the United States, the average 40-year-old plant
employs more than seven times as many workers as the typical plant that is 5 years old
or younger. In contrast, over the same age range, plants in India and Mexico only dou-
ble in size. Furthermore, the growth trajectories are closely matched by the evolution of
TFP. Figure 2.9, drawing on the World Bank Enterprise Surveys, show that this is a
broader phenomenon, with firm size clearly increasing with the level of development.
This is consistent with findings discussed earlier that efficiency and quality tend to be

Enhancing Firm Performance 39
FIGURE 2.8 Increased Demand from Trade Causes Firms to Concentrate on Their Best-Performing Products but Has Little Impact on Product Price
0.06
0.13
0.57
0
0.2
0.4
0.6
Coef
ficie
nts
Industry-specificshock
Firm-specificshock
GDP
a. Demand shock and product mix concentration(Demand shocks and skewness: first difference)
0.00
0.01
0.03
0
0.01
0.02
0.03
Coef
ficie
nts
Price TFPR
b. Demand and prices(Demand shock productivity and price: first difference)
LPR
Source: Cusolito, Fernandes, and Maemir 2017. Note: Panel a displays the coefficients of the regression of the Theil index on three types of demand shocks: country, industry, and firm. Panel b shows the coefficients of the regression of labor productivity (LPR), revenue total factor productivity (TFPR), and price on the firm-level demand shock.
FIGURE 2.9 Firm Size Increases with the Level of Development
50 MYSSGP
QAT
KWTCHEIRL
TWL
EEL
NLD
AUS
NOR
UVKSYRIDN
MARHND
PSE
LAO
SLE
MWIETH
BEN
NICIRN
MNE
REUGRC
CYP
SVKLBYECU
TURPANSRB
CZE
SAU
ISDHKG
SWE
PIN
USAAUT
DEUTTO
UKR
BGRVENBRA LVR
RUS
LTUROUMKD
ARGGEO
LKA
KGZ
GHAKHM
CMRSDN
UGARWA
NPLMDG
PHLMDA
PRI
ARE
25
1
500 2,500
GDP per capita (log scale)
10,000 50,000
2
10
Esta
blis
hmen
t size
(log
sca
le)
4
Source: Bento and Restuccia 2017.

40 Productivity Revisited
lower in developing countries, as may well be the ability to amass a large client base. All
three can be restrained by problems in the operating environment and deficient human
capital and firm capabilities.
Concluding Remarks
This chapter documents the major shifts in measurement and conceptualization of
firm productivity. It has two important implications for policy.
First, it challenges much of the empirical literature to date that has worked with
standard measures of TFPR and asks for a reexamination of a long list of revenue-
based productivity studies linking productivity (efficiency) changes to policy changes
such as trade liberalization or market deregulation. As shown here, important iden-
tification problems can lead to misleading conclusions and policy prescriptions. Of
great importance is the need to approach the analysis of productivity and market
structure in an integrated fashion, to understand both how policy initiatives work
their way through the market structure and how firms subsequently respond.
Thus, this chapter seeks to initiate an ambitious new empirical agenda for develop-
ing countries that requires a commitment to collect systematic data on prices, specifi-
cally at the firm-product level. This report has identified and worked with industrial
data sets from Brazil, Chile, China, India, Colombia, Ethiopia, Malaysia, and Mexico
that have such data, but most countries do not.
Second, the chapter argues that policies to improve firm performance and growth
need to move beyond a narrow focus on efficiency to explore the upgrading of product
quality and the cultivation of demand. All require improvements both on the human
capital side and in the operating environment. Both efficiency and quality require
strengthening the ability of firms to identify, adapt, and implement new productive
technologies and processes (that is, technology transfer). Both require investments in
“innovation,” broadly construed, ranging from improving managerial practices to
licensing of technologies, and R&D, supported by the kinds of policies discussed at
length in The Innovation Paradox (Cirera and Maloney 2017), as well as specific initia-
tives in quality infrastructure and marketing. In terms of cultivating demand, the find-
ings in this chapter suggest the need to rebalance business support services toward this
end, as well as exploring policies to reduce search, matching, and informational fric-
tions, strengthen links to multinational firms and facilitate access to global value chains,
develop networks, and facilitate investments in marketing and advertising.
The next chapter discusses how the distortions or market failures in the operating
environment can lead to the misallocation of factors across firms and hence inhibit
productivity growth along the first margin. Moreover, it also explores in depth how
they may also affect both the within-firm upgrading discussed in this chapter and the
entry of more efficient and higher-quality firms as well.

Enhancing Firm Performance 41
Annex 2A. Quality and Physical Total Factor Productivity Estimation
As discussed, quality differences across firms could have implications for the estima-
tion of productivity (TFPQ). Indeed, even if output and input price data at the firm
level are available, which allows the production function to be estimated in physical
units, not controlling explicitly for quality generates biased production elasticities and
productivity measures. Why? Because high-quality production processes typically use
higher quantities of inputs to produce the same product. For instance, high-quality
wine production uses only the best vines, leading to more waste of grapes per unit of
wine produced. Thus, not controlling for quality differences could lead to the mistaken
conclusion that a plant producing high-quality products is relatively more ineffi-
cient, even if data on inputs and outputs are available in terms of physical units.
This explanation sounds reasonable, but the challenge is to empirically prove it, given
that product quality is often an unobservable variable.
To bridge that gap, Cusolito, García, and Juvenal (2018) focus on the wine industry
in Chile and create a new and unusually rich database at the firm level that merges
several sources of information, including the manufacturing census, export transaction
data, and observable measures of quality coming from publicly available experts’ wine
rankings.
The authors first confirm that ignoring quality biases TFPQ downward, making
high-quality firms look unproductive. That finding also challenges the standard
approach of inferring the quality content embedded in a product by estimating the
residual of a demand function and instrumenting prices with TFPQ (when firm-level
prices are observed). If the production elasticities are biased and contaminated for the
parameter meant to capture the relative importance of quality on output, then TFPQ
still contains quality determinants, and it is not orthogonal to the demand residual—
thus invalidating the condition needed for a valid instrument. Furthermore, the find-
ing shows that one cannot, as Schott (2008) does, simply treat output prices as measures
of quality. Hence, the task of separating efficiency from quality—which requires con-
trolling for quality—becomes challenging, even when firm-level prices are available.
Notes
1. Schmitz (2005), for example, analyzing the U.S. and Canadian iron ore industries when faced with increased competition from Brazil, documents a doubling of labor productivity arising from invest-ment in management practices (raising worker competencies and reorganizing work schedules, leading to better capital utilization) and a loosening of restrictive work practices, including over-staffing. Dunne, Klimek, and Schmitz (2008) also note that TFP in the U.S. cement industry had been falling for decades until the entry of firms from Australia, Japan, Mexico, and Spain, among others, in the 1980s. In the following decade, TFP increased by 35 percent among U.S. cement mak-ers, with 75 percent of that increase arising from within plants. Again, the increased ability to adjust the workforce and the relaxation of some workplace regulations were central factors in generat-ing these improvements. Both studies argue that the previous rents made possible work rules that

42 Productivity Revisited
prohibited plants from firing workers to make way for the adoption of new technologies or machin-ery, and hence had impeded innovation. De Loecker (2011) shows that productivity rose in Belgian textiles when important tariffs were reduced. See also Holmes and Schmitz (2010).
2. Duval, Hong, and Timmer (2017) show that credit constraints impeded firms’ emergence from the financial crisis.
3. “Why Is Fruit So Expensive in Japan?” The Independent, July 16, 2014, https://www.independent .co.uk/life-style/food-and-drink/features/why-is-fruit-so-expensive-in-japan-9605105.html.
4. The goods were identified as identical as classified by the Harmonized System of industrial classification at the 10-digit (HS-10) level of disaggregation.
5. The Wine Spectator is perhaps the most comprehensive guide to wines around the globe. Each year, it provides scores for about 300–400 Chilean wines. The ratings are given on a scale of 50 to 100 points—where a higher score indicates higher quality—for a sample of wines within firms. Varieties are uniquely identified according to the name of the producer, the commercial name of the wine, the wine grape, and vintage year. Descorchados is a Chilean wine publication that pro-vides scores for an average of 1,000 wines each year, as well as information on prices per bottle. Wine tasters working for Descorchados make a first selection of the top wines within a vineyard, called recommended, and provide a quality ranking per vineyard, based on blind tasting, and information about the ratio of tasted wines to recommended wines, which can also be used to construct categorical quality variables at the vineyard level.
6. Sutton (1998), in fact, lumps investments in these dimensions together as R&D.
7. To control for quality differences, the study relies on a nested constant elasticity of substitution structure for preferences for goods produced by multiproduct firms (Hottman, Redding, and Weinstein 2016).
References
Aghion, P., N. Bloom, R. Blundell, R. Griffith, and P. Howitt. 2005. “Competition and Innovation: An Inverted-U Relationship.” Quarterly Journal of Economics 120 (2): 701–28.
Ahn, J. B., E. Dabla-Norris, R. A. Duval, B. Hu, and L. Njie. 2016. “Reassessing the Productivity Gains from Trade Liberalization.” Working Paper 16/77, International Monetary Fund, Washington, DC.
Ahn, J. B., and R. A. Duval. 2017. “Trading with China: Productivity Gains, Job Losses.” IMF Working Paper 17/122, International Monetary Fund, Washington, DC.
Atkin, D., A. K. Khandelwal, and A. Osman. 2017. “Exporting and Firm Performance: Evidence from a Randomized Experiment.” Quarterly Journal of Economics 132 (2): 551–615.
Bastos, P., J. Silva, and E. Verhoogen. 2018. “Export Destinations and Input Prices.” American Economic Review 108 (2): 353–92.
Bento, P., and D. Restuccia. 2017. “Misallocation, Establishment Size, and Productivity.” American Economic Journal: Macroeconomics 9 (3): 267–303.
Bloom, N., M. Draca, and J. Van Reenen. 2016. “Trade-Induced Technical Change? The Impact of Chinese Imports on Innovation, IT and Productivity.” Review of Economic Studies 83 (1): 87–117.
Canales, M., and A. García Marín. 2018. “Productividad, tamaño y empresses súper-estrella: Evidencia microenonómica para Chile.” Working paper, University of Chile.
Cirera, X., and W. F. Maloney. 2017. The Innovation Paradox: Developing-Country Capabilities and the Unrealized Promise of Technological Catch-Up. Washington, DC: World Bank.
Combris, P., S. Lecocq, and M. Visser. 1997. “Estimation of a Hedonic Price Equation for Bordeaux Wine: Does Quality Matter?” Economic Journal 107 (441): 390–402.

Enhancing Firm Performance 43
Cusolito, A. P., A. M. Fernandes, and H. Maemir. 2018. “Cross-Country Evidence on the Effects of Demand Shocks on the Product Mix.” Background paper for Productivity Revisited, World Bank, Washington, DC.
Cusolito, A. P., M. García, and L. Juvenal. 2018. “Quality and Efficiency in the Wine Industry.” Background paper for Productivity Revisited, World Bank, Washington, DC.
Cusolito, A. P., A. García Marín, and W. F. Maloney. 2017. “Competition, Innovation and Within-Plant Productivity: Evidence from Chilean Plants.” Background paper for Productivity Revisited, World Bank, Washington, DC.
Cusolito, A. P., L. Iacovone, and L. Sanchez. 2018. “The Effects of Chinese Competition on All the Margins of Firm Growth.” Background paper for Productivity Revisited, World Bank, Washington, DC.
De Loecker, J. 2011. “Product Differentiation, Multiproduct Firms, and Estimating the Impact of Trade Liberalization on Productivity.” Econometrica 79 (5): 1407−51.
———. 2013. “Detecting Learning by Exporting.” American Economic Journal: Microeconomics 5 (3, August): 1–21.
———. 2017. “Productivity Analysis Using Micro Data. Where Do We Stand?” Background paper for Productivity Revisited, World Bank, Washington, DC.
De Loecker, J., and J. Eeckhout. 2018. “Global Market Power.” Working Paper, Katholieke Universiteit Leuven.
De Loecker, J., P. K. Goldberg, A. K. Khandelwal, and N. Pavcnik. 2016. “Prices, Markups, and Trade Reform.” Econometrica 84 (2): 445–510.
Dunne, T., S. Klimek, and J. Schmitz. 2008. “Does Foreign Competition Spur Productivity? Evidence from Post-WWII US Cement Manufacturing.” Working Paper, Federal Reserve Bank of Minneapolis.
Duval, R. A., G. H. Hong, and Y. Timmer. 2017. “Financial Frictions and the Great Productivity Slowdown.” IMF Working Paper 17/129, International Monetary Fund, Washington, DC.
Eslava, M., and J. Haltiwanger. 2017. “The Drivers of Life-Cycle Growth of Manufacturing Plants.” Background paper for Productivity Revisited, World Bank, Washington, DC.
Foster, L., J. Haltiwanger, and C. Syverson. 2016. “The Slow Growth of New Plants: Learning about Demand?” Economica 83 (329): 91–129.
Holmes, T. J., and J. A. Schmitz Jr. 2010. “Competition and Productivity: A Review of Evidence.” Annual Review of Economics 2 (1): 619–42.
Hombert, J., and A. Matray. 2018. “Can Innovation Help US Manufacturing Firms Escape Import Competition from China?” Journal of Finance, June 5, https://doi.org/10.1111/jofi.12691.
Hottman, C., S. Redding, and D. E. Weinstein. 2016. “Quantifying the Sources of Firm Heterogeneity.” Quarterly Journal of Economics 131 (3): 1291–364.
Hsieh, C. T., and P. J. Klenow. 2014. “The Life Cycle of Plants in India and Mexico.” Quarterly Journal of Economics 129 (3): 1035–84.
Katayama, H., S. Lu, and J. Tybout. 2003. “Why Plant-Level Productivity Studies Are Often Misleading, and an Alternative Approach to Interference.” NBER Working Paper 9617, National Bureau of Economic Research, Cambridge, MA.
Khandelwal, A. 2010. “The Long and Short (of) Quality Ladders.” Review of Economic Studies 77 (4): 1450–76.
Krishna, P., A. Levchenko, and W. Maloney. 2018. “Growth and Risk: The View from International Trade.” Unpublished, World Bank, Washington, DC.
Kugler, M., and E. Verhoogen. 2011. “Prices, Plant Size, and Product Quality.” Review of Economic Studies 79 (1): 307–39.

44 Productivity Revisited
Lederman, D., G. Miion, R. Prado-Provenca, and J. Silva. 2018. “Trade, Skills, and Productivity.” Working Paper, World Bank, Washington, DC.
Manova, K., and Z. Zhang. 2012. “Multi-product Firms and Product Quality.” NBER Working Paper 18637, National Bureau of Economic Research, Cambridge, MA.
Mayer, T., M. J. Melitz, and G. I. Ottaviano. 2014. “Market Size, Competition, and the Product Mix of Exporters.” American Economic Review 104 (2): 495–536.
———. 2016. “Product Mix and Firm Productivity Responses to Trade Competition.” NBER Working Paper 22433, National Bureau of Economic Research, Cambridge, MA.
McMillan, M. S., and D. Rodrik. 2011. “Globalization, Structural Change and Productivity Growth.” NBER Working Paper 17143, National Bureau of Economic Research, Cambridge, MA.
Schmitz Jr., J. A. 2005. “What Determines Productivity? Lessons from the Dramatic Recovery of the US and Canadian Iron Ore Industries Following their Early 1980s Crisis.” Journal of Political Economy 113 (3): 582–625.
Schott, P. K. 2008. “The Relative Sophistication of Chinese Exports.” Economic Policy 23 (53): 6–49.
Sutton, J. 1998. Technology and Market Structure. Cambridge, MA: MIT Press.
Zaourak, G. 2018. “Quality-Upgrading over the Life Cycle. Evidence for Malaysia.” Background paper for Productivity Revisited, World Bank, Washington, DC.

45
3. Misallocation, Dispersion, and Risk
Chapter 2 focuses not only on efficiency but also on new ways of conceiving of firm
performance and approaches to improving it through the accumulation of physical,
human, and knowledge capital. Ideally, a well-functioning economy would ensure that
these factors flowed to those firms that can use them most productively, grow most
rapidly, and create the most jobs. Conceptually, the returns to, for instance, an addi-
tional unit of physical investment should be equated across all firms: no productivity
gains can be reaped by taking resources from one firm and giving it to another. In real-
ity, however, distortions and market failures—such as missing financial markets, labor
market regulations, and taxes—exist in all economies to a greater or lesser degree.
Hence, dispersion occurs in marginal products, potentially indicating misallocation.
Hence, in explaining differences in levels of development, it is not only the level of
accumulation of physical, human, and knowledge capital that matters, but how they are
allocated across heterogeneous firms.
Olley and Pakes (1996) offer a way of capturing the contribution of reallocation to
growth that underlies the Melitz-Polanec decompositions in chapter 1. The key contri-
bution of Hsieh and Klenow (2009) was to offer a quantification of just how large the
cost to societies of such misallocation may be—in a sense, demonstrating how micro-
economic distortions plausibly have large macroeconomic consequences. By interpret-
ing the dispersion in revenue total factor productivity (TFPR) as a direct measure of
distortions, they argue that if capital and labor in China and India are hypothetically
reallocated to reduce dispersion to the extent observed in the United States, their
benchmark country, the “static” or one-off gains in manufacturing total factor produc-
tivity (TFPR) are 30 percent to 50 percent in China and 40 percent to 60 percent
in India.
Part of the attraction of the Hsieh-Klenow framework was its tractability and appar-
ent ease of replicability. Figure 3.1 presents comparable statistics for how much could
be gained if all dispersion were eliminated for 10 developing countries plus the United
States. TFPR would have ranged from 40 percent higher even in the United States to
160 percent higher in Kenya. The impressive magnitude of these potential gains has led
to focusing policy on removing the driving distortions, for instance, by improving the
popular Doing Business rankings.
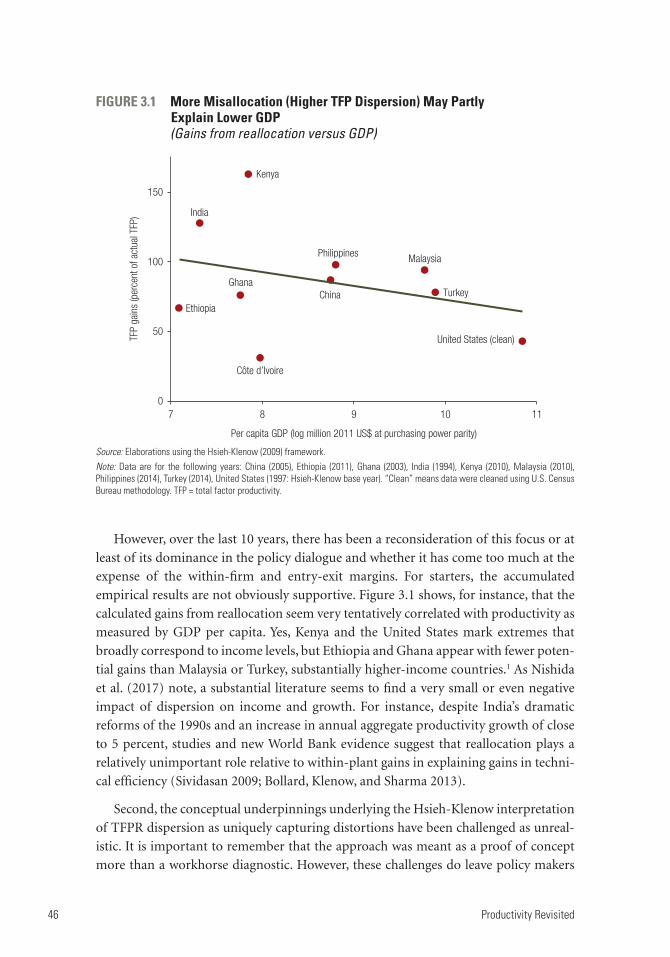
46 Productivity Revisited
However, over the last 10 years, there has been a reconsideration of this focus or at
least of its dominance in the policy dialogue and whether it has come too much at the
expense of the within-firm and entry-exit margins. For starters, the accumulated
empirical results are not obviously supportive. Figure 3.1 shows, for instance, that the
calculated gains from reallocation seem very tentatively correlated with productivity as
measured by GDP per capita. Yes, Kenya and the United States mark extremes that
broadly correspond to income levels, but Ethiopia and Ghana appear with fewer poten-
tial gains than Malaysia or Turkey, substantially higher-income countries.1 As Nishida
et al. (2017) note, a substantial literature seems to find a very small or even negative
impact of dispersion on income and growth. For instance, despite India’s dramatic
reforms of the 1990s and an increase in annual aggregate productivity growth of close
to 5 percent, studies and new World Bank evidence suggest that reallocation plays a
relatively unimportant role relative to within-plant gains in explaining gains in techni-
cal efficiency (Sividasan 2009; Bollard, Klenow, and Sharma 2013).
Second, the conceptual underpinnings underlying the Hsieh-Klenow interpretation
of TFPR dispersion as uniquely capturing distortions have been challenged as unreal-
istic. It is important to remember that the approach was meant as a proof of concept
more than a workhorse diagnostic. However, these challenges do leave policy makers
FIGURE 3.1 More Misallocation (Higher TFP Dispersion) May Partly Explain Lower GDP(Gains from reallocation versus GDP)
Source: Elaborations using the Hsieh-Klenow (2009) framework.Note: Data are for the following years: China (2005), Ethiopia (2011), Ghana (2003), India (1994), Kenya (2010), Malaysia (2010), Philippines (2014), Turkey (2014), United States (1997: Hsieh-Klenow base year). “Clean” means data were cleaned using U.S. Census Bureau methodology. TFP = total factor productivity.
China
Côte d’Ivoire
Ethiopia
Ghana
India
Kenya
MalaysiaPhilippines
Turkey
United States (clean)
0
50
100
150
TFP
gain
s (p
erce
nt o
f act
ual T
FP)
7 8 9 10 11
Per capita GDP (log million 2011 US$ at purchasing power parity)
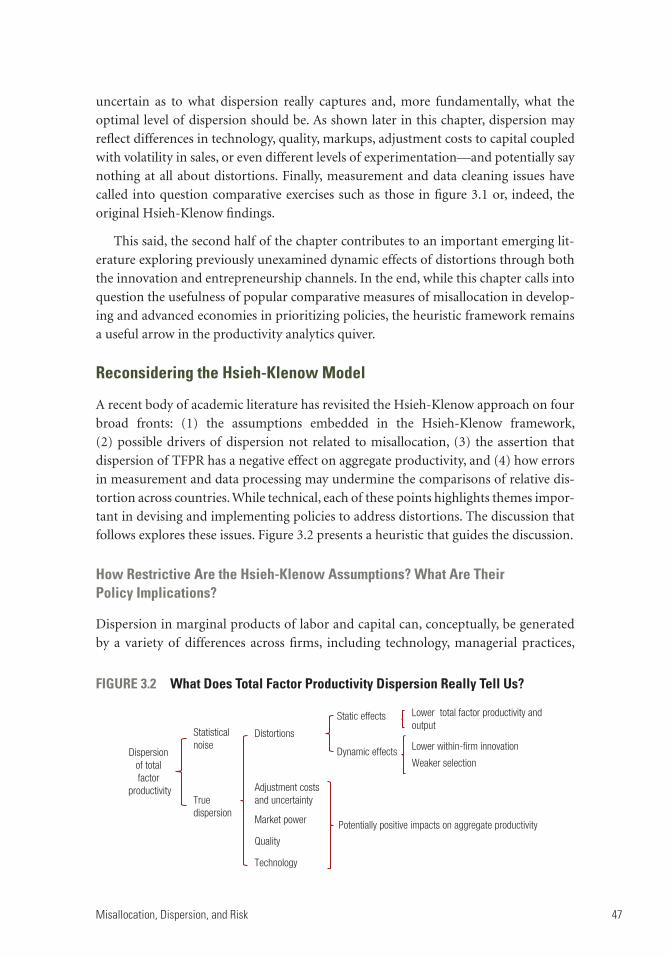
Misallocation, Dispersion, and Risk 47
uncertain as to what dispersion really captures and, more fundamentally, what the
optimal level of dispersion should be. As shown later in this chapter, dispersion may
reflect differences in technology, quality, markups, adjustment costs to capital coupled
with volatility in sales, or even different levels of experimentation—and potentially say
nothing at all about distortions. Finally, measurement and data cleaning issues have
called into question comparative exercises such as those in figure 3.1 or, indeed, the
original Hsieh-Klenow findings.
This said, the second half of the chapter contributes to an important emerging lit-
erature exploring previously unexamined dynamic effects of distortions through both
the innovation and entrepreneurship channels. In the end, while this chapter calls into
question the usefulness of popular comparative measures of misallocation in develop-
ing and advanced economies in prioritizing policies, the heuristic framework remains
a useful arrow in the productivity analytics quiver.
Reconsidering the Hsieh-Klenow Model
A recent body of academic literature has revisited the Hsieh-Klenow approach on four
broad fronts: (1) the assumptions embedded in the Hsieh-Klenow framework,
(2) possible drivers of dispersion not related to misallocation, (3) the assertion that
dispersion of TFPR has a negative effect on aggregate productivity, and (4) how errors
in measurement and data processing may undermine the comparisons of relative dis-
tortion across countries. While technical, each of these points highlights themes impor-
tant in devising and implementing policies to address distortions. The discussion that
follows explores these issues. Figure 3.2 presents a heuristic that guides the discussion.
How Restrictive Are the Hsieh-Klenow Assumptions? What Are Their Policy Implications?
Dispersion in marginal products of labor and capital can, conceptually, be generated
by a variety of differences across firms, including technology, managerial practices,
FIGURE 3.2 What Does Total Factor Productivity Dispersion Really Tell Us?
Dispersion of total factor
productivity
Statisticalnoise
True dispersion
Distortions
Adjustment costs and uncertainty
Market power
Quality
Technology
Static effects
Dynamic effects
Lower total factor productivity andoutput
Lower within-firm innovation
Weaker selection
Potentially positive impacts on aggregate productivity
48 Productivity Revisited
market power, quality, demand, and decision making. To be able to infer distortions
in a compact way, the Hsieh-Klenow framework requires imposing theoretical
assumptions that recent analysis suggests are not realistic (Haltiwanger, Kulick, and
Syverson 2018).
To begin, the methodology interprets any difference across firms in TFPR as reflect-
ing distortions, despite allowing underlying productivities—that is, physical total factor
productivity (TFPQ)—to vary. For this to be the case, the methodology needs to assume
that any increase in productivity is fully offset by a fall in prices (that is, that the elasticity
of prices to technological improvements = −1). Empirical work with census data about
U.S. firms suggests that industry-level elasticities are generally substantially less than 1,
and overall, closer to 0.5 or 0.6, consistent with the common finding of a positive cor-
relation between TFPQ and TFPR. That is, only about half of a rise in efficiency would
be offset by a fall in prices, and that rise would therefore increase measured TFPR
(Haltiwanger, Kulick, and Syverson 2018).
Recent empirical work from follower countries is not supportive either. For example,
studies for Argentina (Chen and Juvenal 2016), Chile (Cusolito, García Marín, and
Maloney 2017), Colombia (Eslava and Haltiwanger 2017), India (De Loecker et al.
2016), and Slovenia (De Loecker and Warzynski 2012) show incomplete pass-through
of productivity to prices. Cusolito, García Marín, and Maloney (2017), Cusolito,
Iacovone, and Sanchez (2018), and Zaourak (2018b) for this volume find that firms
with high TFPQ in Chile, Mexico, and Malaysia charge higher markups. As an example,
figure 3.3, for Malaysia, suggests that firms with lower marginal costs, as expected, pro-
duce more output, but also have higher markups, suggesting that pass-through is not
complete.2
This underlying pass-through relationship could break down at two steps. First, any
increase in productivity needs to be translated proportionately into a decrease in marginal
costs. Second, the decrease in marginal costs needs to be translated proportionately into
lower prices. The first condition requires constant-returns-to-scale production technol-
ogy, which ensures that increases in demand will not change prices or TFPR. This is prob-
ably empirically questionable. Haltiwanger, Kulick, and Syverson (2018) find that TFPR is
positively correlated with firm-specific demand shocks, consistent with chapter 2.
For the second condition, most common demand functions (such as linear ones)
generate less than proportional pass-through of marginal costs into prices. Together,
these suggest that rather than TFPR and TFPQ being independent, the two are
positively related: dispersion of TFPR can reflect the dispersion of underlying
productivity and demand. Also, unlike the Hsieh-Klenow assumptions, it allows
markups to differ across firms.
More prosaically, it is not just that different underlying values of the elasticities
across countries will make comparisons of Hsieh-Klenow distortion measures

Misallocation, Dispersion, and Risk 49
difficult, but they will vary within the manufacturing sector, making even within-
country diagnostics difficult. In addition, as Kasahara, Nishida, and Suzuki (2017)
document, the assumption that all firms have the same underlying production pro-
cesses (technology) is probably too strong. Looking at the Japanese knitted gar-
ment industry, they find that heterogeneity in technology accounted for perhaps 20
percent of measured increases in dispersion in the five years after the bubble burst
in Japan.
In work for this volume, David et al. (2018) use Orbis data for a larger number of
countries and find that heterogeneity in firm-level technologies potentially explains
between one-quarter and one-half of the dispersion in the marginal product of capital
(figure 3.4).3 This is an important result, as it suggests that a nonnegligible portion of
observed dispersion may not entail “misallocation” at all, while markup dispersion is
generally modest. Taken together, these latter two factors—technology heterogeneity
and markups—can explain as much as 50 percent of the observed dispersion.
Ideally, as Haltiwanger, Kulick, and Syverson (2018) suggest, policy makers might
rather look for more direct measures of distortions, at least to see if there is any correla-
tion with the measures derived from the Hsieh-Klenow framework. This is taken up in
FIGURE 3.3 Pass-Through Is Imperfect in Malaysia
Source: Zaourak 2018b, using the Manufacturing Census from the Department of Statistics, Malaysia.Note: The panels plot the log of estimated firm markups and quantity against marginal costs. Variables are de-meaned by product-year fixed effects. Markups, costs, and quantity outliers are trimmed below and above the 3rd and 97th percentiles.
–5
–4
–2
Log
mar
kups
0
2
4
0Log marginal costs
5
a. Markups and marginal costs
–10
–5 0Log marginal costs
5
–5
0
Log
quan
tity
5
10
b. Marginal costs and quantity
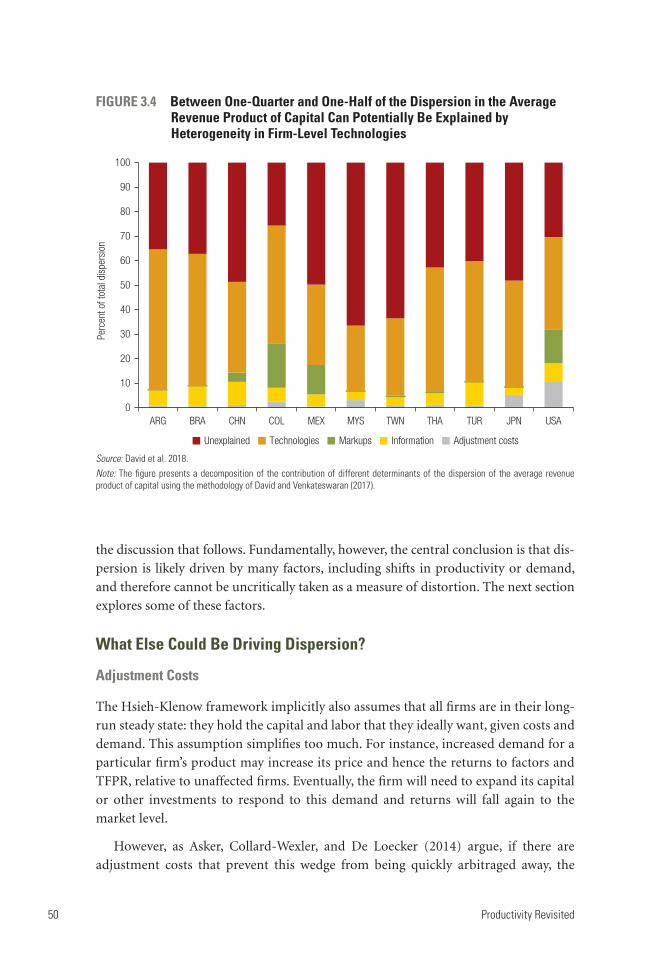
50 Productivity Revisited
the discussion that follows. Fundamentally, however, the central conclusion is that dis-
persion is likely driven by many factors, including shifts in productivity or demand,
and therefore cannot be uncritically taken as a measure of distortion. The next section
explores some of these factors.
What Else Could Be Driving Dispersion?
Adjustment Costs
The Hsieh-Klenow framework implicitly also assumes that all firms are in their long-
run steady state: they hold the capital and labor that they ideally want, given costs and
demand. This assumption simplifies too much. For instance, increased demand for a
particular firm’s product may increase its price and hence the returns to factors and
TFPR, relative to unaffected firms. Eventually, the firm will need to expand its capital
or other investments to respond to this demand and returns will fall again to the
market level.
However, as Asker, Collard-Wexler, and De Loecker (2014) argue, if there are
adjustment costs that prevent this wedge from being quickly arbitraged away, the
FIGURE 3.4 Between One-Quarter and One-Half of the Dispersion in the Average Revenue Product of Capital Can Potentially Be Explained by Heterogeneity in Firm-Level Technologies
Source: David et al. 2018.Note: The figure presents a decomposition of the contribution of different determinants of the dispersion of the average revenue product of capital using the methodology of David and Venkateswaran (2017).
ARG BRA CHN COL MEX MYS TWN THA TUR JPN USA0
10
20
30
40
50
60
70
80
90
100
Perc
ent o
f tot
al d
ispe
rsio
n
Adjustment costsInformationMarkupsTechnologiesUnexplained
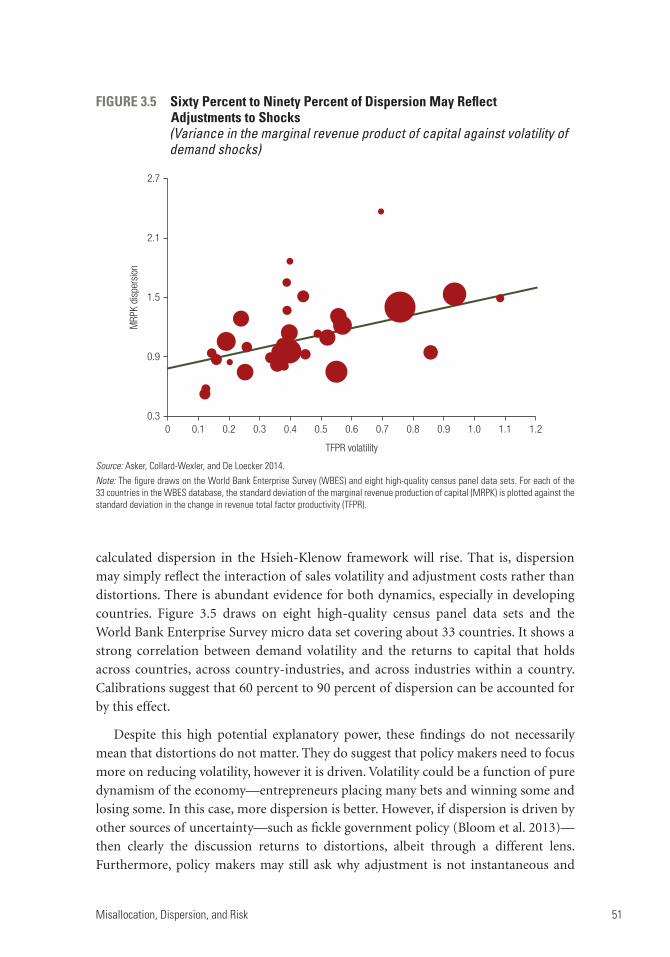
Misallocation, Dispersion, and Risk 51
calculated dispersion in the Hsieh-Klenow framework will rise. That is, dispersion
may simply reflect the interaction of sales volatility and adjustment costs rather than
distortions. There is abundant evidence for both dynamics, especially in developing
countries. Figure 3.5 draws on eight high-quality census panel data sets and the
World Bank Enterprise Survey micro data set covering about 33 countries. It shows a
strong correlation between demand volatility and the returns to capital that holds
across countries, across country-industries, and across industries within a country.
Calibrations suggest that 60 percent to 90 percent of dispersion can be accounted for
by this effect.
Despite this high potential explanatory power, these findings do not necessarily
mean that distortions do not matter. They do suggest that policy makers need to focus
more on reducing volatility, however it is driven. Volatility could be a function of pure
dynamism of the economy—entrepreneurs placing many bets and winning some and
losing some. In this case, more dispersion is better. However, if dispersion is driven by
other sources of uncertainty—such as fickle government policy (Bloom et al. 2013)—
then clearly the discussion returns to distortions, albeit through a different lens.
Furthermore, policy makers may still ask why adjustment is not instantaneous and
FIGURE 3.5 Sixty Percent to Ninety Percent of Dispersion May Reflect Adjustments to Shocks (Variance in the marginal revenue product of capital against volatility of demand shocks)
Source: Asker, Collard-Wexler, and De Loecker 2014.Note: The figure draws on the World Bank Enterprise Survey (WBES) and eight high-quality census panel data sets. For each of the 33 countries in the WBES database, the standard deviation of the marginal revenue production of capital (MRPK) is plotted against the standard deviation in the change in revenue total factor productivity (TFPR).
0.30 0.1 0.2 0.3 0.4 0.5
TFPR volatility
0.6 0.7 0.8 0.9 1.0 1.1 1.2
0.9
1.5
MRP
K di
sper
sion
2.1
2.7

52 Productivity Revisited
whether distortions may not explain why adjustments are faster in some countries than
others. It could be for reasons of uncertainty, limited access to capital, or barriers to
purchasing necessary capital goods.
In addition, David and Venkateswaran (2017) argue that theoretically just looking
at dispersion is not enough to separate out all relevant effects and may overstate the
possible contribution of adjustment effects to explaining dispersion.4 They offer an
integrated framework that combines ingredients of the two previous approaches, and
uses not only dispersion, but several other statistical moments of the data to identify
the respective importance of the individual effects.5 In the case of manufacturing firms
in China, they find only a modest role for uncertainty and adjustment costs, and a
larger role for other factors. They find the reverse for large U.S. firms, though perma-
nent firm-specific factors remain important. So again, it may be that removing distor-
tions is more important for countries at lower levels of development, while for advanced
economies, the more pressing issue is adjustment costs.
Quality
As discussed in chapter 2, better quality is often manifested through higher prices and
may lead to markups resulting from product differentiation. Conceptually, additional
price variance that is not driven by marginal costs will show up as dispersion. In addi-
tion, quality dispersion may increase with the level of quality. Krishna, Levchenko, and
Maloney (2018) explore the patterns of quality upgrading in disaggregated bilateral
exports to the United States, at the 10-digit (HS-10) level of disaggregation in the
Harmonized System (HS) of industrial classification. Export unit values serve as a
proxy for product quality. Figure 3.6 shows that as the average standardized quality
rises, so does the dispersion and TFP. This may make sense: firms or countries capable
of producing higher-quality products may still find it profitable to produce at the lower
end for a different market.
Risk
Pulling together the last sections also raises the question of the role of risk and uncer-
tainty in driving dispersion. Economic development is, by nature, a continuous process
of placing wagers, making uncertain investments in new products, new firms, new
management techniques, new production processes, and the like. The outcome in
terms of higher productivity or quality of a firm or sector is uncertain and leads to
dispersion in TFPR over the medium term.
As empirical support for this effect, Doraszelski and Jaumandreu (2013) show that
engaging in risky innovation, such as research and development (R&D) activities,
roughly doubles the degree of uncertainty in the evolution of a producer’s productivity
level. As it is well documented that investments in R&D as a share of GDP rise with the
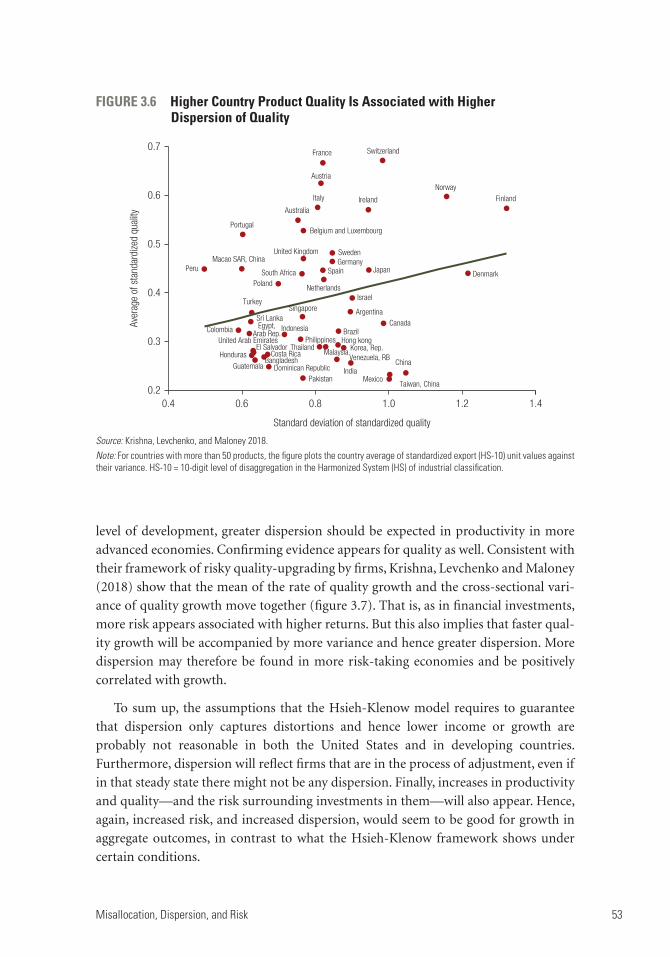
Misallocation, Dispersion, and Risk 53
level of development, greater dispersion should be expected in productivity in more
advanced economies. Confirming evidence appears for quality as well. Consistent with
their framework of risky quality-upgrading by firms, Krishna, Levchenko and Maloney
(2018) show that the mean of the rate of quality growth and the cross-sectional vari-
ance of quality growth move together (figure 3.7). That is, as in financial investments,
more risk appears associated with higher returns. But this also implies that faster qual-
ity growth will be accompanied by more variance and hence greater dispersion. More
dispersion may therefore be found in more risk-taking economies and be positively
correlated with growth.
To sum up, the assumptions that the Hsieh-Klenow model requires to guarantee
that dispersion only captures distortions and hence lower income or growth are
probably not reasonable in both the United States and in developing countries.
Furthermore, dispersion will reflect firms that are in the process of adjustment, even if
in that steady state there might not be any dispersion. Finally, increases in productivity
and quality—and the risk surrounding investments in them—will also appear. Hence,
again, increased risk, and increased dispersion, would seem to be good for growth in
aggregate outcomes, in contrast to what the Hsieh-Klenow framework shows under
certain conditions.
FIGURE 3.6 Higher Country Product Quality Is Associated with Higher Dispersion of Quality
Source: Krishna, Levchenko, and Maloney 2018.Note: For countries with more than 50 products, the figure plots the country average of standardized export (HS-10) unit values against their variance. HS-10 = 10-digit level of disaggregation in the Harmonized System (HS) of industrial classification.
United Arab Emirates
Argentina
Australia
Austria
Belgium and Luxembourg
Bangladesh
BrazilCanada
China
Colombia
Costa Rica
Denmark
Dominican Republic
Egypt,Arab Rep.
El Salvador
Finland
France
Germany
Guatemala
Honduras
Hong kong
India
Indonesia
Ireland
Israel
Italy
Japan
Korea, Rep.
Macao SAR, China
Malaysia
Mexico
Netherlands
Norway
Pakistan
Peru
Philippines
Poland
Portugal
South Africa Spain
Sri Lanka
Sweden
Switzerland
Taiwan, China
Thailand
Turkey
United Kingdom
Venezuela, RB
0.2
0.3
0.4
0.5
0.6
0.7Av
erag
e of
sta
ndar
dize
d qu
ality
0.4 0.6 0.8 1.0 1.2 1.4
Standard deviation of standardized quality
Singapore
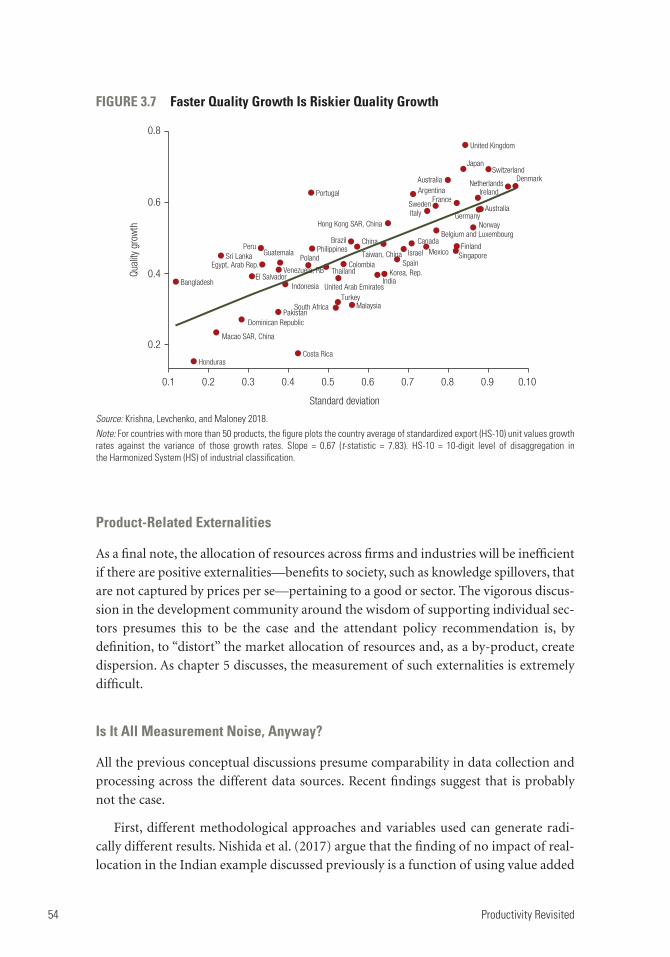
54 Productivity Revisited
Product-Related Externalities
As a final note, the allocation of resources across firms and industries will be inefficient
if there are positive externalities—benefits to society, such as knowledge spillovers, that
are not captured by prices per se—pertaining to a good or sector. The vigorous discus-
sion in the development community around the wisdom of supporting individual sec-
tors presumes this to be the case and the attendant policy recommendation is, by
definition, to “distort” the market allocation of resources and, as a by-product, create
dispersion. As chapter 5 discusses, the measurement of such externalities is extremely
difficult.
Is It All Measurement Noise, Anyway?
All the previous conceptual discussions presume comparability in data collection and
processing across the different data sources. Recent findings suggest that is probably
not the case.
First, different methodological approaches and variables used can generate radi-
cally different results. Nishida et al. (2017) argue that the finding of no impact of real-
location in the Indian example discussed previously is a function of using value added
FIGURE 3.7 Faster Quality Growth Is Riskier Quality Growth
Source: Krishna, Levchenko, and Maloney 2018.Note: For countries with more than 50 products, the figure plots the country average of standardized export (HS-10) unit values growth rates against the variance of those growth rates. Slope = 0.67 (t-statistic = 7.83). HS-10 = 10-digit level of disaggregation in the Harmonized System (HS) of industrial classification.
United Arab Emirates
ArgentinaAustralia
Australia
Belgium and Luxembourg
Bangladesh
Brazil CanadaChina
Colombia
Costa Rica
Denmark
Dominican Republic
Egypt, Arab Rep.
El Salvador
Finland
France
Germany
Guatemala
Honduras
0.1 0.2
0.2
0.3 0.4
0.4
0.5 0.6
0.6
0.8
0.7 0.8 0.9 0.10
Hong Kong SAR, China
IndiaIndonesia
Ireland
Israel
Italy
Japan
Korea, Rep.
Macao SAR, China
Malaysia
Mexico
Netherlands
Norway
Pakistan
Peru PhilippinesPoland
Portugal
Singapore
South Africa
SpainSri Lanka
Sweden
Switzerland
Taiwan, China
Thailand
Turkey
United Kingdom
Qual
ity g
row
th
Standard deviation
Venezuela, RB
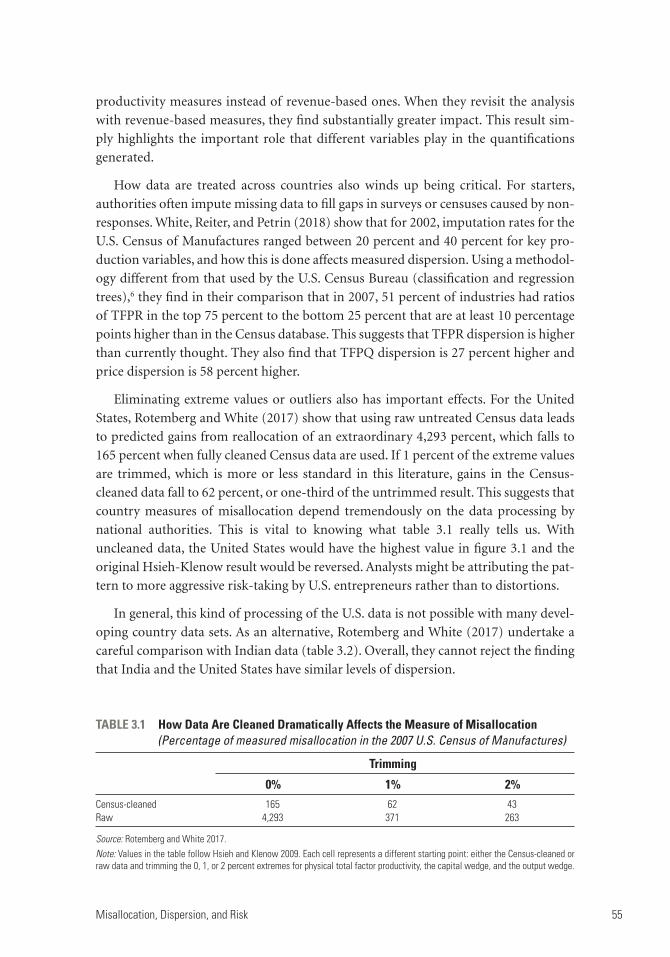
Misallocation, Dispersion, and Risk 55
productivity measures instead of revenue-based ones. When they revisit the analysis
with revenue-based measures, they find substantially greater impact. This result sim-
ply highlights the important role that different variables play in the quantifications
generated.
How data are treated across countries also winds up being critical. For starters,
authorities often impute missing data to fill gaps in surveys or censuses caused by non-
responses. White, Reiter, and Petrin (2018) show that for 2002, imputation rates for the
U.S. Census of Manufactures ranged between 20 percent and 40 percent for key pro-
duction variables, and how this is done affects measured dispersion. Using a methodol-
ogy different from that used by the U.S. Census Bureau (classification and regression
trees),6 they find in their comparison that in 2007, 51 percent of industries had ratios
of TFPR in the top 75 percent to the bottom 25 percent that are at least 10 percentage
points higher than in the Census database. This suggests that TFPR dispersion is higher
than currently thought. They also find that TFPQ dispersion is 27 percent higher and
price dispersion is 58 percent higher.
Eliminating extreme values or outliers also has important effects. For the United
States, Rotemberg and White (2017) show that using raw untreated Census data leads
to predicted gains from reallocation of an extraordinary 4,293 percent, which falls to
165 percent when fully cleaned Census data are used. If 1 percent of the extreme values
are trimmed, which is more or less standard in this literature, gains in the Census-
cleaned data fall to 62 percent, or one-third of the untrimmed result. This suggests that
country measures of misallocation depend tremendously on the data processing by
national authorities. This is vital to knowing what table 3.1 really tells us. With
uncleaned data, the United States would have the highest value in figure 3.1 and the
original Hsieh-Klenow result would be reversed. Analysts might be attributing the pat-
tern to more aggressive risk-taking by U.S. entrepreneurs rather than to distortions.
In general, this kind of processing of the U.S. data is not possible with many devel-
oping country data sets. As an alternative, Rotemberg and White (2017) undertake a
careful comparison with Indian data (table 3.2). Overall, they cannot reject the finding
that India and the United States have similar levels of dispersion.
TABLE 3.1 How Data Are Cleaned Dramatically Affects the Measure of Misallocation (Percentage of measured misallocation in the 2007 U.S. Census of Manufactures)
Trimming
0% 1% 2%Census-cleanedRaw
1654,293
62371
43263
Source: Rotemberg and White 2017.Note: Values in the table follow Hsieh and Klenow 2009. Each cell represents a different starting point: either the Census-cleaned or raw data and trimming the 0, 1, or 2 percent extremes for physical total factor productivity, the capital wedge, and the output wedge.

56 Productivity Revisited
Furthermore, just using the raw U.S. data to calculate dispersion instead of the
Census-cleaned data reverses the relationship between the calculated “gains from real-
location” and GDP in figure 3.1. Figure 3.8 now shows that the most advanced econo-
mies have the most to gain from reallocation. The U.S. value here is likely extreme, but
the exercise shows that without confidence that cleaning methods are comparable across
countries, it is difficult to infer any relationship and reject, for example, a hypothesis that
the entrepreneurial dynamism of the United States drives greater dispersion.
In a similar spirit, Bils, Klenow, and Ruane (2017) revise Hsieh and Klenow’s (2009)
findings when accounting for measurement errors in India and the United States and
find that for Indian manufacturing plants from 1985 to 2011, the true marginal
TABLE 3.2 India and the United States Have Similar Levels of Dispersion after Data Are Similarly Cleaned(Percent)
Country Raw data trimming Clean data trimming
0% 1% 2% 0% 1% 2%United States 4,293 371 264 65 48 40
India 147 91 76 63 58 53
Source: Rotemberg and White 2017.
FIGURE 3.8 Is Dispersion Correlated with Higher GDP? Without Common Data Cleaning Methods, It Is Impossible to Know
Source: Elaboration based on World Bank studies and Rotemberg and White (2017) results. Note: The figure plots the relationship between the level of per capita GDP and TFP gains from equalizing TFPR within industries for selected countries. In panel a, the bullet for the United States is based on Census-cleaned data. In panel b, it is based on raw data. TFP = total factor productivity; TFPR = revenue total factor productivity.
Côte d’Ivoire
Ethiopia
Ghana
IndiaKenya
Malaysia
Turkey
United States (clean)
a. Census—cleaned data b. Census—raw data
TFP
gain
s (p
erce
nt o
f act
ual T
FP)
7 8 9 10 11
Per capita GDP(log million 2011 US$ at purchasing power parity)
Per capita GDP(log million 2011 US$ at purchasing power parity)
China
Côte d’Ivoire
Ethiopia
Ghana
India
Kenya
Malaysia
Turkey
United States (raw)
0
50
100
150
200
250
0
50
100
150
200
250TF
P ga
ins
(per
cent
of a
ctua
l TFP
)
7 8 9 10 11
China
PhilippinesPhilippines

Misallocation, Dispersion, and Risk 57
products are only half as dispersed as measured average products, and the potential
gains from reallocation are reduced by two-fifths.
The bottom line is that it is impossible to draw a straight line between TFPR disper-
sion and the degree of distortion in the economy. More dispersion may reflect a more
dynamic economy in which entrepreneurs are placing more risky bets, both losing but
also winning more, and hence growing more. It may therefore be more productive to
identify what policies or distortions appear to be influencing dispersion (see Restuccia
and Rogerson 2017).
A strand of research tries to do this, exploring the role of adjustment costs in labor
and capital (Hopenhayn and Rogerson 1993), taxes (Guner, Ventura, and Xu 2008),
informality (Busso, Madrigal, and Pagés 2013); government regulations (Hsieh and
Moretti 2015; Fajgelbaum et al. 2015; Brandt, Tombe, and Zhu 2013), property rights
(Besley and Ghatak 2010; Banerjee 1999; Deininger and Feder 2001), trade protec-
tion (Pavcnik 2002; Trefler 2004), and financial frictions (Buera, Kaboski, and Shin
2015). Ideally, analysis would treat these all simultaneously to better isolate the rela-
tive contribution of each driver so as to potentially help order policy priorities.
Correa, Cusolito, and Pena (2017) use the World Bank Enterprise Survey database
and apply the De Loecker (2013) methodology and explore the contribution of a
large set of determinants that includes policy variables related to the business
environment.
Figure 3.9 presents the explanatory contribution to TFPR dispersion of four vari-
ables of interest for low-income and high-income countries according to the World Bank
country classification. In all cases, the direction of the impact is the same at both
FIGURE 3.9 Potential Drivers of TFPR Dispersion
Source: Correa, Cusolito, and Pena 2017, using World Bank Enterprise Survey data.Note: The figure presents the contribution of the main determinants of the dispersion of estimated revenue total factor productivity (TFPR).
–70
–60
–50
–40
–30
–20
–10
Cont
ribut
ion
to v
aria
tion
in T
FPR
disp
ersi
on (p
erce
nt)
0
10
20
Exporting Access to credit Red tape Product marketcompetition
High-income group Low-income group

58 Productivity Revisited
income levels. The number of reported competitor firms and an increase in the num-
ber of exporting firms reduce TFPR dispersion. Product market competition has the
greatest impact of all variables—arguably because it forces the exit of unproductive
firms, thereby trimming the left tail of the TFPR distribution and reducing dispersion.
This is in line with the Hsieh-Klenow interpretation of distortions driving dispersion.
However, the effect of better access to credit and a decrease in distortionary red tape is
to increase dispersion, probably because both help finance experimentation.
Though product competition enters with the largest explanatory power
(50–60 percent), the combined access to credit and red tape variables account for a
non-negligible 15–20 percent. While only a first step toward a more complete mapping
of drivers of dispersion, the analysis again highlights the difficulty of inference from
dispersion.
Dynamic Effects of Distortions
The previous discussion focuses on methodological and measurement issues that
cast doubt on TFPR dispersion as a reliable guide to the likely importance of reallo-
cation to explaining aggregate income differentials. The finding from chapter 1 that
most productivity growth has, in fact, been driven by within-firm improvements
for a sample of important developing countries would also seem to point to de-
emphasizing the distortion-reallocation agenda. However, recent research suggests
that even if the gains envisaged by Hsieh-Klenow are smaller and certainly less clear,
there are other unexplored channels that may magnify the impacts of distortions and
barriers to reallocation. In particular, there may be important dynamic effects
through the decisions that firms make about investments, firm upgrading, and entry
and exit. Hence, while most productivity gains may be through within-firm improve-
ment, these may be importantly affected by the distortions generally associated with
the reallocation margin.
Effects through Intermediate Inputs
Distortions may have additional effects working through the interactions among firms
and sectors. In particular, in research prepared for this volume, Krishna and Tang (2018)
show that efficiency gains from removing distortions may be larger because of addi-
tional effects across industries. For example, policy distortions, such as taxes on output
and inputs, lower firms’ output and raise their prices for upstream firms. This, in turn,
will raise the input prices of downstream firms, lowering production below the socially
optimal level. Removing such distortions will have efficiency gains that are magnified
through this channel. Guided by an extended version of the Hsieh-Klenow framework,
Krishna and Tang (2018) find that the average value of the input-output multiplier for
China—the size of the magnification of a distortion in inputs—for the manufacturing
sector is 3.57, while the multiplier for India is about 2.21. Despite these substantial

Misallocation, Dispersion, and Risk 59
magnitudes, Krishna and Tang (2018) find that aggregate TFP losses from resource
misallocation are similar and sometimes even smaller than those computed using the
core Hsieh-Klenow (2009) approach and subsequent studies. The surprising results
are due to the fact that the dispersion in the marginal revenue product of materials
across firms is substantially smaller than those of labor and capital.
Political Economy Effects
Taxes and financial frictions are frequently cited distortions. In a recent paper, Zaourak
(2018a) presents a political economy framework and explores the role of lobbying for
capital tax benefits in amplifying the effects of misallocation due to financial frictions.
Matching data on lobbying activities in the United States to Compustat firm-level data,
Zaourak finds that lobbying for capital tax benefits together with financial frictions
increases the dispersion in the marginal product of capital and amplifies the negative effect
of the credit shock on output by one-third. The framework is able to explain 80 percent of
the decline in output and almost the entire drop in total factor productivity observed for
the nonfinancial corporate sector during the financial crisis of 2008–09.
Disproportionate Impact of Distortions on More Productive Firms
In reality, distortions probably penalize the more productive firms more heavily.
Thus, the measures available to date probably understate the impact of aggregate
measures of distortion (Restuccia and Rogerson 2008; Hsieh and Klenow 2009, 2014).
In India, for example, rigid labor laws become binding for firms that have hired
10 workers, thereby making it harder for the more productive (larger) firms to adjust
their workforces. In Mexico, the penalties for reducing the workforce to adopt new
technologies were higher than for simply downsizing the workforce, penalizing firms
that were more open to technological advance (Maloney 2009). To show that these
effects may be larger in developing countries, Bloom et al. (2013) and Iacovone,
Maloney, and Tsivanidis (2018) argue that weak contracting laws and institutions
prohibit firms from hiring skilled managers. Clearly, weak financial intermediation,
and thus lack of credit, will penalize firms whose underlying productivity would dic-
tate that they grow to a larger size, or diversify the risk implied in upgrading in pro-
ductivity or quality. Hence, these correlated distortions may have larger impacts than
envisaged originally by Hsieh and Klenow.
Arguing that disturbances are more correlated in developing countries, Bento and
Restuccia (2017), using the World Bank Enterprise Surveys, estimate the productivity
elasticity of distortions: to what extent the Hsieh-Klenow measures of distortion actu-
ally lead to declines in measured productivity. Figure 3.10 shows that the elasticities are
larger for developing countries.
These differential effects may help explain why countries with similar measured
distortion can have such different levels of development.

60 Productivity Revisited
Dynamic Effects
Several recent lines of work have focused on how distortions can affect firm dynamics—
firms’ decisions about investment and entry and exit.
Hsieh and Klenow (2014) acknowledge that the estimates of the impact of misal-
location in their 2009 paper, even if taken as correct, could explain only one-third of
the gaps in aggregate manufacturing TFP between the United States and China or
India. This means that, consistent with the Melitz-Polanec decompositions in the first
chapter, most of the productivity gap is due to differences in plant productivity.
The relevant question is why plant productivity is so low in developing countries.
Hsieh and Klenow (2014) argue that correlated disturbance disproportionately harms
large establishments, inhibiting them from investing in new technologies, developing
new markets, or diversifying into more and higher-quality products. These dynamic
effects can explain why a 40-year-old U.S. plant is, on average, four times as large as a
comparable Mexican plant and six times larger than a comparable Indian plant. These
sizes correspond to gaps between high-productivity and low-productivity firms that
are five to six times larger than in the United States. To the degree that this is due to a
differential impact on large firms of distortions, as opposed to, for instance, manage-
ment quality, as discussed in chapter 2, this is potentially a potent long-term channel
affecting growth.
FIGURE 3.10 Distortions Have Larger Impacts in Developing Countries(GDP per capita and productivity elasticity of distortions)
Source: Bento and Restuccia 2017.
5000 0.2 0.4
Productivity elasticity of distortions
0.6 0.8
2,500
10,000
GDP
per c
apita
(log
sca
le)
50,000
USAESP
POL
MEX
ZAF
HUN
SVK
IRL
SVN CZE
LVAUPA
BIHECH
TURAUS
UKBRA
ALB
PANTTOLTU
KAZ ROUBGBARG
PER
SLV GEOPRY
LAO
YEM
IDNPHL
PSE
INDGHA
KGZ
MDA
HND
BEN
ETH
MDG
MWI
NPLBGD UGA
MNG
COLTHA

Misallocation, Dispersion, and Risk 61
In particular, Hsieh and Klenow see this channel working first, by retarding invest-
ment in intangible capital7 in existing firms; second, by increasing the entry of firms
because of reduced competition by incumbents and thereby lowering average firm
size; and third, by increasing the presence of marginal entrants that are less produc-
tive than firms that otherwise would have entered. By focusing on these life-cycle
effects, their calibrations can account for one-third of the differential between the
United States and India, but explain substantially more of the difference between the
United States and Mexico.
Incorporating the productivity elasticities of distortions discussed into a model of
life-cycle growth yields different but important investment effects. Bento and Restuccia
(2017) simulate the impact if the productivity elasticity of distortions increases from
0.09 in the United States to 0.5 in India and find that aggregate output and average
establishment size fall by 53 percent and 86 percent, respectively, compared with
37 percent and 0 percent in the standard factor misallocation model. This pattern is
presented in figure 3.11. As the productivity elasticity of distortions increases, the return
to investing in productivity decreases and existing firms invest less in upgrading. This
leaves more room for entrants, but for similar reasons, they also choose a lower level of
investment and productivity. The life-cycle investments of firms have little amplifying
power because of the offsetting impact of increased entry. Bento and Restuccia’s data
suggest that, broadly consistent with Hsieh and Klenow, firm size rises with a country’s
level of development (see figure 3.11, panels e and f). The results suggest that account-
ing for entry and endogenous productivity roughly doubles the implied impact of cor-
related distortions, relative to a model with only factor misallocation.
Buera and Fattal Jaef (2018) use those mechanisms to explore the patterns of devel-
opment dynamics resulting from mitigating distortions. Their emphasis has been on
understanding how allocative distortions interact with the incentives of the firms to
invest in innovation and other forms of intangible capital in shaping both the magni-
tude of long-term losses in productivity and the speed of transitional dynamics follow-
ing reforms aimed at alleviating these distortions.
They consider separately two types of convergence episodes: sustained growth
accelerations in the postwar period, and transitions to a more market-oriented econ-
omy by two former communist countries (Hungary, Romania) and one current com-
munist country (China). Figure 3.13 shows the average behavior of TFP and
investment rates for Hungary, Romania, and China, and four acceleration episodes
(Singapore, Japan, Chile, and the Republic of Korea). The former group of countries
is plotted in panel a, and the latter group is plotted in panel b. Despite the initial
slump in the case of Hungary, Romania, and China, both TFP and the investment rate
increase over time. This pattern of behavior has been noted before in the literature as
a challenge for the standard neoclassical growth model, the workhorse model for
studying transitions, because it suggests that TFP should decrease as the country

62 Productivity Revisited
FIGURE 3.11 Higher Productivity Elasticity of Distortions Is Correlated with Lower GDP Per Capita and Smaller Firm Size
0500
2,500
10,000
50,000USA
ESPIRL
KAZ
ZAFTHA ARG
URY
PER
POLHUN
SVKSVN CZE
TTOLVA
TUR
ALBBIH
EZA MNG
IDN
SLV GEOPRY
PHLKGZ HND
GHAIND PSE
BGDBEN
NPLUGAMDG
MWIETH
LAO
YEM
MDA
PANBRG
BRA
ROULTU
MEX
0.2 0.4
Productivity elasticity of distortions
Productivity elasticity of distortions and GDP per capita
GDP
per c
apita
0.6 0.8 0.2500
2,500
10,000
50,000
0 0.4
a. Manufacturing b. Services
ESPUSASWE
IRL
ISR
RUS
VENMUS
NICPHL
PER
UKR
GHA
CMR
TCDRWA
UGA BEN
LAO
SLEMWI
ALB
MAR
WSMVNM
PSETZE
KGZ
HUN
PAN
KAZCZE SVN
BRA
ARG
LTUEST
SVK
Productivity elasticity of distortions
GDP
per c
apita
0.6 0.8
BEN
SYRIDN
PSELAO MAR
HND
NPL
RWAKHM
PHLMDA
KGZ GEO
LKATON
VEN BGRMNP
UKR
MYS
ASM
TTO
PRI
ARE
DEU
SGP
LUX LIE
QATMCOMACUSACHEIRL
SWECZE
LVARUSROU
AUT
GHA
STP
UGA
NICUVK
ECU
MDV GLP
MTQ
NCL
CYPSVKPAN
LBYSRB
TUR
BMU
SMRBRNAUS
NOR
KWT
ALA
GRLMNEIRN
MWI
SLE
1
2
4
10
Firm
size
(log
sca
le)
25
50
c. Manufacturing
GDP per capita and firm size
500 2,500 10,000
GDP per capita (log scale)
50,000
RWA
FSMBEM
MWI
LAOVNM MAR
GEO
UVK ALB
TUN IRN
GUFROUPER UKR
GLPARG
MUS
CPV
TZA
LKATCD
UGA
SLESTP
YEM
GHAMDA
WSMNIC
SLVMLTVEN
ECU
SRB
ASM
URY
GGYDNK
GUMSGP
KWT
BRN QAT
GBR
LIEMCO
NORUSA
SJMANDSWE
MACISL
ALA
ITA
SMR
EST
1
500
Firm
size
(log
sca
le)
2,500 10,000
GDP per capita (log scale)
50,000
2
4
10
25
d. Services
1
2
4
10
25 USA
ESPZAF
POL
COL
NIC
BGD
GHA
SVK HNDVNN
UGAMAR
UKR
BGRLVARUS
MUSLSTGEO
BRAIRLLTU
INDETH MWI
BEN
YEMUVK
PSE
ECU BIHDZA
CZETUR
INDLAO
MNG
TTO
50
e. Manufacturing
Productivity elasticity of distortions and firm size
0 0.2 0.4 0.6 0.8
Productivity elasticity of distortions
Firm
size
(log
sca
le)
1
2
Productivity elasticity of distortions
0 0.2
USA
RWA
TUN ALBLAOBENUVK
VNM MARCPVNGD
UMPPERLKAROUMUSTSE WSM
RHM
VENSLE
FSM
TCDCMR
SVKSLV BRACZE
GEO
ESP
LVA
ISRRUS
MNESRB
MKDURYMNGKGZMDA
HRVLTUBGR SVN
POL SWE
ESF
0.4 0.6 0.8
4
Firm
size
(log
sca
le) 10
25
f. Services
Source: Bento and Restuccia 2016.
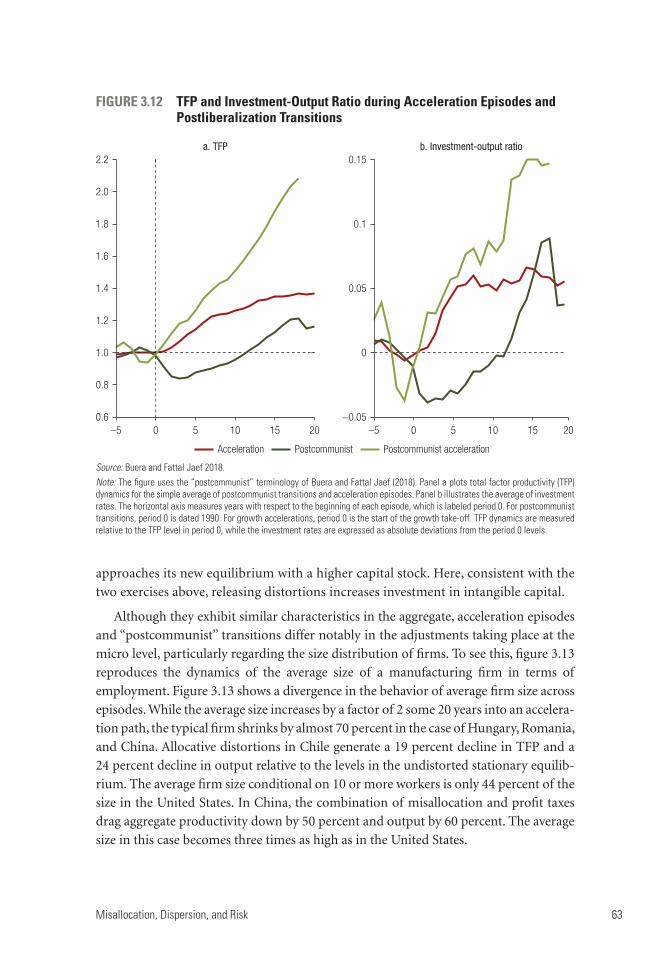
Misallocation, Dispersion, and Risk 63
approaches its new equilibrium with a higher capital stock. Here, consistent with the
two exercises above, releasing distortions increases investment in intangible capital.
Although they exhibit similar characteristics in the aggregate, acceleration episodes
and “postcommunist” transitions differ notably in the adjustments taking place at the
micro level, particularly regarding the size distribution of firms. To see this, figure 3.13
reproduces the dynamics of the average size of a manufacturing firm in terms of
employment. Figure 3.13 shows a divergence in the behavior of average firm size across
episodes. While the average size increases by a factor of 2 some 20 years into an accelera-
tion path, the typical firm shrinks by almost 70 percent in the case of Hungary, Romania,
and China. Allocative distortions in Chile generate a 19 percent decline in TFP and a
24 percent decline in output relative to the levels in the undistorted stationary equilib-
rium. The average firm size conditional on 10 or more workers is only 44 percent of the
size in the United States. In China, the combination of misallocation and profit taxes
drag aggregate productivity down by 50 percent and output by 60 percent. The average
size in this case becomes three times as high as in the United States.
FIGURE 3.12 TFP and Investment-Output Ratio during Acceleration Episodes and Postliberalization Transitions
Source: Buera and Fattal Jaef 2018.Note: The figure uses the “postcommunist” terminology of Buera and Fattal Jaef (2018). Panel a plots total factor productivity (TFP) dynamics for the simple average of postcommunist transitions and acceleration episodes. Panel b illustrates the average of investment rates. The horizontal axis measures years with respect to the beginning of each episode, which is labeled period 0. For postcommunist transitions, period 0 is dated 1990. For growth accelerations, period 0 is the start of the growth take-off. TFP dynamics are measured relative to the TFP level in period 0, while the investment rates are expressed as absolute deviations from the period 0 levels.
–5 0 5 10 15 200.6
0.8
1.0
1.2
1.4
1.6
1.8
2.0
2.2a. TFP
Acceleration Postcommunist Postcommunist acceleration
–5 0 5 10 15 20−0.05
0
0.05
0.1
0.15b. Investment-output ratio
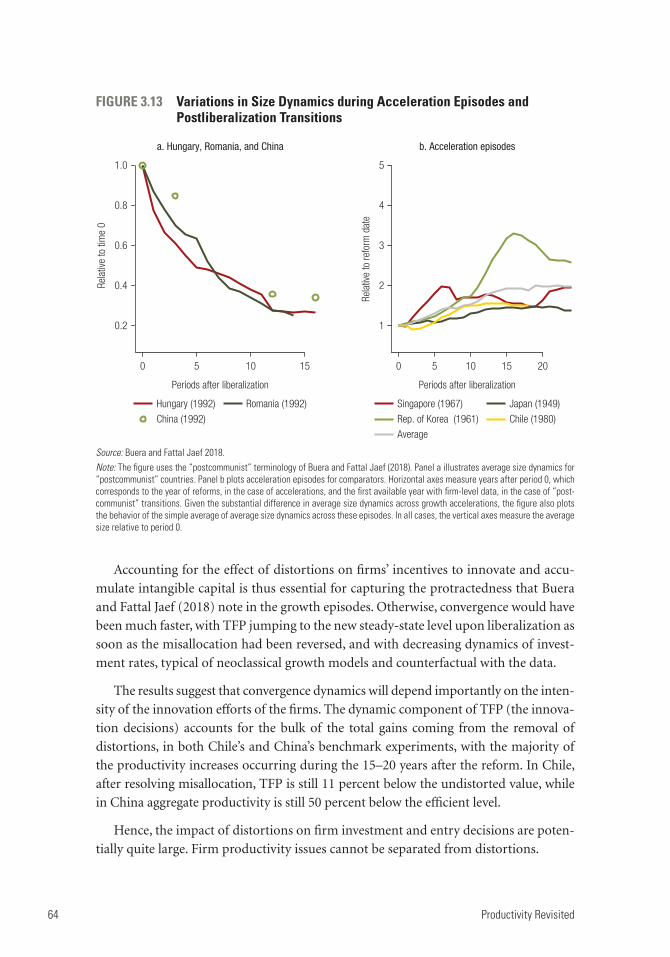
64 Productivity Revisited
Accounting for the effect of distortions on firms’ incentives to innovate and accu-
mulate intangible capital is thus essential for capturing the protractedness that Buera
and Fattal Jaef (2018) note in the growth episodes. Otherwise, convergence would have
been much faster, with TFP jumping to the new steady-state level upon liberalization as
soon as the misallocation had been reversed, and with decreasing dynamics of invest-
ment rates, typical of neoclassical growth models and counterfactual with the data.
The results suggest that convergence dynamics will depend importantly on the inten-
sity of the innovation efforts of the firms. The dynamic component of TFP (the innova-
tion decisions) accounts for the bulk of the total gains coming from the removal of
distortions, in both Chile’s and China’s benchmark experiments, with the majority of
the productivity increases occurring during the 15–20 years after the reform. In Chile,
after resolving misallocation, TFP is still 11 percent below the undistorted value, while
in China aggregate productivity is still 50 percent below the efficient level.
Hence, the impact of distortions on firm investment and entry decisions are poten-
tially quite large. Firm productivity issues cannot be separated from distortions.
FIGURE 3.13 Variations in Size Dynamics during Acceleration Episodes and Postliberalization Transitions
Source: Buera and Fattal Jaef 2018.Note: The figure uses the “postcommunist” terminology of Buera and Fattal Jaef (2018). Panel a illustrates average size dynamics for “postcommunist” countries. Panel b plots acceleration episodes for comparators. Horizontal axes measure years after period 0, which corresponds to the year of reforms, in the case of accelerations, and the first available year with firm-level data, in the case of “post-communist” transitions. Given the substantial difference in average size dynamics across growth accelerations, the figure also plots the behavior of the simple average of average size dynamics across these episodes. In all cases, the vertical axes measure the average size relative to period 0.
0 5 10 15
0.2
0.4
0.6
0.8
1.0
Periods after liberalization
a. Hungary, Romania, and China b. Acceleration episodes
Rela
tive
to ti
me
0
Hungary (1992) Romania (1992)
China (1992)
0 5 10 15 20
1
2
3
4
5
Periods after liberalization
Rela
tive
to re
form
dat
e
Singapore (1967) Japan (1949)
Rep. of Korea (1961) Chile (1980)
Average
Misallocation, Dispersion, and Risk 65
Concluding Remarks
Allocating factors of production to the most productive firms is a critical function
of a well-functioning economy. The growth literature over the last decades has
moved barriers to reallocation to center stage as an explanation for cross-country
income differences, largely on the basis of vast differences in levels of economic dis-
tortions and dispersion of TFPR.
However, the decompositions in chapter 1 suggest that reallocation of factors of
production has been an important driver of productivity growth, although not the
dominant one, in the past for several developing countries, accounting for perhaps
25 percent of efficiency growth. Furthermore, as this chapter shows, the Hsieh-Klenow
framework relies on very strong assumptions that, once rendered more realistic, make
it difficult to disentangle distortions, on the one hand, from adjustment lags and risk or
differences in technology, quality, markups, or even levels of experimentation on the
other. Empirically, conducting comparisons across countries has proved much more
perilous than generally assumed; in one exercise, the United States shows more disper-
sion than most developing countries, and in general, the derived potential impacts
from reallocation vary greatly across sets of assumptions.
Conceptually, however, the framework has proven to be an influential starting point
for thinking about how distortions affect the economy and remains salient. The work
here argues that even if the static “one-off” gains from reallocation are not as great as
thought, distortions in the operating environment also have “dynamic” impacts on
investments in managerial and technical capabilities, or the R&D required to raise effi-
ciency and product quality. Likewise, they contribute to the decisions of potentially
high-productivity firms to enter, and low-productivity firms to exit. This margin and
the interactions between human capital factors and operating environment are the
subject of the next chapter.
Notes
1. Baily, Hulten, and Campbell (1992) document that about half of overall productivity growth in U.S. manufacturing in the 1980s can be attributed to factor reallocation from low-productivity to high-productivity establishments.
2. Alternatively, it is possible that highly efficient firms may also invest more in quality or product differentiation that generates rents.
3. Orbis is Bureau van Dijk’s global database containing production and financial data based on balance sheets of companies across the world.
4. Indeed, the authors show that the use of a single statistical moment like dispersion is not enough to disentangle the importance of a specific factor in explaining (mis)allocation. Their strategy uses readily observable moments in firm-level data, such as capital and revenues, to measure the contributions of technological and informational frictions, as well as a rich class of (potentially distortionary) firm-specific factors.

66 Productivity Revisited
5. These effects are the variance of investment, the autocorrelation of investment, the correlation of investment with past fundamentals, and the covariance of the marginal (revenue) product of capital with fundamentals.
6. Classification and regression trees are machine-learning methods for imputing data or predicting models. The data space is partitioned recursively and each partition is used to make a prediction (Burgette and Reiter 2010).
7. Intangible assets lack physical substance and include patents, copyrights, franchises, goodwill, trademarks, and trade names, and can, under some definitions include software and other intan-gible computer-based assets.
References
Asker, J., A. Collard-Wexler, and J. De Loecker. 2014. “Dynamic Inputs and Resource (Mis)Allocation.” Journal of Political Economy 122 (5): 1013–63.
Baily, M. N., C. Hulten, and D. Campbell. 1992. “The Distribution of Productivity in Manufacturing Plants.” Brookings Papers: Microeconomics 1992, 187–267.
Banerjee, A. 1999. “Land Reforms: Prospects and Strategies.” Conference Paper, Annual World Bank Conference on Development Economics, Washington DC; and MIT Department of Economics Working Paper No. 99-24.
Bento, P., and D. Restuccia. 2016. “Misallocation and Technology: Amplification Effects of Policy Distortions.” Background paper for Productivity Revisited, World Bank, Washington, DC.
———. 2017. “Misallocation, Establishment Size, and Productivity.” American Economic Journal: Macroeconomics 9 (3): 267–303.
Besley, T., and M. Ghatak. 2010. “Property Rights and Economic Development.” In Handbook of Development Economics, edited by D. Rodrik and M. Rosenzwieg, Vol. 5, 4525–95. New York: Elsevier.
Bils, M., P. J. Klenow, and C. Ruane. 2017. “Misallocation or Mismeasurement?” In 2017 Meeting Papers (No. 715), Society for Economic Dynamics.
Bloom, N., B. Eifert, A. Mahajan, D. McKenzie, and J. Roberts. 2013. “Does Management Matter? Evidence from India.” Quarterly Journal of Economics 128 (1): 1–51.
Bollard, A., P. J. Klenow, and G. Sharma. 2013. “India’s Mysterious Manufacturing Miracle.” Review of Economic Dynamics 16 (1): 59–85.
Brandt, L., T. Tombe, and X. Zhu. 2013. “Factor Market Distortions across Time, Space and Sectors in China.” Review of Economic Dynamics 16 (1): 39–58.
Buera, F. J., and R. N. Fattal Jaef. 2018. “The Dynamics of Development: Innovation and Reallocation.” Policy Research Working Paper 8585, World Bank, Washington, DC.
Buera, F. J., J. Kaboski, and Y. Shin. 2015. “Entrepreneurship and Financial Frictions: A Macro-development Perspective.” Annual Review of Economics 7 (August): 409–36.
Burgette, L. F., and J. P. Reiter. 2010. “Multiple Imputation for Missing Data via Sequential Regression Trees.” American Journal of Epidemiology 172 (9): 1070–76.
Busso, M., L. Madrigal, and C. Pagés. 2013. “Productivity and Resource Misallocation in Latin America.” B. E. Journal of Macroeconomics 13 (1): 903–32.
Chen, L., and N. Juvenal. 2016. “Quality, Trade, and Exchange Rate Pass-Through.” Journal of International Economics 100 (May): 61–80.
Correa, P. G., A. P. Cusolito, and J. Pena. 2017. “Identifying and Quantifying the Effects of Private Sector Policies on Productivity Dispersion.” Background paper for Productivity Revisited, World Bank, Washington, DC.

Misallocation, Dispersion, and Risk 67
Cusolito, A. P., A. García Marín, and W. F. Maloney. 2017. “Competition, Innovation and Within-Plant Productivity: Evidence from Chilean Plants.” Background paper for Productivity Revisited, World Bank, Washington, DC.
Cusolito, A. P., L. Iacovone, and L. Sanchez. 2018. “The Effects of Chinese Competition on All the Margins of Firm Growth.” Background paper for Productivity Revisited, World Bank, Washington, DC.
David, J., and V. Venkateswaran. 2017. “The Sources of Capital Misallocation.” NBER Working Paper 23139, National Bureau of Economic Research, Cambridge, MA.
David, J. M., V. Venkateswaran, A. P. Cusolito, and T. Didier. 2018. “Capital Allocation in Developing Countries.” Background paper for Productivity Revisited, World Bank, Washington, DC.
Deininger, K., and G. Feder. 2001. “Land Institutions and Land Markets.” Handbook of Agricultural Economics, edition 1, volume 1A, Agricultural Production, edited by B. L. Gardner and G. C. Rausser, chapter 6, 287–331. New York: Elsevier.
De Loecker, J. 2013. “Detecting Learning by Exporting.” American Economic Journal: Microeconomics 5 (3): 1–21.
De Loecker, J., P. Goldberg, A. Khandelwal, and N. Pavcnik. 2016. “Prices, Markups, and Trade Reform.” Econometrica 84 (2, March): 445–510.
De Loecker, J., and F. Warzynski. 2012. “Markups and Firm-Level Export Status.” American Economic Review 102 (6, October): 2437−71.
Doraszelski, U., and J. Jaumandreu. 2013. “R&D and Productivity: Estimating Endogenous Productivity.” Review of Economic Studies 80 (4): 1338–83.
Eslava, M., and J. Haltiwanger. 2017. “The Drivers of Life-Cycle Business Growth.” Background paper for Productivity Revisited, World Bank, Washington, DC.
Fajgelbaum, P. D., E. Morales, J. C. S. Serrato, and O. M. Zidar. 2015. “State Taxes and Spatial Misallocation.” NBER Working Paper 21760, National Bureau of Economic Research, Cambridge, MA.
Guner, N., G. Ventura, and Y. Xu. 2008. “Macroeconomic Implications of Size-Dependent Policies.” Review of Economic Dynamics 11 (4): 721−44.
Haltiwanger, J., R. Kulick, and C. Syverson. 2018. “Misallocation Measures: The Distortion That Ate the Residual.” NBER Working Paper 24199, National Bureau of Economic Research, Cambridge, MA.
Hopenhayn, H., and R. Rogerson. 1993. “Job Turnover and Policy Evaluation: A General Equilibrium Analysis.” Journal of Political Economy 101 (5): 915–38.
Hsieh, C. T., and P. J. Klenow. 2009. “Misallocation and Manufacturing TFP in China and India.” Quarterly Journal of Economics 124 (4): 1403–48.
———. 2014. “The Life Cycle of Plants in India and Mexico.” Quarterly Journal of Economics 129 (3): 1035–84.
Hsieh, C. T., and E. Moretti. 2015. “Housing Constraints and Spatial Misallocation.” NBER Working Paper 21154, National Bureau of Economic Research, Cambridge, MA.
Iacovone, L., W. Maloney, and N. Tsivanidis. 2018. “Family Firms and Contractual Institutions.” Unpublished working paper.
Kasahara, H., M. Nishida, and M. Suzuki. 2017. “Decomposition of Aggregate Productivity Growth with Unobserved Heterogeneity.” Discussion Paper 17083, Research Institute of Economy, Trade and Industry (RIETI), Tokyo.
Krishna, P., A. Levchenko, and W. Maloney. 2018. “Growth and Risk: The View from International Trade.” Background paper for Productivity Revisited, World Bank, Washington, DC.

68 Productivity Revisited
Krishna, P., and H. Tang. 2018. “Production Networks, Trade and Misallocation.” Background paper for Productivity Revisited, World Bank, Washington, DC.
Maloney, W. F. 2009. “Mexican Labor Markets: Protection, Productivity, and Power.” In No Growth without Equity? Inequality, Interests, and Competition in Mexico, edited by S. Levy and M. Walton. Washington, DC: World Bank and Palgrave Macmillan.
Nishida, M., A. Petrin, M. Rotemberg, and T. White. 2017. “Are We Undercounting Reallocation’s Contribution to Growth?” Center for Economic Studies Paper No. CES-WP-13-55, U.S. Census Bureau, Washington, DC.
Olley, G. S., and A. Pakes. 1996. “The Dynamics of Productivity in the Telecommunications Equipment Industry.” Econometrica 64: 1263–97.
Pavcnik, N. 2002. “Trade Liberalization, Exit, and Productivity Improvements: Evidence from Chilean Plants.” Review of Economic Studies 69 (1): 245–76.
Restuccia, D., and R. Rogerson. 2008. “Policy Distortions and Aggregate Productivity with Heterogeneous Establishments.” Review of Economic Dynamics 11 (4): 707–20.
———. 2017. “The Causes and Costs of Misallocation.” Journal of Economic Perspectives 31 (3): 151–74.
Rotemberg, M., and T. Kirk White. 2017. “Measuring Cross-Country Differences in Misallocation.” Working Paper, New York University and U.S. Census Bureau.
Sivadasan, J. 2009. “Barriers to Competition and Productivity: Evidence from India.” B.E. Journal of Economic Analysis and Policy 9 (1): 1–66.
Trefler, D. 2004. “The Long and Short of the Canada-US Free Trade Agreement.” American Economic Review 94 (4): 870–95.
White, T. Kirk, J. P. Reiter, and A. Petrin. 2018. “Imputation in U.S. Manufacturing Data and Its Implications for Productivity Dispersion.” Review of Economics and Statistics 100 (3): 502–9.
Zaourak, G. 2018a. “Lobbying for Capital Tax Benefits and Misallocation of Resources during a Credit Crunch.” Working Paper 8384, World Bank, Washington, DC.
———. 2018b. “Quality-Upgrading over the Life Cycle. Evidence for Malaysia.” Background paper for Productivity Revisited, World Bank, Washington, DC.

69
4. Entry and Exit: Creating Experimental Societies
Entry of more productive firms and exit of less productive firms account for roughly
one-quarter of productivity growth, as the decompositions in chapter 1 show. However,
that contribution varies greatly by country. While plant entry and exit account for
25 percent of U.S. productivity growth, Foster, Haltiwanger, and Krizan (2001) find, it
accounts for 72 percent in China, according to Brandt, Van Biesebroeck, and Zhang
(2012).1 In the long run, when static gains from reallocation through the elimination
of distortions are exhausted, entry and exit must account for a significantly larger
share because technological advance and firm upgrading will be the only drivers of
reallocation—and firm entry and exit are a key vector of that advance. Finding ways to
promote the entry of productive firms and exit of unproductive ones is central to the
productivity reform agenda.
Here, too, there is fresh thinking on the determinants of entrepreneurship. While
the traditional concerns of market failures and barriers to entry and exit remain criti-
cal, the field over the last decade has seen an expansion of investigation focusing on the
following three topics: thinking of entrepreneurship as a process of experimentation,
the personal characteristics and human capital necessary to facilitate the process, and
long historical processes underlying growth.
Treating entrepreneurship as an experimental process requires a greater focus
on how individuals process information and perceive, tolerate, and manage risk, as
well as on the framework institutions that support this process. Though these
issues have been discussed in the context of scientific discovery (Moscarini and
Smith 2001) and venture capital (Kerr, Nanda, and Rhodes-Kropf 2014), their
application to productivity growth in developing countries is newer. Often a par-
ticular product, process, or technology has never been tried in the local context and
the firm contemplating doing so is facing great uncertainty. An entrepreneurial
sector as a whole needs to learn how to identify projects, evaluate risk, and judge
when to continue and when to exit. Countries go through a process of discovery of
what products and industries will work in their context (see Hausmann and Rodrik
2003, for example).
As to the personal characteristics and human capital that drive productivity growth,
studies of entrepreneurial personality have enjoyed a resurgence, partly as a result of

70 Productivity Revisited
radical increases in data, and partly due to a twenty-first century fascination with
start-up culture, as Kerr, Kerr, and Xu (2017) argue. This resurgence has occurred
jointly with the focus on behavioral economics (Astebro et al. 2014), psychology, and
advances in the study of management quality (Bloom, Bond, and Van Reenen 2007).
The focus on both experimentation and personality or human capital dovetails with
a focus on national learning dominant in Schumpeterian or evolutionary economics
approaches to explaining the Asian miracles. As discussions of changing institutions,
culture, and personality necessarily involve centuries-long processes, the economics
literature has also seen a renewed interest in historical approaches to explaining differ-
ent growth experiences. This chapter follows this trend, as well.
Paralleling chapter 1, this chapter treats entrepreneurship as a response to techno-
logical opportunity. It presents measures of entrepreneurial activity and reveals a puz-
zle in the low number of capable entrepreneurs in developing countries, given the
available technological opportunities. It then offers a simple framework for thinking
about why this might be so, comprising both operational environment factors and
those relating to the quality of entrepreneurs. In the process, the chapter discusses fac-
tors impeding exit, as well.
Drivers of Entry and Exit
Entrepreneurs can be seen as agents who identify and take advantage of the opportuni-
ties accompanying the disequilibria brought on by technological advance (see Schultz
1980; Schmitz 1989; and Holmes and Schmitz 1990). On the one hand, the appearance
of new technologies offers new possibilities for profit in the advanced economies. On
the other, the possibilities of bringing frontier technologies to developing countries
offers huge business opportunities. Reframing the two puzzles from chapter 1, why
have entrepreneurs in advanced economies become less dynamic, and where are the
missing entrepreneurs in developing countries who would propel their countries to the
frontier?
The Global Slowdown in Productivity and Its Relationship to Entry
Part of the answer to the first puzzle, as Haltiwanger et al. (2017) and Decker et al.
(2018) note, is that the decline in productivity growth in advanced economies is
matched by a decline in entry (or exit) and the reallocation it triggers. Although the
entry and churning of firms has no social value per se, it potentially plays an important
role in boosting productivity and job quality if newcomers are more productive than
incumbents and they draw away labor and capital. New small firms are often very good
at identifying new market opportunities (Lerner 2000), where new technologies can be
applied to meet specific customers’ needs. Start-ups are quick to introduce new

Entry and Exit: Creating Experimental Societies 71
products that allow them to reap the benefits of unexploited market niches. Small
young firms hire more workers via poaching from other firms than they lose to other
firms (Haltiwanger et al. 2017); that is, compared with large mature firms, small young
firms exhibit positive net flows of jobs through poaching. To the degree that the decline
in productivity in the advanced economies represents a cyclical downturn, the entry
rate of firms tends to be more cyclical than the exit rate (Lee and Mukoyama 2015).
Figure 4.1 shows that the employment shares for young firms (those less than five
years old) across many sectors have declined steadily since the early 1980s and can be
shown with some care in sectoral analyses to broadly track the decline in productivity.
This suggests either that new firms are not entering or that old firms are not exiting,
with the exception of the information sector, which experienced a huge spike in
employment in the mid-1990s to early 2000s.
Evidence for developing countries is limited because of constraints to data access for
firm-level censuses. However, World Bank analysis for this volume, using data from
regionally representative countries, suggests, if anything, a reverse trend (figure 4.2).
Other measures for these countries similarly suggest different patterns. With the excep-
tion of perhaps Morocco and a very volatile China, entry is broadly stable or increasing,
and exit—again with the exception of China—is broadly increasing. Two other
barometers of dynamism, the dispersion in growth rate of sales and employment,
Source: Haltiwanger 2016.Note: Young firms are defined as those less than five years old. Industries are defined on a consistent North American Industry Classification Scheme (NAICS) basis. Data include all firms (new entrants, exiters, and continuers).
FIGURE 4.1 Employment Shares for Young U.S. Firms Have Declined Steadily since the Early 1980s in Most Sectors
25
30
Sect
oral
em
ploy
men
t sha
re (p
erce
nt)
20
15
10
5
0
1981
1983
1985
1987
1989
1991
1993
1995
1997
1999
2001
2003
2005
2007
2009
2011
Retail ServicesFinance, insurance, and real estate
Manufacturing
Information
Economy-wide

72 Productivity Revisited
similarly show no strong pattern across the period—again, perhaps with a decline
in China ( figure 4.3). In sum, the data are imperfect; coverage varies by country and
measures of dynamism are very sensitive to data noise. However, it is hard to tell a story
for developing countries of a steady decline in business dynamism over the period such
as the one above for the United States.
What Drives Entry and Exit Rates?
The decline in entry, like the slowdown in reallocation discussed in chapter 3, can be
broken down into two components.
First, there may be a decline in opportunities for entrepreneurs. A decline in
entry could then be driven by a decline in technological advance. Variation in start-
up rates may endogenously reflect changes in the pace of innovation in an industry
for the reasons hypothesized by Gort and Klepper (1982): a period of rapid innova-
tion leads to a surge in entry, reallocation, and subsequent productivity growth
from the innovation. That an important part of reduced entry in the United States
might be due to reduced opportunities is suggested precisely by the rise in the share
of young firms in the information industry in the late 1990s. Entrepreneurs reacted
to the new profit opportunities presented by the arrival of information and com-
munication technologies. The overall decline might be consistent with the
FIGURE 4.2 Unlike in the United States, the Proportion of Young Firms in Developing Countries Appears Not to Be Declining
Source: Elaborations using firm-level census data. Note: This figure plots the aggregate proportion of young firms in the manufacturing sector of selected developing countries. Young firms are defined as those less than five years old.
10
20
30
40
50Pe
rcen
tage
of y
oung
firm
s in
man
ufac
turin
g
1997 2000 2003 2006 2009 2012
EthiopiaChina IndonesiaCôte d’Ivoire Morocco

Entry and Exit: Creating Experimental Societies 73
FIGURE 4.3 Measures of Entrepreneurial Dynamism in Developing Countries Show No Clear Pattern of Reduced Entrepreneurial Dynamism, 1997–2012
0
0.1
0.2
0.3
0.4
0.5
a. Entry
Entry
rate
1997 2000 2003 2006 2009 20120
0.1
0.2
0.3
0.4
Exit
rate
1997 2000 2003 2006 2009 2012
b. Exit
Chile EthiopiaChina IndonesiaCôte d’Ivoire Morocco
0.2
0.4
0.6
0.8
1.0
c. Dispersion of employment growth
Inte
rdec
ile ra
nge
of e
mpl
oym
ent g
row
th ra
tes
1997 2000 2003 2006 2009 2012
0.5
1.0
1.5
2.0
d. Dispersion of sales growthIn
terd
ecile
rang
e of
sal
es g
row
th ra
tes
1997 2000 2003 2006 2009 2012
Source: Elaborations using firm-level census data. Note: Panel a (panel b) plots the aggregate rate of entry (exit) in the manufacturing sector of selected developing countries. The rate of entry (exit) is defined as the number of new firms in the market (number of firms leaving the market) divided by the total number of firms. Panel c (panel d) plots the dispersion of firm-level employment (sales) growth in the manufacturing sector of selected developing countries. Dispersion is defined as the interdecile range of the unweighted distribution of employment (sales) growth rates; growth rates are computed such that the denominator is the average employment (sales) level between t−1 and t.
technological pessimism discussed in chapter 1, as argued by Gordon (2015), who
states that the big technological advances have been reaped in the past, or Bloom
et al. (2017), who show that it is taking progressively more and more engineers to
produce an additional unit of total factor productivity.
However, turnover might also be due to a decline in the responsiveness to those
opportunities. Haltiwanger et al. (2014) and Decker et al. (2018) undertake a decomposi-
tion of the two components and argue that the shocks have been more or less constant
across time in the United States, but the responsiveness to shocks, particularly on the exit
and reallocation side, has weakened. The rise of productivity responsiveness in the

74 Productivity Revisited
high-tech sector before 2000 and the fall after 2000 coincide with the rise and fall of aggre-
gate productivity growth in the United States, which was concentrated in information and
communication technology–related industries (Fernald 2014). This fall in responsiveness
occurred in all industries and within every age group of firms. Older low-productivity firms
were more likely to survive (not exit). Some 18 percent of the decline in the information
sector in the period after 2000 was accounted for by activity of new firms, so selection is
clearly an important aspect, if not the whole story.
As mentioned in chapter 1, the factors undermining the responsiveness to opportu-
nities could be increased uncertainty, increased frictions (barriers to entry and exit), or
a reduction in population (reducing the pool of entrepreneurs) (Pugsley and Sahin
2015). World Bank work for this volume by García (2018) undertakes the same decom-
positions for Chile and documents similar findings across Chile’s period of stagnating
productivity growth: shocks to the economy have been more or less constant, but the
responsiveness has fallen. In the case of Chile, an increase in policy uncertainty, a tight-
ening of labor regulations, or a reduction of financing across the financial crisis could
all be relevant. An increase in the average age of firms is clear, as well.
Weak Technological Convergence by Developing Countries
The importance of technological opportunity just discussed has its cross-country analog in
the gaps in the technological level between the advanced economies and follower countries
and the opportunities those gaps offer for rapid catch-up. By the same logic that a shift in
the technological frontier should induce entrepreneurs to exploit new opportunities—as
appears to be the case in the high-tech sectors—we should expect a tremendous number of
entrepreneurs in developing countries to exploit the possibilities of catch-up, given the huge
expected returns documented in chapter 2. In fact, as Comin shows in various papers
(Comin and Mestieri 2018; Comin and Hobijn 2010, 2011) the average rate of technologi-
cal adoption grows more slowly with distance from the frontier. More specifically, it is more
the intensity of adoption that slows. The question is then, Where are the entrepreneurs who
should be taking advantage of the vast potential technological arbitrage?
Panel a of figure 4.4 shows the share of the workforces around the world that are
self-employed. At first glance, the pattern would suggest that, in fact, as predicted, the
share of self-employed or employers increases with distance from the technological
frontier. However, panel b reveals the reverse pattern, focusing only on those firms that
have at least one employee (call them entrepreneurs), as a measure of the firm having
some minimal dynamism or potential to grow into a sophisticated firm. It is the mem-
ber countries of the Organisation for Economic Co-operation and Development
(OECD) that have the highest rate of dynamic entrepreneurship.
Panel c further shows that the labor market share of self-employment by individuals
who are likely to be able to recognize serious technological opportunities and act upon

Entry and Exit: Creating Experimental Societies 75
them—those with some tertiary education—also increases with development. This
partly reflects lower levels of tertiary education, which, in itself, reduces the pool of
possible dynamic entrepreneurs, but also suggests that the very high levels of total self-
employment are a function of low levels of education.
However, panel d shows that even among individuals with tertiary education,
dynamic entrepreneurship increases with development, arguably reflecting the lack of
incentives in the system, or the dearth of more specialized human capital in developing
countries, despite the very high expected returns. This suggests that even this more
educated pool is not seizing technological arbitrage opportunities as would be expected.
In sum, the share of capable entrepreneurs reflects exactly the opposite of what techno-
logical gaps would predict, and the great mass of observed self-employment in devel-
oping countries is likely to represent “unproductive” churning.
FIGURE 4.4 Despite Higher Opportunities from Technological Adoption, Productive Entrepreneurship Is Not Higher in Developing Countries
Argentina
Belize
Bolivia
Brazil
Colombia
Costa Rica
Dominican Republic
Ecuador
GuatemalaGuyana
HondurasHaiti
Jamaica
Mexico
NicaraguaPanama
Peru
ParaguayEl Salvador
Suriname
Venezuela, RB
Uruguay
Chile
Austria SwitzerlandCzechRepublic
Spain
Estonia
Finland
France
UnitedKingdom
Greece
Iceland
Italy
Luxembourg
Netherlands
Norway
PolandPortugal
SlovakRepublic Slovenia
United States
China
Fiji
Indonesia
Cambodia
Lao PDR
Marshall Islands
Philippines
Palau
Papua New Guinea
Solomon Islands
Thailand
Tonga
Vietnam
VanuatuAlbania
Azerbaijan
Bulgaria
Bosnia andHerzegovina
Belarus
Georgia
Hungary
Kazakhstan
Kosovo
Moldova
Macedonia, FYRMontenegro
Serbia
Tajikistan
Turkmenistan
Turkey
Ukraine
Bangladesh
Bhutan
India
Nepal
Pakistan
Angola
BurundiBurkina Faso
Botswana
Cote d’Ivoire
Cameroon
Congo, Rep.
Comoros
Cabo Verde
Ethiopia
Gabon
Ghana
GuineaGambia, TheGuinea-Bissau
Kenya
LiberiaLesotho
Madagascar
Mozambique
Mauritania
Mauritius
Malawi
Niger
Nigeria
Rwanda
Senegal
Sierra Leone
Swaziland
ChadTogo
Tanzania
Uganda
Zambia
Djibouti
Egypt, Arab Rep.
Namibia Jordan
LebanonSyrianArab
Republic
Tunisia
Sweden
Canada
Belgium
Mali
Morocco
Argentina
Belize
Bolivia
BrazilColombia
Costa Rica
Dominican Republic
Ecuador
Guatemala
Honduras
Jamaica
Mexico
Panama
Peru
El Salvador
Suriname Venezuela, RB
Uruguay
Chile
Austria
Belgium
Canada
SwitzerlandCzech Republic
Spain
Estonia
Finland
France
United Kingdom
Greece
Ireland
Iceland
Italy
LuxembourgNetherlands
Norway
Poland
PortugalSlovak Republic
Slovenia
Sweden
China
Fiji
Cambodia
Marshall Islands
Philippines
Thailand
Tonga
Vietnam
Vanuatu
Albania
Bulgaria
Bosnia and Herzegovina
Belarus
Georgia
Hungary
Kazakhstan
Kosovo
Moldova
Macedonia, FYR
Montenegro
Tajikistan
Turkmenistan
Turkey
Ukraine
Bangladesh
BhutanIndia
Pakistan
Angola
Burundi
Burkina Faso
Botswana
Cote d’Ivoire
Cameroon
Congo, Rep.
Comoros Cabo Verde
Ethiopia
Gabon
Ghana
Gambia, TheGuinea-bissau Kenya
LiberiaLesotho
Madagascar
Mozambique
Mauritius
Malawi
NamibiaNiger
Senegal
Sierra LeoneSwaziland
Chad
Zambia
Egypt, Arab Rep.
Jordan Lebanon
Morocco
Syrian Arab Republic
Tunisia
0
20
40
60
80
a. Share of all self-employed in the laborforce versus per capita GDP
Perc
ent o
f wor
kers
4 6 8 10 12
Ln of GDP per capita (constant US$)
b. Share of entrepreneurs in the laborforce versus per capita GDP
0
2
4
6
8
10
Perc
ent o
f wor
kers
4 6 8 10 12
Ln of GDP per capital (constant US$)
Nicaragua
LAC OECD EAP ECA SAR SSA MENA
Uruguay
Chile
Argentina
Belize
Bolivia
Brazil
Colombia
Costa RicaDominican Republic
Ecuador
Guatemala
Guyana
Honduras
Haiti Jamaica
Mexico
Nicaragua
Peru
Paraguay
El Salvador
Suriname
Venezuela, RB
AustriaBelgium
Canada
Switzerland
Czech Republic
Spain
Estonia
Finland
France United Kingdom
Greece
Ireland
Iceland
Italy
Luxembourg
Netherlands
Norway
Poland
Portugal
Slovak RepublicSlovenia
Sweden
United States
China
Indonesia
Cambodia
Lao PDR
Marshall Islands
Philippines
Palau
Solomon Islands Thailand
TongaVietnam
AlbaniaAzerbaijan
Bulgaria
Bosnia and Herzegovina
Belarus
Hungary
Kosovo
Moldova
MontenegroSerbia
Tajikistan
Turkmenistan
TurkeyUkraine
BangladeshBhutan
India
NepalPakistan
AngolaBurundi
Burkina Faso
Botswana
Cote d’Ivoire
Cameroon Congo, Rep.
ComorosCabo Verde
Ethiopia
GabonGhanaGuinea
Gambia, The
Guinea-Bissau
Kenya
Liberia
LesothoMadagascarMaliMozambique
Mauritania
Mauritius
Malawi
Nigeria
Rwanda Senegal
Sierra Leone Swaziland
Chad
Tanzania
Zambia
Djibout
Egypt, Arab Rep.Jordan
Lebanon
Morocco
Syrian Arab Republic
Tunisia
Argentina
Belize
Bolivia
Brazil
Colombia
Costa Rica
Dominican Republic
Ecuador
Guatemala
Honduras
Haiti
Jamaica
Mexico
Nicaragua
Panama
Peru
El Salvador
Suriname
Venezuela, RB
Uruguay
Chile
Austria
Belgium
Canada Switzerland
Czech RepublicSpain
Estonia
Finland
France
United Kingdom
Greece
Ireland
IcelandItaly
Luxembourg
Netherlands
Norway
Poland
PortugalSlovak Republic
SloveniaSweden
China
Indonesia
Cambodia
Marshall Islands
Philippines Thailand
Tonga
VietnamAlbania
Bulgaria
Belarus
Hungary
Kosovo
Moldova
Montenegro
Serbia
Tajikistan
Turkmenistan
Turkey
Ukraine
Bangladesh
Bhutan
IndiaPakistan
Angola
Burundi
Botswana
Côte d’Ivoire
Cameroon
Congo, Rep.
Comoros Cabo Verde
Ethiopia
Gabon
Ghana
Gambia, The
Kenya
Liberia
Lesotho
Madagascar
Mozambique
Mauritius
Malawi
Senegal
Sierra Leone
Swaziland
Tanzania
Zambia
Djiboute
Egypt, Arab Rep.
Jordan
Morocco
Syrian Arab Republic
Tunisia
0
2
4
6
8
10
c. Share of entrepreneurs with tertiary educationin the labor force versus per capita GDP
Perc
ent o
f ter
tiary
-edu
cate
d w
orke
rs
4 6 8 10 12
Ln of GDP per capita (constant US$)
0
2
4
6
8
d. Share of tertiary-educated workers who areentrepreneurs versus per capita GDP
Perc
ent o
f ter
tiary
-edu
cate
d w
orke
rs
4 6 8 10 12
Ln of GDP per capita (constant US$)
Macedonia,FYR
Ireland
Djibouti
Panama
Sources: Elaborations using the latest available year of the World Bank’s International Income Distribution Data Set (I2D2) and Maloney and Rubio 2018 (all panels); Organisation for Economic Co-operation and Development data (panel d).Note: EAP = East Asia and Pacific; ECA = Eastern Europe and Central Asia; LAC = Latin America and the Caribbean; MENA = Middle East and North Africa; OECD = Organisation for Economic Co-operation and Development; SAR = South Asia; SSA = Sub-Saharan Africa.
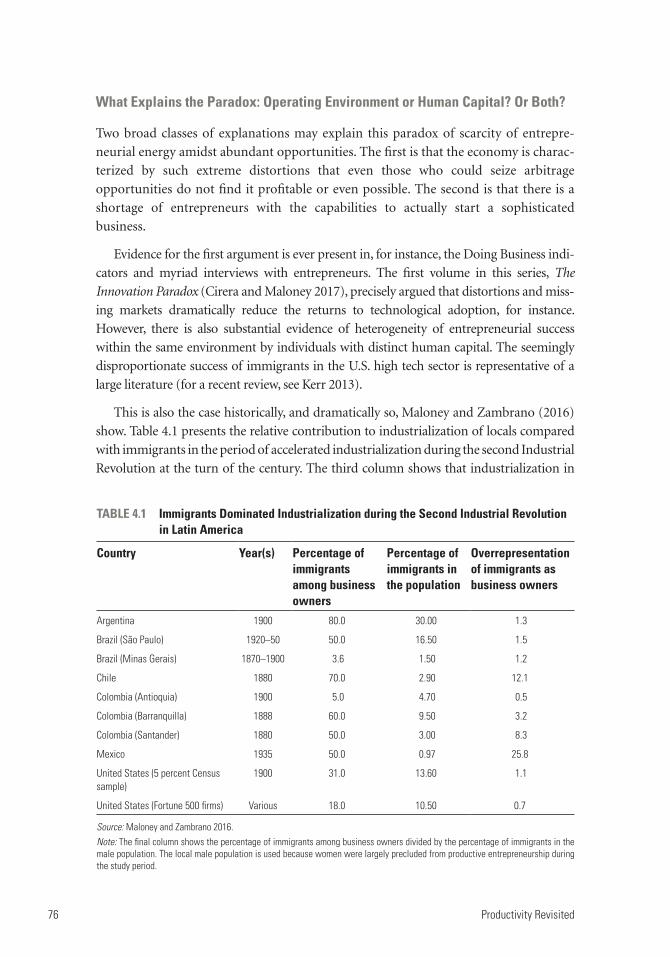
76 Productivity Revisited
What Explains the Paradox: Operating Environment or Human Capital? Or Both?
Two broad classes of explanations may explain this paradox of scarcity of entrepre-
neurial energy amidst abundant opportunities. The first is that the economy is charac-
terized by such extreme distortions that even those who could seize arbitrage
opportunities do not find it profitable or even possible. The second is that there is a
shortage of entrepreneurs with the capabilities to actually start a sophisticated
business.
Evidence for the first argument is ever present in, for instance, the Doing Business indi-
cators and myriad interviews with entrepreneurs. The first volume in this series, The
Innovation Paradox (Cirera and Maloney 2017), precisely argued that distortions and miss-
ing markets dramatically reduce the returns to technological adoption, for instance.
However, there is also substantial evidence of heterogeneity of entrepreneurial success
within the same environment by individuals with distinct human capital. The seemingly
disproportionate success of immigrants in the U.S. high tech sector is representative of a
large literature (for a recent review, see Kerr 2013).
This is also the case historically, and dramatically so, Maloney and Zambrano (2016)
show. Table 4.1 presents the relative contribution to industrialization of locals compared
with immigrants in the period of accelerated industrialization during the second Industrial
Revolution at the turn of the century. The third column shows that industrialization in
TABLE 4.1 Immigrants Dominated Industrialization during the Second Industrial Revolution in Latin America
Country Year(s) Percentage of immigrants among business owners
Percentage of immigrants in the population
Overrepresentation of immigrants as business owners
Argentina 1900 80.0 30.00 1.3
Brazil (São Paulo) 1920–50 50.0 16.50 1.5
Brazil (Minas Gerais) 1870–1900 3.6 1.50 1.2
Chile 1880 70.0 2.90 12.1
Colombia (Antioquia) 1900 5.0 4.70 0.5
Colombia (Barranquilla) 1888 60.0 9.50 3.2
Colombia (Santander) 1880 50.0 3.00 8.3
Mexico 1935 50.0 0.97 25.8
United States (5 percent Census sample)
1900 31.0 13.60 1.1
United States (Fortune 500 firms) Various 18.0 10.50 0.7
Source: Maloney and Zambrano 2016. Note: The final column shows the percentage of immigrants among business owners divided by the percentage of immigrants in the male population. The local male population is used because women were largely precluded from productive entrepreneurship during the study period.

Entry and Exit: Creating Experimental Societies 77
Latin America, unlike in the United States, was overwhelmingly driven by immigrants and
far out of proportion to their share of the population—and, more relevantly, to the male
population, given that few entrepreneurs were women in the period.
Whereas in the United States, the influence of immigrants was more or less propor-
tional to locals in the Census sample (1.1) or slightly lower than predicted based on the
creation of Fortune 500 companies (0.7) (see also Fairlee 2008; Kerr and Kerr 2011),
this is not the case in Latin America, where (with the exception of Antioquia, Colombia,
and Minas Gerais, Brazil), the contribution of immigrant entrepreneurs was far out of
proportion to their presence in the economy, ranging from 1.5 times in São Paulo,
Brazil; to 3.2 times in Barranquilla, Colombia; to 8.3 times in Santander, Colombia; to
12 times in Chile; all the way up to nearly 26 times in Mexico.2 It is hard to tell a story
in which these immigrants were somehow more connected to elites, more fluent in the
language, and more familiar with the local geographic and economic terrain. Perhaps
they were hungrier than the local elites, but there were plenty of hungry non-elites
present as well, and the elites would develop an appetite in the 1950s as they began to
dominate the new sectors. Rather, a better story seems to be one of differential human
capital of various kinds.
Similarly, in Japan, Odagiri and Goto (1996) document that despite constituting
only 5 percent of the population, from 1868 to 1912, former samurai, or Shizoku,
started 50 percent of new businesses. This makes sense in light of the fact that they were
the most traveled and educated individuals of the time and had done much more
accounting for the local lords than fighting during the 200 years of the Tokugawa sho-
gunate ending in 1881.3 Indeed, members of this group who had studied in the United
Kingdom were critical private sector and institutional “entrepreneurs” during the for-
mative period of the Meiji restoration that followed (see box 4.1). In any case, the expe-
rience serves as a good comparator because it occurred in a context common with
other local groups that did not engage as vigorously in the industrialization process.
BOX 4.1
Successful Industrializers “Got Out” Early and Often
In each of the cases that follow, knowledge of frontier industries and supporting institutions was critical to opening new businesses and creating a business culture.
Japan. Under the Tokugawa Shogunate, foreign travel was prohibited until 1866 under penalty of death. Yet some regions understood the dangers of technological inferiority. Five students from Cho-shu- (1863) and 19 students from Satsuma (1863–65) were smuggled out to study abroad in vari-ous universities in the United Kingdom. Upon their return, many would play key roles in the modern-ization project undertaken by the subsequent Meiji Restoration: head of what would become Tokyo University, Minister of Education, the first Prime Minister, Minister of Foreign Affairs, Minister of Industry, the first Director of Railways, and the head of the stock exchange, what would become the
(Box continues on the following page.)

78 Productivity Revisited
Sapporo breweries, and the Japanese textile industry. In particular, one of the Satsuma students, Godai Tomoatsu, become Japan’s leading entrepreneur of the early Meiji period, establishing a tex-tile mill reputed to be Japan’s first modern factory. He also negotiated the establishment of a French-Satsuma trading company that attracted French investment into the Satsuma domain to establish a steamship shipyard and textile spinning factories, and to send promising students from Satsuma overseas. Among those from Cho-shu- was Yozo Yamao, who took classes and worked as an appren-tice in shipbuilding in Scotland. On his return to Japan, he helped establish the Imperial College of Engineering (the Faculty of Engineering at the University of Tokyo). Another of the Cho-shu- Five, Ito Hirobumi, established the cabinet system of government and later became the first Prime Minister of Japan. He recruited the Scotsman Henry Dyer to be the first Principal and Professor of Engineering at the Imperial College of Engineering. Dyer was considered pivotal to the generation of engineering talent and facilitating study abroad.
The United States versus Latin America. The United States was deeply steeped in the industrial project radiating from England. Travel and interchange were frequent, as was industrial espionage. The opposite was true in Latin America. Aspiring Creole merchants were severely constrained by the legal requirement to trade primarily with Spain, a country that came exception-ally late to the Industrial Revolution. Even this trade was prohibited except through peninsular intermediaries. Hence, local entrepreneurs, in contrast to their counterparts in the American colo-nies, had only distant knowledge of the goings on in foreign business and trade centers like Manchester or of advancing business practices. The demand for greater contact among the incipi-ent entrepreneurial class was keen, however. In the 1720s and 1730s, the merchant classes of Peru and Mexico City, among the most developed in the region, sought direct trade with Spain, but were rebuked. Until the end of the eighteenth century, even the establishment of industries was prohibited by the Portuguese colonial government. However, entrepreneurs appeared, both in a vigorous contraband trade as well as in the emergence of truly protean entrepreneurs. One exam-ple was the exiled Colombian Pedro Nel Ospina, who attended the mining school at the new University of California, Berkeley. Upon his return, he established the Antioquia School of Mines, was an entrepreneur in agriculture, and was instrumental in establishing the dominant Antioquian textile industry. As president of the Republic (1922−26), he organized the Departments of Education and Health and the Treasury, secured the creation of the central bank (Banco de la Republica), and greatly advanced critical public works. In 1928, he created the Bogotá stock exchange.
India. Jamsetji Tata, founder of the Tata dynasty and considered one of the fathers of indus-trialization in India, made frequent trips to England in the mid-1800s in his pursuit of establishing a modern textile plant in India. His interest in iron and steel began when he attended a lecture by Thomas Carlyle in Manchester, where he went to check out new machinery for his textile mill. His interest would take him to the United States (the state of Alabama and the city of Cleveland) and elsewhere to gain expertise. His son Dorabji Tata would complete the project, guiding Tata on its path to becoming one of India’s largest conglomerates. He entered Cambridge University in 1877 and also made frequent trips abroad.
In each successful case, being abroad awakened these entrepreneurs to possible industries, ways of operating, and even mindsets that only spending time in the frontier countries can do.
BOX 4.1
Successful Industrializers “Got Out” Early and Often (continued)

Entry and Exit: Creating Experimental Societies 79
Moving from Opportunity to Entrepreneurship
To explain this paradox of low entrepreneurship amid great opportunity, figure 4.5
presents a simple framework for the entrepreneurial decision and implicitly the ele-
ments of the “entrepreneurial ecosystem” needed to redress them. The rest of this chap-
ter discusses the elements of this figure.
Like any investor, an entrepreneur is fundamentally placing a bet, comparing an
entrepreneurial project with an expected range of returns and risks against other alter-
natives, such as “safe” salaried work, which is the opportunity cost of entrepreneurship.
As Kerr, Nanda, and Rhodes-Kropf (2014), among others, argue, entrepreneurship is a
form of experimentation in which entrepreneurs learn about the viability of a product
or process in the local context. This implies both a process of managing risk and a pro-
cess of learning—about the investment, about running a firm, and about evaluating
and managing risk.
Two sets of factors impede this experimentation: operating environment factors
(shown in the middle section of figure 4.5), and factors pertaining to entrepreneurs
per se—that is, human capital, very broadly construed (shown in the right-hand sec-
tion of figure 4.5). Without an enabling environment, capable entrepreneurs will not
enter the market or thrive if they do (as discussed in chapter 2). Conversely, a pristine
experimental environment without capable entrepreneurs will also show limited
dynamism.
Operating Environment
Translating Technological Opportunities to Business Opportunities
The ability of an entrepreneur to generate returns from the entrepreneurial “bet”
depends, in part, on how supportive the enabling operating environment is and on the
costs of experimentation. These factors are explored next and depicted in the top mid-
dle section of figure 4.5.
Enabling Operating Environment and Complementary Factors and Markets The translation of a technological opportunity into a business opportunity that can
be exploited by the most able entrepreneur depends substantially on the overall busi-
ness environment. Clearly, any of the classic frictions in terms of trade distortions,
corruption, excessive taxes, and the like will reduce the expected return of a project.
However, as The Innovation Paradox stresses (Cirera and Maloney 2017), the extremely
high returns presumed to characterize Schumpeterian catch-up will not appear if
complementary markets are not well developed. If human capital is not available to
staff an innovation or necessary machinery cannot be imported, then the actual

80 Productivity Revisited
FIGURE 4.5 Determinants of Entrepreneurial Experimentation and Productive Entrepreneurial Activity
Opportunities
Global arrival of new technologies
Technological gap withfrontier countries
Environment
Potential return• Enabling business environment
• Availability of complementary factors and markets
Cost of experimentation• Information
• Barriers and institutions
• Financing and risk management
• Cost of failure
• Bankruptcy
• Social stigma
• Difficulty returning to salaried work
Alternatives with a more attractiverisk-return profile
Capabilities of entrepreneurs
Personality, culture, and genetics• Drive (need for achievement, conscientiousness)
• Risk attitude and patience (self- efficacy, locus of control)
• Ability to identify opportunities (openness, innovativeness)
Human capital• Basic human capital
• Management capabilities
• Technological capability
• Actuarial and learning capabilities

Entry and Exit: Creating Experimental Societies 81
expected return will not materialize. Hence, the traditional concerns with both
distortions and market failures remain central.
Costs of Experimentation
Moving down the center section of figure 4.5, the next set of points stresses factors that
affect the cost of experimentation to find out whether a project is viable: information, insti-
tutions, markets for financing and diversifying risk, and the cost of failure.
InformationThe availability and quality of information plays a central role for understanding the
likely risk-return profile of a project, or even conceiving of it. As box 4.1 shows, having
knowledge about which technologies exist is the clear necessary first step to catching up
with the frontier. It is a step that historically the United States achieved by close contact
with the mother country and Japan addressed by sending students abroad and then
establishing a local engineering university run by a Scottish expert.
More recently, the high-tech clusters in Ireland, India, and Taiwan, China, were all
started by bringing home the diaspora from places like Silicon Valley. The impact of
immigrants on industrialization shown in table 4.1 also suggest the importance of gath-
ering and processing information—including about the possibility of implementing new
technologies in the local context. Figure 4.6 presents an imperfect, although more con-
temporary, measure of the density of potential entrepreneurs such as the Satsuma and
Cho-shu- students described in box 4.1, who are embedded in global networks and who
FIGURE 4.6 How Well Plugged In to the Knowledge Frontier Are Developing-Country Students?
(Number of Foreign Students Studying in the United States as a Percentage of the Overall Home Country Population)
South Asia Asia and Pacific LAC HI OECD SSA MENA ECA
Hong Kong SAR, China
Korea, Rep.
SingaporeTaiwan,China
Costa Rica
Jamaica
Panama
Venezuela
AustriaBelgium
Canada
Switzerland
Denmark
FinlandFranceUnited Kingdom
GreeceIreland
Netherlands
NorwayNew Zealand
Sweden
United Arab EmiratesIsraelLebanon
Oman
Qatar
Bangladesh
India Sri Lanka
Nepal
Pakistan
China
IndonesiaCambodiaLao
Mongolia
PhilippinesPapua New Guinea
Thailand
Vietnam
ArgentinaBolivia (Plurinational State of)Brazil
ChileColombiDominican RepublicEcuador
Guatemal
Honduras
HaitiMexico
NicaraguaPeruParaguay
El Salvador
UruguayCzechi
SpainCroatiaItalyLithuania
PolandPortugal
Russia SlovakiaSlovenia
Angol aBurundi Burkina Faso
BotswanaCôte d’IvoireCameroon
Congo
Ethiopi
Ghana
GuineaKenyaLiberia LesothoMadagascarMaliMozambiqueMauritaniMalawiaNiger
NigeriaRwanda
SenegalSierra LeoneChad TanzaniaZambia Egypt
Jordan
MoroccoSyria TunisiaYemen
ArmeniaAzerbaijan
BulgariaBosnia and Herzegovina
BelarusHungary
KyrgyzstanMoldova
MacedoniaSerbia
Tajikistan Turkmenistan
Turkey
Ukraine0
0.05
0.10
0.15
Perc
enta
ge o
f pop
ulat
ion
4 6 8 10 12
GDP per capita (constant US$)
Bangladesh
India
Sri Lanka
Nepal
Pakistan
China
IndonesiaCambodi
LaoPhilippines
Papua New Guinea
Thailand
Vietnam
Argentina
Bolivia (Plurinational State of)Brazil
ChileColombia
Costa Rica
Dominican Republic
Ecuador
Guatemala
Honduras
Haiti
Mexico
Nicaragua
Panama
PeruParaguay
El Salvador
Uruguay
Venezuela
Austria
Belgium
Switzerland
Czechia
Denmark
Spain
FinlandFrance
United Kingdom
Greece
Croatia
Ireland
ItalyLithuania
Netherlands
New Zealand
Poland
Portugal
RussiaSlovakia
Slovenia
Angol
BurundiaBurkina Faso
Botswana
Côte d’IvoireCameroon
Ethiopi
Ghana
Guinea
KenyaLiberia
Lesotho
MadagascarMaliMozambique
MauritaniaMalawiNiger
Nigeria
Rwanda
SenegalSierra LeoneChad
TanzaniaZambi
United Arab Emirates
Egypt
IsraelJordan
Lebanon
MoroccoSyriaTunisia
Yemen
Armenia
Azerbaija
Bulgaria
Bosnia and Herzegovina
Belarus
Hungary
Kyrgyzstan
Moldova
MacedoniaSerbia
TajikistanTurkmenistan
Turkey
Ukraine
0
0.01
0.02
0.03
0.04
Perc
enta
ge o
f pop
ulat
ion
4 6 8 10 12
GDP per capita (constant US$)
a. Full sample b. Close-up view (less than 0.4 percent)
Source: Elaborations based on Open Doors and World Development Indicators. Note: Data are as of 2015. The close-up view in panel b truncates the y-axis scale at 0.4 percent of students studying in the United States. HI OECD = High-income members of the Organisation for Economic Co-operation and Development; LAC = Latin America and the Caribbean; MENA = Middle East and North Africa; SSA = Sub-Saharan Africa.

82 Productivity Revisited
know from personal experience where the technological frontier is and therefore what
opportunities could be cultivated in their home countries. The figure presents the ratio of
foreign students studying in the United States, as one possible pole of frontier technology
for which data are readily available, to the overall home country population.
There is clearly a positive relationship with GDP, possibly reflecting that advanced
economies can afford to send more students. The fact that most of Europe is below
trend reflects the presence of excellent universities there. But what is immediately strik-
ing is that despite physical and cultural distance, the four Asian miracles are extraordi-
narily well represented and that even up-and-comers like China, India, Malaysia, and
Vietnam are substantially above trend. By contrast, the major Latin American countries
historically have been isolated and continue to be below trend and would be even more
so if physical and cultural distance were taken into account. Africa, with some excep-
tions, reflects it lower income levels, but nonetheless its connectivity suffers as a result.
In developing countries, to know where the frontier is and what opportunities are
available, potential entrepreneurs need to “get out more.”
Barriers to Entry and InstitutionsConceptually, lower cost of experimentation raises the value of the project and should
stimulate entry (Kerr, Nanda, and Rhodes-Kropf 2014). However, myriad barriers,
institutions, and norms can make entry difficult. Dreher and Gassebner (2013), using
data for 43 advanced economies and developing countries in the Global Economic
Monitor over the period 2003–05, find that more numerous and more onerous proce-
dures required to start a business and larger minimum capital requirements are detri-
mental to entrepreneurship (see also Djankov 2009). On the legal side, Djankov et al.
(2002) offer data for 85 advanced economies and developing countries on the number
of procedures, time, and official costs that a startup must bear before it can operate
legally. Klapper, Laeven, and Rajan (2006) find that in Europe, costly regulations ham-
per the creation of new firms, force new entrants to be larger, and cause incumbent
firms to grow more slowly. The official costs of entry are extremely high in developing
countries (see figure 4.7).
A large literature sees weak institutions working against business dynamism through
numerous channels (see, for example, North 1991; Acemoglu, Johnson, and Robinson
2005). For instance, insecure property rights have long been identified as a barrier to
commerce and dynamism. The medieval Arab social theorist Ibn Khaldun (1377)
noted, “Attacks on people’s property remove the incentive to acquire and gain property.
People, then, become of the opinion that the purpose and ultimate destiny of (acquir-
ing property) is to have it taken away from them. The extent and degree to which prop-
erty rights are infringed upon determines the extent and degree to which the efforts of
the subjects to acquire property slacken.” Johnson, McMillan, and Woodruff (1999)
find for five transition economies in Eastern Europe and the former Soviet Union that
weak property rights limit the reinvestment of profits in start-up manufacturing firms,

Entry and Exit: Creating Experimental Societies 83
FIGURE 4.7 Entry and Exit Costs Are Higher in Follower Countries than in Frontier Countries
Source: World Bank Doing Business Indicators, 2017.Note: EAP = East Asia and Pacific; ECA = Eastern Europe and Central Asia; LAC = Latin America and the Caribbean; MENA = Middle East and North Africa; OECD = Organisation of Economic Co-operation and Development; SAR = South Asia; SSA = Sub-Saharan Africa.
Belize
Bolivia
EcuadorGuatemala
Guyana
Honduras
Paraguay
El Salvador
Cambodia
Lao PDR
Philippines
Papua New Guinea
Solomon Islands
Vietnam
Albania
KyrgyzRepublic
Moldova
TajikistanBangladesh
Bhutan
India
Sri Lanka
Nepal
Pakistan
Angola
Burundi
Burkina Faso
Côte d’Ivoire
Cameroon
Cabo Verde
Ethiopia
Ghana
Guinea-Bissau
Kenya
Liberia
Lesotho
Madagascar
Mali
Mozambique Mauritania
Malawi
Niger
Nigeria
Rwanda
Senegal
Sierra Leone
Swaziland
Tanzania
ZambiaDjibouti
Jordan
Lebanon
LAC OECD EAP ECA SAR SSA MENA
Argentina
Chile
Colombia
Costa Rica
Dominican RepublicMexico
PanamaPeru
Uruguay
AustriaBelgium
Canada
Switzerland
Denmark
Spain
Estonia Greece
Italy
Luxembourg
Netherlands
Poland
PortugalSlovak RepublicChina
PalauThailand
Tonga
ArmeniaAzerbaijan
Bulgaria
Belarus HungaryMontenegroSerbia
Turkey
UkraineBotswana
Gabon
Mauritius
Morocco
Tunisia
0
20
40
60
a. Cost of business start-up procedures (percent of gross national income per capita)
4 6 8 10 12
Ln of GDP per capita (constant US$)
Perc
ent o
f GNI
per
cap
ita
0
2
4
6
b. Time to resolve insolvency (years)
4 6 8 10 12
Ln of GDP per capita (constant US$)
Year
s
LAC OECD EAP ECA SAR SSA MENA
Bolivia Colombia
Nicaragua
China
Marshall Islands
ThailandArmenia
BelarusMontenegro
Serbia
Sri Lanka BotswanaMauritius
Djibouti
Tunisia
Argentina
Brazil
Chile
Costa RicaDominican Republic
Ecuador
Guyana
Honduras
Jamaica
Mexico
Panama
Peru
ParaguayEl Salvador
Suriname
Venezuela, RB
AustriaBelgium
Canada
Switzerland
Czech Republic
Denmark
Spain
Estonia
France
Greece
Ireland
Italy
Luxembourg
Netherlands
Norway
PolandPortugal
Slovak Republic
Slovenia
Sweden
United States
Micronesia, Fed. Sts.
Indonesia
Cambodia
Philippines
Palau
Solomon Islands
Tonga
Vietnam
Azerbaijan
Bulgaria
Hungary
KyrgyzRepublic
Moldova
Tajikistan
Turkey
Ukraine
Bangladesh
India
Nepal
Pakistan
Burundi
Burkina Faso
Central African Republic
Côte d’Ivoire
Congo, Rep.
Ethiopia
Gabon
Ghana
Guinea
Kenya
Liberia
Lesotho
MadagascarMali
Mozambique
Malawi
Niger
Nigeria
Rwanda
Senegal
Sierra Leone
Chad
Tanzania
Zambia
Egypt, Arab Rep.
Jordan Lebanon
Morocco
Syrian Arab Republic
while access to credit does not appear to explain differences in investment. Estrin,
Korosteleva, and Mickiewicz (2009), using the Global Entrepreneurship Monitor sur-
veys for 42 countries over 1998–2005, find that a strong property rights system is
important for high-growth entrepreneurship. Adamopoulos et al. (2017) use
household-level panel data from China and find that land institutions in rural China

84 Productivity Revisited
that disproportionately constrain the more productive farmers worsen both the alloca-
tion of resources across farmers (misallocation) and the type of farmers who operate in
agriculture (selection).
Furthermore, weak property rights or uncertain rules of the game lessen the qual-
ity of entrepreneurship by making owners unwilling to hire better professional man-
agers, leading to a decline in firm productivity (figure 4.8). Iacovone, Maloney, and
Tsivanidis (2015) show that uncertainty around the rule of law or trust more gener-
ally leads to a much higher incidence of family-managed firms, which numerous
studies (including Bloom and Van Reenen 2007; Lemos and Scur 2018; Akcigit, Alp,
and Peters 2018) have shown to adversely affect the quality of management and
productivity.
A wider variety of norms and regulations may also be at play. For instance, Neergaard
and Thrane (2011) argue that the ample maternity benefits found in the Nordic welfare
model favor employment over entrepreneurship. In Denmark, a sole proprietor is not
allowed to work while on maternity leave. If she does so, her maternity allowance is
reduced. This may be tantamount to closing the business down if you have a child and
may account for the fact that women are generally much older than men when starting
a business. Thirty percent of women in the survey perceive the childcare system as a
significant barrier to starting a business.
Financing and Managing RiskClearly, the ability of entrepreneurs to finance projects across the various stages of
starting up a venture is critical. Other studies have dealt in depth with what markets,
such as venture capital, are missing in developing countries and how governments
can simulate them. Empirically, the evidence is mixed on how much a constraint
finance is in early stages. Estrin, Korosteleva, and Mickiewicz (2009), for example, see
it as critical; others view it as less so because many start-ups are self-financed initially.
And as discussed later in this chapter, the psychological literature is beginning to
question how much unavailability of finance is an excuse that more aggressive and
resourceful entrepreneurs find a way around. Know-how and mentorship are rated a
critical part of most venture capital engagements (De Carvalho, Calomiris, and de
Matos 2008). Hence finance is linked to the human capital issues discussed in the
next sections.
In addition, however, financial markets are an important way of diversifying risk
and limiting liability. As chapter 2 shows, more advanced economies appear to take on
more risk—and this is likely to reflect precisely the existence of these kinds of financial
markets. Finally, the ease of exiting a successful project enter into the calculations
(box 4.2). The existence of private equity markets or stock exchanges makes it easier for
entrepreneurs to cash in on their investments and move on to a new project, should
they choose to do so.
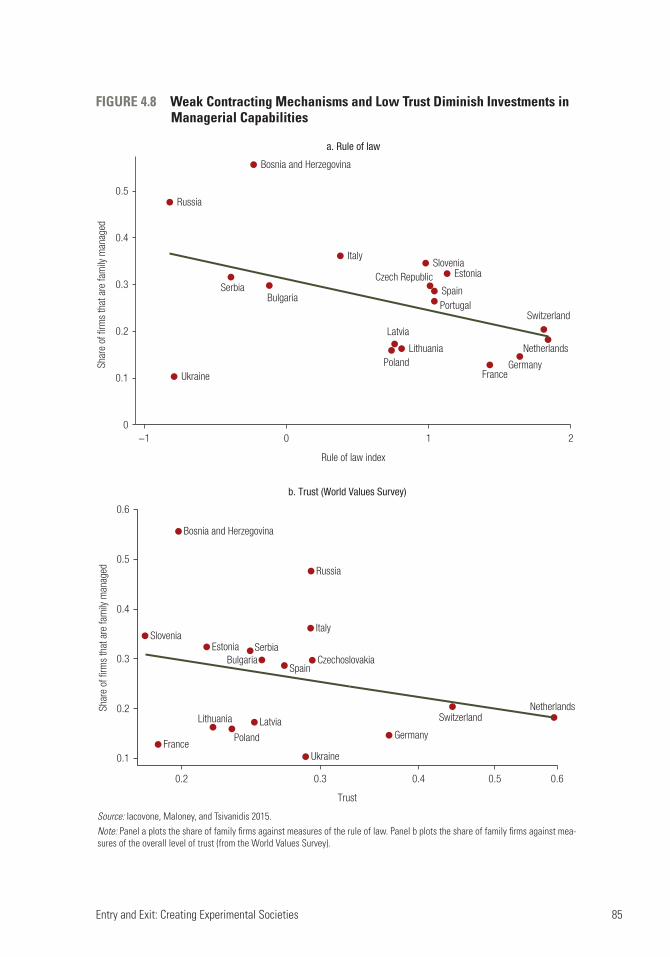
Entry and Exit: Creating Experimental Societies 85
FIGURE 4.8 Weak Contracting Mechanisms and Low Trust Diminish Investments in Managerial Capabilities
Source: Iacovone, Maloney, and Tsivanidis 2015.Note: Panel a plots the share of family firms against measures of the rule of law. Panel b plots the share of family firms against mea-sures of the overall level of trust (from the World Values Survey).
Bulgaria
Bosnia and Herzegovina
a. Rule of law
Switzerland
Czech Republic
Germany
Spain
Estonia
France
Italy
Lithuania
Latvia
NetherlandsPoland
Portugal
Russia
Serbia
Slovenia
Ukraine
0
0.1
0.2
0.3
0.4
0.5
Shar
e of
firm
s th
at a
re fa
mily
man
aged
−1 0 1 2
Rule of law index
Bulgaria
Bosnia and Herzegovina
Switzerland
Czechoslovakia
Germany
Spain
Estonia
France
Italy
Lithuania Latvia
Netherlands
Poland
Russia
SerbiaSlovenia
Ukraine
Shar
e of
firm
s th
at a
re fa
mily
man
aged
0.1
0.2
0.2
0.3
0.3
0.4
0.5 0.60.4
0.5
0.6
b. Trust (World Values Survey)
Trust

86 Productivity Revisited
Cost of Failed Experimentation and ExitIn theory, firms decide to exit the market when the present value of the expected future
benefits from continuing to operate exceeds the exit costs plus the present value of the
best outside option. Several studies find that relatively low productivity, as a contribu-
tor to low future returns, helps predict exit (see, for example, Baily, Hulten, and
Campbell 1992; Olley and Pakes 1996). Conversely, Eslava, Kugler, and Haltiwanger
(2009) find that higher demand, lower input costs, and higher markups reduce the
probability that plants exit in Colombia. As firms age, firms’ productivity and future
profits increase, decreasing the probability of exit (Clementi and Palazzo 2016; Dunne,
Roberts, and Samuelson 1988).4
Clearly, any barriers to the entry of higher-productivity firms that could challenge
low-productivity incumbents will also lower exit. Dunne et al. (2013) find that entry
costs faced by potential entrants, fixed costs faced by incumbent producers, and the
toughness of short-term price competition are all important determinants of long-
term benefits and exit. Also, as the number of firms in the market increases, the value
of continuing in the market declines and the probability of exit rises.
Barriers to product market competition are likely to increase markups and reduce
the probability of exit, whereas trade liberalization will induce the exit of low-
productivity firms. Eslava, Kugler, and Haltiwanger (2009) document the exit of less
productive plants after a trade reform in Colombia. Their findings are consistent with
the prediction of several models that the productivity threshold required for firms to
survive after trade liberalization increases (Melitz 2003; Bernard et al. 2003).
Similarly, while taxes reduce expected future profits, making outside options more
attractive and exit more likely, subsidies to incumbent firms have the opposite effect
and impede the exit of low-productivity firms. Acemoglu et al. (2013) argue that while
BOX 4.2
Capital Market Development and the Facilitation of Exit—Novo Mercado in Brazil
Private equity in new ventures eventually needs a way to exit to reap greater returns. Two institu-tions in Brazil, Novo Mercado and Bovespa Mais, have proven critical to developing Brazil’s ven-ture capital market. Brazil has radically increased flows for initial public offerings through its Novo Mercado, a premium listing tier that requires firms to adopt governance standards that are stron-ger than legally demanded. The increased transparency has helped stimulate Brazil’s venture capi-tal and private equity market. In 2007 Novo Mercado celebrated the addition of its 100th company, having hosted 81 of Brazil’s 113 initial public offerings since its founding.
Bovespa Mais, which broadly holds to Novo Mercado standards, targets small and mid-cap firms, seeking to host companies with a gradual strategy of gaining access to capital markets. It helps companies improve their transparency, grow their shareholder base, and increase liquidity.

Entry and Exit: Creating Experimental Societies 87
policies like research and development (R&D) tax credits to entrants can help and may
encourage growth, their impact pales in comparison with removing artificial support
for inefficient incumbents. They find for the United States that taxing the continued
operation of incumbents can lead to sizable gains (on the order of a 1.4 percent
improvement in welfare) by encouraging exit of less productive firms and freeing up
skilled labor to be used for R&D by high-productivity incumbents. Subsidies to the
R&D of incumbents do not achieve this objective because they encourage the survival
and expansion of low-quality firms.
Conversely, what is often overlooked is that the cost of exiting an unproductive firm
importantly determines the cost of experimentation. For instance, one explanation that
multinationals in Penang, Malaysia, give for their inability to cultivate local suppliers is
that Malaysian bankruptcy laws (at the time) were harsh and societal reputational costs
of failure are high.5 Doing Business data on bankruptcy laws across the world show that
it takes longer to resolve insolvency in follower countries (figure 4.7, panel b).
Furthermore, high bureaucratic costs of closing businesses often lead to the persistence
of zombie firms in the enterprise cadasters, distorting inference by showing a large
number of very low productivity firm that have, for all intents and purposes, exited.
As is clear, follower countries tend to penalize failure much more than advanced
economies, and this makes entrepreneurs carry more of the downside risk. Social stig-
mas associated with failure compound these costs.
Similarly, highly distorted labor markets that restrict job creation and make reentering
the salaried labor market difficult (see, for example, Botero et al. 2004) lower the attractive-
ness of entrepreneurship. If reentry into a salaried job is difficult, the unemployment
becomes part of the downside risk. Together, these imply that the downside costs of entre-
preneurship are indeed intimidating and risk, overall, is to be minimized.
These exit costs also affect the approach to risk in important ways. For instance, if
an entrepreneur is responsible for the entire downside risk of a failed endeavor, then
clearly greater risk is a disincentive to entrepreneurial activity. If, however, bankruptcy
laws allow an entrepreneur to walk away from a failed endeavor with minimal debt and
easily rejoin the salaried work force, then the decision is best considered as an option
problem—more risk implies a possibility for a greater upside without increasing the
downside cost of failure. In this situation, a context that heightens the upside risk will
encourage more entry. In a sense, the Silicon Valleys of the world approximate this
option view. In fact, Manso (2016) argues that the perennial puzzle of why entrepre-
neurs appear to earn less on average than salaried workers can be explained by viewing
the choice in the United States as an option rather than psychological concepts of over-
optimism or irrationality or even psychic benefits of entrepreneurship. When the
potential upside benefit is correctly calculated, including the fact that, for the most
part, U.S. entrepreneurs can get a salaried job if they fail with little social stigma or
overhanging debt, entrepreneurs earn significantly more.

88 Productivity Revisited
Rent-Seeking Alternatives
The final issue with respect to the operating environment is the availability of less pro-
ductive alternatives with a more attractive risk-return profile—perhaps rent-seeking or
corruption, or safe salaried or public sector jobs—that can divert entrepreneurial
energy away from productive activities, as Baumol (1990) and Murphy, Shleifer, and
Vishny (1991) have stressed. Murphy, Shleifer, and Vishny (1991) argue that the share
of talented people who go into law versus engineering captures this trade-off and sug-
gest, using international data, that unproductive entrepreneurship leads to lower eco-
nomic performance. More generally, safe salaried jobs may seem more attractive; in
Penang, Malaysia, talented engineers preferred rotating among the myriad opportuni-
ties in the multinational sector than striking out on their own. This can lead to a self-
reinforcing bad equilibrium. Acemoglu (1995) argues that the proportion of
unproductive agents influences relative rewards. More rent-seeking reduces the return
to both entrepreneurship and rent-seeking. Multiple equilibria may arise as a result,
where having few entrepreneurs leads to more rent-seeking activities, which, in turn,
leads to fewer productive entrepreneurs. In this view, development policy must figure
out how to break out of these low-entrepreneurship equilibria.
Capabilities of Entrepreneurs
Beyond the operational environment, individual characteristics that affect the respon-
siveness to opportunities matter for entrepreneurship to emerge. The final section of
figure 4.5 explores two main topics in this regard. The first are psychological, personal-
ity, or cultural traits of individual entrepreneurs. The discussion that follows very
broadly summarizes a few key strands of the recent work on this topic, with the goal of
putting the topic on the productivity reform agenda and introducing some recent pol-
icy experiments. The second topic deals with an expanded set of human capital invest-
ments, beginning with standard higher education, but then including managerial
competencies, technological capabilities, and what we call “actuarial” capability. In fact,
with the exception of genetic determinants, this separation between personality traits
and human capital may be somewhat arbitrary because increasingly experiments sug-
gest that both family upbringing and deliberate policy interventions can alter even
some of the most basic personality characteristics.
Personality, Culture, and Genetic Determinants: Drive, Risk Tolerance and Patience, and the Ability to Identify Opportunities
Economists have tended to resist psychological and cultural explanations for eco-
nomic outcomes. Too often, the term becomes a hand-wavy residual catch-all for elu-
sive determinants. However, since roughly 2005, psychological perspectives have been
reintroduced into the entrepreneurship literature, as Frese and Gielnik (2014) note.

Entry and Exit: Creating Experimental Societies 89
Concurrently, over the last decade, more rigorous explorations have been made pos-
sible by the availability of micro data with personal characteristics (Kerr, Kerr, and Xu
2017).6 The World Values Survey, for example, reveals a great deal of heterogeneity in
preferences across individuals, and such heterogeneity has become central in main-
stream macroeconomics.
“Culture” has loomed large in the literature on entrepreneurship, most formally in
the work of Baumol, but ubiquitous in diagnoses of underdevelopment, for instance, in
Latin America (see box 4.3). Guiso, Sapienza, and Zingales (2006) herald the arrival of
the “New Cultural Economics,” and both empirical and theoretical work now pay more
attention to how cultural differences affect economic performance, and their commu-
nication across generations.7 In practice, lines blur. Psychological traits that are mal-
leable, for instance, through training programs, begin to look more like human capital.
Culture is hard to separate from more formal institutions,8 on the one hand, and, on the
other hand, as the section argues, can be conflated with certain types of human capital.
In addition, in the advanced economies, there is an ongoing debate as to whether at the
individual level, entrepreneurs are born or made (Fisher and Koch 2008): that is, how
BOX 4.3
Is Inherited Culture Stymying Experimentation?
The Roman empire left a long legacy that potentially worked against entrepreneurship, most par-ticularly in Spain and Latin America. As Baumol (1990) notes, Roman nobility frowned on entrepre-neurship and relegated commerce and manufacturing to manumitted slaves. Persons of honorable status had three primary and acceptable sources of income: landholding (not infrequently as absentee landlords), “usury,” and what may be described as “political payments” (booty, indemni-ties, provincial taxes, loans, and miscellaneous extractions).
This attitude was perpetuated through the Middle Ages. As Safford (1976) notes, “The [Spanish] nobility’s special position was codified in the thirteenth-century Siete Partidas [the unify-ing legal code of Spain, based, in some cases verbatim, on the Roman Code of Justinian], which cautioned Spanish nobles against defilement in commerce” (Safford 1976, 6). This attitude remained central to Spanish law into the twentieth century and was transmitted to the Spanish colonies. An overwhelming consensus exists among historians of virtually all countries of Latin America of an attitude of disdain for productive labor, derived from the colonial masters, and mainlined into the emerging societies across the social strata (for an overview, see Stein and Stein 1970; see also Safford 1976 and Maloney and Zambrano 2016). Culture thus plays a large role in one narrative of Latin American development.
In China, on the other hand, Baumol (1990) notes, enterprise was not only frowned upon, rank-ing very low in the Confucian social order, but was also subjected to impediments deliberately imposed by the officials, at least after the fourteenth century AD. The road to riches ran through the Mandarin bureaucracy that, he argues, allowed for confiscation of rents of others’ ingenuity. Yet the dismissive view of enterprise ran throughout many countries and areas influenced by Confucianism, including Japan, the Korean peninsula, the island of Taiwan, and what is now Vietnam, areas that today are or are rapidly becoming very entrepreneurial.
90 Productivity Revisited
much is inherited genetically and how much is learned and hence malleable. Clearly, at
a national level, empirically such factors are hard to distinguish from other slow- moving
processes like culture or human capital, broadly considered.9
Figure 4.5 identifies three broad entrepreneurial characteristics found in the busi-
ness and economics literature that have been probed by the recent psychological litera-
ture: drive or grit (including aggressiveness and proactivity, autonomy, and
innovativeness), risk attitude and patience, and ability to identify opportunities. There
are many more characteristics that could be explored, but the point here is only to be
illustrative and choose a few that would seem clearly related to exploiting technological
opportunities. Underlying these are psychological primitives such as a need for achieve-
ment, conscientiousness, openness, and innovativeness.
The literature is just beginning to quantify the contribution to entrepreneurship of
different determinants. Though it cannot speak to population-wide characteristics, the
literature researching twins (Nicolaou et al. 2008; Nicolau and Shane 2010) provides
some support for biological underpinnings arguing that up to 40 percent of variance in
entrepreneurship choices is explained by genes. However, Linquist, Sol, and van Praag
(2015), comparing biological and adopted children, find that while children of entre-
preneurs are 60 percent more likely to become entrepreneurs than others in Sweden,
the influence of adoptive parents is twice as large as the influence of biological
parents. That is, characteristics related to nurture or environment wind up being more
important. Zumbuehl, Dohmen, and Pfann (2013) find that parents who invest more
in child-rearing show a greater intergenerational similarity in attitudes toward risk.
Nanda and Sørensen (2010) find that Danes are more likely to become entrepreneurs if
their coworkers have previously been entrepreneurs.
The source of these parents’ and coworkers’ beliefs and preferences is often anchored
in culture. Spolaore and Wacziarg (2009, 471) show that the distance from the techno-
logical frontier captured by genetic characteristics, proxying for “customs, habits,
biases, conventions etc. that are transmitted across generations—biologically and/or
culturally—with high persistence,” is correlated with economic performance.
Putterman and Weil (2008) demonstrate that backgrounds of the ancestors migrating
to a country are correlated with economic performance.
At a more micro level, Guiso, Sapienza, and Zingales (2006) offer the example of
how culture defined by religion and ethnicity affects beliefs about trust and show that
entrepreneurship is sensitive to such beliefs. Trustworthy individuals have a compara-
tive advantage in the kinds of incomplete contracts based on handshakes. Trusting oth-
ers (and being trusted) increased the likelihood of becoming an entrepreneur. More
generally, they find that cultural variables, such as agreeing that thriftiness is a value
that should be taught to children, can explain half of the cross-country difference in
national savings rates.

Entry and Exit: Creating Experimental Societies 91
More specifically, however, the cultural attitudes toward child raising may affect two
underlying determinants of attitudes toward risk tolerance, which is often cited as the
critical driver of entrepreneurial choice (Kihlstrom and Laffont 1979; Cramer et al. 2002;
van Praag and Cramer 2001). “Self-efficacy” describes a person’s belief that he or she can
perform tasks and fulfill a role. It is directly related to expectations, goals, and motivation
(Cassar, Friedman, and Schneider 2009). “Locus of control” is the degree to which people
believe that they have control over the outcome of events in their lives, as opposed to
external forces beyond their control. As discussed later, there is some evidence that these
characteristics are malleable—that is, that policy can affect them. Box 4.4 provides an
example of an attempt to inculcate an entrepreneurial culture and entrepreneurial skills
that started in Chile and has been replicated in 50 countries around the world.
On the other hand, a recent strand in the behavioral economics literature10 denies
that risk tolerance is, in fact, the distinguishing characteristic of entrepreneurship and
focuses rather on nonpecuniary benefits of entrepreneurship, such as preferences for
autonomy and control, and overconfidence. For instance, Astebro et al. (2014) cite
Holm, Opper, and Nee (2013), who find no clear difference in preferences toward risk
between entrepreneurs and non-entrepreneurs in the Yangtze Delta region of China. As
an alternative, they explore overconfidence, reflecting the fact that entrepreneurs seem
to frequently overstate their chances of success by multiple factors compared to what is
objectively the case. The Holm, Opper, and Nee (2013) Yangtze Delta study suggests
that entrepreneurs were not biased in their estimation of their abilities relative to
others, but did, rather, have a preference for competition. Herz, Schunk, and Zehnder
(2014) find that surveyed individuals demonstrate overprecision—an underestimation
of the true variance of their information—and hence lowered the perceived option
value of exploration and reduced incentives to engage in entrepreneurship.
A much broader literature focuses on the nonpecuniary benefits of entrepreneurship
and the fact that these benefits are regularly invoked to explain an apparently recurrent
empirical pattern that entrepreneurs earn less than their comparable counterparts in the
salaried sector. Frey, Benza, and Stutzer (2004) argue that autonomy and control, aspects of
self-employment, raise happiness. Hurst and Pugsley (2011) point out that in the United
States most firms start small and remain so, with no new technology and no intention of
growing. Most of these self-employed claim nonpecuniary benefits as a first-order motive
for self-employment. This is consistent with Lucas’s (1978) argument that there is a distri-
bution of entrepreneurial ability or characteristics that imply that both Walmart and mom-
and-pop stores will coexist. Bengtsson, Sanandaji, and Johannesson (2017) unpack some of
these characteristics, finding that Swedish entrepreneurs, compared with the less dynamic
and innovative self-employed, are less averse to risk and ambiguity, more aware of opportu-
nity costs, exhibit greater tolerance of greed, and are less behaviorally inhibited. With the
notable exception of risk-aversion, the self-employed do not differ appreciably from wage-
earners on most psychological characteristics.

92 Productivity Revisited
BOX 4.4
Changing Culture, Plugging In: Start-Up Chile and Followers
Start-Up Chile was established in 2010 to increase the incidence of high-potential entrepreneur-ship in Chile, strengthen the entrepreneurial ecosystem, and position Chile as an innovation and entrepreneurship hub. It has welcomed 1,400 beneficiaries and their start-up teams to Chile since 2010. In total, 76 percent of the entrepreneurs are foreign and 24 percent are Chilean, although the percentage of Chileans has grown to an average of 40 percent, indicating growing interest among Chileans in the benefits of entrepreneurship. The program aims to provide a soft landing for foreign entrepreneurs in Chile, facilitated by a partner in the Chilean business community. Participants receive free office space in downtown Santiago and a $40,000 grant. They also ben-efit from weekly workshops to learn about start-ups, and training to refine their pitches that is mainly based on peer-to-peer teaching, all in a collaborative environment.
By bringing entrepreneurs to Chile from around the globe, Start-Up Chile seeks not only to connect Chile better to the rest of the world, but to contribute to a cultural change that creates more openness toward entrepreneurship and prepares Chilean entrepreneurs to be competitive globally. Administrators claim this is already happening.a The results to date have been mixed. For domestic entrepreneurs, the program has had no clear effect on a variety of economic variables (survival, profitability, exports, employment, future projects of the head of the project). It has, however, led to greater access to funds, suggesting that the process of selection into the program has served as a signal of quality.
Semi-structured interviews with key players suggest that the program had attracted talent. However, concerns about the attractiveness of the investment environment, the relatively low selectivity, and the inability to retain good foreign firms have reduced the impact. The program has contributed to the image of the country as a destination for entrepreneurship and innovation. It also has promoted a culture of entrepreneurship in the country by strengthening the community of entrepreneurs, improving the perception of entrepreneurship, legitimizing it as a career, increasing appreciation of entrepreneurial skills and values, and diffusing new techniques. It has strength-ened interactions among agents of the entrepreneurial ecosystem, although in an unsustainable way.
The interviews also revealed some confusion over Start-Up Chile’s four goals: attracting and retaining foreign entrepreneurs, strengthening domestic entrepreneurs, strengthening local insti-tutions, and branding the country. The interviews stressed that it is especially necessary to retain foreign start-ups as an anchor to achieve the other goals. It has proven difficult to evaluate the program’s impact on establishing a better ecosystem or a country brand. The relatively modest size of the grant has likely led to a modest effect.
The Chilean experience has influenced the creation of 50 entrepreneurship programs across the world. Brazil, the Republic of Korea, Jamaica, Malaysia, Peru, and Puerto Rico have directly replicated the model.
Sources: Melo 2012; Verde 2016.a. See http://www.startupchile.org/social-impact/.
Entry and Exit: Creating Experimental Societies 93
Self-Employment versus EntrepreneurshipThese differences in motivation and goals are arguably central to understanding
the contrasting patterns between self-employment and business entrepreneurship
seen in figure 4.4. One literature argues that, for instance, the large share of workers
in the self-employed sector in developing countries does not reflect labor market
distortions, but rather the interaction of the same desire for control and indepen-
dence combined with low opportunity cost due to the meager remuneration that
poorly educated workers can glean in a low-productivity formal salaried sector
(see, for example, Maloney 2004 and Perry et al. 2007). This is perhaps the least
exotic explanation for the observed downward relationship between the share of
the workforce that is self-employed and per capita GDP in panel a of figure 4.4. As
examples, Falco et al. (2012) find higher rates of self-reported happiness among
those employing at least one individual (a large fraction of the sample) than among
those with salaried employment. Workers transiting into informal self- employment
from formal salaried employment in Mexico and those informally self-employed
interviewed in Brazil report the same valuation of independence and control
(Maloney 2004). The now common distinction of “subsistence” versus “entrepre-
neurial” self-employment is, in this sense, unhelpful because its connotation of
being rationed out of formal employment into poverty is not supported by evi-
dence. What is really meant by “subsistence” is “nondynamic,” in the same sense
discussed by Bengtsson, Sanandaji, and Johannesson (2017).11 That said, again,
these same characteristics dictate that these low-growth firms are not the source of
the bulk of productivity gains.
Are Financial Constraints All in Our Mind? As another example, the psychology literature is also revisiting how much of
finance constraints that entrepreneurs declare is really due to failures in the finan-
cial markets and how much is really an excuse for other failures. Most U.S. firms
start with small amounts of capital; 80–95 percent of founders used some sort of
“financial bootstrapping,” relying on their own savings or those of family and
friends, and did not rely on formal debt from banks or equity from investors.
Edelman and Yli-Renko (2010), using longitudinal data on nascent entrepreneurs,
argue that entrepreneurs’ perceptions of opportunity mediate between objective
characteristics of the operating environment and the entrepreneurs’ efforts to start
a new venture: neither objective evaluations nor perceptions of missing finance
affected entrepreneurs’ efforts. As Frese and Gielnik (2014) note, median starting
capital by founders in the United States was a low $22,700 (Hurst and Lusardy
2004). Bischoff et al. (2013) argue that capital constraints are only binding when
nascent entrepreneurs had a mental model common to novice entrepreneurs, but
not to experienced entrepreneurs. That is, part of releasing financial constraints in
the operating environment may, in fact, be learning entrepreneurship.

94 Productivity Revisited
Psychological Characteristics Can Be Affected by Policy
A small but emerging literature suggests that personality traits can be changed. In a
randomized controlled trial in Togo, for instance, Campos et al. (2017) tested whether
teaching personal initiative had a larger impact on entrepreneurship than traditional
business training. The former is a psychology-based training approach that teaches a
proactive mindset and focuses on entrepreneurial behaviors. The latter tries to teach
basic financial and marketing practices. Personal initiative is defined as a self- starting,
future-oriented, and persistent proactive mindset. The personal initiative mindset is
key to entrepreneurial success because it involves looking for ways to differentiate
one’s business from others, anticipate problems, better overcome setbacks, and foster
better planning for opportunities and long-term preparation.
Campos et al. (2017) find that personal initiative training increased firm profits by 30
percent compared with an insignificant 11 percent for traditional training. They see their
results as providing a middle ground between the view that an individual must be born
with an entrepreneurial personality and the view that entrepreneurs can be made by learn-
ing specific entrepreneurial practices by showing that training can teach people to develop
a mindset with attributes such as proactiveness that are often assumed to be innate.
Gertler and Carney (2017) similarly ran a randomized control trial in Uganda of a
program to provide youth with traditional hard business skills (such as identifying
business opportunities, generating ideas, and using financial statements) versus soft
interpersonal and intrapersonal skills (negotiation skills, stress management, self-
esteem, risk taking, goal setting, entrepreneurial self-identity). Noncognitive skills were
potentially affected by the latter type of training. They found that both types of train-
ing, but particularly the soft skills, were significant contributors to finding opportuni-
ties for generating business ideas, dealing with the effects of competition, understanding
the utility of record keeping, and improving along a hard skills index. Soft skills
improved negotiation outcomes, making entrepreneurs more persuasive in selling
ideas. Both sets increased total earnings by 30 percent and satisfaction with the quality
of life by 16–17 percent. Both, but particularly the hard skills training, increased what
are called the “Big 5” personality skills—agreeability, conscientiousness, extroversion,
neuroticism, and openness—by significant magnitudes.
Lafortune, Riutortz, and Tessada (2017) tested the impacts of a training program in
Chile. Some groups received a visit from a successful ex-student as a role model. Students
also received personalized versus group “consulting sessions.” Both interventions
increase household income one year later, with role models being particularly cost-
effective. Role models did not improve knowledge or use of business practices but rather
increased motivation, particularly among those with less experience. Consulting bene-
fited experienced and educated entrepreneurs. Similarly, Higuchi, Nam, and Sonobe
(2015) establish the importance of motivational aspects to business success in Vietnam.

Entry and Exit: Creating Experimental Societies 95
Bruhn, Karlan, and Schoar (2016) find a positive impact of access to one year of
management consulting services on TFP and return on assets for Mexican small and
medium enterprises. More interesting, however, owners also increased their “entrepre-
neurial spirit” (according to an index that measures entrepreneurial confidence and
goal setting). Using Mexican social security data, the authors find a persistent large
increase (about 50 percent) in the number of employees and total wage bill even five
years after the program. They document wide heterogeneity in the specific managerial
practices that improved as a result of the consulting, with the most prominent being
marketing, financial accounting, and long-term business planning.
Human Capital
Even the entrepreneur most genetically predisposed to be driven, tolerant of risks, and
aware of opportunities requires an array of human capital ranging from general ana-
lytic and communication skills to sophisticated entrepreneurial and technical training.
To recognize a new technological opportunity and make it a business opportunity
requires the ability to collect and interpret information, organize the project logisti-
cally, analyze the technical feasibility, form the long-term risk-return profile of the
project, and compare it to other alternatives, as well as to navigate property rights,
financial markets, and government regulation. Various forms of human capital are
explored next.
Basic Human Capital Solid human capital across several dimensions forms the bedrock of entrepreneurial
skills.12 The World Bank has recently developed a Human Capital Index that attempts to
capture the basics. Childhood stunting may seem far from high-tech entrepreneurship,
but studies show that malnourished children not only perform worse in formal
schooling, but also tend to be less energetic and curious, two characteristics associated
with entrepreneurs. A recent literature stresses the importance of basic noncognitive
skills at the worker level, but this emphasis is applicable to entrepreneurs as well
(Cunningham and Villaseñor 2016).
Sophisticated entrepreneurship generally requires general analytical skills at a high
level. As Schultz (1980) points out, many agents face and manage risk but are not entre-
preneurs. The additional skill required to arbitrage the opportunities arising from the
disequilibrium state brought on by technological advance is the ability to make deci-
sions that are neither routine nor repetitive. This is as central to entrepreneurs’ success
as is their efficiency in acquiring information and in formulating and acting upon their
expectations (Schultz 1980) and is likely to involve higher- level generic skills.
Managerial and Technological CapabilitiesThe emerging literature on managerial quality (Bloom and Van Reenen 2007) clearly
stresses the importance of sound basic business strategies and human resources

96 Productivity Revisited
policies, but also the ability to view a longer horizon. The Innovation Paradox (Cirera
and Maloney 2017) stresses the need for building managerial capabilities as a critical
complement to innovation and hence a productivity strategy. Maloney and Sarrias
(2017) further show that raising these capabilities on average is not simply a question
of eliminating weak firms. In many cases, it is the best firms that lag the frontier more
than the weakest. Furthermore, there seems to be an acute information asymmetry in
which managers don’t know what they don’t know. They believe themselves to be far
better informed and skilled than they are, and hence neither realize how they could
improve nor the likely returns to doing so. Perhaps for this reason, to address this gap,
heavily subsidized management support programs have proliferated throughout the
advanced world that encourage firms to benchmark and then upgrade their practices;
such programs were central to the productivity policies in Japan and Singapore.
Recent studies find that such management extension services tend to generate very
high rates of return. For the United States, Jarmin (1999) finds that firms that partici-
pated in manufacturing extension partnership programs in the United States experi-
enced between 3.4 percent and 16 percent higher labor productivity growth between
1987 and 1992 than nonparticipating firms. Giorcelli (2016) has studied the U.S. appli-
cation of such policies in postwar Italy and finds that management practices had larger
and more persistent effects than machinery purchases or technology on productivity,
sales, and survival, with effects persisting even 15 years after the program ended. The
key channel through which skills improved firm performance was by helping managers
make better investment decisions—investing in new plants or new machines, for
example—which made their production more efficient.
In a randomized control trial in India in which textile firms were provided manage-
ment consulting, Bloom et al. (2013) find a dramatic increase in the adoption of good
management practices by treated plants, with productivity increasing by 11 percentage
points over the treatment group in one year relative to the control group. A similar
study in Colombia by Iacovone, Maloney, and McKenzie (2018) finds that locally pro-
vided consulting services in a less expensive mode that grouped entrepreneurs have a
positive impact on management, firm size, and employment. In general, the small but
incipient body of evidence related to management extension and business advisory,
much of it randomized control trials and hence the gold standard, appears to be posi-
tive across different types of firms (see McKenzie and Woodruff 2014 and What Works
Centre for Local Economic Growth 2016 for surveys of this literature).
Another type of intervention supporting business upgrading is the provision of quality-
enhancing programs oriented to the adoption of existing quality standards. The available
evidence of the impact of quality-enhancement programs and standard-setting is less solid,
but also positive (Guasch et al. 2007). Using firm-level surveys, Escribano and Guasch
(2005) find that standards (proxied by International Organization for Standardization cer-
tification) increased productivity by some 2.4–17.6 percent in four Central American
countries, less than 1 percent in four Southeast Asian countries, and 4.5 percent in China.
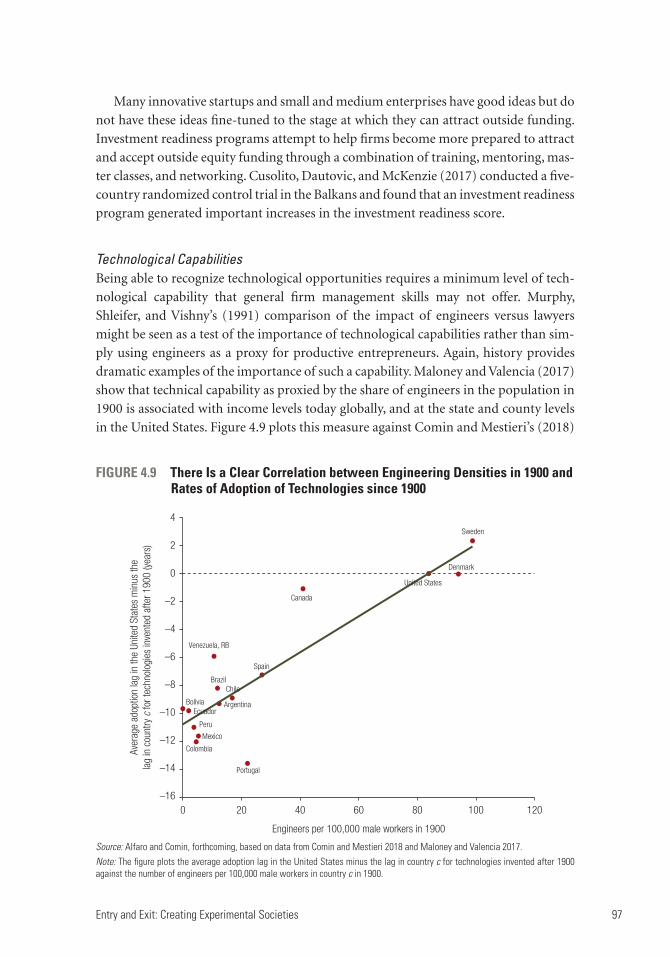
Entry and Exit: Creating Experimental Societies 97
Many innovative startups and small and medium enterprises have good ideas but do
not have these ideas fine-tuned to the stage at which they can attract outside funding.
Investment readiness programs attempt to help firms become more prepared to attract
and accept outside equity funding through a combination of training, mentoring, mas-
ter classes, and networking. Cusolito, Dautovic, and McKenzie (2017) conducted a five-
country randomized control trial in the Balkans and found that an investment readiness
program generated important increases in the investment readiness score.
Technological CapabilitiesBeing able to recognize technological opportunities requires a minimum level of tech-
nological capability that general firm management skills may not offer. Murphy,
Shleifer, and Vishny’s (1991) comparison of the impact of engineers versus lawyers
might be seen as a test of the importance of technological capabilities rather than sim-
ply using engineers as a proxy for productive entrepreneurs. Again, history provides
dramatic examples of the importance of such a capability. Maloney and Valencia (2017)
show that technical capability as proxied by the share of engineers in the population in
1900 is associated with income levels today globally, and at the state and county levels
in the United States. Figure 4.9 plots this measure against Comin and Mestieri’s (2018)
FIGURE 4.9 There Is a Clear Correlation between Engineering Densities in 1900 and Rates of Adoption of Technologies since 1900
Source: Alfaro and Comin, forthcoming, based on data from Comin and Mestieri 2018 and Maloney and Valencia 2017. Note: The figure plots the average adoption lag in the United States minus the lag in country c for technologies invented after 1900 against the number of engineers per 100,000 male workers in country c in 1900.
–16
–14
–12
–10
–8
–6
–4
–2
0
2Sweden
Denmark
United States
Canada
Venezuela, RB
Portugal
Colombia
Mexico
Peru
EcuadorBolivia
Spain
BrazilChile
Argentina
4
0 20 40 60 80 100 120
Aver
age
adop
tion
lag
in th
e Un
ited
Stat
es m
inus
the
lag
in c
ount
ry c
for t
echn
olog
ies
inve
nted
afte
r 190
0 (y
ears
)
Engineers per 100,000 male workers in 1900

98 Productivity Revisited
measures of technological adoption rates and shows a clear correlation. Even though
they had the same level of per capita income in 1900 as Chile and Argentina, entrepre-
neurs in Denmark and Sweden had far faster adoption rates than their Latin contem-
poraries. This pattern appears even within subnational units in the United States.
Counties with higher engineering densities showed higher rates of mechanization,
retail activity, and structural transformation across the twentieth century even after
controlling for all other types of education, including medical and legal higher educa-
tion and a vast array of initial economic conditions. Even today, figure 4.10 shows that
states with higher engineering densities in 1900 had higher levels of adoption of home
computers in the 1990s.
In a fascinating exercise in “nanoeconomics”—an excruciatingly fine examination
of the characteristics of early Meiji-era Japanese firms and their owners—it appears
that certain pioneering entrepreneurs had higher levels of strategic ability, which led to
a stronger international outlook and led them to forge more international connections
(see box 4.5). They also hired more engineers than their more insular competitors.
Both their strategic ability and the engineering prowess led to more sophisticated pro-
duction mechanisms and higher total factor productivity that launched Japan’s indus-
trialization process. Both managerial and technical capabilities appear central to
successful entrepreneurship.
FIGURE 4.10 U.S. States with Higher Engineering Densities in 1900 Had Higher Rates of Adoption of Home Computers in the 1990s
Source: Maloney and Valencia 2017, using data supplied by Skinner and Staiger (2005).
AK
AL
AR
AZ
CA
CO
CT
DC
DE
FLGA
HIIA IDIL
IN
KS
KYLA
MAMD
MEMI
MN
MO
MS
MT
NC
NDNE
NH
NJ
NM
NV
NYOH
OK
OR
PARI
SCSD
TN
TX
UT
VA
VT
WA
WI
WV
WY
Perc
enta
ge w
ith c
ompu
ters
at h
ome,
199
3
0 5010
20
30
40
50
100 150 200 250
Local engineers per 100,000 male workers
U.S. states Linear trend

Entry and Exit: Creating Experimental Societies 99
BOX 4.5
The Nanoeconomics of Entrepreneurial Strategy in Meiji-Era Cotton Spinning: Evidence from Japan’s First Manufacturers
From 1880 to 1920, Japan’s cotton spinning industry went from negligible to a global player, adopt-ing ring spinning frame technologies faster than any other country, starting the Industrial Revolution in Japan and taking the first step in what became known as the Japanese miracle. In contrast to most other latecomers to industrialization, this success happened under a highly com-petitive open economic regime, without government protectionist measures.
To understand the variation of success of firms in Japan’s first giant manufacturing industry, Braguinsky and Hounshell (2016) compiled a detailed “nano”-level database that captures infor-mation such as firm founders and key employees, their educational and employment histories, professional networks, the institutions and organizations they interacted with, and intellectual property. Important strategic choices diverged from the outset.
Indeed, low-quality government efforts to diffuse technology actually hurt early textile firms. The dominant firms that adopted the latest technologies and that subsequently dominated the industry association that disseminated them received no government assistance. Only the Osaka Spinning Company, which engaged international expertise, entered at necessary scale. Meanwhile, the gov-ernment technology specialist who advised 20 plants had no training as an engineer, had not studied abroad, and had no experience in cotton spinning. He led numerous government-sponsored mills into technological blind allies. Meanwhile, Osaka Spinning Company recruited Takeo Yamanobe, who had studied mechanical engineering at Kings College, Cambridge, and then worked at Rose Hill Mill in Lancashire. Contacts in Lancashire allowed him to draw on a different (globally connected) knowl-edge base from that of government-aided mills. Yamanobe worked with Platt Brothers of Oldham to adapt the technologies to local conditions. Yamanobe would also head Boren, the industry associa-tion that disseminated the latest technologies. New entrants, working with Boren and Osaka, intro-duced ring spinning frames and developed new major sources of supply of longer-staple cotton from India and the United States. The chief engineers of the three most progressive firms were sent by their respective employers to England for training. All were graduates of Imperial College of Engineering. Diffusion of ring spinning technology was the fastest in the world. Attention to product quality during the early years of industry development meant first and foremost having competent trained engineers in charge of production facilities. This was not the case in most firms, and many firms did not choose to follow the leaders. The superior strategic management of the leading firm, as well as its stronger engineering capabilities, led to better performance and survival.
In sum, the story of Japan’s first industry was not one of government support, but rather of several leading private entrants powered by visionary entrepreneurs and guided by the first gen-eration of educated engineers whose technical knowledge stemmed from direct contact with fron-tier firms in England. They “broke the spell of backwardness” and put the Japanese cotton spinning industry on the path to global competitiveness.
The nanoeconomic database assembled by Braguinsky and Hounshell shows that the worst technological choices were made by firms that received government subsidies and technical assis-tance, challenging the view that government efforts played a vital role in steering Japan’s first manufacturing giant. While Taiwan, China, appears to have been more successful in the semicon-ductor industry, “the vast majority of efforts by the public sector to target particular industries seem to have been far less successful” (Lerner 2009, 132). The nanoeconomics data illustrate the extreme heterogeneity in entrepreneurial quality that permitted some firms to invest in developing
(Box continues on the following page.)

100 Productivity Revisited
Clearly, establishing a capability to generate such technological expertise is neces-
sary. Importing engineers helps in the short run but does not develop an indigenous
innovative capability. The United States, through the Morrill Land Grant program,
launched in 1862, created land-grant colleges in U.S. states using the proceeds of fed-
eral land sales. Starting out as institutions for teaching agricultural and mechanical
expertise, some of these colleges eventually morphed into some of the most important
engineering departments in the country, among them the Massachusetts Institute of
Technology (MIT) and the University of California (UC) Berkeley. Pedro Nel Ospina,
on return to Colombia from studying at UC Berkeley, established the Antioquia School
of Mining, which provided managerial and technical expertise for one of the three
most important centers of industrialization in Latin America. One of the students from
Cho-shu-, Japan, returned from studies in Scotland to establish what would become the
Imperial College of Engineering in Japan (box 4.1). Again, figure 4.6 crudely captures
the fact that the Asian miracles send far more students per capita abroad at every level
of income than other developing regions.
Government attempts to disseminate technological knowledge have a mixed record.
Low-quality government efforts include the British government’s use of unskilled
agents in attempting to replicate German success in dyestuffs, the unsuccessful technol-
ogy transfer in the Ghana aluminum industry (Easterly 2001), and the failed Skolkovo
(Silicon Valley) project in Russia (Lerner 2009). In Japan, misguided government
efforts hurt early textile firms. The firms that adopted the latest technologies and that
subsequently dominated the industry association that disseminated them were firms
that had no government assistance. The engineer in charge of the program was not up
to date and distributed dated information (box 4.5). Again, this is an argument for
maximizing private sector participation in the design of all types of programs to sup-
port technology transfer and innovation.
Actuarial Capabilities: Learning to ExperimentGeneral higher-order human capital, managerial capabilities, and technical capabilities
are all necessary types of human capital for successful entrepreneurship. However, the
demand and sales networks, improving quality, diversifying, and upgrading the product mix. “Perhaps the most surprising takeaway from our study of the Japanese Meiji Era cotton spinning industry is that individual vision and volition mattered so much,” Braguinsky and Hounshell (2016, 62) conclude.
Sources: Braguinsky and Hounshell 2016; Ohyama, Braguinsky, and Murphy 2004.
BOX 4.5
The Nanoeconomics of Entrepreneurial Strategy in Meiji-Era Cotton Spinning: Evidence from Japan’s First Manufacturers (continued)

Entry and Exit: Creating Experimental Societies 101
framing of entrepreneurship as a process of experimentation (Kerr, Nanda, and
Rhodes-Kropf 2014; Manso 2016) highlights the question of how entrepreneurs man-
age information, how they learn from the experimentation process, and how they
become better learners over time. Development is about placing informed bets. Getting
the necessary information to place the right bet is only half the battle; entrepreneurs
must also be able to process it in a way that allows rigorous cost-benefit analysis and
comparison against other options. We term this skillset “actuarial capabilities.” In a
microcosm of R&D investment, Roberts and Weitzman (1981), Bolton and Harris
(1999), and Moscarini and Smith (2001) discuss how entrepreneurs invest in informa-
tion arising from the process of experimentation to decide whether to continue experi-
mentation or whether to stop. Key to the discussion is that the process of experimentation
itself leads to increased precision in detecting the signals of how profitable a project is
and hence how much should be invested.
Good analogs are found in the process of adopting new “disruptive” technologies
about whose impact little is known. Investors need to form an opinion not only about
the likely returns and risks associated with any particular industry or technology in the
local context, but historically of the viability of the entire industrialization process itself.
Maloney and Zambrano (2016) push the R&D literature further in this context to
explore investment not only in regard to the precision of evaluating arriving informa-
tion, but also in regard to the precision of evaluating prior expectations about the rela-
tive payoffs of different projects. For example, two individuals may receive identical
information about the increasing use of steam engines globally, but one may lack the
technical and business background to confidently undertake an evaluation of the profit-
ability of using steam engines in a particular local context. As shown in box 4.6, Chilean
entrepreneurs established a vast copper industry in the mid-1800s and a thriving nitrate
industry and proved very agile in responding to demand shocks in the agricultural sec-
tor affecting nitrate sales. However, at the dawn of the twentieth century when indus-
tries become more technically and managerially complex, Silva Vargas (1977) observes
“the surprising ignorance of established merchants’ techniques, accepted and in com-
mon usage in Europe for centuries, like letters of exchange, double entry bookkeeping,
or banking operations, as well as the lack of a basic theoretical knowledge of credit,
simple and compound interest, amortization, capitalization, banks.” That is, Chilean
entrepreneurs lacked the basic knowledge about discounted present value, let alone the
ability to price out the likely risk inherent in a complex project.
Furthermore, entrepreneurs’ prior beliefs about likely profitability may not only
prevent entry into new sectors but may also discourage investing in the ability to weigh
the import of new information—that is, learning how to assess new opportunities.
This leads to a new information-driven development trap: The entrepreneur cannot
see the potential in the industrialization project and hence does not invest in the ability
to interpret the associated new “signals” surrounding its benefits—and hence stays with
safe traditional activities. This may mean underinvesting precisely in the kinds of

102 Productivity Revisited
BOX 4.6
Industrial Retrogressions: Insights from Chile and Brazil into the Relative Roles of Learning and the Culture and Business Climate
The local elite in Chile exhibited plenty of entrepreneurial mettle in the mid-1800s. As soon as Spanish restrictions on trade were lifted after independence, exports from Chile—and Latin America more generally—boomed. Chilean entrepreneurs were the second largest presence in Peruvian nitrate fields, ahead of the British, and pioneered copper mining in their home country. They proved responsive to global price movements in commodities. When the price of copper rose mid-century, production by Chileans quadrupled from 1844 to 1860. When demand for foodstuffs skyrocketed during the gold rushes in California and Australia, Chilean wheat exports rose ten-fold in value from 1848 to 1850. Southern hacendados borrowed heavily to clear lands, tripling acreage from 1850 to 1870 (Conning 2001). The early nitrate economy in the Norte Grande had global links that elicited a strong and dynamic response from Chilean entrepreneurs throughout the economy, Cariola and Sunkel (1985) argue. As many as 50,000 Chileans sailed to San Francisco to search for gold and brought mining technologies to their Anglo counterparts (Monaghan 1973).
However, the decline in entrepreneurship at the end of the nineteenth century demands expla-nation. Mac-Iver (1900, 10–11) notes that “Chilenos didn’t lack either an entrepreneurial spirit, nor the energy to work, characteristics which are incarnate in the first railroads and telegraphs, in ports and piers, the irrigation canals in the central valley. But these qualities have been lost.” Writing in 1911, Encina concurs, but notes that the Chilean had an “obsession for fortune at one blow (ganada de un arretazo), or in one-off adventure (extraña aventura)” and lacked the technical and managerial skills to enter modern sectors (Encina 1911, 195). Silva (1977, 50) notes the lack of “the basic theoretical knowledge of credit, simple and compound interest, amortization, capi-talization, banks, etc. which the principle newspaper, El Mercurio de Chile, sought to explain to its readers in 1822.” Furthermore, Maloney and Valencia (2017) show that Chile and Latin America had perhaps one-third of the engineering and scientific capacity of even the U.S. South at the time available to evaluate the new technologies in mining and industry. This missing entrepreneurial and technological capital would have been essential to moving from the customary high-return, short-horizon projects to the evaluation and planning of more complex projects with longer gesta-tions emerging from the Second Industrial Revolution.
By contrast, the foreign entrepreneurs arriving in Valparaiso after independence had precisely this capital. Villalobos and Beltran (1990, 99) note that “the empresarial spirit united with the motivation to apply new techniques was almost always the result of initiatives on the part of for-eigners who came to Chile and saw opportunities to develop or solutions to problems based on practical experience. They brought a greater tradition of information, spirit of action, attention to detail, and urgency to capitalize on the results or resources generated; these were not common traits of the average inhabitant of the country, whose nature of work was little developed beyond the artesenal level.” Explicit is the emphasis on the role of practical experience based on having managed industries beyond the artisanal level previously, that is, the capability to manage infor-mation and see opportunities.
Minas Gerais, the other self-starting region highlighted in table 4.1, offers another example of backsliding that also suggests the importance of entrepreneurial capital. Largely financed by the traditional landed elites, the textile and iron industries grew significantly in the nineteenth cen-tury. However, in contrast to the northern U.S. colonies, which engaged in a sustained process of learning by doing and innovation in both iron and steel from the early eighteenth century on
(Box continues on the following page.)

Entry and Exit: Creating Experimental Societies 103
higher-order business skills as well as the technical capabilities discussed previously.
Finally, without such investment, as modernization proceeds and new projects become
more complex, locals’ skills in interpreting these signals will deteriorate, potentially
leading entrepreneurs and countries to abandon established industries as they become
more sophisticated. Box 4.6 shows that this is precisely what happened in both Chile
and Brazil. This view suggests another source of multiple growth paths: It may not be
the case, as Murphy, Shleifer, and Vishny (1991) and Baumol (1990) argue, that poten-
tial entrepreneurs allocate their talents between productive and rent-seeking activities
based on the incentives. Rather, to the degree that entrepreneurs in a country are unable
to evaluate productive projects, they may decide to create less sophisticated but poten-
tially relatively unproductive ones. That is, the incentives to pursue rent-seeking or
productive paths may emerge endogenously from the presence or absence of advanced
entrepreneurial skills, as side effects.
(Swank 1965), from 1830 to 1880 Brazil experienced a “retrogression in technique”(Rogers 1962, 183). Birchal (1999) argues that the underlying problem was difficulty in selecting new technolo-gies (in our model, evaluating a new project). Success in the productive process was affected by variation in resource inputs in ways that could not be predicted or understood, given the limits in metallurgy at the time. The best mix of resource inputs was found by trial and error and depended on the knowledge of workers, entrepreneurs, or managers. Therefore, not surprisingly, the most successful Mineiro foundries in the first three-quarters of the century were set up by foreigners with extensive knowledge of metallurgy. Birchal’s (1999) description corresponds tightly to the learning process we model: success in the iron industry required experimentation to learn about processes and this, in turn, required the accompanying human capital.
Similarly, in the 1880s there was potential for Minas to enter the electrical industry before foreigners moved the frontier too far to catch up. However, as in Chile, there was insufficient investment in entrepreneurial capital, in this case of both managerial and technical bent. Birchal (1999, 183) concludes, “Mineiro firms relied strongly on foreign technologies and skilled personnel. . . . The existing informal and spontaneous technological innovation system was not developed enough to take the process of technological assimilation farther in the direction of a profound modifcation of existing foreign technologies or to create a more complex indigenous technological alternative.” As in Chile, local entrepreneurs were active but were unable to evalu-ate and adopt the new technologies that would keep them competitive and abandoned industries to foreigners.
The seeming loss of entrepreneurial zeal, but the subsequent regaining by the end of the twentieth century by local elites in Chile, who became major industrial players, and Brazilians, who became major producers of steel, cast some doubt, for instance, on the view that cultural attitudes toward entrepreneurship, or even the operating environment, are the binding constraints on entrepreneurship. The lack of preparation in both entrepreneurial and technical skills as the technological frontier moved forward seems a more likely explanation.
BOX 4.6
Industrial Retrogressions: Insights from Chile and Brazil into the Relative Roles of Learning and the Culture and Business Climate (continued)

104 Productivity Revisited
Given such development traps, the question arises, How much can culture and per-
sonality be modified to avoid or break out of them? Here, two anomalies of the Latin
American experience are again informative. First, table 4.1 showcases two regions
(Antioquia, Colombia, and Minas Gerais, Brazil) fully steeped in the Spanish-
Portuguese traditions, where locals nonetheless embraced and drove the industrializa-
tion project. In both cases, tradition proved malleable.
Both phenomena suggest that something more than culture or institutional context is
at work. As prominent observers remarked at the time, it was the loss of entrepreneurial
spirit that was notable, not its absence. For example, Chilean entrepreneurs completely
established the copper industry during the Golden Era from 1850 to 1880, and entrepre-
neurial zeal was evident in the nitrate and wheat industries. Yet the copper industry, as
with mining industries across the continent, was ceded to the modern U.S. firms, and
industrialization was led by immigrants. Such rapid changes in entrepreneurial presence
cannot be easily explained by a sudden resurgence of Roman influence, or even a worsen-
ing business climate, since this is precisely when immigrants were arriving and thriving.
Concluding Remarks
The entry of more productive firms and the exit of less productive firms in a period of
“normal” economic activity is an important contributor to productivity growth. It also is
the central player in structural transformation: ideas for new industries must be identi-
fied, and entrepreneurs must start and run them. Counter to the U.S. evidence, declining
dynamism of this type does not seem to be the key driver of slower growth in the follower
countries for which we have data, although Chile does seem to show some decrease in
responsiveness to technological shocks. In fact, the factors driving the slowdown may dif-
fer substantially by income level. Financial constriction arising from the crisis may be
more binding in countries with less developed markets than the advanced economies, but
perhaps the slower arrival of technological advances at the frontier affect the latter more.
The greater mystery this chapter began with is why, given the vast potential for the
adoption of existing technologies in follower countries, there are not cadres of entre-
preneurs pursing these vast opportunities. The chapter shows that the masses of self-
employed in developing countries are generally very low-skilled workers who lack the
skillset needed for entrepreneurship. Even among workers with a tertiary education,
who are most likely to be able to launch and manage sophisticated firms, the share of
entrepreneurs decreases with the distance from the frontier, both as a share of the pop-
ulation and as a share of tertiary graduates.
This is the entrepreneurial paradox that accompanies the innovation paradox. To
probe it, the chapter digs more deeply into what the new wave of analysis is saying about
the characteristics of an ecosystem that can support experimentation, as well as the skill-
set the experimenter must have. The discussion urges revisiting the idea that all countries
have a cadre of capable entrepreneurs just waiting for the right framework conditions.
Entry and Exit: Creating Experimental Societies 105
Beyond basic education, technological know-how, managerial capabilities, and a kind of
“actuarial” capital that enables evaluating and managing the risk attendant to sophisti-
cated projects are also needed.
In addition, the chapter sketches recent research on psychological and cultural predis-
positions that underlie successful entrepreneurship. Among the most important are
drive, tolerance for risk, and openness to new ideas. How malleable these characteristics
are and the appropriate policies to instill and support them are frontier questions in this
agenda. But it is increasingly clear that parenting and early childhood development, social
interactions with other entrepreneurs and inventors, a culture that promotes risk and
experimentation and does not penalize failure, and framework conditions that set the
right incentives are crucial to fostering the creation of an entrepreneurial society.
Notes
1. To understand why firm turnover is more important for some countries than others, Asturias et al. (2017) explore this question in the context of fast-growth and slow-growth episodes. Their results for Chile and the Republic of Korea show that net entry plays a relevant role during peri-ods of fast growth. Clementi and Palazzo (2016) show that entry and exit play a major role in shaping aggregate dynamics, in the sense that they propagate the effects of aggregate shocks. The authors find that a positive shock to the common productivity component increases the number of entrants because it makes entry more appealing. However, entrants are smaller than incum-bents and they exhibit lower average idiosyncratic efficiency than incumbent firms.
2. Fairlee (2008), for the United States, finds that immigrants start more firms, but as a share of firms, they are broadly in line with their share of the population. Relatedly, Akcigit, Grigsby, and Nicholas (2017) document a disproportionate contribution of immigrants to innovation, but they do not document their share in high tech start-ups. They examine the relationship between immigration and innovation in the United States and show that technology areas in which immigrant inventors were prevalent between 1880 and 1940 experienced more patenting and citations between 1940 and 2000. They find that the contribution of immigrant inventors to U.S. innovation was substantial and that immigrant inventors were more productive than native-born inventors.
3. Odagiri and Goto (1996) note that nearly half of managers (those born before 1869) were low-class Shizoku, who accounted for only 5 percent of the population. Stead (1904) also shows that at the turn of the century, they were roughly 35 percent of those accepted into the best institu-tions of higher education, again, despite being less than 5 percent of the population. The former samurai also became some of the earliest foreign exchange students, not directly because they were Shizoku, but because many were literate and well-educated scholars. Some of these exchange students started private schools for higher education. Many became reporters and writers, setting up newspaper companies, while others entered government service (see box 4.1).
4. Hopenhayn’s (1992) framework shows how firm size affects the exit rate. In his model, there exists a “size threshold” below which firms decide to exit. Similarly, in Jovanovic’s (1982) noisy selection model, firms remain in business as they receive positive news each period about their continued productivity. Hence, in general, longer-lived firms are less likely to leave unless challenged by new technologies.
5. Interviews by authors with enterprises in Penang.
6. See Zhao, Seibert, and Lumpkin 2010 for a meta review of literature on personality and entrepreneurship.
7. Cultural factors are also thought to be a determinant in the overall level of the accumulation of human capital. Botticini and Eckstein (2005) find that Jewish religious beliefs led to accumulation

106 Productivity Revisited
of human capital and choices of specialization in occupations with high return to literacy. Becker and Woessmann (2009) find that in nineteenth century Prussia, Protestant counties were more prosperous than Catholic ones because of differences in literacy and education. A substantial lit-erature studying the behavior of immigrants documents that immigrants share attitudes toward living with parents (Giuliano 2008), female work, and fertility decisions (Fernández and Fogli 2006), or petty corruption (Fisman and Miguel 2007). At one level, Max Weber’s (1905) asser-tion of a link between religious belief or religiosity and entrepreneurial qualities is revived by McCleary and Barro (2006) and Becker and Woessmann (2009), who argue that the economic consequences of the emergence of Protestantism have lasted centuries, although through its impact on human capital accumulation (literacy), rather than through a work ethic and thrift.
8. Doepke and Zilibotti (2008) further argue for a mutual determination of institutions and values, which give rise, as with Acemoglu (1995), to different growth paths.
9. On a grand historical scale, Galor and Michalopoulos (2009) take a genetic point of view that the failure of the landed aristocracy to lead the risky process of industrialization could be attributed to the effect of Darwinian selection on the low representation of entrepreneurial, risk-tolerant individuals within the landed gentry, and the prevalence of risk-tolerant individuals among the middle and even the lower classes.
10. For a survey, see Astebro et al. (2014).
11. Subjective responses, for instance, from the Global Entrepreneurship Monitor data, show that those reporting being own-employed “Out of Necessity” are a minority (roughly 43 percent) in Latin America. In Croatia, Hungary, and Slovenia, the share is only 29 percent, which is not dis-tinguishable from the levels in Japan (26.3 percent) or Germany (26.5 percent). Furthermore, it would be interesting to know how formal salaried workers with comparable education responded to being asked whether they were employed “out of necessity.”
12. See vander Sluis, van Praag, and Vijverberg (2004) for a meta-analysis of education and entrepreneurship.
References
Acemoglu, D. 1995. “Reward Structures and the Allocation of Talent.” European Economic Review 39 (1): 17–33.
Acemoglu, D., U. Akcigit, H. Alp, N. Bloom, and W. R. Kerr. 2013. “Innovation, Reallocation and Growth.” Working Paper 18993, National Bureau of Economic Research, Cambridge, MA.
Acemoglu, D., S. Johnson, and J. A. Robinson. 2005. “Institutions as a Fundamental Cause of Long-Run Growth.” In Handbook of Economic Growth, Vol. 1A, edited by P. Aghion and N. Durlauf, 385–472. Amsterdam: Elsevier B. V.
Adamopoulos, T., L. Brandt, J. Leight, and D. Restuccia. 2017. “Misallocation, Selection and Productivity: A Quantitative Analysis with Panel Data from China.” NBER Working Paper 23039, National Bureau of Economic Research, Cambridge, MA.
Akcigit, U., H. Alp, and M. Peters. 2018. “Lack of Selection and Limits to Delegation: Firm Dynamics in Developing Countries.” NBER Working Paper 21905, National Bureau of Economic Research, Cambridge, MA. Issued in January 2016, revised in April 2018.
Akcigit, U., J. Grigsby, and T. Nicholas. 2017. “Immigration and the Rise of American Ingenuity.” American Economic Review 107 (5): 327–31.
Alfaro, L., and D. Comin. Forthcoming. Macroeconomics. Oxford: Oxford University Press.
Astebro, T., H. Herz, R. Nanda, and R. A. Weber. 2014. “Seeking the Roots of Entrepreneurship: Insights from Behavioral Economics.” Journal of Economic Perspectives 28 (3): 49–70.
Asturias, J., S. Hur, T. Kehoe, and K. Ruhl. 2017. “Firm Entry and Exit and Aggregate Growth.” Research Department Staff Report 544, Federal Reserve Bank of Minneapolis.

Entry and Exit: Creating Experimental Societies 107
Baily, M. N., C. Hulten, and D. Campbell. 1992. “The Distribution of Productivity in Manufacturing Plants.” Brookings Papers on Economic Activity: Microeconomics 4: 187–249.
Baumol, W. J. 1990. “Entrepreneurship: Productive, Unproductive, and Destructive.” Journal of Political Economy 98 (5, Part 1): 893–921.
Becker, S. O., and L. Woessmann. 2009. “Was Weber Wrong? A Human Capital Theory of Protestant Economic History.” Quarterly Journal of Economics 124 (2): 531−96.
Bengtsson, O., T. Sanandaji, and M. Johannesson. 2017. “The Psychology of the Entrepreneur and the Gender Gap in Entrepreneurship.” In Gender and Entrepreneurial Activity, edited by A. N. Link, 6–45. Cheltenham, U.K.: Edward Elgar.
Bernard, A. B., J. Eaton, J. B. Jensen, and S. Kortum. 2003. “Plants and Productivity in International Trade.” American Economic Review 93 (4): 1268–90.
Birchal, S. d. O. 1999. Entrepreneurship in Nineteenth-Century Brazil: The Formation of a Business Environment. New York: St. Martin’s.
Bischoff, K. M., M. M. Gielnik, M. Frese, and T. Dlugosch. 2013. “Limited Access to Capital, Start-Ups, and the Moderating Effect of an Entrepreneurship Training: Integrating Economic and Psychological Theories in the Context of New Venture Creation (Summary).” Frontiers of Entrepreneurship Research 33 (5): 3.
Bloom, N., S. Bond, and J. Van Reenen. 2007. “Uncertainty and Investment Dynamics.” Review of Economic Studies 74 (2): 391–415.
Bloom, N., B. Eifert, A. Mahajan, D. McKenzie, and J. Roberts. 2013. “Does Management Matter? Evidence from India.” Quarterly Journal of Economics 128 (1): 1–51.
Bloom, N., C. I. Jones, J. Van Reenen, and M. Webb. 2017. “Are Ideas Getting Harder to Find?” NBER Working Paper 23782, National Bureau of Economic Research, Cambridge, MA.
Bloom, N., and J. Van Reenen. 2007. “Measuring and Explaining Management Practices across Firms and Countries.” Quarterly Journal of Economics 122 (4): 1351–408.
Bolton, P., and C. Harris. 1999. “Strategic Experimentation.” Econometrica 67 (2): 349–74.
Botero, J. C., S. Djankov, R. La Porta, F. Lopez-de-Silanes, and A. Shleifer. 2004. “The Regulation of Labor.” Quarterly Journal of Economics 119 (4): 1339–82.
Botticini, M., and Z. Eckstein. 2005. “Jewish Occupational Selection: Education, Restrictions, or Minorities?” Journal of Economic History 65 (4): 922–48.
Braguinsky, S., and D. A. Hounshell. 2016. “History and Nanoeconomics in Strategy and Industry Evolution Research: Lessons from the Meiji-Era Japanese Cotton Spinning Industry.” Strategic Management Journal 37 (1): 45–65.
Brandt, L., J. Van Biesebroeck, and Y. Zhang. 2012. “Creative Accounting or Creative Destruction? Firm-Level Productivity Growth in Chinese Manufacturing.” Journal of Development Economics 97 (2): 339−51.
Bruhn, M., D. Karlan, and A. Schoar. 2016. “The Impact of Consulting Services on Small and Medium Enterprises: Evidence from a Randomized Trial in Mexico.” Policy Research Working Paper 6508, World Bank, Washington, DC.
Campos, F., M. Frese, M. Goldstein, L. Iacovone, H. C. Johnson, D. McKenzie, and M. Mensmann. 2017. “Teaching Personal Initiative Beats Traditional Training in Boosting Small Business in West Africa.” Science 357 (6357): 1287–90.
Cariola, C., and O. Sunkel. 1985. “The Growth of the Nitrate Industry and Socioeconomic Change in Chile, 1880−1930.” In The Latin American Economies, edited by I. R. C. Condre and S. J. Hunt. Teaneck, NJ: Holmes and Meier.
Cassar, A., D. Friedman, and P. H. Schneider. 2009. “Cheating in Markets: A Laboratory Experiment.” Journal of Economic Behavior & Organization 72 (1): 240–59.
Cirera, X., and W. F. Maloney. 2017. The Innovation Paradox: Developing-Country Capabilities and the Unrealized Promise of Technological Catch-Up. Washington, DC: World Bank Group.
108 Productivity Revisited
Clementi, G. L., and B. Palazzo. 2016. “Entry, Exit, Firm Dynamics, and Aggregate Fluctuations.” American Economic Journal: Macroeconomics 8 (3): 1–41.
Comin, D., and B. Hobijn. 2010. “An Exploration of Technology Diffusion.” American Economic Review 100 (5, December): 2031–59.
———. 2011. “Technology Diffusion and Postwar Growth.” NBER Macroeconomics Annual 25 (2011): 209–59.
Comin, D., and M. Mestieri. 2018. “If Technology Has Arrived Everywhere, Why Has Income Diverged?” American Economic Journal: Macroeconomics 10 (3): 137–78.
Conning, J. 2001. “Latifundia Economics.” Unpublished, Department of Economics, Williams College.
Cramer, J. S., J. Hartog, N. Jonker, and C. M. van Praag. 2002. “Low Risk Aversion Encourages the Choice for Entrepreneurship: An Empirical Test of a Truism.” Journal of Economic Behavior & Organization 48 (1): 29–36.
Cunningham, W. V., and P. Villaseñor. 2016. “Employer Voices, Employer Demands, and Implications for Public Skills Development Policy Connecting the Labor and Education Sectors.” World Bank Research Observer 31 (1): 102–34.
Cusolito, A. P., E. Dautovic, and D. McKenzie. 2017. “Can Government Intervention Make Firms More Investment-Ready? A Randomized Experiment in the Western Balkans.” Policy Research Working Paper 8541, World Bank, Washington, DC.
De Carvalho, A. G., C. W. Calomiris, and J. A. de Matos. 2008. “Venture Capital as Human Resource Management.” Journal of Economics and Business 60 (3): 223–55.
Decker, R. A., J. C. Haltiwanger, R. S. Jarmin, and J. Miranda. 2018. “Changing Business Dynamism and Productivity: Shocks vs. Responsiveness.” NBER Working Paper 24236, National Bureau of Economic Research, Cambridge, MA.
Djankov, S. 2009. “The Regulation of Entry: A Survey.” World Bank Research Observer 24 (2): 183–203.
Djankov, S., R. La Porta, F. Lopez-de-Silanes, and A. Shleifer. 2002. “The Regulation of Entry.” Quarterly Journal of Economics 117 (1): 1–37.
Doepke, M., and F. Zilibotti. 2008. “Occupational Choice and the Spirit of Capitalism.” Quarterly Journal of Economics 123 (2): 747–93.
Dreher, A., and M. Gassebner. 2013. “Greasing the Wheels? The Impact of Regulations and Corruption on Firm Entry.” Public Choice 155 (3/4): 413–32.
Dunne, T., S. D. Klimek, M. J. Roberts, and D. Y. Xu. 2013. “Entry, Exit, and the Determinants of Market Structure.” RAND Journal of Economics 44 (3): 462–87.
Dunne, T., M. J. Roberts, and L. Samuelson. 1988. “Patterns of Firm Entry and Exit in US Manufacturing Industries.” RAND Journal of Economics 19 (4): 495–515.
Easterly, W. 2001. The Elusive Quest for Growth. Cambridge, MA: MIT Press.
Edelman, L., and H. Yli-Renko. 2010. “The Impact of Environment and Entrepreneurial Perceptions on Venture-Creation Efforts: Bridging the Discovery and Creation Views of Entrepreneurship.” Entrepreneurship Theory and Practice 34 (5): 833–56.
Encina, F. A. 1911. Nuestra Inferioridad Economica, sus Causas, sus Consequencias. Santiago: Coleccion Imagen de Chile.
Escribano, A., and J. L. Guasch. 2005. “Assessing the Impact of the Investment Climate on Productivity Using Firm-Level Data: Methodology and the Cases of Guatemala, Honduras, and Nicaragua.” Policy Research Working Paper 3621, World Bank, Washington, DC.
Eslava, M., M. Kugler, and J. Haltiwanger. 2009. “Trade Reforms and Market Selection: Evidence from Manufacturing Plants in Colombia.” NBER Working Paper 14935, National Bureau of Economic Research, Cambridge, MA.

Entry and Exit: Creating Experimental Societies 109
Estrin, S., J. A. Korosteleva, and T. Mickiewicz. 2009. “Better Means More: Property Rights and High-Growth Aspiration Entrepreneurship.” IZA Discussion Paper 4396, Institute for the Study of Labor, Bonn.
Falco, P., W. F. Maloney, B. Rijkers, and M. Sarrias. 2012. “Heterogeneity in Subjective Wellbeing: An Application to Occupational Allocation in Africa.” Policy Research Working Paper 6244, World Bank, Washington, DC.
Fairlee, R. 2008. “Estimating the Contribution of Immigrant Business Owners to the U.S. Economy.” Office of Advocacy Report, U.S. Small Business Administration, Washington, DC.
Fernald, J. 2014. “Productivity and Potential Output before, during, and after the Great Recession.” Chapter 1 in NBER Macroeconomics Annual 2014, edited by J. A. Parker and M. Woodford, vol. 29, 1−51. Cambridge, MA: MIT Press.
Fernández, R., and A. Fogli. 2006. “Fertility: The Role of Culture and Family Experience.” Journal of the European Economic Association 4 (2-3): 552–61.
Fisher, J. L., and J. V. Koch. 2008. Born, Not Made: The Entrepreneurial Personality. Santa Barbara, CA: Praeger.
Fisman, R., and E. Miguel. 2007. “Corruption, Norms, and Legal Enforcement: Evidence from Diplomatic Parking Tickets.” Journal of Political Economy 115 (6): 1020–48.
Foster, L., J. C. Haltiwanger, and C. J. Krizan. 2001. “Aggregate Productivity Growth: Lessons from Microeconomic Evidence.” In New Developments in Productivity Analysis, edited by C. R. Hulten, E. R. Dean, and M. J. Harper, 303–72. Chicago: University of Chicago Press.
Frese, M., and M. M. Gielnik. 2014. “The Psychology of Entrepreneurship.” Annual Review of Organizational Psychology and Organizational Behavior 1 (1): 413–38.
Frey, B. S., M. Benz, and A. Stutzer. 2004. “Introducing Procedural Utility: Not Only What, but Also How Matters.” Journal of Institutional and Theoretical Economics 160 (3): 377–401.
Galor, O., and S. Michalopoulos. 2009. “The Evolution of Entrepreneurial Spirit and the Process of Development.” The Carlo Alberto Notebooks 111, Collegio Carlo Alberto.
García, Alvaro. 2018. “Job Reallocation and the Productivity Slowdown in Chile.” Background paper for Productivity Revisited, World Bank, Washington, DC.
Gertler, P., and D. Carney. 2017. “Making (Great) Entrepreneurs: The Return to Teaching Youth Hard versus Soft Entrepreneurial Skills from an At-Scale Experiment.” Presentation, World Bank.
Giorcelli, M. 2016. “The Long-Term Effects of Management and Technology Transfer: Evidence from the US Productivity Program.” SIEPR Discussion Paper No. 16-010, Stanford Institute for Economic Policy Research, Stanford University.
Giuliano, P. 2008. “Culture and the Family: An Application to Educational Choices in Italy.” Rivista di Politica Economica 98 (4): 3–38.
Gordon, R. 2015. “Secular Stagnation: A Supply-Side View.” American Economic Review: Papers and Proceedings 105 (5): 54–59.
Gort, M., and S. Klepper. 1982. “Time Paths in the Diffusion of Product Innovations.” Economic Journal 92 (367): 630–53.
Guasch, J. L., S.-L, Racine, I. Sanchez, and M. Diop. 2007. Quality Systems and Standards for a Competitive Edge. Washington, DC: World Bank.
Guiso, L., P. Sapienza, and L. Zingales. 2006. “Does Culture Affect Economic Outcomes?” Journal of Economic Perspectives 20 (2): 23–48.
Haltiwanger, J. 2015. “Top Ten Signs of Declining Business Dynamism and Entrepreneurship in the U.S.” Paper written for the Kauffman Foundation New Entrepreneurial Growth conference, June.
Haltiwanger, J., R. Decker, R. Jarmin, and J. Miranda. 2014. “The Secular Decline in Business Dynamism in the U.S.” Working paper, University of Maryland.
110 Productivity Revisited
Haltiwanger, J., H. Hyatt, L. B. Kahn, and E. McEntarfer. 2017. “Cyclical Job Ladders by Firm Size and Firm Wage.” NBER Working Paper 23485, National Bureau of Economic Research, Cambridge, MA.
Hausmann, R., and D. Rodrik. 2003. “Economic Development as Self-Discovery.” Journal of Development Economics 72 (2): 603–33.
Herz, H., D. Schunk, and C. Zehnder. 2014. “How Do Judgmental Overconfidence and Overoptimism Shape Innovative Activity?” Games and Economic Behavior 83: 1–23.
Higuchi, Y., V. H. Nam, and T. Sonobe. 2015. “Sustained Impacts of Kaizen Training.” Journal of Economic Behavior & Organization 120: 189–206.
Holm, H. J., S. Opper, and V. Nee. 2013. “Entrepreneurs under Uncertainty: An Economic Experiment in China.” Management Science 59 (7): 1671–87.
Holmes, T. J., and J. A. Schmitz Jr. 1990. “A Theory of Entrepreneurship and Its Application to the Study of Business Transfers.” Journal of Political Economy 98 (2): 265–94.
Hopenhayn, H. A. 1992. “Entry, Exit, and Firm Dynamics in Long-Run Equilibrium.” Econometrica 60 (5): 1127–50.
Hurst, E., and A. Lusardy. 2004. “Liquidity Constraints, Household Wealth and Entrepreneurship.” Journal of Political Economy 112 (1): 319–47.
Hurst, E., and B. W. Pugsley. 2011. “What Do Small Businesses Do?” NBER Working Paper 17041, National Bureau of Economic Research, Cambridge, MA.
Iacovone, L., W. Maloney, and D. McKenzie. 2018. “Improving Management with Individual and Group-Based Consulting: Results from a Randomized Experiment in Colombia.” Working paper.
Iacovone, L., W. Maloney, and N. Tsivanidis. 2015. “Family Firms and Contractual Institutions.” Working paper. LACEA 2016 Papers, Latin American and Caribbean Economic Association.
Jarmin, R. S. 1999. “Evaluating the Impact of Manufacturing Extension on Productivity Growth.” Journal of Policy Analysis and Management 18 (1): 99–119.
Johnson, S., J. McMillan, and C. M. Woodruff. 1999. “Property Rights, Finance and Entrepreneurship.” Conference Paper for The Nobel Symposium in Economics—The Economics of Transition, Stockholm; CESifo Working Paper No. 212, Center for Economic Studies and Ifo Institute (CESifo).
Jovanovic, B. 1982. “Selection and the Evolution of Industry.” Econometrica 50 (3): 649–670.
Kerr, S. P., and W. R. Kerr. 2011. “Economic Impacts of Immigration: A Survey.” NBER Working Paper 16736, National Bureau of Economic Research, Cambridge, MA.
Kerr, S. P., W. R. Kerr, and T. Xu. 2017. “Personality Traits of Entrepreneurs: A Review of Recent Literature.” Working Paper 24097, National Bureau of Economic Research, Cambridge, MA.
Kerr, W. R. 2013. “US High-Skilled Immigration, Innovation, and Entrepreneurship: Empirical Approaches and Evidence.” NBER Working Paper 19377, National Bureau of Economic Research, Cambridge, MA.
Kerr, W. R., R. Nanda, and M. Rhodes-Kropf. 2014. “Entrepreneurship as Experimentation.” Journal of Economic Perspectives 28 (3): 25–48.
Khaldun, I. 1377. The Muqaddimah: An Introduction to History. Princeton, NJ: Princeton University Press. 2015 edition.
Kihlstrom, R. E., and J. J. Laffont. 1979. “A General Equilibrium Entrepreneurial Theory of Firm Formation Based on Risk Aversion.” Journal of Political Economy 87 (4): 719–48.
Klapper, L., L. Laeven, and R. Rajan. 2006. “Entry Regulation as a Barrier to Entrepreneurship.” Journal of Financial Economics 82 (3): 591–629.
Lafortune, J., J. Riutortz, and J. Tessada. 2017. “Are Micro-entrepreneurs Constrained by Their Lack of Knowledge or Motivation? Lessons from a Randomized Experiment in Chile.” https://www.pov ertyactionlab.org/sites/default/files/publications/651_Are-micro-entrepreneurs-constraineds -by-their-lack-of-knowlwdge-or-motivation_February2017.pdf.

Entry and Exit: Creating Experimental Societies 111
Lee, Y., and T. Mukoyama. 2015. “Entry and Exit of Manufacturing Plants over the Business Cycle.” European Economic Review 77 (July): 20–27.
Lemos, R., and D. Scur. 2018. “All in the Family? CEO Choice and Firm Organization.” Working Paper, University of Oxford.
Lerner, J. 2000. “Small Businesses, Innovation, and Public Policy in the Information Technology Industry.” In Understanding the Digital Economy: Data, Tools, and Research, edited by E. Brynjolfsson and B. Kahin, 201–14. Cambridge, MA: MIT Press.
———. 2009. Boulevard of Broken Dreams. Why Public Efforts to Boost Entrepreneurship and Venture Capital Have Failed––And What to Do about It. Princeton, NJ: Princeton University Press.
Lindquist, M. J., J. Sol, and M. van Praag. 2015. “Why Do Entrepreneurial Parents Have Entrepreneurial Children?” Journal of Labor Economics 33 (2): 269–96.
Lucas Jr., R. E. 1978. “On the Size Distribution of Business Firms.” Bell Journal of Economics 9 (2): 508–23.
Mac-Iver, E. 1900. Discurso sobre la Crisis Moral de la Republica. Santiago, Chile: Imprenta Moderna.
Maloney, W. F. 2004. “Informality Revisited.” World Development 32 (7): 1159–78.
Maloney, W. F., and M. Rubio. 2018. “Self-Employment and Entrepreneurship across the Life Cycle and Level of Development.” Background paper for Productivity Revisited, World Bank, Washington, DC.
Maloney, W. F., and M. Sarrias. 2017. “Convergence to the Managerial Frontier.” Journal of Economic Behavior & Organization 134 (C): 284–306.
Maloney, W. F., and F. Valencia Caicedo. 2017. “Engineering Growth: Innovative Capacity and Development in the Americas.” Working paper, World Bank, Washington, DC.
Maloney, W. F., and A. Zambrano. 2016. “Entrepreneurship, Information and Learning.” World Bank, Washington, DC, and Universidad de los Andes, Bogotá, Colombia.
Manso, G. 2016. “Experimentation and the Returns to Entrepreneurship.” Review of Financial Studies 29 (9): 2319–40.
McCleary, R. M., and R. J. Barro. 2006. “Religion and Economy.” Journal of Economic Perspectives 20 (2): 49−72.
McKenzie, D., and C. Woodruff. 2014. “What Are We Learning from Business Training and Entrepreneurship Evaluations around the Developing World?” World Bank Research Observer 29 (1): 48–82.
Melitz, M. J. 2003. “The Impact of Trade on Intra-industry Reallocations and Aggregate Industry Productivity.” Econometrica 71 (6): 1695–725.
Melo, H. 2012. “Prosperity through Connectedness (Innovations Case Narrative: Start-Up Chile).” Innovations: Technology, Governance, Globalization 7 (2): 19–23.
Monaghan, J. 1973. Chile, Peru, and the California Gold Rush of 1849. University of California Press.
Moscarini, G., and L. Smith. 2001. “The Optimal Level of Experimentation.” Econometrica 69 (6): 1629−44.
Murphy, K. M., A. Shleifer, and R. W. Vishny. 1991. “The Allocation of Talent: Implications for Growth.” Quarterly Journal of Economics 106 (2): 503–30.
Nanda, R., and J. B. Sørensen. 2010. “Workplace Peers and Entrepreneurship.” Management Science 56 (7): 1116–26.
Neergaard, H., and C. Thrane. 2011. “The Nordic Welfare Model: Barrier or Facilitator of Women’s Entrepreneurship in Denmark?” International Journal of Gender and Entrepreneurship 3(2): 88–104.
Nicolaou, N., and S. Shane. 2010. “Entrepreneurship and Occupational Choice: Genetic and Environmental Influences.” Journal of Economic Behavior & Organization 76 (1): 3–14.

112 Productivity Revisited
Nicolaou, N., S. Shane, L. Cherkas, J. Hunkin, and T. D. Spector. 2008. “Is the Tendency to Engage in Entrepreneurship Genetic?” Management Science 54 (1): 167–79.
North, D. C. 1991. “Institutions.” Journal of Economic Perspectives 5 (1): 97–112.
Odagiri, H., and A. Goto. 1996. Technology and Industrial Development in Japan: Building Capabilities by Learning, Innovation, and Public Policy. Oxford, U.K: Oxford University Press.
Ohyama, A., S. Braguinsky, and K. M. Murphy. 2004. “Entrepreneurial Ability and Market Selection in an Infant Industry: Evidence from the Japanese Cotton Spinning Industry.” Review of Economic Dynamics 7 (2): 354–81.
Olley, G. S., and A. Pakes. 1996. “The Dynamics of Productivity in the Telecommunications Equipment Industry.” Econometrica 64: 1263–97.
Perry, G. E., O. Arias, P. Fajnzylber, W. F. Maloney, A. Mason, and J. Saavedra-Chanduvi. 2007. Informality: Exit and Exclusion. Washington, DC: World Bank.
Pugsley, B. W., and A. Sahin. 2015. “Grown-Up Business Cycles.” Review of Financial Studies. https://doi.org/10.1093/rfs/hhy063.
Putterman, L., and D. Weil. 2008. “Post-1500 Population Flows and the Long-Run Determinants of Economic Growth and Inequality.” NBER Working Paper 14448, National Bureau of Economic Research, Cambridge, MA.
Roberts, K., and M. L. Weitzman. 1981. “Funding Criteria for Research, Development, and Exploration Projects.” Econometrica 49 (5): 1261–88.
Rogers, E. 1962. “The Iron and Steel Industry in Colonial and Imperial Brazil.” Americas 1 (2): 172−84.
Safford, F. 1976. The Ideal of the Practical: Colombia’s Struggle to Form a Technical Elite. Austin, TX: University of Texas Press.
Schmitz Jr., J. A. 1989. “Imitation, Entrepreneurship, and Long-Run Growth.” Journal of Political Economy 97 (3): 721–39.
Schultz, T. 1980. “Investment in Entrepreneurial Ability.” Scandinavian Journal of Economics 82 (4): 437–48.
Silva Vargas, F. 1977. “Notas sobre la evolucion empresarial chilena en el siglo xix.” Empresa Privada, 73–102.
Skinner, J., and D. Staiger. 2005. “Technology Adoption from Hybrid Corn to Beta Blockers.” NBER Working Paper 11251, National Bureau of Economic Research, Cambridge, MA.
Spolaore, E., and R. Wacziarg. 2009. “The Diffusion of Development.” Quarterly Journal of Economics 124 (2): 469–529.
Stead, A. 1904. Japan by the Japanese—A Survey by Its Highest Authorities. Portsmouth, NH: Heinemann.
Stein, S. J., and B. H. Stein. 1970. The Colonial Heritage of Latin America, vol. 10. New York: Oxford University Press.
Swank, J. M. 1965. History of the Manufacture of Iron in All Ages, and Particularly in the United States from Colonial Times to 1891, 2nd ed. New York: B. Franklin.
vander Sluis, J., M. van Praag, and W. P. Vijverberg. 2004. “Education and Entrepreneurship in Industrialized Countries: A Meta-analysis.” Working Paper 51-04, Amsterdam School of Economics Research Institute (ASE-RI). https://pure.uva.nl/ws/files/2107544/35537 _ wp51_04 .pdf.
van Praag, C. M., and J. S. Cramer. 2001. “The Roots of Entrepreneurship and Labour Demand: Individual Ability and Low Risk Aversion.” Economica 68 (269): 45–62.
Entry and Exit: Creating Experimental Societies 113
Verde. 2016. “Evaluación del Programa Start-Up Chile de Corfo, Resumen Ejecutivo.” Santiago, February 19. http://www.economia.gob.cl/wp-content/uploads/2016/08/Res-Ejecutivo-START -UP-CHILE.pdf.
Villalobos, S. R., and L. Beltran. 1990. Historia de la Ingeniera en Chile. Santiago: Hachette.
Weber, M. 1905. The Protestant Ethic and the Spirit of Capitalism. Routledge. 2013 ed.
What Works Centre for Local Economic Growth. 2016. Evidence Review 2: Business Advice, Updated June 2016. London.
Zhao, H., S. E. Seibert, and G. T. Lumpkin. 2010. “The Relationship of Personality to Entrepreneurial Intentions and Performance: A Meta-Analytic Review.” Journal of Management 36 (2): 381–404.
Zumbuehl, M., T. J. Dohmen, and G. A. Pfann. 2013. “Parental Investment and the Intergenerational Transmission of Economic Preferences and Attitudes.” IZA Discussion Paper 7476, Institute of Labor Economics, Bonn.


115
5. Productivity Policies
The new wave of thinking about productivity presented in previous chapters has atten-
dant consequences for the design of productivity policies. The disciplining principle for
policy design and implementation should be the same as in the first wave of analysis and
reforms. That is, government interventions are justified by the need to remove distor-
tions, establish the right framework of economic incentives, redress missing markets, or
correct other market failures that can be found in many aspects of the economy.
However, the analysis of previous chapters shows that many of the approaches com-
monly used to identify which of these are critical in the realm of productivity rest on
weak conceptual or analytical foundations or use databases that lack the requisite
information. Hence, there is a risk of erroneous policy prescriptions, mistakes in the
inferences of welfare implications and distributional effects from policy reforms, and
in the end, an inability to prioritize the policy reform agenda. This is critical since gov-
ernments have limited capabilities and attention spans (bandwidth) and must choose
among policies with the most potential impact. Furthermore, the findings stress that
there are complementarities across broad areas of policy that need to be treated in inte-
grated ways. This makes both policy and policy making more complex.
Both the need to prioritize amid policy uncertainty and the need to address comple-
mentarities amplify a central theme of the previous volume in this series, which can be
updated as the Productivity Policy Dilemma: for developing countries, the greater mag-
nitude of the market failures to be resolved and distortions to be removed and the
multiplicity of missing complementary factors and institutions increase the complexity
of productivity policy, yet government capabilities to design, implement, and coordi-
nate an effective policy mix to resolve and coordinate them are weaker.
This dilemma dictates a need for progress along two fronts. For starters, there is a need
to reduce the dimensionality of the policy mix by setting priorities broadly guided by two
questions. First, how certain is it that the identified distortion or market failure is, in fact,
a major barrier to productivity growth relative to others? Second-wave analysis clearly
increases the uncertainty surrounding some traditional recommendations. At the same
time, it offers important new findings and new tools for the analytical agenda ahead.
Second, how likely is it that the government can successfully redress the distortion
or market failure? The classic concerns here are the analytical capabilities of the gov-
ernment, the ability to design and evaluate appropriate policies, and then the ability to
116 Productivity Revisited
execute across several policy dimensions. Here, enhancing the productivity of the state—
the number of tasks it can execute and coordinate given its finite resources, and the
quality of those tasks—becomes a critical dimension of productivity policy.
The sections that follow summarize the main lessons from the second wave of anal-
ysis and discuss their major implications for evidence-based policy making and
prioritization.
Summary of Main Lessons from the Second Wave of Productivity Analysis
1. Toward a New Toolkit of Productivity Diagnostics and Analytics
The question about whether resolving a particular distortion or market failure should
be a priority can only be answered by careful analytical work that will progressively
establish with some certainty the efficacy of interventions and the mechanisms through
which they work. This volume has so far explained that when output and input prices
at the firm level are not observed, then the productivity measure conflates both
demand- and supply-side factors—and therefore the usual productivity residual is a
measure of firm performance instead of efficiency. Furthermore, the chapters have dis-
cussed that even when output and input prices at the firm level are observed, the pro-
ductivity measure captures both efficiency and quality, unless the quality measure is
observable. Identification problems linked to the lack of acknowledgment of demand
factors embedded in the productivity residual can have nontrivial consequences for
“evidence-based” policy making.
■ Revenue-based productivity measures are a flawed diagnostic of efficiency. One
concern is to mistakenly infer efficiency gains from the reallocation of resources
toward the most productive firms while the effect of such reallocation is to
increase market concentration. If variations in productivity at the firm level are
mainly driven by variations in output prices (instead of technical changes), then
a higher covariance between productivity and employment, which is often the
measure used to infer the degree of (mis)allocation in an industry or economy,
will indicate higher market concentration instead of aggregate productivity
gains. A similar problem arises when exploring structural transformation issues.
In this case, large differences in labor productivity among sectors can suggest
that efficiency can be gained by transferring workers to more productive sectors.
To the degree that labor productivity is capturing rents due to barriers to entry,
this approach amounts to arguing for transferring workers to the more distorted
and inefficient parts of the economy.
■ Productivity analysis that does not account for market structure and market power
may lead to false inference about the impact of policy reforms and the channels
through which they work. As an example, evidence from India suggests that trade
liberalization led to larger declines in input prices than output prices and hence

Productivity Policies 117
a rise in firm markups and a decrease in competitive pressures. In contrast to
what standard trade models would have predicted, the benefits from the trade
reform were not passed through to consumers. In Chile, increased Chinese com-
petition led to a fall in markups and a concomitant fall in innovation and pro-
ductivity because financially constrained firms did not have the revenues needed
to cover the fixed costs of innovating. Thus, the second wave of analysis asks for
a serious reevaluation of a long list of productivity diagnostics that document
broad gains from policy reforms when those studies rely on simple assumptions
or weak data.
■ Productivity analysis that does not take into account demand factors may lead to
ineffective policies for fostering firm growth over the life cycle. Identification prob-
lems about the type of growth model, whether supply-driven or demand-driven,
that helped a country move forward along the development path may affect the
effectiveness of economic policies geared toward expanding the private sector
and may imply a waste of public resources when policies target the wrong objec-
tives. For instance, the evidence here shows that productivity is more important
at early stages of the life cycle, while cultivating demand matters more at a ma-
ture age. Furthermore, there may be trade-offs between developing “efficiency”
comparative advantages and “quality” comparative advantages. Moreover, not
taking into account quality aspects when analyzing firm productivity may lead
to false inferences that high-quality firms are the unproductive firms in a sector.
■ The commonly used metric of dispersion of revenue-based productivity is not a reli-
able measure of distortions or barriers to the efficient allocation of resources in an
economy. Conceptually, dispersion may depend on assumptions that are shown to
be unsupported by the data. Dispersion can be driven by technology, quality, risky
investment, adjustment costs, and markup differences without necessarily imply-
ing a bad outcome at the aggregate level. Indeed, dispersion can have a positive
implication for aggregate productivity if it is the result of technological differ-
ences, quality upgrading, innovation, and entrepreneurial experimentation. New
evidence for a sample of 12 developing countries shows that heterogeneity in
production technologies (that is, firm-level differences in output elasticities of
capital and other inputs in the production function) can potentially account for
between about one-quarter and one-half of dispersion. This is an important
result, as it suggests that a nonnegligible portion of observed dispersion may not
entail a “misallocation” at all. Furthermore, inferences about misallocation prove
to be empirically highly sensitive to how data are processed and cleaned, render-
ing cross-country comparisons unreliable. For example, just using the raw U.S.
data to calculate dispersion instead of the Census-cleaned data reverses the rela-
tionship between the calculated “gains from reallocation” and GDP, showing that
the most advanced econo mies have the most to gain from reallocation.
■ Entrepreneurs cannot be assumed to be similar in basic human capital, including
basic numeracy, managerial skills, or psychological traits. Traditionally,

118 Productivity Revisited
economics has shied away from opening the black box of the entrepreneur—
the individual who combines factors of production or decides to launch a firm.
However, the recent research on management quality and on culture and an
emerging psychological literature on the characteristics of successful engineers
suggest that these dimensions are central to understanding productivity
differences. The vast share of the workforce in both formal employment and
informal self-employment in developing countries is characterized by low basic
human capital and low modern sector productivity. Hence the opportunity
cost of being self-employed is low, and the reserve of entrepreneurs who can
manage sophisticated enterprises is limited. In an important sense, total factor
productivity differences are, in fact, managerial capability differences, which
can be thought to include basic abilities to combine capital and labor, techno-
logical literacy, and what this volume calls actuarial capability—the ability to
learn about, quantify, and manage the risks involved in a project. Finally, a new
literature suggests that issues of personality with respect to identifying oppor-
tunities, having the energy to push a project forward, and tolerating risk are
also important. A nascent literature suggests that these traits are malleable.
Overall, although we now know much more about how to approach the measure-
ment of productivity and its correlates, much of what we thought we knew needs to be
reviewed. In each case discussed, a rejuvenated analytical agenda is needed to isolate the
true impact of proposed policy reforms and the necessary supporting contexts. In addi-
tion, the volume draws on a new generation of data to support this agenda. Chapter 2
emphasizes the need for firm-level data on prices, marginal costs, product quality,
worker qualifications, and risk.
Generating the necessary empirical base in the productivity realm requires more
analytical rigor and more detailed firm-level data. Thus, access to firm-level census data
that gather that type of information and expansion of the coverage of existing data-
bases to incorporate these key dimensions of firm performance are crucial to providing
new insights for the second wave of policy reforms. In the end, strong analytical work
combined with a second generation of industrial surveys are essential to making
productivity policies more effective.
2. A Comprehensive Approach toward Productivity Growth and the Role of the
“Within” Component
The productivity (physical total factor productivity, TFPQ) decompositions presented
in this volume confirm that all three components (within-firm, between-firm, and
selection) are relevant for explaining productivity growth and dictate a reweighting of
the elements in the productivity policy mix. Though the tractability of the Hsieh-
Klenow approach has moved the (mis)allocation agenda to the center of many policy
discussions, the recent criticisms on both conceptual and empirical levels suggest that
the static focus is not fully justified.

Productivity Policies 119
The TFPQ decompositions in chapter 1 suggest that all margins of productivity
growth are important and, in fact, the within-firm margin, which is related to firm
upgrading (through innovation, technology adoption, and managerial practices, among
others) is relatively more important than the between-firm margin. The within-firm
margin explains at least half of productivity growth in China, Ethiopia, and India, consis-
tent with a renewed focus on technology adoption and good managerial practices as
explaining productivity and income differences between advanced economies and
emerging markets. In Chile and Colombia, the entry and exit of firms is the largest con-
tributor. Reallocation is arguably equal in contribution to the within dimension only in
the Indian case, broadly following that country’s far-reaching trade liberalization.
This said, this volume shows that these three components are inextricably linked.
The small red arrows in figure 5.1 capture this interdependency: On the one hand, as
chapter 3 establishes, impediments to reallocation of resources driven by distortions,
such as trade barriers, poor regulation, and the presence of informal firms or overbear-
ing state-owned enterprises, can have negative dynamic effects on the within margin, as
they may discourage firm upgrading or prevent the exit of unproductive firms and the
entry of high-productivity firms.1 On the other hand, without the arrival of new inno-
vation shocks as incumbent and new firms introduce new products and processes and
compete for resources, even the cleanest, least distorted economic system will cease to
reap gains from reallocation.
3. The Operating Environment and Human Capital: Critical Complements across All
Three Productivity Margins
The last point highlights that, cutting across the three margins in figure 5.1 is the essen-
tial complementarity of both environmental factors and a range of types of human
capital: personality, as well as managerial, entrepreneurial, and technological capabili-
ties. Productivity growth requires progress on all these fronts.
FIGURE 5.1 Drivers of Productivity Growth
Reallocation toward more productive firms
Within-firmperformance upgrading
Entry of high-productivity,exit of low-productivity firms
Total factor productivity growth
Human capital and innovative infrastructure: basic skills;entrepreneurial, managerial, and technological capabilities
Operating environment: resolving market failures and removing distortions
Dynamic effects
Innovation shocks
120 Productivity Revisited
Chapter 2 notes a long literature that shows the positive impact of competition
policy on productivity working through the reallocation channel by facilitating the
transfer of resources to more productive firms—the within-firm component; by stimu-
lating incumbents to invest in productivity-enhancing innovation; and in entry and
exit by permitting the entry of more productive firms and encouraging the exit of less
productive ones. Hence opening markets to international trade, exposing state-owned
industries to competition, and reducing their ability to prevent the emergence of com-
petitors is of central importance to ensuring that managers are on their toes and look-
ing at opportunities to bring new techniques and technologies from the frontier. Here,
the insistence from industrial organization economists that productivity policy and
market structure be approached in an integrated fashion becomes a critical agenda for
understanding both the channels through which policy changes affect firm incentives
and how they respond.
However, though the overall system may be crystalline—undistorted and with all
market failures resolved—if there are no entrepreneurs with the necessary human capital
to take advantage of it, there will be no growth. The centrality of this point and the need
for better measurement of human capital are highlighted in the World Bank’s recently
launched Human Capital Index. The Human Capital Project includes a program of mea-
surement and research to inform policy action, and a program of support for country
strategies to accelerate investment in human capital.2 As noted, entrepreneurship without
at least numeracy and literacy is likely to lead to the non-productivity-increasing churn-
ing seen in much of the developing world’s self-employed sectors. If the managers of
established firms or incipient start-ups lack the managerial capabilities to recognize or
respond to new technological opportunities or domestic and foreign competition, there
will be no impetus to upgrade their firms or enter the market.
The evidence presented here and elsewhere on immigrants makes this case. Some
kind of human capital—whether world experience, business training, risk appetite
or tolerance, or openness to seeing the viability of a project—permitted them to
thrive in the same imperfect business climate and institutional setup in which locals
did not.
Furthermore, chapter 2 documents a heterogeneity of responses to increased
competition, such as trade liberalization, that depend on firms’ ability to develop a
strategy to meet competition, to diversify into other products, or to upgrade to a dif-
ferent market—all of which depend on higher-level firm capabilities that rest on core
managerial competencies that developing countries lack. Attracting foreign direct
investment is an initial way of transferring technology and driving reallocation, but
over the longer term, the enhancement of human capital along several dimensions—
capabilities in management, technological adoption, and risk evaluation, for exam-
ple—becomes central for both within-firm performance upgrading and new firm
entry.

Productivity Policies 121
4. Beyond Efficiency: Policy Needs to Adopt a Broader View of Value Creation in the
Modern Firm
The firm is the main creator of value added and the ultimate driver of aggregate eco-
nomic growth. Breaking apart revenue-based productivity into its constituent parts in
chapter 2, while confirming the centrality of efficiency improvement, fortuitously
opened the door to identifying other dimensions of firm performance that also contrib-
ute to the generation of value added but that require a broader policy focus. However,
from a policy perspective, all determinants of firm performance should not be taken as
interchangeable. New evidence shows that advantages in marginal costs matter rela-
tively more at early stages of a firm’s life cycle, while demand factors such as quality
upgrading, advertising, marketing, and brand name have a relatively larger effect on
firm performance at later stages.
Raising the quality of a product may require some of the same kinds of investments
needed to increase efficiency—and suffer from similar market failures. 3 In this regard,
all the considerations discussed in The Innovation Paradox (Ciera and Maloney 2017)
are relevant, and its discussion about improving the functioning of the innovation sys-
tem by improving firm capabilities, facilitating technology transfer and adoption, and
enhancing the enabling environment are germane.
Policy in these areas can be justified largely in terms of information asymmetries of
multiple types. First, firms don’t know what they don’t know. Self-evaluations of man-
agement quality at even the most basic level reveal that entrepreneurs are generally
wildly optimistic about their own abilities. The kinds of managerial extension pro-
grams that offer subsidized benchmarking and improvement plans help make such
self-evaluations more realistic. Second, weak information about the quality of private
sector services offered makes firms reluctant to contract them and hence support a
market for such services. There are important barriers to technology adoption for both
managers and workers. Financial constraints impede managers from covering the fixed
costs of acquiring the latest technologies, even when they are available in the countries
where their firms operate. Resistance to learning, adapting, and changing, and mis-
alignment of incentives within firms between employers and workers have been high-
lighted by the literature as important reasons for the lack of adoption and use of new
technologies.
From a policy perspective, establishing the right framework of economic incentives to
encourage firms to make those investments is crucial to increasing firm performance. This
centers the competition policy agenda as a core pillar of the productivity policy agenda.
The importance of competition policy has been widely recognized, although its
effectiveness with respect to trade reforms can be easily questioned. Inherent in the
promise of the first wave of structural reforms was the assumption that competi-
tive markets would emerge if the right regulatory framework were established and
122 Productivity Revisited
therefore consumers would benefit from the procompetitive effects of these
reforms. However, evidence has shown that product market competition has
decreased in several advanced economies, while the degree of product market con-
centration has remained stubbornly high in emerging ones (De Loecker and
Eeckhout 2018), raising the priority of product market competition policies in the
productivity agenda.
Experimental methods have the potential to test new instruments for both real or
digital markets, address market failures from a nonregulatory standpoint, and solve
key identification issues, such as the fact that entry and exit are also endogenous
responses to market conditions that may have independent effects. Busso and Galiani
(forthcoming), for example, analyze the effects of a randomized expansion of retail
firms serving beneficiaries of a cash transfer program in the Dominican Republic by
certifying more firms as providers for the program. Six months after the interven-
tion, product prices decreased by about 5 percent while service quality perceived by
consumers improved. However, Bergquist (2017) produced less expected results in
her analysis of the competitiveness of rural agricultural markets. She implemented
three different incentive experiments to induce traders to enter randomly selected
markets for the first time. Entry in this case did not enhance competition and had
negligible effects on prices, documenting a high degree of market power of interme-
diaries, with large implied losses to consumer welfare and market efficiency. Again,
understanding the underlying market structure seems essential to ensuring that poli-
cies have their predicted impact.
Scaling up demand. The issue of quality elides into a broader agenda of how the new
importance of demand highlighted in chapter 2 matters for firm growth. Here, addi-
tional policies may be considered. The findings that most firms enter with higher pro-
ductivity than incumbent firms and that most firm growth in the United States and a
large fraction of that in Chile, Colombia, Malaysia, and Mexico after entry is due to
increased demand suggest a range of programs focused exactly on creating and expand-
ing that demand. Policies to support firm growth should therefore focus on building
firms’ client base, mainly through innovative solutions that reduce buyer-seller trans-
action costs due to searching, matching, and informational frictions.
Examples of those policies include digital platform development or connection,
business intermediation, and links to global value chains. Reducing matching costs has
been highlighted as a major objective of export promotion agencies to facilitate access
to foreign markets (Lederman, Olarreaga, and Payton 2010). A recent intervention for
rug producers in the Arab Republic of Egypt—where a group of academics partnered
with a U.S. nongovernmental organization and an Egyptian intermediary to secure
export orders from foreign buyers through trade fairs and direct marketing channels—
shows that demand-side interventions can be a powerful tool to boost firm growth

Productivity Policies 123
(Atkin, Khandelwal, and Osman 2017). They help build a self- sustained customer base,
generate learning-by-exporting effects, increase product quality, and reduce produc-
tion costs. Business support services that help firms develop the necessary quality stan-
dards to get access to global value chains by supplying intermediate inputs to
multinational companies can also have an important effect, as can managerial consult-
ing services on marketing to develop brand recognition.
5. Creating Experimental Societies
Chapters 3 and 4 highlight that investments, either by ongoing firms to upgrade effi-
ciency or quality, or by newly entering firms, are fundamentally wagers under uncer-
tainty. Firms cannot know how much a new technology or marketing plan will increase
their profitability. New firms cannot know whether their new idea, or firm, or sector is
viable until they enter and then learn from experience. The finding of a risk-return
frontier in investments in quality, and the further finding that advanced economies
place big risky bets while less developed countries do not, suggest that societies need to
learn to quantify, tolerate, and manage risk to accelerate the process of productivity
catch-up. As also discussed in chapter 3, such risk or uncertainty can reduce the rapid-
ity with which firms make the investments needed to adjust to shocks. Fundamentally,
we need to create experimental societies in which individuals are encouraged to place
well-researched bets and reduce the penalties for failure.
Here again, both the environment and the human capital of the individuals who
populate it are central to facilitating the large-scale entry of firms that can bring ideas
from the frontier and test them out in the local context—a process that will lead to
many failures, but some major successes that drive growth. Chapter 3 shows that the
advanced economies appear to be more able to take on more risk and reap larger
growth rates. Increasing the willingness and ability of entrepreneurs to experiment,
while reducing the cost of experimentation, is thus critical to the strategy for long-term
productivity growth. In addition, the providers of inputs, such as financing, also need
high levels of actuarial capabilities to identify and gauge risk.
At the most basic level, there must also be mechanisms in the financial sector pre-
cisely to diversify risk of various types. It may be that the inability to diffuse risk is as
much a barrier to upgrading and innovation as credit restrictions per se. The finding
that financing innovation is difficult, especially for start-ups and young firms, is not
news, but sustainable solutions have been elusive, especially for developing countries.
Imperfect information about borrowers and difficulties monitoring their activities
have long been known to lead to credit rationing or costly borrowing.4 Innovation is
risky and produces both intangible assets that typically are not accepted as collateral to
obtain external funding and intangible assets that are easily “expropriated” by other
firms. Early stages of the innovation process are typically more difficult to finance
because both uncertainty and intangibility are high, while at the later stage much of the
124 Productivity Revisited
uncertainty may have been resolved and investments are focused on tangible assets.
Poorly designed regulation compounds these issues.5 On the other side, it is possible
that developing-country bankers lend short term and to safe customers because they
lack the capabilities to effectively evaluate new products.
Governments often try to support innovative start-ups and high-growth firms with
direct public support programs through such means as grants, royalties, and tax breaks.
However, public servants are often not the best qualified people to select innovative
projects to be financed. The longer-term goal is the development of a self-sustaining
risk capital ecosystem. This requires supporting framework conditions that permit the
financing of seed and venture funds and the accumulation of managerial expertise to
staff them, as well as the development of a pipeline of high-quality projects supported
by investment readiness programs.6
More generally, the process of experimentation with new processes and new prod-
ucts is affected by the standard appropriability externalities. Because knowledge is eas-
ily used by others, an innovator is likely to be copied and lose some of the potential
rents. The social benefit is higher than the private benefit; thus, there will be under-
investment in experimentation. Hence government subsidies, tax write-offs, and pat-
ents are long-accepted remedial policies. The same logic supports public foundations
that search out and test for the viability of new practices or products and then dissemi-
nate them through such means as agricultural extension programs, public research
institutes, and university departments specializing in basic research. A long-standing
literature stresses the coordination failures among such nonmarket institutions in
National Innovation Systems (see, among others, Freeman 1995; Lundvall 1992; Nelson
1993; Soete, Verspagen, and Weel 2010; and Edquist 2006) and stresses failures sur-
rounding the acquisition of firm capabilities.
However, it is not always clear that such common market failures are the most criti-
cal barrier to experimentation. Numerous countries, for example, have established sub-
sidies or tax write-offs for R&D expenditure with little to show for it, despite the success
of these policies elsewhere. But the key failure may not be in the accumulation of inno-
vation (knowledge capital) per se, but rather there may be a more pressing problem in
accumulation more generally—in capital markets, barriers to entry and exit, labor
restrictions, or especially management quality, as discussed earlier (see Maloney and
Rodriguez Clare 2007 and Cirera and Maloney 2017). Likewise, the process of self-
discovery highlighted by Hausmann and Rodrik (2003) may be hampered not by mar-
ket failures, but by a shortage of capable discoverers and may reflect the inability of
local entrepreneurs to recognize productive opportunities in the first place.
The insights of second-wave analysis have profound implications for policy. Box 5.1
explores how the fundamental process of structural transformation can be rethought
in terms of these insights.

Productivity Policies 125
BOX 5.1
Structural Transformation: What Are the Conclusions for Policy?
Moving from evidence to effective policy demands keeping all three components of total factor productivity (reallocation, innovation, and selection) in mind. This is particularly true for policies to promote structural transformation.
McMillan and Rodrik (2011) and McMillan, Rodrik, and Verduzco-Gallo (2014) offer some sug-gestive causal channels driving structural transformation. Slow structural transformation can be seen as reflecting barriers to reallocation; McMillan and Rodrik (2014) identify rigid labor markets as a possible candidate. To the degree that such rigidities imply segmentation, the available mea-sures of average productivity are not adequate to confirm it on conceptual grounds. As they note, efficiency requires calculation of marginal product, but data are readily available only for average labor productivity. They also correctly note that different production technologies (among other factors) across sectors can lead to different corresponding average products across sectors (see Rogerson 2017), even if marginal products are equalized. If agriculture is more labor intensive than manufacturing, its average productivity will be lower, even if no distortions exist.
This gap between concept and measurement may be more important than McMillan and Rodrik acknowledge. Figure B5.1.1 presents Rogerson’s calculations for this volume, showing the average productivity for manufacturing relative to agriculture over time. If removing barriers to movement were facilitating structural transformation, average productivities would be expected to converge if, in fact, they are a good proxy for marginal products. However, as figure B5.1.1 shows, they do not. This result is more consistent with differing production technologies driving
FIGURE B5.1.1 Average Productivity Gaps between Manufacturing and Agriculture Persist over Time, Suggesting That Segmenting Labor Market Distortions Are Probably Not the Main Barrier to Structural Transformation
(Log sectoral productivity relative to agriculture, by country)
Source: Rogerson 2017, for this volume.
2.5
2.0
1.5
1.0
0.5
0
China
India
Indon
esia
Japa
n
Malaysi
a
Philip
pines
Rep.
of Ko
rea
Taiwan
, Chin
a
Thaila
nd
Unite
d Stat
es
1950s 1960s 1970s 1980s 1990s 2000s
(Box continues on the following page.)
126 Productivity Revisited
The National Productivity System
Figure 5.2 seeks to bring together several of these findings in a graphical way. The figure
highlights, first, that the firm is the critical player in the system, and its decisions on
accumulating capital, labor, or knowledge need to be jointly considered. Second, the
figure broadly distinguishes the demand for factors from the supply to highlight that
without firm demand, supply-side policies are pushing on strings. Clearly, the division
between the two sets of variables is not so sharp, particularly in the knowledge area, and
the bidirectional arrows crudely capture the feedback relationship between firms and
knowledge institutions.
The first group of variables on the demand side comprises the overall set of incen-
tives to invest and accumulate. This includes the macro context: in particular, the vola-
tility of sales, the competitive structure, and the trade regime that determine whether
firms seek to enter or grow. In addition, as chapter 2 stresses, demand-related initiatives
such as the development or connection to digital platforms that reduce searching,
average productivity gaps than with distortion-driven segmentation. Furthermore, as a forthcom-ing volume on agricultural productivity will discuss, the measurement of agricultural productivity is difficult; hence permanent gaps between measurement and reality are likely.
One possible takeaway is that removing distortions is not the major driver of transformation. Rather, the question that needs to be asked is, Who or what creates the underlying opportunities in new sectors that drive structural transformation? As chapters 2 and 4 discuss, and as the Melitz decompositions in chapter 1 suggest, weaknesses in the process of upgrading existing firms or in entrepreneurship may merit as much focus in explaining the pace of structural transformation as distortions.
In fact, both elements may be salient at different moments in the development process. Chile, for instance, was Latin America’s growth miracle from 1986 to 2006. Much of Chile’s productivity growth is thought to have arisen from the unwinding of the vast distortions accumulated over the previous 50 years. However, productivity has leveled off over the last 15 years, turning attention to the weaknesses along the other two dimensions. Figure B5.1.1 similarly suggests that the impor-tance of reallocation diminishes with level of income, accounting for very little in more advanced economies. In the United States, structural transformation never accounts for more than 0.1 percent of growth, while in Japan; Taiwan, China; and the Republic of Korea, the contribution is low or nega-tive, despite having been important during their miracle periods. Such a negative contribution may be optimal, for example, if demand increases for nontraded services that require shifting work away from more productive manufacturing. The increasing role of lower productivity growth in services as societies get richer is known as the Baumol Effect: it may be the best for society, but it slows growth. More generally, the findings suggest that the importance of the between-sector reallocations versus the within-sector improvements depends on the stage of development.
BOX 5.1
Structural Transformation: What Are the Conclusions for Policy? (continued)

Productivity Policies 127
matching, and informational transaction costs; the establishment of domestic or inter-
national commercial networks; or even procurement policies are also included here.
The second set of variables captures firm capabilities: the core managerial compe-
tencies, production systems, and higher-end capabilities for technological development
or absorption and innovation that enable a firm to recognize an opportunity and
mobilize itself to take advantage of it. Of particular salience is what chapter 4 calls actu-
arial capabilities, the ability to quantify and manage the risk intrinsic to any project.
As discussed throughout the volume, development is, by nature, a process of placing a
series of bets on opportunities with uncertain returns. Entrepreneurs need to develop
the capabilities to quantify and manage the associated risk.
The third set of variables are those characteristics discussed in chapter 4 that relate
to the process of entrepreneurship: drive or grit, risk tolerance, and openness to recog-
nizing new opportunities.
There are clear interactions between the three sets of variables. As chapter 2 docu-
ments, the ability to participate in a large international market increases the likely ben-
efits of upgrading and innovating and informs about entrepreneurial opportunities,
while better capabilities permit established and new firms to take advantage of these
markets. Higher macro volatility will lead to less firm entry and upgrading, while low
growth may lead governments to experiment with unsustainable macro policies.
On the supply side are all the sources of knowledge that support firm demand. On the
physical capital side are efficient domestic industries and easy access to imported
FIGURE 5.2 The National Productivity System
Government oversight and resolution of market failures
Knowledge (A)
SUPPLY
The firm
DEMANDACCUMULATION/ALLOCATION
Human capital (H)
Physical capital (K)
Physical capital– Upstream industry– Imports– Foreign direct investment
Human capital– Education and training system– Programs to support entrepreneurial skills
Knowledge capital– Support to firm capability upgrading and entrepreneurship– Investment readiness programs– Quality and standards programs– Domestic science and technology system– International innovation system
Incentives to invest and accumulate
– Volatility of sales– Competitive structure– Trade regime and international networks– Support to expand demand
– Macro context
Firm capabilities– Core competencies (management)– Production and technological systems– Actuarial capabilities
Entrepreneurial characteristics– Drive (Grit)– Risk tolerance– Ability to recognize opportunities
Barriers to accumulation/reallocationAbsent finance and risk-diffusion marketsEntry/exit barriersBusiness/regulatory climateCost of failure (culture, bankruptcy law)
Barriers to knowledge accumulation(technology adoption and invention)
Rigidities (labor, etc.)Seed/venture capitalInnovation and self-discovery Externalities

128 Productivity Revisited
intermediate goods. On the human capital side is the entire set of institutions ranging from
primary school to technical institutes to universities, as well as whatever programs can teach
the skills that feed into higher worker, managerial, and entrepreneurial efficacy.
The second set are institutions that support firms, including the kinds of productiv-
ity and quality extension services found around the world, services to disseminate new
technologies or best practices, and higher-end consulting services in specialized topics
as well as more advanced skills for risk evaluation. The science and technology and
quality systems (see box 5.2) specifically facilitate technological transfer, adapt existing
knowledge, or generate new knowledge for the use of firms. Finally, the international
innovation system generates most new knowledge; therefore, being firmly plugged in
along manifold dimensions is key for technological transfer. Because many of these
institutions are nonmarket (government research institutes, universities, and so on),
BOX 5.2
The Role of a Modern and Efficient Quality Infrastructure Ecosystem in Enhancing Competitiveness and Increasing Productivity
Over the long run, raising product quality may increase a firm’s profitability and its demand for better skilled workers. Hence quality-upgrading programs have been commonplace in advanced economies such as the United States and Japan. Furthermore, as countries develop or become more integrated with the international market, firms that serve consumers are looking for a higher quality of goods and services. At a very practical level, a firm’s ability to demonstrate quality and safety of goods and services, and to comply with international standards, is often necessary to enter desirable export markets. Demonstrating such compliance requires a sound quality infra-structure (QI) ecosystem.
This system comprises the organizations (public and private) together with the policies, rele-vant legal and regulatory framework, and practices needed to support and enhance the quality, safety, and environmental soundness of goods, services, and processes. It relies on scientific measurement (metrology), standardization, accreditation, and conformity assessment.
For governments, a QI ecosystem serves as a mechanism for supporting relevant trade and indus-trial policies and for ensuring enforcement of mandatory technical regulations. A recent study from the United Kingdom argues that more than €6.1 billion of U.K. exports per year can be attributed to meeting standards (Hogan, Sheehny, and Jayasuriya 2015). For businesses, a modern and efficient QI ecosystem helps firms adopt new technologies and innovation in their production processes. A survey of British companies found that more than 60 percent of product and process innovators used stan-dards as a source of information for innovation, while 37.4 percent of the productivity growth can also be attributed to use of standards. For consumers, a QI ecosystem ensures public health and safety and environmental and consumer protection. Technical regulations play an important role in this regard, together with effective enforcement mechanisms such as market surveillance. These mecha-nisms ensure that fraudulent and counterfeit products are not traded in the marketplace.
The World Bank Group and the National Metrology Institute of Germany have partnered to develop the first comprehensive QI diagnostic and reform toolkit (World Bank, forthcoming). It is designed to help development partners and country governments analyze the QI ecosystem and
(Box continues on the following page.)

Productivity Policies 129
put together a coherent offering to support QI reforms and capacity development. The focus of such reforms could be any one or a combination of the following:
■ Improve the legal and institutional framework for efficient and effective QI ■ Enhance trade opportunities by removing unnecessary nontariff barriers and technical bar-
riers to trade through harmonization of technical regulations and mutual recognition of conformity assessments
■ Better integrate into global value chains ■ Enhance the overall quality of products and services ■ Encourage innovative products to enter high value added markets ■ Increase productivity and efficient use of scarce resources ■ Provide for better consumer protection
The analysis of QI ecosystems is done across four pillars: (1) legal and institutional framework, (2) administration and infrastructure, (3) service delivery and technical competency, and (4) exter-nal relations and recognition. Each pillar scores the level of QI development on a number of rele-vant indicators. The toolkit is an important analytical tool that not only identifies gaps in national QI systems but facilitates benchmarking to the best international practices. It also complements firm-level analyses of productivity and analysis of trade dynamics to identify constraints and iden-tify opportunities to increase the export competitiveness of firms.
BOX 5.2
The Role of a Modern and Efficient Quality Infrastructure Ecosystem in Enhancing Competitiveness and Increasing Productivity (continued)
the question about what mechanisms and incentives link them to one another is prom-
inent in the National Innovation System literature.7
The upper part of the center panel of figure 5.2 captures barriers to accumulation of
all factors: absent finance and risk mitigation markets, entry and exit barriers, poor
regulatory measures, and for start-ups, the cost of failure and the burden of bank-
ruptcy, as discussed in chapter 4. It is essential to make the point, highlighted in chapter
2, that all types of barriers to accumulation and reallocation affect within-firm upgrad-
ing and innovation as well: first, because physical and human capital are complements
to knowledge; and second, because the accumulation of knowledge capital is subject to
all the same accumulation barriers as physical capital (capital markets, business cli-
mate, ability to diversify risk, and so on).
Clearly, innovation-specific issues are still important, and they are captured in the
next group down. For instance, there may be an absence of seed or venture capital that
would enable new innovative start-ups to emerge and existing firms to place new inno-
vative bets. In addition, there may be specific restrictions on the workforce restructur-
ing required for the adoption of new technologies (see Levy 2018 for Mexico). Finally,
there are all the standard information-related market failures discussed earlier: those
related to the appropriation of knowledge that have given rise to R&D subsidies and tax
incentives and to intellectual property rights systems.
130 Productivity Revisited
Obviously, this figure and discussion merely sketch the interactions that theory and
the empirics suggest are potentially important to increasing productivity. Furthermore
the importance or configuration may vary across sectors and some types of firms, such
as microenterprises, which have little interaction within this formal system at all
(see box 5.3). However, the challenge for an individual country, as outlined in the intro-
duction, is to identify where the most binding distortions or constraints lie. The role for
government is discussed next.
Government Productivity and Policy Making
As shown at the top of figure 5.2, government has a role in overseeing the National
Productivity System (NPS) and resolving a broad set of potential market failures or
distortions. Like firms, government makes policy under uncertainty: in this case, about
which market failures are really the most critical to redress or which distortions to
reduce, and what the likely impact of any corresponding policy will be. Also, like firms,
governments and government agencies differ in their productivity and quality of out-
put. This “output” can be measured along at least four dimensions: (1) rationale and
design of policy, (2) efficacy of implementation, (3) coherence of policies across the
actors in the NPS, and (4) policy consistency and predictability over time.8
Chapter 2 establishes that firms in poorer countries tend to have lower efficiency and
produce lower-quality products, both arising from low investments in firm capabilities
and innovation. Figure 5.3 confirms that, unsurprisingly, the same is true of public orga-
nizations as well. The measure of bureaucratic effectiveness in the figure captures percep-
tions of the quality of public services, the quality of the civil service and the degree of its
independence from political pressures, the quality of policy formulation and implemen-
tation, and the credibility of the government’s commitment to such policies. As shown in
figure 5.3, bureaucratic effectiveness declines with GDP.
Hence governance capabilities diminish with distance from the frontier precisely as
the number of missing markets and market failures become larger.9 Thus, on the one
hand, given finite resources, including the government’s attention span (or bandwidth)
and capacity, governments need to identify some rough ranking of the policy space—
based on the likelihood that a distortion or market failure is important and the prob-
ability that it can be redressed successfully—to prioritize productivity policies. On the
other hand, increasingly the productivity of government allows government both to
take on more tasks and to do them better and in more coordinated ways and thus
becomes a critical element of the productivity agenda. This chapter does not go into
detail on the vast topic of governance reform: a substantial literature exists, and ongo-
ing work by the World Bank Bureaucracy Lab and others lays out the contours of the
current debates. But several themes emerging from the analysis of the private sector are
salient for the public sector, as well.

Productivity Policies 131
BOX 5.3
How Do Microenterprises and Informal Firms Unplugged from the National Productivity System Affect Overall Productivity?
In many low-income countries, self-employment can reach 80 percent of the workforce. This per-centage decreases linearly with development. The self-employed and microenterprises that employ a handful of additional workers are usually of low productivity, are not covered by labor protections, lack access to finance, and are disconnected from large firms. They are unplugged from the National Productivity System. How do we think about their impact on overall productivity?
Barriers to reallocation. One view is that distortions are preventing the transfer of these workers and associated capital to more productive, larger firms. Levy (2018), for instance, argues that in Mexico, the fact that large firms need to pay health insurance, taxes, and the like offers an implicit subsidy to microenterprises and leads to an excessive investment in low-productivity projects. Relatedly, very high minimum wages may prevent workers from transiting to more productive sectors. This is probably an overstatement. Falco et al. (2015) and Perry et al. (2007) note that in Brazil, Ghana, and Mexico, self-employment is for the most part a choice—often an option out of formal employment—not a survival modality. Even without seg-mented labor markets, however, the distortions highlighted by Levy can lead to significant misallocation, even if workers consider themselves indifferent between the two sectors. Hence, designing social protection legislation that is not de facto a subsidy to less productive firms becomes an important productivity policy.
Barriers to within-firm growth. Firms not registered with authorities often lack access to capi-tal, risk-mitigating mechanisms, or new technology. Hence policies to facilitate formalization are often considered a key to productivity growth within the sector. It is important, however, to also think of formalization as a choice variable and that firms with little desire to expand may not see the benefits of interaction with government institutions.
Put differently, low modern sector productivity combined with a large mass of poorly edu-cated workers makes the opportunity cost for very poor entrepreneurs very low: they will not grow, no matter how much access to finance they have. This said, recent randomized control trials (Bruhn, Karlan, and Schoar 2018; Anderson, Chandy, and Zia 2017; Brooks, Donovan, and Johnson 2017; McKenzie and Puerto 2017) suggest that microentrepreneurs often do have the potential to improve their managerial quality and strengthen performance and hence raise the incomes of the generally poorer workers. Over the long run, however, it is unlikely that many Steve Jobs or Bill Gates will emerge from a sector of extremely poorly educated workers.
In the end, it is not possible to say whether the association with high employment shares of microenterprises is a cause or merely a result of low national incomes. However, research to date suggests that policy proceed on three fronts:
1. Improve the productivity in the modern sector that is the focus of this volume, raising the opportunity cost of opening or continuing low-productivity microenterprises
2. Eliminate the implicit subsidies toward unproductive firms in often poorly designed social legislation and barriers to worker mobility (such as minimum wages)
3. Improve the quality of entrepreneurship and facilitate access of microenterprises to the formal National Productivity System
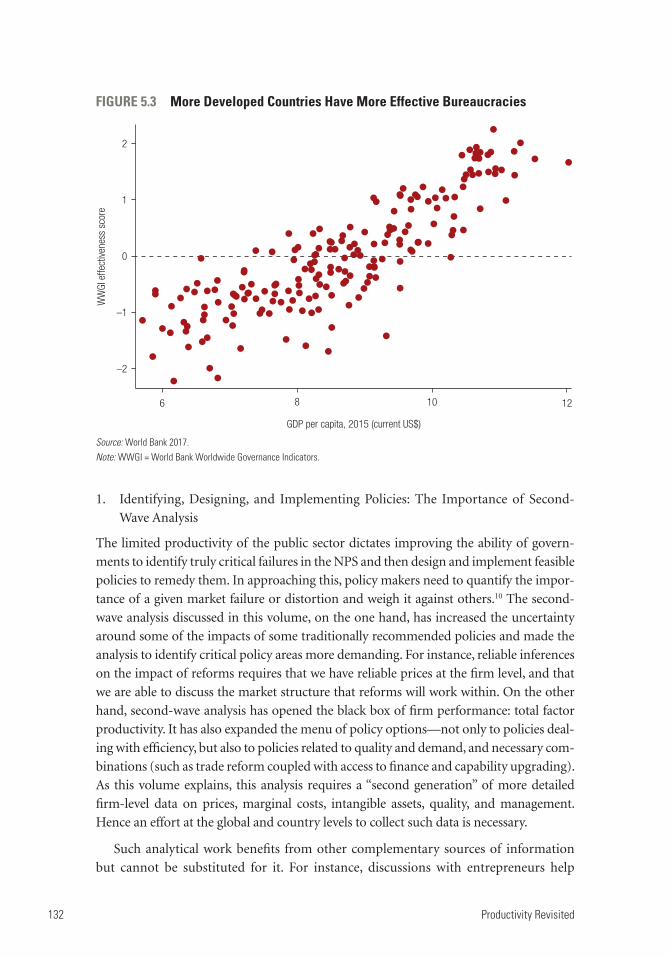
132 Productivity Revisited
1. Identifying, Designing, and Implementing Policies: The Importance of Second-
Wave Analysis
The limited productivity of the public sector dictates improving the ability of govern-
ments to identify truly critical failures in the NPS and then design and implement feasible
policies to remedy them. In approaching this, policy makers need to quantify the impor-
tance of a given market failure or distortion and weigh it against others.10 The second-
wave analysis discussed in this volume, on the one hand, has increased the uncertainty
around some of the impacts of some traditionally recommended policies and made the
analysis to identify critical policy areas more demanding. For instance, reliable inferences
on the impact of reforms requires that we have reliable prices at the firm level, and that
we are able to discuss the market structure that reforms will work within. On the other
hand, second-wave analysis has opened the black box of firm performance: total factor
productivity. It has also expanded the menu of policy options—not only to policies deal-
ing with efficiency, but also to policies related to quality and demand, and necessary com-
binations (such as trade reform coupled with access to finance and capability upgrading).
As this volume explains, this analysis requires a “second generation” of more detailed
firm-level data on prices, marginal costs, intangible assets, quality, and management.
Hence an effort at the global and country levels to collect such data is necessary.
Such analytical work benefits from other complementary sources of information
but cannot be substituted for it. For instance, discussions with entrepreneurs help
FIGURE 5.3 More Developed Countries Have More Effective Bureaucracies
Source: World Bank 2017.Note: WWGI = World Bank Worldwide Governance Indicators.
2
1
0
–1
–2
6 8 10
GDP per capita, 2015 (current US$)
WW
GI e
ffect
ivene
ss s
core
12

Productivity Policies 133
suggest areas for investigation, validate findings, and give them context,11 although this
source of information is not without caveats. We know that firms and industries with
weak management often don’t know what they don’t know and hence will offer incor-
rect self-diagnostics. Industry associations may not be widespread enough to distill
quality information in a representative way. Finally, large business associations may be
involved in quasi-corporatist relationships with government in which representatives
may be closely linked to political parties or families, for example, and their combined
objective may not necessarily be the growth rate of the economy. In this case, concrete
evidence from solid evaluations helps: When reforms addressing market failures are
presented as “good things to do” because they are “removing inefficiencies,” govern-
ments often resist—partly because they are not sure of the potential benefits of imple-
menting politically sensitive reforms. But when presented with hard evidence of
concrete benefits in terms of employment, for example, it is easier to make the case for
the reforms (Devarajan 2012).
2. Strengthening Executive Capability
As with capability building in the private sector, there are long-standing efforts to
increase executive capabilities through traditional methods, such as personnel pol-
icies that attract the right talent, competitive salaries to retain that talent, promo-
tion policies that reward performance and technical skills, and good training
programs (IDB 2014). Here again, this volume does not summarize the emerging
literature, but draws a few parallels to the firm literature discussed in this and other
chapters.
First, output quality depends on inputs and, as shown in chapter 2, better inputs tend
to cost more. A randomized control trial by Dal Bó, Finan, and Rossi (2013) finds that
for Mexico’s public sector, higher wages attract not just more able workers but also those
who report having greater motivation for public service. This last characteristic echoes
the research on the role of psychological characteristics in entrepreneurship, and
expands the discussion of what makes government functionaries effective and optimizes
the design of incentives. As Dal Bó, Finan, and Rossi (2013) note, for instance, because
markets are not used to value outputs in the public sector, it is difficult to price outputs,
and hence financial remuneration such as bonuses may not work. Consistent with their
focus on public service–mindedness, Besley and Ghatak (2018), moving beyond a nar-
row notion of homo economicus, argue for better understanding how functionaries
derive their status and self-worth. They note that there is potential for incorporating the
pursuit of nonpecuniary goals in the make-up of incentives, talent selection, and orga-
nization design. One possibility is to put decision making in the hands of those who are
most motivated to behave honestly and help beneficiaries of those services. Consistent
with this, Rasul and Rogger (2018) in Nigeria show that when management practices are
more geared toward autonomy, project completion and quality improve and agency
problems are diminished.

134 Productivity Revisited
3. Developing Experimental Governments
As with the rest of society, in the absence of all the desired information on diagnostics
and policies, governments must also become more experimental in searching for the
appropriate solutions. Continuous well-designed evaluation of implemented policies,
both as rapid follow-up and sophisticated program evaluation, should be a central fea-
ture of every relevant government strategy to deal with a problem, because it both
reveals information on what interventions work and develops a performance and
accountability mindset.
Such experimentation requires nimbleness in adjusting to lessons learned and flex-
ibility in measuring performance, including a tolerance for failure. Policies to support
start-ups, for instance, will necessarily involve many “failed experiments.” However, the
need for governments to take risks and learn from mistakes runs immediately into
programs to reduce corruption: it is often difficult to distinguish between a functionary
who placed a reasonable bet and lost versus one who is incompetent or corrupt. Hence,
like the firms in chapter 2 who slowed their adjustments to shocks or investments as
they faced more sales uncertainty, the frequent combination of unclearly defined pub-
lic sector rules and draconian punishments can lead to paralysis where, far from taking
risks, functionaries do not want to be responsible for anything. As with changing social
attitudes toward failure and bankruptcy laws, reducing penalties for taking informed
risks is necessary. Khemani et al. (2016), in Making Politics Work for Development:
Harnessing Transparency and Citizen Engagement, focus on two forces—citizen engage-
ment and transparency—as strategies to reduce corruption that are less likely to create
such paralysis.
On the other side of the table, experimentation also needs to be balanced against the
fourth dimension of quality government: the consistency of policy across time that
firms face. Frequent policy reversals or priority changes with alternations of adminis-
trations add to firm uncertainty about the operational environment. Box 5.4 discusses
how regulatory uncertainty can depress investment and productivity growth and how
developing a well-designed regulatory system can reduce it.
Both consistency over time and the third dimension—coherence of policies across
the NPS—can be partly mitigated by overarching productivity councils that span
elected administrations, have legitimacy and weight within the public debate, and over-
see the overall functioning of the various parts of the system (see box 5.5). Many areas
of government are directly or indirectly involved in the design and execution of policies
to promote productivity. Trade tribunals, competition authorities, and individual
bureaus inside finance ministries and different line ministries (education, labor, agri-
culture, trade), for example, are incidentally or directly engaged in crafting policies to
promote productivity. However, the potential of these policies to translate into produc-
tivity growth is diminished by the lack of coordination between different government
agencies, which may have conflicting mandates and policy goals. Not only does each

Productivity Policies 135
bureau cater to a distinct constituency, but the fragmentation creates information silos
within each government area, limiting the quality and potential economic gains of a
productivity-enhancing policy. For example, a regulatory overhaul in a particular sec-
tor might not serve to increase productivity if the main productivity bottleneck for
firms is access to credit.
Increasingly, governments across both emerging market and advanced econo-
mies are addressing these problems through innovative institutional frameworks to
promote productivity. Although the shape of such institutions might vary depend-
ing on existing institutional arrangements, the most effective institutions share a
number of necessary characteristics, including “independent governance, transpar-
ent processes, solid research capacity, an economy-wide frame of reference and
linkages to policy-making mechanisms within government” (Banks 2015, 24). At a
BOX 5.4
Regulatory Uncertainty: A Barrier to Productivity Growth
As noted in chapters 1 and 2, the uncertainty firms face impedes investment and productivity growth, as well as how quickly they adjust to shocks. Research has recognized that increased risk arising from regulatory uncertainty can depress investment (World Bank 2018). Regulatory uncer-tainty can arise from unclear or inconsistent regulations; poor delivery of what could be robust regulations, including discretionary behavior by various players along the regulatory value chain; or both.
A good regulatory management and governance system—sometimes referred to as good regulatory practices—is critical for regulatory efficiency and predictability. In addition to good-quality regulations, this includes high-quality and effective regulatory institutions, timely public consultation, systematic assessment of impacts of new regulation, and regular “fit- for-purpose” checks of the regulatory stock, leading to reduced perceptions of risk, sustainable investments, and growth. The recent World Bank Global Investment Competitiveness Report, 2017−2018 (World Bank 2018), which surveyed executives in nearly 750 companies, found that the “legal and regulatory environment” was the second most important consideration of senior executives when making investment decisions, superseded only by “political stability and security.” They also iden-tified regulatory uncertainty as the second most important constraint to investment and growth.
Good regulatory practices are complementary to regulatory efficiency reforms. Research has found that countries with relatively good regulatory governance practices stand to gain more from efforts to streamline regulations and procedures affecting business than countries that embark only on reductions of regulatory costs and procedures. Scores on the World Bank’s Global Indicators for Regulatory Governance also show strong correlations between regulatory governance and many indexes for lower corruption and stronger rule of law.
The World Bank Group has, in recent years, developed an approach to improving regulatory management and governance and increasing regulatory predictability. A strong focus on institu-tions and regulatory delivery, user engagement and feedback, and strong interagency coordination are increasingly providing some evidence that regulatory predictability can reduce the perception of risk for investors and enhance innovation and investment.
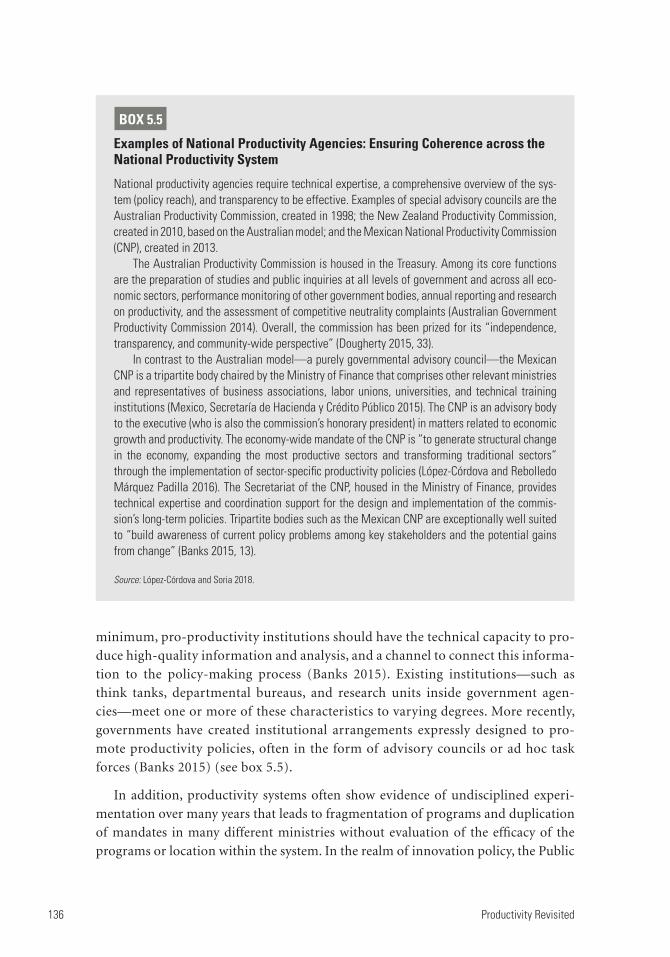
136 Productivity Revisited
minimum, pro-productivity institutions should have the technical capacity to pro-
duce high-quality information and analysis, and a channel to connect this informa-
tion to the policy-making process (Banks 2015). Existing institutions—such as
think tanks, departmental bureaus, and research units inside government agen-
cies—meet one or more of these characteristics to varying degrees. More recently,
governments have created institutional arrangements expressly designed to pro-
mote productivity policies, often in the form of advisory councils or ad hoc task
forces (Banks 2015) (see box 5.5).
In addition, productivity systems often show evidence of undisciplined experi-
mentation over many years that leads to fragmentation of programs and duplication
of mandates in many different ministries without evaluation of the efficacy of the
programs or location within the system. In the realm of innovation policy, the Public
BOX 5.5
Examples of National Productivity Agencies: Ensuring Coherence across the National Productivity System
National productivity agencies require technical expertise, a comprehensive overview of the sys-tem (policy reach), and transparency to be effective. Examples of special advisory councils are the Australian Productivity Commission, created in 1998; the New Zealand Productivity Commission, created in 2010, based on the Australian model; and the Mexican National Productivity Commission (CNP), created in 2013.
The Australian Productivity Commission is housed in the Treasury. Among its core functions are the preparation of studies and public inquiries at all levels of government and across all eco-nomic sectors, performance monitoring of other government bodies, annual reporting and research on productivity, and the assessment of competitive neutrality complaints (Australian Government Productivity Commission 2014). Overall, the commission has been prized for its “independence, transparency, and community-wide perspective” (Dougherty 2015, 33).
In contrast to the Australian model—a purely governmental advisory council—the Mexican CNP is a tripartite body chaired by the Ministry of Finance that comprises other relevant ministries and representatives of business associations, labor unions, universities, and technical training institutions (Mexico, Secretaría de Hacienda y Crédito Público 2015). The CNP is an advisory body to the executive (who is also the commission’s honorary president) in matters related to economic growth and productivity. The economy-wide mandate of the CNP is “to generate structural change in the economy, expanding the most productive sectors and transforming traditional sectors” through the implementation of sector-specific productivity policies (López-Córdova and Rebolledo Márquez Padilla 2016). The Secretariat of the CNP, housed in the Ministry of Finance, provides technical expertise and coordination support for the design and implementation of the commis-sion’s long-term policies. Tripartite bodies such as the Mexican CNP are exceptionally well suited to “build awareness of current policy problems among key stakeholders and the potential gains from change” (Banks 2015, 13).
Source: López-Córdova and Soria 2018.

Productivity Policies 137
Expenditure Reviews (PERs) for Science, Technology, and Innovation (STI) offer a
first step by generating a map of government programs and documenting the flow of
resources (Correa 2014). These can be enhanced to take a broader view of govern-
ment productivity programs that can incorporate all three margins of productivity
growth. The PERs for STI already cover much of the territory of within-firm upgrad-
ing (innovation) and start-ups. A Productivity Public Expenditure Review (P-PER)
would more explicitly integrate the regulatory angle: Not only would governments
understand what resources are being spent on, for instance, start-ups, but they could
also see what regulatory barriers to experimentation, or excessive costs of failure, are
working at cross-purposes. Not only would they see the implicit costs of tax write-
offs or subsidies for R&D in existing firms, but they could map the industry and
competitive structure that those firms face, or the degree of regulatory uncertainty in
the system. Annex 5A explores the potential for P-PERs in more detail.
4. Making Do with Limited Information: Integrating Industrial Policy in Productivity
Policy
Industry-specific externalities feature prominently in the growth and trade literatures.
Various studies suggest that positive externalities lead productivity to rise with the size
of the industry. They may arise for numerous reasons—local industry-level knowledge
spillovers, input-output links, and labor pooling, for instance—but they are not cap-
tured by the market price of a good, which is therefore underproduced. Historically,
these externalities have been thought to justify quite large interventions aimed at
removing trade distortions, and to justify subsidizing and directing credit. Often such
“vertical policies” are dismissed on the grounds that government will implement them
badly. However, government failures also affect more “horizontal” policies—witness
dysfunctional public education systems and corruption in infrastructure provision
around the world—yet governments continue to enter these areas.
The real problem is that such industry-related externalities have proved extremely
difficult to document and quantify, let alone permit a ranking of goods by their poten-
tial for productivity growth.12 The persistent empirical gaps on these points has led the
literature to develop shortcuts to identifying potentially good sectors. For instance,
natural resources are thought to have negative growth externalities; high technology
goods are thought to have more knowledge spillovers; “complex” products are thought
to stimulate capabilities that allow moving to more sophisticated industries—yet the
evidence on these assumptions is mixed at best (see Maloney and Nayyar, forthcoming,
for details; see also box 5.6).
However, the same overall questions laid out at the beginning of the chapter
apply here: Should policy focus on this market failure, or are there other distor-
tions, market failures, or considerations that are more important? The evidence
presented in chapter 2 suggests there may well be. First, even if we knew for sure

138 Productivity Revisited
that on average a particular good offered important positive externalities, the
tremendous heterogeneity in the way in which even very narrowly defined goods
are produced across countries, as documented in chapter 2, should give policy
makers pause. The vast differences in productivity and quality reflect differences
in the enabling environment, access to inputs, managerial capabilities, design
capacity, human resource organization, and marketing—and may correspond-
ingly lead to very different levels of spillovers to the rest of the economy.13 This
supports concerns that expanding a sector with potential positive externalities
does not necessarily imply that they automatically will occur (see Baldwin 1969;
Rodriguez Clare 2007; and Lederman and Maloney 2012). Box 5.6 argues that
presumably low-externality industries, such as mining, helped lay the foundation
for industrialization in the United States and Japan, while high-tech industries in
Mexico have not led to growth miracles.
These examples raise the fundamental question of whether the heterogeneity in
productivity and quality within products swamps any differences between goods in
BOX 5.6
Industrial or Productivity Policies? Natural Resource Blessings and High-Tech Disappointments
Particular goods are often thought to have externalities, such as learning spillovers, that enhance overall productivity beyond what their price would reflect and justify industry-specific support in what can be called “industrial policies.” However, the vast heterogeneity of development experi-ences around specific goods suggests that the focus should instead be on productivity policies of the kinds described in this volume. To cite two examples:
Extractive natural resource industries are often thought of as having few or even negative externalities, yet, at the beginning of the twentieth century, copper mining in the United States led to a knowledge network in chemistry and metallurgy that laid the foundations for subsequent diversification and industrialization. Japan was the second largest exporter of copper in the mid-nineteenth century, and two of the six dominant industrial conglomerates (zaibatsu)—Furukawa and Sumitomo—started as copper extraction companies before becoming prominent in computers (Fujitsu) and manufacturing and banking (Sumitomo). At the same time, the largest exporter of copper, Chile, saw its industry nearly die by 1900, as was the case with indigenous mining throughout Latin America. Copper is a highly homogeneous product, yet the development out-comes were vastly different.
Similarly, electronics are thought to have strong learning externalities. Both Mexico and the Republic of Korea began assembling electronics in the early 1980s, yet only Korea has produced a truly indigenous electronic device in the Galaxy and there is no Mexican Samsung.
Both examples suggest the importance of a deliberate focus on raising firm and sectoral pro-ductivity and quality performance in any sector, and that this focus on the “how” may be more important than the “what” that is produced.
Source: Lederman and Maloney 2012.
Productivity Policies 139
terms of development impact: that is, whether how a good is produced is poten-
tially more important than what is produced (see Lederman and Maloney 2012).
This volume strongly suggests that the overall framework for productivity growth
is a necessary complement to sectoral policies: attention probably should be
focused more on the market failures and distortions attending more horizontal
considerations such as education, managerial quality, institutions, or entrepre-
neurship, the overall innovation system, and the competitive environment than the
production basket itself.
Concluding Remarks
Productivity has again moved to center stage in the debates surrounding two growth-
related puzzles: the slowdown in global economic dynamism in the midst of spectacu-
lar technological advances and the frustratingly slow catch-up of developing countries
to the technological frontier. The tremendous effort behind recent analytical advances
dedicated to understanding these puzzles and raising productivity across the globe sug-
gests that Ibn Khaldun’s early appreciation of productivity’s centrality to societal prog-
ress is widely shared. And in the same way that his Muquddimah shifted paradigms of
social organization in its time, the literature grouped here as “second wave” has impor-
tantly shifted the approach to pivotal productivity issues. This volume pulls together
these insights and, using new data sets from multiple countries, extends the analysis
and grounds it in the developing-country reality.
This last chapter has attempted to summarize some of the lessons emerging from
these new approaches and offer guidance for policy. In the first instance, from a purely
empirical point of view, it flags that many existing diagnostics and analytical approaches
need to be reconsidered. This includes, in particular, using dispersion as a measure of
economic distortions, but extends to a long list of earlier studies exploring the impact
of specific interventions on productivity. Central to the latter point is the need to treat
market power and productivity analysis in an integrated framework. Furthermore,
recent work suggests that exploring the heterogeneity across entrepreneurs and manag-
ers is essential to gaining a better understanding of both the determinants of entry of
new firms and upgrading among incumbents.
The chapter then stresses the need to approach productivity policy in an integrated
way that encompasses all three margins of productivity: the between margin (or real-
location margin), the within margin (or firm-upgrading margin), and the selection
margin (or the entry and exit margin). Although the evidence suggests a rebalancing
away from the influential focus on static reallocation toward policies to improve
within-firm performance, the volume also stresses how the drivers of the individual
margins affect the other two in a dynamic sense. Barriers to reallocation may provide a
disincentive for firms to upgrade or new entrepreneurs to enter. And symmetrically,
factors restricting entry, such as inadequate human capital as broadly construed here,

140 Productivity Revisited
will blunt the force for reallocation over the long run. In looking for these drivers, the
volume stresses the need to focus both on the operating environment and on human
capital as critical and complementary.
Lifting the hood on the firm, chapter 2 stresses that standard measures of total
factor productivity conflate several factors—efficiency, quality, and market power—
but that, in fact, growth and jobs policies are interested in more than just efficiency.
The average quality of goods rises with development, reflecting the accumulation of
many of the same firm capabilities driving efficiency, but also, like efficiency, boost-
ing value added and generating better-quality jobs. Furthermore, for several coun-
tries, the analysis confirms that much of firm growth is, in fact, driven by expanding
demand rather than increased efficiency. Again, many policies that are important for
promoting efficiency remain relevant, but the analysis suggests a shift toward policies
focusing on establishment of networks, matching suppliers and clients, connecting
firms to global value chains to expand demand, enlarging a firm’s customer base by
eliminating search and transaction costs, and matching frictions through the devel-
opment of digital platforms and connections and business skills focused on develop-
ing a client base.
Finally, increasing productivity requires the development of experimental
societies. Fundamentally, entrepreneurship is a process of experimentation: growth
occurs by entrepreneurs placing informed bets. Experimental societies require both
an operating environment that encourages and facilitates the mitigation of risk and
entrepreneurs who are capable of quantifying and managing it. It also requires a
greater tolerance of setbacks and failure, and an understanding that dispersion in
total factor productivity measures will be greater, not less, given that the outcomes of
investments in efficiency and quality are, by nature, uncertain. The lack of such
experimental arrangements is one answer to the entrepreneurial paradox: that despite
the huge potential gains to be reaped from moving to the technology levels of
advanced economies, relatively few entrepreneurs emerge in follower countries who
can take advantage of such opportunities.
Together, these various lessons can be broadly captured in the notion of a National
Productivity System that highlights the complementarity of a variety of types of human
capital and a broad range of critical markets and elements in the operating system.
Government also has a role to play in overseeing the overall system, remedying market
failures, and removing distortions. Hence, the productivity of government in designing
well-founded, well-executed, coherent, and persistent policies becomes a central consid-
eration in overall productivity policy. As with firms, developing-country governments
have more limited capabilities at the same time that the market failures and distortions
they face are more acute; hence, getting inference right is critical to prioritizing produc-
tivity policies. The lessons of second-wave analysis, and a more experimental approach
on the part of government, thus become critical elements in this process.

Productivity Policies 141
This said, though the volume has sought to distill some key emerging messages, to
date, the impact of the new analysis has been less to definitively answer central ques-
tions in productivity growth than to reopen many debates and set out the broad out-
lines of this ambitious analytical and policy agenda going forward. Settling those
debates will require greater investment in industrial surveys that collect not only firm-
level prices, but also measures of quality, marginal costs, investments in intangible
assets, and technology and managerial capabilities across all sectors of the economy,
including services. Similarly, the incipient efforts to understand the drivers of produc-
tive entrepreneurship will need to be strengthened.
“The Phenomenon of Weightlessness,” as depicted by Remedios Varo on the
front cover, metaphorically captures the aspirations of this volume. Mankind is by
nature bound by gravity and constrained by resources. The miracle of productivity
growth is that over two centuries, it has helped lift welfare to levels unimaginable
to our ancestors, using the same resources available to them. Continuing this trend
is vital in the final push to end global poverty and create fulfilling and challenging
jobs for all.
Annex 5A. Policy Coherence and Effectiveness Supporting Productivity Growth: A Proposal for World Bank Productivity Public Expenditure Reviews
Managing the breadth and complexities of policies and regulations with the goal of
increasing productivity demands strong processes and capabilities in government.
Three areas are key: a good combination of policies to provide incentives for and
support productivity growth and coordination across agencies and ministries,
effective policies that use robust policy design and implementation, and smart reg-
ulatory reform.
The World Bank could address these issues with Productivity Public Expenditure
Reviews (P-PERs). Such reviews would attempt to identify the distortions and regula-
tions that are harmful to productivity growth and help countries improve the quality
and composition of existing productivity policies. The methodology would build on
the existing Public Expenditure Review (PER) on Science, Technology, and Innovation
(STI)—an integrated and holistic evaluation of STI policies by the World Bank—and
would expand it to cover elements that are specific to productivity policies. The pro-
posed methodology is based on analyzing different stages of the logical framework of
public policies: the quality of the policy inputs, the quality of design and implementa-
tion, and the efficiency and effectiveness in achieving the policy goals. The proposed
country-level P-PER would proceed in five stages:
1. Diagnostic phase. This stage would include understanding the evolution of
productivity over time, the sources of productivity growth, and the extent of

142 Productivity Revisited
competition in good markets and misallocation in factor markets in the
country. It would involve analytical work to identify the main policy priorities
or demand for productivity policies.
2. General evaluation of the quality and coherence of the policy mix. Based on the
findings of the diagnostic phase and analysis of the existing institutional
framework, this stage would evaluate whether existing policies are oriented
toward supporting productivity policies, identifying unnecessary overlaps,
and finding gaps in terms of public support and inconsistencies in the
objective of productivity growth. This stage would examine the portfolio of
policies to support the private sector, including innovation policies, export
policies, and sector policies. It would assess the coherence of these policies
with the priorities identified in stage 1, as well as with general productivity
objectives.
3. Evaluation of the quality of design, implementation, and governance (functional
analysis) of existing instruments based on good practices. This stage would
evaluate whether policy design is based on addressing documented market
failures, whether the proposed solutions instruments are designed using
appropriate policy instruments, and whether solid monitoring and evaluation
frameworks are in place. It would also evaluate whether implementation used
good management practices in the public sector. It would assess the extent of
effective coordination mechanisms in implementing such policies, given the
difficulties in coordinating effective policies and regulatory reform.
4. Evaluation of the efficiency of existing instruments. This stage would examine the
ability of existing instruments to produce the expected outputs with reasonable
levels of resources and seek to understand the quality of services that
beneficiaries of public policies are receiving.
5. Evaluation of overall execution of system. This final stage would focus on
documenting the impact of existing policies that support the productive sector
in achieving productivity objectives.
In addition to helping build the necessary capabilities for effective policy imple-
mentation, the P-PER would prioritize measures to support productivity policies and
identify priority areas for regulatory reform. The analysis would also offer suggestions
on how to improve coordination in productivity policies.14
Notes
1. For example, Adamopoulos et al. (2017) argue that distortionary policies in Chinese agriculture not only lead to misallocation, but also adversely affect the selection of farmers and productive units.
2. See http://live.worldbank.org/building-human-capital.
3. Sutton (1998) terms both types of investment “R&D” (research and development). On the man-agement side, based on the experience of large textile firms in India, Bloom et al. (2013) argue
Productivity Policies 143
that investments in managerial upgrading could pay for themselves in a year, yet firms do not undertake them. Bruhn, Karlan, and Schoar (2013) find the same for smaller firms in Mexico. As McKenzie and Woodruff (2013) argue, whether this is a question of information asymmetries, imperfect credit markets, or missing institutions to diversify risk is not clear.
4. Financial market failures also curtail incentives to innovate. Frequently, banks do not know the specific default risk of an individual innovator seeking to borrow funds, so they can price a loan based only on the average default risk. As a result, low-risk borrowers face higher interest rates than they would if there were perfect information and may choose not to seek a loan. In addition, banks cannot perfectly monitor the activities of the innovator after the loan has been approved. As a result, an innovator may be tempted to take on a riskier project than the one originally agreed to because in case of success the innovator gets all of the upside, while in case of failure the loss is capped.
5. Chava et al. (2013) find that banking deregulation facilitates greater risk taking and experimenta-tion by small firms.
6. See Cusolito, Dautovic, and McKenzie 2018 for a World Bank example in the western Balkans.
7. For a more detailed discussion of these and relevant policies, see Cirera and Maloney 2017.
8. See Cirera and Maloney 2017 for greater elaboration of these dimensions.
9. This section draws from Maloney and Nayyar, forthcoming.
10. Andrews, Pritchett, and Woolcock (2013, 2017) propose the approach of “Problem-Driven Iterative Adaption,” which combines experimentation with solutions to particular problems with iterative feedback, while engaging a broad set of actors to ensure that reforms are viable and relevant.
11. Rodrik (2004), for instance, refers to “public-private coordination councils,” which could seek out and gather information on investment ideas, achieve coordination among different state agencies, push for changes in regulation to eliminate unnecessary transaction costs, and generate a package of relevant financial incentives for new activities when needed.
12. This almost agnostic view is supported by Pack and Saagi (2006) and Harrison and Rodriguez-Clare (2010), who review much of the industrial policy literature per se.
13. The problem is compounded by the fact that as production becomes more fragmented and about half of global trade involves trade in intermediate inputs through global value chains, countries trade tasks, not goods. China does not export the high-tech iPhone but in fact exports low- to medium-skill assembly tasks worth 1–2 percent of the value added of the product. In fact, elec-tronics is one of the lowest value-added sectors in China (Koopman, Wang, and Wei 2008), and there are likely fewer knowledge spillovers that would arise from actually designing the iPhone. Hence, while the focus probably should be on externalities pertaining to tasks, the data available are on final goods.
14. The source for this annex is Cirera 2018.
References
Adamopoulos, T., L. Brandt, J. Leight, and D. Restuccia. 2017. “Misallocation, Selection and Productivity: A Quantitative Analysis with Panel Data from China.” NBER Working Paper 23039, National Bureau of Economic Research, Cambridge, MA.
Anderson, S. J., R. Chandy, and B. Husnain Zia. 2017. Pathways to Profits: Identifying Separate Channels of Business Growth through Business Training. Finance & PSD Impact Evaluation Note No. 41. Washington, DC: World Bank.
Andrews, M., L. Pritchett, and M. Woolcock 2013. “Escaping Capability Traps through Problem Driven Iterative Adaptation (PDIA).” World Development 51(C): 234−44.
———. 2017. Building State Capability: Evidence, Analysis. Oxford, U.K.: Oxford University Press.

144 Productivity Revisited
Atkin, D., A. K. Khandelwal, and A. Osman. 2017. “Exporting and Firm Performance: Evidence from a Randomized Experiment.” Quarterly Journal of Economics 132 (2): 551−615.
Australian Government Productivity Commission. 2014. “A Quick Guide to the Productivity Commission.” Australian Government Productivity Commission.
Baldwin. R. E. 1969. “The Case against Infant-Industry Tariff Protection.” Journal of Political Economy 77 (3): 295−305.
Banks, G. 2015. “Institutions to Promote Pro-productivity Policies: Logic and Lessons.” OECD Productivity Working Paper 2015-01, OECD Publishing, Paris.
Bergquist, L. F. 2017. “Pass-Through, Competition, and Entry in Agricultural Markets: Experimental Evidence from Kenya.” PEDL Research Paper, Department of Economics, University of California at Berkeley.
Besley, T., and M. Ghatak. 2018. “Solving Agency Problems: Intrinsic Motivation, Incentives, and Productivity.” Working paper, London School of Economics.
Bloom, N., B. Eifert, A. Mahajan, D. McKenzie, and J. Roberts. 2013. “Does Management Matter? Evidence from India.” Quarterly Journal of Economics 128: 1−51.
Brooks, W., K. Donovan, and T. R. Johnson. 2017. “Mentors or Teachers? Microenterprise Training in Kenya.” Unpublished, University of Notre Dame.
Bruhn, M., D. Karlan, and A. Schoar. 2013. “The Impact of Consulting Services on Small and Medium Enterprises: Evidence from a Randomized Trial in Mexico.” Policy Research Working Paper 6508, World Bank, Washington, DC.
———. 2018. “The Impact of Consulting Services on Small and Medium Enterprises: Evidence from a Randomized Trial in Mexico.” Journal of Political Economy 126 (2): 635−87.
Busso, M., and S. Galiani. Forthcoming. “The Causal Effect of Competition on Prices and Quality: Evidence from a Field Experiment.” American Economic Journal: Applied Economics.
Chava, S., A. Oettl, A. Subramanian, and K. Subramanian. 2013. “Banking Deregulation and Innovation.” Journal of Financial Economics 109 (3): 759–74.
Cirera, X. 2018. “Towards a Productivity Public Expenditure Review.” Background paper for Productivity Revisited, World Bank, Washington, DC.
Cirera, X., and W. F. Maloney. 2017. The Innovation Paradox: Developing-Country Capabilities and the Unrealized Promise of Technological Catch-Up. Washington, DC: World Bank.
Correa, Paulo. 2014. Public Expenditure Reviews in Science, Technology, and Innovation: A Guidance Note. Washington, DC: World Bank Group.
Cusolito, A. P., E. Dautovic, and D. McKenzie. 2018. “Can Government Intervention Make Firms More Investment-Ready? A Randomized Experiment in the Western Balkans.” Policy Research Working Paper 8541, World Bank, Washington, DC.
Dal Bó, E., F. Finan, and M. A. Rossi. 2013. “Strengthening State Capabilities: The Role of Financial Incentives in the Call to Public Service.” Quarterly Journal of Economics 128 (3): 1169−218.
De Loecker, J., and J. Eeckhout. 2018. “Global Market Power.” Working paper. http://www.janeeckhout .com/wp-content/uploads/Global.pdf.
Devarajan, S. 2012. “In Defense of Industrial Policy.” http://blogs.worldbank.org/africacan/in -defense-of-industrial-policy.
Dougherty, S. 2015. “Boosting Growth and Reducing Informality in Mexico.” OECD Economics Department Working Paper 1188, OECD Publishing, Paris.
Edquist, C. 2006. “Systems of Innovation: Perspectives and Challenges.” In The Oxford Handbook of Innovation, edited by J. Fagerberg and D. C. Mowery, 181–208. Oxford, U.K: Oxford University Press.

Productivity Policies 145
Falco, P., W. F. Maloney, B. Rijkers, and M. Sarrias. 2015. “Heterogeneity in Subjective Wellbeing: An Application to Occupational Allocation in Africa.” Journal of Economic Behavior and Organization 111 (March): 137−53.
Freeman, C. 1995. “The ‘National System of Innovation’ in Historical Perspective.” Cambridge Journal of Economics 19 (1): 5–24.
Harrison, A., and A. Rodríguez-Clare. 2010. “Trade, Foreign Investment, and Industrial Policy for Developing Countries.” In Handbook of Development Economics, Vol. 5, edited by D. Rodrik and M. R. Rosenzweig. Amsterdam: Elsevier B.V.
Hausmann, R., and D. Rodrik. 2003. “Economic Development as Self-Discovery.” Journal of Development Economics 72 (2): 603−33.
Hogan, O., C. Sheehny, and R. Jayasuriya. 2015. The Economic Contribution of Standards to the UK Economy. London: Centre for Economics Research and Business Research for the British Standards Institution.
IDB (Inter-American Development Bank). 2014. Rethinking Productive Development: Sound Policies and Institutions for Economic Transformation. New York: Palgrave Macmillan.
Khaldun, I. 1377. The Muqaddimah: An Introduction to History. Princeton, NJ: Princeton University Press. 2015 edition.
Khemani, S., E. Dal Bó, C. Ferraz, F. Finan, C. Stephenson, A. Odugbemi, D. Thapa, and S. Abrahams. 2016. Making Politics Work for Development: Harnessing Transparency and Citizen Engagement. Washington, DC: World Bank.
Koopman, R., Z. Wang, and S. J. Wei. 2008. “How Much of Chinese Exports Is Really Made in China? Assessing Domestic Value-Added When Processing Trade Is Pervasive.” NBER Working Paper 14109, National Bureau of Economic Research, Cambridge, MA.
Lederman, D., and W. F. Maloney. 2012. Does What You Export Matter? In Search of Empirical Guidance for Industrial Policies. Latin America Development Forum. Washington, DC: World Bank.
Lederman, D., M. Olarreaga, and L. Payton. 2010. “Export Promotion Agencies: What Works and What Doesn’t.” Journal of Development Economics 91 (2): 257−65.
Levy, S. 2018. Under-rewarded Efforts: The Elusive Quest for Prosperity in Mexico. Washington, DC: Inter-American Development Bank.
López Córdova, J. E., and J. Rebolledo Márquez Padilla. 2016. “Productivity in Mexico: Trends, Drivers and Institutional Framework.” International Productivity Monitor 30 (Spring): 28−42.
López Córdova, J. E., and A. Soria. 2018. “Institutional Arrangements to Boost Productivity Growth: An Overview.” Background paper for Productivity Revisited, World Bank, Washington, DC.
Lundvall, B-Å, ed. 1992. National Systems of Innovation: Towards a Theory of Innovation and Interactive Learning. London: Pinter.
Maloney, W. F., and G. Nayyar. Forthcoming. “Industrial Policy, Information, and Government Capacity.” World Bank Research Observer.
Maloney, W. F., and A. Rodriguez Clare. 2007. “Innovation Shortfalls.” Review of Development Economics 11 (4): 665−84.
McKenzie, D., and S. Puerto. 2017. “Growing Markets through Business Training for Female Entrepreneurs: A Market-Level Randomized Experiment in Kenya.” Policy Research Working Paper 7993, World Bank, Washington, DC.
McKenzie, D., and C. Woodruff. 2013. “What Are We Learning from Business Training and Entrepreneurship Evaluations around the Developing World?” World Bank Research Observer 29 (1): 48−82.

146 Productivity Revisited
McMillan, M. S., and D. Rodrik. 2011. “Globalization, Structural Change and Productivity Growth.” NBER Working Paper 17143, National Bureau of Economic Research. Cambridge, MA.
McMillan, M. S., D. Rodrik, and Í. Verduzco-Gallo. 2014. “Globalization, Structural Change, and Productivity Growth, with an Update on Africa.” World Development 63: 11–32.
Mexico, Secretaría de Hacienda y Crédito Público. 2015. Comité Nacional de Productividad (National Productivity Commision). July 2. https://www.gob.mx/productividad/articulos/comite- nacional -de -productividad-cnp?idiom=es.
Nelson, Richard R., ed. 1993. National Innovation Systems: A Comparative Analysis. New York: Oxford University Press.
Pack, H., and K. Saggi. 2006. “Is There a Case for Industrial Policy? A Critical Survey.” World Bank Research Observer 21 (2): 267−97.
Perry, G. E., O. Arias, P. Fajnzylber, W. F. Maloney, A. Mason, and J. Saavedra-Chanduvi. 2007. Informality: Exit and Exclusion. World Bank Latin American and Caribbean Studies 40008. Washington, DC: World Bank.
Rasul, I., and D. Rogger. 2018. “Management of Bureaucrats and Public Service Delivery: Evidence from the Nigerian Civil Service.” Economic Journal 128 (608): 413−46.
Rodríguez-Clare, A. 2007. “Clusters and Comparative Advantage: Implications for Industrial Policy.” Journal of Development Economics 82 (1): 43–57.
Rodrik, D. 2004. “Industrial Policy for the Twenty-First Century.” John F. Kennedy School of Government, Harvard University, Cambridge, MA, September.
Rogerson, R. 2017. “Structural Transformation and Productivity Growth: Cause or Effect?” Background paper for Productivity Revisited, World Bank, Washington, DC.
Soete, L., B. Verspagen, and B. T. Weel. 2010. “Systems of Innovation.” In Handbook of the Economics of Innovation, edited by B. H. Hall and N. Rosenberg, 1159–80. Amsterdam: Elsevier.
Sutton, J. 1998. Technology and Market Structure. Cambridge, MA: MIT Press.
World Bank. 2017. “Worldwide Governance Indicators, 2016 Update.” World Bank, Washington, DC. http://info.worldbank.org/governance/wgi/#home.
———. 2018. Global Investment Competitiveness Report, 2017−2018: Foreign Investor Perspectives and Policy Implications. Washington, DC: World Bank.
———. Forthcoming. Assuring Quality to Access Global Markets: A Reform Toolkit. Washington, DC: World Bank.

147
Appendix A. Measuring the Productivity Residual: From Theory to Measurement
This appendix explores the measurement of productivity.1 It focuses in particular on
the interpretation of the productivity residual and how it relates to underlying compo-
nents of producer behavior and consumer demand. The appendix first presents a con-
ceptual framework and discusses how this framework can inform policy, before
examining the challenges in measurement and estimation. It contrasts the traditional
setup, which considers the production of homogeneous products, and the modern
view, which allows for meaningful product differentiation.
Conceptual Framework
To understand the potential problems a researcher may face when working with micro-
data, consider the case in which we have access to producer-level panel data for an
industry.2
It is common to consider firm performance (π) as the residual in a regression of
sales (s) on input expenditures (e). Assume a log-linear relationship and, for simplicity,
labor as the only input, so that
s = βe + π, (A.1)
with s, the log of sales, depending on the log of price and quantity of products sold,
s = p + q, and e, the log of the total wage bill (input expenditure) defined by the sum of
log wage and employment, e = w + l.
From a production point of view, a standard production function3 is given by
q = αl + ω, with ω capturing productive efficiency. With few exceptions, the existing
literature has viewed the sales-generating equation (A.1) as the empirical analog of the
production function and interpreted the residual π as a measure of total factor produc-
tivity (TFP). But this is true only in a very special case: when α = β and ω = π. In prac-
tice, this will only be identical if in fact all producers in the industry face the same
output price and wage rate. In any other case, of either output price or input price
variation, the term productivity would be used too loosely (if not incorrectly).

148 Productivity Revisited
In general, what we have learned is that standard practices lead to residuals that
capture output and input prices, in addition to efficiency (ω), leading to
π = p − αw + ω. (A.2)
This is precisely why De Loecker and Goldberg (2014) refer to the residual, π, as firm
profitability, and why it is probably more appropriate to refer to these residuals as a
measure of performance.
The distinction between physical productivity ω (often called physical TFP, or TFPQ) and profitability π (referred to as revenue TFP, or TFPR) is important; the latter depends
not only on physical efficiency, but also on prices, which reflect product differentiation
and markups in addition to input costs. To draw conclusions as to how a producer
reacts to changes in the operating environment, we need to decompose this residual
into its components. This is crucial because the exposure to policy change is not
expected to affect these aspects in the same way. Nevertheless, the majority of analyses
implemented so far have focused on TFPR without considering that whether a policy
affects it through changes in prices or in efficiency has vastly different implications, and
this holds at both the micro and macro levels.
Policy Relevance of Decomposing Firm Performance
The framework presented above indicates that TFPR consists of two distinct economic
variables of interest: physical efficiency and prices, which reflect product differentia-
tion and markups (in addition to costs). These variables turn out to have very distinct
time series patterns in the data and more importantly have different economic
interpretations.
As noted by De Loecker and Goldberg (2014), distinguishing between profitability
and efficiency is important because this allows the researcher to link improvements in
firm performance to specific mechanisms through which globalization affects firms.
Understanding these mechanisms is important for assessing the welfare and distribu-
tional effects of trade openness. For example, a trade liberalization that improves firm
performance by inducing improvements in physical efficiency has different implica-
tions from a liberalization that makes firms better off by increasing their profits.
So far, the term “productivity” has been used very loosely, with rather large implica-
tions for policy recommendations because there is a risk of prescribing misleading
solutions when data do not provide the necessary information to properly identify the
contribution of supply and demand factors to firms’ profitability. In this respect,
the recent consensus on price heterogeneity at the firm level requires researchers to be
much more cautious about how to interpret productivity, or what is loosely referred to
as TFP. The reason is that, although we can correctly infer productivity from aggregate
output and input series when appropriately deflated, we cannot follow the same

Measuring the Productivity Residual: From Theory to Measurement 149
strategy when relying on micro data unless we observe firms’ prices. The bottom line is
that markups and production costs play a prominent role. Therefore, performance
(and not productivity) is a better definition of the residual of a production function
using sales and expenditure data. Nonetheless, there are different approaches that can
help address, at least partially, some of the main concerns related to production func-
tion estimations.
To organize the discussion that follows, we divide this methodological section
into two parts. The first part presents different challenges of estimating the produc-
tion function in a standard framework of production, which considers single-
product firms and perfectly competitive input and output markets. Following the
evolution of the literature, we will review the most important approaches to solving
for the endogeneity problems: instrumental variables, fixed-effects models, and
more recent control variable approaches. The second part, in contrast, presents
challenges and recent methodological contributions in a more realistic setup,
extending the analysis to imperfectly competitive input and output markets and
multiproduct firms.
Traditional Framework (Q, X )
Consider the textbook setup in which a single-product firm, denoted by i, produces a
homogeneous good using a Cobb-Douglas production technology:
.= Ωβ βQ L Kit it it itL K
Assume that we observe physical output (Q) produced using observed inputs, labor
(L) and capital (K), and (unobserved) productivity, for a panel of firms in a given
industry. Furthermore, this standard framework assumes perfectly competitive input
markets, yielding common input prices for all relevant factors of production.
In the discussion that follows, we consider Q to be output generated by capital (K)
and labor (L). This is of course a stylized description of (any) production technology.
Depending on the data set and the industry under study, a different technology can be
specified and as such other inputs can be included, typically intermediate inputs, such
as energy. The main choice of specification is, however, whether output is recorded as
gross output or value added. Recently the literature has started to become more serious
about the difference and under which conditions the value-added production function
is in fact formally identified. The reduced-form value-added approach first constructs
value added by netting intermediate inputs from output (given that both are expressed
in the same units—more on this later) and then proceeds to treat it as output. This of
course restricts the underlying production function substantially (for instance, it could
come from assuming a coefficient of 1 on the intermediate input bundle). In fact, the
traditional motivation for doing this is that intermediate inputs are expected to react

150 Productivity Revisited
the most to productivity shocks, and therefore create a clear simultaneity problem and
associated bias. Although this observation is correct, the solution to construct value
added is not. The only rationale to not consider intermediate inputs in the produc-
tion function specification is if the underlying technology is Leontief in these
intermediate inputs.4
Challenges
The main challenge is that input choices are not random and thought to be a function
of the unobserved efficiency term, referred to as productivity. This problem has been
discussed and analyzed since at least the 1940s. To make the problem more precise, let
us consider the log specification of this production function:
qit = β
Llit + β
Kk
it + ω
it + ε
it, (A.3)
in which lowercases denote logs, and ωit represents shocks that are potentially observed
or predicted by the firm when making input choices or TFP, while εit represents classical
measurement error in recorded output, as well as unanticipated shocks to production.
Estimating the production function using ordinary least squares (OLS) will lead to
biased coefficients, and subsequently biased productivity estimates.
Simultaneity bias. Firms install capital, purchase intermediate inputs, and hire
workers based on their (expected) profitability. In the case of homogeneous goods and
common input prices, where all firms receive the same output prices and face the same
input prices, this profitability is determined by the efficiency with which firms produce:
that is, their productivity. This simply implies inputs are endogenous, and that they are
correlated with the unobserved productivity term.
Selection bias. Given that a panel of firms in an industry is tracked over time, attri-
tion will further plague the estimation of the production function. The entry and exit
of firms are not random events, and there is a long literature, dating back to Gibrat
(1931), on firm growth and selection. In particular, over time, firms with higher values
of productivity are expected to, all things equal, survive with a higher probability.
This selection bias is expected to mostly plague factors of production that require sub-
stantial adjustment cost, be it in a time-to-build or monetary sense. In the standard
setup, this is the case for capital. Firms with a higher capital stock can therefore absorb
lower-productivity shocks, given that their option value of remaining active in the
market is higher. This would lead to a downward bias in the capital coefficient.
Measurement error in inputs. Labor is usually measured in man-hours or simply
number of full-time employees, while it would be more appropriate to control for
the type of labor, education, experience, and specific skills. For materials, specific infor-
mation on discounts or quality differences in inputs may be lacking. For capital, it is

Measuring the Productivity Residual: From Theory to Measurement 151
usually necessary to aggregate investment over various categories of capital such as
equipment, machinery, land, and buildings and correct for the appropriate deprecia-
tion. There are basically two ways of measuring capital: either directly via book
value (not free from problems) or through the investment sequence using the
perpetual inventory method, which requires making some assumptions about the
initial stock of capital.5
Approaches
In the last decade, several approaches have been proposed to control for the prob-
lems just presented. In this section, we provide a brief description of the main method-
ological contributions, their advantages and weaknesses, together with econometric
programs and commands developed for their implementation. We refer the reader to
the overview by Ackerberg et al. (2007) for a detailed discussion.
Historically, the two traditional approaches adopted to face such problems were
instrumental variables and fixed effects.
Instrumental variables. The logic behind the instrumental variables approach is to
find appropriate instruments (that is, variables) that are correlated with the endoge-
nous inputs but do not enter the production function and are uncorrelated with the
production function residuals. Researchers have mainly used input prices (such as cap-
ital cost, wages, and intermediates prices) or lagged values of inputs. While input prices
clearly influence input choices, the critical assumption is that input prices need to be
uncorrelated with ωit. Whether this is the case depends on the competitive nature of the
input markets in which the firm is operating. If input markets are perfectly competi-
tive, then input prices should be uncorrelated with ωit because the firm has no impact
on market prices. If this is not the case, input prices will be a function of the quantity
of purchased inputs, which will generally depend on ωit.6
Although using input prices as instruments may make sense theoretically, the
instrumental variables approach has not been uniformly successful in practice.
According to Ackerberg et al. (2007), there are several reasons for this. First, input
prices are often not reported by firms, and when firms report the labor cost variable, it
is often reported as average wage per worker (which masks information about unmea-
sured worker quality). The problem is that unobserved worker quality will enter the
production function through the unobservable ωit. As a result, ω
it will likely be posi-
tively correlated with observed wages, invalidating use of labor costs as an instrument.
Second, to use input prices as instruments requires econometrically helpful variation
in these variables. While input prices clearly change over time, one generally needs
significant variation across firms to properly identify production function coefficients.
This can be a problem, as we often tend to think of input markets as being fairly national
in scope. Third, working with lagged values of inputs requires additional assumptions
on the time series properties of the instrument to work.7 Finally, the instrumental

152 Productivity Revisited
variables approach only addresses simultaneity bias (endogeneity of input choice), not
selection bias (endogenous exit).
Fixed effects. A second traditional approach to dealing with production function
endogeneity issues is fixed-effects estimation. From a theoretical point of view, fixed-
effects models rely on the strong assumption that the productivity shocks are time-
invariant: that is, ωit = ω
it−1. If this assumption holds, researchers can consistently
estimate production function parameters using either mean differencing, first differ-
encing, or least squares dummy variables estimation techniques.
Unfortunately, this assumption contrasts with the macroeconomic evidence about
the productivity dynamics over the business cycle, thus making the entire use of fixed
effects invalid. Furthermore, this assumption implies some limitations in the analysis,
because researchers are usually interested in exploring the evolution of the residual
when there is a change in policy variables (such as deregulation, privatization, or trade
policy changes). Typically, these changes affect different firms’ productivities differ-
ently, and those firms that the change affects positively will be more likely to increase
their inputs and less likely to exit.
The fixed-effects estimator also imposes strict exogeneity of inputs. This is an
assumption that is difficult to validate empirically, because a profit-maximizing firm
will change the optimal use of inputs when facing a productivity shock. Finally, a sub-
stantial part of the information in the data is often left unused because fixed effects
exploits only the within-firm variance, which in micro-data tends to be much lower
than the cross- sectional variance. Often it is not even enough to allow for proper iden-
tification, leading, therefore, to weakly identified coefficients.
Thus, even if fixed-effects approaches are technically (fairly) straightforward and
have certainly been used in practice (usually delivering unrealistically low estimates
for βk), they have not been judged to be all that successful at solving endogeneity
problems in production functions, given the issues just discussed.8
Control function. A third approach, the control function approach, was introduced
by Olley and Pakes (1996) and has become a popular approach to dealing with the
simultaneity and selection bias. This approach was modified and extended by various
authors, notably Levinsohn and Petrin (2003) and Ackerberg, Caves, and Frazer
(2015).9 The main insight and critical assumptions are discussed below.
The Control Function
The control function approach relies on two main assumptions: one about firm
behavior, and the other about the statistical process of the time series of productivity.
Optimality condition. The behavioral assumption is that firms maximize profits, and
this generates an optimal “input” demand equation, directly relating each input to the
Measuring the Productivity Residual: From Theory to Measurement 153
firms’ productivity and relevant state variables of the firm. The latter enter the model-
ing environment due to the explicit notion of entry and exit and modeling the indus-
try’s equilibrium in the spirit of Ericson and Pakes (1995).
Denote the relevant input demand factor by z. This could be either investment (the
case of Olley and Pakes 1996) or a variable input in production, like material inputs
(the case of Levinsohn and Petrin 2003). The essential ingredient is that each input will
relate directly through an unknown function to the unobserved productivity shock and
the other relevant state variables, here simply capital.
This gives z = h(ω,k). Inverting this equation is the key approach, and the associated
assumptions required allowing this inversion, to express productivity as an unknown
function of the control variable z, and k:
ω = h−1(z,k).
Now simply replace the productivity term by this expression and get
qit = β
Llit + β
Kk
it + h−1(z
it,k
it) + ∈
it.
The first set of approaches, including those of Olley and Pakes (1996) and Levinsohn
and Petrin (2003), suggested estimating the labor coefficient, in a first stage, by project-
ing output on labor, and a nonparametric function of capital and the relevant control
variable: investment in Olley and Pakes 1996, and an intermediate input in Levinsohn
and Petrin 2003.
All these approaches, however, are subject to identification concerns. The key concern
is that conditional on (a function of) capital and the control variable, it becomes difficult
to argue that there is any independent variation left in the labor variable. This is the argu-
ment made by Ackerberg, Caves, and Frazer (2016). In particular, Ackerberg, Caves, and
Frazer (2015) correctly note that in the model assumed above, featured by a Cobb-Douglas
production function in which firms face common input prices and produce a homoge-
neous good, one can in principle not identify the labor coefficient in the first stage. The
reason is simply that the optimal labor choice is a function of the very same variables, capi-
tal and productivity. This implies that there is no independent variation in labor, condi-
tional on a function in capital and productivity to identify the labor coefficient.
Illustration of non-identification of the labor coefficient. To highlight the non-identification
result of Ackerberg, Caves, and Frazer (2015), consider the (log) optimal labor choice, and
invert it to obtain an expression for (log) productivity: in fact, the function h(·):
ωit = c + (1 − β
L)l
it − β
Kk
it,
in which c is constant capturing the wage, the output price, and parameters. It suffices
to plug this expression into the estimating equation (A.3) to see that the labor

154 Productivity Revisited
coefficient “drops out,” highlighting the inability to identify the labor coefficient in a
first stage. We refer to Ackerberg, Caves, and Frazer (2015) for a detailed discussion
about these non-identification issues, and how one can in principle salvage both
Olley and Pakes’s (1996) and Levinsohn and Petrin’s (2003) methods and achieve
identification in the first stage. Although it is fair to say that the conditions under
which this identification result is obtained are at best conceptually valid, it is not rec-
ommended to launch any productivity analysis using such underlying assumptions—
in particular, because Ackerberg, Caves, and Frazer (2015) propose a powerful though
simple alternative, by essentially giving up on identifying anything else but predicted
output in the first stage.
The main takeaway from this debate, and what is ultimately relevant for empirical
work, is that we can abandon the idea of identifying, and hence estimating, any coeffi-
cient in this so-called first stage (that is, the semiparametric model).
Instead, the first-stage in Ackerberg, Caves, and Frazer (2015) simply eliminates the
measurement error from output by the following projection:
qit = ϕ
t(l
it, k
it, z
it) + ∈
it.
This equation in fact immediately generates an expression for productivity, which is
known up to the parameters, to be estimated:
ωit = ϕ
it − β
Llit + β
Kk
it.
This relationship will come in handy when generating moment conditions to find
the production function parameters. But the estimation crucially relies on the second
assumption, regarding the time-series properties of the productivity process.
Productivity process. All control function approaches develop estimators that form
moments on the productivity shock ξit. This shock is the difference between realized
and predicted productivity: that is, the so-called news term in the productivity time-
series process. The bulk of the literature considers an exogenous Markov process for
productivity such that
ξit + ω
it − E(ω
it|ω
it−1),
and the familiar AR(1) process is a special case.10
From the first stage, this productivity shock can be computed by, for a given value of the
parameters (βL,β
K), projecting productivity on lagged productivity—and in general, this is
a nonparametric projection ξit(β). This entails considering a regression of productivity
(given parameters) on a nonlinear function in lagged productivity (given parameters).
In practice, this is typically done by using a polynomial expansion. The special case would
be the AR(1) specification, common in the panel data approach (discussed earlier).

Measuring the Productivity Residual: From Theory to Measurement 155
The parameters are then identified, and estimated, by forming moments on this
productivity shock. The standard ones used in the literature are
E[ξit(i
L)l
it−1] = 0,
E[ξit(b
K)k
it] = 0,
in which the very observation of the simultaneity bias is used. Current labor choices do
react to productivity shocks, if labor is the standard static variable input used in
production, but lagged labor is not. Lagged labor is, however, related to current labor,
through the persistent part of productivity; but this is exactly taken out in the proce-
dure discussed above. In the case of capital, both current and lagged capital are valid
moments because capital is assumed to face a time-to-build adjustment cost in the
standard model. The point is not that these moments always need to be imposed, but
that the researcher can adjust the moment conditions depending on the industry and
setting and which inputs are thought to be variable or slow to adjust in light of a
productivity shock.
If a gross output production function is considered, and one does not assume an
underlying Leontief technology, additional parameters need to be estimated.11 For
example, the coefficient on the intermediate input is identified using the same moment
condition as used for the labor coefficient. This, however, requires the researcher to
state clearly under which conditions lagged materials are valid instruments—especially
in light of the standard framework employed in the literature, at least by Ackerberg,
Caves, and Frazer (2015) and also recently by Gandhi, Navarro, and Rivers (forthcoming).
This framework assumes a neoclassical environment in which firms produce homoge-
neous products while facing common input prices. This greatly limits the ability to
identify purely variable inputs of production (this was, as mentioned, the motivation
for constructing value added as a measure of output), because there is no independent
variation left to identify these coefficients. However, as soon as this stylized environ-
ment is replaced by a more realistic setting, such as the one discussed by De Loecker
and Warzynski (2012) and De Loecker et al. (2016), in which firms face different input
prices (if anything, due to location and to product differentiation), lagged variable
inputs become valid instruments, as long as these firm-specific input prices are, of
course, serially correlated. The latter is a very strong fact in a variety of data sets in
which input prices (such as wages and price of raw materials) are separately recorded.
Implementation and DiscussionInvestment versus intermediate input. The major insight of Olley and Pakes (1996) is to
offer an alternative to estimating production functions in the presence of unobserved
productivity shocks, which generate biased estimates of both the output elasticities and
productivity itself (often the main object of interest). The alternative moves away
from panel data techniques (such as fixed effects, discussed earlier), and the search for

156 Productivity Revisited
instruments (also discussed). The control function makes it clear that additional eco-
nomic behavior is assumed and therefore the validity rests on these assumptions. In
particular, Olley and Pakes (1996) heavily rely on investment to be an increasing func-
tion in productivity (conditional on a producer’s capital stock). Although there is good
intuition that more productive firms will invest more, this is of course not always the
case, for example, in the case of adjustment cost giving rise to lumpy investment, or
complementarities with other (unobserved) factors such as spending on research and
innovation, or engaging in global activities (such as foreign direct investment). In addi-
tion, firms often do not invest in any given year, which would limit the sample that one
can use to estimate the production function.
This is precisely the motivation behind Levinsohn and Petrin 2003. In developing
economies, firms often do not invest, and this would yield a systematically different
sample of “successful” firms. This is the major attraction of the Levinsohn and Petrin
(2003) approach: we can now rely on the same insights of Olley and Pakes (1996), but
instead rely on an input, like electricity, materials, or any other input that is deemed to
be flexible in production, and easily adjustable by the firm.
There is, however, no golden rule as to which control to use in which applica-
tion. In fact, carrying out robustness with multiple control variables (either vari-
able input, or investment, or both), is the preferred strategy. The point is that
different specifications are valid under different underlying assumptions of eco-
nomic behavior and underlying market conditions. The productivity residual is
computed after estimating the production function, and therefore there is no inde-
pendent information with which to test the relationship between the control vari-
able and productivity. The best practice is therefore to bring to bear the institutional
details and knowledge of the setting under study (particular industry, country, or
time frame), and verify whether the underlying assumptions are plausible.
Robustness analysis should be done keeping in mind that different results (of the
subsequent productivity results) are not necessarily a problem. They might simply
imply that different assumptions about firm behavior lead to different conclusions
in the productivity analysis of interest.
To summarize, the control function approach relies explicitly on profit maximi-
zation to generate a relationship between the unobserved productivity term and
observable inputs and a control variable. This is the sense in which the search for
“the instrument” is replaced by adding more structure on firm behavior and mar-
ket structure of output and input markets. In addition, the moment conditions are
obtained after specifying a particular productivity process. It is obvious that the
parameters obtained, and the subsequent productivity analysis, are subject to the
validity of these assumptions. Recent work has relaxed the reliance on a particular
exogenous Markov process for productivity (De Loecker 2013; Doraszelski and
Jaumaundreu 2013).

Measuring the Productivity Residual: From Theory to Measurement 157
Results Countless papers have applied the control function approaches successfully. As an
instructive example, Ackerberg et al. (2007) present the work by Pavcnik (2002) that
investigates the effects of trade liberalization on plant productivity in the case of
Chile. The results in Ackerberg, Caves, and Frazer (2015) confirm the theoretical pre-
dictions mentioned before: the coefficients on variable inputs such as skilled and
unskilled labor and materials should be biased upward in the OLS estimation, whereas
the direction of the bias on the capital coefficient is ambiguous. Table A.1 displays
the results of the production function estimates for plants operating in the food
processing industry.
The coefficients from semiparametric estimation in column (3) are lower than the
OLS estimates in column (1) for labor and materials. This implies that estimated
returns to scale decrease (consistent with a positive correlation between unobserved
productivity and input use) with the coefficients on the more variable inputs account-
ing for all of the decline. Consistent with selection, the capital coefficient rises, mov-
ing from OLS to Olley-Pakes. In particular, it exhibits the biggest movement (in
relative terms) in the direction that points at the successful elimination of the selec-
tion and simultaneity bias. Also considering other industries, semi- parametric esti-
mation by Pavcnik (2002) yields estimates that are from 45 percent to more than
300 percent higher than those obtained in the OLS estimations in industries in which
the coefficient increases.
Previous literature has often used fixed-effects estimation that relies on the tempo-
ral variation in plant behavior to pinpoint the input coefficients. The fixed-effects coef-
ficients are reported in column (2), and they are often much lower than those in the
OLS or the semiparametric procedure, especially for capital. This is not surprising
because the fixed-effects estimation relies on the intertemporal variation within a
plant, thus overemphasizing any measurement error.
TABLE A.1 Estimated Input Coefficients: Results of Different Approaches
(1)OLS
(2)Fixed effects
(3)Olley and Pakes 1996
Unskilled labor 0.178 (0.006)
0.210 (0.010)
0.153 (0.007)
Skilled labor 0.131 (0.006)
0.029 (0.007)
0.098 (0.009)
Materials 0.763 (0.004)
0.646 (0.007)
0.735 (0.008)
Capital 0.052 (0.003)
0.014 (0.006)
0.079 (0.034)
Source: Pavcnik 2002, p. 259, Table 2—full sample, N = 8,464.Note: OLS = ordinary least squares.

158 Productivity Revisited
These results are indicative of those for the other industries in table 2 in Pavcnik’s
(2002) work. The average of the returns-to-scale estimate across industries when esti-
mated by OLS is 1.13; when estimated by Olley-Pakes, it is 1.09; and when estimated by
fixed effects, it is 0.87. The average of the capital coefficients across industries from OLS
is 0.066; from Olley and Pakes (1996), 0.085; and from fixed effects, only 0.021 (with
two industries generating negative capital coefficients).
In fact, Pavcnik 2002 and hundreds of other papers rely on sales or value added to
measure output. Therefore, for the sake of clarity, we should interpret the residual as a
measure of sales per unit because researchers estimated a so-called sales-generating
production function.12 Until a few years ago, the focus of researchers was to tackle
selection and simultaneity problems. This was clearly an empirical challenge. Pavcnik
2002 represents an excellent example of how these problems should be tackled.
Notable exceptions are Syverson (2004) and Foster, Haltiwanger, and Syverson
(2008), who use U.S. data that allow them to separately identify producer-level quanti-
ties and prices. In particular, they rely on a selected set of plausibly homogeneous good
industries (such as ready-mixed concrete) and exploit output price data to separate out
price variation from productivity. An implicit assumption in their framework is that
input prices do not vary across firms. This assumption is indeed plausible in the con-
text of the homogeneous product industries they consider; for example, it is plausible
to assume that (conditional on region) the input prices ready-mixed concrete produc-
ers face are the same. Their results show that there are important differences between
revenue and physical productivity. This motivates and introduces the more recent evo-
lution of productivity research.
Modern Framework (R, E )
Let’s consider now a more realistic setup in which we observe total revenues and sales
and a vector of input expenditures. However, we do not observe either the number of
goods produced or the quantity used of each input. Using a basic production function
with an unobserved productivity term, we can express log sales (s) in the following way:
= ′ α + π + ∈e .sit it it it (A.4)
Equation (A.4) represents a point of departure for the literature that typically uti-
lizes firm- or plant-level data across many different sectors of one or more economies.
Such data tend to be readily available based on firms’ balance sheet data for a large set
of countries and time periods.
However, it is important to review the underlying factors at play in equation (A.4).
Relying on the definition of sales, we know that sit = p
it + q
it, assuming a standard Hicks-
neutral production function, x= ′ β + ω ,qit it it with β and ωit the vector of production
function coefficients and productivity, respectively. Please note that these are
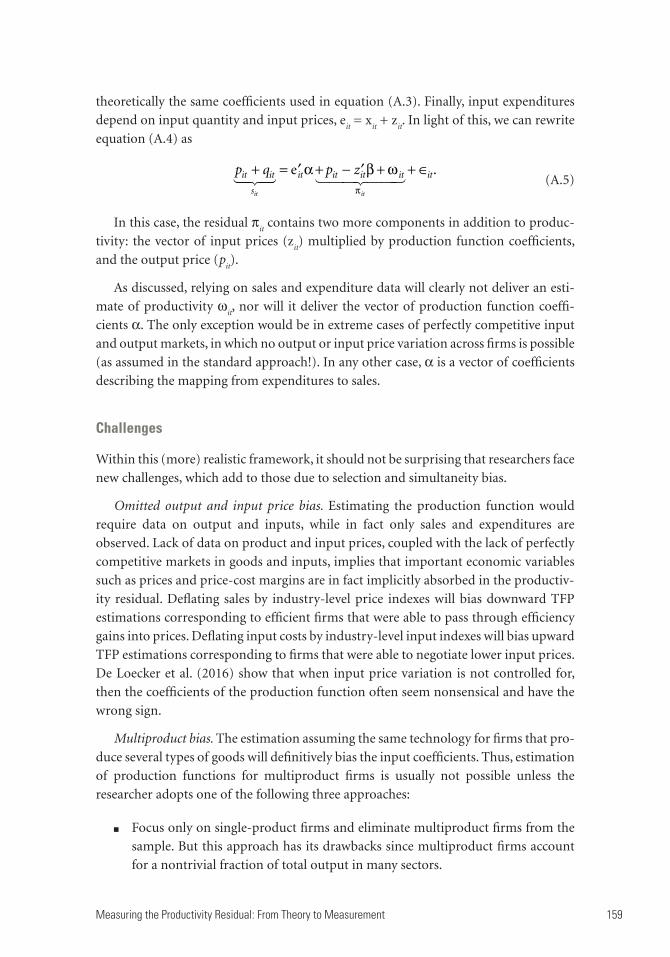
Measuring the Productivity Residual: From Theory to Measurement 159
theoretically the same coefficients used in equation (A.3). Finally, input expenditures
depend on input quantity and input prices, eit = x
it + z
it. In light of this, we can rewrite
equation (A.4) as
+ = ′ α + − ′β + ω + ∈
π
e .��� �� � ��� ���p q p zit it
s
it it it it it
it it
(A.5)
In this case, the residual πit contains two more components in addition to produc-
tivity: the vector of input prices (zit) multiplied by production function coefficients,
and the output price (pit).
As discussed, relying on sales and expenditure data will clearly not deliver an esti-
mate of productivity ωit, nor will it deliver the vector of production function coeffi-
cients α. The only exception would be in extreme cases of perfectly competitive input
and output markets, in which no output or input price variation across firms is possible
(as assumed in the standard approach!). In any other case, α is a vector of coefficients
describing the mapping from expenditures to sales.
Challenges
Within this (more) realistic framework, it should not be surprising that researchers face
new challenges, which add to those due to selection and simultaneity bias.
Omitted output and input price bias. Estimating the production function would
require data on output and inputs, while in fact only sales and expenditures are
observed. Lack of data on product and input prices, coupled with the lack of perfectly
competitive markets in goods and inputs, implies that important economic variables
such as prices and price-cost margins are in fact implicitly absorbed in the productiv-
ity residual. Deflating sales by industry-level price indexes will bias downward TFP
estimations corresponding to efficient firms that were able to pass through efficiency
gains into prices. Deflating input costs by industry-level input indexes will bias upward
TFP estimations corresponding to firms that were able to negotiate lower input prices.
De Loecker et al. (2016) show that when input price variation is not controlled for,
then the coefficients of the production function often seem nonsensical and have the
wrong sign.
Multiproduct bias. The estimation assuming the same technology for firms that pro-
duce several types of goods will definitively bias the input coefficients. Thus, estimation
of production functions for multiproduct firms is usually not possible unless the
researcher adopts one of the following three approaches:
■ Focus only on single-product firms and eliminate multiproduct firms from the
sample. But this approach has its drawbacks since multiproduct firms account
for a nontrivial fraction of total output in many sectors.

160 Productivity Revisited
■ Aggregate product prices to the firm level and conduct the analysis at the firm
level, but this implies assuming that markups are common across products with-
in a firm (which is a rather restrictive assumption).
■ Devise a mechanism for allocating firm input expenditures to individual prod-
ucts and conduct the analysis at the product level (see De Loecker et al. 2016).
We will explain the last option at the end of the methodological section.
Approaches
Just as in the standard setting, there are a few ways of dealing with the biases discussed
earlier. It is clear, however, that the treatment of the unobserved productivity shocks,
discussed above, is not independent from the issues raised in this section. In fact, as we
will show below, the framework suggested by De Loecker et al. (2016) combines insights
from the control function approach and that of demand estimation from empirical
input-output.
Reinterpretation. The first and simplest solution to not observing physical output
and input is to reinterpret the residual of the production function as profitability—as
discussed in great detail by De Loecker and Goldberg (2014). The change of course calls
for a reinterpretation of the findings of any productivity analysis using (deflated)
sales and (deflated) expenditures: replace productivity with profitability everywhere,
and this of course can have substantial implications for policy and identification of the
drivers of efficiency, compared with drivers of markups, or more broadly factors deter-
mining pass-through of costs to price.
Add structure on demand. Klette and Griliches (1996) and De Loecker (2011) pro-
vide an empirical framework for dealing with the omitted variable bias, focusing
uniquely on the unobserved output price component. Sticking to the Cobb-Douglas
specification, we now simply recognize that output is measured by sales, leading simply
to the following estimating equation:
sit = β
Llit + β
Kk
it + p
it + ω
it + ∈
it,
in which s, p denote log sales and log prices, respectively. This equation is referred
to as the sales-generating production function, and in fact the residual from the
equation (pit + ω
it) is referred to as TFPR, and ω
it = TFPQ, in Foster, Haltiwanger,
and Syverson 2008.
We refer the reader to the two papers—Klette and Grillches 1996 and De Loecker
2011—but the main insight here is that the unobserved output price term can be
replaced by a particular functional form for the (inverse) demand function, say
p = p(q,d), in which d is an observable demand shifter. This allows the researcher to
separate the demand and price variation from the variation in productivity, and the
associated relationship with the various inputs. In essence, it allows the researcher to

Measuring the Productivity Residual: From Theory to Measurement 161
add auxiliary data on demand—in the case of De Loecker (2011), product-level quota
and industry output—and thereby isolate the mapping from inputs to physical output,
while relying on the insights from the control function literature.
This approach is therefore subject to the validity of the demand system, and more-
over relies on additional data that credibly move around demand, and hence prices,
independently from production.
Integrate with markups. A recent literature has moved away from the focus on pro-
ductivity estimation, and instead focuses on estimating markups (price-cost margins)
using a production approach. In essence, this approach relies on the production func-
tion to obtain output elasticities of variable inputs of production to derive an expres-
sion for the markup. Once the markup is estimated, additional prices can be used to
recover estimates of marginal costs, which are perhaps more useful when comparing
firms producing differentiated products.
In particular, De Loecker and Warzynski (2012) put forward an approach to esti-
mate markups μit that relies on cost minimization, without specifying the conduct or
the shape of the demand function by essentially contrasting the cost share (of a vari-
able input of production) to the revenue share (of that same variable input of
production).
The method boils down to applying the following first order condition by firm,
time, and product:
( )μ = θ ,P Q
E Xit itit it
it
in which θit is the output elasticity of a variable input X—that is,
∂∂
q
x,—and E(X)
it is
the expenditure on input X. Applying the production function techniques discussed
earlier could in principle deliver the output elasticity, and the second term is directly
observable. An immediate observation is that under a Cobb-Douglas production func-
tion, the variation across producers within an industry and over time is determined
only by the ratio of sales to variable-input expenditure. If one departs from Cobb-
Douglas, and, say, considers a translog production function (as proposed in De Loecker
and Warzynski 2012), the variation in markups can also come from variation in the
output elasticity. However, both approaches do impose a constant technology over
time by keeping the parameters of the production function time-invariant. This can of
course be relevant in specific settings where the interest lies in the time-series proper-
ties of the markups. See De Loecker and Eeckhout 2018 for such an application.
De Loecker et al. (2016) extend this approach to (1) account for multiproduct firms
and (2) explicitly deal with not observing physical inputs, and the fact that products are
differentiated, making (observable) quantity variation not immediately useful for
identifying technology parameters. Their approach follows two steps.

162 Productivity Revisited
1. Consider the set of single-product producers in a sector.
De Loecker et al. (2016) observe output prices and therefore consider the mirror image
of De Loecker 2011, where now input prices (W) are not observed, and quantities in a
given industry cannot be compared immediately, because of, say, quality differences.
This means that the estimating equation looks as follows:
qit = β
Llit + β
Kk
it − αw
it + ω
it + ∈
it,
in which w is the log input price index. Their approach relies on the notion that unob-
served quality differences can be traced back to outcomes in the product market. In
particular, De Loecker et al. (2016) provide a flexible approach that relates unobserved
input prices to a nonparametric function D(·) of output prices, market shares, and
product dummies. This yields an estimating equation that shares many similarities
with the standard approach, except for the extra term that controls for the unobserved
input price:
qit + β
Llit + β
Kk
it − D(p
it,·)+ ω
it + ∈
it.
De Loecker et al. (2016) then provide conditions under which this yields unbiased
estimates of the production function and rely on insights from the control function
approach (Ackerberg, Caves, and Frazer 2015) discussed earlier.
2. Consider all producers.
Having estimated the technology parameters by sector, we can go back to all firms,
including multiproduct firms, and recover the implicit input allocations across prod-
ucts (within a firm). This solves the main problem when estimating multiproduct pro-
duction functions: we do not know the breakdown of an input by product. While all
the details are in De Loecker et al. 2016, and the associated code is posted, the main idea
behind the input allocation shares is as follows. We illustrate the approach for a simple
production function that consists of just labor, and a producer with two products, each
with its respective technology (denoted by 1 and 2, respectively). Let us for simplicity
assume away input price heterogeneity such that all workers are paid a common wage
w. To keep notation light, consider a firm in a given period of time:
q1 + β
1Ll1 + ω;
q1 + β
2Ll1 + ω.
The standard problem is that we do not observe the labor used in each production
process, but as in De Loecker et al. 2016, we only have data on production by product
(q) and total employment (L) at the firm level. We wish to recover markups and
marginal costs for each product-firm-year observation.

Measuring the Productivity Residual: From Theory to Measurement 163
First, we obtain the estimates of the technology parameters by considering the set of
single-product firms producing products 1 and 2, respectively. This is done as described
above, and this makes the parameters (β1L
,β2L
) known objects. Following De Loecker
et al. (2016), we define the expenditure share of employment of a product as exp(ρijt
),
and this simply states how much of, here, the wage bill accrues to product 1 versus prod-
uct 2. In this simplified setting, the expenditure share is simply given by L1/(L
1 + L
2),
because the wage rate drops out. We can now rewrite the system of equations for the
firm producing two products, for a given period:
q1 − β
1Ll = β
1Lρ
1 + ω;
q1 − β
2Ll = β
2Lρ
2 + ω.
The crucial insight of De Loecker et al. (2016) is that we are left with three unknowns,
but seemingly only two equations. However, the additional restriction is that the sum
of expenditures across products must sum to the total recorded expenditure, here the
total wage bill. In other words, the shares ρijt
sum to one across all the products. Paired
with the standard assumption in the theory of multiproduct firms that the firm applies
its productivity, capability, or management skills to each product line yields a simple
solution to this system of equations: solve for the shares, and productivity—which now
allows the user to go back to the markup formula and apply this at the level of a firm-
product, and with data on prices, marginal costs can be recovered as well.
This procedure is fully general as long as the production function is log additive in
the productivity term, and as long as the productivity shock is assumed to be common
across products. In addition, the identification of the shares is intuitive: conditional
on technology, any variation observed in quantity produced can only come from the
use of the input (labor). Productivity is identified simply from the level of average
output across products to total employment (here labor productivity).
ResultsThe realization that measured firm performance captures markups as well as physical
efficiency naturally leads to two other sets of literature that were developed in different
contexts: the large industrial organization literature on imperfect competition, and
the international literature on incomplete (exchange rate) pass-through. The first
explicitly investigates the measurement and determinants of markups (such as the role
of market structure, product differentiation, and demand elasticities). The second
focuses on how a certain type of cost shock (exchange rate changes) is passed through
to prices. The role of market power, however, has been traditionally absent in the pro-
ductivity literature. One can tell many stories as to why this is, but the fact remains
that most popular estimators in the literature (Olley and Pakes 2016; Levinsohn-Petrin
2003; and Ackerberg, Caves, and Frazer 2015) are silent about market power and
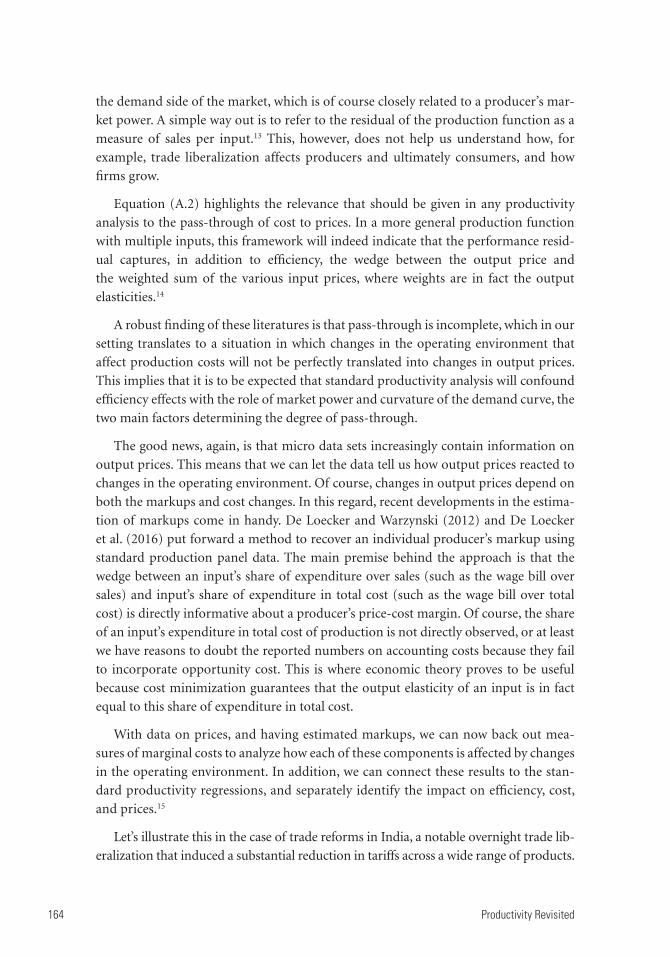
164 Productivity Revisited
the demand side of the market, which is of course closely related to a producer’s mar-
ket power. A simple way out is to refer to the residual of the production function as a
measure of sales per input.13 This, however, does not help us understand how, for
example, trade liberalization affects producers and ultimately consumers, and how
firms grow.
Equation (A.2) highlights the relevance that should be given in any productivity
analysis to the pass-through of cost to prices. In a more general production function
with multiple inputs, this framework will indeed indicate that the performance resid-
ual captures, in addition to efficiency, the wedge between the output price and
the weighted sum of the various input prices, where weights are in fact the output
elasticities.14
A robust finding of these literatures is that pass-through is incomplete, which in our
setting translates to a situation in which changes in the operating environment that
affect production costs will not be perfectly translated into changes in output prices.
This implies that it is to be expected that standard productivity analysis will confound
efficiency effects with the role of market power and curvature of the demand curve, the
two main factors determining the degree of pass-through.
The good news, again, is that micro data sets increasingly contain information on
output prices. This means that we can let the data tell us how output prices reacted to
changes in the operating environment. Of course, changes in output prices depend on
both the markups and cost changes. In this regard, recent developments in the estima-
tion of markups come in handy. De Loecker and Warzynski (2012) and De Loecker
et al. (2016) put forward a method to recover an individual producer’s markup using
standard production panel data. The main premise behind the approach is that the
wedge between an input’s share of expenditure over sales (such as the wage bill over
sales) and input’s share of expenditure in total cost (such as the wage bill over total
cost) is directly informative about a producer’s price-cost margin. Of course, the share
of an input’s expenditure in total cost of production is not directly observed, or at least
we have reasons to doubt the reported numbers on accounting costs because they fail
to incorporate opportunity cost. This is where economic theory proves to be useful
because cost minimization guarantees that the output elasticity of an input is in fact
equal to this share of expenditure in total cost.
With data on prices, and having estimated markups, we can now back out mea-
sures of marginal costs to analyze how each of these components is affected by changes
in the operating environment. In addition, we can connect these results to the stan-
dard productivity regressions, and separately identify the impact on efficiency, cost,
and prices.15
Let’s illustrate this in the case of trade reforms in India, a notable overnight trade lib-
eralization that induced a substantial reduction in tariffs across a wide range of products.

Measuring the Productivity Residual: From Theory to Measurement 165
De Loecker et al. (2016) observe panel data of Indian manufacturing firms over the
period 1988−2012. In addition to standard firm-level production data, they observe
product-level output prices and quantities. This allows them to obtain estimates of mark-
ups and marginal costs, in addition to efficiency, for each product-firm pair over the
sample period. The interest of De Loecker et al. (2016) lies in analyzing the impact of
the tariff changes, for both final and intermediate goods: that is, output and input tariffs.
The main results are summarized in table A.2.
In column (1), the standard procompetitive effects from trade liberalization are
confirmed: reduction in output tariffs implies, on average, lower output prices of
Indian manufacturing products. However, this price effect masks the underlying
dynamics of cost and pass-through. The lowering of output tariffs did not significantly
affect the cost of production, which goes against the common wisdom of efficiency
gains through X-inefficiency reductions—a popular narrative when describing mea-
sured productivity gains in the aftermath of a certain policy change (such as trade lib-
eralization or deregulation). In fact, De Loecker et al. (2016) do not find any systematic
impact on efficiency, as measured by TFPQ.
One of the major findings of this study is that input tariffs substantially lower mar-
ginal cost, by giving access to cheaper inputs, but the results in column (3) indicate that
these cost savings are only partly passed on to consumers. This leads overall to only a
modest price drop, and a negative association between markups and input tariffs: that
is, as input tariffs fall, and intermediate input prices fall (relatively), Indian manufac-
turing firms see their variable profit margins (markups) increase.
Column (3) seems to go against standard economic theory and empirical evi-
dence that increased competition in output markets does not affect markups. This
specification is, however, not equipped to tease out this effect because cost and
competition effects occur simultaneously. Therefore, in column (4), the authors con-
dition on marginal cost of production, tracing out the pure procompetitive effects.
And indeed, the fall in output tariffs leads to lower markups, holding fixed the cost of
production.
TABLE A.2 Firm Performance and Trade Reforms: The Case of India
(1) Prices
(2) Marginal cost
(3) Markups
(4) Markups
Output tariff 0.15*** 0.05 0.10 0.14***
Input tariff 0.35 1.16** −0.80++ 0
Marginal cost — — — Yes
Source: De Loecker et al. 2016.Note: Each column refers to a regression of the component of firm performance on output and input tariffs. All regressions include firm-product fixed effects and sector-year fixed effects. Standard errors are clustered at the industry level.Significance level: ++ = 11.3%; ** = 5%; *** = 1%.

166 Productivity Revisited
In any event, the important insight from De Loecker et al.’s (2016) work for policy
is that changes in tariffs or other trade policy instruments do not necessarily translate
to proportional changes in prices, as typically assumed in the literature. In the presence
of market power and variable markups, the response of prices and their components is
substantially more complex. This insight has implications for the aggregate gains from
trade, their distribution across consumers and producers, and the relative importance
of static versus dynamic impacts.
Although this is an isolated study, and one of the first to decompose firm perfor-
mance into price, cost, and markup effects, there is reason to believe these results will
extend to other settings. Recent work by De Loecker, Van Biesebroeck, and Fuss (2016)
follows a similar strategy to evaluate the impact of increased Chinese imports on
Belgian manufacturing firm performance.
The results are qualitatively very similar: while output prices fall with increased
imports from China, variable profit margins actually increase. The latter is precisely for
the same reason as in India: producers have access to cheaper inputs. As a result, the
marginal cost of production falls, but such savings are only partly passed on to con-
sumers in the form of lower output prices.
De Loecker, Van Biesenbroeck, and Fuss (2016) delve deeper into the input market
channel. They find that the reduction in intermediate input prices is not limited to
firms that directly import, but the effect manifests itself through the entire input
market. This suggests that the general equilibrium effects are important and suggests
caution in applying the practice of preclassifying producers as importers when study-
ing the role of imported intermediate inputs.
There are also other economic reasons that make the acknowledgment of demand
factors embedded in the productivity residual relevant for economic policy. Lack of iden-
tification of demand and supply factors behind the residual can also lead to misleading
conclusions regarding the sources of aggregate productivity growth. If variation in TFPR
mainly reflects variations in markups instead of efficiency, then what appears to be a real-
location of activity toward more efficient firms (that is, allocative efficiency) may merely
reflect a reallocation of activity and market shares toward firms with market power.
The identification of demand and supply factors is crucial to understanding the
determinants of firm growth along a firm’s life cycle. For decades economists have
emphasized the role of efficiency to foster firm growth, but recent research shows that
the demand component may play a more prominent role. Foster, Haltiwanger, and
Syverson (2016) pioneered this demand versus supply debate by arguing that a firm’s
ability to increase its demand may be even more important to ensuring firm growth
(profits, sales, employment) than is its ability to increase physical efficiency. By focus-
ing on the accumulating process of the demand component in a particular homoge-
neous good sector, Foster, Haltiwanger, and Syverson (2016) argue that the observed
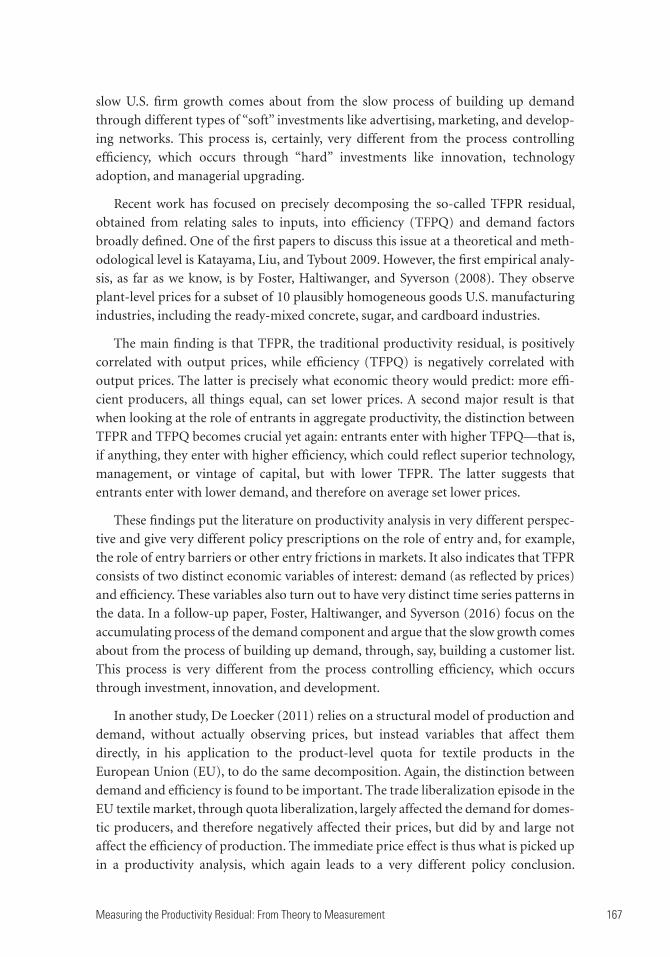
Measuring the Productivity Residual: From Theory to Measurement 167
slow U.S. firm growth comes about from the slow process of building up demand
through different types of “soft” investments like advertising, marketing, and develop-
ing networks. This process is, certainly, very different from the process controlling
efficiency, which occurs through “hard” investments like innovation, technology
adoption, and managerial upgrading.
Recent work has focused on precisely decomposing the so-called TFPR residual,
obtained from relating sales to inputs, into efficiency (TFPQ) and demand factors
broadly defined. One of the first papers to discuss this issue at a theoretical and meth-
odological level is Katayama, Liu, and Tybout 2009. However, the first empirical analy-
sis, as far as we know, is by Foster, Haltiwanger, and Syverson (2008). They observe
plant-level prices for a subset of 10 plausibly homogeneous goods U.S. manufacturing
industries, including the ready-mixed concrete, sugar, and cardboard industries.
The main finding is that TFPR, the traditional productivity residual, is positively
correlated with output prices, while efficiency (TFPQ) is negatively correlated with
output prices. The latter is precisely what economic theory would predict: more effi-
cient producers, all things equal, can set lower prices. A second major result is that
when looking at the role of entrants in aggregate productivity, the distinction between
TFPR and TFPQ becomes crucial yet again: entrants enter with higher TFPQ—that is,
if anything, they enter with higher efficiency, which could reflect superior technology,
management, or vintage of capital, but with lower TFPR. The latter suggests that
entrants enter with lower demand, and therefore on average set lower prices.
These findings put the literature on productivity analysis in very different perspec-
tive and give very different policy prescriptions on the role of entry and, for example,
the role of entry barriers or other entry frictions in markets. It also indicates that TFPR
consists of two distinct economic variables of interest: demand (as reflected by prices)
and efficiency. These variables also turn out to have very distinct time series patterns in
the data. In a follow-up paper, Foster, Haltiwanger, and Syverson (2016) focus on the
accumulating process of the demand component and argue that the slow growth comes
about from the process of building up demand, through, say, building a customer list.
This process is very different from the process controlling efficiency, which occurs
through investment, innovation, and development.
In another study, De Loecker (2011) relies on a structural model of production and
demand, without actually observing prices, but instead variables that affect them
directly, in his application to the product-level quota for textile products in the
European Union (EU), to do the same decomposition. Again, the distinction between
demand and efficiency is found to be important. The trade liberalization episode in the
EU textile market, through quota liberalization, largely affected the demand for domes-
tic producers, and therefore negatively affected their prices, but did by and large not
affect the efficiency of production. The immediate price effect is thus what is picked up
in a productivity analysis, which again leads to a very different policy conclusion.

168 Productivity Revisited
De Loecker (2011) also finds the demand component to be much more volatile than
the efficiency component, which seems plausible given the cyclicality of tastes and fash-
ion and competitive structures. This is in contrast to the more persistent process of
technical efficiency, which moves much more slowly, with discrete jumps whenever
firms invest in new technology or managerial practices.
Although many technical issues remain unresolved in the production function esti-
mation literature, ranging from measurement error in inputs to the functional of pro-
duction, the good news is that the discussion here leads to more interesting work to be
done in terms of the economics of the problem, with the potential that we can learn more
about the mechanism through which producers react to shocks. Topics that were previ-
ously not mentioned at all in the productivity literature now become central: price setting
and pass-through, the role of input markets, market power, and how all these shapes the
evolution of efficiency and aggregate outcomes through the allocation of resources.
Notes
1. This appendix summarizes the main methodological discussion presented by Cusolito, De Loecker, and Biondi (2018).
2. In what follows, we will omit subscripts of producers and time, and all variables are deflated with the appropriate industry-wide deflators. Moreover, we use the term “producer” to accommodate both plant and firm as units of observation in the data and analysis.
3. To simplify notation, we base our discussion on a (log) Cobb-Douglas production function, but our framework generalizes to any other functional form.
4. We refer to De Loecker and Scott 2016 for a detailed discussion of this issue; Ackerberg, Caves, and Frazer (2015) also discuss this in detail.
5. For treatment of capital measurement error, see De Loecker and Collard-Wexler 2015.
6. Other possible IVs are output prices, as long as the firm operates in competitive output markets. These instruments have been used less frequently, presumably because input markets are thought to be more likely to be competitive.
7. For empirical implementation, the user can use the following Stata command: ivreg.
8. For empirical implementation, the practitioner can use the following Stata command: xtreg, fe.
9. For empirical implementation, the practitioner can use prodest, a new and comprehensive Stata module for production function estimation based on the control function approach.
10. Under this setup, the control function and the dynamic panel data approach pioneered by Arellano and Bond (1991), and subsequent work by Blundell and Bond (1998), are closely related.
11. Under Leontief technology, the estimated parameters need to be adjusted by the intermediate-to-output ratio to obtain the correct output elasticities. See De Loecker and Scott 2016 for an application of this procedure.
12. Interestingly, this was clearly stated in footnote 3 of Olley and Pakes 1996.
13. This is precisely how Olley and Pakes (1996) proceed in their seminal paper.
14. See De Loecker and Goldberg 2014 for more details.
15. Identification here presumes that the change in the operating environment is exogenous with respect to an individual producer. This condition will, of course, not always be met. Additional work might be needed to guarantee a causal interpretation.

Measuring the Productivity Residual: From Theory to Measurement 169
References
Ackerberg D., L. Benkard, S. Berry, and A. Pakes. 2007. “Econometric Tools for Analyzing Market Outcomes.” In The Handbook of Econometrics, Vol. 6A, edited by J. Heckman and E. Learner, 4171–276. Amsterdam: North-Holland.
Ackerberg, D., K. Caves, and G. Frazer. 2015. “Identification Properties of Recent Production Function Estimators.” Econometrica 83 (6, November): 2411–51.
Arellano, M., and S. Bond. 1991. “Some Tests of Specification for Panel Data: Monte Carlo Evidence and an Application to Employment Equations.” Review of Economic Studies 58 (2): 277−97.
Blundell, R., and S. Bond. 1998. “Initial Conditions and Moment Restrictions in Dynamic Panel Data Models.” Journal of Econometrics 87: 115−43.
Cusolito, A., J. De Loecker, and F. Biondi. 2018. “A Frontier Productivity Diagnostic for Micro and Macro Analysis and Country Engagement.” World Bank, Washington, DC.
De Loecker. J. 2011 “Product Differentiation, Multi-Product Firms and Estimating the Impact of Trade Liberalization on Productivity.” Econometrica 79 (5, September): 1407–51.
———. 2013. “Detecting Learning by Exporting.” American Economic Journal: Microeconomics 5 (3, August): 1−21.
De Loecker, J., and A. Collard-Wexler. 2015. “Reallocation and Technology: Evidence from the US Steel Industry.” American Economic Review 105 (1, January): 131–71.
De Loecker, J., and J. Eeckhout. 2018. “Global Market Power.” http://www.janeeckhout.com/wp - content/uploads/Global.pdf.
De Loecker, J., and P. K. Goldberg. 2014. “Firm Performance in a Global Market.” Annual Review of Economics 6 (1): 201–27.
De Loecker, J., P. Goldberg, A. Khandelwal, and N. Pavcnik. 2016. “Prices, Markups, and Trade Reform.” Econometrica 84 (2): 445–510.
De Loecker, J., and P. T. Scott. 2016. “Estimating Market Power. Evidence from the US Brewing Industry.” NBER Working Paper 22957, National Bureau of Economic Research, Cambridge, MA.
De Loecker, J., J. Van Biesebroeck, and J. Fuss. 2016. “International Competition and Firm-Level Adjustment in Markups and Production Efficiency.” Working paper.
De Loecker, J., and F. Warzynski. 2012. “Markups and Firm-Level Export Status.” American Economic Review 102 (6, October): 2437−71.
Doraszelski, U., and J. Jaumaundreu. 2013. “R&D and Productivity: Estimating Endogenous Productivity.” Review of Economic Studies 80: 1338−83.
Ericson, R., and A. Pakes. 1995. “Markov-Perfect Industry Dynamics: A Framework for Empirical Work.” Review of Economic Studies 62 (1): 53−82.
Foster, L., J. Haltiwanger, and C. Syverson. 2008. “Reallocation, Firm Turnover, and Efficiency: Selection on Productivity or Profitability?” American Economic Review 98 (1): 394−425.
———. 2016. “The Slow Growth of New Plants: Learning about Demand.” Economica 83 (3289): 91−129.
Gandhi, A., S. Navarro, and D. Rivers. Forthcoming. “On the Identification of Gross Output Production Functions.” Journal of Political Economy.
Gibrat, R. 1931. Les inégalités économiques. Paris: Sirey.
Katayama, H., S. Liu, and J. Tybout. 2009. “Why Plant-Level Productivity Studies Are Often Misleading, and an Alternative Approach to Inference.” International Journal of Industrial Organization 27 (3): 403−13.

170 Productivity Revisited
Klette, T. J., and Z. Griliches. 1996. “The Inconsistency of Common Scale Estimators When Output Prices Are Unobserved and Endogenous.” Journal of Applied Econometrics 11 (4): 343−61.
Levinsohn, J., and A. Petrin. 2003. “Estimating Production Functions Using Inputs to Control for Unobservables.” Review of Economic Studies 70: 317−40.
Olley, S. G., and A. Pakes. 1996. “The Dynamics of Productivity in the Telecommunications Equipment Industry.” Econometrica 64 (6): 1263−97.
Pavcnik, N. 2002. “Trade Liberalization, Exit, and Productivity Improvement: Evidence from Chilean Plants.” Review of Economic Studies 69: 245–76.
Syverson, C. 2004. “Market Structure and Productivity: A Concrete Example.” Journal of Political Economy 112: 1181–222.


The World Bank Group is committed to reducing its environmental footprint. In support of this commitment, we leverage electronic publishing options and print-on-demand technology, which is located in regional hubs world-wide. Together, these initiatives enable print runs to be lowered and shipping distances decreased, resulting in reduced paper consumption, chemical use, greenhouse gas emissions, and waste.
We follow the recommended standards for paper use set by the Green Press Initiative. The majority of our books are printed on Forest Stewardship Council (FSC)–certified paper, with nearly all containing 50–100 percent recycled content. The recycled fiber in our book paper is either unbleached or bleached using totally chlorine-free (TCF), processed chlorine–free (PCF), or enhanced elemental chlorine–free (EECF) processes.
More information about the Bank’s environmental philosophy can be found at http://www.worldbank.org/corporateresponsibility.
ECO-AUDIT
Environmental Benefits Statement