products of lactobacillus delbrueckii subsp. bulgaricus
TRANSCRIPT
microorganisms
Article
Products of Lactobacillus delbrueckii subsp.bulgaricus Strain F17 and Leuconostoc lactis StrainH52 Are Biopreservatives for Improving PostharvestQuality of ‘Red Globe’ Grapes
Xiang Fang 1, Qinchun Duan 2, Zhuo Wang 1, Fuyun Li 1, Jianxiong Du 2, Wencan Ke 2, Diru Liu 1,Ross C. Beier 3 , Xusheng Guo 2 and Ying Zhang 1,*
1 College of Public Health, Lanzhou University, Lanzhou 730000, China; [email protected] (X.F.);[email protected] (Z.W.); [email protected] (F.L.); [email protected] (D.L.)
2 State Key Laboratory of Grassland and Agro-Ecosystems, School of Life Sciences, Lanzhou University,Lanzhou 730000, China; [email protected] (Q.D.); [email protected] (J.D.); [email protected] (W.K.);[email protected] (X.G.)
3 United States Department of Agriculture, Agricultural Research Service, Southern Plains AgriculturalResearch Center, Food and Feed Safety Research Unit, College Station, TX 77845-4988, USA;[email protected]
* Correspondence: [email protected]
Received: 21 March 2020; Accepted: 29 April 2020; Published: 30 April 2020�����������������
Abstract: ‘Red Globe’ table grapes are large, edible, seeded fruit with firm flesh that tastes good, butcan have poor postharvest shelf-life. This study was conducted to explore the effects of products ofLactobacillus delbrueckii subsp. bulgaricus strain F17 and Leuconostoc lactis strain H52 on ‘Red Globe’table grapes for the enhancement of shelf-life and improvement of grape quality characteristicsduring postharvest storage. Strains F17 and H52 were isolated from traditional fermented yakmilk obtained in the Qinghai–Tibetan Plateau. Samples from untreated and treated grapes wereanalyzed for physicochemical, biochemical, and microbiological properties (weight loss, decay rate,pH, total soluble solids content, titratable acidity, total phenols, sensory evaluation, and microbialgrowth) for 20 days. The results demonstrated that supernatants from both strains significantlyreduced weight loss, decay rate, aerobic mesophilic bacteria, and coliform bacteria counts; delayedmaturity and senescence of table grapes; and reduced titratable acidity and total phenols. However,the supernatant of strain F17 was more effective and resulted in better sensory evaluations andhad a significant inhibitory effect on yeast and molds by day 5. Meanwhile, the supernatant fromstrain H52 had a significant inhibitory effect on fungi over the whole storage period. In addition,the results of the Pearson correlation analysis suggested that weight loss, decay rate, total solublesolids content, and microorganisms were highly correlated with the sensory evaluation data andquality of postharvest grapes when treated with the products of strain F17. On the basis of these dataand sensory organoleptic qualities, the supernatant containing products from strain F17 had the bestpotential as a biopreservative to improve the postharvest quality of ‘Red Globe’ table grapes.
Keywords: biopreservative; grapes; Lactobacillus delbrueckii subsp. bulgaricus strain F17; Leuconostoclactis strain H52; postharvest; products
1. Introduction
‘Red Globe’ table grapes are large, edible, seeded fruit with firm flesh that tastes good, but canhave poor postharvest shelf-life. Fruits and vegetables are recommended as a regular part of the human
Microorganisms 2020, 8, 656; doi:10.3390/microorganisms8050656 www.mdpi.com/journal/microorganisms
Microorganisms 2020, 8, 656 2 of 16
diet because they contain antioxidants, dietary fiber, minerals, and vitamins, as well as other beneficialsubstances that help support good human health [1]. Nevertheless, most fruits are susceptible tophysical injury and microbial invasion, resulting in a short postharvest life. Therefore, our laboratoryhas been studying the problem of how to extend the shelf-life and improve the quality of postharvestfruit and vegetables. With this question in mind, we selected ‘Red Globe’ table grapes to investigateways of improving their postharvest shelf-life.
Table grapes are not only delectable and nutritious, but also a source of polyphenols and resveratrol,with high economic and dietary value [2]. Polyphenols are important bioactive substances and areproducts of grape berries, which play an important role in grape flavor; color; taste; and many probioticfunctions such as anti-oxidation, anti-cancer, and prevention of cardiovascular and cerebrovasculardiseases [3]. Moreover, resveratrol from grapes also has anti-inflammation and anticancer properties [4].These characteristics have caused added interest for daily consumption, resulting in market demand ofhigh-quality table grapes [5]. However, table grapes are a highly perishable, non-climacteric fruit thatundergoes a variety of postharvest deteriorations including weight loss, softening, loss of nutritional,and functional compounds either at room or refrigerated temperatures during storage [6]. Furthermore,owing to a high sugar content, water content, thin skin, soft flesh, and susceptibility to infections bypathogenic bacteria, grapes are extremely perishable during storage, transportation, and sales, whichgreatly reduces the quality and commodity value of grapes.
The quality of postharvest table grapes in China and abroad is widely attempted to be maintainedusing sulfur dioxide (SO2) fumigation [7]. Moreover, numerous studies have shown that SO2 fumigationcan significantly inhibit most common pathogens that cause grape decay, such as gray mold andRhizopus nigricans [8,9]. However, the residue concentration of SO2 is one key factor used to determinethe quality of postharvest grapes, and the levels of residues are difficult to control during the fumigationtreatment process. Once SO2 fumigation leads to improper levels of SO2 residues, these residuescan both be potentially harmful to human health and give a sulfurous flavor to the table grapes [10].As consumer awareness of food contamination and human health has increased, most consumers aremore aware of food safety issues and are critical of the use of chemical preservatives, as well as thepreferable preservation technologies that will keep foods safe and free of chemicals [10,11]. In addition,coating table grapes with ‘aloe vera gel’ could reduce the loss of phenolics and ascorbic acid, resultingin a higher retention of total antioxidant activity, which improved the overall preservation of grapeberries during cold storage and extended the shelf-life of grapes [12]. Therefore, some researchers haveturned their attention to safe, pollution-free, environmentally friendly preservation technologies. It isworth noting that biological preservation technologies, as an alternative to chemical fungicides, havebeen recognized as promising methods to control postharvest diseases in fruits and vegetables [13].The biological preservation technologies are often applied as edible antimicrobial coatings or theaddition of natural antibacterial substances on the surface of fruits [14–16].
As it is possible to inhibit microbial growth by introducing other competitive microorganisms thatare beneficial to humans, some microorganisms with biological protective effects have been proposed asbiological preservatives [10]. Lactobacillus is a bacterium found in the natural microbiome of meat, milk,vegetables, and fish, and is used both as a protective culture and a producer of bacteriocins [17], and ithas a long history of safe use in food. Moreover, Lactobacillus are generally recognized as safe (GRAS) bythe U.S. Food and Drug Administration. Therefore, Lactobacillus delbrueckii subsp. bulgaricus strain F17and Leuconostoc lactis strain H52, which were isolated from traditional fermented yak milk obtained inthe Qinghai–Tibetan Plateau, were selected for this experiment. On the basis of previous studies in ourlaboratory, strains F17 and H52 possess favorable antioxidant activities. In addition, it was discoveredthat F17 produces a class IIa bacteriocin and H52 produces exopolysaccharides [18,19]. Subsp. bulgaricusis a lactic acid producing bacterium [20,21], and is acid tolerant [22]. It was demonstrated that F17and H52 can significantly inhibit foodborne pathogens [18,19] such as Salmonella typhi, Staphylococcusaureus, Listeria monocytogenes, and Escherichia coli [23].

Microorganisms 2020, 8, 656 3 of 16
Although Lactobacillus and their metabolites are widely used to control foodborne pathogensand spoilage organisms in meat products to ensure food quality and safety [24–27], to the best ofour knowledge, the application of products of lactic acid bacteria to improve table grape qualityduring storage at 25 ◦C has not been reported. Therefore, the focus of this study was on extending theshelf-life of fresh table grapes using a supernatant of Lactobacillus containing products as a potentialbiopreservative. Lactobacillus supernatant-treated grapes were compared to the untreated controlgrapes in terms of weight loss, decay rate, stem browning, pH, total soluble solids content (SSC),titratable acidity (TA), total phenols (TP), microbial counts, and sensory evaluation during storageat 0, 5, 10, 15, and 20 d at 25 ◦C. The overall effects of the supernatants of strains F17 and H52 wereevaluated on the preservation of ‘Red Globe’ table grapes.
2. Materials and Methods
2.1. Raw Material
Ripe ‘Red Globe’ table grapes were harvested from a local orchard in Yuzhong County,Gansu province, China. The grapes were immediately transported to the laboratory followingcollection. Grapes with defects such as decay and mechanical damage were discarded and grapeberries of uniform size, shape, and color were selected for the experiment. A total of 600 grape berrieswere randomly divided into the control, and F17 and H52 supernatant-treatment groups. The F17 andH52 grape berry groups were immersed in a fermentation supernatant (see Section 2.2) containingproducts from strain F17 or strain H52 for 2s. Meanwhile, untreated grapes served as the control.Clean plastic boxes containing holes were used to store 10 air-dried grape berries per box at 25 ◦C.
2.2. Preparation of Strains F17 and H52 Fermentation Supernatants
The frozen strains F17 and H52 were removed from a –80 ◦C ultra-low temperature freezer(DW-HL668, Zhongke MeiLing Cryogenics Company, Ltd., Hefei, China) and thawed at roomtemperature, and then cultured in Man–Rogosa–Sharpe (MRS) broth (Qingdao Hope Bio-TechnologyCo., Ltd., Qingdao, China) and incubated at 37 ◦C for 24 h. The bacteria were transferred to fresh MRSbroth and incubated at 37 ◦C for 24 h, then the bacteria count of both F17 and H52 broths was adjustedto 1 × 10⁸ colony forming units (CFU)/mL using a UV/vis double beam U-2910 spectrophotometer(Hitachi, Tokyo, Japan). After that, the fermentation supernatant was separated from the bacteriaby centrifugation at 8000× g for 15 min at 4 ◦C with a cryogenic high-speed Allegra 64R centrifuge(Beckman Coulter, Brea, CA, USA). The bacterial precipitate was discarded and the supernatantscontaining the products of strains F17 and H52 were stored at 4 ◦C until use.
2.3. Determination of Weight Loss
Weight loss of the table grapes in each group during storage was measured by monitoring theweight change of the grape berries after 0, 5, 10, 15, and 20 d of storage at 25 ◦C. Weight loss wascalculated as the percentage loss of initial weight [28].
2.4. Decay Assessment
During storage, decay incidence was monitored by determining the natural microorganismsassociated with the grape berries, and the disease severity of each grape berry was evaluated accordingto the following empirical scale [29]: ‘0’ = intact grape berry; ‘1’ = one lesion less than 2 mm in diameter;‘2’ = one lesion less than 5 mm in diameter; ‘3’ = several lesions or less than 25% of the grape berrysurface infected; and ‘4’ = more than 25% of the grape berry surface infected, and if sporulation wasobserved. The decay index (DI) was calculated using the following formula and expressed as % [29]:
DI =
∑(d× f)
N×D(1)
Microorganisms 2020, 8, 656 4 of 16
where d is the degree of rot severity scored on a grape berry and f is its respective quantity, N is thetotal number of grape berries examined, and D is the highest degree of disease severity occurring onthe scale shown above.
2.5. Stem Browning Assessment
The browning grade was determined by visual scoring on a 0–4 scale according to the colorchange of the grape stem [30]. The scoring criteria use was as follows: ‘0’ meant the cap stem wasgreen and healthy; ‘1’ represents a slight browning of the cap stem; ‘2’ indicates a slight to moderatebrowning of the cap stem; ‘3’ represents a moderate browning of the cap stem and secondary stem;and ‘4’ meant the cap stem and secondary stem are fully brown. When no browning was observed, thestem browning grade was assigned a zero; when there was full browning, the grade of stem browningwas four. The grape berries were evaluated in duplicate by a team of individuals with a central personconfirming the agreement in stem browning assessment and expressed as %.
2.6. Chemical Analysis of Grape Juice: Measurement of Total SSC, pH, and TA
Grape juice was obtained using a food blender after the seeds were removed. The juice wasthen filtered through four layers of cheesecloth in preparation for measurement of total SSC and pH.Total SSC was measured by a hand-held refractometer (RHB-18ATC, Shanghai, China) at 20 ◦C andthe appropriate temperature correction adjustments were applied, and the results were expressed as%. The pH was determined by using a PB-10 pH meter (Sartorius, Göttingen, Germany). TA wasdetermined by potentiometric titration with 0.1 N NaOH up to pH = 8.2 and expressed in % of tartaricacid [31]. All experiments were performed in quadruplicate.
2.7. Assay of Total Phenols
Total phenols were measured according to the method described by Sánchez-González et al. [16].Table grape tissue (35 g) was suspended in 40 mL of methanol and 10 mL of 6 N HCl. The mixture washomogenized in a grinder (Jiuyang, Jinan, China) for 5 min, and then the supernatant was obtained bycentrifugation at 10,000× g for 10 min at 4 ◦C. The total phenol content in the table grape berry tissuesupernatant was determined based on the Folin–Ciocalteu method [16]. The supernatant (250 µL),ultrapure water (15 mL), and 1.25 mL of the Folin–Ciocalteu reagent (Solarbio, Beijing, China) wereadded in a 25 mL brown volumetric flask and held for 8 min. Then, 7.5% Na2CO3 (3.75 mL) wasadded followed by ultrapure water to a total volume of 25 mL. The reaction mixture in the brownvolumetric flask was incubated in darkness for 2 h at room temperature. The absorbance of the reactionmixture was measured using a U-2910 spectrophotometer at 765 nm. A gallic acid standard (BeijingSolarbio Science & Technology Co., Ltd., Beijing, China) was used to generate a standard curve, andthe total phenols were expressed as mg of gallic acid equivalents per gram of grape berry weight.The absorbance measurement of each sample was carried out in triplicate.
2.8. Microbiological Analysis
Aerobic mesophilic bacteria (AMB), yeast and molds (YAMs), and coliform bacteria (CB) countswere evaluated in all groups throughout the entire grape storage period. Sterile physiological saline(225 mL) was added to each sample and control group (25 g of grape tissue/group). The microbespresent on the surface of the table grapes were fully dissolved in the physiological saline with the aid ofa constant temperature shaking incubator (SPH-2102, Shanghai Shiping Experimental Equipment Co.,Ltd., Shanghai, China) at 60 rpm for 35 min at 25 ◦C. Serial dilutions of grape surface microbial fluidwere plated on plate count agar (PCA) (Qingdao Hope Bio-Technology Co., Ltd., Qingdao, China) todetermine AMB, and potato dextrose agar (PDA) (Beijing Aoboxing Bio-Technology Co., Ltd., Beijing,China) and violet red bile agar (VRBA, Qingdao Hope Bio-Technology Co., Ltd., Qingdao, China) wereused for enumeration of AMB, YAMs, and CB. PCA, PDA, and VRBA plates were incubated for 48 h at30 ◦C, for 5 d at 25 ◦C, and for 1–2 d at 37 ◦C, respectively. Microbial counts were evaluated at 0, 5, 10,
Microorganisms 2020, 8, 656 5 of 16
15, and 20 d of sample storage at 25 ◦C. The results were expressed as log CFU/g grape berry weight,and each treatment of four replicates was analyzed in duplicate.
2.9. Sensory Evaluation
Sensory evaluation of table grapes was based on the observed glossiness, color, odor, appearance,and overall acceptability parameters [14,32], and the tasting parameters were not required for this step.The sensory quality, purchase intention, and acceptable evaluation test were performed by the panelistson day 0, 5, 10, 15, and 20. Panelists were individuals that frequently purchased and consumed grapes.Purchase intention was assessed with a five-point structured hedonic scale, ranging from 1 to 5: a ‘1’meant they certainly would not buy the grapes, and a ‘5’ meant they certainly would buy the grapes.In addition, a nine-point hedonic scale was used with the following scoring definitions: a ‘1’ meant anextreme dislike for the grapes, a ‘5’ meant they neither had a like nor dislike for the grapes, and a ‘9’meant they had an extreme liking for the grapes [33]. The sensory evaluation of the grape berries wasevaluated in duplicate by a team of seven individuals with a central person confirming the agreementin sensory assessment.
2.10. Statistical Analysis
The results of physicochemical properties and microbial counts were expressed as the means ±standard deviation of four parallel samples. The statistical significance of the difference between thethree groups was tested using analysis of variance (ANOVA). The Tukey test was applied for posthoc comparisons. Pearson correlation analysis was performed by selecting indicators to evaluate theextent of relationships between the groups. All of the above statistical analyses were completed usingIBM SPSS Statistical Analysis Software v. 22.0.0.0 (SPSS Inc., Somers, NY, USA) for Windows software,and the significance level was defined at p < 0.05.
3. Results
3.1. Weight Loss
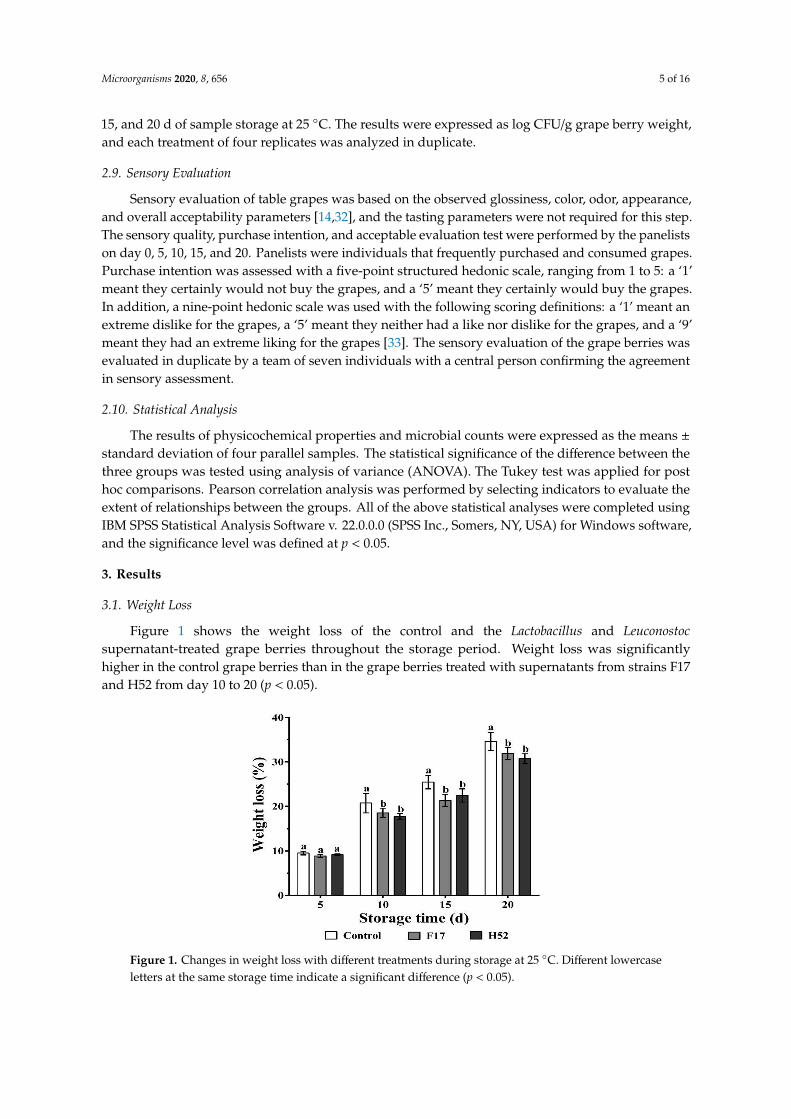
Figure 1 shows the weight loss of the control and the Lactobacillus and Leuconostocsupernatant-treated grape berries throughout the storage period. Weight loss was significantlyhigher in the control grape berries than in the grape berries treated with supernatants from strains F17and H52 from day 10 to 20 (p < 0.05).
Microorganisms 2020, 8, x 5 of 16
were evaluated at 0, 5, 10, 15, and 20 d of sample storage at 25 °C. The results were expressed as log
CFU/g grape berry weight, and each treatment of four replicates was analyzed in duplicate.
2.9. Sensory Evaluation
Sensory evaluation of table grapes was based on the observed glossiness, color, odor,
appearance, and overall acceptability parameters [14,32], and the tasting parameters were not
required for this step. The sensory quality, purchase intention, and acceptable evaluation test were
performed by the panelists on day 0, 5, 10, 15, and 20. Panelists were individuals that frequently
purchased and consumed grapes. Purchase intention was assessed with a five-point structured
hedonic scale, ranging from 1 to 5: a ‘1’ meant they certainly would not buy the grapes, and a ‘5’
meant they certainly would buy the grapes. In addition, a nine-point hedonic scale was used with the
following scoring definitions: a ‘1’ meant an extreme dislike for the grapes, a ‘5’ meant they neither
had a like nor dislike for the grapes, and a ‘9’ meant they had an extreme liking for the grapes [33].
The sensory evaluation of the grape berries was evaluated in duplicate by a team of seven individuals
with a central person confirming the agreement in sensory assessment.
2.10. Statistical Analysis
The results of physicochemical properties and microbial counts were expressed as the means ±
standard deviation of four parallel samples. The statistical significance of the difference between the
three groups was tested using analysis of variance (ANOVA). The Tukey test was applied for post
hoc comparisons. Pearson correlation analysis was performed by selecting indicators to evaluate the
extent of relationships between the groups. All of the above statistical analyses were completed using
IBM SPSS Statistical Analysis Software v. 22.0.0.0 (SPSS Inc., Somers, NY, USA) for Windows
software, and the significance level was defined at p < 0.05.
3. Results
3.1. Weight Loss
Figure 1 shows the weight loss of the control and the Lactobacillus and Leuconostoc
supernatant-treated grape berries throughout the storage period. Weight loss was significantly
higher in the control grape berries than in the grape berries treated with supernatants from strains
F17 and H52 from day 10 to 20 (p < 0.05).
Figure 1. Changes in weight loss with different treatments during storage at 25 °C. Different lowercase
letters at the same storage time indicate a significant difference (p < 0.05).
Figure 1. Changes in weight loss with different treatments during storage at 25 ◦C. Different lowercaseletters at the same storage time indicate a significant difference (p < 0.05).
Microorganisms 2020, 8, 656 6 of 16
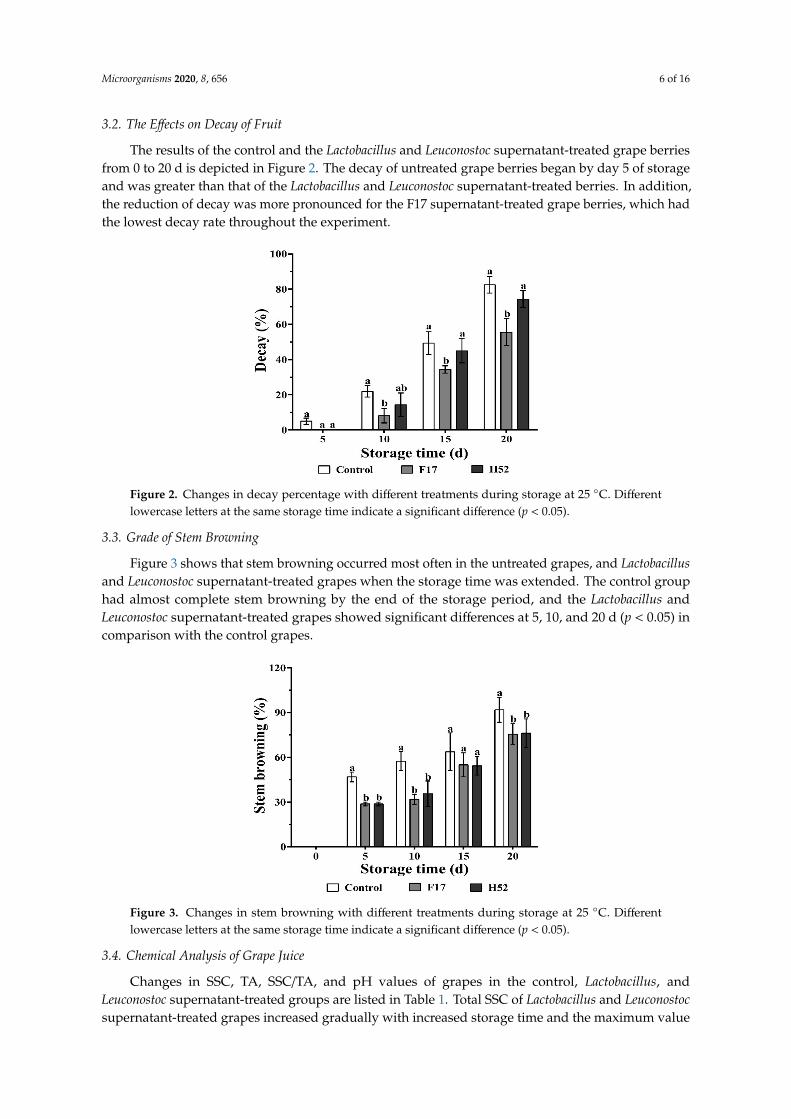
3.2. The Effects on Decay of Fruit
The results of the control and the Lactobacillus and Leuconostoc supernatant-treated grape berriesfrom 0 to 20 d is depicted in Figure 2. The decay of untreated grape berries began by day 5 of storageand was greater than that of the Lactobacillus and Leuconostoc supernatant-treated berries. In addition,the reduction of decay was more pronounced for the F17 supernatant-treated grape berries, which hadthe lowest decay rate throughout the experiment.
Microorganisms 2020, 8, x 6 of 16
3.2. The Effects on Decay of Fruit
The results of the control and the Lactobacillus and Leuconostoc supernatant-treated grape berries from 0 to 20 d is depicted in Figure 2. The decay of untreated grape berries began by day 5 of storage and was greater than that of the Lactobacillus and Leuconostoc supernatant-treated berries. In addition, the reduction of decay was more pronounced for the F17 supernatant-treated grape berries, which had the lowest decay rate throughout the experiment.
Figure 2. Changes in decay percentage with different treatments during storage at 25 °C. Different lowercase letters at the same storage time indicate a significant difference (p < 0.05).
3.3. Grade of Stem Browning
Figure 3 shows that stem browning occurred most often in the untreated grapes, and Lactobacillus and Leuconostoc supernatant-treated grapes when the storage time was extended. The control group had almost complete stem browning by the end of the storage period, and the Lactobacillus and Leuconostoc supernatant-treated grapes showed significant differences at 5, 10, and 20 d (p < 0.05) in comparison with the control grapes.
Figure 3. Changes in stem browning with different treatments during storage at 25 °C. Different lowercase letters at the same storage time indicate a significant difference (p < 0.05).
Figure 2. Changes in decay percentage with different treatments during storage at 25 ◦C. Differentlowercase letters at the same storage time indicate a significant difference (p < 0.05).
3.3. Grade of Stem Browning
Figure 3 shows that stem browning occurred most often in the untreated grapes, and Lactobacillusand Leuconostoc supernatant-treated grapes when the storage time was extended. The control grouphad almost complete stem browning by the end of the storage period, and the Lactobacillus andLeuconostoc supernatant-treated grapes showed significant differences at 5, 10, and 20 d (p < 0.05) incomparison with the control grapes.
Microorganisms 2020, 8, x 6 of 16
3.2. The Effects on Decay of Fruit
The results of the control and the Lactobacillus and Leuconostoc supernatant-treated grape berries from 0 to 20 d is depicted in Figure 2. The decay of untreated grape berries began by day 5 of storage and was greater than that of the Lactobacillus and Leuconostoc supernatant-treated berries. In addition, the reduction of decay was more pronounced for the F17 supernatant-treated grape berries, which had the lowest decay rate throughout the experiment.
Figure 2. Changes in decay percentage with different treatments during storage at 25 °C. Different lowercase letters at the same storage time indicate a significant difference (p < 0.05).
3.3. Grade of Stem Browning
Figure 3 shows that stem browning occurred most often in the untreated grapes, and Lactobacillus and Leuconostoc supernatant-treated grapes when the storage time was extended. The control group had almost complete stem browning by the end of the storage period, and the Lactobacillus and Leuconostoc supernatant-treated grapes showed significant differences at 5, 10, and 20 d (p < 0.05) in comparison with the control grapes.
Figure 3. Changes in stem browning with different treatments during storage at 25 °C. Different lowercase letters at the same storage time indicate a significant difference (p < 0.05).
Figure 3. Changes in stem browning with different treatments during storage at 25 ◦C. Differentlowercase letters at the same storage time indicate a significant difference (p < 0.05).
3.4. Chemical Analysis of Grape Juice
Changes in SSC, TA, SSC/TA, and pH values of grapes in the control, Lactobacillus, andLeuconostoc supernatant-treated groups are listed in Table 1. Total SSC of Lactobacillus and Leuconostocsupernatant-treated grapes increased gradually with increased storage time and the maximum value

Microorganisms 2020, 8, 656 7 of 16
was reached at the end of storage, whereas the control grapes peaked at day 10 of storage andthen progressively decreased. The total SSC of the strain H52 supernatant-treated grapes increasedthroughout storage, but decreased below the total SSC of the grapes treated with the strain H52supernatant on day 20. The grape berries treated with the supernatant from strain F17 maintained ahigh level of total SSC throughout the storage period.
Table 1. SSC (%), TA (%), SSC/TA, and pH with different treatments on ‘Red Globe’ table grapes duringstorage at 25 ◦C.
Indicators TreatmentStorage Times (Days)
0 5 10 15 20
SSC Control 15.00 ± 0.10 a 16.00 ± 0.71 a 19.63 ± 0.65 a 18.00 ± 0.61 a 17.45 ± 0.36 a
F17 15.00 ± 0.10 a 15.38 ± 0.41 a 17.50 ± 0.35 b 18.38 ± 1.08 a 20.25 ± 0.25 b
H52 15.00 ± 0.10 a 15.75 ± 0.56 a 18.25 ± 0.25 b 19.88 ± 0.74 b 19.50 ± 0.50 b
TA Control 0.67 ± 0.02 a 0.64 ± 0.01 a 0.60 ± 0.01 a 0.57 ± 0.02 a 0.50 ± 0.01 a
F17 0.68 ± 0.02 a 0.67 ± 0.01 a 0.63 ± 0.01 a 0.62 ± 0.03 b 0.56 ± 0.02 b
H52 0.68 ± 0.03 a 0.65 ± 0.02 a 0.61 ± 0.01 a 0.59 ± 0.00 ab 0.53 ± 0.01 ab
SSC/TA Control 22.49 ± 0.65 a 25.01 ± 1.33 a 32.52 ± 1.45 a 31.90 ± 1.67 ab 34.73 ± 0.56 a
F17 22.13 ± 0.86 a 23.04 ± 0.54 a 27.89 ± 0.67 b 29.80 ± 1.85 b 36.19 ± 1.13 a
H52 22.27 ± 1.12 a 24.42 ± 0.61 a 30.08 ± 1.16 ab 33.59 ± 1.91 a 36.83 ± 1.52 a
pH Control 3.51 ± 0.02 a 3.52 ± 0.03 a 3.54 ± 0.02 a 3.57 ± 0.01 a 3.63 ± 0.02 a
F17 3.48 ± 0.02 a 3.45 ± 0.02 b 3.49 ± 0.03 a 3.52 ± 0.02 b 3.56 ± 0.05 b
H52 3.48 ± 0.02 a 3.46 ± 0.03 b 3.51 ± 0.01 a 3.55 ± 0.02 ab 3.60 ± 0.02 ab
SSC = soluble solids content; TA = titratable acidity; data = mean ± standard deviation (SD) of three replicates. a,b
Different lowercase superscripts indicate a significant difference (p < 0.05).
The TA of grapes in all groups gradually decreased over the entire storage period, while thelargest TA decrease was observed in the control grapes, from 0.67 to 0.5, at ∆ = 0.17 (Table 1). In general,the rate of SSC/TA in all samples showed an upward trend with storage time and reached a maximumvalue at 20 d of storage. The value of SSC/TA in the Lactobacillus and Leuconostoc supernatant-treatedgrapes progressively increased and reached a maximum value at 20 d, while the value of SSC/TAin the control grapes increased through day 10 to 32.52 and then decreased at day 15, and slightlyincreased again at day 20. The SSC/TA from the strain F17 supernatant-treated grapes was always asomewhat lower value than the SSC/TA of the strain H52 supernatant-treated grapes with the SSC/TAat day 20 of F17 and H52 achieving 36.19 and 36.83, respectively. Table 1 shows the pH of grapes in allsamples increased with storage time and reached a maximum value by the end of the storage period.However, the pH values of the strains F17 and H52 supernatant-treated grapes showed the lowestvalues following the 5d storage period. Overall, the Lactobacillus and Leuconostoc supernatant-treatedgrapes showed the lowest pH values in comparison with the control grapes at all storage times.
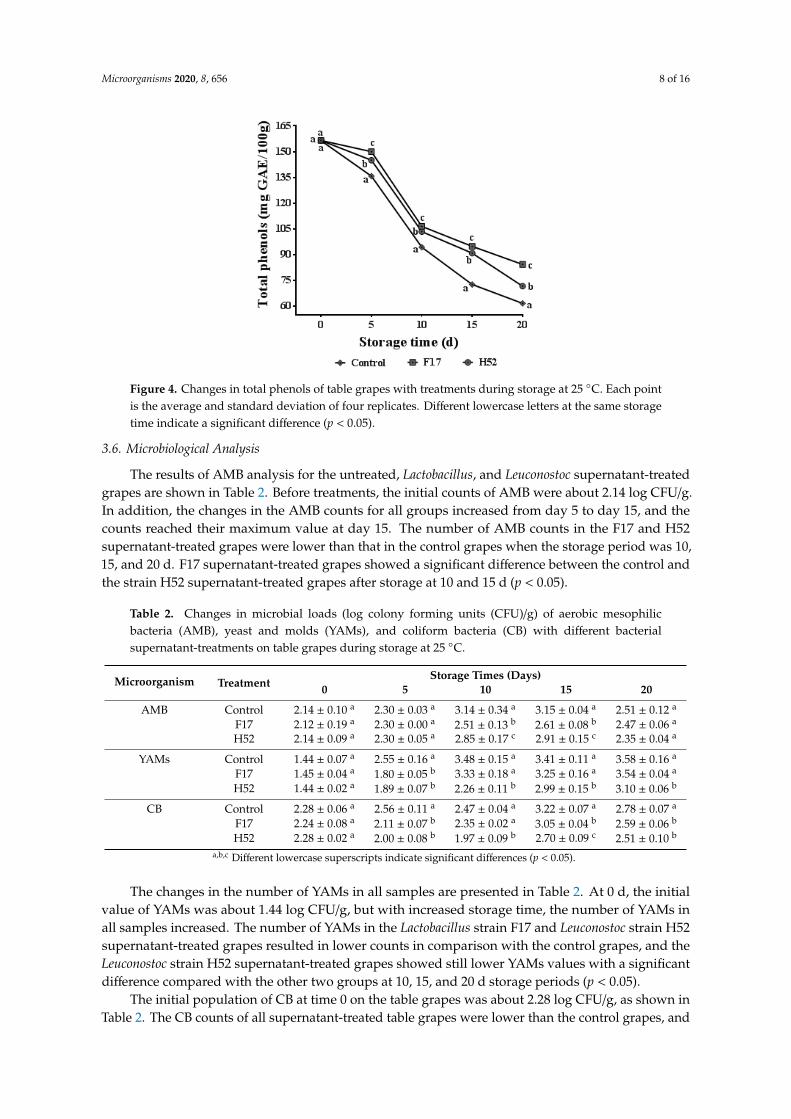
3.5. Changes in Total Phenols
The effects of different treatments on total phenols are shown in Figure 4. During the storageperiod, total phenols decreased in all groups over the storage time. Total phenols of the Lactobacillusand Leuconostoc supernatant-treated grapes were significantly higher than that of the control grapes atall storage times (p < 0.05), and the Lactobacillus strain F17 supernatant-treated grapes had the highesttotal phenols.
Microorganisms 2020, 8, 656 8 of 16Microorganisms 2020, 8, x 8 of 16
Figure 4. Changes in total phenols of table grapes with treatments during storage at 25 °C. Each point is the average and standard deviation of four replicates. Different lowercase letters at the same storage time indicate a significant difference (p < 0.05).
3.6. Microbiological Analysis
The results of AMB analysis for the untreated, Lactobacillus, and Leuconostoc supernatant-treated grapes are shown in Table 2. Before treatments, the initial counts of AMB were about 2.14 log
CFU/g. In addition, the changes in the AMB counts for all groups increased from day 5 to day 15, and the counts reached their maximum value at day 15. The number of AMB counts in the F17 and H52 supernatant-treated grapes were lower than that in the control grapes when the storage period was 10, 15, and 20 d. F17 supernatant-treated grapes showed a significant difference between the control and the strain H52 supernatant-treated grapes after storage at 10 and 15 d (p < 0.05).
Table 2. Changes in microbial loads (log colony forming units (CFU)/g) of aerobic mesophilic bacteria (AMB), yeast and molds (YAMs), and coliform bacteria (CB) with different bacterial supernatant-treatments on table grapes during storage at 25 °C.
Microorganism Treatment Storage Times (days)
0 5 10 15 20 AMB Control 2.14 ± 0.10 a 2.30 ± 0.03 a 3.14 ± 0.34 a 3.15 ± 0.04 a 2.51 ± 0.12 a
F17 2.12 ± 0.19 a 2.30 ± 0.00 a 2.51 ± 0.13 b 2.61 ± 0.08 b 2.47 ± 0.06 a H52 2.14 ± 0.09 a 2.30 ± 0.05 a 2.85 ± 0.17 c 2.91 ± 0.15 c 2.35 ± 0.04 a
YAMs Control 1.44 ± 0.07 a 2.55 ± 0.16 a 3.48 ± 0.15 a 3.41 ± 0.11 a 3.58 ± 0.16 a F17 1.45 ± 0.04 a 1.80 ± 0.05 b 3.33 ± 0.18 a 3.25 ± 0.16 a 3.54 ± 0.04 a H52 1.44 ± 0.02 a 1.89 ± 0.07 b 2.26 ± 0.11 b 2.99 ± 0.15 b 3.10 ± 0.06 b
CB Control 2.28 ± 0.06 a 2.56 ± 0.11 a 2.47 ± 0.04 a 3.22 ± 0.07 a 2.78 ± 0.07 a F17 2.24 ± 0.08 a 2.11 ± 0.07 b 2.35 ± 0.02 a 3.05 ± 0.04 b 2.59 ± 0.06 b H52 2.28 ± 0.02 a 2.00 ± 0.08 b 1.97 ± 0.09 b 2.70 ± 0.09 c 2.51 ± 0.10 b
a,b,c Different lowercase superscripts indicate significant differences (p < 0.05).
The changes in the number of YAMs in all samples are presented in Table 2. At 0 d, the initial value of YAMs was about 1.44 log CFU/g, but with increased storage time, the number of YAMs in all samples increased. The number of YAMs in the Lactobacillus strain F17 and Leuconostoc strain H52 supernatant-treated grapes resulted in lower counts in comparison with the control grapes, and the Leuconostoc strain H52 supernatant-treated grapes showed still lower YAMs values with a significant difference compared with the other two groups at 10, 15, and 20 d storage periods (p < 0.05).
The initial population of CB at time 0 on the table grapes was about 2.28 log CFU/g, as shown in Table 2. The CB counts of all supernatant-treated table grapes were lower than the control grapes, and Leuconostoc strain H52 supernatant-treated grapes had the lowest number of CB counts among all groups during the entire storage period (p < 0.05). The number of CB from the strain H52
Figure 4. Changes in total phenols of table grapes with treatments during storage at 25 ◦C. Each pointis the average and standard deviation of four replicates. Different lowercase letters at the same storagetime indicate a significant difference (p < 0.05).
3.6. Microbiological Analysis
The results of AMB analysis for the untreated, Lactobacillus, and Leuconostoc supernatant-treatedgrapes are shown in Table 2. Before treatments, the initial counts of AMB were about 2.14 log CFU/g.In addition, the changes in the AMB counts for all groups increased from day 5 to day 15, and thecounts reached their maximum value at day 15. The number of AMB counts in the F17 and H52supernatant-treated grapes were lower than that in the control grapes when the storage period was 10,15, and 20 d. F17 supernatant-treated grapes showed a significant difference between the control andthe strain H52 supernatant-treated grapes after storage at 10 and 15 d (p < 0.05).
Table 2. Changes in microbial loads (log colony forming units (CFU)/g) of aerobic mesophilicbacteria (AMB), yeast and molds (YAMs), and coliform bacteria (CB) with different bacterialsupernatant-treatments on table grapes during storage at 25 ◦C.
Microorganism TreatmentStorage Times (Days)
0 5 10 15 20
AMB Control 2.14 ± 0.10 a 2.30 ± 0.03 a 3.14 ± 0.34 a 3.15 ± 0.04 a 2.51 ± 0.12 a
F17 2.12 ± 0.19 a 2.30 ± 0.00 a 2.51 ± 0.13 b 2.61 ± 0.08 b 2.47 ± 0.06 a
H52 2.14 ± 0.09 a 2.30 ± 0.05 a 2.85 ± 0.17 c 2.91 ± 0.15 c 2.35 ± 0.04 a
YAMs Control 1.44 ± 0.07 a 2.55 ± 0.16 a 3.48 ± 0.15 a 3.41 ± 0.11 a 3.58 ± 0.16 a
F17 1.45 ± 0.04 a 1.80 ± 0.05 b 3.33 ± 0.18 a 3.25 ± 0.16 a 3.54 ± 0.04 a
H52 1.44 ± 0.02 a 1.89 ± 0.07 b 2.26 ± 0.11 b 2.99 ± 0.15 b 3.10 ± 0.06 b
CB Control 2.28 ± 0.06 a 2.56 ± 0.11 a 2.47 ± 0.04 a 3.22 ± 0.07 a 2.78 ± 0.07 a
F17 2.24 ± 0.08 a 2.11 ± 0.07 b 2.35 ± 0.02 a 3.05 ± 0.04 b 2.59 ± 0.06 b
H52 2.28 ± 0.02 a 2.00 ± 0.08 b 1.97 ± 0.09 b 2.70 ± 0.09 c 2.51 ± 0.10 b
a,b,c Different lowercase superscripts indicate significant differences (p < 0.05).
The changes in the number of YAMs in all samples are presented in Table 2. At 0 d, the initialvalue of YAMs was about 1.44 log CFU/g, but with increased storage time, the number of YAMs inall samples increased. The number of YAMs in the Lactobacillus strain F17 and Leuconostoc strain H52supernatant-treated grapes resulted in lower counts in comparison with the control grapes, and theLeuconostoc strain H52 supernatant-treated grapes showed still lower YAMs values with a significantdifference compared with the other two groups at 10, 15, and 20 d storage periods (p < 0.05).
The initial population of CB at time 0 on the table grapes was about 2.28 log CFU/g, as shown inTable 2. The CB counts of all supernatant-treated table grapes were lower than the control grapes, and
Microorganisms 2020, 8, 656 9 of 16
Leuconostoc strain H52 supernatant-treated grapes had the lowest number of CB counts among all groupsduring the entire storage period (p < 0.05). The number of CB from the strain H52 supernatant-treatedtable grapes was about 2.51 log CFU/g at 20 d; it was reduced by 0.27 log CFU/g in comparison withthe control grapes. It should also be noted that the supernatant of strain F17 significantly inhibited CBduring the storage periods of 5, 15, and 20 d (p < 0.05).
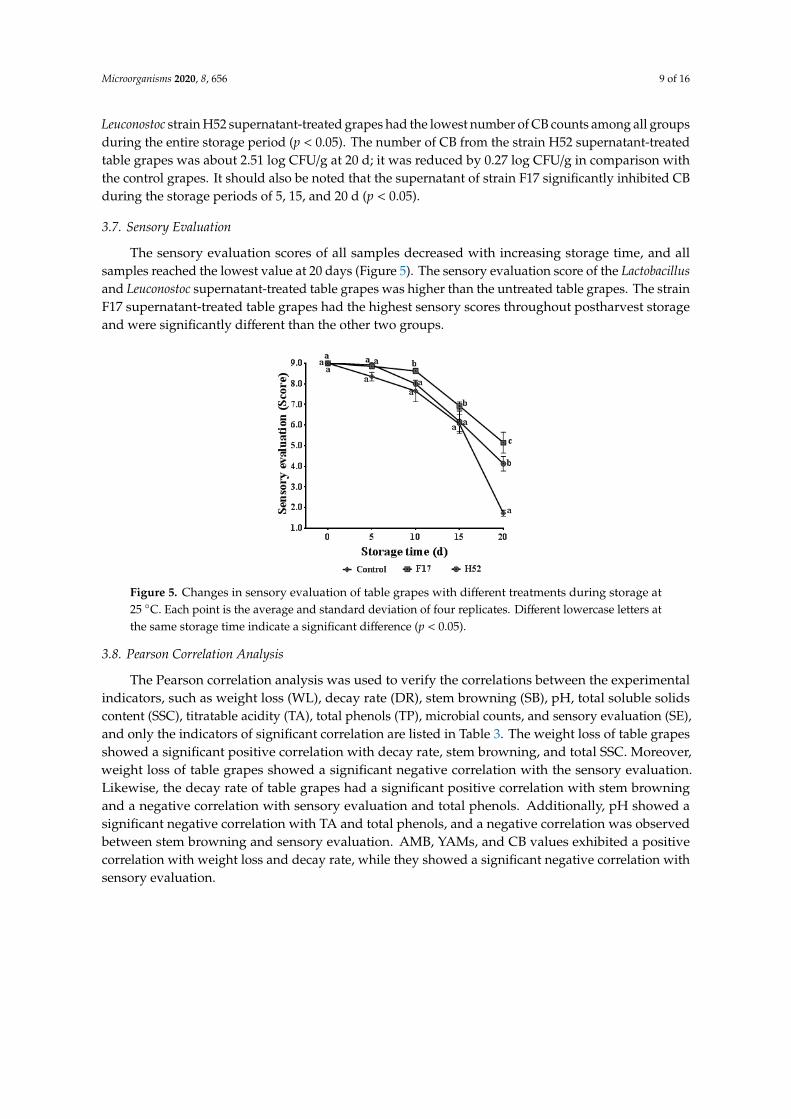
3.7. Sensory Evaluation
The sensory evaluation scores of all samples decreased with increasing storage time, and allsamples reached the lowest value at 20 days (Figure 5). The sensory evaluation score of the Lactobacillusand Leuconostoc supernatant-treated table grapes was higher than the untreated table grapes. The strainF17 supernatant-treated table grapes had the highest sensory scores throughout postharvest storageand were significantly different than the other two groups.
Microorganisms 2020, 8, x 9 of 16
supernatant-treated table grapes was about 2.51 log CFU/g at 20 d; it was reduced by 0.27 log CFU/g in comparison with the control grapes. It should also be noted that the supernatant of strain F17 significantly inhibited CB during the storage periods of 5, 15, and 20 d (p < 0.05).
3.7. Sensory Evaluation
The sensory evaluation scores of all samples decreased with increasing storage time, and all samples reached the lowest value at 20 days (Figure 5). The sensory evaluation score of the Lactobacillus and Leuconostoc supernatant-treated table grapes was higher than the untreated table grapes. The strain F17 supernatant-treated table grapes had the highest sensory scores throughout postharvest storage and were significantly different than the other two groups.
Figure 5. Changes in sensory evaluation of table grapes with different treatments during storage at 25 °C. Each point is the average and standard deviation of four replicates. Different lowercase letters at the same storage time indicate a significant difference (p < 0.05).
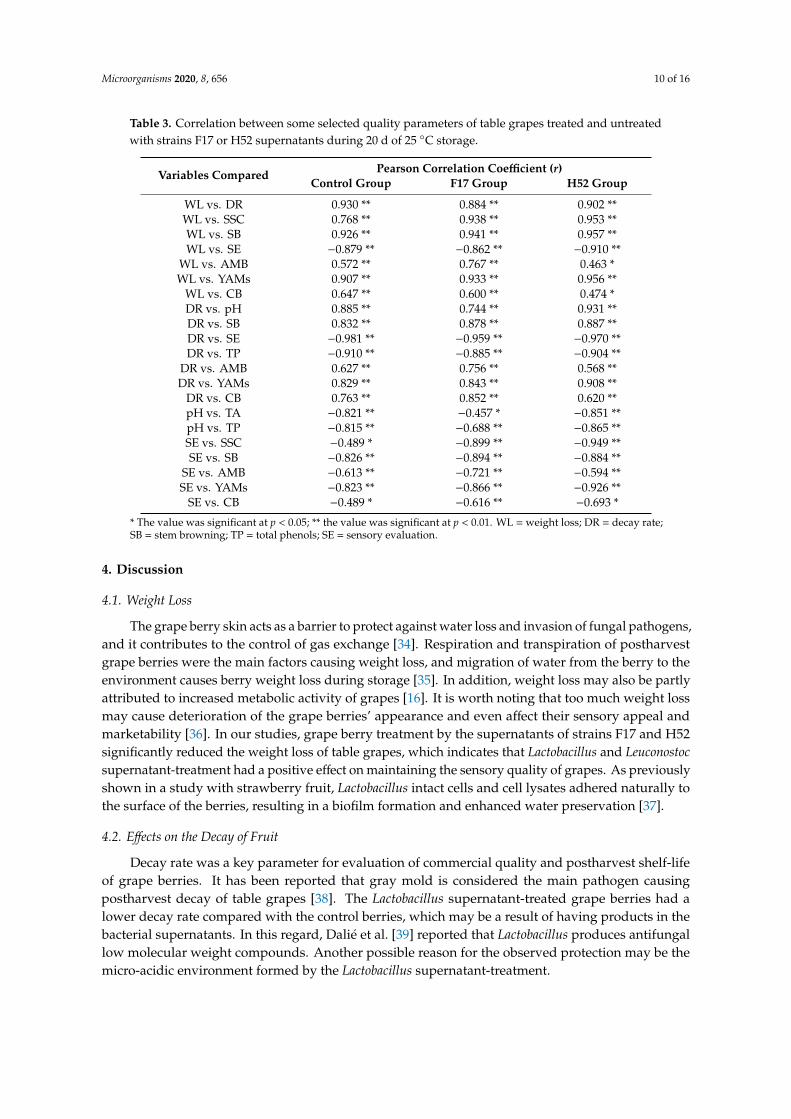
3.8. Pearson Correlation Analysis
The Pearson correlation analysis was used to verify the correlations between the experimental indicators, such as weight loss (WL), decay rate (DR), stem browning (SB), pH, total soluble solids content (SSC), titratable acidity (TA), total phenols (TP), microbial counts, and sensory evaluation (SE), and only the indicators of significant correlation are listed in Table 3. The weight loss of table grapes showed a significant positive correlation with decay rate, stem browning, and total SSC. Moreover, weight loss of table grapes showed a significant negative correlation with the sensory evaluation. Likewise, the decay rate of table grapes had a significant positive correlation with stem browning and a negative correlation with sensory evaluation and total phenols. Additionally, pH showed a significant negative correlation with TA and total phenols, and a negative correlation was observed between stem browning and sensory evaluation. AMB, YAMs, and CB values exhibited a positive correlation with weight loss and decay rate, while they showed a significant negative correlation with sensory evaluation.
Figure 5. Changes in sensory evaluation of table grapes with different treatments during storage at25 ◦C. Each point is the average and standard deviation of four replicates. Different lowercase letters atthe same storage time indicate a significant difference (p < 0.05).
3.8. Pearson Correlation Analysis
The Pearson correlation analysis was used to verify the correlations between the experimentalindicators, such as weight loss (WL), decay rate (DR), stem browning (SB), pH, total soluble solidscontent (SSC), titratable acidity (TA), total phenols (TP), microbial counts, and sensory evaluation (SE),and only the indicators of significant correlation are listed in Table 3. The weight loss of table grapesshowed a significant positive correlation with decay rate, stem browning, and total SSC. Moreover,weight loss of table grapes showed a significant negative correlation with the sensory evaluation.Likewise, the decay rate of table grapes had a significant positive correlation with stem browningand a negative correlation with sensory evaluation and total phenols. Additionally, pH showed asignificant negative correlation with TA and total phenols, and a negative correlation was observedbetween stem browning and sensory evaluation. AMB, YAMs, and CB values exhibited a positivecorrelation with weight loss and decay rate, while they showed a significant negative correlation withsensory evaluation.
Microorganisms 2020, 8, 656 10 of 16
Table 3. Correlation between some selected quality parameters of table grapes treated and untreatedwith strains F17 or H52 supernatants during 20 d of 25 ◦C storage.
Variables Compared Pearson Correlation Coefficient (r)Control Group F17 Group H52 Group
WL vs. DR 0.930 ** 0.884 ** 0.902 **WL vs. SSC 0.768 ** 0.938 ** 0.953 **WL vs. SB 0.926 ** 0.941 ** 0.957 **WL vs. SE −0.879 ** −0.862 ** −0.910 **
WL vs. AMB 0.572 ** 0.767 ** 0.463 *WL vs. YAMs 0.907 ** 0.933 ** 0.956 **
WL vs. CB 0.647 ** 0.600 ** 0.474 *DR vs. pH 0.885 ** 0.744 ** 0.931 **DR vs. SB 0.832 ** 0.878 ** 0.887 **DR vs. SE −0.981 ** −0.959 ** −0.970 **DR vs. TP −0.910 ** −0.885 ** −0.904 **
DR vs. AMB 0.627 ** 0.756 ** 0.568 **DR vs. YAMs 0.829 ** 0.843 ** 0.908 **
DR vs. CB 0.763 ** 0.852 ** 0.620 **pH vs. TA −0.821 ** −0.457 * −0.851 **pH vs. TP −0.815 ** −0.688 ** −0.865 **SE vs. SSC −0.489 * −0.899 ** −0.949 **SE vs. SB −0.826 ** −0.894 ** −0.884 **
SE vs. AMB −0.613 ** −0.721 ** −0.594 **SE vs. YAMs −0.823 ** −0.866 ** −0.926 **
SE vs. CB −0.489 * −0.616 ** −0.693 *
* The value was significant at p < 0.05; ** the value was significant at p < 0.01. WL = weight loss; DR = decay rate;SB = stem browning; TP = total phenols; SE = sensory evaluation.
4. Discussion
4.1. Weight Loss
The grape berry skin acts as a barrier to protect against water loss and invasion of fungal pathogens,and it contributes to the control of gas exchange [34]. Respiration and transpiration of postharvestgrape berries were the main factors causing weight loss, and migration of water from the berry to theenvironment causes berry weight loss during storage [35]. In addition, weight loss may also be partlyattributed to increased metabolic activity of grapes [16]. It is worth noting that too much weight lossmay cause deterioration of the grape berries’ appearance and even affect their sensory appeal andmarketability [36]. In our studies, grape berry treatment by the supernatants of strains F17 and H52significantly reduced the weight loss of table grapes, which indicates that Lactobacillus and Leuconostocsupernatant-treatment had a positive effect on maintaining the sensory quality of grapes. As previouslyshown in a study with strawberry fruit, Lactobacillus intact cells and cell lysates adhered naturally tothe surface of the berries, resulting in a biofilm formation and enhanced water preservation [37].
4.2. Effects on the Decay of Fruit
Decay rate was a key parameter for evaluation of commercial quality and postharvest shelf-lifeof grape berries. It has been reported that gray mold is considered the main pathogen causingpostharvest decay of table grapes [38]. The Lactobacillus supernatant-treated grape berries had alower decay rate compared with the control berries, which may be a result of having products in thebacterial supernatants. In this regard, Dalié et al. [39] reported that Lactobacillus produces antifungallow molecular weight compounds. Another possible reason for the observed protection may be themicro-acidic environment formed by the Lactobacillus supernatant-treatment.
Microorganisms 2020, 8, 656 11 of 16
4.3. Grade of Stem Browning
The grade of stem browning not only reflects the freshness of grapes, but also has a direct effecton the consumer’s intention to purchase the grapes. Moreover, browning and drying of stems maybegin to occur even before the actual deterioration of fruit [40]. Thus, stem browning is often used toevaluate the quality of table grapes from a sensory perspective [9]. In these studies, the Lactobacillusand Leuconostoc supernatant-treated grapes showed lower stem browning than the untreated tablegrapes during the entire storage period. There are two possible reasons for this result. Desiccationis considered the main factor for stem browning, and weight loss of the untreated grapes in thisstudy was significantly higher than that of Lactobacillus or Leuconostoc supernatant-treated grapes.The supernatants of strains F17 and H52 may have possessed favorable antioxidant capacity, whichmay inhibit the activity of oxidase, resulting in reduced stem browning.
4.4. Chemical Analysis of Grape Juice
Total SSC, TA, SSC/TA, and pH are key indicators reflecting the organoleptic quality, maturity,and senescence of table grapes [9,41]. Total SSC of the Lactobacillus and Leuconostoc supernatant-treatedgrapes increased gradually over the length of storage, and reached a maximum value by the endof storage. This result was consistent with the report by Meng et al. [28] showing that the totalSSC of postharvest table grapes gradually increased with the maturity of the grapes stored at 20 ◦C.The decrease in total SSC observed in the control grapes at 15 to 20 d may be explained by the largeloss of water at these times, which is consistent with the weight loss data. The grapes treated with thestrain H52 supernatant maintained a high level of total SSC throughout the storage period, and thisresult may be related to the secretion of exopolysaccharide by strain H52.
Organic acids, primarily tartaric acid, play a key role in grape organoleptic quality. Moreover, thechange of the tartaric acid content is one of the indicators used to measure the grape’s physiologicalprocesses and fresh-keeping ability [42]. The TA content is used as a marker to determine whenthe respiratory substances of postharvest grapes are consumed, and Lactobacillus and Leuconostocsupernatant-treatments appear to reduce the table grape’s respiration. The reduction in TA correlateswith the loss of water in the control grapes. The SSC/TA ratio value is related to the maturity of grapeberries and may be used as an indicator to determine the postharvest senescence of table grapes [43].We observed a progressive increase of SSC/TA in the Lactobacillus and Leuconostoc supernatant-treatedgrapes, which reached maximum values at day 20, while the value of the SSC/TA ratio in the controlgrapes increased only until day 10 and then decreased by day 15. These observations may be interpretedas the supernatant-treatments can delay the onset of maturity and senescence of table grapes. pHhas been used as an indicator that reflects the senescence of grapes [44]. It was shown that, withthe prolongation of storage time, the pH increased owing to utilization of the grape’s organic acidsduring respiration [45]. However, pH values of the strains F17 and H52 supernatant-treated grapespresented the lowest values after being stored for 5 d, and a plausible reason may be that strainsF17 and H52 produce acidic metabolic products such as lactic acid [20,21], or the Lactobacillus andLeuconostoc supernatant-treatments may suppress the decomposition of organic acids by reducing therespiration of grapes.
4.5. Changes in Total Phenols
Polyphenol is an important indicator used to evaluate the internal postharvest quality of grapes,which reflects the antioxidant degree and quality of grapes [46]. The change in total phenols isclosely related to the degree of browning. Polyphenols will consume dissolved oxygen and, togetherwith the action of polyphenol oxidase, will oxidize and polymerize to form quinone substances,which then undergo enzymatic browning [16]. In these studies, the Lactobacillus and Leuconostocsupernatant-treatments significantly increased total phenol production (p < 0.05) and the strain F17supernatant-treated grapes exhibited the greatest retention of total phenols. A possible explanation
Microorganisms 2020, 8, 656 12 of 16
for this result is that strains F17 and H52 possessed a favorable antioxidative capacity and had anantioxidant effect on the grapes.
4.6. Microbiological Analysis
The AMB counts for all groups increased from day 5 to day 15, but the AMB counts of theLactobacillus and Leuconostoc supernatant-treated groups were lower than that in the control groupwhen the storage period was 10, 15, and 20 d. Additionally, AMB counts showed a significant differencein all groups at a storage period of 10 and 15 d (p < 0.05). A likely reason for these observations is thatthe products of Lactobacillus and Leuconostoc, such as bacteriocins, extracellular polysaccharides, andlactic acid, inhibit aerobic mesophilic bacteria; however, inhibition mechanisms are unclear.
The number of YAMs in the Lactobacillus and Leuconostoc supernatant-treated groups showed alower number of YAMs counts in comparison with the control group, and can be explained by theproduction of antifungal low-molecular-weight-compounds, such as organic acids, reuterin, hydrogenperoxide, proteinaceous compounds, hydroxyl fatty acids, and phenolic compounds [39]. The strainH52 supernatant-treatment significantly inhibited YAMs among all groups from day 10 to 20 and maybe a result of production of an extracellular polysaccharide [47].
It was reported that bacterial exopolysaccharides produced by Lactobacillus showed significantantibacterial activity against pathogens such as Cronobacter sakazakii, Escherichia coli, Listeriamonocytogenes, Salmonella Typhimurium, Shigella sonnei, and Staphylococcus aureus [48]. It shouldalso be noted that the strain F17 supernatant-treatment also significantly inhibited CB during thestorage periods of 5, 15, and 20 d (p < 0.05). Inhibition of CB may be a result of a bacteriocin, a productof strain F17 [18].
4.7. Sensory Evaluation
The sensory evaluation score of table grapes was based on the comprehensive evaluation of theglossiness, color, odor, overall appearance, and acceptability parameters, and reflects the consumers’acceptance of postharvest table grapes. The strain F17 supernatant-treated table grapes had the highestsensory scores and were significantly different among the three groups. This demonstrated that thestrain F17 supernatant-treatment significantly improved the sensory quality of postharvest table grapes.Therefore, from a business standpoint, the strain F17 supernatant-treatment was more suitable for tablegrape preservation.
The weight loss of table grapes showed a significant positive correlation with decay rate, stembrowning, and total SSC, and was consistent with the results of Champa et al. [49], who reportedthat weight loss of the grape berry was positively correlated with decay rate. Previous studies haveshown that even a minimal moisture loss could cause visible quality changes in table grapes, such asbrowning [30], and wilting and desiccation [50]. With increased storage time, progressive increases intotal SSC may be interpreted as water evaporation from the berry surface [51]. Weight loss of tablegrapes also showed a significant negative correlation with the sensory evaluation [49], and water losswould lead to deterioration of grape berries. Likewise, Champa et al. [49] found that the decay rate oftable grapes had a significant positive correlation with stem browning and a negative correlation withsensory evaluation and total phenols. In our study, grape decay may lead to the loss of polyphenols.With increased storage time, TA was gradually consumed by grape respiration [52], resulting in theincrease of pH and stem browning [45], which decreased the sensory evaluation scores [53]. The AMB,YAMs, and CB exhibited a positive correlation with weight loss and decay rate of the grape berries,while showing a significant negative correlation with sensory evaluation. These results are consistentbecause microbes consume nutrients and produce harmful substances that can cause grape weightloss and increase the decay rate, which will increase a negative sensory evaluation of grapes. Theseresults suggest that weight loss, decay rate, stem browning, total SSC and microorganisms are highlycorrelated with the sensory evaluation and quality of postharvest grapes. Therefore, the developmentof a biopreservative is expected to have a positive effect on these indicators.
Microorganisms 2020, 8, 656 13 of 16
5. Conclusions
In this study, Lactobacillus delbrueckii subsp. bulgaricus strain F17 and Leuconostoc lactis strainH52 supernatants possessing probiotic properties were developed as potential biopreservativesfor postharvest table grape preservation. Although, supernatants from both strains F17 and H52significantly reduced weight loss, decay rate, and delayed maturity and senescence of table grapes,the supernatant from strain F17 was more effective and resulted in better grape sensory evaluations.For YAMs, strain F17 demonstrated significant initial inhibition in the first five days, while thesupernatant of strain H52 showed a significantly greater growth inhibition during the entire storageperiod. In addition, the Pearson correlation analysis results suggested that weight loss, decay rate,stem browning, total SSC, and microorganisms were all highly correlated with the sensory evaluationand quality of postharvest grapes. On the basis of the overall characteristics and sensory quality ofthe treated grapes, the supernatant containing products of strain F17 was the overall best potentialbiopreservative for improving the postharvest quality of ‘Red Globe’ grapes.
Author Contributions: Conceptualization, X.F. and Y.Z.; methodology, X.F. and Y.Z.; software, X.F., Y.Z., andZ.W.; validation, X.F., Q.D., and Y.Z.; formal analysis, X.F. and F.L.; investigation, X.F., Q.D., Y.Z., Z.W., F.L., andJ.D.; resources, X.F., Q.D., Z.W., F.L., D.L., and Y.Z.; data curation, Z.W. and Y.Z.; writing—original draft, X.F.;writing—review & editing, Y.Z. and R.C.B.; visualization, X.F., D.L., and Y.Z.; supervision, W.K. and X.G.; projectadministration, X.F., Y.Z., and X.G.; funding acquisition, Y.Z. and D.L. All authors have read and agreed to thepublished version of the manuscript.
Funding: This research was funded by the National Natural Science Foundation of China (Beijing, China; projectnumber: 31501976) and the Fundamental Research Funds for the Central Universities of China (Lanzhou, China;project numbers: lzujbky-2018-70 and lzujbky-2018-16).
Conflicts of Interest: The authors declare no conflict of interest.
References
1. Siroli, L.; Patrignani, F.; Serrazanetti, D.I.; Tabanelli, G.; Montanari, C.; Gardini, F.; Lanciotti, R. Lactic acidbacteria and natural antimicrobials to improve the safety and shelf-life of minimally processed sliced applesand lamb’s lettuce. Food Microbiol. 2015, 47, 74–84. [CrossRef]
2. Krikorian, R.; Boespflug, E.L.; Fleck, D.E.; Stein, A.L.; Wightman, J.D.; Shidler, M.D.; Sadat-Hossieny, S.Concord grape juice supplementation and neurocognitive function in human aging. J. Agric. Food Chem.2012, 60, 5736–5742. [CrossRef] [PubMed]
3. Rasines-Perea, Z.; Teissedre, P.-L. Grape polyphenols’ effects in human cardiovascular diseases and diabetes.Molecules 2017, 22, 68. [CrossRef]
4. Jang, M.; Cai, L.; Udeani, G.O.; Slowing, K.V.; Thomas, C.F.; Beecher, C.W.W.; Fong, H.H.S.; Farnsworth, N.R.;Kinghorn, A.D.; Mehta, R.G.; et al. Cancer chemopreventive activity of resveratol, a natural product derivedfrom grapes. Science 1997, 275, 218–220. [CrossRef] [PubMed]
5. Duan, J.; Wu, R.; Strik, B.C.; Zhao, Y. Effect of edible coatings on the quality of fresh blueberries (Duke andElliott) under commercial storage conditions. Postharvest Biol. Technol. 2011, 59, 71–79. [CrossRef]
6. Pastor, C.; Sánchez-González, L.; Marcilla, A.; Chiralt, A.; Cháfer, M.; González-Martínez, C. Quality andsafety of table grapes coated with hydroxypropylmethylcellulose edible coatings containing propolis extract.Postharvest Biol. Technol. 2011, 60, 64–70. [CrossRef]
7. Badosa, E.; Trias, R.; Parés, D.; Pla, M.; Montesinos, E. Microbiological quality of fresh fruit and vegetableproducts in Catalonia (Spain) using normalised plate-counting methods and real time polymerase chainreaction (QPCR). J. Sci. Food Agric. 2008, 88, 605–611. [CrossRef]
8. Abdolahi, A.; Hassani, A.; Ghosta, Y.; Bernousi, I.; Meshkatalsadat, M.H. Study on the potential use ofessential oils for decay control and quality preservation of tabarzeh table grape. J. Plant Prot. Res. 2010, 50,45–52. [CrossRef]
9. Zhang, J.; Li, D.; Xu, W.; Fu, Y. Preservation of Kyoho grapes stored in active, slow-releasing pasteurizingpackaging at room temperature. LWT Food Sci. Technol. 2014, 56, 440–444. [CrossRef]
10. Ma, L.; Zhang, M.; Bhandari, B.; Gao, Z. Recent developments in novel shelf life extension technologies offresh-cut fruits and vegetables. Trends Food Sci. Technol. 2017, 64, 23–38. [CrossRef]
Microorganisms 2020, 8, 656 14 of 16
11. Gol, N.B.; Patel, P.R.; Rao, T.V.R. Improvement of quality and shelf-life of strawberries with edible coatingsenriched with chitosan. Postharvest Biol. Technol. 2013, 85, 185–195. [CrossRef]
12. Serrano, M.; Valverde, J.M.; Guillén, F.; Castillo, S.; Martínez-Romero, D.; Valero, D. Use of Aloe vera gel coatingpreserves the functional properties of table grapes. J. Agric. Food Chem. 2006, 54, 3882–3886. [CrossRef]
13. Droby, S.; Cohen, L.; Wiess, B.; Daus, A.; Wisniewski, M. Microbial control of postharvest diseases of fruitsand vegetables-current status and future outlook. Acta Hortic. 2001, 553, 371–376. [CrossRef]
14. Oh, Y.A.; Oh, Y.J.; Song, A.Y.; Won, J.S.; Song, K.B.; Min, S.C. Comparison of effectiveness of edible coatingsusing emulsions containing lemongrass oil of different size droplets on grape berry safety and preservation.LWT Food Sci. Technol. 2017, 75, 742–750. [CrossRef]
15. Kim, I.-H.; Oh, Y.A.; Lee, H.; Song, K.B.; Min, S.C. Grape berry coatings of lemongrass oil-incorporatingnanoemulsion. LWT Food Sci. Technol. 2014, 58, 1–10. [CrossRef]
16. Sánchez-González, L.; Pastor, C.; Vargas, M.; Chiralt, A.; González-Martínez, C.; Cháfer, M. Effect ofhydroxypropylmethylcellulose and chitosan coatings with and without bergamot essential oil on qualityand safety of cold-stored grapes. Postharvest Biol. Technol. 2011, 60, 57–63. [CrossRef]
17. Settanni, L.; Corsetti, A. Application of bacteriocins in vegetable food biopreservation. Int. J. Food Microbiol.2008, 121, 123–138. [CrossRef]
18. Fang, X.; Li, Y.; Guo, W.; Ke, W.; Bi, S.; Guo, X.; Zhang, Y. Lactobacillus delbrueckii subsp. bulgaricus F17 andLeuconostoc lactis H52 supernatants delay the decay of strawberry fruits: A microbiome perspective. FoodFunct. 2019, 10, 7767–7781. [CrossRef]
19. Ding, W.; Wang, L.; Zhang, J.; Ke, W.; Zhou, J.; Zhu, J.; Guo, X.; Long, R. Characterization of antioxidantproperties of lactic acid bacteria isolated from spontaneously fermented yak milk in the Tibetan Plateau.J. Funct. Foods 2017, 35, 481–488. [CrossRef]
20. Plessas, S.; Bosnea, L.; Psarianos, C.; Koutinas, A.A.; Marchant, R.; Banat, I.M. Lactic acid productionby mixed cultures of Kluyveromyces marxianus, Lactobacillus delbrueckii ssp. bulgaricus and Lactobacillushelveticus. Bioresour. Technol. 2008, 99, 5951–5955. [CrossRef]
21. El Kafsi, H.; Binesse, J.; Loux, V.; Buratti, J.; Boudebbouze, S.; Dervyn, R.; Kennedy, S.; Galleron, N.;Quinquis, B.; Batto, J.-M.; et al. Lactobacillus delbrueckii ssp. lactis and ssp. bulgaricus: A chronicle of evolutionin action. BMC Genom. 2014, 15, 407. [CrossRef] [PubMed]
22. Zhai, Z.; An, H.; Wang, G.; Luo, Y.; Hao, Y. Functional role of pyruvate kinase from Lactobacillus bulgaricus inacid tolerance and identification of its transcription factor by bacterial one-hybrid. Sci. Rep. 2015, 5, 17024.[CrossRef] [PubMed]
23. Graça, A.; Esteves, E.; Nunes, C.; Abadias, M.; Quintas, C. Microbiological quality and safety of minimallyprocessed fruits in the marketplace of southern Portugal. Food Control 2016, 73, 775–783.
24. Vermeiren, L.; Devlieghere, F.; Debevere, J. Evaluation of meat born lactic acid bacteria as protective culturesfor the biopreservation of cooked meat products. Int. J. Food Microbiol. 2004, 96, 149–164. [CrossRef]
25. Jones, R.J.; Hussein, H.M.; Zagorec, M.; Brightwell, G.; Tagg, J.R. Isolation of lactic acid bacteria withinhibitory activity against pathogens and spoilage organisms associated with fresh meat. Food Microbiol.2008, 25, 228–234. [CrossRef]
26. Swetwiwathana, A.; Visessanguan, W. Potential of bacteriocin-producing lactic acid bacteria for safetyimprovements of traditional Thai fermented meat and human health. Meat Sci. 2015, 109, 101–105. [CrossRef]
27. Woraprayote, W.; Malila, Y.; Sorapukdee, S.; Swetwiwathana, A.; Benjakul, S.; Visessanguan, W. Bacteriocinsfrom lactic acid bacteria and their applications in meat and meat products. Meat Sci. 2016, 120, 118–132.[CrossRef]
28. Meng, X.; Li, B.; Liu, J.; Tian, S. Physiological responses and quality attributes of table grape fruit to chitosanpreharvest spray and postharvest coating during storage. Food Chem. 2008, 106, 501–508. [CrossRef]
29. Meng, X.; Tian, S. Effects of preharvest application of antagonistic yeast combined with chitosan on decayand quality of harvested table grape fruit. J. Sci. Food Agric. 2009, 89, 1838–1842. [CrossRef]
30. Candir, E.; Ozdemir, A.E.; Kamiloglu, O.; Soylu, E.M.; Dilbaz, R.; Ustun, D. Modified atmosphere packagingand ethanol vapor to control decay of ‘Red Globe’ table grapes during storage. Postharvest Biol. Technol. 2012,63, 98–106. [CrossRef]
31. Youssef, K.; Roberto, S.R.; Chiarotti, F.; Koyama, R.; Hussain, I.; de Souza, R.T. Control of Botrytis mold ofthe new seedless grape “BRS Vitoria” during cold storage. Sci. Hortic. Amst. 2015, 193, 316–321. [CrossRef]

Microorganisms 2020, 8, 656 15 of 16
32. Guerra, I.C.D.; de Oliveira, P.D.L.; Santos, M.M.F.; Lúcio, A.S.S.C.; Tavares, J.F.; Barbosa-Filho, J.M.;Madruga, M.S.; de Souza, E.L. The effects of composite coatings containing chitosan and Mentha (piperita L.or x villosa Huds) essential oil on postharvest mold occurrence and quality of table grape cv. Isabella. Innov.Food Sci. Emerg. Technol. 2016, 34, 112–121. [CrossRef]
33. dos Santos, N.S.T.; Aguiar, A.J.A.A.; de Oliveira, C.E.V.; de Sales, C.V.; e Silva, S.D.M.; da Silva, R.S.;Stamford, T.C.M.; de Souza, E.L. Efficacy of the application of a coating composed of chitosan and Origanumvulgare L. essential oil to control Rhizopus stolonifer and Aspergillus niger in grapes (Vitis labrusca L.). FoodMicrobiol. 2012, 32, 345–353. [CrossRef] [PubMed]
34. Costa, C.; Lucera, A.; Conte, A.; Mastromatteo, M.; Speranza, B.; Antonacci, A.; Del Nobile, M.A. Effects ofpassive and active modified atmosphere packaging conditions on ready-to-eat table grape. J. Food Eng. 2011,102, 115–121. [CrossRef]
35. Melo, N.F.C.B.; de MendonçaSoares, B.L.; Diniz, K.M.; Leal, C.F.; Canto, D.; Flores, M.A.P.;Tavares-Filho, J.H.d.C.; Galembeck, A.; Stamford, T.L.M.; Stamford-Arnaud, T.M.; et al. Effects of fungalchitosan nanoparticles as eco-friendly edible coatings on the quality of postharvest table grapes. PostharvestBiol. Technol. 2018, 139, 56–66. [CrossRef]
36. Sabir, F.K.; Sabir, A.; Unal, S.; Taytak, M.; Kucukbasmaci, A.; Bilgin, O.F. Postharvest quality extension ofminimally processed table grapes by chitosan coating. Int. J. Fruit Sci. 2018, 19, 347–358. [CrossRef]
37. Kraiem, M.; Kachouri, F.; Ghoul, M.; Hamdi, M. Antioxidative and bioprotective effect of lactic acid bacteriaon postharvest strawberry: Intact and cell lysates. J. Food Sci. Technol. 2015, 52, 7345–7352. [CrossRef]
38. Pearson, R.C.; Goheen, A.C. Compendium of grape diseases. Mycologia 1989, 81, 176–177.39. Dalié, D.K.D.; Deschamps, A.M.; Richard-forget, F. Lactic acid bacteria–potential for control of mould growth
and mycotoxins: A review. Food Control 2010, 21, 370–380. [CrossRef]40. Bai, J.; Plotto, A.; Spotts, R.; Rattanapanone, N. Ethanol vapor and saprophytic yeast treatments reduce
decay and maintain quality of intact and fresh-cut sweet cherries. Postharvest Biol. Technol. 2011, 62, 204–212.[CrossRef]
41. Baxter, C.J.; Carrari, F.; Bauke, A.; Overy, S.; Hill, S.A.; Quick, P.W.; Fernie, A.R.; Sweetlove, L.J. Fruitcarbohydrate metabolism in an introgression line of tomato with increased fruit soluble solids. Plant CellPhysiol. 2005, 46, 425–437. [CrossRef] [PubMed]
42. Gao, P.; Zhu, Z.; Zhang, P. Effects of chitosan–glucose complex coating on postharvest quality and shelf lifeof table grapes. Carbohyd. Polym. 2013, 95, 371–378. [CrossRef] [PubMed]
43. Xu, C.; Yagiz, Y.; Zhao, L.; Simonne, A.; Lu, J.; Marshall, M.R. Fruit quality, nutraceutical and antimicrobialproperties of 58 muscadine grape varieties (Vitis rotundifolia Michx.) grown in United States. Food Chem.2017, 215, 149–156. [CrossRef] [PubMed]
44. Han, C.; Zhao, Y.; Leonard, S.W.; Traber, M.G. Edible coatings to improve storability and enhance nutritionalvalue of fresh and frozen strawberries (Fragaria × ananassa) and raspberries (Rubus ideaus). Postharvest Biol.Technol. 2004, 33, 67–78. [CrossRef]
45. Martínez-Ferrer, M.; Harper, C.; Pérez-Muñoz, F.; Chaparro, M. Modified atmosphere packaging of minimallyprocessed mango and pineapple fruits. J. Food Sci. 2002, 67, 3365–3371. [CrossRef]
46. Nicolosi, E.; Ferlito, F.; Amenta, M.; Russo, T.; Rapisarda, P. Changes in the quality and antioxidantcomponents of minimally processed table grapes during storage. Sci. Hortic. Amst. 2018, 232, 175–183.[CrossRef]
47. Li, W.; Ji, J.; Rui, X.; Yu, J.; Tang, W.; Chen, X.; Jiang, M.; Dong, M. Production of exopolysaccharides byLactobacillus helveticus MB2-1 and its functional characteristics in vitro. LWT Food Sci. Technol. 2014, 59,732–739. [CrossRef]
48. Yildiz, H.; Karatas, N. Microbial exopolysaccharides: Resources and bioactive properties. Process Biochem.2018, 72, 41–46. [CrossRef]
49. Champa, W.A.H.; Gill, M.I.S.; Mahajan, B.V.C.; Bedi, S. Exogenous treatment of spermine to maintain qualityand extend postharvest life of table grapes (Vitis vinifera L.) cv. Flame Seedless under low temperaturestorage. LWT Food Sci. Technol. 2015, 60, 412–419. [CrossRef]
50. Sabir, A.; Sabir, F.K.; Kara, Z. Effects of modified atmosphere packing and honey dip treatments on qualitymaintenance of minimally processed grape cv. Razaki (V. vinifera L.) during cold storage. J. Food Sci. Technol.2011, 48, 312–318. [CrossRef]
Microorganisms 2020, 8, 656 16 of 16
51. Pretel, M.T.; Martínez-Madrid, M.C.; Martínez, J.R.; Carreño, J.C.; Romojaro, F. Prolonged storage of ‘Aledo’table grapes in a slightly CO2 enriched atmosphere in combination with generators of SO2. LWT Food Sci.Technol. 2006, 39, 1109–1116. [CrossRef]
52. Rizzini, F.M.; Bonghi, C.; Tonutti, P. Postharvest water loss induces marked changes in transcript profiling inskins of wine grape berries. Postharvest Biol. Technol. 2009, 52, 247–253. [CrossRef]
53. Vazquez-Hernandez, M.; Navarro, S.; Sanchez-Ballesta, M.T.; Merodio, C.; Escribano, M.I. Short-term highCO2 treatment reduces water loss and decay by modulating defense proteins and organic osmolytes inCardinal table grape after cold storage and shelf-life. Sci. Hortic. Amst. 2018, 234, 27–35. [CrossRef]
© 2020 by the authors. Licensee MDPI, Basel, Switzerland. This article is an open accessarticle distributed under the terms and conditions of the Creative Commons Attribution(CC BY) license (http://creativecommons.org/licenses/by/4.0/).