prof. g. f. kniazzeh prof. - dspace@mit home
TRANSCRIPT

XVII. PLASMA MAGNETOHYDRODYNAMICS AND ENERGY CONVERSION
Prof.Prof.Prof.Prof.Prof.Prof.Prof.Prof.Prof.Prof.Prof.Prof.Prof.Prof.Prof.Prof.Prof.Prof.
A. BrownN. CarabateasS. CooperI. FreedmanH. HeiserA. HoffmanD. JacksonL. KerrebrockE. McCuneP. MeissnerR. MelcherC. OatesP. PenhuneM. Reynolds IIIH. ShapiroL. Smith, Jr.E. StickneyH. Woodson
Dr. A. T. LewisM. T. BadrawiJ. F. CarsonA. N. ChandraJ. M. CrowleyR. DethlefsenM. G. A. DrouetD. A. EastR. K. EdwardsJ. R. Ellis, Jr.F. W. Fraim IVJ. W. GadzukJ. GerstmannJ. B. HeywoodP. G. KatonaF. D. KettererG. B. Kliman
RESEARCH OBJECTIVES AND SUMMARY OF RESEARCH
1. Magnetohydrodynamics
Our work in magnetohydrodynamics is broadly concerned with the interactions
between electromagnetic fields and electrically conducting fluids, particularly in those
situations to which a continuum fluid description is applicable. Both plasmas and liquid
metals are employed in the experimental aspects of our work and the development of
measurement techniques receives particular attention. An important extension of this
activity is the study of blood flow and related topics in biomedical engineering.
(a) Plasma Magnetohydrodynamics
The past year has been spent in improving the capabilities of the magnetic annular
shock tube for producing clearly defined quantities of shock-heated gas and for meas-
uring values of the physical quantities relevant to the experiments. These improve-
ments are based upon experience with the original version of the shock tube. In
particular, the following changes have been made:
(i) The duration and magnitude of the pre-ionization current have been increased to
improve initial gas breakdown.
(ii) The sinusoidal drive current has been replaced by a square pulse to reduce time-
variant effects.
(iii) All low-melting-point insulating materials have been removed, or covered with
Pyrex, to reduce ablation from the surface of these insulators.
(iv) Eight magnetic field coils have been inserted around the annulus to measure the
azimuthal distribution of drive current.
(v) A magnetic field coil has been provided to measure the variation of azimuthal
magnetic field with time at a fixed axial position.
*This work was supported in part by the U. S. Air Force (Aeronautical Systems
Division) under Contract AF33 (615)-1083 with the Air Force Aero Propulsion Labora-
tory, Wright-Patterson Air Force Base, Ohio; and in part by the National Science
Foundation (Grant G-24073).
QPR No. 72
G. F. KniazzehF. KoskinenS. LeeF. LercariH. LevisonT. LubinA. OkerekeH. OlsenS. PiersonP. PorterH. PruslinW. Rook, Jr.W. RoweShavitSolbesS. WeingradL. WilsonC. Wissmiller
139
(XVII. PLASMA MAGNETOHYDRODYNAMICS)
(vi) An electrostatic probe to complement the azimuthal magnetic field probe is beingdesigned.
Experiments have begun and the results of these changes should soon be known. Theseexperiments are particularly designed to test the azimuthal uniformity of the drive cur-rent. The long-range goals of these experiments are still the improvement of this typeof shock tube and the careful investigation of magnetohydrodynamic shock waves.
A. H. Shapiro, W. H. Heiser, J. B. Heywood
(b) Mathematical Methods in Continuum Magnetohydrodynamics
This research is concerned with mathematical methods for the analysis of the inter-actions occurring in magnetohydrodynamics. The present work has grown out of theinvestigation of MHD channel flows; particularly out of the analytical and numerical tech-niques that were used to obtain solutions to the nonlinear differential equation governingthe interaction of a traveling AC magnetic field with an MHD channel flow.
Our research concerns the application of techniques, such as perturbation expansionsand iterational and variational methods, to a variety of nonlinear continuum MHD prob-lems. The purpose of this effort is twofold: first, to produce solutions to specific prob-lems that are of practical interest; second, to obtain a better understanding of the broadclasses of problems to which these techniques are applicable. The analysis of the flowof an electrically conducting fluid around a sphere with a dipole magnetic field is at pres-ent being undertaken for the case in which the dipole axis is perpendicular to the direc-tion of fluid flow.
J. P. Penhune
(c) Magnetohydrodynamic Wave Phenomena
One of our experiments is concerned with the excitation of Alfv6n waves in a liquidmetal (NaK alloy). Generation of these waves by using a current-sheet excitation hasbeen verified, and shown to be markedly superior to the mechanical methods used inexperiments reported previously. The systematic study of the excitation transmission,attenuation, and reflection of these waves in the hydromagnetic waveguide continues.
A second waveguide study is concerned with MHD wave propagation in nonuniformmagnetic fields. NaK alloy again serves as the working fluid for the experimental partof this investigation.
A theoretical study of MHD surface waves on fluids of finite electrical conductivityis also being undertaken. An experimental study of some aspects of these waves hasrecently been initiated, and will also use NaK as the working fluid.
W. D. Jackson, J. P. Penhune
(d) Magnetohydrodynamic Channel Flow and Turbulence
The flow characteristics of electrically conducting fluids in channels or ducts areof interest in connection with many engineering applications of magnetohydrodynamics.While these include both liquid and ionized gas flows, the use of liquid metals has advan-tages for a considerable range of laboratory investigations.
A closed-loop flow facility has been constructed with NaK used as the working fluid.This loop is being used for study of pressure drop versus flow-rate relations (includingthose for MHD power-conversion devices), and the characteristics of turbulence in thepresence of magnetic fields.
The character of MHD turbulence is modified when a pronounced Hall effect occursin the flow. The characteristics of turbulence in this situation are being investigated,
QPR No. 72 140

(XVII. PLASMA MAGNETOHYDRODYNAMICS)
and work continues on the application of Norbert Wiener's "Calculus of RandomFunctionals" to the study of turbulent-flow situations.
W. D. Jackson
(e) Local Fluid-Velocity Measurement in an Incompressible
Magnetohydrodynamic Flow
The behavior of different types of velocity probes is being investigated to developdevices capable of measuring the local fluid velocity in an MHD flow for the case inwhich the applied magnetic field is perpendicular to the fluid velocity. The develop-ment of such probes will be important for experimental investigation of MHD flows,particularly those associated with MHD power-generation schemes.
The behavior of a nonconducting Pitot tube is being investigated experimentally. Herethe J X B forces increase the pressure measured at the stagnation point above the usualstagnation pressure. The velocity-pressure correlation has been determined experi-mentally as a function of applied magnetic field for a probe with a flat front end perpen-dicular to the axis of the tube. The effects of probe angle of attack and nose shape arenow being studied.
A miniaturized electromagnetic flowmeter is also receiving attention.
A feasibility study is being made to determine whether a hot-wire anemometer canbe constructed with sufficient sensitivity to be useful in the sodium-potassium eutecticliquid-metal flow loop described in (d) above.
A. H. Shapiro, W. D. Jackson, R. S. Cooper, D. A. East
(f) Ionization Waves in Weakly Ionized Plasmas
During the past year, some further studies have been made on the nature of certainmacroscopic instabilities observed in the plasma of glow discharge tubes. The regionof tube operation in which the instability is incipient has been defined for several gases,and the properties of shock-excited waves generated by external sources have beenthoroughly examined in these regions.
Further work is being done toward the development of a theory to describe the behav-ior exhibited by the plasma in these experiments. Some new experiments are being per-formed to find additional methods of exciting the observed ionization waves. Theinteraction of the waves with internally generated sonic waves in the neutral gas is alsobeing investigated both experimentally and theoretically.
R. S. Cooper
(g) Blood-Flow Studies
Electrical methods are widely used in blood-flow measurement, and prominentamong the devices used is the magnetohydrodynamic or electromagnetic flowmeter.Work reported under (e) above is being adapted for both mean and local blood-flowmeasurement and magnetohydrodynamic, thermal, and ultrasonic techniques are atpresent under investigation.
A second aspect of our blood-flow work is concerned with the application of engi-neering methods to the study of the cardiovascular system. We are engaged in thisresearch jointly with Dr. Dexter and his associates at Peter Bent Brigham Hospital.A study of the pressoreceptor system has recently been completed as a step in the
*This work is supported in part by the National Institutes of Health (GrantNo. 5 TI HE 5550-02).
141

(XVII. PLASMA MAGNETOHYDRODYNAMICS)
identification and analysis of the mechanisms responsible for the regulation of cardio-vascular functions.
G. O. Barnett, W. D. Jackson
2. Energy Conversion
Our studies include both magnetohydrodynamic and thermionic methods of generatingelectrical power, and involve over-all system considerations, properties of workingfluids, and operating characteristics of conversion devices.
(a) Magnetohydrodynamic Power Generation with Liquid Metals
The generation of electrical power in space vehicles offers a potential applicationfor MHD generators to operate on a closed-cycle system in which a nuclear reactor isthe thermal-energy source. An important feature of an MHD system is the absence ofrotating parts, and, to utilize it, a working fluid is required with a sufficiently high elec-trical conductivity at the temperatures involved. A scheme in which a liquid metal isused as the working fluid in the MHD generator duct is under investigation. Kineticenergy is imparted to this flow by driving it with its own vapor in a condensing-ejectorsystem.
A cycle analysis has been completed and has revealed efficiencies that are suffi-ciently attractive to warrant detailed investigation. During the coming year, the oper-ation of condensing ejectors on alkali metals will be considered, the conductivity oftwo-phase flows in the presence of magnetic fields will be measured, the study ofliquid-metal generator configurations will continue, and further cycle analysis will beperformed.
W. D. Jackson, G. A. Brown
(b) Magnetohydrodynamic Induction Generator
The MHD induction machine utilizes the interaction between a traveling magneticfield (such as that produced by a polyphase winding) and a channeled, flowing fluid thatmay be either a plasma or a liquid metal.
The theoretical analysis of this machine has been extended to include such realmachine effects as entry and exit conditions, finite core permeability, and velocity pro-file effects. This work has clearly demonstrated that the reactive power requirementsof an induction generator are excessive when operated on a plasma flow but that satis-factory operation should be obtained with liquid metals.
A preliminary experimental investigation of a linear induction generator operatingon an NaK flow with a two-phase, traveling-field coil system has demonstrated elec-trical power generation. This work will be extended and developed during the comingyear.
W. D. Jackson
(c) Alkali-Metal Magnetohydrodynamic Generators
The over-all objective of this research is to investigate the feasibility of operatingmagnetohydrodynamic generators with alkali metals as working fluids. Our immediateobjective is to establish the electrical properties of both superheated and wet alkali-metal vapor at temperatures up to 20000K.
Dr. G. O. Barnett is Established Investigator, American Heart Associate, HarvardMedical School, Boston, Massachusetts.
QPR No. 72 142

(XVII. PLASMA MAGNETOHYDRODYNAMICS)
A small potassium loop, capable of a mass flow of 10 grams per second,has been constructed and is now being put into operation. Meanwhile, analyt-ical studies of the wet vapor have been carried to the stage at which electrical
conductivities can be computed, if the distribution in size of the droplets can
be determined.
J. L. Kerrebrock
(d) Thermionic Energy Conversion
The research objectives of our group are oriented toward the evaluation of possible
improvements of thermionic -converter performance based on the recent developments
in the areas of surface and transport effects. The following studies are at present being
conducted:
(i) Parametric evaluation of ideal converter performance as determined by the prop-
erties of cesium films on polycrystalline and single-crystal metallic surfaces.
(ii) Detailed study of the processes responsible for the creation of the highly con-
ducting plasma in the interelectrode region of cesium thermionic converters, and inter-
pretation of experimental current-voltage characteristics in the ignited mode.
(iii) Extension of previous measurements of the thermal conductivity of cesium vapor
to higher temperatures and possibly to other alkali metals.
E. N. Carabateas
(e) A-C Properties of Superconductors
Recent intensive efforts to fabricate hard superconductors have opened up a wide
range of possibilities for utilizing these materials in the production of high DC fields,
particularly in situations for which these are required in large volume. The advan-
tages associated with reducing field-power dissipation also apply to the production of
AC fields, but there is an additional problem in that reactive power has to be circu-
lated. This problem essentially implies zero-loss capacitive energy-storage elements,
in addition to essentially infinite Q inductors. It is thus of interest to investigate the
behavior of superconducting materials carrying AC currents in the presence of AC mag-
netic fields. As well as establishing the merits of superconducting materials in inductor
and capacitor fabrication, such investigations provide an additional method of gaininginsight into the mechanism of superconductivity.
Present investigations deal with superconducting materials in the form of wire or
ribbon, and two experimental techniques are being pursued.
(i) The current-carrying capacities of short, straight lengths of superconducting
wire or ribbon are being determined as a function of frequency in the range up to 10 kc.
(ii) A-C solenoids, fabricated to avoid electric eddy currents and insulated to accom-
modate electrical fields arising from aB/aT effects, are being tested. In both cases,
the AC current required for transition to normal conductivity has been obtained and, in
the case of solenoids, the Q has been measured.
A third investigation is planned to obtain data on the behavior of superconductors
in an externally applied AC field. These data will be derived either from a rotating
magnet system or from a separate copper -conductor AC solenoid.
The work is, at present, experimental in character, but future theoretical studies
are envisaged.
W. D. Jackson
QPR No. 72 143

(XVII. PLASMA MAGNETOHYDRODYNAMICS)
A. WORK COMPLETED
1. LARGE-SIGNAL BEHAVIOR OF A PARAMETRIC MAGNETOGASDYNAMIC
GENERATOR
This report summarizes an Sc. D. thesis with this title which was submitted to the
Department of Electrical Engineering, M. I. T., September 20, 1963, and will appear
as an RTD Technical Documentary Report
In this study the large-signal behavior of a parametric magnetogasdynamic generator,
consisting of a cylindrical coil with batches of highly conducting plasma traveling along
the coil axis, is considered. In this limit, the gas behavior is strongly affected by the
magnetic forces. The purpose of this study was to determine (i) whether the require-
ments on the conductivity and velocity of the gas found for small-signal behavior are
relaxed because of any enhancing mechanism during the interaction; (ii) what fraction
of the gas power could be extracted as useful electrical power, that is, the over-all gen-
erator efficiency; (iii) how the interaction between the field and the gas leads to gas
behavior that limits the growth of the parametric oscillations so that a stable operating
point is reached; (iv) an estimate of the minimum size and power of a generator with
present technology; and (v) the factors that control the scaling of the parametric gener-
ator.
To answer these questions, an analysis is presented for the small-signal behavior
to establish the important parameters and provide a basis of comparison for the large-
signal behavior. The large-signal electrical and gas behavior are treated separately
as far as possible. A criterion is established for determining the steady-state oper-
ating point in terms of the electrical terminal behavior. The gas -flow interaction with
the field is analyzed by using a quasi one-dimensional-flow model with the constraints
for a strong interaction that the magnetic pressure balance the static gas pressure in
the radial direction, and the power given up by the gas balance the gross electrical
power generated.
A. T. Lewis
B. ALFVEN WAVE STUDIES
1. SOME PROPERTIES OF MAGNETOHYDRODYNAMIC WAVEGUIDES
The dispersion equation for the MHD waveguide has been derived by a number of1-7
investigators. Basically, the MHD waveguide consists of a hollow, rigid-wall cyl-
inder of arbitrary, but constant, cross section immersed in a uniform, steady mag-
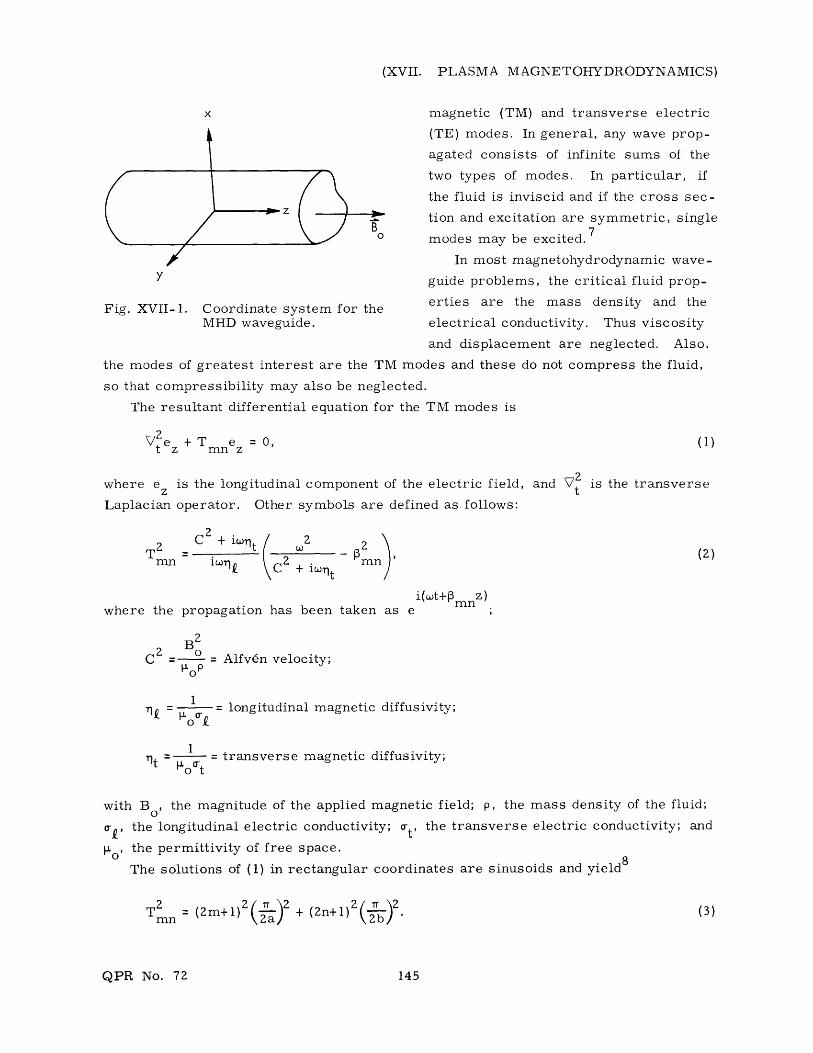
netic field aligned parallel to the cylinder axis as in Fig. XVII-1, and filled with a
homogeneous electrically conducting fluid.
The total behavior of such a waveguide may be described in terms of transverse
QPR No. 72 144
(XVII. PLASMA MAGNETOHYDRODYNAMICS)
t-z B
Fig. XVII-1. Coordinate system for theMHD waveguide.
the modes of greatest interest are the TM
magnetic (TM) and transverse electric
(TE) modes. In general, any wave prop-
agated consists of infinite sums of the
two types of modes. In particular, if
the fluid is inviscid and if the cross sec-
tion and excitation are symmetric, single
modes may be excited. 7
In most magnetohydrodynamic wave-
guide problems, the critical fluid prop-
erties are the mass density and the
electrical conductivity. Thus viscosity
and displacement are neglected. Also,
modes and these do not compress the fluid,
so that compressibility may also be neglected.
The resultant differential equation for the TM modes is
2V e +T e = 0,tez mn z
2where e z is the longitudinal component of the electric field, and V2 is the transverse
Laplacian operator. Other symbols are defined as follows:
2 2 + iwrnt w2 2mnn ioNp C 2 + i ont
i(ot+p mn z )
where the propagation has been taken as e
B2
C 2 0 = Alfv6n velocity;
1S -= longitudinal magnetic diffusivity;
oI
t = transverse magnetic diffusivity;
with B o , the magnitude of the applied magnetic field; p, the mass density of the fluid;
, the longitudinal electric conductivity; at' the transverse electric conductivity; and
Lo' the permittivity of free space.The solutions of (1) in rectangular coordinates are sinusoids and yield8
2 2m1)2 ( T2- 2.T = (m+1)M a)2 + (2n+1 imn\2/\b
QPR No. 72 145

(XVII. PLASMA MAGNETOHYDRODYNAMICS)
Here, a and b are the half-widths of a rectangular waveguide. In cylindrical coordi-
nates the solutions of (1) are Bessel functions and yield
2 (m2T 2 ) (4)
th th
Here, a is the radius of a cylindrical waveguide, and a is the n root of the m -
order Bessel function.
The propagation constant P is obtained from (2).
ST 2 +i ]2 r mnmn t 1 + C 2 /i t (5)
At very low frequencies (w-0) (5) becomes
T Wm mn (6)mn c (1-i). (6)
At very high frequencies (w-cc) (5) becomes
Pmn = (1-i). (7)
At intermediate frequencies such that
2 2(8)STmn << << C /T t , (8)
(5) becomes approximately
Pmn = ( - + n+ T (9)
Equations 6 and 7 are characteristic of diffusion phenomena. At low frequencies
the magnetic field diffuses through the fluid in a time short compared with the period
of the excitation. Thus the field is not convected by the fluid. At high frequencies the
field cannot penetrate the fluid. Thus the fluid is not convected by the field. But if w
satisfies (9), there is a region in which mutual convection of the fluid and the field gives
rise to the Alfv6n wave.
If the asymptotes of Re (P) and -Im (f) in (6), (7), and (9) are plotted in log-log
coordinates, Fig. XVII-2 results. An exact evaluation of (5) for a shock-excited gas
experiment is also plotted in Fig. XVII-2, and shows that the asymptotes are a very
good approximation to the exact curves.
QPR No. 72 146

(XVII. PLASMA MAGNETOHYDRODYNAMICS)
The intersections of the asymptotes are interesting points, two of which corre-
spond to condition (8). Notice that the lower limit of the Alfv6n region is controlled
2- 1 3 C
C
2rt
Re (mn)
-Im (pm)
2 25/3 2
107 1010 10
Fig. XVII-2. Typical shock-excited gas experiment.
= 0= 4.5 X 10 v/m (Te 3.5 ev); p = 1.7 X 10⁻⁵ kg/m 3
(15=+.5 2+
(n= 1.5 x0 15/cc H ); B = 1.6 w/m2; b = 0.07 m; T 0 1
3.8/b (J 1 (Tb) = 0); Va = 5 X 10 5 m/sec; r = Tt =1.8 X
2 310 m /sec; w 2 /w 1 = 2.6 X 10 .
by conductivity and geometry, while the upper limit is controlled by conductivity,
density, and applied field. The frequency below which, under condition (8), the
waveguide is distortionless is twice the geometric mean of the upper and lower
QPR No. 72
10
100
10- 1
147

(XVII. PLASMA MAGNETOHYDRODYNAMICS)
2-1/3 C
I C2 qt
Re (pmn)
Fig. XVII-3. Typical liquid-metal experiment.
Tf = Ot = 2.63 X 10⁶ v/m; p = 8.5 X 10 2 kg/m 3 (NaK);
Bo = 0.8 w/m 2 ; b = 0.19 m; T 0 1 = 3.8/b (J 1 (Tb) = 0);
Va = 24.5 m/sec; 7, =. = 0.3 m 2 /sec; w2 / 1 = 16.
limits. In Fig. XVII-3 data are plotted for a typical liquid-metal experiment for
comparison.
In view of these results, Eq. 5 should be rewritten
W 11- Zi
2i W2
Now,
2w 2 = magnetic Reynolds number
1 mn
2 C 2
- = Lundquist number.o Cot
(10)
Thus, in order that an Alfv6n wave exist, both the magnetic Reynolds and Lundquist
numbers must be large compared with unity.
Listed below in tabular form is a comparison of a number of Alfv6n wave experi-
ments in terms of the critical frequencies.
QPR No. 72
- Im (Pmn)
148

(XVII. PLASMA MAGNETOHYDRODYNAMICS)
Experimenter Medium fl f2
1. Jephcott, Stocker, arc plasma 46.5 kc 51.3 me
and Woods 4
2. Wilcox, da Silva, shock plasma 41.4 kc 111.0 mc
Cooper, and Boley 3
3. DeCourey and Bruce9 irradiated gas 57.2 mc 4.07 mc
84. Gothard, and NaK 9.75 cps 158 cps
Jackson and Carson
5. Lundquist 1 Hg 159 cps 10.3 cps
6. Lehnert2 Na 21.5 cps 770 cps
See W. D. Jackson and J. F. Carson (Sec. XVII-B2).
G. B. Kliman
References
1. S. Lundquist, Phys. Rev. 83, 307 (1951).
2. B. Lehnert, Phys. Rev. 94, 815 (1954).
3. J. M. Wilcox, A. W. da Silva, W. S. Cooper, and F. I. Boley, Experimentson Alfv6n Wave Propagation, in Radiation and Waves in Plasma, edited by M. Mitchner(Stanford University Press, 1961), p. 138.
4. D. F. Jephcott, P. M. Stocker, and L. C. Woods, IAEA Report CN-10/62,1962.
5. R. W. Gould, STL Report TR-60-0000-09143, 1960.
6. J. Shmoys and E. Mishkin, Phys. Fluids 3, 473 (1960).
7. L. C. Woods, UKEA Research Group Report CLM-R5, 1961.
8. N. Gothard, S. M. Thesis, Department of Electrical Engineering, M. I. T., 1962.
9. D. J. DeCourey, Jr. and M. H. Bruce, Report AFCRL G2-550, 1962.
2. EXPERIMENTS WITH A LIQUID-METAL MAGNETOHYDRODYNAMIC
WAVEGUIDE
The presence of hydromagnetic waves in conducting fluids was first established by
Alfv6n, in 1942. Since that time, much progress has been made in the theoretical
study of these waves, but experimental work has proceeded slowly. Lundquist, 2 in
1951, tried to excite waves in mercury, and Lehnert 3 repeated and improved the
experiment, in 1954, using liquid sodium. Other experimental work has been done
QPR No. 72 149

(XVII. PLASMA MAGNETOHYDRODYNAMICS)
with shock-excited plasmas. 4' 5 Most of the results thus far have been somewhat incon-
clusive, showing only partial agreement with theoretical predictions.
Many of the difficulties in experimental work have been caused by the need for a high-conductivity working fluid to avoid excessive attenuation. The Lundquist number, areciprocal magnetic Reynolds number based on Alfv6n velocity and wavelength, is definedas
Lu =O
where f is the excitation frequency, B the applied magnetic field, p the fluid density,and a- the fluid electrical conductivity. It provides a convenient basis on which the suit-ability of a medium may be established and, to ensure propagation without undue attenu-ation, it must be much less than one, which in turn requires that the ratio of electrical
conductivity to mass density be as large as possible. Lehnert was able to achieve
improvement in the Lundquist number of over 100 by using sodium instead of mercury.
Handling and instrumentation problems are always present in alkali-metal research, andthe high temperature necessary to liquify sodium leads to additional complications. The
use of sodium-potassium eutectic alloy as the working fluid affords an increase over
mercury in the conductivity-density ratio about three times less than that of pure
sodium. Sodium potassium affords the advantage of being liquid at room temperature,
and accordingly has been chosen as the working fluid for this experiment.
Lundquist attempted to launch waves, using a vibrating disk with vanes attached. Thedevice was intended to couple mechanically to the fluid and to cause torsional disturb-
ances that would propagate along the axial magnetic-field lines, but the mechanism at
work was really motional induction. Therefore Lehnert used a copper disk without
vanes. The rotation of the disk in the magnetic field caused an induced electric field
in the disk. Matching of tangential electric-field components across a boundary requires
an induced current to flow in the fluid. This current in turn reacts with the magnetic
field to form a J X B force that acts on the fluid to generate vorticity and, if conditions
permit, the vorticity will propagate.
The search for an optimal means of excitation led to the use of a directly injected
current sheet to launch the waves. A small disk, 5 cm in diameter, in the center of
the waveguide shown in Fig. XVII-4 is fed with alternating current. A copper collecting
ring soldered to the outside wall of the waveguide provides a return. The feed conduc-tors leading from the ring to the source are designed to give equal resistance in allpaths, and result in a reasonably symmetrical current-sheet excitation. Exciting
currents are of the order of 100 amps.
The waveguide itself is constructed of stainless steel, and has an internal diameter
QPR No. 72 150

(XVII. PLASMA MAGNETOHYDRODYNAMICS)
Fig. XVII-4. MHD waveguide showing excitation structure.
of 38 cm. The length of the waveguide is 18 cm, and is limited by the gap length of the
magnet that was available. The applied magnetic field is 0.8 weber/meter 2 . The rec-
tangular chamber on the left of the waveguide contains the elevating mechanism for the
exciter probe. With this arrangement it is possible to position the probe at any height
within the waveguide. The chamber on the right contains the mechanism for both radial
and axial movement of probes for local magnetic-field measurements. Counters attached
to the shafts provide information about the location of the probes. The waveguide is filled
and drained with the aid of a filling-station apparatus that contains the necessary valves
and fittings for transferring the sodium potassium from storage cans to the waveguide.
If a sinusoidal drive and an exp(k - r) space dependence are assumed, the dispersion
relation is obtained from the pertinent hydrodynamic equations that yield values of the
real and imaginary parts of the propagation vector as a function of frequency. The values
of Alfv6n speed v, wavelength X, and attenuation a calculated for the conditions of the
experimental apparatus are shown in Fig. XVII-5. The frequency dependence of v above
-200 cps indicates that this is a diffusion-controlled region and that waves should only
be observed below this frequency. The method of excitation used in this experiment pro-
duced waves with magnetic-field components in the transverse plane only. The addition
of a conducting center column would allow propagation of purely transverse electromag-
netic waves.
Lundquist used a floating mirror to detect waves. Lehnert refined the measurement
somewhat by measuring potential difference in the moving fluid with two probes. The
approach taken in the present experiment was to look at the waveguide in as many ways
QPR No. 72 151

(XVII. PLASMA MAGNETOHYDRODYNAMICS)
10 100 1000 10,000f (CPS)
Fig. XVII-5. Wave properties as a function of frequency.
as possible. Two measurement schemes are possible when direct electric excitation isused. The relation of voltage and current at the driving terminals may be examined, andthe internal fields of the waveguide may be measured. The field probe used for thisexperiment consisted of a solenoid, 3/8 in. in diameter, with 300 turns of number 37wire. The coil was oriented so that the magnetic field induced in the c direction wasmeasured. The output of the probe was examined with an oscilloscope and voltmeter.
A probe to measure local velocity in the fluid is under development, but was not avail-able when the present experiment was performed.
Since the waveguide is of finite length, examination of the terminal impedance yieldsresonances. The results are shown in Fig. XVII-6 to be consistent with theoretical pre-dictions based on calculated values of wavelength. The waveguide is essentially being
run as a resonant cavity when operating at these points. The internal-field measure-
ments were made at the resonances indicated on the impedance graph.
The measurements illustrated were taken with the exciter probe located at a height
of 3 cm; this enabled the excitation of the X/2 and 3X/2 resonances as indicated. Move-ment of the probe in the radial direction provided profiles of the type shown inFig. XVII-7, while axial profiles obtained at a radius of 12 cm are given in Fig. XVII-8.To check that wave propagation was occurring, one set of data was obtained with a free
surface at the top of the waveguide. Excitation without the applied field yielded a decay
QPR No. 72 152

(XVII. PLASMA MAGNETOHYDRODYNAMICS)
TERMINAL IMPEDANCE
EXCITER DISK RADIUS = 2CM
Bo= 0.8 WEBER/M 2
ZI FOR INFINITELY LONG
WAVEGUIDE
I I I b I I I I I I
40 80 120
I I I I I
160 200 240 280 320 360
f (c/s)
Fig. XVII-6. Resonance measurements.
of the induced field away from the
Bo= 0.8 WEBER/M'
f 80 c/s
h= 172 CM
h11.7 CM
INDUCED B FIELDRELATIVE AMPLI-
TUDE
h=4.5 CMI
EXCITERX
AI/I/I/ // / II
18 16 14 12 10 8 6 4 2 0
RADIAL DISTANCE,CM
Fig. XVII-7. Induced B field -radial traverses.
exciter, while, with the field applied, an indication
of free-surface motion was obtained as shown
in Fig. XVII-8.
The growth of the induced field along the
axis is particularly evident in the case of the
3X/2 resonance, and is probably explained
by the near-effects of the exciting-current
sheet. The exciting disk was insulated on
both top and bottom surfaces, and thus the
fluid immediately above and below it is
weakly coupled to the electromagnetic effects.
The data of Fig. XVII-7 are consistent with
ithe existence of a stationary volume of liquid
above the exciter, but further experimental
work is required to clarify the behavior in
this region, and the waveguide is now being
modified for this purpose.
The work reported here is of a prelimi-
nary nature, but it has served to indicate
the feasibility of using a sodium-potassium
QPR No. 72
3.4 x 10⁻³n,
3.0
2.6
2.2
0.6 -
0.20
153
"-' "U ~-~'''"'"~ ~ ~ " ~
I
~-

(XVII. PLASMA MAGNETOHYDRODYNAMICS)
alloy as the working fluid in the study of Alfv6n waves, as an alternative to the tran-
sient conditions of a shock-excited plasma. Conduction-type direct electrical excita-
tion has been shown to be greatly superior to the vibrating disks used by early
1.0
0.8 -
INDUCED FIELD STRENGTH PROBE 12 CM
FROM CENTER B - 0.8 WEBER M2
0
POSITION
0 2 4 6 8 10 12 14 16 18
HEIGHT (CM
Fig. XVII-8. Induced B field - axial traverses.
experimenters, and magnetic field probes have proved to be satisfactory for the detec-
tion of wave conditions inside the waveguide. This study will continue, and will be con-
cerned with both transverse magnetic and transverse electromagnetic modes, a different
excitation, and different boundary conditions.
W. D. Jackson, J. F. Carson
References
1. H. Alfv6n, Nature 150, 405 (1942).
2. S. Lundquist, Phys. Rev. 83, 307 (1951).
3. B. Lehnert, Phys. Rev. 94, 815 (1954).
4. J. M. Wilcox, A. W. da Silva, W. S. Cooper, and F. I. Boley, Experimentson Alfv6n Wave Propagation, in Radiation and Waves in Plasma, edited by M. Mitchner(Stanford University Press, 1961), p. 138.
5. D. F. Jephcott, P. M. Stocker, and L. C. Woods, IAEA Report CN-10/62,1962.
1962.
R. W. Gould, STL Report TR-60-0000-09143, 1960.
J. Shmoys and E. Mishkin, Phys. Fluids 3, 473 (1960).
L. C. Woods, UKEA Research Group Report CLM-R5, 1961.
N. Gothard, S. M. Thesis, Department of Electrical Engineering, M. I. T.,
10. D. J. DeCourey, Jr. and M. H. Bruce, Report AFCRL G2-550, 1962.
QPR No. 72 154

(XVII. PLASMA MAGNETOHYDRODYNAMICS)
C. MAGNETOHYDRODYNAMIC POWER GENERATION WITH LIQUID METALS
Preliminary studies on a liquid-metal MHD power system employing a condensing
ejector have been completed. The objective was to determine the expected cycle effi-
ciencies and specific weights by using available fluid-dynamic, thermodynamic, and
PuMP Fig. XVII-9. Liquid-metal MHD power systememploying a condensing ejector.
MHD CONDENSING
GENERATOR EJECTOR
PUMP
RADIATOR/COOLER
heat-transfer information for the components and processes of the cycle. For the pres-
ent, the liquid-metal MHD generator has been characterized as having a specified effi-
ciency. Later studies will integrate the generator performance parameters with those
of the components that are used to produce the liquid-metal stream in a complete system
study.
The basic cycle is shown in Fig. XVII-9. Three loops are required for the conversion
system. Energy from a nuclear reactor is transferred to a flowing liquid, perhaps lith-
ium, which boils the primary working fluid, cesium, in the boiler section between the
first and second loops. The cesium vapor then enters the condensing ejector at
state ( ) . The condensing ejector also receives "cool" liquid cesium, state ( ) , which
is returned from the radiator in the third loop. These two streams are mixed in the con-
densing ejector so as to produce a liquid-cesium stream having a high stagnation pres-
sure. The liquid cesium stream is then split with a fraction being returned to the boiler
and the remainder being returned to the radiator.
Available analytical and experimental data have been used to calculate the perform-
ance of the condensing ejector. Calculations have been made to establish the pressure
drops and weights for the boiler and radiator, including state-of-the-art results for the
two-phase flow, which occurs in the boiler under zero gravity conditions.
QPR No. 72 155

(XVII. PLASMA MAGNETOHYDRODYNAMICS)
10
SPOWER LEVEL 300 KWE
w WORKING FLUID : CESIUMo 5-
5 ip "-300 PSIA T "=1600RUo o
U.J ~lp =IOPSIA T0'=2400R
Sg=0.7 'd=0.9C ..0 g
NO PUMP WORK
30 50 100 150 200INLET VAPOR STAGNATION PRESSURE,po0 , PSIA
Fig. XVII-1O. Effect of vapor stagnation pressure oncycle efficiency.
The cycle efficiency for the best conditions found thus far is shown in Fig. XVII-10.The conditions are for a space power system with a 300-kwe output. Cesium vapor issupplied to the condensing ejector at 2400 R and for the stagnation pressures shown inFig. XVII-10. The cesium liquid enters at 1600 R and 300 psia. Both streams are thenaccelerated to a pressure of 10 psia in the condensing ejector. The liquid-cesium streamfrom the ejector is usually available at a high velocity, and can be diffused to any desiredstagnation pressure before entry into the generator. A diffuser efficiency of 90 per centhas been used. A generator efficiency of 70 per cent has also been employed. The cycleefficiency is very low, approximately 2 per cent, when p" is 30 psia, but increasessteadily to approximately 12.5 per cent at 170 psia. The omission of the pump power forthe reactor loop will drop the cycle efficiency by an increment of approximately 0.5 percent.
Since the calculated cycle efficiencies and specific weights for the liquid-metal MHDpower system are quite competitive with other systems now under consideration, furtherstudies of it are planned.
G. A. Brown, W. D. Jackson, K. S. Lee
D. EXPERIMENTAL STUDY OF INDUCTION-COUPLED LIQUID-METAL
MAGNETOHYDRODYNAMIC CHANNEL FLOW
The direct generation of electrical power from the kinetic power carried by an elec-trically conducting fluid may be achieved through the utilization of the inductive coupling
QPR No. 72 156

(XVII. PLASMA MAGNETOHYDRODYNAMICS)
between a traveling magnetic field and the moving fluid. It has been shown1 that the
operating characteristics of an MHD induction generator can be determined from the
magnetic Reynolds number, based on wave speed and velocity and the velocity differ-
ence between the wave and the fluid. The conductivity and velocity attainable with ion-
ized gas flows are too low to yield satisfactory operating conditions, but liquid metals
yield more promising results as is indicated in Table XVII-1. Two methods of con-
verting the thermal energy of a power-system heat source to the kinetic energy of a
moving fluid have recently been proposed.2,3
Table XVII-1. Experimental results.
Liquid Metal Metal Vapor
velocity v 102 103 m/sec
conductivity a 106 10 2 mhos/m
magnetic field B 2 2 wb/m 2
1 2B2 10 8 3power density 4-v B2B 10 10 W/m 3
wavelength X 50 50 cm
magnetic o vkXReynolds ZTr 10 10number
The magnetic Reynolds number criterion used in Table XVII-1 is attained from a
one-dimensional analysis that ignores real machine effects, all of which may be
expected to degrade performance. An induction-coupled liquid-metal MHD channel flow
has been set up to investigate directly real machine effects such as end losses, fluid
viscous losses, magnetic-field configuration, and edge effects. Eutectic sodium potas-
sium alloy (NaK) was selected as the working fluid for a closed-loop flow facility driven
by a positive displacement pump with a capacity of 20 gallons per minute at a head of
20 p.s.i. A 300 gallon per minute centrifugal pump will be obtained for future experi-
ments. The entire flow loop is fabricated from stainless steel with neoprene connectors
and O-rings. Figure XVII-11 shows the general layout of the flow facility, including the
instrumentation used for the experimental study. Details of the design and construction
of the loop have already been given.4-6
The traveling-field coil system is contained in the horizontal cylindrical tank on the
table shown in Fig. XVII-11. It comprises 24 pairs of saddle coils assembled around a
4 1/4 inch diameter tube as shown in Fig. XVII-12. The coil pairs are spaced 6 inches
QPR No. 72 157

Fig. XVII-11. Liquid-metal flow facility.

(XVII. PLASMA MAGNETOHYDRODYNAMICS)
4.25DIA.
Fig. XVII-12. Traveling-field coil structure.
apart, and are connected to produce a two-phase system with a wavelength of 1 ft. The
coil structure is kerosene-cooled, and powered from a 60-cps alternator rated at 44 kva
at 230 volts. A variable-speed DC motor drive enables the alternator frequency to be
varied.
A high aspect ratio rectangular channel was used in these experiments. The internal
dimensions were 2 3/4 in. X 3/8 in. which yielded a velocity of approximately 10 ft per
second at maximum capacity. The long sides of the channel were insulated with epoxy
but, to minimize electrical losses in the chosen geometry, the remaining two sides of
COIL
Fig. XVII-13. Power-flow measurement circuit details.
QPR No. 72 159

(XVII. PLASMA MAGNETOHYDRODYNAMICS)
(Ap) n =S/I-S vs S FOR
R = 4.1 x 10 2ma
-THEORETICALA EXPERIMENTAL
1.0
0.8
C 0.6
0.4
0.2
I I i I I-1.0 -0.8 -0.6 -0.4 -0. 0
-0.4
- GENERATOR -0.6
-0.8
I _________________
0.2 0.4 0.6
PUMP
Fig. XVII-14. Normalized pressure vs slip.
s 3S RmaR
(I-S)Psn
sn + R m a 2 c 2
FOR Rma =4.1x10⁻² a
- THEORETICALA EXPERIMENTAL
-1.0 -0.8 -0.6 -0.4 -0.2 0 0.2 0.4
S
A -I
A -2
-GENERATOR PUMP
-3
Fig. XVII-15. Normalized power vs slip.
the channel were of nickel-plated copper. Transition sections were provided at each
end of the generator channel to connect to the 1.1 in. flow-loop tubing. Provision was
made for fluid pressure to be measured at 6-inch intervals along the channel.
Measurements were made of fluid velocity, pressure drop along the MHD channel
section, and power flow between the alternator and the coil system. The system was
first filled with alcohol to check out operation and calibrate the venturi flowmeter. To
minimize flow pulsations introduced by the positive displacement pump, the fluid veloc-
ity was kept at maximum value throughout runs with NaK, and the slip between the field
and the fluid was varied by adjusting the speed of the alternator drive motor. Direct-
reading NaK manometers did not function satisfactorily, and so a single mercury
QPR No. 72
_ 1
160

(XVII. PLASMA MAGNETOHYDRODYNAMICS)
manometer was used. This was connected by a system of valves to the appropriate pres-
sure measurement point.
Because of the small amount of electrical power flow involved in the MHD interaction,
relative to the 1500 volts required to drive the field coils, direct measurement of power
flow could not be made. Instead, the differential amplifier scheme shown in Fig. XVII-13
was used, and was calibrated directly by means of dummy loads connected across the
coil terminals. Pressure-slip and power flow-slip data are given in Figs. XVII-14 and
XVII-15, respectively, and a comparison with theoretical predictions is made.
The normalization of the experimental results and the theoretical curves are obtained
in the following way. The power Ps delivered by the fluid to the coils 7 is given by
IJ 0cXN 2 VsSRmaP22s (1)s K+a 1+ s2R2 ,
ma
where o is the fluid permeability, X is the wavelength, vs is the wave speed, NI is
the magnetomotive force, c is the over-all width of the machine, and
s = 1 - v/v s (a)
o -favsR = o s (2b)ma K+ a
a = ak (2c)
K= o (2d)c
In these definitions, s denotes the slip between vs and the average fluid velocity v;
Rma is the relevant magnetic Reynolds number; -f, the fluid conductivity; a, the
channel half-width; K, the ratio giving o to the field-structure permeability 4c;and a, the ratio that is a measure of the ratio of a to X in terms of the wave
number k.
As the experimental results are for a constant value of v, and the effect of changing
sR is of interest, it is convenient to define a constant value of magnetic Reynoldsmanumber R' as
ma
v omfavR' = R - (3)
ma ma v K + a
The normalized power P is then obtained assn
QPR No. 72 161
(XVII. PLASMA MAGNETOHYDRODYNAMICS)
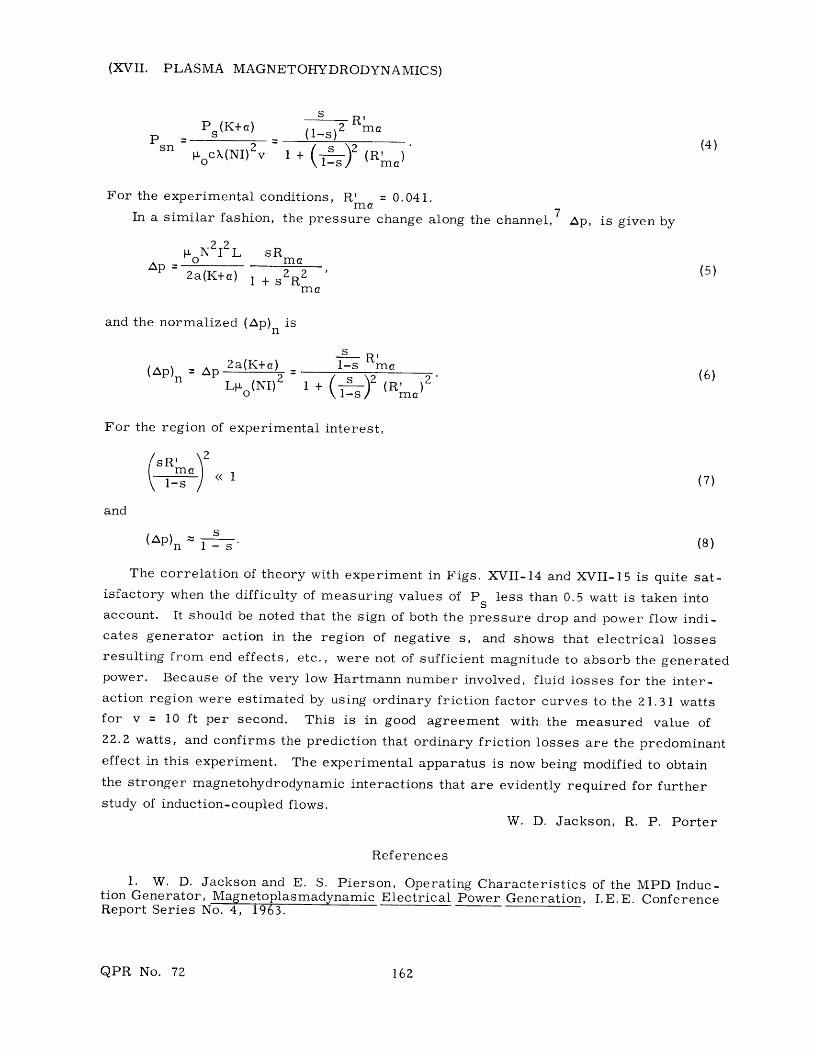
sR'P (K+a) mls)2 map = s (s R
sn I0cX(NI) v 1 + (Rma )
For the experimental conditions, R' = 0.041.maIn a similar fashion, the pressure change along the channel, 7 Ap, is given by
N2I2L sRo ma
2a(K+a) 1 + R2 (5)ma
and the normalized (Ap) n isssR'
2a(K+a) 1-s man 2 (s2 R' 2 (6)LL (NI) 1 + 1- (Rma)
For the region of experimental interest,
sR' 2- << 1 (7)
and
(AP)n -s (8)
The correlation of theory with experiment in Figs. XVII-14 and XVII-15 is quite sat-isfactory when the difficulty of measuring values of Ps less than 0.5 watt is taken intoaccount. It should be noted that the sign of both the pressure drop and power flow indi-cates generator action in the region of negative s, and shows that electrical lossesresulting from end effects, etc., were not of sufficient magnitude to absorb the generatedpower. Because of the very low Hartmann number involved, fluid losses for the inter-action region were estimated by using ordinary friction factor curves to the 21.31 wattsfor v = 10 ft per second. This is in good agreement with the measured value of22.2 watts, and confirms the prediction that ordinary friction losses are the predominanteffect in this experiment. The experimental apparatus is now being modified to obtainthe stronger magnetohydrodynamic interactions that are evidently required for furtherstudy of induction-coupled flows.
W. D. Jackson, R. P. Porter
References
1. W. D. Jackson and E. S. Pierson, Operating Characteristics of the MPD Induc-tion Generator, Magnetoplasmadynamic Electrical Power Generation, I.E.E. ConferenceReport Series No. 4, 1963.
QPR No. 72 162

(XVII. PLASMA MAGNETOHYDRODYNAMICS)
2. W. D. Jackson, Review of MHD Power Generation, Proc. AMU-ANL Conferenceon Direct Energy Conversion, Argonne National Laboratory, Lemont, Illinois, Novem-ber 1963.
3. D. G. Elliot, Two-fluid magnetohydrodynamic cycle for nuclear-electric powerconversion, Am. Rocket Soc. J. 32, 924 (1962).
4. F. W. Fraim IV, Design and Construction of a Magnetohydrodynamic ChannelFlow System, S. B. and S. M. Thesis, Department of Electrical Engineering, M. I. T.,1962.
5. J. F. Carson, Friction Factor Measurement for NaK MagnetohydrodynamicChannel Flow, S. B. Thesis, Department of Electrical Engineering, M. I. T., 1963.
6. M. H. Reid, Experimental Investigation of a Liquid Metal Induction Generator,S. M. Thesis, Department of Electrical Engineering, M. I. T., 1963.
7. E. S. Pierson, Power flow in the magnetohydrodynamic induction machine,Quarterly Progress Report No. 68, Research Laboratory of Electronics, M. I. T.,January 15, 1963, pp. 113-119.
E. NEURAL PATTERNS IN BLOOD-PRESSURE REGULATION
This study is concerned with the description of a part of the pressoreceptor reflex
system, a biological control system involved in the regulation of blood pressure. The
system consists of stretch-sensitive receptors located in the walls of certain arteries
which transduce the pressure signal into related electrical activity on the nerve asso-
ciated with the sensors; the nerve itself, which transmits the information to the brain;
the vasomotor center of the brain, which processes the information; and the efferent
nerves, which transmit the control signals to the heart and blood vessels, thereby
closing the control loop.
The work reported on here deals with the transduction of the pressure signals into
nerve firings on the nerve involved. Specifically, the relation between the firing fre-
quency on the carotid sinus nerve and the pressure at the carotid sinus is considered.
From the published data of single-fiber studies, it is possible to construct a model that
qualitatively at least reproduces the behavior of the biological system.
The static behavior of the system is characterized by no neural activity below a
threshold level of pressure, a firing rate proportional to pressure above the threshold
value, and an asymptotic approach to a maximum firing frequency as the static pressure
is raised to a sufficiently high level.
The dynamic response of the system, as determined by the system response to step-
like variations in pressure, exhibits a rapid increase of firing rate upon application of a
positive step which is followed by a decay to a final value that is higher than the value of
This work was supported in part by the National Institutes of Health (GrantNo. 5 TI HE 5550-02.
QPR No. 72 163

(XVII. PLASMA MAGNETOHYDRODYNAMICS)
PRESSURE
Fig. XVII-16.
Fig. XVII- 16.
FIRING RATE
ASYMPTOTEOF RESPONSES
Step responses on asingle fiber.
firing rate before application of the step. A
negative step produces an initial cessation of
firing, after which the firing rate grows back
to a steady value lower than its initial value.
If the pressure steps are started at
0 mm Hg and their amplitude is increased,
the (idealized) responses are observed as
shown in Fig. XVII-16. These observations,
as well as observations of ramp responses,
suggest that the system may be modeled in
the manner of Fig. XVII-17. The first non-
linear section results in the successive step
responses approaching an asymptotic response.
The use of the linear filter corresponds to
approximating the step response by the sum
of a step and a single decaying exponential. The effect
corresponds to that of the static threshold and accounts
to negative steps.
of the second nonlinear section
for the nature of the responses
OUT LINEAR OUTPRESSURE H(s) Os+ a IN FIRING RATE
a>O b>O
a<b
Fig. XVII-17. Model whose response approximates the responseof a single fiber.
The complexity of this model can be increased by adding more poles and zeros
(approximating the step response by sums of decaying exponentials).
The experimental part of this study consisted of the application of (almost) sinus-
oidal pressure variations imposed upon static levels of pressure, and the recording of
the resultant activity on the carotid sinus nerve. The recordings were obtained from
multifiber preparations. The activity corresponding to 10 cycles of each stimulus fre-
quency at each static level was recorded, so that some averaging could be performed
to reduce the effects of noise (noncorrelated) components in the outputs.
The data-reduction scheme consists of thresholding the outputs to obtain a clean base
line, and counting the number of firings in a window whose position with respect to the
stimulus is controllable, as indicated in Fig. XVII-18. Using this scheme, we obtained
curves of firing rate vs time corresponding to the stimulation; a typical example appears
QPR No. 72 164

(XVII. PLASMA MAGNETOHYDRODYNAMICS)
NERVESIGNAL OUTFROM COUNTERTAPE
GATEPULSE
TRIGGERED TRGERED
GENERATOR SYNCHRONIZEDVA LE WITH PRESSURE
VARIABLE SINUSOID,DECONTROL FROM TAPE
CONTROL
Fig. XVII-18. Block diagram of datareduction scheme.
rate vs time minus angle of pressure) is
coefficients of the decaying exponentials
in Fig. XVII-19. Qualitatively, the peaks
of these curves tend to occur in the region
in which the corresponding pressure is
near its peak. Since these curves are not
sinusoidal, their first harmonics are being
calculated, and the amplitude and phase of
the first harmonics with respect to the
amplitude and phase of the pressure are
being examined. Preliminary results indi-
cate that the angle of the system function
(angle of first harmonic of averaged firing
positive. This agrees with the fact that the
used to approximate the step response are
positive, that is, that the residues in the poles of H(S) are positive, which implies that
No. OF FIRINGS IN 50 MS WINDOW
LOCATED AT TIMES INDICATED,
SUMMED OVER 10 CYCLES OF
STIMULATION.
T - 1.03 sec
MEAN PRESSURE '~ 90 mm Hg
PEAK-TO-PEAK VARIATION
" 12.5 mm Hg
TIME IN FRACTIONS OF 1 PERIOD
Fig. XVII-19. Typical experimental curve of firing rate vs timeobtained from gross recordings.
QPR No. 72 165

(XVII. PLASMA MAGNETOHYDRODYNAMICS)
the negative real poles and zeros of H(S) alternate, with a zero nearest the origin.
Requiring the critical frequency nearest the origin to be a zero, together with requiring
the number of poles to equal the number of zeros, implies positive phase shift.
These preliminary results also indicate that the system gain (amplitude of first har-
monic of the averaged firing rate versus time divided by amplitude of the pressure
sinusoid) is an increasing function of frequency. This trend agrees with the amplitude
vs frequency behavior of the system function H(S) - s + bO < a < b.s + b
D. H. Pruslin
F. PENETRATION OF AN ION THROUGH AN IONIC DIPOLE LAYER
AT AN ELECTRODE SURFACE
When cesium is adsorbed on a metallic surface in the form of ions, these ions and
their images form a dipole layer. 1,2 If an ion is introduced to the surface, it travels
through a fraction f of the potential difference caused by this dipole layer from the
image plane to a point at infinity, 2 as shown in Fig. XVII-20. Values of the penetration
SURFACE
Fig. XVII-20. Potential of an ion withrespect to the potential
AO. = fa, I of a substrate surfaceI e A e = Vo as a function of distance
S- _ from the surface.
r
coefficient have been computed by Rasor and Warner 3 and by Kennedy. 4 In this report
it is shown that the penetration coefficient can be evaluated as a function of coverage in
two different ways, one for an immobile film, and the other for a completely mobile
film. Subsequently, values of the penetration coefficient can be obtained from the
Langmuir-Taylor data for cesium on tungsten in two different ways. Both methods give
values for the penetration coefficient which agree closely with each other over the entire
range of the coverage, and these values fall between the theoretical expressions for f
obtained for the cases of immobile and mobile films.
1. Penetration Coefficient for an Immobile Film
For an immobile film the cesium ions occupy fixed lattice sites, as shown in
Fig. XVII-21a. A cross -section view of the surface is shown in Fig. XVII-2 b. The
following nomenclature is used.
QPR No. 72 166

(XVII. PLASMA MAGNETOHYDRODYNAMICS)
Symbol Definition
d lattice constant of the crystal
X distance of the center of charge of an adsorbed ion from theimage plane, taken to be equal to the hard-core ionic radiusof cesium
r distance of an ion from the image plane
r.. distance between an ion at r and any adsorbed ion at i,j
r.. distance between an ion at r and an image of any adsorbedion at i,j
r distance between an adsorption site and any other site at i,j
1.
6. = ionic coverage1 l
l surface density of adsorbates at full coverage4d
x rj2d/ i J 9
II
2d
SAMPLE SITE
(a)
(b)
Fig. XVII-21. (a) Immobile adsorbate-substrate system. (b) Crosssection of adsorbate-substrate system.
The potential on an ion at any r as a result of being in the field of the remaining
adsorbed ions and their images can be expressed as
V(r) = q -(rP (1)
in which the summation is performed over every adsorbate, and each adsorbate corre-
sponds to a distinct distance r... For the square lattice model with perfect arrangement
of adsorbates,
QPR No. 72 167

(XVII. PLASMA MAGNETOHYDRODYNAMICS)
2 2rij+ = (r-k) + rij (2a)
2 2rij - = (r+X) + rij (2b)
with
22 4d 2 (i2+j)r- (2c)
i
Equation 1 is rewritten
r.. - r.. (r.. +r..j+)1]- 1+ 1]- 1+
(r) rij+rij (r j+r j+ )
or
2 2r.. - r..
V(r) =q 2 2 (3)
1ij+ 1- 1J+ 1]-
Substituting Eq. 2 in Eq. 3, for r = X, yields
V(r=k)= 4qX2 2 1
-co2 2 1/2 2 1/2 22 + 4d 2(i+j Z 4d + 4 d 22[4 2 i2 + (i+ j ) (i +j
(4)
in which i,j take on all values except i = j = 0.2
Since 2 << d. (i2+j2 ), we neglect X2 in the denominator of Eq. 4 to obtain1
qk263/2 oc
V(r=X) 1 (5)4d 3 (i2+j2 3/2
Evaluating the sum 5 then gives the potential of an adsorbed ion resulting from the otheradsorbed ions, in other words, the value of V in Fig. XVII-21b, which is equal to
2.21qX 2V(r=X) = - (6)
The potential at infinity with respect to the image surface is identified as V inFig. XVII-20. For large r, the potential felt by an ion from the discrete dipoles is
QPR No. 72 168

(XVII. PLASMA MAGNETOHYDRODYNAMICS)
approximately the same as that which would be felt from a continuously distributed dipole1,6
layer. This value has been stated to be
lim V =V = V = 2rMo- 1 i for M = 2qX. (7)r-oo00
2. Mobile Films
For mobile films the cesium ions can move freely from one lattice site to another,
and hence each lattice site has the same probability of being occupied by a cesium ion
that is simply the coverage. Hence
p(O) = 0. (8)
The potential, then, of an ion at distance r is obtained by summing over each lattice
site and multiplying this potential by the probability of occupation. For the mobile film,2 i+ 2
r.. = 4d (i +j , so that13
V(r=) = P(0) (9)4d3 - 2 .23/2-00 (i+j)
Evaluating the sum gives
2.21qk2.V(r=k) = 3 1 (10)
d
3. Determination of f
The penetration coefficient is determined by the relation f , where A.i is thee
change of ionic work function, and A $e is the change of electron work function. The
increase in ionic work function occurs because the ion penetrates through the potential
V - V of Fig. XVII-20. Thus A i = V - V. The electron work function decreases
as a result of the accelerating potential V o, so that A e = V . Thus we obtain the rela-
tion
f = 1 V (11)Voo
Substituting the calculated values for V and V , we obtain for the immobile film
f. = 1 2.21 ° .1 / 2 = 1 - 0.3628 1/2 (12)Im 1 1
For the completely mobile film independent of coverage,
QPR No. 72 169

(XVII. PLASMA MAGNETOHYDRODYNAMICS)
2.21Xfm = 1 = 0. 6 3 2 . (13)rrd
4. Ionic Coverage
The ionic coverage is related to the total coverage by Fermi-Dirac statistics, andthe following relation has been derived. 7
Fig. XVII-22. Born-Haber cycle.
T =00
6000 K
8000 r
10000
12000
1400'
0.2 0.3 0.4 0.5 0.6 0.7 0.8 0.9 1.0
9
Fig. XVII-23. Ionic coverage vs total coverage for varioussurface temperatures.
QPR No. 72
0.4
0.3
0.2
0.1 -
0.1
170

(XVII. PLASMA MAGNETOHYDRODYNAMICS)
0. = (14)1 + exp(-E/kT)
where E is the difference in energy between a bound 6S electron of a surface adsorbate
atom and the Fermi level of the substrate. This quantity is determined from experiment
in the following manner. Consider the Born-Haber cycle of Fig. XVII-22. Two energy
balances result from this cycle:
fa = e - Vi + (15)
and
fa a + E. (16)
Equation 15 can be solved for f by using the atomic heat of adsorptions data of Taylor2 a
and Langmuir. If it is assumed that a does not change with coverage - which is rea-
sonable since the atom is not acted upon by the electric forces of the dipole layer - and
if f for various materials tends towards the same value at higher coverages, thenaknowing f = f (0) and a , we can calculate the value of E = E(O) and substitute it in
a aEq. 13; this procedure yields 0. = 0.(0). This is plotted for various temperatures in
1 1
Fig. XVII-23 for cesium tungsten.
5. Correlation of Experimental Results
Theoretical values for f from Eqs. 11 and 12, for the two limiting cases of mobile
and immobile films, are plotted against 0 in Fig. XVII-24. Curves are also drawn
i 2,8on the same coordinates by computing f i from previous experimental data. '8 The
evalues of f computed from Taylor-Langmuir data fall between the theoretical values
obtained for the two limiting cases considered. Furthermore, values of f calculated
in two different ways from the Taylor-Langmuir measurements agree within experi-
mental uncertainties. Curve 4 is calculated from direct measurement of i. By using
the cycle of Fig. XVII-22, together with the relations
4i ( 0) = io + A i, (17)
-A e = e - eo' (18)
A i = fA'e' (19)
so that
i( ) = io + f(eo e) (20)
(where the zero subscripts denote values at zero coverages), the expression for f is
obtained.
QPR No. 72 171

1.0 - CURVE
1 Eq. 6
2 Eq. 10
0.9 No. 1 3 Eq. 14 T 8000
K
4 f= iNo. 44 Ae
0.8 5 Rhenium8
6 Molybdenum8
No. 3 7 Tungsten8
0.7 -
No. 2
0.6
S0.5 - No. 6
Fig. XVII-24. Penetration coefficientvs coverage.
0.4
No. 7
0.3
No. 5\
0.2
0.1
0 0.2 0.4 0.6 0.8 1.0
4
CESIUM ON
No. 1 Tungsten2
No. 2 Rhenium9
No. 3 Tungsten9
3- No.4 Molybdenum9
f No. 12 No. 2
No.No.4
00.1 0.2 0.3 0.4 0.5 0.6 0.7 0.8 0.9 1.0
Fig. XVII-25. Atomic heater adsorption vs coverage.
QPR No. 72 172

Table XVII-2. Experimental values of relevant potentials and penetration coefficients.
e (eV) i (eV)(measured) e (measured )
1.1
.99
.90
.73
.58
.45
.34
.26
.205
.165
4.62
4.12
3.75
3.10
2.62
2.20
1.89
1.74
1.70
1.78
0
.5
.87
1.522,0
2.42
2.73
2.88
2.922.84
2.05
2.46
2,76
3.22
3.58
3,87
4.06
4.13
4.07
3.96
Curve 3 Curve 4fa(eV) f f
(measured) (computed) (computed)
0
.41
.711.17
1.53
1.82
2.01
2.08
2.021.91
2.82
2.722.632.472.322.19
2.09
1.98
1.901.84
.80
.782
.77
.75
.739
.733
.704
.685
.655
.82
.817.77.765.751
.737
.723.693.673
0
.05
.1
.2
.3
.4
.5
.6
.7
.8

(XVII. PLASMA MAGNETOHYDRODYNAMICS)
fa + Vi- io- ef=a 1 e
eo - e
(21)
Equation 17 is used with the Taylor-Langmuir measurements of f = f (0) to calculatea a
curve 3. This double agreement increases the confidence placed in the Taylor-Langmuir
data. Table XVII-2 lists the numerical values used in the calculations.
The results of Charbonnier and others8 for the variation of the energy of adsorption
with coverage are shown in Fig. XVII-25. From this figure it is seen that there is a
much stronger variation of the energy of desorption with coverage; this result is in dis-
agreement with the Taylor-Langmuir data. In Fig. XVII-24, the penetration coefficient
as obtained from Eq. 17, with data of Charbonnier, Swanson, Cooper, and Strayer8 used,
is also shown. The values obtained for f versus coverage do not fall between the two
limiting cases of mobile and immobile films, as do the values obtained from Taylor-
Langmuir data.
J. W. Gadzuk
References
1. I. Langmuir, J. Am. Chem. Soc. 54, 2798 (1932).
2. J. B. Taylor and I. Langmuir, Phys. Rev. 44, 423 (1933).
3. N. S. Rasor and C. Warner III, Correlation of Electron, Ion and Atom EmissionEnergies, Atomics International Report AI-6799, November 1961.
4. A. J. Kennedy, Adv. Energy Conv. 3, 207-222 (1963).
5. J. Topping, Proc. Roy. Soc. (London) A114, 67 (1927).
6. J. H. de Boer and C. F. Veenemans, Physica 1, 953-965 (October-November1934).
7. E. N. Carabateas, Analytical Description of Cesium Films on Metal, Report tothe National Science Foundation, "Basic Studies of Cesium Thermionic Converters,"June 1963.
8. F. M. Charbonnier, L. W. Swanson, E. C. Cooper, and R. P. Strayer, Inves-tigations of the Migration, Desorption, and Voltage Breakdown Properties of CesiumFilms on Refractory Electrodes, Field Emission Corporation Report Log. No. 63020,April 1963.
QPR No. 72 174