professional development training: utilization of the behavioral risk factor surveillance system...
TRANSCRIPT

Professional Development Training:Utilization of the Behavioral Risk Factor
Surveillance System (BRFSS) Data
LaTonya BynumArkansas BRFSS Survey Coordinator
October 25, 2011

OutlineoOverview of BRFSS survey
oHistory and purpose of BRFSS
oSurvey Methods
oProcess for Adding Questions
oReview of BRFSS survey results
oDemonstration on how to access data
oExamples of BRFSS Data to Action

Behavioral Risk Factor Surveillance SystemBRFSS is a random digit dial telephone survey that collects health
information from adults on behaviors that put health at risk for premature death and disease.
Six benefits of the survey:
1) Covers most health topics2) Identifies health disparities3) Public data use file4) Results can be viewed online5) Data collected annually6) FREE Technical assistance

• In the 1980s research showed health behaviors play an important role in unnecessary deaths and diseases.
• In 1984 CDC started the state-based BRFSS to collect health information on risk behaviors and health practices that affect health status.
• By 1997 all states were participating.
BRFSS History

BRFSS Survey Design

Telephone SurveysHouseholds with a telephone are selected

People 18 and older are randomly selected
Random Sample

Interviewers are Trained

Computer Assisted Telephone Interview
• Telephone Interview
• Data Entry

Calls are made 7 days a week
• 2,300 – 2,500 calls per month
• More than 100,000 calls nationwide per year

Data Collection
• Arkansas BRFSS contracts with Clearwater Research
• Interviews are monitored to maintain and ensure data quality.
• Data are sent to state & CDC
• CDC aggregates monthly data for the entire year.
• Final data are available by March of the following survey year.

Data are weighted...· to compensate for unequal selection
probability
· to ensure that data can be used to represent the Arkansas adult population

Arkansas BRFSS Facts & Update
• Data collected continuously since 1993
• Sample sizes range: 1,764 – 5,732
• Sends out monthly advance letters
• Moving towards multimodal survey & new weighting procedure
• Cell phone data collection began in 2009
• Oversampling for Blacks and Hispanics

1991
1993
1994
1995
1996
1997
1998
1999
2000
2001
2002
2003
2004
2005
2006
2007
2008
2009
2010
0
50
100
150
200
250
300
350
400
450
500
550
600
650
700
750
Arkansas BRFSS Minority Sample Size: Survey Years 1991, 1993 - 2010
Black, NH Hispanic Other, NH
Survey Year
Sa
mp
le S
ize
s

1) Core Asked by all states
2) Optional Modules Specialized topic questions states can choose to
include
3) State-added questions State specific questions to address state and
local issues
Design of BRFSS Questionnaire

• ~ $1,200 - $1,300 per question•July 1 planning for next annual survey begins•New question proposals are due by September•Proposals are reviewed in October•Pre-testing of state added questions begins October•December questionnaire is finalized•New questions are included on survey from January 1 – December 31
How to add BRFSS Questions

CDC Required Response Rate: 40.0%
Arkansas BRFSS 2010 Response Rate: 53.0%
Response Rate for 2010

Who uses it?
· State and Local Health Departments
· Students and Researchers· Non-Profit Agencies· Federal Agencies· Research organizations· Insurance companies· Media

How it is used?· Plan and implement programs like the
UAMS Disability and Health Program· Develop plans to reduce the burden of
Diabetes, Obesity, Heart Disease, and Tobacco
· Identify health disparities across the state
· Prepare grant proposals for state and local level projects
· Conduct public health awareness campaigns for the Arkansas BreastCare program
· Publish scientific articles in professional journals

BRFSS
TOBACCO
CANCER CONTROL
ALCOHOL
DISABILITYDIABETES
OBESITY/ OVERWEIGHT
ORAL HEALTH
HEALTH CARE ACCESSWOMEN’S HEALTH
MENTAL HEALTH
+ 100 OTHER TOPICS3
IMMUNIZATIONINJURY
ELDER HEALTH
DEPRESSION
RACISM
BRFSS Topics of Interest...
HIV or STD
SLEEP

Physical Activities or Exercise

1996 1998 2000 2001 2002 2003 2004 2005 2006 2007 2008 2009 201045
55
65
75
85
Percentage of Persons 18 and Older Participating in Any Phys-ical Activities or Exercises In The Past Month By Year,
U.S. versus ArkansasU.S. Arkansas
Pe
rce
nta
ge
Source: http://apps.nccd.cdc.gov/brfss/index.asp

Percentage of Persons 18 and Older Participating in Any Physical Activities or Exercises In The Past Month By State, 2010 BRFSS
Source: http://apps.nccd.cdc.gov/gisbrfss/default.aspx

White Black Hispanic Other30
40
50
60
70
80
90
100
70.668.3
70.1 67.6
Percentage of Persons Age 18 and Older Participating in Any Physical Activities or Exercises In The Past Month by Race/
Ethnicity, Arkansas 2009 and 2010
Race/Ethnicity
Perc
ent
State %: 70.2
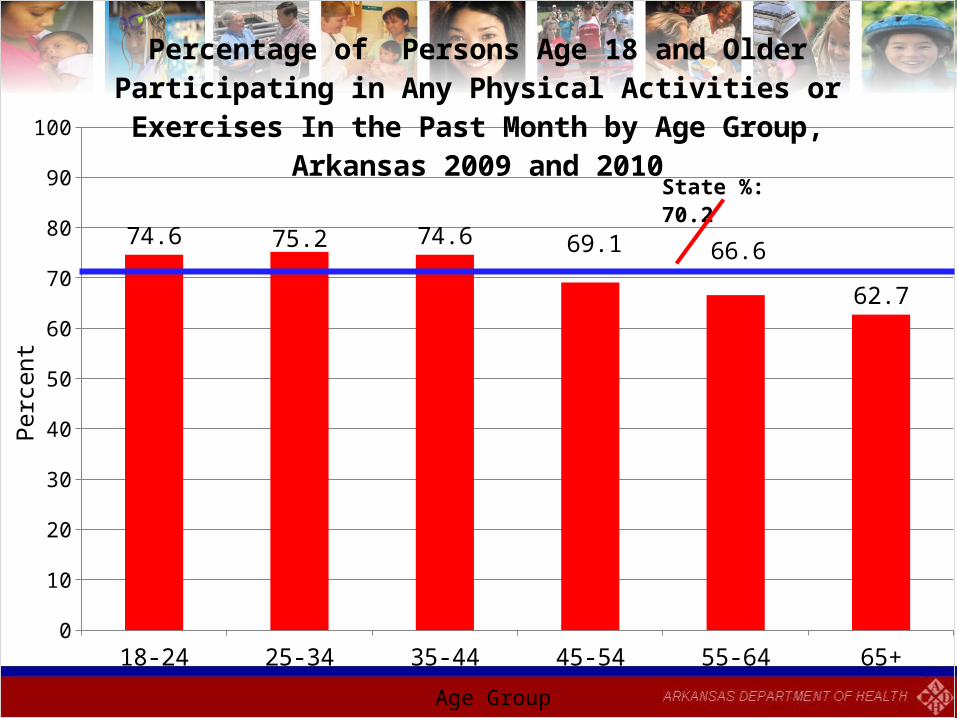
18-24 25-34 35-44 45-54 55-64 65+0
10
20
30
40
50
60
70
80
90
100
74.6 75.2 74.6 69.1 66.6
62.7
Percentage of Persons Age 18 and Older Participating in Any Physical Activities or Exercises In the Past Month by Age
Group,Arkansas 2009 and 2010
Age Group
Perc
ent
State %: 70.2

< HS Education HS Grad Some College College0
10
20
30
40
50
60
70
80
90
51.5
64.8
70.8
83.6
Percentage of Persons Age 18 and Older Participating in Any Physical Activities or Exercises In the Past Month by Educa-
tional Level, Arkansas 2009 and 2010
Educational Level
Perc
ent
State %: 70.2

0
10
20
30
40
50
60
70
80
90
54.1
63.1
67.4
82.6
Percentage of Persons Age 18 and Older Participating in Any Physical Activities or Exercises In the Past Month by Income
Level, Arkansas 2009 and 2010
Income Level
Perc
ent
State %: 70.2

Nutrition: Consumption of 5 Fruits and
Vegetables Per Day

1996 1998 2000 2002 2003 2005 2007 200910
15
20
25
30
35
40
Percentage of Adults Age 18 and Older Consuming 5 or More Fruits and Vegetables Per Day by Year, U.S. versus Arkansas
U.S. Arkansas
Pe
rce
nta
ge

Source: http://www.brfss.ar.gov

White Black Hispanic Other0
5
10
15
20
25
30
35
20.723.3
21.1
26.8
Percentage of Adults Age 18 and Older Consuming 5 or More Fruits and Vegetables Per Day by Race/Ethnicity,
Arkansas 2007 and 2009
Race/Ethnicity
Perc
ent
State %: 21.1

18-24 25-34 35-44 45-54 55-64 65+0
5
10
15
20
25
30
35
20.1 19.3 19.9 19.9 21.3
25.5
Percentage of Adults Age 18 and Older Consuming 5 or More Fruits and Vegetables Per Day by Age Group,
Arkansas 2007 and 2009
Age Group
Perc
ent
State %: 21.1

< HS Education HS Grad Some College College0
5
10
15
20
25
30
35
40
15.3
18.521.7
25.9
Percentage of Adults Age 18 and Older Consuming 5 or More Fruits and Vegetables Per Day by Educational Level,
Arkansas 2007 and 2009
Educational Level
Perc
ent
State %: 21.1

0
5
10
15
20
25
30
35
40
18.020.3
22.1 22.1
Percentage of Adults Age 18 and Older Consuming 5 or More Fruits and Vegetables Per Day by Income Level, Arkansas
2007 and 2009
Income Level
Perc
ent
State %: 21.1

HIV Testing Results

Arkansas Nationwide (2010 Data)0
10
20
30
40
50
60
35.0
37.2
Percentage of Persons Age 18 - 64 Ever Been Tested for HIV,Arkansas versus US 2009 - 2010P
erce
nt

Source: http://www.brfss.ar.gov

White Black Hispanic0
10
20
30
40
50
60
70
32.4
61.5
31.8
Percentage of Persons Age 18 - 64 Ever Been Tested for HIV by Race/Ethnicity, Arkansas 2009 and 2010
Race/Ethnicity
Perc
ent
State %: 35.0

18-24 25-34 35-44 45-54 55-640
10
20
30
40
50
60
24.5
52.9
42.4
29.5
18.8
Percentage of Persons Age 18 - 64 Ever Been Tested for HIV by Age Group: Arkansas, 2009 and 2010
Age Group
Perc
ent
State %: 35.0

< HS Education HS Grad Some College College0
10
20
30
40
50
60
28.9
33.1 36.8 37.3
Percentage of Persons Age 18 - 64 Ever Been Tested for HIV by Educational Level: Arkansas, 2009 and 2010
Educational Level
Perc
ent
State %: 35.0
0
5
10
15
20
25
30
35
40
45
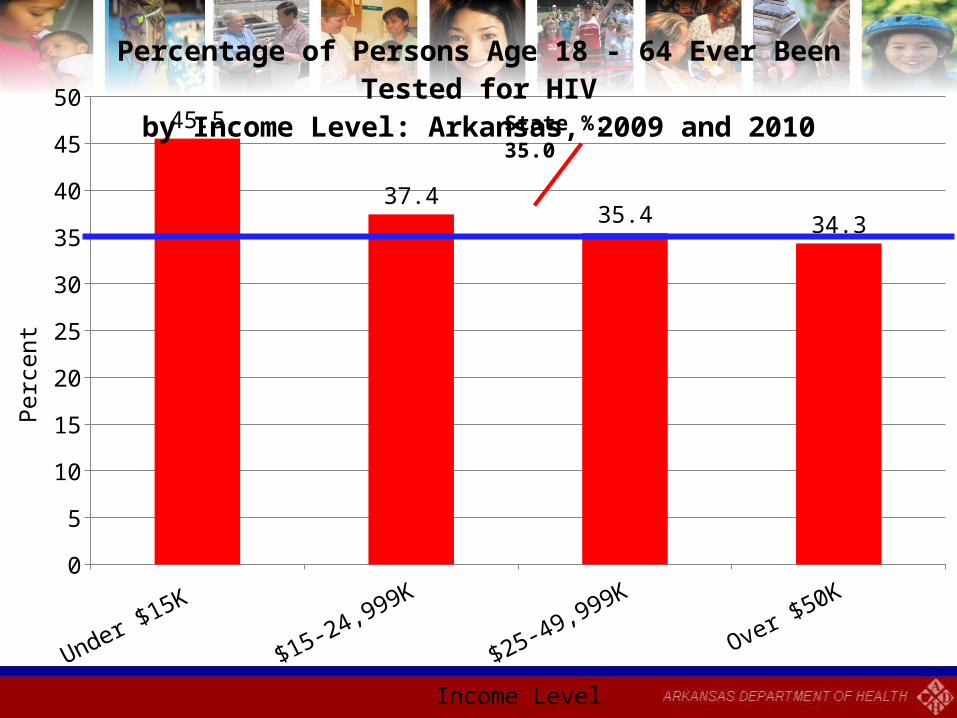
5045.5
37.435.4 34.3
Percentage of Persons Age 18 - 64 Ever Been Tested for HIVby Income Level: Arkansas, 2009 and 2010
Income Level
Perc
ent
State %: 35.0

Drug treatment facility
Jail or Prison
Counseling and testing office
At home
Somewhere else
Hospital
Clinic
Private Doctor or HMO Office
0 10 20 30 40 50
0.5
1.7
2.9
3.1
12.4
14.6
26.1
38.7
Where did you have your last HIV test?
Percent
Loca
tion

Strengths
• State and County Estimates
• State based survey
• Timeliness
• Cost
• SMART-BRFSS (Statistical Metro-/Micropolitan Risk Trends) – Cities & counties with 500+ observations
• GIS and mapping capability – State and county-level
• Linking to other data sources – EPA & Census data
• Launching follow-up surveys of subpopulations identified in BRFSS – Asthma Follow-up

Weaknesses
• Self Reported
• Small cell sizes
• Telephone coverage
• Technology barriers
• Non-response
• Recall bias
• Language barriers
• Non-institutionalized population

How to Access BRFSS Data
Submit requests to [email protected], charts, fact sheets, GIS maps, or data files
AR BRFSS County Estimates: www.brfss.ar.govClick on BRFSS MapsClick on County DataClick on report of choice (2004 – 2010:xls)
CDC BRFSS: www.cdc.gov/brfssClick on BRFSS MapsClick on Prevalence Data and Trends DataClick on SMART: City and County Data

CDC Prevalence and Trends WebQuery is a web based tool provided by BRFSS
• Data can be exported to Excel
• List data for all states
• Compare state to state or state to nation
• Review or print graph of BRFSS data
• Copy graph and insert into presentation or report
• View trend data by year, state to state, and by respondent answer choice

http://apps.nccd.cdc.gov/brfss/index.asp
Bookmark it!
This is the main page: You can pull-down the
menus to search for
information by state, year and
category.

Select the state of interest, “Arkansas.”
Select the year, “2010.”
Select the category, “Overweight and Obesity
(BMI).” and Press the “Go” Option.

Select the option for “Weight classification by Body Mass Index
(BMI)” by clicking here.

Click the drop down menu and select the option for “Grouped
by Race” and click “Go” button.

This shows the percent of Black adults who reported
they are obese “44.5”.
This shows the Race Category is “Black”, % (Percent), CI
(Confidence Intervals), and n (number of people who were
interviewed).

Resources at www.brfss.ar.gov Arkansas BRFSS Presentations - Presentations that include Arkansas BRFSS data
Arkansas BRFSS Publications- Strategic plans, factsheets, and documents that include Arkansas BRFSS
data
Arkansas BRFSS Quick Links- National query systems that include Arkansas BRFSS data
Arkansas BRFSS Optional Module Data- CDC tabulated reports that include Arkansas BRFSS data on specific
health topics
Arkansas BRFSS GIS Maps- Geographic Information System (GIS) maps that visually display Arkansas
BRFSS county data estimates

Program Modification
The University of Arkansas Medical Sciences (UAMS) Partners for Inclusive (PIC) Communities
Office Modifies the Arkansas Disability and Health Program
The UAMS Partners for Inclusive Communities (PIC) used the BRFSS information to target their health
promotion efforts. After finding disparities in rates of obesity among persons who have a disability, the PIC implemented a new health intervention (Living Well
with a Disability) at local independent living centers in 2007.

Change In Policy
Clean Indoor Air Act Protects the Public from Secondhand Smoke: Act 8
According to the BRFSS, current smoking prevalence among Adults in Arkansas was 23.5% in 2005, compared with
20.5% nationwide. In April 2006, state lawmakers used the BRFSS data to support their decision to pass the
Arkansas Clean Indoor Act, which prohibits smoking in work and public places, including bars and restaurants.

Appropriation of Funds
State Legislator Appropriates $2 Million for Implementation of the Arkansas Cancer Plan
BRFSS data on breast and cervical cancer were included in the Arkansas Cancer Facts and Figures
publication which was used to educate the Arkansas Legislative Public Health Welfare and Labor Committee as well as foster support for
improving public health in Arkansas.
Through broad-based collaborative action, $2 million was successfully secured for
implementation of the Arkansas Cancer Plan.

A powerful tool for health
professionals.
BRFSS

LaTonya Bynum
Arkansas BRFSS Survey Coordinator
www.brfss.ar.gov
Toll Free Phone: 1-800-462-0599 EXT. 2003
Questions…