professional sports in las vegas · las vegas over the past 5 years, an average of 7 percent of...
TRANSCRIPT


Professional Sports in Las VegasAdditions and Expansions

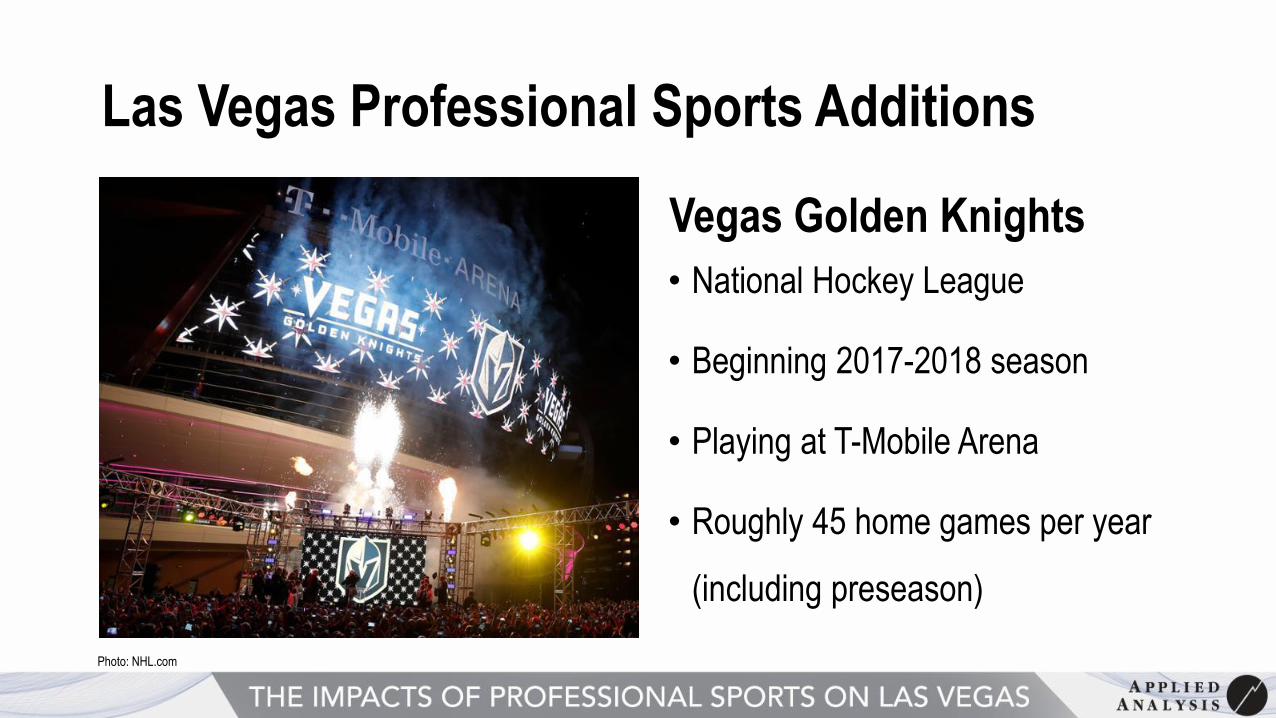
Las Vegas Professional Sports Additions
Las Vegas Professional Sports Additions
Vegas Golden Knights
• National Hockey League
• Beginning 2017-2018 season
• Playing at T-Mobile Arena
• Roughly 45 home games per year
(including preseason)
Photo: NHL.com
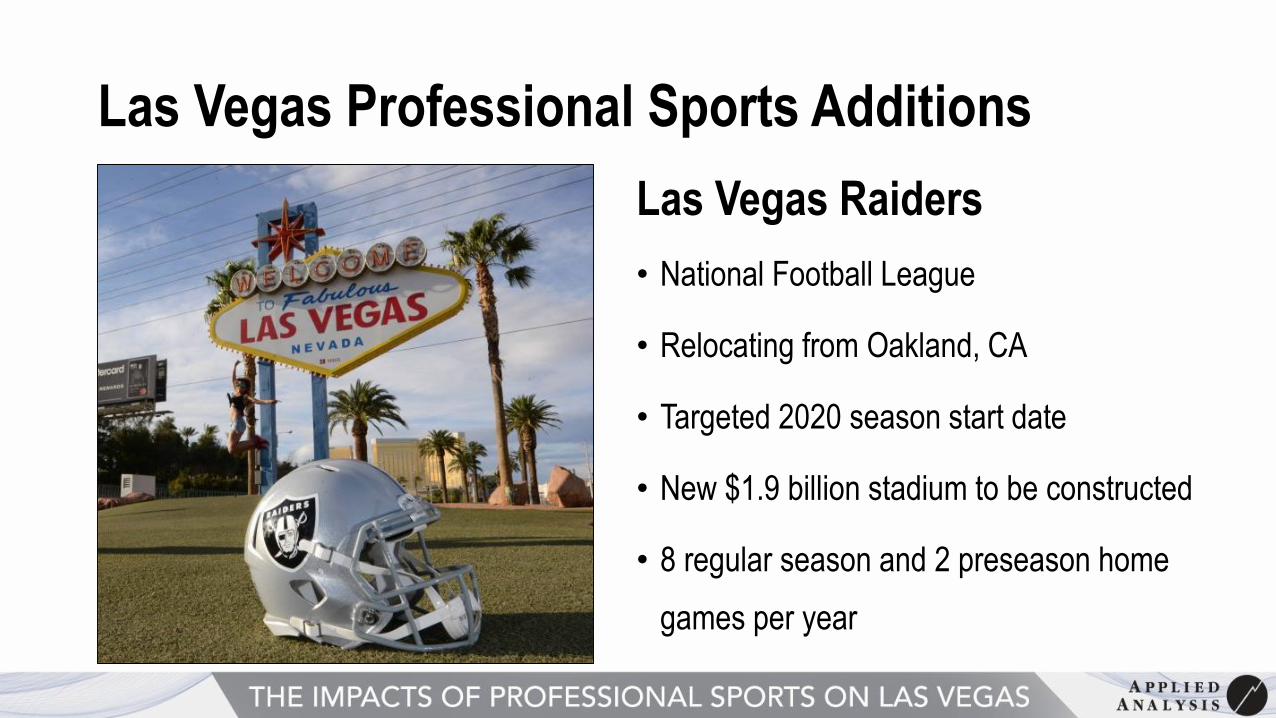
Las Vegas Professional Sports Additions
Las Vegas Raiders
• National Football League
• Relocating from Oakland, CA
• Targeted 2020 season start date
• New $1.9 billion stadium to be constructed
• 8 regular season and 2 preseason home
games per year

Las Vegas Professional Sports Existing Major Professional Sports Entities

Las Vegas Professional Sports UFC
• World Headquarters in Las Vegas
since 2001
• International Fight Week had a $230
million economic impact in 2015
• Agreement with T-Mobile Arena to be anchor tenant, will have at least 4 events at the venue annually

Las Vegas Professional Sports UFC
• Nearing completion of new headquarters building, which includes the UFC Performance Institute
• 180,000-square-foot facility on 24 acres
• In addition to corporate offices, the campus includes training and rehab space for all UFC fighters
• Opening second quarter of 2017

Las Vegas Professional Sports NASCAR
• NASCAR in Las Vegas since 1996
• Adding a second race in 2018
• Estimated 96,400 out-of-town attendees in 2016
• $82 million in visitor spending in 2016
Source: Las Vegas Convention and Visitors Authority

Las Vegas Professional SportsWrangler National Finals Rodeo
• Held in Las Vegas since 1985
• In 2015:
• 172,650 total event attendance
• 46,700 out-of-town visitors
• $71 million in visitor spending
Source: Las Vegas Convention and Visitors Authority

Las Vegas Professional SportsWrangler National Finals Rodeo

Tourism and Special EventsLas Vegas is Built for Large-Scale Events
National Finals RodeoTotal Event Attendance: 170,000+
Electric Daisy CarnivalTotal Event Attendance: 400,000+

Las Vegas Professional SportsA Mutually Beneficial Relationship
As a destination for attendees, Las Vegas
has a lot to offer beyond the main event

Las Vegas Professional SportsA Mutually Beneficial Relationship
WORLD-CLASS
RESORTS
FINE DINING
ENTERTAINMENT
SHOPPING
Visitors in Las Vegas to Attend Sporting Events
Spend Money on a Variety of Non-Event Activities
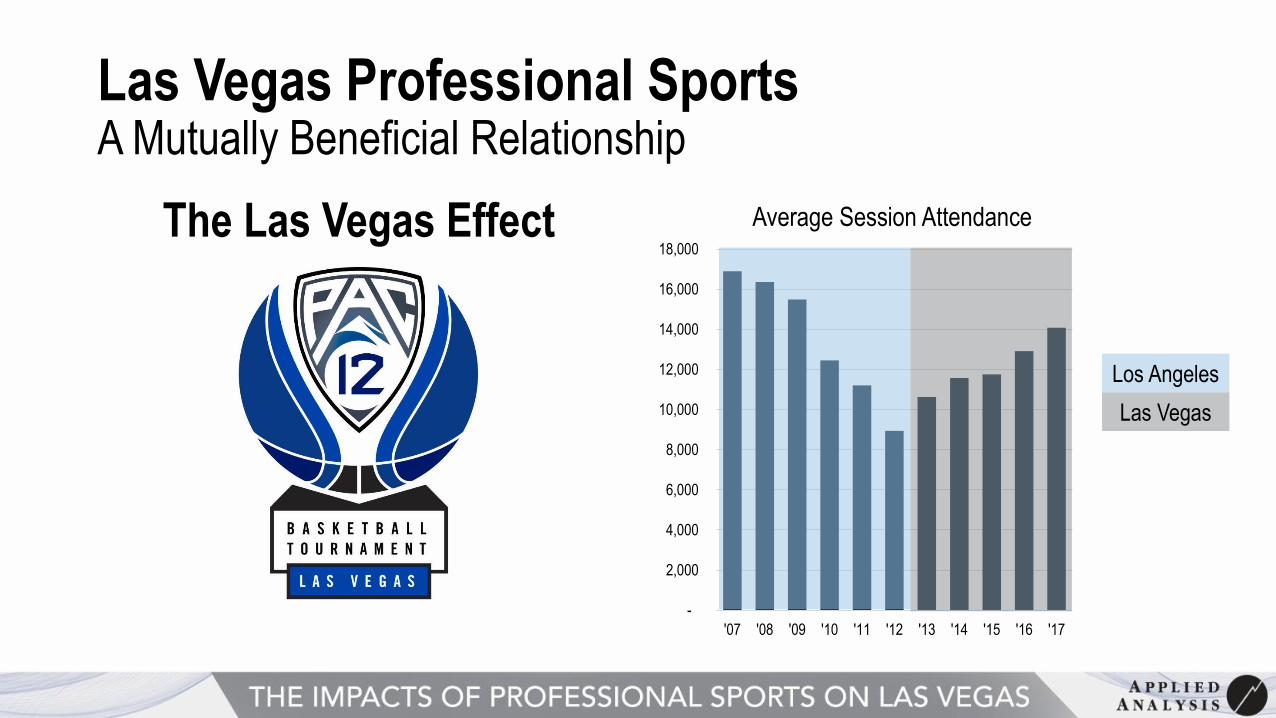
Las Vegas Professional SportsA Mutually Beneficial Relationship
The Las Vegas Effect
-
2,000
4,000
6,000
8,000
10,000
12,000
14,000
16,000
18,000
'07 '08 '09 '10 '11 '12 '13 '14 '15 '16 '17
Average Session Attendance
Los Angeles
Las Vegas
Leveraging the Las Vegas Tourism
Economy

Top U.S. Tourism Cities
Las Vegas
1STOvernight Tourism Visits
Rank Destination Overnight Visits
1 Las Vegas 41.1 M
2 New York 35.0 M
3 Orlando 31.5 M
4 Los Angeles 29.5 M
5 Chicago 27.0 M
6 Atlanta 25.9 M
7 Charlotte 24.5 M
8 Seattle 19.2 M
9 Detroit 18.0 M
10 San Francisco 18.0 M
Source: Destination Marketing Association International (2014), Las Vegas Convention and Visitors Authority

Las Vegas Room Inventory
Rank City Room Count
1 Las Vegas 149,200
2 Orlando 117,400
3 Chicago 111,500
4 New York 106,600
5 Los Angeles 98,100
6 Atlanta 94,600
7 Houston 78,200
8 Dallas 77,500
9 Phoenix 62,600
10 San Diego 60,500
Source: Las Vegas Convention and Visitors Authority
More hotel & motel rooms than
any other U.S. market
149,200
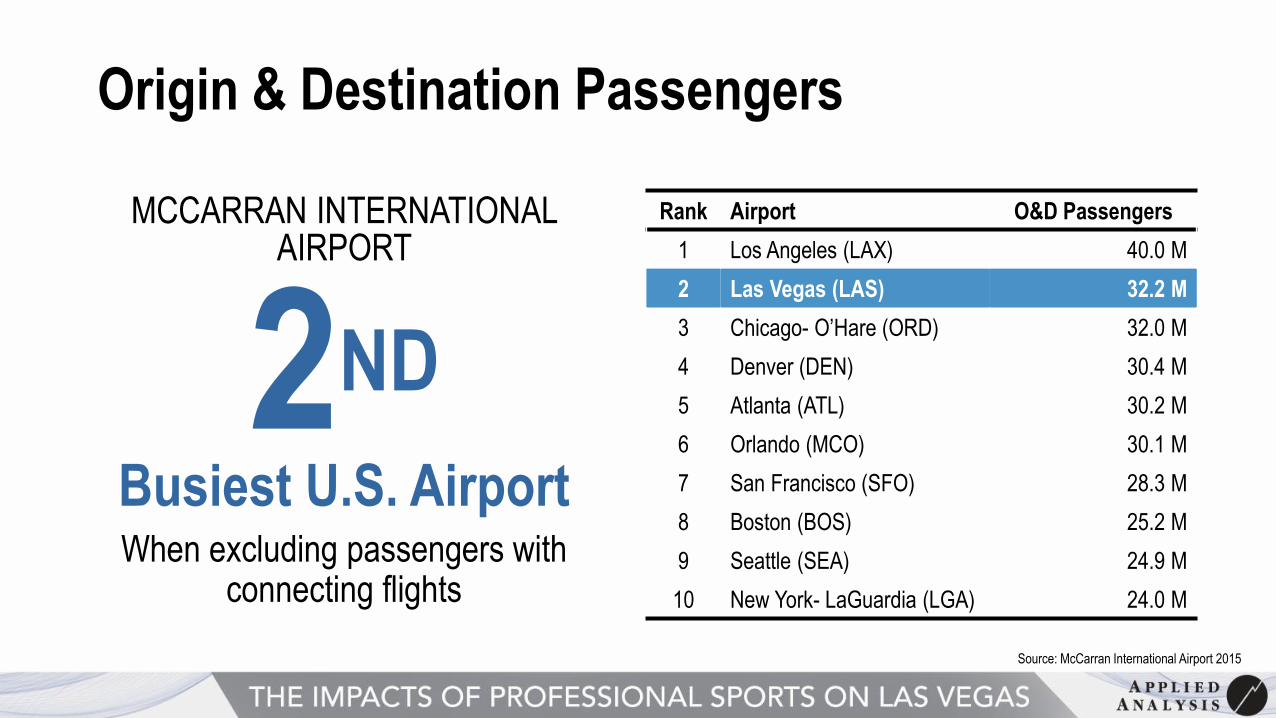
Origin & Destination Passengers
MCCARRAN INTERNATIONAL AIRPORT
2ND
Busiest U.S. AirportWhen excluding passengers with
connecting flights
Rank Airport O&D Passengers
1 Los Angeles (LAX) 40.0 M
2 Las Vegas (LAS) 32.2 M
3 Chicago- O’Hare (ORD) 32.0 M
4 Denver (DEN) 30.4 M
5 Atlanta (ATL) 30.2 M
6 Orlando (MCO) 30.1 M
7 San Francisco (SFO) 28.3 M
8 Boston (BOS) 25.2 M
9 Seattle (SEA) 24.9 M
10 New York- LaGuardia (LGA) 24.0 M
Source: McCarran International Airport 2015

Tourism and Special EventsLas Vegas
Over the past 5 years, an average of
7 percent of visitors have come to
Las Vegas specifically for special
events, such as a concert, sporting
event, or festival. That translates to
14.3 million visitors between 2012
and 2016.0
5
10
15
20
25
30
35
40
45
50
'90 '92 '94 '96 '98 '00 '02 '04 '06 '08 '10 '12 '14 '16
Mill
ions
Annual Las Vegas Visitors
Source: Las Vegas Convention and Visitors Authority, Applied Analysis
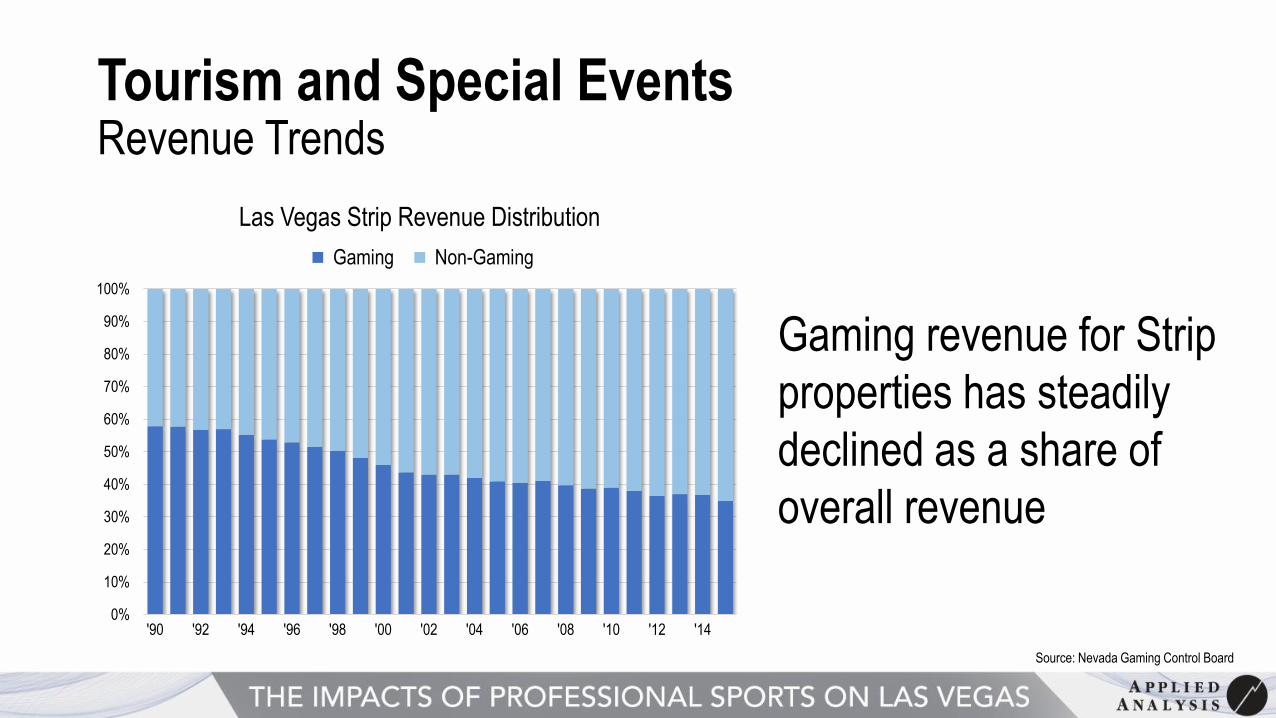
Tourism and Special EventsRevenue Trends
Gaming revenue for Strip
properties has steadily
declined as a share of
overall revenue
0%
10%
20%
30%
40%
50%
60%
70%
80%
90%
100%
'90 '92 '94 '96 '98 '00 '02 '04 '06 '08 '10 '12 '14
Las Vegas Strip Revenue Distribution
Gaming Non-Gaming
Source: Nevada Gaming Control Board

Tourism and Special EventsVisitor Spending
$1.5B
$2.9B
$3.4B
$3.9B
$4.1B
$5.2B
$6.7B
$7.6B
Sightseeing
Entertainment
Other
Food & Beverage
Local Transportation
Lodging
Shopping
Gaming
Visitor Spending – 2016
$2.9B
$0.0
$0.5
$1.0
$1.5
$2.0
$2.5
$3.0
$3.5
2010 2011 2012 2013 2014 2015 2016
Bill
ions
Visitor Entertainment Spending
Source: Las Vegas Convention and Visitors Authority, Applied Analysis

Economic ImpactsExisting Sporting Events

Sporting Events in Las Vegas

Economic Impacts of Sporting EventsNBA Summer League
Source: Las Vegas Convention and Visitors Authority
2015
22,025Out-of-Town Visitors
$18.2 millionDirect Visitor Spending

Economic Impacts of Sporting EventsLas Vegas Bowl
2015
29,025Out-of-Town Visitors
$12.4 millionDirect Visitor Spending
Source: Las Vegas Convention and Visitors Authority

Economic Impacts of Sporting EventsPac-12 Basketball Tournament
2016
10,400Out-of-Town Visitors
$11.7 millionDirect Visitor Spending
Source: Las Vegas Convention and Visitors Authority

Economic ImpactsNew Teams, New Venues

Economic ImpactsT-Mobile Arena
• Home of the Golden Knights and UFC
• Held 49 events in first year without an anchor tenant
• Expected to host 100-150 events per year at full exposure

Economic ImpactsT-Mobile Arena
1.2 Million+Estimated Total Annual
Attendance

Economic ImpactsT-Mobile Arena
313,000Annual Incremental
Visitors
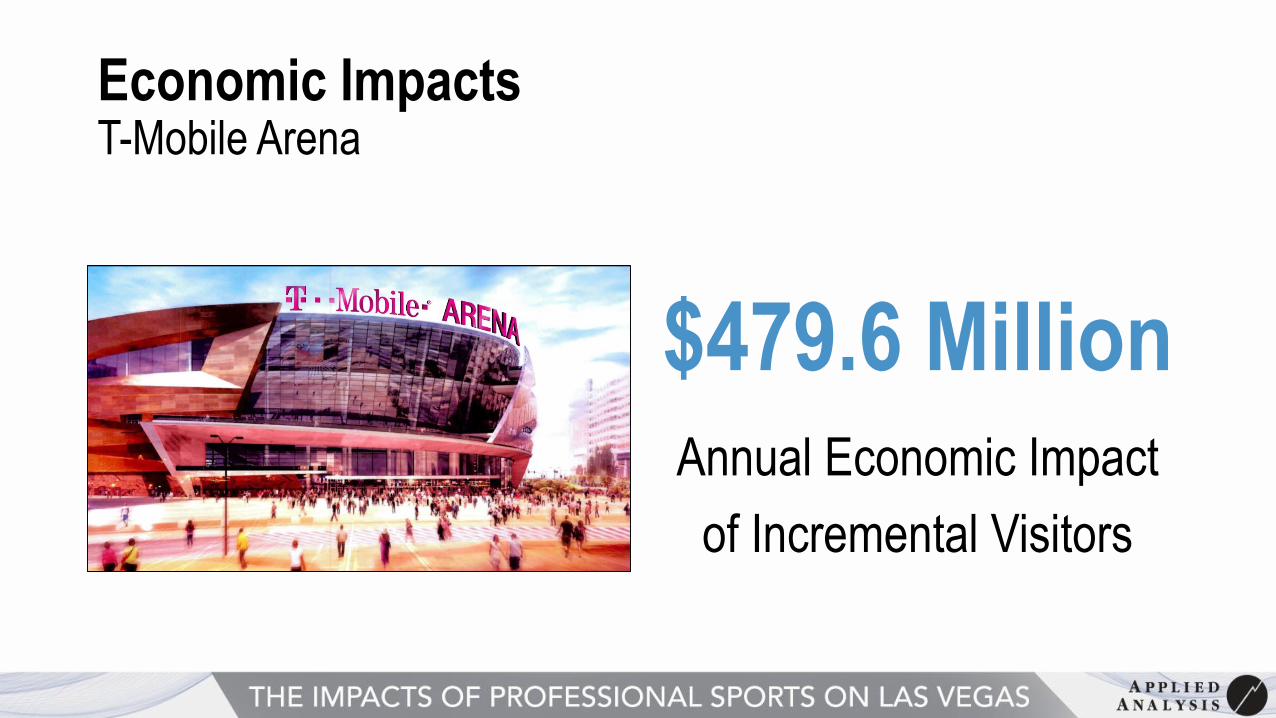
Economic ImpactsT-Mobile Arena
$479.6 MillionAnnual Economic Impact
of Incremental Visitors
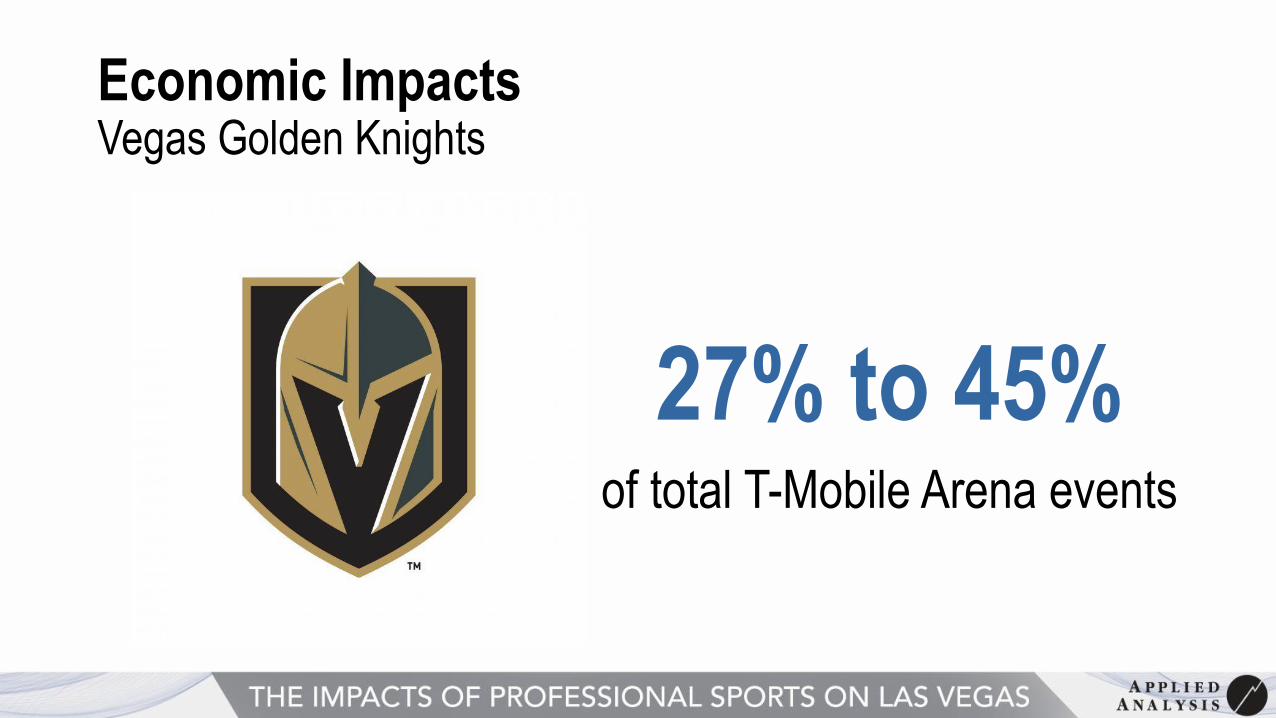
Economic ImpactsVegas Golden Knights
27% to 45% of total T-Mobile Arena events
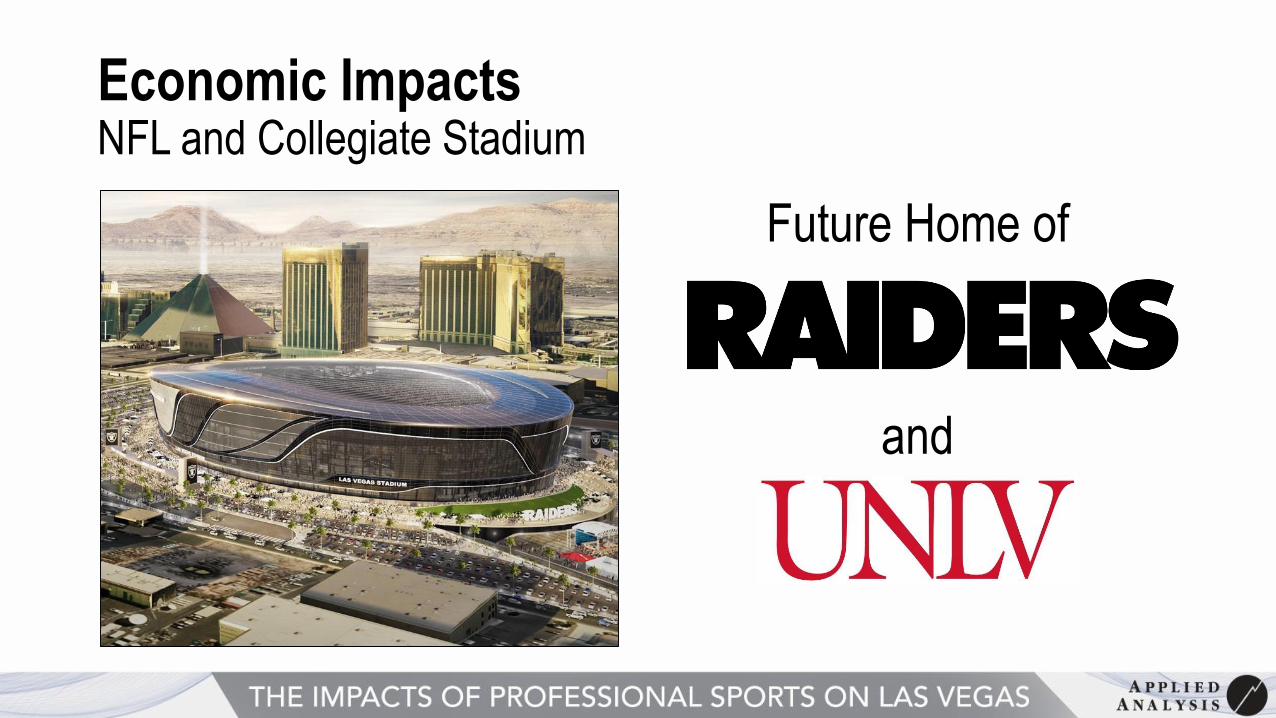
Economic ImpactsNFL and Collegiate Stadium
Future Home of
and

One-Time Construction ImpactsNFL and Collegiate Stadium
$2.79 BillionTotal Economic Impact
Source: Applied Analysis

One-Time Construction ImpactsNFL and Collegiate Stadium
10,800Direct Person-Years of Employment
Source: Applied Analysis
18,700Total Person-Years of Employment

One-Time Construction Impacts NFL and Collegiate Stadium
$968 MillionIn Wages
Source: Applied Analysis
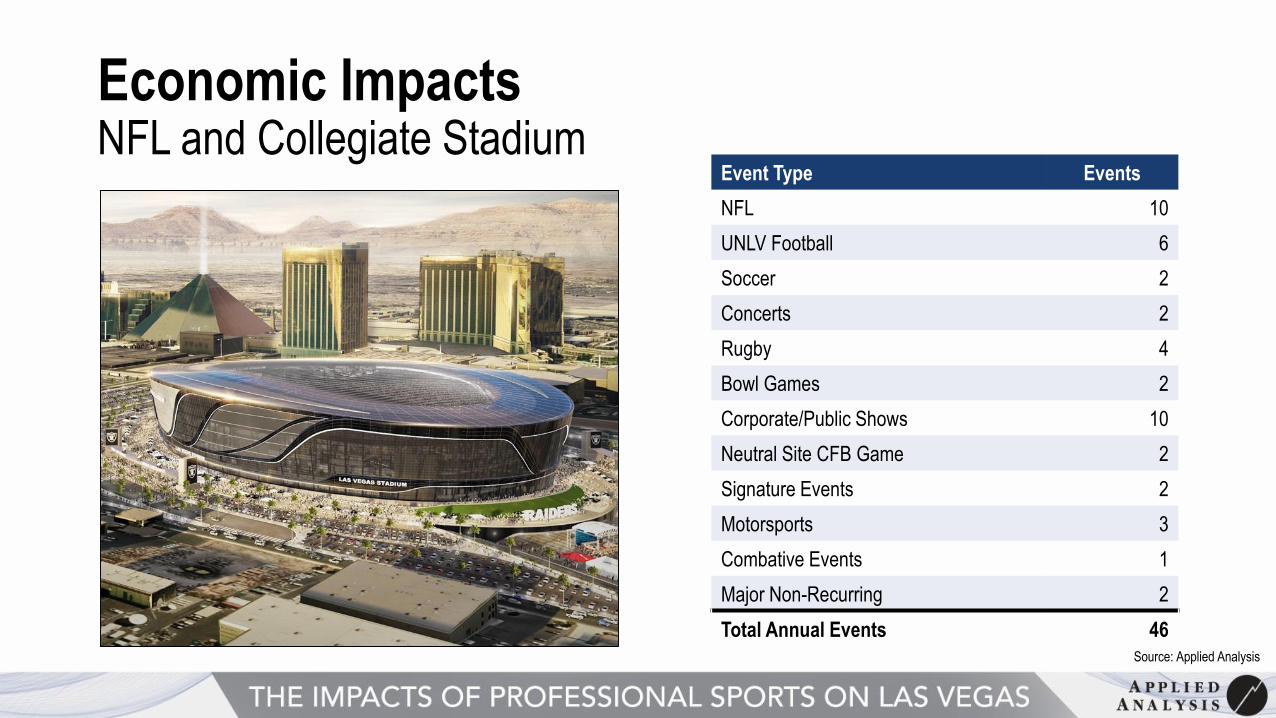
Economic ImpactsNFL and Collegiate Stadium
Source: Applied Analysis
Event Type Events
NFL 10
UNLV Football 6
Soccer 2
Concerts 2
Rugby 4
Bowl Games 2
Corporate/Public Shows 10
Neutral Site CFB Game 2
Signature Events 2
Motorsports 3
Combative Events 1
Major Non-Recurring 2
Total Annual Events 46

Recurring ImpactsNFL and Collegiate Stadium
1,970,000Total Attendance
Source: Applied Analysis

Recurring ImpactsNFL and Collegiate Stadium
818,00042% Visitor Attendance
Source: Applied Analysis

Recurring ImpactsNFL and Collegiate Stadium
450,00023% Incremental (Net
New) Visitor Attendance
Source: Applied Analysis
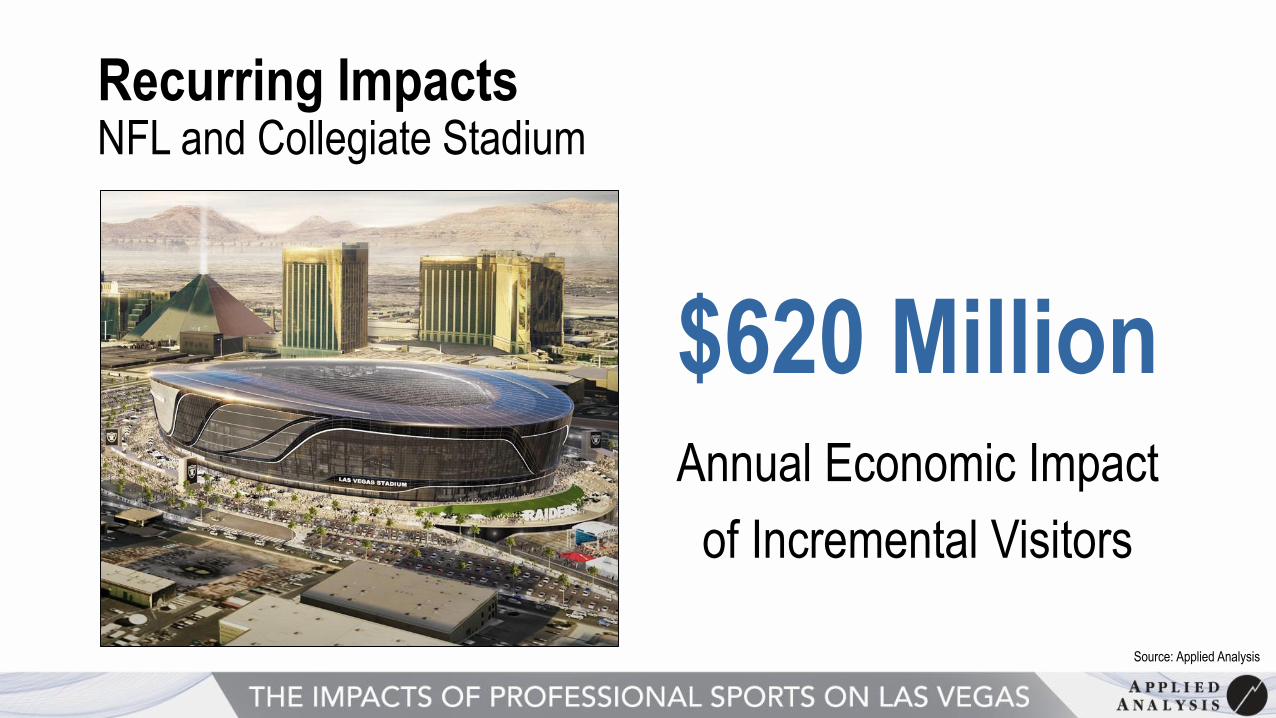
Recurring ImpactsNFL and Collegiate Stadium
$620 MillionAnnual Economic Impact
of Incremental Visitors
Source: Applied Analysis
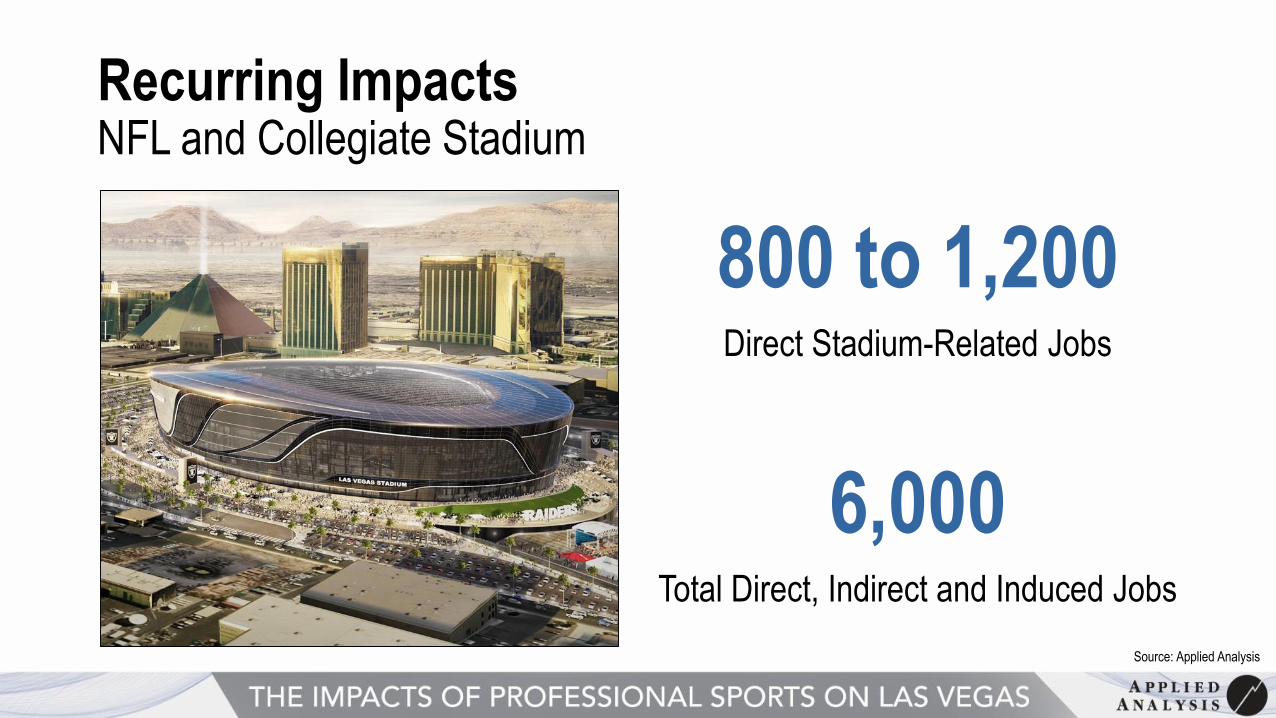
Recurring ImpactsNFL and Collegiate Stadium
800 to 1,200Direct Stadium-Related Jobs
Source: Applied Analysis
6,000Total Direct, Indirect and Induced Jobs

Recurring Impacts NFL and Collegiate Stadium
$231 MillionTotal Wages
Source: Applied Analysis

Recurring ImpactsLas Vegas Raiders
$235 MillionAnnual Economic Impact
of Incremental Visitors
Source: Applied Analysis

Source: NHL Player’s Association, Forbes, Spotrac.com/USA Today Sports Media Group
Team PayrollsNational Hockey League
Average Team Payroll
$72.6 MillionAverage Player Salary
$2.9 Million

Source: NHL Player’s Association, Forbes, Spotrac.com/USA Today Sports Media Group
Team PayrollsNational Football League
Average Team Payroll
$155.1 MillionAverage Player Salary
$2.1 Million

Super Bowl ImpactSuper Bowl LI
Houston, TX
138,000Total Super Bowl Visitors
$350 MillionTotal Economic Impact
Source: Super Bowl Host Committee, Rockport Analytics

Las Vegas Hosts
300,000Visitors During
Super Bowl Weekend Without
the Game in Town
Super Bowl ImpactLas Vegas

Preparing for Growth
Infrastructure Investments

Proposed Infrastructure ImprovementsStadium Site - Russell Road at Interstate 15
Attendees by Mode of Transportation
Auto 39,000
Transit/Shuttle 15,600
Walk/Bike 3,900
Other 6,500
Stadium Capacity 65,000
Total Vehicles on Game Day
16,061Source: Nevada Department of Transportation/CH2M Hill

Proposed Infrastructure ImprovementsHigh Impact Project Approval
Concept Plan
Public Facilities Needs Assessments/Specific Plan Review
Land Use Plan Amendment
Development Agreement
Land Use Approval
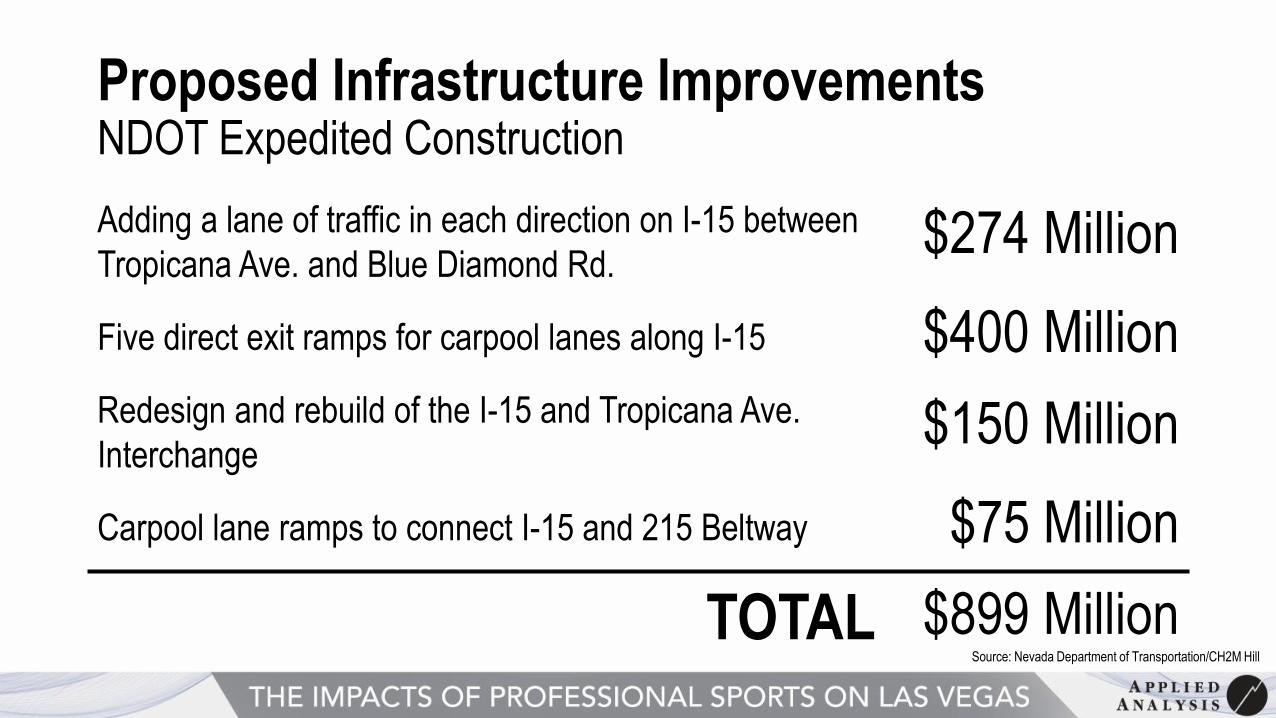
Proposed Infrastructure ImprovementsNDOT Expedited Construction
Adding a lane of traffic in each direction on I-15 between
Tropicana Ave. and Blue Diamond Rd.$274 Million
Five direct exit ramps for carpool lanes along I-15 $400 Million
Redesign and rebuild of the I-15 and Tropicana Ave.
Interchange$150 Million
Carpool lane ramps to connect I-15 and 215 Beltway $75 Million
TOTAL $899 MillionSource: Nevada Department of Transportation/CH2M Hill

Professional Sports in Las VegasBeyond the Game
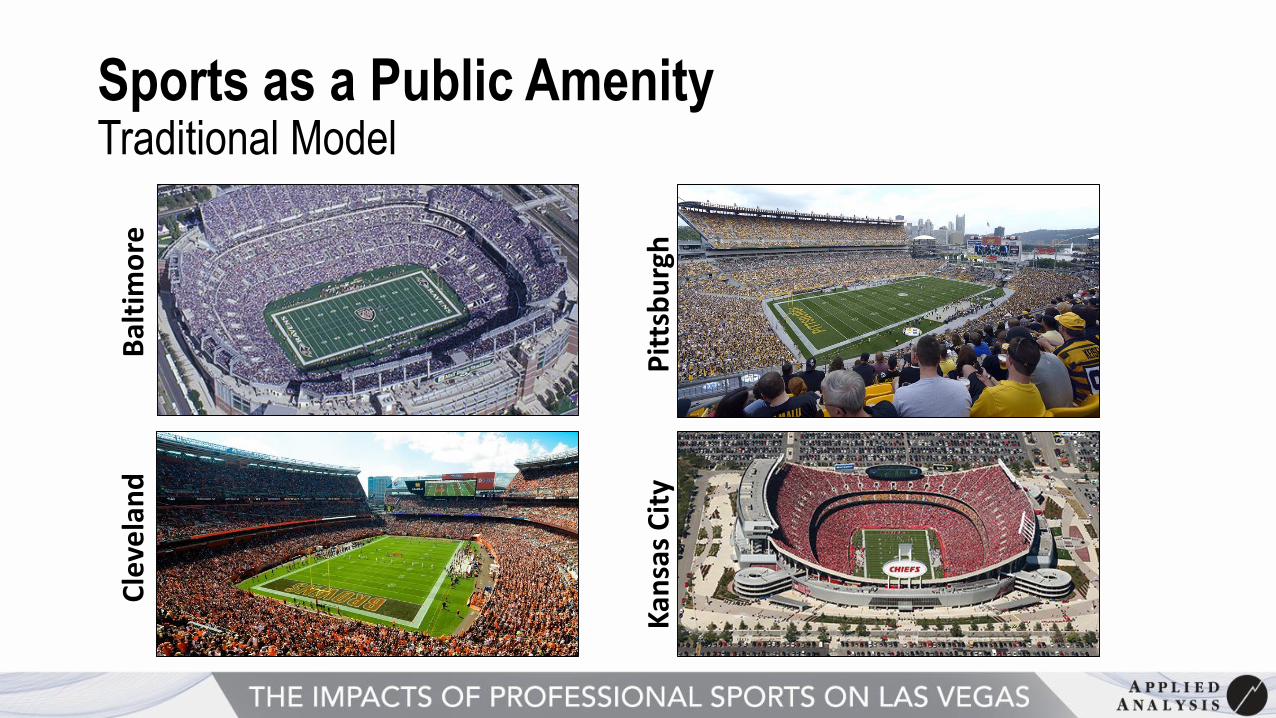
Sports as a Public AmenityTraditional Model
Pit
tsb
urg
h
Cle
vela
nd
Bal
tim
ore
Kan
sas
Cit
y

Sports as an IndustryNASCAR
• 700+ motorsports-related companies are located near NASCAR headquarters in Charlotte, NC
• Race teams, manufacturers, research and design
• $5 billion in regional economic impact
• North Carolina Motorsports and Automotive Research Center at University of North Carolina-Charlotte.

An Emerging IndustryThe UFC Model
•UFC’s presence in Las Vegas is more than the fight day experience
•Media Production
•Athlete Training
•Scientific Study

An Emerging IndustryThe Future of Las Vegas Sports
