professor jaikrishna and professor s.n. mitra …
TRANSCRIPT

PROFESSOR JAIKRISHNAAND
PROFESSOR S.N. MITRA MEMORIALAWARD LECTURES
INDIANNATIONALACADEMY
OFENGINEERING
April 2018

INDIAN NATIONAL ACADEMY OF ENGINEERING
GOVERNING COUNCIL
Office Bearers
President Vice-Presidents
Chief Editor of Publications Executive Director
Dr. B.N. Suresh Dr. Indranil Manna Dr. Pumendu Ghosh Dr. PradipDr. Pumendu Ghosh Brig RajanMinocha
The Indian National Academy of Engineering (INAE) is an autonomous institution partly supported by the Department of Science and Technology, Govt, of India and is recognized as a Scientific and Industrial Research Organization (SIRO) by the Department of Scientific and Industrial Research, Govt, of India.
Registered Office
Indian National Academy of Engineering Unit No. 604-609, SPAZE, I Tech Park, 6th Floor, Tower A, Sector 49, Sohna Road
Gurgaon - 122 002 (India)Phone: (91) - 0124 - 4239480 Fax: (91)-0124-4239481
Email: [email protected] Website: www.inae.in
© Copyright 2018. Indian National Academy of Engineering. All rights reserved
Published by the Indian National Academy of Engineering, New Delhi Printed at the Naman Stickers, 96-B, 4 D Campus, Murlipura, Jaipur

PROFESSOR JAIKRISHNAAND
PROFESSOR S.N. MITRA MEMORIAL AWARD LECTURES
INDIAN
NATIONAL
ACADEMY
OF
ENGINEERING
April 2018

Award Lecture Series ofIndian National Academy of Engineering
E D I T O R I A L
The Indian National Academy of Engineering (INAE) functions as an apex body that promotes
the practice of engineering and technology in solving problems of national importance. Its
activities include formulation of technology policies, promotion of quality engineering education,
and encouraging R&D activities.
With an objective to promote engineering excellence INAE has instituted Professor Jai Krishna
and Professor S N Mitra memorial awards. These awards are given to an eminent engineer,
engineer-scientist or a technologist for academic and scholarly achievements in any discipline of
technology/outstanding research in engineering and technology and application
thereof/outstanding contributions in the management o f education and research in
engineering/outstanding achievements and contributions in the Indian industry, engineering
services and engineering projects.
The present volume is a compilation of the award lectures of both Professor Jai Krishna and
Professor S N Mitra memorial awardees since its inception. The INAE sincerely appreciates the
efforts of the Awardees in bringing out this special volume of the INAE and hopes that the award
lectures will promote the general philosophy of INAE, particularly to the younger generation.
April, 2018Purnendu Ghosh
Chief Editor, Indian National Academy of Engineering

CONTENTSEDITORIAL
PURNENDU GHOSH
PROFESSOR JAI KRISHNA MEMORIAL AWARD LECTURES
1. Sustainable Mineral Development - The Indian Perspective A JOY K. GHOSE
2. Historical Glimpses of Engineering Education in Colonial India and in the Decades thereafterD.V. SINGH
3. Science and Tec Technology of Fast Breeder Reactor Programme in India : Challenges and AchievementsBALDEV RAJ
4. 21st Century Aerospace Technologies Transformation of Development Processes the Indian Defence Perspective V.K. SARASWAT
5. The Resurrection of a Steel Plant and the Renaissance of a Steel City SANAK MISHRA
6. Materials in Flight DIPANKAR BANERJEE
7. Geometry's Role in Discovery of Dynamics AMITABHA GHOSH
8. Creativity: Personal Experience M.L. MUNJAL
9. Unmanned Systems - Strategic Challenges AVINASH CHANDER
10. Development of Wide Ranging High Nitrogen Stainless Steels for Improved Characteristics and Resource ConservationL.K. SINGHAL
PROFESSOR S.N. MITRA MEMORIAL AWARD LECTURES1. Microsystems-on-Silicon: A Revolution on Grains of Sand
Indian Status and ProspectsA.B. BHATTACHARYYA
2. Edges in Speech: The Engineering Challenge in Processing Sounds of SilenceB. YEGNANARAYANA

3. Global Navigation Satellite Systems (GNS S)SURENDRAPAL
4. Over-View of Indian Power Systems, Challenges and Environment J. NANDA
5. India as a Global R&D Powerhouse ASHOK SOOTA
6. The Energy Scenario in India - The Present and the FutureS.P. SUKHATME
7. The Development of Passive Safety Systems for Advanced Heavy Water ReactorR.K. SINHA
8. Governance (Control) of Distributed Manufacturing and Service Networks N. VISWANADHAM
9. Understanding the Advances in High Performance Computing Through Computational ElectromagneticsN. BALAKRISHNAN
10. Role of Formal Modelling in Building Robust Software Systems R.K. SHYAMASUNDAR
11. 50 Years of Fuzzy Sets: Data to Knowledge SANKAR K. PAL
168
175
179
197
216
231
242
146
266

PROFESSOR JAIKRISHNA MEMORIALAWARD LECTURES

Award Lecture Series ofIndian National Academy of Engineering
Professor Jai Krishna Memorial Award Lecture 2004
Sustainable Mineral Development- The Indian Perspective
Ajoy K. Ghose Director : Indian School of Mines, Dhanbad
Introduction
To have been invited to deliver this lecture by the Academy is an honour that I deeply appreciate. I knew Prof. Jai Krishna for many years. Besides being an outstanding engineer, he was the very epitome of culture. I was somewhat tempted to speak on the culture of an “engineer”, but having been a miner all my life, I desisted from such a foray. I have chosen to discuss the importance of mineral resources in the Indian context and how best to assure the sustainability of the minerals industry for the greater good of the nation.
Mining and consumption of non renewable mineral resources date back to the Stone Age, and India has had a rich heritage of mineral exploitation from the days of the Harappan civilization. For millennia, the riches unearthed by the miners have made the lives of people better, easier and more secure, and without the availability of minerals, the materials civilization as we know it today will perhaps literally collapse. In fact, it is almost impossible to imagine life without minerals and metals as society needs them for ever-widening purposes. “Everything begins with mining” is the leitmotif of the American Mining Association, and this catch-all phrase underscores the vital role that mineral resources play in the well-being of any nation. Shorn of all its rhetoric, sustainable development has really become a key issue of our times, and meeting global minerals hunger deserves as the high a priority as meeting the global hunger(Ghose,2004). Sustainable development is an umbrella concept, and a hackneyed phrase as well in contemporary lexicon that sounds almost trite. With its
audacious goals, however, widely supported by public policy, its implications are vital for the health and well-being of the Indian mineral industry. We shall try here to explore the many dimensions of sustainable mineral development.
Indian Minerals Sector-The Heritage and Current StatusThe minerals sector in India has had a hoary tradition. The authors of the Rigveda, who wrote on fire, m etals and gem s, founded an autochthonous civilization in the plains of Punjab, Haryana and Rajasthan during the Pre-Harappan era. Copper ore was mined in the Pre-Harappan Ganeshwar-Jodhpura sector. The earlierst 14C data related to mining archaeology in India are those of Rajpura-Dariba mining area near Udaipur which has been dated at 1260+/-160 B .C, testifying to a flourishing lead-zinc mining activity in the distant past (Biswas. 1992). Kautilya's Arthasashtra (circa 330 B.C.) is possibly the world's oldest mining tome recounting the importance of revenue from the minerals sector to the State exchequer. The hierarchy of management of mines, the duties of the mine officials and the somewhat draconian punishments for theft of minerals have been described with rare insight in Arthashastra (Ghose,2002).
Mining in medieval India was perhaps neither moribund nor buoyant, as one can glean from the accounts of Tavemier, Alberuni, Buchanan- Hamilton and from such monumental work as A in-I-Akbari (Bagchi and G hose,1980). Tavemier, in his travelogue (1665-1669 A.D.), described the flurry of diamond mining activity on the banks of the Krishna river which had yielded

2
the famous diamonds Hope and Kohinoor. There was active mining for reef gold in South India, for copper ores in Khetri, Dariba and Singhania, and for lead, zinc and silver near Udaipur. While the history of coal mining cannot be traced with accuracy, the first organized efforts for coal mining were made by Sumner and Heatly in 1774 at Ethora, Damalia and Chinakuri.
India is well-endowed with mineral resources, and has high geological potential which is yet to be fully explored, assessed and exploited. India produces 87 minerals, out of which 4 are fuel minerals, 11 metallic, 50 non-metallic and 22 m inor m inerals. The aggregate m ineral production during 2003-2004 was valued at over Rs.625250 million. With a geologic and
A large number of industrial non-metallic minerals, especially limestone, fertilizer minerals like rock phosphate and gypsum, refractory and ceramic minerals, beach sand minerals, barite, magnesite, and graphite amongst others are available in India thus reinforcing its resource endowment. The rich quality of dimension stones accounted for export earnings to the tune of Rs.23,746 million during 2002-2003 for granite only. Despite excellent prospectivity, however, the nation has not struck it rich and discovered any major world-class deposits in the past three decades, barring the East Coast Bauxites and the Rampura-Agucha Lead-Zinc deposit. This underscores the urgent need to increase significantly the investment in exploration. Mineral reserves represent an almost stretchable continuum and investment in exploration in the
metallogenic history similar to mineral- rich Australia, South Africa, South America and Antartica, all of which formed the erstwhile Gondwanaland, there is a vast potential for finding “bonanza” type mineral deposits. With the new winds of change blowing across the minerals sector under the liberalised mineral policy, the nation is poised today for a new growth vector in the minerals sector.
India's major mineral resource endowment is sizeable (Table I). The life index in the table has been estimated on the basis of the current reserves and the current production level (R/P), and may not be an accurate estimator of the minerals availability as the reserves are not a fixed stock, and the future demand is equally uncertain.
post-Independence era has significantly added to the resource base. The continued use of India's mineral resource endowment has to proceed within a sustainable development framework.
Today India is a major mining nation with the value of production ranking sixth in the global league table. The minerals sector, unquestionably one of the fundamental strengths of the Indian economy, accounts for over 2% of the GDP of the nation for more than 19% of India's merchandise exports, and provides direct employment to over1,300,000 Indians. There is also a large informal sector of small-scale/artisanal mining. Its multiplier effects on the economy are substantial, and it is also the main source of income and social benefits for many in rural and remote parts of the country.
Table 1: Indian Recoverable reserves of Selected MineralsWorld Reserve Indian Reserve Life Index
World Reserve Indian Reserve Life Index
Bauxite 35 Bt 3.07 Bt 500 yearsChromite 7,6 Bt 86 Mt 30 yearsCoal 13,000 Bt 82 Bt 220 yearsCopper 650 Mt 9.4 Mt 20 yearsIron Ore 300 Bt 17 Bt 160 yearsManganese 5 Bt 167 Mt 100 years

3
Sustainable Development - A Concept of Many Hues
Sustainable development is a many-splendoured coinage, first articulated in the report on “Our Common Future” by Brundtland Commission (1987), as a strategy that meets the needs of the present without compromising the ability of future generations to achieve their own requirements. The key concept is to promote the conservation and the sustainable use of natural resources, which allows long-term economic growth and enhancement of productive capacity, along with being equitable and environmentally acceptable. Depending upon the vantage point from which one chooses to look at the many dimensions of sustainable development, there could be conflicting interpretations and a potpourri of view points. To many, sustainable mineral development is an oxymoronic term as mineral resources are necessarily finite and no process of mineral exploitation could be sustainable per se. The link between the long-term availability of mineral commodities and sustainable development is however tenuous, and the potential of future generations to enjoy a standard of living equal to that of the present generation depends on all the assets that we pass on. These include inter alia physical capital (infrastructure, produced goods and built environment), human capital (well-educated people), natural capital (clean environment, pristine wilderness and rich biodiversity), social capital (social relations and institutions within and between societies, their norms and functionality), a well -developed culture and of course, technology. In fact, a generation that fails to invest in new technology, that despoils the environment, and that perpetuates widespread poverty in order to husband its stock of mineral resources for future use is not likely to achieve sustainable development, and is even less likely to earn accolades from the future generations (Tilton, 2002). We need to invest the income from exploitation of a mineral deposit in other forms of capitals in such a way that the present value of future return on that capital equals the present value of the mineral deposit, that is, the natural resource capital should be replaced by an equal amount of other forms of capital.
The issues of sustainability need to be examined within the bounds of a time-frame, and also vis-a- vis the ability of the minerals sector to generate adequate re-investible surplus to build a sustainable economy for the future generations. Future, as is being repeatedly and forcefully touted by the advocates of singularity (Kurzweil Vinge, quoted in Ghose,1993), is necessarily uncertain, and as growth and technological change are likely to become hyperexponential in the not-too-distant future, our concern on resource exhaustion is probably irrelevant. The pace of mineral extraction is only a modest determinant of the sustainable development. Of far greater significance could be the mindless squandering by the current generation on weapons race and wars, corruption and sheer mismanagement of the resources!
In essence, sustainable mineral development calls for a proactive management strategy to evolve and put in place a credible framework that will in the long term (a) satisfy the mineral and material needs of the burgeoning population of India; (b) enhance environmental quality through espousal of cleaner technologies; (c) ensure social harmony through partnership with stakeholders; and (d) sustain and enhance the economic viability of the mining operations for a better future of the succeeding generations. In fact, susta inab le developm ent em braces the commitment to ecological integrity, but also incorporates social and economic dimensions of sustainability. All of these take crystallize into focused attention on management of resources and recourse to innovative technologies for exploitation and environmental protection. As of present, the per capita per year consumption level of mineral raw materials for an average Indian is of the order of 0.8 tonnes, compared to 23 tonnes for an American or 15 tonnes for a citizen of EU. This needs to be boosted to a level of 3-4 tonnes at least within the next two decades for assuring a decent quality of life. Will our mineral resource endowment allow for meeting the specified levels of demand? As an advocate of technological cornucopia, one can posit that given the inputs of new tech n o lo g y and a h igher q u a lity management, we will not run out of our mineral

4
resource base, at least not in the next 50 years, with with the impacts of efficient levels of conservation , recycling and secondary production and substitution. The population threat is a potent one to sustainable mineral development and to the sustainability of the society at large.
Sustainable Mineral Development ParadigmThe key elements for sustainable mineral development in India will hinge critically on the following:(i) Maintenance of ecological integrity- the
protection of the environment and biodiversity will be a major challenge. The disposal of wastes or “residuals” generated by the m inerals sector amounting to over 650 million tonnes annually (an order of magnitude estimate only) in an environmentally compatible manner is almost an insuperable task.
(ii) Inter-generational equity - not stealing from one's grand children through profligate use of mineral resources.
(iii) In te r-g en e ra tio n a l equ ity w hich recognises the close interaction of poverty and environmental degradation, and the right of the poor and the disadvantaged to seek a better quality of life.
(iv) Stakeholder engagement to ensure policy decisions that take account of community impacts and sentiment.
(v) Social capital development to promote the capacity of communities to direct their own development,
(vi) Transparency and accountability in decision-m aking , operations and reporting.
Although the environmental performance of the minerals sector has improved significantly in the recent past, much remains to be done. Equally important is the need to convert revenues realised by mineral exploitation to other forms of capital
such as social capacity building and infrastructure development, and advertisement advocacy of the contributions of the sector so that community perceptions do not come in the way of development or the licence to operate. The mining industry has to adopt the approval processes for new projects which are thorough, transparent and inclusive, and which incorporate risk assessment for all major aspects. It is important to stress that sustainable mineral development calls for strenuous efforts, investment in technology for exploration, mining, and rem ediation of “orphaned” mines. It will be a long and arduous journey rather than a destination, a quest for an elusive ever more sustainable and equitable development. The pervasive impacts of the NIMBY (Not in My Back Yard) and BANANA (Build Almost Nothing Anywhere Near Anyone) syndromes are thwarting mineral development in many regions o f the country, sometimes reinforced by the judicial activism. Only through constructive engagement with the community, can the mining industry earn its license to operate. The industry has to fight hard to stem the expanding wave of institutional incompetence and organized incapacity not only to improve its visible image but also to deliver re-investible surplus for capacity-building for the future generations.
Agenda for Action - Towards Sustainable Mineral DevelopmentThe sustainable minerals development for the future is for the nation to seize and shape, and the essential steps could be the following:
(I) Expanding the inventory of mineral resource through investment in high-tech exploration. The concept of “Glass Earth”, being actively researched by CSIRO, Australia, could be emulated to make the upper 1 km of the continental crust neartransparent to recognise ore bearing systems, and thus locate new deposits of value. This will call for investment in research too for integrating data sets from various detection techniques.
(ii) Seeking step change in production and

5
productivity improvement in the mineral extraction process through innovative mining for sustained competitive advantage for the minerals sector.
(iii) Developing innovative and efficient p rocessing techn iques to convert subeconomic resources to workable deposits.
(iv) Developing long-term business strategies which incorporate greater value-addition through mineral processing, resource stewardship and industrial ecology.
(v) Putting in place systems to embed sustainable development principles into strategic planning and operational practice, and also operate systems for monitoring, evaluation and reporting.
(vi) Addressing the issues of governance, ethical standards and accountability, and establishing viable long-term relationships with the stakeholders and listening to them.
The Indian mining industry has to respond to the challenges of sustainability using new and innovative technologies, and being willing and aware of its bounden responsibility to address the relevant issues through a new mindset and management philosophy. Institutional capacities will have to be developed for resolving the problems that continue to put road-blocks on the way to sustainable development.
Concluding RemarksMining is, was, and shall continue to be the keystone for the future of the Indian economy. The inexorable rise in minerals hunger through population pressure and aspirations for a higher quality of life must be met through imaginative
crafting of sustainable development principles and their smart application.
ReferenceBagchi, S., and Ghose, A.K.(1980): 'History of Mining in India-circa 1400-1800 and Technology S ta tu s ', Ind ian Jou rna l o f H isto ry o f Science, 15(1),pp.25-29.
Biswas, A.K.(1992): 'Minerals and Metals in Ancient India', Centenary Lecture, Bengal Engineering College.(Unpublished).
Ghose, A.K.,(2001): ' Sustainable Development of Indian Mineral Industry - Crafting a Strategy fo r th e F u t u r e ' in M in in g P o l ic y In itia tives(E d .D har and Gautam ), APH Publishing Corporation, New Delhi,pp.3-12.
Ghose, A.K.,(2002):' Kautilya, art and science of mining, and the future of global mining industry', Journal of Mines, Metals & Fuels,50(12),pp.448- 451.
Ghose, A.K.(2003): 'Envisioning the Future of M ining ', T rans.M in ing ,G eo log ical and Metallurgical Institute, Vol. 100, pp. 1 -5.
Ghose, A.K.(2004): 'Sustainable Mineral Development - Meeting Global Minerals Hunger in the New Millennium',Proceedings of the World Engineers' Convention 2004, Vol.F-A, China Science and Technology Press, Beijing,pp.8-11.
Tilton, John E.,(2002): On Borrowed Time? Assessing the Threat of Mineral Depletion, Resources for the Future,Washington,D.C. 158p.
World Commission on Environment and Development (1987): Our Common Future, Oxford University Press.

Award Lecture Series ofIndian National Academy of Engineering
Professor Jai Krishna Memorial Award Lecture 2007
Historical Glimpses of Engineering Education in Colonial India and in the Decades Thereafter
D.V. SinghFormer Vice Chancellor
University of Roorkee, Roorkee
IntroductionI am grateful to the Indian National Academy of Engineering and its President for giving me the Jai Krishna Memorial Award. I am greatly honoured. This honour is very special to me because from 1958 to 1990,1 had an opportunity and the privilege to be on the faculty of the University of Roorkee, where Prof. Jai Krishna was a towering leader in academics and research.
Jai Krishna studied engineering at the famous Thomason College of Civil Engineering where he passed with honours in 1935, winning the prestigious Thomason Prize and two Gold Medals. He joined Thomason College of Civil Engineering faculty in 1939. The College became University of Roorkee in 1948. Jai Krishna obtained his D octoral Degree in C ivil Engineering from University of London in 1954. He established teaching and research programme in Earthquake Engineering at the University of Roorkee. This is the only programme of its kind in India even today. He pioneered research and development in Earthquake Engineering in India and the instrumentation and monitoring of different seismic zones in the country. Jai Krishna served the University Roorkee with great distinction, became Professor in 1960 and was appointed the Vice Chancellor of the University in 1971. After his retirement, Jai Krishna was honoured with a life-time appointment as Professor Emeritus in the Department of Earth Quake Engineering, which he had established.
Jai Krishna played a leading role in formulation of Indian Standards for Earth Quake Resistant Design of Structures. This Standard is used extensively and is one of the most comprehensive
in the World. He was responsible for earthquake resistant designs of a large number of major and important engineering structures in India. His research contributions were outstanding and recognized by Shanti Swaroop Bhatnagar Prize (1966), Institution of Engineers (India) National Design Award (1971), International Award of Japan Society of Disaster Prevention (1988), Life Time Achievement Award (1997) of our Academy of which he was the F ounder President.
Jai Krishna established the Indian Society of Earthquake Technology in 1982 and served as its Founder President. Through his initiatives, India became a member country of the International Association of Earthquake Engineering of which he was elected as the President for the Term 1977- 80. He was a Fellow of the Indian National Science Academy, Third World Academy of Sciences, and the International Association of Earthquake Engineering.
Jai Krishna was a product of the technical education system established by the British Government and after independence, he obtained his doctorate degree from a leading University in England. He devoted his entire life to engineering education and research in India. I, therefore, felt that if I present historical glimpses of engineering education in the colonial India and a short profile of how it shaped during the decades after independence, it will be an appropriate tribute to the memory of a great academician and the Founder President of our Academy. I must begin with the evolution of University education to dispel the notion that the concept of Universities was unknown in India until the British established them in Calcutta, Madras and Bombay.

7
Evolution of University EducationIn Europe, 'Studium Generale', indicating what we today understand as University, had many teachers and students drawn from many places, and also had many subjects of instruction and discussions. The oldest Studium Generale in Europe dating from the beginning of the 12th Century, were Bologna, Reggia, Montpellier, Paris and Oxford. In India the Budhist developed similar Studium Generale or University institutions several hundred years before they appeared in Europe. The Budhist Viharas developed into big institutions teaching liberal subjects, grammar, philosophy, medicine, arts and sciences. These monastic institutions, with their complex structure and management, had workshops and schools of arts and crafts and developed as Universities, among them were Nalanda, Vallabhi, Vikramshila, Odantapuri, Jagaddala, Mithila, Ranchi, etc. However, these Universities disappeared with the decline of Budhism in India.
Vocational Education in Medieval IndiaDetails of vocational and technical education in medieval India are not available. The excellence of manufactured articles, fabrics of cotton and silk, embroideries, painted and enameled wares, steel weapons, gold and silver ornaments and white paper, is well known, and could not have been achieved and maintained for centuries without a dependable technical education. Three systems of technical education were prevalent, the hereditary learning, pupilage training and training schools attached to workshops. The manufacturing establishments (Karkhanas) gradually started imparting technical education in their areas of specialization. The Shurat-Am of Muslim rulers looked after and assisted the workshops engaged in industrial training activities. The early Muslim rulers supported such Karkhanas and their technical/vocational education. Both Hindus and Muslims took great interest in vocational education as a result of which trained workers of every trade were available in abundance.
Technical Education in British India: The BeginningIn 1794, to train technical persons in India, the
British Government established the first Survey School in Madras with eight students from English schools. The Madras Survey School trained only English boys. The British policy at that time was against teaching surveying to native Indians because of military and political implications of survey work and as a precaution against reliable maps falling into the hands of the French, the Dutch and the Portuguese. The Court of Directors of the East India Company insisted on the secrecy of survey maps and restricted the 'art and science ofsurveying’ to English boys. The Madras Survey School went through several ups and downs, was on the brink of closure in 1810 but was revived in 1819, admitting some apprentices directly called from England in addition to boys from the local English schools. The Survey School was expanded in 1857 and renamed as the Civil Engineering School.
Developments in Bengal
Civil surveying for revenue purposes remained outside the ambit of the restrictions of the East India Company because it was an ancient branch of knowledge in India and a class of people, the Amins, specialized in preparing land revenue maps. The General Committee of Public Instruction comprising mostly of English officers, constituted in 1823 in Bengal was, for about twenty years, the only Government agency of Bengal Government concerned with education matters. In 1842, the Committee was replaced by a Council of Education. The Committee and its successor Council in their reports frequently mentioned the branches of study which would be ’useful to students to earn their livelihood'. Apart from 'reading writing and arithmetic’, surveying was strongly recommended for Indians required injudicial and revenue departments and by courts. At that time surveying was taught in Bengal in two colleges, the Mohammedan College (established in 1781) and the Hindu College (1817). The public opinion in Bengal was that drawing and surveying be taught only in colleges and not in schools. From the need to teach these subjects in colleges, the concept of colleges of civil engineering was a big step. Engineering was not classified into several subdivisions and it

8
meant engineering for civil purposes as distinct from m ilitary. The im portance o f civil engineering, as a branch of instruction for Indians, began to attract attention of authorities in about 1843. Construction of roads and canals was in progress and it was realized that men trained in engineering would be required; surveying skills would not be enough. At this time, the idea for having a University was gaining ground. The Council of Education in its report in 1844-45, suggested the establishment of a central university for 'granting degrees in arts, science, law, medicine and civil engineering'. However, the Bengal Government took no action until after ten years.
Developments in Bombay and N WPElphinstone Institution in Bombay started engineering classes in 1844 to train surveyors and builders. In 1847, after producing six surveyors/ builders and four assistant surveyors/ builders in three years, the programme was closed because the British view was that it did not attract students of sufficient merit to qualify as 'scientific civil engineersfully groomed in the theory oftheir art'. After the conquest of the northern region by the British, the North Western Province (NWP) was created in 1836 with Agra as its headquarters. In 1843 the subject of education in NWP was transferred from the Bengal Government to the Government in Agra. The renovation work on old Yamuna Canals and construction of some roads were in progress. Thinking had started on a new bold venture - the Ganga Canal. At this time the appointment of Thomason as the Lieutenant Governor of NWP proved vital. While the Governors of Presidencies, appointed from British aristocracy and political heavy weights, responded slowly through proper channels to the proposals coming from lower levels, Thomason, rising from the ranks of civil servants, made the proposal himself, followed them up for accep tance by h igher a u th o ritie s and implemented them vigorously. Thomason, in his memorandum dated September 23 1847, submitted a detailed proposal for setting up a college to train Indians as Civil Engineers. Probey Cautley, an army engineer whose name is closely associated with the construction of Ganga canal,
with a limited view, had envisaged a school for the supply of 'efficient workmen for the entire line o f canal'. Thomason went further in his proposal emphasizing the requirements of surveying, irrigation, navigation, roads, bridges and railways in the country, for all of which it was impossible to provide Europeans. He made a strong case to form a nucleus at Roorkee for training Civil Engineers.
The proposal of Thomason was accepted by the Governor General Hardinge and the Government of NWP, by a notification dated 25 November 1847, established the Civil Engineering College at Roorkee. The College started functioning on January 1,1848, with Lieutenant Maclagan as the Principal and four teachers, two of whom were Indians. The College began with three courses, one for engineers, one for upper subordinates (overseers) and the third for lower subordinates (sub-overseers and draughtsman). In 1852, Thomason compiled several of his previous recommendations in one document, strongly recommending to the Government to raise 'Roorkee College into a great school for every branch o f e n g i n e e r i n g l abour ' . The recommendations were only partly accepted and even they were not all implemented. Yet with limited development, the Roorkee College became a model and catalyst for the other engineering colleges in India. Within a few years engineering colleges of Calcutta, Madras and Poona followed. Thomason died untimely in 1853. The Roorkee College was named Thomason College of Civil Engineering in 1854 in honour of its founder. The engineering class was open to European military officers and English, Anglo-Indians and Indian Civilians. During the first twenty years, only a few Indians were admitted. But after 1870 the number of Indians increased and that of Europeans declined.
The concept of the engineering education through formal instructions in a school or college was unknown at that time even in England. Therefore, the subjects of engineering, when Roorkee College was established, were not properly classified from the point of view of teaching. The teachers of Roorkee College, within the first twenty five years of its existence, did pioneering

9
work in systemizing the teaching of engineering, formally writing lecture notes, developing examples, making drawings, writing books and manuals and updating them periodically. The Roorkee College Manuals and Treatise on Civil Engineering became standard texts not only in Roorkee but at other colleges in India. The distinctiveness in engineering teaching in India owes a great deal to this pioneering work done at Roorkee.
Except for starting one industrial school in 1892, the NWP government concentrated all its efforts to reorganize Roorkee College. From the beg inn ing the C o llege was under the administrative control of PWD, which was largely manned by royal and other military engineers. After a rather stagnant period during the decade of 1890, programmes expanded to include mechanical and electrical engineers at one end to motor drivers and linemen on the other. Machinery and tools were indented from England and a modern workshop was established, including forge and foundry shops run entirely on electricity. Several new courses were added, including a course in telegraphy in 1893. The mechanical apprentice and the industrial apprentice courses of three years were opened in 1896 to train foremen. The industrial apprentice course covered various trades, printing, photography, metal and woodwork, electric motors and mechanical engines. In 1897, the two year engineering course was extended to three years with two branches, civil and electrical; telegraphy was m erged w ith e lectrica l engineering. During the early decades of the 20th Century, the profile of the college changed from degree-level education to an industrial apprentice level institute. Even an automobile drivers' class was started in 1907.
Wood's DispatchThe issue of suitably trained persons for PWD in all the three Presidencies was being raised. The famous Wood's Dispatch of July 19, 1854 from the Court of Directors of the East India Company envisaged an enlarged system of education to be pursued in India. In response, the Governor General Lord Dalhousie recommended to the
Court for establishment of an engineering class at each of the three presidencies of Calcutta, Madras and Bombay. Unlike that in NWP the progress in the Presidencies was slow but things started moving.
By 1842 it was recognized in Madras that the survey school was inadequate for the needs of PWD and establishment of an engineering college was desirable. The initial reaction of the Court of Directors to the proposal was negative on the ground that the general education in the Presidency had not advanced enough to justify such a venture. It took the Court five years to agree with the Supreme Government on the need to upgrade the Survey School. The matter was referred to the Director of Public Instruction (D P I) M adras who recom m ended the establishment of a college 'on the pattern o f Roorkee College'.
Conflicts in MadrasA conflict of interest however delayed the opening of Engineering College in Madras. Major Maitland, who had opened a school in the Gun Carriage Factory Madras in 1840 for ordnance officers and apprentices, wrote to the Council of Education that 'Ordnance artificers and the pupil o f the Manufactory' be induced to study and improve themselves to become 'Mechanics and artisans o f a superior order and out o f their number might be found intelligent foremen and overseers fo r the Ordnance Branch o f the Services'. Maitland maintained that to produce capable engineers, every student admitted to an engineering college must have learnt at least one trade. Maitland must have had enough influence to stall the establishment of the engineering college until his ideas and his school became essential component of it. Finally in 1854, Lord Dalhousie proposed that 'whether by the extension o f Maitland's school or by its incorporation with a large institution upon the principle o f Thomason College at Roorkee, a complete system o f instruction should be provided at Madras for every class belonging to PWD- Europeans, East- Indians or natives whether artificers, foremen, overseers, surveyors or civil engineers'. The Court of Directors conveyed their concurrence in

10
1855 and the Director of Public Instructions (DPI) was asked to submit a detailed proposal.
DPI Arbuthnot did not accept the wisdom of Gun Carriage Factory School as a basis for the proposed institution, and suggested a scheme of an institution at three levels just as at Roorkee College, with provision of military students along with civilians and kept Maitland and his school out of the proposal. The Madras Government, to please both the parties, accepted the DPI's scheme with the provision that every student of the college be required to master some craft or trade and the school at the Gun Carriage Factory be extended to supply the PWD with artificers. The Supreme Government in 1856 accepted the proposal of Madras Government but insisted that for the purpose of practical training, the Maitland School be amalgamated with the proposed college. Major Maitland interpreted this order to mean that he was given the authority to direct the establishment of the college. After a voluminous correspondence between the DPI, the Chief Engineer PWD and Major Maitland, the dispute, taking more than two years, resolved. Finally, the Supreme Government withdrew the order for the amalgamation, but ordered that Major Maitland be appointed Director of Practical Instruction, and the college of practical training should use his workshop.
In 1857, pending settlement of the dispute, the Madras Government ordered the expansion of the Survey School, changed its name to Civil Engineering School and appointed Lt. Winscom as the Principal. After some more hiccups, the Civil Engineering College came into being in Madras in 1859. It functioned on a very modest scale because Madras Government gave no grants in addition to what was given to the Survey School. The College was affiliated to the University of Madras and the first batch received the Bachelor of Civil Engineering (BCE) in 1864. The Madras University added mechanical engineering course in 1894 and the name of the degree was changed from BCE to BE (Bachelor of Engineering). The Madras College was the first to offer a degree programme in mechanical engineering. In 1920, the college moved to Guindy.
Tribulations in BengalIn 1854, the Council of Education Bengal recommended the establishment of a separate engineering department in the proposed Presidency College, which was to function in the following year by incorporating the Hindu College. The Chief Engineer of Bengal, Col. Goodwyn, on the other hand, recommended the constitution of a separate engineering college for general improvement of Department of Public Works. The Bengal Government concurred with the Chief Engineer, but took two years to prepare its detailed scheme to obtain the sanction of the Court of Directors. In November 1856, the Civil Engineering College Calcutta started functioning in a portion of the Writers Building with 10 students and two teachers, Capt. Sherwill of the Engineers as Professor of Surveying and Shome as Professor o f M athem atics, since no Englishman was available with suitable qualification. The Government gave a guarantee of employment in PWD to the students after passing the two-year course. The College was affiliated to the Calcutta University in 1857,, and the course duration was raised to three years including one year training, afterat the end of which the candidates got the degree of Licentiate in Civil Engineering (LCE). The question of merger of engineering college with Presidency College remained alive, and in 1862 when the Government of India invited the view of the Bengal Government on the issue, the latter supported the merger. In 1865 the Engineering College was closed and instead a department of Civil Engineering at the Presidency College was opened. This step impeded the progress of engineering education in Bengal for the next about fifteen years.
After a gloomy existence, the prospects brightened up in 1878 when a practical training institute around a newly established PWD Workshop came under consideration, and it was decided that the civil and mechanical engineering students should receive theoretical training in a college and practical training in a workshop. In April 1880 the engineering department in the Presidency College was again given a separate identity as a college, and was moved to Sibpur. It

11
was given the name, Government Engineering College Howrah. Later in May 1887 it got another name Civil Engineering College, Sibpur. In 1920 it was named as Bengal Engineering College, Sibpur and remained so until after independence.
The Poona CollegeOn the basis of the project submitted by the Bombay Government, the Supreme Government in 1855 approved the establishment of a college for the instruction of civil engineers, surveyors, overseers, foremen and artisans. Not much happened on the project except starting an Engineering Class and a Mechanical School at Poona. Later, the matter was taken up by the DPI Howard, who said that the school was 'too narrow and governmental' and that it 'trained officers for government service but did nothing for the public'. Howard's idea got an impetus through the munificence of Sir Cowasjee Jehangir, who made a magnificent donation of Rs. 50,000/-. Consequently the School was converted into Poona Civil Engineering College in 1864 and affiliated to the University of Bombay in 1868 for the degree of Licentiate in Civil Engineering.
The scope of instruction of college was expanded in 1879 to include forestry and agriculture by starting a class for forest rangers and a diploma course in agriculture. The name of the College of Engineering was changed to the College of Science. General courses in science were started leading to B.Sc. degree of the Bombay University. The most distinguished and famous alumnus of the College, Sir Mokshagundam Visvesvaraya, topped the list of L.C.E's in 1884. In 1886, the course of civil engineering was revised and upgraded, and the minimum qualification for admission was raised from matriculation to what was then called Previous Examination. The trend towards opening new courses was reversed. The Rangers Class was closed in 1904. By 1911 all other non-engineering courses were also abolished. The B.Sc. classes were transferred to the Science Institute in Bombay and the College was given back its original name, the Poona College of Engineering.
Hegemony of Army over the Engineering Colleges
The Royal Engineers in the army in British India played a major role influencing the fortunes and also the misfortunes of the four engineering colleges. They were the only type of engineers that came to India with the East India Company. As the Com pany took more and more responsibility of governance of the country, all technical jobs of engineering and scientific nature were entrusted to these military engineers. The PWD was almost entirely officered by them. Engineering education fell naturally in their sphere. The original proposals for each of the four engineering colleges stipulated that the colleges be placed under the education departments of the respective Presidency or Province. This was done to fulfill the civilian objectives of the colleges to train engineering personnel for civilian work. But many of the Principals, Professors and Instructors appointed to organize and run these colleges were, in the prevailing circumstances, military engineers. These military officers with natural proclivities towards the army, tended to forge close links between the college and the military. The army became, at least partly, the feeder for admission in the college and it served the needs of the army by running tailor made special courses for officers and other ranks of the engineering corps.
From the beginning, the Roorkee College was placed under PWD and not under the education department as envisaged originally. The Government of India recognized that the Thomason College had special obligations towards the army and that a certain proportion of seats in the engineering and the upper subordinate classes should be reserved for young men from the army who wanted to change over to services in public works. Also, under the orders of the Military Department of the Government of India, special courses were regularly run for army personnel till the end of the 19th Century. All the Principals, except one, were military officers until 1930.
The other three colleges were gradually placed under the control of the department of education.

12
However, in matters of admission and special courses, Madras College had similarity with Roorkee College. Its last Royal Engineer Principal retired in 1907. The Calcutta College too showed military bias but its life was short. The engineering classes of the Presidency College and later Sibpur College had no military connection. The first Principal of the Poona College Capt. JBH Close, was very keen to make the College serve military needs by providing instruction to European sappers posted in Bombay Presidency. The Education Department did not allow too much importance to training military officers at Poona. Only the first two Principals were from the military. Subsequently, the m ilitary connection ceased.
Stanley EngineersBy 1858, it was clear that the ambitious obj ectives of the Roorkee College envisaged by its founder did not quite fit in with the imperial interests perceived by Her Majesty's Government in England, which had taken the responsibility of directly governing India after the 1857 war of independence. A scheme of directly recruiting young Civil Engineers in England for service in the public works in India was initiated in 1859 by the Secretary of State Lord Stanley. Engineers recruited under the scheme were dubbed as Stanley Engineers. From 1859 to 1868, 165 'Stanley Engineers' were appointed in PWD against only 45 from Roorkee College.
While the military engineers nurtured all the four engineering colleges in their infancy, within a few years they also initiated policies which adversely affected the growth of the colleges. In 1870, as a modification of the Stanley Scheme, a college of civil engineering, the Royal Indian Engineering College, popularly called Cooper's Hill College, was established in England on the pattern of Roorkee College, to train engineers for PWD in India. The entire expenditure of the Cooper's Hill College was borne by the Government of India, and its purpose overlapped with that of the engineering colleges in India. Persons recruited and trained in England thus filled the bulk of the posts in India. The products of the engineering colleges in India were deprived o f job
opportunities, with the result that many went unemployed or were under-employed. The persons behind the Stanley Scheme and the Cooper's Hill College were some military engineers who were intimately associated with the establishment and running of the four colleges in India.
The Game of NumbersThe Cooper's Hill College was designed for an intake of 50 students. However, employment in PWD in India was restricted to 40. Nevertheless, with effect from 1876, the share of Roorkee was fixed at 8 and from 1885 onwards it was reduced gradually to 5 and then to 4. The remaining engineers passing from Roorkee were adrift and there were cases when they had to accept jobs of draftsmen, accountants or school masters. In late 1870's the demand for engineers in PWD started diminishing because of the general reduction in government expenditure. In 1878, Principal Bandreth of the Roorkee College proposed that appointments in other Government departments similar to PWD, be opened for employment to Roorkee engineers, but the Government of India did not respond favourably. In 1880, the Secretary of State passed an order denying jobs to Englishmen trained and educated in India. However, this order was practically rescinded in 1883. The annual appointments for each class were: Cooper's Hill 15, Indian Colleges 9 and Royal Engineers 6. Out of the appointments from the Indian Colleges, 5 and 4 were given to Roorkee and 1 and 2 were given to Sibpur in alternate years; 2 to Poona and 1 to Madras every year. Due to continued fall in the demand for engineers in PWD, the the recruitment in PWD from Cooper's Hill was reduced from 15 to 10 in 1892, and thereafter to less than 7. The Cooper's Hill College limped on for another 17 years, and was finally closed in 1907. The stores and machinery were shipped from the Cooper's Hill to India and distributed free among the engineering colleges.
Establishment of UniversitiesFollowing the 1854 Dispatch of the Court of Directors of the East India Company sent to the Governor General of India in the Council, the

13
Universities of Calcutta, Madras and Bombay were founded in the three Presidencies in 1857. At that time, they were purely examining bodies concerned mainly with instituting degrees and framing rules and regulations for examinations leading to degrees. Their scope covered 'all branches o f learning involving intellectual efforts worthy o f recognition by a University'. They established faculties and instituted degrees in traditional areas like arts, science, law, etc., and also in medicine and engineering. It was left to the colleges to enroll students, organize teaching and seek affiliation with the university degrees. For engineering, Calcutta and Bombay Universities aimed higher and instituted Master of Civil Engineering (M.C.E.) degree for which a B.A. degree was the prerequisite. The Madras University more realistically instituted, in addition to M.C.E., a lower degree called Graduate in Civil Engineering (G.C.E.) for which the prerequisite qualification was matriculation. The three engineering colleges at Calcutta, Madras and Poona were duly affiliated to the Universities of their Presidencies.
The ground reality of the needs of engineering education and the unchartered waters of academic aspects through which the colleges were required to steer, did not match the expectations of the Universities. The colleges continued to produce
engineering personnel at two levels, officers and subordinates, with great efficiency. If the universities did not consider the engineer officer worthy of university degrees, the college certificates were valuable enough. There were no takers for the M.C.E. degree. Therefore, the Calcutta and the Bombay Universalities, like the Madras University, instituted a lower degree of L.C.E. From 1864, the graduates of the engineering colleges at Calcutta Poona and Madras received university degrees, L.C.E. andB.C.E.
The University of Allahabad was established in 1887 and the Punjab University in 1892. The Roorkee College was affiliated initially to the Calcutta University in 1864 and to Allahabad University in 1894. These affiliations appear to have remained only notional as there is no record of Roorkee students going for university examination. The affiliation with the Allahabad University ended in 1905.
Status of Technical Education in India (1884-85)Sir MacDonnell's Memorandum prepared in 1886 on the existing state, and the future prospects of technical education had nothing much to notice except the four engineering colleges, three schools of industrial art and about forty five lower grade industrial schools. The following enrollment status during 1884-85 was reported:
Name of College University School TotalLevel Level
Civil Engineering College, Madras 19 106 125College of Science, Poona 102 77 179Government Engineering College, Howrah 42 107 149Thomason College of Civil Engineering, Roorkee 155 155
TOTAL 318 290 608
Sir MacDonnell reported that a few more Survey Schools were functioning during the period in Hyderabad (Sind):

14
Province Survey Schools Industrial SchoolsNumber Enrolment Name Enrolment
Madras - - 6 249Bombay 1 21 7 307Bengal 4 171 5 172Punjab - - 4 93NW Province - - 2 186Central Province - - 19 316Assam 7 163 1 18Burma 5 110 1 38
Total 17 465 45 1379
Golden Jubilee of Queen's ReignThe golden jubilee celebration of Queen Victoria's reign in 1887 provided the occasion to collect large sums of money from the public for commemorating the event suitably. In Bombay and Madras opening of technical schools was considered an appropriate way of utilizing the funds. Viceroy DufFerin in a public address in Lucknow in 1888 said 7 have always taken the deepest interest in technical education. I have called the attention o f all the subordinate governments to the desirability o f promoting this branch o f instruction by every means in their power. But I must remind you that it is neither within the competence nor the function o f the Supreme Government to give practical effect to its views. The latter responsibility devolves on the local government to a certain degree, but still more largely on the Indian community. Even the local governments, unassisted by the liberality and counsels o f those who are in a position to support their efforts, can but do little'.
The impulses, which led to the formation of the Indian National Congress, were also responsible for the origin of the Victoria Jubilee Technical Institute (VJTI), which was founded in 1887. The great names associated with the Institute include Dadabhai Naoroji, Pherozshah Mehta, Dinsha Wacha, R.D. Ranade, Badruddin Tyabji, K.T. Telang, and philanthropic members of Jeejabhai, Wadia and Petit families. The public donations collected to commemorate the viceroyalty and to celebrate the Golden Jubilee of Victoria's reign provided the funds.
Stagnation at the end of the 19th Century The facilities of technical education at the end of 19th Century comprised 4 engineering colleges at the degree level, about 20 survey and technical institutions and some 50 industrial schools. The standard of education was very good except in the industrial schools. The diplomas/ degrees of the colleges were recognized by the Institute of Civil Engineers, London. However, there was stagnation in the growth of education. Only 6 engineers passed from Sibpur in 1861 and 9 in 1900, averaging just 5.4 during the first forty years. Roorkee also operated below par; till 1856 a total of 31 engineers passed out against the sanctioned outturn of 152 during its first 8 years; in the next 12 years (1857-1869), 84 students passed out at an average of 7 per year against the capacity of 25. The reason for non-utilization of the capacity was not the non-availability of suitable candidates but the then prevailing employment policy of the Government.
The Government support for the development of technical education came to a standstill by 1875. In the next quarter century, the Engineering Colleges barely continued to exist. The attitude of the Government was at variance with the need of the public. An elaborate system of technical education was being demanded to improve the employability of youth and to reduce the poverty of the people, whereas the Government opinion was that the development of industry was a prerequisite for the expansion of technical education. The resulting debate helped in creating public awareness of private efforts. Establishment of

15
VJTI was the first example. The national sentiment for technical education found its greatest expression in the endowment of Rs.30 Lakh created by Jamshedji Nusserwanji Tata in 1898 to promote a technical institution, which finally led to the creation of the IISc. In Bangalore.
Emergence of Public OpinionIn 1880s, a new class of educated Indians was growing and making its presence felt. Many of them had exposure to education, literature and political thoughts of the West. This class wanted to emulate the West to make progress in respect of technical education and industrial development. This new class began to impress on the Government the need to start and accelerate the pace of such development. It had the support of some Englishmen but the majority of them were Indians. Englishmen on the official side said that the Indians were trying to move too fast.
The newspapers with national leanings were continually faulting the Government for not making enough provisions for technical education. Unemployment was on the increase and technical education was viewed not only as the basic need for industrialization but also as a means to ameliorate unemployment. The Indian National Congress in its third Session held at Madras in 1887 passed a resolution that '— having regard for poverty o f the people, it is desirable that the Government be moved to elaborate a system o f technical education'. A mention of the need to have technical education became a regular feature of the Presidential address at Congress Sessions and its resolutions. In particular, the subject was emphasized by the Congress Presidents, W.C. Banerjee in 1892, Anand Mohan Bose in 1898, Chandavarkar in 1900 and Madan Mohan Malviya in 1909. Earlier in the 1901 session the Congress passed a resolution expressing its opinion that a Government College of Mining Engineering be established at some suitable place on the model of the Royal School of Mines in England and the mining colleges of Japan and Europe.
Individuals were coming forward with schemes
of their own and published pamphlets and newspaper articles emphasizing the need of technical education. At the same time, some individual Englishmen and English newspapers derided these ideas. For exam ple, one Englishman bemoaned that Bombay had already voted money for technical education to loosen a further flood of technical education upon this land. He added that the bulk of native educated community approved of the scheme because they did not understand what it meant. Even the prestigious Pioneer, then a leading Anglo-Indian paper, observed: 'the technical education in Central Provinces being everywhere rampant, and that engineering and agricultural classes have sprung up with the rapidity o f mushrooms'.
Lord Curzon’s DispensationIn 1900 Viceroy Lord Curzon appointed Sir Edward Buck to advise him on technical and industrial schools. Buck recommended that technical education be separated from the general education at all levels in terms of separate schools and separate administrative set-ups. His views, however, were ignored. In 1901, Curzon appointed a committee under the chairmanship of Col. John Clibbom, Principal of Thomason College, to examine the subject of technical education. Its report did not appeal to Curzon and was not even published. Curzon, did not favour spreading higher level technical education in India. His response to Tata's scheme of starting a higher level science research institute was lukewarm. Curzon was of the opinion that India did not have the necessary educational base to profit from higher technical education. He was in favour of beginning at the lowest level. Fresh Government resolutions resulted only in opening a few more technical and industrial schools. There were few industries in India and most of them were owned by the Europeans. They preferred to employ Europeans in all technical positions.
In 1902, Indian Universities Commission was appo in ted , w hich m ade the fo llow ing recommendations on technical education: As the Colleges o f Engineering train a large number o f students for the lower branches o f the profession and only a small number for the higher branch o f
16
which alone the University takes cognizance, we do not think it desirable that the University should itselfundertake instruction in Engineering'.
Negative Response of Provinces to the Offer of Additional GrantsThe Government of India sent out a circular in 1903 to the provincial Governments asking for suggestions on the utilization of additional grants for technical education. Punjab replied that it wanted no immediate establishment of technical schools. United Provinces, as advised by the Upper India Chamber of Commerce, considered technical schools unnecessary and the industrial schools serving no useful purpose. Madras wanted no grants for expansion. Bombay wanted to reorganize the VJTI, and to start three or four new technical schools. Bengal wanted a weaving school at Serampore. These negative replies further convinced Curzon that technical education was not needed.
But the Indian public opinion was different. When Curzon fund exceeding Rs. 1.5 crores for setting up a Memorial for the Queen Victoria was collected, the public opinion was strongly in favour of utilizing it to advance the cause of technical education. It was suggested that the fund be added to Tata's gift for a science institute. But Curzon preferred a monument in stone.
The Swadeshi movement of the first decade of the 20th century also led to the urge of Swadeshi education. During this period, many national educational in stitu tions, free from the Government control, were established for example, National Council of Education, Bengal (1906), which later became the Jadavpur University and some others. A few of them also imparted technical education. In the decades that followed some more institutions imparting technical and industrial education at various levels, and in different disciplines of technology were established.
Post World-War IAfter the World War I, the Government became a little more responsive to the public demand of technical education. The situation, which was
stagnant during the War period, began to improve. Several institutions were established during the War and in the decades thereafter. They included the Banaras (then Benares) Hindu University (1916), the Harcourt Butler Technology Institute, Kanpur (1920), the Calcutta University College of Science and Technology (1920), the Bihar Engineering College, Patna (1924), the Indian School of Mines, Dhanbad (1926), the Maclagan College of Engineering, Lahore (1930), the Andhra University, Vizag (1933), the University Department of Chemical Technology, Bombay(1934), and the Aligargh Muslim University(1935). Some colleges were started in the Princely States of India in 1937. Many other colleges in the four regions of the country were started in subsequent years. There was a lack of coordination at the all India level, and to some extent at the provincial level on the issues of the contents and the duration of the educational programmes. The nomenclatures, 'Engineering', 'Technical', 'Technological', or 'School', 'College', and 'Institute' were arbitrarily used, and did not indicate the level of the programmes.
Abbott and Wood report commissioned by the Government of India in 1937 stated that provision for technical education at all levels was too inadequate for a large country like India, and that there was no integrated policy and there was no coordinating agency for its proper development. Later, for coordination and standardization of the courses, the All India Association of Principals of Technical Institution was formed in 1941. Several technical institutions were established in different parts of the country during this period. As recommended by the Abbot-Wood Committee, a Polytechnic was established in Delhi in 1941.
Pre-independence InitiativesIn 1944, the Central Advisory Board of Education was asked by the Reconstruction Committee of Viceroy's Executive Council to give a report on the post-war education development in India. In the light of the Report, the Council appointed a committee in 1945 under the chairmanship of N.R.Sarkar to consider the development of higher technical institutions in India. In its interim report submitted in 1945, the Sarkar Committee

17
recommended the establishment of not less than four Higher Technical Institutions, one each in the North, East, South and the West. The objectives of these institutions were expected to be similar to those pursued by the Massachusetts Institute of Technology, USA. The key features of the proposed programme were non-specialized orientation and integrated curricula supported by institutional processes that would encourage Indian students to think creatively. The products of these institutions were expected to be 'creative scientist-engineers' and technical leaders with a broad human outlook and individuals with 'creative initiative in future situations'. All students were expected to have strong core knowledge of basic sciences, engineering sciences, humanities, and technical arts besides the professional courses in chosen disciplines.
The number of engineering colleges in the year 1946 was 46 with an intake capacity of 2500 students. These colleges catered predominantly to the needs of the various Government departments such as Public Works, Railways, Electricity, Telecommunications, Irrigation, etc. A very small proportion of engineers found opportunities in private sector companies engaged in engineering operations. The intake capacity for post- graduate education in engineering was a mere 30 students in 1947. Most had to go abroad to obtain postgraduate education in engineering.
On the recom m endations o f the Sarkar Committee, a national agency, All India Council for Technical Education (AICTE, then not a Statutory body), was established in 1945 for planned and coordinated growth of technical education in India. In 1947 at the time of Independence, Polytechnic education was severely lacking in respect of eligibility, duration, standard and management. At that time, only 53 institutions conducted Diploma courses in the country with an intake capacity of 3670 students. The major task of the AICTE was, therefore, coordination, standardization and improvement of Polytechnic education. The action on the other recommendations, which led to the establishment of IITs, was taken by the Government of India after Independence.
Earlier Initiatives in Independent IndiaThe Government of India, after Independence, recognized the importance of the quality technical education for the economic and industrial growth of the country, which required the future generation of engineers to be competent, innovative, good designers and excellent product manufacturers. The Radhakrishnan Commission Report (1949) made several recommendations on technical education emphasizing the need of new types of engineering and technical institutions in I n d ia . A s a c o n s e q u e n c e o f th e s e recommendations, several new developments took place in the subsequent years.
The visionary report of the Sarkar Committee gave rise to the birth of the first Indian Institute of Technology at Kharagpur in 1951 followed by four other IITs at Bombay, Madras, Kanpur and Delhi in the late fifties and early sixties. The IIT at Guwahati, Assam started functioning from 1992. The University of Roorkee was converted into an IIT in 2001 after the State of Uttar Pradesh, which already had an IIT, was reorganized to create a new State, Uttaranchal (now Uttarakhand).
The initiatives to conceive a grand design for technical education in India and to implement the concept true to its spirit, in the form of Indian Institutes of technology (IITs), was a hallmark developm ent in independent India. The performance of the IITs during the last four to five decades has provided a sense of fulfillment. Their achievements in producing high quality engineers and technologists and in undertaking advanced R&D in science and technology, have received worldwide recognition. Though their future directions may depart from the original design, they will hopefully continue to maintain their reputation and their brand image.
Considering the ambitious economic and social development goals of post-independent India, the need for training engineers in much larger numbers and in diverse disciplines was acutely felt. While a number of engineering colleges were started adopting the conventional pattern of engineering education, there was a desire to establish a few technological institutions which

18
would provide world-class technical education and would have the dynamic characteristics to adopt themselves to rapid changes in engineering knowledge and its applications.
In 1959, under the chairmanship of M.S. Thacker, a Working Group on Technical and Vocational Training and also a Committee on Post-graduate Education and Research were constituted. Another important step in the development of technical education was the appointment of the Kothari Commission (1964). The Kothari C o m m issio n R ep o rt c o n ta in e d m any recom m endations, w hich included the importance of practical training and industry- institute interaction. During the first two decades after Independence, the expansion in technical education was accompanied by huge investments by the Government in infrastructure in the academic institutions. In the late fifties, faced with a serious shortage of faculty in technical institutions, a Technical Teachers Training (TTT) programme was started. Reasonably attractive fellowships were offered to fresh graduates to induce them to study for a post-graduate degree in one of the leading institutions in the country, and later to join the teaching profession. Some teacher trainees were also sent abroad for acquiring higher qualifications. The Technical Teacher Training (TTT) programme resulted in the creation of a large pool of dedicated teachers.
Growth of Technical EducationOn the recommendation of the Engineering Personnel Committee, which was appointed by the Planning Com m ission in 1955, the Government of India initially decided to establish eight Regional Engineering Colleges (RECs). In order to provide each State with a Regional Engineering College, seven more were approved during the Third Plan period, bringing the total number of RECs to fifteen by 1972. Two more were added later, one in Jullandhar (1985) and the other in Hamirpur (1989).
After the TTT programme was phased out, the Quality Improvement (QIP) for improving the quality of technical education and developing the faculty of engineering institutions was launched
by the Government of India in 1970. This programme is operated in 25 engineering/ technical institutions; seven of them are major QIP centres and eighteen are minor centres. This programme provides opportunity for continuous upgrading of knowledge and skills of persons who are already in the teaching profession. Over the years, a large number of teachers acquired higher degrees from the leading institutions in the country under this programme.
In order to assess the impact of foreign technical assistance on the development of technical education in India and to determine the areas needing to be further developed and supported through the foreign technical assistance programme, the Government of India appointed a Committee under the chairmanship of Y. Nayudamma (1978). Another Committee also under the chairmanship of Nayudamma was constituted at about the same time to review the postgraduate education and research in eng ineering and technology and make recommendations for further development. Whereas, little is known about the outcome of the former, several recommendations of the latter were implemented.
The National Policy on Education (NPE 1986) was a major development in the field of education. NPE came out at a time when the role and impact of private institutions imparting technical education were not known or even perceived. NPE was, therefore silent on this aspect and so was the resulting Programme of Action (POA 1992). This weakness of the Policy still persists
Postgraduate Education in Engineering and TechnologyThe postgraduate education in engineering and technology in India had a late start. The postgraduate programmes in the country started in a few institutions in early 1950's but the doctoral programmes were not common until early 1960's. The recommendations of the Thacker Committee (1959-61) and of the Nayudamma Committee (1978-79) played a role in the development of the postgraduate education. These Committees were constituted by the then

19
Ministry of Education and their reports were submitted directly to the Ministry for perusal and action . L ater a Review Com m ittee on Postgraduate Education in Engineering was constituted by AICTE in 1995 under the chairmanship of R Rama Rao, which submitted its Report to AICTE in 1999. The actions on this Report have been slow and sporadic. The postgraduate education in India remains weak and needs urgent attention. With a weak postgraduate education in engineering, the technology base will be weak and India will not be able to become a front runner in the field of technology, industrial productivity and the service sector, which determine the growth and development of the country.
Rama Rao Committee ReportRama Rao Committee supported the 'GATE' system of admission and recommended the increase of the duration of M.E./M.Tech programme from 18 months to 21 months, enhancing the scholarship to post-graduate students, with a provision of its periodic review. The duration of the programme was, however, increase to 24 months. The Rama Rao Committee recommended strengthening the one year postgraduate diploma programmes in suitable d iscip lines w ith industria l/ application
More IITs are being planned and conceptualized; the Joshi Committee short-listed seven institutions to be considered for raising them to the level of IITs. The Anandakrishnan Committee subsequently did a detailed exercise, which included visits to the seven institutions. In its
orientation, namely maintenance of thermal power stations, plastics engineering, industrial engineering, VLSI design, CAD, Information Technology, et al. These programmes could be aimed at key industry personnel and the concerned industries should be expected to invest in setting up links with selected institutions. The Diploma programme could be offered both on- campus and in Distance Education mode. The Rama Rao Committee recommended enrolling foreign students in post-graduate programmes, particularly in emerging areas since many countries may not have the facilities in those areas. The Committee emphasized an assured placement through active linkages with potential employers. It recommended that programmes in new areas be started after careful considerations of all aspects and with due care, and listed 35 re p re se n ta tiv e a reas . The C om m ittee recommended restructuring and, at the same time, phasing out of the outdated programmes.
Expansion of Technical Education and the Private SectorThe technical education in India has expanded enormously. The quality of education however, is a major concern. The AICTE website gives the following statistics of the approved technical institutions.
report submitted to MHRD in February 2006, the Committee recommended a concept for a new group of Institutions calling them Indian Institute of Engineering Science and Technology. Lately, the MHRD has taken another initiative to establish three new IIITs and constituted a
Intake in UG Engineering/ Diploma Engineering (Source AICTE Website, not updated)
Region Number of StatesEngineering/ Diploma
Number of Institutions IntakeCentral 03 112/101 37195/23741Eastern 12 114/146 34016/22905Northern 03 106/117 32298/15689North-West 06+1UT 153/130 50645/ 30206Southern 03 496/315 165757/79675South-West 02 207/ 254 70788/48600Western 2+1UT 158/181 48990/44600TOTAL 1346/1244 439689/265414

20
Committee to submit recommendations on the suitability of the sites proposed by three States to establish them. This Committee has submitted its report to the MHRD. Time has come for the policy makers to look beyond IITs, not only because establishment of new institutions require huge investments but more so because the framework, the structure and the philosophy of new IITs or new leading Institutions designed in 2007-08 would have to be different from what they were in 1951.
All the 20 National Institutes of Technology have been declared as the Institutes of National Importance by the NIT Bill 2007 passed by both the Houses of Parliament and by the Law, which came into force from August, 15, 2007. The collective NIT Vision 2025 is to produce 'thinking engineers' with 'sensitivity for the cause o f nation', who will have the 'capability to develop new technologies'. Effective and consistent implementation of the plans and programmes backed by sound policies, rather than the statutory label of 'national importance', will enable the NITs to realize their professed mission and may take them beyond the IITs.
Some issues in Technical Education
I listing below some issues concerning technical education, which may be considered important needing attention:
(i) The governance structures of engineering institutions
(ii) Expansion of engineering education and quality issues
(iii) Systems of regulation and their efficacy to ensure norms and standards of technical education; in what way they have succeeded and in what way they have not?
(iv) Admission policies and processes(v) Shortage of teaching faculty(vi) Availability of good text-books and other
learning materials
(vii) Teaching and learning in electronic environment
(viii) Laboratory practices(ix) Computer and communication skills of
students(x) Entrepreneurship training and skills as part
of curricula(xi) Role and initiatives of industries in
engineering education(xii) Quality of teaching and research(xiii) Accreditation of courses/ programmes and
mobility of students with credit transfers(xiv) Actual cost of technical education and how
can it be reduced and what should be the price of education which students should pay
(xv) Collaboration with foreign Universities/ Laboratories for the following:- Exchange of students and faculty- Mutual arrangements to utilize sabbatical
leaves- Mutual arrangements for Credit Transfers- Joint R&D programmes with foreign
Universities including international bidding for contract research
- Issues related to regulatory measures of AICTE, UGC and MHRD regarding tie- ups with foreign institutions.
ConclusionAt the threshold of the current Century, the view which emerged from the UNESCO—World Conference on Higher Education is particularly relevant to technical education: A renewal o f Higher Education is essential for the whole society to be able to face up to challenges o f the Twenty First Century to ensure its intellectual independence, to create and advance knowledge, and to educate and train responsible, enlightened citizens and qualified specialists, without whom no nation can progress economically, socially, culturally or politically'. Education faces a major challenge of providing learning opportunities to the society that will empower the citizens to cope with increasing use of science and technology in the 21st Century, which is growing at an ever-increasing price.

Award Lecture Series ofIndian National Academy of Engineering
Professor Jai Krishna Memorial Award Lecture 2008
Science and Technology of Fast Breeder Reactor Programme in India: Challenges and Achievements
Baldev Raj Distinguished Scientist and Director
Indira Gandhi Centre for Atomic Research, Kalpakkam, 603 102, India
IntroductionThe citizens of the planet earth with a population of more than 6 billion, over periods of civilization in different parts of the world, have progressively endeavored to provide and search for better quality of life. Certain parts of the world practice science and technology, robust management philosophies and broad variations of capitalism and socialism with clear perspectives and programmes, and have achieved remarkable success in their objectives. It is also the fact that more than 2 billion of the population do not have access to even minimum amount of energy, clean w ater, educa tion and h ea lth ca re . The disappointing fact is that the deprived citizens, which include a large fraction of expecting mothers and children, do not see the hope and faith in the political systems in their countries, the world systems and the organizations created for the purpose of providing inputs and catalytic processes to achieve the minimum standard of life. The population is likely to grow to about 9 billion by the end of 2050, and the climate changes are threatening to deprive the underprivileged more than those who are doing well in the world.
Thus, we find that the world is divided between optimism and disillusionment. History is demonstrative of the fact that enlightened human beings can remove disillusionment with their
capacity, capability, commitment, approaches and selfless service. The nations and the world bodies require leadership of intellectuals, social scientists, scholars and the believers in the voice of democracy to guide the systems and societies where politicians and bureaucrats combine their sensitivity to large masses with intellectuals and professionals to have high synergy for enhancing quality of life for the deprived citizens of this planet in a systematic and demonstrative manner. This brings to focus the importance of ethics of individuals and the organizations. The current scenario also demands a coherent synergy between the ethical organizations to deliver equity to all citizens on this planet. Equity to all means education with health care and equal opportunity. Realizing that a developed civilization also means creating an eco-system in various parts of the world for wealth generation and management. It is clear that cost effective energy, sustainable over centuries in various parts of the world; with strong base in science and technology along with addressing the issues of global warming and sustaining and enhancing bio-diversity are the key issues. There is a need that energy, water, health, land and food are considered in a comprehensive and interlinked fashion for sustainable options to provide better quality of life to all the citizens of the planet(Fig-1)-

22
itTttUVW firW ft
Eco SystemW e a lth g e n e ra t io n & i M a n a g e m e n t ,
EquityEducation & health caro
Equal opportunity
EnergySustainability
Environ
Energy, wafer, health, land, food are to be considered in a comprehensive and interlinked fashion for sustainable options with better quality of life to all the citizens of the Planet
Fig.l A developed civilization scenario
The Gross Domestic Product (GDP) and other indices of socio-economic development like literacy, longevity and human development are also directly dependent upon the per capita energy consumption of a country. As far as India is concerned, it is the largest democracy with the current population of about 1.05 billion, and is on a road to rapid growth in economy. An impressive average the GDP growth rate of about 8% per year has been achieved in succession over the last 4-5 years. The growth rate has to be sustained at high levels over the next 10 years to address the challenges developed in India. The current per capita energy consumption in India is 23 GJ/a which is significantly low compared to 332 GJ/a in the USA and 220 GJ/a in the OECD (Organization for Economic Cooperation and Development) countries. Out of this, the per capita electricity is still low (about 660 kWh/a = 2.4 GJ/a), compared to 13000 kWh/a (47 GJ/a) in the USA and 8204 kWh/a (50 GJ/a) in the OECD countries. Hence, the demand for a rapid increase in the electricity generation capacity in the
coming decades is beyond a matter of debate for India to realize its dreams of a sustained growth in econom y backed by strong in d u s tria l development. Realising its requirements and the potential, India is aiming to reach at least the per capita energy consumption of the present world average (2200 kWh/a) by 2030 from the current value of 660 kWh/a. This calls for the electricity generation capacity of about 600 GWe by 2030 assuming a population of about 1.4 billion. It is worth mentioning that the present energy scenario is not satisfactory, and the persistent shortage, unreliability and high prices for industries need to be eliminated on priority. Raising the electricity availability by about 5 times in the next twenty five years calls for a careful examination of all the issues related to sustainability, including relative abundance of available energy resources, the diversity of sources of energy supply and technologies, security of supplies, self- sufficiency, security of energy infrastructure, effect on local, regional and global environment and demand management.

23
CurrentResources
Indian Energy
U I n'lKHJ ■HWHl fmmmtu.
Vc b i -v
d e p l e t i o n lo *i f e e s r i e t Y
; i r i 7'. .••! r -vn ii i i r i p
C u r r a n tr a t e 1 3 0 • * . 1 2 i n a- LOS!?
2 -U SZ r a c e I S . f i ■ ( . . * L B .5
T o ta l S o la r r r - l l r r t in n a r e a
r e q u i r e d [ c a s e d o n M N E S e s t im a t e 2 0 M W / k n i^ } :A i c u r re n t r»1 ie-> > 39GO sq Mm * t 2 0 5 Z ru le - sq
(Ref : A Strategy for growth of Electrical Energy in India, DAE, 2004: Coal data from Report o f the Expert Committee on Road map for Coal Sector Reforms)
*. Ta be p fn lt'tnaa^ v utcd in lrb n q » f t s k id*1
lW f i m p o r t ; « G W e
| Period; 2Q12-2Q20I D e f i c i t |r. t w M | e d t i f fr ra s il fu*! ILWP
Prqorlnd(“quirwiienl
- - n iiL T iir r j 4 2 & J
Tim drlitll r. prnrtlrnlty wiped out in SjhU
Delict 7 ‘S A b
1 FBJL L&lro :pw-*:fud Ifcfial LIAR [ : LW R r Em p a rted )
Uncle*- (Domestic “ J-Vtageprogramme [ in Mfdrorflrttm
Cflfll i ti*n“sl i
| M o n ^ a n v * r R t G n q |
| H.- ccicctrt
*:*r. 'A StiWiy.-, bl &Ch-.Eh B*iD EnL-'ij'i q lu ll 11 A v u m A r l 10 & u ? ir t Jt>M I >Vp
Strategies for Long Term Energy Security
Fig.2 Current Indian energy resources and Nuclear Contribution
India has good reserves of coal and river system and these must be exploited with the best technologies. The current Indian energy resources and the projected nuclear contribution are illustrated in Fig.2. The Integrated Energy Policy document o f the Planning Commission, Government of India, indicates that the proved reserves of coal, the most abundant energy resource, at the current level of consumption can last for about 130 years. Of course, coal and lignite consumption will increase in the future, and the reserves would last for a limited period. If the domestic coal production continues to grow at5 % per year, the total, including proved, indicated and inferred, extractable coal reserves will run out in around 45 years. Bio-waste is a good option for us while biomass should be carefully considered to ensure that this option does not conflict with the food cycle for human beings, cattle and other species. Strong R&D base in nuclear energy in
the country, and recent indicators that India would be integrated in the world nuclear energy system for civil nuclear energy allow us to forecast a large contribution from nuclear energy in the coming 50 years. However, judicious combination of all the energy resources is essential for India.
The concerns vis-a-vis the threat of climate change has also been an important issue in form ulating the energy policy of India. Environmental concerns are associated with all forms of energy including fossil fuels, nuclear energy and renewable, sources throughout the energy chain from exploration, mining, transportation, and generation to end-use. Carbon dioxide from fossil fuel combustion accounts for about 40 % of the global warming. A 1,000 MWe coal-fired station consumes 3 million tonnes of coal per year producing 7 million tonnes of carbon dioxide, 120 thousand tonnes of sulphur dioxide,

24
20 thousand tonnes of nitrogen oxide and three quarters of a million tonne of ash. These emissions produce much of the environmental damage including global warming through the green-house effect. Similarly, for hydel projects, large environmental impacts and loss of land occur. Apart from the concerns of environmental issues, the high fluctuations in natural gas prices faced by the country call for an urgent need to diversify the energy production. From this point of view, nuclear energy is considered to be the most preferred option for the country.
Nuclear Energy: Concept of Nuclear Fission and BreedingFission is a nuclear reaction where a fissile atom, after absorbing a neutron splits mainly into two atoms of nearly equal masses (fission products). A fission, apart from generating fission products, generates more than one neutron and also releases large amounts of energy. Such reactions are possible in heavy atoms such as Uranium-235, Plutonium-239 and Uranium-233, which are
It emerges from the above numbers that fast reactor with natural uranium is not possible since r\ is less than unity. Fast reactors yield higher number of neutrons, the highest yield being with Plutonium-239. In order to maintain the steady- state energy generation, one neutron must be reserved to continue the fission chain. The excess of neutrons thus generated is the key parameter in the nuclear fission scenario, which is the measure of the quality of the fissile element with respect to breeding.
Breeding is a concept of artificial production of fuel for nuclear reactors. For realizing breeding, i.e., fissile material production to be greater than fissile material consumption, out of say r\ neutrons produced by one fertile atom for one neutron captured, one must be reserved to continue the fission chain while 'p' neutrons would be lost
called fissile isotopes. Natural uranium contains about 0.7% Uranium-235 and the rest is Uranium- 238. Other two, i.e. Plutonium-239 and Uranium- 233 are not naturally occurring isotopes. They are generated by a process called nuclear radioactive transmutation (capture of one neutron followed by two successive emissions of beta particles) of Uranium -238 and Thorium -232 (sim ply thorium), respectively. These two are called fertile isotopes. Natural uranium and thorium are the naturally occurring nuclear fuel materials. The energy generated by fission in one fissile nucleus is ~ 3xl0"18 kWh. Since one kg of Uranium 235 contains about 2.5xl024 nuclei, one kg of natural uranium containing about 7 g of Uranium 235 has an electricity potential of ~ 52,500 kWh. The number of neutrons generated from fission per neutron absorbed in the fissile material, called ‘rj' depends upon the energy of the neutron when it gets absorbed. For fission reaction to be sustainable, ti should be greater than 1. Table-1 gives the ‘rf value:
unproductively due to capture and leakage. Hence, the number of neutrons available for capture by the fertile nucleus to do conversion is given by [r| - (1 +p)]. Obviously, this must be 1 for breeding to take place. Thus, ti should be greater than [2 + p]. Hence, the choice is to have r| as much greater than 2 as possible. Breeding ratio is a measure of the degree of conversion of fertile to fissile material and defined as: BR = Fissile mass produced / Fissile mass destroyed. The breeding gain, i.e. BR-1 = Fissile mass gained / Fissile mass destroyed, which decides the amount of fissile material generated in a given time. Since Pu has highest yield of neutrons, which in turn will result in highest BR, its use in fast reactor is most beneficial from breeding point of view. The BR needs to be higher than 1.03 for significant utilization of U-238 in any reactor system.
Table-1 ‘i)' values for various nuclear fissile isotopesReactor types Natural Uranium Uranium 235 Uranium 233 Plutonium 239
Thermal 1.34 2.04 2.26 2.06
Fast < 1 2.20 2.35 2.75

25
A nuclear reaction, in general, can transform a heavy nucleus. The newly generated nuclei undergo all probable interactions and decays, so that they have both production and destruction routes. However, through a proper combination of fissile, fertile and other materials arranged in a carefully worked out geometry, it is possible to realize a fissile nuclei production rate that exceeds the fissile nuclei consumption rate. A reactor system in which this has been realized is called a 'Fast Breeder Reactor' (FBR). This category of reactors can sustain energy production without any external feed of fissile material; but accumulates extra fissile material in the reactor, which can be used for feeding a new reactor after reprocessing. In advanced FBR, it is possible to achieve a breeding ratio up to 1.5. Such high breeding ratios are not possible in any other reactor systems. In the thermal reactors, the production of new fissile material (plutonium) from uranium-238 is lower than the consumption of fissile material (uranium-235). So the breeding ratio is less than unity and is called conversion ratio. Hence, these category of reactors always needs external feed of fissile materials and are called 'converters'. Pressurized Heavy Water Reactor (PHWR) comes under this category.
The effective utilization of uranium is possible only in FBR system. This is quantified by comparing with a typical PHWR system. With a conservative 3% heavy atom loss in complete fuel cycle, maximum utilization possible with FBR system is about 85%. In once through fuel cycle of the PHWR, 0.7% of the uranium resource (average bumup 7000 MWd/t) is used. In a closed fuel cycle through the FBRs, the fuel can be recycled any number of times. But considering the fissile material quality, reprocessing loss and fertile feed for every recycle, around 10 recycles are realisable. In every cycle, about 7 atom% of heavy elements is burnt corresponding to an average bumup of 70,000 MWd/t (peak bumup 100 GWd/t). Assuming that 7 recycles are possible out of 10 projected earlier, nearly 49% of heavy element atoms can be burnt in the FBR, which gives a ratio of about 70 times uranium utilization factor. This means that one kg of natural uranium would generate about 36,80,000
kWh in the FBR, compared to only 52, 500 kWh possible in the PHWR. Considering that the thermodynamic efficiency of the FBR steam cycle (0.4) is higher than that of the PHWR (0.3) due to higher operating temperatures in the FBR, electricity generation becomes higher than36,80,000 kWh per kg of U in the FBR route. It is worth mentioning that with advanced fuel with high bumup (peak bumup 200,000 MWd/t) and fuel cycle losses of 1%, it is possible to realize the uranium utilization factor nearly 100 times higher than that of once through fuel cycle thermal reactor.
Although thorium possesses a number of superior physical and nuclear characteristics than uranium, it is not fissile. Thus, even with much greater abundance than to uranium, and also early recognition of its superior characteristics as an energy source, thorium has lagged far behind uranium. In the early years of nuclear energy there was enthusiasm for thorium worldwide and several thorium-based reactor systems were examined, but due to the easy availability of uranium and saturation in energy demand in the developed world, interest in thorium could not be sustained. In India, on the other hand, the energy demand has been growing fast. Considering India's modest uranium reserves, large growth in nuclear power can be realized only through efficient conversion of fertile materials into fissile materials and utilizing the latter to produce energy. Development of appropriate breeders is thus a necessity.
'While in the case of uranium systems, it is necessary to go for the fast breeder reactors, in the case of thorium systems the choice is not obvious at this stage. Uranium-233, which is the fissile isotope derived from thorium, runs equally well in thermal as well as fast spectrum. Since India has a mature thermal reactor technology, there is a strong motivation to continue with this. At later point in time, when the fast reactor technology also attained maturity, we can make relative comparison, and choose either fast or thermal reactor for thorium utilization.

26
Indian Nuclear Programme
India has limited uranium and abundant thorium resources (Fig.3). The uranium resources of reasonably assured and inferred categories in India is 84,600 t. (< 2% of world resource). However, the thorium resource in the country is225,000 t (the second largest reserve in the world), which has an energy potential of 155,000 GWe-y. The uranium resource available in the country can feed 10 GWe capacity of PHWRs for ~ 50 years with thermal efficiency of 30 %. Since the FBRs can extract more than 70 times thermal energy from the same quantity of uranium and generate electricity with higher thermal efficiency (40 %), the available uranium can also feed 275 GWe for about 200 years, when used in FBR after reprocessing. Thorium can feed 275 GWe
Th-FBR
U-FBR
COALU-PHW R
HYDRO l GAS
Fig.3 Energy Resource position in Indiacapacity power plants for about 550 years. Taking cognizance of India's nuclear resource profile, Dr.Homi Bhabha formulated a 'Three Stage Nuclear Power Programme' for achieving energy independency (Fig.4).
World class performance
Stage - III and Beyond Thorium Based Reactors
* 30 kWtti KAMIN1- Operating
- POWER POTENTIAL =155,000 GWe-y
- Availability of ADS can enable early introduction of Thorium
* Participation in ITER towards development of fusion technology
Stage-I PHWRs
* 1 5 - O p e ra tin g* 3 - U n d e r c o n s tru c tio n " S e v e ra l o th e rs p la n n e d* C o n s tru c tio n p la n n e d
fo r 7 0 0 M W e u n its* G e s ta tio n p e rio d
b e in g re d u c e d* P O W E R P O T E N T IA L 2
1 0 ,0 0 0 M W eLWRs
• 2 BWRs O p e ra t in g• 2 VVERs under
construction
S ta g e - II F a s t B re e d e r R e a c to rs
* 4 0 M W th F B T R - O p e ra tin g T e c h n o lo g y O b je c t iv e s re a lis e d
* S O O M W e P F B R -u n d e r c o n s tru c tio n
• P O W E R P O T E N T IA L ; M in im u m 5 3 0 G W e
K a ip a k k a m - U n iq u e N u c le a r S ite in th e W o rld h o u s in g a ll T h re e S ta g e s & C lo s e d F uel C y c le F a c ilit ie s
IG C A R - M is s io n O rie n te d C e n tre fo r D e v e lo p m e n t o f S c ie n c e B a s e d T e c h n o lo g y fo r F B R
Fig.4 Three stage Indian Nuclear Power Programme

27
Enhancement of PHWR programme through advanced uranium exploration, import of natural uranium for PHWRs, import of water reactors from outside under safeguards are the current plans of the department. It is also planned to establish mega nuclear parks with colocated fuel cycle facilities.
Importance of FBR with Closed Fuel Cycle
With the limited nuclear resources a v a ila b le in the co u n try and considering the recent substantial increase in uranium prices, in view of its efficient use of uranium FBRs with closed fuel cycle, is an inevitable option. Further FBRs are essential for converting thorium to 233U, required for the third stage of Indian nuclear power programme. FBR is a very efficient system for handling actinides and long- lived fission products in the domain of waste management. FBR can be designed to incinerate high-level wastes arising from the reprocessing of spent fuel (Fig.6). In the concept of integrated FBR with co-located fuel cycle, it is possible to derive wealth from waste, i.e. fission products, such as 137Cs, will be separated and used as a radiation source for various societal applications. This approach minimizes th e q u a n ti ty o f w a s te to be immobilized. The Separation of noble metals such as Palladium for societal applications such as catalysts, fuel cellsetc. are also possible. * -o , Fig.6 Benefits of closed fuel cycle
Further, the FBRs would also provide critical liquid metal technology and high temperature design inputs for the future accelerated driven systems (ADS), fusion and high temperature reactor systems. These apart, the FBRs can provide electricity at competitive costs over long periods. Hence, the FBRs are the most preferred and suitable option for providing sustainable and environmentally acceptable energy systems.
a£Q-3IIhFl
YearNote; Results fo ra scenario with current domestic Uranium resources and a s s u m e short doubling tim* FBR (mm 2021
Fig. 5 Strategy for Thorium introduction in Third stage
win -
wo -
4UIJ -
JOO-
m \ -
loci
u -
Detailed calculations have shown that thorium can be deployed on a large scale about 3 decades after introduction of FBRs with short doubling time
Power profile of PHWR programme
~T2 0 1 Q 3 0 3 5 7 0 1 0
HUMy
10000 100000 10(10000

28
International Fast Reactor Programme
FAST REACTOR: OPERATIONAL DATA (2007)
Reactor Country
PowerPeriod of Operation
Cumulative years ofOperationalExperience
MWt MWe
Clementine USA 25 (KWt) — 1946-52 6 (Hg Cooled)
EBR-I USA 1.4 0.2 1951-64 13
BR-5/BR-10 Russia 8 — 1958-02 44
DFR UK 60 15 1959-77 18
EBR-II USA 62.5 20 1961-91 30
EFFBR USA 200 66 1963-72 9
Rapsodie France 40 — 1967-83 16
BOR-6O Russia 55 12 1968-... 39
SEFOR USA 20 — 1969-72 3
BN-350 Kazakhstan 750 150 1972-99 27
Phenix France 563 250 1973-... 34
PFR UK 650 270 1974-94 20
JOYO Japan 50-75/140 — 1977-... 30
KNK-n Germany 58 21 1977-91 14
FFTF USA 400 — 1980-93 13
BN-600 Russia 1470 600 1980-... 27
SPX1 France 3000 1240 1985-97 12
FBTR India 40 13.2 1985-... 22
MONJU Japan 714 280 1994-... 13
BN-800 Russia 2000 800Under
construction
—
CEFR China 65 20 —
PFBR India 1250 500 —
Total All Fast Reactors 390

29
The cumulative operation experience of the FBR adds up to 390 reactor years. Although this figure includes, by definition, the shutdown periods due to technical and administrative reasons, and also some of the reactors have provided limited experience, due to their small size and absence of steam generators. This operating experience is considered substantial for drawing a few generic inferences. The small-size experimental reactors, for example EBR-II, Rapsodie, BOR-6O, JOYO and FBTR have provided valuable experience on sodium technology, fuel element design involving choice of fuel, cladding and wrapper material, burnup limits demonstration, and material irradiation data. EBR-II, in particular, had been extensively utilized for a robust sodium bonded metal fuel development. The objective of US fast reactor programme of U-19Pu-10Zr sodium bonded metal fuel has been successfully demonstrated in EBR-II and FFTF. However, these small-sized reactors have limitations in dem onstra ting the s tru c tu ra l in teg rity requirements of commercial fast reactors as the design loading, in particular, the thermal loading, increases with the size/rating of the components.
The performance of austenitic stainless steels with the exception of S S 321 has been satisfactory in the fast reactors. Grades with which good performance has been achieved include SS 304, SS 304LN, SS 316, SS 316L and SS 316LN. There have been a number of cracks and sodium leaks associated with SS 321 welds in Phenix secondary sodium piping and steam generators, and super-heater and re-heater vessel shells of Prototype Fast Reactor. The cracks are attributed to delayed re-heat cracking. As a result, SS 321 has been replaced gradually by SS 316LN in Phenix. In view of this experience, it emerges that stabilized grades SS 321 and SS 347 will not be considered for future fast reactors. Performance of C-0.3 Mo steel (15 Mo 3) in Superphenix fuel storage drum and sodium tanks constructed for use in SNR 300 had not been satisfactory, and has led to rejection of this grade of steel for FBRs.
As far as steam generator is concerned, except for Superphenix and FBTR, all the single wall steam generators had experienced tube leaks during the
operations. IHX operational experience, except for the Phenix reactor and minor incident of drain pipe failure in the EBR-II, has not been a concern from consideration of loss of plant availability. Sodium leaks from Phenix IHX took place at secondary sodium outlet header as the thermal loading due to the difference in temperature of inner and outer shell was under-estimated at the design stage. All the IHXs were repaired and a number of heat exchangers got replaced subsequently. Design modifications were carried out in sodium outlet header, including incorporation of thermal mixer. The performance of the mechanical sodium pumps in the reactors has been good, and the load factor outage due to pumps is very marginal. Minor incidents had occurred in EBR-II, Rapsodie, KNK-II, BOR- 60, FFTF, PFR, BN-350, Phenix and BN-600 sodium pumps with most of the incidents being in the early periods of operation. To overcome the problems of small sodium leaks, provisions have been made in the design to minimize the consequences of sodium leaks early, detection of sodium leaks, fast dumping of sodium in safe manner and fighting sodium fire. All the reactors have design features specific to sodium leaks in the primary radioactive sodium system into inerted guard vessel/piping/cabin and not in air so as not to result in fire. However, secondary sodium piping is single walled and sodium leak can cause fire. Sodium leaks have occurred in all the power reactors, and in some cases leading to sodium fire.
The experience gained from the design and operation of the SFRs has provided a firm basis for the design of future commercial fast reactors. The experience gives confidence in the perform ance o f fuel elem ents, sodium components and in the safety of plant operations. Maintenance on sodium components has been well demonstrated. The operation with failed fuel elements does not show any concern and provides acceptable time for operator action. Fuel performance gives confidence that the bumup can be enhanced to 200 GWd/t in a phased manner with improved cladding and wrapper materials.
There is renewed interest in fast reactors due to

30
their ability to fission actinides, leading to generation of less long-lived nuclides in high- level wastes. The FSR systems will feature in further works of the International Projects on Innovative Nuclear Reactors and Fuel Cycles (INPRO), and other international work on the FSRs including the Global Nuclear Energy Partnership (GNEP) and the Generation IV International Forum (GIF). In this respect, the operating experiences have paved the way for reaching the ambitious objectives of safety, reliability, performance and competitiveness, targeted for the future FSRs.
FBR Programme in IndiaThe seed for fast reactor programme in India was sown through the establishment of a research center (then called Reactor Research Centre) in 1972 dedicated to the development of fast reactor technology and by the decision to construct Fast Breeder Test Reactor (FBTR) at Kalpakkam. The FBTR is a sodium cooled loop type 40 MWt / 13.2 MWe experimental reactor which was commissioned in 1985 with an unique plutonium rich carbide fuel (70 % Pu & 30 % U). The experience gained in the construction , commissioning and operation of the FBTR as well as 390 r-y worldwide FBR operational experience, rich experience with MOX fuel, 30 y of focused R&D programme involving extensive te s tin g and v a lid a tio n , m a te r ia l and manufacturing technology development and demonstration, peer reviews and synergism among DAE, R&D Institutions and Industries, have provided the necessary confidence to launch a Prototype FBR of 500 MWe capacity (PFBR). The reactor construction was started in 2003, and the reactor is scheduled to be commissioned by 2010.
As a follow-up to the PFBR, it is planned to construct two twin units of 500 MWe reactors, with improved economy and safety during 2010- 20. Various elements of reactor design are being carefully analysed with the aim of introducing innovative features towards further reduction in unit energy cost and enhancing the safety in these reactors. Clear strategies have been identified to simplify the design, reduce the construction time,
enhance the bumup and close the fuel cycle with minimum cooling and out-of-pile inventory, without sacrificing the overall safety during the entire process. It is targeted to bring down the unit energy cost by ~ 25 %. Further, with advanced structural materials for clad and wrapper, a bumup of 25 at % is envisaged for mixed oxide fuels.
It has been realized that for enhanced growth of the fast reactors in the country, it is imperative to develop metallic fuelled FBRs, which promise a much higher breeding. A comprehensive programme on the development of metal fuelled reactor and its fuel cycle has been undertaken with the aim of introducing metal fuel in commercial FBRs by 2020. Fabrication of the test fuels for irradiation in the FBTR and pilot plant for pyrochemical reprocessing are the firm action plans under implementation. Directed research to develop metallic fuels for achieving high breeding ratio (1.45) and high bumup of ~ 25 at % is the target; based on which a spectrum of activities with synergism have been undertaken in the Department of Atomic Energy.
The design features of FBRs, challenges and achievements in the science and technology of the FBR and fuel cycle, highlights of R&D, future plans and the road-map for achieving robust growth of fast breeder reactor technology with closed fuel cycle in India, are highlighted below. In the subsequent discussion, the term FBR refers to the sodium-cooled fast breeder reactors.
Description of PFBR Plant and Related Fuel Cycle Facility
The PFBR is a pool type reactor with 2 primary and 2 secondary loops with 4 steam generators per loop.The overall flow diagram comprising the primary circuit housed in the reactor assembly, secondary sodium circuit and balance of plant (BoP) is shown in Fig.7. The nuclear heat generated in the core is removed by circulating sodium from cold pool at 670 K to the hot pool at 820 K. The sodium from the hot pool after transporting its heat to four intermediate heat exchangers (IHX) mixes with the cold pool. The
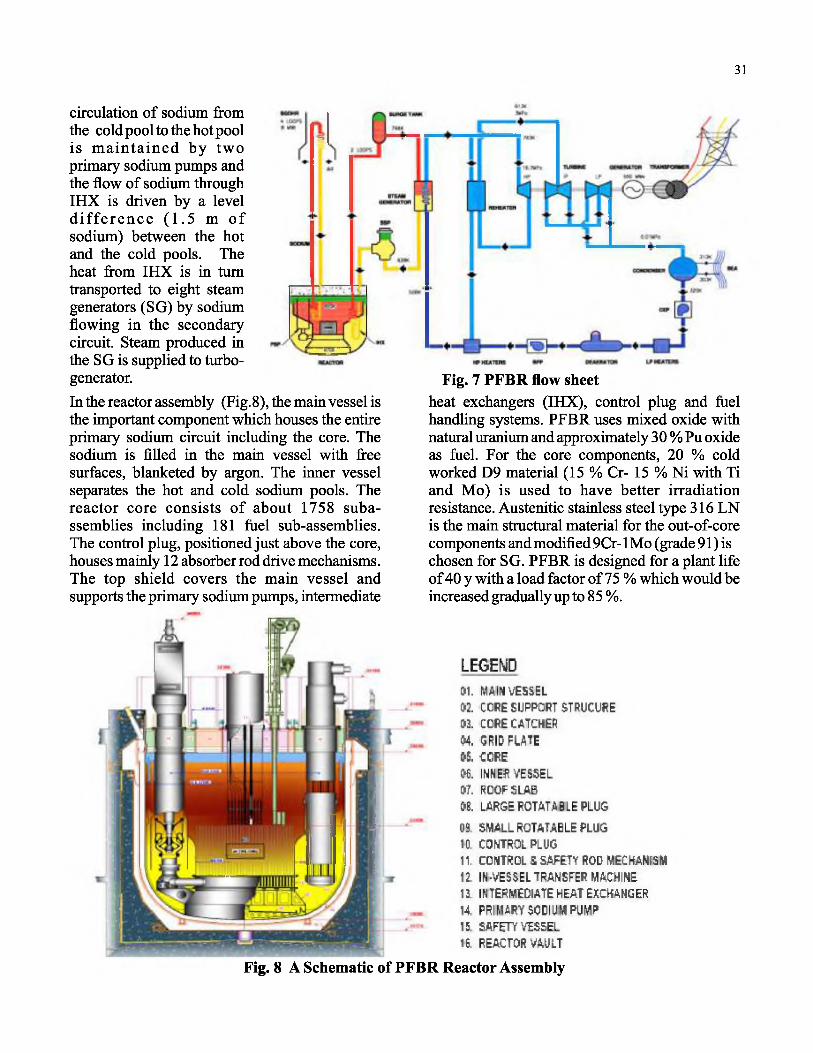
31
Fig. 7 PFBR flow sheetheat exchangers (IHX), control plug and fuel handling systems. PFBR uses mixed oxide with natural uranium and approximately 30 % Pu oxide as fuel. For the core components, 20 % cold worked D9 material (15 % Cr- 15 % Ni with Ti and Mo) is used to have better irradiation resistance. Austenitic stainless steel type 316 LN is the main structural material for the out-of-core components and modified 9Cr-1 Mo (grade 91) is chosen for SG. PFBR is designed for a plant life of 40 y with a load factor of 75 % which would be increased gradually up to 85 %.
LEGEND01. MAIN VESSEL
a t CORE SUPPORT STRUCURE
03. CORE CATCHER
04. GRID PLATE05. CORE
06. INNER VESSEL
07. ROOF SLAB
08. LARGE ROTATABLE PLUG
09. SMALL ROTATABLE PLUG
10. CONTROL PLUG
11. CONTROLS SAFETY ROD MECHANISM
11 IN-VESSEL TRANSFER MACHINE
13. INTERMEDIATE HEAT EXCHANGER
14. PRIMARY SODIUM PUMP
15. SAFETY VES5EL
16. REACTOR VAULT
circulation of sodium from the cold pool to the hot pool is m ain tained by two primary sodium pumps and the flow of sodium through IHX is driven by a level d iffe re n c e (1 .5 m o f sodium) between the hot and the cold pools. The heat from IHX is in turn transported to eight steam generators (SG) by sodium flowing in the secondary circuit. Steam produced in the SG is supplied to turbogenerator.In the reactor assembly (Fig.8), the main vessel is the important component which houses the entire primary sodium circuit including the core. The sodium is filled in the main vessel with free surfaces, blanketed by argon. The inner vessel separates the hot and cold sodium pools. The reactor core consists of about 1758 subassemblies including 181 fuel sub-assemblies. The control plug, positioned just above the core, houses mainly 12 absorber rod drive mechanisms. The top shield covers the main vessel and supports the primary sodium pumps, intermediate
Fig. 8 A Schematic of PFBR Reactor Assembly

32
The closed fuel cycle with recovery of fuel material from the irradiated fuel and recycling of the fuel, are important ingredients for the sustainability of the fast reactor programme, because the recycling of the fuel is necessary for achieving the effective utilization of the valuable fissile material. By adopting co-extraction of uranium and plutonium , with optimized decontamination factors for the fission products, closed fuel cycles with realizable strategies and technologies would be established, for achieving economy, safety and societal acceptance. The co-location of the fuel cycle facility of fabrication, reprocessing and waste management along with reactors would minimize the cost of the energy, allow better physical control of the fissile material and reduce transportation risks. This philosophy will, therefore, be adopted in planning of the Fast Breeder Reactors at various sites. Simultaneously with the construction of the reactor, the fuel cycle o f the reactor has been addressed in a comprehensive manner, and the construction of a co-located fuel cycle facility has been initiated. A dedicated Fast Reactor Fuel Cycle Facility (FRFCF) for reprocessing of the Prototype Fast Breeder Reactor fuel is being co-located near the reactor. The co-location concept obviates the need for transportation of plutonium through public domain, thus avoiding any radiation related hazards during transportation. The high-value fissile material remaining in the spent fuel from the PFBR is separated in this facility, processed and recycled to the reactor in the form of fabricated fuel pins.
Challenges in FBR Science and TechnologyAs indicated above in an FBR with 40 % thermal efficiency, 1 gram of heavy metal can generate 120 kWd electrical power. About 60 g of natural U is required for the PHWR to generate this energy, and about 1.51 of coal is required for fossil plant. To harness this potential of the FBR, advanced core structural material to withstand the effects of high irradiation and an efficient coolant to extract the high heat generated in the fuel are the essential requirements. The structural materials are being researched and evolved continuously to meet the higher standards of performance. The current state-of-the-art material, namely, D9 allows for
achieving the maximum bumup of about 100 kWd/g. Developing suitable structural materials is the most important issue as the governing factor for the end of life for the fast reactor fuels is the structural material, not the fuel. This calls for extensive R&D in both science and technology including post-irradiation examination (PIE) techniques to achieve a target bumup of 200 kWd/g, As far as coolant is concerned, the liquid metal, particularly sodium, is preferred. However, there are many challenging issues in both science and technology that have been resolved but there are a few issues yet to be addressed, particularly in the domains of sodium chemistry, sensors, mechanical behaviour of materials in sodium, nondestructive examination (NDE), especially in- service inspection (ISI) techniques in sodium particularly (opaqueness), thermal hydraulics and structural mechanics. These apart, to meet the requirements of commercial deployment and sustainability, the FBR and closed fuel cycle have to be designed with improved economy and enhanced safety. Among the many parameters which decide this, higher temperatures with long design life is the key issue which calls for extensive R&D in the domain of materials and mechanics. Towards improving the safety with enhanced natural heat removal capability, pool-type concept is generally adopted in which the entire primary sodium circuit is housed within a single vessel with associated thin shell structures. The manufacturing of such thin, but large dimensioned shell structures with the possible minimum manufacturing deviations, dictated by functional requirements and seismic considerations, call for many challenging and innovative manufacturing techniques. Further, there are a few challenging technological issues such as the development of robust welding and hard-facing techniques, design and development of large diameter bearings and elastomers, etc. Even though these have been successfully resolved for the PFBR, focused R&D is being continued with enhanced thrust, ultimately to realize the potential of higher bumup (up to 200 kWd/g), higher operating temperature (up to 575°C), longer design life (60 y and above) and high capacity factor (90 % and above). Table-2 shows the comparison of the principal parameters of thermal and fast reactors.

33
Table 1:1 Comparison between typical Thermal and Fast Reactors
Parameters Thermal Neutron Reactors (PHWR)
Thermal Neutron Reactors (PWR)
ast Breeder Reactors (FBR)
Fuel Natural U02 Enriched U02 (Pu-U) 0 2
Fissile content Natural 235U (0.7 %) 235U 4-5 % 239Pu 25-30 %
Clad materialZircaloy-2 Zircaloy
20% CW 15Cr-15Ni- Mo-Ti
Coolant Heavy Water Light Water Liquid Sodium
Core outlet temp, °C 293 325 547
Core power density, W/cm3
40 100 400
Neutron energy 0.04 eV 0.06 eV > 100 keV
Burnup, MWd/t 6,700 40,000-50000 100,000
Neutron Flux (average), n/cm2/s 2 xlO14 lx lO 14 4.5xl015
Life of core (peak burnup basis) ~200 days 1100 days 540 days
Life limiting factor Core
Vessels
Fissile content Fissile content Clad and wrapperCorrosion corrosion Creep-fatigue
High neutron flux in the FBR causes high material damage due to irradiation, compared to thermal neutron reactors. Sodium, because of its opaqueness poses problems for ISI. Sodium leak is also concern for the operation and maintenance of the FBRs. However, low operating pressure in the FBR offers advantage over the thermal neutron reactors in terms structural integrity. Higher operating temperatures in the FBR yield higher thermodynamic efficiency which coupled with higher bumup leads to economic advantage.
Achievements in research on structural materials for core of FBRFast neutrons, and hence lower cross sections for fission demand an increased neutron flux (~1015 n/cm2/sec) by an order of magnitude over the thermal reactors to achieve the desired linear heat rates. The core materials are, therefore, subjected to a demanding environment of high fast neutron
flux coupled with high temperatures and high thermal gradients due to high heat transfer property of sodium to extract heat efficiently High flux of fast neutrons induce atomic displacements in the core structural materials leading to phase instabilities, void swelling, irradiation creep and perceptible large changes in the mechanical properties. These factors are interlinked, and it has been shown that void swelling depends sensitively on the evolution of the phases in austenitic stainless steels, and has the dominant influence on irradiation creep behavior, mechanical strength and ductility. Variations in chemical composition and microstructure influence void swelling and irradiation creep. Thus, the solution to this mega challenge is the judicious choice of composition and tailoring of microstructures.
Void swelling, irradiation creep and irradiation

34
embrittlement arising out of fast neutron exposure of the core structural materials are important features that determine the residence time of the fuel elements in the core of the FBRs. For economic viability, the target bumup required for the FBRs are more than 20 atom % of heavy metal (200,000 MWd/t), and this can be achieved only by the availability of materials resistant to void swelling, irradiation creep and irradiation embrittlement, as well as by satisfying the high temperature mechanical properties. Since the fuel cycle cost is strongly linked with burnup, selection of materials resistant to void swelling and irradiation creep is an important research endeavour.
The structural materials for the fast reactor core components have evolved continuously over the years, resulting in substantial improvement in the fuel performance. The first generation materials belonged to austenitic stainless steel type SS 304 and 316 grades. These steels quickly reached their limits because of unacceptable swelling at doses higher than about 50 displacements per atom (dpa). The term dpa is conventionally used by the FBR experts for quantifying the effects of irradiation on structural materials in terms of the average number of displacements that each atom undergoes, which indirectly means the amount of vacancies / interstitials created under irradiation. One dpa is approximately equal to the cumulative neutron dose of 3xl021 neutrons/cm2. Many im provem ents were made by changing percentage of major and minor elements and by m odification o f the m icrostructures by introducing cold work. This has led to the development of advanced core structural materials such as alloy D9 for which the incubation dose for swelling is improved compared to 316 S S.
For doses above 120 dpa, austenitic stainless steels are not employed, as void swelling is found to be substantial. Though ferritic/martensitic steels, such as modified 9Cr-lMo and Sandvik HT9 exhibit higher void swelling resistance than conventionally used austenitic stainless steels. These alloys display poor thermal creep strengths at temperatures above 923 K. This has led to
restriction in achieving high bumup of fuel with clad operating at temperatures in the range of870- 970 K which has lesser safety margins to ensure near zero failure. However, oxide dispersion strengthening (ODS) is a promising means of e x te n d in g th e c re e p r e s i s t a n c e o f ferritic/martensitic steels beyond 973 K without sacrificing the inherent advantages of high thermal conductivity and low swelling of ferritic- m artensitic steels. The y ittria dispersed ferritic/martensitic steels have emerged as choice candidate alloys. Finely dispersed yittria oxide particles improve high temperature creep strength by hindering mobile dislocations and also retard irradiation swelling by acting as trapping sites for point defects induced by irradiation. The addition of a small amount of titanium has been found to be very effective in reducing the size of oxide particles to 2-3 nm, with associated reduction in interparticle spacing that significantly improves creep rupture strength.
Currently, 9Cr-ODS steel with composition of 9Cr-0.12C-2W-0.2Ti-0.37Y20 3 has received international consideration. Clad tubes (OD-8.5 mm with 0.5 mm wall thickness) of this composition has crossed test period of -25,000 h without failure under creep test conditions of 105 MPa hoop stress at 973 K. There is also a need to explore nano dispersed austenitic stainless alloys and make the choice based on performance evolved over the entire fuel cycle considerations.
Creep properties of austenitic stainless steelsIt has been seen that creep rupture strength of alloy D9 is better than that of 316 SS by afactor of four at 923 K, by a factor of about six at 973 K and by about a factor of ten at 1023 K. The improvement in strength is found to be the consequence of prolonged secondary creep stage exhibited by Alloy D9. Austenitic stainless steels derive their strength from solid solution strengthening and from carbide precipitation in the matrix. In the case of 316 SS, fine M23C6type of carbides is known to form at 873 K. At 973 K and above, coarsening of carbides take place enabling recovery, and thus decreasing the efficiency of precipitation strengthening. In Alloy D9, carbon is partitioned between matrix titanium

35
and other alloying elements like chromium. The fine secondary titanium carbides form predominantly in the matrix impart higher creep rupture strength and void swelling resistance to alloy D9.
Improving creep properties of Alloy D9
The TiC forms as fine scale precipitates in Alloy D9 when appropriate therm om echanical treatments are made. It has been seen that fine precipitates play a crucial role in delaying the
onset of void swelling in fast reactors (Fig.9a). The microstructural stability of these precipitates is a key issue in the performance of the material in the fast reactor. The basis of this microstructural stability lies in part in the orientation relationship (OR) of the precipitates with austenite matrix (F ig .9b ). The fine scale p rec ip ita tio n characteristics of titanium carbides in alloy D9 has been investigated by lattice imaging techniques for studying the lattice strain around the fine precipitates.
Fig.9 Improving alloy D9 creep properties
Significant efforts have been made for indigenous development of Alloy D9; a 15Cr-15Ni-Ti modified austenitic stainless steel, and its eventual fulfillment of all the requirements of design engineer, including the issues concerning metal joining and component qualification. An extensive research on thermophysical and mechanical properties characterisation has been pursued as a part of this indigenous Alloy D9 development effort. IGC AR is now in possession of a reliable D9 technology. Study of radiation damage up to high doses of about -150 dpa would require three to four years in a nuclear reactor. In contrast, a few hours in a charged particle accelerator can effectivbely simulate some crucial aspects of neutron damage. A 1.7 MeV Tandetron accelerator is employed for inducing ion irradiation damage in alloy D9. The presence
of nanometer-sized coherent TiC precipitates embedded in the austenite matrix serves as sink to radiation generated point defects, and thus leads to an enhancement swelling resistance. The effect of Ti/C ratio on void swelling behaviour as a function of temperature is depicted in Fig. 10. The void swelling was measured by heavy ion irradiation of 30 appm helium pre-implanted samples using a damage rate of 7 x 10'3 dpa/s. On increasing the titanium content, void swelling was reduced and the peak swelling temperature shifted to lower values. The existence of fine TiC leads to a measurable increase in positron lifetime, which, after calibration can be used for optimizing the Ti/C ratio in alloy D9. Studies on many variants of Alloy D9 with different titanium contents have indicated that the alloy with Ti/C =6 in 20% cold worked state possess the optimum
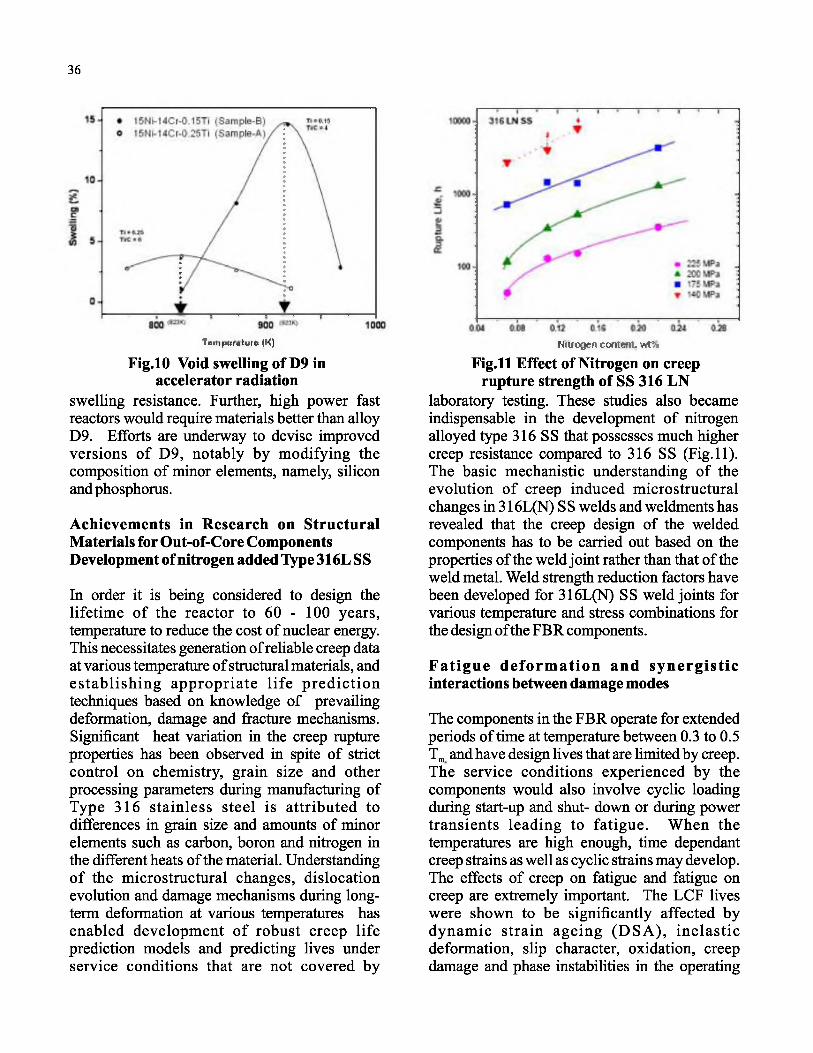
36
THFfipftfitMre (KJFig.lO Void swelling of D9 in
accelerator radiationswelling resistance. Further, high power fast reactors would require materials better than alloy D9. Efforts are underway to devise improved versions of D9, notably by modifying the composition of minor elements, namely, silicon and phosphorus.
Achievements in Research on Structural Materials for Out-of-Core Components Development of nitrogen added Type 316L SS
In order it is being considered to design the lifetime of the reactor to 60 - 100 years, temperature to reduce the cost of nuclear energy. This necessitates generation of reliable creep data at various temperature of structural materials, and establishing appropriate life prediction techniques based on laiowledge of prevailing deformation, damage and fracture mechanisms. Significant heat variation in the creep rupture properties has been observed in spite of strict control on chemistry, grain size and other processing parameters during manufacturing of Type 316 stainless steel is attributed to differences in grain size and amounts of minor elements such as carbon, boron and nitrogen in the different heats of the material. Understanding of the micro structural changes, dislocation evolution and damage mechanisms during longterm deformation at various temperatures has enabled development of robust creep life prediction models and predicting lives under service conditions that are not covered by
HiifOQen content. wPi
Fig.ll Effect of Nitrogen on creep rupture strength of SS 316 LN
laboratory testing. These studies also became indispensable in the development of nitrogen alloyed type 316 SS that possesses much higher creep resistance compared to 316 SS (Fig.ll). The basic mechanistic understanding of the evolution of creep induced micro structural changes in 316L(N) SS welds and weldments has revealed that the creep design of the welded components has to be carried out based on the properties of the weld joint rather than that of the weld metal. Weld strength reduction factors have been developed for 316L(N) SS weld joints for various temperature and stress combinations for the design of the FBR components.
Fatigue deform ation and synergistic interactions between damage modes
The components in the FBR operate for extended periods of time at temperature between 0.3 to 0.5 Tm and have design lives that are limited by creep. The service conditions experienced by the components would also involve cyclic loading during start-up and shut- down or during power transients leading to fatigue. When the temperatures are high enough, time dependant creep strains as well as cyclic strains may develop. The effects of creep on fatigue and fatigue on creep are extremely important. The LCF lives were shown to be significantly affected by dynamic strain ageing (DSA), inelastic deformation, slip character, oxidation, creep damage and phase instabilities in the operating

37
temperature range of these steels. These time dependant mechanisms have been found to act either independently or synergistically depending on the test conditions and can lead to premature failure when compared with fatigue failure under time independent conditions. DSA has been
noticed to be particularly harmful in austenitic stain less steels at m oderately elevated temperatures where creep and oxidation damage effects are not present. The negative strain rate sensitivity of half-life cyclic stress is established as potent indicator of DSA in fatigue (Fig. 12).
Fig.12 Effect of strain rate on low cycle fatigue behaviour of SS 316 LN
Thermo-mechanical fatigue of SS 316L (N)Steels used in fast breeder reactors are often subj ected to steady mechanical loading that takes place in combination with cyclic temperature variations evaluation of thermo mechanical fatigue (TMF) provides a challenge to the experimentalists since there is a need to ensure simultaneous control of temperature and strain waveforms, and minimization of temperature gradients to enable the uniform stress and strain fields in the gauge length of the test specimen. Detailed investigations under in-phase where IP: peak strain and peak temperature in TMF cycle coincide and out-of-phase OP: peak strain and minimum temperature in TMF cycle coincide have been conducted on 316 LN stainless steel by employing the temperature cycles consisting of (a) an identical temperature range with increasing peak temperature (573-823,623-873 and 673-923 K) and (b) a constant peak temperature with increasing temperature range (673-1073, 623- 873, 673-923, 573-923 K). These tests have
provided better insight to the thermomechanical behaviour, particularly effects of creep, compressive and tensile stresses and dynamic strain on ageing during cyclic loadings.
Improving type IV cracking resistance of ferritic steelsFerritic and ferritic-martensitic steel weld joints experience premature failure in the heat affected zones (HAZ). Extensive analysis of creep deformation and fracture has been conducted on the base, weld and weldments and on the simulated HAZ structures of 2.25Cr-lMo, 9Cr- lMo and Mod. 9Cr-lMo steels with a view to optimize the performance of the weldments. In Mod. 9Cr-lMo, creep rupture lives of weld joints were found to be significantly inferior compared to those the base metal (Fig. 13 a). The failure location changed from base metal to intercritical HAZ with increase in test temperature and decrease in applied stress. The type IV cracking in intercritical HAZ weld joint (Fig.13 b) occurred
10* 10* 10'* IQ* 10'*5 T i t A I N i f A T E / ■"*
3 1 # L ( N ) @ @
S i x a i n A m p l i l y d &
■ P33K -------$73 K

38
as a result of preferential accumulation of creep strain with associated creep cavitation. Poor creep strength of weld joints has been attributed to the microstructural degradation in this region. These studies have enabled the development of suitable welding process and boron added Mod. 9Cr-lMo
steel for improving type IV cracking resistance. Microalloying with boron not only retards the coarsening rate of M23C6by replacing some of its carbon but also significantly alters the microstructure of fine as well as coarse grain heat affected zones.
Boron content (PPM)
a : Rupture life of modi. 9Cr-lMo base metal and weld joint b : Type IV cracking in Weld JointFig.13 Type IV cracking resistance in ferritic steel
Effect of sodium on mechanical behaviour of austenitic stainless steelsTo study the mechanical behaviour of reactor
materials in sodium environment, unique insodium testing facilities have been constructed and are in operation. The results from these tests certify the performance of indigenous materials for use in sodium cooled fast spectrum reactor programme. The results also indicate that insodium fatigue and creep properties are lower than those in air, enhancing the suitability and performance of components in sodium. In PFBR, there are many components with mating surfaces which are in static contact with each other for long duration or in relative motion in flowing sodium environment. Wear and friction data for some of these material combinations in flowing sodium has been generated using indigenously developed reciprocating type tribometer installed in one of the sodium loops. The material combinations so far tested include 316LN against 316LN, 316LN against NiCr-B hardfaced deposit, NiCr-B against NiCr-B, NiCr-B against Cr plating and aged alloy D9 against itself. Mating surfaces of these
material combinations are encountered in various reactor components like grid plate, diverse safety rod drive mechanism (DSRDM), control and safety rod drive mechanism (CSRDM), fuel subassemblies etc. The testing parameters were chosen to simulate the reactor operating conditions for these components. A facility for evaluating the susceptibility for self-welding has been set up, where the mating surfaces were kept in contact under stress in flowing sodium. Detailed investigations of self / welding behaviour of various steels with different surface treatments have been evaluated using this facility, which have provided valuable design inputs. In general, friction coefficient is high for austenitic stainless steel against itself, without any hard coating. The static friction coefficient is typically in the range of 0.2-0.7, and it is found to increase with increase of applied stress. In contrast, the material combinations in which at least one of the mating surfaces is hardfaced have much lower coefficient of friction, with s typically below 0.1. Wear loss or damage in these m aterial combinations were minimal.
39
Life prediction of PFBR materials by Artificial Neural Network approachLow cycle fatigue (LCF) and creep-fatigue interaction data generated in house on 316L(N) stainless steel was used to assess the capability of Artificial Neural Network (ANN) approach for life prediction. This approach gave the values very close to the actual lives. These investigations have revealed that the success and accuracy of prediction depend upon (i) quality of data, (ii) extent of coverage of training data in the domain of prediction, (iii) selection of appropriate input variables, (iv) transformation of input variables and (v) optim ization of neural network parameters. Low cycle fatigue properties of nitrogen-alloyed 316L stainless steel (SS) has been studied at various temperatures between room temperature and 873 K. The neural network model could predict fatigue life within a factor of2.0 of the experimental values over the whole range of test temperatures and nitrogen content. The model has been expanded to develop a unified model to predict fatigue life of 316 SS grade of stainless steel with and without nitrogen, with normal, and low carbon contents.
Indigenous Development of Alloys for FBRProgrammeCore materialsThe indigenous development of alloy D9 started with a large number of laboratory optimizing melting, casting, forging and heat treatment conditions. Based on the laboratory studies, commercial heats were made at MIDHANI. Using these ingots, clad and wrapper tubes were successfu lly produced. The processing technology has been fully developed to produce the estimated 50,000 fuel clad tubes of 2.7 metre long and 0.45 mm wall thickness required for PFBR. Whereas alloy D9 will be used for the initial core of PFBR, efforts are underway to develop modified grades of D9 with higher silicon and phosphorus contents, called D9I for clad tubes, for future cores of PFBR and FBRs.
Out-of-core materialsStructural components of FBTR have been made using nuclear grades of 304 and 316 SS. In order to reduce susceptibility of welds to corrosion and
stress corrosion cracking, low carbon grades of 304 and 316 S S strengthened by nitrogen alloying called 304L(N) and 316L(N) SS, have been selected for PFBR. Another strategy has been to eliminate the number of welds by using large size plates and long size tubes. 316L(N) and 304L(N) SS plates currently produced in the country are much smaller in dimensions than what is required for PFBR. However, it was realised that facilities do exist in SAIL steel plants that could be combined to produce these materials in the required dimensions. Materials were, therefore, melted in one plant and transported to another where these were rolled into plates. Development of these plates required augmentation of facilities for heat treatment and final finishing which did not exist at SAIL plants. Some industries in the private sector, in the vicinity of integrated steel plants, were also included for effective and economical production of these plates. As a result, it is now possible to produce all plates in sizes required for 304L(N) and 316(L)N SS within the country for the first time. Their evaluation has given promising and even better results as compared to the imported materials.
Oxide Dispersion Strengthened (ODS) alloysDevelopment of the long-life fuel cladding is one of the key technologies to reach an economical stage of the fast breeder reactor as this development is instrumental for minimizing the fuel cycle cost. ODS alloys have been developed by high-energy ball milling of pre-alloyed powders together with dispersoid particles, followed by consolidation and thermomechanical processing. It has been observed that during mechanical alloying by high energy ball milling, yttria decomposes and dissolves in the metal matrix. Following annealing at >1373K, extremely fine and stable Y-Ti-0 particles (Alpha- Y2Ti2Os) precipitate in the m atrix. The microstructure and particle distribution in indigenously developed Fe-9Cr-0.11C-2W- 0.2Ti-0.35Y20 3 ferritic-martensitic ODS alloy is depicted in F ig .14. The rea liza tion o f development of ODS steels has been possible due to the excellent synergy established among IGCAR, DMRL, NFC, MIDHANI and ARCI Hyderabad.

40
Fig.14 Microstructure of Indigenous ODS Alloy
Sensors' Science and TechnologySensors have been developed for measuring ultra trace levels of dissolved hydrogen, carbon and oxygen contents in liquid sodium, in addition to monitoring the level, flow velocity etc. in sodium circuits. Detection of a steam leak in the steam generator of the fast reactor is needed to avoid escalation and propagation of the leak which could result in large maintenance issues. Based on detailed properties on thermochemical and electrochemical investigations of the candidate hydride ion conducting electrolyte systems, a very sensitive electrochemical hydrogen sensor has been developed for detection of the steam leak. This sensor operating at 723 K uses CaBr2- CaHBr as solid electrolyte and can measure down to 50 ppb of hydrogen in sodium with capability to detect a change in hydrogen level of 15 ppb at this concentration level. Tests in FBTR and also in large experimental sodium loops for studying its long term performance have shown the sensor to be stable and reliable with short response times, unaffected by process parameters. The sensor and the measurement instrumentation are simple, cost effective and need low maintenance in contrast to the existing leak detection technology using high vacuum and mass spectrometry. For detecting the steam leaks during the start-up or low power operating conditions of the reactor, a sensor system that measures continuously hydrogen levels in argon cover gas has been developed. This
uses a long thin-walled nickel tube in the form of a coil which is positioned in the cover gas plenum and maintained at 773 K, and through which high purity argon is made to flow. The hydrogen diffusing through the nickel coil into the argon stream is measured by a thermal conductivity detector and a sensor using thin film of tin oxide. This system has the capability to measure from a few to several thousands of ppm of hydrogen in the cover gas. An electrochemical carbon sensor for measuring of dissolved carbon in sodium has also been developed for continuous monitoring of carbon at ppm level in sodium and to detect any hydrocarbon oil leak from the shaft cooling assembly of the centrifugal pumps used in sodium circuits. On-line monitoring of dissolved oxygen in sodium is needed since high oxygen levels would result in enhanced corrosion and mass transfer of the structural steels in the sodium circuit. A sensor using oxide ion conducting yttria doped thoria (YDT) ceramic is being developed for meeting this requirement. The electroceramic of the sensor is in the form of a small thimble prepared by isostatic pressing followed by sintering. By adopting a novel combustion synthesis, nano powders of yttria doped thoria were prepared. By using zinc oxide as the sintering aid, the green compacts of the electrolyte could be sintered at 1123 K itself compared to temperatures above 2273 K reported in literature. This process avoided grain growth in

41
the sintered product, thus increasing the mechanical strength of the electroceramic component. India leads the world in development of specific sensors for sodium application in liquid metal, fast reactors and other allied technologies.
Ferrofluid science and technologyA colloidal force microscope, for in-situ
measurement of very weak forces (10'13N to 10' nN) between individual colloidal ferromagnetic particles has been developed. Using this force microscope, stretching and collapse of polymer in association with surfactant interaction has been studied. With the in-depth understanding of interaction at molecular level, a new process for stabilizing colloidal systems having many advantages over the existing stabilization techniques such as steric or electro-steric has been developed. These basic studies on stability of ferrofluids has led to devising optical technique for detection of defects in ferromagnetic materials, tunable optical filters and mechanical seals using ferrofluids.
A novel optical technique for the detection of defects in ferromagnetic materials, using ferrofluid emulsion has been developed. In this innovation, the colour changing property of the emulsion under magnetic field has been exploited for the detection of defects. The technique has high sensitivity and reliability. The colour change takes place due to property of the ferrofluid, which is used for fluid-based magnetic flux leakage (MFL) detector. The technique is based on robust physics, simple instrumentation, and is thus unique and rugged.
A new tunable light filter, using monodispersed magnetic emulsions, has been successfully developed. The filter comprises of ferrofluid- based emulsion cell, a miniature solenoid and a variable direct current source for changing the magnetic field. It is suitable for selecting wavelengths in the ultraviolet, visible and infrared regions. The unique feature of this filter is that the center wavelength, the bandwidth and the intensity of the transmitted or reflected light can be tuned precisely by controlling the applied
magnetic field with a suitably tailored ferrofluid. It is simple to operate and less expensive compared to the existing optical filters.
A ferrofluid-based seal consisting of ferrofluid, a permanent magnet, two pole pieces and a m agnetically perm eable shaft has been assembled. The magnetic structure, consisting of stationary pole pieces and rotating shaft concentrates magnetic flux in the radial gap under each pole. When ferrofluid is introduced into the radial gap, it assumes the shape of a "liquid O- ring" and produces a hermetic seal. The seal designed and developed on this principle has been tested on a rotating shafl-pole piece assembly where the shaft speed is varied from 0 to 3000 rpm. Even with a radial gap of 1mm between the shaft and the pole-piece, the performance of the seal is found to be excellent, with almost negligible leakage over a long period.
Challenges and achievements in designApart from excellent heat transfer properties, the use of sodium results in large margin between the operating temperature and the boiling point of the coolant. Hence, there is no need to pressurize the system, and all the disadvantages associated with the unforeseen depressurisation of the coolant are absent in FBR. High thermal conductivity, low viscosity and large difference between the hot sodium and the air coupled with significant variation of sodium density with temperature permit removal of decay heat through natural convection modes. It also provides high thermal inertia, and hence, more time for the operator to act in case of exigencies without fear of any temperature rise exceeding the acceptable limits.
Sodium has, however, certain disadvantages. It introduces challenging issues of thermal hydraulics and structural mechanics. High thermal stresses and thermal shocks are induced on the adjoining metal wall, and the temperature fluctuations on the metal are also to be considered due to sodium , free level fluctuations. Temperature fluctuations are created on the metal wall due to a special phenomenon called thermal striping which is caused by to lack of perfect m ixing o f sodium stream s at d ifferen t

42
temperatures, particularly in the sodium piping. The stainless steel parts when subjected to temperature fluctuations are subjected to high- cycle fatigue damages. Seismic behaviour of interconnected buildings resting on the common base raft as well as seismic responses of thin walled vessels, pumps and absorber rod mechanisms call for complex numerical and experimental simulation studies. Addressing these failure modes comprehensively (Fig. 15), in the design of components for long reliable operation at ~ 823 K for a design life of over 40 years is a challenge of high order to fabricate reliable FBRs.
S h i*1 B W ill i iQ q! EnflMon AzftnuChiirHIM|»l JlUI-B■arjchem
B u c k in g
Fluid E lu i c
InrtdWiy Flow n d u r r t '■ 'inra^on
U m tar
TTmrmal S tr ip in g
1 dLCkJIrn]
Fig. 15 Failure modes for structural mechanisms
The complicated structural mechanics issues that are depicted in Fig. 15, have been successfully resolved through extensive numerical simulations with detailed experimental investigations. Peer reviews by national and international expert teams, science-based R&D output derived from in-house efforts as well as collaborative projects established through synergy among DAE, academic institutions, R&D establishments and industries, has added to the high confidence on the design of FBRs In the following paragraphs, a few typical challenging tests performed to qualify the design are presented.
Qualification of Fuel Pin End Plug Weld
The fuel pin end plug is welded after inserting the
CLAD TU BE —OD 5.1 x 0.37 THK.
05.1
VEND PLUG
All dimensions are in mm
Fig. 16 End plug weld jointfuel pellets in the cladding tube. A schematic typical weld configuration is shown in Fig. 16 along with important dimensions. The end plug welding is a challenging task, and some defects in the form of pockets are unavoidable in the practical situations. Since the fuel pin clad is one of the critical elements the core sub-assembly, the weld configuration needs to be qualified thoroughly to ensure reliable operation without any failure so that this will not restrict the maximum achievable bumup in the reactor. Creep damage is the governing failure mode for this weld, and hence, it is simulated experimentally on a few practically achieved end plug welds. The temperature in the region of the end plug is 823 K under steady state condition. The fission gas pressure accumulated at the end of 200 GWd/t bumup can be 12 MPa (maximum). The clad material is 20 % cold-worked 316M, used for FBTR fuel pins.
Fuel pins with an end plug weld were tested at 973 K under an internal pressure of 20 MPa to account for possible uncertainties in the fission gas release phenomenon. A leak in the pin is the indication of failure, which is detected by a fall in the steady state pressure in the chamber. Six pins were tested and leaks occurred after 1104 h (min) and 1188 h (max). The observed cracks were investigated by image analysis. The creep life of end plug is determined by finite element analysis in conjunction with French design code RCC-MR: edition 2002 and the predicted life is

43
Con'rolling stress - MPa
Fig. 17aeq distributions to identify critical location
1050 h, which compares well with the test results (1104 h- m in im u m and 1188 h-maximum). From the longitudinal and hoop stress distributions, the distribution equivalent stress (aeq) that governs the creep rupture is derived. From this distribution, the location of crack initiation is predicted as ~1.5 mm below the weld junction as shown in Fig. 17, which is close to the observed crack location.
The permissible creep life of the end plug at 823 K has been extrapolated from the experimental data (lowest creep life is 1104 h at 973 K) using the Larson Miller Parameter: T(20+log.tr). The allowable life is worked out as 1.6xl06 h (182 y). This is longer than the target life for the sub- assembly, even after accounting for possible life reductions under irradiation and fission gas environment at this location. Thus, the fuel pin life will be limited by the accumulated neutron dose with burnup and the end plug weld will not impose any restriction on achievable burnup. Further, the investigation confirms the quality of end plug weld configuration manufactured for the reactor application.
The procedure adopted for the creep damage estimation, which is based on the d approach, is validated by predicting the creep crack initiation life of pre-cracked standard CT specimens machined from welded austenitic stainless steel plates, subjected to constant axial loading. The analysis indicates that the procedure predicts the experimental creep initiation life-closely (Fig. 18).
Fig.18 Time to predict creep crack growth of 1 mm in two CT specimens
Acceptable End Plug Weld Repairs for PFBR Fuel PinsA few fuel pin end plug welds with no repair, 3 repairs and 4 repairs were selected and tested at 973 K to accelerate the damage under an internal pressure of 20 MPa The application of correct pressure is ensured by measuring the hoop and the longitudinal strains in the vicinity of end plug welds for a few typical pins. The life of fuel pin in the reactor is 2 y. The permissible cumulative creep damage under maximum fission gas pressure (12 MPa) at temperature of 833 K is 0.25. Under actual environment with the presence of spent fuel and fission gas, it is reported that creep damage is accelerated, which is due to a factor called 'fuel adjacency factor'. The pessimistic value reported for this effect is 10. This implies that the allowable creep damage without considering the fuel adjacency effect (W) should be limited to 0.025. Minimum rupture life required for the weld is derived from the definition of creep damage by time fraction rule: W = t / tr, where t is the actual duration of operation (2 y) and tr is the minimum time to rupture under the imposed stress and temperature. Accordingly, tr, the minimum rupture life to be demonstrated by tests under similar conditions is2 / 0.025, equal to 80 y.
Accelerated creep tests were conducted at higher

44
temperature of 973 K. As per Larson-Miller Parameter (LMP), defined as: T(20+log tr), the minimum rupture time of 5.6 d should be ensured. The rupture lives measured for the various test cases indicate that the minimum rupture time required (5.6 d) are ensured even for the welds with 4 repairs. In view of a limited number of tests that have been completed, it is recommended to restrict the weld repair to two only at the present stage of manufacturing and continue with more work for better understanding of end plug failures with controlled repairs.
BO -
■ _|Q 4 H-s jff ifcn uan fin an w a ll tu rf-ac*
* 30 ■ ____ ___ ______________________________
JO ■ID ■
0 ------------------------ 1----------------------- 1-----------------------------------------------T----------------------- ■
a.O 0.2 DL4 (1.6 0.B 1_D
Fig.19 Permissible thermal striping limits for FBR
Establishing Thermal Striping LimitsThermal striping is attributed to random temperature fluctuations on the metal surface caused by instability of two adjacent fluid jets of different temperatures impinging on the metal surface. A computer code, solving the governing differential equations for transient temperature fluctuations both in fluid and structure simultaneously, is used to quantify thermal striping on the metal walls (Fig.19), which have prior creep-fatigue damage. Application of random analysis approach and quantification of temperature attenuation of high frequency components have helped to recommend higher temperature range (75 K for locations where creep-fatigue damage is insignificant) for future reactors.
Pool thermal hydraulics analysis of reactor assembly of PFBR, has been carried out based on
Fig. 20 Thermal striping zones in sodium pools
Direct Numerical Simulation (DNS) formulation. Fig.20 shows the summary of thermal hydraulics analysis, which indicates the temperature fluctuations in the reactor assembly components, due to thermal striping. It has been ensured that these temperature fluctuations are well below the respective permissible values (ATp).
Experimental Simulation of Thermal Ratcheting in Thin ShellsThermal ratcheting is the failure mode caused by high strains, accumulated progressively in large thin walled shell structures near sodium free levels due to level variation of axial temperature and stress gradients. The strains accumulated within a few cycles (-20) can reach the allowable ductility limit of the material. In view of complex thermo-mechanical deformation behaviour that is associated w ith ratcheting m echanism , experiments were conducted to simulate ratcheting on 1/30111 scaled down model of PFBR main vessel. The experimental setup involves complex features to introduce very sharp and moving axial temperature gradients along the shell. The temperature field measured on a main vessel mockup by thermal imaging techniques is shown in the Fig.21. Numerical simulation of the same with Chaboche theory over-predicts ratcheting (till date no appropriate model is available internationally). Towards developing appropriate constitutive model including micro and macro aspects of thermo-mechanics, targeted experiments and analysis are in progress.

45
<SOf)TemperatureTest in progress Thermal Imaging
Fig.21 Simulation of thermal ratcheting in a thin shell
Seismic Analysis of Interconnected buildings of PFBRFBR vessels are slender, in the sense that the diameter to thickness ratio is relatively high. For the main shell structures, such as main vessel, i n n e r v e s s e l a n d th e r m a l b a f f le s , diameter/thickness ratio ranges between 500 and 800. Further, the main vessel carries ~1150 t of primary sodium mass, apart from the line load of -10001 transmitted at the junction of core support structure support shell. The vessel is supported at the top. The inner vessel and thermal baffles are separated by relatively thin annulus of liquid sodium (annulus gap-diameter ratio: W/D ~ 1/100). Another special feature of FBR is the existence of free fluid surfaces, which is the source of sloshing phenomena during normal operation as well as seismic events. These features are responsible for their lower natural frequencies (5-15 Hz) at which seismic responses would be maximum because the earthquake has high energy content in this range of frequencies. Hence, the seismic loadings play an important role in the structural design of the components. This apart, seismic design should respect specified design and safety criteria, which calls for highly challenging analyses in various aspects. It is worth mentioning that minimum wall thickness required is decided by seismic loadings in FBR. The extraction of seismic
excitations in the form of time histories are required at various component support locations, which are determined by seismic analysis of nuclear island including all the essential buildings and base raft. Towards this, a detailed finite element model of nuclear inter-connected buildings (NICB) has been generated (Fig.22), based on which seismic analysis is completed for the reactor assembly components, including fluid structure interaction to satisfy the specified seismic design criteria. Fig.23 shows the finite element model of reactor assembly.
Fig.22 Finite element model of NICB

46
Fig.23 Finite Element model of RA
Buckling of Thin VesselsSeismic event poses dynamic loadings
(shear force, bending moment and pressure distributions). Consequent to seismic event with respect to buckling of thin shells, mainly the main vessel (shear buckling of cylindrical portion and
shell buckling of dished end), inner vessel (shell bucking at the torus portion) and thermal baffle (dynamic buckling in the upper portion), have been evaluated (F ig .24). By m eans of sophisticated analysis including the effects of initial geometrical imperfections, plasticity i the presence of high thermal stress, ratcheting induced deformations and dynamic amplification / reduction under seismic loadings, it is ensured that the design has sufficient margin and the factors of safety are more than the minimum required by the design codes. It is also ensured by analysis using an in-house computer code that there is no problem of parametric instability of thin shells, induced by dynamic loadings due to coupling of vibration and buckling modes. Buckling analysis has been extensively validated through tests (Fig.25). Further, the complex nonlinear behaviour of thin shells of reactor assembly supported on reactor vault and interconnected buildings of NICB have been methodically analysed for predicting the response of various structures under seismic events and the margins established for various loading combinations.
Fig.24 Buckling of thin shells under seismic loads

47
Development of Inflatable Seals for Top Shield Structures
Test Theory Test TheoryFig.25 Validation of C AST3M computer code for buckling of thin shells of PFBR
In pool type FBRs, the top shield supports major components and the sealing against cover gas is achieved by employing various types of elastomer seals. Among these several types of seals, the important ones are the seals used to seal the annular gaps between rotatable plugs which facilitate fuel handling operation. In PFBR, and two inflatable seals along with a static back-up seal are used to seal the gap whereas in FBTR, one inflatable seal is used in combination with liquid metal seal (Fig.26).
Axially expanding inflatable seals for FBTR were developed with ethylene propylene diene M-class rubber (EPDM) in collaboration with Defence Materials and Stores Research & Development Establishment (DMSRDE), Kanpu,r and tested at specially built experimental set-up (Fig.27) at IGCAR for meeting across-seal leakage under inflated condition, permeation-leakage and frictional force under both static as well as dynamic conditions.
Fig.26 Sealing arrangement in PFBR
Further, the tests are conducted at room temperature as well as at elevated temperature (323 K & 353 K). The allowable across-seal leakage as well as permeation-leakage were set at 10'3 std. cc/s/m-length of seal and 10'2 std. cc/s/m- length of seal under static and dynamic condition, respectively. Allowable frictional force was set at lOOON/m length of seal. Seals of both uncoated as well teflon coated ones are tested and evaluated in-collaboration with Facilitation Centre for Industrial Plasma Technologies (FCIPT), Institute of Plasma Research, (Ahmedabad).
Fig.27 Inflatable seal test facility
Back-up seal which acts as secondary seal to inflatable seals during reactor operation in PFBR has been developed with fluorocarbon material in-collaboration with Hari Shankar Singhania E lastom er and Tyre R esearch Institu te (HASETRI), Rajasthan and tested in a dedicated test facility (Fig.28), for allowable leakage (10'3 std. cc/s/m-length of seal) as well as compressive force required for ensuring design leak tightness. The tests are carried out at both room temperature as well as at elevated temperature (-383 K) with design mismatch between the sealing surfaces.

48
Upper Part Lower part
CSRDM DSRDMFig.29 Testing of Prototype components
The results of both room temperature and elevated temperature tests have demonstrated that the required leak tightness can be achieved at a seal compression force of MOON per loading point which was also demonstrated through numerical analysis. In achieving the milestones, expertise available at several R&D labs, industries, institutes etc. are pooled together. Major agencies which contributed to the success are HASETRI - Rajasthan; DMSRDE - Kanpur; FCIPT, IPR- Ahmedabad; ASP Sealings - New Delhi; IIT - Delhi; IIT - Kharagpur; Polyrub-Mumbai etc.
Testing of Mechanisms in SodiumTesting of components, particularly those having moving parts such as absorber rod mechanisms, fuel handling systems in sodium and imposing the actual environment and loading conditions are essential and integral part of the technology dem onstra tion . F u ll-sca le com ponents manufactured under technology development exercises have been tested in sodium simulating reactor conditions with success (Fig.29).
Transfer Arm

49
Advanced Safety Analysis Sodium Fire StudiesThe problems related to sodium have been solved
successfully. This success has been well demonstrated by a long and reliable operation of sodium systems in the FBTR as
1.00e+009.50e-019.00e-018.50e-018.00e-017.50e-017.00e-016.50e-016.00e-015.50e-015.00e-014.50e-014.00e-013.50e-013.00e-012.50e-012.00e-011.50e-011.00e-015.00e-020.00e+00
Performance Test of Leak Collection Tray CFD simulation of sodium drainingFig.30 Experimental and numerical simulation of sodium fire in leak collection tray
well as in many test loops at IGCAR. Understanding the science behind sodium fire, sodium-concrete interactions, sodium aerosol behaviour and its effects has been well studied based on extensive numerical and experimental simulation using dedicated test facilities. Fig.30 shows the experim ental and num erical simulations of sodium fire in the leak collection trays. Based on these, sodium has been chosen confidently for the PFBR, and for the future FBRs being planned by the department.
Detailed steady-state CFD (computational fluid dynamics) calculations on sodium combustion over the sloping cover tray and hold-up vessel for various levels of sodium on -the tray have been
carried out to obtain the sodium combustion characteristics, especially the burning rate. A simplified transient model with parameters adjusted from the above CFD calculations has been developed to estimate the total un-bumt sodium in the LCT for a defined experiment. This simplified model can also estimate the hold-up vessel material temperature. Fig.31 shows typical results of a CFD calculation on LCT for one particular sodium level on the sloping cover tray and hold-up vessel. The model allows estimation of the un-bumt sodium as a function of sodium leak rates using the simplified transient model of the process in LCT. The model has been benchmarked with the experimentally evaluated un-bumt sodium for typical sodium leak rates.
n XISpC1:344
- lt*-= I M rtwe ito
\ x h M I tort
IiTemperature distribution in top plate Temperature distribution in bottom plate
Fig.31 CFD estimation of sodium combustion in leak collection trays

50
Analysis of Core Disruptive Accident (CD A)It is a very low probability event (< 10'6/r-y) that is considered as beyond design basis event in FBR. It is postulated that the loss of sodium in the nuclear core flow caused by primary sodium pump trip in association with failure of both the shutdown systems on demand is an initiating event. CDA scenarios are (i) temperature rise of fuel, clad and coolant resulting in coolant boiling, fuel meting and slumping, (ii) formation of vapourised fuel, coolant and structural materials, called core bubble at high pressure and temperature, (iii) automatic neutronic shutdown of reactor due to fuel dispersal caused by core bubble pressure and (iv) release of mechanical work by pressure energy stored in core bubble. Analysis is carried out to determine the strains in the main vessel and its internals, sodium slug impact at the top shield bottom, sodium release to reactor containment building (RCB), and finally, temperature and pressure rises in RCB which define its design loadings.
The analysis of CDA calls for sophisticated modeling for treatment of large distortions in the fluid domains, strong geometrical and material non-linearities in structures, fast transient fluid structure interaction, sodium slug impact on the top shield, shock-wave propagation, interactions between the moving interfaces of various fluids and automatic rezoning of finite element mesh. Addressing all the complexities, the computer code FUSTIN has been developed based on A rb itrary L agrangean E u lerian (A LE) formulation for fluids and convected co-ordinate formulation for structures. It has been extensively validated using international benchmark problems, viz, MANON (France), COVA (UK), CONT (UK), MARA (France) and TRIG (India) series. TRIG tests were conducted at Terminal B allistic Research Laboratory (TBRL), Chandigarh, to generate data for validation of FUSTIN code. Further tests were conducted on 11X3 scaled reactor assembly mockup to assess the structural integrity of intermediate heat exchanger and decay heat exchangers as well as to estimate sodium leak through top shield penetrations. With such extensive numerical and experimental investigations, the structural
integrity of primary containment as well as RCB is ensured with high level of confidence under CDA loadings.
Fig.32 Transient Response of the Thin Shell under simulated CDA Loading
Fig.32 shows the numerical prediction of the transient response of a typical 1/30* scaled-down model of main vessel subjected to low density explosive (LDE). The LDE charge has been specially developed which can simulate satisfactorily the rate of energy release including peak pressure using a technique of lowering the density of PETN by precipitating it in the foam, thereby reducing the charge density of PETN from ~0.8 g/cc to ~0.14 g/cc. The overall dynamic displacements are captured through 2 high-speed cameras: digital (3000 pps) and conventional (6000 pps). Sufficient strain gauges were pasted at the critical locations in the vessel. Accelerometers were placed on the top shield to understand the inertial forces. Pressure transducers were placed on the bottom of the top cover plate to measure the dynamic pressures due to slug impact.
NDE of Reactor ComponentsThe structural integrity of the reactor core and the structural components, including fuel assemblies, reactor vessels and steam generators need to be ensured through stringent quality control and periodic in-service inspections. During service, the structural integrity is affected by various m aterial degradation processes such as intergranular corrosion (IGC), stress corrosion cracking (SCC), pitting corrosion, creep and fatigue damage. It is essential to detect and evaluate the degradation of the structural materials and components in the operating plants

51
either on-line or during shutdown. Advanced ultrasonic and eddy current based NDE procedures have been developed for inspection of structural and core components of the reactor and steam generator components.
Cladding tubes housing the nuclear fuel are critical components demanding stringent quality. The tubes are inspected by both immersion ultrasonic and eddy current techniques to ensure reliable detection of various types of defects with high sensitivity. The defects expected in cladding tubes include ID defects, OD defects, isolated large inclusions, grouped fine inclusions, circumferential defects and defects in presence of variations in cold work and texture. The relative capabilities of ultrasonic and eddy current techniques for detection of these defects are shown in Table.3. The table clearly brings out the necessity for use of both the techniques for ensuring stringent quality control of the tubes. In the case of ultrasonic testing, standard test procedures are followed. In the case of eddy current testing, the required inspection
methodology and acceptance criteria have been developed for inspection of the cladding tubes of PFBR, manufactured at NFC. In view of the access from outside, encircling differential probes that produce characteristic figure-of-eight-signals for defects have been designed and developed. The detection sensitivity has been verified on calibration tubes consisting of through-holes of different diameters as well as electro-discharge machined notches. In order to detect and evaluate the depth of defects in the cladding tubes, an online testing procedure that uses artificial neural network has been developed. This uses eddy current data from two test frequencies and quantifies the defect size on-line. This procedure has been successfully applied to detect defects in the indigenously produced FBTR cladding tubes, some of which have periodic wall thickness variations of about 2%. The neural network has been trained to eliminate signals from thickness variations and probe wobble, and also, at the same time, to quantify the diameter of the reference standard holes between 100 and 1000 microns. It has been possible to detect holes of size larger than 200 microns (Fig.33).
Fig.33 Neural network application in eddy current testing of clad tubes
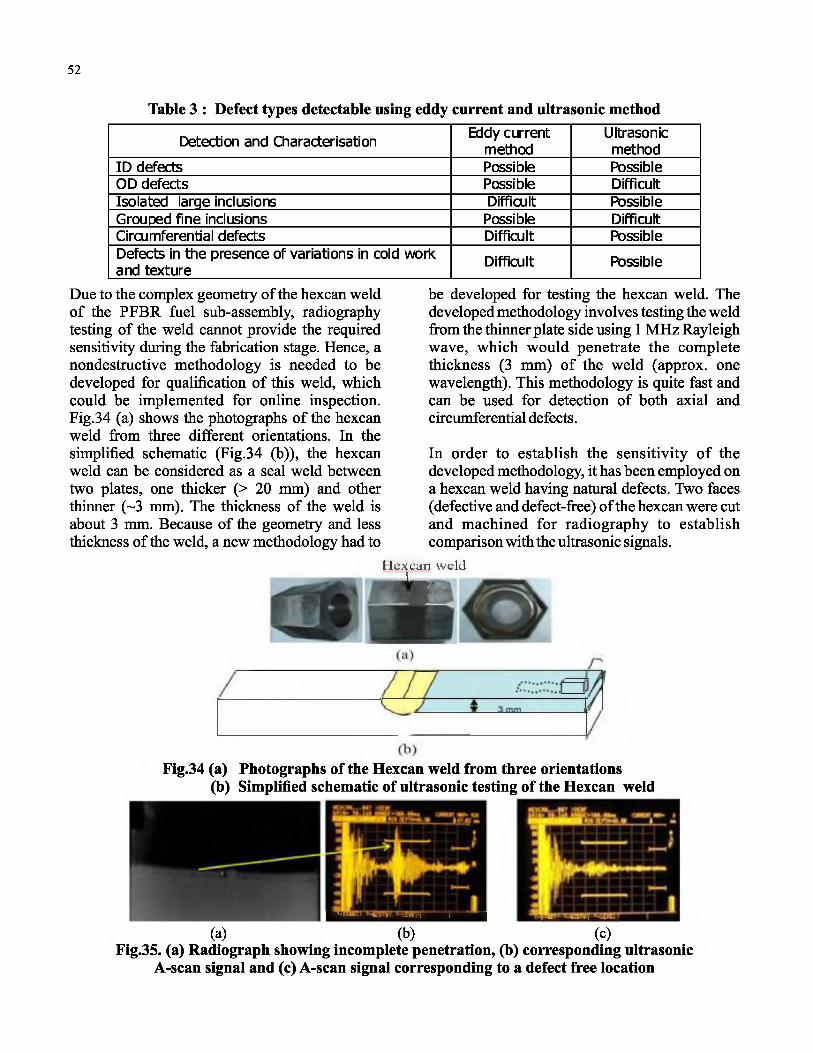
52
Table 3 : Defect types detectable using eddy current and ultrasonic method
Detection and Characterisation Eddy current method
Ultrasonicmethod
ID defects Possible PossibleOD defects Possible DifficultIsolated larqe inclusions Difficult PossibleGrouped fine inclusions Possible DifficultCircumferential defects Difficult PossibleDefects in the presence of variations in cold work and texture Difficult Possible
Due to the complex geometry of the hexcan weld of the PFBR fuel sub-assembly, radiography testing of the weld cannot provide the required sensitivity during the fabrication stage. Hence, a nondestructive methodology is needed to be developed for qualification of this weld, which could be implemented for online inspection. Fig.34 (a) shows the photographs of the hexcan weld from three different orientations. In the simplified schematic (Fig.34 (b)), the hexcan weld can be considered as a seal weld between two plates, one thicker (> 20 mm) and other thinner (~3 mm). The thickness of the weld is about 3 mm. Because of the geometry and less thickness of the weld, a new methodology had to
be developed for testing the hexcan weld. The developed methodology involves testing the weld from the thinner plate side using 1 MHz Rayleigh wave, which would penetrate the complete thickness (3 mm) of the weld (approx. one wavelength). This methodology is quite fast and can be used for detection of both axial and circumferential defects.
In order to establish the sensitivity of the developed methodology, it has been employed on a hexcan weld having natural defects. Two faces (defective and defect-free) of the hexcan were cut and machined for radiography to establish comparison with the ultrasonic signals.
Hu,vefln weld
d i
Fig.34 (a) Photographs of the Hexcan weld from three orientations(b) Simplified schematic of ultrasonic testing of the Hexcan weld
(a) (b) (c)Fig.35. (a) Radiograph showing incomplete penetration, (b) corresponding ultrasonic
A-scan signal and (c) A-scan signal corresponding to a defect free location

53
An innovative ultrasonic test methodology has been developed for in-service inspection of the shell weld of the core support structure (CSS) in the main vessel of the PFBR. The inspection of this weld immersed in sodium requires development of a special methodology because of the restricted access to the weld, curvature of the main vessel and ultrasonic beam-skewing that occurs at the K-type weld used for joining the main vessel to the support shell plate. The
support structure
developed methodology involves inspection from the outside surface of the main vessel, using normal beam ultrasonic transducer (Fig.36). The methodology involves sending the ultrasonic beam through the core support plate from the knuckle portion of the main vessel, which is about 450 mm away from the weld to be inspected. Because of the presence of curvature in the main vessel, ultrasonic beam enters the weld overlay at an angle a to the support shell structure. Further, because of the presence of columnar grains in the austenitic stainless steel weld overlay and the K weld, ultrasonic waves get skewed and enter the support shell structure at another angle P as shown in Fig.36. Beyond this point, the ultrasonic wave propagates in the support shell structure at this angle and gets reflected every time it encounters the plate surface. When the wave encounters any defect or interface in the shell plate, ultrasonic wave is reflected from the defector or interface
and is picked up by the same transducer. By changing the location of the transducer, these angles can be changed, and hence, defect at any location including in the shell weld of the core support structure can be detected.
The developed methodology has the advantage that inspection at multiple angles of ultrasonic wave propagation can be achieved just by moving a single normal beam ultrasonic transducer along the curved surface of the main vessel. Multiple angle beam inspection would ensure the detectability of defects of any orientation. This methodology has been successfully demonstrated on the main vessel sector mock-up assembly for the detection of defects down to 20 % wall thickness (~ 6 mm) on both sides of the plate. This is the first time worldwide that such a methodology has been developed for inspection of a critical weld, which was originally designed to be non-inspectable. The development has enhanced the reliability and the safety of the reactor system.
Another important development involves an automated eddy current imaging for the location of weld, e.g., in the main vessel (stainless steel) of the PFBR and determination of its centre-line for exam ination by u ltrasonic testing . The identification of weld-centre line is necessary for fixing the required skip distance and scan ranges for ultrasonic testing. In the case of austenitic stainless steel welds, the weld region with complex microstructures having delta ferrite and other phases, possess different electrical conductivity and permeability as compared to the base metal. This microstructural variation helps to identify the weld centre line under eddy current. During raster-scan imaging of welds, the weld region produces large amplitude changes in coil impedance and the grey level image and 3-D profile image give distinct information of the weld. The accuracy of detection of the weld centre-line has been found to be 0.1mm. As the inspection would be carried out at maximum of 423 K, a high-sensitive differential eddy current sensor with capability for operating at 473 K and for non-contact detection with a lift-off of 10 mm has been developed. This sensor has shown stable

54
detection performance both at room temperature and at high temperatures. This sensor would be integrated into die sensor head of an inspection robot for automated and remote inspection of main vessel.
The non-destructive condition monitoring of the steam generator tubes made of modified 9Cr~ IMo s of PFBR is very important, and it is ensured through periodic eddy current testing (ECT). ECT of ferromagnetic tubes such as SG tubes poses challenge due to high and continuously varying magnetic permeability which limits the penetration of the eddy currents and produces
continuous disturbing noise. Hence, for inspection of the steam generator tubes of PFBR, a new technique called remote field eddy current testing has been explored, and necessary instrument, sensor and software have been designed and developed, after systematic finite element modelling and validation.
The technique involves detection of the induced voltages in the range of nano volts in a receiver coil that is kept about three tube diameters away from a transmitter coil excited with alternating current at low frequencies (<1 kHz) (Fig.37). The magnetic fields after double-wall are transmission
R e m o t e 9 C r - 1 M o t u b e
Scan Distance, mm
Fig.37 Remote field eddy current set-up, typical exciter-receiver probe and signals from regions of different extents of wall thickness (WT) loss.
will be picked-up by the receiver coil whose phase lag and magnitude are directly proportional to the tube wall loss. Working on these principles, an efficient instrument with lock-in amplifier has been developed indigenously for remote field eddy current testing of ferritic steel tubes. The instrument has shown the capability for reliable detection of 10% wall loss comparable with the international state-of-the-art. For in-service inspection of the steam generator tubes of PFBR, in order to cover a length of about 23 m and the
expansion bend regions, flexible sensors have been designed and developed. Wavelet transform- based advance signal processing methods have been developed to suppress the disturbing signals from bends and other materials property variations to reliably detect and size the defects. The influence of sodium (electrically conducting) on detectability of defects in steam generator tubes has been studied systematically upon exposing the tubes to sodium environment. Suitable digital signal processing methods have

55
also been developed to suppress the disturbing influences of sodium, and thus, enabling reliable detection of the potential defects with a very high probability of detection. A special robotic device has been developed to guide the sensor into the steam generator tube and to perform automated inspection. The remote field instrument, sensor, signal processing methods and robotic device have been successfully integrated to realise an efficient and automated inspection system to meet the challenging inspection works of steam generators.
Reliable detection and sizing of defects in the steam generator tubes require that the excitation frequency is optimized and the receiver coil is positioned in remote-field zone. In this regard, a
detailed Unite element analysis has been earned out to examine the electromagnetic field-defect interactions in the RFEC technique using an axi- symmetric finite element model and a 3-D code, developed in-house. Triangular and hexahedral meshes have been employed in axi-symmetric and 3-D models, respectively, and the RFEC signals due to various types of defects have been predicted at different frequencies and inter-coil spacing. The test frequency, the excitation current and receiver coil location and its size have been optimised using the models. Fig.38 shows the predicted induced voltage in the receiver coil at different frequencies for different coil positions for frequency optimisation based on RFEC intensity and measured induced voltage at 1100 Hz for model validation.
w- 1 4 cD > a>O 1 . 2
£> 0 . 8 O)-2> 0 . 6
7 00 H z9 00 H z1 100 H z1 300 H z
— 1 500 H zM 1 100 H z E x p e r i m e n t a l
2.1 2 . 2 2 .3 2 . 4 2 .5 2 . 6
Receiver coil location, ID <12.6 mm) times
Fig.38 Induced voltage in receiver coil and Intensity of back entered remote field (inset)
The technology developed in-house has demonstrated the performance superior to that of the international state-of-the art. Using this technology along with a winch mechanism for probe handling, it is possible to reliably detect and size 10% wall thinning in the tubes. This technology has been successfully used for in- service inspection of full-scale SG test facility built at IGCAR. The development technology is a major step and an essential need for regulatory requirement for safe and reliable operation of SGs of FBRs. This technique can be readily applied to
other ferromagnetic tubes in heat exchangers, boilers and condensers for detection of defects and corrosion wall loss.
the sensitisation of austenitic stainless steels (SS) is another major problem during welding or high temperature service. Electrochemical technique, known as electrochemical potentiokinetic reactivation (EPR) technique, has been developed and standardised by ASTM (ASTM G108) to quantify the degree of sensitization (DOS). The EPR technique provides a criterion

56
to identify the complete absence of sensitization, and, thus, is useful in quality control of fabricated components. However, it does not readily provide an acceptance criteria if a certain DOS is present in the material. Despite all efforts, the EPR technique has not shown much of its early promise as a tool for quantifying degree of sensitization. This is because of (i) its high sensitiv ity to the changes in chem ical composition of the SS, and (ii) inconsistencies in the correlation between ASTM Practice A262E and EPR DOS that results due to the effects of aging temperature, which does not permit a
threshold DOS to be defined. These drawbacks in the EPR technique call for applying alternate NDT technique to unambiguously quantify the DOS. Eddy current testing (ECT) is a viable alternative due to its high sensitivity to changes in electrical conductivity and permeability. An important and potential application arising from the present study is that by knowing the EC signal amplitude for different categories of specimens, the propensity to and the extent of IGC could be assessed without subjecting the specimens to bend test (Fig.39).
ijj-Condition!.
£
■5e<■5cC/5
fjLU
0.5 -
<1.6 -
0.4 -
I I S S I 'K H M I
►♦ *
0-0 “I ........................................ .. '"I 1 I0 i n 6 (1 to 1? 14 16 IB 30 22 1*
S a m p le N u m b e r
t o-
| ‘
4 *
i .1 «■01
V) 2UHI
!Straus* TeHed Condition'R H D h > ft
c c 71exACkin 1 *1
**♦ *
**
i i s & L H H I.L l
UftAfrJuctLn t a i | t
S 1G 15 idS a m p l e N u m b e r
J 5
Fig.39 Responses to the as-aged (A) and Strauss tested specimens (B)
The impact of this would be felt during monitoring of the SS components in service by providing vital information on the initiation and progress of IGC/IGSCC. Also, ECT could be used as a reliable tool to ensure quality of fabrication against sensitisation. This would help fabricators and the users to guard against sensitisation, particularly in applications where fabrication costs are linked to the DOS. However, for this to be feasible, proper optimization of the EC test parameters, precise calibration and systematic and reliable measurements are important pre-requisites.
As discussed in earlier sections, fatigue damage is
one of the important problems for a number of high temperature components in fast reactors. A SQUID (Superconducting Quantum Interference Device) based system for NDE has been developed at IGCAR, and has been employed to characterise the delta ferrite content in 316 stainless steel weld joint specimens subjected to high temperature fatigue (Fig.40). Since SQUID has an extremely high sensitivity for magnetic flux signals, it can detect even extremely small changes in the delta ferrite content of the weld specimen. It is possible to extrapolate this information to evaluate the progress of fatigue damage, and in turn to assess the residual life of a weld undergoing fatigue damage.

57
SQUID output vs distance of the wefdment sample after magnetisation
sftUID
■f t * virgin
i t f S M ■ , L * W le jw ie1 * IQQ-cjcl-e
A * 150 o yd®
M D B i /* 200 cycle4 250 c j t le
■ia is□ s t a n c e
20
SQUID output Vs No ofcycfes of the weldment
DoL I T
s o ui a
s4 2 0
10 1S
No orcytles:o 25
Fig.40 Characterisation of a fatigue tested weld specimen using SQUID
In-Service inspection (ISI)In service inspection (ISI) is crucial to ensure the
reliable long operation of the Fast Reactor over a life span of 60 years. The design stage incorporates all aspects which make repair feasible as warranted by the ISI campaigns. The most important aspect of ISI and repair is to carry out the activies in radioactive sodium at temperature of about 473 K. ISI systems span a range of activities, namely: development of sensors and manipulators which can operate in harsh environments and high quality image processing systems, remote controlled robots to inspect the main vessel completely by traveling over the small inter-vessel space between the main vessel and the safety vessel, and finally, demonstrating the reliable operation of these devices. These are the important technological aspects in this realm. International experience has demonstrated that the reliability of steam generator has a high impact on the plant availability.
It is planned to carry out periodic inspection of the PFBR main vessel and the safety vessel during the service period. The main vessel (MV) of PFBR is 12.9 m in diameter and the safety vessel (SV) surrounds the main vessel with a nominal annular gap of300 mm ±50 mm. This annular gap is utilised for the inspection of the both vessels. The oobjective of the ISI campaign is to inspect
the critical welds on MV and the dissimilar weld between the roof slab shell and the MV of PFBR. The inspection programme is to be implemented according to ASME B and PV Code, Section XI, Div3.
A comprehensive ISI system has been conceived forthelSIofMV andSV ofPFBRbasedonafree roving four-wheeled concept. The device is a four-wheeled remote controlled mobile robotic device to carry the NDE equipment into the interspace for enabling volumetric examination the welds and visual examination of the external surface and the internal surface of the M V and the SV respectively. The MV-SV interspace will be at 423 K at the time of inspection. Designing a remotely operated robotic vehicle system capable of working at that temperature of is the critical challenge involved in this development. The vehicle will be maneuvered by means of four independently driven wheels with steering capability, two resting on each vessel. The vehicle consists of a central structure about which two orthogonal arms are articulated. The wheels that are pressing on each vessel are placed at the ends of each arm. Each wheel will have traction and steering actuators with encoders for position feedback. The vehicle has a collapsible design to facilitate insertion through the openings provided from the operating floor, into the vessel interspace. The device will be lowered into the

58
s 'IT* QftflLSGS
TI EFffiAt E-tEyJLATlON
Half vertical section of Reactor assembly
H4IN V£SS4L SifEIY '■,£:££ L
C A M E R A
V I S U A L
S Y S T E M
U T M O D U L E
3D M odel of ISIdevice ,SI D evice in expanded
condition
Fig.41 ISI vehicle - VENTURE for the inspection of MV and SVinterspace by a winch through one of the six inspection openings provided on top of the reactor vault and the anti-convection barrier. Fig.41 shows the photograph of the prototype vehicle “VENTURE” developed in collaboration with Bhabha Atomic Research Centre. Once inserted into the inter-space, the vehicle can be expanded to provide the reaction needed to maintain the device in position against gravity and the frictional force required for traction. Inherently, this gives the vehicle the capability of adapting to the geometric variations in the inter-space. The handling devices and the chambers for the ISI system, and a few accessories like cable take- up/release and mono-articulated chain have been conceptualized. The NDE modules, viz, Ultrasonic Test module (UT) and Visual Examination (VE) modules are the payloads to be carried by the VENTURE and DISH A for inspection of the MV and the SV. The prototypes of the UT module and the VE module have been developed and validated at IGC AR.
Further, a 3D virtual planning environment for the ISI has been developed in collaboration with Indian Institute of Science, Bangalore. This m odeling and s im u la tio n is aim ed at implementing a 3D environment for visualization of the motion of the ISI device in the annular inter-space.
Post Irradiation Examination (PIE)Mixed carbide fuel of high plutonium content (U03 Pu 07)C was chosen for FBTR to avoid high fissile enrichments required for the small core and to ensure the superior compatibility of carbide fuel with sodium as compared to MOX fuels with high plutonium. Since the high carbide fuel with plutonium content was expected to have a high fuel swelling rate, inputs from post-irradiation examination (PIE) were crucial to increase the bumup and linear heat rating beyond the initial design values. Post-Irradiation examination was carried out on the indigenously developed mixed carbide fuel subassemblies of FBTR in the radiometallurgy hot cells of IGCAR. PIE was carried out at different stages of bumup starting with experimental fuel pins to understand the beginning of life performance and after bumups of25,50 & 100 & 155 GWd/t. No fuel pin failure has occurred so far indicating the excellent performance of the carbide fuel. The fuel has operated at a peak linear heat rating of400 W/cm. The salient results of the PIE carried out at different bumups are highlighted below.
PIE carried out the on the experimental fuel pins has revealed that the fuel-clad gap reduces during the early stages of burnup giving enough confidence to operate the fuel at higher LHR of 320 W/cm. PIE carried out 25 GWd/t & 50

59
GWd/t has indicated that the fuel has a lower swelling rate than expected, and that Fuel Clad Mechanical Interaction (FCMI) has not initiated. Fuel swelling was getting accommodated in the sinter porosities. The fission gas release and the internal pressure were found to be nominal (< 20%). The absence of FCMI and negligible dimensional change in the structural materials have enabled increasing the fuel bumup to 100 GWd/t.
The PIE of fuel sub-assembly after 100 GWd/t and 155 GWd/t bumups has indicated significant changes in the dimensions and mechanical properties of the hexagonal wrapper and fuel pins. The dimensional measurements on the hexagonal wrapper indicated a maximum dilation of 0.65 mm at the centre of the fuel column region.
Fig.42 Volumetric swelling of clad and wrapper as a function of dpa
The fuel-clad gap was observed to have closed at the center of the fuel column indicating the onset of Fuel Clad Mechanical Interaction (FCMI) and restrained swelling of fuel beyond lOOGWd/t. Metallographic examination of 155GWd/t bumup fuel has revealed a distinct zone devoid of fuel porosities near the outer diameter of the fuel. Complete closure of the fuel-clad gap and circumferential cracking at the centre as well as at the end of the fuel column has indicated that the entire fuel column have entered the restrained swelling regime. Fig.44 shows the comparison of photo-mosaics of fuel-clad cross-sections at the centre of the fuel column at different bumups. A
Considering the initial minimum inter-sub- assembly gap of 0.7 mm, this increase can have considerable effect on the fuel handling operations. The maximum diametral strain (Ad/d) of a typical fuel pin measured after 155GWd/t is around 5 % as compared to 1.6 % estimated at lOOGWd/t. The volumetric swelling after 81 dpa (peak) corresponding to the bumup of 155 GWd/t was estimated to be around 11.5 % for the clad and around 4 % for the wrapper (Fig.42). Remote high temperature tensile tests on the irradiated clad indicated appreciable decrease in both ultimate tensile strength and uniform elongation with increasing dpa (Fig.43). The room temperature tensile properties of wrapper, however, indicated a hardening behaviour with decrease in ductility with a increasing dpa.
Fig.43 Variation of UTS of cladding with dpa
maximum gas release of 16 % and an internal pressure of 2.09 MPa in the fuel pin due to release of fission gas has been estimated for 155GWd/t fuel. The PIE results indicate a faster rate of damage in structural materials and the onset of FCMI along the entire fuel column at 155 GWd/t bumup. The thermomechanical analyses based on the PIE results indicate that the bumup could be extended marginally to 170 GWd/t. The PIE facilities and the expertise are unique in the world, and there form the foundation for development of advanced metallic fuels for the FBRs in the country.

60
25 GW d/t 50 GW d/t 100 GW d/t 154G W d/tFig.44 Comparison of ceramographs of fuel-clad cross section at various burnup
Computer System for PFBR DesignThe design of any nuclear power plant is a complex activity requiring large amount of computing power for the design and analysis. The IGCAR with a mission to design and develop fast reactor technology had equipped it-self with the required computer systems and Computer Aided Engineering (CAE) application packages from the beginning. The computer systems have a right mix of Symmetric Multi Processing Systems and Cluster Computer System. They are high performance RISC processor-based system, 8 way Xeon servers, 32 processor Itanium Cluster with high end workstations. They are supported by an advanced CAE package for linear and nonlinear finite element analysis, Computational Fluid Dynamics, 3D modeling, walkthrough etc. In addition, reactor physics and safety analysis codes written in high-level language are also executed.
These systems are supplemented with DAE computing grid having a processing power of few Tera FLOPS. The computing facilities at the Computer Division are being augmented with a 128 node Cluster Computer System with a processing power of 9 to 10 Tera FLOPS, total memory capacity of 1 Terabyte, storage capacity of more than 40 Terabytes and with a state-of-the- art Infiniband interconnect technology supporting transfer rate of 20Gbps.These high performance Computing Systems are connected to the Intranet to enable the scientists and engineers to execute their computing jobs from their desktops. These computer systems and application packages have played a key role in the indigenous design of the
Prototype Fast Breeder Reactor.
Full Scope Replica-type Operator Training SimulatorTo ensure safe operation of any nuclear power plant, comprehensive training of the operators in all states of the reactor is essential. The high operating safety and high efficiency record of the nuclear power stations in USA, UK, France, and India are largely due to the high quality training imparted to operating staff through computer based operator training simulators. It is also mandatory from the regulatory body (AERB) guidelines that all the reactor operators shall be sufficiently trained on the training simulator before they are allowed to perform the reactor operations due to safety considerations. This training on simulators is, in addition to the operation experience and experience from model facilities, test reactors, power reactors and classroom training.
A Full Scope Replica Type operator training simulator is designed and being built at IGCAR for the PFBR. The Simulator is Full Scope in the sense that all the sub-systems starting from reactor core to the turbo generator are simulated. It is a Replica type in the sense that the training simulator exactly resembles the PFBR control room in terms of no. of panels, consoles, layout, instrumentation, annunciations etc. The heart of any simulator is the modeling software. Computer simulation or modeling represents the application of the relevant mathematical models to real systems. These models are run in the exact sequence and in real time to simulate the exact

61
behavior of the plant. The models for the neutronics, primary and secondary sodium, steam water, electrical sub systems have been developed. Apowerful instructor station is part of the simulator. The simulator being a computer based system, the instructor has the flexibility to impart training to the operators in various reactor states, scenarios, malfunctions, incidents and observe the trainee's actions, reflexes. Unique features and challenges in building the PFBR
simulator are: (a) It is the first full scope simulator for a fast reactor in the world (b) The Pressurised Heavy Water Reactors (PHWR’s) are well understood, and the systems have stabilized. The PFBR being the first of its kind, the simulator is being developed concurrently along with design and construction of the reactor, and (c) the fuel handling sub-system are being simulated with animation features.
Challenges and Achievements in Technology Hard-facing of Reactor Components using Nickel Base Alloy
Ageing Time (h)
Fig.45Hardness of nickel-base hardfacing alloy with ageing
Cobalt-base alloys due to their proven performance are used for high temperature hard-facing applications. However, considerations of induced radioactivity from Co60 isotopes, nickel-base alloys have been chosen for hard-facing of the PFBR components. Room temperature hardness of these alloys is higher than that of cobalt-base alloys; but the hardness reduction at elevated temperatures is higher for these alloys than for the cobalt-base alloys. Hence, a systematic study on the variation of hardness of nickel-base alloy deposits with elevated temperature exposure was undertaken by the IGCAR. Fig. 45 gives reduction in room temperature hardness for AWS Ni-Cr-B alloy (Colmonoy-5) after ageing at different elevated temperatures for durations up to 5000 hours. From the high-temperature hardness data available on as-welded deposits and hardness data on long-term aged deposits, the high-temperature hardness of the nickel-base hard-facing alloy for different ageing durations has been estimated. The results depicted in Fig. 46 show that the hardness of these deposits at operating temperature even after 40
a 550
400
300
6 — C- 5 a t RT
■ A * -C -5 a t 400 C
- ■ *C -5 a t 550 C
O S t-6 at RT
A St-6 at 400 C
O St-6 at 550 C
-m ----------------------- 54
a
11 \\ \ ( ) 9 A \ 596
530 , , 534 <;?< 11505 - • — . -
461 46
0390
335
0 5 10 15 20 25 30
Exposure at 550 C (Years)
Fig.46 Hardness of Colmonoy-5(C-5) deposit on exposure at 823 K
years of service exposure would be higher than that of the cobalt-base alloys. The nickel-base alloy chosen for hard-facing is highly susceptible to cracking and it was required to deposit this alloy on components of very large dimensions without any cracks. As the volume of deposition increases, obtaining deposits without cracking, is a challenge and demands special technology development efforts. A team comprising designers, fabricators and metallurgists worked in synergy to realize the application. Hard-facing of the bottom plate of the grid plate assembly (a circular plate of ~6 m diameter and -60 mm thickness) is one such component in which a technology development effort was successfully implemented. The hard-facing is done on two rings on the outer side of this plate. The circumferential length of hard facing for each ring exceeds 21m. Plasma Transferred Arc (PTA) process is chosen for this application because of its ability to minimise dilution from base metal. Initial trials during technology development of this process resulted in extensive cracking of the deposit. Subsequent trials during technology development using modified
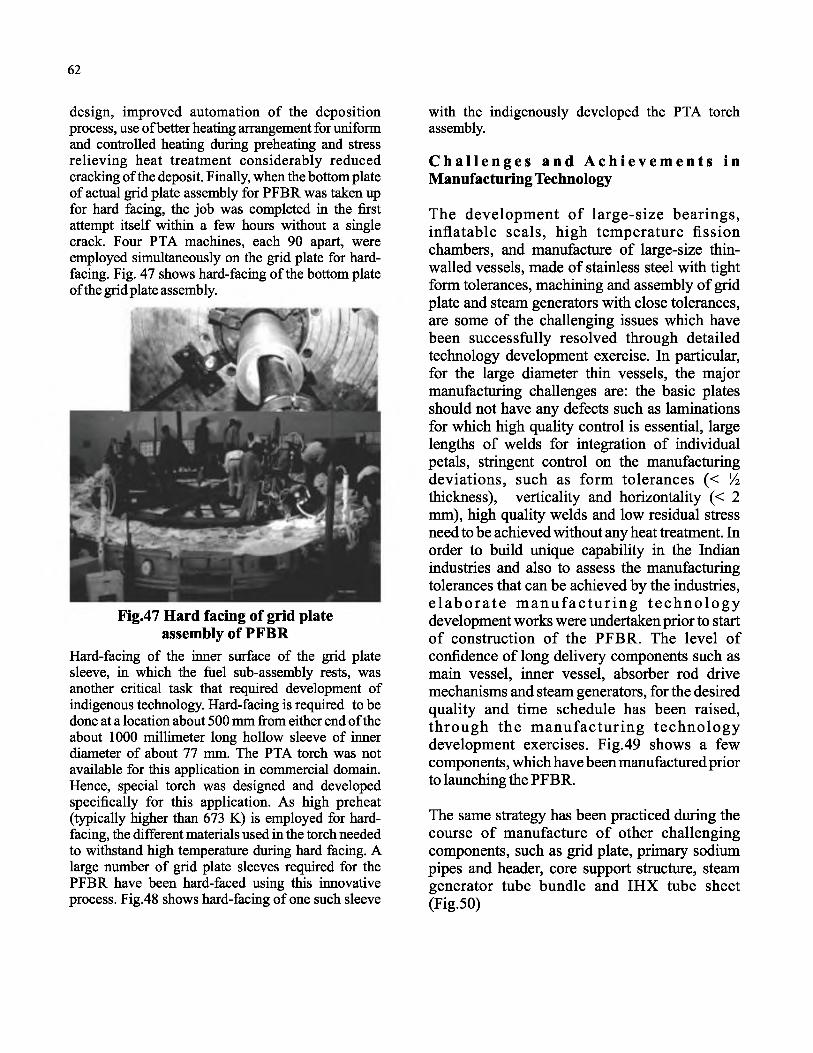
62
design, improved automation of the deposition process, use of better heating arrangement for uniform and controlled heating during preheating and stress relieving heat treatment considerably reduced cracking of the deposit. F inally, when the bottom plate of actual grid plate assembly for PFBR was taken up for hard facing, the job was completed in the first attempt itself within a few hours without a single crack. Four PTA machines, each 90 apart, were employed simultaneously on the grid plate for hard- facing. Fig. 47 shows hard-facing of the bottom plate of the grid plate assembly.
Fig.47 Hard facing of grid plate assembly of PFBR
Hard-facing of the inner surface of the grid plate sleeve, in which the fuel sub-assembly rests, was another critical task that required development of indigenous technology. Hard-facing is required to be done at a location about 500 mm from either end of the about 1000 millimeter long hollow sleeve of inner diameter of about 77 mm. The PTA torch was not available for this application in commercial domain. Hence, special torch was designed and developed specifically for this application. As high preheat (typically higher than 673 K) is employed for hard- facing, the different materials used in the torch needed to withstand high temperature during hard facing. A large number of grid plate sleeves required for the PFBR have been hard-faced using this innovative process. Fig.48 shows hard-facing of one such sleeve
with the indigenously developed the PTA torch assembly.
C h a l l e n g e s a nd A c h i e v e m e n t s in Manufacturing Technology
The development of large-size bearings, inflatable seals, high temperature fission chambers, and manufacture of large-size thin- walled vessels, made of stainless steel with tight form tolerances, machining and assembly of grid plate and steam generators with close tolerances, are some of the challenging issues which have been successfully resolved through detailed technology development exercise. In particular, for the large diameter thin vessels, the major manufacturing challenges are: the basic plates should not have any defects such as laminations for which high quality control is essential, large lengths of welds for integration of individual petals, stringent control on the manufacturing deviations, such as form tolerances (< !4 thickness), vertically and horizontality (< 2 mm), high quality welds and low residual stress need to be achieved without any heat treatment. In order to build unique capability in the Indian industries and also to assess the manufacturing tolerances that can be achieved by the industries, e la b o ra te m a n u fa c tu r in g tec h n o lo g y development works were undertaken prior to start of construction of the PFBR. The level of confidence of long delivery components such as main vessel, inner vessel, absorber rod drive mechanisms and steam generators, for the desired quality and time schedule has been raised, through the m anufacturing technology development exercises. Fig.49 shows a few components, which have been manufactured prior to launching the PFBR.
The same strategy has been practiced during the course of manufacture of other challenging components, such as grid plate, primary sodium pipes and header, core support structure, steam generator tube bundle and IHX tube sheet (Fig.50)

63
IHX T u b ttf itt l
S leam G enerator C SRDMButterflyValve
IH X T u b e to Tub# Sheet
Joint Mock up
Fig.49 Components manufactured under Technology development exercises
Challenges in ConstructionThe concept of inter-connected buildings has been adopted for nuclear island of the PFBR. The nuclear island extends over 100 m x 92 m area with tall buildings, The highest among these is the reactor containment building which is about 72 m tall. With the base raft thickness of 3.5 m, the civil construction of the nuclear island interconnected buildings (NCIB) involves pouring of 35000 m3 of concrete. Completion of the construction of the PFBR before 2010 calls for many challenging and innovative ideas to be implemented, both in the construction and management policies. It is required to carry out civil construction and equipment erection simultaneously which involves the-sate-of-art erection equipments and construction m ethodologies, and highly optimised construction sequences. The erection
Fig.50 P F B R components under manufacture
of large dim ensioned and slender FBR components w ith stringent dim ensional accuracies (a typical tolerance to be achieved on horizontality over 15 m is less than 1 mm) is a typical challenging task to be completed for the first time in the country. Transportation of thin shell structures from the site assembly to the final locations is another challenging activity in the construction. With systematically planned mock- up trials, confidence to erect components with the specified - tolerances has been achieved. The confidence has been demonstrated through successful erection of the safety vessel in June 2008 (Fig.51), and other components are being erected sequentially. Details of erection and sequencing have been finalized after a comprehensive analytical and virtual simulation studies.
Fig.51 Successful erection of safety vessel on the inner wall of reactor vault

64
Cost Reduction StrategyIt is planned to construct 4 units of 500 MWe capacity beyond the PFBR by 2020. The total envisaged programme of the fast breeders with recycle strategies is more than 500 GW(e). The capital cost is the deciding factor in economy. This apart, fuel cycle cost reduction is also a s ig n if ic a n t f a c to r in a c h ie v in g th e competitiveness of the FBR. A systematic road
map has been made for the cost reduction for the next four FBRs through a number of measures. These include twin unit design, introduction of further innovations, enhanced design life to 60 y, lower construction time, higher load factor and higher burnup. On same financial funding terms as that of the PFBR, the cost of these units will be brought down significantly. The mechanisms of cost reduction are shown in Fig.52.
100.0%-
9 0 . 0 % -
8 0 . 0 % -
7 0 . 0 % -
6 0 . 0 % -
5 0 . 0 % -
4 0 . 0 % -
3 0 . 0 % -
2 0 .0% -
10.0%-
100.0% 98.9%
8 1 . 3 %
9 4 . 9 %
8 0 . 4 % a76.5%
6 7 . 7 %
6 5 . 0 %
n PFBR
D PFBR w ith 200GWd/t
D PFBR w ith 40.5% Therm al tj
n PFBR w ith 80% capac ity factor
a PFBR w ith 40.5% Therm al n & 80% Capac ity Factor
n PFBR w ith 40.5% Therm al n. 80% Capac ity Factor & 200GWd/t Burn-up
'Tw in un its of 500 MWe with 40.5% Thermal n. 80% Capac ity Factor & 200GWd/t Burn-up (Capitaf co s t reduction by 10%)
1 Twin un its of 500 MWe with 40.5% Thermal tj C onstruction tim e 5 yrs.80% Capac ity Factor & 200GWd/t Burn-up
(Capital co s t reduction by 10%) with
Fig.52 Cost reduction mechanisms for future FBRsStatus of ReprocessingThe success of fast reactor technology demands matching competence in closing the fuel cycle through fuel reprocessing. The reprocessing of the fast reactor fuels is a major challenge due to high concentrations of plutonium and high specific radioactivity. Plutonium Uranium Extraction (PUREX) process is the workhorse of the fast reactor fuel reprocessing forthenext2 to 3 decades. The technology of fast reactor fuel reprocessing is planned to be established in India in four phases: The first phase is the developmental phase for the design and development of equipment and systems, and carrying out engineering scale experiments in inactive conditions; the second phase is setting up
of pilot plant for radioactive trials; the third phase is demonstration of plant operation at sufficient throughput level for confidence in scaling to actual size plant and the fourth is the plant construction and operation. For over two decades, R&D has been carried out in the Reprocessing Development Laboratory (RDL) on various systems and equipment such as chopper, dissolver, centrifugal extractor etc. This effort has culminated in setting up of the pilot plant, CORAL (Compact Reprocessing of Advanced fuels in Lead shielded facility). This pilot plant was commissioned in late 2003 and is currently reprocessing FBTR mixed carbide fuel of 155 GWd/tbumup with a cooling period of 2 years. The Demonstration Fuel Reprocessing
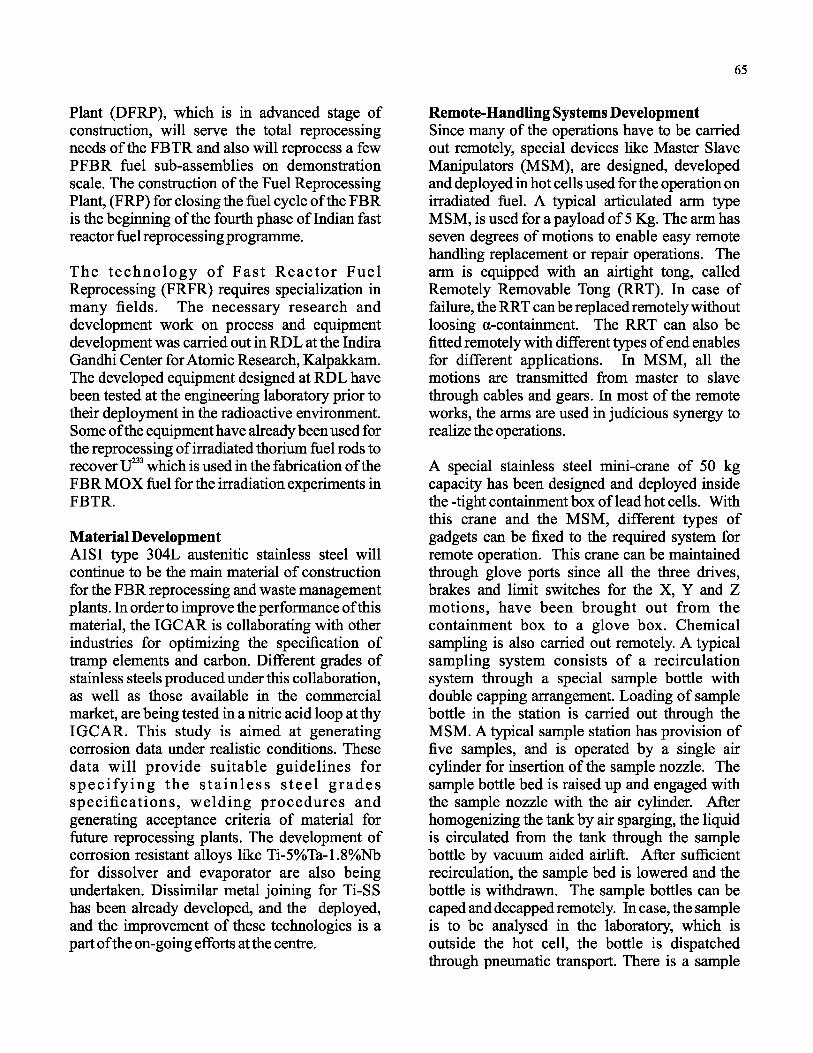
65
Plant (DFRP), which is in advanced stage of construction, will serve the total reprocessing needs of the FBTR and also will reprocess a few PFBR fuel sub-assemblies on demonstration scale. The construction of the Fuel Reprocessing Plant, (FRP) for closing the fuel cycle of the FBR is the beginning of the fourth phase of Indian fast reactor fuel reprocessing programme.
The techno logy o f F ast R eac to r Fuel Reprocessing (FRFR) requires specialization in many fields. The necessary research and development work on process and equipment development was carried out in RDL at the Indira Gandhi Center for Atomic Research, Kalpakkam. The developed equipment designed at RDL have been tested at the engineering laboratory prior to their deployment in the radioactive environment. Some of the equipment have already been used for the reprocessing of irradiated thorium fuel rods to recover U233 which is used in the fabrication of the FBR MOX fuel for the irradiation experiments in FBTR.
Material DevelopmentAISI type 304L austenitic stainless steel will continue to be the main material of construction for the FBR reprocessing and waste management plants. In order to improve the performance of this material, the IGCAR is collaborating with other industries for optimizing the specification of tramp elements and carbon. Different grades of stainless steels produced under this collaboration, as well as those available in the commercial market, are being tested in a nitric acid loop at thy IGCAR. This study is aimed at generating corrosion data under realistic conditions. These data will provide suitable guidelines for sp e c ify in g the s ta in le s s s tee l g rades specifications, w elding procedures and generating acceptance criteria of material for future reprocessing plants. The development of corrosion resistant alloys like Ti-5%Ta-1.8%Nb for dissolver and evaporator are also being undertaken. Dissimilar metal joining for Ti-SS has been already developed, and the deployed, and the improvement of these technologies is a part of the on-going efforts at the centre.
Remote-Handling Systems DevelopmentSince many of the operations have to be carried out remotely, special devices like Master Slave Manipulators (MSM), are designed, developed and deployed in hot cells used for the operation on irradiated fuel. A typical articulated arm type MSM, is used for a payload of 5 Kg. The arm has seven degrees of motions to enable easy remote handling replacement or repair operations. The arm is equipped with an airtight tong, called Remotely Removable Tong (RRT). In case of failure, the RRT can be replaced remotely without loosing a-containment. The RRT can also be fitted remotely with different types of end enables for different applications. In MSM, all the motions are transmitted from master to slave through cables and gears. In most of the remote works, the arms are used in judicious synergy to realize the operations.
A special stainless steel mini-crane of 50 kg capacity has been designed and deployed inside the -tight containment box of lead hot cells. With this crane and the MSM, different types of gadgets can be fixed to the required system for remote operation. This crane can be maintained through glove ports since all the three drives, brakes and limit switches for the X, Y and Z motions, have been brought out from the containment box to a glove box. Chemical sampling is also carried out remotely. A typical sampling system consists of a recirculation system through a special sample bottle with double capping arrangement. Loading of sample bottle in the station is carried out through the MSM. A typical sample station has provision of five samples, and is operated by a single air cylinder for insertion of the sample nozzle. The sample bottle bed is raised up and engaged with the sample nozzle with the air cylinder. After homogenizing the tank by air sparging, the liquid is circulated from the tank through the sample bottle by vacuum aided airlift. After sufficient recirculation, the sample bed is lowered and the bottle is withdrawn. The sample bottles can be caped and decapped remotely. In case, the sample is to be analysed in the laboratory, which is outside the hot cell, the bottle is dispatched through pneumatic transport. There is a sample

66
bottle dispatch station in the cell connected by a pipe to a special glove box in the laboratory, where the receipt station is located. The loading of sample bottle in the dispatch station is through MSM. In case the analysis is to be carried out in the hot cell itself then, decapping is carried out remotely using another special gadget and MSM. Aliquoting is carried out remotely by a teledosimet. pH metric titration for acidity and chelation based solvent extraction for uranium and plutonium estimation are carried out remotely in the cell.
Challenges for DFRP and Fuel Reprocessing Plant (FRP)The process flow-sheet for the DFRP and the FRP could be finalised based on the experience of the CORAL operations. The process equipment designs are fine tuned and scaling-up could be done with confidence. The entrainment of organic in strip product which is seen during the CORAL campaigns, is a safety-related issue which has been addressed. Early detection of this phenomenon during plant operation has emerged as an important requirement. The DFRP operation will aid in estimating the various performance factors of plant operation. This plant would be commissioned in 2010.
Since the FRP is linked with the commercial operation of the FBR and the fuel cycle, the cost of the plant as well as the construction time has to be kept under close control. Since the plant handles large quantities of Pu, issues like modular construction with batch operation, especially for reconversion operations, are being addressed during the design stage. Various R&D activities on in-service inspection and online monitoring are concurrently being undertaken to improve the plant performance.
Future R&D Future Fast ReactorsThe objectives of the R & D programme are to ensure economy by way of reducing the footprint of the reactor and simplification of components, ensure safety through advanced seismic designs, compact and sensitive chemical sensors for early detection of steam generator leaks, enhanced
plant life and availability. A variety of equipment including modified cold traps, flow measuring devices, training simulator, etc, are under development. Dedicated facilities are being built to test large-size reactor components such as grid plate, large diameter bearings, etc. The shake table is used to carry out validation of numerical predictions of complex phenomenon such as fluid-structure interactions effects in thin shells, sloshing, non-linear dynamic by CAST3M. A number of experimental programmes are being pursued on safety-related issues such as aerosol and behaviour, sodium leaks, interaction of sodium with concrete, sodium fires, etc.
A comprehensive programme on the development of materials is being pursued to realize a bumup of 200 GWd/t in future reactors. This includes development of improved versions of D-9 alloys, ferritic steels, oxide dispersion strengthened steels and forming, welding and coating technologies for large size and intricate components. The development of advanced NDE techniques is being pursued to enable precise and accurate in-service inspection of the reactor components.
R & D on Fuel Cycle for the FBRsA comprehensive R & D programme on reprocessing and waste management is underway with the objectives achieving of longer plant life and availability in line with the reactor systems, reduced cost and minimum waste generation. The R&D activities on fast reactor fuel reprocessing include, equipment, process and material development as well as development of inservice inspection and remote handling devices. The operating experience of the CORAL had been useful in upgrading the designs. For example, the chopper for the DFRP design is modified to improve the pin selection mechanism. In the scaled up version of the CORAL type dissolver for the DFRP, mechanical agitation of the pellets is incorporated to improve the dissolution rates as well to reduce the hull losses. Centrifugal extractors are being continuously evaluated for possible design improvements based on modelling and experience. Apart from the equipment being developed for regular plant operation, R & D is also being pursued for novel

67
extraction equipment for special purpose operations, such as a 20 stage ejector mixer settler with provisions for ins-itu electrolysis.
The development of flow-sheets for minor actinide partitioning and recovery of valuable isotopes such as Cs-137, Sr-90 and palladium is being pursued to ensure that the quantity of high- level waste to be immobilized is minimum, and the period of surveillance of high-level nuclear waste is reduced. Novel separation systems such as room temperature ionic liquids (8T/1) and supercritical extraction are being studied with a view to develop environment-friendly separation technologies. Novel techniques such as direct electrodeposition of uranium as oxide and palladium as metal from extracts of these metal ions into RTILs have been demonstrated.
A comprehensive programme on modeling of solvent extraction processes as well as process equipment is in place to provide inputs for the development of flow-sheets as well as design of novel equipment. The modeling programme includes determination of the densities of solutions containing actinides, behaviour of plu tonium in various oxidation states, polymerization and third phase formation. Keeping in focus the fact that the fast breeder reactors to be constructed after 2020 will be based on m etallic fuels, the developm ent o f pyrochemical reprocessing was initiated more than 10 years ago. The molten salt electrorefining route for metallic fuel has been established on a laboratory scale. Towards the application of the pyrochemical reprocessing for the oxide fuels, salt media based on magnesium chloride with reduced operating temperature has been explored. An engineering scale facility for demonstration of molten salt electrorefining of uranium and its alloys on kg scale will be ready for operation by the end of2008.
Towards safe disposal of high-level waste, the development of ceramic matrices for waste immobilization has been taken up. “Synroc”-type waste matrix has been developed and the optimised flow-sheet for synthesis of precursors has been shown to yield high density waste forms.
Iron phosphate glass is being developed for the immobilization of Cesium-137 and a few other radioactive species which pose problem in glasses, due to their limited solubilities.
Basic ResearchBasic research is being pursued on a number of areas related to reactors as well as nuclear fuel cycle. The research programme on materials includes studies on mechanical properties of materials, corrosion behaviour, radiation damage, grain boundary engineering for enhancing mechanical properties and ferrofluids for seals. Programmes on basic research also span a wide variety of other disciplines ranging from chemistry, physics, chemical engineering to environmental studies. Large-scale interaction with academic and research institutions is one of the key elements of the R & D strategy to enable breakthroughs. The Centre provides freedom to pursue interest in diverse areas as cultural heritage, health care, education, etc. The centre has a tradition of pursuing basic research in light scattering, theoretical physics, high-pressure research, computational modeling, super conductivity etc., The basic science has paid rich dividends by way of providing an environment of high achievements and developing capacity to meet the challenges.
Collaborations and HRD (academic, industry and R&D)In order to meet the urgent and growing need of human resources, a training school for graduate engineers and science post-graduates has been established at the IGCAR. In addition to the training programmes in engineering disciplines, two new streams of training in Nuclear Reactor Physics and Nuclear Fuel Cycle Chemistry are being conducted at the training school. Most of the R&D programs require solid foundation of physics, chemistry and engineering. To achieve breakthroughs, and provide for an adequate resilience in frontline technology and provide momentum R&D activities, a number of young research scholars have been inducted into the program under the aegis of Homi Bhabha National Institute.

68
By virtue of the multidisciplinary expertise, the IGCAR has established itself as a nationally and internationally reputed research Center not only in the primary areas of fast reactor technology but also in many associated areas. It has been realised that the success in the R & D efforts would heavily depend upon the availability of quality manpower to execute the long-term programmes. Thus, human resource development has been one of the areas of emphasis in the management philosophy of the Centre. For achieving the mission objectives of the Centre, the IGCAR has entered into collaborations with a number of educational and research institutions. The collaborations have encompassed various facets of materials development, chemistry, reprocessing, design, and safety. One of the key modes of interaction with academic institutions is through undergraduate, post-graduate and doctoral students.
The IGCAR has been an active participant in the International Working Group on Fast Reactors (IWGFR), and other International Atomic Energy Agency (IAEA) activities of interest on fast breeder reactor (FBR) programmes. The IGCAR has also been actively participating in international Co-ordinated Research Programmes (CRP) of the IAEA in areas of reactor engineering, reprocessing, NDE and safety. The IGCAR has actively participated along with Russia, France, Korea and Japan on the investigation of the thermal striping damage of the expansion tank of the Phoenix reactor. The thermal hydraulic as well as the structural damage predictions made by the IGCAR scientists matched well with the in-plant data. Another CRP project in which the IGCAR has made significant contribution was on inter-comparison of computer codes to predict seismic behaviour of the FBR cores. In the CRP on core mechanics of the FBRs, the predictions by the IGCAR scientists were found to be in good agreement with the experimental observations. The IGCAR is actively participating in several current CRP projects; One example is on the separation efficiencies for La, Ce and Nd in the oxide electrowinning process using MgCl2 based electrolyte, in collaboration with Russia, Japan, Korea, China and Czech Republic. Recently a programme of
internship has been initiated with the Nagaoka University of Technology (NUT) in which the students from the university would do project work at the IGCAR with guides from both the institutes. Apart from aiding in exchange of expertise and facilities, this programme would serve to strengthen the existing dynamic and vibrant relations between the IGCAR and NUT.
The collaboration of the IGCAR with the French Atomic Energy Commission (CEA) dates back to 1969, when the fast breeder test reactor (FBTR) was conceived to be built by adaptation from the French fast reactor Rapsodie. Several design modifications were envisaged. This collaborative phase lasted till the embargo regime was imposed after the first peaceful nuclear explosion. The IGCAR re-established collaboration with the French Atomic Energy Commission (CEA) in 1989 to exchange computer codes in the field of thermal hydraulics and structural mechanics. Under this collaboration, the IGCAR received CASTEM 2000, PLEXUS and TEDEL codes for structural mechanics analysis from CEA. R ecently , the IG C A R has estab lished collaboration with CEA in wider spectrum of subj ects related to basic science and safety.
In an Indo-French collaborative programme on ferrofluids, a device has been developed that can measure forces of the order of 10'13 N between colloidal particles, and it has been effectively utilized for synthesizing ferrofluids and their emulsions with long-term stability. The programme has led to filing of four patents that include force apparatus, ferrofluid based magnetic flux leakage measurements for NDT and optical filters. The technology is now being adapted to develop the dynamic seals for sodium pumps used in fast reactors. In collaboration with Centre for NDE, Iowa State University, a three dimensional boundary element model has been developed and validated for detection and quantitative evaluation of surface and sub-surface cracks in structural components. In collaboration with the Michigan State University, East Lansing, modelling of response of in-house developed SQUID sensors for detection of defects through flux leakage measurements has been pursued for
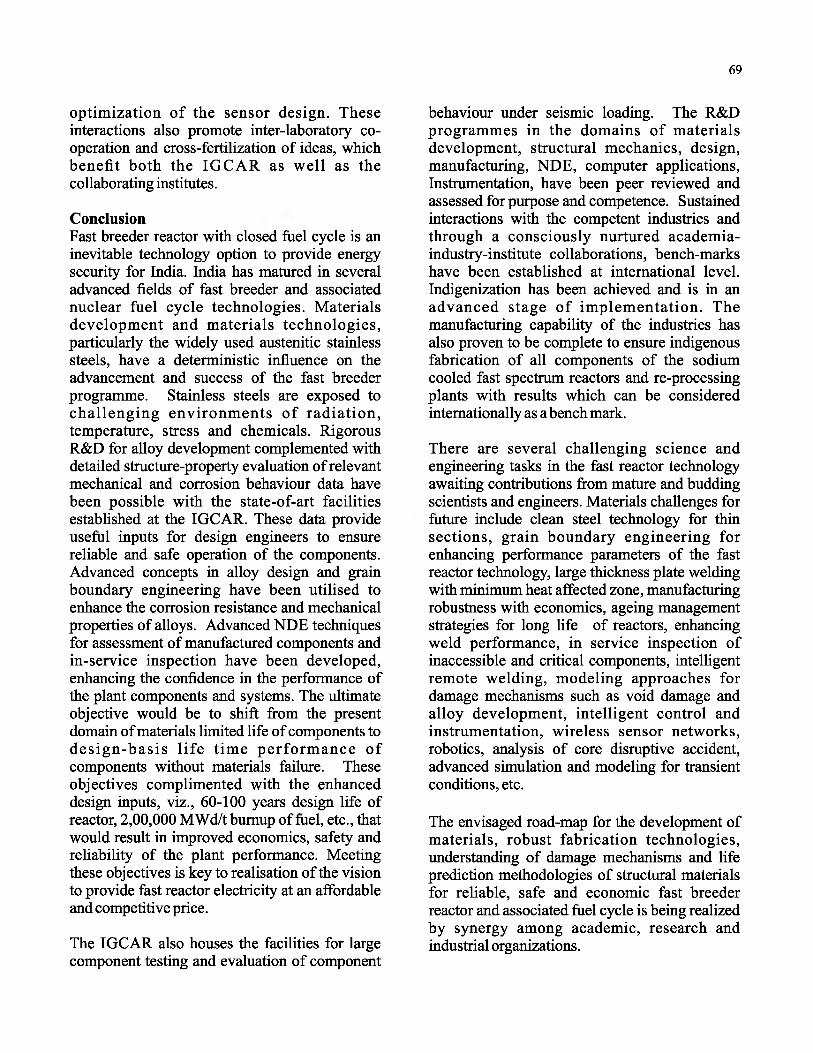
69
optimization of the sensor design. These interactions also promote inter-laboratory cooperation and cross-fertilization of ideas, which benefit both the IGCAR as well as the collaborating institutes.
ConclusionFast breeder reactor with closed fuel cycle is an inevitable technology option to provide energy security for India. India has matured in several advanced fields of fast breeder and associated nuclear fuel cycle technologies. Materials development and materials technologies, particularly the widely used austenitic stainless steels, have a deterministic influence on the advancement and success of the fast breeder programme. Stainless steels are exposed to challenging environm ents o f radiation, temperature, stress and chemicals. Rigorous R&D for alloy development complemented with detailed structure-property evaluation of relevant mechanical and corrosion behaviour data have been possible with the state-of-art facilities established at the IGCAR. These data provide useful inputs for design engineers to ensure reliable and safe operation of the components. Advanced concepts in alloy design and grain boundary engineering have been utilised to enhance the corrosion resistance and mechanical properties of alloys. Advanced NDE techniques for assessment of manufactured components and in-service inspection have been developed, enhancing the confidence in the performance of the plant components and systems. The ultimate objective would be to shift from the present domain of materials limited life of components to design -basis life tim e perform ance o f components without materials failure. These objectives complimented with the enhanced design inputs, viz., 60-100 years design life of reactor, 2,00,000 MWd/t bumup of fuel, etc., that would result in improved economics, safety and reliability of the plant performance. Meeting these objectives is key to realisation of the vision to provide fast reactor electricity at an affordable and competitive price.
The IGCAR also houses the facilities for large component testing and evaluation of component
behaviour under seismic loading. The R&D programmes in the domains of materials development, structural mechanics, design, manufacturing, NDE, computer applications, Instrumentation, have been peer reviewed and assessed for purpose and competence. Sustained interactions with the competent industries and through a consciously nurtured academia- industry-institute collaborations, bench-marks have been established at international level. Indigenization has been achieved and is in an advanced stage of im plem entation. The manufacturing capability of the industries has also proven to be complete to ensure indigenous fabrication of all components of the sodium cooled fast spectrum reactors and re-processing plants with results which can be considered internationally as a bench mark.
There are several challenging science and engineering tasks in the fast reactor technology awaiting contributions from mature and budding scientists and engineers. Materials challenges for future include clean steel technology for thin sections, grain boundary engineering for enhancing performance parameters of the fast reactor technology, large thickness plate welding with minimum heat affected zone, manufacturing robustness with economics, ageing management strategies for long life of reactors, enhancing weld performance, in service inspection of inaccessible and critical components, intelligent remote welding, modeling approaches for damage mechanisms such as void damage and alloy development, intelligent control and instrumentation, wireless sensor networks, robotics, analysis of core disruptive accident, advanced simulation and modeling for transient conditions, etc.
The envisaged road-map for the development of materials, robust fabrication technologies, understanding of damage mechanisms and life prediction methodologies of structural materials for reliable, safe and economic fast breeder reactor and associated fuel cycle is being realized by synergy among academic, research and industrial organizations.

70
AcknowledgementsThe benefits derived from family, friends, Department of Atomic Energy, peers, colleagues, collaborating individuals and organisations from India and abroad are sincerely acknowledged. I am especially thankful to Dr. P. Chellapandi, Director, Safety Group, IGCAR for many encouraging discussions and support in preparing this comprehensive manuscript.
ReferencesAnil Kakodkar, 1997, Tailoring R & D Thrusts in Nuclear Power Technology for Sustainable Development, International Seminar on the Role of Nuclear Energy for Sustainable Development, Organised by Indian Nuclear Society, New Delhi, Sept 8-9,1997.
R.B. Grover, Subhash Chandra, Scenario for Growth of Electricity in India, Energy Policy, 34(2006)2834-2847.
M.R. Srinivasan, Energy Foresight for Developing Economies, 2006, Seventh Annual Conference of Indian Nuclear Society, Energy Foresight - India 2050, Organised by Indian Nuclear Society, Nov 21 -24,2006.
Baldev Raj, 2007, Sustainable Development and Closed Fuel Cycle - An Overview, SAGNE Meeting, April 18-20,2007, International Atomic Energy Agency, Vienna, Austria.
Baldev Raj, Status of Sodium Cooled Fast Reactors with Closed Fuel Cycle in India, 2007, International Congress on Advances in Nuclear Power Plants, Nice, France, May 13-18,2007.
Baldev Raj, Kamath H.S., Natarajan and Vasudeva Rao PR., 2005, A perspective on Fast Reactor Fuel Cycle in India, Progress in Nuclear Energy, Vol. 47,No. l-4,pp.369-379.
K itheri Joseph, K .S u ja tha, S .N agaraj, K.H.Mahendran, R.Sridharan, G.Periaswami and T.Gnanasekaran, J.Nucl. Mater., 344 (2005) 285.
K.H.Mahendran, R.Sridharan, T.Gnanaseakaran and G.Periaswami, Ind. Eng. Chem. Res., 37 (1998)1398.
E. Prabhu, V. Jayaraman, K.I. Gnanasekar, T. Gnanasekaran andG. Periaswami, Asian J. Phys. 14(2005)33 40.
V. Jayaraman, D. Krishnamurthy, Rajesh Ganesan, A. Thiruvengadasami, R. Sudha, M.V.R. Prasad and T. Gnanasekaran, Ionics 13(2007)299.
Technology Road map for Generation IV Nuclear Energy System, Gif-002-00, Dec 2002, Issued by US DO E, N uclear R esearch A dvisory Committee.
B. K. Choudhary, C. Phaniraj, K. B. S. Rao and S. L. Mannan, Key Eng. Mater., 171-174 (2000) 437.
B. K. Choudhary, C. Phaniraj, K. B. S. Rao and S. L. Mannan, ISIJ Inter. Supplement. 41 (2001) S73.
C. Phaniraj, B. K Choudhary, K. B. S. Rao and Baldev Raj, Scripta Materialia, 48 (2003) 1313.
C. Phaniraj, B. K. Choudhary, Baldev Raj and K.B. S. Rao, J. Mater. Sci., 40 (2005) 2561.
C. Phaniraj, B. K. Choudhary, Baldev Raj and T. Jayakumar, Mater. Sci. Eng. A, 398 (2005) 373.
S. Latha, M. D. Mathew, K. B. S. Rao and S. L. Mannan, Trans. Indian Inst. Met., 49 (1996) 587.
Divakar, A Banerjee, S. Raju and E. Mohandas, Proc. Conf. Physical Metallurgy Research, Techniques and Applications, Mumbai, India, December 2004.
R. Rajaraman, P. Gopalan, B. Viswanathan, S. Venkadesan, J. Nuc/. Mater., 217 (1994) 325.
C. David, B. K. Panigrahi, R. Rajaraman, S. Balaji, A. K. Balamurugan, K. G. M. Nair, G. Amarendra, C. S. Sundar, B. Raj, J. Nuc/. Mater., 2008 (in press).
S. Ukai, S. Mizuta, M. Fujiwara, T. Okuda and T. Kobayashi, J. Nuc/. Sci. Technol., 39 (2002) 778.

71
R. Lindau A Moslang, M. Rieth, M. Klimiankou, E. Matema-Morris, AAlamo, A A. F. Tavassoli, C. Cayron, A-M. Lancha, R Femandz, N. Baluc, R. ScMublin, E. Diegele, G. Filacchioni, J.W. Rensman, B.v.d. Schaaf, E. Lucon and W. Dietz, Fusion Eng. Des., 75 (2005) 989.
Nagesha, M. Valsan, R. Kannan, K. B. S. Rao, V. Bauer, H.-J. Christ and Vakil Singh, Int. J. Fatigue (in press).
V. Shankar, T. R S. Gill, S. L. Mannan and S. Sundaresan, Mater. Sci. Eng., 343 (2003) 170.
V. Shankar, T. R S. Gill, M. Thamban and R Patel, Proc. SOJOM 2000, paper WM-25,2000.
Vani Shankar, A Nagesha, M. Valsan and K. B. S. Rao, IGCAR, Kalpakkam, Unpublished work.
K. S. Chandravathi, K. Laha, K. B. S. Rao and S. L. Mannan, Mater. Sci. Technol., 17 (2001) 559.
K. Laha, K. S. Chandravathi, P. Parameswaran, K.B. S. Rao and S. L. Mannan, Metall. Mater. Trans. A, 38 (2007) 58.
S. K. Albert, M. Kondo, M. Tabuchi, F. Yin, K. Sawada and F. Abe, Metall. Mater. Trans. A, 36(2005)333.
V. Moorthy, B. K. Choudhary, S. Vaidyanathan, T. Jayakumar, K. B. S. Rao and Baldev Raj, Int. J. Fatigue, 21 (1999)263.
B a ld e v R a j , S. L . M a n n a n , K. V. Kasiviswanathan, M. D. Mathew, V. Karthik andC. N. Venkiteswaran, M. Saibaba, and P. Puthiyavinayagam, J. Met. Mater. Processes, 18(2006)1.
J. Joseph, V. Venugopal, N. G. Muralidharan, C. N. Venkiteswaran and K. V. Kasiviswanathan, Post Irradiation Examination carried out on FBTR subassembly no. 1201 0001, Report No: IGC/DPEND/PIES/FSA/12010001/03/Rev0- 2004, IGCAR Kalpakkam.
AK. Bhaduri, R. Indira, S. K. Albert, B. P. S. Rao, S. C. Jain, S. Ashok Kumar and P. Kuppusamy, Recommended hard facing materials for NSSS components; IGCAR Report: IGC/HTF/05, 2000.
AK. Bhaduri, S. Venugopal, G. Srinivasan and S. K. Ray, Development, Characterisation and Evaluation of Transition Metal Joint for PFBR Steam Generator Circuit, IGCAR Report: IGC/MTD/M J S/2001/02,2001.
P. Chellapandi, S. C. Chetal, and Baldev Raj, Int. J. Pres. Ves. Piping, 82 (2005) 739.
P. Chellapandi, S. C. Chetal and Baldev Raj, Nucl. Eng. Design (in press).
P. Chellapandi, K. Velusamy, S. E. Kannan, Om Pal Singh, S. C. Chetal, S. B. Bhoje, Harbans Lai and V. S. Sethi, Proc. 1st National Conf. Nuclear Reactor Safety, Mumbai, Nov 2002.
Anish Kumar, K.V. Rajkumar, G.K. Sharma, T. Jayakumar and Baldev Raj, “Development of New Ultrasonic Methodologies for Inspection of Components of Prototype Fast Breeder Reactor”, Proc. (CD) Intern. Conf. on Advances in Stainless Steels, ISAS-2007, Chennai, 9-11 April, 2007.
H. Shaikh, B.P.C. Rao, S. Gupta, R.P. George, S. Venugopal, B. Sasi, T. Jayakumar, H.S. Khatak, British Corrosion Journal, 37 (2), 2002, pp. 129- 140.
K. V. Kasiviswanathan, C. Rajagopalan and Baldev Raj, Insight, 45 (2003) 82.
K. V. Kasiviswanathan, C. Rajagopalan and R. Chellapandian, Proc. Conf. Materials and Technologies for Nuclear Fuel Cycle Covering Materials, Robotics, Process instrumentation & Inspection Technologies, MRPI 2003, SERC, Chennai, pp. 106-118,2003.
K. V. Kasiviswanathan, C. Rajagopalan, Goutam Kumar Guin and Baldev Raj, J. Non-Destructive Evaluation, 4 (2005) 39.

Award Lecture Series ofIndian National Academy of Engineering
Professor Jai Krishna Memorial Award Lecture 2009
21st Century Aerospace Technologies and Transformation of Development Processes the Indian Defence Perspective
V K Saraswat,Scientific Advisor to Raksha Mantri
Director General, Defence R&D Organization & Aeronautical Development Agency
IntroductionAerospace has been widely acknowledged asbthe single most critical and cutting-edge technology domain in the twenty first century. Technology advances in this critical area have been fast paced, with multiple applications that are multidisciplinary in nature. The field of aerospace technology encompasses various technology areas, viz., mechanical, aerodynamics, materials, electronics and avionics, just to name a few this facet, and an overall understanding of these diverse domains make it the single most challenging area for scientists and technologists.
The United States is acknowledged as the world leader with its Government playing a leading role. In 2006, the US National Science and Technology Council's Committee on Technology, put out a National Aeronautics policy on R&D which included recommendations made to clarify, focus, and coordinate the R&D activities in Aeronautics. The key features of this policy were to provide long term stability and focus in innovative research and Test & Evaluation, infrastructure, develop advanced concepts and technologies for unsurpassed military capability, cultivate an R&D environment that enables a globally competitive U.S. aeronautics enterprise, and encourages industry investment and academic participation.
India unfortunately does not have any such well laid out policy framework to encourage and stimulate R&D/technology development in aeronautics. This is perhaps the primary need of the hour. In the civilian sector hardly any progress has been achieved and the National Aeronautics Laboratory under the CSIR has just recorded initial breakthrough with its Humsa and Saras programs. I
will focus on the defence technology development - its achievements, limitations and key challenges.
Indian aerospace technologies in defence sector took the first tentative steps in the early eighties with the birth of the Integrated Guided Missile Development Program. The technology scenario at the start was quite bleak. Dependency on foreign technologies, lack of a policy framework for indigenous R&D, non-availability of a vendor base, lack of manufacturing support and infrastructure kept the status of our indigenous technology development at a low level. The DRDO took up the challenge of abinitio development of technology infrastructure for almost every sub-system of the family of missiles which it had been tasked to develop. Design, prototype manufacturing, T&E infrastructure and qualification of developed systems for the Agni, Prithvi, Trishul, Akash and Nag laid the foundations of the aerospace technology in the country. Work was started concurrently in diverse areas, viz., propulsion- liquid and subsequently solid, navigation, guidance systems - wire guided, command guidance, aerodynamics reentry structures, light weight high temperature materials development, on-board computers and avionics systems. The whole gamut of activity in each of these areas starting from basic design to prototype development was taken up on a war footing. Within the first seven years from the start, the DRDO gave to the nation its first strategic missile systems- Prithvi and Agni TD. From then on, a family of missile systems have been produced, viz., the Prithvi II/III, Agni II/III , Akash area defence system, etc. Its most ambitious venture, the Ballistic Missile Defence System, is in an advanced stage of development.

73
Work on the Air-to-Air missile Astra and the long- range SAM in collaboration with Israel is underway. The DRDO's future road-map in missile systems include the development of Hypersonic air breathing vehicle propulsion which includes dual mode Ramjet-Scramjet at Mach 2-8, aerothermodynamic design studies, thermal protection systems, high temp materials- coatings, paints and m etallic foams for applications in extended air defence, surveillance and recce. Long range radars for target tracking will be another key area of focus.
Simultaneously test facility build-up for each of these systems will also be undertaken, of which the hypersonic wind tunnel and shock tunnel will be the main priority tasks. The Indo-Russian joint venture Brahmos which has recorded, significant progress will reach its next stage with the development activity for long-range cruise missile as its main focus.
The Future technology areas will include pulse detonation engines using hydrogen, liquid methane etc, inertial sensors, navigation sensors: BRAINS with stellar navigation, radar seekers: LWIR / MWIR seekers and extending into Ladar seekers. Another key area of future development will be in stealth materials and the fabrication, multispectral stealth materials and technologies including coatings and structures, carbon-carbon composites, high performance nano-composites with carbon ceramic polymer up to 3000 deg C operation.
Aeronautic systems:In the early nineties the DRDO made its first foray into combat aviation with the Light combat aircraft program. The abrupt end of the HF-24 Marut program had left the combat aviation scenario in a limbo, and we had perforce to start all over again. The ongoing work of the IGMDP proved to be of immense use for the LCA, and industries/academia which were contributing to the IGMDP were now drawn into the LCA. The LCA program turned out to be truly a national endeavour. Spearheaded by the Aeronautical development Agency at (ADA) with HAL as its manufacturing partner, the LCA program
encompassed over 15 DRDO labs, a number of CSIR Institutes, HAL, BEL , ordnance factory, Indian large-scale private players, and small and medium scale industries. The LCA program gave to the country a number of critical technologies, viz., fly-by-wire technology, composite structures, mission computers and avionics, quadruplex digital flight control systems, etc. The Citical Control Law (CLAW) under joint development with the USA was hit by sanctions, and India had to re-group its indigenous skill-sets to complete the development through its own efforts. Aeronautics and aerospace industry of India actually came into its own and received global attention with the LCA program. Today the DRDO can proudly claim to have played a major part in enhancing the technology capability of India's defence industrial base, attested by the fact that a number of aerospace majors of the world have set up their R&D centres in India. The challenges in this path were many, chief among them being the setback faced due to post-1998 technology sanctions from the denial regimes and lack of whole-hearted commitment of the users.
Having to a great extent circumvented these problems, the DRDO's future roadmap is targeted towards development of the next generation medium combat aircraft (a twin seater dual engine aircraft with supersonic speeds and possibly stealth built into it. Meanwhile work had also been initiated for the development of unmanned system and in the nineties the first unmanned aerial vehicles, the Lakshya (an aerial target) and Nishant (a surveiallance UAV) had been developed with their attendant technologies for airfarme, launch and recovery, command and control system with data-links having been indegenised to a great extent. Today, work is in progress for the development of a Medium Altitude High Endurance (MALE) UAV with greater endurance (24 hrs) and extended command range. Work on the electro-optic payloads is also underway. The DRDO has initiated the development of an unmanned combat vehicles in which advanced features of stealth and speed will be added progressively as they demonstrate maturity. Another important sphere of developmental activity is on an Airborne Early

74
Warning and Control system for air-borne surveillance for which work on the primary radar is underway at LRDE.
The key technology areas in which the DRDO will focus in the coming decade will thus include just to name a few super-cruise, thrust vector control, serpentine air intake systems. The aeronautics development scenario in the country has thus graduated in steps from a tactical combat aircraft and a tactical unmanned air vehicle to the next generation fighter and onto an unmanned combat aircraft.
Electronic systemsAerospace technologies are heavily dependent on electronics and avionics. DRDO has recognised this important fact, and has initiated a number of developmental activities in related areas, including synthetic aperture radar and AES A for multi-target tracking and engagement, network- centric operations, long-range EO systems for UAV/aerostats, solid state lasers , multi- spectral laser warning and counter-measure systems and high speed data links and high data rate links . Work is on for ultra-wide band software defined radios and next generation dedicated satellite communication systems. A major thrust will be on space-based systems with the MEM S-based mini satellite for Elint/Comint operations, unfurlable antennas, Leo/Meo Satcom systems as top priorities for development.
Way forwardHaving given a broad overview of the DRDO's activity in aerospace technologies and its future road-map, I outline below the measures required to enhance India's position in the global aerospace scenario.
1. Firstly, there is a need for a new vision for technology leadership. This vision for indigenous technology development, should focus on building advanced aerospace technologies with transformed development processes with the aim of making India a leader in high technology areas and systems. This vision would be a reality in a 20-25 year time span. This could be achieved basically through a 3-
step process involving a number of players.(i) We should first focus on formulating
new patterns for the technical education system, aimed at building capabilities and capacity for thinking in new lines. The system must inculcate creativity and innovation culture with systematic problemsolving skills. It must develop collaborative working skills for design-build-test-validate cycle in the curriculum. The aim is not to catch up with the west but to innovate independently better products and system s, th a t w ould exceed International benchmarks.
(ii) We should develop linkages and collaborative working culture. E xpertise developed through isolated tasks if linked together will result in a combined effect far greater than that derived from individual effect. H ere, the synerg istic partnership of the Govt, labs, industry and academ ia is an important factor. Guidelines must be set and mechanisms put in place with due incentives to enable private industries and academic institutions to work in together with the Govt, labs to achieve greater success.
(iii) Another important factor is to develop a capability to take decisions under risk. Failures need to be considered as part of success and an integral portion of the development effort. Fast decision making and a willingness to develop high risk- high payoff technology that are im p o rtan t face ts ac tiv ity o f concerning aerospace should be promoted.
2. The second phase should deal with the establishment of a working methodology for development. The quickest and the best route for development should be a s y n e r g i s t i c e f f o r t . P r o d u c t conceptualisation, simulation studies and

75
modelling are best done at the academia institutions, which should concentrate on converting scientific concepts to developm ent of technologies and processes (TRL 0 to 3). Product conceptualisation and preliminary designing are best done at the R&D labs (TRL 3-6). Final product manufacturing and fabrication should ideally be left to the industry partner, who should be brought into the loop in the early stages. This synergistic partnership can be effectively utilised to produce optimum results in the shortest possible time, with the added advantage of being able to achieve advanced upgrading faster rate at probably lesser cost.
There are of course many challenges to this development process and the path to technology development especially in aerospace domain, is not easy. Some of the specific challenges relating to the area of defence technologies include:(I) Fast changing advances with greater
complexity(ii) Forecasting future requirements in
consultation with users(iii) Motivating the development team,
specia lly for long-gesta tion programs
(iv) Difficulty in getting private industry to invest time/money in high- risk projects
(v) Multi-organisational collaborative working on multi-technologies at different phases during the life cycles of technologies
3. In order to make Indian aerospace tech n o lo g ies and system s m ore competitive and to attain world-class standards in the 21st century there is a need to change the development processes. The development cycle, its maturation, product designing, testing and validation together with technology transfer and production co-ordination should be carried out effectively within the c o m m i t t e d t i m e - f r a m e . The
requirements need to be organised in a focussed manner with a formal system of t a s k a s s i g n m e n t and r e s o u r c e deployment. Concurrent approach rather than a sequential process should be encouraged. Funding methodology and the fund-flow should be streamlined so as not to introduce delays in the process. Appropriate review mechanisms should ensure system dynamism.
4. Mechanisms for defence technology acquisition and developm ent are important. The aerospace technologies are of critical importance, and it is necessary to understand the avenues available for the technology planners. Broadly speaking the modus operandi within the defence sector and outside can be divided into two main streams:(i) Assessing the technology gaps in the
defence sector and launching of basic research programs to fill the re gaps are a long lead requirement which should be recognised well in advance. Sim ultaneously, for systems which are imported from abroad, we must ensure at least limited technology transfer so as to provide learning process to our scientific personnel . F inally , international collaboration between other countries with complementary skill-sets and respectable work-share arrangement is perhaps the quickest m e a n s to j u m p s t a r t n e w technologies.
(ii) While these are the channels for technology acquisition in the defence sector, the civilian sector can also an important role in enhancing the technological capability of the nation. Defence R&D must identify certain niche technologies which must be home- grown from grass- root level. Examples of this include hypersonic propulsion, nano-sensors and systems, strategic materials, Imaging sensors and systems etc.

76
These must be given as technology seeding projects to reputed academic institutions, wherein Centres of excellence established in core t e c h n o lo g ie s cou ld becom e fountains of knowledge in the years to come. Yet another measure could be the training of Indian S&T personnel in reputed universities abroad, and investing in them for future technology needs. This method has been honed to perfection by China, which sends its personnel for specialised training abroad and then brings them back to be placed on top posi t ions with excellent remuneration. Another important r o u t e c o u l d be to a l l o w technologically advanced countries to open R&D centres in India, utilise Indian manpower and ensure mechanisms to earn valuable foreign exchange through exports from Indian shores of their products, with the pre-condition that these products would be easily available to the Indian defence establishm ent. Finally, Govt, should create more Aero Parks and SEZs for aero- technologies and invest heavily in tes t fac i l i t ies and h igh-cos t manufacturing facilities. The in f ra s t ru c tu re s requ i red for d e v e lo p m e n t , m a n u fa c tu re , qualifications of aero-technologies are extremely expensive and therefore, require support of Govt, funding at the initial stages of their creation(GOCO model). In many cases the dividing line between military and civil aero- technologies
is very narrow, and therefore, the infrastructures could be shared. Training institutes within the Aero Parks could be established for generating world-class qualified technicians in aero-technologies. Adequate linkages between research organisations, academia, industries and these Aero Parks and SEZs sh o u ld be e n su re d th ro u g h innovative schemes to nurture new ideas and create break-throughs.
ConclusionThe Government, industry and academia should share responsibility for the development of aerospace technology, with the Govt, playing a leading role and instituting policies and mechanisms for incentivising all players to proactively partake in development across a range of technical disciplines. It could also liberalize procedures for high risk-high payoff projects for critical technology development. The country will needs scientists and technologists with substantial knowledge across multiple technical areas, and also improved tools and methods for overall system integration. The Government, Industry and in the years ahead academia will therefore have to indicate their willingness to support development of future systems that will be more complex, involve higher risk and are technology intensive.
The future of aerospace products in India depends on technology development and integration of the efforts of all players performing their well- defined roles for a synergistic output. In the final analysis, technology innovation and product moving need to be encouraged to strengthen India's position in the field of aerospace for which a new vision of cooperative connectivity needs to be established at the earliest.

Award Lecture Series ofIndian National Academy of Engineering
Professor Jai Krishna Memorial Award Lecture 2010
The Resurrection of a Steel Plant and The Renaissance of a Steel City
Sanak MishraManaging Director: Roorkela Steel Plant, Director : Steel Authority of India
IntroductionIn about two years during 2002-04, the Rourkela Steel Plant (RSP) achieved one of the most dramatic turnarounds in the Indian corporate history. (Reference: http://www.steelworld. com/rour.htm; Rourkela Steel Plant; A Saga o f Transformation). In fact, what happened is rather unique. While turnarounds in industry and business are not uncommon, the process through which it was achieved at Rourkela is not what is commonly seen. To comprehend this, one has to actually understand, first of all, the circumstances that had the Steel Plant in their stranglehold and the kind of hopeless situation that existed there.
The RSP was the torch-bearer for the Public Sector Steel Industry in India, and carried the banner of the industrial revolution for the nascent Republic of India. The construction of the Steel Plant, then a part of the erstwhile Hindustan Steel Limited (HSL) and now a unit of the Steel Authority of India Limited (SAIL), was started during the mid-fifties of the 20th century, in collaboration with a consortium of leading steel plant designers from the Federal Republic of Germany.
The units at the 1.0 MT stage were commissioned between December, 1958 and early part of 1962. With a view to meeting the additional demand for flat products in the country, it was decided to increase the capacity of the Blooming & Slabbing Mill, Hot Strip Mill and Plate Mill at RSP. Accordingly, capacity of ingot steel was increased from 1.0 MT to 1.8 MT between 1965 and 1969. Besides expansion of the capacity of the existing units, the scheme also envisaged addition of new units like Electrical Sheet Mill (for dynamo and transformer grade steel) and galvanizing lines (for
corrugated and plain galvanized sheets). Subsequent to the expansion of the steel plant a number of units were added to enhance the product quality, production, productivity and to meet the market needs. These units included Spiral Weld Pipe Plant, Silicon Steel Mill, Captive Power Plant-II, Mechanical Shop, Structural & Fabrication Shop, Heavy Loco Repair Shop, Slag Granulation Plant and Coke Ovens Battery Number 5.
These additional facilities made RSP one of the unique steel plants under the SAIL umbrella producing a wide variety of special purpose steel. The use of its plates in ship building and high pressure vessels, silicon steel in electrical industries, corrugated galvanized sheets for roofing including industrial roofing, pipes in the oil and gas sectors, tin plates in packaging industries and special plates in the defence of the nation are well known.
In order to overcome technological obsolescence and to continue to remain competitive in the market place, even internationally, RSP went in for modernization, which was conceived in 1988. Phase-I of modernization, which emphasized on improving the quality of raw materials, consisted of a new oxygen plant, upgradation schemes for blast furnaces, dolomite brick plant, cast house slag granulation plant at blast fumace-4, raw material handling system, coal handling plant (in coke ovens) and power distribution system, was completed in 1994. Phase-II consisted of a new sinter plant, basic oxygen furnace and slab casting shop in steel melting shop-II, modification of plate mill & hot strip mill and installation of slab casting shop in SMS-I, except for hot strip mill,

78
which was completed in 1999, all the other areas were completed in 1997.
On the other hand, the RSP had been continuously incurring losses year after year, since the mid- 90s. While a part of this could be due to the overcapacity in the steel industry and the consequential decline in steel prices, there were other factors that did not meet the eye and were the ones which had been taken for granted. The facilities which had been introduced during the modernization were done at a cost of more than Rs.4000 crores and with borrowings mostly from financial institutions, carried a huge burden of interest. These equipment and facilities also entailed a huge amount of depreciation. The only way out for the plant was to utilize these equipment and facilities fully for generating revenue to payback this burden. But what was noticeable was that capacity utilization was very low, both in the modernized units as well as in the pre-existing units, adding to the fixed cost of production which ultimately brought down the profitability and contributed to the losses.
The reason for the low capacity utilization was because of poor level of equipment health that led to breakdowns quite frequently, thus interrupting production. Fires and “Maioperations ” were occurring quite regularly contributing to breakdowns and interruptions in production. The state of health of equipment in the critical areas like Coke Ovens, Blast Furnaces, Steel Melting Shops, Power Plants and other downstream areas was also not anywhere near satisfactory, stifling the efforts to hike up production. Another phenomenon that was quite visible was the acceptance of low standards. This led to low efficiency in the form of poor techno-economics on the one hand which again added to cost, and poor quality of products on the other hand leading to the pile up of unsold stocks. Apparently, significant quantities of production had been carried out only for volumes thus earning incentives, and not catering to the requirement of customers. At the same time, the level of discipline in the steel plant was also far below the mark, making any effort to come out of the situation a difficult one. There was a perceptible
fear among the employees due to the dominance of the pressure groups who resisted any kind of even incremental improvements at the shop floor.
The result was that the steel plant was accumulating losses year after year. Instead of working towards changing things, the employees were more concerned about finding reasons that had led to the mess and blaming everything of the past to be the cause of the problem. The confidence of the employees, both Executives and Non-Executives, had been shaken up, and no one believed that any improvement was possible. Most employees were already expecting the closure of the plant; hence the morale was low. The other thing was that there was a visible absence o f leadership th roughout the organization. Another important feature was that no one seemed to be in a position to understand the implications of this phenomenon. At this stage, the Rourkela Steel Plant was incurring a loss o f Rupees 3 crores a day.
Experiments in CourageIt was in this background that I was drafted to head the Rourkela Steel Plant as its Chief Executive.. On joining, the first thing I did was to study the ground realities and understand what actually was wrong. It became increasingly clear, with some homework, that there were some common external factors which were the same for every player in the steel industry which had to do with the depressed market. But I also discovered that many of RSP's woes were very specific to the steel plant itself, and had nothing to do with the outside world. These were the “internal” factors. Low capacity utilization, poor equipment health, breakdowns, mal-operations, fires, poor technoeconomics, poor quality of finished products, etc. were all the result of the actions of the management and employees of the steel plant. It was, therefore, the employees who had to undo the same, working hand in hand with the management.
I firmly believed that “human resources are the most powerful force in taking any organization forward even if the organization is highly technology centered.” So any effort that needed to be made had to have employees at the centre.

79
Considering the industrial relations situation and a lack of employee faith on the management which was largely the creation of shop-floor pressure groups, many had cautioned me on the steps to be taken where the employees were concerned. But it was clear that if things at RSP had to improve then steps were needed right away and we simply did not have the luxury of an unlimited time frame. I was convinced that if the Steel Plant had to improve its lot primarily through internal actions, then it had to be isolated and insulated from any form of interference from political masters and bureaucrats. I understood clearly that this was an onerous responsibility which was solely mine, and I also understood that in doing so, there was a very real risk to my own position and continuance as the Chief Executive of the Steel Plant. I decided to take that risk, considering that if the Plant had to survive and get revived, that was the least that should be done.
Oblivious of the words of caution of my well- wishers, I decided to act on my own conviction and move on. In fact, I took the unprecedented step of visiting the shop floors in an exercise that was internal “Reaching Out”, within a week of taking charge of RSP. This was actually a clear deviation from the protocol of hierarchy which was broken very consciously. My idea of doing things keeping in mind the interest of RSP was in effect aimed at engaging the attention of each and every employee in the process of revival of RSP. While my colleagues on the shop floor were somewhat surprised seeing the Chief Executive right at the work place, I chose to speak directly to the employees who operated machines and equipment.
In about a month or so, having travelled the length and breadth of the steel plant, I got the opportunity of meeting thousands of employees. I began by telling each group the truth regarding the prevailing state of affairs at RSP. I described the unenviable situation to the organization in clear terms, and explained that unless each employee understood and worked for the steel plant the future could no more be taken for granted. At the same time, I welcomed to hear their feelings about the situation that we were in. It was easy to notice
that a number of people had no clue of the importance of their individual roles. Many did not know how their own performance affected others, and how the performance of others affected their performance. I had a straight forward question to each section of employees which was simply “Are you prepared to take up the challenge for the future of the steel plant or are you going to sit and watch as the situation goes out of hand ?” Happily many were willing to give an honest effort to make things better. Most of the employees found my approach of speaking my heart out an unusual one, and they also spoke from their heart telling me things like, Give us challenges and we will achieve” and “Give us the resources and we will produce at record level.”
Another thing I did was taking a look at the critical and important posi t ions at the Senior Management and General Manager level, making a complete reshuffle of many of the incumbents giving them new areas for delivering results instead of continuing them in departments where they had grown. These senior executives were posted with clear-cut responsibility for results. Similarly, non-performers were also eased out to the sidelines, making way for potential performers in key positions. One of the purposes behind all these actions was to demonstrate to the employees and the people all around that there had to be a paradigm shift through visible initiatives directed towards bringing about improvements.
The Ten PrioritiesDuring my interactions with the employees, I made note of the different aspects of the organization, keeping in view the ultimate objective of turning around the steel plant from a loss-making one to a vibrant one. I introduced and energetically engaged the employees in “ 10 Priorities” which were as follows:
• Employee motivation and employee pride• Leadership practice• E n v i r o n m e n t a l r e l a t i o n s an d
organizational change• Plant maintenance and equipment health• Sm all i n v e s tm e n t sch em es for
maintaining current operations

80
• Sustained operation and consistent production
• Strengthening secondary streams of cash generation
• Operation and purchase cost reduction• S u s ta in in g the benefi ts o f any
Improvement Proj ects already carried out• Enhancing Gross Margin and Net Sales
Realisation
To convey the seriousness of these initiatives, crack teams were formed with Senior Executives to monitor each one of them.
Bringing ClosenessI had firmed up my objective of bringing about a turnaround through each and every employee of RSP a movement that would reduce the distance between minds. One of the difficulties was that in any interaction, employees always came up with the blame game and kept pointing out the responsibility of the management to bring about improvements and own up the failures, besides the failure of equipment performance and other shortfalls. This was a mindset that had crept in over many years of working in a casual manner and had put the management and Managers on the defensive. It had become an accepted position that managers would listen to allegations from the employees and top management was responsible for all wrongs. The other thing was to blame the upstream units and the downstream units besides blaming maintenance by operation and vice- versa. Moreover most employees, Executives or Non-Executives thought that they were working very hard but not getting enough reward or
recognition. These made interactions getting focused on these aspects rather than on discussing how to make things better. This had to be overcome, again, by a paradigm shift. It needed some straight talking and some courageous actions. It was of paramount importance that the employees understood that turning around the loss-making steel plant was NOT the sole responsibility of the Managing Director only, and that each employee had to accept responsibility in his/her respective place and sphere of work.
A New CredoIt was against this backdrop that I commenced a string of interaction sessions within a few months of taking over the charge of RSP. These were called Workshops for “Sharing Concern”, involving nearly 120 employees at a time from key operational (production) departments to start with, and later from centralized services and maintenance departments. In each of these Workshops, 70% of participants were nonexecutives. I sat through each and every Workshop and set the tone with some tough talking. I explained the areas of concern, which I had identified and have explained earlier in this article and repeatedly reminded them that “We ourselves are responsible for the situation in which the Steel Plant finds itself ’. While things were bad, improvements could not come from actions by anyone from outside or the Managing Director alone. On the other hand, solutions of the RSP's problems could come only through internal physical actions to be performed by the employees themselves on the shop- floor. The deliberations in these Workshops can be summarized as follows:

81
For the first time, we had the financial figures of the steel plant placed before the employees who got a feel of where we stood financially. Although there was a possibility of the employees becoming demoralized through this sharing of information, I decided to go ahead so that there could be a sharing of concern through this knowledge. Components like gross margin, revenue realisation, fixed cost, variable cost, contribution and net margin (or profitability), relevant to the department, were also presented and discussed in detail. Through this type of presentations, one thing was made clear: Our focus had to be on “profit-related working” and each one had to understand whether a particular action was contributing to more cost, or, to more revenue. Accordingly, the employees, had to be careful and carry out actions in a manner that would inclusive revenue rather than cost.
The employees were encouraged to explain their understanding of the problems and what according to them could be the solution, and their views were taken seriously. But it was emphasized during the interactions that there was no use of blaming others because everyone was accountable for the results. It was, therefore, necessary to sit with the people we blamed because they were also one of us, so that the job was done as it was supposed to have been done. During the Workshops, it was reiterated that, “The future of the steel plant lay in the hands of the employees themselves”. It was therefore important that each employee did what was expected off him/her and not what was convenient to him or her.” On several occasions when employees felt the pressure of hard work, they would talk of rewards, but I would tell them that “no one was doing RSP a favour by working hard. The process of reviving RSP involves hard work like never before and I cannot promise you anything for this hard work. But the one thing I can assure you of at the end is a sense of accomplishment. I can tell with confidence that it will be much more satisfying than any reward that you may get.”
Because of the adverse market conditions, the steel plant had been operating only three out of its four blast furnaces. The steel plant, because of its low capacity utilization in the primary units, had
evolved a system of importing slabs from other sister units to keep its finishing units in the mills running. While low capacity utilization added to fixed cost, the import of slabs also added to cost. For RSP's profitability, it had to produce slabs from its own hot metal, and then convert them into finished products against firm orders rather than the estimated projections.
I took two important decisions in the early days to counter this situation. The first was to absolutely minimize the import of slabs from the sister units and the second was to reintroduce four-blast- fumace operation.. Since the market conditions had not improved this was a risky decision. But I decided that instead of importing slabs it was better to focus on cost reduction through the existing capacity utilization for profitability, which was our ultimate objective. This entailed pressure on blast furnaces and steel melting shops both the which had poor track record in continuous operations. At the same time, it was decided that the finishing units shall not produce except against firm orders. It was made clear that it is better to keep our finishing units idle and carry out maintenance activities for better operations than to make steel which ultimately was not sold.
I impressed upon my colleagues that while it was the job of the Central Marketing Organisation to organize orders for us, we had to wake up to the fact that the RSP had many unique products whose customers were known and that we needed to get them to understand that we were in a position to fulfill their needs. This strategy of organizing customer contact was put in place by which their requirements of quality were understood and met.
Simultaneously, all concerned were asked to explore ways and means to meet customer requirements in terms of quality, packaging, ana chemistry, etc. Innovations were encouraged in all units from sinter making to finishing units.
The health of the blast furnace, (specifically BF # 3) was in very bad shape. During November 2001 when pressure on production was very high, I decided for its Shell Repairs in banked condition

82
and fixed a target of 21 days for the same. This was for the first time in four decades that a major job was finished before time. The employees were asked to diagnose the cause of these breakdowns and mal-operations and come out with their own suggestions for preventing them. Surprisingly, they came out with solutions, and even some departments took oaths to not do anything that will cause mal-operations.
To meet the challenges it was essential that there was discipline throughout the organization. Also, it was essential that everyone joins in. It was made clear through disciplinary actions that those who did not take the duties at the shop-floor seriously, were not going to be tolerated. The background or level of the person ceased to matter in cases of breach in discipline. Several executives and nonexecutives were proceeded against in a very transparent and fair manner to set examples of our seriousness to set things right at the steel plant.
Initial Results of the Turnaround StrategyGradually, the results started coming monthly production and sales figures surpassed all earlier levels in almost every area. Stocks were brought down to a manageable level. Innovations enabled smooth operation of production units even in the worst monsoon. Hot strip mill took up rolling of longer slabs for better customer satisfaction. Packaging of HR coils, cold rolled products and silicon steel reached a level that customers began to acknowledge. Employees were able to recognize the kind of potential that they and the steel plant possessed, and began to speak of targeting higher levels of performance. For the first time many of the units likes sinter plant, steel melting shop No. 2, hot strip mill and silicon mill simultaneously performed at rated capacity giving employees tremendous confidence. Other departments also smashed their existing records and began to look for further improvements.
What had been achieved was a “reduction in the distance between the minds” of people and elevation of spirit of working to help each other in their respective departments which made the initial results possible. Employees began to see themselves as members of a family on a single
platform with a common purpose. This gave me a great deal of confidence. In fact, the resistance among the employees to work hard for results seemed to be significantly less. They had tasted success and felt a sense of accomplishment like they never had before. This led to reaching targets that were nearly 20% higher than before for the financial years 2002-03 and 2003-04.
Engaging Large Groups for Securing the FutureWith the steep growth plans, the need was to involve the entire collective in larger groups so that the combined effort could be brought about through synergy. So, we began what is probably unprecedented in corporate history. Starting from April 1, 2002, each Wednesday, I along with the Executive Director (Works) interacted with 500 different employees of different levels belonging to different departments at the Gopabandhu Auditorium inside the plant premises. Popularly known as Managing Director's weekly Mass Contact Exercise, it is now being regularly held since then, and perhaps constitutes the longest- lasting large group intervention anywhere in the world. Here again, I set the tone first by spelling out the issues which impacted the “Survival and Future of Rourkela Steel Plant”. We shared in fo rm a t ion rega rd ing the p r io r i t i e s , achievements, performance against potential, and what prevented us from doing better, etc. The presentations on each topic was made by nonexecutive employees from different shop-floors who communicated in either Oriya or Hindi. These were backed up by departmental level discussion programmes called “Performance Excellence Workshops” which focused on the kind of performance expected from the departments for RSP's growth In both kinds of programmes the presentations were followed by interaction sessions where the idea was to enable individual employees to come out with their action plan as to what they would like to do individually and as members of their department for achieving the steep targets.
As would be expected, the interaction programmes began with the question of low earnings in some units due to low production

83
which was not always the fault of the workmen. People also complained of lack of resources and lack of planning etc. I took it as an opportunity to tell people that we had to address customer needs. For example, unless the pipe plant collective produced shorter lengths there would be less orders. Similarly, I told the employees that ensuring proper main tenance was the responsibility of the department's employees, and the maintenance was also under the same head of department. If they did not sort out the things the situation would not improve. While answering and responding to suggestions of the employees I made it amply clear that we should better stop the production if there is any risk to the safety of our employees ,or, if the health of the equipment is not up to the mark. I also emphasized that all employees would have to report in time and stay till the end of the shift so that we got continuous production and output.
The Samsakar movementI had to keep the pressure and had no hesitation in telling people that we were still far from achieving our potential. I pointed out that we were losing quite substantially on account of delay shift-start and on account of leaving work before shift end. I also informed people about the kind of losses incurred due to wild cat work stoppages which were due to people with interests not in line with the interest of RSP. I called upon the employees to the choice was either to work hard and survive or perish. Most importantly, I told the employees that it was up to us as to what our future was going to be.
I introduced a movement called “SAMSKAR”, which later came to be recognized as the Vision of SP. It emphasised that “We have to create and sustain a peaceful work environment where every employee can contribute to the plant in assigned area of work with full freedom and dignity and without fear”.
The employees also wholeheartedly adopted OUR MIS SION which stated - “The future of our Steel Plant lies in our own hands. It is our collective responsibility to rebuild our Plant into a profitable, harmonious and vibrant organization.
We will do whatever things are necessary which are good for our Plant. We shall never do anything that hurts our Plant.”
Collective CourageThe process of change that was evolving so uniquely at the RSP was the one that focussed on accepting the primacy of the RSP. During the mass contact exercise it was made clear that we are sitting together to discuss the future of RSP which in reality was the future of the employees and their family members. Responding to a workman who had justified a work stoppage orchestrated by some unruly contract labourers and spoke with disrespect to the dreams and aspirations of the RSP collective, I had spontaneously said, “People like you who do not want to work for the future of RSP are not wanted here, and you can go.” All employees present accepted that this was what we all wanted.Several employees in fact that they did not want indiscipline in the plant and wanted the harshest action against culprits who spread indiscipline. In fact, we got our young executives who were unbiased, to examine various aspects of our working discipline, late coming and early going, house-keeping and welfare facilities, etc. Based on their reports which evolved on the basis of extensive interaction with shop- floor employees, a process of reforms was put in place in line with our samskar.
New Systems for the working of the Steel PlantStandard operating practices were put in place for dealing with cases of indiscipline. We came down very heavily on each case of indiscipline by employees, irrespective of their rank or nonexecutives sending out a clear message that those who did not respect RSP were not going to be tolerated. Exemplary punishment orders were passed to convey this point. The distinction between workers and officers was removed. While the transfer of officers for improving working was routine, for the first time, workers were transferred to other departments when required. The redeployment of employees was made to meet the work needs, and not to satisfy the pressure groups or meet personal preferences. Direct reporting system was introduced to get rid

84
of the wasteful practice of reporting through zonal Time Offices, and also to give dignity to the employees who signed 'in' and 'out' in attendance registers at their respective workplaces. A new system of gate pass identity cards for contract labourers and other visitors was introduced. The plant refused to issue gate pass to those who have criminal background. The purpose was to protect the sanctity and security of the steel plant and its employees. Check off system for membership of unions was made open to all trade unions so that employees got the freedom of choice in union affiliation.
Safety standards were overhauled and reset, keeping in mind the “safety First of Employees”, and the employees without basic protective equipment were routinely turned back from work. Two-wheeler drivers without helmets were not allowed entry. Departments were encouraged to organise campaigns like safety, environment with melas involving large groups and also rewards were given every month to the departmental collectives for achievements like zero accident, zero absenteeism, 100% production performance etc.
Results for Financial Year 2004 - 05The plant continued to perform at high volumes. What was significant was that the plant not only produced more than 1.50 MT of saleable steel but also dispatched identical quantity to the market for a record third year in a row, thus establishing the acceptability of RSP's products among the customers.
An important feature of the plant's success was the operation of many of the production units at more than 100% capacity under-utilization for months together overcoming the problem of capacity utilization since the inception. Besides, RSP improved significantly in its techno-economic parameters with unprecedented improvements in various items like consumption, consumption of energy, water, stores and spares etc., per tonne of crude steel, besides a phenomenal improvement in the lining life of converters in both SMS - 1 and SMS - II which brought down the cost of production, thus the profitability.
With this performance, the plant, which had posted net profit from January 2004, was able to move into net profit made for every quarter of the financial year 2004 - 05, and ended the year with an incredible net profit of Rs 1045 crores. This net profit was not only the highest ever in the plant's history, but was also much higher than the sum total of profit earned during all the earlier years. Thus, the Rourkela Steel Plant had come up from a level of Rs. 3 crores loss per day to a level of Rs.3 crores profit per a day, a remarkable recovery achieved in exactly 3 years. A very important aspect of this performance was the restoration of confidence in the employees, encourage their ability to break away from the shackles of fear and low performance, and promotions belief that there was no limit to their abilities once they start working together like the members of a family.
Achieving a Sense of FreedomToday, the Rourkela Steel Plant is a transformed place. It boasts of record profits in excess of Rs. 10000 crore per year. But the real achievement is perhaps elsewhere. In the confidence employees, categorized as follows:
• The uncertainties of the future become a thing of the past.
• The ignominy of belonging to a loss- making plant with no future had been replaced by pride.
• The fear of disruptive elements who held the future to ransom had disappeared.
• Lack of confidence which had become the mindset of the employees changed into enthusiasm, to work.
• The identity of Rourkela Steel Plant and the respect it had started receiving generated a sense of pride in the employees
• Interference from outsiders, politicians or bureaucrats, was not there.
• Establishment of a sense of dignity in working as equals in the progress and prosperity of the steel plant
• A feeling among employees that Rourkela Steel Plant is one big family where employees are employees and not executives or non-executives
• Most importantly, with the kind of
85
transformation that had taken place against all odds, there was a feeling that Rourkela Steel Plant had built inner strengths for securing its future.
Making Rourkela a Steel CityIt began with my reinforcing the annual Vanamahatsov which involved our school children, followed soon by revival of rose & chrysanthemum show, boating facilities & toy train in the Indira Gandhi park, making the annual horticulture & flower shows more popular. Somewhere along the line, as the steel plant marched ahead on a path of prosperity, the residents of Rourkela known as “Steel City”, but by 2001, labeled as a “Dead City”, started dreaming of renovating the town and rejuvenating life and living.
As a starter, with a view to fighting the menace posed by Plastic Bags, we launched one of the first campaigns in the State in the year 2003 which was truly unique, when nearly 14000 participants belonging to schools, colleges besides citizens, socio-cultural organizations and employees of RSP formed a human chain stretching more than eight kilometers to create awareness and discouraging the use of plastic and polythene bags. We then banned the use of polythene and plastic bags in all our establishments. The entire city was given a massive facelift, roads given fresh carpeting, and drains rebuilt, Chowks were made wider in many places, all walls cleansed of all graffiti, etc. Playgrounds and facilities for games and sports were revamped, attracting the sports-loving school and college students to these locations with new enthusiasm.
Rourkela then pioneered “City Architecture in Steel” by building monuments in welded and painted steel to reinforce the commitment of the Steel Plant to various social purposes and to the vision for the future. Some examples are: Water for Life at the water supply department, Ring of Well Being at the Ispat general hospital, steel for Harmony dedicated to the citizens of Rourkela at the Birsa Munda Chowk, Steel for Safety at the traffic chowk, Steel for Prosperity inaugurated by His Excellency the then President of India, Guru-
Shishya Sampradaya in Ispat English medium school, etc. All these were conceived, designed, fabricated and installed from RSP's own steel by its own employees. This truly represents the creativity and enthusiasm of the RSP collective who wanted to fulfill their dream of a new prosperous Rourkela.
Amongst many new civic infrastructures built in Rourkela during 2003-05, the notable ones are: an Astro-Turf stadium for hockey, a Musical Fountain, an Open Air Theatre suitable for an audience of 20,000 people, an 800-seat Auditorium. Many other existing infrastructures which were in poor shape were completely revamped, such as the Gopabandhu library, the civic centre, the Adarsha Pathagar. The Ispat general hospital, the second largest hospital in Orissa, with more than 700 beds, was similarly revamped. In fact, visitors coming from outside acknowledged the change at Rourkela, the cleanliness and the greenery that were visible and the fact that from the 2004, it was cleanest and greenest city in Orissa. RSP has a dedicated Public Health Department, apart from Town Engineering and Town Services Departments, to cater to the sanitation and beautification needs of the township. The Steel plant developed an effective system for collection of bio-degradable, non-biodegradable and inert wastes. These wastes were disposed off in a systematic and planned manner. The steel plant was also pursuing a continual mission to spread the canopy of green in the steel township as well the adjoining areas. It has planted more than 40,34,000 trees since inception. In the last fiscal alone the steel plant has planted around 39,000 trees. RSP has been involving citizens from all walks of life, community neighbours as well as school children in its sustained afforestation campaign. Its efforts have resulted in enhancing the ambience of the steel city and making it a nature lover's delight. It won the “Indira Priyadarshini Brukshamitra Puraskar”, from the Ministry of Environment and Forests, in 2005. The same year, it also received the Golden Peacock Award from the World Environment F oundation.
Rourkela Industrial Township managed by

86
Rourkela Steel Plant had been ranked 14th in sanitation and cleanliness, for the year 2009-10, as per a study conducted by the Ministry of Urban Development, Government of India. It is noteworthy that no other industrial city in the SAIL family or any city in a has come anywhere close to Rourkela Industrial Township. The study, which ranks 423 Indian cities, was conducted jointly by AC Nielsen, Development and Research Services and the Centre for Environment Planning Technology
A Cultural RenaissanceAs Chairman of the Bhanja Cultural Trust in Rourkela, which is one of the eminent institutions in the eastern part of the country, I had an insight into the potential for developing cultural activities at Rourkela. While launching the effort by organizing the famous Oriya Festival “Kumar Pumima” in October 2002, which was a grand success. I gave the idea of a Cultural Calendar by virtue of which major festivals of the region and the country would be celebrated by the Steel Plant with the participation of all the ethnic groups of Rourkela. Today, the celebration of cultural events covers Utkal Divas, Baisakhi, Kumar Pumima, Dola Utsav, Makar Utsav, Raja Sankranti, Rabindra Jayanti and many others. These occasions provide the residents of the Steel City with a wide spectra of Indian culture, classical music and dance giving them a taste of our rich heritage. RSP is also encouraging the Vedvyas Sangeet Nrutyotsav which is held from 1st to 5* November every year. This event brings artists of national and international fame to Rourkela covering every form of dance and music, and has come to be a major event which the residents look forward to every year.
Leading in Corporate Social Responsibility (CSR)Rourkela Steel Plant started some developmental activities in its peripheral villages in the 1970s. Activities like building roads, bore wells and providing some health care activities used to be carried out, which were managed by a section of Town services department of RSP. The funds for these activities were allocated by SAIL under peripheral development.
During 2003, we decided to intensify its corporate social responsibility programs. A separate department was created to manage the programs and projects. In order to create a road pap for the implementation of CSR activities, RSP engaged an expert agency named society for rural Industrialization (SRI) based at Ranchi. After carrying out detailed survey and study of the peripheral area and the people residing there, SRI submitted a report called shankhadawani, which provided the direction for implementation of various developmental projects and programs. One o f th e p r im a r y s u g g e s t i o n s in shankhadhwani was to set up an institute which could be the center for planning, designing and implementation of RSP's CSR programs and projects.
With the objective of institutionalizing the activities related to CSR by RSP, the Institute for Peripheral Development (IPD) was formed. An MOU was entered into with B AIF Development Research Foundation, Pune, to ensure continual professional inputs. The IPD is the nerve centre of RSP's drive on CSR.
AcknowledgementsThe “Experiments in Courage” at Rourkela would not have been successful without the unstinted enthusiasm of the thousands of employees of Rourkela Steel Plant. I am also thankful to many others who stood by me and had faith in what I was doing. It is not possible to name so many of them here. I salute them all.
ReferencesBreak Free; by Prof. Debashis Chatteijee, IIM Lucknow; Penguin Books, 2006; “The Rourkela Steel Plant Story”, Chapter 7, page 73-78.
Strategic Corporate Communication;_by Prof Paul Argenti, Tuck School of Business, Dartmouth, USA; Tata McGraw-Hill, 2007; Chapter5,page 115-116
Corporate Social Responsibility in India; by Dr. S.K. Panda, IAS; ICFAI University Press, Hyderabad, 2008; pages 133,136, 138,271,278-79, 283.

Award Lecture Series ofIndian National Academy of Engineering
Professor Jai Krishna Memorial Award Lecture 2011
Materials in FlightDipankar Banerjee
Department of Materials Engineering Indian Institute of Science
Bangalore 560012
IntroductionOur inspiration for flight derives of course from nature. Satish Dhawan (1) has written a marvellous monograph for Sadhana that described the aerodynamics and mechanics of bird flight (Figure 1). The wings of a bird are designed to do everything that an aeronautical engineer dreams of. They provide active control of an unstable configuration and generate both lift and thrust. Appropriately, our first intimations of the role materials play in flight also emerge from the myth of wings that Daedalus fashioned for Icarus of feather held together by wax. He warned Icarus not to fly too close to the sun or else the wax would melt or too close to the water or else moisture would make the wings too heavy. Icarus, in his youthful exuberance, flew too high.
When once you have tasted flight, you will forever walk the earth with your eyes turned skyward, for there you have been, and there you will always long to return.
Figure 1: Wing configurations in bird flight (1)
The feather is a beautiful interlocking structure made up of a protein called keratin (Figure 2a). This structure is flexible and strong enough to achieve optimum configurations during flight and withstand aerodynamic loads but is also multifunctional: feathers are water repellent, ultraviolet resistant, provide thermal insulation and are regenerative. When the Wright brothers first flew in Kitty Hawk in 1903, they however used an airframe made of wooden struts and a muslin skin held together by steel wire braces, and a 12 horsepower, 4-cylinder, gasoline for engine. That first powered flight lasted 12 seconds. Wood itself is an extraordinary material and, as with many natural materials, it is constituted by a hierarchy of structures (Figure 2b): a bundle of straws made from cellulose, lignin and water with cell walls containing a nanostructure of cellulose fibrils that determine its strength. Wood is of course multifunctional, and its structure provides pathways and mechanisms for regeneration.
AirframeThe transition from wood to metal occurred with
the flight of a monoplane made of an
Calamus or Quill
\ Inferior umbilicus

88
Figure 2: (a) Feathers (3) and (b) deforming wood (2)
The transition from wood to metal occurred with the flight of a monoplane made of an iron frame in 1915, designed by Junkers in Germany. This was the only such plane ever built. By 1917, Junkers had transitioned to aluminium airframes. His use of Duralumin marked the advent of precipitation- hardened alloys. This first application of nanostructured metal therefore preceded Feynman's famous talk by almost four decades.
The limiting factor in the use of materials for airframes is the frictional heating that is associated with the velocity of flight. It is this that provides an upper limit to the use of materials in airframes, as shown in Figure 3.
0 500 1000 1500 2000 2500 3000TEMPERATURE, C
PMC
A1______ Ti__________Ti ALUMINIDE / Ni
REFRACTORY METALSCMC, C/C
Figure 3: Airframe materials capability (3)

Carbon fiber-polymer matrix composites today provide the most effective option for flight in terms of specific strength, modulus and fatigue resistance in the low supersonic regime, and the structural efficiency of the airframe has increased significantly with the application of these composites to both military and civil aircraft over the last decade. Our light combat aircraft uses 43% by weight of composites (including in primary structures such as the fuselage and wings) through manufacturing processes developed at the National Aerospace Laboratory in Bangalore
80%
10%1975 1980 0 1985 1990 1995 2000 2005
and implemented in production at the Hindustan Aeronautics Limited (Figure 4). Cocuring and cobonding supporting struts with the composite sk in im p ro v e s the e f f ic iency o f the manufacturing process while saving weight of metal joints. While carbon fibre prepregs for manufacture are currently obtained from Europe, the DRDO has funded the development of the carbon fibre process at the National Aerospace Laboratory. This effort over the last decade has now stabilised into a technology that is ready for production.
Figure 4 : The use of composites in modern aircraft (4 )and the LCA composite fuselage. The lower pictures show the NAL carbon fibre and the facility (courtesy NAL)
The use of composites in airframes opens the doors for the introduction of multifunctionality. The demands on airframe shape for low-velocity subsonic flight and supersonic flight are conflicting. The long slender wings that reduce lift induced drag in the low-velocity regime must be replaced by swept back forms that minimise
supersonic wave drag, frictional drag and various geometry-based drag effects at higher velocities. A variety of wing shapes such as the oblique wing and the flying or blended wing represent various approaches to this basic issue, and will culminate in the development of adaptive wings that continuously change shape or morph in flight, as

90
do the bird's wings, in response to varying aerodynamic demands. This in tensely multidisciplinary topic, involving aerodynamics, control, and sensor and actuator design, will demand a range of sensor and actuator materials (Table 1) Multifunctionality will include the ability to monitor damage and induce the release of healing fast-curing resin. The Aeronautical Development Agency's DISMAS program has
developed initial engineering concepts for such applications (Figure 5). Multifunctionality will also play a key role in the development of microair vehicles (6). The integration, at various levels, of power sources and sensor with airframe is one of the key objectives of programs that have been initiated by the Aeronautics Research and Development board and the Aeronautical Development Establishment of DRDO.
Strain (%) Stress (Mpa) Energy density (j/g)
Actuation Speed
DielectricElastomers
215 7.2 3.4 medium
PiezoelectricMaterials
0.2-1.7 110-131 0.013-0.13 fast
Shape memory Alloys
>5 >200 >15 slow
MagnetorestrictiveMaterials
0.2 70 0.007 fast
ConductingPolymers
10 450 23 slow
The Human Muscle >40 0.35 0.1 fastTable 1: Some common actuation materials (5).
••
)00 OOOQ••m
•##0O oo m m t
•••
DOO
I - 9 . 6 0 E - 4
I - 0 . 0 0 E + 0
Intensity Graph
11 10
: 2 , 0 8 E - 3
Figure 5 : A Multi-transmitter-Multi-receiver Array with Lamb Wave Tomography Reconstruction developed under ADA's DISMAS programme for damage detection
in composites (CNDE and IIT, Madras), courtesy ADA.
As the velocity of flight increases, aluminium and the polymer matrix composites must be replaced by titanium. The SR 71, the extraordinary highspeed reconnaissance plane that emerged out of Lockheed's famous Skunk Works in 1966, had a frame built completely of a beta titanium alloy.
The than Blackbird flew at altitudes greater, 70000 feet at velocities approaching Mach 3, well out of the range of the surface to air missiles of the day, and has now been retired from service. At still higher velocities and in applications requiring reentry, the primary metal structure of the

airframe will have to be protected by thermal protection structures and leading edged of such airframes will use composites of SiC (Figure 6). The manufacturing process for C-C composites for the rentry nose cone of the Agni was developed at the laboratories of DRDO’s missile complex a long time back. The process was extended to manufacture of C-SiC composites for jet vanes using the reaction-bonded process at the Defence Metallurgical Research Laboratory. However, long term applications require the use of the SiC-SiC carbide composites that are far more oxidation resistant than C fibre based composites. A m ulti-laboratory program involving laboratories of the DRDO (DMRL,
GTRE, DMSRDE), NAL and PSG College of Technology, Coimbatore has developed various aspects of the manufacturing process for SiC/ SiC composites (Figure 6). The process for the synthesis polymeric precursor, polycarbosilane, for spinning SiC fibre has been developed at DMSRDE, and the first runs of spinning experiments were realised at NAL. The CVI process for SiC infiltration has been engineered and optimised at NAL, and a weaving process for the brittle SiC fibre has been developed at the PSG College of Technology. Alternative infiltration processes are being explored at DMRL.
Wings Control Surfaces Cryogenic Tanks
Al/SiC, AI-Li/SiC Carbon/Carbon AI-2219, Al-Li (2090), CFRP
Primary Structures
SPFDB Al & Ti Alloys, IMI 834, Ti-1100,
CFRP, Titanium Matrix Composites
Propulsion
DS&SC Superalloys Refractory
Metals, C/C, C/SiC, SiC/SiC
Actively Cooled Structures
C/C; Mo-Re heat pipes, FGM (SiC/SiC
C/SiC), C/SiC heat exchanger
Figure 6 : Materials in hypersonic transport and SiC/SiC facility at NAL with prototype shapes and structure (courtesy: Y. Mahajan and NAL)

92
PropulsionWhen Frank Whittle offered his concept of a jet engine to Britain's air ministry in 1929, it was turned down as impractical. He pursued his idea with private funding. At the same time, Hans von Ohain in Germany patented his concept of a jet engine in 1934. His engine flew a Heinkel aircraft in 1939, while a Whittle's engine powered a Meteor aircraft in 1941. The improvements in the efficiency and performance of jet engines have since been spectacular as seen in Figure 7. Materials have played a key role. The thermodynamic efficiency of the Brayton cycle that is associated with the gas turbine engine depends on the maximum temperature attained in the cycle, the turbine entry temperature, which is
determined by the temperature capability of materials. Combined with internal cooling and thermal barrier coatings, the temperature capability of the turbine blades today approaches an incredible 1600C degree (Figure 8a, well above the melting point of the nickel base alloys that these blades are made of. The development of cast Ni base alloys is a fascinating story. The key discovery came in 1929 when Bedford and Pilling, and simultaneously, Merica added A1 and Ti to Nichrome, the Whittle material used in the Whittle turbine. It was only in 1940 that Bradley and Taylor envisioned the existence of gamma prime. Improvements in temperature capability that occurred through several metallurgical approaches: increasing the volume fraction of
O
5
O'l - Xe>lU
5 oI -
H (/)DXI- 1940 1950 1960 1970 1980 1990 2000
YEARFigure 7: Improvement in thrust to weight ratio of military engines (courtesy GTRE).
10 '
8 '
6 '
4'
_ . . .M 88 ccaF 404 * crM RB 199 • *
•
OLYMPUS• ADOUR
• •F101 P W 1120
F9/6 *•
gamma prime, solid solution strengthening with vacuum melting and the control of solidification refractory elements, the transition from a forged during investment casting to form of equiaxed, product to a cast product, the introduction of columnar and single crystal structures.

93
(0Q.
o
O>■"bj
30.<OLUO'D5VC1110.2LU
YEARFigure 8: Internal cooling and thermal barrier coating permit higher turbine
entry temperatures. These exceed liquation temperatures of the alloys as indicated by the phase diagram of the Ni-Al system in the background.
The complexity of the internal cooling passages that allow the airfoils to operate with a gas impingement temperature above their melting point is shown in Figure 9. The improvements in temperature capability that seen in Figure 8 are as much due to the material capability as to the development of the casting processes that allows the capture of this complex detail with precise dimensional accuracy. Further improvements in temperature capability are realised through a thermal barrier coating based on zirconia above
an oxidation resistant bond coat. The use of thermal barrier coating for rotating parts under high stresses was enabled by the electron beam evaporation process that imparts the ability to absorb thermal stresses through the formation of a columnar deposition structure.
The Defence Metallurgical Research Laboratory has developed the investment casting processes for integral rotors use in small engines and equiaxed, directionally solidified and single

crystal airfoils, together with oxidation resistant platinum aluminide coatings. Facilities for production with this technology have been created at HAL in Koraput, Orissa. Capability for electron beam physical vapour deposition of thermal barrier coatings has been installed at
ARCI in Hyderabad and process development has been initiated. Alloys developed at DMRL match or exceed the temperature capability of current cast alloys (The alloys are indicated by boxed nomenclatures in Figure 8).
Figure 9: The complexity of the internal cooling configuration imparted by precisely positioned ceramic cores (courtesy DMRL)
Figure 8 also suggests that the improvement in temperature capability of the cast nickel-base alloys is beginning to saturate. However, the next major improvement in the thermal efficiency of the gas turbine will come from the elimination of the requirement for internal cooling. The ultrahigh temperature materials set that is being
explored toward this objective is based on refractory metal intermetallics, the platinum group metals, SiC/SiC composites or ceramic oxides (Figure 10). Many of these materials will find application in the structural components of other air breathing engines such as scramjets for hypersonic propulsion.
— tJi suptwaifcy viaW— Nb-£i Alloy C, compressive rractura/j ieid — Nb'Si MASC. lans*3 IraciuHVyiaU— Uo Si-tS, ecmpfesjive rfactjra icitf — -Si& S lC CMC. tensile yie«— WpOsjiGdAiOs He*urai yield
■ tJPH PMQfWi, rensile yield — JrRliNbNi, conripnessive yield— P lA lta , com pressive yield
ANO-JGdAlO-,
i r f l r .N C .N i
2<X1 4QQ 000 000 1 000 1200 1400 1600 1 SOU
Temperature (UC)
Figure 10: The emerging ultra high temperature materials set (7)

95
While these improvements enable higher thrust, several material and process improvements have driven weight reduction of gas turbines. These include polymer matrix composites for fan blades and casing, integrally bladed discs of titanium alloys (blisks), and integrally bladed titanium matrix/C fibre composite discs (blings). As in the nickel base alloy system, improvements in the temperature capability of titanium alloys have saturated as shown in Figure 12. The search for
Figure 12: A natural limit to the evolution of high temperature titanium alloys set by the beta
transus and onset of Ti3Al precipitation with alloying (courtesy DMRL)
Figure 11: Titanium products together with process maps and simulation of flow (courtesy DMRL)
The materials driven improvement in the turbine entry temperature of the gas turbine has driven consequent improvements in the temperature capability of turbine discs and high temperature titanium alloys of the compressor. Alloy metallurgy and processes to manufacture compressor disc, rings, airfoils and related welding technologies have been demonstrated in joint programmes between DMRL, Midhani, HAL Foundry and Forge for an alloy equivalent to IMI 834 (Figure 11). The development of powder metallurgy processes that are used for high temperature nickel base turbine discs have been initiated at DMRL.
titanium based intermetallics to replace the much heavier nickel base alloys began with the work of Me Andrews and Kessler in the 1950s. The intervening decades have resulted in the emergence of engineering alloys with 'reasonable plasticity' as summarised in Figure 13, which also illustrates the relative merits of these alloys with respect
YEAR

96
to the industry workhorse, the nickel base alloy IN 718, and a high temperature titanium alloy. The TiAl base alloys provide a significant specific modulus advantage, while the orthorhombic alloys provide enhanced specific strength at higher ductility. Much of the work on orthorhombic aluminide alloys was carried out at
DMRL. It is only very recently, after five decades of intermittent effort, that the first titanium intermetallic alloys based on gamma TiAl appear to have found application in the low pressure turbine ofthe GEnx engine for the Boeing 787 (8). Curiously, polymer matrix composites and
Burn Resistance
LMP for rupture at 650C at a specific stress of 70 Mpa/p
Isothermal Oxi dation in air at 650 C, mg/cm 2
Specific yield stress at 650C,
Mpa/p
Ductility at Room
Temperature% El
Specific Stress Intensity, AK.po/p for Fatigue Crack Growth at 3.10 -4
mm/cycle
Specific Modulus at 650C, Mpa/p
Specific Low Cycle Fatigue Life, in cycles at
a plastic strain amplitude of + .03%/P
0 alloys y-TiAl IN 718
Figure 13: A radar diagram comparing properties ofthe titanium aluminides with theNi-base alloy, IN 718 and a conventional titanium alloy, IMI 834.The LCF comparison is for IMI 834 at 600C, IN 718 and the gamma TiAl alloy, Ti-46Al-2Nb at 650C, and an O alloy at 550C. The crack growth comparison is for IMI 834 at 550C, and IN 718, the gamma TiAl alloy, Ti-47Al-2Cr and an O alloy at 650C. The densities used in the normalization of data are 8.2 gm/cc for IN 718,5.5 gm/cc for the O alloys, 4.8 gm/cc for IMI 834 and 3.8 gm/cc for gamma TiAl alloys (courtesy; DMRL)

97
intermetallics have been implemented first in commercial engines in a complete reversal of past trends. The use of orthorhombic aluminides and gamma TiAl in the high temperature compressor of advanced military engines continue to be explored (9).
The life or durability of materials is as important as other aspects of performance, ranging from several hundreds of hours for military engines to several thousands of hours for commercial engines. DMRL and GTRE have embarked on a programme to combine materials behaviour and continuum mechanics in sophisticated life prediction tools that will in the future incorporate online damage sensing as well.
Conclusion
We have traced a brief history of the materials usage in flying machines, and have indicated our capability in this area. We have also indicated our future requirements. For airframes, we see a shift in emphasis from materials that improve structural efficiency through improvements in specific properties to smart materials that will enhance aerodynamic performance through a d a p t a b l e s t r u c t u r e s , a n d i m p a r t multifunctionality, as well. In propulsion we envisage the development of the next generation ultrahigh temperature materials for uncooled gas
turbines and other air breathing engines, together with intelligent online damage assessment capability. The scale of our efforts will be directly dependent on the progress in our military air vehicle and propulsion programmes for both manned and unmanned vehicles in the coming years.
References
S.Dhawan, Sadhana, 16,275-352,1991.Gibson, L. J. & Ashby, M. F. Cellular Solids Pergamon, Oxford, 1988.Source unknown.
P. Sparaco, Aviation Week and Space Technology, 59,2004.
S.G. Wax, G.M. Fischer, and R.R. Sands, Journal of Metals, 17-23, 2003.
L. Christodolou and J. Venables, Journal of Metals, 39-45,2003.
J.-C. Zhao and J.H. Westbrook, MRS Bulletin, 624-629,2003..
G. Norris, Flight International, 2006.
S. Kandebo, Aviation Week and Space Technology, 37-38,2004.

Award Lecture Series ofIndian National Academy of Engineering
Professor Jai Krishna Memorial Award Lecture 2012
Geometry's Role in Discovery of DynamicsAmitabha Ghosh
Platinum Jubilee Senior Scientist, The National Academy of Sciences India Aerospace Engineering and Applied Mechanics Department
Bengal Engineering and Science University, Shibpur P.O. - Botanical Garden, Howrah - 711 103
Introduction
Dynamics, i.e. the 'Science of motion', is undoubtedly one ofthe most fundamental aspects of all sciences and serves as the foundation for most engineering and science disciplines. Although the critical points are summarized in the form of three laws of motion which look very simple to even school students now-a-days, it took about two millennia to arrive at the final level that was marked by the publication of Newton's 'Principia' about three centuries ago. The process of conceptual evolution of the basic concepts of 'Dynamics' is a wonderful story of adventure of human intellect. Here only one aspect will be dealt with namely the role played by 'geometry' in the discovery of'Dynamics'.
Presently, all Eire habituated in using various mathematical tools like algebra and calculus in handling dynamical problems; but most often it is forgotten that the present approach is a relatively recent development. Even Newton's work was predominantly of geometrical nature. The first step towards calculus-based mathematical description of dynamics was taken by Jacob Bernoulli. In his book 'Phoronomia' one finds, for the first time, the laws of motion in differential forms in the year 1716. But the final formulation of dynamics in more or less today's mathematical language was done by Leonhard Euler in 1736. This formulation made 'dynamics' accessible to all interested in science, and perhaps, led to 'Principia' remaining a closed book to most.
In this presentation it is intended to show how geometry played a key role in the conceptual evolution of the basic principles of dynamics and
our understanding ofthe universe. Till the time of Rene Descartes there was no suitable approach to represent motion of physical objects except through geometry.
Geometry, by virtue of its nature, appears to be the most suitable means to represent distance, displacement, rotation etc. This was also one of the first branches of mathematics that was the obvious choice of scientists and philosophers for describing motion. Another point that has to be kept in mind is that the progress in the understanding of science of motion was very closely linked with astronomy. This was so because most of the observed motions on the surface of the earth are complicated and difficult to analyze without accurate time measuring devices and a sound knowledge of dynamics. On the contrary, the heavenly motions appeared more uniform and understandable. They repeated year after year offering good opportunity to make systematic observations. Since the use of geometry was so extensive in all scientific activities it will be desirable to chose only those applications of geometry which led to conceptual evolution and developments in physical understanding. Thus, many very innovative applications of geometrical principles for measurement purpose will be omitted. The whole evolutionary process that led to the development of the subject of 'Dynamics' is extremely complex. To extract some clear ideas from this complicated scenario the only option is to concentrate upon the key concepts. Thus, apart from presenting some early developments in kinematics this article will take up the matters related to the development of the concept of force and action-at-a-distance, composition of motion

leading to the understanding of orbital motion and universal gravitation and associated problems. The origin of the fantastic realization that 'force' produces 'acceleration', and not 'velocity' as was thought earlier, will be also discussed.
As we all know it was Aristotle who first systematically studied the subject and his principles and ideas, though very wrong, prevailed for almost two millennia! Of course, philosophers started thinking about the earth and the universe even much before Aristotle's time. By the time Hellenistic astronomy reached some
maturity the philosophers already found out that the earth was spherical. They also determined the size of the earth by the use of geometry and some astronomical phenomena. A rudimentary model of a geocentric universe gained the general acceptance based on common observations. The heavenly celestial dome used to be considered as a sphere but by very intelligent observation and thinking they concluded that the heavenly sphere was much larger in size compared to that of the terrestrial globe. The geometrical property that led to this understanding is that a diameter divides a circle into two equal parts (Fig. 1 a).
99
From observations philosophers knew that when star A rises in the eastern horizon and star B sets in the western horizon then (at some other season) when B rises in the east A will set. Thus, the configuration would have been as shown in Fig. la. If the earth's size were comparable to that of the heavenly sphere, the configuration would have been as shown in Fig. lb, and, obviously, the observation would have been then different so far as the simultaneous rising and setting of stars A and B was concerned. Philosophers found the absolute symmetry of a circle very amazing and ascribed maximum importance to this shape. Since there was no concept of force as a cause of motion all motions were thought to be the natural
tendency of objects to go to their natural places. These motions were called 'natural motions'. Motions contrary to that were called 'violent motion'. As the stars and planets appeared to move in circles uniformly, uniform circular motion was considered as the natural motion of the material of which the stars were made of (the 5th element).
The first concept of manipulation of geometry to match the observed 'kinematics' resulted from a deviation from the expected uniform circular motion. It was found that for describing the four equal sectors of a whole year the sun takes unequal times (Fig. 2a). This was horrifying to the philosophers.

100
Figure 2 (a) Figure 2 (b)
Uniform circular motion the sun was considered to be a must; then how to explain the observation? Hipparchus first brought the concept of geometrical kinematics to save the situation. He suggested that the sun is moving uniformly in a circle, but the earth is slightly away from the centre. Thus, the motion looks non-uniform from the earth which is not at the centre (Fig. 2b). With
‘"s../ \ ____ j L.
! -v.-M '■I I I/ \ /■ V /
/ \ /• \ // w V
O / . E
further observations some other problems confronted the philosophers so far as the uniform circular motion was concerned. It was observed that sometimes a planet moves in a retrograde fashion. Their brightnesses were also noticed to vary. Ptolemy and other contemporary astronomers found a satisfactory solution to this using geometry.
' " Vs ' X S ?i V " \
A "— i------------
/ \ ! i / ! / y .
/ \ / / \V ■' \)\ / \ /\y/ s/ /E
/y <i
Figure 3
It was suggested that a planet moves on an epicycle with its centre at A as shown. The points rotates around the centre of a circle as shown in Fig. 3. By suitable combination of the speeds the retrograde motion of a planet could be also explained. Furthermore, the varying distance of P
Figure 4
from E (the earth) could explain the varying brightness of planets. As is known today this transitory concept and celestial kinematics is totally wrong but the clever use of geometry could match the observations successfully. At a later time astronomers could produce any observation

101
by adding epicycle after epicycle as shown in Fig.4. Unfortunately, this apparent success of the ancient astronomy only delayed the discovery of the real character of our solar system.
Much later Copernicus following the suggestions
! i i i i \
\ \\ \\ \\ \
\\
VS .
s .N .
o 11 *— ______r
_______V " / ////y
Figure 5 (a)
An outer planet (say Mars) moves at a slower speed than that of the earth. So an examination of the four successive positions of the earth, E„ E2, E} and E 4, and the corresponding positions of the Mars, MIt M2, M} and M 4 are considered, the planet mars will appear to move backwards for a short period in the background of the fixed stars. This also explained the strange and unexplained coincidence that retrograde motions take place only when the planet is nearest to the earth and so
of Aristarchus for a heliocentric model of the universe did propose a heliocentric model as a theoretical model. The preference for that model was justified by the use of geometry. This model could produce retrograde motion and variation of planet brightness very easily as indicated in Fig. 5a.
- " A - -
I'-— A / \
ii\\\
v V.
o \
Figure 5 (b)appears brightest. This could not be explained by the epicycle model. This model could also geometrically prove why an inner planet (say Venus) can never be away from the sun beyond a maximum angular distance (Fig. 5b).
Using the accurate observational data recorded by Tycho Brahe over a long period of time, his assistant Johannes Kepler was able to determine the orbital planes of the planets. Following a
L in e s o f n o d e s o f t h e p l a n e t s
Figure 6 (a)
Copemican model he showed that all the lines of nodes (Fig. 6a) intersect at the sun (Fig. 6b). This gave rise to the concept of an interacting force between the sun and the planets. Till then the
Figure 6 (b)
motions of the planets were considered as natural motions and sun had nothing to do with that. Kepler first realized that sun must be the cause of the motion of the planets. Though, he did not realize the

true nature of the dynamics of orbits which are composite motions but he became aware of a crude model of gravitation as an interacting mechanism between bodies not in contact. In fact, this marks the birth ofthe modem concept of force.
The next major development was made by Galileo. Using geometry he was the first to show the composite nature of projectile motion. This was important as later Newton used this to analyze orbital motions and completed the theory of Universal Gravitation. Galileo also analyzed
102
uniformly accelerated motions and showed that the distance covered increases as square of the time elapsed. In modem mathematical form it is equivalent to *=- at2 . The law of inertia of motion (uniform rectilinear motion) was perfected by Rene Descartes.
The most interesting application of geometry was made by Huygens in analyzing the acceleration of a point rotating along a circular path. It can be realized that it is of paramount importance for studying the orbital motion of planets.
Fig. 7 shows a circle of radius r and a particle moving on it with a speed v. According to the first law of motion already established by Rene Descartes, the particle will move with a constant speed v along the tangent AP if it is freed from the constraint to move in the circle at point A. So, if the particle is free to move it will reach point B after a time t and at point C after time 21. However, being constrained to move along the circle it reaches point D instead of B after time t. It should be noted that the whole analysis is being done in the immediate vicinity of A. Hence the distance AB, BC and the arcs AD and DE are extremely small in comparison with the radius r. Furthermore, DB and EC, in the limit, can be considered to be linear extensions of the radial lines OD and OE, respectively. (The figure is
exaggerated to explain the geometry). So v t« r . Now BD is the distance through which the particle may be considered to have fallen to the centre (because of its circular motion) in time t. Now
BD - OB - r
= (r2 + v V ) 1/2- r
= r2.2
1 + v t1/2
- r
, I v V ^1 + -
1 v2 2 « r2 r
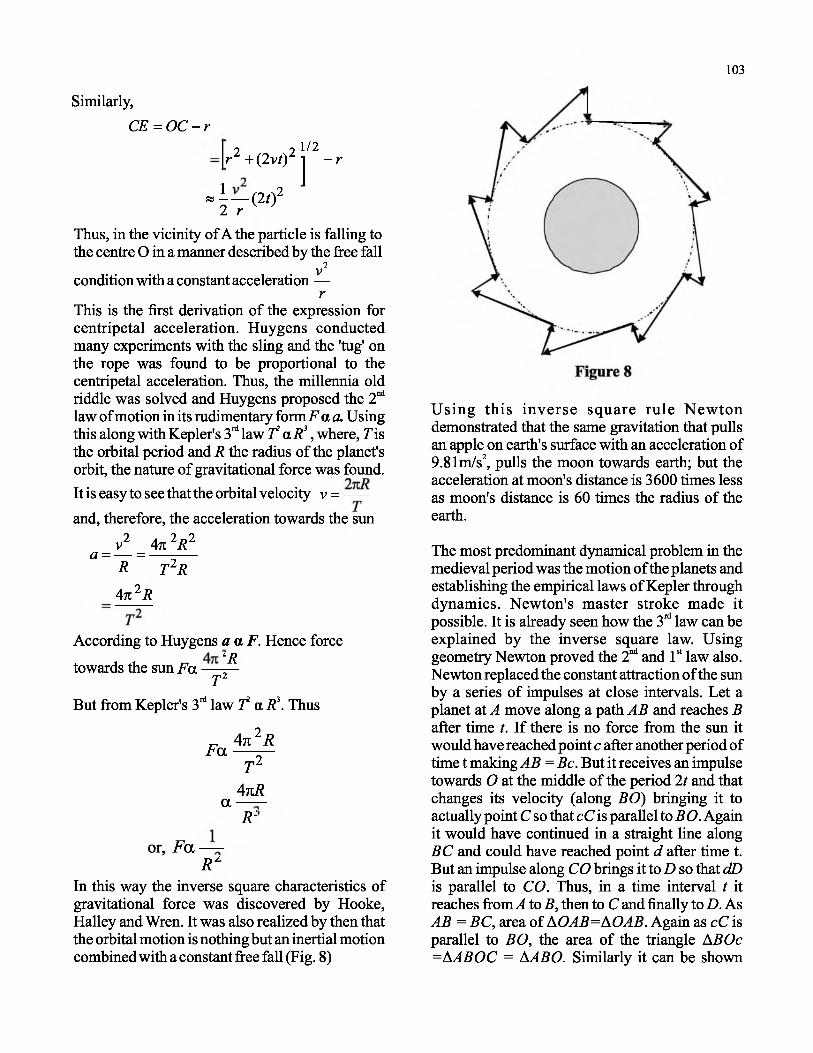
103
Similarly,CE = OC - r
1/2r 2 +(2v0 2 l ~ r
» \ — (2t) 22 r
Thus, in the vicinity of A the particle is falling tothe centre O in a manner described by the free fall
2condition with a constant acceleration —
rThis is the first derivation of the expression for centripetal acceleration. Huygens conducted many experiments with the sling and the 'tug' on the rope was found to be proportional to the centripetal acceleration. Thus, the millennia old riddle was solved and Huygens proposed the 2nd law of motion in its rudimentary form F a a. Using this along with Kepler's 3rd law I s a R3, where, 7is the orbital period and R the radius of the planet's orbit, the nature of gravitational force was found.It is easy to see that the orbital velocity v = -----and, therefore, the acceleration towards the sun
v2 4712R 2a = — = — -—R t 2R
4k 2 R
According to Huygens a a F. Hence force
towards the sun Fa ^rji 2
But from Kepler's 3rd law I 2 a R \ Thus
F a
a
4712 Rrj-r'Z
4kR
R :
or, F aR z
In this way the inverse square characteristics of gravitational force was discovered by Hooke, Hailey and Wren. It was also realized by then that the orbital motion is nothing but an inertial motion combined with a constant free fall (Fig. 8)
Using this inverse square rule Newton demonstrated that the same gravitation that pulls an apple on earth's surface with an acceleration of 9.81m/s2, pulls the moon towards earth; but the acceleration at moon's distance is 3600 times less as moon's distance is 60 times the radius of the earth.
The most predominant dynamical problem in the medieval period was the motion of the planets and establishing the empirical laws of Kepler through dynamics. Newton's master stroke made it possible. It is already seen how the 3rd law can be explained by the inverse square law. Using geometry Newton proved the 2nd and 1st law also. Newton replaced the constant attraction of the sun by a series of impulses at close intervals. Let a planet at A move along a path AB and reaches B after time t. If there is no force from the sun it would have reached point c after another period of time t making AB = Be. But it receives an impulse towards O at the middle of the period I t and that changes its velocity (along BO) bringing it to actually point C so that cC is parallel to BO. Again it would have continued in a straight line along BC and could have reached point d after time t. But an impulse along CO brings it to D so that dD is parallel to CO. Thus, in a time interval t it reaches from A to B, then to C and finally to D. As AB = BC, area of AOAB=AOAB. Again as cC is parallel to BO, the area of the triangle ABOc =AABOC = tsABO. Similarly it can be shown

104
The proof of the 1st law of Kepler, i.e. a planet describes elliptic orbit with sun at one of the foci using geometry, is far more involved and required the genius of Newton to comprehenced. Apparently, even he took a long time. As the final example how the geometry played the vital role in unraveling the mystery behind motion and inertia, N ewton's proof of 1st law is presented below.
The approach is to show that with an elliptic orbit the centre of attraction being at one of the foci the force of attraction, i.e., acceleration towards the centre of attraction, is inversely proportional to the square of the distance. Let the orbit be the ellipse shown in Fig. 10 with AB and KL as the major and minor axes, respectively.
A
Figure 9
that tsAOB = ABOC=ACOD. This proves the area law of Kepler known as the 2nd law that states that a planet describes equal area in equal times during its orbital motion. It should be noted that the area law is valid for motion under any central force.
B
Figure 10
Let the sun be at F and the planet at P. It moves toY in an extremely small interval of time At. The same planet when at position p moves to y in the same amount of time At. Hence by the 2nd law the area of A FPY= area of A Fpy. If there had been no attraction the planet would have moved to point X from P (along the tangential path) in time At. But
due to the attraction along PF it falls to the position Y where XYI is parallel to PFQ. The same argument is valid for the planet at position p. Thus, the distance fallen in time At at P is X Y and that at p is xy. Using the properties of ellipse Newton proved the following relation:

105
w A B x P Q x Y Z 2X Y = --------- --—-----X Ix K L 2
When, A t —> o ,Y —> P and X I —» P Q . So far as an infinitesimally small interval of time is concerned
X Y -» x YZ2 KL1
, AB 2Similarly at/? xy —» — — x yzKL2
XY YZ2Thus, the ratio of the falling distances at P and p is given b y ---- =xy yz
Again, since the areas of the triangles FPY and Fpy are same — x FP xYZ = —xFpxyz
XY YZ2 Fv2Hence,----= — - = —*—=■ and the distance of fall, that is proportional to the acceleration (or forcexy yz FP
according to the Huygens' finding), is inversely proportional to the square of distance from the sun.
Conclusion acceleration. Huygens' work on centripetalacceleration showed the equivalence between
The above proof is an excellent example of free fall under gravity and accelerated motion. It geometry's application in dynamics. As seen from took more than two centuries for Einstein to start the above discussion the limiting form of his journey for establishing his General Theory of geometry was the way to handle a quantity like Relativity using this equivalence concept.

Award Lecture Series ofIndian National Academy of Engineering
Professor Jai Krishna Memorial Award Lecture 2012
Creativity : A Personal ExperienceM.L. Munjal
Honorary Professor and INS A Senior Scientist Department of Mechanical Engineering Indian Institute of Science, Bangalore
IntroductionBom to nearly illiterate parents on the wrong side of the border, and starting my life from a refugee camp, I rose to receive awards from three different Prime Ministers! Here are a few glimpses of my life story with the hope that it will inspire the younger generation to challenge themselves at every stage and convert adversity into advantage, instead of cribbing about inadequacy of resources, facilities and opportunities.
Creativity: A Personal ExperienceAs a three year old child, living in a refugee camp in Hoshiarpur, Punjab, I overheard my father thanking God. I asked him what he was thanking God for when we did not even know where the next meal would come from. He answered simply, “Son, we are alive, isn't that sufficient?” That ultimate bottom line has stayed with me all my life. I realized that God gave us life and the rest is in our hands; no excuses!
Luckily, the Government gave us some refugee grant and the Sanatan Dharam Higher Secondary School waived all tuition fees. Never mind if I had to walk several kilometers daily to the school without proper shoes. One day, during morning prayers in the school, a guest lecturer told us that as physical strength can be increased by means of regular physical exercises, intelligence could be increased by intellectual exercise; nobody is bom intelligent. This appealed to me instantly. I started challenging myself intellectually. Playing with integers, I developed 'magic tables' to entertain myself as well as my classmates. I turned adversity into an advantage. I engaged myself with mathematical challenges that made me excel not only in mathematics but also everything
logical. In fact, my excelling in mental mathematics was partly due to my father who used to do most of his accounting mentally in his vocation as utensil vendor.
Looking for logical patterns in algebraic calculations was my hobby. This is how I developed during the eighth standard what I later came to know was called the binominal theorem.
At the end of the 7th grade, during vacation time, when challenged by my brother who would not let me play, I took up the 8th grade Mathematics book, taught myself from the text, and solved all exercises in two weeks' time. This not only took my brother off my back (he could no longer stop me from playing), but also led to self-discovery. I realized that I did not need a teacher. With the resultant self-confidence, despite my spending evening hours to play cricket for my school, I secured 5th rank in the Punjab University in my Higher Secondary examination. On hindsight I realize that had I been coached I would never have risen to heights of creativity.
However, the future was bleak because my father could not afford to send me to college. But then, as the saying goes, God helps those who help themselves. The Government introduced the 'Government of India Scholarship' for life for the first ten rank holders of every university in the country (In 1961 there were very few universities in the country). So suddenly my higher education right up to PhD was taken care of.
I wanted to pursue my career in Mathematics and Physics. However, I was persuaded to take up Engineering for its lucre. I joined the Punjab

107
Engineering College, Chandigarh in Mechanical Engineering, but my mind was always in research. During the summer vacation after 3rd year, we visited Bangalore on an educational tour of South India. That was when I discovered the Indian Institute of Science (IISc) by chance. The whole batch of students of Mechanical Engineering went to Mysore by buses, but due to some mis- communication, I was stranded in the IISc campus. During those two days and nights, I went around the library and the laboratories, and realized that the Indian Institute of Science was indeed the place I had been always looking for. Fortunately, next year I got selected to do my ME degree in the Department of Internal Combustion Engineering without any formal interview or test. During my stay at IISc, I developed a great interest in vibrations as well as in mathematics.
In the 4th semester, I was asked to work on analysis and design of mufflers for the engine exhaust noise control. However, acoustics or noise control had not been taught in the class. In fact, it was not a part of the curriculum those days. I had the option to request for a change of the project. However, I decided to take it up as a challenge. I went to the library, selected a book on 'Fundamentals of Acoustics' and gave myself a crash course in acoustics. I read the book by Kinstler and Frey cover to cover and solved most of the problems. Then I did a literature survey of the journal papers available in the area of muffler acoustics. I realized that very little had been done on rational synthesis of exhaust mufflers. The normal practice those days was one of trial and error. I felt intuitively that I could do better than that. Over the next three months, making use of m athematical induction, electro-acoustic analogies, and heuristics of matrix multiplication (all self-taught), I developed an algebraic algorithm by virtue of which I was able to write the out the expression for Insertion Loss of a given linear dynamical filter, without having to write and so lv e th e g o v e rn in g e q u a tio n s simultaneously. This algebraic algorithm was not only a break-through for the analysis of onedimensional filters but also for the rational synthesis of vibration isolators as well as exhaust mufflers. This was a. Had I not challenged myself,
I would have ended up making, at best, a small incremental contribution to the field. Instead, I developed a niche for myself. When I made a presentation on my work in the Department seminar, the only question I was asked, “How did it all occur to you?” It was difficult to explain that it was the result of my life-long affair with mathematical induction; a habit of looking for logical patterns in algebraic operations.
Owing to a unanimous recommendation of the faculty of the Department, I was offered a lecturership in the Department without any interview. In fact, a supemumary post was created for me, waiving the requirement of a Ph.D for the lecturer's post. At this juncture, I was advised by my friends and colleagues that I should go to Europe or US A for Ph.D. Their argument was that nobody at the Department of Internal Combustion Engineering has any credentials in dynamical filters or acoustic filters and exhaust mufflers, and that even if I got a Ph.D, it would have little international recognition. My spontaneous rejoinder was that MIT or Caltech had their reputation because of their faculty and alumni, and I would stay here, make the best of the meagre resources the II Sc had to offer, and publish papers in the best of journals. I would make my Institute as well as research supervisors proud of me. By God's grace and my sustained research work, I succeeded substantially.
As a lecturer I was teaching the subject of vibrations. I wanted to set up some basic experiments for research as well as demonstration forwhich. I requested the Chairman of the Department for a grant of Rs. ten thousand. He said that I had to wait for at least one year. Denial of this grant disappointed me at first, but then I challenged myself to carry with on my analytical research so that I would not need experimental validation.
I learnt and made use o f the theory of combinatorics to establish the sufficiency of the constraints for writing the Velocity Ratio in terms of valid combinations of the characteristic impedances of the elements constituting a dynamical filter, making use of an ingenious two-

108
row array of the element subscripts. Based on the analytical validation of my algorithm, I got my PhD degree, and soon after I was awarded the Science Academy Medal for Young Scientists in Engineering Sciences for 1975.1 received it at the hands of Mrs. Indira Gandhi, the then Hon'ble Prime Minister of India during the Science C ongress at W altair in January 1976. Unfortunately, the atmosphere of the Science Congress was marred by the ttate of emergency that had been declared in the country a few months earlier.
During the next seven years, I worked on the analysis of commercial mufflers, most of which made use of perforated elements. This posed a formidable challenge. In association with one of my PhD students, I developed a distributed parameter approach along with eigen analysis of perforated element mufflers. Apaper based on this work was adjudged the best paper in the world in Muffler Acoustics by Nelson Industries in USA, and we got the Nelson Acoustical Paper Award (First Prize) in 1984. Based on this breakthrough, I got two projects from the Volkswagen Foundation, Germany, and published a few papers that have been cited widely.
I had my first sabbatical at the Institute for Technical Acoustics, Technical University of Berlin, during 1979-80, where I gave a course on muffler acoustics in English. I did not know much of German and my audience were not proficient in English. So, I used to prepare and hand over Xerox copies of the course in English one week in advance. These sets of notes became the first draft of a monograph. Thus, I converted a problem into an opportunity. I improved the notes over the next few years, and finally it was published by John Wiley, New York, in 1987. This monograph has remained till today the only book on this subject, and has been cited in most of the papers that have appeared in journals during the last 25 years. (Incidentally, its second edition is under preparation and may be published by John Wiley, Chichester, UK in early 2014).
During my sabbatical stay in West Berlin in association with Prof. Manfred Heckl, I worked on the mechanisms of the railway noise
generation. In particular, I studied the rail-wheel interaction and modeled the flexural vibration of the rail as well as wheel, and investigated the effect of the periodic sleepers underneath. An interesting result of the study was that the sleepers should not be placed at equal distances; exact periodicity was responsible for harmonic excitation of the rail resulting in excessive noise in certain bands of frequencies and thence the train speeds.
I received the 'Shanti Swarup Bhatnagar award in Engineering Sciences' for the year 1986 at the hands of Shri Rajiv Gandhi, the then Hon'ble Prime Minister of India, and the Fellowship of the Indian National Science Academy (1987), Indian Academy of Sciences (1987) and the newly established Indian National Academy of Engineering (1987). In a way, I became a Founder Fellow of the INAE, although I was away at the University of Calgary in Canada and Nelson Industries in Wisconsin for my second sabbatical. During my stay at the Nelson Industries, I worked for the first time on active noise control of the air handling units used in thermal power plants and on the heating, ventilation and air conditioning (HVAC) systems. Our studies revealed that in a tuned ANC system, the secondary source (or auxiliary source) and the primary source unload each other. They present acoustical short-circuit (zero acoustic impedance) to each other. In other words, they are made to silence each other by means of an adaptive digital infinite impulse response (HR) filter working on the feedback control or feed-forward approach.
In 1988,1 was approached by the DRDO to work on acoustic propagation across lined hulls. This was an entirely new field, but then I took up the challenge and eventually developed the guidelines for design of the stealth linings for submarines. There was an element of serendipity here, but then, as they say, serendipity has never happened to an un-initiated person. The graphical user interface (GUI) as well as the codes for analysis of these resonator linings were passed on to the Indian navy. This and some other associated pieces of research got me the coveted DRDO Academic Excellence Award for the year 2009 at

109
the hands of Hon'ble Prime Minister of India, Dr. Manmohan Singh.
My third sabbatical was at the Climate Control Division of the Ford Motor Company in Michigan. I worked in the challenging field of vibro-acoustics of hoses and bellows. The studies revealed that apart from their role in vibration isolation and the structure-borne sound, hoses and bellows play an important role in the break-out noise as well as in enhanced axial transmission loss. Concurrently, I have been active in the environmental noise control. I was the Chairman of the National Committee for Noise Pollution Control, which advises the Central Pollution Control Board, the executive wing of the Ministry of Environment and Forests. Since its inception in 1998, b a se d on th is c o m m itte e 's recommendations, the Ministry of Environment and Forests has issued Gazette notifications for the control of noise from diesel generators sets, portable gensets, automobiles, fire crackers, public address systems, etc. This work has been recognized by the Government of Madhya Pradesh by awarding the Pt. Jawaharlal Nehru National Award in Engineering and Technology for the year 2010.
Subsequent to my formal superannuation in July, 2010,1 have been retained as Honorary Professor. During the last three years, I had the honour to work as INAE Distinguished Professor. Since August 2013,1 have been INS A Senior Scientist. Since 2010, I have been working and guiding graduate students)in the analysis and design of multiply-connected mufflers. These are used extensively in automotive exhaust systems that call for high wide-band insertion loss, particularly at and around the firing frequency, and low backpressure. Multiply-connected mufflers satisfy both the requirements, but pose formidable challenge in modeling. An Integrated Transfer Matrix (ITM) method has been developed and validated for such muffler configurations. To avoid the rather cumbersome computational fluid dynamics (CFD) modeling, lumped flow- resistance network model has been developed for evaluation of the mean-flow back-pressure, making use of the (nonlinear) electric circuit
theory. Based on my sustained work in muffler acoustics, I was invited to deliver a plenary address at the 18th International Congress on Sound and Vibration at Rio de Janeiro, Brazil. During the inauguration ceremony, I was bestowed with Honorary Fellowship of the International Institute of Acoustics and Vibration.
I have always worked on practical problems. It is more challenging, yet it is more satisfying to an engineering scientist. I have carried out more than 100 consultancy projects during the last four decades, apart from helping the DRDO and the defence forces. Working in the institutional consultancy mode, I have been able to earn for (or return to) the IISc a substantial part of my salary or pension, apart from increasing my take home salary or pension. Moreover, my students get the opportunity to work on real-life problems. Consequently, they are in high demand in the industry. I must say, being myself an active researcher, I have been able to attract some very good students for PhD or M.Sc./ME whose creativity has often surprised me.
ConclusionArising out of all these personal experiences, there are a few suggestions that I would like to make to the younger members of the scientific and academic fraternity:1. Be resourceful. The best of science was not
created by scientists with great resources. In fact, I often turned the lack of resources into a challenge and the result was amazing. A fellow scientist from USA once remarked, “But then, you had the advantage of adversity!”.
2. Everybody wants to work at, or be associated with, a world class Institute like Indian Institute of Science. Well, IISc is what it is today because of its outstanding faculty as well as alumni. Why don't we aim at excelling ourselves, so that the Institute's name shines further. Let us rise to a level that the Institute feels proud of us.
3. If you enjoy your work you will never feel tired. I proved this to myself again and again

110
in my life. As per the science of Psychology, a man can work 24 hours a day provided he is not doing what he is obliged to do. Enjoy the process of research; do not make it a job. Work does not kill, stress does; and stress is a state of mind, an attitude.
4. Creativity increases as we think deeper and deeper, and this depth can be achieved by thinking about a problem undisturbed for long hours at a stretch without coffee breaks. It was this kind of long, uninterrupted sittings in the library that resulted in the development of the path-breaking algebraic algorithm for analysis of one dimensional acoustic filters and vibration isolators at the start of my career.
5. When you listen to a teacher in the class you may not grasp or retain everything. However, if the teacher tells you to read yourself what he is going to teach the next day, you will be alert in the class to clarify your doubts, and
when teacher touches upon those points you will never forget the answers. This is what I do in my classes. My student, incidentally, discovers his potential, and is ready for research by the time he finishes the course.
6. Often students complain about a particular teacher being too harsh in marking. H ow ever, I to ld m yse lf in sim ilar circumstances that the teacher may deduct more marks for a small mistake, but if I did not make any mistake, what could he do? This led me to strive for perfection, which resulted in self- confidence, self- esteem and creativity.
7. In the long run, clarity about basic principles, laws and concepts is more important than cramming for the examinations. Concepts remain with you for a long time and, during spells of deep extended thinking, result in creativity.

Award Lecture Series ofIndian National Academy of Engineering
Professor Jai Krishna Memorial Award Lecture 2014
Unmanned Systems - Strategic ChallengesAvinash Chander
Scientific Advisor to the RakshaMantri Secretary, Department of Defence Research & Development (DDR&D)
Director General, Defence Research & Development Organisation, Ministry of Defence
IntroductionRobotics has made significant progress, since its first deployment as an industrial robot more than 50 years ago. Robots are now a days being used extensively in m anufacturing, services, healthcare/medical, defense, and space. They have enhanced the safety of humans from dangerous tasks, improved the productivity and the quality of life. In the future, the robots are poised to transform the human society in the same way as the computers or internet did in the past.
The defense forces are primarily interested in mobile robots or unmanned vehicles in air, land and sea. The mobile robots or unmanned systems have transformed warfare as evidenced by thousands of them been deployed in Iraq, Afghanistan and Pakistan, that have supported the armed forces in targeting, disarming roadside bom bs, clearing land m ines, surveying intelligence collection etc. Unmanned systems have also proved very effective in fast response to catastrophic and unexpected incidents,including natural or civil disasters like fires, floods and earthquakes.
Evolution of unmanned capabilitiesAn unmanned aerial vehicle (UAV) is an aircraft that carries no human pilot or passengers. The UAVs, sometimes called "drones", can be fully or partially autonomous, but are more often controlled remotely by a human pilot. .Of late, the UAVs have becom e increasing ly more sophisticated, and the term UAV has been changed to UAS, an acronym for Unmanned Aircraft System, which amplifies the fact that apart from being an aerial vehicle, this complex system includes ground stations, satellite
connectivity, sometimes on-board weapons, and other components.In the beginning, the UAVs were introduced primarily to conduct surveillance and reconnaissance missions, taking advantage of their ability to loiter for long periods.The first successful use of the UAV, in a war was demonstrated by Israel during the 1982 Lebanon war, when the UAV called IAI Scoutproved to be of great utility in destroying all SAM sites, partly through the use of Sampson decoys to get them to reveal their presence, and partly through reconnaissance information obtained by the Scout UAVs. Another UAV which proved to be of great utility during war was Pioneer UAV RQ-2A. One of the RQ-2 Aoperation during 1991 Gulf war was assessing the damage caused by naval gunfire to targets on Faylaka Island near Kuwait City, whereseveral Iraqi soldiers signalled their intention to surrender to the aircraft during a low pass the first time enemy soldiers had ever surrendered to an unmanned aerial vehicle. They were later captured by the U.S. ground troops.The next significant advancement of reconnaissance and surveillance UAVs was Northrop Grumman RQ-4 Global Hawk. The RQ-4 provides a broad overview and systematic surveillance using high resolution synthetic aperture radar (SAR) and long-range electro-optical/infrared (EO/IR) sensors with long loiter times over the target areas. It can survey as much as 40,000 square miles (100,000 km2) of terrain a day.
The next major shift occurred when the UAVs were started to be used in weapon attack missions by delivering various lethal and nonlethal payloads.General Atomics Aeronautical Systems, Inc. MQ-1L Predator can provide near real-time reconnaissance using a satellite data link system

112
and perform attack missions as well, through its ability to fire Hellfire-C missiles.The most historic use of the Predator/Hellfire missile combination occurred when CIA ground forces directed attacks against al Qaeda forces during the opening months of the war on terrorism.The next significant leap in UAVs occurred with the introduction of Unmanned Combat Air vehicles. Boeing X-45A Joint Unmanned Combat Air System (J-UCAS), first flown in 2002, was the first modem UAV designed specifically for combat strike missions. The stealthy, swept-wing jet, has fully retractable landing gear and a composite, fiber-reinforced epoxy skin. Its fuselage houses two internal weapons bays.
A recent trend is exemplified by Boeing; it retrofitted a number of retired Lockheed Martin F - 16 fighter j ets with equipment enabling them to be flown remotely without a pilot.
The unmanned advantageRecently, considerable research has been performed to examine whether the UCAV-type platforms might eventually take on at least some of the functions that are historically performed by manned fighter aircraft.Experts argue that the UCAV will replace manned aircraft in certain type of missions. In particular, they are desirable for performing suppression of enemy air defense (SEAD) missions, such as destroying enemy surface-to-air missile (SAM) sites, as these are some of the most dangerous missions flown by manned planes. The UCAVs would also be useful in completing other types of air-to-ground attacks, especially those against heavily defended targets where it would be risky to send pilots. The future would also see the entry of directed energy weapons, which would also get mounted on the UCAVs for effective usage.
The manned platforms also have some serious disadvantages, derived mostly from their inherent human limitations. The maximum Aircraft Manoeuvring that could be sustained by humans is max 9g, while the unmanned platforms are more manoeuvrable than manned planes without the limitations of having a human pilot. The need of aircrew, pressurized cabin and
safety features haveweight penalty, thus unmanned platforms can have enhanced load anaweapon carrying capability. The studies have shown that fatigue has significant effect on aircrew effectiveness, especially in long-duration missions. Therefore, the unmanned platform offers greater potential for a sustained presence over the target areas. Other advantage offered by the unmanned vehicles is significantly lower cost compared to manned vehicles.This should allow the military to buy UCAVs in much larger quantities than the manned aircraft.They can be spent to heavily defended areas without the risk of losing some without endangering a pilot.They can be built stealthier than a manned plane since one of the least stealthy parts of the aircraft,the cockpit is unnecessary.
However, for UCAVs to perform air-to-air combat against other aircraft, would need development of much more advanced artificial intelligence and autonomous technologies.
UAV missionsOne of the key military capability areas that the UAV provides can be classified as battle spaceawareness. The function of the UAV is determined by its payload which is directly related to the task. The UAV s carry a wide variety of sensor payloads: such as Electro-Optics (EO); Infra-Red (IR); Synthetic Aperture Radar (SAR); Signal and Communications Intelligence (SIGINT and COMINT); Chemical, Biological and Radiation (CBR) detection systems; and radio relay equipment. These enable them to perform a variety of tactical missions like intelligence and reconnaissance missions such as like image intelligence, signal intelligence,target acquisition, target designation, NBC missions like monitoring of nuclear, biological or chemical (NBC) contamination etc. In the future, technology will enable mission endurance to extendfrom hours to days and allow for long- endurance persistent reconnaissance and surveillance.One of the challenges of unmanned systems development and fielding is the development of efficient tasking, collection, processing,exploitation, and dissemination technologies in order to translate vast quantities of
113
sensor data into a shared understanding of the environment.The important capability area is force application, consisting of UAVs like Predator, Reaper, and Gray Eagle UASs that conduct offensive weapon attack missions by delivering various lethal and nonlethal payloads. Militarily these systems are gaining tremendous importance, as they can conduct precision strikes on faraw ay ta rg e ts w ithou t c o lla te ra l dam age.C urrent technology and future advancements are enabling single platform perform a variety of missions across multiple capability areas.In February 2013, it was reported that UAVs were used by at least 50 countries, several of which made their own: for example, Iran, Israel and China.As of 2012, the United States Air Force employed 7,494 UAVs, and that means that almost 1 out of 3 US Air Force aircraft are UAVs.There are more than 24 military programs in the world that are developing military UCAVs from the scratch or converting UAVs to armed UAVs and UCAVs, including the BAE systems Mantis and Taranis, ElbitHermis 450, China has also developed WZ-2000 and Chang Hong-3 UCAV platform displayed in various defence exhibitions in recent years.
The Indian scenarioThe IAF currently operates a wide variety of fighter aircraft likeSU-30MKI multirole aircraft, Mig-29, Mirage 2000, Jaguar, Mig-27ML and airborne surveillance aircraft as PhalconAEW, EMB-145AEWCetc.
The Indian armed forces have been operating UAVs for over a decade. The Indian army was the first to acquire UAVs, in late 1990s from Israel, and the Indian air force and the navy followed. The Indian air force initially acquired the Searcher which could operate at an altitude ceiling of 15,000 ft. and then the Heron, which could operate at an altitude ceiling of 30,000 ft. The Technology Perspective and Capability Roadmap (TPCR) 2013 released by the Ministry of Defence (MoD) projects the technologies and capabilities that the armed forces would be looking for in the near future. It considers unmanned systems as a critical technology for development. The IAF has plans to have fully
operational both UAV and UCAV squadrons by 2017.
The DRDO has initially produced Nishant UAV that uses a mobile-launcher and a parachute recovery system, which give it several tactical operational advantages.Presently, a Medium Altitude Long Endurance Unmanned Aerial Vehicle (UAV) called the Rustom-II is being designed to operate at 30000 ft altitude with an endurance of 24 hrs., carrying Electronic Warfare, Electro-Optic and Synthetic Aperture Radar (EO & SAR) payloads. The data-link has been enhancedfrom the existing capability of line-of- sight system to use Satellite-Based Command system. The Rustom will replace and supplement the Heron UAVs in service with the Indian armed forces.The DRDO is also developing the AURA (Autonomous Unmanned Research Aircraft) which is an Unmanned Combat Air Vehicle (UCAV) for the Indian air force. The AURA UCAV will be a tactical stealth aircraft built largely with composites, and capable of delivering laser-guided strike weapons. It would be a stealthy flying-wing concept aircraft with internal weapons and a turbofan engine.
Impact of UAV and UCAV systemsIndia's present holdings of the UAVs are extremely low, and there is a need for greater quantities to meet the battlefield requirements for the future. There is also a need to have a sound 'capabilities roadmap' available, as well as a clear understanding of 'cost trade-offs' to ensure that any acquisition of UAV capabilities is carried out in an efficient and effective manner. The UAVs are great force multipliers and there must be synergy between the three Services to optimise their employment.
A typical scenario for future airpower projection will involve manned and unmanned platforms operating in the 'cooperative” missions.There is a need for planned integration map of unmanned capability into the armed forces. These Strategy for co-existence and use of both manned and unmanned systems needs to be evolved. The UAVs also require significant numbers of personnel for operations, maintenance and data

exploitation to take full advantage of the increased 'on-station' time available. Since it is expected that the UAV operations will be carried out in addition to current air operations (fighter, transport, tactical helicopter, long range patrol etc) additional resources will almost certainly be needed.
The Unmanned systems are an example of “disruptive technology” that introduces new priorities and value structures requiring significant structural adjustments to processes, organizations, andoperational paradigms. Training is a critical link in delivering warfighter capability. The required manpower skills are also different and there is a need for retraining or specialized training. The training should be done at the induction level. The training programs must adequately encompass initial qualification andproficiency/refresher training while also providing room to accommodate growth astechnology, tactics and procedures improve and evolve. There is a need for policy and plans that describe how the populationwill be exposed to unmanned systems through professional military education and training.
Technology research and challengesThe technology challenges perceived for the development ofthe future fighter aircraft are also relevant for progressing unmanned vehicles development programs like aerodynamics, material technologies, propulsion, control, structural, payload, advanced navigation, high speed computing,MEM S sensors and progress in manufacturing technologies.sensors.Some of the specific capabilities which are exclusive to UAVs/UCAVs are the flying autonomy of aerial vehicle, networked operation, swarm control, operating in the m anned airspace and miniaturization of sub-systems like payloads, sensors and propulsion, hum an-system s engineering to decompose, identify, and implement effective interfaces to support responsive command and control (C2) for safe and effective operations.
The sensors technologies compireminiature sensors, multi-sensor data transfer, unaided
114
navigation combining satellite navigation, terrain mapping, relative motion and the human machine interface, real time multi-agent simulation, detect and avoid, fly-by-light, on-board power g en era tio n and pow er density , health management, fault tolerance, cognitive skills.For the defence the key areas of interest forimproving technology are inter-operability and modularity; com m unicationsystem s, spectrum , and resilience; security, protection; Improvements in reliability, maintainability, and survivability; autonomy and cognitive behavior; weaponry,and High-performance computing (HPC). On-board in fo rm a tio n p ro c e ss in g can m itig a te communication requirements and reduce cognitive load on personnel.For operations within controlled airspace indeed any place in which the UAVs have to interact with commercial and private air traffic,would need to be equipped with on-board equipment and capabilities that would allow them to avoid collisions with other airspace users.
Degrees of autonomyThe autonomy of a machine just means its capability for unsupervised operation. Three general types or degrees of machine autonomy can be distinguished: which are pre-programmed autonomy supervised autonomy and complete autonomy. In the case of pre-programmed autonomy a machine carries out a particular function by following instructions that have been inserted into the machine by a designer or user. Supervised autonomy means that a robotis capable of carrying out most of its functions autonomously without having to rely exclusively on pre-programmed behaviors.More complex functions such as targeting and weapons release would normally still have to be controlled by human operator, who is cognitively more capable o f tak in g su ch d ec is io n s . E x cep tio n a l circumstances or situations are simply flagged to a human operator, who then decides to proceed. Supervised autonomy represents the current state- of-the-art in military robotics. A growing number of military robotic systems fall this category, as the Predator and Reaper. The completely autonomous systems are those where humans no longer have to closely watch the performance of

115
robots. Killer robots with complete autonomy only exist at this moment as experimental robots and are built entirely for research purposes. They are often able to learn by themselves and to modify their behavior accordingly. At this moment such robots are simply not intelligent enough to be useful for humans.Autonomous levels are needed to know how well a UAV will do a task, or would develop tasks to reach goals independently. Autonomous level metrics also guide the conception, design, and test and evaluation of autonomous systems. Autonomy, as defined by Autonomy Level For Unmanned Systems (ALFUS), is an “AUMS's own ability of integrated sensing, perceiving, analyzing, communicating, planning, decision-making, and acting, to achieve its goals as assigned by its human operator(s) through designed human- robot interface (HRI)”.
The highest form of autonomy is fully autonomous swarms. Typically, each UAV in a multi-UAV system coordinates with each other to complete a joint mission, such as combat intelligence, surveillance, and reconnaissance, aerial-based communication networking, suppression of enemy air defense (SEAD), identification and destruction of time-critical targets, close air support, cooperative search, persistent area denial fire alarms detection and monitoring, and terrain mapping etc.
A utonom y requ ires advances in m any technologies like autonomous situational awareness, autonomous mission planning, sense and avoid, su rv ivab ility techno log ies, communication and coordination, automatic target recognition, cognitive radio, advanced navigation etc. The enabling technologies are computer science, AI (Expert systems, neural networks, machine training and learning, natural language processing, and vision), cognitive and behavioral sciences and decision aids.
Ethical, legal and other issuesTechnology is a double-edge sword with benefits and risks, critics and advocates, autonomous military robotics is no exception, no matter how compelling the case may be to pursue such research. The worries include not only where the
responsibility would fall in cases of unintended or unlawful harm, but also the possibility of serious malfunction and robots going wild.How will systems that autonomously perform tasks without direct humaninvolvement be designed to ensure that they function within their intended parameters?They also lower the threshold for entering in conflicts and wars, since fewer military lives would then be at stake.
To date, the UAVs have been employed within relatively benign threat environments against enemies lacking sophisticated air defences or effective electronic counter measures (jammers). Even so, losses, mostly through accidents and some as the result of enemy action have been significant. In future the self protection features that account for dangers, fault-tolerance and safety features would be necessary.
Development strategyThere is a need to develop a national vision and strategy for unmanned aircraft systems, unmanned ground vehicles, and unmanned maritime systems that focused on delivery are of warfighting capability. There is a need to have sound 'capabilities roadmap' available, as well as a clear understanding of'cost trade-offs' to ensure that any acquisition of UAV capabilities is carried out in an efficient and effective manner. Service roadmaps need to evolve and mature along with the doctrine, trainingplans, and documentation n e e d e d to s u p p o r t r o b u s t t r a in in g systems.Sensitization of personnel through education and training is necessary.The technology gaps can be bridged by directed basic research , N ational m ateria l in itia tiv e , establishment of manufacturing hubs, aerospace parks, SEZ's and critical test and evaluation facilities and manpower development.
Some areas to establish 'Centre of Technology' for meeting the future cutting edge technology needs have been identified. These are-unmanned warfare, robotic soldier, unmanned aerial vehicle, advanced aerodynamics, next generation propulsion, materials and meta-materials, advanced computing and techniques and the underwater warfare technologies. These centres

116
are proposed to be set-up in leading academic institutions such as IIT, Mumbai, IIT Chennai, IISc Bangalore, Jadavpur University and some others. The Centres will utilize the academia and the student's strength to create dynamic knowledge houses.
ConclusionThe unmanned aerial systems have reached a high level of maturity.The future challenge of designing safe and secure and standardized systems shall lead to integration of these systems into our national airspaces. Systems need to be designed and tested so that they perform their tasks in a safe and reliable manner, and their
automated operation must be seamless to human operators controlling the system. Capabilities may be provided more efficiently through such attributes as m odularity,interoperability, integration with manned systems, and use of advanced technologies.There is a need for development, integration, and testing of interoperability standards.
It is of the utmost importance that international legislation and a code of ethics for autonomous robots at war are developed before it is too late. There is a need to evolve doctrines for legal and ethical use of unmanned systems.

Award Lecture Series ofIndian National Academy of Engineering
Professor Jai Krishna Memorial Award Lecture 2015
Development of Wide Ranging HighNitrogen Stainless Steels for Improved Characteristics
and Resource ConservationL.K Singhal
Jindal Stainless Limited, Hisar-125005
Introduction
If we look at the average annual growth rate in production of major metals and alloys during the last three decades, we note that the growth rate of stainless steels at 5.3 2%is far ahead of others [Fig 1 ].
Lead
Copper
AtLTrvfUum
Cfl<U>rs Stcd
Starless sfceH
Fig: 1 Compounded annual growth rate of major metals (% /year): 1980-2013
This has been possible because stainless steels are man-made alloys in which apart from iron and chromium, addition of alloying elements C, Mn, Si, Cr, Ni, Mo, N, Ti, W, Nb and B coupled with three distinct crystal structures provide almost infinite possibilities to vary the composition,
propertiesand characteristics for widening the scope of applications, to enable development of new functions and to provide ability to adapt to the market forces. Stainless steels thus exhibit remarkably wide ranging attributes [Fig.2].

118
Fig: 2 Stainless steels together exhibit such attractive wide ranging characteristics
Another man-made family of non-metallic materials, i.e., plastic also exhibits similar versatility and matchesthe growth-rate of stainless steel [Fig. 3]
Index; 199D ■ 1003 5 . -1 M l
SCOS t a i n l e s s s t e e t
250J
P la s t ic
200
1 5 0
I P OM l
m
1 9 8 02 0 1 3
Fig: 3 Stainless steel production Vs plastic production
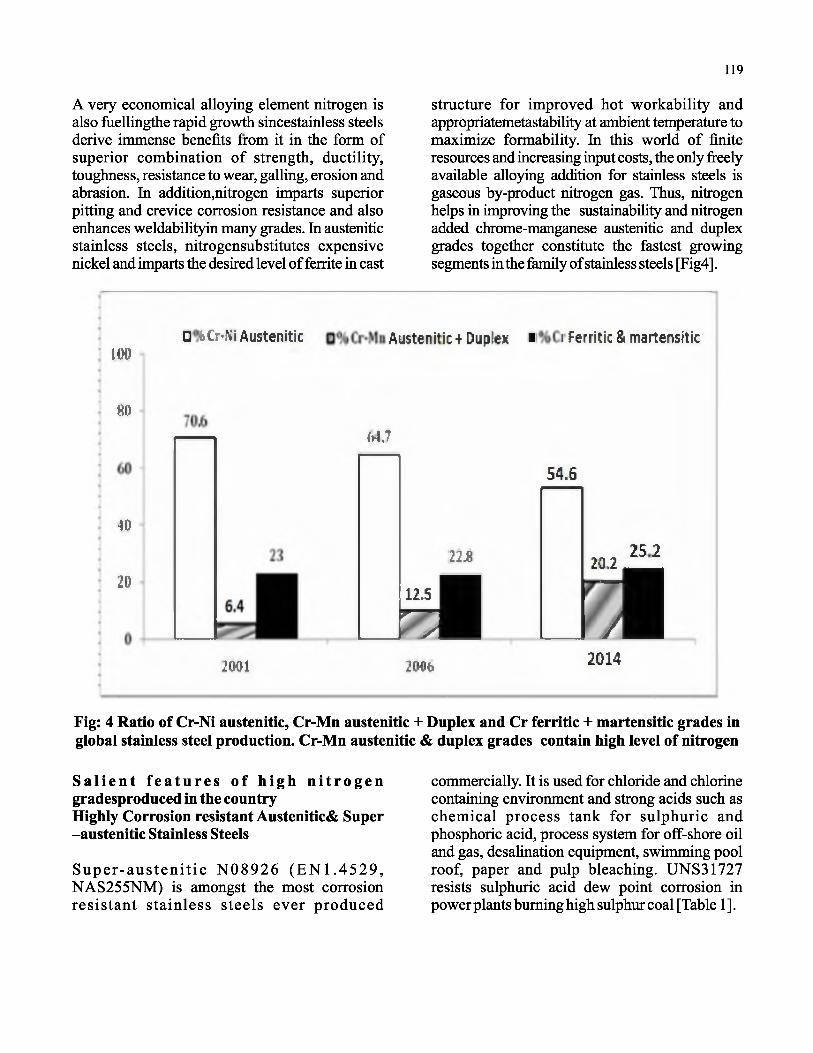
119
A very economical alloying element nitrogen is also fUellingthe rapid growth sincestainless steels derive immense benefits from it in the form of superior combination of strength, ductility, toughness, resistance to wear, galling, erosion and abrasion. In addition,nitrogen imparts superior pitting and crevice corrosion resistance and also enhances weldabilityin many grades. In austenitic stainless steels, nitrogensubstitutes expensive nickel and imparts the desired level of ferrite in cast
structure for improved hot workability and appropriatemetastability at ambient temperature to maximize formability. In this world of finite resources and increasing input costs, the only freely available alloying addition for stainless steels is gaseous by-product nitrogen gas. Thus, nitrogen helps in improving the sustainability and nitrogen added chrome-manganese austenitic and duplex grades together constitute the fastest growing segments in the family of stainless steels [Fig4].
m□ U > N i Austenitic Austenitic + Duplex ■ t Ferritic & martensrtic
m
40
2D
{>1,7
2 2 M
\j M
54.6
2 5 2 202 _
1
2001 2046 2014
Fig: 4 Ratio of Cr-Ni austenitic, Cr-Mn austenitic + Duplex and Cr ferritic + martensitic grades in global stainless steel production. Cr-Mn austenitic & duplex grades contain high level of nitrogen
S a l i e n t f e a t u r e s o f h igh n i t r o g e n gradesproduced in the country Highly Corrosion resistant Austenitic& Super -austenitic Stainless Steels
S u p e r-au s te n itic N 08926 (E N 1 .4529 , NAS255NM) is amongst the most corrosion resistan t stainless steels ever produced
commercially. It is used for chloride and chlorine containing environment and strong acids such as chemical process tank for sulphuric and phosphoric acid, process system for off-shore oil and gas, desalination equipment, swimming pool roof, paper and pulp bleaching. UNS31727 resists sulphuric acid dew point corrosion in power plants burning high sulphur coal [Table 1 ].

Table 1: Composition of two super-austenitic stainless steels containing nitrogen
120
Grade C Mn Cr Ni Mo N CuUNS N08926 (NAS255NM)
=0.020 =2.0 19-21 24-26 6-7 0.15-0.25 0.5-1.5
UNS S31727 (NAS 155N)
=0.030 =1.0 17.5-19
14.5-16.5
3.8-4.5
0.15-0.21
2.8-4.0
These grades derive their very high pitting corrosion resistance from the combined effect of chromium,nitrogen and molybdenum. Pitting resistance equivalent number is given by PREN = %Cr+3.3 * %Mo+K* %N where K according to different studies varies from 13 to 30. Potentio- dynamic studies have shown that in case of all other elements conforming to N08926, increaseof nitrogen from 0.04% to 0.19% dramatically improved the pitting resistanceof this alloy with Epit increasing from 123mV to 265mV at 45°C in
2M NaCl+O.lM HCL solution [1]. Several studies have highlighted that nitrogen and molybdenum act synergistically to enhance resistance to pitting and crevice corrosion [2-5]. XPS analysis of this alloy shows that passive film is more enriched in chromium and molybdenum compared to the bulk composition and on increasing nitrogen content from 0.04% to 0.19%the concentration of these two elements in passive film is further enriched 1. Ipass and Icrit for the two compositions are compared in Table 2.
Table.2 : Ipass & Icrit at different temperatures in0.5M H2S04 in N08926 and its low nitrogen version
Temperature(°C)
1 pass nA/cm2 1 current [oA/cm20.04% N 0.19% N 0.04% N 0.19% N
22 5.08 4.34 34.85 15.050 8.87 8.38 70.30 63.2085 11.97 9.19 448.0 83.1
Composition of the alloys tested :
C Mn Cr Ni Mo NAlloy with 0.04%N 0.02 1.47 20.45 24.65 6.3 0.042Alloy with 0.19%N 0.02 1.63 20.68 24.78 6.3 0.19
Since copper improves the corrosion resistance in sulphuric acid, highly alloyed UNS S31727 is being used in chimneyand damper of power plants which bum high sulphur coal to withstand sulphuric acid dew point corrosion. Other applications include flue gas heat exchanger and dilute sulphuric acid tank.
Heat resistant micro-alloyed austenitic stainless steelUNS 30815, popularly known as 253MA,
exhibits very good oxide stability, high elevated temperature strength and excellent resistance to sigma phase precipitation on account of combination of high silicon, nitrogen and cerium 6 Nitrogen and cerium combine to improve its creep rupture strength.Although it has similar chromium and even lower nickel content than 309S table 3,it can resist oxidation at temperature upto 1100°C whereas 309S is suitable only upto 1000°C.

Table 3: Composition range of three austenitic heat resistant alloys
121
Grade C M n Si Cr Ni N CeUNSS30815(253MA) 0.05-0.1 =0.80 1.4-2.0 22-24 10-12 0.14-0.2 0.03-0.08U NSS30908(309S) =0.08 =2.0 =0.75 22-24 12-15 - -
UNSS31008(310S) =0.08 =2.0 =1.5 24-26 19-22 - -
Fig.5 indicatesthe superiority of this grade over 309S and 31 OS during cyclic testing in air in temperature range of 1000C to 1150C. This grade provides superior service to even 310S grade in carbon, nitrogen and sulphur- bearing environments. S30815 forms a thin adherent and elastic oxide which ensures good protection under cyclic condition.
Fig: 5 Superior cyclic oxidation behaviour of S 30815. Corrosion rate calculated on the basis of testing at elevated temperature for 24 hour followed by cooling to room temperature

122
High Strength Chrome-Nickel Austenitic Stainless Steels:The Popular grades produced in this category are listed in Table 4.
Table 4: Composition range of popular high strength Cr-Ni austenitic stainless steel containing >0.1% nitrogen
Grade C Mn Si Cr Ni Mo N301LN(UNS S30153
=0.03 =2.0 =1.0 16-18 6-8 - 0.07-0.2
304N(UNS S30451
=0.08 =2.0 =0.75 18-20 8-10.5 - 0.1-0.16
304LN(UNS S30453)
=0.030 =2.0 =0.75 18-20 8-12 - 0.1-0.16
316LN(UNS S31653)
=0.030 =2.0 =0.75 16-18 10-14 2-3 0.1-0.16
301LN exhibits very high work hardening rate. Nitrogen increases pitting resistance,proof strength and toughness. High strength permitsthe use of thinner sections. It is extensively used in rail coaches in different tempers due to lower weight and thus more economical running cost. High toughness ensures excellent crash resistance. 304LN, apart from moderately higher strength than 304L, is better suited for applications requiring very low relative magnetic permeability (< 1.005) due to very low ferrite content. This grade is also very resistant to transformation to martensite on cooling to cryogenic temperatures. It is used in applications where magnetic interference is to be avoided and low temperatures such as MRI scanners and LNG tankers respectively. On account of increased corrosion resistance and very low magnetic permeability, 316LN is preferred for certain chemical, pharmaceutical, cryogenic applications and surgical implants.
High strength chrome -manganese austenitic stainless steelsOn account of the presence of nitrogen, the yield strength of the general purpose Cr-Mn grades is
30-40% higherthan that o f304. These alloys with appropriate selection match 300 series in drawability and stretchformability. Some of the Cr-Mn stainless steels produced in the country are listed in Table 5. Cr-Mn stainless steels exhibit attractive combination of strength, ductility, toughness, formability, weldability, wear, and corrosion resistance. LikeCr-Ni alloys, Cr-Mn grades alsohave extra low carbon grades for superior inter-granular corrosion resistance. There are also grades with higher chromium and molybdenum for corrosion and oxidation resistance(T ab le 5 ) .These grades are replacing301,302,304,304L, and 316L for many applications in white goods, kitchenware, architecture, building and construction, automotive& transport and industrial sectors. High nitrogen austenitic grades exhibit vastly superior combination of strength and ductility as compared to vide ranging speciality steels. (Fig6). Economical Cr-Mn grades with high nitrogen can exhibit superior ductility for a given strength as compared to popular 304 grade(Fig 7). Their resistance to wear, galling, erosion, and abrasion is generally superior to other varieties of stainless steels.
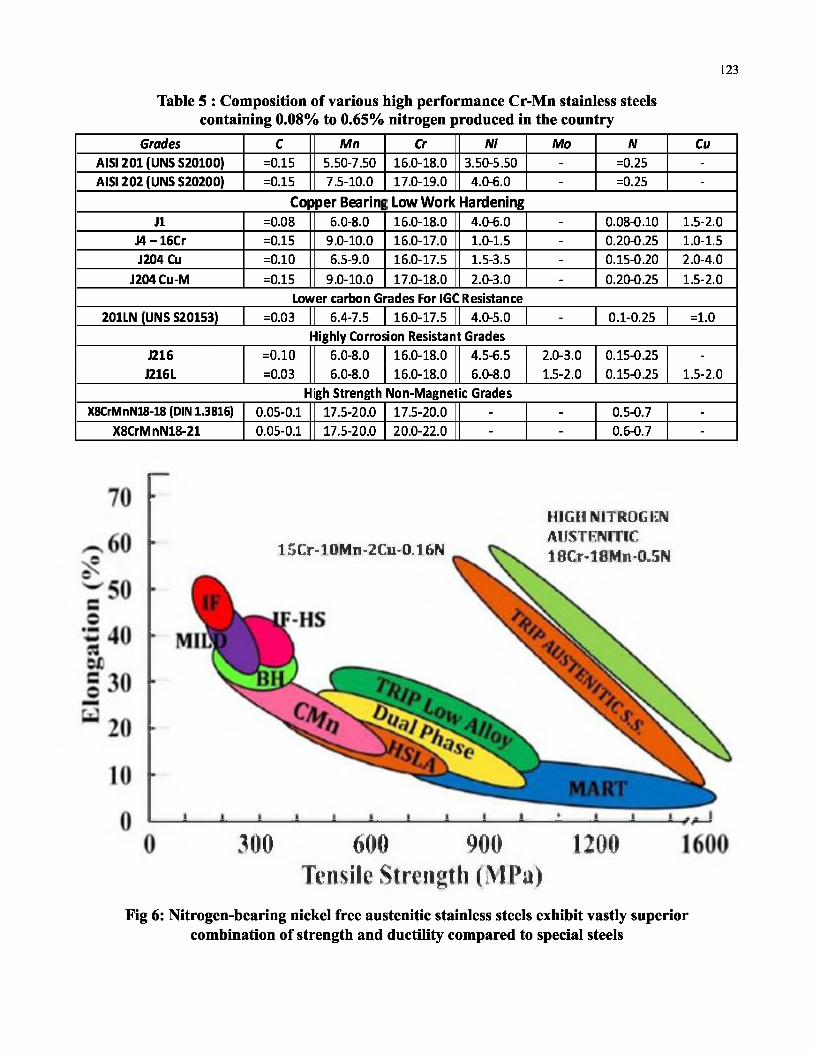
123
Table 5 : Composition of various high performance Cr-Mn stainless steels containing 0.08% to 0.65% nitrogen produced in the country
Grades C Mn Cr Ni Mo N CuAISI 201 (UNS S20100) =0.15 5.50-7.50 16.0-18.0 3.50-5.50 - =0.25 -AISI 202 (UNS S20200) =0.15 7.5-10.0 17.0-19.0 4.0-6.0 - =0.25 -
Copper Bearing Low Work HardeningJl =0.08 6.0-8.0 16.0-18.0 4.0-6.0 - 0.08-0.10 1.5-2.0
J4 - 16Cr =0.15 9.0-10.0 16.0-17.0 1.0-1.5 - 0.20-0.25 1.0-1.5J204 Cu =0.10 6.5-9.0 16.0-17.5 1.5-3.5 - 0.15-0.20 2.0-4.0
J204 Cu-M =0.15 9.0-10.0 17.0-18.0 2.0-3.0 - 0.20-0.25 1.5-2.0Lower carbon Grades For IGC Resistance
201LN (UNS S20153) =0.03 6.4-7.5 16.0-17.5 4.0-5.0 0.1-0.25 =1.0Highly Corrosion Resistant Grades
J216 =0.10 6.0-8.0 16.0-18.0 4.5-6.5 2.0-3.0 0.15-0.25 -
J216L =0.03 6.0-8.0 16.0-18.0 6.0-8.0 1.5-2.0 0.15-0.25 1.5-2.0Hgh Strength Non-Magnet c Grades
X8CrMnN18-18 (DIN 1.3816) 0.05-0.1 17.5-20.0 17.5-20.0 - - 0.5-0.7 -X8CrMnN18-21 0.05-0.1 17.5-20.0 20.0-22.0 - - 0.6-0.7 -
300 600 900 1200 Tensile Strength (MPa)
Fig 6: Nitrogen-bearing nickel free austenitic stainless steels exhibit vastly superior combination of strength and ductility compared to special steels
l5Cr-10Mn-2Cu-0.1GN
HIGH NITKOGKNAUSTENfTIC 18Cr-18Mn-0.5N

124
1 Will
\mnun
i
iwm-
I mL
7 604 J2 4Z■ M i Jllfljr
im\
• ii
♦ juj
204 Cu
304 * *
«e.
iEyLk'y
|N«I
tWKI
tllHl
IZMI
)DW
PUKI
m
• :iw «* JIM
2WCu
304
Fig. 7: Elongation vs Yield Strength and ultimate tensile strength for 304 & 204Cu
Suitably designed Cr-Mn grades exhibit corrosion resistance similar to their Cr- Ni counterpart. For example, comparable corrosion resistance of J216L and316L is observed in wide variety of chloride and acidic media with added
advantage of higher yield strength in case of J216L which can translate into material saving with suitable design.Fig 8 compares corrosion resistance of these two grades in 5% H2S 04 as an illustrative example(7).
C u r r c n l (m A / c m ")
Fig: 8 Potentiodynamic curve in 5% sulphuric acid at 25°C
The ability of high nitrogen grades to exhibit combination of very high strength low magnetic permeability is also a useful attribute for use in many instruments and industrial products. Fig 9
shows that 304 grade develops increasing amount of martensite whereas X8CrMnN 18- 18remains non-magnetic even after heavy cold deformation.

125
Fig: 9 High nitrogen steel X8CRMN18-18 remains non-magnetic even after heavy cold reduction with very high strength
High nitrogen austenitic stainless steels also appear ideally suited for blast resistance. Armoured vehicles require good combination of strength and ductility to absorb the blast energy while maintaining structural integrity. The remarkable feature of high nitrogen Cr-Mn steel is that at a given hardness level they exhibit outstanding elongation and Charpy impact strength which are beneficial for the protection
against blast and fragment in the event of an explosive device detonating before it can be diffused. Their non-magnetic nature is also a desirable attribute for blast resistant material for protection from mines which are magnetically triggered. The properties of a commercial blast- resistant low-alloy steel, aluminium alloy and a high nitrogen stainless steel are compared in Table 6.
Table 6: Comparison between a blast resistant steel, A1 alloy and high nitrogen stainless steel
Properties ARMOX370TCIass2
HNS HNS NHS HNS 7039Aluminium
RHA steel Hot rolled Hot rolled Hot rolled Hot rolled Blastresistant
PlateThickness
40-80mm 50mm 16mm 12mm 8mm 38-45mm
Composition 0.3C-0.4SilCr-0.8Ni0.7Mo-(B)
18Cr-18Mn0.05C-0.54N
18Cr-18Mn0.05C-0.54N
18Cr-18Mn0.05C-0.54N
18Cr-18Mn0.05C-0.54N
Hardness HB 300-350 280 290 350 410 81Y.S. MPa 850 581 702 1006 1072 380UTS MPa 950-1150 864 948 1107 1138 450% Elongation 12-14 53 46 29 28 11-13Charpy Impact (Joule)
3 0 ** 298** 298** 280** “ 6.5-8.3** 70-75++
Note: ARMOX is trade mark of SSAB Sweden; NHS is X8CrNiN18-18;** Notched; ++ Unnotched

126
Stainless steels containing copper and silver precipitates are known for anti-bacterial characteristics. High nitrogen stainless steel, X8CrMnN 18-21 containing 0.65% nitrogen also exhibits anti-bacterial behaviour against wide ranging gram positive and gram negative bacteria
which will further widen the scope of applications of such engineering materials.
Heat resistant ferritic stainless steelThe composition of high chromium ferritic stainless steel 446 is shown in Table 7.
Table 7: Composition of Ferritic grade S44600 which contains high nitrogen
Grade C Mn Si Cr Ni NUNSS44600 =0.2 =1.5 =1.0 23-27 =0.75 =0.25Typical 0.1 0.6 0.4 24 0.3 0.16
In this grade, addition of nitrogen facilitates grain refinement of the cast and rolled structure, which in turn leads to better ductility, improved toughness and superior surface quality of the products. In addition, nitrogen also improves high temperature strength and creep resistance. Owing to high chromium and absence of nickel, it has very good resistance to sulphidizing gases and
salts. Its superiority over highly alloyed 31 OS in fuel oil of high sulphur content is seen in Fig 10. It exhibits good resistance to molten copper, brass, lead and tin. It can be used for service in temperature range of 700 to 1100°C. This steel is used for recuperators, stack dampers, muffle tubes, furnace and kiln linings, boiler components and spouts for molten copper alloys.
140129
120
100
co
"35o 30 72
(XClo
-»0
2 0
4 4 6 3 1 0 SFig.10 : Corrosion test at 900°C for 1000 hours in fuel oil containing
3% sulphur, 0.01%sodium and 0.02% vanadium.

127
Martensitic Stainless Steel
Two martensitic stainless steels,410N and EN 1.4116N, have been produced with nitrogen levels of 800PPM and 1200PPM, respectively.
Table 8 indicates the composition range of these alloys as well as their low nitrogen counterparts. Nitrogen increasesthe pitting potential as well as the strengthand erosion-corrosion resistance of such grades.
Table 8: composition range of two high nitrogen containing martensitic stainless steels
Grade C Mn Si Cr Mo V N410 0.08-0.15 =1.0 =1/0 11.5-13.5 - - -
410N 0.12-0.16 0.4-1.0 =1.0 13.0-14 - - 0.07-0.121.4116 0.48-0.55 =1.0 =1.0 14-15 0.5-0.8 0.1-0.15 =0.11.4116N 0.48-0.55 =1.0 =1.0 14-15 0.5-0.8 0.1-0.15 0.1-0.15
Duplex and super-duplex stainless steels developed indigenously (Table9) and suppliedfor applications in mineral beneficiation, paper
Wide ranging two-phase alloys from lean-duplex and pulp,power, copper refinery, petrochemicals, to super-duplex have been successfully oil & gas and sea-water pumps.
Table 9: Duplex & Super Duplex Stainless Steels
Duplex C Mn Si Cr Ni Mo Cu NUNSS32101 =0.040 4-6 =1 21-22 1.35-1.7 0.1-0.8 0.1-0.8 0.2-0 .25UNSS32304 =0.030 =2.5 =1 21.5-24.5 3.5-5.5 0 .05-0 .6 0.05-0.6 0 .05-0 .2UNSS31803 =0.030 =2 =1 21-23 4.5-6 .5 2.5-3.5 - 0.08-0 .2UNSS32205 =0.030 =2 =1 22-23 4.5-6 .5 3-3.5 - 0 .14-0 .2
Superduplex C Mn Si Cr Ni Mo Cu N WUNSS32750 =0.030 =1.2 =0.8 24-26 6-8 3-5 =0.5 0.24-0.32 -
UNSS32760 =0.030 =1.0 =1.0 24-26 6-8 3-4 0.5-1.0 0.20-0.30 0.5-1.0
The addition of nitrogen additions increases the austenite ratio for a given nickel, chromium and molybdenum content. Thus nitrogen helps in achieving balance of 50% austenite-50% ferrite phase more economically. In duplex stainless steels, ferrite phase contains more chromium and molybdenum than the austenitic phase which in turn is richer in nitrogen. For example, in lean- duplex 32101, nitrogen in ferrite is -0.04% whereas it is around ~ 0.4% in austenite. Similarly, in super-duplex S 32750,nitrogen
~0.06% in ferrite and ~0.48% inaustenite, and thereby identical PREN of -42 in both phases (8). Thus, in duplex stainless steels, the positive effect of nitrogen on pitting corrosion resistance is even more enhanced due to higher solubility of this element in austenite which is less resistant to such localized attack than ferrite. The beneficial effect of high chromium and nitrogen contents in duplex stainless steels is evident from( Fig 10) which compares the critical pitting temperature of four austenitic and duplex stainless steels.

128
S O
7 0
6 0
g 5 0
% 4 0
3 .E 3 0
2 0
i o
o
C o m p a r i s i o n o f C r i t i c a l P i t t i n g T e m p e r a t u r e a s p e r A S T M G 4 8
□ 1
□□ I
3 0 4 1 2 1 0 1 31SL 3 2 3 ( ^ ^ 0 8 9 0 4 3 2 2 0 5 N 0 8 9 2 6 3 2 7 S O
Fig: 10 Comparison of critical pitting temperature of four austenitic and duplex gradesS32101 has only 1.5%Ni as against 8% in 304. S32101 and S32304 without appreciable Mo that can replace 316with 10% Ni & 2% Mo. S32205 with only 5% Ni and 3% Mo is superior to N 8904 with 20% Ni and 4% Mo in respect of pitting resistance, and 32750 with only 7% Ni and 3.5% Mo matches N08926with24%Niand6%Mo.
The addition of nitrogen slows down the diffusion coefficient of chromium and molybdenum at high temperature and as a result the steelis less sensitive to intermetallic phases, an aspect of vital importance for successful processing of superduplex grades. Nitrogen addition in duplex stainless steels has really made them highly weldable. Nitrogen raises the temperature at which austenite begins to form from ferrite. Therefore, even at relatively rapid cooling rate after welding, problem of excess ferrite in HAZ is avoidable. Thus, deliberate addition of nitrogen in second generation of duplex stainless steels has fostered their rapid growth.
ConclusionStainless steel grades with their varying compositions and crystal structures are endowed with very attractive wide ranging characteristics. New superior / cost- effective grades are also continuously evolving to fulfil the emerging needs, provide new functions and meet market demands to fuel its rapid growth.The paper has
listed several high nitrogen containing stainless steels of austenitic, super-austenitic, ferritic, martensitic, duplex-and super-duplex varieties produced successfully in the country and offering a range of of benefits accruing from nitrogen addition in these grades.
Reference:C.R.Clayton& K.G. Martin, Report to Office Naval Research, October 1988
R.C. Newman & T.Shahriba, Corr. Sci. 27(8) (1987), 837-843
RFA Ja rg e liu s P e tte rsso n , C o rro sio n 54(1998),162-168
I. 01efjord& L. Wegrelius, Corr. Sci. 38(1996), 1203-1220
U.Kamchi Mudali, R.K.Dayal, J.B.Gnanamurthy & P.Rodriguez, Trans IIM, 50(1997)37-47
J.D.Wilson, TJ.Camey & J.C.Kelly, Corrosion, 2005,Paper 05422
V S h a n k a r R o & L . K . S i n g h a l , J.Mater.Sci.442009,2327-2333
J.Charles& P.Chemelle, 8th Duplex Stainless Steels Conference, 2010, Beaune, France 29-82

PROFESSOR S.N. MITRA MEMORIAL AWARD LECTURES
Award Lecture Series ofIndian National Academy of Engineering
Professor S. N. Mitra Memorial Award Lecture 2005
Microsystems-on-Silicon: A Revolution on Grains of Sand - Indian Status and Prospects
A.B. BhattacharyyaEmeritus Professor
Jaypee Institute of Information Technology, A-20, Sector 62, Noida - 201 307
IntroductionIt is indeed a great honour to have been awarded Prof. S.N. Mitra Memorial Award of the Indian National Academy of Engineering. The story of my silent, intimate and behind- the scene interaction with Prof. Mitra, spread over more than one and half a year, in translating the idea of an Academy of Engineering in India to a reality, is not known to except anyone two of us. It was very much at the level of personal relationship and shared perception. Apart from the wisdom of the award committee to select me for the award I see an invisible hand of destiny as well in being the first awardee. It is perhaps a common practice on such occasions to highlight personal research as that is the safest option for the speaker. I, however, opt for dealing with the status of microelectronics revolution in our country, a topic for which I have a deep sentimental attachment, because as a professional involved in this area I considered it important for our country. How developing countries will address silicon revolution is a topic with global interest (1). India with its huge domestic markets and skilled human resources is reckoned as a country with huge potential for silicon revolution, but it seems to possess little will power to seize the opportunity. The area of microelectronics is the story of a technological revolution in silicon, in layman's language, on the grains of sand. In spite of all sorts of speculation about its doomsday due to possible emergence of new nano materials I believe that it will be decades before an alternative can be found for the silicon micro system, and ignoring its development would put us way behind in the industrial race. The presentation will deal with (i) Microsystem on silicon (MOS^.In literature MOS stands for
Metal-Oxide-Semiconductor structure which is the b asic b u ild in g b lock d riv in g the semiconductor revolution, (ii) The technical details have been avoided so that the highlight is on behavioural feature of the area which can be comprehended even by a non-specialist.
Here I eleborate some astounding developments that have taken place in the world of silicon which are influencing our daily life, and also briefly retrospect on the Indian status and look ahead for possible opportunities in future.
I quote a poem of a young poetess (U.B) from the Silicon Valley characterizing the grains of sand which are the basic raw material of silicon that has dominated the human civilization for about fifty years: A few lines of the poem are as follows:
Grains of SandDeserted along l a m a grain o f sand
That will think As you shrink
From the outstretched hand....You surrender me to an unseen script
Cleaving me In leaving me
Still love will light the sunless crypt
The words to note are: shrink or sink, leave or cleave. These words aptly epitomize our dilemma.
Facets and JargonFor every person on this planet microelectronics industries produce currently on the average 60 million transistors. By 2008 the figure is projected to be one billion for every individual.

131
For the last forty years the average compound growth rate is around fifteen percent and the microelectronics business is around 200 billion US Dollars. It literally controls a market of about one trillion US dollars. Silicon is expected to overtake
steel in a couple of years from now. Indian domestic semiconductor market is Rs. 1700 crores i.e. only 400 million US dollars. It is an embracing statistic for the nation of India. Indian semiconductor production is around Rs. 40 crores.
Table 1: SI A International Roadmap: 1999-2014 [2]Year 1999 2002 2014
Feature size (mm) 180 130 35
Minimum mask count 22-24 24 30
Wafer diameter (mm) 300 300 450
Memory (Bits) 1G 4G IT
Transistor /Sq.cm (|iP) 6.2M 18M 390M
Interconnect level 6-7 7 10
Clock speed (MHz) 1250 2100 10000
iP Chip size (mm2) 340 430 901
DRAM Chip size (mm2) 400 560 2240
Power supply 1.5-1.8 1.2-1.5 0.37
Maximum power 90 130 183
No. of pins 700 957 3350
The past and feature progress of silicon revolution can be depicted through Table 1(2) called the r o a d m a p , w h i c h m a k e s f a c t s a n d accomplishments look stranger than fiction. The above scaling projects accounts for 15% growth of global electronics market.
Moore”s LawIn 1965, Gordon Moore, the founder of INTEL, used four data points to make an empirical prediction that the number of transistors per chip would double every two years. Actually it doubled every eighteen months. The prediction has survived for forty years and the road maps
closely follow Moore's law. A layman's figure is that sixteen transistor in a chip in die beginning of twenty first century! Moore's Law predicts the half-life of any processes technology as very small. It may be designated astechnological soap bubble!
The scaling characterized by the roadmap is associated with the following implications.
• FAB Cost escalates exponentially• Chip becomes cheaper• Design cost, effort and time increases
progressively

132
• Number of model parameter describing the electrical characteristics of the transistor increases exponentially (say, from ten to thousands!)
• System on chip (SOC) is the ultimate product frontier
Moore's Law has survived in spite of various limiting factors because it has fuelled the ever- increasing expectation and hunger for cheaper, faster and smaller electronic systems triggering innovation, competition and ever-widening domain application, unforeseen ever before in the history of mankind.
In short, the optimist's viewpoint is that Moore's Law has to survive in order to sustain the human
highlights the escalating Fab cost from which the following observations can be made:
High capital expenditure for entry intechnologyHigh entry barrierExpensive wafer technology upgradation L i m i t e d f ew c an s u s t a i n t he manufacturing business.
Indian Status in ManufacturingThe following developments are noteworthy:
Semiconductor Complex Limited (SCL) set up with 5 |xm technology in 1983 as a public sector enterprise
spirit which may even want to scale heights beyond the limits of the sky. The journey from microelectronics to nanoelectronics and beyond is a natural evolutionary process. In the nano scale dimension quantum phenomena dominate the device physics.
Printing house is not everybody's cup of teaThe scaling unleashed by Moore's Law stretches every aspect related to manufacturing to the state of its fundamental limits which have to be continuously scaled by new technology. Hence, it is not the problem of only developing one technology. Each technology node means development of multiplicity of technology. Hence, only selected few can play the printing game on silicon on a mass scale. Table.2
Present capability 0.8 jim with in-house development effortPresently taken over by the Department of Space to India's strategic needs and assigned status o f a development laboratory
• Total investment around Rs. 400crores so far. Wafer turn-over capability of2000 wafers per month of six inch wafer capability.
The stage is set for major manufacturing facilities being set up in India with the new government policy announced. It is proj ected that sooner than later three state of art silicon fabrication facilities would come up in India.
Table 2: Fab cost versus technology node
Technology Node (in micron) Year Cost (MUS$)
1.2 1988 350
0.8 1990 500
0.5 1992 750
0.35 1996 1500
0.18 2000 1700
0.13 2002 2000
0.07 2008 2500

133
Table 3: Capacity by feature sizeFeature size QOnm 0.13|j,m 0.15|j,m 0.18(xm 0.25|j,m 2.5(j,mNo. of fabs 4 17 10 22 16 32
Table 4: Planned capacity by wafer sizeWafer size 125nm 150nm 200nm 300nm
No. of fabs 8 24 64 4
Table 5: Production capacityf (Wafer/month: 150 mm)Year 2000 2004 2008
Wafer/month (150mm) 82K 252K 615K
Chinese aggression on Silicon EstateIt will be of direct interest to compare our status and strategy with that of another developing country, Republic of China which inherited almost similar technological legacy as that of India. When India set up the SCL we were fairly ahead of China both in the domain of technology and design. The following tables will illustrate that China is now a very dominant player in manufacturing of silicon integrated chips.lt is projected that China will produce more than 50% of global chip requirement in a few years time. It is also visible that they have not seen silicon technology in isolation, but have perceived it as convergence technology of information,
communication, entertainment, processing, control and computation.
Rendezvous of mechanics and electronics on siliconThe history of silicon revolution shows that there always has been a driving factor which has sustained the industry. It appears that every second decade starts with a new technology driver since the inception of silicon revolution. The characteristics features have been the emergence of the new product followed by a period of product standardization (Moore/Makimoto wave). The dominant technology driver in the respective decade is broadly indicated in Table 6.
Table 6: Technology driversYear 1960-1980 1980-2000 2000-2020Technology drivers Calculator,
Equipment,
mainframe
Personalcomputers(PC),communication
Digital consumer, Sensor, Embeded systems, robotics SOC, NOC
Table 7: Attributes of siliconProperty Remark
Single Crystalline
Elasticity
Hardness
High quality factor
Comparable to Aluminium
Comparable to Quartz
Table 8: Robot intelligence roadmapYear 2010 2020 2030 2040
Intelligencelevel
Lizard Mouse Monkey Human

134
As in the present and following decade one of the technologies is identified to be sensors which is also indispensable element of information technology, it is relevant to see what is the potential of silicon to play its part.lt is already established that silicon having conquered the electronics world is said to integrate the mechanical world into its kingdom. From mechanical view-point the attributes of silicon are highly attractive as outlined in Table 7.1t may be noted that microfabrication technique used for silicon chips is directly applicable for purpose of micromachining to fabricate micromechanical sensors and actuators. Diversifying and expanding the sensor world on silicon include families belonging to : acoustics, force, inertia, vision, touch, smell, acceleration, position, traction etc. Sensors will have key role in robotics, the projected technology driver in the coming decade the roadmap of which is given in Table 8.For the evolution of intelligence in robot the information processing capability will have to be increased from 104 MIPS3.
Embeddedsystems“It is everywhere but not seen anywhere”.The embedded system in a new Avatar in the information age, integratedhardware, software, programmability sensors, actuators carrying out computation unnoticed by the user. The pervasiveness is accounted for in Economy, F le x ib ility h a rd w are /so ftw are op tion , Individualization, Function integration.
The application domains are as follows:
Professional areas: Medical system, Traffic control, Automobile Security, Health Care, Agriculture, Environment, Industrial Plants etc.
Consumer Products: Home and Kitchen Appliances, Audio and Video Products, Toys
Communication: Mobile phones
Computation: Mobile desktop for storage, communication, I/O Displays
Civil Engg.: Intelligent Highways, Intelligent
B uild ings, In te lligen t B ridges, Energy Conservation.
Design: AThreadmill for Moore's Law“I don't have time to design in right the first time. I'am too busy getting ready to design it a second time”“A design that meets specification is the designer's view of a good design. However, a design that solves the problem is the customer's view of a good design”“Design complexity = System complexity+ Silicon complexity”
The progress of the Moore's Law seems to get threated by the complexity of designing system on chip numbering billions of transistors. GSM is more than just a lot of VLSI5 - in the same sense that a city is not a large village and the human brain is not just a large collection of ganglions4. Complexity is how muchmore the whole is than sum of its parts5.
Design Status in IndiaSome salient facts related to the Indian design status are:
(i) Almost all maj or multinational companies have VLSI design operation in India. Total design enterprises add up to about one hundred.
(ii) A round 7000 VLSI designers in employment in India.
(iii)Incentive: low cost on designer
(iv) Outsourcing to India mostly on labour intensive functions and low end operations.
Rule of thumb: One manyear of year should generate 1M$ in the life cycle of the design. Roughly about ten designs, if implemented in India for a product it is estimated to generate one billion US$ during the life time of the product designed.
For the sake of comparison we may note that the performance of the Peoples Republic of China in terms of revenue earned is estimated to be one billion US$ in 2004, and has a projected growth rate of about 60%.
3MIPS (Million Instructions Per Second) “Giant Scale Integration 5Very Large Scale Integration

135
Prospects for IndiaThe brief status review shows that India has almost missed the silicon revolution shaping the destiny of the twenty first century industrial revolution. India, however, did realize its importance which is symbolized by the setting up of the Semiconductor Complex Ltd. as a public sector enterprise in 1983. Driven by the motivation of self-reliance its technology scaled up to 0.8 micron, the limit of infrastructural capability provided through its internal R&D effort. It has a range of niche processes having significant intellectual property which can be transformed to productive business. India perhaps looked at silicon technology merely as strategic need rather than as a commercial platform to build the electronics industry. India has now to select a pragmatic approach from the
following options available:
(i) Integrated device model (vertically integrated with in house product, process, tool, equipment development and marketing. Examples: IBM, Motorola, Siemens, Philips etc.)
(ii) Foundry operation (manufacturing, serving as a printing house of silicon design). South Korea, Taiwan, Singapore, Peoples Republic of China are the examples who are geared to produce 50% of global chips on silicon.
(iii) Fables enterprise: Outsource the manufacturing with strong focus on design and product and system development which is low cost knowledge intensive entry to the silicon empire.
PROSPECT FOR INDIAE R O A Q M A P FO R INDIA
i i
TI
M
FA BLE SB SEM ICO NDU CTO R
SOLUTION PttQVWKH
IS l f C O M P A N Y
IIP SLO CK OESfGN SERVICES
JL
NlCKfc AK LASfcM JCO *DUCTO « COMP AMY O U A H O POUND* Y
IN T H E A R E A O f W IR E L E S S .
IN T E R N E T . T E L E C O M , P O W E R H O T ,
J W U L T W E O L A N E T W O R K IN G
SEMICONDUCTOR INTELLECTUAL PROPERTY IH THE AREA O F DSP.
^ MULTIMEDIA. V<HP TELECOM . INTERNET
M ESA CELLS/IP BLOCKS -* ■ FOR CUSTOMER
OESKihi STRVICTS
I K U N I I N O D E S 1G ', fc A C K !■ fJ IJ D E S IG N T P H Y 5I C M r iH S I & N ) rOLJNDRY I IN AQES E M f iC O fJ L D S Y S T E M S ( O f t T O O L S C E l L L IB R A R Y D E V E 'L O P W I N T / TECHNOLOGY VIBRATION
Figure 1: Possible roadmap for silicon enterprise in indiaA possible roadmap for India projecting different levels of opportunity is shown in Fig.l which ensures rapid response to market opportunity and fast exit from risky ventures. The degree of success will be governed by the ambience in the country for entrepreneurship, hassle-free business practices, global outlook and high quality technical education. It is also believed that
a vibrant fabless silicon activity will prove to be natural nucleus for investment on foundry.
Technical educationIn knowledge-intensive industry such as microsystems on silicon, technical education will play a decisive role regarding our competitiveness and leadership in the area. The issues where

136
special attention in the field of VLSI education are:
(0 Problem solving, project orientedapproach.
(ii) L earn ing ra th e r than teach ingorientation.
(hi) Awareness of intellectual propertygeneration.
(iv) Systems approach and complexitymanagement.
(v) Multidisciplinary focus.(vi) Teamwork.
ConclusionMicrosystems on silicon industry have special attributes which can be encapsulated in five dimensional T-space6Technology - Most subtle and most effectiveengine for social changeTime - Secret weapon of businessTools- The most value for the lowest cost in theleast possible timeTask- Civilization advances with tasks performed without thinking of them Talent - More from less
India's greatest assets could be large number of Indian professionals working abroad and having expertise in all the sectors of silicon technologies. The stage is set for reverse knowledge drain if not reverse brain drain in view of globalization, and India offering great opportunities for cost effective operations. Quit-India trend will be replaced by destination-India phenomenon. The so-called integrated circuit (IC) technology perhaps may be renamed as India-China technology if manufacturing capability in China is coupled with the design potential of India. If India-China business partnership is formed around silicon the formidable alliance can offset the missed opportunity for both the countries.
India's government supported manufacturing effort perhaps could take note of the initial
support given directly or indirectly to such industries. In silicon a strategic investment needs to be coupled with the business model to sustain the scaling associated with silicon. The IEEE International Conference on VLSI design which has set high standards, and is participated globally, India-Chip programme initiated by the M inistry of Information Technology and implemented by the Semiconductor Complex Limited, Integrated programme on MEMS7, formation of Indian Semi Conductor Association are some of the very positive developments which have taken place in India.
ReferencesA.B. Bhattacharyya, “VLST-The Technological Giant and The D eveloping C ountries” Proceedings IEEE, Vol.71, pp. 144-148 (1983)
Semiconductor International Association, In ternational Technology Roadmap for Semiconductors (2001)
G.E. Moore, “Progress in Digital Integrated Electronics,” IEEE, Electron Device Meeting, Washington (1975)
Carlo. H. Sequin, “Managing VLSI Complexity: An Outlook, “Proceedings IEEE, Vol.71, pp 149- 166 (1983), 6 Extract from book entitled “Concurrent Engineering” (Mentor Graphics), 7 MEMS (Micro-Electro Mechanical Systems) 10
D.V. Steward, “Analysis and Complexity in System Analysis and Management,” Petrocelli Books, 1981
T. Makimoto, “Paradigm Shift in Electronic Industry,” GOSPL Conference, New Delhi, 2004
David Roman, Electronic Engineering Times, Feb. 2005
D.N. Singh, Private Communication 11
6 Extract from book entitled “Concurrent Engineering,” (Mentor Graphics)7 MEMS (Micro Electro Mechanical systems)

Award Lecture Series ofIndian National Academy of Engineering
Professor S. N. Mitra Memorial Award Lecture 2006
Edges in Speech: The Engineering Challenge in Processing Sounds of Silence
B. YegnanarayanaProfessor & Microsoft Chair
International Institute of Information Technology
IntroductionWhen we consider a signal in general, and speech in particu lar, we im m ediately think of transforming (usually Fourier transform) the signal to extract information present in the signal. This means examining the signal in terms of components along different sinusoids. But consider the following situations: (a) My talking to all of you in the auditorium (b) Our conversations at a party (c) Our recognizing or imitating people by voice (d) Our enjoying music through various instruments (e) Finally, our recognition of an object in an image
It is not talking about representation of signals in all these cases, it is about the information or message extracted or interpreted. The difference is in the medium and the message. The message has no simple model, and hence, cannot be predicted or derived easily. That is why it is information. On the other hand, the medium is relatively easier to analyze and model.
The key features ofthe message are perceived by the human being by direct listening. Most signal processing methods tend to extract the characteristics of the medium, and through these characteristics these try to model the message. By
representing the signal through the medium characteristics, we get only a small part of the whole message information. But in most cases, due to redundancy the message can be inferred from the small part that we receive.
The small part of the message information that is extracted is usually in the time varying spectral components of each short-time segment of the signal. In the case of speech, the successive short- time segment is about 20 msec, and the spectral features represent the smoothed magnitude spectrum, which in turn is the square of the magnitude of the Fourier transform (FT) of the short-time segment. The magnitude spectrum also can be viewed as the 2nd order statistical information from the signal.
The real story begins here. To appreciate what is left out in the analysis, consider the analogy in the case of image. In particular, consider the image of the bird shown in Fig. 1. It is obvious that the information of the bird is mostly in the line sketch (or edge picture). The binary, gray level and colour information of the bird only adds a little shading (spectral) information, and not the message (line sketch or edge) information.

138
Fig. 1 Illustration of significance of line sketch in an image
Such edges are there in every form of communication, both in production and in perception, and speech is no exception. We will see what we mean by these edges in speech, and discuss its importance both in the production and in the perception of the message in speech. We can also see how one can exploit this edge information in speech for various situations involving speech processing, including the ones mentioned earlier.
Nature of Speech and Speech ProcessingSpeech is meant to communicate a message using a language. Speech has much more information than the language and the text in that language. Speech-to-text conversion by machine, as in dictation for example, destroys the other in fo rm ation co rrespond ing to speaker characteristics, emphasis, emotion, state of health, etc. This other information is perceived and interpreted by human listener. Most of such information is either due to physiological characteristics or environm ental/societal c h a ra c te r is tic s , or m anually acqu ired characteristics.
To understand the nature of speech, it is necessary to understand the process of speech production and perception. Speech is produced by exciting a time varying vocal tract system by time varying excitation. The variation in the system and excitation are more in the form of bursts of activity, called sequence of events. An event may be viewed as some change in the production mechanism. The auditory mechanism seems to perceive these events or acoustic hints to capture the information in speech, including the message. The production and the perception of the sequence of events may take place at different levels. The main thing we need to understand is that the entire speech signal is not equally important. On the other hand, a machine representation and processing of speech uses all of the speech signal samples. Fig.2 illustrates the nature of the speech signal and some of the characteristic features which can be seen visually through spectrogram. But there are many features which are perceptually important, but cannot be seen easily in the normal waveform or spectrogram representation as in Fig. 2. Some of those features can be seeninFig. 3.

Time (sec)
Fig. 2 Waveform and spectrogram of the speech signal for the utterance “Don’t ask me to carry an oily rag like that”
0.510 15 20 25 30 35 40 45 50
<d)
10 15 20 25 30 35 40 45 50
20 25 30 T im e (m s )
Fig. 3 (a) Speech signal, (b) LP residual, (c) Hilbert transform, (d) Hilbert envelope, and (e) Residual phase
Traditionally speech processing involves short- time (10-30 msec) spectrum analysis in which the features (for example, the resonances) of the time varying vocal tract system are represented by the features of the smoothed magnitude of the FT of the short-time segment. Spectrogram is one such example. We can still infer most of the speech message information from the temporally varying smoothed spectral features. This is because of the
high redundancy of speech information. A few hints from these spectral features are enough to fill up the remaining message information we have stored in our memory. But many natural characteristics in speech are lost in this information gathering from the signal.
The loss of key information in the traditional short-time spectrum analysis can be categorized

into three parts: (a) Phase of the short-time (10-30 msec) FT of the signal (b) Information in the subsegmental (1-3 msec) regions in speec (c) Information in the suprasegmental (>300 msec) features of speech.
While the phase of the short-time FT together w ith the m agnitude p rov ide com plete representation of the original short-time segment, computationally and conceptually it is difficult to process and interpret the FT phase due to the artifacts of digital processing of signals such as sampling and windowing. Moreover, it appears that subsegmental information seems to reflect the physiological characteristics, especially of the voiced excitation of the speech production, and hence, is likely to represent the natural characteristics of the speaker's voice. The suprasegm ental in fo rm ation is m ostly acquired/leamt trait of an individual's voice, and is characterized by durations of the sound units as
140
well as the variations in the voice pitch called intonation. The duration and intonation together is termed as prosody. Prosody, together with the strength of excitation or intensity, are called suprasegmental features. The duration of sound units, the pitch contour and the energy contour of an utterance are shown in Fig. 4. Besides the pitch contour, the individual excitation epochs, especially of voiced speech, are also shown. It is these epochs that constitute the main features of speech production. We call this impulse-like excitation information as edges in speech. The significance of these edges, and the information around them, can be seen in the illustration of speech signal where they are either modified or totally absent (as in whispered speech). Fig. 5 shows waveform for cases where the edge information is modified to different extents. Interestingly, it is these edges in speech that seem to play crucial role in many speech communication situations mentioned in the beginning.
D .Q
S ( t )O.B
1
3
<*«> *1a
00P (t> ?0
G-Q
0.0 0 6
0 . 4
Kt) 6 2 00 Oft 1 1ft
sp(t)
Fig 4 s ( t ) : speech waveform, e ( t ) : energy contour, p (t ): pitch contour, i (t) : instants of significant excitation, and sp (t) : spectrogram
maa taa aur pi taa kaa aa dar kar naa chaa hi e

141
- 4
■*# III »H--- NH-—i-*t+*+
(a)
(b)
(c)
(d)
(e)
Fig. 5 (a) Speech signal, (b) LP Residual, Speech synthesized with (c) impulse excitation, (d) Residual phase, (e) Random Noise
Processing Edge Information in Speech Epoch ExtractionHaving realized the im portance o f the information in the impulse-like excitation, the next step is to learn how to extract this information from speech signal, especially where the speech is degraded by noise, channel and other types (multispeaker) of degradations. There are
many methods, and one of them is by using the concept of group-delay as illustrated in Fig. 6. Group-delay function is the negative derivative of the FT phase function with respect to frequency. Using this concept one can determine the locations (time instants) of these impulses, a point property derived from block processing of the signal, as illustrated in Fig. 6.
C o n s i d e r a u n it s a m p l e s e q u e n c e
F T p h a se tufta) =■ - arc
- g ro u p d e la y := - t
A s Hie w in d o w Is m o v e d to H ie righ l, th e a v e r a g e of d>L( o ) , I .e .. <D'(os)in c r e a s e s lin ea rly w ith lim e
1
- J *
Fig. 6 Principle of epoch extraction using group-delay

Impulse-like Excitation Feature of SpeechAn approximation to the impulse-like excitation features of speech can be obtained using the Hilbert envelope (HE) of the residual signal in the linear prediction (LP) analysis of speech. Fig. 3 shows the speech signal, its LP residual and the HE of the LP residual for an utterance.
Suprasegmental (duration and intonation) Features of SpeechThe prosody (duration and in tonation) characteristics of sequences of sound units in speech are naturally acquired by practice, and the implicit rules governing the prosody are difficult to derive from the signal. The rules of prosody are not only governed by the message to be conveyed, but are also by characteristics of the language, speaker and the environment (social). Nonlinear models such as artificial neural networks can be trained to capture to some extent the prosody rules specific to a language or a speaker or both. The input data to train these models is derived from the sequence of impulse-like excitation such as the HE of the LP residual shown in Fig. 3. These models may in turn be used to develop not only for identification or verification of a language or speaker, but can also be used to improve the quality ofa text-to-speech system.
142
Applications of Edge Information in SpeechApart from capturing the prosody knowledge in speech, the sequence of impulse-like excitation information can be used in several practical speech processing situations. A few of them are illustrated in this section.
Prosody ManipulationOne can modify the duration characteristics of the individual sound units or the overall duration of an utterance by merely manipulating the sequences of epoch intervals derived from an approximate excitation (residual) signal. A modified excitation signal is then reconstructed, which in turn is used to excite a model representing the time varying vocal tract system. The results are illustrated in Fig. 7 for changing the speed of an utterance without altering significantly the characteristics of the natural voice.
Fig. 8 is an likewise an illustration of manipulation of pitch of the voice. One can also modify both prosody parameters (duration and pitch) simultaneously using the knowledge of the epoch sequence of the original utterance and the rules governing the prosody modification. This kind of tool is useful for producing speech from text, just as we read a text aloud for producing speech. The key challenge is to determine the rules governing the prosody that we use while reading a text.
Waveform
2 4
Time (sec)
Spectrogram
AilrttL2 4
Time (sec)
(a)
(b)
(c)
2Time (sec)
2 4
Time (sec)
Fig. 7 Speech waveforms and narrowband spectrograms for (a) Original, (b) Duration increased by 1.5 times and (c) duration decreased by 0.75 times
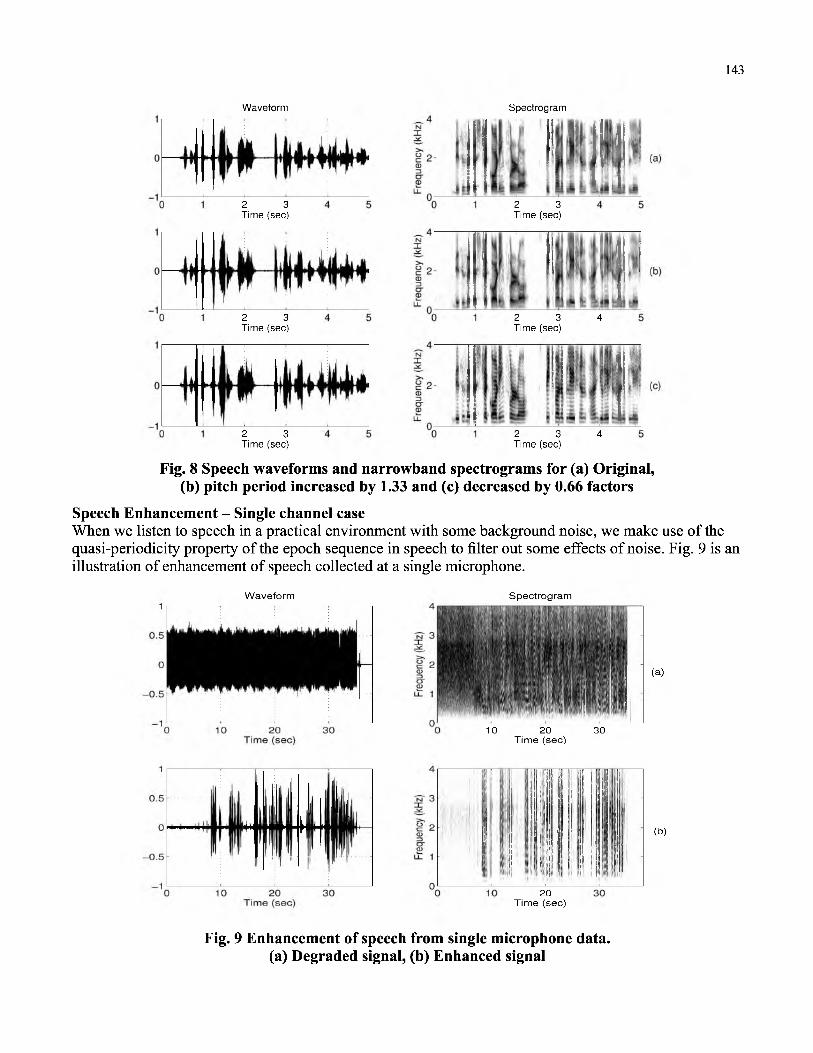
143
2 3Time (sec)
Waveform Spectrogram
2 3 4Time (sec)
2 3 4Time (sec)
2 3Time (sec)
2 3Time (sec)
2 3Time (sec)
Fig. 8 Speech waveforms and narrowband spectrograms for (a) Original,(b) pitch period increased by 1.33 and (c) decreased by 0.66 factors
Speech Enhancement - Single channel caseWhen we listen to speech in a practical environment with some background noise, we make use of the quasi-periodicity property of the epoch sequence in speech to filter out some effects of noise. Fig. 9 is an illustration of enhancement of speech collected at a single microphone.
W a ve fo rm
(a)
S p e c tro g ra m
10 20 30T im e (sec)
20T im e (sec)
(b)
Fig. 9 Enhancement of speech from single microphone data,(a) Degraded signal, (b) Enhanced signal

144
Speech Enhancement - Multichannel caseSpeech in a room is affected by reverberation. Human listening by two ears can reduce the effect of reverberation to some extent. The binaural processing effect can be realized by processing speech collected at two spatially separated microphones. The key idea in processing the two
microphone signals is that the epoch sequence of the direct speech into the microphones is unaffected by reverberation, and hence the speech components in the signals can be reinforced by compensating for the delay in the direct sound at the two microphones. Fig. 10 illustrates the enhancement of speech from two microphone data.
Waveform Microphone-1
4Spectrogram
2.5M icrophone-2
------- 02 2.5 0
W aveform Addtion 4
1 1.5Time (sec)
00 0.5 1 1.5
Time (sec)
2.5Enhanced
00Speech
4
Fig. 10 Enhancement of speech in two microphones caseSpeech Enhancement - Multispeaker dataA long standing problem in scientific research is the so called “cocktail party” problem, where human beings are able to converse effortlessly in the midst of simultaneous conversations from several others. The signal processing challenge is how to separate an individual speaker's speech from the combined speech signal of several speakers picked up by one or more microphones, distributed spatially in the room. The challenge is compounded by the fact that the signal is also corrupted by nonspeech ambient noise, and also speech-like noise due to reflections and reverberation.
The ability of human beings in dealing with speaker separation problem is attributed to two factors.
(a) The external factors such as binaural hearing and availability of multimodal inputs in human communi cati on .
(b) The internal factors involving some form of spectrum analysis by the human ear, and the sophisticated neural processing mechanism for perception of sound including selective attention.
From a signal processing point of view the binaural hearing is substituted by using signals picked up by two or more microphones, and the auditory spectral processing is substituted by the short-time spectrum analysis of speech. Very few attempts have been made to view the other important features ofthe speech signal, especially the source of voiced excitation in speech production. While the average pitch or pitch changes in voiced excitation are explored for speaker separation, the dominant feature responsible for speaker separation is mostly ignored. This dominant feature is the sequence of impulse-like excitation of the vocal tract system during production of speech, i.e., the edges in speech.

145
Exploring the impulse-like excitation feature of speech, a technique was developed to separate an individual speaker's voice from multispeaker speech data. The quality of the resulting enhanced speech of the desired speaker is significantly
better than the results obtained by the currently available methods for processing multispeaker speech data, such as blind source separation and independent component analysis. The results are shown in Fig. 11.
Microphone-1
(a)
2 2.5 3Microphone-2
-10.5 1.5 2 2.5 3
Speaker-1 Enhanced3.5 4.5
'H f f
0.5 1.5 2 2.5 3Speaker-2 Enhanced
3.5 4.5
f ....(d)
0.5 1 1.5 2 2.5 3 3.5 4 4.5Time (sec)
Fig. 11 Enhancement of speech from multispeaker data
ConclusionThe results of speech research prove three important points which are as follows:
(a) The significance of the impulse-like excitation in speech for applications such as speech enhancem ent , speech recognition and speaker recognition.
(b) The robustness of this excitation information against degradations such as noise, channel and reverberation.
(c) The relatively less significant role of the spectral features, corresponding mainly to the response of the vocal tract system.
All these studies suggest the importance of processing signals to capture the message information in the sequence of impulses in the excitation, which is equivalent to capturing the “sounds of silence”. This is analogous to capturing
the image information in edge pictures or line sketches. While human beings are able to perceive the objects in these edge pictures, it is almost impossible with our current understanding to automatically derive the object information from line sketches. The problem is no different in speech or any other signal in general, and hence, the engineering challenge is processing these “sounds of silence”The results of processing methods discussed in this paper are available for listening at the following website: http://speech.cs.iitm. emet.in/main/results/enhance.html
AcknowledgementI would like to gratefully acknowledge all my students who shared with me the excitement, joy, pain and frustration in the pursuit of this research over the past three decades.
References:http://speech.cs.iitm.emet.in

Award Lecture Series ofIndian National Academy of Engineering
Professor S. N. Mitra Memorial Award Lecture 2007
Global Navigation Satellite System (GNSS)S. Pal
Distinguished Scientist Programme Director, Satellite Navigation Program / Chairman, GAGAN PMB
Deputy Director, Digital & Communication Area ISRO Satellite Centre, Bangalore
IntroductionConventional satellite technology has got three applications : communication, remote sensing and, scientific studies. The latest one added to this list is Satellite Based Navigationalso referred to as Satellite Navigation/Global Positioning System and lately termed as Global Navigation Satellite System (GN SS).W ith the technological advancemen t t ak ing p lace in mobi le communications, controls, automobiles, aviation, geodesy, geological survey, military operations, precision farming, town planning, banking, weather predictions, power grid synchronization etc., in spite of each one having separate domains, there is one thing common in all of them for their future; ana that is the Precise-position, Timing and Velocity (PVT) - information, which can only be provided by the Global Navigation Satellite System (GNSS).
The GNSS is a vast system of systems, providing global positioning, navigation and timing information to scores of users in oceans, land, air and even in space. The paper traces the history of navigation, evolution of navigation satellites, the three present constellations and a world scenario in these areas. India has taken a significant step in this direction with its SB AS system GAGAN and deployment of its own Regional Navigation Satellite Constellation (IRNSS). The paper will touch upon the various GNSS connected aspects, their applications and the Indian perspective.
It is a great honour for me to deliver Prof. S N Mitra Memorial (2007) Award Lecture. It is my humble tribute to the great electronics and RF communication engineer and one of the founder members of thelNAE.
History of Navigation“Navigation is the science of charting one's own route from Point 'A' to Point 'B' with respect to known references both in spatial as well as temporal domain”.Navigation is also the process of planning, recording and controlling the movements of a craft from one place to another.
H IS TO R Y O F N AVIG ATIO N• Navigation is the science of charting one's own route
from point 'A' to point 'B' with respect to known references both in spatial as well as in temporal domain
• Identifying and remembering objects and land marks like rocks, trees, rivers, marking on trees or leaving stones/flags and looking at Sun and Moon, as points of reference were the techniques and navigational aids that the early man used to find his way in jungles, deserts, mountains etc. Perhaps the time reference was day/night or even could be seasons.
• The situation changed drastically when man started long voyages on oceans.
Navigation is the determination of the position and velocity of a moving vehicle or a craft. Apparently the word 'NAVIGATE' is derived from the latin word NAVIS - meaning ship and 'agere' 'to move, steer'or 'to direct'. There is another thinking about the word 'Navigation' having its origin in Sanskrit - where 'Nav' or 'Nau' means 'Nauka' - boat and 'gati' - means 'velocity'. Some scholars feel that art of navigation was bom in the Sindhu Valley 6000 years ago.
The early man wondered away from his hut or cave, he asked himself, where am I? That became the need and may also be the origin of navigation. He also perhaps wanted to know as how to go back
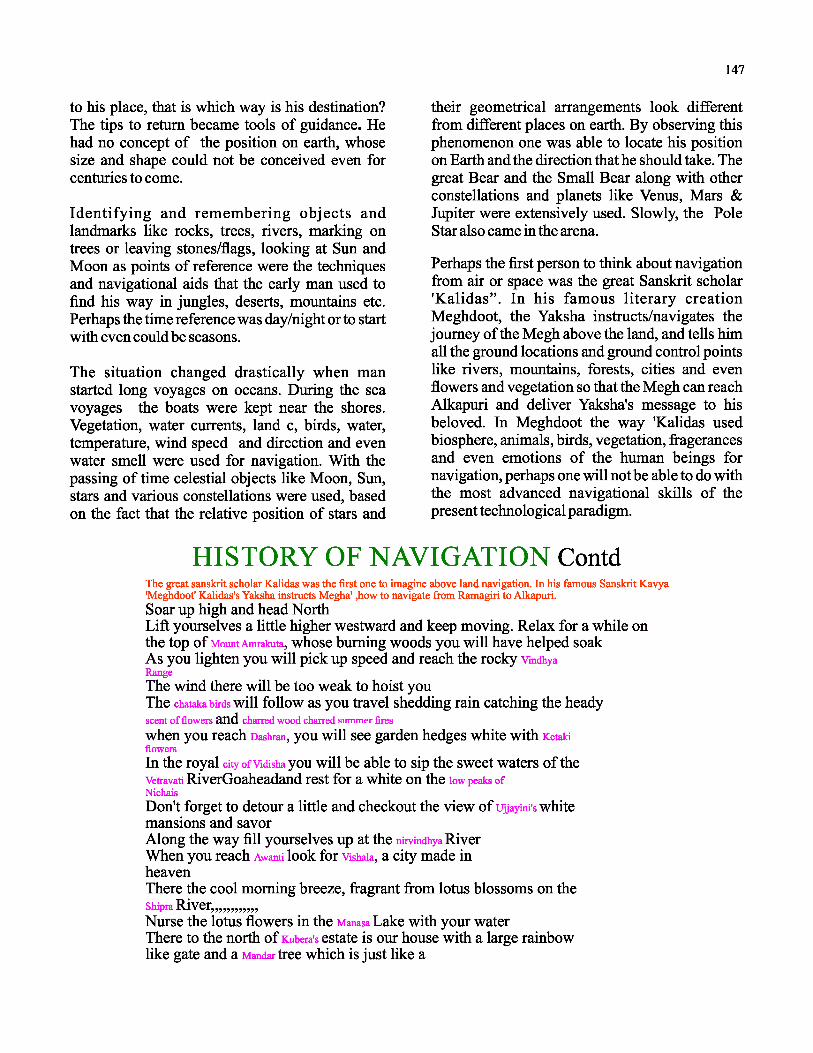
147
to his place, that is which way is his destination? The tips to return became tools of guidance. He had no concept of the position on earth, whose size and shape could not be conceived even for centuries to come.
Identifying and remembering objects and landmarks like rocks, trees, rivers, marking on trees or leaving stones/flags, looking at Sun and Moon as points of reference were the techniques and navigational aids that the early man used to find his way in jungles, deserts, mountains etc. Perhaps the time reference was day/night or to start with even could be seasons.
The situation changed drastically when man started long voyages on oceans. During the sea voyages the boats were kept near the shores. Vegetation, water currents, land c, birds, water, temperature, wind speed and direction and even water smell were used for navigation. With the passing of time celestial objects like Moon, Sun, stars and various constellations were used, based on the fact that the relative position of stars and
their geometrical arrangements look different from different places on earth. By observing this phenomenon one was able to locate his position on Earth and the direction that he should take. The great Bear and the Small Bear along with other constellations and planets like Venus, Mars & Jupiter were extensively used. Slowly, the Pole Star also came in the arena.
Perhaps the first person to think about navigation from air or space was the great Sanskrit scholar 'Kalidas”. In his famous literary creation Meghdoot, the Yaksha instructs/navigates the journey of the Megh above the land, and tells him all the ground locations and ground control points like rivers, mountains, forests, cities and even flowers and vegetation so that the Megh can reach Alkapuri and deliver Yaksha's message to his beloved. In Meghdoot the way 'Kalidas used biosphere, animals, birds, vegetation, fragerances and even emotions of the human beings for navigation, perhaps one will not be able to do with the most advanced navigational skills of the present technological paradigm.
HISTORY OF NAVIGATION ContdThe great sanskrit scholar Kalidas was the first one to imagine above land navigation. In his famous Sanskrit Kavya 'Meghdoot' Kalidas's Yaksha instructs Megha' ,how to navigate from Ramagiri to Alkapuri.Soar up high and head NorthLift yourselves a little higher westward and keep moving. Relax for a while on the top of Mount Amrakuta, whose burning woods you will have helped soak As you lighten you will pick up speed and reach the rocky vindhyaRangeThe wind there will be too weak to hoist youThe chataka birds will follow as you travel shedding rain catching the headyscent o f flowers and charred wood charred summer fireswhen you reach Dashran, you will see garden hedges white with KetakiflowersIn the royal city of Vidisha you will be able to sip the sweet waters of the Vetravati RiverGoaheadand rest for a white on the low peaks ofNichaisDon't forget to detour a little and checkout the view of ujjayini's white mansions and savorAlong the way fill yourselves up at the nirvindhya River When you reach Awanti look for Vishala, a city made in heavenThere the cool morning breeze, fragrant from lotus blossoms on theShipra River,,,,,,,,,,,,Nurse the lotus flowers in the Manasa Lake with your water There to the north of Kubera's estate is our house with a large rainbow like gate and a Mandartree which is just like a

148
HISTORY OF NAVIGATIONPhoenicians, Vikings and Greek were undertaking sea voyages and had navigation skills even 3000 years back. Phoenicians claimed to have circumnavigated Africa from Red sea, sailing via the Cape of Good Hope.Burning fire on mountain tops were used as light houses. The legendary Light House of Alexandria was an example.
Navigation' word has perhaps its origin in 'Naoka'- 'Nav' boat + 'Gati'-velocity, in Sanskrit.Not much is written in the modern history about Navigation activities in Asia-Pacific region. Chinese, Arabs etc., had under taken lot of sea voyages.In Mohanjadaro ruins (Indian sub continent) one clay tablet was found which depicted a boat.Sindhu or Indus valley civilization ruins ( parts of Pakistan, Gujarat, Harayana) do show that perhaps a successful business with Romans, Babylonians and Sumerian civilizations.Out of 18 Tamil Sidhas, Sidha Bhoganathar went to China via sea route (even he is supposed to have designed an aeroplane) and lived in China as Lao-tzu, spread Taosim. He is attributed to have great navigational skills.
Phoenicians, Vickings, Irish Monks and Greeks were undertaking sea voyages and had great navigation skills even 3000 years ago. Phoenicians claimedt o H a v e circumnavigated Africa from Red Sea, sailing via the Cape of Good Hope. During those days perhaps burning fire on mountain tops were used as light houses. The legendary ILight house of Alexandaria was an example.
Although 'Nav' word has its origin in 'Naoka' - 'Nav' in Sanskrit "gati” means velocity, not much is known about Indian's capabilities in navigation, though great work was reported in the area o f astronomy, time measurement, to certain
extent terrain mapping, village and city planning. In Mohanjadaro ruins ,one clay tablet was found which depicted a boat. The Sindhu or Indus valley civilization which was spread in parts of Pakistan and Gujarat, do show that India had ports and perhaps a successful business with Romans, Babylonian and Sumerian civilizations. In Bate Dwarka marine archeological findings indicate the existence of a well-developed marine navigation in 1000 BC.
The archeological site at Lothal has got remains of a port which indicates that more than 4500 years India also had an advanced sea-transportation system. The dock is almost of the s ame size as t h a t ofmodern Vishakapatanam dock.However, not much is known about the navigation aids used by the sea travelers. Cholas in the past and Marathas in the recent past had large navy. As per the classic Tamil literature out of the 18 Tamil Sidhas, - SidhaBhoganathar went to China via sea route (even he is supposed to have designed an
his journey on 6th September 1492. had very primitive navigation tools and his place in navigation history is recorded owing to his courage, resolution and audacity rather than to his insight, intellect or erudition.
In 324 BC Alexander the great supposed to have expressed his desire to his admiral to sail to Africa. The Arabs had sailed to the Malabar Coast and the Mallaca strait, Sumatra and even reached China in 800 AD. The Chinese had some
aeroplace) and lived in China as Lao-tzu, spread Taosim, also had great navigational skills. Sumerians, Arabs & Chinese also undertook long sea voyages earlier to 3"century BC.
In the recorded history, Megallan (1550 AD) went on voyage to circumnavigate earth equipped with primitive sea charts, an earth globe, cross staff, dead reckoning tools wooden and metal theodolites and quadrants, hour glasses, a log and knotted rope. Christopher Columbus who started

149
fragmented maps which depicted geographical features of sea, rivers even in 2000 BC. During Tang dynasty (700 AD ) such navigational directions extended from Korea around to Africa and the Persian Gulf. Intercontinental trade was pioneered by the Persian Jews, through the 'Silk route' even in 5th century BCE. The Jews traveled west to east, and spoke many languages. Even
Vasco Da Gama met on the Indian shores a Jew , whom he supposed to have baptized. Earlier cross-staff astrolable, traverse board and dead reckoning tools were used. With these tools and great personal skills the sailors could estimate the ship's speed, direction and the approximate latitude but not longitude.
N,K ■; i p k . H u H i I
HH
Earlier navigator some how could determine the latitude but not the longitude and the speed. They had hour glass, pendulum clocks and all primitive time-measuring equipment.Aroundl 500 AD, the Chinese invented the compass for direction finding, but earlier even the Europeans, particularly, the Italians used compass needles named lodestone needles fordirection finding. During long voyages a great need was felt for a chronometer which did not get affect by the gravity, temperature, humidity and loses less than a few seconds in 24 hours. In 17th century AD, Queen Anne of England announced £20000 reward for a certified chronometer. In 1764 George Harrison, a carpenter claimed the award.
It is interesting to note that although most of the navigators could determine the latitude with very good accuracy, but determination of longitude of a place always remained a problematic exercise,
for want of an accurate clock. However, by 1700 AD longitude of many places were determined w ith respect to Paris Observatory. The methodology depended on pendulum clocks and telescopes. Pendulum clocks could not be used in the sea due to errors on account of gravity variations, humidity, temperature and the added instability of the boat made it difficult to determine the latitude. The chronometer made it simpler to determine both longitude and latitudes in the sea.lt took another 220 years after the invention of chronometer to estimate very accurately the position, the velocity and the time instantaneously independent of location and weather.
With the advent of marine chronometer by George Harison, the British parliament declared Greenwich laboratory longitude to be 0° longitude reference and Greenwich time to be the

150
mean time reference for all purposes. Later in the year 1884 at Washington this was ratified by an international agreement and the Greenwich meridian was adopted as the prime meridian. The French for long time were using Paris observatory meridian as 0° meridian.
Till the end of the 19th century for positioning, timing and navigation chronometers, sextants and various types of compasses were the main tool. The beginning of the lO^century brought the use of radio-telegraph and HF radio while the first and the second world wars brought the use of radars for navigation. Over the years some of the land based radio positioning equipment and systems like LORAN, OMEGA, DECCA and VOR. ALPHA and CHAKYA came into use. Quite a few of them are still in use and may continue to be in use in spite of satellite-based navigation.
With the advent of space technology Transit, GPS and GLONASS positioning and navigation systems were evolved, which could provide position and guidance accuracies in meters and submeters.
Besides for guidance purposes for aircraft, instrument landing system and microwave landing system are used in poor visibility. The IR and the laser sensors are used for missile guidance systems.
Basic Principle of Radio NavigationRadio navigation technique involves the positioning and the accurate determination of time on some standard reference frame. There are three basic principles of positioning, based on the fact that radio waves travel with the speed of light, a well known parameter: these are (i) Trilateration(ii) Hyperbolic positioning (iii) Doppler positioning.
Trilateration: If the distances from three known location transmitters are known then the observer can compute his position unambiguously. The nestimation of a position based on measurement of distance is referred to as trilateration. An rf navigation system working on this principle is referred as a time-of-arrival system (TOA system).
LAND BASED LORAN -C (LONG RANGE NAVIGATION)• FIRST RADIO-POSITIONG SYSTEM FOR MARITIME
APPLICATIONS• SERVICE FROM 30 CHAINS FOR WIDE COVERAGE• PRINCIPLE OF RANGING FOR POSITION-FIX:• RADIO-PULSE TRANSMISSION FROM MASTER AND
SECONDARY STATIONS (OVERAGLOBAL NETWORK)• RECIEVER GETS BOTH PULSES AND TIME DIFFERENCES
(TD) FOR EACH PAIR OF MASTERSECONDARY STATIONS IS COMPUTED
• LOCUS OF POINTS HAVING THE SAME TD FROM A SPECIFIC MASTER-SECONDARY PAIR IS A CURVED LINE OF POSITION (LOP).
• POSITION DETERMINED BY INTERSECTION OF 2 LOPsTD IS USED WITH MAPS TO ESTIMATE LAT/LONG
• PHASE MEASUREMENTS IMPROVES PRECISION• LORAN OPERATING RANGE: 90-110 KHZ• LIMITED COVERAGE:-1000km RANGE• O B S T R U C T IO N /IN T E R F E R E N C E FROM GRO UND
FEATURES• REFLECTION BY IONOSPHERE
■jj> ' i j j
■ r i u . L J l
H y p e r b o l i c positioning: This is a system where distance from a master station and two synchronized slave stations are plotted, and the p o i n t o f intersection gives the position of the observer. Loran-C is an example of this system.
Doppler positioning system : This is based on continuous monitoring of the frequency shift of a stable transmitter by observer and then based on the number of observations, the position of the observer is determined.Satellite-based navigation l ike G P S , G L O N A S S are b a s e d on TOA/Trilateration while the earlier systems like
TRANSIT, TSIKADA etc. were using Doppler positioning and TOA.
Space Based NavigationAfter the launch of Sputnik-I on 4th October 1957 by the erstwhile Soviet Union, two scientists (William H Guier and George C Wieffenbach) at

151
the Applied Physics Laboratory (APL) of John Hopkins University were carefully studying the rf transmission and observed certain regularities, the most important being the prominent changes in the doppler shift produced by an over flight, caused by the accelerations along the line of sight, which were enhanced by the spacecraft high speed and low orbital latitude. They determined the orbit of Sputnik very accurately from the doppler frequency data, observed from one location in a single pass, since the satellite orbit obeyed Kepler's Laws. This led to the idea that "If the satellites orbit were already known, a radio receiver (observer) unknown position could be determined accurately from the doppler measurements.
This idea gave birth to the TRANSIT system of
navigation concept. The Transit spacecraft provided inputs for analyzing the Earth's gravity, ionospheric refraction correction, development of reliable mechanical and electronic satellite construction techniques. TRANSIT could give the best position accuracy of (approx..) 25m. The TIM ATION, a programme of the Naval Research Laboratory, used the concept of synchronized tone transmission. It also had on-board stable atomic frequency standards (Rubidium and Cesium). The TIMATION provided the precise time and the accurate position to the passive terrestrial observers using range better than the Doppler measurement. Meanwhile, the U.S. Airforce under a programme, termed 62IB, launched satellites where the ranges were measured by four satellites simultaneously in view by matching the incoming PRN signal with
SATELLITE NAVIGATION & POSITION SYSTEMS
GPS (1978) JtGLONASS
TIMATIONDevefapefl m 1972 hy the Naval Research Laboratory fNRLJ, TIMATION
satellites were intended- to provide time and frequency transfer, The lliiid satellite acted as a GPS techn-oloyy dcmonsh atoi.
TSIKADARussian four satellite civil navigation syslem
TSYKLONFirst navigation satellite launched by soviet union in late 1967.The satellite is based on doppier technique similar to TRANSIT system.
SEC OR 4 Sequential Collation uf Range)
SECOR was a U. 5 army satellite navigation and positioning system. Thirteen Satellites
were launched between 1364 and 1969.TRANSIT
Operated in 100 MHz and -tO-O MHz frequency bands and flow ed the user to determine the if
position by ine-asurlng the Doppler shift of a radio signal transmitted by tho satellite.
W hen man m oves from one place to another 3D po* longitude & height) are required. SPUTNIKFirst artificial Satellite launched from Russia. Operated using
Doppler frequency shift to obtain position.
a user-generated replica signal and measuring the received phase against the user's (receiver) crystal clock. With this concept the user's latitude, longitude, altitude and a correction to the user's clock could be determined. In 1978 all the programmes were merged bythe U S government into a single entity and a Joint Program Office for G l o b a l P o s i t i o n i n g S y s t e m ( G P S ) , NAYSATAR,was created . The motto of GPS -
JPO was: Drop 5 bombs simultaneously in the same hole andbuild a cheap set that navigation (<$10000) both the targets have since been met more than adequately.Parallely Soviet Union was also working on satellite based navigation and they launched TSYKLON andTSIKADA series of navigation satellites which finally culminated into GLONASS constellation.

152
Navigation Satellites* TRAN SIT (US Navy satellite developed by John H ok Ins, A pplied Physics Laboratory , 19(:0-1995). Based on
doppler shift m easurem ents of a 4QC IVtHz tone.* TlWlATtOlN { T lM efnavigATlO N) program m e. - 2 satellites (^967 & 1969) also called NCST { Navy C entre for
Space Technology) satellites carried quartz o scilla to r which w ere regularly updated by m aster clocks* NAVSTAR ( NAVi gallon Satellite Tim ing and Ranging} o f US A ir force PF.GJECT621, used pseudorandom noise
ranging signals,* U nder TIM ATiO N Program tw o m ore satellites viz., NTS-I
( Navigation Technology Satellite) and NTS-II w ere launched in 1974 and 1977 and carried Rubidium and cesium Atom ic docks.
* In 1971, US Govt. D ecided to bring a ll the above technologies under one head and m ade a jo in t program office und er w hich um brella, '3PS satellites w ere developed and first block 1 satellites were launched during 197B- 1985 and second block during 1909 to 1990. GPS constellation w as com pleted by 1995.
ifffrl-YllF-f'i-H ■n -
J l N Eaafa
$ -J
Both GPS and GLONASS constellations used onboard atomic clocks and PRN signals. GPS had two frequencies but different codes for all satellites (CDMA) while GLONASS had separate frequencies and codes for satellites (FDMA).
Both the constellations worked well, and were in
GPS, GLONASS & GALILEO - ConfigurationC on ste lla tion GPS G L O N A S S G A LILE O
Tota l S a te llite s 2 4 + 3 2 4 (4 O p r) 2 7 + 3O rb ita l P eriod 12 hrs 11 h rs 1 5m in 14H rs 2 2 minO rb ita l p lanes 6 3 3O rb ita l h e igh t (km ) 20200 1 9 100 2 3 6 1 6S at. In each plane 4 8 10Inclination 55 dea 6 4 .8 dea 5 6 deaP lan e S ep ara tio n 60 deg 120 deq 120 deaFreq uency 1 5 7 5 .4 2 M H z
1 2 2 7 .6 M H z1 2 4 6 - 1257 M Hz
1602 - 1616 M Hz1 1 6 4 - 1300 MHz
1 5 5 9 - 1591 M HzM odu lation C D M A FD M A C D M A
full operational mode in 1995-98. Meanwhile, the European Union also announced its intention of putting their own navigation satellite constellation GALILEO by 2012. Many other nations have also notified their intentions of having their own constellation or participating in theGNSS.
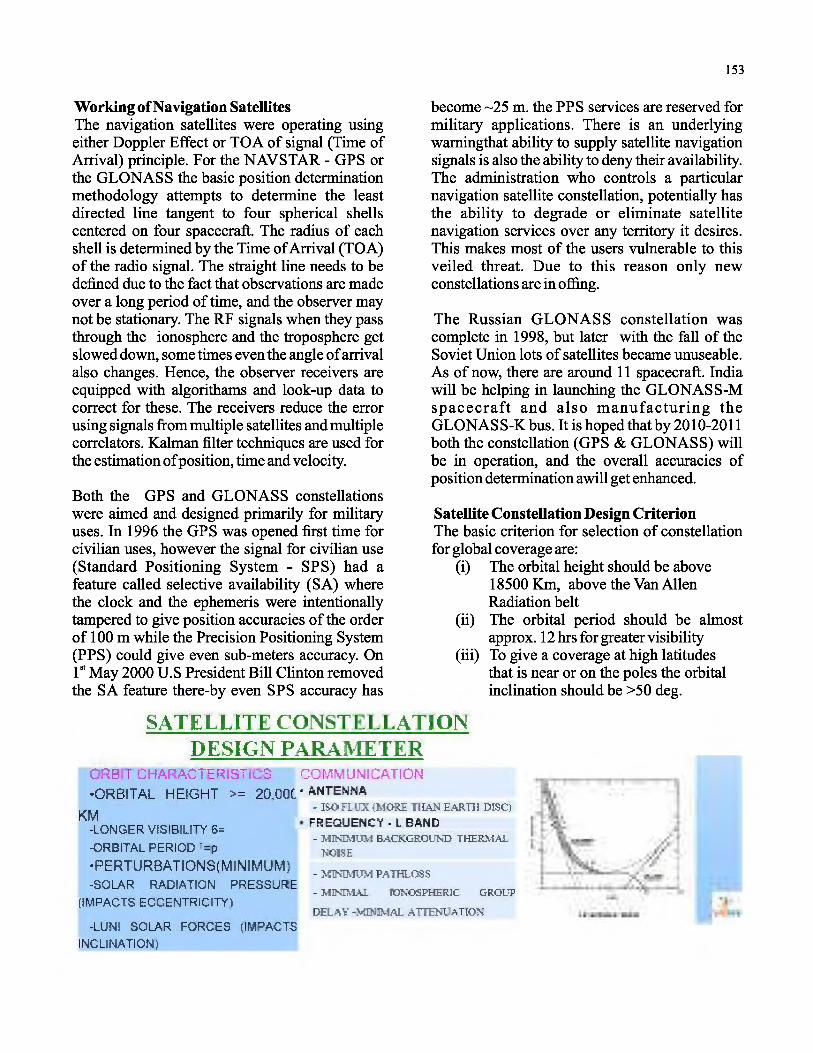
153
Working of Navigation SatellitesThe navigation satellites were operating using either Doppler Effect or TOA of signal (Time of Arrival) principle. For the NAVSTAR - GPS or the GLONASS the basic position determination methodology attempts to determine the least directed line tangent to four spherical shells centered on four spacecraft. The radius of each shell is determined by the Time of Arrival (TOA) of the radio signal. The straight line needs to be defined due to the fact that observations are made over a long period of time, and the observer may not be stationary. The RF signals when they pass through the ionosphere and the troposphere get slowed down, some times even the angle of arrival also changes. Hence, the observer receivers are equipped with algorithams and look-up data to correct for these. The receivers reduce the error using signals from multiple satellites and multiple correlators. Kalman filter techniques are used for the estimation of position, time and velocity.
Both the GPS and GLONASS constellations were aimed and designed primarily for military uses. In 1996 the GPS was opened first time for civilian uses, however the signal for civilian use (Standard Positioning System - SPS) had a feature called selective availability (SA) where the clock and the ephemeris were intentionally tampered to give position accuracies of the order of 100 m while the Precision Positioning System (PPS) could give even sub-meters accuracy. On 1st May 2000 U.S President Bill Clinton removed the SA feature there-by even SPS accuracy has
become -25 m. the PPS services are reserved for military applications. There is an underlying wamingthat ability to supply satellite navigation signals is also the ability to deny their availability. The administration who controls a particular navigation satellite constellation, potentially has the ability to degrade or eliminate satellite navigation services over any territory it desires. This makes most of the users vulnerable to this veiled threat. Due to this reason only new constellations are in offing.
The Russian GLONASS constellation was complete in 1998, but later with the fall of the Soviet Union lots of satellites became unuseable. As of now, there are around 11 spacecraft. India will be helping in launching the GLONASS-M spacecraft and also manufactur ing the GLONAS S-K bus. It is hoped that by 2010-2011 both the constellation (GPS & GLONASS) will be in operation, and the overall accuracies of position determination awill get enhanced.
Satellite Constellation Design CriterionThe basic criterion for selection of constellation for global coverage are:
(i) The orbital height should be above 18500 Km, above the Van Allen Radiation belt
(ii) The orbital period should be almost approx. 12 hrs for greater visibility
(iii) To give a coverage at high latitudes that is near or on the poles the orbital inclination should be >50 deg.
S A T E L L I T E C O N S T I. I. I .ATI ON D ESIG N P A R A M E T E R
ORB f CHARACTERISTICS COMMUNICATION •ORBITAL HEEGHT >= 20,00t ‘ ANTENNA
- IS-O FLUX {MORE TIIAN EARTH DISC)KM-LONGER VISIBILITY 6=
-ORBITAL PERIOD ' = p
•PERTURBATIONS! M INIMUM ) -SOLAR RADIATION PRESSURE
UMPACTS ECCENTRICITY)
-LUNJ SOLAR FORCES (IMPACTS INCLINATION)
FREQUENCY■L BAND- M IN IM U M BACKGROUTd THERM A i.
NOISE
- M IN IM U M PA7HLOSS
- M IN IM A L sONOSPHHRIC GROUP
DELAY -M IN IM A L A TTE N l AT FOX
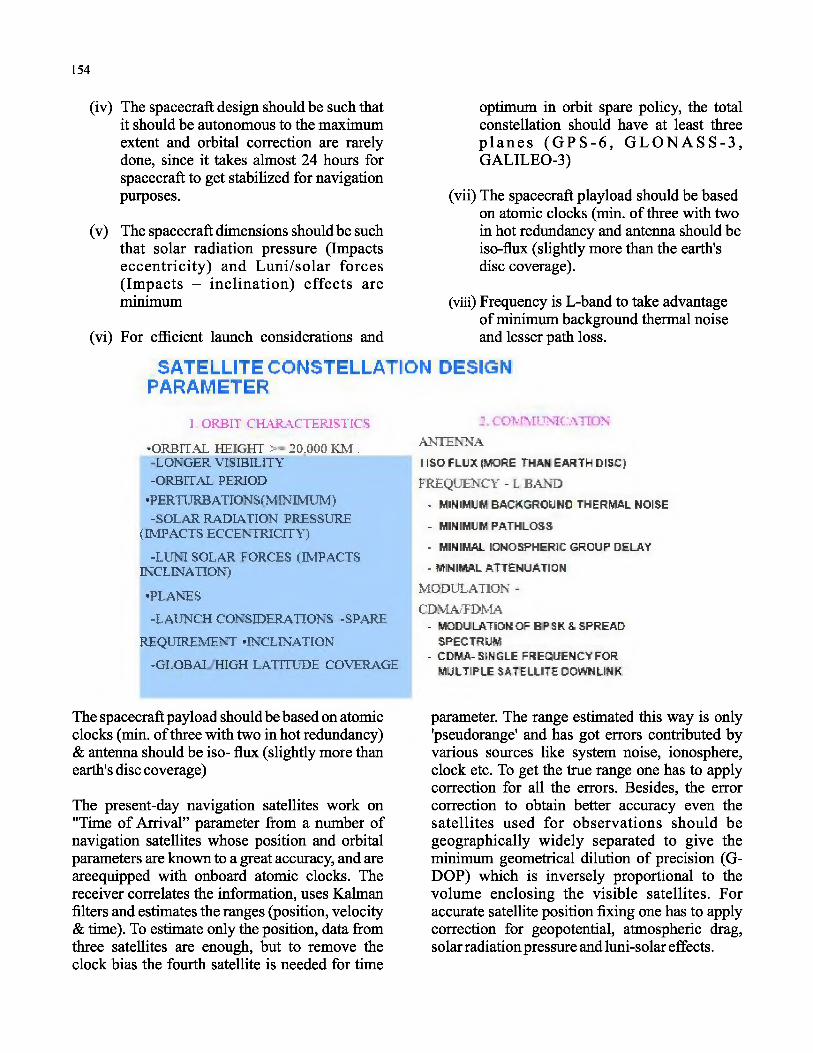
154
(iv) The spacecraft design should be such that it should be autonomous to the maximum extent and orbital correction are rarely done, since it takes almost 24 hours for spacecraft to get stabilized for navigation purposes.
(v) The spacecraft dimensions should be such that solar radiation pressure (Impacts eccentricity) and Luni/solar forces (Impacts - inclination) effects are minimum
(vi) For efficient launch considerations and
optimum in orbit spare policy, the total constellation should have at least three p l a n e s ( G P S - 6 , G L O N A S S - 3 , GALILEO-3)
(vii) The spacecraft playload should be based on atomic clocks (min. of three with two in hot redundancy and antenna should be iso-flux (slightly more than the earth's disc coverage).
(viii) Frequency is L-band to take advantage of minimum background thermal noise and lesser path loss.
SATELLITE CONSTELLATION DESIGN PARAMETER
I. ORBIT CHARACTERISTICS
♦ORBITAL HEIGHT >- 20.000 KM . -LONGER VISIBILITY -ORBITAL PERIOD
•P ERTURBATIONSfM INIMUM)-SOLAR RADIATION PRESSURE
(IMPACTS ECCENTRICITY)
*:LUM SOLAR FORCES (IMPACTS INCLINATION)
-PLANES
-LAUNCH CONSIDERATIONS -SPARE
REQUIREMENT -INCLINATION
-GI.ORAI HIGH LATITUDE COVERAGE
2 COMMUNICATION ANTENNAI ISO FLtJX (MORE THAN EARTH DISC}
FREQUENCY - L BAND- MINIMUM BACKGROUND THERMAL NOISE
- MINIMUM PATHLOSS
- MINIMAL IONOSPHERIC GROUP DELAY
- MINIMAL ATTENUATION
M ODULATION -
CDMA/FDMA- MODULATEOkOF BPSK & SPR EA D
SPECTRUM- CDMA-SINGLE FREQUENCYFOR
MULTIPLE SATELLITE DOWNLINK
The spacecraft payload should be based on atomic clocks (min. of three with two in hot redundancy) & antenna should be iso- flux (slightly more than earth's disc coverage)
The present-day navigation satellites work on "Time of Arrival” parameter from a number of navigation satellites whose position and orbital parameters are known to a great accuracy, and are areequipped with onboard atomic clocks. The receiver correlates the information, uses Kalman filters and estimates the ranges (position, velocity & time). To estimate only the position, data from three satellites are enough, but to remove the clock bias the fourth satellite is needed for time
parameter. The range estimated this way is only 'pseudorange' and has got errors contributed by various sources like system noise, ionosphere, clock etc. To get the true range one has to apply correction for all the errors. Besides, the error correction to obtain better accuracy even the satellites used for observations should be geographically widely separated to give the minimum geometrical dilution of precision (G- DOP) which is inversely proportional to the volume enclosing the visible satellites. For accurate satellite position fixing one has to apply correction for geopotential, atmospheric drag, solar radiation pressure and luni-solar effects.
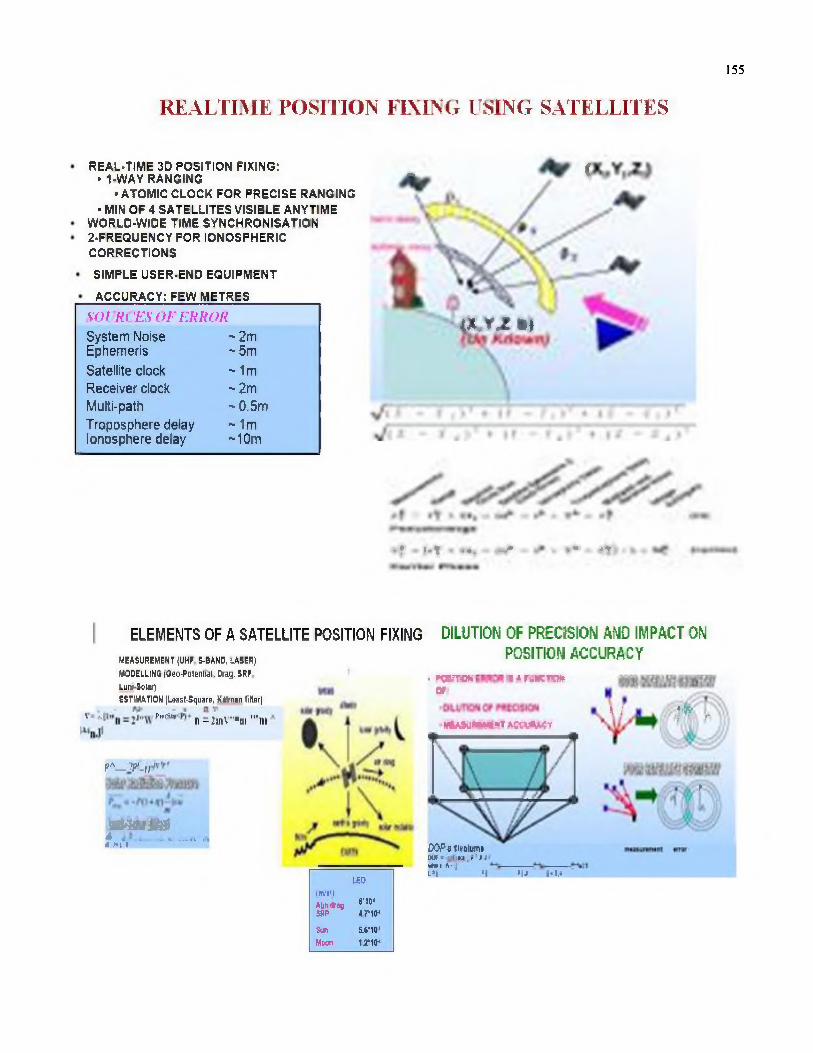
155
R E A LTIM E POSITION FIXING USING SA TELLITES
* cREAL-TIME 3D POSITION FI KING:* 1-WAY RANGING
•ATOMIC CLO C K FOR PRECISE RANGING• MIN O F 4 SATELLITES VISIBLE ANYTIME
WORLD-WIDE TIME SYNCHRONISATION 2-FREQUENCY FOR IONOSFHERIC
CORRECTIONS
SIMFLE USER-END EQUIPMENT
ACCU R ACY : FEW M ETRES
SOI Kt £ S O F i :r r o k
System Noise ' 2mEphemeris ^5m
Satellite clock - 1mReceiver clock - 2mMulti-path ' 0 .5mTroposphere delay - 1mIonosphere delay - 10m
( K r x *>
■f -f>1 * •** W* k * r t i
ELEMENTS OF A SATELLITE POSITION FIXING DILUTION OF PRECISION AND IMPACT ONPOSITION ACCURACYMEASUREMENT .|UHF tBAND, iASEP)
WODELLlNG ifleo-PMenlnl. teag. SRF Lunt-il'Utf)tSTHrtATlOH jLWttSqiMM, fittnin 1iHer|
1 ■ f"cB* n=2mV"“ii ""m
?A—V'-U
fm a m& i - K_- __ L - —i A it M I
UOinvi'l*1)11*43 6'irSAP mfun avio iMmn uw
. wroti is i rL,hrr<-* v
■WlAlg tMtUT aqcuamtI / frTFi
f
(lOPiflWllimiDUP- ! !»:i I m ' A J■philt, fi ~ I ---------------l*t *1 MJ i*u

Satellite Based Positioning SystemThe Satellite positioning system mainly consists of three segments:
Space Segment - A constellation oforbiting or Geostationary / Geosynchronous satellites whose orbital parameters are accurately known and are equipped with atomic clocks.
Ground Control Systems - Ground control segment consists of a number of monitoring and message uplinking stations. The ground segment maintains the constellation, monitors satellite health, finds out accurate orbital parameter (using CDMA, laser or one way ranging across the globe), maintains the network time and uplinks the various param eters to satellites for transmitting to users.
User Segment Consists of a multichannel receivers with high sensitivity (160 dBW) and fast processors to give the position to the user. The user segment is only one-way receiving system which does not have any linkage with the constellation except for receiving signals. The constellation and ground segment are blind to the user.
GPS and GLONASS were the two constellations which were completely operational from 1995 to 1998. GLONASS service was badly affected due to the fall of Soviet Union. However GPS programme continued. In 2000 AD, the European
Global Scenario of GNSSGPS, GLONASS & GALILEO - Configuration
Constellation GPS GLONASS GALILEOTotal Satellites 24 + 3 24 (4 Opr) 27 + 3Orbital Period 12 hrs 11 hrs 15m in 14H rs 22m inOrbital planes 6 3 3Orbital height (km) 20200 19100 23616Sat. In each plane 4 8 10Inclination 55 deg 64.8 deg 56 degPlane Separation 60 deg 120 deg 120 degFrequency 1575.42MHz 1246- 1257 MHz 1 164- 1300 MHz
1602 - 1616 MHz 1559 - 1591 MHzModulation CDMA FDM A CDMA

157
Union announced its ambitious plan of a parallel constellation of 30 satellites in three planes with a large number of free and paid services. The constellation is called GALILEO. They have put two spacecraft in orbit for experiments.The whole constellation is likely to be completed by 2012- 2013.Meanwhile Russians are making efforts to make the GLONASS constellation completed by 2010.However Russians have planned modernization & revival of the full constellation using M & K series of spacecraft.
Since satellite life is limited and based on experience, US has planned modernization of the GPS signals by increasing BW and power and additing extra signal L5, with ME code on L1/L2, but still providing the existing services. The GALILEO constellation envisages a large number of services. The GALILEO has discussed interoperability issues with GPS and
GLONASS. Galileo will also be having a service termed as PRS, (Public Regulated Services) available on the lines of PPS and M code of GPS to selected users ofthe European Union. The space segment of any the GNSS constellation provides one-way ranging where the user will never have communication with the spacecraft and the space segment is always blind of the users. All constellation except the GLONAS transmits their signals using CDMA, to have resistance to jamming and interference. The same thing is achieved in the GLONAS by FDMA. The Russians have 14 sets of frequencies. They repeat the frequency for satellites on antipodal mode. However for interoperability considerations under the GLONAS modernization. GLONAS will also be transmitting one signal using CDMA.L-band frequency spectra from 1164 to 1620 is completely occupied by GPS, GLONASS and GALILEO transmitting frequencies.
a (ii o as I Ton tnn v 16111.6 - I f i l3 ,(i M ill
GPS, GLONASS & GALILEO Frequency Plans

158
ARMSiiam's
ECa -fLEj i ECli
A H V i SJ ttSSi
Sii.'iM (si's Bsniisfsflrij.cfi:
□ 1 \ 1G lu T y '5 S Banrijj iMMallmncm
'sed.
All the three constellations have carried out extensive coordination with one another. Needless to add that GPS and GLONASS were the earlier players. However new services are also being planned in the overlapping frequencies but
using orthogonal and BOC modulations techniques. L-band is the most crowded band in the available space to earth links. India for this very reason has gone to L and S-bands of frequencies for its IRNSS Constellation.
Compatibility & interoperability with other GNSS
E5a rE5l>AAA
L i lA iA A
L *5 i
— — —
L3M
liVtnC.TU'HUUA
L 5N
(E6i LT
*1
/•1ft AK6
I K A " k_ _ I
[RNNSS Baad
Thankfully borrowed from ICG — Bangalore Meet

159
The GPS, and the GLONASS stand-alone, satellites may not be satisfactorily working all thecannot satisfy the integrity, accuracy and time. Time to alarm could be from minutes toavailability requirements for all phases of flight, hours and there is no indication of the quality ofparticularly for the more stringent precision service, approaches. Integrity is not guaranteed, since all
LIMITATIONS OF GPS AND GLONASS* OPS -stand alone, cannot satisfy the integrity, accuracy & avail ability
requirements for all phases of flight, particularly lor the more stringent precision approaches.
* Integrity is not guaranteed, since all satellites may not be satisfactorily working all times.
* Time to alarm could be from minutes to hours and there is no indication of (|uality of service.
* Accuracy is not sufficient even with S/ A off, the vertical accuracy for 95% of the rime is >10m.
* For GPS Sc GLONASS stand alone systems availability & continuity are not assured*
* All these calls for a special system addressing all the above, which could be done by augmenting the GNSS systems.
Accuracy is not sufficient even with S/A off in the integrity, accuracy and availability are assured.GPS. The vertical accuracy for 95% of the time is All these calls for a specialsystem addressing all>10m. For the GPS and the GLONASS stand- the above, which could be done by augmentingalone systems availability and continuity are not the GNSS systems, assured while for GALILEO for certain services
REQUIREMENT OF ENHANCEMENT OF ACCURACY, AVAILABILITY AND INTEGRITY
For the safety-critical applications it is essential that a user be assured that the system is operating within design tolerances and the position estimates derived from it can be trusted to be within specifications — This is the s o called integrity requirement.Timely warning of a system anomaly (which may be hazardous is called time to alarm .— jOSec En-roufe— 6 Sec AP\ II (^pproadi whb Vertical Guidance)

160
For the safety-critical applications like civil aviation sector, it is essential that a user be assured that the system is operating within the designed tolerances, and that the position estimates derived from it can be trusted to be within the specifications. This is the so-called integrity requirement. Timely warning of a system anomaly which may be hazardous is called to "time to alarm”.
The space based augmentation termed as S-BAS is the most popular system for augmenting the existing constellation. In S-BAS system a GPS like signal is transmitted by a geostationary
satellite which ensures the integrity parameter of the constellation and transmits correction related to ionosphere, troposphere, ephemeris and timings. There are no S-BAS system as of now for GLONASS & GALILEO). Presently, American WAAS (Wide Area Augmentation System) is the only certified S-BAS system. The EGNOS (European Geo Navigation Overlay System) is under certifications, while the GAGAN of India and the M-SAS of Japan are under deployment. Brazil, Nigeria, Russia and China have also expressed their intention of having their own S- BAS systems.
US WIDE A R EA AUGMENTATION SYSTEM OF G PS ■
W AAS
24 Wide Area Reference Stations
2 Wide Area Master Stations
2 Navigation Land Uplink Stations
2 GEOs-AOR & POR
EUROPEAN GEOSTATIONARY NAVIGATION OVERLAY SERVICE - EGNOS

161
Japanese S-BAS System (M SAS)
The US and European systems are the forerunners consisting of a large large number of reference, uplink and Master Control Centres with each one having 2 GEO spacecraft.
Japan has planned M-SAS along with its own novel system QZSS which is a tear-drop shape constellation to avoid problems of low look angles.
China had its Beidou system. China is going in a big way with its COMASS (~ 35 satellites) system which will have GEO, MEO Components. Their plans are to have a global system.
Indian Scenario in the GNSSIndia has entered the arena of the GNSS for the
QZSS Navigation System
last seven years and used the Satellite Positioning System (SPS) in IRS andscientific satellites, and have completed the GAGAN-TDS, the technology demonstration phase of the Indian S- B AS system along with the Airports Authority of India. India plans to participate in the GALILEO and the GLONASS, to have its own regional constellation (IRNSS) which will provide accuracies over the landmass comparable to or better than the GPS. We have also taken up in a big way the ionospheric and tropospheric studies and their modeling. India may becomethe biggest user of the GNSS for the GIS, mobile, survey, mining, fishing industry, aviation, road, rail transport etc.
NATIONAL SPACE SYSTEMS

162
India has presently six components of its space programme. The GNS S is the latest one to enter in Indian space arena, and will augment the existing world-wide satellite-based navigation systems.
To start with India has undertaken as (ISRO & Airports Authority of India joint venture)the work to establish its own Satellite Based Augmentation System for the GPS constellation - named GAGAN (GPS Augm ented GEO Aided Navigation System) on the lines with the WAAS of US. In the Technology Demonstration (TDS) phase the system consists of eight reference
DEO 3 1 n U
stations to measure ionospheric, ephemeris and time corrections, one master control centre at Bangalore along with one uplink station for GEO. GS AT-4 spacecraft will carry the required L-band transponder, transmitting corrections for LI & L5 (GRS) frequencies. As of today for the TDS phase we are using INMARSAT 4F1 spacecraft. GAGAN Final Operational Phase (FOP) has begun. In the OP phase we shall have minimum of two Master Control Centres, 16 referenc estations with (triple receiver redundancy) and redundant communication links. The whole system will be a certified by 2010.
I N D I A N A I K S P I C E T O B E S E R V I C E D
- a v o
The GAGAN is required to service the Indian Airspace. However, the CEO foot-prints cover a larger area, provide opportunity to serve the neighbouring countries by establishing suitable reference station. GAGAN is a fine example of great cooperation and understanding between an R&D organization (ISRO) and a large public sector service provider (AAI) for executing a complex technological proj ect.
Preliminary System Acceptance
Si pi|[S
GAGAN-TDS Phase position accuracy results are very encouraging, clearly indicating the improvements shown by the augmentations achieved over the GPS alone system. The position accuracies from the GAGAN-TDS results show very encouraging results. The red and blue shaded areas show with and without S BAS correction. With corrections accuracies are approx. 3 m.
Test ResultsL ih l \
P S A T E s l l C r ite r ia -I ■’Girl I On AjOLUI fiCyb-ctMir t t i « i 7.5 M s v a r i
A f l i i t v f dIKisilion j m u u c \ ill North, dllll I |il li i r r t i o i m i-
lirTH'i t l l d l t i ln -E v i i Cl I lf ) |:i

163
An SBAS receiver was flown on the NRSA aircraft. The SIS (Signal in Space) from the GAGAN was verified and the performances were compared with the INMCC (Indian Master Control Centre), generated by HPL/VPL (Horizontal and Vertical Protection Limits) contours and were observed to be in perfect agreement.

164
a-carian H - j i r r t : - C ,A H R
hi;Is -
■•J ■ □ L I - 3B cach o n N lji'i'i C P B B
h?
-
POSITION OF MAGNETICE'Ql'ATOR AND SCINTILLATION REGIONS
ENDIAM REGION EXPERIENCES UNPREDICTABLEIONOSPHERIC DISTURBANCES
SUCCESS O F CAGAN IS DEPENDANT OH THE 3TUCV AMD MOOE1 THE IONOSPHERE OVER THE REGIOtJ.
■ A
India falls on the magnetic equator and u n d e r th e e q u a to r ia l ionosphere whose behaviour is quite unpredicted. Ionosphere correction and modeling are two important tasks forany satellite based augmentation system. To study this phenomena ISRO has established almost 28 Total E le c tro n C o n te n t (T E C ) monitoring stations, around the country, and has taken up iono studies in a big way. The models and results will be used for [_ G A G A N a n d f u t u r e nay igationproj ects.

165
Indian Regional Navigation Satellite System (IRNS S)India has planned its own Regional Navigation Satellite System consisting of seven satellites in GEO orbit.
kif O Mink* **» W i « i i f *
iM t* m i i r t *
" - “ ■Je t
IRNSS Architecture• Space Segment
- Seven satellite configuration, 3 SVs in Geo-Stationary orbit (34° 83°and 132°East), 4 SVs are in GEO Synchronous orb it placed at inclination of 29 ’ (with Longitude crossing at55° and 111°East)
- The configuration takes care of continuity of service with afailure of onesatellite.- The satellites are of 1 ton class with navigation payload of 102 Kgs and
power consumption of 676 W atts.■ There will be two downlinks (L and S bands) providing dual frequency operation
with e irp of 31.5 dBW at EOC.- The payload will have 3 Rubidium clocks.
• Ground Segment- Master Control Center
IRNSS Ranging & Integrity Monitoring stations (IRIM)IRNSS Telemetry and Command stations
- Navigation Control CentreI RNSS Network Timing Centre
• User SegmentPlanned operationalization by 2011 -2012
The space segment will consist of seven spacecraft (3 in GEO and 4 in Geo Geo Synchronous Orbit (29 deg inclination) covering the GEO arc from 34 deg to 111 deg. The IRNSS system will be transmitting siz signals in LI, L5 & S-band frequencies, for standard positioning and precision positioning applications. All the satellites will be providing position accuracies, over the Indian Geopolitical Boundary over 1500 km areas, equivalent to or better than GPS/GLONASS or GALILEO constellations. Under IRNSS besides the Satellite Control Centre, Navigation Control Centre and IRNSS Network timing centres are planned to be established. IRNSS constellation will be operational by 2011.

166
IRNSS Coverage AreaHDOP & VD O P (99%) for the ProposedConstellationGEO 34,83,132G S O 55(55,235), 111(111,291) User Mask Angle 5deg.Under IRNSS constellation will be operational by the year 2011 AD.
GNS S Applications and Related IssuesPerhaps next to INTERNET if any single technological phenomenon which is going to influence many walks of human life will be to G N SS.T heG N SS ap p lica tio n s besides navigation and tim ing inform ations are numerous. The most common applications are mapping, surveying, natural resources and land management (town planning, forest mapping, epidemic mapping and management, precision farming etc.) scientific studies (Iono, Tropo and
NAVIGATIONS P A t lC R A F T
- it.qiciun■ iKCP
-xtaaaxGEOGRAPHIC DATA COLLECTION:
- S U R V 'f iY E tG
- jWlfflfEEMNe SCIENTIFIC RESEARCH
- AtMCfiPUQUC itUJJlih:
GEOOYNAMICS- CSUUHAL *K>VE!J£EsTfr. CMJSTjkL QEFOEHaTIDNS
MILITARY
fflO TBAL H iJO tR C l AND LAND MOTAGfUEf'T
- Til5 IM5-ES T
- fgsESf MENSURATION■ T O W N P L A N H IN &
■ FLEET MCVEMENT- ROLlTlW3',A U G N M E N T
M U H IlQ H IlE i THF H F A 1 M OF F K L(liumii'TOteai, lunu eaiisi dr .t :J .■ n.'ii Uoc.
AGR1CU1TLTI- PRECISIONFifiHlfcH*
EMEfiJGE^CV RESPONSE■ 5EAF?uH AND F? 5CUE
BUSINESS SOLUTIONS- LOCATION BASED SERVICES
- MOBILE- TOURISM■ rttrULHGUdllfcUD
atmospheric studies), health monitoring of tall buildings, long bridges, search and rescue, powergrid synchronization, banking and mobile services time control etc., are a few important applications.
In the near future mobile, satellite-based navigation services, internet and other telecom services will get merged into one service giving birth to many newer applications which will be termed as the GN S S Assisted Applications.
Assisted GNSS Appiications

167
AREAS OF RESEARCH & DEVELOPMENT IN POSITIONING AND TIMING SYSTEM (GNSS)
T E C H N O L O G Y
PRECISION ORBITS [ IML N\ M UKONLNA IK >S
i n : \ T L O r M E W T O F N . W H i - \ T T c : » >S O F T W A R E
X T f t M H i ' I I H ' K K l ' R I M I I ' M . i R S I I I M , I P i l f R f K i F M MAKERSL S O F L t ' X V > I E N N V i F O R M 'A ( K ' l a l I i n a l r J l c i n t n s < c ; p s + t ; u
A < I I H a I I ' 1 S U M M E O F I ' M \ ^ l i > F i W S O M H i \ K H
S C I E N C E
* IONO I lit H'< > \l< HH I I I V i: iN n i FE Q L 'A T U R lA L K K I ;M JIM IN I.- U AN I)
* R A D IO (i< < T L T A T l f l l N S i m i l e I’O HN r vrt: \ i t m MiMOM’i i E m fI I ' M P E R \ I \ R l I ' K O I T L X
- K l A I 1 1 M l W L A t i l l H I f iKI-JI AS I liN(,
f - - ~
Although the GNSS is going to be a big phenomenon but interoperability between various constellations, interferences, standardization of signals and receivers and use of precision measurement equipments by terrorist/anti-social elements are some of the issues which need to be tackled.
Issues related with GNSS
Intentional and Unintentional Interferences Multipath, Indoor and Urban Environment Over crowding of Frequency Spectra Need for higher anti-jamming margins Protection of R N S S and Radio Astronomy bands Continuity of existing and planned constellations ionospheric and Solar weather impact on G N S S signals Standardization of Civilian Signals and Receivers Universal Time and Reference Frames (Each Constellation as of today has adopted different time and geodetic reference frames)
Issues related with GNSSInteroperability refers to the ability of open global and regional satellite navigation and timing services to be used together to provide better capabilities at the user level than would be achieved by relying solely on one service or signal.
Compatibility refers to the ability of space-based positioning, navigation, and timing services to be used separately or together without interfering with each individual service or signal.
ConclusionA f t e r a l l , w e n e e d m e a s u r e m e n t s o f s p a c e a n d t i m e f o r a l m o s t a l l o u r a c t i v i t i e s a n d G N S S p r o v i d e s t h e s e .
H e n c e , G N S S w i t / i n f l u e n c e o u r f i f e m o r e t h e n a n y o t h e r t e c h n o l o g i e s / a d v e n t .
Acknowledgements
The Author wishes to express sincere thanks and gratitude to ISRO Management; Dr. G. Madhavan Nair, Chairman-ISRO/Secretary DOS, Dr. K Kasturirangan, Former Chairman, ISRO and Dr. P S Goel, Former Director, ISAC Dr. K N Shankara, Director- ISAC, for giving opportunities to work and lead the Indian Satellite Based Navigation Program. The author also puts on record his gratitude towards Dr. Ramalingam, Chairm an, A irports A uthority o f India, AAI/GAGAN colleagues for their wholehearted support to the GAGAN Project. Dr. Ramalingam played the most important role in bringing AAI &
ISRO together to realize the GAGAN, whose fruits will be reaped by many GNSS users in the years to come not only in India but by the entire world civil aviation community.
ReferencesLecture on Global Navigation Satellite Systems- A Vast System of Systems. Houston System of S y s t e m s S e m in a r , I E E E - A E S S , NASAS/JSC/Gilruth Centre, Houston, Texas, USA, ll-12,hOctober2007.
Global Navigation Satellite System (GNSS) - An Indian Scenario, Vikram Sarabhai Memorial Lecture, IETE Mid Term Symposium-2007, Vadodara, India (April 2007).

Award Lecture Series ofIndian National Academy of Engineering
Professor S. N. Mitra Memorial Award Lecture 2008
Over-view of the Indian Power Systems, Challenges and Environmentally
J. NandaHonorary Scientist, Indian National Science Academy Department of
Electrical Engineering , I.I.T. Delhi
IntroductionAt the dawn of independence, electricity supply was in the private sector, confined mostly to metropolitan cities and the big towns. The country then had no technology base in electrical power engineering, and practically all equipment for the power sector were imported. However, over the span of 60 years since independence, India has taken spectacular strides in the power field. Today the country has large-scale integrated operation of power systems, and has infrastructural facilities to indigenously manufacture power equipment and accessories, both for the country's need and for export. However, power demand has been consistently higher than the generation available, leading to average energy shortage of 7% and the peak-power shortage of 11%. From time to time, several initiatives have been undertaken to address this issue. The Govt, of India has drawn an ambitious plan of adding 100,000 mw by the year 2012, thus nearly doubling the installed capacity that existed ten years ago. This calls for the for developm ent o f m atching transm ission, subtransmission and distribution systems to ensure reliable and secure power supply at an affordable price, keeping in view the long-term sustainability.
The tempo of industrilisation in India is steadly growing on all fronts, covering energy intensive activities like the development of automobile, petro-chemicals, pharmaceuticals, fertilizers, textiles, steel, aluminium, biotechnology, rapid transit systems etc. A constantly growing energy demand has to be met through an adequately planned electrical power generation programmes. Though electrical energy is environmentally the most benign form of energy, its production is
mainly routed through conventional fossil fuel burning or through nuclear energy, and wherever possible through hydro-resources. All of these give rise to environmental issues of varied nature. The production, transportation, and usage of energy must be designed in an environmentally benign manner and at costs allowing for economically healthy growth. The crux of the problem is to resolve the 3-E issue, viz energy, environment and economy, While endeavoring to analyse and resolve the balance of trade off between energy and environment and between energy and economy, “sustainable development” would be the final goal to achieve.
Chronological Growth: SEBs and REBsThe power sector has been on the priority list of the Indian planners as reflected by the plan outlays. About 20% of the total public sector outlays is provided for the power sector. The installed capacity has been redoubling itself every seven to eight years. The total installed capacity of utility in India has increased from 1360 MW at the time of independence to about 130,000 MW at present. The per capita energy consumption is a major economic indicator. Our per capita energy consumption is of the order of 500 units (which was 12 units at the time of independence) compared to 13,200 units of US A, 11,000 units of Australia, 6,600 units of UK, 4,300 units of South Africa, 1000 units of China and 1,200 units of Malaysia. As a thumb rule, expenditure in generation should be equal to transmission and distribution put together. However, in the Indian Power System, expenditure on generation has been around 70% as against 30% on transmission and distribution put together. This needs to be addressed on war footing basis if economy of

169
power system with desired reliability and security is to be achieved.
Before independence electricity supply was in the private sector. Small isolated power systems were feeding local loads around urban areas. The enactment of Electricity (Supply) Act 1948 gave a positive boost to the development of State Electricity Boards (SEBS) for promoting coordinated development of generation and supply of power within the states in an efficient and economic manner. Thus, State was chosen as a spatia l unit for pow er planning and interconnected operation was viewed in forms of building up State Capital Grids. However, as the power systems in the states rapidly developed, the inadequacy of planning with States as special units became clear by the Third Five Year Plan (1961-66) , in view of the uneven distribution of natural resources for power generation. It is estimated that the country has hydel potential of 600 billion units of firm annual energy and84,000 MW of firm power at 60% load factors. Major portion of this hydro potential is situated in the northern and north-eastern regions. The total coal resources are assessed as 170 billion tones. These are primarily located in the states of Orissa, Bihar and West Bengal which constitutes about 75% of our coal reserve. The rest of the coal reserves are located in Madhya Pradesh (15%), Andhra Pradesh (6%) and Maharashtra (3%).
As the power systems in the States developed, the integration of power systems of contiguous States to form regional grids evolved in 1963 to achieve economy and reliability. Accordingly, in 1963 the country was demarcated into five regions, viz. Northern, Western, Southern, Eastern and North- Eastern Regions for planning and operation of power systems. Regional Electricity Boards (REBs) were established and the process of linking of power systems of the individual States within a region were taken up giving rise to the concept of Regional Grids. To interconnect the contiguous State systems, the construction of inter-state/inter-regional transmission lines was promoted by the Central Government by providing 100% loan assistance to the States outside their State Plans outlays for construction
of such lines. Regional grids o f220 KV level got developed and limited interconnected operation started in the seventies. The emergence of the Central Generating Corporations, namely, National Thermal Power Corporation (NTPC) an d N a t io n a l H y d r o e le c t r ic P o w er Corporation(NHPC) in 1975 gave a further fillip to the development of regional Grids, as 400 KV transm ission system s were developed transcending the State boundaries to enable the constituent States in the regions to obtain their shares from the Regional Thermal or Hydro Stations. Today, the country has fairly well- developed regional grid systems operating in almost all the regions. The REBs have well- established Regional Load Despatch Centres (RLDCs) for coordinating the regional grid operation in conjuntion with State Load Despatch Cetres (SLDCs). The regional girds have been in operation since the early eighties providing all the advantages of integrated operation of power systems like normal and emergency assistances, co-ordinated overall maintenance scheduling of the generating plants, savings in capacity additions and minimize interruptions in power supply. Because of integrated operation, it has been possible to establish a large pithead super- thermal power stations with unit size o f500 MW at Singrauli, Rihand, Korba, Vindhyachal, Ramagundam, Farakka, Talchar etc., and many other pithead stations are being planned.
National GridTo cater to diverse Load Centres and available energy resources in the country with economic, reliable and secure power supply it is necessary to establish a strong and reliable National Grid. Power grid has been entrusted with this task which was formed by the Government of India in October, 1989. Development of such a National Grid is being planned in a phased manner corresponding to the generation capacity additions through establishment of high capacity transmission highways. In the first phase of National Grid development, because of wide variation in electrical parameters (mainly frequency regimes) of various regional grids, asynchronous interconnection of regions through H V D C b a c k - to -b a c k t ie s have been

170
accomplished. These ties allow limited and controlled exchange of power while maintaining the integrity of the two regions i.e. without interfering with their internal operational aspects such as the frequency regime. The first back-to- back tie is a 2x250 MW HVDC tie between no rthern and w estern reg ions. HVDC interconnections have also been established between western and southern regions and between eastern and southern regions. There has also been the first HVDC± 500 KV bipole with a capacity of 2000 MW already commissioned between Rihand and Dadri. The second phase comprising hybrid EHVAC 400 KV/765 KV and high capacity HVDC bipole is being completed p r o g re s s iv e ly . In th e th ird p h a se , interconnections are planned to be strengthened through commissioning of a ring of 765 KV system interconnecting various regional grids by the year 2012. The National Grid so developed would have inter-regional power transfer capacity of 30,000 MW, and would facilitate unhindered exchange of power across the length and breadth ofthe country.
Transmission SystemsMassive expansion of transmission network is suffering on account of severe right-of- way(ROW) problems due to environmental constraints, resistance by land owners for land acquisition, crunch of financial resources etc. These problems are addressed by the following manner:
(i) Width of 765 KV Towers is reduced from the usual 85 meters to 64 meters.
(ii) 70 m high towers are used against normal 45 m towers(Rajaji National Park Uttranchal) to save felling of trees and thus protecting wild life.
(iii) Enhancement of the reliability and the capacity of the existing transmission system by application of thyristor controlled series com pensators ( T C S C ) a n d s t a t i c V a r C o m p en sa to rs(S V C ) in m any corridors of the transmission systems.
This enhances the power carrying capacity of line from 30% to 50%. Some typical cases are increase in c a p a c ity o f R a ip u r-R o u rk e la transmission system from 800 to 1200 MW; increasing capacity of Kanpur- Ballabhgarh systems from 450 to 600 MW, increase in capacity of Panki- Muradnagar transmission system fro 450 to 600 MW etc.
(iv) There is planning for more TCSCs on 400 KV lines.
(v) 220 KV double circuits (D/C) line in J&K has been upgraded to 400 KV single circuit line for the first time in India to utilize the available ROW and to enhance power transfer capability of the line.
(vi) 400 KV AC transmission system shall remain as the backbone of the Indian Power System. 400 KV uses bundled conductors (quadruple conductors per phase) in a phase to enhance power transfer capacity of the line. The country has already gone for 765 KV AC transmission to meet the need of bulk power transfer and has taken up design of 1000 KV transmission system for evacuation of power of the order of 20,000-30,000 MW from NER /NR to central part of India.
(vii) Indian Grid will be a hybrid of AC and DC systems because of controllability. HVDC system in genera l is economically viable for bulk power transfer over long distances. Recentlyf 500 KV,2000MW HVDC bipole has been commissioned between Talcher and Kolar. ^6 0 0 KV HVDC which can be upgraded to ± 800 KV is being planned for power evacuation (4000- 6000 MW) from NE region to Central India.
(viii) A fully automated remote controlled
171
400 KV su b s ta tio n has been established at Bhiwadi, Rajasthan, leading to reduction in man-power cost and economy in operation. More such substations are being installed in various parts of the country.
Independent Power Producers (IPPs)Several private sector companies are setting up power plants in various part of the country, and the ir pa rtic ip a tio n is characterized by development of large sized resources head based power stations, reluctance to invest in evacuation/transmission system, short gestation period due to use of modem tools and technology and use of sub-optimal parameters of generators, excitation and control system.
Distribution SystemProper attention has not been given to the planning d is tribu tion system by SEBs .Distribution network all over the country is plagued with weakness like long route network, high losses , low voltage profile because of inadequate shunt compensation, inadequate transformer and cable capacity, absence of preventive maintenance, absence of automation and inadequate spares etc.
Grid OperationRapid expansion of regional grids and their integration to form the National Grid poses great challenges in grid operation and management. Though each region has a RLDC, the utilities generally do not comply with the RLDC's advice. The continued overdrawing of power by deficient SEBs at the peak time, and reluctance to back down generation during off-peak hours causes grid problems. The main problems of the Indian grid are inadequate generation, a poor frequency and voltage control, inadequate load dispatch and communication facilities, lack of redundancy in transmission system and lack of operational discipline.
Communication for Power SystemsPLCC, microwave, optical fibre, satellite communication have been implemented. Adequate metering and instrumentation at
various levels have been effected. Sequential and disturbance recorders have been installed in the 400 KV and 220 KV substations. Optical fibre is embedded in the ground wire of the transmission lines to provide a ready-made basic infrastructure for data and speech communication.
Indigenous CapacityAt the time of independence India had to import all the equipment for generation, transmission and distribution. Over the years, plants to manufacture the necessary equipment were established. Today thermal power plants up to 500 MW capacity, hydro-power plants up to 165 MW capacity, and nuclear sets of 235 MW capacity are manufactured in India, and are in operation. The manufacturing capability for the future 1000 MW thermal set and 500 MW nuclear set are being established.
capability exists to design and supply world-class electrostatic precipitators (ESPs) for pollution control. The country is self-sufficient in manufacture of components of transmission and distribution lines up to 400 KV. These include power and distribution transformers, instrument transformers, dry-type transformers, SF6 Switchgear, Gas insulated switchgear(GIS), Series and shunt compensation schemes etc. Cogeneration and combined cycle plants have been designed and commissioned to achieve higher plant efficiencies. Fluidised bed boilers have been manufactured and commissioned to make efficient use of high ash content Indian coal. India has been developing clean coal technology for the last couple of decades. A 150 ton/day coal capacity pressurized fluidized bed gasifier alongwith the 6.2 MW IGCC plant has been operating at Trichy which serves as the basic for upscaling the capacity of IGCC plants. A high percentage of the trains in the Indian Railways are equipped with indigenous traction and traction control equipment. India's metro's run on drives and controls manufactured in India.
The Bhabha Atomic Research Centre(B ARC) has played a crucial role in the design, development and supply of various control and instrumentation

172
systems for the Indian power sector. Sufficient expertise has been generated leading to self- reliance in nuclear plant. C&I systems through development, manufacture and operation of C& I systems for research reactors-DHRUVA, PURNIMA I, II, III, KAMINI and power reactors- MAPS, NAPS, KAPS, KAIGA, RAPP. A multi computer based control system has been developed which is in regular operation for our natural uranium based pressurized heavy water reactors(PHWRs) for power refilling. Digital recording system has been adopted for m on ito ring n u c lea r p lan t param eters . BARCIS(BARC Inspection System) has been developed in recognition of the need for a system capable of quickly performing a wide range of measurements and with minimum radiation risk to its operators. Indigenous turn-key capability is available to provide state-of-the-art technology for executing power generation projects from concept to commissioning.
India is one the few countries to indigenously develop the HVDC technology. A 100 MW, 100 KV, 6-Phase, Monopole experimental HVDC line linking to lower Sileru (AP) and Barsoor (MP) was commissioned and made operational by a total indigenous effort with the association of APSEB, MPSEB, BHEL,CPRI and IISC in October 1989, and is in commercial operation form 1991. The system uses water cooling for the thyristors developed by BHEL, fibre optic transmission for firing pulses and mix analog and digital controls.
ChallengesThe country needs to meet its energy demand growing at a very fast rate, but it has several constraints to meet. Most importantly the country is facing a crunch of financial resources for taking up developmental activities in the power sector. The cost of equipment and that of installation are also increasing. Besides, there are other social and environmental issues which pose serious challenges. To address those issues we should have proper upkeep of the existing facilities and take innovative initiatives including application of latest technologies. Some of the strategies are the following:
• Renovation and Modernisation of existing Plants:
• Energy Conservation• Clean Coal Tecchnology• The 3 -E problem and Sustainable Growth• Demand Side Management• Flexible AC Transmission Systems• Enhancement o f Transmission line
conductor temperature by seeking new material
• DistributionAutomation• Application of soft computing to power
system• Dispersed generation and Independent
Power Producers(IPP).• Smart digitaly controlled power grid with
comprehensive electronic sensors.• Creation of Micro Grids - local power
networks with a degree of self sufficiency• Use of smart two-way electric meters• Reduced Carbon generation• Use of modem Lighting technologies
(LED, OLED, CFLetc.)• Improving energy efficiency in industrial,
commercial and consumer use.• Use of more Nuclear and Renewable
energy sources.
EnvironmentA constantly growing energy demand has to be met through an adequately planned electrical power generation programme 'commensurate with minimal environment degradation'. While analyzing the trade-off between energy and environment and between energy and economy, 'Sustainable Growth' would be the final goal to achieve. The production, transportation and use of energy must be designed in an environmentally benign manner and at costs allowing for economically healthy growth.
The use of coal in a direct form poses a number of environmental problems. Indian coal has high ash content to the extent o f 40%. S 0 2 and particulates(fiy-ash) need to be controlled. S02 emission from thermal power plants exceed the production of S02 in nature. Highly developed countries like the USA and Europe are producing S02 which is over 10 times what nature produces

173
in their respective countries. These emissions are carried over to other countries where acid rain has deteriorated the soil and poisoned the water sources. The release of COz from conventional thermal power plants causes the green house effect, resulting in slow but steady rise of ambient temperature causing global warming. Large scale release of chlorofluore carbons (CFC) causes depletion of the ozone layer. While harnessing hydro-electric resources more attention must be given to afforestation to maintain the ecological balance and to mitigate environmental impact of these power plants.
Measures for pollution control for SOz and particulates from the thermal power plants are p ro h ib itiv e . The p ro h ib itiv e costs o f desulphurization plants have so far not been able to justify their installation even in super-thermal power stations in India. The simplest systems of desulphurization using seawater at Trombay Thermal Power Station, Bombay to desulphurise flue gas costs about Rs. 30 crores. Even the latest ESP to controlthe particulates for a 500 MW coal-fired unit presently costs about Rs.20 crores.
Effect of Global WarmingA ccord ing to resea rch done by IPCC (International Panel on Climate Control), the earth's average temperature rose by 0.74 degree Celsius in the last century equivalent to what had happened in the last 1300 years. The temperature could rise between 1.8 to 4 degree Celsius in the coming century. There is more C 02 in the atmosphere than there has been in the last 650,000 years. The sea levels which have risen a total of 17 cm over the course of the 20th Century, would rise anywhere between 18 and 59 cm as a result of global warming and ice-caps melting.
Global warming due to emissions from industrial, transportation and agricultural gases causes sea- level rise, droughts, floods like Tsunami, change of contours of countries by the rising sea level, reduction in agriculture output, and hence, food insecurity, extinction of species (flora and fauna), birds and causing serious environment problems to human beings health wise (Asthma, respiratory problems, chest and stomach problems etc.),
extreme climate and bringing-in new diseases. Certain species of penguin are getting extinct in Antarctica because of ice melting and the penguin are unable to bring up their baby ones.
The arctic sea ice is melting faster than last year, despite a cold winter. A few years ago scientists were predicting that the arctic waters would be ice-free by 2080, but One group now predicts this will be by 2013. Sea-ice has a higher reflectivity than ocean water, so as the ice melts, the water absorbs more of the sun's energy and warms up more, and that in turn warms the atmosphere more, including the atmosphere over the Greenland ice sheet. Greenland is already losing ice to the oceans, contributing to the gradual rise in sea-levels. The ice-cap holds enough water to raise sea-levels globally about 7 m if it all melted.
Conclusion(i) More use of nuclear energy is required.
It is the best option to curb carbon emission. The contribution of nuclear power plants to radioactivity is insignificant in the background of natural radioactivity. With natural radioactive elements like uranium, thorium and potassium present in the earths crust, the measured radioactivity ofthe continental crust is ofthe order of 2x1025 Becquerel (Bq) i.e. equivalent to 500 m i l l io n m il l io n c u r ie s . Radioactivity in radioactive wastes from a modem 1000 MW nuclear plant after operation over one full year and cooled for 10 years would be only 2.6xl017Bq, i.e. 8 millionth of natural background radioactivity. The fear, therefore, is highly exaggerated. France and Canada meet more than 60% of their demand through nuclear energy.
There have been accidents - Chernobyl (1988) in USSR and three miles Island(1978) in US A, but they were due to h u m a n e r r o r a n d p o o r instrumentation. Modem nuclear plants have more and more built-in safety interlocks. Intensive training of

174
personnel is the main task, which has been well realized. The problems are no m ore te c h n o lo g ic a l ones b u t institutional, solutions of which require co-operative efforts of all.
(ii) Use of more renewable sources of energy(solar, wind, fuel cells etc.) is necessary.
(iii) Renovation and modernization of the old thermal and hydro plants are required.
(iv) Use of IGCC plants, combined cycle power plants can achieve over 50% thermal efficiency as against 35-37% for conventional power plant. This avoids the use of flue gas desulphurizing systems and makes possible the use of high ash coal right at the pit head.
(v) Advanced combustion technology needs to be installed.
(vi) Fluidised bed combustion in boilers would control fly ash.
(vii) Energy need to be Conserved.
(viii)More tree plantation is required to check deforestation
(ix) Before the start o f UN Climate
Conference (3-17 Dec, 2007) at Bali, Indonesian President launched a campaign to plant 79 million trees which was duly completed. 1 billion trees were also planted mainly in Mexico, Ethiopia, Turky, Tunisia, Korea, Indonesia, Kenya, Morocco, Myanmar, Brazil etc during 2007 . The U n ion M in is try o f Environment and Forests in India has set for it-self a target of increasing the forest cover to 33% by 2012.
(x) Efficient grid management and control with high penetration of renewables need to be ensure.
(xi) Smart grid and use of micro grids (Local Power Networks with a degree of self sufficiency) needs to be installed.
(xii) C arbon g en era to n needs to be controlled.
In the UN Climate Conference in Bali (Dec.2007) EU suggests a goal of reducing the green-house emission by between 25 and 40 percent below 1990 levels by 2020. The Kyoto (Japan) protocol wants 37 most industrial countries to cut the output of C 02and other green-house gases by 5% below 1990 levels by 2012.
(xiii) All nations should be legally bound to Carbon CAP or Carbon Tax.

Award Lecture Series ofIndian National Academy of Engineering
Professor S. N. Mitra Memorial Award Lecture 2009
India as a Global R&D PowerhouseAshok Soota
Executive Chairman MindTree Ltd
IntroductionI am humbled and honoured to be conferred “Prof S N Mitra Memorial Award 2009” by the Indian National Academy of Engineers. I am deeply aware that earlier recipients and most of you are scientists and discoverers who have to your credit many innovations, patents and development of new technologies. I have always had a deep faith in the importance of R&D and a firm belief in investments in R&D. However, I personally cannot take credit for developing a single product or new technology. These have all been done by my colleagues I respect and admire in the various organizations I have had the privilege to lead, be it the Shriram Refrigeration or the Wipro Infotech and now the Mind Tree. Accordingly, I accept this honour on behalf o f my colleagues and technologists who have great achievements of which they can be proud.
R&D will be the power force to propel India to leadership in the global economy. The investments in R&D can make India the world's fastest growing economy and ensure inclusive and sustainable growth. India missed the boat during the global manufacturing wave in the eighties and nineties in which the victors were the so-called Asian Tigers like Singapore, South Korea, Taiwan. By the late nineties, China had supplanted all these countries to become the workshop for the world, and its leadership has accelerated in recent years. However, there is still an opportunity for India to become the next workshop for the world through design led manufacturing and there are indications that we are ready to grasp this opportunity. India's software capabilities play to this opportunity since the software and design content of so many products is increasing.
While I believe that R&D and investments in new technology development can take India to the greatest heights, we must acknowledge that there is huge gap between where we are and what we want to be. Here I would like to take stock of the accomplishments to-date and identify the major shortcomings and where we lag behind. Last year, I was given the privilege to Chair the Study team on Research & Development for the XI Plan for the ICT Sector. To a large extent, I will draw on the findings of this report. I also find appealing some of the thoughts and ideas in a paper on “Creating a Research Ecosystems”. This is a PAN IIT initiative through a group led by Prof Arvind Kudchadkar of which I am also a member.
R&D as percentage of GDPIn today's knowledge economy, new products and services developed through R&D are going to be amongst the most significant contributors to future GDP growth. R&D, therefore, acquires prime importance for the economy. Furthermore, R&D is of critical importance for the nation's security and fulfilling various societal objectives. Unfortunately, India's investment in this crucial area at about 0.9% of GDP is very low compared to most other countries. Most developed economies invest anywhere from 2 to 4% of GDP. China's percentage is probably around 1.5% of GDP.
There is a school of thought that our R&D numbers are actually higher as the data on research done in universities is not adequately captured. My view is that this would not make a significant difference. More important, because the cost of knowledge generation and cost of R&D in India is so much less than in most of the

176
world, we do get better “bang for the buck.”Seen in this light and from a Purchasing Power Perspective India's R&D would rank in the top ten in the world.
In this context the concept of Gandhian engineering as coined by Dr. R. A. Mashelkar not just doing things cheaper, but “getting more from less, for more and more people.” Gandhian engineering approaches lead to a paradigm shift. Examples of success in Gandhian engineering given by Dr Mashelkar include the path-breaking Tata Nano, the Jaipur foot, Shanta Biotech's hepatitis vaccine at less than 5% of prevailing international costs. All these are worth emulating and expanding to have thousands more such successes. As Dr Mashelkar points out when you design products for the richest in the world, the poor cannot buy them, but when you develop a good product for the poor, even the rich will start using it.
Institutions for delivery of R&D and Categories of sources for funding R&D efforts in IndiaIndia articulated and adopted a scientific policy as early as 1958, and through its 5-year plans built capabilities in R&D. However, an anomaly has remained that India's R&D has been largely funded by the Government/Public sector while the role of the Private sector has been relatively dormant. Excluding global R&D outsourcing, of which India has been a major beneficiary, the Government's contribution to the R&D pie was as high as 80% and of the Private sectors at only 20%. In about 5 years, there should be a goal ofbringing it up to a level of 50%. Even Taiwan went through such a cycle where the Government's contribution to R&D progressively came down from 80% to be come a minority share.
Briefly, the major sources for R&D funding and delivery in India are:
(i) R&D undertaken by the academia and R&D Labs through extra-m ural funding and funding by DIT, DST, DTC and from funding by industry
(ii) First-party Labs which undertake R&D largely for their own missions or to fulfill in-house needs as in the case of Space, Atomic Energy, DRDO and user agencies/sectors
(iii) R&D undertaken by third party R&D labs, as in the case of C-DAC, SAMEER, C-DOT, CSIR Labs, etc. who get funding from respective ministries and various sources
(iv) R&D work undertaken by Indian public sector as in the case of BEL, ECIL and ITI
(v) R&D undertaken by large private sector and SME sector (for domestic markets and exports) including export of R&D services
(vi) R&D undertaken by the global MNCs and other foreign companies
Globalization of R&DIn recent years the globalization of R&D has accelarated sharply and India has acquired leadership. Hundreds of MNCs have set up captive research centres cutting across a range of industries from Autos to Pharma, Chemicals, Food, Consumer durables and, of course, Information Technology which was the forerunner of the wave. In most cases, the Indian labs have become their largest labs globally or outside of their home country.
The outsourced R&D has become a $ 9.0 bn industry for India, and it has grown at above 25% compounded for the 4 years preceding the current global recession. Companies such as HCL, MindTree, Sasken, TCS, Wipro, and others have established themselves as global R&D players. However, in the case of the outsourcing industry, the IPR invariably belongs to the customer and so there is no multiplier benefit. The above mentioned firms also generate their own licensable IP. In addition, there are a host of relatively young and new companies also developing their own IP/Products.

177
A heartening feature of the globalization of R&D, applicable to both the captive and merchant labs is the movement up the value chain. In early years, there was a tendancy to offshore or outsource only the low-end work, but now the labs in India are being used to generate products for global markets apart from customizing the products for local markets. These work best where these are integrated with the global operations. Texas Instruments is a great example where the labs have generated many products which have captured high global market shares. Likewise, even the merchant R&D centres are being increasingly entrusted w ith end-to-end responsibility, and some companies are creating com plete products up-to the ready-to- manufacture or even ready-to-brand stages.
All the above is a great tribute to and acknowledgement of the quality of talent in India. Our largest competitor in this area is China which has many successes linked to manufacturing in the country. The English language capability in India has been an advantage for us over China and, more importantly, the comfort of the customers in our IP protection laws and IP protection regime, culture and history. In this context the following quotation from Jack Welch, the legendary ex-CEO of General Electric in relevant: “India is a developing country but it is a developed country as far as its intellectual capital is concerned. We get the best intellectual capital per dollar here - thanks to the amazing quality o f Indian talent. ’’ "India is a developing country with a developed country R&D infrastructure "
What has gone well in India's R&D efforts ?The most visible successes for the Indian R&D which have brought pride and self-confidence to the country are our achievements in space and atomic energy. The same degree of unqualified success cannot be claimed in the areas of defence or agriculture where there have been significant investments or in environment or healthcare areas which are now receiving more attention.
The large institutional base that has been created in research institutes and laboratories and universities serve as a strong foundational
framework. In the areas of achievement, the Gandhian engineering examples need to be highlighted.
What could be better in India's R&D effortsThe weaknesses are dealt at depth to focus on eliminating these for achieving our goals:
i) The first and the foremost, as pointed out by Prakash Reddy in his book “Globalization of Corporate R&D”, the various Institutions forming a part of the national innovation system function as silos and do not have strong links and flow of information between them. Accordingly, all the 3 components (universities, research institutes and labs managed by Government and the Industrial sector) perform well in their own sphere, but don't realize potential synergies of collaboration. In this context, I may mention the approach of and the concept behind the recently founded University, NUT University. This is founded on four core principles, where learning would be industry- linked, technology-based, research- driven and seamless. To ensure that curriculum always stays relevant and current, visiting faculty from industry will constantly be interacting with the s tu d en ts at the cam pus. M ore importantly, an Incubation Centre is planned to be set up so that the R&D projects can find commercial application and patenting, licensing and technology transfer become easy. All processes are technology-based and a research mindset is inculcated. Most interesting is the concept of seamlessness where the students are encouraged to enroll for apparently unrelated subjects.
(i) Lack of R&D clusters of excellence in specific areas.
(ii) Relatively less focus is given on fundam ental research v is-a-v is development. Accordingly, we have

178
the phenomenon of Indians in overseas labs receiving Nobel prizes and other high recognitions whereas people of similar capabilities are not able to do pioneering work in the Indian ecosystem for research.
(iii) With so much of the country's spend coming through the Government labs, there is inadequate commercialization of the technology and an absence of mechanisms/incentives to maximize this.
(iv) There is an inadequate patent culture. Other than C SIR and other Government labs, majority of the patents are by the MNCs in their captive centres.
(v) We are followers of standards rather than creators of standards which come by w o rk in g on le a d in g edge technologies and pushing the envelope on these.
(vi) Private sector must step up its investments on R&D and see it as a source of competitive advantage.
(vii) Finally, R&D is all about people which includes attracting and retaining the best talen t, providing the right incentives (both monetary and technical challenges), encouraging more people to seek PhDs and so on. The partial reversal of the brain drain in recent years shows that there is an increasing belief that leading edge work can be done in India.
Conclusion : Vision for R&D in India
(i) There is a need to articulate our future vision for R&D and its importance for achieving sustainable and inclusive growth.
(ii) The Research Ecosystem begins with education and creating a learning env ironm en t w hich in cu lca tes curiosity, innovation and creativity.
(iii) There should be a focus on creating research universities. The SEZ scheme of the country could be adapted for creating research clusters and research universities.
(iv) For commercialization of the technology developed in the Government labs, many things can be done. These include technology showcasing at exhibitions, and technology incubators in institutions etc.
For Public-Private projects there should be a suitable policy framework and the Government should have a clear policy defining the IPR and the royalty sharing mechanisms between developing institutions, inventors, and the industry.
(v) The talent crunch for the Government Labs and universities is truly looming needs as a major impeding factor since the talent is being drawn into the R&D outsourcing industry and the MNC labs. To create more manpower for research and to offset attrition the following to be introduced, (a) The pay scales for technical manpower in academics, Government, and R&D laboratories should be enhanced to enable attracting / retention of qualified manpower, (b) With a view to attract more students for PhD, the Government should create prestigious research fellowships, at enhanced rates, with a provision for participation of the scholar in national and international conferences for presentation of his or her paper.
(vi) A framework for industry-academia- professional bodies - government relationship needs to be evolved.
AcknowledgementI thank the Indian National Academy of Engineers for bestowing this honour on me and wish each of you the best in your future endeavours.

Award Lecture Series ofIndian National Academy of Engineering
Professor S. N. Mitra Memorial Award Lecture 2010
The Energy Scenario in India - The Present and the Future
S.P SukhatmeProfessor Emeritus
Indian Institute of Technology, Bombay
IntroductionI deem a great honour to be conferred the ProfS N Mitra Memorial Award for the year 2010 and am deeply grateful to the Academy for selecting me.
The word 'energy' is in the news almost every day because energy is recognized to be a key driver of India's economic growth. Here our focus will be on the primary energy sources - coal, oil, natural gas, hydro, nuclear, wind and biomass used for commercial purposes. The questions are as follows: What is the commercial energy scene in India today? What are the existing sources (renewable and nonrenewable) supplying our needs? At what rate are we producing/consuming them? How long are the nonrenewable sources likely to last? What are the energy alternatives today? And what are the alternatives which could be significant in the future? What are the proj ected future needs of energy for the country? And when are we likely to meet them?
While recognizing the need for energy in a growing economy, we have to ensure that the nation's future use of energy resources leads to sustainable development, and that harmful effects on the environment in the form of the green-house effect and global warming are minimized. Recent reports issued by the Intergovernmental Panel on Climate Change have been controversial. Nevertheless, it is now fairly certain that the average concentration of the green-house gases (carbon dioxide, methane, etc) has increased by about 100 ppm in the last 150 years. The available experimental data also indicate that the global average temperature has increased by about 0.8°C over the same period of time. What is even more alarming is that there are indications of a rise of0.2°C over the next few decades. Thus, as the
nation continues to move on a 'high growth' path requiring a large growth rate in the use of energy, it is clear we would have to keep the safety of the environment in mind.
The Commercial Energy Scene Today Coal: It is the mainstay of our energy scene. The rate of production of this commodity over the last 60 years is shown in Fig.l. It is seen that the production has been increasing steadily at the rate of 4 or 5 per cent every year, and that the production in 2008 was 493 Mt. In recent years, coal is also being imported in significant quantities. Data on the imports is presented in Table 1. It may be noted that the imports are in the form of coking and non-coking coal.
India has fairly large reserves of coal. Estimates made in 2008 by the Geological Survey of India give the total reserves to be about 267,000 Mt, of which about 105,000 Mt are classified as proved reserves. Being a non-renewable resource, the production curve for coal is likely to follow the shape shown in Fig.2. Thus, although the production is increasing at the moment, it is likely to pass through a maximum sometime in the future, and then slowly decrease. Calculations show that the peak production would lie in the years from 2040 to 2080. The lower value of2040 is obtained if one assumes that only the proved reserves of 105,000 Mt are available, while the higher value of 2080 is obtained if one assumes that all the reserves amounting to 267,000 Mt are mined. It has to be noted that prospecting for coal is continuing and that more coal may be available.
Oil: Fig.3 presents the data on the domestic production of crude oil (curve 1), the import of

180
crude (curve 2) and the consumption of petroleum products (curve 3) in India over the years. The domestic production of crude oil was negligible until 1960. Thereafter, it increased slowly because of discoveries on-shore in Assam and Gujarat and was about 7 Mt per year in the early seventies. Major discoveries off-shore in regions like Bombay High resulted in a rapid increase to over 30 Mt per year by 1985. However, subsequently the production has fluctuated in the range of 27 and 34 Mt per year for the last 25 years, and indications are that the domestic production may not increase unless some major discoveries are made. Because of the increase in demand, the annual imports of crude oil have been steadily rising every year at the rate of 8 or 9 per cent, the quantity imported in 2008 being 128 Mt. Correspondingly, the consumption of petroleum products has also been growing at a rapid rate, and was 161 Mt in 2008. The continuous increase in consumption is a consequence of the good economic growth. However, it is also a source of worry because the import costs India thousands of crores of rupees and raises the issue of energy security. The position regarding the reserves of crude oil is rather uncertain. Present estimates are that the proved recoverable reserves are only around 800 Mt that may last for only 20 years. Extensive prospecting is in progress, and there is hope that more discoveries will be made.
Natural Gas : Its production started in India around 1970 and the data on the annual useful production are plotted in Fig.4. The domestic production rose steadily from 1980 onwards and crossed 30 billion cubic metres in 2002. Subsequently, the production did not increase much for 6 or 7 years, and was 32.85 billion cubic metres in 2008. Domestic production has gone up significantly from 2009 because of inputs from the new discoveries off-shore in the Krishna- Godavari Basin, and will be in excess of 50 billion cubic metres in 2010. In addition to the domestic production, fair amounts of natural gas are now being imported. Imports during 2010 will probably be around 10 billion cubic metres. Present reserves of natural gas are estimated to be about 1250 billion cubic metres. These may last for only about 30 years. However, the prospects of
finding more gas reserves off-shore are good.
Hydro-electric Power: At the time of independence, the installed capacity of hydroelectric power in India was only 508 MW. It increased rapidly in the fifties at an average rate of14 per cent per year. Thereafter, the growth rate has been slower, but nevertheless impressive. The installed capacity in 2009 was 36,880 MW. The growth in installed capacity over the years is presented in Fig. 5. The electricity generated from hydro-electric power is also shown in the same figure. Hydro-electric power is a renewable source of energy and an indirect use of solar energy. Thus it is of importance from the long term point of view. India's reserves of hydroelectric power have been estimated to be 148,700 MW. Thus there is considerable scope for generating more hydro-electric power, particularly in the northern and north-eastern regions. However, there are serious concerns regarding the displacement of people who have to be rehabilitated because of the submergence of land behind dams. The destruction of flora and fauna on account of submergence is also a source of worry. These and other concerns need to be carefully addressed if the expansion of hydroelectric power is to progress at a rapid pace.
Nuclear Power: The installed capacity of nuclear power plants in India in 2010 is 4560 MW. The growth over the years is shown in Fig.6. Barring the first two reactors, which were boiling water reactors, all the others are pressurized heavy water reactors (PHWRs). They are indigenously developed and use natural uranium as the fuel. Only the uranium-235 isotope, which makes up only 0.71 % in natural uranium, is utilized. India has limited resources of uranium. Present estimates are that reasonably assured reserves of uranium are only about 60,000 tonnes. Thus, the present strategy is to build a capacity of10,000 MW of PHWRs which would yield 330 GW-year of electricity over their life-time of 30 to 40 years. The spent fuel would be re-processed and used subsequently in fast breeder reactors (FBRs). This part of the programme will be described later under 'Energy Alternatives'. In addition to the present installed capacity, a

181
number of units are at different stages of construction. These have a capacity of 4120 MW and include three PHWRs (1620 MW), one Prototype Fast Breeder Reactor (500MW) and two Pressurised Water Reactors (2000 MW). Data on the electricity generated from nuclear power plants is presented in Fig.6. It is seen that there was an increase in generation till 2002. Thereafter the generation fluctuated and touched a low of 14,927 GWh in 2008 in spite of the added installed capacity. The low capacity factors in these years were due to the shortage of uranium fuel. This shortage has now been overcome and generation has increased. The electricity generated in 2010 should cross 21,000 GWh.
Miscellaneous Sources: These sources like wind energy, biomass and small hydro-electric power stations (i.e. units with capacities less than 25 MW) are renewable and are growing in importance. Fig.7 presents data on the growth of capacity in wind energy and the electricity produced. It will be seen that starting from 1992, the growth has been spectacular, the installed capacity in 2009 being nearly 12,000 MW. However, it has to be noted that the wind energy is generally available for only 4 or 5 hours a day. As such, the annual plant load factors are only around15 per cent. Surveys indicate that there is a potential for installing a total capacity of about45,000 MW of wind energy on land in India. The installed capacity of biomass power units and small hydro-electric power units has also been growing steadily. Data are presented in Table 2. It is seen that the installed capacities till the end of 2008 were 1750 and 2429.7 MW, respectively. In the case of biomass power units, it is estimated that India's total potential is about 20,000 MW, while in the case of small hydro-power units, it is estimated that there is an aggregate potential of about 15,000 MW in the country. About 4000 sites with a total capacity of a little over 10,000 MW have been identified.
Electricity Production in India: Data on the installed capacity and the electricity produced over the years are presented in Fig.8. The data show that the installed capacity has increased from 1362 MW in 1947 to 16,664 MW in 1973
and to 163,669 MW in 2009. The corresponding figures for the electricity produced were 4073, 66,689 and 771,000 GWh respectively. It is to be noted that the above data on installed capacity does not include captive power plants. The total capacity of such plants is around 19,000 MW.
The percentage contribution of the various energy sources to the installed capacity in the year 2009 was as follows:
Coal 53.21% Oil 0.73%Natural Gas 10.60% Nuclear 2.79% Hydro-electric 22.63 % Miscellaneous 10.04 %
It is seen that coal is the dominant contributor, followed by hydro-electric power and natural gas. Oil contributes very little to large-scale electricity generation, and is used essentially for transport purposes and for supplying heat energy. Nuclear energy and miscellaneous sources together constitute close to 13 per cent of the capacity. This may seem small. However, it has to be noted that their contribution has grown over the last 30 years. Prior to that, it was negligible.
Annual Production of Energy in India: It isworthwhile to estim ate the heat energy content/equivalent in each of the commercial sources consumed/produced every year and obtain an overall figure for the country. This calculation is done for the year 2008 by following the procedure given in (8). The heat energy content of fuels is obtained by multiplying the consumption/production by the calorific value, while the heat energy equivalent of a source supplying electrical energy is obtained by dividing the electrical energy produced by an appropriate energy conversion efficiency. The results are given in Table 3. It is seen that the total heat energy consumption/production in 2008 was 21,391 PJ. Out of this, coal, oil and natural gas contributed 91.86 per cent, while the remaining sources (hydro-electric, nuclear, wind and biomass) contributed only 8.14 per cent.
Energy Alternatives The Need for AlternativesFossil Fuels'. India's known reserves of oil and

182
natural gas are limited. Given the present rate of production, the oil reserves are likely to be consumed in another 20 years. Natural gas reserves may last a little longer, perhaps for about 30 years. This situation will change for the better only if additional discoveries are made. As oil and natural gas become scarcer, a greater burden will fall on coal. Present indications are that coal production may peak in the period from 2040 to 2080.
Hydro-electric Power: There is considerable scope for increasing the capacity of hydro-electric power in India. However, environmental and other concerns need to be taken care of, particularly for large projects so that this renewable source is used to its full potential.
Nuclear Power: The PHWRs used at present for power generation use natural uranium as fuel. In these reactors, only the uranium-235 isotope is utilized. This isotope is available to the extent of less than 1 % in naturally occurring uranium. The other isotope, uranium-238 which constitutes more than 99 % o f naturally occurring uranium, is wasted. Given the fact that India has limited resources of uranium, it is clear that only a limited amount of power can be extracted in this manner. It is also clear that the growth of nuclear power in India rests to some extent on public perceptions regarding safety. Fears regarding the hazards associated with accidents which may occur, and the disposal of radioactive waste persist and need to be continuously addressed.
Miscellaneous Sources: Mnd and biomass have begun to play a small but significant role in the commercial energy scene.
It is thus evident that there is a need for expanding the use of the existing alternatives and at the same time, developing new alternative energy sources. The immediate need within 20 or 30 years would be to develop alternatives to alleviate the problems caused by the depletion of oil, natural gas and uranium. The long-term need would be to develop alternative sources to replace coal. It is to be noted that although these observations are
being made with respect to India, they are applicable to many other countries in the world.
Primary Sources of Alternative EnergyThe primary sources of alternative energy which hold potential for the future can be broadly classified under three categories. These are : solar option, nuclear option, and other options.In addition to the primary sources, there are some secondary alternatives. These sources are different from primary sources in the sense that they require a primary source or one of the existing sources of energy for their production. It is also important to remember that the energy obtained from a secondary source is less than the energy required for producing it. A good example of a secondary source is 'hydrogen energy'.
The Solar Option: Solar energy is a large, renewable source of energy. It may be used directly or indirectly. At present, the only method by which solar energy is being used commercially on a large scale in the world (and in India) is through the generation of hydro-electric power, which is an indirect use of solar energy. However, there are problems associated with the use of solar energy. The main problem is that it is a dilute source of energy. The solar radiation flux even on the hottest day does not exceed 1 kW per sq. metre and the total radiation over a whole day is at best 7 kWh per sq. metre. Thus large collection areas are needed in many applications and these result in excessive costs. The second problem arises particularly in direct applications, and is associated with the fact that the availability of solar energy varies widely with the time of the day. The variation occurs because of the day-night cycle. It also occurs at a specific location because of local weather conditions. Consequently, if the collected energy is needed round the clock, it has to be collected when available during the day and stored for later use. The need for a storage device adds greatly to the cost of a solar system. Thus, the real challenge in utilizing solar energy as an energy alternative is of economic nature. One has to strive for the development of cheaper methods of collection and storage so that the large initial investments required in most applications are reduced.

183
Solar energy is utilized directly via the thermal and photo-voltaic routes, and the market for solar thermal devices and systems as well as PV systems has grown significantly in the last 20 years. While they are important and need to be encouraged, it has to be recognized that the direct routes are limited in their ability to meet our country's large needs.
Solar thermal applications include water heating, space heating, drying, cooking, etc. In addition, the thermal energy collected can also be used to operate a thermodynamic cycle and obtain electrical power or refrigeration. Out of all the applications, water heating is the most attractive from an economic view point. In India, a large number of systems have been installed. Typical pay back periods are in the range of 4 to 5 years. Most of the systems use flat-plate collectors and it is cumulatively estimated that the total area in flat- plate collectors in water heating systems installed in India is about 2 million sq. metres. The hot water is used for domestic purposes or for meeting the needs o f industries and commercial establishments.
Another important application is the generation of power in solar thermal-electric power plants. Considerable attention is currently focused on the construction of a number of plants each with capacities of a few megawatts under the Jawaharlal Nehru National Solar Mission. Experience gained from installing and operating such plants will be useful for scaling up. At present, the major impediment is the initial cost of such plants. Typically, the cost is estimated to be around Rs 15 crores per MW for a plant which operates only during the day for about 8 hours. In order to off-set this, the Government is offering attractive feed-in tariffs over a period of many years.
Photovoltaic conversion is the other direct method of utilizing the solar energy. The principal advantages associated with it are that solar cells have no moving parts, require little maintenance and work quite satisfactorily with beam or diffuse radiation. The main factors limiting their use are that they are rather costly, and that there is little economy associated with the magnitude of the
power generated in an installation. 90 per cent of the commercial production of solar cells is from single crystal and multi-crystalline silicon.
Current production of solar P V modules in India is around 100 MW with a significant amount being exported. The current cost is about $ 4-5 per peak watt. In spite of the high initial cost, photovoltaic systems are being used increasingly to supply electricity for many situations requiring small amounts of power. Their cost-effectiveness increases with the distance of the location from the main power grid lines. Thus, in the future, P V systems may become one of the important sources of power for providing small amounts of electrical energy in kilowatts for localized use in remote locations. It is also possible that a number of grid- connected P V power systems having capacities of a few megawatts may be installed.
Apart from hydro-electric power, the sun's energy is also being used indirectly on a commercial scale through wind energy and energy in biomass. These indirect applications will grow as the need for alternatives increases. We will discuss these a little more. It is also possible that solar energy may be used indirectly in the future through the energy stored in waves and in marine currents , and the energy which can be developed by utilizing the temperature differences between the upper and lower levels of water in the oceans. These indirect applications will also be described.
The wind power machines installed are all of the propeller type with capacities usually ranging from 1 to 2 MW, and costing about Rs 50,000 per KW. The typical payback period is 4 to 5 years. It is important to note, however, that all these developments have taken place on land. The time is now appropriate for India to start harnessing the potential of wind energy off-shore. The potential off-shore is much more than what is available onland because the wind speeds off-shore are usually higher and steadier. In addition, in some cases, resources are concentrated close to the load centres in metropolitan cities. In this context, it is worth noting that one of the world's largest offshore wind farms having a capacity of 300 MW (100 machines each with a capacity of 3 MW) has

184
gone into operation off the coast of Kent in England in 2010.
The term 'biomass' is used in a broad sense in the context of deriving energy from it. It includes all plant life and their residues after processing. Plant life refers to trees, agricultural plants, bushes, grasses and algae, while residues include crop residues like straw, stalks, leaves, roots, etc and agro-processing residues like oilseed, groundnut and coconut shells, husk, bagasse, molasses, saw dust, wood chips, etc. The term 'biomass' is also generally understood to include human and animal waste and organic fractions of industrial and household waste. There are many ways of obtaining energy from biomass. These may be classified under thermochemical conversion, biochemical conversion and oil extraction. In turn, thermochemical conversion includes processes like combustion, gasification and pyrolysis, while biochemical conversion includes anaerobic digestion and fermentation. It should be noted that biomass is a sustainable source of energy because there is no net release of carbon dioxide if one considers the whole process of growing biomass and using it subsequently as a source of energy.
Traditionally, much of India's non-commercial energy has been obtained by burning wood, agricultural waste and dung cakes in inefficient 'chulhas'. A considerable amount of effort has therefore been expended in improving traditional 'chulha' designs so that higher efficiencies are obtained. On a larger scale, some energy is also being generated by the 'energy plantation' approach, and by biomass gasification. Another way of obtaining gaseous fuel is through anaerobic digestion of wet animal waste to produce biogas. Many biogas plant designs of varying capacities have been developed in India, and there are 3 or 4 million biogas plants. These have made a small but significant impact on the rural scene.
In the last few years, the need for developing liquid fuels, particularly for the transport sector has resulted in the use of fermentation processes for making ethanol from food crops having sugar
or starch content. For India, it is rather important to first produce fermentable sugars from cellulosic or hemi-cellulosic biomass rather than using food crops grown on agricultural land. Liquid fuels in the form of bio-diesel are also being produced by extracting oil from oil plants or by the process of transesterification of certain edible and non-edible oils.
There is a large potential for using biomass in India for providing solid, liquid and gaseous fuels. Apart of the energy from these fuels could be used for generating electricity. The electricity potential alone is estimated to be about 20,000 MW that needs to be exploited keeping in mind that the biomass grown for this purpose does not displace food crops grown on agricultural land.
The wave energy is energy available at the ocean surface because ofthe interaction of the wind with the water surface. It is difficult to collect because of wide fluctuations in amplitude and frequency of the waves at any location. As a result, considerable ingenuity is required in building cost-effective devices. Nevertheless, a number of devices for converting wave energy into electricity have been developed. Two of the devices developed are the Oscillating Water Column (OWC) system and the Pelamis system. The OWC system is set-up near the shore in shallow water, 10 to 25 m deep. In India, an O WC system has been bu ilt and operated at Thiruvananthapuram. The system is located at the tip of a breakwater wall at a water depth of 10 m where the average wave power potential is 13 kW/m. The plant has been generating 18 kW of electrical power. The Pelamis system is a semisubmerged device in which the energy of the waves is transferred through hinged joints to operate hydraulic motors which in turn drive electrical generators. A number of pilot systems have been built in many countries and recently the world's first commercial wave energy plant producing 2.25 MW has been commissioned in Portugal.
Marine currents with fair energy potential exist along the coasts of many countries. The kinetic energy in these currents can be harnessed by using

185
submarine turbines. The technology for extracting the energy is still in its infancy, and only a few pilot plants are in operation in the world. The estimated global resource is 800 TWh/yr. No estimates are available for India.
Ocean thermal energy conversion (OTEC) systems utilize the temperature difference between the upper and lower layers of water in the tropical oceans to drive a heat engine, and thereby generate electrical power. The concept was first suggested in 1930 and a few pilot plants have been built in different parts of the world. However, they have been found to be very expensive because of the low energy conversion efficiency and the need for large amounts of parasitic power. In India, an open cycle OTEC plant producing 100,000 litres of desalinated water per day has been operating at Kavaratti in Lakshadweep since 2005. The global resource is estimated to be about 10,000 TWh per year. No estimates are available for India.
The Nuclear Option : Under this option, the two alternatives are : breeder reactor, and nuclear fusion.Breeder Reactor: The uranium-235 isotope in uranium is used in a PHWR reactor, because uranium-235 is the only naturally occurring fissile material. Thus, the uranium-238 isotope, which constitutes more than 99 % of natural uranium, is wasted. However, uranium-238 is a fertile material and can be converted into a fissile m a te r ia l, p lu to n iu m -2 3 9 , by n eu tro n bombardment. In turn, the plutonium-239 when subjected to neutron bombardment splits into fission products, and neutrons and energy arereleased as heat (Fig.9). This two-step process forms the basis for the working of a breeder reactor. Breeding is achieved by having both fissile and fertile materials in the reactor core under conditions which provide enough neutrons to propagate a chain reaction in the fissile material as well as to convert more fertile material into fissile material than was originally present. A breeder reactor working on the uranium-238 to plutonium-239 cycle utilizes naturally occurring uranium more completely and thereby helps to extend the supply of uranium by a factor of about 100. It is estimated that the reasonably assured
reserves of 60,000 tonnes of uranium in India could yield 42,200 GW-yr of electricity through the fast breeder reactor route.
The next stage planned in the Indian nuclear power programme is to build breeder reactors utilizing thorium. Naturally occurring thorium- 232 is also a fertile material and can be converted into uranium-233 which is a fissile material. The reactions occurring in this breeder reactor are shown in Fig.9.They are of particular significance because India has ample reserves of thorium. It is estimated that about 225,000 tonnes of thorium metal is available, and that there is a potential for obtaining 150,000 GW-yr which can satisfy India's energy needs for a long time.
The current status in India is that a Fast Breeder Test Reactor (FBTR) using plutonium-uranium carbide fuel has been in operation in Kalpakkam since 1985. The reactor has operated up to a thermal power level of 18.6 MW. The successful operation of the FBTR, and the experience gained in running it have led to the commencement of the next phase of the breeder programme, viz. the design and construction of a Prototype Fast Breeder Reactor (PFBR). PFBR is a 500 MWe sodium-cooled, pool-type reactor designed to use a mixed oxide of uranium and plutonium as the fuel. Construction began in 2004 and the reactor is likely to go critical in 2011.
Nuclear Fusion: In nuclear fusion, energy is released by joining the nuclei of very light atoms. If current research on controlled fusion is eventually successful and fusion reactors are built, they could provide the ultimate solution to the world's energy problem. The reactions of interest in fusion involve the fusing of nuclei of deuterium into nuclei of helium-4 and the release of protons, neutrons and energy. Deuterium occurs naturally and abundantly in sea water.A fusion reaction can be self-sustaining only if the rate at which the energy is supplied to the plasma is less than the rate at which the energy is generated by the fusion reaction. This is only possible above a certain critical temperature which is estimated to be of the order of 100 million Kelvin for the above-mentioned

186
reactions. Thus, the key problems in the development of a nuclear fusion reactor are the attainment of the required high temperature by initially heating the fuel charge and the confinement of the heated fuel for a long enough time for the reaction to become self-sustaining.A number of countries have come together to launch a joint programme for building and operating a fusion power reactor (9). The joint program m e is called the In terna tional Thermonuclear Energy Reactor (ITER). The participating countries are the European Union, Japan, China, India, Korea, Russia and USA. The aim of ITER is to establish the scientific and technological feasibility of building a controlled fusion power reactor. Further, it is planned to gain the necessary experience for eventually designing, constructing and operating the first electricity-producing plant based on nuclear fusion.
Other Options: Some other primary sources which have the potential for providing energy in the future are : (i) tar sands, (ii) oil shale, (iii) shale gas, (iv) coal bed methane, (v) gas hydrates,(vi) tidal energy and (vii) geothermal energy. Of these, the first five are fossil-fuel like substances or fossil fuels mixed with some other materials.
Tar Sands are porous sandstone deposits impregnated with heavy viscous oils called bitumen or simply deposits of heavy oils. The bitumen is separated from the sand and then processed and converted to synthetic crude oil. Large deposits of tar sands are available in Canada and Venezuela, and some plants producing crude oil have been in operation in these countries. No significant deposits have been located in India. However, recently Indian companies have indicated an interest in acquiring some of the reserves abroad.
Oil Shale is a finely textured rock mixed with a solid organic material called kerogen. When crushed, it can be burnt directly like coal. Alternatively, it can be converted into oil by pyrolysis. India has reserves of oil shale in the north-east. These have been evaluated recently by the Directorate General of Hydrocarbons, and
there are indications that a significant amount of oil can be obtained from them. However, no commercial activity has taken place so far.
Shale Gas is natural gas found in underground shale rock deposits in many parts of the world. Till recently, its extraction was considered to be uneconomical. However, two factors have contributed to the rapid development of shale gas extraction. These are advances made in underground horizontal drilling and in high- volume hydraulic fracturing. Companies in the United States have provided the lead in this respect. In India, extensive deposits of shale rock are found in the Gangetic plain, Assam, Raj asthan and some coastal areas. Some preliminary exploratory work has begun, and there are reports that the US Geological Survey may help in making a resource assessment.
Coal bed Methane (CBM) is natural gas adsorbed underground within the solid matrix of coal. In addition to the gas, fractures in the coal bed are usually filled with water. In order to extract the gas, wells are drilled down into the coal seam and file water is pumped out. This reduces the partial pressure of the adsorbed gas and causes it to flow upwards out ofthe wells. If an adequate number of fractures are not present naturally, hydraulic fracturing is first resorted to. The first commercial production of CBM in India commenced in 2007 and in 2009,26 blocks covering an area of 13,600 sq km have been auctioned by the Directorate General of Hydrocarbons. Development work is underway in some of the blocks and production is expected in 2011.The reserve potential of the blocks is estimated to be 180 billion cubic metres. For the country as a whole, the recoverable reserves are estimated to be 800 billion cubic metres.
Gas Hydrates are ice-like structures of gas (methane) and water at a temperature of 10 to 30°C and at a pressure of a few hundred bars. These deposits are found to occur naturally in large quantities deep down on the ocean floor in many parts of the world. Potentially, this is a vast energy source if extraction can be done economically. The development of technology for

187
extracting methane gas from hydrates is still in its infancy. India has good resources of gas hydrates in the Krishna-Godavari and Mahanadi basins and in the Andaman deep sea. In 2008, as a first step, the Directorate General of Hydrocarbons and the US Geological Survey have signed an MoU for co-operation in the areas of estimating and exploiting these resources.
Tidal Energy is the energy available in water because of the rise and fall of the water level during high and low tides. From a practical point, this energy can only be tapped in certain coastal estuaries where the rise and fall is amplified to a few metres. A barrage and a low head hydroelectric power station are built at such locations. In India, the two potential regions for exploiting tidal energy are the Gulf of Khambhat and the Gulf of Kutch in Gujarat. Calculations show that it should be possible to have an installed capacity of 7000 MW generating 15,000 GWh per year in the Gulf of Khambhat where the average tidal range is around 7 m. Similarly, in the Gulf of Kutch, it is estimated that a capacity o f900 MW yielding 1600 GWh per year could be installed.
Geothermal Energy is the energy coming out of the interior of the earth on the surface. Because of non-homogeneities in the earth's crust, this flow of heat creates numerous localized hot spots below the surface. Groundwater comes into contact with the hot rocks in some of these locations, and as a result, steam or hot water is formed. Wells drilled to these locations cause the steam/water to emerge at the surface where the energy can be utilized. A number of geothermal power plants utilizing steam coming out on the earth's surface have been installed in many countries, the total installed capacity in the world being around 9000 MW. In addition, a fair amount of geothermal energy available in hot water is used directly as heat. In India, geothermal sources in the form of steam and hot water exist along the west coast, in Ladakh and in parts of Himachal Pradesh. However, they do not seem to be suitable for generating electricity, and are being used only for tapping small amounts of energy.
Projecting the FutureApproach 1 - Energy Needs Based on Desired GDP Growth RatesA number of studies have been conducted with the objective of projecting India's future needs for commercial energy and the corresponding growth in the installed capacity of electrical power. These studies have also given the break-up of energy sources which will supply these energy needs. The studies are based on the centralized planning concept in which one prescribes a desired rate of growth of GDP for the country and calculates the required growth in demand for energy and electricity. Among other things, such studies usually need to make assumptions regarding the growth in population. They also need to make assumptions regarding some of the following quantities : (i) the energy intensity (kg of oil equivalent spent per rupee of the GDP), (ii) the energy/GDP elasticity (the ratio of the growth rates of the two), and (iii) the electricity/GDP elasticity. Depending on the model, these quantities may be taken to be constant or their variation with time may be considered.
Two studies, one by The Energy and Resources Institute (TERI) and the other by the Department of Atomic Energy (DAE) are consider here. Both were completed in 2006. The study by TERI (10) adopted a sectoral approach and predicted the energy scenario over the next 25 years, i.e. up to2031, with a GDP growth rate of 8 %. It considered a number of energy scenarios of which the 'Business-as-Usual' (BAU) scenario and the Hybrid (HYB) scenario are discussed here. The BAU scenario assumed the most likely path of development for the country in the absence of any major new policy alternatives. On the other hand, the HYB scenario was a more aggressive are in which among other things, there was a stress on renewable energy, a large increase in nuclear energy, a focus on energy efficiency measures and the deployment of clean technologies. The results obtained for 2031 for the heat energy content/equivalent of the total commercial energy requirements and the source-wise break-up are given in Table 4. For comparison, data for 2001 as given in the TERI report are also tabulated. It may be mentioned that the data on hydroelectric

188
power, nuclear power, wind energy, etc (energy produced in the form of electricity) do not seem to have been converted to their thermal equivalent in the TERI data. This is incorrect and for this rea so n , th ese num bers are se r io u s ly underestimated. An approximate conversion factor would be 3. This has been used for correcting the results presented by the TERI.
Table 4 shows that over a period of 30 years from 2001 to 2031, the commercial energy requirements in India would grow from 303 to 2231 Mtoe, i.e. by a factor of 7.4 and at the average rate of 6.9 % in the B AU scenario. The corresponding numbers for the HYB scenario wouldbeafactorof5.7 andagrowth rate of 6.0 %.These are alarming figures because they show that even in the HYB scenario, there will be a very steep rise in the requirements. Further, the predictions show that India will continue to be heavily dependent on fossil fuels in 2031. In physical terms, fossil fuels will be needed to the staggering extent of 1387 Mtoe in 2031 in the HYB scenario. This amounts to 79.9 % of the commercial energy requirements. Hydroelectric power, other renewable sources and nuclear power will supply only 348 Mtoe (20.1 %) in spite o f the encouragement given to these sources in the HYB scenario. The corresponding percentages for 2001 are 91.1 and 8.9, respectively.
The other is by Grover and Chandra of the DAE[11]. This study makes assumptions similar to those indicated earlier, but projects slightly conservative values. The results are also shown in Table 4. The energy requirements are projected to grow by a factor of 3.7 to a value of 50.4 EJ (1204 Mtoe) over a period of 30 years from 2002 to 2032. This value corresponds to an average annual growth rate of 4.55 %. The source-wise break-up is also given. It is seen that the source- wise energy requirements are smaller than the corresponding requirements in the TERI study w ith the HYB scenario . However, the percentages obtained for different energy sources are similar to the percentages obtained in the TERI study. Using available projections for the likely growth in India's population, per capita values of the energy requirements are obtained. These are also given in Table 4.
Another important quantity predicted in the two studies is the growth in installed electrical power capacity for the country as a whole and the contributions made by the various sources. The energy required for this purpose forms a significant part of the total listed in Table 4. Table 5 shows the installed capacity as predicted by TERI for 2031 for both the scenarios, and by the DAE for 2032. The results show the enormous increase in the installed capacity over the years. The TERI study shows that in 2031 the capacity would increase to 795 GW with the BAU scenario and 700 GW with the HYB scenario. The DAE study indicates that the capacity would increase from 138.7 GW in 2002 to 648 GW in2032, i.e. by a factor of 4.7. It is again seen that the source-wise percentages obtained by TERI for the HYB scenario and by the DAE are in reasonable agreement and that the comment made earlier regarding the heavy dependence on fossil fuels in 2031/32 still holds. The TERI study shows that in 2031, coal, oil and natural gas will provide the energy for 63.4 % of the installed electrical power capacity in the HYB scenario. Similarly, the other study shows that in 2032, the percentage will be 56.6.
The above information for electricity also presented in Table 6 in terms of the electrical energy predicted to be consumed annually for the country as a whole, and on a per capita basis. For comparison, the corresponding data for 2002 is also included. It is seen that in 2031/32, the per capita consumption of electricity will be about 3.5 to 4 times the value of 614 kWh in 2002. However, in spite of these gains, the value will still be about one-fifth of the current per capita electricity consumption in the US A.
The question that needed to be addressed is the following : Are the predictions of the above studies likely to come true 20 years from now ? It is obviously difficult answer this question with certainty. Nevertheless, one can hazard an educated guess. We note first that the Government has implemented a number of pro-active policies in the past few years, and is proposing to continue to do so in the future. We note also that the economic indicators for good GDP growth are

189
very positive. Keeping these factors in mind, it appears that the per capita values somewhere in between the predictions of the H YB scenario and the DAE study are likely to come true. Taking the arithmetic mean of the predictions, we obtain the following likely values for 2031/32:
Per capita energy requirement (Heat energy content/equivalent) = 43.2 GJ
The value of 43.2 GJ includes a per capita electricity consumption=2296 kWh
It is possible that the fossil fuels needed to be imported in the future may not be available to the extent required because of the large quantities involved or the increasing costs of the commodities. Issues of energy security are also likely to come to the fore. The nation would then be faced with a situation where the inadequate supply of energy would act as a major constraint to economic growth. Therefore, it should come as no surprise if on that account, the average growth rate of the GDP declines gradually to a value of 5 or 6 % instead of the projected growth rate of 8 %. As a consequence, the values predicted for the commercial energy requirements, the installed electrical power capacity and the per capita values may take a little longer to be attained. A more likely date would then be 2040 instead of2031/32.
Approach 2 - Energy Planning Based on Per Capita NeedsAn alternative way of planning and projecting the future is to consider the energy required on per capita basis to satisfy the basic human needs. Goldemberg, Johansson, Reddy and Williams(12) adopted such an approach and performed their calculations by considering various activities grouped under the broad headings of residential, com m ercial, transportation, m anufacturing, agriculture, m ining and construction. They arrived at the result that in a country like India, the average requirement of power on per capita basis would be 210 W of electricity and 839 W of fuel. Aper capita electric power requirement of 210 W corresponds to an annual electricity requirement of 1840 kWh, while a per capita fuel power requirement of 839
W corresponds to an annual energy requirement of 26.5 GJ. An essential feature of the calculation done by Goldemberg et al. was that it was based on the adoption of high quality energy carriers and energy efficient technologies in every activity even if the use required higher initial investments. The study was done 25 years ago. Thus, it is likely that the numbers generated by the study would have decreased because the efficiencies of most devices and systems have increased over the years. Using the multiplying factor of 3 for obtaining the heat energy equivalent of the electricity needed and adding that to the energy requirement associated with the fuel, we obtain a per capita heat energy requirement of 46.4 GJ.
Comparison on a Per Capita BasisA comparison of the per capita values for energy requirements and the electricity consumption as obtained by the two approaches is shown in Table 7. We note that Approach 1 predicts values for the year 2031/32, while Approach 2 suggests values which would be desirable to attain over a period of time in order to satisfy the basic needs. Table 7 displays the interesting fact that there is fairly good agreement between the values obtained by the two approaches. This indicates that the basic energy needs, both in terms of electricity and fuel as given by Approach 2 could be satisfied by 2031/32. However, as stated earlier, if the economic growth rate slips a little, the satisfaction of basic needs may be delayed to around 2040. Needless to say, the satisfaction amongst the people will be greater if the energy usage is more equitably distributed than what is the case at present.
ConclusionSome important questions are: What are the per capita values which India should aim for in the long run beyond 2030 or 2040? Should we try to match the large per capita values for energy usage which exist today in most western countries or should we be satisfied with values which are not very different from those given in Table 7.
While it would be nice to imagine a future in which the people of India would have at their disposal plentiful supplies of energy, it is not likely to be the case. Present indications are that

190
India's population may stabilize around 1500 million by 2050. Given the size of our population, the limitations of our energy resources, both renew able and non-renew able and the environmental issues involved, it would be wise for the nation to plan for a simple life style. Our most viable option would be to provide an annual per capita energy requirement around 45 GJ which includes an annual per capita electricity availability around 2200 kWh and not more. Such frugal use of energy may be the only way to ensure sustainable development in the future. Indeed, it would be pertinent for us to remember what Gandhiji said many years ago. ’’There is enough on this earth to meet every man's need, but not enough to meet even one man's greed.”
AcknowledgementThe author is grateful to his colleague, Prof J K Nayak, for the help given in the preparation of the write-up.
ReferencesMinistry of Coal and Mines (www.coal.nic.in)
Annual Reports, Ministry of Coal and Mines
M inistry of Petroleum and Natural Gas (www.petroleum.nic.in)
500
/-s 400<u
g 300
>- 200 S3•S
-§ 100£&H
1950 1960 1970 1980 1990 2000 2010Year
Fig. 1 Annual production of coal (1)
0
Central Water Commission, Ministry of Water Resources (www.cwc.gov.in)
Annual Reports, Central Electricity Authority, Ministry of Power
Nuclear Power Corporation of India, Department of Atomic Energy (www.npcil.co.in)
Ministry of New and Renewable Energy (www.mnre.gov.in)
Sukhatme, S.P. and Nayak, J.K. 2008. Solar Energy - Principles o f Thermal Collection and Storage, 3rd edition, Tata McGraw-Hill Publishing Co. Ltd., New Delhi, p. 11.
International Thermonuclear Energy reactor (ITER) project (www.iter.org)
National Energy Map for India.2006. The Energy and Resources Institute, New Delhi
Grover,R.B. and Chandra, S. 2006.Energy Policy, 34:28
Goldemberg, J., Johansson,T.B.,Reddy,A.K.N. and Williams,R.H. 1985.Ambio, 14:190

Prod
uctio
n ra
te (10
’ m
’ /ye
ar)
Prod
uctio
n ra
te (M
t/yea
r)
191
2010 Year
1 9 5 0 1 9 6 0 1 9 7 0 1 9 8 0 1 9 9 0 2 0 0 0Year
Fig. 3 Annual production, import and consumption of oil. 1. Domestic production of crude, 2. Import of crude,
3. Consumption of products (3)
2 0 1 0
1950 1960 1970 19901980
YearFig. 4 Annual production of natural gas (3)
2000 2010
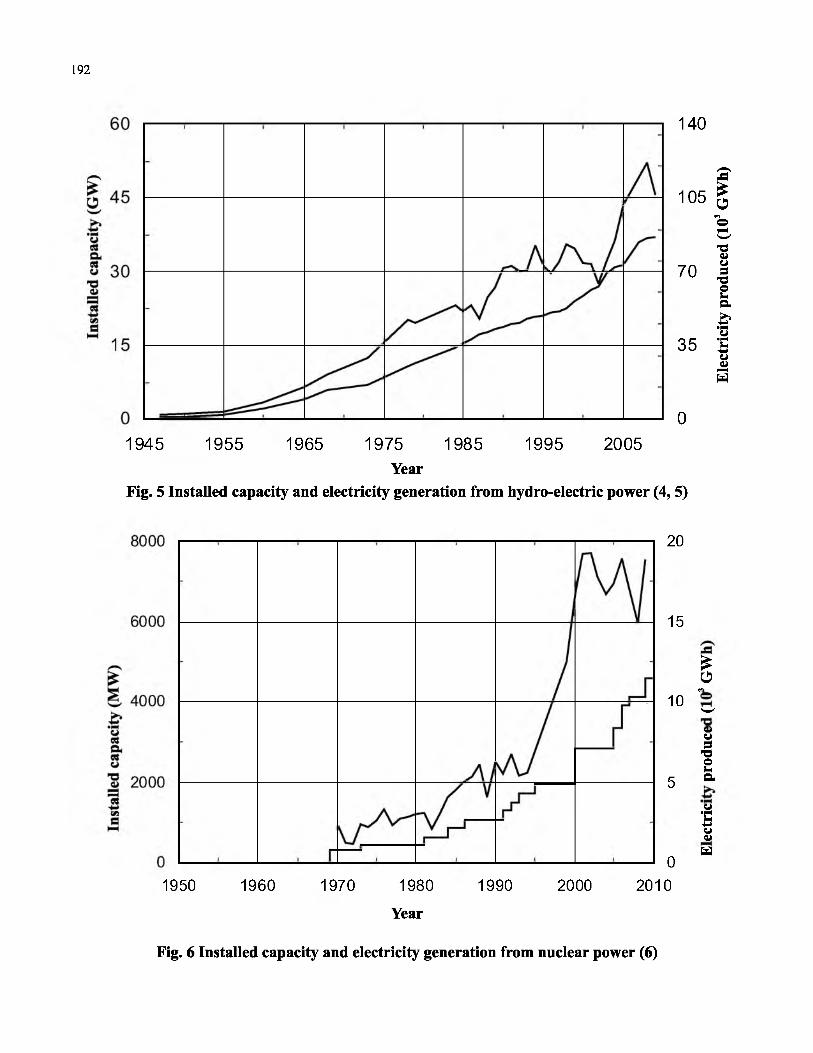
192
140
105
70
35
01945 1955 1965 1975 1985 1995 2005
YearFig. 5 Installed capacity and electricity generation from hydro-electric power (4,5)
1950
20
15
£Ofn
10 'w'V o 3 -o o u a-5
1 9 6 0 19 7 0 19 8 0
Year
1 9 9 0 2 0 0 00
2 0 1 0
u■c-Mu«U
Fig. 6 Installed capacity and electricity generation from nuclear power (6)
Elec
trici
ty
prod
uced
(1
03 G
Wh)

193
£esS'u
aat■M09£3
1990 1994 1998 2002 2006 2010Year
Fig. 7 Installed capacity and electricity generation from wind energy (7)
1945 1 955 1965 1 975 1985 1995 2005
Year
Fig. 8 Total electricity capacity and electricity generation from all commercial sources (5)
Elec
trici
ty
prod
uced
(1
0' G
Wh)
El
ectr
icity
pr
oduc
ed
(GW
h)
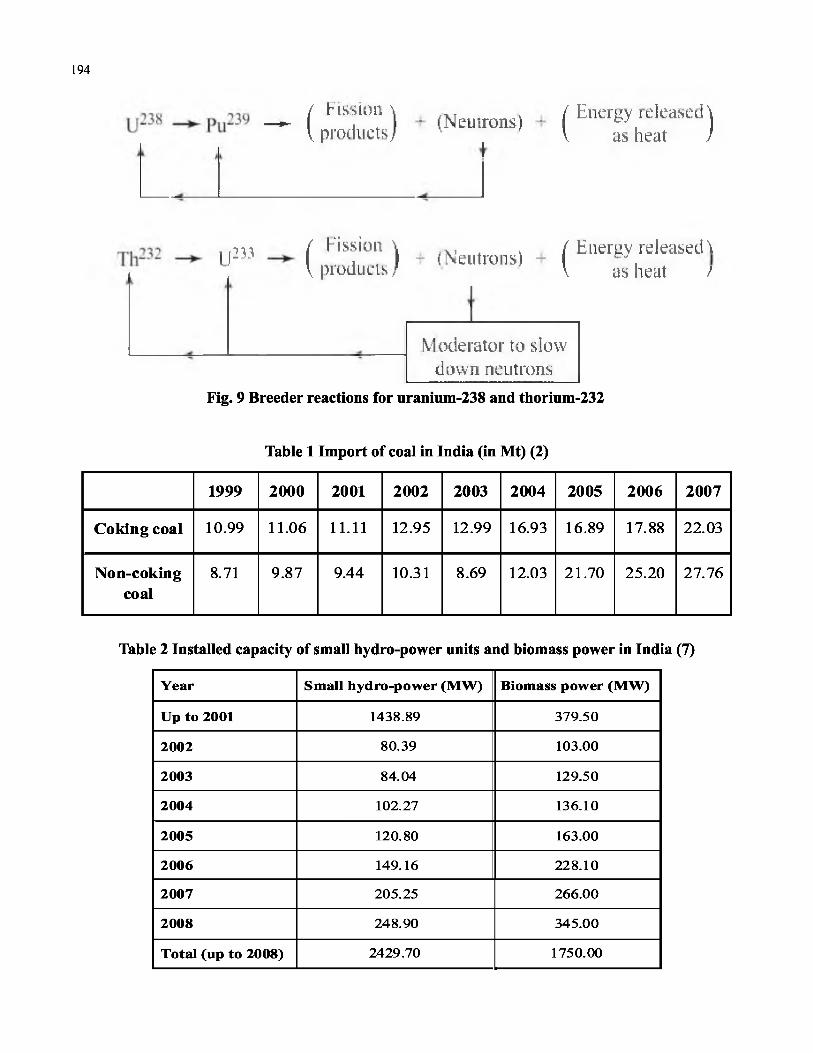
194
- ( £ £ ) *'N“ ' * ('"T i™ ")
u2iy { * * f ° " ) + (Neutrons) + ( Energy releasecU V p ro d u c t / \ as heat /
Moderator to slow down neutrons
Fig. 9 Breeder reactions for uranium-238 and thorium-232
Table 1 Import of coal in India (in Mt) (2)
1999 2000 2001 2002 2003 2004 2005 2006 2007
Coking coal 10.99 11.06 11.11 12.95 12.99 16.93 16.89 17.88 22.03
Non-cokingcoal
8.71 9.87 9.44 10.31 8.69 12.03 21.70 25.20 27.76
Table 2 Installed capacity of small hydro-power units and biomass power in India (7)
Y ear Sm all hydro-pow er (M W ) Biom ass pow er (M W )
Up to 2001 1438.89 379.50
2002 80.39 103.00
2003 84.04 129.50
2004 102.27 136.10
2005 120.80 163.00
2006 149.16 228.10
2007 205.25 266.00
2008 248.90 345.00
T otal (up to 2008) 2429.70 1750.00

195
Table 3 Energy production from commercial sources - Year 2008
Energy source Production/Consumption
Heat energy equivalent (in 1015 J)
Per cent contribution
Coal 492.95 Mt 13 002 60.78
Oil 128.16 Mt 5 366 25.09
Natural gas 32.85 x 10⁹m3 1 282 5.99
Hydro-electric power 121 499 GWh 1 250 5.84
Nuclear power 14 930 GWh 179 0.84
W ind power 13 334 GWh 137 0.64
Small hydro-power 8 045 GWh 83 0.39
Biomass power 7 665 GWh 92 0.43
Total 21 391 100.00
Table 4 Projecting the future - Commercial energy requirements in India (Heatenergy content/equivalent)
O rganisation TE R I [10] DA E [11]
Y ear 2001 2031 2031 2002 2032
Scenario - B A U H Y B - -
M toe % M toe % M toe % EJ % E J %
C oal 150 49.5 1176 52.7 767 44.2 6.40 47.5 19.0 37.7
o n 101 33.3 757 33.9 484 27.96.02 44.7 19.0 37.7
N atural G as 25 8.3 136 6.1 136 7.8
H ydro (large and sm all)+ 21 6.9 120 5.4 123 7.1 0.79 5.9 6.0 11.9
N uclear+ 6 2.0 39 1.7 126 7.3 0.23 1.7 4.4 8.7
M iscellaneous(R enew ables)+
0 0 3 0.1 99 5.7 0.03 0.2 2.0 4.0
Total 303 100 2231 100 1735 100 13.46 100 50.4 100
Per capita values (GJ)
12.45 65.60 51.02 12.95 35.40
N.B. (1) Electricity generated by hydro-electric, nuclear, wind and biomass is converted to a heat equivalent value by using an appropriate value for the energy conversion efficiency
(2) 1 Mtoe = 0.041868 EJ (3) TERI data modified as explained in text(4) BAU: 'Business as Usual' scenario (5) HYB: 'Hybrid' scenario

196
Table 5 Projecting the future - Installed electrical power capacity (including captive power)
Organisation TERI [10] DAE [11]
Year 2031 2031 2002 2032
Scenario BAU HYB - -
GW % GW % GW % GW %
Coal 466 58.6 292 41.7 71.9 51.8 266 41.0
Oil + Natural gas
145 18.2 152 21.7 32.8 23.7 101 15.6
Hydro 159 20.0 160 22.9 27.8 20.0 150 23.1
Nuclear 21 2.6 70 10.0 2.7 2.0 63 9.7
Miscellaneous(Renewables) 4 0.5 26 3.7 3.5 2.5 68 10.5
Total 795 100 700 100 138.7 100 648 100
Table 6 Projecting the future - Electricity consumption
Organisation TERI [10] DAE [11]
Year 2031 2031 2002 2032
Scenario BAU HYB - -
Electricityconsumption(TWh)
3458 3045 638 3485
Per capita electricity consumption (kWh)
2429 2138 614 2454
Table 7 A comparison between two approaches
Approach 1 Approach 2
Annual per capita energy requirement (Heat content/equivalent in GJ)
43.2 46.4
Annual per capita electricity consumption (in kWh)
2296 1840

Award Lecture Series ofIndian National Academy of Engineering
Professor S. N. Mitra Memorial Award Lecture 2011
The Development of Passive Safety Systems for Advanced Heavy Water Reactor
R. K. Sinha,Director, Bhabha Atomic Research Centre, Trombay, Mumbai - 400085
IntroductionIn a nuclear reactor the fission of nuclear fuel produces fission products, neutrons, and fission energy The radioactive fission products are retained within the matrix of the fuel, and even after cessation of the fission reaction, continue to release ionising radiation and heat, at a progressively diminishing rate. Some of the neutrons lead to additional fissions in the fuel to carry forward the controlled chain reaction, some others produce new fissionable materials (Plutonium and Uranium-233, out of Uranium- 238 and Thorium-232 respectively), and the rest move away from the fuel to get absorbed, like other ionising radiations generated in the reactor, in materials inside the reactor, including the shields designed for this purpose. The fission of one gram of Uranium-235 produces roughly 1 Megawatt-day of thermal energy. This fact not only underlines the enormous energy security associated with a relatively small inventory of nuclear fuel material, but also the extremely small mass of the fission products, for a given amount of energy, that need to be managed as a part of a nuclear waste management programme.
Keeping in view the Indian context of domestic availability of meagre uranium but huge thorium resources, it is worth clarifying that premature deployment of thorium on a significant scale will, on account of inherent physics characteristics of thorium, slow down the pace of growth of nuclear power. A steep rate of growth of nuclear capacity needs Plutonium-Uranium based fast breeder reactors, as has been envisaged in the early part of the second stage of the Indian nuclear power programme, which starts with the current generation water cooled reactors in the first stage.
The scientific and engineering principles and practices behind the design of nuclear reactors follow a system of internationally recognised and validated design codes. The first-of-a-kind features, introduced as a part of the continuing innovation processes natural for any growing industry, require extensive validation before implementation. Before launching the large-scale use of thorium, it is, therefore, important to demonstrate all the associated technologies on a plant scale. The Advanced Heavy Water Reactor has been planned to serve as a platform for the demonstration of thorium fuel cycle technologies, along with other innovative technologies that will be used in this reactor. This reactor employs several, first-of-a-kind, passive safety features. This paper will briefly cover the guiding design philosophy and the engineering development behind the introduction of passive safety features in the Advanced Heavy Water Reactor.
Meeting the challenge of the numbers through innovationCurrently 433 nuclear power reactors are operational world-wide and 65 are under construction, (IAEA, PRIS, October 31, 2011). Nuclear power contributes to meet about 13.5% of the world electricity demand in thirty countries. A survey carried out by the IAEA documented an additional 41 developing countries that fulfill the criteria as potential users of nuclear technology, and are interested in nuclear power (IAEA, 2009). Another study conducted under IAEA's INPRO activity projects the estimates for worldwide nuclear power demand in 2050 as 1000 GWe (moderate) and 1500 GWe (high), yielding figures o f projected installed generation capacities (with 80% capacity factor) as 1250

198
GWe and 1875 GWe, respectively (IAEA, INPRO GAINS, 2011). Corresponding figures for the year 2100 lead to projected installed capacities of 3125 GWe, and 6250 GWe respectively. In countries with rapidly growing economy, such as India and China, the stipulated growth profile for nuclear energy is steep. For India, the Integrated Energy Policy Report (Planning Commission, 2006) projects a need to have an installed electrical generation capacity of 778 GWe with 8% GDP growth rate, and 960 GWe with 9% GDP growth rate, that includes a nuclear based generation capacity of 63 GWe, assuming only a modest import component.
Although India has reasonable resources of renewable energy, it is envisaged that even if stretched to their full potential, these can, at best, contribute only to a fraction of the total electricity need (about 36.1% in 2070 based on low benchmark of 2000 kWh per capita per annum consumption) in the future (Sukhatme, 2011). The balance, a maj or part, of energy requirement shall have to be met by either fossil fuels or nuclear energy. In this paper, based on the Planning Commission and DAE projections, a two-and- half times higher benchmark has been projected as the basis for achieving a developed status, and an additional need of primary energy, to substitute hydrocarbon fuels. Following the approach of Sukhatme (2011), a corresponding reduction in the share of renewable may, therefore, take place with a higher target. According to a recent TERI policy brief, “India does not have adequate extractable coal reserves required either to meet the current incremental demand or to make long term supply commitments” (Batra and Chand, 2011). In fact, according to this report, the estimated coal imports required by 2031-32 may reach a level comparable to the current cumulative international trade in coal. Therefore, notwithstanding the environmental issues associated with progressively enhancing scale of use of fossil fuels, sustainable development and energy security of India will call for large-scale deployment of nuclear energy.
Following the opening up of international civil nuclear cooperation, subsequent to the
preparation of Integrated Energy Policy Report (IEPR), the nuclear fuel supply for a higher growth rate of nuclear power need not be constrained by the non-availability of domestic resources, as has been assumed in the IEPR. Thus, for example, in a recent study (Sinha, 2011) it has been shown that with reprocessing and metallic fuel-based Fast Breeder Reactors, along with the use of thorium at an appropriate stage, it is possible to achieve a nuclear installed capacity of 300 GWe in 2047-56 and 600 GWe 9-15 years later, to contribute to almost 50% ofthe electricity needs along with solar, renewable, and hydrocarbon fuels to meet the rest of the needs for reaching a level of human development consistent with a developed status assumed, 5000 kWh/a per capita. Further enhancement of the nuclear share will be possible with the large-scale deployment of thorium, leading to complete energy independence for India for several centuries, not only considering electricity alone, but also the generation of synthetic hydrocarbon fuels and hydrogen for the transport sector and process heat for various industries.
Such a large-scale deployment of any major industry in a densely populated democratic country, like India, brings in issues relating to land availability, and socio-political dimensions of land acquisition and displacement of population. In the context of nuclear energy, on account of historical reasons, the nuclear industry and the associated regulatory practices follow a highly conservative approach in prescribing measures for the protection of public at large against ionising radiation, originating from a nuclear facility. For example, enormous scientific data are now available on the health effects of ionising radiation following the Japan atomic bombings and the Chernobyl accident. This data appear to indicate nearly 1000 fold margin over the current public radiation exposure protection limits. (Allison, 2011).
Notwithstanding this, the large-scale deployment of nuclear power in densely populated regions, will call for demonstration of further enhanced levels of safety, even with a smaller land footprint requirement, so that under any operational state,

199
including beyond-design basis events, there should be no need to adopt any emergency measures in the public domain. This must be the main guiding philosophy for the reactor technologies to be used in the large-scale deployment phase of nuclear power in densely populated regions. In India, this phase will coincide with the third stage of the Indian nuclear programme, when thorium will be deployed on a large-scale. Hence, the Advanced Heavy Water Reactor has been designed not only to use thorium, but also to demonstrate some of the technologies that will be relevant for use in future reactors that may need to be located close to population centers. In this context, it is relevant to recall the following vision, expressed in an IAEA publication: “Four decades from now, in any country of the world, it should be possible to start replacing fossil fuelled power plants, at the same urban or semi-urban site where these are located, with advanced Nuclear Power Plants that would, more economically, deliver at least twice the power that was being produced by the replaced plants” (Sinha, 2006).
Evolution of advanced reactor designs and the role of passive safety featuresLike any other growing industry, the nuclear power industry too has been learning from experience. The specific measures to discharge the fundamental safety functions, described later, have, thus, progressively evolved over the five decades of existence of commercial nuclear power programme in the world. Current reactors rely on principles of diversity, redundancy, and physical and functional independence as well as failsafe designs to minimise the probability of failure/unavailability of engineered safety features, to ensure the safety. The required reliability of power supplies for all safety-critical functions is provided through incorporation of qualified emergency supplies based on multiple diesel generators and battery banks.
A passive system is either a system which is composed of passive components and structures or a system which uses active components in a very limited way to initiate subsequent passive operation (IAEA, 1991). These include passive
therm al hydraulic system s, m echanical components and devices and even physics aspects, with varying degree of passivity making a classification necessary for the passive systems. Some passive and inherent safety features have already been incorporated in current generation reactors, to provide a grace period in case of the failure of active systems.
Although current nuclear reactors are safe enough, the anticipated increase in the number of NPPs calls for further reduction in core damage frequency by an order of magnitude. Moreover, a review of the past nuclear accidents like the Three Mile Island, Chernobyl and Fukushima has revealed a lack of appropriate operator response, or erroneous response, which aggravated the accident. In Fukushima, non-availability of the engineered safety systems due to the nonavailability of the active components, such as pumps, also contributed to the core damage. In the light of the above, passive safety systems, which work on the basis of natural physical laws, are attractive as these do not require any signal or operator action to perform their function, thereby enhancing the safety and the reliability, and consequently decreasing the core damage frequency.
Advanced Heavy Water Rector (AHWR)AHWR is a 300 MWe, vertical, pressure tube type reactor cooled by boiling light water and moderated by heavy water (Fig. 1). The reactor is fuelled with dual MOX (Mixed Oxide fuel) consisting of (U233-Th)02 and (Pu-Th)02. AHWR is nearly self-sustaining in U233. The design of AHWR is fine-tuned towards deriving a large fraction of its power from thorium based fuel, while achieving negative void coefficient of reactivity. Another version of AHWR, known as AHWR-LEU, fuelled with (LEU-Th)02 has also been designed. The AHWR incorporates several passive safety systems to enhance safety, reliability and public acceptance besides improving the economic competitiveness. Passive systems are incorporated for core cooling under normal operation, shutdown and accident scenarios. Additionally, AHWR adopts passive system for containment cooling following a

200
postulated Loss of Coolant Accident (LOCA). Besides, innovative passive safety systems have been designed for several non-cooling applications such as reactor trip in case of wired shutdown system failure, containment isolation
REACTOR BUILDINGG K A V I T Y D W V E N WATER POOL — ( G D W F J
Pa s s iv e COOLING SYSTEM FOR V I CONCRETE STRUCTURE
PassiveCONTAINMENTISOLATIONU 1 DUCTS (2 Nos.)
P A E S IV FP O IS O NIN JEC T IO NSYSTEM
and automatic depressurisation. A detailed description of the design of the AHWR is available in some references (e.g. Sinha and Kakodkar, 2006 and the web-site of Department of Atomic Energy).
TUSSIVE CONTAINMENT C O O L IN G S Y S T E M
IS O LA T IO N C O N D E N S E R
P A S S IV E GORE DECAY HEA~ 5- ' REMOVAL SYSTEM
?T J^ B = N E |~ GENE RATDR
F E E D R J M P FEED 1 D£A£JUTQ3 WAFER V H E A F E R 3 |
L ^_ A -CEP
/ / / / 7 / / f f 7 /TURBINE BUILDING
f T. . _ M — COOLING | | ^ ^ WATER
CONDENSER/ / / / / / J / / f
' / / yPNOCtSSWAlfcR
■■ tMODERATOR HEAT HeCQVERY SYSttM
Fig. 1: Schematic of AHWR showing its passive systems
Core concepts in reactor safetyIt is useful to capture some of the core concepts in nuclear reactor safety, so that these can serve as a backdrop for discussion on the safety features of AHWR. As per the Safety Standard NS-R-1 (IAEA, 2000) of International Atomic Energy Agency (IAEA) and Safety Code (AERB/SC/D) of Atomic Energy Regulatory Board (AERB), the general nuclear safety objective is 'to protect individuals, society and the environment from harm by establishing and maintaining in nuclear installations effective defenses against radiological hazards'. The IAEA Standard and the AERB Code also specify a technical safety objective to take all reasonably practicable measures to:
(i) Prevent accidents in nuclear installations and mitigate their consequences, should they occur;
(ii) Ensure with a high level of confidence that, for all possible accidents taken into account in the design of the installation, including those of
very low probability, any radiological consequences would be below prescribed limits; and
(iii) Ensure that the likelihood of accidents with serious radiological consequences is extremely low and below acceptable limits.
To meet these objectives, the AERB safety code, in line with the related IAEA safety standard, also specifies that the following fundamental safety fonctions shall be performed in all operational states, including postulated accident conditions:
1. Control of the reactivity (Reactivity is a measure of the tendency of the reactor core to change power level);
2. Adequate heat removal from the core; and
3. Confinement of radioactive materials and control of operational discharges within

201
prescribed limit, as well as to limit accidental releases within acceptable limits.
The afore-mentioned 'general safety objective', 'technical safety objective' and 'fundamental safety functions' are core concepts at the foundation of safety philosophy of nuclear reactors globally.
Fundamental Safety Function #1: Control ofthe reactivity
Reactivity coefficientsNegative reactivity coefficients make reactor
8
E£ 0
oro
§-8
inherently safe against the reactivity excursions. One of the design objectives of the AHWR is to achieve a negative void coefficient of reactivity. This implies that in case the heat generation rate in the core exceeds the heat removal rate, higher steam formation will lead to reduction of power. Physics design considerations to achieve this inherent safety feature called for an under-moderated core (Fig. 2). Such a core configuration resulted in the reduction of lattice pitch. If fact, the design evolved in several stages considering several engineering challenges to the mechanical design of fuel handling system and piping layout. These challenges have been successfully met.
Undermoderated J
[ region: JJG
/ O ver m oderated/D/
region
■ /
: /' /0____I____ _____i___ t _ i i
16 20 25 30 35
Lattice pitch, cmFig. 2: Void reactivity as function of lattice pitch
Shutdown systemsAHWR incorporates two independent fast-acting shutdown systems based on diverse principles. Shutdown System 1 (SDS-1) comprises shut-off rods, which fall under gravity on actuation. The design is fail-safe, implying that during power failure the electromagnetic clutch de-energises to release the rods and shutdown the reactor. Shutdown System 2 (SDS-2) is based on injection of liquid poison in the moderator on actuation. The injection continues under gas pressure and ensures the shutdown.
Limitation on reactivity insertionThis obj ective is achieved by a combination of physics and mechanical designs by limiting the maximum worth of the control and shut-off rods and maximum speed of withdrawal such that maximum reactivity insertion is limited to a permissible value and cannot
be exceeded. This feature is added to prevent any unacceptable power raise through erroneous or deliberate human action.
Passive Poison Injection System (PPIS)AHWR design has the capability to safely shut down the reactor in the event of failure of both the wired shutdown systems. Both the shutdown systems incorporated in the AHWR are based on the principle of diversity and functional independence such that probability of unavailability of shutdown system is very low. However, design incorporates a unique passive poison injection system to safely shutdown the reactor in the very unlikely event of failure of both the wired shut down system that may result from malevolent acts or sabotage. The PPIS is activated by steam over-pressure alone (Fig. 3).

202
RELIEF TO GDWP
HELIUMPRESSURE
3 CtL □
U lU lucefew
— crIQ .
R D ^
S4bar
P j S H K f C 0 N D E N S E R S
a
STEAM DUMP LINES
TURBINE
I I
FEEDWATER
CONDENSATEPOT
PASSIVEVALVE
H IG H V 1 PRESSURE
I n ^ i Q u i e rPOISON
TAIL PIPE
INLETHEADERa
Fig. 3: Schematic of Passive Poison Injection System of AHWR
Fundamental Safety Function #2: Adequate heat removal from core
Main Heat Transport System (MHTS):Core cooling is by far the largest single application for passive systems in NPPs. Most of them employ a natural circulation (NC) system which is essentially a fluid-filled system with a heat source and a heat sink located at a higher elevation. At the source the fluid absorbs the heat, becomes lighter and rises to the heat sink where it rejects the heat, becomes heavier and gravitates down reaching back the heater, thus completing
the circulation without the requirement of a pump. The primary function of such natural circulation system is to transport heat from a source to a sink. The absence of moving/rotating parts to generate the motive force for flow makes it less prone to failures reducing the maintenance and operating costs. The motive force for the flow is generated within the loop simply because of the presence of the heat source and the heat sink under the influence of the gravitational force field.
Natural circulation (NC) systems are also employed in nuclear industry for decay heat

203
removal, post accident containment cooling and for cooling of radioactive waste storage facilities the NC systems are extensively used in shutdown heat removal and post-accident heat removal. Nuclear reactors continue to generate heat, at progressively reducing rate, even after shutdown, due to the decay of radioactive fission products, and this heat has to be removed to maintain fuel temperatures within safe limits. In view of this, almost all current nuclear power reactors are designed to remove decay heat by natural circulation in the event of a complete loss of pumping power (CLOP).
In AHWR, natural circulation is the mode of coolant circulation to remove heat from the reactor core under normal as well as shutdown conditions. Fig. 4 shows the Main Heat Transport (MHT) System and the passive isolation condenser system of AHWR used for decay heat removal in the event of station black out. The two- phase steam water mixture generated in the core flows through the tail pipes to steam drum, where steam gets separated from water. The separated water flows down through the downcomers to the reactor inlet header (RIH). From the header it flows back to the core through inlet feeders.
Passive Isolation Condenser SystemThe isolation condenser (IC) system is designed to remove the decay heat in a passive manner (Fig.4). During the normal operation, the decay heat is removed by dumping steam into the main condenser. However, during the non-availability
of the main condenser, the decay heat is removed using ICs. An example of non-availability of the main condenser is station black-out. Steam from the steam drum flows into the IC, where it gets condensed, and the condensate returns back to the steam drum. Both the MHT and IC system flow rates are maintained by natural circulation. The ICs reject heat to a large pool of water called Gravity Driven Water Pool (GD WP) in which it is immersed (Fig.l). The water inventory in the GDWP is 8 million litres, which is sufficient for at least three days of cooling before start of boiling.
Passive Emergency Core Cooling System (ECCS)The ECCS is designed as an Engineered Safety Feature (ESF) to mitigate the consequences of a Loss Of Coolant Accident (LOCA). ECCS, on actuation, injects water to Main Heat Transport System and removes heat from the fuel and provides means for transferring the heat to the ultimate heat sink. The ECCS of the AHWR consists of three systems of which, the first two are passive in nature, and active actions are not required for injection. These are (i) High Pressure (HP) Injection from accumulators (Fig. 5), (ii) Low Pressure (LP) Injection from GDWP (Fig. 5), (iii) Long Term re-circulation.
To achieve complete passive operation, one-way rupture discs have been incorporated downstream of the accumulators and the GDWP.

204
5'f Vn‘YQRr/gN W T E R P O O L(gcwf)
fT IA U T f • ' M >nf
CONDENSATEWET'IRNUNE
ACTIVE VAlVE
R S E R
GlX X A N T C M A 'W E lT A L P PE
D O W N C O V E R
Fcceep
Fig. 4: Schematic of MHT and IC systems of AHWR
GOWP
ACCUMULATOR
O n e W a y
R up tu re D isk
Fig. 5: Schematic of passive high pressure and low pressure emergency core cooling system

205
Passive Automatic Depressurisation System:Following a postulated large-break LOCA, the system depressurises rapidly to passively initiate the ECCS injection. Initially, the accumulators inject the ECC water. Later, injection continues through the GDWP. However, during a smallsized break, there may be a phase where the accumulators get exhausted and the system pressure is still high to preclude the initiation of the GDWP injection under gravity. To eliminate such sc e n a r io s , a p a ss iv e a u to m atic depressurisation system is incorporated in the design. This system depressurises the reactor by valving in isolation condensers as heat exchanger to reject the heat to the GDWP. ICs are valved in passively, using passive auto depressuriastion valve.
F u n d a m e n t a l Sa f e t y F u n c t i o n #3: Confinement of radioactivity
Passive Containment Cooling System (PCCS)Following a postulated LOCA, the containment needs to be cooled and depressurised to minimise the ground level release. This is achieved passively in the AHWR by incorporating a passive containment cooling system. It consists of a set of heat exchangers located underneath the GDWP. The steam-air mixture rejects heat to the GDWP water through the heat exchangers. The water circulation in the tubes gets established by natural circulation.
Passive Containment Isolation System (PCIS)During the normal operation of the reactor, the primary containment is ventilated through an exhaust system that maintains slightly negative pressure in the containment. However, following a postulated LOCA, containment needs to be isolated from external atmosphere. This is achieved passively in the AHWR by passive containment isolation system. It isolates the containment from the external atmosphere by establishing a water seal in the u-shaped ventilation duct by spilling water from a tank on the basis of differential pressure in the VI and V2 zones of the primary containment.
Vapour Suppression PoolFollowing a postulated break in the MHTS, the containment pressure increases. A suppression pool in the form of the GDWP is provided at higher elevation that condenses the steam released from the MHTS, thus limiting the containment pressure.
Containment structureThe containment is the ultimate barrier to the release of radioactivity in the public domain. The AHWR employs double containment philosophy that is a proven concept as employed in the Indian PHWRs. As an improvement over the existing design, primary containment is provided with steel liner that further improves leak tightness.
R&D on passive systemsThe innovative systems incorporated in the design of the AHWR have been extensively tested in several major experimental facilities set up in BARC and in some other research and academic institutions in the country. The large experimental programme conducted during last ten years has been used to validate several computer codes developed in-house. The experimental facilities range from simple glass apparatus to simulate two- phase flow conditions under a range of experimental parameters to a multi-storey facility to simulate the full height (39 m) available in natural circulation in the Main Heat Transport system of the AHWR. These facilities also use special hardware developed for the purpose of carrying out the experiments under simulated actual conditions existing in the reactor. Two of these special developments are highlighted below:
Fuel Rod Cluster Simulators (FRCS):It may be noted that the experim ental investigations on boiling natural circulation in simulated test facilities employ the non-nuclear simulation of fuel using electrically heated fuel rod cluster simulators (FRCS) (Fig. 6). Development of simulated and instrumented fuel rod cluster (Fig. 7) is a challenging task because of the very high heat fluxes required, large number of instrument penetrations through the pressure boundary and electrical insulation requirements, and has been successfully accomplished. Both

206
directly and indirectly heated type FRCSs have been developed with power rating up to 6 MW. These FRCSs are extensively instrumented for detection of critical heat flux. In the context of simulation of neutronic feedbacks in test
Fig. 6: FRCS installed in ITLTwo-phase flow instrument development:
Significant efforts have also been directed towards the development of two-phase flow instrumentation like void fraction measurement using intrusive and non-intrusive methods. Intrusive methods involved development of
Fig. 8: Multi-point conductance probe
facilities, the simulation of void reactivity feedback by use of void fraction measurement probes and power controllers has been demonstrated in parallel channel natural circulation loop with tubular test sections.
W WB , IM| * ftpt*ft* cvntMtw
L---m b a i n t O t a i M n
Fig. 7: Instrumented FRCSconductance probes (Fig. 8), capacitance probes and admittance probes (Fig. 9) whereas non- intrusive methods involved neutron radiography and gamma-ray densitometry (Fig. 10 and 11) for the measurement of void fraction. Other specialised instruments developed include thermal power measurement in a boiling channel.
Fig. 9: Rotating electric field admittance probe
Fig. 10: Gamma-ray based two-phase flow meter Fig.ll: Single-beam traversing gamma ray densitometer

207
Design validation for natural circulation based passive systems of AHWRExamples of the passive cooling systems in the AHWR are MHTS, ECCS, ICS and PCCS. These passive cooling systems are first of a kind (FOAK) and need experimental validation by building simulated scaled model. Natural circulation-based passive systems are susceptible to various kinds of flow instabilities, density wave oscillations being the most predominant among them. The density wave oscillations are a result of multiple regenerative feedbacks among the flow, void fraction and pressure drop. The presence of multiple parallel channels adds complexity to the issue as the system may exhibit various modes of oscillations like in-phase (global) oscillation or out-of-phase (parallel channel or regional) oscillations. The parallel channel instability is found to be the limiting one in terms of stable operating domain. The instabilities are more predominant at low- pressures and low-flows, a condition typical of start-up. This requires designing of the reactor with adequate margin as well as adoption of an operating procedure to avoid instabilities.
The important phenomena related to natural circulation that can have a bearing on the performance of the MHT and IC systems are the following: (i) Steady state operation of natural circulation systems (ii) Instability of natural circulation systems (iii) Start-up of natural circulation systems (iv) Thermal stratification in GDWP
Besides, the thermal hydraulic, computer codes used for the analysis of the passive safety systems are also required to be validated using the data generated. The following sections provide a brief account of the experimental validation of the design o f these system s from various considerations.
design validation in separate and integral test facilities. Integral Test Loop (ITL) is an integral scaled test facility that was set-up to validate the design of the AHWR. It simulates the main heat transport system, emergency core cooling system, isolation condenser system and associated controls of AHWR. Fig. 12 shows the schematic oflTL.
The main objectives of the facility are validation of the steady-state and flow stability behavior, evolution and validation of the start-up procedures, simulation of LOCA to assess the effectiveness of ECCS and SBO simulation to establish the adequacy of ICS for decay heat removal etc. The facility design is based on Power-to-Volume Scaling (Scale factor- 1:452) and designed for 100 bar/300 °C.
rUCL. i>AIJCL
jiiiHoseffra
■D\. ■*!■■£ EC JiLXLMjLiJQn
Main Heat Transport System (MHTS) performance validation:The AHWR design has undergone extensive Fig. 12: Schematic of Integral Test Loop (ITL)

208
Start-up procedure:
The reactor has to be started up from low pressure (atmospheric) and ambient temperatures to its normal operating conditions (7 MPa and 285.9 °C). Experimental studies have revealed that two- phase natural circulation is unstable at low pressures due to the presence of flow instabilities like Geysering and flashing that occur only at low
Fig. 13: Experiments on
Steady State Natural Circulation:Fig. 14a shows the comparison of experimental data with predictions for steady state mass flow rate for various powers in Integral Test Loop that simulates AHWR.
pressures. These instabilities are suppressed at higher pressures. Therefore, low pressure instabilities, have to be considered while arriving at a rational start up procedure. Two start-up procedures have been investigated for the AHWR (Fig. 13). These are start-up with external p re s su r isa tio n and s ta r t-u p w ith se lf pressurisation.
Startup simulation in ITL
Stability performance:Fig. 14b shows the comparison of experimental data with predictions for stability for various powers, pressures and sub-cooling in Integral Test Loop.
A—iTO
£©
4flnf
F re fs u re * f O b i * 10s20 K
* EtytriAtvnaldati* Ejri*r
A ( r u i j r | t o l J m o d e - 1
A f lHfLO S o RBJIPM
BB iubr«
Pow&f <■(a) (b)
Fig. 14: Experimental data on steady state and stability behavior in ITL

209
Performance of other passive systems of AHWR
Passive ECCS performance:The LOCA tests for different inlet header break sizes (i.e. 5% - 200%) were carried out by changing the sizes of break simulating orifice before the QOV. Experimental data for 100%
inlet header (IH) break is shown in Fig. 15a and b. The LOCA initiation is indicated by the reduction in MHT pressure, and when the MHT pressure reaches 5 MPa accumulator injection starts. As soon as the accumulator level becomes low and the accumulator is isolated by the isolation valve, the GDWP starts injecting into the MHTS.
T im * - i T im e * s
(a) (b)
Fig. 15: Experiment and prediction of 100% LOCA in ITL
Performance of Isolation Condenser System (ICS)The isolation condenser system is designed to remove the decay heat during SBO. Fig. 16a and b show a typical test data showing the adequacy of IC to remove decay heat in Integral Test Loop.
t 5 E
>01 - JsU-o
iaI■—■3CLo
Tim# - 1 Tin) ft - s
Fig. 16: Experiments on validation of IC performance for decay heat removal
Performance of Passive Containment Cooling SystemPassive containment cooling system involves the condensation of steam in the presence of non- condensables. The effect of non-condensable on heat transfer coefficient has been studied in the separate effect test facility and compared with the prediction of theoretical models. Fig. 17a and b show schematic and photograph of the facility used to study the effect of non-condensable on heat transfer coefficient.
A fC u f f iu ls l i j r r in u 3 f L ~ p :
1 050 1505

210
(a) (b)Fig. 17: Schematic of PCC and photograph of passive containment cooling test facility
Performance of Passive Containment Isolation System (PCIS)Passive containment isolation system has been simulated in a separate effect scaled test facility. Fig. 18 shows the photograph of the facility. The pressures in the V1 and V2 zone are simulated using compressed air. The time for spilling adequate water in the ventilation duct for effective seal formation is found to be ~7 seconds which is adequate to meet the functional requirement of passive containment isolation system (Fig. 19).
T im e (s)
Fig. 18: Photograph of PCI test facility Fig. 19: Typical data from PCI test facility
Development of components for passive systems of AH WRDesign and development of various specialised components like passive valves, one way rupture disc (O WRD), etc. is key to successful integration of passive systems in AHWR. These developments are the following.
Passive valves:The Adoption of passive valves for actuation based on sensing of process conditions is considered as a significant improvement over current designs using valves actuating on signals/sensors. Various passive valves under final stages of development and testing (Fig. 20) are as follows: (i) Hot Shutdown passive valve (HSPV) for ICS (ii) Passive poison injection valve for PPIS (PPIV) (iii) Passive accumulator isolation valve for ECCS accumulator (AIP V) (iv) Passive auto-depressurisation valve.

211
PIPV
PP!VFig. 20: Passive valves in development
Passive valves work on the principle of selfactuation due to system energy. One of the valves, known as Hot Shutdown Passive Valves (HSPV), is demonstrated to work passively due to steam pressurisation under station blackout (SBO) condition. The actuator assembly of these valves consists of two metallic bellows in housing. In case of SBO, the housing gets pressurised due to rising steam drum pressure and a net upward force in the bellows assembly causes the valve plug to proportionally open up and reduce the system pressure accordingly. Seal bellows are also being utilised to make these valves leak proof. The mechanical system of this valve has been qualified as per ASME requirements. The actuator and seal bellows have been rigorously designed, qualified and tested for this application. Multiply bellows made of high strength materials have been designed and analysed.
One-way rupture disks:One Way Rupture Disk (OWRD) is developed to perform the isolation function (between accumulator & MHTS and GDWP & MHTS) is a passive component of the system. The OWRD fails at low differential pressure in the forward direction, but withstand the high differential pressure that is normally present in the reverse direction.
Acoustic sensors:The safety analysis of different break sizes in the inlet feeder pipe has revealed that for certain break size, the flow stagnates in the reactor channel leading to fuel overheating as no trip is
effective. Low flow trip signal is however not feasible due to the complexity in triplication of all 452 channels. If such an event occurs, it is possible for the fuel clad to exceed 800 DC temperature. To avoid fuel failures, it is necessary to generate trip signal. For this, a steam leak detection system has been developed. The system detects acoustic signal generated due to leak of high enthalpy water from the feeder. As capturing acoustic signal does not depend on the size of break, the real time acoustic signal can be a dependable parameter for reactor trip. To make it more reliable in real time, the system runs on logic of triplication. The sensor developed is capable of detecting leaks significantly smaller than stagnation channel break.
Results
Peak Clad TemperatureAs a part ofthe safety assessment, a large number of postulated initiating events (PIE) have been analysed for the AHWR and their frequency of occurrence was assessed using Probabilistic Risk Assessment methodology. Using validated computer codes the highest temperature of the fuel cladding, anywhere in the core, was determined. It can be seen that successive integration of various passive systems (Table 1) like passive poison injection system, passive auto-depressurisation system, and acoustic sensors have led to enhanced safety under various postulated multiple failures. A plot of this Peak Clad Temperature (PCT) and frequency ofthe event is given in Fig. 21.
HSPV

212
LB LG C A w tth fa ilure o f w ired shu tdow n system
1200
1100
O 1000ooT 900L-£ 800 <c
700
GOO<D C l
£I® 500
400
300200
1E-11
T T
Beyond design basis
Design Basis Events
L O R A /ex t e n d e d SBO w ith fail u r e o f w ir e d s h u t d o w n s y s t e m
SBLOCAwsth failure of wired shutdown system
J
InEetHeader ■GuilotineLOCA
ECC headerbreak
Normal
Operation
♦
SBLdCE
nStagnation channel break
T TIE -1 0 1E-9
T I' 1E-S
■*“ 1— 1E-7
“ F 1E-6
I— 1E-5
THf ’"T IE -4 1 E-3
7 T 0.01 0.1
FrequencyFig. 21: Peak clad temperature
The peak clad temperature (PCT) is the most im portant param eter that indicates the effectiveness of cooling and the health of fuel elements in the reactor. Starting with a base design, progressive additions of passive systems led to a robust design with only one extremely low probability postulated initiating event (PIE)
for event of various frequenciesmore than 25% break of the largest pipe (600 mm dia) along with a malevolent act preventing failure of the two shutdown systems in the residual risk domain, leading to an unacceptable peak clad temperature. The design options to address even this scenario are now being evaluated.

Table 1: Progressive improvement in safety due to passive systems
213
Accident ScenarioFrequenc
y(per year)
Peak Clad Temperature
(°C) Design ModificationOriginaldesign Present
ECC Header Break 1.0E-04 2600 325 ECC Header compartmentalis ation
Large Break LOCA (LBLOCA) with failure of wired shutdown system
6.3E-10 2600 2600BDBA with extremely low frequency, hence can be neglected for safety analysis
Loss Of Regulation Accident (LORA)/Extended SBO with failure of wired shutdown system
1.0E-10 2600 320 Introduction of passive poison injection systemSmall Break LOCA with failure
of wired shutdown systems 6.3E-09 2600 320
Stagnation channel Break 0.005 2600 320Introduction of three independent signals for acoustic trip
Small Break LOCA (SBLOCA) 1.0E-03 1250 320 Introduction of auto de- pressurisation system
Consequence evaluation
The assessment of the consequences in the public domain due to accidents at NPPs, involves carrying out Level-3 Probabilistic Safety Assessment (PSA) studies. One such study has been carried out for AHWR. As already mentioned above, except for a sequence of extremely low probability associated with Large Break of Coolant Accident (LOCA), there is no damage to fuel clad that could lead to release of radioactivity. In this study, LOCAs of various break sizes have been analysed to assess consequences in the public domain.
These analyses were carried out using various validated thermal hydraulic and atmospheric dose evaluation codes. Consequences in terms of thyroid dose and bone marrow dose to the
individual located at various distances have been evaluated for the accident sequences arising out of LOCAs of various break sizes in the inlet header without the operation of Emergency Core Cooling System. In addition, the operation or otherwise of the various engineered safety features, namely, containment coolers, primary containment filtration and pump-back system, primary containment controlled discharge, secondary containment filtration and pump-back have been considered in these evaluations. The radioactivity released to the environment, both at ground level and at stack level, during these events was used in these evaluations. The dose evaluations were carried out assuming that the recipient will be located at the plant fence boundary for a period of 72 hours with no counter measures. Based on these evaluations, the frequency of exceedance of a given dose is shown in Figure 22.

214
1 ODE-ID
1 ODMi
1 OQE-09 .i
Q)O IZ <D
"V a>O) o X
UJ100E-1?o
o cr <Dc r <D
1 00E-13
T
f DDE-03
\
Y
1 00E-Q2 1 00E-01 I.OOEtOO
Thyroid Dose (Sv) at 0.5 Km
Fig. 22 : Frequency of exceedance of given dose at plant boundary
From this figure it is noted that even at a distance of 0.5 km from the reactor, the frequency of exceeding the reference dose level of 0.5 Sv suggested by AERB/SG/D-12, Annexure-II is less than the 10'14, implying fulfillment of the criteria of no impact in public domain, as has been the design objective of AHWR.
ConclusionThe design of the AHWR has been carried out with the twin objectives of (a) demonstrating large-scale commercial utilisation of thorium in a nuclear power reactor, and (b) demonstrating the effectiveness of advanced passive systems to achieve the objective of practically zero impact of any events occurring within the plant on the public at large outside the plant boundary, thus demonstrating that the technologies that could be helpful in seeking location of the next generation Indian reactors with a reduced foot-print and also at sites close to population centres. The technologies developed have led to the fulfillment of the advanced safety criteria that have been stipulated for this reactor.
AcknowledgementThe design and experimental programmes carried out towards the development of passive systems of AHWR has been a team effort . More specifically, I acknowledge the support provided by Dr. RK. Vijayan, Shri Vikas Jain and Shri M.T. Kamble toward preparation of this paper.
ReferencesAERB, AERB/SC/D, Safety Code- Design of pressurised heavy water reactor based nuclear power plants, 2009
AERB Safety gu ide, A E R B /SG /D -12 , Annexure-II
Allison Wade, Radiation and Reason Fukushima and After, March 2011
Banerjee S. and Sinha R. K., Thorium utilisation for sustainable supply of nuclear energy, Journal of Physics: Conference Series 312,2011.
Batra R.K. and Chand S.K., TERI, Policy Brief, March 2011

215
Congressional Research Service -USA, Nuclear Power Plant Security and Vulnerabilities, 2010
Gianni Petrangeli, Nuclear Safety, Butterworth- Heinemann Elsevier, 2006
IAEA, INPRO, GAINS Project, 2011
IAEA, INS AG 10, Defence in depth in nuclear safety, 1996IAEA, Nuclear Safety Services Document No. NP-T-2.1,2009
IAEA, Power Reactor Information System, October 31,2011
IAEA, Safety standard, NS-R-1, Requirements for safety of Nuclear Power Plants: Design, 2000
IAEA, TECDOC-626, Safety related terms for advanced nuclear plants, 1991
IAEA, TECDOC-1450, Thorium fuel cycle — Potential benefits and challenges, 2005
IAEA, TECDOC-1624, Passive Safety Systems and Natural Circulation in Water Cooled NuclearPower Plants, 2009
Laina Maria-Konstantina, Status, Generic Technical Issues and Prospects of Small and Medium-sized Reactors (SMRs), ICENES 2011
San Francisco, California, USA, 2011
Lung M., A review of the thorium nuclear fuel cycles, European Commission report EUR- 17771,1997.
Mukhopadhyay D. et al, Level -1,-2, and -3 PSA for AHWR, BARC/2008/E/024,2008
Planning Commission, Integrated Energy Policy Report, 2006
Sinha R.K. and Kakodkar A., Design and development of the AHWR—the Indian thorium fuelled innovative nuclear reactor, Nuclear Engineering and Design, 2006
Sinha R.K., IAEA, Nuclear Power Newsletter, Vol.3,No.3, Special issue, September 2006.
Sinha R.K., Scenarios for growth of Nuclear Power, 2011 (unpublished)
Sukhatme S. P., Meeting India's future needs of electricity through renewable energy sources, Current Science, Vol. 101, No. 5, September 2011
US-NRC, US-NRC Report of special inquiry group, Three Mile Island, 1980
World watch Institute, The World Nuclear Industry Status Report 2010-2011, U.S. A.
Award Lecture Series ofIndian National Academy of Engineering
Professor S. N. Mitra Memorial Award Lecture 2012
Governance (Control) of Distributed Manufacturingand Service Networks
N. Viswanadham INAE Distinguished Professor
Computer Science and Automation, Indian Institute of Science, Bangalore-560012, India
IntroductionThis paper addresses the interaction between two well developed subjects namely, the social networks and the supply chain networks to develop a governance model for global supply chain networks. Social networks field is very well stud ied , and there have been sem inal contributions and text books on this topic. The focus in social networks has been on connectivity between individuals, social capital, dense and weak connections, strength of weak ties, structural holes and brokerage and closure. These concepts have been extended to inter- organizational networks, and a topic that dominates the discussion is the Governance of the networks. Similarly, supply chain networks have been a hot topic of the last two decades, and several text books are in existence. Supply chains were concerned with the performance measures such as inventory management, supply-demand matching, sensor networks to improve visibility and lead time and cost reduction. Packaged software implementations and supply chain planning are given attention.
The three important supply chain business processes include procurement, manufacturing and distribution and retail. In some verticals such as apparel, food, etc., all the three processes are well integrated and orchestrated as farm to fork or farm to fashion chains. Factory gate pricing is common. Disruptive changes are happening in all the three business processes and some of the business leaders are driving these changes.
(i) In som e v e r t i c a l s , th e B2B procurement process is undergoing disruptive changes. These include
moving away from strong ties with trusted suppliers to order configured SCNs where the OEM selects all players in the chain back to farms growing exactly the right cotton needed for the shirt or vegetables for nutritious food manufacture; buying through m u lti-tie r purchasing platform i.e. supplier factory gate pricing than payment on delivery; focusing on the entire supplier ecosystem not just its product price and quality; developing strong connections with the stakeholders and governments than marketing.
(ii) In the manufacturing business process is also changing its face from owning assets to orchestrating without owning any assets and concentrating on connections and governance
(iii) The retail process is undergoing changes due to innovations in Internet search and advances in machine learning and data mining. Retailers gain an understanding of how shoppers move around their stores - where they go, in what order, how long they stay, when they come to the store, and how all of these questions map to actual sales. Retailers are developing p re d ic t iv e m o d e ls fo r p r ic e d iscoun ting , ad v ertis in g , and couponing. W al-M art, Netflix, Amazon and several others are experts in this technology

217
(iv) There are also disruptive changes in supply chain governance: from reactive expediting to proactive multitier risk management, from assuming that everything works to plan to governance, coordination and control of entire SCN operations.
In this paper, we develop the three stages of network governance, namely, network formation, coordination and execution taking into account the above changes.
There is literature exploring relationship between social networks and supply chain networks. Borgatti and Li (3) provide a detailed view of social networks that is relevant to supply chain literature. Their aim has been to apply those concepts and theories of social network analysis to supply chain which have material, information and financial flows. There are also three subnetworks within the supply chain, namely, the procurement, manufacturing and distribution and all these could be globally dispersed and controlled by a focal firm. Small manufacturersa large number of them, located in the developing countries, dominate such industries as food, leather, and apparel. Generally, central manufacturing firms coordinate their activities. Similarly, large retailers coordinate the global sourcing of fresh vegetables, apparel and other products from the small and medium enterprises. Gereffi, Humphrey and Sturgeon (5) have made substantial contributions to the supply chain governance literature. They presented several case studies, particularly from auto, electrics and apparel industries.
Here we address the problem of governance or control of large engineering networks such as global manufacturing and service networks, transportation networks, construction and infrastructure creation networks, where there is either goods or services flow from node to node. In these cases, the nodes are independent organizations and they form networks towards a specific business goal. Recent experiences and studies have shown that these projects involving large networks suffer severe time and cost
overheads. The primary reason is the lack of governance (control) mechanism that coordinates the activities of all the partners in the network in the execution of the project. We focus here on global supply chain networks; the theory can be adapted to other networks. We use control theory, social networks in particular inter organizational networks and the supply chain ecosystem framework (16) we recently developed. In fact, our results are generalization of hierarchical process control (9) which proved useful in NC machine control and factory automation (17). Our governance mechanism can be applied in practice, and there are several companies like Wal-Mart, Li & Fung, GT Nexus and Amazon who are following the final step in our model, namely, the execution using BPO and other tools.
Motivating ExamplesHere we consider three examples which are important, particularly in the emerging market context.
Integrating SMEs into global value chains
Small and Medium Enterprises (SM Es) significantly contribute to economy, poverty alleviation, employment, and availability of products and services at affordable costs. In India, the sector accounts for 45 % of the manufacturing output and in terms of value 40 % of the total export. Further, the sector employs 59.7 million personnel across 26.1 million enterprises. With less manpower and low capital investment, SMEs are known for fast decision making, adaptability to change, driving innovation and competition.
However, they suffer several disadvantages, such as limited capital, finances, IT resources, technical manpower for R&D, exposure to regulations, import-export policies, and finally lack of strategic relationships with the global players. They are dependent on large corporations for business and have myopic exposure to business processes in the entire supply chain. Follow ing the Governance m echanism s suggested here, in particular, the orchestrator model one can improve their competitiveness and also integrate them into the global value chains.

218
We discuss the example of orchestrating the print service chain (14) consisting o f paper manufacturers, warehouses printers, courier companies and customer companies such as banks, insurance com panies, education institutions, etc.
Integrated Logistics ProvidersIntegrated logistics providers (IKL) are intermediaries at various stages of the supply
chain. On the supply side the IKL can manage inbound shipments, as exemplified by Vector SCM for General Motors and Exel for Ford in Europe amongst others. Similarly, there are consumer centric IPLs such as Amazon.com, UPS and others. At a slightly higher plane, there are 4 PLs, also known as channel masters, such as Dell and Cisco who manage the entire supply chain network inclusive of the demand, supply and service chains.
m
• H / J#
v /
'V
X/ I
4'* j v
M \
F
m+
• f
Figure 1: The social network of an integrated logistics provider
The IKLs possess deep domain knowledge and strong influence over other parties in the network. They exploit this clout to coordinate the activities across players within the sub-network and across the entire network. Due to the fact that 4 PLLs leverage upon the complementary capabilities of other parties in the chain as and when needed, their offerings are characterized by a broad scope of multi-modal services, global reach, complex m anagem ent capab ilities , and superior technological systems. Based on customer requirements, an IKL is able to select effective supply chain partners to team the best competencies available that optimally fulfill the requirements. Their ability to coordinate activities is to a large extent determined by their ability to transform their superior information, on the state of the network, into real time decisions that enhance the performance of the entire network. By substituting physical assets with
dependable relationships, new value players such as 4 PLs dominate the supply chain, outsource non-core capabilities to contract manufacturers and 3PLs and take control of the supply chain decision process. The IKL is highly embedded in the supply chain, almost all the actors will interact with it and its in- betweenness centrality highlights its importance to the success of the supply chain.. The relationship between the focal firm and the IKL represents a strong tie in the sense of providing access to valuable resources that in this case are the benefits arising from IKL know-how and relationships.
In India, there are millions of very small players with one truck and two trucks or a warehouse or a family owned distribution centers. They may not be IT enabled although the scenario is changing with wireless technologies. A few logistics companies such as GATI, TCS, SICAL, etc,

219
dominate the 3 PL space. Most of the shippers do not have logistics connectivity, and they use private players. The train is cheaper than truck but hauls mostly the government freight such as the iron ore or the food grains. The orchestrator model can be used to connect all the players to plan and execute the logistics functions to reduce the logistics cost and improve the service levels. In(13) we develop optimization model for partner selection.
Mandi as an Orchestrator matching supply and demandIn India, there are a around 7000 public wholesale market yards for agricultural products which are regulated through an Agricultural Produce Market Committees (APMC) act. As per the regulation all the food retailers need to buy the agriculture products through the Mandi and not directly from the farmer. Mandis were created to provide the farmers a centralized marketplace to sell their produce at a fair price. Some of these laws have been relaxed over time, allowing investment opportunities for the private sector. The farmers bring the agricultural produce to the Mandi's physical location where it is auctioned and sold to the traders, who are registered with the Mandi. The auction format is the classical open- cry ascending price auction (English auction). The trader in-turn sells the produce to wholesalers, retailers, or food processing companies.
Players in the current Mandi system are as follows:
(i) Farmers are sellers of agricultural produce. Their objective is to get the best price for their produce. Their options are sell it to a village trader, a commission agent or a trader at the Mandi.
(ii) Commission agents are the middlemen or the brokers They buy from a farmer and sell to a trader charging a commission.
{m)Traders are registered with the Mandi. They bid on the items and buy them to sell in turn to s wholesalers, industries or retailers.
(\\)APM C / Mandi Staff - Their role is to ensure that the tendering /auctioning process takes place smoothly and transparently in the market and maximum number of farmers derive the benefits of their service.
The current agricultural network has structural holes. On one side there is the group of farmers (sellers) and on the other side, there are consumers (buyers). These two groups are not allowed to buy/sell directly with each other and are forced to transact via the Mandi. In the Mandi system, traders have a high bargaining power (a monopoly) on the prices. Traders are in a powerful position in the network due to the geographical locations of farmers and consumers. Moreover, in some situations, the traders are a cartel.
Based on Burt's theory, nodes get informational and economic benefits by filling structural holes in a network. In addition to the electronic exchange, there is a huge opportunity for new players like Reliance Fresh, ITC or Farmers Cooperatives such as AMUL, Safal, Nandini etc. to fill the structural holes and act as a bridge between farmers and consumers.
Global Supply Chain NetworksGlobal supply chain networks (GSN) consist of a number of independent organizations, each concentrating on its core businesses, forming an alliance towards a specific goal. GSN is an Inter- organizational network. The products and services generated by the global supply chain or se rv ice chain v is it severa l co u n tries , organizations such as a ports, customs, distribution centers and the facilities of the stakeholders, including suppliers, contract manufacturers, logistics providers and retailers before finallylanding in the customer's hands. The actors in a global supply chain network are linked through a variety of relationships such as subcontracting, licensing, common technical standards, marketing contracts and shared network product and process-related standards.
Supply chains today are treated as simple linear processes of goods or services swiftly passing

220
though an efficient 'logistics or IT pipeline', and the stakeholders concentrate only on that part of the pipe directly controlled by them, or at best, their customers and suppliers. The result is that there are three or four masters for the supply chain and each depends on the service level agreements to keep supply chain smooth. However, global supply chain networks are affected by partner companies, their governments, social and industrial organizations, logistics and information technology services infrastructure, the third party service providers that connect the companies and the countries to the external economic and social environment, resources including natural, financial and human resources with talent, connections and knowledge of the industrial environment, industry clusters, universities, etc. Indeed they are integral part of the supply chain functioning and they have tremendous influence. We provide some examples below.
The supply chains are affected by the government policies and social pressures. In 2010, the Canadian company Research in Motion or RIM found its Blackberry, in trouble over new security requirements by governments in the Middle East and in India. Tata's have to move from Singur with a huge loss due to pressure from the farmers. S ev e ra l sp e c ia l econom ic zones and infrastructure projects in India are delayed or abandoned due to social pressures. Institutions play a crucial role in supply chain projects and need to have harmonious relationship with them. N ow adays G overnm ent o v e rs ig h t and compliances of various regulations such as Green have become the norm. The clusters, banks and human resources, software providers and logistics companies are essential for stream lined procurement, manufacturing and distribution processes. On the other hand, their failure or m a lfu n c tio n in g w ill have d isa s tro u s consequences. For example, when earthquake and tsunami that stuck northeastern Japan in March, 2011 several suppliers failed in their contracts resulting in huge losses. Thus, we see that the supply chains performance is very much affected by the governments, social groups, resources and their availability and also the delivery service models.
The Supply Chain EcosystemHere we develop a framework that takes into account all the above three factors in the supply chain design. Our supply chain ecosystem has
(ftt t i tu thM tt
i fI iS * - — *
i
S u p p l y C h a i n
30m
_ Im
s
S t
Supply Chain*
four components, namely, (i) Supply chain (ii) Institutions (iii) Resources (iv) Delivery Infrastructure
All the four elements play a role in the functioning of the supply chain. The ecosystem aware analysis of the supply chains is concerned about fo u r i s s u e s , n a m e ly ,P e r f o r m a n c e , Risks,Innovations, and Governance. The risk analysis and risk mitigation should consider the risks that emanate from resources, governments, social groups, delivery mechanisms etc, in addition to those from the supply chain. The innovations that influence the supply chain industry could come from deregulations, reduction of tariffs, creating clusters, providing alternate reliable energy source, financial mobility or through new business models for delivery. In summary, the framework explains the forms of network collaboration, the advantages, the new supply chain formation process, and the new rules of engagement required in global supply chains. Network contagion and the complexity of cause and effect in networked supply chains can also be examined using this framework.
Supply Chain GovernanceIn vertically integrated hierarchical companies, coordination and control of activities along the value chain is managed through ownership and direct managerial oversight. The company,

221
together with the subsidiaries, affiliates and joint ventures located in different geographic locations retains the ownership. Given the fragmented and competitive nature of the global supply chains, it is challenging for the diverse interest groups within the network to align themselves with the objectives of the global supply chain and the end- customer. The movement of goods, information and finances need to be facilitated by someone within these organizations or outside of them.
Of particular importance in the global value chains is the issue of governance, which refers to the key actors in the chains that determine the selection of partners and the division of labor among them, and the final responsibility of delivery of goods to the customers. Governance models such as channel master, third party service providers, fourth party logistics providers exist today for supply-demand matching and instore replenishment. Uncertainty rules in the practical world. Consequentially, sales routinely deviate from forecasts; components are damaged in transit; production yields fail to meet plan; and shipments are held up in customs. In truth, schedule execution as per plans generated by supply chain planning is just a myth. Significant efforts are expended to expedite orders, to check order status at frequent intervals, to deploy inventory “just-in-case” and to add safety margins to lead times. Supply chain execution thus becomes a very important step. Monitoring the goods flow from origin to destination and making decisions to counter events that cause disruptions such as truck failures, customs payments or government or social interference to maintain the commitments to the customers are functions of the execution team.
Some companies are managing multiple tiers of their supply chain (e.g. their suppliers' suppliers and further upstream suppliers) to ensure supply continuity, risk m itigation, and to gain competitive advantage. Some of the best practices include:
(i) Selecting suppliers across multiple tiers (Configuring the Chain) by the OEM to ensure the quality of a particular critical
component or assembly, i.e. the OEM not only selects their immediate tier 1 supplier, but also actively influences or actually selects tier 2,3, or 4 suppliers.
(ii) OEM buying on behalf of multiple tiers, i.e. OEM buys materials for one or more of their suppliers or OEM buys a specific material (e.g. steel) for their entire supply chain to have stronger purchasing power.
(iii) M u lti-T ie r su p p ly c h a in r isk management, i.e. mitigating financial, weather and geopolitical risks at the 2nd tier, 3rd tier suppliers as well.
Thus, the facilitation function involving supply chain governance, coordination and control (GCC) is becoming increasingly critical for achieving competitiveness. Since the supply chain networks and their ecosystems involve companies which are globally distributed and are under independent ownership, the governance involves inter-organizational coordination. The GCC of the global supply chains requires interaction with several agencies such as resource owners, financial institutions, governments, social institutions, industry organizations, ports, airports, logistics and software providers and several others. One can see the importance of the connections betw een the supply chain stakeholders. In fact, it is known that in the small- scale industries such as agriculture, contracting and textiles, connections areimportant for entering the global value chain. These capabilities, which are required for decision making, are not supported by EDI and ERP platforms, which focus inside the four walls of the organization and have no role in the network. Also businesses both small and big do not share information with their partners. The result is inefficient and uncompetitive supply chain and high cost low quality products for the consumers.In the next section, we review the social network theory for organizations and establish a link between the concepts in global supply chain networks and the social networks.
222
Inter-Organizational NetworksAn inter-organizational network consists of multiple organizations linked through formally established multilateral ties that facilitate achievement of a common goal. They are social networks of organizations which involve the management and the employees. Network members can be linked by many types of connections and flows, such as information, materials, financial resources, services, and social support. Relationships among network members are primarily nonhierarchical, and the participants often have substantial operating autonomy. Connections may be informal and totally trust based or more formalized, as through a contract. Partner Networks can bring competitive advantage. Certain concepts of social networks are important. They include strong and weak ties, structural holes, network governance and orchestration.
Literature debates the tension between weak and strong ties of organizations, particularly between the suppliers and the manufacturers. Strong relations gain from long-term intimate relations and high level of trust, and they stimulate knowledge exchange (sharing of skills and knowhow) between the partners. Keiretsu in Japan, Chaebol in Korean, Guanxi in China are perfect examples. Strong ties promote commitment but also restrict firms' freedom to access new frontiers. The buyers may socially obligate themselves to partners with obsolete capabilities and ignore potential new partners with lower costs or better technologies. Weak ties arm length relationships, on the other hand, incentivize the partners to be on the cutting edge in cost and innovation and also provide flexibility to sever ties if needs emerge. Firms with weak ties, however, need a broker who is knowledgeable and better informed to connect them. Strong ties generally exist between co-located organizations and/or those within the same vertical such as auto or electronics or apparel.
Structural Holes in Global SCN ContextA network could be a collection of unconnected or loosely coupled organizations such as suppliers, logistics providers, ship owners, manufacturers
etc. Such a network has many structural holes. Organizations focus on activities inside their own group, which creates holes in the information flow between the groups. Structural hole refers to the social gap between two groups. Structural holes often are the weak connections between clusters of densely connected organizations. Holes are buffers, like an insulator in an electric circuit. Organizations on either side of a structural hole circulate in different flows of information. Such networks need to be orchestrated by an external broker.
In the context of global supply chains, there is chasm or the distance between a supplier in China and an OEM in USA which includes geographic, institutional, infrastructural, and logistical and resource dependent barriers. The chasm or distance created by several pillars of separation could have different effects on the supply chain performance. The supplier networks and the OEM networks have a structural hole. The broker needs to bridge the differences in culture, laws and regulation, and in organizational practices and resource regulations and practices (power, water, clusters, human, financial) and also in delivery infrastructure. From bridging the information gaps to providing connections to the stakeholders to interfacing with the Governments to get contracts, there are varieties of ways in which the social connections can help. Several brokers thrive by filling in these holes. One needs to understand the information arbitrage by which people acting as brokers harvest the value buried in the structural holes.
Three Types of Network GovernanceThe inter-organization network may be brokered or may follow participant-shared model. In the participant-shared governance model, members divide responsibilities among themselves (Cooperatives) either or one of the members can act as lead and network governance could be through a single organization. An outside organization can act as a broker and lead the organization. Thus, there are three forms of governance: (i) Highly Centralized Network External Broker (Li & Fung, Olam International) (ii) Participant Shared Network Govemance(

223
H e a lth c a re , C o o p e ra tiv e s in D a iry Amul)Participant Shared Network Governance With a Lead Player: Producer-driven (Cisco, Nike), Buyer-driven (Wal-Mart, Carrefour, Levi). All three governance forms are in practice and none proved superior. In the following these governance forms as applied to global supply chain networks are discussed.
Network orchestration is broker-driven network governance model. In this case a firm outside the network takes the governance responsibility. The orchestrator firms do not own any production fac ilities and their basic role involves coordinating and integrating activities along a given value chain. Because they own fewer assets and the leverage the resources of partner companies, network orchestrators generally require less capital and often generate higher revenues than the traditional firms in several product markets.
The orchestrators have been around for quite some time in certain industries. Contractor of a large commercial building construction project, the cinema producer, a lead logistics provider are examples of orchestrators. In the Agri-food area is the Olam International Limited which supplies raw and processed agricultural commodities, grown mainly by small and medium size producers in developing and emerging countries, to well established regional and international customers In apparel business, Li & Fung provides a powerful example of a new kind of sophisticated orchestrator coordinating a very broad process network.
Ritter et al. (2004) pointed out that the research focus in inter-organizational networks is shifting from structures and governance to business models, planning, execution and managing relationships. Networks have now become a strategic option that firms can use to collaborate with partners to enhance the market share. The management function of network governance requires capabilities that enable a firm to identify partners, coordinate the resources, government and social agencies and activities performed by other members of the supply chain network, as
well as abilities to plan and control the activities at the network level.
Governance of GSCNThe global supply chain has three important business processes, namely procurement, manufacturing and distribution. In a stable environment the governance can be through the development of technical and process standards. The complexity of information transmitted between firms can be reduced through the adoption of technical standards that codify information and allow clean hand- offs between trading partners.
In most cases the procurement strategy is /Joo/eJinterdependence, where each individual company in a group makes a discrete, well- defined contribution. Pooled interdependence has a flavor of weak social ties and structural holes as “arb itrage” opportunities. According to Thompson (1967), pooled interdependencies are well-managed by standardized rules and shared mechanisms to orchestrate transactions. Intemet- based p rocurem ent is c rea ting pooled interdependencies between a large number of loosely coupled agents, where standardization of connection and transacting procedures are the key coordination mechanism enabling low cost supplier participation.
However, in certain verticals of global supply chain networks there could be environmental, technological and political changes which require strategic changes in the processes. For example, the business world is changing from unipolar to multipolar with new markets emerging in Asia. Changing labor costs, increasing transport costs, multiple trade barriers are changing cost competitiveness of the suppliers. Technology changes are happening fast. We see fast changes in demand from desk-top to lap-top to tablets or land-line phones to cell phones, from visiting retail shops to ordering online. Thus, the customer locations change, technologies change, regulations change and resource availability and costs vary. One time standardization and project planning approaches do not work.

224
Governance, coordination and control are of particular importance in the changing world and refer to how the lead firm or the orchestrator determine and coordinate the activities of the actors in the supply chain. This includes selection of suppliers; what will they supply (outputs of suppliers in the network); how it is to be produced (e.g., product tolerances and process standards); assigning the functions to the suppliers and the production and delivery schedules (how much to produce and when); and up-gradation of suppliers in terms of equipment, capacity and their moving up the value chain (e.g., m oving from manufacturing into design), and others. Also, key production parameters such as the product
definition, specification, the production schedule and location, the technology to be used, quality systems, labor standards and environmental standards need to be decided along with the targeted price and communicated to the chain partners. In addition, Government agencies and international organizations regulate the product design and manufacture, keeping in view the consumer safety, and market transparency as in the case of food safety standards, children's toys, and motor vehicles. There could be regulation on environment and child and women labor. The broker or lead firm has the responsibility that the labor laws are followed and the products follow the environmental standards.
Other Igtntifs
O f j j f J 1 I I
rO r d e rQs
D fe t it fa
Cnnntinaf u>n
Governance
( * — *LA■ V . * .A w
• • *
—H *
• ♦ ♦
" # *•• *
\ j■*#
■ 'iai wir*1-!! DMViHjtiers
Figure 3: The Governance, coordination and Control
Retails
Network FormationBased on the vertical it is possible to identify the suppliers, industry logistics providers, financial and insurance agents, customs, port infrastructure governments involved for the entire network. Collection of the data on all the supply chain players regarding their quality and delivery
reliability is part of this exercise. Also taxes and regulation changes happening in the countries, possible natural, political and economic risks, are also collected during this step. More importantly, connections and trust are established with the players. This deep domain knowledge and connections are vital for success.

225
Stage Governance level Functions
1. Supply Chain Formation
• Identify stake holders for all the supply chain functions• Develop connections with all ecosystem partners• Acquire domain knowledge about the vertical, taxes, tariffs
business friendliness of the countries,• Assess possible political economic risks, regulations on
product environment and labor,• Build systems for effective communication, collaboration and
coordination among the network partners.• Builds business models and relationships for growth
2. Coordination Partner selection Planning
• For the given order, select the supply chain partners to optimize the performance
• Assign functions to the suppliers: Product design, how is it to be produced (e.g., product tolerances and process standards)
• The production and delivery schedules (how much to produce and when) and to whom and when to deliver.
3. Control • Monitoring the order execution for product quality and timeliness of the activities of spatially distributed independent actors during sourcing, production, distribution and service and take action for any deviations.
Table 1: Supply Chain Governance
CoordinationCoordination is “to bring different elements of a complex activity or organization into a harmonious or efficient relationship”(Oxford C oncise D ic tionary , 1999). The basic organizational or management challenge in global supply or service chain networks of this kind is the coordination of its activities sourcing, design, production, distribution and service with spatially distributed independent actors.There are several activities that need to be repeatedly performed in a timely and orderly manner end- to-end by the network participants. Key parameters such as the product definition, the specification, the technology and the quality systems, labor and environmental standards need to be decided along with the targeted price, and communicated to the chain partners. In addition, Governmental and international organizational regulations on product design and manufacture for ensuring consumer safety (e.g., food safety standards, children's toys, and motor vehicles) and on environment and child and women labor need to be adhered to by all partners.
More importantly, decisions need to be made on the following:
(i) For every order, the selection of the suppliers; assigning the functions to them such as what to supply, how is it to be produced (e.g., product tolerances and process standards), the production and delivery schedules (how much to produce and when) and to whom and when to deliver, etc. In the globally dispersed networks, each order may visit different supply chain members depending on the location of the customer, political and economic situation, resource costs, transport costs and capacity availability. Because of the short time span for the order execution the suppliers can be selected with minimal partner or political risk. b. Upgradation of suppliers in terms of equipment, capacity and delivery methods to meet the regulations, standards and delivery schedules.

226
ControlThis step involves the real-time control of the supply chain execution which requires monitoring the goods flow from origin to- destination and managing exceptions. Exceptions include fire in supplier factories, earth quakes or typhoons in the regions disrupting power supplies, truck failures, customs regulations, labor problems, etc. Completely automated tools as in the case of process control systems may not be available for global supply chain networks.
There are several leading companies which practice execution. Genpact, a leading BPO company, partners with Penske a trucking company based in US, to manage transport of auto components from suppliers in US to manufacturers in Detroit. Truck scheduling, driver assignment, monitoring truck path, exceptions in case of repairs, payments along the way are all managed by Genpact staff located in India. Li & Fung has set up a global video conference network, as well as numerous virtual office applications, which enable the Hong Kong based headquarters to have real-time connectivity with its worldwide branches at minimum cost, and relocate certain functions to lower-cost regions without sacrificing the work quality. V ideo-conferencing allow s buyers and manufacturers to examine the colour of a material or the stitching on a garment There are companies trying to build Control Towers, which are collaborative platforms in the cloud plus automated processes and work-flows to provide real-time dashboard visibility for multiple partners as well as cutting edge analytics to assess the operational and financial impacts of changes, and “what if decision support to pre-empt issues or resolve problems rapidly.
TalentThe talent required for the governance is different for the three steps. For network formation, to have people with soft skills such as connections;
industry knowledge and who can speak with all the local stake holders are required. Local connections and knowledge will help to get approvals quickly and resolve any dispute that may arise with land owners, local communities and labor unions. The data need to be processed to select the partners and assess the partnership risk. For coordination and partner selection for each order, the talent required is again local and industry knowledge and collect data to run the optimization problem. Execution requires domain and product knowledge and expertise in quality control and exception management. One needs to identify the soft skills, R& D, execution abilities, connections, domain knowledge that are needed at each step and recruit the talent. Talent acquisition has become a talent in itself.
Mathemat i cal Models for Design of Governance MechanismsThe design of the three stages of governance involves a variety of models. The network formation problem can be formulated as Fuzzy AHP (20) or Location selection problem (16, Chapter 8). One can use the transaction cost economics approach for supplier selection. All these methods are data intensive and require both regular and fuzzy data. One can rank order the suppliers for each component based on the ecosystem parameters. For the coordination problem, the selection of partners for a particular order one can use optimization techniques, Fuzzy AHP or transaction cost economics. A modified transaction cost economic model based on the ecosystem is described below. In (15), we proposed a mixed integer program to optimally design the supply chain taking into account various factors related to global manufacturing systems. Theoretical tools useful for exception management using tools such as expert systems, decision support systems, and case-based reasoning. Currently, execution is through reactive expediting in case of disruptions rather than proactive control and execution.

227
Partner Selection using Transaction Cost Economics
Figure 4: The TCE model for a GSCN
Transaction costs are defined as the costs which are made in order to coordinate and connect all links in the global supply chain. Transaction costs relate to finding a suitable trading partner, negotiating, setting up and signing a contract, monitoring compliance with the contract, and imposing fines if the agreements are violated. They include observable costs such as transport costs, import duties and formal trade barriers such as customs tariffs, Soft costs which include making and monitoring contracts, information costs, costs due to cultural differences and miscommunication, unwritten laws, trust building, networking, risk costs, costs due to safety regulations and provisions, etc. The hard observable costs decrease with trade liberalization and decreasing transport costs, the soft costs gain relative importance. Three characteristics of transactions that affect the size of transaction costsare : asset specificity, uncertainty and frequency. Transaction Cost Economics (TCE) posits that when transaction cost are low, the transaction will be carried out through the governance structure spot market, and when transaction costs are high, it becomes efficient to set up an organizational structure (hierarchy in the terminology of Williamson) for carrying out the
transaction. In between market and hierarchy, there is the governance structure hybrid.
Asset SpecificityThe asset specificities ares interpreted using the supply chain ecosystem framework. The supply chain specific assets are concerned with the supplier manufacturing processes such as specialist dies and manufacturing processes. Other Supply chainspecific assets are good relationships between the members of the network. The physical asset specificity and dedicated asset specificity are included under the supply chain assets. There are asset specificities under the resources wing: that include the human, clusters, financial institutions etc. location specific infrastructure such as ports and airports which attract the companies to the location. The delivery infrastructure specificity includes customized logistics and IT processes that enable on time delivery, 3PLs and IT providers, etc. Institutions also create specificities giving companies several benefits in terms of taxes and tariffs with special regulations, creating special economic zones, special universities for training manpower, etc. Special trucks for carrying

228
finished vehicles (outbound logistics) and also special trucks and ships for delivering heavy power plant equipment such as boilers(Inbound logistics), temperature controlled warehouses, refrigerated vehicles, Sophisticated forklift trucks, guidance systems, etc, are asset-specific. Some of these costs are irrecoverable. The ecosystem and the investment climate widen the definition of asset specificity from supplier - buyer to tying the businesses to the location.
The Governance model consists of three stages. In literature these are combined into one step because of the strong ties assumption. When the ties are weak and flexibility and risk mitigation are the key issues, in global supply chain the formation and coordination issues are to be considered separately. In (14) the print supply chain orchestration problem for a local bank is considered and a complete solution which includes a Nonlinear Integer Programming model is provided. The optimization problem is solved using CPLEX.. The article (15) deals with the problem of cost minimization for orchestrating SMEs in verticals such as apparel. The supply demand m atching problem in Mandi is formulated and solved in (18).
ConclusionsWe have discussed the governance, coordination and control mechanisms with particular reference to global supply chain networks. The theory is applicable to other spatially distributed networks or networks with multiple stake-holders as well. The models can be applied to infrastructure and manufacturing supply chains in India to expedite the execution oftheseprojects.
This paper deals with the integration of social networks, supply chain networks, multilevel control theory, and transaction cost economics to develop an approach for governance of networks. The three stages of network governance namely the network formation, coordination and control are highly data intensive and require trust and collaboration across all stake-holders. The governance mechanism can be applied in practice and there are several companies like Wal-Mart, Li & Fung, and Amazon who are already following
the execution part using BPOs or dashboards in their factories.
There are several directions in which future work can be done.
(i) The three stages of governance require data which are both organized and unorganized. For network formation, we need data on partner's ecosystem which means their country data, its infrastructure and resources apart from the unit costs and quality etc. Currently supply cahins work in silos and data is not shared for both policy and privacy reasons. Policy makers need to recognize the potential of harnessing big data to unleash the next wave of growth in their economies. They need to provide the institutional framework to allow companies to easily create value out of data while protecting the privacy of citizens and providing data security. Business, policy, and technical challenges must be tackled before these systems are widely embraced. Industry groups and government regulators should study rules on data privacy and data security, particularly for uses that touch on sensitive consumer information. Legal liability frameworks for any faulty decisions of automated systems will have to be established by governments, companies, and risk analysts, in consort with insurers.
(ii) There are several application areas such as infrastructure development where our research can have immense impact. In India there are two giant enterprises which can benefit from the application of the orchestration framework.
(a) Indian Railways with more than 64,015 kilometers of track and 6,909 stations, 200,000 freight wagons, 5 0 ,0 0 0 c o a c h e s and 8 ,0 0 0 locomotives is an ideal orchestrator for end-to-end freight logistics. With freight transfer by rail, other services like warehousing, trans-shipment, regulations clearance; multi-modal inbound and outbound shipping can

229
be orchestrated using SMEs.
(b) Similarly, the Indian Postal Service, with 155,333 post offices, provides communication (mails, telegrams, fax), transportation (parcel), finance (banking and in su rance) and international money transfer services. The post office can help transform the core rural business processes of procurement, production, processing and retailing by using its logistics, information and financial networks.
AcknowledgementsThe author would like to acknowledge the financial support from Indian National Academy of Engineering for this project. Also thanks are due to ProfY. Narahari, Dr Roshan Goankar, Dr S. Kameshwaran and Prof V. V. S Sarnia for their critical comments on the earlier version of this paper
ReferencesBitran, G.R., Gurumurthi, S., and Sam, S.L., 2007. The Need for Third-Party Coordination in Supply Chain G overnance. M IT Sloan Management Review 48(3):30-7.
Burt, R. S. 1992. Structural holes: The social structure of competition. Cambridge, MA: Harvard University Press.
Stephen P. Borgatti , Xun Li , 2009 On Social Network Analysis in a Supply Chain Context, Journal of Supply Chain Management, Spring.
Craig R Carter, Lisa M Ellram, Wendy Tate, 2007, The Use Of Social Network Analysis In Logistics, Research. Journal of Business Logistics; 28,1; pg. 137.
Gary Gereffi, John Humphrey,Timothy Sturgeon, 2005, The governance of global value chains, Review of International Political Economy 12:1 February: 78-104.
Hinterhuber, A. 2002. "Value Chain Orchestration in A ction and the Case o f the G lobal
Agrochemical Industry." Long Range Planning 35(6):615-24.
Yusoon Kima, Thomas Y. Choib, Tingting Yanb, Kevin Dooleyb, 2011, Structural investigation of supply networks: A social network analysis approach, Journal of Operations Management, 29,194-211.
Sergio G. Lazzarini, Fabio R. Chaddad, Michael L. Cook, 2001,Integrating Supply Chain And Network Analyses: The Study of Netchains, Journal of Chain andNetwork Science, 1 (1), 7-22.
L. M. Patnaik, N.Viswanadham, and I. G. Sarma, 1982, Hierarchical control of an ammonia reactor, IEEE Trans. On Systems, Man and Cybernetics, Vol. SMC-12,6, pp 919-924.
Keith G. Provan, Patrick Kenis, 2007,Modes of Network Governance: Structure, Management, and Effectiveness, Journal of Public Administration Research and Theory, 18:229-252.
Thomas Ritter, Ian F. Wilkinson , Wesley J. Johnston , 2004, Managing in complex business networks, Industrial Marketing Management, 33, 175-183.
Thompson, J.D. 1967. Organizations in action. NY: McGraw-Hill.
Viswanadham, N. and Gaonkar, R, 2009, A conceptual and analytical framework for management of integrated knowledge based logistics providers, Int. J. Logistics Systems and Management, Vol. 5, Nos. 1/2, pp. 191-209.
N. Viswanadham, Sowmya Vedula and Rakesh Kulkami, 2011, Orchestrating the print supply chain in emerging markets, submitted for publication.
N. Viswanadham and S. Kameshwaran, 2009, Orchestrating a network of activities in the value chain, Proceedings of the 5th IEEE International Conference on Autom ation Science and Engineering, (IEEE CASE' 09), Bangalore, August 22-25,2009 pp 501-506.

230
N. Viswanadham and S. Kameshwaran, 2012, Ecosystem Aware Global Supply Chain Management, World Scientific Publishing.
N. Viswanadham and Y. Narahari, Performance Modeling of Automated Manufacturing Systems, Prentice Hall, USA, 592 pages, 1992.
N. Viswanadham, Sridhar Chidananda, Y. Narahari, Pankaj Dayama, Orchestrating Agricultural Marketing in India: An Optimization Model, Conf. on Automation Science &
Engineering Seoul, Korea, August 20-24, 2012, 988-993.
Bill McBeath, 2011 Supply Chain Orchestration: Part One, Chain LinkResearchhttp://www.chainlinkresearch.com/orchestrator.
Mithat Zeydan , Cuneyt Colpan , Cemal Cobanoglu, A combined methodology for supplier selection and performance evaluation, Expert Systems with Applications 38 (2011) 2741 -2751

Award Lecture Series ofIndian National Academy of Engineering
Professor S. N. Mitra Memorial Award Lecture 2013
Understanding the Advances in High Performance Computing through Computational Electromagnetics
N. BalakrishnanIndian Institute of Science, Bangalore 560012
IntroductionOver the last four decades, the computational power has been steadily increasing following the Moore's law. According to this law, the number of transistors packed inside a single chip doubles every 18 months, and so does the compute power. The demands from the practical applications that call for accurate prediction of performance through simulations have also been growing steadily. Often times, this had led to the push-pull effect wherein the computer performance has been creating newer prospects in applications, and later newer demands from practical applications drove increased com puter performance. While on one side the computer performance was steadily increasing through enhanced performance of single processors, the advent of parallel processing with commodity processors and high speed interconnects heralded the exit of vector and scalar pipelines in the traditional supercomputers. This not only made the high performance computers affordable but also offered solutions to many problems hitherto considered computationally intractable. This saga of continuous growth in demand for compute power and the computer performance with the attendant increase in the efficiency of computational algorithms has been witnessed in many areas such as Computational Fluid Dynamics, Computational Structural Mechanics, Weather Forecasting and many more. It had a large impact on the way we developed the programmes and algorithms, and called for a deeper understanding of architecture of the computer's cache memory, inter-processor communication, cache coherency, and architecture-algorithmic interaction, s that the best performance could extracted from the machines.
The focus of this presentation is to cover our group's work in Computational Electromagnetics that has been tuned to be responsive to the changes in the national and the international scenarios and also to the revolution in computers, computing techniques and informatics. In this write-up, the complex mathematical basis of our work and the graphical presentation of the results have been left out.
The SeventiesThe computational resource available at the Indian Institute of Science till 1979 was an IBM 360/44 main frame computer with 32 kilobytes of main memory and 1 MB single disk storage. Short precision addition or subtraction on this machine took 3.81 microseconds and the long precision took 6.32 microseconds. In short, this machine had a performance capability of a few 1000 floating point operations per Second (a few Kilo FLOPs). Our journey started with this computer. One of the major challenges at that time was the synthesis of antenna arrays to yield apre-specified radiation pattern. The traditional approaches considered equally spaced antenna arrays. However, unequally spaced designs yield larger bandwidth. The then known approaches to the synthesis of unequally spaced arrays resulted in element spacing that are very small, leading to mutual coupling between antennas besides practical realization difficulties. The focus of our work was to synthesize both linear and circular arrays with practical realization constraints. To this end a series of transformations were evolved that converted the constrained optimization problem into an unconstrained one. The unconstrained optimization was performed using the Simplex method of Nelder and Mead which

232
did not require the derivative of the objective function to be explicitly available. In order to take care of constraints in the radiation pattern particularly in the sidelobe region, a created response surface technique was proposed. With these, the synthesis of conventional and monopulse antenna arrays as well as directivity and SNR optimization of antenna arrays with practical realizations constraints were studied (1,2,44,45).
This was the time when the only programming language used was FORTRAN. The programmer did not have to worry about the order of accessing the memory and there was no memory hierarchy. The only innovation in programming needed in those years was the memory overlay in order to allow programmes to be larger than the computer memory. The largest number of variables in our optimization was less than 100.
The Early EightiesIn the early eighties, the DEC 1090 computer with 256 KB of main memory was installed at the Indian Institute of Science. This was the first time sharing machine with VT100 terminals was available for access at the IISc. Our group's focus then shifted towards solving larger problems. The attention had been directed towards predicting the radiation characteristics of antennas mounted on satellite/launch vehicle structures through computational means. To this end, the wire grid model of an Indian satellite along with the method of moments (MoM) for structures comparable to the wave length, was developed to predict the modification to the radiation pattern of antenna due to the satellite structure. A major challenge at that time was to develop algorithms that did not require the storage of the matrix in memory. The Spectral Iteration Technique (SIT) for structures larger than a wavelength and the Geometrical Theory of Diffraction (GTD) for large structures formed the focus of our work. The spectral iteration technique was successfully applied to predict the radiation pattern of Yagi-Uda Arrays. For larger bodies such as the missiles, the studies included ray-tracing and the EM and geometrical modeling aspects as well, and have culminated in the development of a comprehensive set of
computer codes (software) for predicting the modification to the radiation characteristics of antennas due to the presence of aerospace bodies (3,4,5,6,46-50).
The work described above brought about a level of confidence in EM scattering simulation that only needed experimental verification. The selection of site for the installation of Instrument Landing Systems (ILS) is non-trivial, and the experimental means to this end are time consuming and expensive. In the light of this, improved theoretical prediction of the effects of uneven terrain on the glideslope of the ILS assumes significance. Using flat plate modelling derived from actual terrain profile and the scattering models based on Uniform Theory of Diffraction (UTD) and Uniform Asymptotic Theory (UAT), the quality of the glideslope has been evaluated by computing the EM field and the Differential Depth of Modulation (DDM) signal. Theoretical results have been compared and were found to agree well with those measured at two airport sites in India. This comparison also brought out the fact that the inclusion of terrain impedance considerations improves the accuracy of theoretical prediction of the aberrations and kinks in the glideslope (7-11,51). The number of variables that we handled came to be close to 100.
Late EightiesThe RISC processors were introduced in the late eighties,and this was the start of the movement away from the main frame. The experiences in modelling the scattering from complex targets, and that in radar signal processing, were fused through an international collaboration. A major part of the research efforts was devoted to modelling the EM scattering from hydrometeors (dielectrics and coated dielectrics), and their verification using multi-parameter - Doppler and polarization - radar observations.
Studies of scattering from hydrometeors like rain, hail, graupel and snow are complicated because of the differing sizes, shapes and distributions in which they occur in nature. The scattering from such p o ly -d ispersed sca ttere rs fu rther complicates the inverse scattering problem of

233
hydrometeor identification and estimation from polarimetric radar returns, due to the imprecise knowledge of the dielectric constant of the scatterers. The contributions in the area of polarimetric radar meteorology have aided in evolving a framework for interpretation of radar echoes and contributed towards improved microphysical insight into the meteorological p rocesses. M ajor am ongst them is the introduction of a new algorithm to obtain zero-lag correlation coefficient between horizontally and vertically polarized echoes, derivation of its statistical properties and establishing its meteorological significance. Other noteworthy contributions include an algorithm to measure and interpret the differential phase shift upon scattering, a rain-hail boundary in the Zh- Kdp space and a novel non-iterative method of correcting for the attenuation.
All the above studies have been validated with radar data from several severe storms. In a very coordinated experiment involving two coherent radars (one with polarimetric capability) and a KING AIR aircraft with a 2D probe, the comparisons of the scattering computed from 2D probe samples of hydrometeor sizes, scattering computed from a melting model, and the remote radar measurements, have been demonstrated to be in close agreem ent, vindicating the sophistication of the scattering models developed. One of the very first measurements reported in the literature wherein the polarimetric and Doppler measurements have been used to qualitatively and quantitatively explain the microphysics of a severe hailstorm resulted from this study. The use of polarization techniques to satellite-borne radar observations for global coverage has been shown to be realisable for the first time, and this work had far reaching significance in establishing the use of satellite for global rainfall measurements. This was our group's first foray into not merely scattering and radiation simulation, but in fact into the inverse scattering problem of target identification (12-22,52-66).
The major architectural change that took place with the RISC processors was the introduction of cache memory. The order of accessing the
memory and ensuring that the information needed is always available in the cache became important in programming. This era was also the beginning of the introduction of architecture-optimized numerical packages like IMSL and ESSL. As developers, one started to have an insight into the way the actual computation is done. This was also the era where large data from the radars needed to be handled besides the need for graphical visualization on high-end graphic workstations and color printers.
The NinetiesThe Supercomputer Education and Research Centre was established at the Indian Institute of Science in the early nineties. This gave access to large main frames such as Cyber 992, a host of RISC machines and the first distributed-memory parallel computer IBM SP-2. This brought us to parallel architectures, interconnect switches and the world of P VM and MPI, and to the performance ranges in MFLOPs. Subsequently, the several shared memory machines from IBM and SGI and clusters from HP with performances in the range of a few Giga FLOPS were also added. The class of problems that was tackled grew both in complexity and size. The size of the problem reached several thousand variable and a paradigm shift took place from detection to recognition, and a higher resolution in detection, thereby detecting minor variation on scatterers rather than just detecting the scatterers (23-43,67-83).
The experiences gained in accurate modelling of the scattering from dielectric and coated dielectric hydrometeors have been directly applied to RCS modification of aircraft and its management in an effort towards stealth design. A comprehensive formulation using the Extended Boundary Condition Method called T-Matrix method has been developed to predict the RCS of complex targets coated with a chiral medium. This method is the same as that developed in the work on scattering from weather targets but extended to multi-layered bodies and for chiral media wherein the propagation constant is different for right and left circularly polarized waves.
Using full wave solutions o f the EM equations,

234
the scattering from rough surfaces has been modelled for predicting the clutter characteristics from vegetated land, urban land and sea surface. These predictions have been validated using the first Indian airborne radar over the Indian terrain. The results indicate that the clutter distribution predicted from the scattering model and that seen in the actual measurements are in close agreement. This has fed critical inputs to the design of India's first Airborne Surveillance Platform.
T he te c h n iq u e s in C o m p u ta t io n a l Electromagnetics (CEM) can be grouped under three classes. The first is the integral equations method. The second is based on differential equations, and the third is the class of asymptotic techniques such GTD, PO and GO. The advances in computers and their availability have stimulated research into solving the scattering from large structures through the use of CEM. Iterative techniques have been developed successfully using CG method and the Fast Multipole Method for the rapid solution of the integral equations that arise in EM. This work along with those on polarimetric radars has been extended to radar recognition so that the Indian radars of the future will be more capable of target recognition than mere detection. This innovative recognition technique that identifies targets with small material and geometrical variations has opened up many research prospects that would direct the future radar research in India and elsewhere.
Working in collaboration with the scientists at ADA, our group has developed a parallel MoM to predict the RCS of aircraft of practical size like LCA and Mirage at frequencies beyond 3 GHz. Further, a repertoire of techniques such as PTD, UTD, FDTD, FEM and MoM Shooting and bouncing of rays, have been developed. This has given us the capability for operational level RCS Prediction codes. The Finite Difference Time Domain Method (FDTD) has been fully developed in its parallel form with a very novel method of introducing the Absorbing Boundary Conditions based on Chiral boundaries. This unique technique has extended the applicability
of FDTD to a class of aircraft that include the Nation's prestigious Light Combat Aircraft in estimating its RCS.An edge based Finite Element Method has been developed for applications for complex scatterers with sharp edges. These two established our spectrum of work to include all the three class of techniques in CEM. The airborne radars in applications such as Airborne warning and Control Systems (AWACS) call for design of antenna arrays which yield very low sidelobes and larger bandwidth and the ability to handle large powers. The most preferred design involved narrow wall inclined slot arrays. Powerful numerical techniques have been developed for their accurate design, and these have been validated using experimental data by a Ph D student from the DRDO. As part of the research work of one of the scientists from the DRDO, a very comprehensive design tools for the Analysis of Coupled-Resonator and inverted slot Slow Wave Structuresfor Traveling-Wave Tubes for Aerospace Applications have been developed, and these were validated with experiments.
Year 2000 and BeyondDuring this period, the Indian Institute of Science installed a 22 Tera FLOP Blue Gene machine. Additionally, CMMACS, a CSIR laboratory installed more recently, a 360 TFLOPmachine with 17,344 cores. With the advent of non- metallic aircraft, the need for full 3D solutions became apparent. The Method of Moments is originally touted to be a low frequency method but known to produce accurate results. However, the m atrix size involved while solving e lectrom agnetica lly large scatterers is prohibitively high. The focus of our group in the last few years has been on developing a full 3D MoM code that can take into account full inhomogeneity of the medium and also give accurate results, and extend it to solve more than a million variables. To this end, highly parallel MoM codes based on RWG and SWG basis functions have been developed, and so also parallel framework for the multilevel adaptive cross approximation based fast Method of Moments solution for RCS analysis. This has given us the capability to solve large scattering and radiation problems of high practical utility,
235
and also to push the scattering analysis albeit for smaller objects to the Tera Hertz Region.
The stealth technologies for making the aircraft invisible to the radars have been mastered by several nations. One of the methods of detecting low visibility aircraft is to analyse the radar echoes not merely from the aircraft which is in any case very small but from the wake vortex or the aerodynamic disturbance created around the aircraft. This combined analysis of acoustic and electromagnetic systems requires discretization of not just the aircraft but the entire volume that encompasses the wake vortex - a fully 3-D scattering from large complex bodies. Our current work that is nearing completion combines the SWG-based highly parallel MoM techniques with multilevel compression techniques to save on computational time. This is the beginning to investigate the detection of stealth aircraft through the scatter from wake vortex (84-87). Our current problems have reached the complexity of inverting dense matrices of sizes larger than a million by million.
The FutureT h e f u tu r e o f th e C o m p u ta t io n a l Electromagnetics, just as in many areas such as Weather Forecasting, CFD, CSM etc. will grow much faster than the growth of the computational power. The introduction of accelerators such as GPUs and Many Integrated Core (MIC) is yet to be fully taken advantage of in the CEM. Our future goal is also to move toward accurate prediction of scattering characteristics of complex shaped inhomogeneous bodies of practical importance resulting in equivalent matrix sizes in several millions. Realizing this, the Indian Government has launched a Mission on C ap ac ity and C a p ab ility B u ild in g in Supercomputers, in which our group played a crucial role. This mission will bring to the country capabilities of several Peta FLOPS of compute power with memory in the range of several Tera Bytes. It is expected that the CEM will effectively benefit by solving the practical problems that form the focus of maj or national initiatives.
AcknowledgementFirst and foremost is our heartfelt thanks to INAE for the Prof SN Mitra Memorial award. It will act as a great booster to the present, past and future group members. This journey of nearly four decades that witnessed the growth of compute powers from a few kilo FLOPS to now PetaFLOPS of more than 1012 times, from a few kilo bytes of main memory to several tera bytes of more than 1010 times and from just 1 MB of storage to Peta Bytes (109 times),the number of variables from a few 10's to a few millions, has been a stimulating one. Our approach has been to use a practical engineering problem to understand such stupendous advances in high performance computing and also to be a part of this relentless growth. Our work in CEM has also spurred within the group to look at emerging issues in large scale network analytics, large scale battle field deployable sensor networks and information security. Such a wonderful opportunity would not have been possible without the help of several illustrious people who were and are part of our group. My research supervisor Prof. S. Ramakrishna, my two mentors Dr. Dusan Zmic and Dr. Richard Doviak, and my colleagues Prof. VN Bringi, Prof S M Rao, Prof M Sachidananda and Dr P Krishnamurthy, were the ones who shaped my initial understanding of CEM. All the work has been the result of high-level of dedication by my students Bokhari, Jha, Poulose, Reena, Venky, Niraj, Prasad, Sanjay, Raj, Sridhar, Latha, Padhy and Negi. They deserve all the appreciation and my gratitude. The entire work was supported in parts by the Department of Aerospace Engineering and the Supercomputer Education and Research Centre at the Indian Institute of Science, the Government of India and the National Severe Storms Laboratory at Norman, Oklahoma, USA.
ReferencesN. B alakrishnan, P. K. M urthy and S. Ramakrishna, "Synthesis of Antenna Arrays with Spatial and Excitation constraints", IEEE Trans, on Antennas and Propagation, Vol. AP-27, pp. 690-696, September 1979.

236
N. Balakrishnan and S. Ramakrishna, "Optimum Difference Mode Excitations for Monopulse Arrays", IEEE Trans, on Antennas and Propagation, Vol. AP-30, pp. 325-330, May, 1982.
S. A. Bokhari and N. Balakrishnan, "A Spectral Iteration Techniques for Analysis of Yagi-Uda Arrays", Proc. IEEE (London), Part- H, No. 3, pp. 198-202, June 1985
S. A. Bokhari and N. Balakrishnan, "Analysis of Cylindrical Antennas - A Spectral Iteration Technique", IEEE Trans, on Antennas and Propagation, Vol. AP-33, pp. 251-258, March 1985.
S. A. Bokhari and N. Balakrishnan, "A Method to Extend the Spectral Iteration Technique", IEEE Trans, on Antennas and Propagation, Vol. AP-34, pp. 51-57, January 1986.
R. M. Jha, V. Sudhakar andN. Balakrishnan, "Ray Analysis of Mutual Coupling between Antennas on a General Paraboloid of Revolution (GPOR)", Electronic Letters, Vol. 23, No.11, pp. 583-584, May 1987.
M. M. Poulose, P. R. Mahapatra and N. Balakrishnan, "Microwave Landing System - A Favoured Alternative to Current ILS", IETE Technical Review, Vol. 2, No.11, pp. 373-382, 1985.
M. M. Poulose, P. R. Mahapatra and N. Balakrishnan, "Computer Aided ILS Site Evaluation Deemed Practical", ICAO Bulletin, pp. 36-39, September 1987.
M. M. Poulose, P. R. Mahapatra and N. Balakrishnan, "Computer Aided ILS Site Evaluation Deemed Practical", Commonwealth Air Transport Electronics News, Vol. 26, No.l, pp. 9-12, 1988, reprinted from ICAO Bulletin, September 1987.
M. M. Poulose, P. R. Mahapatra and N. Balakrishnan, "Terrain Modelling of Glide Slope
for ILS", Proc. of IEE (London), Vol. 134, No. 3, pp. 275-279, June 1987.
M. M. Poulose, P. R. Mahapatra and N. Balakrishnan, "Accurate Estimation of ILS G lideslope in the presence o f Terrain Irregularities", Journal of the Institution of Telecom. Enggs., Vol. 33, No.l, pp. 22-29, January-February 1987.
N. Balakrishnan, D.S. Zmic, J. Goldhirsh and J. Rowland, "Comparison of simulated rain rates from disdrometer data employing polarimetric radar algorithms", Journal of Atmospheric and Oceanic Technology, Vol. 6, No. 3, pp. 476-486, June, 1989.
V. N. Bringi, V. Chandrasekar, N. Balakrishnan and D. S. Zmic, "An examination of radar propagation effects in rainfall at microwave frequencies", Journal of Atmospheric and Oceanic Technology Vol. 7, No. 6, pp. 829-840, November 1990.
D. S. Zmic andN. Balakrishnan, "Dependence of reflectivity factor - rainfall rate relationship on polarization", Journal of Atmospheric Oceanic Technology, Vol. 7, No. 5, pp. 792-795, October 1990.
V. Chandrasekar, V.N. Bringi, N. Balakrishnan and D .S . Z rn ic , "E rro r S tru c tu re o f Multiparameter radar and surface measurements of rainfall, Part III: Specific Differential Phase", Journal of Atmospheric Oceanic Technology, Vol. 7, No. 5, pp. 621-629, October 1990.
N. Balakrishnan and D. S. Zrnic, "Use of polarization to characterize precipitation and discriminate large hail", Journal of Atmospheric Sciences, Vol. 47, No.13, pp.1525-1540, 1st July1990.
N. Balakrishnan and D. S. Zmic, "Estimation of rain and hail rates in mixed phase precipitation", Journal of Atmospheric Sciences Vol. 47, No. 5,1 pp. 565-583,1st March, 1990.

237
D. S. Zmic and N. Balakrishnan, "Processing and interpretation of data from polarimetric weather radars", (Invited Paper in a Book), W-M Boemer, et al. (Eds), Direct and Inverse Scattering Methods in Radar Polarimetry, NATO- Advanced Science Institutes (ASI) Series C, Vol. C-350, Kluwer Academic Publications, Dordrecht, NL, Ch. VIII-7, pp. 1713-1748, ISBN No: 0-7923- 1498-0,15th February, 1992.
D. S. Zmic, N. Balakrishnan, C. L. Ziegler, V. N. Bringi, K. Aydin and T. Matejkai, "Polarimetric Signatures in the Stratiform Region of a Mesoscale Convective System", Journal of Applied Meteorology, Squires Special Issue of the Journal of Applied Meteorology', Vol. 32, pp. 678-693,1993.
D. S. Zmic, V. N. Bringi, N. Balakrishnan, K. Aydin, V. Chandrasekar and J. Hubbert, "Polarimetric Measurements in a Severe- Hailstorm", Monthly Weather Review, Vol. 121, No. 8, pp. 2223-2238, August 1993.
Dusan S. Zmic, N. Balakrishnan, Alexander Ryshkov and S. L. Durden, "Use of Copolar Correlation Coefficient for probing precipitation at nearly vertical incidence", IEEE Trans, on Geosciences and Remote sensing, Vol. 32, No. 4, pp. 740-748, July 1994.
J. Metcalf, N. Balakrishnanet. al., "Technology of Polarization Diversity Radars for Meteorology - State of the art review - A panel Report", Radar in Meteorology, Chapter 19b, Ed. D. Atlas, AMS, Boston
V. V. Sanjayanath, N. Balakrishnan and G. R. Nagabhushana, "Applications of Conjugate Gradient Method for Static Problems involving conductors of arbitrary shape", IEEE Trans, on Antennas and Propagation, Vol. 42, June 1994.
K. RajalakshmiMenon, N. Balakrishnan, M. J a n a k i r a m a n a n d K . R a m c h a n d , "Characterization of fluctuation statistics of radar clutter for Indian terrain", IEEE Trans, on Geosciences and Remote Sensing, Vol. 33, No. 2, pp. 317-324, March 1995.
Reena Sharma, N. Balakrishnan, V. V. Varadan and V. K. Varadan, "Scattering from Chirally coated conductor", Journal of Wave Material Interactions, Vol. 9(1),pp. 17-34, January 1996.
V. V. S. Prakash, S. Christopher and N. Balakrishnan, "On the application of Fourier transform techniques to waveguide interior regions", Society of Electronic Engineers, J. of Electro-technology, India, Vol. 40, No. 3 & 4, pp. 42- 50, September & December, 1996.
V. V. S. Prakash, S. Christopher and N. Balakrishnan, "Hybrid method of analysis of slot discontinuity in a rectangular waveguide and the validity of circuit representation", Int. Journal RF and Microwave CAE 8, pp. 339-349,1998.
V. V. S. Prakash, S. Christopher and N. Balakrishnan, "Sidewall inclined slot in a rectangular waveguide:Theory and experiment", IEE Proc. Microwave Antennas Propagation, Vol. 145, No. 3, pp. 233-238, June 1998.
Reena Sharma and N. Balakrishnan, "Scattering of Electromagnetic waves from Arbitrary Shaped Bodies Coated with a Chiral Material", Smart Materials and Structures, Vol. 7, No. 6, pp. 851- 866, December 1998.
Reena Sharma and N. Balakrishnan, "Scattering of Electromagnetic Waves from Chirally Coated Cylinders", Smart Materials and Structures, Vol. 7,No. 4, pp. 512-521, August, 1998.
S. M. Rao and N. Balakrishnan, "Computational Electromagnetics - A Review", Invited Article in the Special Issue on Computational Sciences, Current Science, Vol. 77, No.10, pp. 1343- 1347, November, 1999.
V. V. S. Prakash, S. Christopher and N. Balakrishnan, "Nonresonant edge slot antenna for phased array applications: Theory and experiment", IETE Technical Review, India, April, 1999.
N. Sachdeva, N. Balakrishnan, and S. M. Rao, "A new absorbing boundary condition for FDTD",

238
Microwave Opt. Technology Letter, Vol. 25(2), pp. 86-90, 20thApril, 2000.
V. V. S. Prakash, S. Christopher and N. Balakrishnan, "Method of Moments Analysis of narrow wall slot array in a rectangular waveguide", IEE Proceedings, Microwaves, Antennas & Propagation, Vol. 147, No. 3, June 2000.
V. V. S. Prakash, S. Christopher, and N. Balakrishnan, "Moment method analysis of narrow wall inclined slot array in a rectangular waveguide", IEE Proceedings, Microwaves, Antennas & Propagation, Vol. 147, No. 3, pp. 242- 246, March, 2000.
V. V. S. Prakash, S. Christopher and N. Balakrishnan, "A selective survey of waveguide- fed slot Arrays", IETE Technical Review, India, Vol. 17,No.l, January-February,2000.
K. RajalakshmiMenon, N. Balakrishnan, S. M. Rao and K. Ramchand, "A Simple Technique for Discrimination between Radar Targets with Minor Variations”, Microwaves and Optical Technology Letters, Vol. 28, No. 5, pp. 336-342, 5 th March, 2001.
N. Sachdeva, N. Balakrishnan, S. S. Ghosh and S. M. Rao, "An Efficient Parallelisation of FDTD” Microwave and Optical Technology Letters ,2001.
V. L. Christie, L. Kumar and N. Balakrishnan, "Equivalent circuit modeling of practical coupled-cavity slow-wave structures for TWTs", Microwave and Optical Technology Letters, Vol. 35(4), pp. 322-326, 20th November, 2002.
NirajSachdeva, S. M. Rao and N. Balakrishnan, "A Comparison of FDTD- PML with TDIE", IE E E T ran sa c tio n s on A n ten n as and Propagation, Vol. 50, No.11, pp.1609-1614, November, 2002.
Latha Christie V, Lalit Kumar and Balakrishnan N "Inverted Slot-Mode Slow-Wave Structures for
Traveling-Wave Tubes", IEEE Transactions on M ic ro w av e T h eo ry and T e c h n iq u e s , Vol.55(6): 1112-1117,2007.
Christie, V. Latha, Lalit Kumar, and N. Balakrishnan. "Analysis o f propagation characteristics of circular corrugated waveguides using coupled integral equation technique." Electromagnetics 27.4,229-240,2007.
Rajalakshmi K Menon, Balakrishnan N, Ramchand K "Discriminating Complex Bodies with their Minor Variations using E-Pulse", IEEE Transactions on Aerospace and Electronic Systems, 44(1):408-416, 2008.
N. B alakrishnan and S. R am akrishna, "Performance Maximisation of antenna array systems in the presence of Practical Constraints", Proc. of the International Conference on Radar, Paris, pp. 163-168, May 1984.
N. Balakrishnan, "Optimisation of Performance of Indices of Mono-pulse Arrays with Constraints on Sum and Difference Mode Sidelobes", Proc. of International Symposium on Antennas and Propagation, Kyoto, Japan, pp.1135-1138, 20-22 August 1985.
S. A. Bokhari and N. Balakrishnan, "A spectral iteration technique for the analysis of a monopole on a rectangular plate", Proc. of JINA 86, Symposium on Antennas, Nice, France, 1986.
S. A. Bokhari and N. Balakrishnan, "A Spectral Iteration Technique for the analysis of a monopole on a circular ground plane", Proc. of the IEEE MONTECH-86, Conference on Antennas and Communication, Montreal, Quebec, Canada, 29 September-1 October 1986.
S. A. Bokhari and N. Balakrishnan, "A wire grid model for the analysis of VHF antenna mounted on the BHASKARA satellite", Proc. of International Symposium on Antennas and Propagation, Kyoto, Japan, pp.1139-1141,20- 22 August 1985.
R. M. Jha, S. A. Bokhari, V. Sudhakar and N.

239
Balakrishnan, "Efficient ray path computation and its application to slot antennas on a cone", Proc. of the IEEE MONTECH-86, Conference on Antennas and Communication, Quebec, Canada, 29 September-1 October 1986.
S. A. Bokhari, N. Balakrishnan and P. R. Mahapatra, "An algorithm for the pattern computation of triangular lattice phased arrays", Proceedings of IEEE AP-S/URSI Symposium, Blackburg, VA, USA, pp.137-140, 15-19 June 1987.
M. M. Poulose, P. R. Mahapatra and N. Balakrishnan, "Accurate Modelling of ILS Glideslope", Proc. of the CIE 86 International Conference on Radar. Nanjing, China, pp.50-55, 3-6November 1986
N. Balakrishnan and D. S. Zmic, "Hydrometeor identification from polarimetric measurements", Eos, Vol.69,No.44,p.l074,1 November, 1988.D. S. Z rn ic , N. B a lak rishnan and M. Sachidananda, "Processing and interpretation of alternately polarized weather echoes", Proc. of IGARSS-88, No.ESA SP-284, Vol.l, pp.243- 246, , University of Edenburg, UK, 13-16 September 1988.
D. S. Z rn ic , N. B a lak rishnan and M. Sachidananda, "Use of differential propagation phase constant to estimate liquid water in a mixture of rain and hail", Abstracts of the National Radio Science Meeting,, Boulder, CO, pp.178,5- 8 January 1988.
D. S. Zmic and N. Balakrishnan, "Ground based m easurem ents o f rain", [invited paper] IGARSS'89, 12th Canadian Symposium on Remote Sensing, Vancouver, Canada, Vol. 3, pp 1901, IEEE No. 88 CH, 10-14 July 1989.
N. Balakrishnan and D. S. Zmic, "Suggested use of cross correlation between orthogonally polarized echoes to infer hail size", 24th Conference on Radar Meteorology, Tallahassee, FL, pp.292-296,27- 31 March 1989.
N. Balakrishnan and D. S. Zmic, "Correction of
propagation effects at attenuating wavelengths in polarimetric radars", 24th Conference on Radar Meteorology, Tallahassee, FL, pp.287-291,27-31 March 1989.
D. S. Z rn ic , N. B a lak rishnan and M. Sachidananda, "Polarimetric measurements determine the amounts of rain and hail in a m ix tu re" , 24 th C o nference on R adar Meteorology, Tallahassee, FL, pp.396-400,27-31 March 1989.
N. Balakrishnan, D. S. Zmic, J. Goldhirsh and J. Rowland, "Comparison of simulated rain rates from disdrometer data employing polarimetric radar algorithms", Paper presented at the National Radio Science Meeting, Boulder, CO, January 1989 (The above paper also appeared as Report of the John Hopkins University, Applied Physics Laboratory, Laurel, Maryland 20707, USA, Report No. JHU/APL, S1R88U-028, pages 35, May 1988).
D. S. Z rn ic an d N . B a la k r i s h n a n , "Polarimetricmeasurands from hydrometeors", Proceedings of the URSI General Assembly, Boulder, CO, September 1990.
N. Balakrishnan, D. S. Zmic, K. Aydin, V. Chandrasekar and V. N. Bringi, "Polarimetric signatures in the stratiform region of a mesoscale convective system", Proceedings of the 25th Conference on Radar Meteorology of the American Meteorological Society, pp.525-528, Paris, France, 24-28 June 1991.
D. S. Zmic, N. Balakrishnan, V. N. Bringi, K. Aydin and V. Chandrasekar, "Polarimetric m easurem ents in a severe hail storm ", Proceedings of the 25th Conference on Radar Meteorology of the American Meteorological Society, pp. 666-669, Paris, France, 24-28 June1991.
N. Balakrishnan, D. S. Zmic and V. N. Bringi, "Measurement and modelling of the Differential Phase Shift upon scattering in Polarimetric Weather radars and its use in inferring the hail size", Proceedings of the Asia Pacific Microwave

240
Conference, APMC 1992,11-13 August 1992.
N. Balakrishnan, D. S. Zmic and R. J. Doviak, "Linear Polarization for Weather Radars - Trade offs", Proceedings of 26th International Conference on Radar Meteorology of the American Meteorological Society, Norman, OK, US A, 24-28 May, 1993.
D. S. Zmic, N. Balakrishnan and B. Gordan, "Copolar Correlation at Vertical Incidence", Proceedings of the 26th International Conference on Radar m eteorology of the American Meteorological Society, Norman, OK, USA, 24- 28 May, 1993.
D. S. Zmic, N. Balakrishnan, A. Ryzhkov, S. L. Durden,"Use of co-polar correlation coefficient for probing precipitation along the vertical", Geoscience and Remote Sensing Symposium, IGARSS '93, 'Better Understanding of Earth Environment', International , pp:1238 - 1240, Vol.3,18-21 August 1993.
K. RajalakshmiMenon, N. Balakrishnan, R. P. Shenoy and K. Ramchand, "Characterization of la n d and sea c lu t te r from a irb o rn e measurements", Proceedings of the International Conference on Radar, Paris, pp. 173-178, 3- 6 May 1994.
S. Christopher, V. V. S. Prakash, A. K. Singh and N. Balakrishnan, "Moment Method Analysis of Dielectric Covered Radiating Slots Using Alternative Green's Function Approach", The Eleventh Annual Review of Progress in Applied Computational Electromagnetics, ACES 1995, Monterey, CA, USA, 20-25 March 1995.
S. Christopher, V. V. S. Prakash, A. K. Singh and N. Balakrishnan, "Moment Method Analysis of Dielectric Covered Radiating Slots Using Alternative Green's Function Approach", Proceedings of the Eleventh Annual Review of the Progress in Applied Com putational Electromagnetics, Monterey, Canada, pp. 1-9, Computational Electromagnetic Society, 20- 24 March 1995.
Reena Sharma and N. Balakrishnan, "Scattering from Chirally coated spheroids - a study in RCS modification", Proceedings of the Asia Pacific Microwave Conference, APMC 1992, Adelaide, Australia, Vol: 1, pp: 251 - 254, 11-13 August 1992.
Reena Sharma and N. Balakrishnan, “Scattering from Chiral Composites", (Invited Paper), International Conference on Smart Materials, Structures and MEMS, SPIE'96, Indian Institute of Science, 11-14 December 1996.
Reena Sharma and N. Balakrishnan, "Scattering from Chirally Coated Bodies", The Twelfth Annual Review o f Progress in Applied Computational Electromagnetics, ACES 1996, Monterey, CA,USA, 18-22 March 1996.
B. S. Shridhar and N. Balakrishnan, "Accurate Design of Shaped Beam Doubly Curved Reflector Antennas for Airborne Applications", The Twelfth Annual Review of Progress in Applied Computational Electromagnetics, ACES 1996, Monterey, C A, USA, 18- 22 March 1996.
V. V. S. Prakash, N. Balakrishnan and S. Christopher, "Theoretical studies on the effect of waveguide geometry on the radiating slot", Proc. Applied Computational Electromagnetic Society, Monterey,USA,pp.201-207,1997.
V .V. Sanjaynath , Reena Sharma and N. Balakrishnan, "Analysis of Chiral Scatterers using Volume Integral Formulation", Conference on Bianisotropics 1997, Glasgow, UK, 5-7 June 1997.
D. V. S. R a v ik a n th , R een a S harm a, RajalakshmiMenon and N. Balakrishnan, "Simulation of Time Series of Clutter Echoes for Airborne Radars", International Conference on Radars RADAR99, Paris, France, November1999.
V. L. Christie, S. Anuradha, Lalit Kumar and N. Balakrishnan, "Three Dimensional Simulation and sensitivity Analysis of a Waveguide Window", 7th International Conference on

241
Recent Advances in Microwaves, Malaga, Spain, 13-16 December 1999.
N. Sachdeva, N. Balakrishnan, and S. M. Rao, "A Comparison of FDTD-PML with TDIE", 2000 IEEE International Symposium on Antennas and Propagation and USNC/URSI, Salt Lake City, 16-21 July 2000.
N. Sachdeva, N. Balakrishnan, and S. M. Rao, "A new Absorbing Boundary Condition for FDTD", 2000 IEEE International Symposium on Antennas and Propagation and USNC/URSI, Salt Lake City, 16-21 July 2000.
P. Venkatesh Rao and N. Balakrishnan, "Homogeneous lossy media for electromagnetic scattering problems using edge-based FEM", International Conference JINA 2002, France, Session-V,No:5.16, November 2002.
P. Venkatesh Rao and N. Balakrishnan, "Use of Chiral absorber to terminate the open region in FEM ", In ternational Conference JIN A 2002,France, Session-I, No: 1.18, November2002.
V. L. Christie, L. Kumar, N. Balakrishnan, "The design of an inter-digital structure for TWTs", Infrared and Millimeter Waves, Conference D igest, Twenty Seventh In te rn a tio n a l Conference, pp:341 - 342,22-26 September 2002.
Rajalakshmi Menon K, Balakrishnan N, Ramchand K “Discriminating Complex Bodies with Minor Variations Using E-Pulse “ IEEE International Radar Symposium-India 2007, Bangalore, 11-13 December 2007.
Y Kumar Negi, V Prasad Padhy, N Balakrishnan. “RCS Enhancement of Concealed/Hidden Objects at Terahertz (THz)”, 27th Annual Review o f Progress in A pplied C om putational Electromagnetics, Williamsburg, Virginia, March 27-31,2011.
Venkat Prasad Padhy, N Balakrishnan, D Gope, Solving Volume Integral Equation using Sea LAPACK, Intl. Conf. Mathematical Methods in Electromagnetic Theory, 288-291.
Venkat Prasad Padhy, Yoginder Kumar Negi, N Balakrishnan, RCS Enhancement due to BRAGG Scattering, Intl. Conf. Mathematical Methods in Electromagnetic Theory, 443-446.
Award Lecture Series ofIndian National Academy of Engineering
Professor S. N. Mitra Memorial Award Lecture 2014
Role of Formal Modelling in Building Robust Software Systems
RK ShyamasundarFaculty of Technology and Computer Science
Tata Institute of Fundamental Research, Homi Bhabha Road, Mumbai 400005
IntroductionThe concept of computation existed long before the invention of computers. The notion of computing emerged through the pioneering formalization of the notion of algorithm (or automatic computation) in a variety of ways by A. Church, Alan Turing, Emil Post and AA Markov. In 1968, Herbert A. Simon argued that certain phenomena are artificial in the sense “they are as they are only because of a system's molded by goals or purposes, to the environment in which it lives. I f natural phenomena have an air o f necessity about them in their subservience to natural law, artificial phenomena have an air of c o n t i n g e n c y in t he i r m a l l e a b i l i t y by environment”. The contingency of artificial phenomena created doubts as to whether they fall properly within the compass of science. It is relevant to quote Richard Feynman (1983) who says, “Computer science differs from physics in that it is not actually a science. It does not study natural objects. Neither it is mathematics. It's like engineering-about getting to do something, rather than ...” . Juris Hartmanis while contrasting computing with other disciplines argues that computing being a sciences o f the ar t i f i c ia l -holds the p roperty th a t like mathematical structures the theory cannot be challenged by theory of experiments. He further argues that the role of experiments in computer science is to demonstrate the constructible universes in contrast to the role of experiments in natural sciences like physics. Perhaps, in the context of Big data and machine learning, the statement needs a relook.
The heart of computing lies in “programming”. Early works of Edsgar Dijkstra and Tony Hoare
demonstrated that “Abstraction” is the key feature for good programming, and it is this that distinguishes it from classical engineering. The power of Abstractioncm be gauged through the words of Niklaus Wirth: “Computer system involves machines o f great complexity. This complexity can be mastered intellectually by one tool only: abstraction. A language represents an abstract computer whose objects and constructs lie closer to, and reflect more directly, the problem to be represented than the concrete machine”.
The rapid growth of computing power and its availability led to the deployment of computers in a variety of critical and non-critical sectors. As software was extendable and flexible, “processes” were continuously replaced by software, often referred to as process control concept. Such a trend dramatically increased the demands on software engineers. Programs and systems became increasinglycom plex and almost impossible for a single individual to fully understand. The abundance of computing resources coupled with a significant drop in their cost inevitably reduced the attention given to good design. At the expense of quality, the pursuit of profit became paramount; this naturally resulted in the deterioration of programming quality. Our limitations in designing complex systems are no longer determined by slow hardware, but by our own intellectual capability. From experience, we know that most programs could be significantly im proved, made morereliable, more economical, and easier to use.
One of the distinguishing features of computer science as compared to other engineering disciplines is the lack of “continuity” of behavior

243
with respect to input. The absence of continuity makes it impossible to assure robustness by testing it under extreme conditions. It is because of this Dijkstra made the remark that “ Testing can only show the presence of an error and not the absence”. The complexity of building robust programs or software can be gauged from the argument made byEdsgar Dijkstra in his 1972 Turing Award Lecture. To quote him: “To put it quite bluntly: as long as there were no machines, programming was no problem at all;when we had a few weak computers, programming became a mild problem, and now we have gigantic computers, programming has become an equally gigantic problem ”.
To address the challenge faced in engineering software, the NATO Science Committee in early 1967 organized a conference comprised of scientists representing various member nations, on possible international actions in the field of computer science. Possible actions included the setting up of an International Institute of Computer Science at a later date). The conference was to shed further light on the many current problems in software engineering, and also to discusspossible techniques, methods and developments that might lead to their solution. It was hoped that the conferencewould be able to identify present necessities, shortcomings and trends and that the findings could serve as a signpostto manufacturers of computers as well as their users. The degree of the crisis could be gauged by declaration of the Algol 68 committee to IFIP council “ ... as a tool for the reliable creation of sophisticated programs, the language was afailure... ”. The honesty and the courage with which the committee of experts evaluated the outcome is something very unusual.
The grand challenge of correct program design and development lead to several seminal works by Edsgar W. Dijkstra, CAR Hoare, Ole Johan Dahl, Niklaus Wirth, Robert Floyd, and others. Inspired by these works, significant amount of work was done to design programming languages and programming methodologies with tool support to complex software development that would enable
correct software development for varieties of architectures like sequential, concurrent, distributed, real-time along with several other parameters of communication over the years. The challenge has become daunting in the context of multicore processors that arose due the pleateau reached by the Moores Law, Internet and cybersecurity.
In the sequel, I shall highlight some of our select results inspired by these challenges. I shall follow an essay style avoiding mathematical formalisms concentrating on the underlying motivations and the contributions.
Semantic Foundations of Real-Time Distributed ComputingConcurrent systems started being built in early 1970's based on some of the foundations built in 1960's, there was hardly any evolution in realtime languages even though several of the systems had been built and was in operation. Consequently, no serious analysis of complexity, no design m ethodlogy, no standard of implementation, and no concept of portability existed for real-time languages even in early 1980's. A major response came from the US Department of Defence in the development a new real-time language Ada.Language CHILL was also developed for telecommunication purposes around that time. While the claim was “rigourous definition”, the official standards lacked any acceptable characterization of concurrency let alone real-time - even though the language was to cater to real-time embedded systems. Onemust admit that the language had nice features considered in an isolated manner but while integrated, it was lacking formal characterization and hence leading to serious correctness concerns. We developed (1-2) the first realistic models for real-time concurrency that had the following properties:
(i) Realistic in the sense that concurrent actions can and will overlap in time unless prohibited by synchronization constraints
(ii) No unrealistic waiting of processors is modelled, and yet the many parameters
‘.C.A.R. Hoare (who was member of the committee) in his Turing award lecture notes that report was suppressed by IFIP.

244
involved in real-time behaviour are re f le c te d by a c o r re s p o n d in g parameterization of the underlying network model like latency etc.
(iii) Applied to programming languages for distributed computing such as ADA and Occam that are based on synchronized communications,
(iv) Provide a sound and a relatively complete compositional method of verification.
(v) Satisfied the standard of rigour as provided by denotational semantics.
(vi) Our model allowed consideration of drifting of the clocks and thereby the s e m a n t ic s p r o v id e d a c le a n correspondence on the synchmoization of clocks in a distributed set up. It embedded the result that clocks could be synchronized under e-precision for some s (however small it is) greater than 0.
Using the model, several leading ESPRIT projects emerged for reasoning distributed programs and building tools for providing automatic support. Static analysis techniques were proposed to reason about the temporal behaviours for programs in real-time distributed programming languages. It was shown that several interesting properties such as parallel actions, deadlocks, livelocks, termination, temporal errors, failures etc. can be specified and formally verified. An added advantage of the approach is that it iscompositional and thus enables incremental reasoning of timing properties.We built some of the early tools (6- 7,32) for automatic analysis of programs including a real-time programming environment (8). We further demonstrated (4,10), how reasoning by other methods for parameters other than correctness like performance, bandwidth etc., could be effectively incorporated in our model. Another interesting aspect was a compositional denotational semantics for prioritized real-time distributed programming languages has been given (11) in reponse to a paper “ Why no one has specified priority” by Leslie Lamport.The approach does not have the restriction of other approaches such as prioritized
internal moves can pre-empt unprioritized actions etc. The proposed semantics provides a clear distinction between semantic model and the execution model.The results were further enriched (3-5)for a spectrum of nondeterministic broadcast networks of processes having unbuffered and buffered types communications that are common in the new com puter architectures.
Design of Robust Distributed Programs: Methodolgies, Languages and DebuggersThe motivation for exception-based reasoning can be captured in a quotation due to RS Flint, 1984: “People seem to bu ild expectations based on the m ajority rather than the totality o f cases involved in a decision and thus ignore special situations i f they represent only a relatively sm all percentage o f cases ...yes, birds fly ; but no, ostriches don 'f\
The same observation made in the context of database modelling indeed truly holds for program specification and design. Any program, P, can be viewed as a transformer designed to performa certain class o f intended state transitions from an initial state characterized by predicate p to realize an intended goal, say G, characterized by predicate, sayq. From the initial state it may not always be possible to reach the intended goal. Let us partition the output states of P into two complementary sets: standard and exceptional ranges of P wrt q. The exceptional range of P is the set of states reached when q cannot be realized by normal execution of P and can be treated as exceptional conditions. The example above can then be described by
{/n/e}BIRD {NORM AL^, OSTRICH:«ctf fly , EMU: not fly}
The normal and exceptional conditions can essentailly be treated as exit points of a program. A program can be called robust, if it terminates at a declared exit point for any possible input state - thus, one has a complete characterization of the state transition. While there had been works on the sequential programs, there had been no work in th e c o n te x t o f c o n c u r re n c y and communication. We were the first (19) to develop a sound and complete proof system for Ada

245
fragm ent that included the rendezvous communication and exception propagation mechanisms. Through the proof system, it provided a sound methodology for designing robust distributed programs.
IBM Research had arrived at a language called CDL (Common Design Language) with the experience realized by the group of Harlan D. Mills who was the first to experiment with Structure Programming Concepts at an industrial scale and established its benefits. We used our experience (16,17) to enrich CDL to CDL* and show that
(i) Data integrity is achieable without r e s o r tin g to m u tu a l e x c lu s io n unnecessarily,
(ii) Dynamic resource management is achievable safely guranteeing the anonymity of the dynamically allocating resources, and
(iii) Similar components can be packaged together without resorting to sequential access.
Our results demonstarted that it is possible to realize the inherent para lle lism in the specification without foregoing for purposes of safety. These results have become handy in the context of the new multiprocessor architectures.
To cater tothe general real-time design languages, we designed another language RT-CDL(9,18,33) and provided its formal semantics andanalyzed the same for robustness. We showed that the language (i) permitspropagation of exceptions and various termination levels, (ii) permits to introduce intermediate checkpoints in a natural way, and (iii) permits handling exceptions in a coordinated fashion, without introducing any extra language mechanisms. In othe words, the analysis shows that the language is amenable for compositional reasoning and can be used for the specification and handling of real-time exceptions
— thus, leading to the design of reliable real-time systems.
Functional languages have been widely supported by the realization of the intended specifications as compared to imperitive languages. While functional languages score over correctness i s s u e s , th e y s u f f e r f ro m e f f ic ie n t im plem entations. For realizing efficient implementations, combinatory formulations have played a vital role. However, a similar approach had been absent from the perspective of concurrency. Using algebraic formulations, we related algebraic calculi with combinator formulations and thus showed how similar combinatory formulations can be used for efficient implementations (20,21,34,35).
We have discussed above, how we can arrive at robust programs in high level programming langauges and also discussed how languages could be designed keeping the rationale of robust design. There is another important aspect that also needs to be considered, particularly the underlying “ Compilers” that translate the high- level programs to executable obj ect programs on a given computer. One of the im portant characteristics one needs to keep in mind is:
The problem o f establishing the correctness o f com p ile rs f o r even reasonab ly expressive languages is undecidable
While in classical software systems, one could take the confidence of the designer, but in the context of critical embedded systems, this chance cannot be taken. For this reason, it is important to establish the equivalence of the high-level program and the object program through the notion of “ Translation Validation” introduced by Amir Pnueli. The principle is illustrated by Figure1. We built systems for Object Code Validation so that one can assure the correctenss of the systems on board a system (46, 47) for a safe subset of ADA for the i960 processor.

246
HLL T ranslafor
Translation ValidationQ b .ie c t Code V a lid a t io n
A (ttbsfracr)
CommonSemantic
Fromeiwi'k
Figure 1: Translation Validation
The approach of correct design advocated by us got a big boost with the axiomatic specification of programming languages by Tony Hoare in 1968. Significant amount of work followed by building methodologies with tool (invariant generators, theorem provers, model checkers etc.) supported programming environments. Later in 2008 Tony Hoare while assessing the contribution of his seminal paper, made the following remark “Success of a test,tests the Programmer and not Programs”. This is remarkable as he had been exposed to the problems of building large software systems, in particular at Microsoft. This brings out the role of good debuggers in building complex software. Our contribution in building debuggers for component development and integrated system development is summarized below:
(i) Starting from test generators to semantic debuggers is envisaged in (47,48,49) and issues o f garbage collection for embedded systems are addressed in (53, 54).
(ii) An architecture for debugging partially global address space languages like X10 that is needed over the new generation
multicore processors where one needs to debug thousands of processes and also address new issues like locality exceptions is addressed in (50,51).
(iii) While integrating systems from well- tested components, one encounters different class of issues that should be carefully documented and also addresses by non-classical manner. A platform to address to theses issues using machine learning approach is addressed in (52).
In building robust systems for E-commerce, there is an additional challenge to keep the information leaks under control relative to the threat model.Thus security engineering plays a vital role. Various systems relative to aspects depicted i n F i g u r e 2 w e r e d e v e l o p e d (82,83,84,86,87,88,89,90,103,104) covering aspects like designing crypto-pro toco l verifications, hardening OS for security, and built systems with secure protocols on tamper proof hardware dongles (i-buttons/cell phones) for secure e-transactions and c2B systems using random art; several of the e-authentication used had been demonstarted and prototyped using cell phones/hardware dongles like i-buttons.

247
PuWicK*y
I n f c a ^ r J c t u r c
C R Y P TPrimitives
T r a i b f > r - T r a c i n gscheme
SpeechBiometric
I n t e r f a c e s
S c H p t ln t j
C R Y P T 1 P r o t o c o l A n a l y s e s 1
<2Secure-Message ■,
System
Figure 2: Systems for E-Commerce
Unified Paradigm for the Design of Verifiable Complex Reactive Systems
With the proliferation and ever increasing power and complexity of embedded systems, design of verifiable systems continues to be a challenge. Methodologies like hardware-software co-design has remained paradigm for tradeoff between hardware and software. Synchronous systems, particularly circuit design is supported by a wide range of design automation tools, both at academic and industrial scales. Correctness of synchronous circuitsis very much dependent on the accuracy of the distribution of clocks. Hence, analysis and characterization of the clocks has been one of the priority areas of research in synchronous circuit design. With increases in clock frequency the design and correctness issues become very complex due to the underlying clock skews, power consumption and meta-stability.
On the other hand, asynchronous circuit design offers an alternative that does not have these problems due to the absence of a global clock. Further, it has the advantages of composability and robustness. However, it suffers from the lack of mature behavioral synthesis tools. Complex systems are intrinsically asynchronous and are built from logically synchronous components.
We addressed the challenges through:
1. Defining a novel programming paradigm called Communicating Reactive Processes or CRP(12,13,28,29) that unifies the capabilities of asynchronous and synchronous concurrent programming languages is described in with a view to specify complex reactive systems which usually have both synchronous and asynchronous features. The paradigm intutively extended the property of Esterel w id e ly a p p l ie d fo r sy n c h rn o us hardware/circuit design, namely, “What you prove is what you execute”.
A CRP program consists of independent loca lly reac tive E stere l nodes tha t communicate with each other by rendezvous communication as in Hoare's communicating sequential processes (CSP). A broad structure is shown in Figure 3. CRP faithfully extends both Esterel and CSP, and adds new possibilities such as precise local watchdogs on rendezvous. A CRP program consists of a network of Esterel reactive programsM, II... II M n or nodes, each having its own input /output reactive signals and its own notion of an instant. The network is asynchronous, and the nodes A is locally reactively driving a part

248
of a complex network that is handled globally by the netw ork. All choices can be im plem ented through Esterel. These frameworks have succinctly modelled distributed and VLSI systems(14,37). Spectrum of models that are effective in modelling from purely synchronous to hybrid systems that are combination of discrete and hybrid systems are shown below.
C R P
. 1 nifs insL SvBchnoin jod Axvncftltnrti
m u
fi' r rr" ■ 2vOUf| I ^ " ' ' [fciLSJ
&. 8trrv. £EK Shyjniojundji"
j T nurd CBjpK Sky-anipjundgr
■Bo:ar;rTo 'flAultidtKh Eat'
Figure 4: Spectrum of Synchronous + Asynchronous Variants
Realization l ayers
■ la y e r 0: Requirement Spoci Ilf niton',(. uiisnli tint Ini* u se r r tq a i r c n U n ti nnd n rc l i l t tc tu r i l CDDSlraiatf in to a fo rm a l S p r n
* Layer I: System Model & DesignMuddling, SirnulutiHK!, t i-stiii"- C(H!c ( ItntTiltnn.'Sinllittit, \ ( ritU'iliim
■ L ayer 2: Model to Executable ObjectsE x e c u ta b le o b je t 't> m id > !c n v ra ji< i| : o p r i r m A 'r f c o d ? for rvconn^uruhk1 i ir ch ito ln res , Validation ... W HAT YOU PROVE IS W HAT YOU EXECUTE
* n e tw o rk p H r a lm ^ m m n o n ^ t n o d es
• ESTBRFJj parallelism tfitliiu nodes
# r i ) l i l M l i l t l i f ;i1 in ill I i . - i i i " t O l l d ^ V * > i l H
• allows preemption at any stage Figure 3 : Structure of a CRP Program
2. The correctness of synchronous circuits is quite mature (40-44) but is very much dependent on the accuracy of the distribution o f c lo c k s . H e n c e , a n a ly s is and characterization of the clocks has been one of the im portan t areas o f research in synchronous circuit design. With increases in clock frequency the design and correctness issues become very complex due to the underlying clock skews, power consumption meta-stability etc. On the other hand, asynchronous circuit design offers an alternative that does not have these problems
Figure 5: Requirements to Realization
due to the absence of a global clock. Further, it has the advantages of composability and robustness. However, it suffers from the lack of mature behavioral synthesis tools while synchrnous design has mature tools for verifiable design. Aunification of such systems would have the advantages of both the classes, and thus leads to a scalable verifiable design. With this motivation, we came up with the Multiclock-Esterel that provides a unifed framework of globally asynchronous and locally synchronous systems. The framework envisaged in (15,36,37) for the multi-clock scenarios provides a general framework for the design of systems with multiple local clocks and asynchronous systems. Various possible combinations of synchrony and asynchrony are show n in F ig u re 4. The m ain characteristics are:
asynchronous channels synchronous nodes
I control threads

249
(i) Provides a generalized multi-clock generalization of Esterel. Such a generalization eliminates weaknesses of the of the module definitions of classical Esterel, permits parameterizing the clock of modules and context-independent suspension operators etc.
(ii) CRP proposed earlier is obtained as an in s ta n c e o f the new p a rad ig m . Furthermore, itpreserves the advantages of the synchronous monoclock Esterel paradigm, particularly that of verifiability of specifications /models.
(iii)Provides a unification of synchrony and asynchrony. This in turn leadsto modular s p e c if ic a tio n o f a sy n c h ro n o u s circuits/systems with multipleclocks. W ith such a b asis , con tro l path specification of hardware designcan be done in a modular way.
(iv)Provides a translation from Multiclock Esterel to classical Esterelat the cost of modularity.
(v) Provides a sound formal model for VHDL/VERILOGincludingtransport and inertial delays.
1. One of the main challenges lies in m odelling inform al specifications succinctly and in particular the capturing of fault tolerance systems. Our (Indo-French] effort in this direction has been summarized in the context of a gyroscope specifications in (55) and brought out the challenges from the perspective of languages.
2. We have enriched the reactive framework (45) providing a platform for the enablement of the integrated development o f processors, services, embedded sensors/actuators taking into account r e s o u rc e c o n s t r a in ts , p h y s ic a l parameterssuch as locations and clock time etc., using contextualawareness primitives as observables. This enables us to design
WSN as reactive framework and gain advantages.
In summary, our primary focus area has been to address the challenges in the various layers ranging from specifications to implementation as depicted in Figure 5.
Dec larat ive Programs: Execut ional Specification and CorrectnessThe success of logic programming is often attributed to its simple elegant declarative semantics and the clean separation of logic and control aspects with a broad viewpoint: Algorithm = Logic + Control. Owing to the clean separation of logic and control, a program can be written decalaratively by the programmer and executed procedurally by the computer(58). Yet another attraction of logic programming is the notion of logic variablesth&t leads to nice implementations of communication protocols like remote procedure calls, dynamic process migration etc., and makes logic programs suitable for concurrent programming. Two aspects that need careful attention in treating logic program specifications as executional specifications are the operation of unification which can often make the intuitive understanding of the program complex and the termination of the program. We successfully characterized using the results from term-rewriting systems. I wasextremely happy as one of our papers got the best paper award at a prestigious conference in London and the prize was given by Prof. Robert Kowalski, Imperial College of Science and Technology, who was actually the main champion advocate of the field of Logic Programming and was incidentally also the advisor for the Indian Knowledge Based Systems (Fifth Generation Computer Systems) Initiative from the Govt, of India. A brief summary of our contributions is given in the following:
A characterization of the termination property of logicprograms was realized (22,27,28)using the concept of unificationclosure. It was shown that a logic program terminates (in thestrong sense) if and only if its unification closure isfinite and contains no reflexive pair. The concept of unification closure is closely related to the notions

250
of forward chain and overlap closure in the term- rewriting literature, which have been used to characterize the termination of linear term rewritng systems. Since variables can be substituted only by function terms in logic programs, the linearity condition is not required for our result. It was also established that the condition based on the finiteness of unification closure for termination of logic programs is equivalent to the level mapping condition. Such an equivalence shows that the result is strong enough to compute every total recursive function. Our approach was strong enough to include selection rules for atoms in aclause used by a logic programming interpreter. The approachused to generate a term rewriting system whose termination isequivalent to a given logic program can be helpful in proving termination of logic programs using termination ordering- proposed in the term rewriting literature. Further, we proposed a methodology for proving termination of logicprograms. This was done by introducing the notion of U-graphs as an abstraction of logic programs and establish that SLDNF- derivations can be realized by instances of paths in the U- graphs.Such a relation enables us to use U-graphs for establishing the universal termination of logic programs. In our method, we associate pre- and post-assertions to the nodes of the graph and ordered assertions to select edges of the graph. With this as the basis, we developed a simple method for establishing the termination of logic programs.
A transformational methodology of transforming a given moded logic program to a rewrite system preserving termination characteristics was proposed (23,25,29,30) with the primary motivation to exploit the powerful techniques and the tools available for showing the termination of term rewriting systems. In fact, the method does not have restrictions such as those prescribed in other methods and the method has been used to show the termination of several benchmark programs and to prove the termination of prototype ProCoS compiler. One of the most interesting aspects of this method has been the mechanizability of the technique and the effective use of theorem provers such as RRL, REVE,
ORME etc. Apractical verification tool that helps in the development of provably correct compilers has been developed. The tool is based on the approach of proving termination of PROLOG- like programs using term-rewriting techniques and a technique of testing whether a given PROLOG program can be soundly executed on PROLOG interpreters without the Occur-check test. The tool has been built on top of the theorem prover, RRL (Rewrite Rule Laboratory).The tool is effective for compilers developed using Hoare's refinement algebra approach. The utility of the tool was illustrated(26) through a case study on correctness of a prototype compiler of the ProCos level 0 language PL0.
O u r e a r l i e r m e th o d w a s f u r t h e r extended(24,31)for proving termination of parallel logic programs such as GHC (Guarded Horn Clause) programs - the language developed at the institute of fifth generation computing systems in Japan. The method exploits the fact that unifications in GHC-resolution correspond to matchings. The method consists of three steps: (a) deriving moding information from the given GHC program, (b) transforming the GHC program into a term rewriting system using the derived moding information, and finally (c) proving termination of the resulting rewrite system. We show that the termination of the derived rewrite system implies termination ofthe given GHC program for a class of queries. The approach facilitates applicability of a wide range of termination techniques of rewriting systems in proving termination f GHC programs. Using the method, we have shown the termination of the termination of common benchmark GHC programs such as quick-sort ,merge-sort, merge, split, fair-split and append. We have also implemented the transformation as a front-end to RRL whic henables to prove the termination of GHC programs in an interactive fashion. Further, discuss how the method can be extended to other parallel logic programming languages such as Concurrent Prolog and Parlog.
Analysis of New Generation Programming LanguagesParallel programming languages have not been

251
able to address the issues of natural specification of parallel algorithms and handling of the architectural features to achieve performance concurrently. In other words, there is a large gap between programming languages that are too low level, requiring specification of many details that obscure the meaning of the algorithm, and languages that are too high-level, making the performance implications of various constructs unclear.
Thus, the main challenge is to bridge the gap betw een specifica tion and re a liz a tio n (implementation) that would preserve natural specification of programs and at the same time enable realization of efficient programs on different architectures. Due to the advancements of hardware architectures, complexities of software and the scalability requirements, the challenge reduces to deriving techniques that would enable realization of the intrinsic “parallelism" embedded in algorithms and programs. To scale up performance and a p p lic a tio n s , tra d itio n a lly , hardw are manufacturers used to increase the clock speed. As frequency scaling has hit a plateau, the solution to scale up performance or applications has been to realize/exploit parallelism. That is, parallelism scaling replaces frequency scaling as foundation for increased performance. Thus, parallelism will have profound impact on future software having the following challenges:
(i) On the hardware front, the limits of frequency scaling has led to newer architectures called many-core or multicore processors (informally chip multiprocessors). It may be noted that multi-cores have emerged as the dominant computing platform. Nearly all chip manufacturers have made the paradigm shift to focus on producing chips containing multiple processors or cores. It should be apparent that the architectural/hardware innovations further add to the challenges towards an effective computing platform for multicore processors.
(ii) Apart from concurrency, there is dire need
to look into the parameters like “locality” and new paradigms of programming for realizing performance and energy optimization; the latter needs to become a parameter for compilation as well.
(iii) In the context newer architectures of multi-core, programming is no longer completely independent of hardware architectures.
(iv) F u rth e r, the dem and fo r H igh Performance Computing is ever increasing not only for scientific applications but also for the huge demand for supporting cyber-physical infrastructures.
Architectural advances in system architecture andapplication demands have lead to a large deploymentof multi-core processors. Such major changes have spurred the developmentof new programming languages and programming systems. New class of languages have been designed keeping in view requirements of high performance, high productivity programming of parallel and multi-core computer systems. Some of languages that come into the forefront with such a rationale are X I0, UPC, Titanium, Fortress, Chapel, Co-Array Fortran, CUDA etc. Some of these languages follow structure partially global address space (PGAS) that are characterized bya fixed set of processeswith spawn sty le concurrency w ith b a rrie r synchmoization model, each with one or more threads of control having globally partitioned arrays; global arrays are distinct from local variab les and the com piler generates communication code for each access and thus has limited global synchronization calls, leading to better performance. The PGAS family is increasingly becoming significant with the advent of multicore. X I0 is one of the typical langauges of the PGAS family that is a modem object- oriented programming language designedfor high performance, high productivity programming of parallel and multi-core computer systems. A typical logical structure and the environment of execution are depicted in Figure 6.

X10 (Partial Global Address Space (PGAS))
X10 Data StructuresVirtual level: unbounded
resources p er place
SMP
f f f - W
i______ I L M " I
r d l t i m
t r - 1
u t m 1
X1Q places
. | Physical PEs
uniprocessor Cluster n*t* =l*t* *m
4)!VA q
U H ' » :Ac-vt' A l tci
-DCJ*IVi
; iJM l h
*
i ,
r K
b l.I fW . J^ --- L► V i n r - i k u i
w ysica t XHjnd&d* & s o u r c e s p e r p !
SWF Cluster
PT
tMefCMVttCt
Figure 6: XI0 Language and Host Machine StructureOne of the main drawbacks in the use of these new generation programming languages is the lack of analysis techniques and tools for efficient compiling, analysis for robustness along with scalable debuggers. Our focus of the work has been in this direction with contributions (51,52,55,59,60,61,63) whichis summarized below:
(i) We have arrived at new algorithms for M ay-Happen-in- Parallel (MHP) analysis that is applicable to the family PGAS programming languages. Our approach has offered the best of two worlds to parallelcompilers - higher- level abstractions of concurrency coupled with simple and efficient analysis algorithms that has been effectively used in compilers.
(ii) A new perspective on MHP analysis for PG A S lan g u ag es , sp aw n -s ty le
concurrency + barrier synchronization constructs, a la Clocks ofXIO, has been proposed integrating set-based analysis with phase interval analysis based approaches identifying MHP and refining it for compiler optimization.
(iii) Built a tool for checking whether the program is deterministic through Interference freedom tests, and proof systems for PGAS class of languages.
(iv) Extending the successful approach of single static assignment that has proved very successful in compilers for PGAS class of languages.
(v) Demonstrating that a good debugger for PGAS models needs refinements for stepping, new prim-itives such as schedule point, suspension of future
253
computations etc. The notion of schedule point enables the users to see the possible interleaving of the segment w ith other p lausib le concurrent fragments.
(vi) With the aim of safely exploiting such advanced architectures by m ultithreaded programs from the scheduler's perspective, we realized deadlock-free scheduling of X I0 programs on physical nodes with bounded computation, memory, and communication resources.
Scheduling Multicore Architecture blocks for Exascale ComputingThe E xascale com puting roadm ap has highlighted efficient spatial locality (affinity) oriented scheduling in runtime systems as one of the most important challenges of Concurrency and Locality Challenge. Massively parallel many core and distributed memory architectures have NUM A (non-uniform m em ory access) characteristics in memory behavior, which results in a large gap between the local and the remote memory latency. Unless efficiently exploited, this is detrimental to scalable performance. Modem parallel languages such as X10, Chapel and Fortress have built-in support for initial placement of threads and data structures in the parallel program. Therefore, spatial locality (also referred to as affinity) comes implicitly with the program. The run-time systems of the se languages need to provide efficient algorithmic scheduling of parallel computations with medium to fine grained parallelism.
For handling large parallel computations, the scheduling algorithm (in the runtime system) should be designed to work in a distributed fashion. Centralized scheduling algorithms suffer from unnecessary overheads and non-scalable performance, while distributed scheduling avoids these pitfalls. Further, the execution of the parallel computation happens in the form of a dynamically unfolding executiongraph. It is difficult for the compiler to always correctly predict the structure of this graph and hence perform correct scheduling and optimizations. This is especially
true for data-dependent computations where static analysis based optimizations in the compiler cannot help much for performance driven scheduling. Therefore, in order to schedule generic parallel computations and also to exploit runtime execution and data access patterns, the scheduling should happen in an online fashion. As the computation graph unfolds in time, the online scheduler has to make decisions dynamically on where (which place and processor) and when (order) to schedule the computations.
Moreover, in order to mitigate the communication overheads in scheduling lower data access and synchronization costs in the given parallel computation, it is essential to follow affinity inherent in the computation. Affinity is defined to be the relationship between a thread and the data structure on which that thread operates (reads/writes) upon. Such a data structure and the corresponding thread should be spatially located close to each other (as much as possible) to reduce the communication cost. This is especially true for large-scale computations on distributed memory architectures that involve scalable processing of petabytes to Exabyte's of data. In such large-scale computations movement of data itself becomes so costly that it becomes the key bottleneck to the overall performance and scalability of the parallel computation. Hence, it is critical to perform the computation and hence move the computation to where the data are placed in the system, instead of the traditional way of moving the data to the computation.
Further, the critical path of the scheduled computation is dependent on load balancing across the cores as well as on time and message complexity. Consider for example the UTS (Unbalanced Tree Search) benchmark where one needs to visit all nodes of a large random tree. In the binomial tree (tree expansion done using binomial distribution), typically used in the UTS benchmark, the depth of the tree is large while the breadth is small which leads to a challenging load balancing scenario for the scheduler. This is because, the scheduler needs to minimize the overheads while trying to maintain near perfect load balance across the compute nodes in the

254
system to ensure high parallel efficiency. Further, in order to achieve low scheduled critical path on the target system, the scheduler needs to ensure maximum overlap between computation and communication. The scheduler needs to adapt itself to the nature of the parallel computation and deliver best performance based on various aspects of the underlying parallel computation including tendency to have high load imbalance across the nodes, and computation to communication ratio. Further, the space i.e. main memory (and hence the power) consumed by the scheduler should be small enough to allow for large power-efficient computations. One critical challenge for large scale computing is to achieve low operational cost (including power consumption). This leads to the need for scheduling under bounded resources. Scheduling under bounded resources can lead to physical deadlocks due to cyclic dependency on the availability of the resources. Hence, under bounded resource constraints one needs an efficient distributed deadlock avoidance mechanism to ensure smooth progress. The mechanism of deadlock avoidance needs to be
such that it does not reduce the concurrency of execution as well as it should work with low overheads and without any centralized control. Simultaneous consideration of these objectives namely affinity, time, space and message complexity, along with constraints such as deadlock freedom in a multi-place setup make distributed scheduling a very challenging problem.
Our focus of our work with the above objectives has been the design and realization of a novel affinity driven distributed scheduling framework that optimizes for multiple objectives such as time, message, space complexity, affinity or energy etc. Our generic framework supports good trade-offs between affinity and load balance for maximal performance of data-dependent and irregular parallel computations. The principle of realization lies in mapping the computation graph or the execution graph, a typical structure of which is depicted in Figure 7, to the environment of realization shown in the previous figure:
■ N jLriffJr f i d i t
mMttipk U u i'jU lJc 1 P l l K C I w l ih i l l Ixffip-it
prstcejsam ptr place
S f c f P S M V i Ishki
(a ) ( b )
Figure 7: (a) Computation Graph, (b) Processor Structure
Some of the major contributions [59,61,65,66, 67,68,73,74,78] are summarized below:
(i) Realization of unconstrained space affinity driven distributed scheduling a lg o r ith m and e x p e r im e n ta lly dem onstra ting its low tim e and messagecomplexity. The experimental results are analyzed on multi-core cluster
(Blue Gene/P), many-core cluster (Intel cluster) and NUMA architecture, using real benchmarks in Heat, Molecular Dynamics and Conjugate Gradient (N A S p a r a l l e l b e n c h m a r k s , http://www.nas.nasa.gov/). Comparison of our algorithm with custom (handwritten) code (both implemented using hybrid programming model: MPI +
n
rJtymJw f tdg*

255
Posix Threads) demonstrates the low time and message complexity of our algorithm.
(ii) For constrained space per place, we realized an affinity driven, on-line, distributed scheduling algorithm with low time and message complexity. The algorithm controls the on-line depth-first expansion of the DAG to ensure low space complexity, as well as online breadth-first expansion of the DAG to ensure d istributed deadlock-free execution and ensure high processor utilization while maintaining low overheads.
(iii) A work-stealing scheduling that uses an elegant combination of topology-aware remote (inter-place) spawns and remote prioritized random work steals to reduce the overheads in the scheduler, and to dynamically maintain load balance across the compute nodes of the system, while ensuring affinity maximally. Further, we use d-choice randomized load balancing to improve the load- balance across the nodes (places)in the system .The LDS algorithm was implemented using GASNet API 6 and POSIX threads to enable asynchronous communication across the nodes and improve computation-communication and communication-communication overlap. Using well-known benchmarks such as CG (Conjugate Gradient), K m ean s c lu s te r in g an d H e a t [ABB00],we demonstrated superior performance and scalability of our algorithm (LDS)as compared to custom GASNet+Pthreads code on Blue Gene/P, MPP architecture(upto 2048 nodes). Further, for the UTS (Unbalanced Tree Search)benchmark, we delivered (a) Best parallel efficiency (92%) for the binomial tree as compared to best prior work, (b) around 98% parallel efficiency on 1 Trillion nodes (largest studiedso far by any prior work) for the geometric tree;and (c) upto 40% better performance
than Charm++ -- a system from UIUC.For the Conjugate Gradient benchmark we deliver around 2x or higher performance as compared to Cilk- NOW.
(iv) F o r a u to m a tic p a ra m e te r and performance tuning, we used distributed machine learning along with distributed scheduling, and showed its superior performance with low overhead with prior work on Blue Gene/P platform and demonstrated that ALDS has low overheads.
Behaviour Based Detection of MalwareMalware is increasingly becoming a serious threat and a nuisance in the information and network age. Current detection and remediation approaches are losing ground, because it is relatively easy for an adversary (whether sophisticated or not) to alter malware to evade most existingdetection approaches. Given trends in malware evolution, existing approaches (such as anti-virus (A/V) software and system patching) are becoming less effective. For example, malwarewriters have evolved strategies such as polymorphism, packing, and encryption to hidetheir signature from existing A/V software. Further, malware authors also strive to disableor subvert existing A/V software once their malware has a foothold on the target system.Emerging approaches such as behavior-based detection and semantic malware descriptions have shown promise and are deployed in commercial A/V software. However, newtechniques must be developed to keep pace with the development of malware. The focus of ourwork has been on arriving at behavioral detection of malware and provides an algorithmic basis rather than pure statistical approaches. Our major contributions (75,76,77,78,83,) are as follows:
(I) U s in g a s ta n d a r d b e n c h m a rk specification of programs, we have devised a method and system that can detect malware presence and provide either unobstrusive or obstrusive

256
methods to detect or spread. The method is resilient to program transformations that include compiler optimization transformations, state-of- the-art program obfuscation tools etc. The method is particularly useful for embedded systems.
(ii) Each anti-virus company needs to handle something around 30000 per day. Human experts have to extract (involves complex analysis of encrypted and/or packed binaries) a signature (usually a text pattern) of the malware and deploy it to protect against a malware. However, this approach does not work for polymorphic and metamorphic malware in general, which have the ability to change shape from attack to attack; also, metamorphic virus detection even assuming fixed length is NP-complete. To counter these advanced forms of malware, we need semantic signatures which capture the essential behaviour of the malware which remains unchanged across variants. Note that the signature need not capture all the activities of the malware.
However, knowledge of all the activities of a malware is needed to disinfect (wherever possible) systems already infected by the m alware. In this paper, we present an algorithmic approach for extracting semantic signatures of malware as a regular expression over API calls and demonstrate via experiments its efficacy in detecting and predicting malware variants.
Recently, complex malwares like Stuxnet, Flame etc., have specifically targeted SC AD A o f pub lic in fra s tru c tu re s like pow er grids/plants, and thus, bringing to the forefront the challenges in securing and protecting SCADA. These malwares are horrendously complex complex and hence, need a wholesome approach for detection and protection. In these scenarios, apart from the classical IT security, there is a need to look at other plausible new attacks considering the domain of the physical
systems in conjunction with the capabilities of the embedded computers, and arrive at methods of protection and risk evaluation. We have arrived at an algorithm ic data-intensive approach (referred to as Bigdata approach) for protecting and securing SCADA from malware attacks. The approach is based on using the data used by control-system designers for making the system robust, and then reducing the security and protection problem of control systems or SCADA, in general, to the problem of monitoring distributed streaming data. We have demonstarted that the method is algorithmically scalable and argue that such algorithmic Bigdata approaches enable securing and protecting of IT controlled public infrastructures.
Security as a Basic Design PrincipleWith the explosion of information, it has become essential for the trusted information systems to interact with to untrusted systems, particularly with the promotion of cloud computing. In fact, building secure applications from mostly untrusted code by using information flow control to enforce data security is a challenge. For example, enforcing data security policy when executing untrusted code with access to sensitive data is important as an untrusted application may be able to read some sensitive data, but it should never be able to surreptitiously export this data from the system. Thus, it has become essential to avoid information leaks and protect systems from information adulteration. While there is a spectrum o f good access/au thorization mechanisms available, the existing security models do not cater to the challenges. One of the main reasons for this has been the lack of models that provide a robust unification of mandatory access control (MAC) and discretionary access control (DAC) of information. In the context of networked distributed systems, it becomes further necessary to broaden the scope to include the control of information flow between the distributed nodes on a system-wide basis rather than on an individual basis. It may be noted that different data manipulated by an application have different security requirements. A unified security model is indeed the need of the hour for assuring

257
the security o f the operating system s, programming languages, virtualization, web interaction etc. We have arrived at a novel security model that provides succinct information flow control across the stakeholders of the system consisting of various subjects and objects that are distributed system-wide, through the basic actions of read and write. Our model captures the subtle way the information gets disseminated in the system after the resource is accessed in an authorized way, and leads to succinct definitions of information flow policies with respect to security, privacy and other legal requirements.
We have started looking at the foundational security models like the Bell la Padua, Biba, Chinese wall model, lattice flow model, decentralized information flow model, etc., and analyze their potential flaws and arrive at a model that would provide a sound basis secure design of systems. We have arrived(79, 105)at a novel security model called Readers-Writers Flow Model (RWFM) - for decentralized information flow control taking into account both the readers and the writers of information, which is essential for a proper tracking of any flow property. The proposed label system enables intuitive specification of policies, and supports the discretionary controls required for practical applications in a manner so as to preserve the mandatory nature of the flow control. Labels explicitly identify possible readers and writers of information and can be automatically inferred from the natural language specifications. The RWFM is application independent and can be applied to study any information flow property (confidentiality, integrity, privacy etc.). the RWFM provides a clean semantics of information flow; combines well with the discretionary access control (DAC) and also supports information downgrading (declassifying) and relabeling. It further provides a clean executional model to realize the multi-level security systems for which checking compliance with respect to security andprivacywill become natural.
For securing an information system using RWFM, the first step is to specify the desired security policy. This is achieved by assigning labels to all the subjects and the objects of the system depend ing on the a p p lica tio n
requirements.Our work has shown that the model is better suited for the design, reasoning and analysis of the practical information systems.
(i) Information systems encountered in practice allow information flow in both directions i.e., subjects are allowed to take information from the system and also to provide new information to the system. Models developed hitherto are limited in their ability to accurately handle this bidirectional flow.
(ii)For building practical information systems, a robust unification of mandatory access control (MAC) and discretionary access control (DAC) is essential. Existing models' support for discretionary controls is orthogonal to the Information Flow Control (IFC) and thus defeats the purpose of the mandatory controls.
Earlier models treated confidentiality and integrity as orthogonal, and hence led to ad hoc realizations of compliance. The RWFM model satisfies the principles of full information and canonical international specification. To sum up, our model allows a clean unified model, thus leading to performance centric verifiable systems.There is a general feeling that securing systems in the cyberspace is not working. In fact, some high-profile problems with successful attacks from organizations has made the community desperate and would like to try afresh the security from a new and different perspective. Thus, there is a need to take a very radical approach in wanting to re-think everything: the languages, the operating system, and even the hardware, as well as an emphasis on formal methods for trying to gain some assurance. Our work has shown a promise to contribute in this direction, and an operating system is being designed using the above model.
ConclusionBest Theory is Inspired by Practice and
Best practice is inspired by Theory Donald E. Knuth, Turing Laureate

258
In this write-up, I have highlighted how formal models with good abstractions lead to robust design that could be analyzed mathematically/ formally using either automatic or semiautomatic systems using the principles of separation of concerns, and thus conquer com plex ity th rough the p rin c ip le s o f compositionality. In fact, there has been an argument that security is not a separable concern. We have sketched how a proper security models could overcome such notions.
Let me highlight two principal challenges facing the community, particularly in India:
(i) It is a well-known fact that the cost of errors in software has cost over 100 billion dollars, majority of which is borne by the users. Further, failure counts have been a major bottleneck for the release of software. Thus, it is important to arrive at soundformal methodologiesthat support the use of “Experience, Judgment, and Intuition of Program mers” in building useful, e f f i c ie n t a n d n e a r ly c o r r e c t programs/systems with sound, and efficient interactive tools. In other words, the formal methods should support these crucial aspects. Tony Hoare who says “Success of a test, tests the Programmer and not Programs”, reflects the underlying e n g in e e r in g v iew in b u i ld in g programs/software. From the established grand challenges, we can assert as follows:
What we have : how to describe what programs do, how they do it, and why they work, applied kno - whow for the design, development of (i) simple programs with manual verification, (ii) moderate size used in critical applications and verify them semi-automatically
W hat we need:Adapting to newer a rch itec tu res Scalable autom atic verification for extending the benefits of this technology.
(ii) In recen t y ears , the u n d erly in g framework of mathematical/analytical methods widely used in Computer Science has been lifted up under a general term “Computational Thinking” by Jeannette M. Wing from Carnegie Mellon University to reflect the general issue of solving of problems, designing systems, and understanding human behaviour drawing the lessons of the foundations of Computing. Looking at the impact the field of Computing has made on Science, Technology and Society already, it is needless to say that there is certainly a dire need for looking at the basic scientific questions of computing in the context of the scaling up science discoveries and the demands of the society. This in turn brings up endeavour of incorporating the science of computing in all walks of life Science, Technology and Complex Societal systems. It is indeed a challenge to bring out such a needed education challenge which shall surely show results in the years to come, and would have huge impact on Science and Society.
AcknowledgementsI am thankful to the INAE for considering me for the prestigious Prof. SN Mitra award.
It is indeed a great pleasure to thank my teachers, collaborators, students, and interns who have played key roles in my career. I am greatful to Prof. R. Narasimhan from TIFR, who was responsible for moulding my career at TIFR and to Professors B.L. Deekshatulu, V. Rajaraman, N. Vishwanadham who have provided continuous encouragement and support throughout my career. I am really grateful to several of my scientifc mentors: Professor Edsgar W. Dijkstra, Turing Laureate with whom I was an International Research Fellow at Eindhoven University of Technology, The Netherlands for the year 1978- 79 which changed my perception of the field and research; Professor Willem-Paul de Roever who has been responsible for the initial guidance for
Jeannette M. Wing, Computational Thinking and Thinking about Computing,Philosophical Transactions: Mathematical, Physical and Engineering Sciences, Vol. 366,No. 1881, From Computers to Ubiquitous Computing, by 2020 (Oct. 28, 2008), pp. 3717-3725, Published from Royal Society.

259
research on concurrency and encouragement provided over the years; Dr. James W. Thatcher, one of the first advocates of Abstract Data Types for showing the generality of computing for problem solving. I am also thankful to Prof. CAR Hoare -Turing Laureate, Prof WA Wulf - Former President of US NAE, Prof. Robin Milner- Turing Laureate, Prof. Willem-Paul de Roever, State University of Utrecht, and Dr. Lesley Lamport - Turing Laureate, whose advanced courses at TIFR under a United National Development Program m e opened the ch a llen g es in programming and moulded the career of several people in India including me. I am grateful to Prof. Amir Pnueli - Turing Laureate, whose encouragement and support provided inspiration to several of my works.
My whole-hearted thanks go to TIFR for providing an excellent environment, and support all these years along with generous support from the funding agencies like DST (IFCPAR, ITPAR), DEITY, DAE, and several bi-national programmes like Indo-US, Indo-French, Indo- Italy, Indo-Australia etc.
ReferencesRK Shyamasundar, W.P. deRoever, R. Gerth, R. Koymans, S. Arun-Kumar, Denotational Sem antics for Real-Tim e Program m ing Constructs, Proc. Logics of Programs, Lecture Notes in Computer Science, LNCS 193, Springer-Verlag, New York ,1985.
R. Koymans, RK Shyamasundar, W.P. deRoever, R. Gerth, S. Arun-Kumar, Compositional Sem antics for R eal-T im e D is tr ib u te d Programming Language (with), Information and Computation, Vol.79 , No.3, December 1988, pp 210-256.
RK Shyamasundar, K.T. Narayana, and T. P itassi, Semantics for Nondeterm inistic Asynchronous Broadcast Networks, Proceedings of 14th International Colloquium on Automata, Languages, and Programming (ICALP), Karlshrue, July 1987. Springer-Verlag, LNCS, 267:72-83,1987.
RK Shyam asundar, P ro o f System for Communication Complexity of CSP Programs, International Conference on Parallel Processing and Applications, L'Aquila, Italy, September 1987.
RK Shyamasundar, KT Narayana and T. Pitassi, Semantics of Non deterministic Asynchronous B roadcast N etw orks, Inform ation and Computation, 104, pp. 215-252, June 1993.
LY Liu, and RK Shyamasundar, Static Analysis of Deadlock, Distributed Termination, and Timing Properties in Real-Time Distributed Programs, in Decentralized Systems edited by M. Cosnard and C. Girault, Elsevier Science Publishers B.V. (North-Holland), IFIP, pp. 411- 426,1990.
LY Liu and RK Shyamasundar, Static Analysis of Real-Time Distributed Systems, IEEE Trans on Software Engineering, SE-16, April 1990, pp. 373-388.
AK. Bhattacharjee, SD Dhodapkar and Sanjit Seshia , RK Shyamasundar, A graphical environment for the specification and verification o f reactive system s, 18th International Conference on Computer Safety, Reliability and Security (SAFECOMP'99), Toulouse, France. LNCS vol. 1698, Sept. 1999, pp. 431-444.
LY Liu and RK Shyamasundar, Exception Handling in RT-CDL, Computer Languages, Vol. 15, No. 3, pp. 177-192,1990.
RK Shyamasundar J. Hooman and R. Gerth, R easo n in g o f R eal-T im e D is tr ib u te d Programming Languages, 5th Int. Workshop on Software Specification and Design, Pittsburgh, May 1989, pp. 91-99.
RK Shyamasundar and L.Y. Liu, Compositional priority specification in real-time distributed systems, SADHANA -Journal of the Engineering Sciences oflASc, Vol. 17, Part I, pp. pp. 75-93, March 1992.
G. Berry, S Ramesh and R.K. Shyamasundar,

260
Communicating Reactive Processes, 20th ACM Symp. on Principles of Programming Languages, Charleston, South Carolina, Jan 11-13, 1993, pp.85-99.
RK Shyamasundar, S. Ramesh, Languages for R eactive Specifications: Synchrony Vs Asynchrony, Int. J Foundations of Computer Science, Vol 11,2 (2000), pp 283-314.
Basant Rajan and RK Shyamasundar, Modelling D is t r ib u te d E m b e d d e d S y s te m s in MulticlockEsterel, FORTE/PSTV Conference 2000, North Holland Publ. Co., pp. 301-320, Oct2000.
RK Shyamasundar and S Ramesh, RealTime Programming Languages: Specification and Verification, World Scientific Publishers, Singapore, Nov 2009, ISBN-13 978-981-02- 2566-7,
RK Shyamasundar and J.W. Thatcher, Language Constructs for Specifying Concurrency in CDL, Software Engineering 86, Southampton, U.K., September 1986.
RK Shyamasundar and J.W. Thatcher, Language Constructs for Specifying Concurrency in CDL, IEEE Transactions on Software Engineering, Vol 15,8, pp 977-993, August 1989.
RK Shyamasundar and L.Y. Liu, RT-CDL: A distributed real-time design language and its operational semantics, Computer Languages, 20, l,pp. 1-23,1994.
Kamal Lodaya and RK Shyamasundar, Proof Theory of Exception Handling in a Tasking Environment, Acta Informatica, 28, pp. 7-41, 1990.
N. Raja and RK Shyamasundar, Combinatory Formulations of Concurrent Languages, ACM Transactions on Programming Languages and Systems, Vol. 19,6 (Nov. 1997),pp. 899-915.
N. Raja and RK Shyamasundar, The Quine- Bernay's Com binatory Calculus, Int. J.
Foundations of Computer Science, Vol. 6, No. 4 (1995), 417-430.
Bal Wang and RK Shyamasundar, Methodology for proving the termination of logic programs, Journal of Logic Programming, Vol. 21, 1, August 1994, pp. 1-30.
MRK Krishna Rao and RK Shyamasundar), Unification-Free Execution of Well-Typed Prolog Programs, Int. Static Analysis Symposium (SAS 95), LNCS, 983, Springer-Verlag, pp. 243-260.
MRK K rishna Rao, D. Kapur, and RK Shyamasundar, Proving Termination of Guarded Horn Clause Logic Programs, J. New Generation Computing, 15,pp. 293-338,1997.
M R K K r is h n a R a o , D. K a p u r , RK Shyamasundar, A transformational methodology for proving termination of logic programs, Journal of Logic Programming, Vol 34(1), pp. 1— 42, Jan 1998.
MRK Krishna Rao, P. Pandya, and RK Shyamasundar, Verification Tools in the development of Provably Correct Compilers, Proc. Formal Methods Europe, LNCS, 670, pp. 442-461, April 1993.
Bal Wang and RK Shyamasundar, and Bal Wang, Methodology for Proving the Termination of Logic Programs, 8th Symposium on Theoretical Aspects of Computer Science (STACS) 91, Hamburg, Feb. 14-16, 1991, LNCS, Springer Verlag, Vol. 480, pp. 214-221.
Bal Wang and RK Shyamasundar, Towards a Characterization of Termination of Logic Programs, 2nd Int. Workshop on Programming L anguage Im plem entation and Logic Programming, Linkoping, Sweden August 1990, LNCS, 456, pp. 203-221.
RK Shyamasundar, MRK Krishna Rao and D. Kapur Rewriting concepts in the study of termination of logic programs, 4th Int. Conf. on Logic Programming (ALPUK 92), London, March 30- April 1 1992; W orkshops in

261
Computing (edt. by K. Broda), Springer-Verlag, pp. 3-20, October 1992.
M RK K rishna Rao, D K apur and RK Shyamasundar, A transformational methodology for proving termination of logic programs, presented at the Conference on Computer Science Logic, Berne, 7-11 October 1991, Extended version in LNCS, 626, pp. 213-226, Springer Verlag, 1992.
M RK K rishna Rao, D K apur and RK Shyamasundar, Proving Termination of GHC Programs, Proc. of the 10th Int. Conf. on Logic Programming, Budapest, pp. 720-736, M.I.T. Press, Cambridge, June 1993
LY Liu and RK Shyamasundar, Static Analysis of Real Time Distributed Systems, Symposium on Formal Techniques in Real-Time and Fault Tolerant Systems, Warwick, UK, LNCS 331,134-137, September 1988.
LY Liu, and RK Shyamasundar, RT-CDL: a Real-Time Design Language and its Semantics, 11th World Computer Congress, IFIP 89, San Francisco, August 1989, pp. 21 -26.
Raja N. and Shyamasundar R.K., A Closer Look at Constraints as Processes, Information Processing Letters, 98, No. 5 pp. 206-210,2006.
Raja N. and Shyamasundar R.K. Actors as a C o o rd in a tin g M odel o f C om puta tion , Informatica, 30, No. 4, (2006).
B asant Rajan and RK Shyam asundar , MulticlockEsterel: An Asynchronous Framework for Asynchronous Design, Int. conf. Parallel and Distributed Processing Symposium (IPDPS), Cancun, Mexico, May 2000, pp. 201 -209.
Basant Rajan and RK Shyamasundar, Modelling VHDL in MulticlockEsterel, IEEE Int Conf. on VLSIDesign, Calcutta, 3-7 Jan 2000,pp. 76-83.
BasantRajan and RK Shyamasundar, Networks o f Preem ptible Reactive Processes: An Implementation, International Conf on High
Performance Computing (HiPC), New Delhi, December 1995, pp. 28-35.
Basant Rajan and R.K. Shyamasundar, An implementation of Communicating Reactive Processes, to be presented at IASTED- PDCN'97, Int. Conf. on Parallel and Distributed Computing and Networks, Singapore, August 1997.
RK Shyamasundar and S. Ramesh,, Languages for Reactive Specifications: Synchrony Vs Asynchrony, Proc. of the Symposium on Formal Techniques in Real-Time and Fault Tolerant Systems, LNCS, 863, Springer Verlag, Sept. 1994,pp. 621-640.
RK Shyamasundar, F Doucet, RK Gupta and IH Kruger, Compositional Reactive Semantics of SystemC and verification with RuleBase, Proc. of Next generation Design and Verification methodologies for Distributed Embedded Control Systems, Bangalore, Jan 2007, Springer Verlag, pp. 227-242.
F Doucet, RK Shyamasundar, I Krueger, R Gupta, Reactivity in SystemC Transaction Level Models, Presented at Haifa Verification Conference 2007, Oct 2007, Final paper in LNCS: Hardware and Software Verification and Testing, 4899, Springer Verlag, pp. 34-50,2008.
R Cavada, A Cimatti, A Franzen, K Kalyan, M Roveri and RK Shyamasundar, Computing Abstractions by Integrating BDDs and SMT Solvers, IEEE Conference on Formal methods in Computer Aided Design (FMCAD), Austin, Nov 2007, pp. 69-84.
Frederic Doucet, Rajesh Gupta, I.H. Krueger and RK Shyamasundar, Compositional Interaction Specifications for System C, ACM/IEEE MEMOCODE, Napa Valley, July 2006
RK Shyamasundar and Rajesh Gupta, Reactive Framework for Resource Aware Distributed Computing, ASIAN 04, LNCS 3321, pp. 452- 467, Springer Verlag, Dec 2004.

262
AK Bhattachaijee, SD Dhodapkar, Basant Raj an and RK Shyamasundar, System for Object Code Validation, FTRTFT 2000, LNCS, 1926, pp. 152-169.Sept2000.
V. Murali and RK Shyamasundar, A Sentence Generator for A Compiler for PT: A Pascal Subset, Software Practice and Experience, 13:857-869,1983.
Rohit Kundaji and R.K. Shyamasundar, Refinement Calculus: A Basis for Translation Validation, Debugging and Certification, Theoretical Computer Science, 354, pp. 153-168, (2006).
R ohit K undaji and RK Shyam asundar, Development of Semantic Debuggers based on Refinement Calculus, 20th Int. Conf. on Logic Programming (ICLP), Sept. 2004, LNCS 3132, pp. 460-461.
Shivali Agarwal and R K Shyamasundar, Debugging PGAS Languages: Challenges and Approaches, Workshop on Asynchrony in the PGAS Programming Model, in Int. Conference on Supercomputing, NY, June 2009
Shivali Agarwal, RajkishoreBarik, V. Krishna Nandivada, Rudrapatna Shyamasundar and PradeepVarma. Static Detection of Place Locality and Elimination of Runtime Checks, 6th Asian Symp. On Programming Languages and Systems, APLAS 2008, Bangalore, LNCS 5356, pp. 53- 74.
M angala G au ri, S a tish C hand ra , RK Shyamasundar, Khasiana: A tool-transparent, feedback-driven, adaptive method and apparatus for providing Static-Code-Analysis as a Service, IBM USP, IN920008013 8US1,2008
Pradeep Varma, H arsh it Shah and RK Shyamasundar, Method for Protecting User Managed Memory using exception model, IBM USP, IN920090078US1,2008.
Pradeep Varma, Harshit Shah and RK Shyamasundar, Backward-compatible constant
time exception-protected memory, Int. Conf. on Foundations of Software Engineering, ACM SIGSOFT Symposium on the Foundations of Software Engineering (FSE), August 24-28 2009, Amsterdam, The Netherlands.
Harshit Shah, RK Shyamasundar, PradeepVarma, Concurrent SSA for Concurrent Generalized Barrier Synchronization Languages, IPDPS 2009, Rome, May 2009
F. Maraninchi, N. Halbwachs, P. Raymond, C. Parent, and RK Shyamasundar, Specification and Validation of Embedded Systems: A Case Study of a Fault-Tolerant Data Acquisition System with Lustre Programming environment, CSI J. of Computing, Vol., No.4,Pp.7:69-85,2013.
Shivali Agarwal, and R.K. Shyamasundar, A Proof System for a PGAS Language, In D. Dams, U. Hannemann, M. Steffen (Eds.): LNCS 5930, pp. 162—184. Springer, Heidelberg (2010).
R. Ramanujam and RK Shyamasundar, Process Specification of Logic Programs, 4th FSTTCS, LNCS, 181, Springer-Verlag, 1984.
Shivali Agarwal, RajkishoreBarik, Dan Bonachea, V ivekSarkar, R udrapatna K Shyamasundar and Katherine Yelick Deadlock- Free Scheduling of X I0 Computations with Bounded Resources:. Proceedings of the nineteenth annual ACM symposium on Parallel algorithms and architectures, San Diego, California, USA, Pages: 229 - 240, June 2007
Shivali Agarwal, Rajkishore Barik, Vivek Sarkar, RK Shyamasundar, May Happen-in-Parallel Analysis of X I0 programs, 13th ACM SIGPLAN Symposium on Principles and Practice of Parallel Programming , February 20- 23,2007, Salt Lake City, Utah.
Shivali Agarwal, Narang, and Rudrapatna K. Shyamasundar, Distributed Scheduling of Parallel Hybrid Computations, 20th Int. Symposium on Algorithms and Computations ISSAC), Hawaii, Dec 2009, LNCS, 5878, Springer Verlag, pp. 1144-1154.

263
SB Joshi, RK Shyamasundar, A New Method of MHP Analysis for Languages with Dynamic Barriers, IEEE IPDPS High-Level Parallel P rogram m ing M odels and S upportive Environments (HIPS), Shangai, pp.514-521, May 2012.
Monica Gupta, Shivali Agarwal and RK Shyamasundar, Automatic Checkpointing and Role Based Realization of Software Transactional Memory, US patent IN920090012US1,2009.
Pradeep Varma, H arsh it Shah and RK Shyamasundar, Concurrent Static Single Assignment for General Barrier Synchronization P rog ram m ing L an g u ag es , IB M U SP, IN9200900038US1, 2009
Ankur Narang, Abhinav Shrivastav, RK Shyamasundar, Dynamic Distributed Scheduling Algorithm for State Space Search, Europar 2012 Parallel Processing, August 2012, pp. 141 -154
Ankur Narang, AbhinavSrivastava, Naga Praveen Kumar Katta, Rudrapatna K. Shyamasundar: Performance driven multi-objective distributed scheduling for parallel computations. Operating Systems Review 45(2): 14-27,2011.
Ankur Narang, Rudrapatna K. Shyamasundar: Performance driven distributed scheduling of parallel hybrid computations. Theoretical Computer. Science 412(32): 4212-4225,2011.
Ankur N arang, A bhinavShrivastav, RK Shyamasundar, Dynamic Distributed Scheduling Algorithm for State Space Search, Europar Parallel Processing 2012, August 2012, pp. 141- 154.
R.K. Shyamasundar and ShivaliAgarwal, Distributed Phase Synchronization of Dynamic Set of Processes, Twenty-Eighth Annual ACM SIGACT-SIGOPS PODC, Calgary, Canada, August 2009
Shivali A garw al, R ajkishoreB arik , RK Shyamasundar, A Static Characterization of Affinity in a Distributed program, IEEE IntConf
on H igh Perfo rm ance C om puting and Communication, Dalian, China, Sept 2008
T.S. Deepthi, RK Shyamasundar and N GopalakrishnaKini, May-Happen-in-Parallel Analysis of Java Programs, LAP, 2013.
S h iv a li A garw al, A nkurN arang , R.K. Shyamasundar: “Systems and Methods for Affinity Driven Distributed Scheduling for Parallel Computations”, US 2011/0099553 (Filed: 2009).
Shivali Agarwal, AnkurNarang, Rudrapatna K. Shyamasundar“Distributed Scheduling of Parallel Hybrid Computations”,20thISAAC 2009 LNCS, 2009
Ankur Narang and RK Shyamasundar , Affinity Driven Distributed Scheduling Algorithm for Parallel Computations, ICDCN 2011, LNCS, 6522, Springer Verlag, pp. 167-178
N. V. Narendra Kumar, Harshit Shah, R. K. Shyam asundar. Benchm arking Program Behaviour for Detecting Malware Infection, European Institute of Anti Virus Research (EICAR) Conference 2010. May 2010, pp. 69-91
N. V. Narendra Kumar, Harshit Shah, R. K. Shyamasundar. Can We Certify Systems for Freedom From Malware, Int. Conference on Software Engineering (ICSE) 2010, New and Emergent Research, Cape Town, South Africa, pp .175-178.
N arend ra K um ar, R K S, G S eb astian , SauravYashashwee, Algorithmic Detection of Malware via Semantic Signatures, European Association of Anti Virus Researchers (EICAR) Conference, 7-10May2011,Krems, Austria,pp. 49-76
R.K. Shyamasundar, Security and Protection of SCADA: A Bigdata Algorithmic Approach, Invited Keynote Paper, Proceedings of 7th ACM Security in Information and Networks (SIN 2 0 1 3 ) , h t t p : / / d l . a c m . o r g / c i t a t i o n . cfm?id=2523514, Dec 2013

264
N.V. Narendra Kumar and RK Shyamasundar, Realizing Purpose-Based Privacy Policies Succinctly via Information-Flow Labels, to appear in the 3rd IEEE International Symposium on Privacy and Security in Cloud and Big Data (PriSec), Sydney, Dec 6-8 2014.
Harshit Shah, RK Shyamasundar, PradeepVarma, Concurrent SSA for Concurrent Generalized Barrier Synchronization Languages, IPDPS 2009, Rome, May 2009
Jha S. and Shyamasundar R.K., Adapting Biochemical Structures for Distributed Model Checking, Transactions on Computational system Biology, VII, pp. 107-122, Springer Verlag, 2007.
Patil V.T. and Shyamasundar R.K., E-coupons: An Efficient, Secure and Delegable Micropayment System, Information Systems Frontiers, 7,No. 4/5,pp. 371-389, Springer Verlag, (2005).
Harshit Shah, RK Shyamasundar, On Run-time Enforcement of Policies, Asian 2007, December, LNCS, 4846, pp. 268-281 (2007). Springer Verlag, 2007
VishwasPatil, RK Shyamasundar, Alessandro Mei, Security and Privacy in a Collaborative Environment: PKI and Access Control, VDM Verlag, 2012
AK Bhattacharjee, SD Dhodapkar, Sanjit Seshia and RK Shyamasundar, A graphical environment for the specification and verification of reactive systems, Journal of Reliability Engineering and System Safety, Vol. 71 (3) 2001, pp. 299 - 310
KC Anand and RKShyamasundar, Formal Verification of Activity based specification of protocols, J. Parallel and Distributed Computing, 60,639-676,2000
VS Borkar, Mehul Dave and RK Shyamasundar, Design and Implementation of SeTiA: Secure Multi Auction System: I: Auction Mechanisms, Journal of Intelligent Systems, Vol 14, l,pp 45-68,2005.
S Borkar, Mehul Dave and RK Shyamasundar, Design and Implementation of SeTiA: Secure Multi Auction System: II: Architecture and Implementation Issues, Journal of Intelligent Systems, Vol 14,1, pp. 69-93,2005
Neelima Arora and RK Shyamasundar, UGSP: Secure key establishment protocol for ad hoc network, Proceedings ICDCIT 2004, LNCS 3347, pp. 391 -400, Springer Verlag, Dec 2004
Neelima Arora and RK Shyamasundar, PGSP: A Protocol for Secure Communication in Peer- t o - P e e r S y s t e m , I E E E W i r e l e s s Communications & Networking Conference, WCNC, New Orleans, USA, 2005.
N. Raja, RK Shyamasundar, Actors as a C o o rd in a tin g M odel o f C om puta tion , Informatica,30,4,2006.
N. Raja, R K Shyamasundar, Type Systems for C o n c u r re n t P ro g ra m m in g C a lc u l i , INFORMATICA, Volume 27, 4, December2003,pp.433-443.
L. K aze ro u n i, B asan tR a jan and RK Shyamasundar , Mapping Linear Recurrences onto Systolic Arrays, Int. J. of High Speed Computing, Vol. 8,No.3., 1996, pp. 229-270.
RK Shyamasundar and L.Y. Liu, Compositional priority specification in real-time distributed systems, SADHANA -J. of the Engineering Sciences of Indian Academy of Sciences, Vol. 17, I, pp. 75-93,1992.
RK Shyamasundar, A Correctness Proof for the M ajority Consensus Algorithm (with A. Ravichandran), Information Sciences, 38(3):213- 227 (June 1986).
RK Shyamasundar, A Simple Livelock-Free Algorithm for Packet Switching, Science of Computer Programming, 4:249-256 (1984).
RK Shyamasundar, Algorithms for Constructing Hierarchical Graphs (with E.V. Krishnamurthy), IEEE Tr. Systems, Man and Cybernetics, SMC- 4:459-461 (1974)

265
RK Shyamasundar, Boolean/Matrix Method for the Construction of Hierarchical Graphs, IEEE Tr. Systems, Man and Cybernetics, SMC-8:132- 133(1978).
RK Shyamasundar, Analyzing Cryptographic Protocols in a Reactive Framework, VMCAI2002, Venice (Jan 2002), LNCS, 2294, Springer Verlag, pp. 46-64., 2002
Rak Kishore Barik, ShivaliAgarwal and RK Shyam asundar, C om pile tim e affin ity computation framework devices and Methods, IBM USP, IN 920007099US1,2008
Pradeep Varma, RK Shyamasundar, Concurrent Static Single Assignment for General Barrier Synchronization Programming Languages, IBMUSP, IN9200900038US1, 2009
A Gupta, ShivalAgarwal and RK Shyamasundar, Automatic Checkpointing and Role Based Realization of Software Transactional Memory, US patent IN920090012US1,2009
BS Prasanna and RK Shyamasundar, Federated Two-Factor Identity & Risk Management Ecosystem, 3 Indian patents filed, 2007 (with TCS).
Basant Rajan and RK Shyamasundar, Unified Content and Platform Delivery, Indian Patent applied, 2009 (with Coriolis, Pune)
NV Narandra Kumar and RK Shyamausndar, A Decentralized Information flow Security Model for Multilevel Security and Privacy Domains, International Patent filing in progress, 2014
Nihita Goel, N. V. Narendra Kumar, R. K. Shyamasundar: SLA Monitor: A System for Dynamic Monitoring of Adaptive Web Services. 2011ECOWS 2011:109-116
Harshit Shah, RK Shyamasundar, On Run-time Enforcement of Policies, Asian 2007, December, LNCS, 4846, pp. 268-281 (2007). Springer Verlag, 2007
Anup Bhattacharjee, RK Shyamasundar, Choreography = Orchestration with Scripts + Conversations, Int IEEE Conference on Web Services (ICWS), Beijing, China, Sept 2008
Anup Bhattacharjee, RK Shyamasundar, ScriptOrc: A language to model service choreography, IEEE Asia-Pacific Services C om puting C onference (A PSC C 2008) December 9-12,2008, Yilan, Taiwan.
K. Kalyanasundaram, RK Shyamasundar, Verification of Clock Synchronization in TTP,2006, In Formal Models, Languages and A pplications (Eds. K.G. Subram anian, K.Rangarajan& M. Mukund) Series in Machine Perception &Artificial Intelligence, Vol. 66,2006, pp. 176-195, World Scientific Pub.
Shashank Shekhar, R. K. Ghosh, R. K. Shyamasundar: Postorder Based Routing and Transport Protocol for WSNs, Journal of Pervasive and Mobile Computing, 11,229-243,2014
W. Kuich, RK Shyamasundar, The Structure Generating Function of Some Families of Languages, Information and Control,32:85-92 (1976).

Award Lecture Series ofIndian National Academy of Engineering
Professor S. N. Mitra Memorial Award Lecture 2015
50 Years of Fuzzy Sets: Data to KnowledgeSankar K. Pal
Center for Soft Computing Research Indian Statistical Institute
Kolkata 700108
IntroductionThe theory of FUZZY sets was introduced in 1965 by Lotfi A. Zadeh (Inform. Control., 8, 338- 353,1965) as a new way to represent vagueness in everyday life. They are a generalization of conventional set theory, one of the basic structures underlying computational mathematics and models. The theory of fuzzy sets (FS) was first explained in 1965 by Lotfi A. Zadeh, University of California, Berkely. The theory has been explored as a model of uncertainty analysis during the last fifty years by scientists over the globe for developing methodologies for decisionmaking problems of various kinds. The successful application areas and systems developed broadly include: fuzzy logic control based systems, fuzzy expert systems, and fuzzy pattern recognition and image processing systems. While the aims were to emulate and replace human operators and human expertise respectively in the first two categories, generalization and uncertainty handling were the objectives in the other one.
Characteristics of fuzzy setsA fuzzy set (A) in space of points X = {x} is a class of events with a continuum of grades of m em bership and is characterized by a membership function jiA(x) which associates with each point in X a real number in the interval [0,1 ] with the value of |a.A(x) at x representing the grade of membership of x in A. Formally, a fuzzy set A with its finite number of supports xl, x2 ,, xn, is defined as
A= {(nA(xi), xi)}, i = 1 ,2 ,..., n
The characteristic function |xA(xi) denotes the degree to which an event xi may be a member of A, or possess some imprecise property as
represented by A. As its valuei, the grade of membership of xi in Abecomes higher.In extreme cases when nA(x) is zero or unity, the fuzzy set A boils down to a crisp set. Typical examples of fuzzy set include tall man, large number, long street, very young, sharp corner, beautiful woman, which have no crisp or sharp boundaries.
Fuzzy sets (FS) are nothing but membership functions, and membership functions are context dependent. That is, the function characterizing a set “Tall Men” in India may not be the same as defined in case of Sweden, say, since Swedish are usually much taller than Indians.
FS is a generalization of classical set theory. That is, it has greater flexibility in capturing faithfully v arious aspec ts o f incom pleteness or imperfection in a situation. Flexibility is associated with the concept of |x(x). As the value of increases/decreases, the amount of stretching required in fitting x with the imprecise concept, as represented by A, decreases/increases. In other words, fuzzy sets are elastic and hard (crisp) sets are inelastic. It may be mentioned that n(x) is different from p(x), the probability of occurrence of x. While the former concerns with the compatibility (similarity) of x with an imprecise concept, the latter deals with the no. of occurrences ofx.
The following disciplines, among others, had impact o f fuzzy set theory since 1965: Mathematic, Modelling and Control, Pattern Recognition (PR) & Image Processing (IP), Artificial Intelligence (AI), Data Analysis. Real world applications have been observed in various

267
areas such as : Business and Finance Sectors, Social and Behavioral Sciences, Electronic and Robotic Systems (cars, domestic appliances)
The systems developed can be broadly classified as - fuzzy logic control based systems, fuzzy expert systems, and fuzzy pattern recognition and image processing systems. While the aim in the first two categories is to replace or emulate human operators and human expertise respectively, the objective in the other is to have generalization and uncertainty handling in decision-making.One may note that Zadeh's first paper on fuzzy set theoretic pattern recognition, appeared in 1966 (J. Math. Anal. &Appl. 13,1-7,1966), while that for Controlwas published in1973 (IEEE Trans. Syst., Man and Cyberns., 3(1), 28-44, 1973).It, therefore, appears thathe had the concept and notion of fuzzy classification of data while developing his theory.
Moreover, the techniques of pattern recognition (PR), and image processing (IP), interact with and support a large percentage of control systems (e.g., Mars rover control, camera tracking for repair and docking at space shuttles, fuzzy camcorders, traffic flow control). Applications of fuzzy PR. and Vision have matured, especially because of the commercial success of Japanese products based on fuzzy logic control.
Relevance of fuzzy sets in pattern recognitionThe different tasks in PR and IP where fuzzy set theoretic approach has been found relevant and significant are as follows: Representing linguistically phrased input features for p ro ce ss in g , R ep resen tin g m u lti-c la ss membership of ambiguous patterns, Generating rules & inferences in linguistic form, Extracting ill-defined image regions, primitives, properties and describing relations among them as fuzzy subsets.
Linguistically phrased, input means those described using the terms like small, medium, high etc.. For example, a patient usually describes his/her symptoms to a doctor in terms of those
linguistic terms, viz, temperature is high, and pressure is low.An ambiguous pattern (patterns lying in overlapping regions) should be characterized by multiclass memberships with values in [0,1], unlike the conventional decisionmaking as characterized by {0, 1}, i.e., either belongs or does not belong. So, the decision on a pattern in c-class problem may be characterized by a membership vector with c components, where each component represents the degree of belonging to a particular class. These components and their statistics can be used to make decisions under different choices, like first choice, second choice and combined choice; thereby resulting in a multi-valued recognition system (IEEE Trans. Syst. , Man and Cyberns. , 22, 607-620,1992.). Patterns under combined choice, the second choice can be corrected at higher level under the control of a supervisory programme; thereby reducing the number of wrong decisions in conventional systems.For example, in defence applications, linking of bridge pixels and broken roads can be made under said supervisory scheme while processing remotely sensed imagery.
A gray tone image possesses ambiguity within pixels because of the possible multi-valued levels o f b r i g h t n e s s i n t h e i m a g e . T h i s indeterminacyboth in grayness and spatially, is due to inherent vagueness rather than to randomness. Many basic concepts of image analysis (e.g., edge, comer, boundary, region, property, relation between regions) do not lend themselves well to precise definition. Therefore, it is natural and appropriate to represent them as fuzzy subsets.In summary, fuzzy PR and IP tasks involve a notion of embedding. We find a better solution to a crisp problem by looking in a large space at first, which has different and usually less constraints, and therefore, allows the algorithm more freedom to avoid errors forced by commission to hard answers in intermediate stages. Typical problems where the application of fuzzy PR and IP has been successful include: Speech recognition, Medical image (MRI, X- rays), Remote sensing image (Defence applications), and Natural language processing.

268
It may be noted that it is E. Ruspini (Stanford Research Institute), who first mentioned that clustering should be fuzzy, NOT crisp, i.e., patterns may have origin from more than one class (Inform. Control, 15, 22-32,1969). Subsequently, a new direction to fuzzy set theoretic cluster analysis was initiated by J.C. Dunn (J. Cybems.,3, 32-57, 1974; J. Cybems., 4, 1-15, 1974) and J.C. Bezdek (J. Cybems., 3, 58-73, 1974; J. Maths. Biol., 1, 57-71, 1974)m their work on fuzzy ISO DATA and fuzzy c-means algorithms. S.K. Pal and D. Dutta Majumder (ISI, Kolkata) published first IEEE paper in 1977 applying fuzzy sets in speech recognition. (IEEE Trans. Syst., Man and Cybems., 7(8), 625-629, 1977). Similarly, it is J.M.B. Prewitt (in Picture Processing and Psychopictorics, B. Lipkin and A. Rosenfeld (eds.), Academic Press, N. Y., 1970, pp.75-149) who first mentioned that image segmentation should be fuzzy sub-sets of image, though not much work was done by her. Azriel Rosenfeld, father of image processing, and his group (UMD, College Park) contributed immensely in initiating fuzzy set theoretic image processing research. Their first article appeared in 1979 extending the concepts of digital picture geometry to fuzzy subsets (Inform. Control, 40(1),76-87, 1979). Later on, his contribution in developing fuzzy geometry of image subsets (Pattern Recog. Letters, 2, 311-317,1984) for soft decision-making isalso noteworthy. S.K. Pal and R.A. King are the other pioneers who published their first paper in 19%0(Electronics Letters, 16(10), 376-378, 1980) on fuzzy image enhancement. Subsequently, Pal and his group at the ISI contributed significantly in defining fuzzy corelation between membership functions (Fuzzy Sets and Systems, 17,23-38,1985), fuzzy primitives and grammars from images (IEEE Trans. Syst. Man and Cybems., 16(5), 657-667,1986), fuzzy image entropy (IEEE Trans. Syst, Man and Cybems., 21(5), 1260-1270, 1991), and geometry (Fuzzy Sets and Systems, 48(1), 23-40, 1992) for image segmentation and analysis, among others.Around the same time when fuzzy pattern recognition algorithms were being developed, A. De Luca and S. Termini published their benchmark article on
definition of a nonpro babilistic entropy in the setting of fuzzy set theory (Inform. Control,20, 301-312, 1972). This has become a source of several later investigations on entropy and uncertainty measures with applications to PR and IP. The book by A. Kaufinann (Introduction to the Theory of Fuzzy Subsets: Fundamental Theoretical Elements, vol. 1. New York: Academic, 1975) was the only authored book available, and acted as valuable resource for beginners. The article on Zadeh's possibility theory based on fuzzy sets (Fuzzy Sets and Systems,. 1, 3-28,1978) is another land mark contribution towards approximate reasoning and decision-making in this regard.
Crisis in fuzzy logic researchResearch in fuzzy sets and logic got stuck in mid '80s, as in many other areas and theories. One of the critic ism s was concerned w ith the determ ination of membership functions. Meanwhile, Japanese products on FL controle.g., Sendai, Japan subway system giving smooth ridecame to market vigorously with hundreds of patents. Artificial Neural Networks(ANN) reappeared as machinery for learning and curve fitting. Theory of Genetic Algorithms(GAs) was introduce das a framework of parallel searching and optimization.
FL research flourished again at a higher gearin conjunction with ANN and GAs. Different funding agencies (both in India and abroad) came forward declaring it a thrust area. Various conferences/workshops held in conjunction with other paradigms and disciplines. The IEEE (USA)came forward by publishing different Transactions, and later on form ing the Computational Intelligence Society. Other publishing houses (e.g., Springer, Elsevier) brought out several joumalsin the market on these and related domains. Special issues were also published by other engineering and applied science journals wherever applications of FL, ANN and G A were going on.
Different integrationsIn the late eighties, scientists thought of

269
synergistic integration of FL, ANN and GAs to overcome the limitations of individuals. For example, the searching characteristics of GAs can be used to determine the appropriate membership functions of fuzzy sets as well as in determining the optimal parameters of neural networks. Accordingly, models based on FL+ANN, FL+GAs, ANN+GAs,FL+ANN+GA etc. were framed with various applications. Among them, Neuro-fuzzy hybridization is the most visible integration realized so far. One of the reasons behind this N-F integration was as follows:
Fuzzy Set theoretic models try to mimic human reasoning and the capability of handling uncertainty Neural Network models attempt to em ulate a rc h ite c tu re and in fo rm atio n representation scheme of human brain. So, if FL provides the software, ANN can provide the hardware. This led to the development of the Neuro-fuzzy computing paradigm in order to provide more intelligent systems.
There are two broad categories of integrations resulting in, namely, Neuro-fuzzy systems and Fuzzy neural networks. Given a fuzzy system, ANN is used for efficient learning and adaptation of the rules in the first category. On the other hand, given a neural network, fuzzy sets are used at input, output and during training to augment its application domains. For example, in IEEE Trans. Neural Networks, 3, 683-697, 1992, the authors showed how the capability of generating nonlinear boundaries by multi-layer perceptron (MLP) and the uncertainty handling capabilities of fuzzy set theory can be combined to develop a network which can handle linguistic input in addition to those by conventional MLPs.
Soft ComputingWhile different challenges of synergistic integrations between FL, ANN and GAs were being addressed with application specific merits. Zadeh defined the concepts of Soft Computing consolidating them under one umbrella (Comm. ACM, 37, 77-84, 1994). The aim of soft computing is to exploit the tolerance for
imprecision, uncertainty, approximate reasoning and partial truth to achieve tractability, robustness, low solution cost, and close resemblance with humanlike decision making. Mathematically, the objective is to find an approximate solution to an imprecisely or precisely formulated problem. Since high precision carries high cost, the guiding principle of soft computing is to exploit the tolerance for imprecision by devising methods of computation which leads to an acceptable solution at a low cost.
The roles of the constituting components are as follows:F L : Algorithms for dealing with imprecision and uncertainty arising from overlapping concepts/ regions, ANN : Machinery for learning and curve fitting, and GA : Algorithms for search and optimization.
Later on, rough sets (RS), as explained by Pawlak in \9%2(Int. J. Comp. Inf. Sci., 11, 341—356, 1982) became another component of SC paradigm where its role is to provide, unlike FL, algorithms for handling uncertainty arising from granularity in the domain. Within soft computing, FL, ANN, GA and RS work synergistically, not competitively. The SC framework provides flexible information processing inuncertain situations, and the foundation for the conception and design of high MIQ (Machine IQ) systems. It may be argued that it issoft computing rather than hard computingthat should be viewed as the foundation for Artificial Intelligence.
An example of synergistic Integration of ANN, FL, GAs and RS can be found in IEEE Trans. Neural Networks, 9, 1203-1216, 1998. Here a layered network accepts input in terms of low, medium and high, and provides output in terms of class membership values. GA is used to replace the traditional gradient descent search techniques while finding the optimum network parameter values. In the process it provides a group of solutions (chromosomes) describing different parameter sets, and the possibility of getting stuck
270
at local minima, as in gradient descent search algorithm, is greatly reduced. Rough sets are used to extract the domain knowledge from the training samples in the form of rough reducts. These reducts are encoded as initial network parameters so that the system starts learning from a better initial position; thereby reducing drastically the training time. Such a network, under split and merge modularity framework {IEEE Trans. Kn o wl ed g e Da t a Engg. , 15(1), 14-25, 2003), further enhances the classification perform ance, training time and network compactness, and generates rules of higher accuracy, smaller size, and less confusion. Compact network means, all the links between nodes do not exist. The redundant links in the sense of decision-making get automatically discarded. This integrated framework became an estab lish ed m odule for several fu ture developments. Recently, various granular neural networks are developed for PR problems incorporating the concept of fuzzy-rough setsin granular form for network generation.
Granulation - natural clusteringIn 1997, Zadeh explained the notion of granulation and its centrality in human reasoning and fuzzy logic (Fuzzy Sets and Systems, 90,111-127,1997). Granulation, meaning natural clustering, replaces a fine-grained universe by a coarse-grained one, more in line with human perception. Granules can be defined as a clump of indiscernible objects or points (i.e., similar objects, not discriminable by given attributes or relations).
Granules are exemplified for example in Age: very young, young, not so old,..., Direction: slightly left, sharp right, ...., School: each class/section, Image: regions of similar colors, gray values, e.g., max diff of 6 gray levels (Weber's law) cannot be noticed by naked eyes.
One may note that though Zadeh explained the notion of granulation in 1997, Pawlak's rough set theory, which was defined long before in 1982, was concerned with a granulated domain (crisp set defined over a crisp granulated domain).Given
an object or a region or concept over a granulated domain, whether labeled or unlabeled, rough set theory has the capability in extracting automatically some rule(s), called Information granules, that provide crude description of the said object/region/concept. These granules may be viewed as the cases or prototypes representing the regions. Elongated regions may need multiple such cases rules. Since prototypes are rules, not sample points, these may be referred to as case generation, not as case selection.
In real life problems, all the dimensions of the feature space may not occur in these rules. That means that there is a possibility of dimensionality reduction. Again, depending on the topology of the feature space, granules (cases) of different classes may have different dimensions; thereby leading to the notion of variable dimension reduction. The cases thus obtained would have less storage requirement and fast retrieval; and are, therefore, suitable for mining data with large dimension and size.
Let us consider the Iris data which has three flowers (Setosa, Versicolor and Virginica) with four features (sepal length, sepal width, petal length, petal width) as an example. Here, two flowers are highly overlapped while the other is well separated. It has been observed (IEEE Trans. Knowledge Data Engg., 16(3), 292,2004) that the representative cases generated by the aforesaid method need only 2.5 featutes on an average per case, whereas other well-known methods need all the four features. Thisreduced set of features is also found to be superior to other methods in terms of classification accuracy, retrieval time and generation time.
Granular Computing (GrC)The GrC is a paradigm wherecomputation is performed using information granules' and not the data points (objects). Since the information granulesprovide compressed information, the GrC leads to computational gain, among other advantages, and is,therefore, suitable for mining large data sets.

271
Some of the proven applications of information granules are as follows:
(i) Case based reasoning (where evident is sparse)
(ii) Class representation and indexing(iii) Clustering and image segmentation
(initial classes selected automatically)(iv) Knowledge encoding in neural networks(v) Dimensionality reduction(vi) Data compression and storing(vii) Granular information retrieval
It may be mentioned that it is rough set theory which has significantly enriched the GrC research. An excllent review on GrC is made by J.T. Yao, A.V. Vasilakos and W. Pedrycz (IEEE Trans, Cybems., 43(6), 1977-1989,2013.
Rough sets and cluster definitionIn Pawlak's rough set, both the set and the granules are considered to be crisp. The set is defined over a granulated domain. The theory deals with the notion of belonging of a crisp granule to that crisp set. This is characterized roughly by the concepts of lower and upper approximations. The lower approximations denote the set of granules that do definitely belong to that set, while the upper approximations concern those definitely as well as possible belonging. Accordingly, the crisp set defined over the granulated domain is characterized by that pair of crisp lower and upper approximations, and is termed as rough set. Roughness of a set is defined as: 1 - 1lower|/ |upper|, where |. | denotes the cardinality of a set. It may be noted that, rough set, though the name is rough, is nothing but a crisp set with rough descriptions. In the aforesaid rough set theoretic framework, a cluster or class in pattern recognition problems can be viewed in terms of lower and upper approximations. For example, samples in the central core region of a cluster/class have no ambiguity in respect of their belonging to it; only ambiguity comes from those samples lying at its boundary regions. Therefore, the regions, where these two categories of samples have come from, may be referred to as low er and upper approxim ate regions, respectively.
Generalized rough set and entropyIn real life problems, the set and the granules that were considered in defining the rough sets, can be fuzzy. Accordingly, lower and upper approximate regions would also be fuzzy, being characterized by fuzzy membership functions. Every granule w o u ld have tw o m em b ersh ip v a lu e s corresponding to lower and upper approximate regions signifying the degrees of belonging to the set, in case the set or the granules, either or both, are fuzzy. Various rough sets, so generated incorporating the notion of fuzzy sets, are called generalized rough sets which provide a stronger model of uncertainty handling (e.g., uncertainty due to both overlapping regions and granularity in domain) (IEEE Trans. Syst, Man and Cybems. PartB, 39(1), 117-128, 2009).
Various entropy measures using logarithmic and exponential gain functions of generalized rough sets are defined in terms of set roughness to model the uncertainty arising from overlapping concepts and granularity. These can be used for analysing any kind of data, whether image data, web data, or protein sequence data, wherever uncertainty analysis is needed. Let us consider grey images as an example. Here rough-fuzzy (R-F) entropy takes care of the fuzzy boundaries due to sinusoidal variation of intensity of gray regions, and rough resemblance between nearby gray levels and rough resemblance between nearby pixels. Nearby grey levels have lim ited discernibility, i.e., rough resemblance. For example, a region containing gray values separated by 6 consecutive gray levels cannot be discriminated by naked eyes, and therefore, can be considered as a granule. A pixel usually tends to attain a grey value close to those of its neighbors; thereby showing rough resemblance. Various applications of these rough-fuzzy uncertainty measures and granular mining have been reported demonstrating their superiority over those defined by fuzzy sets or rough sets alone, and other conventional methods. Here we mention three such cases in the areas of image analysis, bioinformatics and online social networks, along with the role of granules.

272
Image segmentation and video trackingIn the investigation reported in IEEE Trans. Syst, Man and Cybems. Part B, 39(1), 117-128, 2009, the superiority of R-F entropy over fuzzy entropy for image segmentation is demonstrated both visually and quantitatively for different kinds of images. The threshold for segmentation was determined by minimizing the greyness ambiguity ofthe image plane. Here granules were formed to determine roughly resembled gray levels and pixels. Granules were of equal size of width (= 6 as per Weber's law).In case of F- entropy, the membership of a level is determined uniquely by the m em bership function, irrespective of its location. On the other hand, for R-F entropy, the membership of a level depends on the granule to which it belongs. It has also been observed that the fuzziness in set has more effect than that in granules in segmentation.
Granules of un-equal size (which is natural) provide better segmentation than those of equal size. This is more apparent in case of video tracking based on spatial and tem poral segmentation of each framefApplied Soft Computing 3(9), 4001-4009, 2013). Here quadtree spatial decomposition was made to produce homogeneous granules of unequal size. These natural granules of unequal sizes reduce the formation of spurious segments in frames, unlike the granules of equal size. In terms of index values (say, P, DB and Dunn indices), there would be an abrupt changeor swing in its value over the frames if the frames are not properly segmented or they produce spurious segments; thereby resulting in miss-tracking.
Gene selection from microarray data:An important application of gene expression data in functional genomics is to classify the samples according to their gene expression profiles. In most gene expression data, the number of training samples is very small compared to the large number of genesinvolved in the experiments. Among the large amount of genes, only a small fraction is effective for performing a certain task. This led to gene selection problem, i.e.,
identifying a reduced set of the most relevant genes.
The granules used here are class independent which model low, medium and highin the feature space for representing the overlapping classes. In this way, a fuzzy equivalence partition matrix (FEPM) of dimension (3xn) is generated; where n is the number of samples and 3 stands for low, m ed ium and h ig h . U sin g th is fu zzy approximation space, various fuzzy/information measured are defined. These include: Entropy (defined on fuzzy approximation spaces of a fuzzy attribute set A), Mutual information (defined between two fuzzy attribute sets P and Q), and other /■information measures, such as V & Chi- square information, between two fuzzy attribute sets P&Q. (IEEE Trans. Knowledge & Data Engg., 22(6), 854-867,2010).
The principle of gene selection is based on maximization of relevance of a gene with respect todecision attribute (i.e., cancerous or normal) and minimization of redundancy with respect toother genes. Merits of FEPM based density app rox im ation approach overthose o f discretization and Parzen-window for computing entropy, and mutual, V & Chi-square information have been adequately demonstrated for several data sets (IEEE Trans, Syst., Man and Cybems, Part B, 40(3), 741-752, 2010). For example, for leukemia data with expression level of7070 genes and 72 samples (47 acute lymphoblastic leukemia and 25 acute myeloid leukemia), the number of genes required to produce more that 98% classification accuracy is less than 10 by the proposed FEPM based method. Similarly, for colon cancer with expression level o f2000 genes (with highest minimal intensity) of 40 tumor and 22 normal colon tissues, the proposed method selects only 7 genes to produce 90% accuracy. Out of ~18000 cDNA spots representing genes of relevance in immunology of 30 patients; 21 with rheum ato id a rth ritis (RA ) and 9 w ith osteoarthritis, it needs only 3 genes to produce 100% accuracy. The corresponding figures ofthe required number of genes are higher for the

273
conventional discretization and the Parzen- window based approaches for computing entropy, and mutual, V and Chi-square information.
Community detection in social networksA social network is viewed as a collection of relations between the social actors (nodes) and the interactions between them. These actors are often indistinguishable in some problem-solving, thereby justifying the formation of granules over them. Again, the relations and the interactions between nodes and clusters of nodes do not lend themselves to precise definition, i.e., they have fuzzy boundaries. So, it is appropriate and natural that a social network is represented in the framework of fuzzy granulation theory.
In society, one can find groups that naturally form, e.g., families, co-workers' circles, friendship circles, villages and towns. Similar to this, in an online social network, we can find virtual groups, which live on the web. Detecting these groups on communities has practical significance. For example, in WWW this will help to optimize the internet infrastructure. In a purchase network this can boost the sell by recommending the appropriate products. In computer network it will help to optimize the routing table creation. Detecting these groups on communities also helps in identifying the special actors in the network. For example, the central nodes of the clusters, or nodes in the boundary region who act as a bridge between communities are the special actors who play different important roles within the society.
Recently, a fuzzy granular model for social network (FGSN) is developed (Information Sciences, 314, 100-117, 2015)using granules of various hop distances around each node.The FGSN for undirected social networks is represented by a triple as S = (C, V, G) where V is a finite set of nodes of the network, C <= V is a finite set of granule representatives and G is the finite set of all granules. The principle of community detection is as follows (Pattern Recog. Letters, 67, 145-152,2015):
(i) Identify the dense fuzzy granules whose granular degree exceeds a threshold, say Q, i.e., identify 0 Cores.
(ii) Merge them if they are nearby (search for6 -Cores belonging to same community i.e., find Community reachable 0-Cores).
(iii) Form a meaningful community by discarding the weakly coupled granules whose Granular embeddedness is less than a threshold, say 1/x
The communities C, thus detected, have fuzzy boundaries. Rough set theoretic view of fuzzy community C is made as follows:
(i) For nodes in lower approximate region reflecting their definitely belonging to C, assign membership value |a = 1.
(ii) For nodes in boundary (i.e., upper - lower) region reflecting their possibly belonging to C, assign (i-value in (0,1).
The effectiveness of the aforesaid fuzzy-rough communities (FRC) over those obtained by three w ell-know n graph theo re tic m odels is demonstrated on LFR benchmark data for various mixing parameters that signify different degrees of overlapping communities. The graph theoretic modelswhich were compared are centrality-based community detection method, modularity optimization method and k-clique percolation method. While the first two produce crisp communities, the other produces overlapping communities. The performance in community detection is evaluated in terms of normalized fuzzy mutual information (NFMI) index. The NFMI measures the goodness of a community structure C, obtained by a method, given the actual one. The FRC-FGSN model is found to be superio r in de tec ting the overlapp ing communities. The superiority is more prominent as the overlapping increases (Pattern Recog. Letters, 67,145-152,2015).

274
ConclusionWe described, in brief, the fuzzy set theoretic research from pattern recognition and machine intelligence perspective during the last fifty years since its inception in 1965.The evolution of the discipline over the years with different concepts, tasks and new technologies, driven by various applications areas as have emerged from time to time, is stated from the point of knowledge mining from the data. This includes the crisis in FL research, synergistic integrations of fuzzy sets with other soft computing paradigms, rough- fuzzy computing and granular mining. What we discussed basically signifies the development of various efficient machine learning tools. These tools can be applied to any real life problem, although only a few example application cases are explained here.
These researches have the significance, among others, to:
(i) Computational Theory of Perceptions (CTP): Here computation is performed based on perceptions, not measurements. Perceptions have ill-defined (fuzzy) boundaries and the attributes they can take are granules. This fuzzy (F)- granularity characteristics of CTP can be modeled using fuzzy-rough computing concept. In this context we mention the recent work on Z-numbers concerning perception granule in natural language processing. For a sentence like “The flower is beautiful”, the perception granule is {subject, predicate, belief} = {description of flower, beautiful, how strongly one Believes to be beautiful}. (Belief could be “adverb”, or “adjective” or “adverbial ph rase” . B e lie f = subjective probability that the flower is beautiful)Z-numbers as explained recently by Zadeh (Inform. Sci., 181(14), 2923 - 2932,2011) provides precisiation
of perception granules. On the other hand, Z*-numbers: Augmented Z- numbers (Inform. Sci., 323(1), 143-178, 2015) defined very recently represents machine-subj ectivity in precisiation.
(ii) Natural computation: Granulation is a process like self-reproduction, self- organization, functioning of brain, Darwinian evolution, group behavior, cell membranes and morphogenesis that are abstracted from natural phenomena f- Granulation is inherent in human thinking and reasoning process, and plays an essential role in human cognition
(iii) Big Data research: Any discussion today on data analysis remains incomplete without the mention of Big Data. The aforesaid research contributions have relevance to Big data handling and analytics (BDA) from uncertainty management and granular mining points of view. For example, on-line social networks have all the characteristics of Big data such as large volume, velocity (dynamic) and varieties (complex). It may be m entioned here that the computational aspects and scalability issues havenot been much addressed yet by the soft computing community. All these constitute future research areas.
AcknowledgementsI thank the Research fellows and younger colleagues and collaborators both in India and abroad who contributed with me towards the development of the subject, the Govt, of India for J.C. Bose Fellowship, the INAEE Chair Professorship, INAE selection committee for selecting me for 2015 Prof. SN Mitra Memorial Award.

(3(nMan ^ a tto n a l Jkcaitemij o f ^xrtgtmerragUnit No. 604-609, SPAZE, I Tech Park, 6th Floor, Tower A, Sector 49, Sohna Road
Gurgaon- 122 002; Phone: +91 0124 4239480 Fax: +91 0124 4239481 email: [email protected] website : www.inae.in