professor michael permezel - ranzcog - bad outcomes in maternity care: do obstetricians intervene...
TRANSCRIPT
Michael Permezel
Medico-legal Forum
Melbourne, June 2015
Informed Consent for Maternity Care
Are we doing enough?

Informed Consent for Maternity Care
Consent and the Law Prac00oners may breach their duty of care to pa0ents if they fail to warn them of the risks inherent within a proposed treatment.
Bridie Woolnough, Resolu0ons Officer, HCC NSW

Informed Consent for Maternity Care
Consent and the Law
What Risks?

Informed Consent for Maternity Care
Bolam v Friern Hospital Management Committee (1957)

Informed Consent for Maternity Care

Informed Consent for Maternity Care
Material Risk Material risk is any risk, which a reasonable person in the pa0ent’s situa0on, would aHach significance to.
Rogers v WhiHaker

Planned Vaginal Birth
Informed Consent?

Planned Vaginal Birth
Informed Consent?
Are Women currently informed of the “Material Risks” of Planned Spontaneous Vaginal Birth?

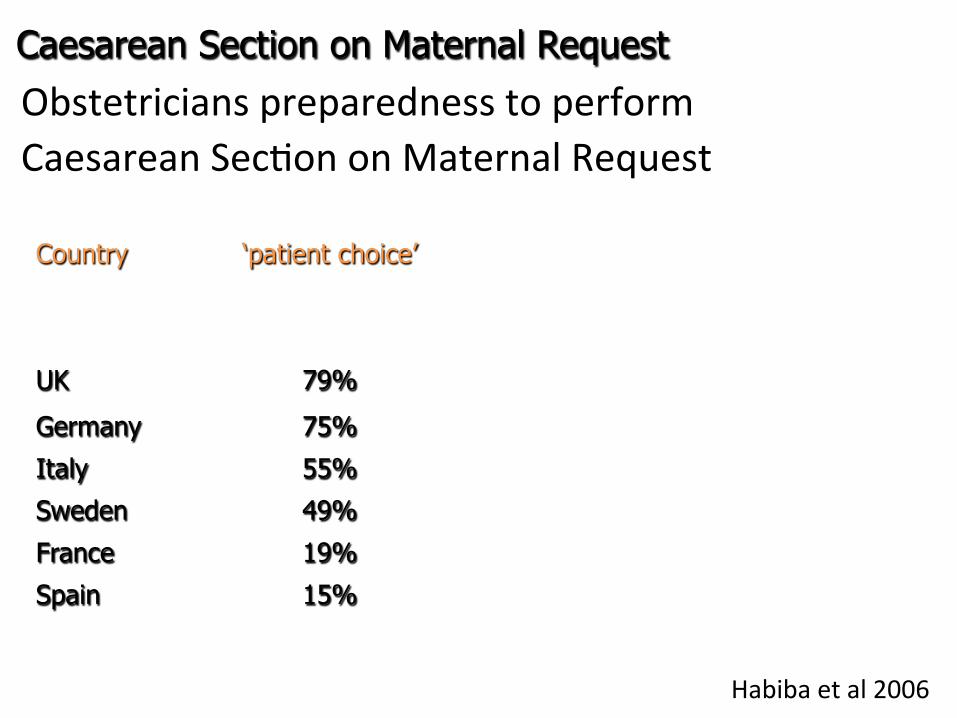
Obstetricians preparedness to perform Caesarean Sec0on on Maternal Request
Habiba et al 2006
Caesarean Section on Maternal Request
Country ‘patient choice’
UK 79%
Germany 75%
Italy 55%
Sweden 49%
France 19%
Spain 15%

Obstetricians preparedness to perform Caesarean Sec0on on Maternal Request
Habiba et al 2006
CS on Maternal Request
Country ‘patient choice’ ‘previous traumatic VD’
‘previous IP stillbirth’
UK 79% 99% 98%
Germany 75% 97% 94%
Italy 55% 78% 81%
Sweden 49% 94% 90%
France 19% 77% 67%
Spain 15% 38% 60%
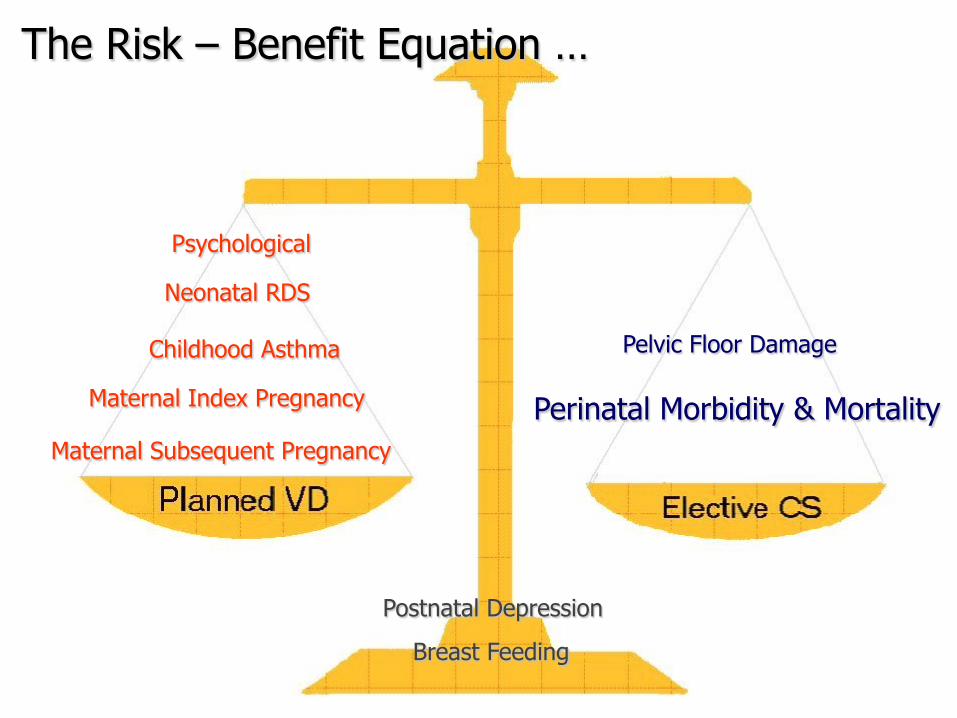
Neonatal RDS
Maternal Index Pregnancy
Maternal Subsequent Pregnancy
Childhood Asthma Pelvic Floor Damage
Perinatal Morbidity & Mortality
Breast Feeding
Postnatal Depression
The Risk – Benefit Equation …
Psychological

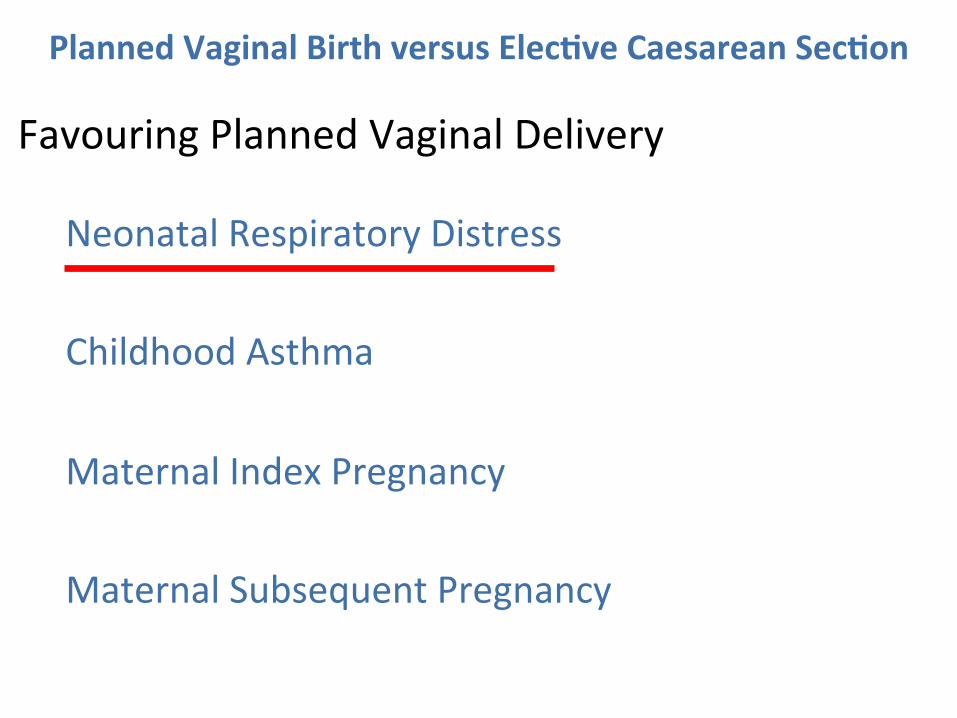
Favouring Planned Vaginal Delivery
Neonatal Respiratory Distress Childhood Asthma Maternal Index Pregnancy Maternal Subsequent Pregnancy
Planned Vaginal Birth versus Elec;ve Caesarean Sec;on
Favouring Planned Vaginal Delivery
Neonatal Respiratory Distress Childhood Asthma Maternal Index Pregnancy Maternal Subsequent Pregnancy
Planned Vaginal Birth versus Elec;ve Caesarean Sec;on

Planned Vaginal Birth versus Elec0ve Caesarean Sec0on
Neonatal Respiratory Distress Ven0la0on in 1st 24 hr
1 neonatal death in 24,077 repeat CS at term; Tita et al, NEJM 2009
Neonatal Ventilation after Elective CS
1.9%
0.9%
0.4% 0.4% 0.4%
0.0%
0.4%
0.8%
1.2%
1.6%
2.0%
37 38 39 40 41
Gestation Weeks
% re
quiri
ng v
entil
atio
n

Planned Vaginal Birth versus Elec;ve Caesarean Sec;on
Favouring Vaginal Delivery
Neonatal Respiratory Distress Childhood Asthma Maternal Index Pregnancy Maternal Subsequent Pregnancy

Planned Vaginal Birth versus Elec0ve Caesarean Sec0on
Childhood Asthma
Thavagnanam et al 2008

Favouring Planned Vaginal Delivery
Neonatal Respiratory Distress Childhood Asthma Maternal Index Pregnancy Maternal Subsequent Pregnancy
Planned Vaginal Birth versus Elec;ve Caesarean Sec;on
Planned Vaginal Birth versus Elec;ve Caesarean Sec;on
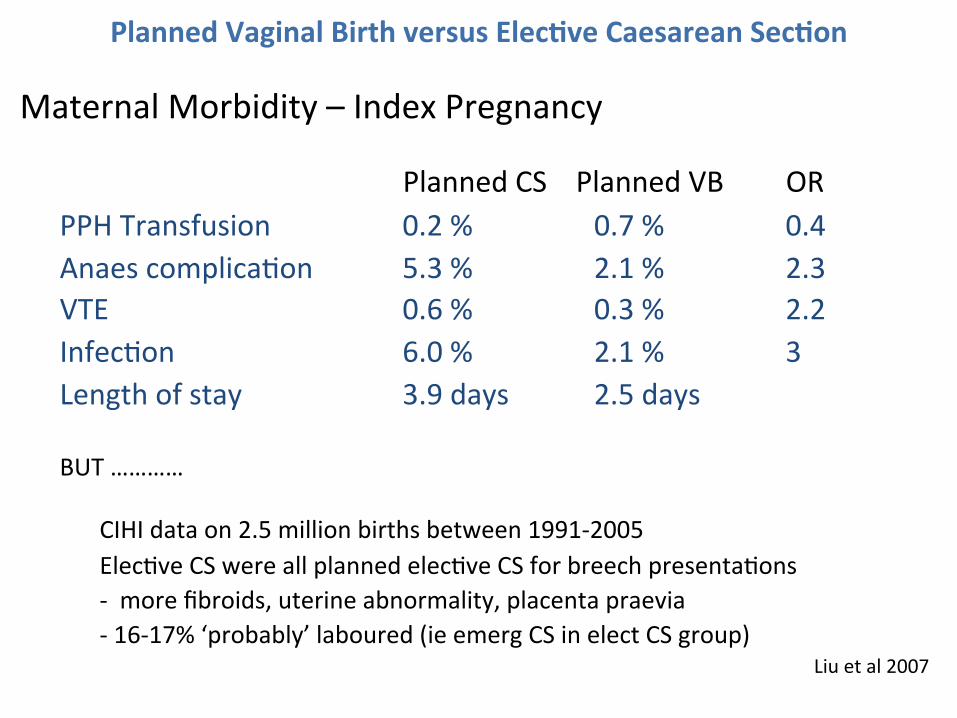
Maternal Morbidity – Index Pregnancy
Planned CS Planned VB OR PPH Transfusion 0.2 % 0.7 % 0.4 Anaes complica0on 5.3 % 2.1 % 2.3 VTE 0.6 % 0.3 % 2.2 Infec0on 6.0 % 2.1 % 3 Length of stay 3.9 days 2.5 days BUT …………
CIHI data on 2.5 million births between 1991-‐2005 Elec0ve CS were all planned elec0ve CS for breech presenta0ons -‐ more fibroids, uterine abnormality, placenta praevia -‐ 16-‐17% ‘probably’ laboured (ie emerg CS in elect CS group)
Liu et al 2007

Planned Vaginal Birth versus Elec;ve Caesarean Sec;on
Maternal Mortality – Index Pregnancy
El CD 0 / 47,776 Pl VD 41/ 2,292,420
Liu et al, 2007

Planned Vaginal Birth versus Elec0ve Caesarean Sec0on
Maternal Mortality – Index Pregnancy Vaginal Delivery 0.03/1000 Elec0ve Caesarean Sec0on 0.07/1000
• Lilford 1987

Planned Vaginal Birth versus Elec0ve Caesarean Sec0on
Maternal Mortality – Index Pregnancy Vaginal Delivery 0.03/1000 Elec0ve Caesarean Sec0on 0.07/1000 Emergency Caesarean Sec0on 0.27/1000 Planned VD, 17% Emerg CS 0.07/1000
Bingham & Lilford 1987

Favouring Planned Vaginal Delivery
Neonatal Respiratory Distress Childhood Asthma Maternal Index Pregnancy Maternal Subsequent Pregnancy
Planned Vaginal Birth versus Elec;ve Caesarean Sec;on

Planned Vaginal Birth versus Elec0ve Caesarean Sec0on
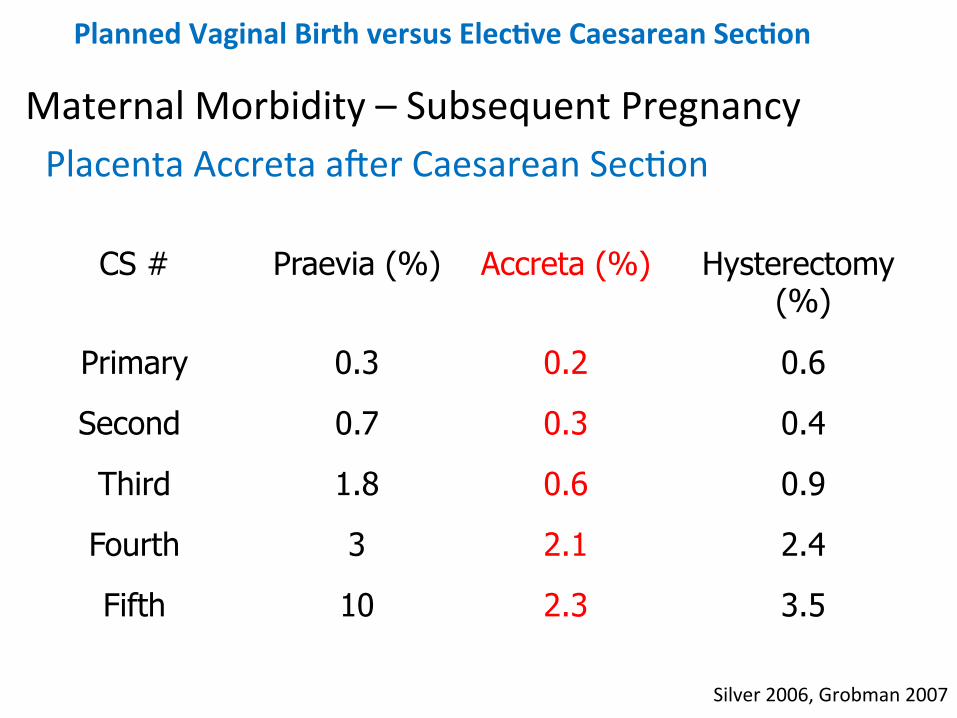
Maternal Morbidity – Subsequent Pregnancy Placenta Accreta aker Caesarean Sec0on
Silver 2006, Grobman 2007
CS # Praevia (%) Accreta (%) Hysterectomy (%)
Primary 0.3 0.2 0.6
Second 0.7 0.3 0.4
Third 1.8 0.6 0.9
Fourth 3 2.1 2.4
Fifth 10 2.3 3.5

CDMR
Median Family Size in OECD Countries
Australian Ins0tute of Family Studies, 2008
Planned Vaginal Birth versus Elec;ve Caesarean Sec;on
Maternal Morbidity – Subsequent Pregnancy Placenta Accreta aker Caesarean Sec0on
Silver 2006, Grobman 2007
CS # Praevia (%) Accreta (%) Hysterectomy (%)
Primary 0.3 0.2 0.6
Second 0.7 0.3 0.4
Third 1.8 0.6 0.9
Fourth 3 2.1 2.4
Fifth 10 2.3 3.5

Planned Vaginal Birth versus Elec;ve Caesarean Sec;on
Maternal Morbidity – Subsequent Pregnancy Placenta Accreta aker Caesarean Sec0on
Silver 2006, Grobman 2007
CS # Praevia (%) Accreta (%) Hysterectomy (%)
Primary 0.3 0.2 0.6
Second 0.7 0.3 0.4
Third 1.8 0.6 0.9
Fourth 3 2.1 2.4
Fifth 10 2.3 3.5

Planned Vaginal Birth versus Elec;ve Caesarean Sec;on
Maternal Morbidity – Subsequent Pregnancy Placenta Accreta aker Caesarean Sec0on
Silver 2006, Grobman 2007
CS # Praevia (%) Accreta (%) Hysterectomy (%)
Primary 0.3 0.2 0.6
Second 0.7 0.3 0.4
Third 1.8 0.6 0.9
Fourth 3 2.1 2.4
Fifth 10 2.3 3.5

Neonatal RDS
Maternal Index Pregnancy
Maternal Subsequent Pregnancy
Childhood Asthma Pelvic Floor Damage
Perinatal Morbidity & Mortality
Breast Feeding
Postnatal Depression
The Risk – Benefit Equation …
Psychological

Planned Vaginal Birth versus Elec;ve Caesarean Sec;on
Favouring Elec0ve Caesarean Sec0on
Pelvic Floor Damage
Perinatal Mortality & Morbidity
Is he the Cause?

Planned Vaginal Birth versus Elec;ve Caesarean Sec;on
Favouring Elec0ve Caesarean Sec0on
Pelvic Floor Damage Urinary Incon0nence Anal Incon0nence Pelvic Organ Prolapse

Planned Vaginal Birth versus Elec;ve Caesarean Sec;on
Major Pelvic Floor Dysfunc0on
Odds Ra0o rela0ve to Nullipara
Caesarean Sec0on 2.5 (1.5-‐4.3)
Spontaneous VD 3.4 (2.4-‐4.9) Instrumental VD 4.3 (2.8-‐6.6)
Odds ra0on rela0ve to Nullipara; Any type of Incon0nence, Prolapse Symptoms or Prolapse Surgery
MacLennan AH et al 2000

Planned Vaginal Birth versus Elec;ve Caesarean Sec;on
Urinary Incon0nence

Planned Vaginal Birth versus Elec;ve Caesarean Sec;on
Urinary Incon0nence Term Breech Trial
Planned CS Planned VB at 3/12
36 / 798 (4.5%) 58/797 (7%)* at 2 years 81 / 457 (18%) 100/460 (22%)
Urinary Incon0nence↑ with VD at 3/12 but not at 2 years
*p < 0.05 Hannah et al, 2002; Hannah et al, 2004

Urinary Incon0nence EpinCont Study
Increased Urinary Incon0nence with VB
p < 0.05; 15,307 women in the Epidemiology of Incon0nence in the County
of Nord-‐Trøndelag, Norway, Rortveit et al 2003
Planned Vaginal Birth versus Elec;ve Caesarean Sec;on
Nulliparous Caesarean Section
Vaginal Birth
Any Incontinence 10% 16% 24%
Moderate or Severe
4% 6% 10%

Planned Vaginal Birth versus Elec;ve Caesarean Sec;on
Anorectal Incon0nence (Short-‐Term)
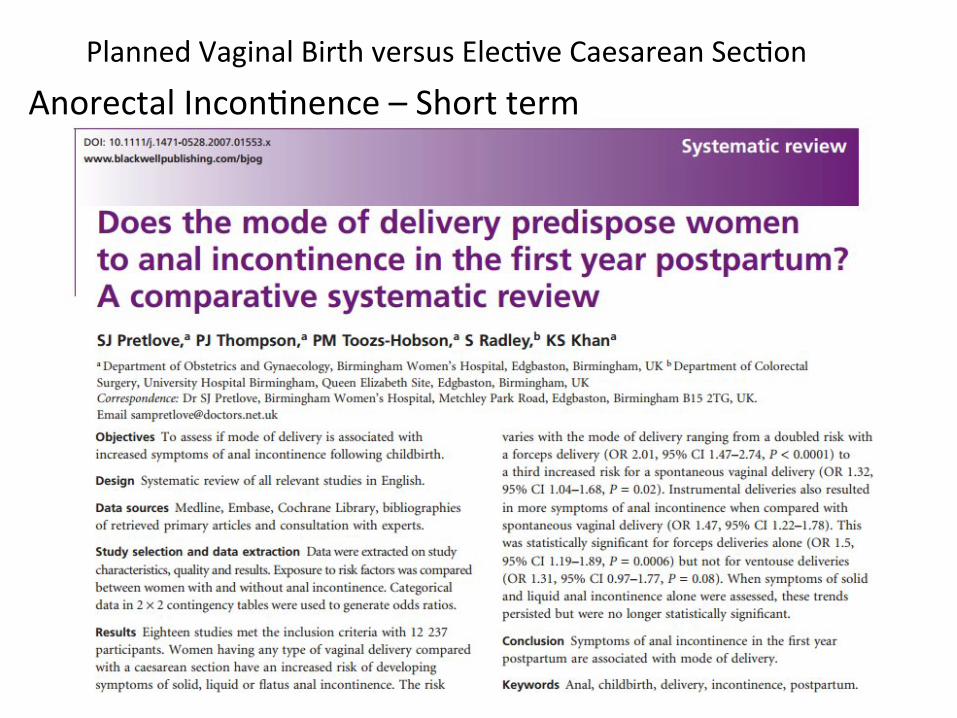
Planned Vaginal Birth versus Elec0ve Caesarean Sec0on Anorectal Incon0nence – Short term

Planned Vaginal Birth versus Elec;ve Caesarean Sec;on
Anorectal Incon0nence – Short Term System Review
* assumes 13% instrumental birth; Systematic review; Pretlove SJ et al, 2010
OR 95% CI
Forceps 2.01 (1.47-‐2.74)
Vacuum 1.60 (1.07-‐2.40)
Spontaneous Vaginal 1.32 (1.04-‐1.68)
All Vaginal* 1.40
Planned Vaginal Birth versus Elec;ve Caesarean Sec;on
Anorectal Incon0nence (Long-‐Term)

Planned Vaginal Birth versus Elec0ve Caesarean Sec0on
Anal Incon0nence – Long term (14 years)
Samesekara et al, 2008
VD associated with 3rd degree tear
Uncomplicated VD
Elective CS
Length of follow up (years)
14.8 14.2 14.2
Prevalence of any anal incontinence
53% 19% 11%
Cleveland Anal incontinence score
3.5 1.3 0.6
Quality of life scores êê ê − Persistent defect in sphincter on EAS
59% 4% 0%

Planned Vaginal Birth versus Elec0ve Caesarean Sec0on
Anorectal Incon0nence – Long term
Gyhagen 2014; Faecal Incontinence 20 years after one birth

Planned Vaginal Birth versus Elec0ve Caesarean Sec0on
Anorectal Incon0nence – Long term
Gyhagen 2014; Faecal Incontinence 20 years after one birth

Planned Vaginal Birth versus Elec;ve Caesarean Sec;on
Anorectal Incon0nence – Long term (20 years)
n VD % CS % OR 95% CI
Anorectal Incon0nence 2425 48.3 42.8 1.25 (1.10–1.43)
Faecal Incon0nence 701 14.5 10.6 1.43 (1.16–1.77)
Solid 245 5.1 3.4 1.54 (1.08–2.17)
Liquid 660 13.9 9.4 1.53 (1.23–1.90)
*Adjusted for maternal age; current BMI and infant birthweight
Gyhagen 2014; Faecal Incontinence 20 years after one birth

Planned Vaginal Birth versus Elec;ve Caesarean Sec;on
Pelvic Floor -‐ Summary
Urinary Incon0nence Definite benefit of CS
Anorectal Incon0nence Definite benefit of CS
More so with increased 0me since the Birth
Planned Vaginal Birth versus Elec;ve Caesarean Sec;on
Favouring Elec0ve Caesarean Sec0on
Pelvic Floor Damage Perinatal Morbidity and Mortality

Planned Vaginal Birth versus Elec;ve Caesarean Sec;on
Perinatal Death “There has to be a very good reason for NOT doing something
that might save the life of a child”
Jonathon Glover; Ethicist; In: Humanity A Moral History of the Twen0eth Century

662,043 singleton births, Victorian Perinatal Data Collection Unit (1992-2002)
When do babies die?

Ingemarssson 1997; Vashevnik, Walker & Permezel 2007
Perinatal Death
0.00%
0.05%
0.10%
0.15%
0.20%
0.25%
0.30%
0.35%
36 37 38 39 40 41 42 43
Gestation
Perin
atal
Dea
ths
each
Wee
k of
Bab
ies
in
Ute
ro
Sweden 1982-1991 Victoria 1991-2002

Ingemarssson 1997; Vashevnik 2007
17%

Ingemarssson 1997; Vashevnik 2007
24%

Planned Vaginal Birth versus Elec;ve Caesarean Sec;on
Perinatal Death (Late Antenatal and Intrapartum)
> 39 weeks’ gesta0on = 1.93 / 1000
Ingemarsson 1997; Vashevnik, Walker & Permezel, 2005

Planned Vaginal Birth versus Elec;ve Caesarean Sec;on
Perinatal Death (Late Antenatal and Intrapartum)
>39 weeks’ gesta0on = 1.93 / 1000
Much less common aker Elec0ve CS
Only 3 Perinatal Deaths aker 5,966 Elec CS 1999-‐2009 (one of which was severe Cong. CMV and one late Neonatal Death in
mother on Rx for Long QT)
Permezel & Milne, JOGR 2015
Ingemarsson 1997; Vashevnik, Walker & Permezel, 2005

Planned Vaginal Birth versus Elec;ve Caesarean Sec;on
Perinatal Death (Late Antenatal and Intrapartum)
> 39 weeks’ gesta0on = 1.93 / 1000
i.e. elec0ve CS at 39.0 weeks will prevent a perinatal death in 1/500 ongoing pregnancies
Ingemarsson 1997; Vashevnik, Walker & Permezel, 2005

Planned Vaginal Birth versus Elec;ve Caesarean Sec;on
Favouring Elec0ve Caesarean Sec0on
Cerebral Palsy ….

The Damaged Baby. Who is at Fault? Infection
5%CVA10%
Intrapartum10%
Other5%
Antenatal Hypoxia
50%
Congenital20%
> 2500 g, Grether and Nelson 1997

The Damaged Baby. Who is at Fault?
Other5%
Congenital20%
Antenatal Hypoxia >38w ?%
Antenatal Hypoxia <38w?%
Intrapartum10%
CVA10%
Infection5%
Modified from > 2500 g, Grether and Nelson 1997
Planned Vaginal Birth versus Elec;ve Caesarean Sec;on
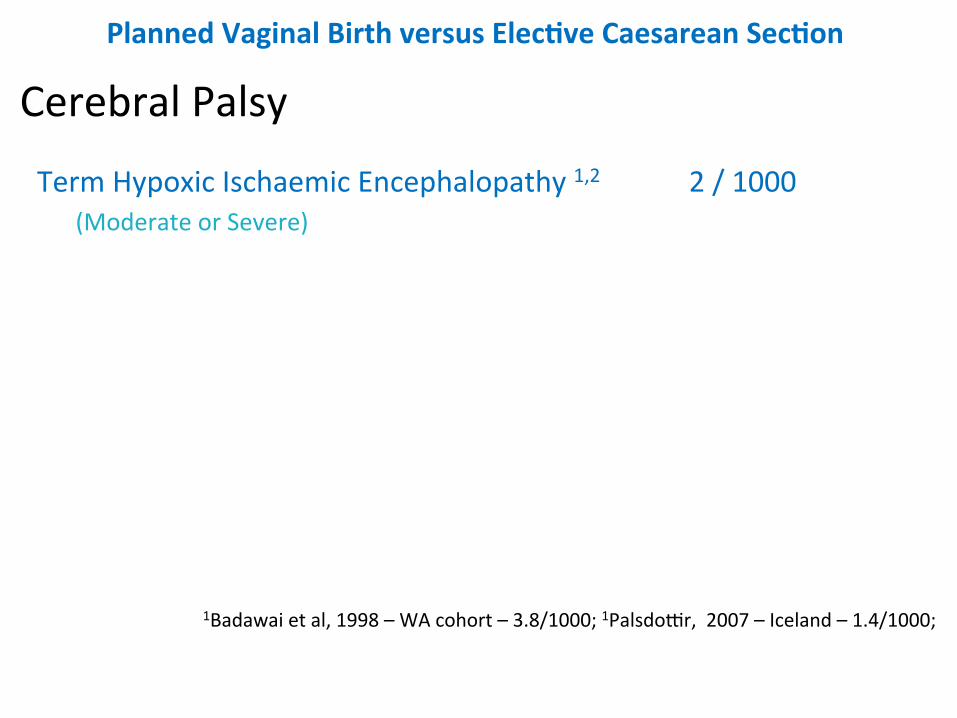
Cerebral Palsy
Term Hypoxic Ischaemic Encephalopathy 1,2 2 / 1000 (Moderate or Severe)
1Badawai et al, 1998 – WA cohort – 3.8/1000; 1Palsdoxr, 2007 – Iceland – 1.4/1000;

Hypoxic-‐Ischaemic Encephalopathy Cerebral Palsy Outcome in HIE Survivors
Carli G, Reiger I, Evans N. 2004; Smith J et al 2000; Amile-‐Tieson 1986; Levene et al 1986
5%
25%
75%
0%
25%
50%
75%
HIE grade I HIE grade II HIE grade III

Planned Vaginal Birth versus Elec;ve Caesarean Sec;on
Cerebral Palsy
Hypoxic Ischaemic Encephalopathy 1,2 2 /1000 (Moderate or Severe)
HIE & Cerebral Palsy 3,4 0.6/1000
(using HIE G2 -‐>25% CP & HIE G3 -‐> 75% )
1Badawai et al, 1998 – WA cohort – 3.8/1000; 1Palsdoxr, 2007 – Iceland – 1.4/1000; 3Graham 2008; 4Blair & Stanley;
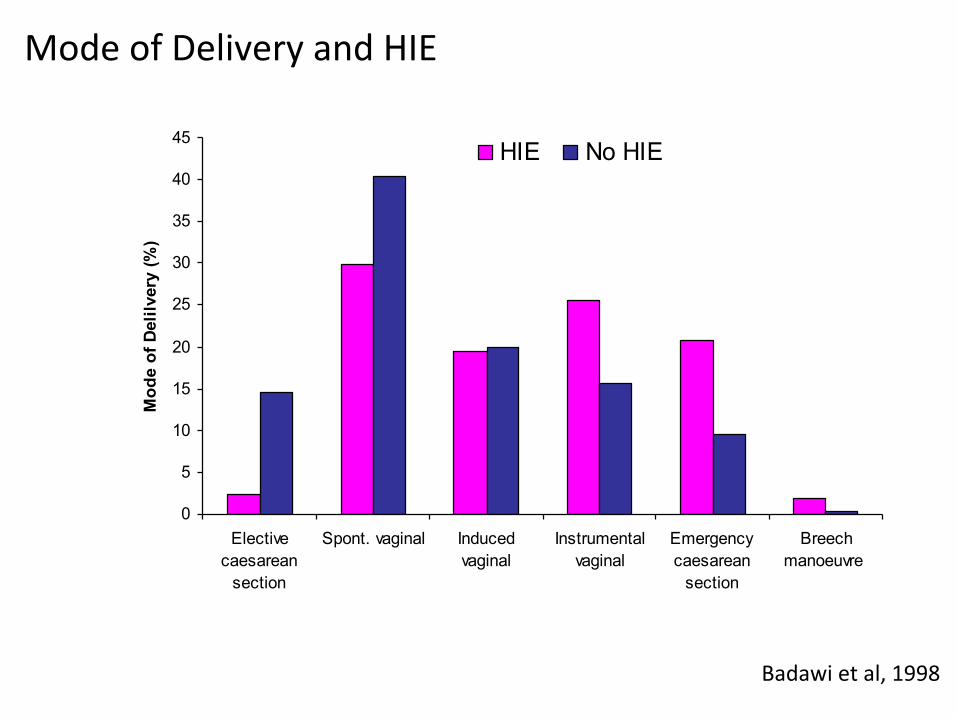
Mode of Delivery and HIE
Badawi et al, 1998
0
5
10
15
20
25
30
35
40
45
Electivecaesarean
section
Spont. vaginal Inducedvaginal
Instrumentalvaginal
Emergencycaesarean
section
Breechmanoeuvre
Mod
e of
Del
ilver
y (%
)HIE No HIE

Planned Vaginal Birth versus Elec;ve Caesarean Sec;on
Cerebral Palsy
Hypoxic Ischaemic Encephalopathy 1,2 2 /1000 (Moderate or Severe)
HIE & Cerebral Palsy 3,4 0.6/1000
(using HIE G2 -‐>25% CP & HIE G3 -‐> 75% )
Cerebral Palsy (Elec Caes) 1 0.1/1000 (using 15% CP elec CS cf other term births 3)
1Badawai et al, 1998 – WA cohort – 3.8/1000; 1Palsdoxr, 2007 – Iceland – 1.4/1000; 3Graham 2008; 4Blair & Stanley;
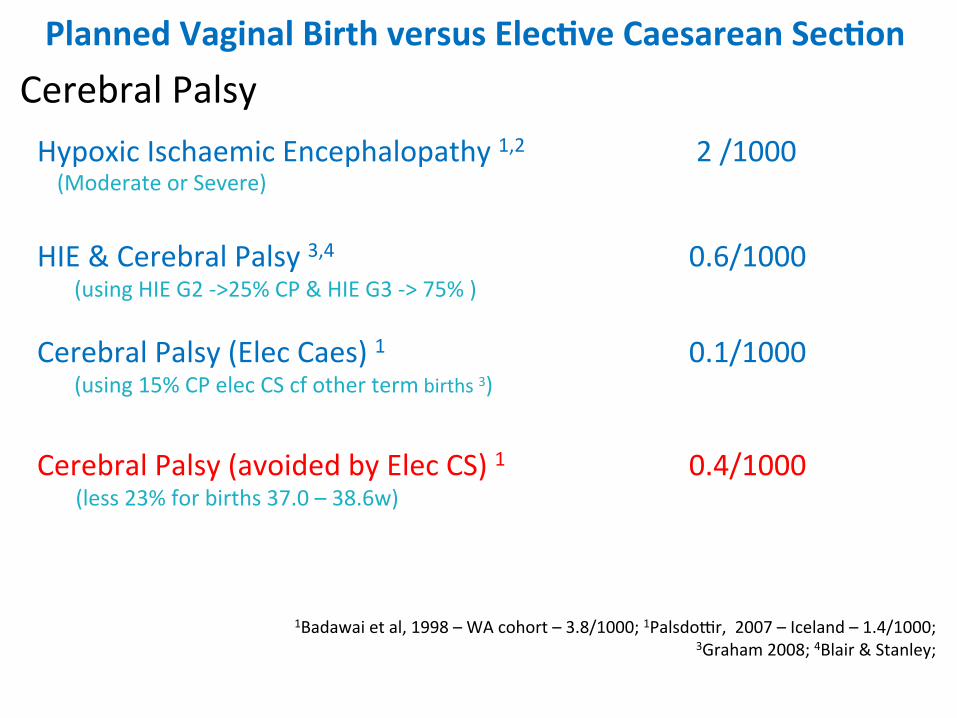
Planned Vaginal Birth versus Elec;ve Caesarean Sec;on Cerebral Palsy
Hypoxic Ischaemic Encephalopathy 1,2 2 /1000 (Moderate or Severe)
HIE & Cerebral Palsy 3,4 0.6/1000
(using HIE G2 -‐>25% CP & HIE G3 -‐> 75% )
Cerebral Palsy (Elec Caes) 1 0.1/1000 (using 15% CP elec CS cf other term births 3)
Cerebral Palsy (avoided by Elec CS) 1 0.4/1000 (less 23% for births 37.0 – 38.6w)
1Badawai et al, 1998 – WA cohort – 3.8/1000; 1Palsdoxr, 2007 – Iceland – 1.4/1000; 3Graham 2008; 4Blair & Stanley;

Planned Vaginal Birth versus Elec;ve Caesarean Sec;on
Favouring Elec0ve Caesarean Sec0on
Brachial Plexus Palsy ….

Planned Vaginal Birth versus Elec;ve Caesarean Sec;on Brachial Plexus Palsy (permanent aker shoulder dystocia with vaginal birth)*
Trondheim, Norway Baske et al, 2008 0.5 / 1000 Los Angeles, USA Gherman et al 1998 0.1 / 1000 Glaveston, USA Chauhan et al, 2005 0.1 / 1000
* Rates of temporary BPP approximately 6x greater

Planned Vaginal Birth versus Elec;ve Caesarean Sec;on
Perinatal Mortality or Long Term Serious Morbidity Mortality 1.9 /1000 Cerebral Palsy 0.4 /1000 Permanent Brachial Plexus Palsy 0.2 /1000 Addi0onal Perinatal Death / Disability 2.5 /1000
(1/400)

Planned Vaginal Birth
Is 1/400 a “Material Risk”?

N= 600, >36 weeks’ gestation Preliminary written information
Risks in everyday life Risks in pregnancy Unavoidable risk of stillbirth at term (3:10,000)
Visual probability aid
Portrayed varying levels of extra risk (1:10,000-1:50)
‘if the increased risk of serious harm to the baby with vaginal delivery was greater than 1 in…., I would prefer delivery by caesarean section’

What level of Fetal Risk (with attempted Vaginal Birth) do Patients regard as an Indication for Caesarean Section?
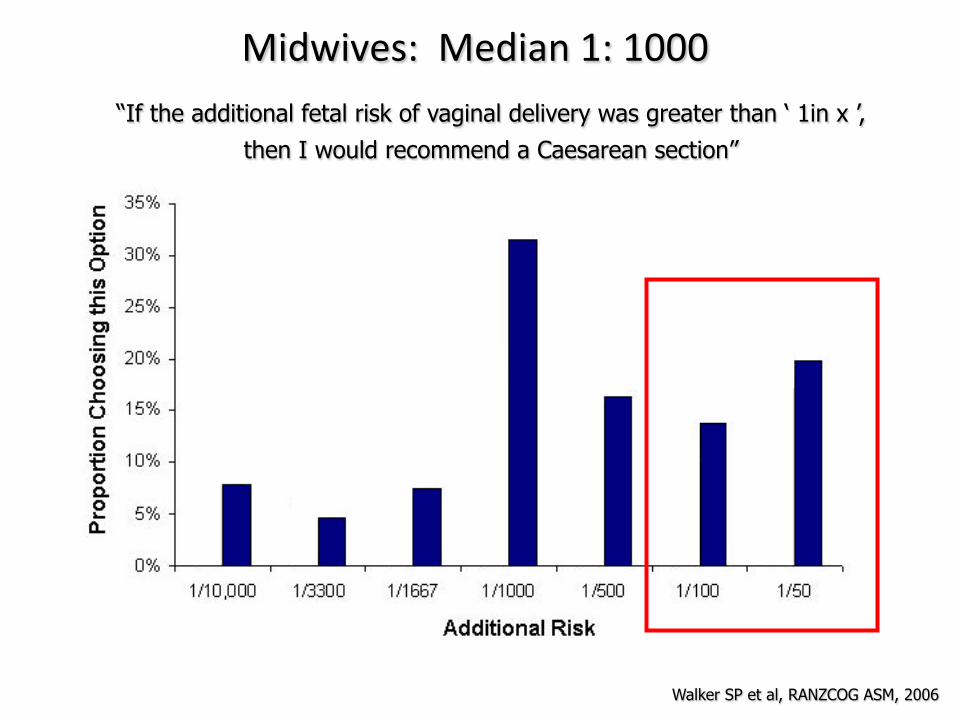
Midwives: Median 1: 1000 “If the additional fetal risk of vaginal delivery was greater than ‘ 1in x ’,
then I would recommend a Caesarean section”
Walker SP et al, RANZCOG ASM, 2006
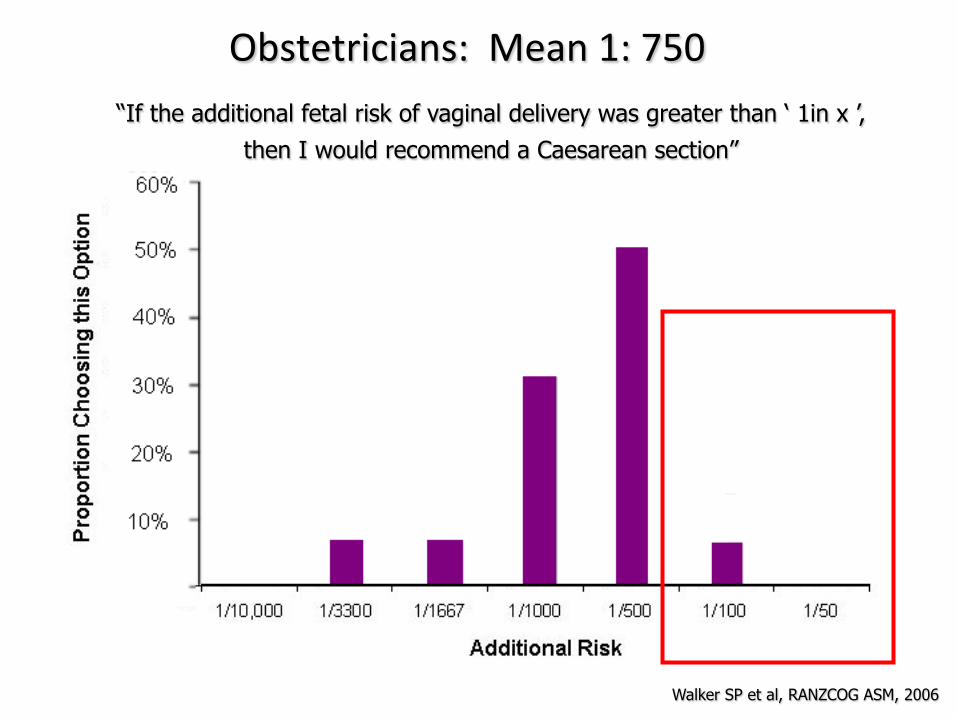
Obstetricians: Mean 1: 750 “If the additional fetal risk of vaginal delivery was greater than ‘ 1in x ’,
then I would recommend a Caesarean section”
Walker SP et al, RANZCOG ASM, 2006

A Paradox for Maternity Carers …

Planned Vaginal Birth versus Elec;ve Caesarean Sec;on
So for most women, nearly all obstetricians and most midwives …………..

Informed Consent for Planned Vaginal Birth ?
So for most women, nearly all obstetricians and most midwives ………….. “Perinatal Risks of Planned VD aker 39 weeks’ (1 in 400) exceeds The risk they define as acceptable to avoid CS” (1 in 750)

Awai;ng Spontaneous Labour
Informed Consent?
Awai;ng Spontaneous Labour
Informed Consent?
There is a duty of care upon the provider of maternity care to inform of the “Material Risks”
of “Awai0ng Spontaneous Labour”

Awai;ng Spontaneous Labour
The Evidence

Awai;ng Spontaneous Labour – Informed Consent?
Postdates Pregnancy

Informed Consent for Awai0ng Spont. Labour?
Await Spontaneous Labour – Informed Consent?
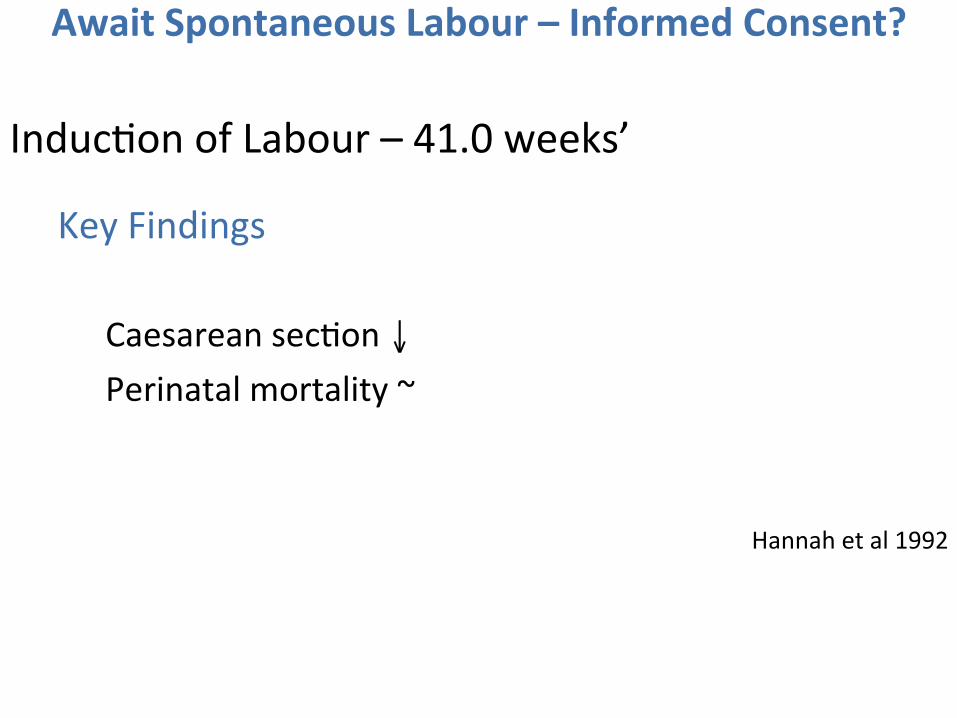
Induc0on of Labour – 41.0 weeks’
Key Findings Caesarean sec0on ↓ Perinatal mortality ~
Hannah et al 1992

Awai;ng Spontaneous Labour – Informed Consent?
Macrosomia

Informed Consent for Awai0ng Spont. Labour?

Await Spontaneous Labour – Informed Consent?
Induc0on of Labour – Macrosomia
Key Findings Birthweight ↓ Shoulder Dystocia ↓ Caesarean Sec0on ~ Spontaneous Vaginal Birth ↑
Boulvain et al 2015

Awai;ng Spontaneous Labour – Informed Consent?
Gesta0onal Hypertension


Await Spontaneous Labour – Informed Consent?
Induc0on of Labour – Gesta0onal Hypertension at 37 weeks’
Key Findings
Hypitat 2009
Caesarean sec0on 0·∙75 (0·∙55–1·∙04) (p =·∙085)
Composite Adverse Maternal Outcome 0·∙71 (0·∙59–0·∙86) (p<0·∙0001)
Composite adverse Neonatal Outcome 0.75 (0.45-‐1.26) (p=0.28)

Awai;ng Spontaneous Labour – Informed Consent?
“Lower Risk” Pregnancy

Ingemarssson 1997; Vashevnik, Walker & Permezel 2007
Perinatal Death
0.00%
0.05%
0.10%
0.15%
0.20%
0.25%
0.30%
0.35%
36 37 38 39 40 41 42 43
Gestation
Perin
atal
Dea
ths
each
Wee
k of
Bab
ies
in
Ute
ro
Sweden 1982-1991 Victoria 1991-2002

Await Spontaneous Labour – Informed Consent?
Are these late Perinatal Deaths avoidable by IOL?
Only 3 Perinatal Deaths aker 12,773 IOL at MHW 1999-‐2009
1 / 4000
Permezel & Milne, JOGR 2105
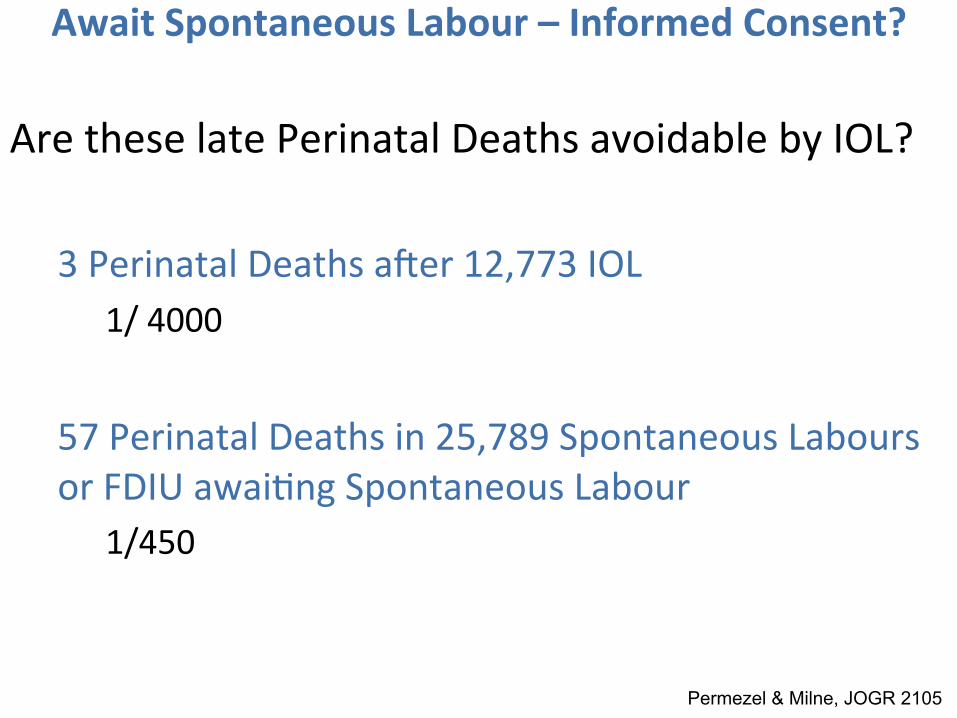
Await Spontaneous Labour – Informed Consent?
Are these late Perinatal Deaths avoidable by IOL?
3 Perinatal Deaths aker 12,773 IOL 1/ 4000
57 Perinatal Deaths in 25,789 Spontaneous Labours or FDIU awai0ng Spontaneous Labour
1/450
MHW 1999-‐2009; Permezel & Milne, JOGR 2015
Permezel & Milne, JOGR 2105

Await Spontaneous Labour – Informed Consent?
Rou0ne IOL?
3 Perinatal Deaths aker 12,773 IOL 1/ 4000 NOTE: a policy of rou0ne IOL would include high heads and unfavourable Cx
57 Perinatal Deaths in 25,789 Spontaneous Labours or FDIU awai0ng Spontaneous Labour
1/450 NOTE: not all prevented by rou0ne IOL as some before scheduled IOL
MHW 1999-‐2009; Permezel & Milne, JOGR 2015
Permezel & Milne, JOGR 2105

Awai;ng Spontaneous Labour – Informed Consent?
“Low Risk” Models of Care

Ingemarssson 1997; Vashevnik, Walker & Permezel 2007
Maternity Care – Informed Consent?
0.0
5.0
10.0
15.0
20.0
25.0
30.0
35.0
"Mixed Risk" "Low Risk"
31.0
15.8
30.4
12.4 15.6
12.3
Obs
tetri
c In
terv
entio
n (%
)
Obstetric Intervention in Mixed Risk and Low Risk Models of Care
Induction Rate Caesarean Section Rate Instrumental Delivery Rate
Permezel & Milne, JOGR 2105

Ingemarssson 1997; Vashevnik, Walker & Permezel 2007
Maternity Care – Informed Consent?
Permezel & Milne, JOGR 2105

Maternity Care – Informed Consent?
The Second Paradox “Mixed Risk – High Interven0on Care”
Meant to be the more complex cases BUT lower Ap5 < 7 and lower perinatal mortality
“Low Risk – Low Interven0on Care”
Meant to be the less complex cases BUT higher Ap5 < 7 and higher perinatal mortality

Summary
Birth -‐ Informed Consent?
Key Points

Maternity Care – Informed Consent?
1. Rate of “preventable” Serious Adverse Perinatal Outcomes

Maternity Care – Informed Consent?
1. Rate of Serious Adverse Perinatal Outcomes
~ 1 / 400 have a serious adverse outcome > 38w (that would be mostly avoided by elec0ve CS)

Maternity Care – Informed Consent?
2. Rate of Serious Maternal Adverse Outcomes

Maternity Care – Informed Consent?
2. Rate of Serious Maternal Adverse Outcomes
Vs
Pelvic Floor Damage Placenta Accreta

Maternity Care – Informed Consent?
3. Women are diverse in their Priori0es for Birth

Maternity Care – Informed Consent?
3. Women are diverse in their Priori0es for Birth
some prioritise fetal welfare at any cost
others prioritise low intervention

Maternity Care – Informed Consent?
4. Models of Care cater for that diversity in Priori0es for Birth

Maternity Care – Informed Consent?
4. Models of Care cater for that diversity in Priori0es for Birth
Maternity Care – Informed Consent?
5. Informed Consent
Informed Consent in Maternity Care must alert women to the “Material Risks” of all management including those of
“Awai0ng Spontaneous Labour”

Thank You
Informed Consent in Maternity Care


Maternity Care – Informed Consent?