proficiency of non-native nepali speakers in the use …
TRANSCRIPT

1
PROFICIENCY OF NON-NATIVE NEPALI SPEAKERS
IN THE USE OF COMMUNICATIVE FUNCTIONS
A Thesis Submitted to the Department of English Education
In Partial Fulfilment for Master of Education in English
Submitted by
Umesh Adhikari
Faculty of Education
Tribhuvan University, Kirtipur
Kathmandu, Nepal
2010

2
PROFICIENCY OF NON-NATIVE NEPALI SPEAKERS
IN THE USE OF COMMUNICATIVE FUNCTIONS
A Thesis Submitted to the Department of English Education
In Partial Fulfilment for the Master of Education in English
Submitted By
Umesh Adhikari
Faculty of Education
Tribhuvan University, Kirtipur
Kathmandu, Nepal
2010
T.U. Reg. No.: 37140-94 Date of Approval of the
Campus Roll No.: 262 Thesis Proposal: 2067-05-24
Second Year Examination Roll No.: 280558/2066 Date of Submission:

3
DECLARATION
I hereby declare that to the best of my knowledge this thesis is original, no part
of it was earlier submitted for the candidature of research degree to any
university.
………………….
Date: Umesh Adhikari

4
RECOMMENDATION FOR ACCEPTANCE
This is to certify that Mr. Umesh Adhikari has prepared this thesis entitled
Proficiency of Non-native Nepali Speakers in the Use of Communicative
Functions under my guidance and supervision.
I recommend this thesis for acceptance.
Date :…………………….
Dr. Anju Giri
Professor,
Department of English Education
Faculty of Education
T.U., Kirtipur, Kathmandu

5
RECOMMENDATION FOR EVALUATION
This thesis has been recommended for evaluation by the following ‘Research
Guidance Committee’:
Signature
Dr. Chandreshwar Mishra __________________
Professor and Head, Chairperson
Department of English Education
T.U., Kirtipur
Dr. Anju Giri (Guide) __________________
Professor, Member
Department of English Education
T.U., Kirtipur
Dr. Anjana Bhattarai __________________
Reader, Member
Department of English Education
T.U., Kirtipur
Date: ……………………..

6
EVALUATION AND APPROVAL
This thesis has been evaluated and approved by the following ‘Research
Evaluation and Approval Committee’.
Signature
Dr. Chandreshwar Mishra __________________
Professor and Head, Chairperson
Department of English Education
T.U., Kirtipur
Dr. Jai Raj Awasthi __________________
Professor, Member
Chairperson,
English and Other Foreign Languages
Education Subject Committee
Department of English Education
T.U., Kirtipur
Dr. Anju Giri (Guide) __________________
Professor, Member
Department of English Education
T.U., Kirtipur
Date:

7
DEDICATION
Dedicated to my late mother Dev Kumari Adhikari.

8
ACKNOWLEDGEMENTS
I am very much indebted to my thesis supervisor Dr. Anju Giri, Professor at the
Department of English Education, T.U. Kirtipur, for her special contribution for
providing me with essential ideas and techniques to carry out this research work. I am
extremely grateful to her for her regular guidance, invaluable suggestions,
encouragement and co-operation to carry out my thesis in this form from very
beginning.
I would like to express my sincere gratitude to Dr. Chandreshwar Mishra, Professor
and Head, Department of English Education. Similarly, I am equally indebted to the
senior faculties at the Department of English Education Prof. Dr. Jai Raj Awasthi,
Prof. Dr. Shanti Basnyat, Prof. Dr. Tirtha Raj Khanniya and Prof Dr. Govinda
Raj Bhattarai for their support and encouragement.
I am grateful to Dr. Anjana Bhattarai, Dr. Bal Mukunda Bhandari and other
faculty members of the department for their genuine inspiration and insightful
suggestions.
I am gratefully acknowledge my deep indebtedness to my wife Mrs. Meena
Adhikari (Khanal) and my brother Mr. Ramesh Adhikari for their continuous
support, encouragement and assistance not only to bring out this thesis but also to
complete my Master Degree on time.
My sweet remembrance also goes to my small daughter Tankeshwary Adhikari who
constantly teased me by throwing, writing and tearing the pages at the time of writing
the thesis.
Last but not least, I am highly grateful to my father Govinda Adhikari and late
mother Dev Kumari Adhikari without whom I would not get this achievement in my
life.
Umesh Adhikari

9
ABSTRACT
The study entitled 'Proficiency of Non-native Nepali Speakers in the Use of
Communicative Functions' is an attempt to compare, analyze and find out
the communicative proficiency of four groups of non-native Nepali speakers,
i.e. Magar, Rai, Yadav, and Shrestha who are studying in different schools of
Kathmandu valley. The researcher has tried to find out the itemwise
proficiency of the students in terms of school, gender and mothertongue. From
the whole study, the researcher found 48.78% proficiency of the students.
Similarly, female students were better in comparison to male students. Among
all four group of non-native Nepali speakers, Rai and Yadav group of students
showed the best and weakest proficiency respectively.
This thesis comprises four chapters. Chapter one deals with the introduction,
review of the related literature objectives and significant of the study. Chapter
two introduces the methodology adapted for the study under which sources of
data, population of the study, sample population, tools of data collection,
process of data collection and limitations of the study are mentioned. In order
to carry out the research, the researcher has used two types of data collection,
i.e. primary source of data collection and secondary source of data collection.
The population of the study constitutes the tenth graders studying in five
different schools of Kathmandu valley. To collect the data the researcher
visited the selected schools and administered the questionnaire to the sample
population. Chapter three includes analysis and interpretation of the data in
which the researcher has used both descriptive and analytical approaches for
the analysis and interpretation of the data. Chapter four consists of findings and
recommendations.

10
TABLE OF CONTENTS
Declaration I
Recommendation for acceptance II
Recommendation for evaluation III
Evaluation and approval IV
Dedication V
Acknowledgements VI
Abstract VII
Table of Contents VIII-XI
List of Tables XII-XIII
Abbreviations and Symbols XIV
CHAPTER – ONE: INTRODUCTION 1-16
1.1 General Background 17
1.1.1 ELT Situation 18
1.1.2 Language and Culture in Nepal 19
1.1.3 Language Functions 20
1.1.4 Classification of Communicative Functions 22
1.1.5 Correlation Between Language Forms and Language Functions 26
1.1.6 Language Functions 27
1.1.7 Testing Proficiency of Communicative Functions 28
1.2 Review of the Related Literature 30
1.3 Objectives of the Study 32
1.4 Significance of the Study 32
CHAPTER – TWO: METHODOLOGY 17-19
2.1 Sources of Data 33
2.1.1 Primary Sources of Data 33
2.1.2 Secondary Sources of Data 33
2.2 Population of the Study 33
2.3 Sample Population 33
2.4 Tools for Data Collection 34

11
2.5 Process of Data Collection 34
2.6 Limitations of the Study 35
CHAPTER – THREE: ANALYSIS AND INTERPRETATION 20-71
3.1 Schoolwise Analysis 36
3.1.1 Total Proficiency of the Students 37
3.1.2 Total Comparison of Schools 37
3.1.3 Itemwise Total Proficiency of the Students 38
3.1.4 Total Proficiency of Nobel Academy 39
3.1.5 Itemwise Proficiency of Nobel Academy 39
3.1.6 Total Proficiency of Elixir Academy 40
3.1.7 Itemwise Proficiency of Elixir Academy 41
3.1.8 Total Proficiency of Gyanodaya Secondary School 42
3.1.9 Itemwise Proficiency of Gyanodaya Secondary School 42
3.1.10 Total Proficiency of Grammar Public School 43
3.1.11 Itemwise Proficiency of Grammar Public School 44
3.1.12 Total Proficiency of Saradha Secondary School 45
3.1.13 Itemwise Proficiency of Saradha Secondary School 45
3.1.14 Comparison of Schools in Item No. 1. 46
3.1.15 Comparison of Schools in Item No. 2 47
3.1.16 Comparison of Schools in Item No. 3 48
3.1.17 Comparison of Schools in Item No. 4 49
3.1.18 Comparison of Schools in Item No. 5 50
3.1.19 Comparison of Schools in Item No. 6 51
3.1.20 Comparison of Schools in Item No. 7 52
3.1.21 Comparison of Schools in Item No. 8 53
3.1.22 Comparison of Schools in Item No. 9 53
3.1.23 Comparison of Schools in Item No. 10 54
3.2 Genderwise Analysis 55
3.2.1 Total Proficiency of the Students 55
3.2.2 Itemwise Proficiency of the Students 56
12
3.2.3 Total Proficiency of Nobel Academy 58
3.2.4 Itemwise Proficiency of Nobel Academy 58
3.2.5 Total Proficiency of Elixir Academy 60
3.2.6 Itemwise Proficiency of Elixir Academy 60
3.2.7 Total Proficiency of Gyanodaya Secondary School 62
3.2.8 Itemwise Proficiency of Gyanodaya Secondary School 62
3.2.9 Total Proficiency of Grammar Public School 64
3.2.10 Itemwise Proficiency of Grammar Public School 64
3.2.11 Total Proficiency of Saradha Secondary School 66
3.2.12 Itemwise Proficiency of Saradha Secondary School 67
3.2.13 Comparison of Schools in Item No. 1 69
3.2.14 Comparison of Schools in Item No. 2 70
3.2.15 Comparison of Schools in Item No. 3 71
3.2.16 Comparison of Schools in Item No. 4 72
3.2.17 Comparison of Schools in Item No. 5 73
3.2.18 Comparison of Schools in Item No. 6 74
3.2.19 Comparison of Schools in Item No. 7 75
3.2.20 Comparison of Schools in Item No. 8 76
3.2.21 Comparison of Schools in Item No. 9 77
3.2.22 Comparison of Schools in Item No. 10 78
3.3 Mother Tonguewise Analysis 79
3.3.1 Total Proficiency of the Students 80
3.3.2 Schoolwise Total Comparison of Schools 80
3.3.3 Itemwise Total Proficiency of the Students 82
3.3.4 Total Proficiency of Nobel Academy 85
3.3.5 Total Proficiency of Elixir Academy 86
3.3.6 Total Proficiency of Gyanodaya Secondary School 86
3.3.7 Total Proficiency of Grammar Public School 87
3.3.8 Total Proficiency of Saradha Secondary School 88

13
CHAPTER – FOUR: FINDINGS AND RECOMMENDATIONS 72-75
4.1. Findings 89
4.2. Recommendations 91
References
Appendices

14
LIST OF TABLES
Page No.
Table No. 1 Total Proficiency of the Students 37
Table No. 2 Total Comparision of the Schools 37
Table No. 3 Itemwise Total Proficiency of the Students 38
Table No. 4 Total Proficiency of Nobel Academy 39
Table No. 5 Itemwise Proficiency of Nobel Academy 39
Table No. 6 Total Proficiency of Elixir Academy 40
Table No. 7 Itemwise Proficiency of Elixir Academy 41
Table No. 8 Total Proficiency of Gyanodaya Secondary School 42
Table No. 9 Itemwise Proficiency of Gyanodaya Secondary School 42
Table No. 10 Total Proficiency of Grammar Public Sschool 43
Table No. 11 Itemwise Proficiency of Grammr Public School 44
Table No. 12 Total Proficiency of Saradha Secondary Sschool 45
Table No. 13 Itemwise Proficiency of Saradha Secondary School 45
Table No. 14 Comparison of Schools in Item No. 1 46
Table No. 15 Comparison of Schools in Item No. 2 47
Table No. 16 Comparison of Schools in Item No. 3 48
Table No. 17 Comparison of Schools in Item No. 4 49
Table No. 18 Comparison of Schools in Item No. 5 50
Table No. 19 Comparson of Schools in Item No. 6 51
Table No. 20 Comparison of Schools in Item No. 7 52
Table No. 21 Comparison of Schools in Item No. 8 53
Table No. 22 Comparison of Schools in Item No. 9 53
Table No. 23 Comparison of Schools in Item No. 10 54
Table No. 24 Total Proficiency of the Students 55
Table No. 25 Itemwise Total Proficiency of the Students 56
Table No. 26 Total Proficiency of Nobel Academy 58
Table No. 27 Itemwise Proficiency of Nobel Academy 58
Table No. 28 Total Proficiency of Elixir Academy 60

15
Table No. 29 Itemwise Proficiency of Elixir Academy 60
Table No. 30 Total Proficiency of Gyanodaya Secondary School 62
Table No. 31 Itemwise Proficiency of Gyanodaya Secondary School 62
Table No. 32 Total Proficiency of Grammar Public School 64
Table No. 33 Itemwise Proficiency of Grammar Public School 64
Table No. 34 Total Proficiency of Saradha Secondary School 66
Table No.35 Itemwise Proficiency of Saradha Secondary School 67
Table No. 36 Comparison of School in Item No. 1 69
Table No. 37 Comparison of School in Item No. 2 70
Table No. 38 Comparison of School in Item No. 3 71
Table No. 39 Comparison of School in Item No. 4 72
Table No. 40 Comparison of School in Item No. 5 73
Table No. 41 Comparison of School in Item No. 6 58
Table No. 42 Comparison of School in Item No. 7 75
Table No. 43 Comparison of School in Item No. 8 76
Table No. 44 Comparison of School in Item No. 9 77
Table No. 45 Comparison of School in Item No. 10 78
Table No. 46 Total Proficiency of the Students 80
Table No. 47 Itemwise Total Comparison of the Schools 80
Table No. 48 Itemwise Total Proficiency of the Students 82
Table No. 49 Itemwise Total Proficiency of Nobel Academy 85
Table No. 50 Itemwise Total Proficiency of Elixir Academy 86
Table No. 51 Itemwise Total Proficiency of Gyanodaya Secondary
School 86
Table No. 52 Itemwise Total Proficiency of Grammar Public School 87
Table No. 53 Itemwise Total Proficiency of Saradha Secondary
School 88

16
ABBREVIATIONS AND SYMBOLS
C.A. : Correct Answers
E.A. : Elixir Academy
etc. : Etcetera
G.P.S. : Grammer Public School
G.S.S. : Gyanodaya Secondary School
I.A. : Incorrect Answers
I.A. : Intermediate in Arts
i.e. : That is
I.Ed. : Intermediate in Education
M.Ed. : Master in Education
N.A. : Nobel Academy
N.A. : No Answers
p. : Page
P.C.L. : Proficiency in Certificate Level
Reg. : Registration
S.L.C. : School Leaving Certificate
S.S.S. : Saradha Secondary School
T. : Total
T.U. : Tribhuvan University
U.N.O. : United Nations Organization

17
CHAPTER - ONE
INTRODUCTION
1.1 General Background
Langauge is an important property of human beings. We can perform many
things by using language. Communication is possible through different ways
and means among them human beings use aural-oral means of communicaiton
which is as important as food for surival in the speech community.
"A language is a set of signals by which we communicate" (Todd, 1987, p.6). It
is the most widely used means of communication. By communication, we
mean the exchange of ideas, thoughts, feelings, etc. between two or more
persons.
Human being is a social creature. He/she can not live in isolation. In order to
fulfill his/her desires, needs and expectations, he/she needs language to
communicate. So, language communicates. "Human language is used not only
to conceal the message for out – groups but used to communicate ideas and
information within speech community" (Bandhu, 2060, p.8).Indeed, language
is the most valuable single possession of the human race in the absence of
which no human being will be alive in this vary world .
To talk about the English language, it is one of the UN languages which is
spoken by millions of people in this world. The U.N.O. has allowed it as an
official language. So, it is called an international language. One in every seven
human beings can speak it. More than half of the world's books and three-
quarters of international mails are in English. English has the largest
vocabulary perhaps as many as two million words and one of the noblest
bodies of literature. In a nutshell, we can say that it is the international
language for Nepal and a vital tool for all students to become successful in

18
local, national and international communication. Undoubtedly, English is one
of the means of communication globally and is also the major world language.
1.1.1 ELT Situation
The 20th century has witnessed a lot of progress in the field of linguistics and
language pedagogy. A number of approaches and methods of teaching and
learning have been proposed and practiced. The grammar translation method
was practiced at the very beginning in a long run and it is still in use. To
overcome the inadequacies of grammar translation method, other several
methods such as direct method, audio-lingual method, communicative method
have been practiced over the years. In addition to the behaviouristic approach,
we have also practiced natural approach, communicative approach, functional
approach, etc. By the same token, various types of syllabi have been used and
replaced by another one. For example, lexical syllable was replaced by
structural syllabus, and communicative syllabus has now been in practice.
There has been a dominant role of different philosophies or language and
language learning at the stages of historical development. The behaviourstic
approach which is related to structuralism in linguistics and empiricists school
of thought in philosophy, emphasized the stimulus-response-reinforcement
minimizing the role of human cognition. Cognitive psychologists, on the other
hand, emphasized on the role of cognition. After Chomsky's criticisms of
Skinner's ''Review of verbal behaviour' (1959), he introduced and defined the
LAD ( i.e. Language Acquisition Device) and explained the role of LAD in
language acquisition and learning. Chomsky, one of the renowned linguist of
the 20th century emphasized the linguistic competence which he calls
"creativity" in language – the fact that a competent native speaker can produce
a meaningful sentence which has no exact precedent in the speaker's earlier
linguistic experience, as well as the fact that competent auditors can understand
the sentence immediately, although it is equally new to them (Abraham 2005,
p.151). Later, Hymes (1972) proposed that in addition to the linguistic

19
competence we need to acquire communicative competence. According to him,
communicative competence refers to 'the intuitive mastery that the native
speaker possesses to use and interpret language appropriately in the process of
interaction and in relation to social context’ (as cited in Khaniya 2005, p. 23).
In fact, when children acquire their first language they not only grasp the
formal properties of language but also the functional aspect of it. So, a child
becomes linguistically and communicatively competent. But in the case of
second language, learner may not be communicatively competent in that
language even though he is linguistically competent. He may produce
grammatically correct sentences but it does not mean that those sentences are
situationally appropriate. Indeed, a language user does not become
communicatively competent unless he knows when to use a particular structure
to whom, when, where and in what manner. The fact is that he has to be
situationally appropriate to the content in serving different communicative
functions.
1.1.2 Language and Culture in Nepal
Language and culture are regarded as the two sides of the same coin. Cultural
knowledge including knowledge of various sub-cultures is referred to as
language. Culture is a complex network of knowledge, belief, art, morals,
foods, dresses, festivals, laws, customs, rituals and other capabilities and habits
acquired by a man as a member of a society. Language is a cultural
phenomenon through which this abstract nexus is materialized and articulated.
Language is the product and active participant of culture.
We all know that, Nepal is a multilingual, multicultural, multireligious and
multiethnic country. Nepal, though a small country, has been very fertile for
language. According to the census report of 2001 there are more than 102
ethnic groups. Out of those groups, Brahmin, Chhetri, so-called Untouchable
and Indigenous respectively consists of 12.74, 15.80, 13.35 and about 39
percentage of the ethnic groups. These ethnic groups may perhaps have

20
different background in respect of their religion, culture, language, etc.
Therefore, their communicative proficiency in the use of different
communicative functions may perhaps also be different by virtue of their such
unique self identity in religion, culture, language, etc. Especially, the choice of
exponents which are the language utterances or forms that different non-native
Nepali speakers use to express a message largely depends upon the linguistic
competence and the situation to be encountered and the personalities involved
in speaking and the degree of formality to be observed. Due to this reasons, the
researcher has focused his study on Proficiency of Non-Native Nepali Speakers
in the Use of Communicative Functions which might be a new research work
in the English Education Department.
1.1.3 Language Functions
The present two year English curriculum for grade ten has two main purposes:
one is to enable students to exchange ideas with people of any nationality who
speak or write English, and the other is to expose them to the vast treasures of
knowledge and pleasure available in written and spoken English. With this
purpose in mind, the curriculum has been prepared in order to make the grade
ten courses more applicable to society both in Nepal and outside world.
Language in the curriculum is seen as a skill that allows one to get things done.
The things done through language are described as functions. Since the entire
research is based on the communicative functions it is worth-mentioning to talk
about language functions in details.
Wilkins (1976, p. 26) states that
The categories of communicative functions refer to the
expressing functions or functional meaning (i.e. the social
purpose of the utterance). For him, categories of communicative
functions are intended to handle the use of language.

21
Corder (1973, p. 32) reveals the fact that
Most of linguists in one way or another try to work into the
definition some statement about the function of language usually
in the form of such phrases as: by which man communicates; a
system of communications; for the purpose of communication.
Corder takes languages as a means of communication. He further notices the
language function as to use to some purpose, to communicate, and be
communicated to; to assume certain roles.
According to Halliday:
The term 'function' is used in two distinct though related sense at
two very different points in the description of language. First, it is
used in the sense of 'grammatical (or syntactic) function' to refer
to elements of linguistic structures such as actor, and goal or
subject and object or theme and rheme. These functions are the
role occupied by classes of words, phrases and the like in the
structure of higher units. Secondly, it is used to refer to the
'functions' of language as a whole, which plays a certain role our
lives; that is required to serve certain universal type of demand.
(1973, p. 104)
To quote Sthapit (2000, p. 9), "A thing can be said to have at least three facts:
substance, form and function. For example, the three facts to a glass can be
described as
Substance : - glass, steel, paper or plastic

22
Form : - cylindrical with one end open
Function : - communicating message
So, what is a function? The function of a thing is the purpose it serves or the
use it is put to."
Thus, despite finding various definitions of language functions, we come into
conclusion that language function is the purpose for which language is used.
Language function is the umbrella term which constitutes both grammatical
function and communicative function. By grammatical function, we understand
the relationship of a constituent (word or phase) with other constituents in a
sentence, whereas communicative function refers to the role that language
plays in communication in a social context. To go into the realm of
grammatical functions is outside the scope of this research. So the
communicative function is described in some detail here.
To be straightforward, language function or function of language generally
refers to the communicative function of language. For example, language is
used to instruct people, to express attitude, to seek, or impart factual
information, to socialize, etc. So, instructing, expressing attitude, imparting and
seeking factual information, etc. are some of the functions of language.
1.1.4 Classification of Communicative Functions
Communicative functions of a language have been classified variously from
broad to narrow classifications. Many linguists have defined and classified it
differently.
How many functions does language have? This question can not
be answered definitely, partly because the complex nature of
language and society and their interrelationship defies any such
enumeration and partly because there is nothing like the only

23
right or proper way of classifying language functions. As a result
the number of communicative functions of language depends on
how broad or how narrow a given classification system is,
(Sthapit, 2000, p. 10).
Thus, we can say that various linguists have the right to classify the language
functions differently. Some classifications of language functions are outlined
below:
Wilkins (1976, p. 44) classifies language functions into six types as follows:
1. Judgment and Evaluation: This category deals with assessments and
the subsequent expression of those assessments. For example, valuation,
verdiction, committal, release, approval, disapproval, etc.
2. Suasion: These are categories of utterance designed to affect the
behaviour of others. For example, inducement, compulsion, prediction,
tolerance, etc.
3. Argument: These categories relate to the exchange of information and
views. For example, information, agreement, disagreement, concession,
etc.
4. Rational Inquiry and Exposition: This category relates to the rational
organization of thought and speech. For example, implication,
deduction, supposition, assumption, proposition, classification,
comparison, contrast, generalization, etc.
5. Personal Emotions: The functions in this category express the speaker's
emotional reactions to events and people. For example, positive
emotions like pleasure, enjoyment, satisfaction, delight, wonder, etc. and
negative shock, displeasure, dissatisfaction, annoyance, irritation, care,
anxiety, etc.
24
6. Emotional Relations: These are largely phatic utterances expressing as
they do various relationships with the person addressed. For example,
greeting, sympathy, gratitude, flattery, hostility, etc.
Halliday (1973) gives seven different functions of languages as follows:
1. Instrumental: The instrumental function serves to manipulate the
environment to cause certain events to happen.
2. Regulatory: The regulatory function of language is the control of
events.
3. Representational: The representational function is the use of language
to make statements, convey facts and knowledge, explain or report-that
is, to 'represent' reality as one sees it.
4. Interaction: The interactional function of language serves to ensure
social maintenance.
5. Personal: The personal function allows a speaker to express feelings,
emotions, personality, etc.
6. Heuristic: The heuristic function involves language used to acquire
knowledge, to learn about the environment. Heuristic functions are often
conveyed in the form of questions that will lead to answers.
7. Imaginative: The imaginative function serves to create imaginary
systems or ideas.
Cordor (1973, p.44) classifies language functions as:
1. Personal: If the orientation is towards the speaker we have the personal
functions of language. It is through this function that the speaker reveals
his attitude towards what he is speaking about.

25
2. Directive: If the orientation is towards the hearer we have the directive
function of language. It is the function of controlling the behaviour of
the participant.
3. Phatic: If the focus is on the contact between the participants we have
the phatic function of language which establishes relations, maintains
them and promotes feelings of goodwill and fellowship, or social
solidarity.
4. Referential: If the focus is on topic we have referential function of
language.
5. Metalingustic: This function is associated with the code. When
language is used to talk about language itself, it is the metalinguistic
function of language.
6. Imaginative: Where the focus is on the message, we have the
imaginative function of language.
Van.Ek (1976, p.45) classifies language functions into six types as follows:
1. Imparting and seeking actual information. For example, identifying,
reporting, correcting, asking, etc.
2. Expressing and finding out intellectual attitudes. For example,
expressing agreement and disagreement, inquiring about agreement or
disagreement, denying something, accepting/ declaiming an offer or
invitation, offering to do something, giving and seeking permission to
do something, etc.
3. Expressing and finding out emotional attitude. For example, expressing
pleasure/displeasure, hope/surprise, satisfaction/dissatisfaction,
sympathy, want/desire, etc.
4. Expressing and finding out moral attitudes. For example, apologizing,
granting forgiveness, expressing approval/disapproval, regret,
indifference, etc.

26
5. Getting things done (Suasion). For example, suggesting a course of
action, requesting others to do something, inviting others to do
something, advising others to do something, warning, instructing,
offering, requesting, etc.
6. Socializing. For example, greeting and meeting people, introducing,
taking leave, attracting attention, congratulating and proposing a toast.
1.1.5 Correlation Between Language Forms and Language Functions
There is no one – to – one correlation between language forms and language
functions. One linguistic form can fulfill a variety of communicative functions
and, conversely, one function can be fulfilled by variety of linguistic forms.
Concludingly, the form-function relationship can be seen in three different
ways:
a. One linguistic form may serve variety of communicative functions.
For example - You shall have it tomorrow.
Form - Declarative
Function - Offering something
- Threatening
- Promising
b. One linguistic form may serve one communicative function.
For example - I'm Sorry.
Form - Declarative
Function - Making an apology
c. Several Linguistic forms may serve one communicative function.
For example-
Forms - You shouldn't write her.
- If I were you I would stop writing her.
- Why don't you stop writing her?
- How about stop writing her?
- I wonder if you could stop writing her.
- Try not to write her.

27
- Stop writing her.
- It's better if you stop writing her.
- Suggest stop writing her.
Function - Asking to stop writing her.
1.1.6 Language Functions
The content of the secondary English curriculum can be seen as a set of
functions realized linguistically by grammatical structures and lexical items.
The following ten language functions are selected from English curriculum of
grade ten for the fulfillment of this study. The language functions are given
below along with examples.
S.N. Functions Language
1. Reporting Statements He told me (that) he was leaving.
2. Reporting Questions Gita asked me where Hari was. She asked me
if he was at home.
3. Reporting commands The head teacher told me to come school at
ten o'clock
4. Giving and withholding
permission
You can …. But you mustn't … Let her sit
here.
Don't let them write in the book.
5. Reporting, giving and
withholding permission
I'm allowed to stay at home on Saturday.
They are not permitted to enter through this
gate.
6. Giving advice /warnings You should …/you ought to …
Why don't you …? You aren't allowed to …
7. Expressing conditions
(I)
If you play volleyball, you'll be late.
If you don't eat, you'll be hungry.
8. Expressing conditions
(II) (Unless, had,
provided that, if only)
Unless Sita could sing,She would not be very popular.If he had not come to Nepal, he would nothave seen Mt. Everest.

28
9. Asking for reasons
purposes and their
responses (because,
because of, so that, for,
to, in order to, therefore,
etc.)
Why did you go to Pokhara ?
I went to Pokhara because ………
Why do you go to the bank?
I go to bank so that I can ………
10. Expressing unexpected
results
(though/although/even
though, however, in
spite of , despite, etc.)
Although he is rich, he wears rages. The water
was icy cold, however we went swimming.
(Adapted from Secondary Level English Curriculum CDC, Nepal)
1.1.7 Testing Proficiency of Communicative Functions
The notion whether how situationally a person is appropriate to the context in
the use of different communicative functions is the matter of how proficient
that person is in that function. The term 'proficiency' is derived from the word
'proficient' which means according to the Oxford Advanced Learner's
Dictionary (1989), 'be able to do something in a skilled or an expert way
because of training and practice'. So, the term of proficiency refers to the
capability or efficiency of the students in the two broader skills of languages
productive and receptive. So the term 'Proficiency', more specifically, refers to
the capability or efficiency of the students in the use of different
communicative functions with reasonable ease according to the situations and
needs directed towards them. This vividly shows the fact that the notion of
proficiency is taken from the objective laid down in the use of the
communicative functions in the English language curriculum of the secondary
level so as to make the students capable to communicate and understand the
day-to-day situations, problems, needs, desires, etc. directed towards them.

29
With regards to testing proficiency of communicative functions, it seems
difficult to have a straightforward position. Different testing experts have given
different arguments. It is said that testing proficiency of communicative
function does not require that the tests themselves should be communicative.
As has been argued elsewhere, the context of an utterance emerges as very vital
in establishing its meaning.
What is convincing about testing is that the performance task in
communicative test should be representative of the type of task
the learner might encounter in their real life situation. They are
also expected to correspond to normal language use where an
integration of communicative skill is required. (Khaniya, 2005, p.
25)
In fact, while testing proficiency of communicative functions the tester should
try to judge the students' ability to use language appropriately for fulfilling
different language functions in various contexts. A language test that seeks to
find out what candidates can do with language provides a focus for purposeful
everyday communication activities. At the initial stage, the tester may give new
structures and ask the students to use those exponents in serving different
communicative functions appropriately. The tester may also give a situational
context and ask to use a particular function in that situation. The students can
also be asked to form various types of dialogues or conversation which will fit
in the given situations. Communicative exchanges can also be asked by giving
the situations of different formality levels of various exponents for serving
different communicative functions. The tester may prepare questionnaire of
different sorts such as questions requiring some context of language use so that
the informants will write as many communicative functions related to the
situations as they know. The tester may prepare multiple choice questions to
elicit the receptive abilities of the students.

30
1.2 Review of the Related Literature
A very few researches have been carried out regarding the communicative
proficiency of the students in the use of communicative functions. Some of the
researches related to my research study are as follows:
Guragain (2003) has conducted a research entitled 'A Study on the Learner's
Ability to Use Colloquial'. He wanted to find out the master's level students'
ability to use colloquial communicative expressions. He found that students
were better at interpretation the expressions than producing the same and that
M.Ed. (English) students were the most able and MBS students were the least
able to use colloquial communicative expressions.
Sharma (2004) has carried out a research entitled 'A Study on the Proficiency
in the Communicative Functions and their Exponents: A Comparative Study'.
He wanted to examine the proficiency of the S.L.C. level students in the
communicative function and their strengths and weaknesses in the structures
and communicative functions. He found that the students' proficiency in
English Language Structures and communicative functions was not
satisfactory. They had more mistakes in written discourse than oral discourse.
Dahal (2004) has conducted a research on 'Students' Proficiency in Expressing
Communicative Function'. He wanted to find out the students' proficiency in
expressing communicative functions. He also wanted to find out form function
reciprocity and show the vertical relationship of communicative functions
between secondary and higher secondary level. He found out that students'
proficiency was not found satisfactory. Most of the functions were realized by
only one form and most of the exponents were found in declarative forms and
most of the exponents were found to be used under only one function.
Yadav (2005) has carried out a research entitled 'Proficiency of Secondary
Level Students in Using Communicative Functions in English'. His main
objective was to find out the proficiency of both receptive and productive

31
language skills of secondary level students in using communicative functions.
He concluded that the proficiency of the secondary level students was not
satisfactory. He found that comparatively the proficiency of the secondary level
students was found to be better in receptive skills than in productive skills.
Ghimire (2007) has carried not a research on 'A study on PCL Second Year
Students' Proficiency in Communicative Functions in English'. He wanted to
find out the PCL second year students' communicative proficiency on the basis
of communicative functions as taught and learned in their PCL first year study
from the newly introduced textbook named 'New Headway Intermediate
Students' Book'. He also wanted to compare students' proficiency in a both
receptive and productive way. He concluded that students were better in the
communicative purpose, i.e. they were more proficient in using appropriate
expressions of languages on their own to serve those communicative functions
in the given situations. The findings also revealed that I.A. students'
communicative proficiency both receptive and productive was better compared
against their I. Ed. counterparts.
Gyanwali (2007) has conducted a research entitled 'Grade X Students'
Proficiency in the Use of Communicative Functions'. He wanted to examine the
students' proficiency in certain functions. He also wanted to find out the
students' weakness and strengths in the structure and communicative functions.
He came to the conclusion that the students were weak in relating language
functions with their correct responses.
Thus, some researches have done their research on grade IX whereas others on
grade X as well as P.C.L. students' proficiency in the use of communicative
functions but till now no one has done their research on the Non-native Nepali
Speakers. Therefore, the researcher thinks that the study might be a new study
in the English Education Department and would be fruitful for the curriculum
and syllabus designers, textbook writers, language trainers, teachers, students
and other new researchers as well.

32
1.3 Objectives of the Study
This study aimed at achieving the following objectives:
1. To find out the proficiency of ‘Non-native Nepali Speakers in the Use of
Communicative Functions’.
2. To compare and analyze itemwise proficiency of Non-native Nepali
Speakers in the use of language functions in terms of the following
variables:
A. School
B. Gender
C. Mother tongue
3. To suggest some pedagogical implications of the findings of this study.
1.4 Significance of the Study
As the study provides information about students' proficiency level in serving
different communicative functions by different Non-native Nepali Speakers,
the significance of this study can hardly be exaggerated in the field of English
language pedagogy. All the curriculum experts and syllabus designers will
know the scenarios of the proficiency level of different communicative
functions shown by the students of different Non-native Nepali Speakers, and
will accordingly design the course. By the same token, the teachers will decide
whether to prioritize the particular students having come from particular Non-
native Nepali Speakers while teaching communicative functions. As a result,
the students who come from different Non-native Nepali community will be
benefited in teaching and learning activities. This shows the importance of
teaching communicative functions to different Non-native Nepali Speakers so
as to feel them easy in day-to-day communication.

33
CHAPTER - TWO
METHODOLOGY
Methodology is a process by means of which new facts and information about
a particular subject matter is sought. The study was conducted by using the
following methodology.
2.1 Sources of Data
In order to carry out this research, the researcher used both primary and
secondary sources of data.
2.1.1 Primary Sources of Data
The primary sources of data for this study were the tenth graders of different
Non-native Nepali Speakers who were studying in different schools of
Kathmandu valley.
2.1.2 Secondary Sources of Data
A number of curriculums, books, journals, pervious theses and research reports
were used for carrying out the works successfully. Some of them were Todd
(1991), Wilkins (1976), Van. Ek (1976), Corder (1973).
2.2 Population of the Study
The population of the study constituted of different non-native Nepali speakers
of tenth grade studying in five different schools of Kathmandu valley.
2.3 Sample Population
The researcher randomly selected five secondary schools of Kathmandu valley.
From each school, eight students studying in grade ten; two from each group
consisting of 50% boys and 50% girls from each school were selected by

34
random sampling procedure. Thus, the total sample population of the study
consisted of forty students.
2.4 Tools for Data Collection
To collect the data, the researcher designed a set of tests of different sorts such
as questions requiring some contexts of language use so that the informants
would write as many communicative functions related to the situation. The
researcher prepared both subjective and objective questions. He designed a test
which consisted of ninety questions from ten language functions; nine
questions from each language functions consisting of four subjective and five
objective questions.
2.5 Process of Data Collection
After preparing the test items the researcher collected the data by using the
following procedures:
i) At first, he visited the selected schools and requested to the principals
for their help and co-operation to collect the data. He entered the
classroom and informed the students orally about the programme.
ii) Then, he selected the required number of the students using random
sampling method.
iii) After that, the test of both subjective and objective questions were
distributed to the sample students consisting of equal number of boys
and girls. The time given them was two hours.
iv) The answer sheets of the students were collected and checked on the
basis of the language structures and functions referred by grade ten
curriculum.
v) At last, the outcomes of their answers were tabulated for interpretation.

35
2.6 Limitations of the Study
The study had been limited in the following ways:
i. The study had been limited to the tenth graders of Kathmandu
valley.
ii. The study had been limited to the four Non-native Nepali
Speakers i.e. Magar, Rai, Yadav and Shrestha. The study had
been limited to forty students consisting of 50% boys and
50% girls randomly selected for the test from five different
schools of Kathmandu valley.
iii. The study had been limited to ten language functions out of
twenty language functions that are set for tenth graders by
Curriculum Development Center, Sanothimi, Bhaktapur.
iv. The study had been limited to written test (i.e. subjective and
objective) only.

36
CHAPTER – THREE
ANALYSIS AND INTERPRETATION
The researcher collected all the answer sheets of the students and checked them
according to the structures and functions set for the students of grade ten by the
Curriculum Development Center, Sanothimi, Bhaktapur. Then the data were
tabulated in terms of school, gender and mothertongue.
For each item 1 mark was given and students' proficiency in the use of
communicative functions was evaluated accordingly. At that time he did not
consider the minor mistakes of the subjective answers. The students who
secured below 35, 35-44, 45-59, 60-74 and above 75 were considered as poor,
satisfactory, good, very good and excellent proficiency respectively. Then the
collected data were analysized and presented descriptively by using different
statistical techniques. So, this chapter consists of three parts.
i) Schoolwise analysis of students' proficiency of communicative
functions.
ii) Genderwise analysis of students' proficiency of communicative
functions.
iii) Mother tonguewise analysis of students’ proficiency of
communicative functions.
3.1 Schoolwise Analysis
The main objective of this study is to find out the students' proficiency of
communicative functions. For this purpose five schools of Kathmandu valley
were selected randomly. From each school, eight students studying in grade ten;
two from each group (i.e. Shrestha, Magar, Rai and Yadav) consisting of 50%
boys and 50% girls were selected using random sampling method. Then, the
researcher administered the test which consisted of ninety questions from ten
language functions; nine questions from each language functions consisting of
four subjective and five objective questions. The answer sheets of the students

37
were collected and checked on the basis of the language structures and functions
prescribed by grade ten curriculum. Therefore, this part describes schoolwise
analysis of the students' proficiency of communicative functions.
3.1.1 Total Proficiency of the Students
Table No. 1
Correct Answers % Incorrect Answers % No Answers % Total
1755 48.75 1613 44.80 2.32 6.44 3600
The above table shows the total proficiency of the students in all ten items.
According to the table, out of 3600 questions the students gave 48.75% correct
answers, 44.80% incorrect answers and 6.44% questions were not answered.
So, the students showed good proficiency.
3.1.2 Total Comparison of Schools
Table No. 2
The above table shows the total comparison of all the schools in ten items.
According to the table, out of 720 questions the students of Nobel Academy
gave 58.19% correct answers, 35.13% incorrect answers and 6.66% questions
were not answered. The students of Elixir Academy gave 45.55% correct
answers, 50.97% incorrect answers and 3.47% questions were out of answers.
Similarly, the students of Gyanodaya Secondary School gave 46.52% correct
answers, 46.94% incorrect answers and 6.52% questions were not answered.
The students of Grammar Public School gave 47.91% correct answers, 46.66%
incorrect answers and 5.41% questions were not answered. In the same way,
the students of Saradha Secondary School gave 45.55% correct answers,
Name ofthe Schools
CorrectAnswers
% IncorrectAnswers
% NoAnswers
% Total
N.A. 419 58.19 253 35.13 48 6.66 720E.A. 328 45.55 367 50.97 25 3.47 720
G.S.S. 335 46.52 338 46.94 47 6.52 720G.P.S. 345 47.91 336 46.66 39 5.41 720S.S.S. 328 45.55 319 44.30 73 10.13 720

38
44.30% incorrect answers and 10.13% questions were not answered. Therefore,
the proficiency of the students studying in all the schools was found good.
3.1.3 Itemwise Total Proficiency of the Students
Table No. 3
Item
No.
Correct
Answers
% Incorrect
Answers
% No
Answers
% Total
Item - 1 159 44.16 190 52.77 11 3.05 360
Item - 2 145 40.27 198 55.00 17 4.72 360
Item - 3 164 45.55 188 52.22 8 2.22 360
Item - 4 179 49.72 168 46.66 13 3.61 360
Item - 5 118 32.77 148 41.11 94 26.11 360
Item - 6 228 63.33 122 33.88 10 2.77 360
Item - 7 191 53.05 158 43.88 11 3.05 360
Item - 8 161 44.72 169 46.94 30 8.33 360
Item - 9 199 55.27 138 38.33 23 6.38 360
Item - 10 211 58.61 134 37.22 15 4.16 360
According to the above table, in Item No. 1, 360 questions were asked to 40
students but only 44.16% answers were correct, 52.77% answers were
incorrect and 3.05% questions were out of answers. In Item No. 2, 40.27%
answers were correct, 55% answers were incorrect and 4.72% questions were
out of answers. In Item No. 3, 45.55% answers were correct, 52.22% answers
were incorrect and 2.22% questions were out of answers. In Item No. 4,
49.72% answers were correct, 46.66% answers were incorrect and 3.61%
questions were out of answers. In Item No. 5, 32.77% answers were correct,
41.11% answers were incorrect and 26.11% questions were not answered. In
Item No. 6, 63.33% answers were correct, 33.88% answers were incorrect and
2.77% questions were not answered. In Item No. 7, 53.05% answers were
correct, 43.88% answers were incorrect and 3.05% questions were out of
answers. In Item No. 8, 44.72% answers were correct, 46.94% answers were
incorrect and 8.33% questions were not answered. In Item No. 9, 55.27%
answers were correct, 38.33% answers were incorrect and 6.38% questions
were not answered. In Item No. 10, 58.61% answers were correct, 37.22%

39
answers were incorrect and 4.16% questions were out of answers. Therefore,
according to the chart students' communicative proficiency in Item No. 6 was
found very good but in Item No. 1, 3, 4,7 ,8 and 9 was found good. Similarly,
students' communicative proficiency in Item No. 5 (i.e. Reporting, giving and
withholding permission) was found poorest among all. On the other hand, they
showed satisfactory proficiency in Item No.2.
3.1.4 Total Proficiency of Nobel Academy
Table No. 4
Correct Answers % Incorrect Answers % No Answers % Total419 58.19 253 35.13 48 6.66 720
The above table shows the total proficiency of the students studying in Nobel
Academy. According to the table, 720 questions were asked in all the items in
which the students gave 58.19% correct answers, 35.13% incorrect answers
and 6.66% questions were out of answers. Thus, the students of Nobel
Academy showed good proficiency.
3.1.5 Itemwise Proficiency of Nobel Academy
Table No. 5
Item No. CorrectAnswers
% IncorrectAnswers
% NoAnswers
% Total
Item - 1 33 45.83 36 50.00 3 4.16 72Item - 2 43 59.72 29 40.27 0 0 72Item - 3 53 73.61 18 25.00 1 1.38 72Item - 4 49 68.05 23 31.94 0 0 72Item - 5 27 37.5 35 48.61 10 13.88 72Item - 6 46 63.88 23 31.94 3 4.16 72Item - 7 46 63.88 21 29.16 5 6.94 72Item - 8 29 40.27 29 40.27 14 19.44 72Item - 9 42 58.33 19 26.38 11 15.27 72Item - 10 51 70.83 20 27.77 1 1.38 72
The above table shows that in Item No. 1, 48.83% answers were correct, 50%
answers were incorrect and 4.16% questions were not answered. In Item No. 2,
59.72% answers were correct and 40.27% answers were incorrect. In Item No.
3, 73.61% answers were incorrect, 25% answers were incorrect and 1.38%

40
questions were not answered. In Item No. 4, 68.05% answers were correct and
31.94% answers were not correct. In Item No. 5, 37.5% answers were correct,
48.61% answers were incorrect and 13.88% questions were not answered. In
Item No. 6, 63.88% answers were correct, 31.94% answers were incorrect and
4.16% questions were out of answers. In Item No. 8, 40.27% answers were
correct, 40.27% answers were incorrect and 19.44% questions were not
answered. In Item No. 9, 58.33% answers were correct, 26.38% answers were
incorrect and 15.27% questions were out of answers. In Item No. 10, 70.83%
answers were correct, 27.77% answers were incorrect and 1.38% questions
were not answered. Therefore, students' communicative proficiency in Item No.
3, 4, 6, 7 and 10 was found very good but in Item No. 2 and 9 was found good.
Similarly, they showed satisfactory proficiency in Item No. 1, 5 and 8.
3.1.6 Total Proficiency of Elixir Academy
Table No. 6
Correct
Answers
% Incorrect
Answers
% No
Answers
% Total
328 45.55 367 50.97 25 3.47 720
The above table shows the total proficiency of the students of Elixir Academy.
According to the table, 720 questions were asked in all the items in which they
gave 45.55% correct answers, 50.97% incorrect answers and 3.47% questions
were out of answers. Therefore, the students of Elixir Academy showed good
proficiency.

41
3.1.7 Itemwise Proficiency of Elixir Academy
Table No. 7
Item No. Correct
Answers
% Incorrect
Answers
% No
Answers
% Total
Item - 1 34 47.22 36 50.00 2 2.77 72
Item - 2 22 30.55 49 68.05 1 1.38 72
Item - 3 30 41.66 41 56.94 1 1.38 72
Item - 4 31 43.05 40 55.55 1 1.38 72
Item - 5 26 36.11 29 40.27 17 23.61 72
Item - 6 45 62.5 26 36.11 1 1.38 72
Item - 7 27 37.5 45 62.5 0 0 72
Item - 8 21 29.16 50 69.44 1 1.38 72
Item - 9 46 63.88 25 34.72 1 1.38 72
Item - 10 46 63.88 26 36.11 0 0 72
According to the above table, in Item No. 1, 47.22% answers were correct,
50% answers were incorrect and 2.77% questions were out of answers. In Item
No. 2, 30.55% answers were correct, 68.05% answers were incorrect and
1.38% questions were not answered. In Item No. 3, 41.66% answers were
correct, 56.94% answers were incorrect and 1.38% questions were out of
answers. In Item No. 4, 43.05% answers were correct, 55.55% answers were
incorrect and 1.38% questions were not answered. In Item No. 5, 36.11%
answers were correct, 40.27% answers were incorrect and 23.61% questions
were out of answers. In Item No. 6, 62.5% answers were correct, 36.11 answers
were incorrect and 1.38% questions were out of answers. In Item No. 7, 37.5%
answers were correct and 62.5% answers were incorrect. In Item No. 8, 29.16%
answers were correct, 69.44% answers were incorrect and 1.38% questions
were out of answers. In Item No. 9, 63.88% answers were correct, 34.72%
answers were incorrect and 1.38% questions were not answered. In Item No.
10, 63.88% answers were correct and 36.11% answers were incorrect. Thus,
students' communicative proficiency of Elixir Academy in Item No. 9 and 10
was found very good but in Item No. 1 and 6 was found good. Similarly,

42
students showed satisfactory proficiency in Item No. 3, 4, 5 and 7. On the other
hand, they showed poor proficiency in Item No. 2 and 8.
3.1.8 Total Proficiency of Gyanodaya Secondary School
Table No. 8
Correct
Answers
% Incorrect
Answers
% No
Answers
% Total
335 46.52 338 46.94 47 6.52 720
The above table shows the total proficiency of the students of Gyanodaya
Secondary School. According to the table, 720 questions were asked in all the
items in which they gave 46.52% correct answers, 46.94% incorrect answers
and 6.52% questions were not answered. Therefore their proficiency was found
good.
3.1.9 Itemwise Proficiency of Gyanodaya Secondary School
Table No. 9
Item No. Correct
Answers
% Incorrect
Answers
% No
Answers
% Total
Item - 1 28 38.88 41 56.94 3 4.16 72
Item - 2 31 43.05 39 40.27 2 2.77 72
Item - 3 26 36.11 44 61.11 2 2.77 72
Item - 4 33 45.83 35 48.61 4 5.55 72
Item - 5 23 31.94 32 44.44 17 23.61 72
Item - 6 52 72.22 17 23.61 3 4.16 72
Item - 7 33 45.83 38 52.77 1 1.38 72
Item - 8 41 56.94 28 38.88 3 4.16 72
Item - 9 36 50.00 28 38.88 8 11.11 72
Item - 10 32 44.44 36 26.38 4 5.55 72
The above table shows the students' communicative proficiency of Gyanodaya
Secondary School. In Item No. 1, 38.88% answers were correct, 56.94%

43
answers were incorrect and 4.16% questions were not answered. In Item No. 2,
43.05% answers were correct, 40.27% answers were not correct and 2.77%
questions were out of answers. In Item No. 3, 36.11% answers were correct,
61.11% answers were incorrect and 2.77% questions were out of answers. In
Item No. 4, 45.83% answers were correct, 48.61% answers were incorrect and
5.55% questions were out of answers. In Item No. 5, 31.94% answers were
correct, 44.44% answers were incorrect and 23.61% questions were out of
answers. In Item No. 6, 72.22% answers were correct, 23.61% answers were
incorrect and 4.16% questions were out of answers. In Item No. 7, 45.83%
answers were correct, 52.77% answers were incorrect and 1.38% questions
were not answered. In Item No. 8, 56.94% answers were correct, 38.88%
answers were incorrect and 4.16% questions were out of answers. In Item No.
9, 50% questions were correct, 38.88% questions were incorrect and 11.11%
questions were out of answers. In Item No. 10, 44.44% answers were correct,
26.38% answers were incorrect and 5.55% questions were out of answers.
Thus, students' communicative proficiency of Gyanodaya Secondary School in
Item No. 6 was found very good but in Item No. 4, 7, 8, 9 and 10 was found
good. Similarly, students showed satisfactory proficiency in Item No. 1, 2 and
3 whereas poor in Item No 5.
3.1.10 Total Proficiency of Grammar Public School
Table No. 10
The above table shows the total proficiency of the students of Grammar Public
School. According to the table, 720 questions were asked in all the items in
which they gave 47.91% correct answers, 46.66 % incorrect answers and 5.41
% questions were not answered. Thus, the students showed good proficiency.
Correct
Answers
% Incorrect
Answers
% No
Answers
% Total
345 47.91 336 46.66 39 5.41 720

44
3.1.11 Itemwise Proficiency of Grammar Public School
Table No. 11
Item No. Correct
Answers
% Incorrect
Answers
% No
Answers
% Total
Item - 1 32 44.44 40 55.55 0 0 72
Item - 2 29 40.27 37 51.38 6 8.33 72
Item - 3 33 45.83 36 50.00 3 4.16 72
Item - 4 34 47.22 35 48.61 3 4.16 72
Item - 5 25 34.72 30 41.66 17 23.61 72
Item - 6 41 56.94 30 41.66 1 1.38 72
Item - 7 38 52.77 30 41.66 4 5.55 72
Item - 8 40 55.55 31 43.05 1 1.38 72
Item - 9 31 43.05 38 52.77 3 4.16 72
Item - 10 42 58.33 29 40.27 1 1.38 72
The above table shows the students' communicative proficiency of Grammar
Public School, Koteshwor in 10 Items. In Item No. 1, 44.44% answers were
correct and 55.55% answers were incorrect. In Item No. 2, 40.27% answers
were correct, 51.38% answers were incorrect and 8.33 % questions were not
answered. In Item No. 3, 45.83% answers were correct, 50% answers were
incorrect and 4.16% questions were out of answers. In Item No. 4, 47.22%
answers were correct, 48.61% answers were incorrect and 4.16% questions
were not answered. In Item No. 5, 34.72% answers were correct, 41.66%
answers were incorrect and 23.61% questions were not answered. In Item No.
6, 56.94% answers were correct, 41.66% answers were incorrect and 1.38%
questions were out of answers. In Item No. 7, 52.77% answers were correct,
41.66% answers were incorrect and 5.55% questions were not answered. In
Item No. 8, 55.55% answers were correct, 43.05% questions were incorrect and
1.38% questions were out of answers. In Item No. 9, 43.05% answers were
correct, 52.77% answers were incorrect and 4.16% questions were not

45
answered. In Item No. 10, 58.33% answers were correct, 40.27% answers were
incorrect and 1.38% questions were not answered. Thus, students'
communicative proficiency of Grammar Public School in Item No. 1, 3, 4 6, 7,
8 and 10 was found good but in Item No. 2 and 9 was found satisfactory.
Similarly, students showed poor proficiency in Item No.5
3.1.12 Total Proficiency of Saradha Secondary School
Table No. 12
The above table shows the total proficiency of Saradha Secondary School.
According to the table, out of 720 questions, the students gave 45.55% correct
answers, 44.30% incorrect answers and 10.13% questions were not answered.
Thus, the students of Saradha Secondary School showed good proficiency.
3.1.13 Itemwise Proficiency of Saradha Secondary School
Table No. 13
Item No. Correct
Answers
% Incorrect
Answers
% No
Answers
% Total
Item - 1 32 44.44 37 51.38 3 4.16 72
Item - 2 20 27.77 44 61.11 8 11.11 72
Item - 3 22 30.55 49 68.05 1 1.38 72
Item - 4 32 44.44 35 48.61 5 6.94 72
Item - 5 17 23.61 22 30.55 33 45.83 72
Item - 6 44 61.11 26 36.11 2 2.77 72
Item - 7 47 65.27 24 83.33 1 1.38 72
Item - 8 30 41.66 31 43.05 11 15.27 72
Item - 9 44 61.11 28 38.88 0 0 72
Item - 10 40 55.55 23 31.94 9 12.5 72
The above table shows that 44.44% correct answers and 51.38% incorrect
answers were given in Item No. 1 in which 4.16% questions were out of
CorrectAnswers
% IncorrectAnswers
% NoAnswers
% Total
328 45.55 319 44.30 73 10.13 720

46
answers. Only 27.77% correct answers and 61.11% incorrect answers were
given in Item No. 2 in which 11.11% questions were not answered. In Item No.
3, they gave 30.55% correct answers, 68.05% incorrect answers and 1.38%
questions were out of answers. In Item No. 4, they gave 44.44 % correct
answers, 48.61% incorrect answers and 6.94% questions were out of answers.
In Item No. 5, only 23.61% answers were correct, 30.55% answers were
incorrect and 45.83% questions left unanswered. Similarly, 61.11% answers
were correct and 36.11% answers were incorrect in Item No. 6 where 2.77%
questions left unanswered. In Item No. 7, 65.27% answers were correct,
83.33% answers were incorrect and 1.38% questions were not answered. In
Item No. 8, 41.66% answers were correct, 43.05% answers were incorrect and
15.27% questions were not answered. In Item No. 9, 61.11% answers were
correct and 38.88% answers were incorrect. Item No. 10, 55.55% answers were
correct, 31.94% answers were incorrect and 12.5% questions left unanswered.
Therefore, they showed very good proficiency in Item No. 6, 7, and 9 but good
proficiency in Item No. 1, 4 and 10. Similarly, they showed satisfactory
proficiency in Item No. 8 but poor proficiency in Item No. 2 ,3 and 5.
3.1.14 Comparison of Schools in Item No. 1.
Table No. 14
Name of
the schools
Correct
Answers
% Incorrect
Answers
% No
Answers
% Total
N.A. 33 45.83 36 50.00 3 4.16 72
E.A. 34 47.22 36 50.00 2 2.77 72
G.S.S. 28 38.88 41 56.94 3 4.16 72
G.P.S. 32 44.44 40 55.55 0 0 72
S.S.S. 32 44.44 37 51.38 3 4.16 72
The above table shows the schoolwise proficiency of the students studying in
five different schools of Kathmandu valley. According to the table, in Item No.
1, 72 questions were asked to 40 students but the students of Nobel Academy

47
gave only 45.83% correct answers, 50% incorrect answers and 4.16% questions
were not answered. Likewise, the students of Elixir Academy gave 47.22%
correct answers, 50% incorrect answers and 2.77% questions were out of
answers. The students of Gyanodaya Secondary School gave 38.88% correct
answers, 56.94% incorrect answers and 4.16% questions were out of answers.
The students of Grammar Public School gave only 44.44% correct answers and
55.55% incorrect answers. The students of Saradha Secondary School gave
44.44% correct answers, 51.38% incorrect answers and 4.16% questions were
out of answers. That is why, the students of all the schools except GSS showed
good proficiency in Item No. 1 whereas GSS students showed satisfactory
proficiency.
3.1.15 Comparison of Schools in Item No. 2
Table No. 15
Name of
the schools
Correct
Answers
% Incorrect
Answers
% No
Answers
% Total
N.A. 43 59.72 29 40.27 0 0 72
E.A. 22 30.55 49 68.05 1 1.38 72
G.S.S. 31 43.05 39 54.16 2 2.77 72
G.P.S. 29 40.27 37 51.38 6 8.33 72
S.S.S. 20 27.77 44 61.11 8 11.11 72
The above table depicts the students' proficiency of all the sample schools in
Item No. 2. According to the table, the students of Nobel Academy gave
59.72% correct answers, 40.27% incorrect answers and none of the questions
were out of answers. The students of Elixir Academy gave only 30.55% correct
answers, 68.05% incorrect answers and 1.38% questions were not answered.
The students of Gyanodaya Secondary School gave 43.05% correct answers,
54.16% incorrect answers and 2.77% questions were out of answers. The
students of Grammar Public School were able to give 40.27% correct answers,
51.38% incorrect answers and they were not able to give the answers of 8.33%

48
questions. Similarly, 27.77% correct answers and 61.11% incorrect answers
were given by the students of Saradha Secondary School where 11.11%
questions were out of answers. Thus, the students of Nobel Academy showed
very good proficiency in Item No. 8 but GSS and GPS students showed
satisfactory proficiency. On the other hand, the students of EA and SSS showed
poor proficiency. Among all the schools the proficiency of the students
studying in Elixir Academy and Saradha Secondary school was the lowest and
the students studying in Nobel Academy was the highest.
3.1.16 Comparison of Schools in Item No. 3
Table No. 16
Name of
the schools
Correct
Answers
% Incorrect
Answers
% No
Answers
% Total
N.A. 53 73.61 18 25.00 1 1.38 72
E.A. 30 41.66 41 56.94 1 1.38 72
G.S.S. 26 38.11 44 61.11 2 2.77 72
G.P.S. 33 45.83 36 50.00 3 4.16 72
S.S.S. 22 30.55 49 68.05 1 1.38 72
The above table shows that 73.61% correct answers and 25% incorrect answers
were given in Item No. 3 by the students of Nobel Academy and they were not
able to give the answers of 1.38% questions. The students of Elixir Academy
gave 41.66% correct answers, 56.94% incorrect answers and 1.38% questions
were not answered. The students of Gyanodaya Secondary School gave 38.11%
correct answers, 61.11% incorrect answers whereas 2.77% questions left
unanswered. Similarly, the students of Grammar Public School gave 45.83%
correct answers, 50% incorrect answers and 4.16% questions were out of
answers. Likewise, 30.55% correct answers and 68.05% incorrect answers
were given by the students of Saradha Secondary School where 1.38%
questions left unanswered. Therefore, the students of Nobel Academy showed
very good proficiency in Item No. 3 whereas GPs showed good proficiency. If

49
we compare all the schools, the proficiency of the students studying in Nobel
Academy was the highest and the students studying in Saradha Secondary
School was the lowest among all the schools. On the other hand, the students of
EA and GPS showed satisfactory proficiency whereas SSS showed poor.
3.1.17 Comparison of Schools in Item No. 4
Table No. 17
Name of
the schools
Correct
Answers
% Incorrect
Answers
% No
Answers
% Total
N.A. 49 68.05 23 31.94 0 0 72
E.A. 31 43.05 40 55.55 1 1.38 72
G.S.S. 33 45.83 35 48.61 4 5.55 72
G.P.S. 34 47.22 35 48.61 3 4.16 72
S.S.S. 32 44.44 35 48.61 5 6.94 72
The above table depicts the schoolwise proficiency of the students in Item No.
4. According to the table, 68.05% correct answers and 31.94% incorrect
answers were given by the students of Nobel Academy. The students of Elixir
Academy gave 43.05% correct answers, 55.55% incorrect answers whereas
1.38% questions left unanswered. The students of Gyanodaya Secondary
School gave 45.83% correct answers, 48.61% incorrect answers and they
could not give the answers of 5.55% questions. Similarly, 47.22% correct
answers and 48.61% incorrect answers were given by the students of Grammar
Public School in which 4.16% questions were out of answers. Likewise, the
students of Saradha Secondary School gave 44.44% correct answers, 48.61%
incorrect answers and 6.94% questions were not answered. Thus, the
proficiency of the students studying in Nobel Academy was found very good in
Item No. 4 whereas GSS, GPS and SSS was found good. Similarly, the
students of EA showed satisfactory proficiency.

50
3.1.18 Comparison of Schools in Item No. 5
Table No. 18
Name of
the schools
Correct
Answers
% Incorrect
Answers
% No
Answers
% Total
N.A. 27 37.5 35 48.61 10 13.88 72
E.A. 26 36.11 29 40.27 17 23.61 72
G.S.S. 23 31.94 32 44.44 17 23.61 72
G.P.S. 25 34.72 30 41.66 17 23.61 72
S.S.S. 17 23.61 22 30.55 33 45.83 72
The above table shows the schoolwise proficiency of the students in Item No.
5. The students of Nobel Academy gave 37.5% correct answers, 48.61%
incorrect answers and 13.88% questions were out of answers. The students of
Elixir Academy gave 36.11% correct answers, 40.27% incorrect answers and
23.61% questions were not answered. The students of Gyanodaya Secondary
School gave 31.94% correct answers, 44.44% incorrect answers and 23.61%
questions were out of answers. Similarly, 34.72% correct answers and 41.66%
incorrect answers were given by the students of Grammar Public School where
23.61% questions left unanswered. Similarly, the students of Saradha
Secondary School gave 23.61% correct answers, 30.55% incorrect answers and
45.83% questions were out of answers. Therefore, the students of EA and NA
showed satisfactory proficiency in Item No. 5 whereas remaining others
showed poor.

51
3.1.19 Comparison of Schools in Item No. 6
Table No. 19
Name of the
schools
Correct
Answers
% Incorrect
Answers
% No
Answers
% Total
N.A. 46 63.88 23 31.94 3 4.16 72
E.A. 45 62.5 26 36.11 1 1.38 72
G.S.S. 52 72.22 17 23.61 3 4.16 72
G.P.S. 41 56.94 30 41.66 1 1.38 72
S.S.S. 44 61.11 26 36.11 2 2.77 72
The above table shows the students' proficiency of all the sample schools in
Item No. 6. According to the table, the students of Novel Academy gave
63.88% correct answers, 31.94% incorrect answers and 4.16% questions were
not answered. The students of Elixir Academy gave 62.5% correct answers,
36.11% incorrect answers and 1.38% questions left unanswered. The students
of Gyanodaya Secondary School gave 72.22% correct answers, 23.61%
incorrect answers and they were not able to give the answer of 4.16%
questions. The students of Grammar Public School gave 56.94% correct
answers, 41.66% incorrect answers and 1.38% questions were not answered.
Likewise, 61.11% correct answers and 36.11% incorrect answers were given
by the students of Saradha Secondary School where 2.77% questions were not
answered. Therefore, the students' proficiency of all the sample schools except
GPS was found very good in Item No. 6 as the students of GPS was found
good.

52
3.1.20 Comparison of Schools in Item No. 7
Table No. 20
Name of
the schools
Correct
Answers
% Incorrect
Answers
% No
Answers
% Total
N.A. 46 63.88 21 29.16 5 6.94 72
E.A. 27 37.5 45 62.5 0 0 72
G.S.S. 33 45.83 38 52.77 1 1.38 72
G.P.S. 38 52.77 30 41.66 4 5.55 72
S.S.S. 47 65.27 24 33.33 1 1.38 72
The above table depicts the schoolwise proficiency of the students studying in
five different school of Kathmandu valley. As given in the table, in Item No. 7,
63.88% correct answers and 29.16% incorrect answers were given by the
students of Nobel Academy where 6.94% questions were not answered. The
students of Elixir Academy gave 37.5% correct answers and 62.5% incorrect
answers. The students of Gyanodaya Secondary school gave 45.83% correct
answers, 52.77% incorrect answers and 1.38 % questions were not answered.
Similarly, the students of Grammar Public School gave 52.77% correct
answers, 41.66% incorrect answers and 5.55% questions were out of answers.
Likewise, the students of Saradha Secondary School gave 65.27% correct
answers, 33.33% incorrect answers and 1.38% questions were not answered.
That is why, the proficiency of the students studying in Nobel Academy and
Saradha Secondary was found very good. Similarly, the students of GPS and
GSS showed good proficiency. On the other hand, the students of EA showed
satisfactory proficiency in this item.

53
3.1.21 Comparison of Schools in Item No. 8
Table No. 21
Name of the
schools
Correct
Answers
% Incorrect
Answers
% No
Answers
% Total
N.A. 29 40.27 29 40.27 14 19.44 72
E.A. 21 29.16 50 69.44 1 1.38 72
G.S.S. 41 56.94 28 38.88 3 4.16 72
G.P.S. 40 55.55 31 43.05 1 1.38 72
S.S.S. 30 41.61 31 43.05 11 15.27 72
The above table shows the schoolwise proficiency of the students in Item No.
8. As given in the table, the students of Nobel Academy gave 40.27% correct
answers and 40.27% incorrect answers whereas 19.44% questions were out of
answers. The students of Elixir Academy gave 29.16% correct answers,
69.44% incorrect answers and 1.38% questions were not answered. The
students of Gyanodaya Secondary School gave 56.94% correct answers,
38.88% incorrect answers and 4.16% questions were not answered. The
students of Grammar Public School gave 55.55% correct answers, 43.05%
incorrect answers and 1.38% questions were out of answers. Similarly, 43.05%
incorrect answers, 41.61% correct answers were given by the students of
Saradha Secondary School where 15.27% questions were out of answers.
Therefore, GSS and GPS students showed good, NA and SSS showed
satisfactory and EA showed poor proficiency in this item.
3.1.22 Comparison of Schools in Item No. 9
Table No. 22
Name of
the schools
Correct
Answers
% Incorrect
Answers
% No
Answers
% Total
N.A. 42 58.33 19 26.38 11 15.27 72
E.A. 46 63.88 25 34.72 1 1.38 72
G.S.S. 36 50.00 28 38.88 8 11.11 72
G.P.S. 31 43.05 38 52.77 3 4.16 72
S.S.S. 44 61.11 28 38.88 0 0 72
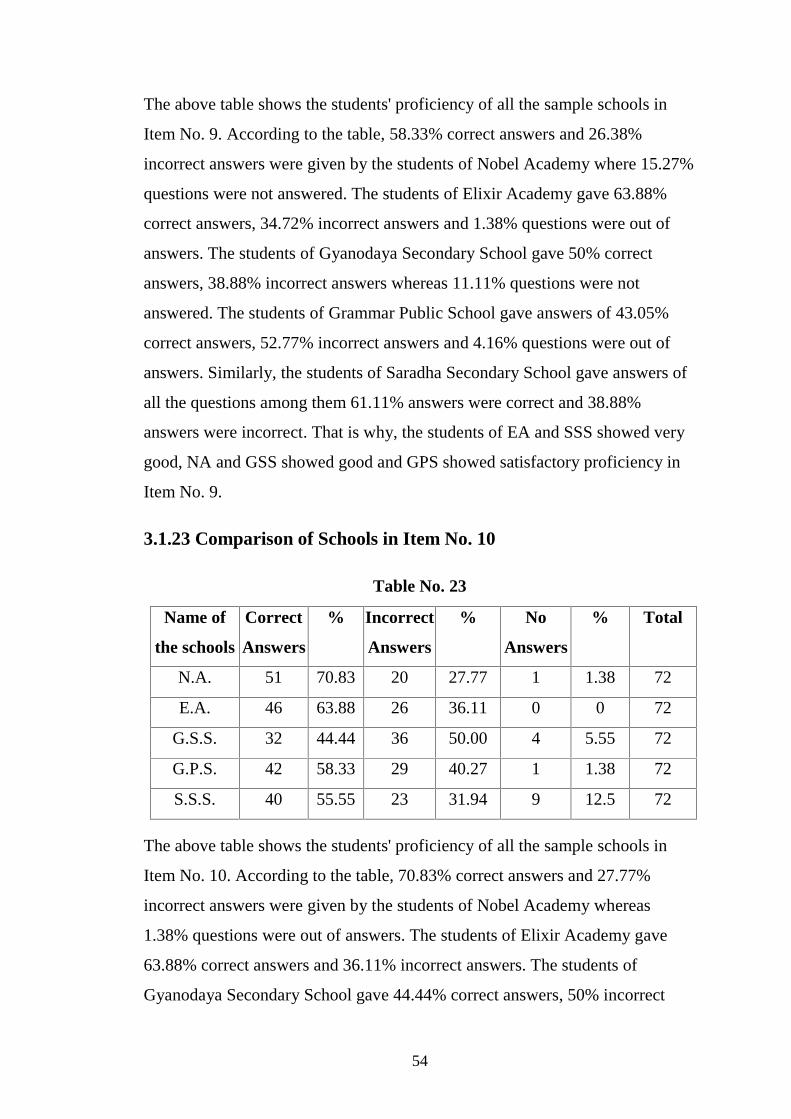
54
The above table shows the students' proficiency of all the sample schools in
Item No. 9. According to the table, 58.33% correct answers and 26.38%
incorrect answers were given by the students of Nobel Academy where 15.27%
questions were not answered. The students of Elixir Academy gave 63.88%
correct answers, 34.72% incorrect answers and 1.38% questions were out of
answers. The students of Gyanodaya Secondary School gave 50% correct
answers, 38.88% incorrect answers whereas 11.11% questions were not
answered. The students of Grammar Public School gave answers of 43.05%
correct answers, 52.77% incorrect answers and 4.16% questions were out of
answers. Similarly, the students of Saradha Secondary School gave answers of
all the questions among them 61.11% answers were correct and 38.88%
answers were incorrect. That is why, the students of EA and SSS showed very
good, NA and GSS showed good and GPS showed satisfactory proficiency in
Item No. 9.
3.1.23 Comparison of Schools in Item No. 10
Table No. 23
Name of
the schools
Correct
Answers
% Incorrect
Answers
% No
Answers
% Total
N.A. 51 70.83 20 27.77 1 1.38 72
E.A. 46 63.88 26 36.11 0 0 72
G.S.S. 32 44.44 36 50.00 4 5.55 72
G.P.S. 42 58.33 29 40.27 1 1.38 72
S.S.S. 40 55.55 23 31.94 9 12.5 72
The above table shows the students' proficiency of all the sample schools in
Item No. 10. According to the table, 70.83% correct answers and 27.77%
incorrect answers were given by the students of Nobel Academy whereas
1.38% questions were out of answers. The students of Elixir Academy gave
63.88% correct answers and 36.11% incorrect answers. The students of
Gyanodaya Secondary School gave 44.44% correct answers, 50% incorrect

55
answers and 5.55% questions were not answered. Similarly, the students of
Grammar Public School gave 58.33% correct answers, 40.27% incorrect
answers and 1.38% questions were out of answers. Likewise, 55.55% correct
answers, 31.94% incorrect answers were given by the students of Saradha
Secondary School where 12.5% questions were out of answers. Thus, the
students of NA and EA showed very good proficiency. On the other hand,
GPS, GSS and SSS showed good proficiency.
3.2 Genderwise Analysis
One of the objectives of this thesis is to compare the proficiency of the students
in term of gender. Considering this fact, the researcher administered the test
items to forty students consisting of 50% boys and 50% girls. After the test he
checked their answer sheets and tabulated the marks under two headings, i.e.
male and female. So, this part deals with the genderwise proficiency of the
students.
3.2.1 Total Proficiency of the Students
Table No. 24
Male Female
CA % IA % NA % T CA % IA % NA % T
854 47.44 844 46.88 102 5.66 1800 901 50.05 769 42.72 130 7.22 1800
The above table shows the genderwise total proficiency of the students.
According to the table, out of 1800 questions, male students gave 47.44%
correct answers, 46.88% incorrect answers and 5.66% questions were not
answered. On the other hand, female students gave 50.05% correct answers,
42.72% incorrect answers and 7.22% questions were not answered. Therefore,
both groups showed good proficiency.

56
3.2.2 Itemwise Proficiency of the Students
Table No. 25
Items
No.
Male Female
CA
% IA
% NA
% T CA
% IA
% NA
% T
Item - 1 72 40.00 105 58.33 3 1.66 180 87 48.33 85 47.22 8 4.44 180
Item - 2 67 37.22 106 58.88 7 3.88 180 78 43.33 92 51.11 10 5.55 180
Item - 3 84 46.66 92 51.11 4 2.22 180 80 44.44 96 53.33 4 2.22 180
Item - 4 87 48.33 87 48.33 6 3.33 180 92 51.11 81 45.00 7 3.38 180
Item - 5 58 32.22 80 44.44 42 23.33 180 60 33.33 68 37.77 52 28.88 180
Item - 6 107 59.44 68 37.77 5 2.77 180 121 67.22 54 30.00 5 2.77 180
Item - 7 88 48.88 88 48.88 4 2.22 180 103 57.22 70 38.88 7 3.88 180
Item - 8 88 48.88 79 43.88 13 7.22 180 73 40.55 90 50.00 17 9.44 180
Item - 9 100 55.55 69 38.33 11 6.11 180 99 55.00 69 38.33 12 6.66 180
Item - 10 103 57.22 70 38.88 7 3.88 180 108 60.00 64 35.55 8 4.44 180
The above table shows that in each Item 360 questions were asked to fourty
students were 180 questions were asked to male students and remaining 180
questions were asked to female students. According to the chart, in Item No. 1
male students gave 40% correct answers, 58.33% incorrect answers and 1.66%
questions were out of answers. On the other hand, female students gave
48.33% correct answers, 47.22% incorrect answers and 4.44% questions were
not answered. So, the proficiency of female students in Item No. 1 was found
better in comparison to male students. In Item No. 2, male students gave
37.22% correct answers, 58.88% incorrect answers and 3.88% questions were
out of answers. On the other hand, female students gave 43.33% correct
answers, 51.11% incorrect answers and 5.55% questions left unanswered. In
Item No. 3, male students gave 46.66% correct answers, 51.11% incorrect
answers and 2.22% questions were not answered. On the other hand, female
students gave 44.44% correct answers, 53.33% incorrect answers and 2.22%
questions were out of answers. In Item No. 4, male students gave 48.33%

57
correct answers, 48.33% incorrect answers and 3.33% questions were not
answered. On the other hand, female students gave 51.11% correct answers,
45% incorrect answers, and 3.38% questions were not answered. In Item No. 5,
male students gave 32.22% correct answers, 44.44% incorrect answers and
23.33% questions left unanswered. On the other hand, female students gave
33.33% correct answers, 37.77% incorrect answers and 28.88% questions were
out of answers. In Item No. 6, male students gave 59.44% correct answers,
37.77% incorrect answers, and 2.77% questions were not answered. On the
other hand, female students gave 67.22% correct answers, 30% incorrect
answers and 2.77% questions were out of answers. In Item No. 7, male students
gave 48.88% correct answers, 48.88% incorrect answers and 2.22% questions
were not answered. On the other hand, female students gave 57.22% correct
answers, 38.88% incorrect answers and 3.88% questions were out of answers.
In Item No. 8, male students gave 48.88% correct answers, 43.88% incorrect
answers and 7.22% questions were not answered. On the other hand, female
students gave 40.55% correct answers, 50% incorrect answers and 9.44%
questions were found unanswered. In Item No. 9, male students gave 55.55%
correct answers, 38.33% incorrect answers and 6.11% questions were out of
answers. On the other hand, female students gave 55% correct answers,
38.33% incorrect answers and 6.66% questions were not answered. In Item No.
10, male students gave 57.22% correct answers, 38.88% incorrect answers and
3.88% questions were out of answers. On the other hand, female students gave
60% correct answers, 35.55% incorrect answers and 4.44% questions were not
answered. In this way, male students showed very good proficiency in Item No.
6; good in Item No. 3, 4, 7, 8, 9 and 10; satisfactory in Item No. 1 and 2. On the
other hand, female students showed very good proficiency in Item No. 6 and
10; good in Item No. 1, 2, 3, 4, 7 and 9; satisfactory in Item No. 8; and poor in
Item No. 5.

58
3.2.3 Total Proficiency of Nobel Academy
Table No. 26
The above table shows the genderwise total proficiency of the students of
Nobel Academy. According to the table, out of 360 questions, male students
gave 55.27% correct answers, 40% incorrect answers and 4.72 % questions
were not answered. On the other hand, female students gave 61.11% correct
answers, 30.27% incorrect answers and 8.61% questions were not answered.
Therefore, female students showed satisfactory proficiency in comparison to
male students.
3.2.4 Itemwise Proficiency of Nobel Academy
Table No. 27
Item No. Male Female
CA
% IA
% NA
% T CA
% IA
% NA
% T
Item - 1 15 41.66 20 55.55 1 2.77 36 18 50 16 44.44 2 5.55 36
Item - 2 15 41.66 21 58.33 0 0 36 28 77.77 8 22.22 0 0 36
Item - 3 25 69.44 11 30.55 0 0 36 28 77.77 7 19.44 1 2.77 36
Item - 4 22 61.11 14 38.88 0 0 36 27 75.00 9 25.00 0 0 36
Item - 5 17 47.22 15 41.66 4 11.11 36 10 27.77 20 55.55 6 16.66 36
Item - 6 22 61.11 13 36.11 1 2.77 36 24 66.66 10 27.77 2 5.55 36
Item - 7 21 58.33 13 36.11 2 5.55 36 25 69.44 8 22.22 3 8.33 36
Item - 8 16 44.44 16 44.44 4 11.11 36 13 36.11 13 36.11 10 27.77 36
Item - 9 22 61.11 10 27.77 4 11.11 36 20 55.55 9 25.00 7 19.44 36
Item - 10 24 66.66 11 30.55 1 2.77 36 27 75.55 9 25.00 0 0 36
The above table shows that in Item No. 1, male students gave 41.66% correct
answers, 55.55% incorrect answers and 2.77% questions were out of answers.
On the other hand, female students gave 50% correct answers, 44.44%
Male FemaleCA % IA % NA % T CA % IA % NA % T199 55.27 144 40 17 4.72 360 220 61.11 109 30.27 31 8.61 360

59
incorrect answers and 5.55% questions were out of answers. In Item No. 2,
41.66 % correct answers, 58.33% incorrect answers were given by the male
students. On the other hand, female students gave 77.77% correct answers,
22.22% incorrect answers. In Item No. 3, male students gave 69.44% correct
answers and 30.55% incorrect answers. On the other hand, 77.77% correct
answers and 19.44% incorrect answers were given by female students where
2.77% questions were out of answers. In Item No.4, male students gave
61.11% correct answers and 38.88% incorrect answers. On the other hand,
female students gave 75% correct answers and 25% incorrect answers. In Item
No. 5, male students gave 47.22% correct answers, 41.66% incorrect answers
and 11.11% questions were out of answers. On the other hand, female students
gave 27.77% correct answer, 55.55% incorrect answers and 16.66% questions
were not answered. In Item No. 6, 61.11% correct answers, 36.11% incorrect
answers were given by the male students where 2.77% questions were not
answered. On the other hand, 66.66% correct answers, 27.77% incorrect
answers were given by the female students and they could not give the answers
of 5.55% questions. In Item No. 7, male students gave 58.33% correct
answers, 36.11% incorrect answers and 5.55% questions were out of answers.
On the other hand, female students gave 69.44% correct answers, 22.22%
incorrect answers and they were not able to give the answers of 8.33%
questions. In Item No. 8, male students gave 44.44% correct answers, 44.44%
incorrect answer and 11.11% questions were out of answers. On the other hand,
female students gave 36.11% correct answers, 36.11% incorrect answers and
27.77% questions were not answered. In Item No. 9, male students gave
60.11% correct answers, 27.77% incorrect answers and 11.11% questions were
out of answers. On the other hand, female students gave 55.55% correct
answers, 25% incorrect answers and 19.44% questions were out of answers. In
Item No.10, male students gave 66.66% correct answers, 30.55% incorrect
answers and 2.77% questions were out of answers. On the other hand, female
students gave 75% correct answers and 25% incorrect answers. That is why
male students showed very good proficiency in Item No. 3, 4, 6, 9 and 10; good

60
in Item No.5, 7, and 8; and satisfactory in Item No. 1 and 2. On the other hand,
female students showed excellent proficiency in Item No. 2, 3, 4 and 10; very
good in Item No.6 and 7; satisfactory in Item No. 8; and poor in Item No. 5.
3.2.5 Total Proficiency of Elixir Academy
Table No. 28
The above table shows the genderwise total proficiency of the students of
Elixir. According to the table, out of 360 questions, male students gave 4.33%
correct answers, 54.72% incorrect answers and 1.94% questions were not
answered. On the other hand, female students gave 47.77% correct answers,
47.22% incorrect answers and 5% questions were not answered. Therefore,
male and female groups showed satisfactory and good proficiency respectively.
3.2.6 Itemwise Proficiency of Elixir Academy
Table No. 29
Item No. Male Female
CA
% IA
% NA
% T CA
% IA
% NA
% T
Item - 1 14 38.88 21 58.33 1 2.77 36 20 55.55 15 41.66 1 2.77 36
Item - 2 11 30.55 25 69.44 0 0 36 11 30.55 24 66.66 1 2.77 36
Item - 3 16 44.44 20 55.55 0 0 36 14 38.88 21 58.33 1 2.77 36
Item - 4 17 47.22 18 50.00 1 2.77 36 14 38.88 22 61.11 0 0 36
Item - 5 10 27.77 22 61.11 4 11.11 36 16 44.44 7 19.44 13 36.11 36
Item - 6 20 55.55 15 41.66 1 2.77 36 25 69.44 11 30.55 0 0 36
Item - 7 13 36.11 23 63.88 0 0 36 14 38.88 22 61.11 0 0 36
Item - 8 12 33.33 24 66.66 0 0 36 9 25.00 26 72.22 1 2.77 36Item - 9 22 61.11 14 38.88 0 0 36 24 66.66 11 30.55 1 2.77 36Item - 1021 58.33 15 41.66 0 0 36 25 69.44 11 30.55 0 0 36
Male Female
CA % IA % NA % T CA % IA % NA % T
156 43.33 197 54.72 7 1.94 360 172 47.77 170 47.22 18 5 360

61
The above table shows that in Item No. 1, male EA students gave 38.88%
correct answers, 58.33% incorrect answers and 2.77% questions were not
answered. On the other hand, female EA students gave 55.55% correct
answers, 41.66% incorrect answers and 2.77% questions were out of answers.
In Item No. 2, male students gave 30.55% correct answers and 69.44%
incorrect answers. On the other hand, female students gave 30.55% correct
answers, 66.66% incorrect answers and 2.77% questions were not answered. In
Item No. 3, male students gave 44.44% correct answers and 55.55% incorrect
answers. On the other hand, female student gave 38.88% correct answers,
58.33% incorrect answers and 2.77% questions were out of answers. In Item
No. 4, 47.22% correct answers and 50% incorrect answers were given by the
male students where 2.77% questions were out of answers. On the other hand,
female students gave 38.88% correct answers and 61.11% incorrect answers in
Which they answered all the questions. In Item No. 5, male students gave
27.77% correct answers, 61.11% incorrect answers and 11.11% questions were
out of answers. On the other hand, female students gave 44.44% correct
answers, 19.44% incorrect answers and 36.11% questions left unanswered. In
Item No. 6, male students gave 55.55% correct answers, 41.66% incorrect
answers and 2.77% questions were out of answers. On the other hand, 69.44%
correct answers and 30.55% incorrect answers were given by female students.
In Item No.7, male students gave 36.11% correct answers and 33.88% incorrect
answers in which they answered all the questions. On the other hand, female
students gave 38.88% correct answers and 61.11% incorrect answers in which
they answered all the questions same like male students. In Item No. 8, male
students gave 33.33% correct answers and 66.66% incorrect answers. On the
other hand, female students gave 25% correct answers, 72.22% incorrect
answers and 2.77% questions were not answered. In Item No. 9, male students
gave 61.11% correct answers and 38.88% incorrect answers in which they
answered all the questions. On the other hand, female students gave 66.66%
correct answers, 30.55% incorrect answers and 2.77% questions were not
answered. In Item No. 10, male students gave 58.33% correct answers and
41.66% incorrect answers. On the other hand, female students gave 69.44%
correct answers and 30.55% incorrect answers. In this item both male and

62
female students answered all the questions. Thus, male students showed very
good proficiency in Item No. 9; good in Item No.3, 4, 6 and 10; satisfactory in
Item No. 1 and 7; and poor in Item No. 2, 5 and 8. On the other hand, female
students showed very good proficiency in Item No. 6, 9 and 10; good in Item
No. 1; and 5 satisfactory in Item No. 3, 4 and 7; and poor in Item No. 2, 3, 4, 7
and 8.
3.2.7 Total Proficiency of Gyanodaya Secondary School
Table No. 30
The above table shows the genderwise total proficiency of the students of
Gyanodaya Secondary School. According to the table, out of 360 questions,
male students gave 42.5% correct answers, 48.05% incorrect answers and
9.44% questions were not answered. On the other hand, female students gave
50.55% correct answers, 45.83% incorrect answers and 3.61% questions were
not answered. Therefore, female students showed good whereas male students
showed satisfactory proficiency.
3.2.8 Itemwise Proficiency of Gyanodaya Secondary School
Table No. 31
ItemNo.
Male FemaleCA
% IA
% NA
% T CA
% IA
% NA
% T
Item - 1 14 38.88 21 58.33 1 2.77 36 14 38.8820 55.552 5.55 36Item - 2 13 36.11 22 61.11 1 2.77 36 18 50.0017 47.221 2.77 36Item - 3 14 38.88 20 55.55 2 5.55 36 12 33.3324 66.660 0 36Item - 4 16 44.44 17 47.22 3 8.33 36 17 47.2218 50.001 2.77 36Item - 5 9 25.00 14 38.88 13 36.11 36 14 38.8818 50.004 11.1136Item - 6 24 66.66 10 27.77 2 5.55 36 28 77.777 19.441 2.77 36Item - 7 12 33.33 24 66.66 0 0 36 21 58.3314 38.881 2.77 36Item - 8 18 50.00 15 41.66 3 8.33 36 23 63.8813 36.110 0 36Item - 9 17 47.22 13 36.11 6 16.66 36 19 52.7715 41.662 5.55 36Item - 10 16 44.44 17 47.22 3 8.33 36 16 44.4419 52.771 2.77 36
Male Female
CA % IA % NA % T CA % IA % NA % T153 42.5 173 48.05 34 9.44 360 182 50.55 165 45.83 13 3.61 360

63
The above table shows the proficiency of the students studying in Gyanodaya
Secondary School in ten different items. According to the table, in Item No. 1,
male students gave 38.88% correct answers, 58.33% incorrect answers and
2.77% questions were not answered. On the other hand, female students gave
38.88% correct answers, 55.55% incorrect answers and 5.55% questions were
not answered. In Item No. 2, male students gave 36.11% correct answers,
61.11% incorrect answers and 2.77% questions were not answered. On the
other hand, female students gave 50% correct answers, 47.22% incorrect
answers and 2.77% questions were out of answers. In Item No. 3, male students
gave 38.88% correct answers, 55.55% incorrect answers and 5.55% questions
were not answered. On the other hand, female students gave 33.33% correct
answers and 66.66% incorrect answers. In Item No. 4, male students gave
44.44% correct answers, 47.22% incorrect answers and 8.33% questions were
not answered. On the other hand, female students gave 47.22% correct
answers, 50% incorrect answers and 2.77% questions were out of answers. In
Item No. 5, male students gave 25% correct answers, 38.88% incorrect answers
and 36.11% questions were not answered. On the other hand, female students
gave 38.88% correct answers, 50% incorrect answers and 11.11% questions
were not answered. In item No. 6, male students gave 66.66% correct answers,
27.77% incorrect answers and 5.55% questions were not answered. On the
other hand, female students gave 77.77% correct answers, 19.44% incorrect
answers, and 2.77% questions were not answered. In Item No. 7, male students
gave 33.33% correct answers and 66.66% incorrect answers in which they
answered all the questions. On the other hand, female students gave 58.33%
correct answers 38.88% incorrect answers and 2.77% questions were not
answered. In Item No. 8, male students gave 50% correct answers, 41.66%
incorrect answers and 8.33% questions were out of answers. On the other hand,
female students gave 63.88% correct answers and 36.11% incorrect answers. In
Item No. 9, male students gave 47.22% correct answers, 36.11% incorrect
answers and 16.66% questions were not answered. On the other hand, female
students gave 52.77% correct answers, 41.66% incorrect answers and 5.55%
questions were out of answers. In Item No. 10, male students gave 44.44%
correct answers, 47.22% incorrect answers and 8.33% questions were not

64
answered. On the other hand, female students gave 44.44% correct answers,
52.77% incorrect answers and 2.77% questions were out of answers. Therefore,
male students showed very good proficiency in Item No. 6; good in Item No. 4,
8, 9 and 10; satisfactory in Item No. 1, 2 and 3; and poor in Item No. 5 and 7.
On the other hand, female students showed very good proficiency in Item No. 6
and 8; good in Item No. 2, 4, 7, 9 and 10; satisfactory in Item No. 1 and 4; and
poor in Item No. 3.
3.2.9 Total Proficiency of Grammar Public School
Table No. 32
The above table shows the genderwise total proficiency of the students of
Grammar Public School. According to the table, out of 360 questions, male
students gave 48.61% correct answers, 46.66% incorrect answers and 4.72%
questions were not answered. On the other hand, female students gave 47.22%
correct answers, 46.66% incorrect answers and 6.11% questions were not
answered. Therefore, both groups showed good proficiency.
3.2.10 Itemwise Proficiency of Grammar Public School
Table No. 33
Item No. Male FemaleCA
% IA
% NA
% T CA
% IA
% NA
% T
Item - 1 15 41.66 21 58.33 0 0 36 17 47.22 19 52.77 0 0 36Item - 2 17 47.22 15 41.66 4 11.11 36 12 33.33 22 61.11 2 5.55 36Item - 3 17 47.22 17 42.22 2 5.55 36 16 44.44 19 52.77 1 2.77 36Item - 4 16 44.44 19 52.77 1 2.77 36 18 50.00 16 44.44 2 5.55 36Item - 5 13 36.11 18 50.00 5 13.88 36 12 33.33 12 33.33 12 33.33 36Item - 6 18 50.00 18 50.00 0 0 36 23 63.88 12 33.33 1 2.77 36Item - 7 18 50.00 16 44.44 2 5.55 36 20 55.55 14 38.88 2 5.55 36Item - 8 24 66.66 11 30.55 1 2.77 36 16 44.44 20 55.55 0 0 36Item - 9 16 44.44 19 52.77 1 2.77 36 15 41.66 19 52.77 2 5.55 36Item - 10 21 58.33 14 38.88 1 2.77 36 21 58.33 15 41.66 0 0 36
Male Female
CA % IA % NA % T CA % IA % NA % T
175 48.61 168 46.66 17 4.72 360 170 47.22 168 46.66 22 6.11 360

65
The above table shows the itemwise proficiency of the students studying in
Grammar Public School. According to the table, in Item No. 1, male students
gave 41.66% correct answers and 58.33% incorrect answers in which they
answered all the questions. On the other hand, female students gave 47.22%
correct answers and 52.77% incorrect answers. In Item No. 2, male students
gave 47.22% correct answers, 41.66% incorrect answers, and 11.11% questions
were not answered. On the other hand, female students gave 33.33% correct
answers, 61.11% incorrect answers and 5.55% questions were out of answers.
In Item No. 3, male students gave 47.22% correct answers, 42.22% incorrect
answers and 5.55% questions were out of answers. On the other hand, female
students gave 44.44% correct answers, 52.77% incorrect answers and 2.77%
questions were not answered. In Item No. 4, male students gave 44.44% correct
answers, 52.77% incorrect answers and 2.77% questions were out of answers.
On the other hand, female students gave 50% correct answers, 44.44%
incorrect answers and 5.55% questions were not answered. In item No. 5, male
students gave 36.11% correct answers, 50% incorrect answers and 13.88%
questions were not answered. On the other hand, female students gave 33.33%
correct answers, 33.33% incorrect answers and 33.33% questions were out of
answers. In Item No. 6, male students gave 50% correct answers and 50%
incorrect answers where none of the questions were left unanswered. On the
other hand, female students gave 63.88% correct answers, 33.33% incorrect
answers and 2.77% questions were not answered. In Item No. 7, male students
gave 50% correct answers, 44.44% incorrect answers and 5.55% questions
were not answered. On the other hand, 55.55% correct answers, 38.88%
incorrect answers were given by female students in which 5.55% questions
were not answered. In Item No. 8, male students gave 66.66% correct answers,
30.55% incorrect answers and 2.77% questions were found unanswered. On the
other hand, female students gave 44.44% correct answers and 55.55% incorrect
answers in which they answered all the questions. In Item No. 9, male students

66
gave 44.44% correct answers, 52.77% incorrect answers and 2.77% questions
were not answered. On the other hand, female students gave 41.66% correct
answers, 52.77% incorrect answers and 5.55% questions were not answered. In
Item No. 10, male students gave 58.33% correct answers, 38.88% incorrect
answers and 2.77% questions were not answered. On the other hand, female
students gave 58.33% correct answers and 41.66% incorrect answers in which
they answered all the questions. Thus, the proficiency of male students was
found very good in Item No. 8; good in item No. 2, 3, 4, 6, 7, 9 and 10;
satisfactory in Item No. 1 and 5. On the other hand, the proficiency of female
students was found very good in Item No. 6; good in Item No. 1, 3, 4, 7, 8 and
10; satisfactory in Item No. 9; and poor proficiency in Item No. 2 and 5.
3.2.11 Total Proficiency of Saradha Secondary School
Table No. 34
The above table shows the genderwise total proficiency of the students of
Saradha Secondary School. According to the table, out of 360 questions, male
students gave 47.5% correct answers, 45% incorrect answers and 7.5%
questions were not answered. On the other hand, female students gave 43.61%
correct answers, 43.61% incorrect answers and 12.77% questions were not
answered. Therefore, male groups of students showed good whereas female
showed satisfactory proficiency.
Male Female
CA % IA % NA % T CA % IA % NA % T
171 47.5 162 45 27 7.5 360 157 43.61 157 43.61 46 12.77 360

67
3.2.12 Itemwise Proficiency of Saradha Secondary School
Table No. 35
Items
No.
Male Female
CA
% IA
% NA
% T CA
% IA
% NA
% T
Item - 1 14 38.88 22 61.11 0 0 36 18 50.0015 41.663 8.33 36
Item - 2 11 30.55 23 63.88 2 5.55 36 9 25.0021 58.336 16.6636
Item - 3 12 33.33 24 66.66 0 0 36 10 27.7725 69.441 2.77 36
Item - 4 16 44.44 19 52.77 1 2.77 36 16 44.4416 44.444 11.1136
Item - 5 9 25.00 11 30.55 16 44.44 36 8 22.2211 30.5517 47.2236
Item - 6 23 63.88 12 33.33 1 2.77 36 21 58.3314 38.881 2.77 36
Item - 7 24 66.66 12 33.33 0 0 36 23 63.8812 33.331 2.77 36
Item - 8 18 50.00 13 36.11 5 13.88 36 12 33.3318 50.006 16.6636
Item - 9 23 63.88 13 36.11 0 0 36 21 58.3315 41.660 0 36
Item - 10 21 58.33 13 36.11 2 5.55 36 19 52.7710 27.777 19.4436
The above table shows the students' proficiency of Saradha Secondary School.
According to the chart, in Item No. 1, male students gave 38.88% correct
answers and 61.11% incorrect answers. On the other hand, female students
gave 50% correct answers, 41.66% incorrect answers and 8.33% questions
were not answered. In Item No. 2, male students gave 30.55% correct answers,
63.88% incorrect answers and 5.55% questions were out of answers. On the
other hand, female students gave 25% correct answers, 58.33% incorrect
answers and 16.66% questions were not answered. In Item No. 3, male students
gave 33.33% correct answers and 66.66% incorrect answers. On the other
hand, 27.77% correct answers and 69.44% incorrect answers were given by the
female students in which 2.77% questions were not answered. In Item No. 4,
male students gave 44.44% correct answers, 52.77% incorrect answers and
2.77% questions were not answered. On the other hand, female students gave
44.44% correct answers, 44.44% incorrect answers and 11.11% questions were
out of answers. In Item No. 5, male students gave 25% correct answers,

68
30.55% incorrect answers and 44.44% questions were not answered. On the
other hand, female students gave 22.22% correct answers, 30.55% incorrect
answers and 47.22% questions were out of answers. In Item No. 6, male
students gave 63.88% correct answers, 33.33% incorrect answers and 2.77%
questions were out of answers. On the other hand, female students gave
58.33% correct answers, 38.88% incorrect answers and 2.77 questions were out
of answers. In Item No. 7, male students gave 66.66% correct answers and
33.33% incorrect answers. On the other hand, female students gave 63.88%
correct answers, 33.33% incorrect answers and 2.77% questions were out of
answers. In Item No. 8, male students gave 50% correct answers, 36.11%
incorrect answers and 13.88% questions were not answered. On the other hand,
female students gave 33.33% correct answers, 50% incorrect answers and
16.66% questions were not answered. In Item No. 9, male students gave
63.88% correct answers and 36.11% incorrect answers. On the other hand,
female students gave 58.33% correct answers and 41.66% incorrect answers in
which both male and female students answered all the questions. In Item No.
10, male students gave 58.33% correct answers, 36.11% incorrect answers and
5.55% questioned were out of answers. On the other hand, female students
gave 52.77% correct answers, 27.77% incorrect answers and 19.44% questions
were not answered. Thus, the proficiency of male students was found very
good in Item No. 6, 7 and 9; good in Item No. 4, 8 and 10; satisfactory in Item
No. 1; and poor in Item No. 2, 3 and 5. On the other hand, female students
showed very good proficiency in Item No. 7; good in Item No. 1, 4, 6, 9 and
10; and poor in Item No. 2, 3, 5 and 8.

69
3.2.13 Comparison of Schools in Item No. 1
Table No. 36
Nameof theschool
Male Female
CA
% IA
% NA
% T CA
% IA
% NA
% T
N.A. 15 41.66 20 55.55 1 2.77 36 18 50.0016 44.442 5.55 36
E.A. 14 38.88 21 58.33 1 2.77 36 20 55.5515 41.661 2.77 36
G.S.S. 14 38.88 21 58.33 1 2.77 36 14 38.8820 55.552 5.55 36
G.P.S. 15 41.66 21 58.33 0 0 36 17 47.2219 52.770 0 36
S.S.S 14 38.88 22 61.11 0 0 36 18 50.0015 41.663 8.33 36
The above table shows the schoolwise proficiency of the students studying in
five different schools of Kathmandu valley in Item No. 1. According to the
chart, the students of each school were asked 36 questions where the total
number of the students was eight consisting of 50% boys and 50% girls form
each communities. As mentioned in the above chart, male NA students gave
41.66% correct answers, 55.55% incorrect answers and 2.77 questions were not
answered. On the other hand, female NA students gave 50% correct answers,
44.44% incorrect answers and 5.55% questions were not answered. Out of 36
questions, male EA students gave 38.88% correct answers, 58.33% incorrect
answers and 2.77% questions were out of answers. On the other hand, female
EA students gave 55.55% correct answers, 41.66% incorrect answers and
2.77% questions were not answered. Male GSS students gave 38.88% correct
answers, 58.33% incorrect answers and 2.77% questions were out of answers.
On the other hand, female GSS students gave 38.88% correct answers, 55.55%
incorrect answers and 5.55% questions were out of answers. Male GPS
students gave 41.66% correct answers and 58.33% incorrect answers. On the
other hand, female GPS students gave 47.22% correct answers and 52.77%
incorrect answers. Male SSS students gave 38.88% correct answers and
61.11% incorrect answers. On the other hand, female SSS students gave 50%
correct answers, 41.66% incorrect answers and 8.33% questions were out of

70
answers. Thus, the proficiency of male students of all the schools was found
satisfactory. On the other hand, female EA, GPS and SSS students showed
good and GSS showed satisfactory proficiency.
3.2.14 Comparison of Schools in Item No. 2
Table No. 37
Nameof theschool
Male Female
CA
% IA
% NA
% T CA
% IA
% NA
% T
N.A. 15 41.66 21 58.33 0 0 36 28 77.77 8 22.22 0 0 36
E.A. 11 30.55 25 69.44 0 0 36 11 30.55 24 66.66 1 2.77 36
G.S.S. 13 36.11 22 61.11 1 2.77 36 18 50.00 17 47.22 1 2.77 36
G.P.S. 17 47.22 15 41.66 4 11.11 36 12 33.33 22 61.11 2 5.55 36
S.S.S 11 30.55 23 63.88 2 5.55 36 9 25.00 21 58.33 6 16.66 36
The above table shows students' proficiency of all sample students in Item No.
2. According to the chart, male NA students gave 41.66% correct answers and
58.33% incorrect answers in which none of the questions were out of answers.
On the other hand, female NA students gave 77.77% correct answers and
22.22% incorrect answers in which they answered all the questions. Male EA
students gave 30.55% correct answers and 69.44% incorrect answers. On the
other hand, female EA students gave 30.55% correct answers, 66.66% incorrect
answers and 2.77% questions were not answered. Male GSS students gave
36.11% correct answers, 61.11% incorrect answer and 2.77% questions were
out of answers. On the other hand, female GSS students gave 50% correct
answers, 47.22% incorrect answers and 2.77% questions were not answered.
Similarly, male GPS students gave 47.22% correct answers, 41.66% incorrect
answers and 11.11% questions were not answered. On the other hand, female
GPS students gave 33.33% correct answers, 61.11% incorrect answers and
5.55% questions were out of answers. Likewise, male SSS students gave
30.55% correct answers, 63.88% incorrect answers and 5.55% questions were
not answered. On the other hand, female SSS students gave 25% correct

71
answers, 58.33% incorrect answers and 16.66% questions were not answered.
Thus, the proficiency of male students of all the schools was found
satisfactory. On the other hand, female group of NA, EA, GPS and SSS
showed good proficiency. Similarly, female students of GSS showed
satisfactory proficiency.
3.2.15 Comparison of Schools in Item No. 3
Table No. 38
Name of
the
school
Male Female
C
A
% I
A
% N
A
% T C
A
% I
A
% N
A
% T
N.A. 25 69.44 11 30.55 0 0 36 28 77.777 19.441 2.77 36
E.A. 16 44.44 20 55.55 0 0 36 14 38.8821 58.331 2.77 36
G.S.S. 14 38.88 20 55.55 2 5.55 36 12 33.3324 66.660 0 36
G.P.S. 17 47.22 17 47.22 2 5.55 36 16 44.4419 52.771 2.77 36
S.S.S 12 33.33 24 66.66 0 0 36 10 27.7725 69.441 2.77 36
The above table shows students' proficiency of all sample schools in Item No.
3. According to the chart, out of 36 questions male NA students gave 69.44%
correct answers and 30.55% incorrect answers. On the other hand, female NA
students gave 77.77% correct answers, 19.44% incorrect answers and 2.77%
questions were out of answers. Male EA students gave 44.44% correct answers
and 55.55% incorrect answers. On the other hand, female EA students gave
38.88% correct answers, 58.33% incorrect answers and 2.77% questions were
not answered. Male GSS students gave 38.88% correct answers, 55.55%
incorrect answers and 5.55% questions were out of answers. On the other hand,
female GSS students gave 33.33% correct answers and 66.66% incorrect
answers. Male GPS students gave 47.22% correct answers, 47.22% incorrect
answers and 5.55% questions were not answered. On the other hand, female
GPS students gave 44.44% correct answers, 52.77% incorrect answers and
2.77% questions were out of answers. Similarly, male SSS students gave

72
33.33% correct answers and 66.66% incorrect answers. On the other hand,
female SSS students gave 27.77% correct answers, 69.44% incorrect answers
and 2.77% questions were not answered. Therefore, both groups of NA showed
very good and GPS and EA showed good proficiency. On the other hand, male
group of GSS showed satisfactory but female group showed poor proficiently.
Similarly, both groups of SSS students showed poor proficiency.
3.2.16 Comparison of Schools in Item No. 4
Table No. 39
Nameof theschool
Male Female
CA
% IA
% NA
% T CA
% IA
% NA
% T
N.A. 22 61.11 14 38.88 0 0 36 27 75.00 9 25.00 0 0 36
E.A. 17 47.22 18 50.00 1 2.77 36 14 38.88 22 61.11 0 0 36
G.S.S. 16 44.44 17 47.22 3 8.33 36 17 47.22 18 50.00 1 2.77 36
G.P.S. 16 44.44 19 52.77 1 2.77 36 18 50.00 16 44.44 2 5.55 36
S.S.S 16 44.44 19 52.77 1 2.77 36 16 44.44 16 44.44 4 11.11 36
The above table shows students' proficiency of all sample students in Item No.
4. According to the chart, male NA students gave 61.11% correct answers and
38.88% incorrect answers. On the other hand, female NA students gave 75%
correct answers and 25% incorrect answers. Male EA students gave 47.22%
correct answers, 50% incorrect answers and 2.77% questions were out of
answers. On the other hand, female EA students gave 38.88% correct answers
and 61.11% incorrect answers. Likewise, male GSS students gave 44.44%
correct answers, 47.22% incorrect answers and 8.33% questions were out of
answers. On the other hand, female GSS students gave 47.22% correct
answers, 50% incorrect answers and 2.77% questions were not answered.
Similarly, male GPS students gave 44.44% correct answers, 52.77% incorrect
answers and 2.77% questions were not answered. On the other hand, female
GPS students gave 50% correct answers, 44.44% incorrect answers and 5.55%

73
questions were out of answers. In the same way, male SSS students gave
44.44% correct answers, 52.77% incorrect answers and 2.77% questions were
not answered. On the other hand, female SSS students gave 44.44% correct
answers, 44.44% incorrect answers and 11.11% questions left unanswered. In
this way, male and female students of NA showed very good and excellent
proficiency respectively. On the other hand, both groups of EA, GPS, GSS and
SSS showed good proficiency except female group of EA as they showed
satisfactory proficiency.
3.2.17 Comparison of Schools in Item No. 5
Table No. 40
Nameof theschool
Male Female
CA
% IA
% NA
% T CA
% IA
% NA
% T
N.A. 17 47.22 15 41.66 4 11.11 36 10 27.7720 55.556 16.1636
E.A. 10 27.77 22 61.11 4 11.11 36 16 44.447 19.4413 36.1136
G.S.S. 9 25.00 14 38.88 13 36.11 36 14 38.8818 50.004 11.1136
G.P.S. 13 36.11 18 50.00 5 13.88 36 12 33.3312 33.3312 33.3336
S.S.S 9 25.00 11 30.55 16 44.44 36 8 22.2211 30.5517 42.2236
The above table shows the students' proficiency of all sample school in Item
No. 5. According to the chart, out of 36 questions male NA students gave
47.22% correct answers, 41.66% incorrect answers and 11.11% questions were
out of answers. On the other hand, out of 36 questions 27.77% correct answer
and 55.55% incorrect answers were given by female NA students in which
16.16% questions were not answered. Male EA students gave 27.77% correct
answers, 61.11% incorrect answers and 11.11% questions left unanswered. On
the other hand, female EA students gave 44.44% correct answers, 19.44%
incorrect answers and 36.11% questions were not answered. Male GSS
students gave 25% correct answers, 38.88% incorrect answers and 36.11%
questions were out of answers. On the other hand, 38.88% correct answers,
50% incorrect answers were giving by female GSS students in which 11.11%

74
questions left unanswered. Similarly, male GPS students gave 36.11% correct
answers, 50% incorrect answers and 13.88% questions were not answered. On
the other hand, female GPS students gave 33.33% correct answers, 33.33%
incorrect answers and 33.33% questions were out of answers. Likewise, 25%
correct answers and 30.55% incorrect answers were given by male SSS
students in which 44.44% questions were not answered. On the other hand,
22.22% correct answers and 30.55% incorrect answers were given by female
SSS students in which 42.22% questions were out of answers. Therefore, both
groups of SSS showed poor proficiency. On the other hand, male NA students
showed good and female students showed poor proficiency but opposite case
happened to the students of EA. Similarly, male GSS students showed poor
and female showed satisfactory but male students of GPS showed satisfactory
and female showed poor proficiency.
3.2.18 Comparison of Schools in Item No. 6
Table No. 41
Name
of the
school
Male Female
C
A
% I
A
% N
A
% T C
A
% I
A
% N
A
% T
N.A. 22 61.11 13 36.11 1 2.77 36 24 66.6610 27.772 5.55 36
E.A. 20 55.55 15 41.66 1 2.77 36 25 69.4411 30.550 0 36
G.S.S. 24 66.66 10 27.77 2 5.55 36 28 77.777 19.441 2.77 36
G.P.S. 18 50.00 18 50.00 0 0 36 23 63.8812 33.331 2.77 36
S.S.S 23 63.88 12 33.33 1 2.77 36 21 58.3314 38.881 2.77 36
The above table shows the students' proficiency of all sample school in Item
No. 6. According to the table, male NA students gave 61.11% correct answers,
36.11% incorrect answers and 2.77% questions were out of answers. On the
other hand, female NA students gave 66.66% correct answers, 27.77%
incorrect answers and 5.55% question were not answered. Male EA students
gave 55.55% correct answers, 41.66% incorrect answers and 2.77% questions

75
were not answered. On the other hand, female EA students gave 69.44%
correct answers and 30.55% incorrect answers. Similarly, out of 36 questions,
male GSS students gave 66.66% correct answers, 27.77% incorrect answers
and 5.55% questions were out of answers. On the other hand, female GSS
students gave 77.77% correct answers, 19.44% incorrect answers and 2.77%
questions were not answered. Male GPS students gave 50% correct answers
and 50% incorrect answers in which they answered all the questions. On the
other hand, female GPS students gave 63.88% correct answers, 33.33%
incorrect answers and 2.77% questions were out of answers. Likewise, male
SSS students gave 63.88% correct answers, 33.33% incorrect answers and
2.77% questions were out of answers. On the other hand, 58.33% correct
answers and 38.88% incorrect answers were given by female SSS students in
which 2.77% questions were not answered. Therefore, both groups of NA
showed very good proficiency. Similarly, male groups of GSS and SSS, and
female group of EA and GPS showed very good proficiency. Male group of EA
and GPS showed good, female group of GSS showed excellent and SSS
students showed good proficiency.
3.2.19 Comparison of Schools in Item No. 7
Table No. 42
Nameof theschool
Male Female
CA
% IA
% NA
% T CA
% IA
% NA
% T
N.A. 21 58.33 13 36.11 2 5.55 36 25 69.448 22.223 8.33 36
E.A. 13 36.11 23 63.88 0 0 36 14 38.8822 61.110 0 36G.S.S. 12 33.33 24 66.66 0 0 36 21 58.3314 38.881 2.77 36
G.P.S. 18 50.00 16 44.44 2 5.55 36 20 55.5514 38.882 5.55 36
S.S.S 24 66.66 12 33.33 0 0 36 23 63.8812 33.331 2.77 36
The above table shows the genderwise proficiency of all sample school in Item
No. 7. According to the table, 58.33% correct answers and 36.11% incorrect
answers were given by male NA students in which 5.55% questions were not
answered. On the other hand, 69.44% correct answers and 22.22% incorrect

76
answers were given by female students in which 8.33% questions were out of
answers. Out of 36 questions, male EA students gave 36.11% correct answers
and 63.88% incorrect answers in which they answered all the questions. On
the other hand, female EA students gave 38.88% correct answers and 61.11%
incorrect answers. Male GSS students gave 33.33% correct answers and
66.66% incorrect answers. On the other hand, female GSS students gave
58.33% correct answers, 38.88% incorrect answers and 2.77% questions were
not answered. Male GPS students gave 50% correct answers, 44.44% incorrect
answers and 5.55% questions were not answered. On the other hand, female
GPS students gave 55.55% correct answers, 38.88% incorrect answers and
5.55% questions left unanswered. Similarly, male SSS students gave 66.66%
correct answers and 33.33% incorrect answers in which they answered all the
questions. On the other hand, female SSS students gave 63.88% correct
answers, 33.33% incorrect answers and 2.77% questions were not answered.
Therefore, male group of NA and GPS showed good and female group of NA
and SSS showed very good proficiency. Similarly, male students of SSS
showed very good, EA showed satisfactory and GSS showed poor proficiency.
On the other hand, female students of GSS and GPS showed good but EA
showed satisfactory proficiency.
3.2.20 Comparison of Schools in Item No. 8
Table No. 43
Name ofthe
school
Male Female
CA
% IA
% NA
% T CA
% IA
% NA
% T
N.A. 16 44.44 16 44.44 4 11.11 36 13 36.1113 36.1110 27.7736E.A. 12 33.33 24 66.66 0 0 36 9 25.0026 72.221 2.77 36G.S.S. 18 50.00 15 41.66 3 8.33 36 23 63.8813 36.110 0 36G.P.S. 24 66.66 11 30.55 1 2.77 36 16 44.4420 55.550 0 36S.S.S 18 50.00 13 36.11 5 13.88 36 12 33.3318 50.006 16.6636The above table shows the genderwise proficiency of all sample schools in
Item No. 8. According to the table, male NA students gave 44.44% correct
answers, 44.44% incorrect answers and 11.11% questions were not answered.

77
On the other hand, female NA students gave 36.11% correct answers and
36.11% incorrect answers in which 27.77% questions were out of answers.
Male EA students gave 33.33% correct answers and 66.66% incorrect answers.
On the other hand, female EA students gave 25% correct answers, 72.22%
incorrect answers and 2.77% questions were out of answers. Male GSS
students gave 50% correct answers, 41.66% incorrect answers and 8.33%
questions were not answered. On the other hand, female GSS students were
able to give 63.88% correct answers and 36.11% incorrect answers. Similarly,
male GPS students gave 66.66% correct answers, 30.55% incorrect answers
and 2.77% questions were not answered. On the other hand, female GPS
students gave 44.44% correct answers and 55.55% incorrect answers in which
they answered all the questions. Likewise, male SSS students gave 50% correct
answers, 36.11% incorrect answers and they were not able to give the answers
of 13.88% questions. On the other hand, female SSS students were able to give
33.33% correct answers, 50% incorrect answers and 16.66% questions were
not answered. That is why, male students of GPS showed very good, NA, SSS
and GPS showed good and EA showed poor proficiency. On the other hand,
female students of GSS showed very good, GPS showed good, NA showed
satisfactory; and EA and SSS showed poor proficiency in this item.
3.2.21 Comparison of Schools in Item No. 9
Table No. 44
Nameof theschool
Male FemaleCA
% IA
% NA
% T CA
% IA
% NA
% T
N.A. 22 61.11 10 27.77 4 11.11 36 20 55.55 9 25.00 7 19.44 36E.A. 22 61.11 14 38.88 0 0 36 24 66.66 11 30.55 1 2.77 36G.S.S. 17 47.22 13 36.11 6 16.66 36 19 52.77 15 41.66 2 5.55 36G.P.S. 16 44.44 19 52.77 1 2.77 36 15 41.66 19 52.77 2 5.55 36S.S.S 23 63.88 13 36.11 0 0 36 21 58.33 15 41.66 0 0 36
The above table shows the genderwise comparison of proficiency of all sample
schools in Item No. 9. According to the table, male NA students gave 61.11%
correct answers, 27.77% incorrect answers and 11.11% questions were not
answered. On the other hand, female NA students gave 55.55% correct

78
answers, 25% incorrect answers and 19.44% questions were out of answers.
Male EA students gave 61.11% correct answers and 38.88% incorrect answers
in which they answered all the questions. On the other hand, female EA
students gave 66.66% correct answers, 30.55% incorrect answers and 2.77%
questions were not answered. Male GSS students gave 47.22% correct answers,
36.11% incorrect answer and 16.66% questions were not answered. On the
other hand, female students gave, 52.77% correct answers, 41.66% incorrect
answers and 5.55% questions were not answered. Male GPS students gave
44.44% correct answers, 52.77% incorrect answers and 2.77% questions were
not answered. On the other hand, female GPS students gave 41.66% correct
answers and 52.77% incorrect answers in which they left 5.55% questions
unanswered. Similarly, male SSS students gave 63.88% correct answers and
36.11% incorrect answers. On the other hand, female SSS students gave
58.33% correct answers and 41.66% incorrect answers. Therefore, male
students of NA, EA and SSS showed very good and GSS and GPS students
showed good proficiency, on the other hand, female students of EA showed
very good, NA, GSS and SSS showed good and GPS showed satisfactory
proficiency in this item.
3.2.22 Comparison of Schools in Item No. 10
Table No. 45
Name ofthe
school
Male FemaleCA
% IA
% NA
% T CA
% IA
% NA
% T
N.A. 24 66.66 11 30.55 1 2.77 36 27 75.009 25.000 0 36E.A. 21 58.33 15 41.66 0 0 36 25 69.4411 30.550 0 36G.S.S. 16 44.44 17 47.22 3 8.33 36 16 44.4419 52.771 2.77 36G.P.S. 21 58.33 14 38.88 1 2.77 36 21 58.3315 41.660 0 36S.S.S 21 58.33 13 36.11 2 5.55 36 19 52.7710 27.777 19.4436
The above table shows the genderwise comparison of proficiency of all sample
schools. According to the table, male NA students were able to give 66.66%
correct answers and 30.55% incorrect answers in which they left 2.77%
questions unanswered. On the other hand, female students gave 75% correct
answers and 25% incorrect answers in which they answered all the questions.

79
Male EA students gave 58.33% correct answers and 41.66% incorrect answers.
On the other hand, female students gave 69.44% correct answers and 30.55%
incorrect answers in which both groups gave answers of all the questions. Male
GSS students gave 44.44% correct answers, 47.22% incorrect answers and
8.33% questions were not answered. On the other hand, female students gave
44.44% correct answers, 52.77% incorrect answers and 2.77% questions were
out of answers. Male GPS students gave 58.33% correct answers, 38.88%
incorrect answers and 2.77% questions were not answered. On the other hand,
58.33% correct answers and 41.66% incorrect answers were given by the
female students. Similarly, out of 36 questions, 58.33% correct answers and
36.11% incorrect answers were given by the male students of SSS in which
5.55% questions were not answered. On the other hand, 52.77% correct
answers and 27.77% incorrect answers were given by the female students in
which 19.44% questions were out of answers. Therefore, male group of NA
showed very good and female showed excellent proficiency. Similarly, male
and female students of EA showed good and very good proficiency
respectively. On the other hand, both groups of GSS, GPS and SSS showed
good proficiency in this item.
3.3 Mother Tonguewise Analysis
To compare and analyze the proficiency of the students in terms of mother
tongue is one of the objectives of this dissertation. So, this chapter deals with
the mother tonguewise proficiency of the students. But, because of the time
limit and length of the thesis, the researcher tried to interpret the datas on the
whole.

80
3.3.1 Total Proficiency of the Students
Table No. 46Magar Rai Shrestha Yadav
CA % IA % NA % T CA % IA % NA % T CA % IA % NA % T CA % IA % NA % T
433
48.1
1
406
45.1
1
61 6.77
900
454
50.4
4
402
44.6
6
44 4.88
900
439
48.7
7
393
43.6
6
68 7.55
900
429
47.6
6
412
45.7
7
59 6.55
900
The above table shows the mother tonguewise total proficiency of the students.
According to the table, 900 questions were asked to each groups in which
Magar students gave 48.11% correct answers, 45.11 % incorrect answers and
6.77% questions were not answered. On the other hand, Rai students gave
50.44% correct answers, 44.66% incorrect answers and 4.88% questions were
not answered. Similarly, Shrestha students gave 48.77% correct answers,
43.66% incorrect answers 7.55% questions were not answered. On the other
hand, Yadav students gave 47.66% correct answers, 45.77% incorrect answers
and 6.55% questions were not answered. Therefore, all groups of students
showed good proficiency.
3.3.2 Schoolwise Total Comparison of Schools
Table No. 47Item No. Magar Rai Shrestha Yadav
CA % IA % NA % T CA % IA % NA % T CA % IA % NA % T CA % IA % NA % T
N.A. 89 49.44 89 49.44 2 1.11 180 101 56.11 71 39.44 8 4.44 180 118 65.55 38 21.11 24 13.33 180 111 61.66 55 30.55 14 7.77 180
E.A. 75 41.66 98 54.44 7 3.88 180 93 51.66 78 43.33 9 5 180 81 45 97 53.88 2 1.11 180 79 43.88 94 52.22 7 3.88 180
G.S.S. 90 50 68 37.77 22 12.22 180 73 40.55 99 55 8 4.44 180 84 46.66 90 50 6 3.33 180 88 48.88 81 45 11 6.11 180
G.P.S. 91 50.55 78 43.33 11 6.11 180 113 62.77 66 36.66 1 0.55 180 75 41.66 85 47.22 20 11.11 180 66 36.66 107 59.44 7 3.88 180
S.S.S. 88 48.88 73 40.55 19 10.55 180 74 41.11 88 48.88 18 10 180 81 45 83 46.11 16 8.88 180 85 47.22 75 41.66 20 11.11 180
Grand
total
433 48.11 406 45.11 61 6.77 900 454 50.44 402 44.66 44 4.88 900 439 48.77 393 43.66 68 7.55 900 429 47.66 412 45.77 59 6.55 900
The above table shows the schoolwise total comparison of schools. According
to the table, 180 questions were asked to each group in ten language functions,
in which Magar group of students of Nobel Academy gave 49.44% correct

81
answers, 49.55% incorrect answers and 1.11 % questions were not answered.
On the other hand, Rai students gave 56.11% correct answers, 39.44%
incorrect answers and 4.44% questions were not answered. Similarly, Shrestha
students gave 65.55 correct answers, 21.11% incorrect answers and 13.38%
question were not answered. On the other hand, Yadav students gave 61.11%
correct answers, 30.55% incorrect answers and 7.77% questions were not
answered. Therefore, out of four groups, Magar group of students showed the
weakest proficiency.
Magar group of students of Elixir Academy gave 41.66% correct answers,
54.44% incorrect answers and 3.88% questions were not answered. On the
other hand, Rai students gave 51.66% correct answers, 43.33% incorrect
answers and 5% questions were not answered. Similarly, Shrestha students
gave 45% correct answers, 53.88% incorrect answers and 1.11% question were
not answered. On the other hand, Yadav students gave 43.88% correct answers,
52.22% incorrect answers and 3.88% question were not answered. Therefore,
out of four groups, Rai students gave better proficiency in comparison to
others.
Magar group of students of Ganodaya Secondary school gave 50% correct
answers, 37.77% incorrect answers and 12.22% questions were not answered.
On the other hand, Rai students gave 40.55% correct answers, 55% incorrect
answers and 4.44% questions were not answered. Similarly, Shrestha students
gave 46.66% correct answers, 50% incorrect answers and 3.33% question were
not answered. On the other hand, Yadav students gave 48.88% correct answers,
45% incorrect answers and 6.11% questions were not answered. Therefore, out
of four groups the proficiency of Magar students was found better in
comparison to others.
Magar group of students of Grammar Public School gave 50.55% correct
answers, 43.33% incorrect answers and 6.11% questions were not answered.
On the other hand, Rai students gave 62.77% correct answers, 36.66 %

82
incorrect answers and 0.55% questions were not answered. Similarly, Shrestha
students gave 41.66% correct answers, 47.22% incorrect answers and 11.11%
questions were not answered. On the other hand, Yadav students gave 36.66%
correct answers, 59.44% incorrect answers and 3.88% question were not
answered. Therefore, both Magar and Rai group of Grammar Public School
showed better proficiency in comparison to others.
Magar students of Saradha Secondary School gave 48.88% correct answers,
40.55% incorrect answers and 10.55% questions were not answered. On the
other hand, Rai students gave 41.11% correct answers, 48.88% incorrect
answers and 10% questions were not answered. Similarly, Shrestha students
gave 45% correct answers, 46.11% incorrect answers and 8.88% question
questions were not answered. On the other hand, Yadav students gave 47.22%
correct answers, 41.66% incorrect answers and 11.11% questions were not
answered. Therefore, all groups of students showed similar type of proficiency
as their proficiency was found satisfactory.
3.3.3 Itemwise Total Proficiency of the Students
Table No. 48
ItemNo.
Magar Rai Shrestha YadavCA % IA % NA % T CA % IA % NA % T CA % IA % NA % T CA % IA % NA % T
Item 1 40 44.4
4
47 52.2
2
3 3.33 90 39 43.3
3
49 54.4
4
2 2.22 90 38 42.2
2
48 53.3
3
4 4.44 90 42 46.6
6
46 51.1
1
2 2.22 90
Item 2 39 43.3
3
47 52.2
2
4 4.44 90 38 42.2
2
51 56.6
6
1 1.11 90 36 40 47 52.2
2
7 7.77 90 32 35.5
5
53 58.8
8
5 5.55 90
Item 3 38 42.2
2
48 53.3
3
4 4.44 90 46 51.1
1
43 47.7
7
1 1.11 90 41 45.5
5
47 52.2
2
2 2.22 90 39 43.3
3
50 55.5
5
1 1.11 90
Item 4 48 53.3
3
38 42.2
2
4 4.44 90 41 45.5
5
47 52.2
2
2 2.22 90 46 51.1
1
40 44.4
4
4 4.44 90 44 48.8
8
43 47.7
7
3 3.33 90
Item 5 35 38.8
8
31 34.4
4
24 26.6
6
90 34 37.7
7
36 40 20 22.2
2
90 25 27.7
7
40 44.4
4
25 27.7
7
90 24 26.6
6
41 45.5
5
25 27.7
7
90
Item 6 52 57.7
7
35 38.8
8
3 3.33 90 61 67.7
7
26 28.8
8
3 3.33 90 58 64.4
4
30 33.3
3
2 2.22 90 57 63.3
3
31 34.4
4
2 2.22 90
Item 7 44 48.8
8
45 50 1 1.11 90 51 56.6
6
37 41.1
1
2 2.22 90 49 54.4
4
36 40 5 5.55 90 47 52.2
2
40 44.4
4
3 3.33 90
Item 8 40 44.4
4
45 50 5 5.55 90 42 46.6
6
43 47.7
7
5 5.55 90 43 47.7
7
36 40 11 12.2
2
90 36 40 45 50 9 10 90
Item 9 48 53.3
3
35 38.8
8
7 7.77 90 50 55.5
5
37 41.1
1
3 3.33 90 49 54.4
4
34 37.7
7
7 7.77 90 52 57.7
7
32 35.5
5
6 6.66 90
Item 10 49 54.4
4
35 38.8
8
6 6.66 90 52 57.7
7
33 36.6
6
5 5.55 90 54 60 35 38.8
8
1 1.11 90 56 62.2
2
31 34.4
4
3 3.33 90
Total 433 48.1
1
406 45.1
1
61 6.77 900 454 50.4
4
402 44.6
6
44 4.88 900 439 48.7
7
393 43.6
6
68 7.55 900 429 47.6
6
412 45.7
7
59 6.55 900

83
The above table shows the itemwise total proficiency of the students.
According to the table, 90 questions were asked to teach groups in each item in
which Magar students gave 44.44% correct answers, 52.22% incorrect answers
and 3.33% questions were not answered in Item No. 1. On the other hand, Rai
students gave 43.33% correct answers, 54.44% incorrect answers and 2.22%
questions were not answered. Similarly, Shrestha students gave 42.22% correct
answers, 53.33% incorrect answers and 4.44% questions were not answered. In
Item No. 2, Magar students gave 43.33% correct answers, 52.22% incorrect
answers and 4.44% questions were not answered. On the other hand, Rai
students gave 42.22% correct answers, 56.66% incorrect answers and 1.11%
questions were not answered. Similarly, Shrestha students gave 40% correct
answers, 52.22% incorrect answers and 7.77% questions were not answered.
On the other hand, Yadav students gave 35.55% correct answers, 58.88%
incorrect answers and 5.55% questions were not answered. In Item No. 3,
Magar students gave 42.22% correct answers, 53.33% incorrect answers and
4.44% questions were not answered. On the other hand, Rai students gave
51.11% correct answers, 47.77% incorrect answers and 1.11% questions were
not answered. Similarly, Shrestha students gave 45.55% correct answers,
52.22% incorrect answers and 2.22% questions were not answered. On the
other hand, Yadav students gave 43.33% correct answers, 55.55% incorrect
answers and 1.11 questions were not answered. On the other hand, Rai students
gave 45.55% correct answers, 52.22% incorrect answers and 4.44% questiosn
were not answered. In Item No. 4, Magar students gave 53.33% correct
answers 42.22% incorrect answers and 4.44% questions were not answered. On
the other hand, Yadav students gave 48.88% correct answers, 47.77% incorrect
answers and 3.33% questions were not answered. In Item No. 5, Magar
students gave 38.88% correct answers, 34.44% incorrect answers and 26.66%
questions were not answered. On the other hand, Rai students gave 37.77%
correct answers, 40% incorrect answers and 2.22% questions were not
answered. Similarly, Shrestha students gave 27.77% correct answers, 44.44%
incorrect answers and 27.77% questions were not answered. On the other hand,

84
Yadav students gave 26.66% correct answers, 45.55% incorrect answers and
27.77% questions were not answered. In Item No. 6, Magar students gave
57.77% correct answers, 38.88% incorrect answers and 3.33% questions were
not answered. On the other hand, Rai students gave 67.77% correct answers,
28.88% incorrect answers and 3.33% questions were not answered. Similarly,
Shrestha students gave 64.44% correct answers, 33.33% incorrect answers and
2.22% questions were not answered. On the other hand, Yadav students gave
63.33% correct answers, 34.44% incorrect answers and 2.22% questions were
not answered. In Item No-7, Magar students gave 48.88% correct answers,
50% incorrect answers and 1.11% questions were not answered. On the other
hand, Rai students gave 56.66% correct answers, 41.11% incorrect answers and
2.22% questions were not answered. Similarly, Shrestha students gave 54.44%
correct answers, 40% incorrect answers and 5.55% questions were not
answered. On the other hand, Yadav students gave 52.22% correct answers,
44.44% incorrect answers and 3.33% questions were not answered. In Item No.
8, Magar students gave 44.44% incorrect answers, 50% incorrect answers and
5.55% questions were not answered. On the other hand Rai students gave
46.66% correct answers, 47.77 % incorrect answers and 5.55% questions were
not answered. Similarly, Shrestha students gave 47.77% correct answers, 40%
incorrect answers and 12.22% questions were not answered. On the their hand
Yadav students gave 40% correct answers, 50% incorrect answers and 10%
questions were not answered. In Item No. 9, Magar students gave 53.33%
correct answers, 38.88% incorrect answers and 7.77% questions were not
answered. On the other hand, Rai students gave 55.55% correct answers,
41.11% incorrect answers and 3.33% questions were not answered. Similarly,
Shrestha students gave 54.44% correct answers, 37.77% incorrect answers and
7.77% questions were not answered. In item no. 10, Magar students gave
54.44% correct answers, 38.88% incorrect answers and 6.66% questions were
not answered. On the other hand, Rai students gave 57.77% correct answers,
36.66 % incorrect answers and 5.55% questions were not answered. Similarly,
Shrestha students gave 60% correct answers, 38.88% incorrect answers and

85
1.11% questions were not answered. On the other hand, Yadav students gave
62.22% correct answers, 34.44% incorrect answers and 3.33% questions were
not answered.
3.3.4 Total Proficiency of Nobel Academy
Table No. 49
The above table shows the mother tonguewise total proficiency of Nobel
Academy. According to the table, out of ten language functions, Magar
students gave 49.44%, correct answers, 49.44 % incorrect answers and 1.11%
questions were not answered. On the other hand, Rai students gave 56.11%
correct answers, 39.44% incorrect answers and 4.44% questions were not
answered. Similarly, Shrestha students gave 65.55% correct answers, 21.11%
incorrect answers and 13.33 % questions were not answered. On the other
hand, Yadav students gave 61.66% correct answers, 30.55% incorrect answers
and 7.77 questions were not answered. Therefore, Shrestha and Yadav group
of students showed very good whereas Rai and Magar students showed good
proficiency.
Item
No.
Magar Rai Shrestha Yadav
CA % IA % NA % T CA % IA % NA % T CA % IA % NA % T CA % IA % NA % T
Item 1 6 33.33 12 66.66 0 0 18 8 44.44 10 55.55 0 0 18 9 50 7 38.88 2 11.11 18 10 55.55 7 38.88 1 5.55 18
Item 2 7 38.88 11 61.11 0 0 18 8 44.44 10 55.55 0 0 18 16 88.88 2 11.11 0 0 18 12 66.66 6 33.33 0 0 18
Item 3 11 61.11 7 38.88 0 0 18 11 61.11 6 33.33 1 5.55 18 16 88.88 2 11.11 0 0 18 15 83.33 3 16.66 0 0 18
Item 4 11 61.11 7 38.88 0 0 18 11 61.11 7 38.88 0 0 18 13 72.22 5 27.77 0 0 18 14 77.77 4 22.22 0 0 18
Item 5 8 44.44 10 55.55 0 0 18 8 44.44 8 44.44 2 11.11 18 5 27.77 9 50 4 22.22 18 6 33.33 8 44.44 4 22.22 18
Item 6 11 61.11 7 38.88 0 0 18 14 77.77 4 22.22 0 0 18 12 66.66 4 22.22 2 11.11 18 9 50 8 44.44 1 5.55 18
Item 7 7 38.88 11 61.11 0 0 18 11 61.11 5 27.77 2 11.11 18 14 77.77 2 11.11 2 11.11 18 14 77.77 3 16.66 1 5.55 18
Item 8 7 38.88 11 61.11 0 0 18 9 50 7 38.88 2 11.11 18 8 44.44 2 11.11 8 44.44 18 5 27.77 9 50 4 22.22 18
Item 9 9 50 8 44.44 1 5.55 18 10 55.55 74 38.88 1 5.55 18 10 55.55 2 11.11 6 33.33 18 13 72.22 2 11.11 3 33.33 18
Item 10 12 66.66 5 27.77 1 5.55 18 11 61.11 7 38.88 0 0 18 15 83.33 3 16.66 0 0 18 13 72.22 5 27.77 0 0 18
Total 89 49.44 89 49.44 2 1.11 180 101 56.11 71 39.44 8 4.44 180 118 65.55 38 21.11 24 13.33 180 111 61.66 55 30.55 14 7.77 180

86
3.3.5 Total Proficiency of Elixir Academy
Table No. 50Item No. Magar Rai Shrestha Yadav
CA % IA % NA % T CA % IA % NA % T CA % IA % NA % T CA % IA % NA % T
Item 1 7 38.88 11 61.11 0 0 18 9 50 7 38.88 2 11.11 18 9 50 9 50 0 0 18 9 50 9 50 0 0 18
Item 2 9 50 9 50 0 0 18 5 27.77 13 72.77 0 0 18 3 16.66 14 77.77 1 5.55 18 5 27.77 13 72.22 0 0 18
Item 3 5 27.77 13 72.22 0 0 18 8 44.44 10 55.55 0 0 18 9 50 9 50 0 0 18 8 44.44 9 50 1 5.5 18
Item 4 8 44.44 9 50 1 5.55 18 10 55.55 8 44.44 0 0 18 7 38.88 11 61.11 0 0 18 6 33.33 12 66.66 0 0 18
Item 5 6 33.33 6 33.33 6 33.33 18 8 44.44 4 22.22 6 33.33 18 6 33.33 12 66.66 0 0 18 6 33.33 7 38.88 5 27.77 18
Item 6 9 50 9 50 0 0 18 12 66.66 5 27.77 1 5.55 18 12 66.66 6 33.33 0 0 18 12 66.66 6 33.33 0 0 18
Item 7 5 27.77 13 72.77 0 0 18 10 55.55 8 44.44 0 0 18 5 27.77 13 72.22 0 0 18 7 38.88 11 61.11 0 0 18
Item 8 5 27.77 13 72.77 0 0 18 5 27.77 13 72.77 0 0 18 9 50 8 44.44 1 5.55 18 2 11.11 16 88.88 0 0 18
Item 9 12 66.66 6 33.33 0 0 18 12 66.66 6 33.33 0 0 18 10 55.55 8 44.44 0 0 18 12 66.66 5 27.77 1 5.55 18
Item 10 9 50 9 50 0 0 18 14 77.77 4 22.22 0 0 18 11 61.11 7 38.88 0 0 18 12 66.66 6 33.33 0 0 18
Total 75 41.66 98 54.44 7 3.88 180 93 51.66 78 43.33 9 5 180 81 45 97 53.88 2 1.11 180 79 43.88 94 52.22 7 3.88 180
The above table shows the mother tonguewise total proficiency of Elixir
Academy. According to the table, out of ten language functions, Magar
students gave 41.66%, correct answers, 54.44 % incorrect answers and 3.88%
questions were not answered. On the other hand, Rai students gave 51.66%
correct answers, 43.33% incorrect answers and 5% questions were not
answered. Similarly, Shrestha students gave 45% correct answers, 43.88%
incorrect answers and 1.33 % questions were not answered. On the other hand,
Yadav students gave 43.88% correct answers, 52.22% incorrect answers and
3.88% questions were not answered. Therefore, Rai and Shrestha group of
students showed good whereas Magar and Yadav showed satisfactory
proficiency.
3.3.6 Total Proficiency of Gyanodaya Secondary School
Table No. 51Item No. Magar Rai Shrestha Yadav
CA % IA % NA % T CA % IA % NA % T CA % IA % NA % T CA % IA % NA % T
Item 1 7 38.88 9 50 2 11.11 18 5 27.77 13 72.22 0 0 18 8 44.44 9 50 1 5.55 18 8 44.44 10 55.55 0 0 18
Item 2 9 50 8 44.44 1 5.55 18 7 38.88 11 61.11 0 0 18 8 44.44 10 55.55 0 0 18 7 38.88 10 55.55 1 5.55 18
Item 3 7 38.88 9 50 2 11.11 18 6 33.33 12 66.66 0 0 18 5 27.77 13 72.22 0 0 18 8 44.44 10 55.55 0 0 18
Item 4 10 55.55 7 38.88 1 5.55 18 6 33.33 11 61.11 1 5.55 18 7 38.88 10 55.55 1 5.55 18 10 55.55 7 38.88 1 5.55 18
Item 5 7 38.88 6 33.33 5 27.77 18 7 38.88 7 38.88 4 22.22 18 7 38.88 7 38.88 4 22.22 18 2 11.11 12 66.66 4 22.22 18
Item 6 14 77.77 3 16.66 1 5.55 18 12 66.66 5 27.77 1 5.55 18 11 61.11 7 38.88 0 0 18 15 83.33 2 11.11 1 5.55 18
Item 7 11 61.11 7 38.88 0 0 18 6 33.33 12 66.66 0 0 18 9 50 9 50 0 0 18 7 38.88 10 55.55 1 5.55 18
Item 8 10 55.55 5 27.77 3 16.66 18 9 50 9 50 0 0 18 12 66.66 6 33.33 0 0 18 10 55.55 8 44.44 0 0 18
Item 9 7 38.88 7 38.88 4 22.22 18 9 50 7 38.88 2 11.11 18 11 61.11 7 38.88 0 0 18 9 50 7 38.88 2 11.11 18
Item 10 8 44.44 7 38.88 3 16.66 18 6 33.33 12 66.66 0 0 18 6 33.33 12 66.66 0 0 18 12 66.66 5 27.77 1 5.55 18
Total 90 50 68 37.77 22 12.22 180 73 40.55 99 55 8 4.44 180 84 46.66 90 50 6 3.33 180 88 48.88 81 45 11 6.11 180

87
The above table shows the mother tonguewise total proficiency of Gyanodaya
Secondary School. According to the table, out of ten language functions, Magar
students gave 50%, correct answers, 37.77 % incorrect answers and 12.22%
questions were not answered. On the other hand, Rai students gave 45.55%
correct answers, 55% incorrect answers and 4.44% questions were not
answered. Similarly, Shrestha students gave 46.66% correct answers and 50%
incorrect answers and 3.33 % questions were not answered. On the other hand,
Yadav students gave 48.88% correct answers, 45% incorrect answers and
6.11% questions were not answered. Therefore, Magar, Shrestha and Yadav
groups of students showed good whereas Rai group of students showed
satisfactory proficiency.
3.3.7 Total Proficiency of Grammar Public School
Table No. 52Item No. Magar Rai Shrestha Yadav
CA % IA % NA % T CA % IA % NA % T CA % IA % NA % T CA % IA % NA % T
Item 1 10 55.55 8 44.44 0 0 18 12 66.66 6 33.33 0 0 18 4 22.22 14 77.77 0 0 18 6 33.33 12 66.66 0 0 18
Item 2 10 55.55 7 38.88 1 5.55 18 11 61.11 7 38.88 0 0 18 3 16.66 11 61.11 4 22.22 18 5 27.77 12 66.66 1 5.55 18
Item 3 10 55.55 7 38.88 1 5.55 18 14 77.77 4 22.22 0 0 18 6 33.33 10 55.55 2 11.11 18 3 16.66 15 83.33 0 0 18
Item 4 9 50 8 44.44 1 5.55 18 8 44.44 10 55.55 0 0 18 12 66.66 5 27.77 1 5.55 18 5 27.77 12 66.66 1 5.55 18
Item 5 9 50 5 27.77 4 22.22 18 8 44.44 10 55.55 0 0 18 4 22.22 5 27.77 9 50 18 4 22.22 10 55.55 4 22.22 18
Item 6 8 44.44 9 50 1 5.55 18 12 66.66 6 33.33 0 0 18 12 66.66 6 33.33 0 0 18 9 50 9 50 0 0 18
Item 7 10 55.55 7 38.88 1 5.55 18 12 66.66 6 33.33 0 0 18 10 55.55 6 33.33 2 11.11 18 6 33.33 11 61.11 1 5.55 18
Item 8 8 44.44 10 55.55 0 0 18 14 77.77 4 22.22 0 0 18 7 38.88 10 55.55 1 5.55 18 11 61.11 7 38.88 0 0 18
Item 9 8 44.44 8 44.44 2 11.11 18 9 50 9 50 0 0 18 6 33.33 11 61.11 1 5.55 18 8 44.44 10 55.55 0 0 18
Item 10 9 50 9 50 0 0 18 13 72.22 4 22.22 1 5.55 18 11 61.11 7 38.88 0 0 18 9 50 9 50 0 0 18
Total 91 50.55 78 43.33 11 6.11 180 113 62.77 66 36.66 1 0.55 180 75 41.66 85 47.22 20 11.11 180 66 36.66 107 59.44 7 3.88 180
The above table shows the mother tonguewise total proficiency of Grammar
Public School According to the table, out of ten language functions, Magar
students gave 50.55%, correct answers, 43.33 % incorrect answers and 6.11%
questions were not answered. On the other hand, Rai students gave 62.77%
correct answers, 36.66% incorrect answers and 0.55% questions were not
answered. Similarly, Shrestha students gave 41.66% correct answers, 47.22%
incorrect answers and 11.11 % questions were not answered. On the other
hand, Yadav students gave 36.66% correct answers, 59.44% incorrect answers
and 3.88 questions were not answered. Therefore, Rai group of students

88
showed very good, Magar showed good and remaining others showed
satisfactory proficiency.
3.3.8 Total Proficiency of Saradha Secondary School
Table No. 53Item No. Magar Rai Shrestha Yadav
CA % IA % NA % T CA % IA % NA % T CA % IA % NA % T CA % IA % NA % T
Item 1 10 55.55 7 38.88 1 5.55 18 5 27.77 13 72.22 0 0 18 8 44.44 9 50 1 5.55 18 9 50 8 44.44 1 5.55 18
Item 2 4 22.22 12 66.66 2 11.11 18 7 38.88 10 55.55 1 5.55 18 6 33.33 10 55.55 2 11.11 18 3 16.66 12 66.66 3 16.66 18
Item 3 5 27.77 12 66.66 1 5.55 18 7 38.88 11 61.11 0 0 18 5 27.77 13 72.22 0 0 18 5 27.77 13 72.22 0 0 18
Item 4 10 55.55 7 38.88 1 5.55 18 6 33.33 11 61.11 1 5.55 18 7 38.88 9 50 2 11.11 18 8 44.44 9 50 1 5.55 18
Item 5 5 27.77 4 22.22 9 50 18 3 16.66 7 38.88 8 44.44 18 3 16.66 7 38.88 8 44.44 18 6 33.33 4 22.22 8 44.44 18
Item 6 10 55.55 7 38.88 1 5.55 18 11 61.11 6 33.33 1 5.55 18 11 61.11 7 38.88 0 0 18 12 66.66 6 33.33 0 0 18
Item 7 11 61.11 7 38.88 0 0 18 12 66.66 6 33.33 0 0 18 11 61.11 6 33.33 1 5.55 18 13 72.22 5 27.77 0 0 18
Item 8 10 55.55 6 33.33 2 11.11 18 5 27.77 10 55.55 3 16.66 18 7 38.88 10 55.55 1 5.55 18 8 44.44 5 27.77 5 27.77 18
Item 9 12 66.66 6 33.33 0 0 18 10 55.55 8 44.44 0 0 18 12 66.66 6 33.33 0 0 18 10 55.55 8 44.44 0 0 18
Item 10 11 61.11 5 27.77 2 11.11 18 8 44.44 6 33.33 4 22.22 18 11 61.11 6 33.33 1 5.55 18 10 55.55 6 33.33 2 11.11 18
Total 88 48.88 73 40.55 19 10.55 180 74 41.11 88 48.88 18 10 180 81 45 83 46.11 16 8.88 180 85 47.22 75 41.66 20 11.11 180
The above table shows the mother tonguewise total proficiency of Sarada
Secondary School. According to the table, out of ten language functions, Magar
students gave 48.88%, correct answers, 40.55% incorrect answers and 10.55%
questions were not answered. On the other hand, Rai students gave 41.11%
correct answers, 48.88% incorrect answers and 10% questions were not
answered. Similarly, Shrestha students gave 45% correct answers, 46.11%
incorrect answers and 8.88% questions were not answered. On the other hand,
Yadav students gave 47.22% correct answers, 41.66% incorrect answers and
11.11% questions were not answered. Therefore, Magar groups of students
showed satisfactory whereas others showed good proficiency.

89
CHAPTER – FOUR
FINDINGS AND RECOMMENDATIONS
While writing the thesis this section is as important as other sections from
which we come to know about the conclusion of the whole study and some
important tips for all who are involved in teaching field, course design and
administration as well. Considering this fact the researcher has tried to go in
depth of his study to find out the shortcomings in the matter of communicative
proficiency of non-native Nepali speakers who are studying in grade ten so as
to suggest some pedagogical implications on the basis of the findings obtained
from the whole analysis.
The study itself has its good aspect that it is related with the various language
functions which are necessary for the students in day-to-day communication to
socialize them in the societies of the present world. There are various language
functions in the textbook of grade ten which facilitate the learners to learn
language through communication but effective teaching methods, presentation
of those functions and modern scientific teaching equipments which are the
important parts to get the students mastered in this field are not found
satisfactory. As a result, students were able to give the answers of nearly 50%
questions and many questions related to some items left unanswered.
Therefore, from the whole study the researcher found various findings and
recommendations which are mentioned in this section.
4.1. Findings
Some of the major findings obtained from the analysis and interpretations are
mentioned below:
i) As a whole it was found that the total proficiency of the students
was 48.78 %. Therefore, their proficiency was proved as good.

90
ii) In terms of schoolwise proficiency of the students the study
showed that the performance of the students of Nobel Academy
was the best, and Elixir Academy and Saradha Secondary School
was the weakest among five sample schools as the proficiency of
the first one was found 58.19% and remaining others was
45.55%.
iii) Out of all sample students in ten language functions the
proficiency of male and female students was found 47.44% and
50.05% respectively. Therefore, female students showed better
performance in comparison to male students in which the
difference in their performance was less than 3%.
iv) All the sample schools showed the best performance in item no. 6
(i.e. giving advice/warning) and the weakest performance in item
no. 5. (i.e. reporting, giving and withholding permission) out of
ten language functions.
v) Among all four groups of non-native Nepali speakers Rai group
of students showed the best and Yadav group of students showed
the weakest performance as their proficiency was found 50.44%
and 47.66% respectively.
vi) Many exponents were found in declarative forms. For example,
‘why you go to gym center?’ for asking questions instead of ‘why
do you go to gym center?’

91
4.2. Recommendations
The following recommendations have been made on the basis of the findings
obtained from the analysis.
i) Concerned persons and authorities should launch effective
programmes from which students will have access to language
functions to use them appropriately.
ii) Students should be encouraged to use appropriate language
functions in appropriate situation from the very beginning.
iii) Most of the students of all the sample schools did not have the
clear concept about item no. 5 (i.e. reporting, giving and
withholding permission). Therefore, their performance was found
the weakest among all language items. For this, teachers should
make them clear about this language item with simple
introduction and examples.
iv) At the time of teaching, priority should be given to male students
to enhance their well performance.
v) Yadav group of students should be given any kind of opportunity
and priority in comparison to others to improve their
performance.
vi) To minimize the declarative forms of sentence teachers should
help and motivate the students by using several language
functions with their structures.

92
REFERENCES
Abrams, M.H. (2005). A glossary of literary terms. USA: Thomson
Wardworth.
Bandhu, C.M. (2006). The secret speech of the Gandharuas. Kathmandu:
Linguistic Society of Nepal, 27, 81.
Bhattarai, G.R. (2005). “A sample research proposal.” Young Voices in ELT, 4,
1-6.
Brown, H.D. (1993). Principles of language learning and teaching. New Jersy:
Prentice Hall.
Corder, S. Pit. (1973). Introducing applied linguistics. Harmondsworth, UK:
Penguin Books.
Dahal, R.P. (2004). Students' proficiency in expressing communicative
function. An unpublished thesis of M.Ed., T.U. Kathmandu
Ghimire, Y.N., (2007). A study on proficiency in communicative functions in
English: A Case of PCL Second Year Students of T.U. An unpublished
thesis of M.Ed., T.U. Kathmandu.
Guragain, D.P., (2003). A study on the learners' ability of use colloquial. An
unpublished thesis of M.Ed., T.U. Kathmandu
Gyanwali, S. (2007). Proficiency in the use of communicative functions by
grade ten students. An unpublished thesis of M. Ed., T.U. Kathmandu.
Halliday, M. (1973). Exploration in the functions of languages. London:
Edward Arnold.
Khaniya, T.R. (2005). Examination for enhanced learning. Kathmandu:
Millennium Publication.

93
Kumar, R. (1999). Research methodology. New Delhi: Sage Publication.
Larsen Freeman, D. Q., (1986). Techniques and principles in language
teaching. Hong Kong: Oxford University Press.
Sharma, L.P. (2004). A study on the proficiency in the communicative functions
and their exponents: A Comparative Study. An unpublished thesis of
M.Ed., T.U. Kathmandu.
Sthapit, S.K. (2000). “Teaching language for communication.” Journal of
NELTA, 5, 1.
Todd, L. (1991). An introduction to linguistics. London: Longman.
Van Ek, J.A. (1976). The threshold level. UK: Council of Europe.
Wardhaugh. R. (2000). An introduction to sociolinguistics. London: Blackwell
Publisher.
Wilkins, D.A. (1976). Notional syllabus. London: Oxford University Press.
Yadav, P.K. (2005). Proficiency of students in communicating in English. An
unpublished thesis of M.Ed., T.U. Kathmandu.

94
APPENDIX – 1
SAMPLE TEST QUESTIONNAIRE
SUBJECTIVE QUESTIONS
School's Name :
………………………………………………………………….
Student's Name : ……………………………………………………………….
Class : …………………. Caste : ………………….
Sex: Male ( ) Female ( ) Time : 1.00 hour
Imagine the following situations. What would you do?
1. Pretend that you were the thief yesterday. You stole ten thousands
rupees from Suren's house. Report to your friend about what you told
the house owner during stolen?
……………………………………………………………………………
……………………………………………………………………………
2. You and one of your friends didn't do the homework given by your
English class teacher. The English class teacher asked you several
questions about why you didn't do. Report any one question to your
friends that he asked.
……………………………………………………………………………
……………………………………………………………………………
3. Imagine that you are a teacher. One of your students asks you to go out
to drink water. Give permission to the student.
……………………………………………………………………………
……………………………………………………………………………
4. One of your friends Sarmila is studying in a campus. She wants part
time job. She comes to your house for advice. Give advice to her.
……………………………………………………………………………
……………………………………………………………………………

95
5. A husband and wife have had a fight. She is with her family. They are
talking on the phone, and he wants her to come. She is expressing her
condition (I).
……………………………………………………………………………
……………………………………………………………………………
6. You were a regular student of class ten but you missed your class the
day before. Your class teacher asked you about why you didn't come.
Give him/her any one reason.
……………………………………………………………………………
……………………………………………………………………………
7. Pretend that you are a student of class ten. Yesterday you went late to
school so the head teacher told you to come school on time. Report what
he/she told you.
……………………………………………………………………………
……………………………………………………………………………
8. Imagine that you are a guard of a company. You always stand on the
parking place. Next behind you is a place were there is a signboard
written 'No Parking Here'. One of the men comes with motorcycle and
wants to park his cycle there. Withhold permission.
……………………………………………………………………………
……………………………………………………………………………
9. A boy/girl likes to marry with you. You like him/her very much and like
to marry with him/her but you are expressing your condition (I).
……………………………………………………………………………
……………………………………………………………………………
10. You and a fellow worker are talking. He is telling you about a
conversation about overtime work he recently had with the boss. Report
to your friend about what the boss told you.
……………………………………………………………………………
……………………………………………………………………………

96
11. You had gone to Pokhara two weeks ago for taking part in an interview.
The interviewer asked you two questions which were very important.
Report those two questions that he asked.
a. …………………………………………………………………………
b. …………………………………………………………………………
12. You are travelling by a bus on the way to Biratnagar from Kathmandu.
One of the passengers beside you is smoking. Withhold permission.
……………………………………………………………………………
……………………………………………………………………………
13. Imagine that you are a doctor. One of your friends comes there at your
clinic that he/she has a problem of diarrhoea. Give him/her advice.
……………………………………………………………………………
……………………………………………………………………………
14. A boy is asking his father for getting permission to use the family
motorcycle. The father wants to give permission on certain condition.
He is expressing his condition (I).
……………………………………………………………………………
……………………………………………………………………………
15. One of your close friends requests you to go to Pokhara but you don't
like to go there. You request her/him to go to Nagarkot, but she doesn't
like to go to Nagarkot. Ask her/him one reason about why she likes to
go to Pokhara not to Nagarkot.
……………………………………………………………………………
……………………………………………………………………………
16. Fill in the blank to complete the sentences of your partner.
a. Though he was tired,
……………………………………..……………….
b. In spite of his request,
…………………………………………….……….
c. He failed the exam, even though
…………………………..………………

97
d. Although it was raining outside,
………………………….……………….
17. Suppose that you are a Nepalese Army. You have been serving as a
Nepalese Army for two years. Mr. Dill Bahadur Gurung is the chief of
the army. Report in about two sentences about what he told you to do.
a. …………………………………………………………..……….……
b. ………………………………………………………..…………….…
18. You have recently heard The English News from Radio Nepal by Shila
Chanda. Report to your friend the headline that you heard.
……………………………………………………………………………
……………………………………………………………………………
19. Yesterday you met to your friend on the way to school. Report one
question that you asked him/her on the way that he/she became very
happy with you.
……………………………………………………………………………
……………………………………………………………………………
20. Read the following sentence and report on what your partner has said.
A. Ram, finish the work before you leave.
B. ……………………………………………………….
21. Give examples how each of the following communicative function can
be expressed in different ways.
a. withholding permission
……………………………………………………………………
b. reporting, withholding permission
i) ……………………………………………..……………………
ii) ………………………………………………………..………….
c. reporting permission
i) …………………………………………………………..….
ii) ………………………………………………………….…….

98
22. One of your friends wants to go to abroad. He/She can't decide whether
to go by bus, train or plane. He/She comes at your house with the
problem. Give him/her advice.
……………………………………………………………………………
……………………………………………………………………………
23. You are physically weak student in your class. You are always beaten by
your friends. Express your condition (II).
……………………………………………………………………………
……………………………………………………………………………
24. Suppose that you are a famous football player. You always hit the goal
when you are at the corner. Now you are at the front of the ground.
Express your condition (II).
……………………………………………………………………………
……………………………………………………………………………
25. One of you classmates always goes to the temple but you don't know
why he/she goes there. Ask him/her why he/she goes there.
……………………………………………………………………………
……………………………………………………………………………
26. You are the oldest son of your parents. You are never loved by your
parents. Your parents love to your elder brother very much. Now
express your condition (I).
……………………………………………………………………………
……………………………………………………………………………
27. Your younger brother is going to take an exam but he is not well-
prepared. Advise him.
……………………………………………………………………………
……………………………………………………………………………
28. Read the following sentence and report your friend what Mina says.
A. I am going to learn to swim.
B. ……………………………………………………………………..……

99
29. Fill in the blank spaces.
a. If he laboured hard, ………………………………………………..…..
b. He could win the race , if he ……………………………………….…..
30. One of your neighbours always goes to the gym centre but you don't
know why he/she goes there. Ask him/ her why he/she goes there.
……………………………………………………………………………
…………………………………………………………………………..
Thanking you !

100
OBJECTIVE QUESTIONS
School's Name: ………………………………………………………….
Student's Name:…………………………………………………………..
Class:……………….. Caste:……………….
Sex: Male ( ) Female ( )
Time: 1 hour
Tick ( √ ) the best answer.
1. 'She told me that she was watching an excellent movie' is said when
someone wants
a. to report command b. to report question
c. to report statement d. to report permission
2. 'She asked me if she would meet me' serves the communicative function of
a. reporting statement b. clarifying
c. showing the limit of knowledge d. reporting question
3. The expression 'I'm allowed to stay at home on Saturday' serves the
communicative function of
a. reporting, giving permission b. reporting, withholding permission
c. reporting past event d. asking for permission
4. The expression 'you can ……….. but you mustn't ………….. 'serves the
communicative function of
a. reporting, withholding permission
b. giving and withholding permission
c. withholding permission d. withholding warning
5. The expression 'The head teacher told me to come school at ten o'clock'
serves the communicative function of
a. reporting command b. giving advice
c. reporting statement d. giving permission

101
6. The expression 'you should take Cetamole' serves the communicative
function of
a. giving permission b. giving advice
c. giving instruction d. talking about personal experience
7. When someone says 'If Anil fails the exam, he won't come'. Here the person
is
a. expressing performance b. expressing intention
c. telling purpose d. expressing condition (I)
8. When someone says 'I go to the bank so that I can purchase the money.' Here
the speaker is
a. asking for reason. b. expressing condition
c. telling purpose d. expressing unexpected result
9. When someone says 'she was 85 years old, however she still lived a very
active life.' Here the person is
a. expressing her ability b. expressing her performance
c. agreeing d. expression unexpected result
10. The expression 'I hear you are getting a transfer and promotion' serves the
communicative function of
a. describing b. reporting command
c. reporting statement d. talking about present event
11. The expression 'Priti asked where the party was' serves the communicative
function of reporting question.
a. strongly agree b. fairly agree
c. disagree d. strongly disagree
12. The expression 'The chief of the army told her not to shut him' serves the
communicative function of
a. reporting command b. advising
c. suggesting d. reporting statement

102
13. The statement 'Ram wasn't permitted to enter the classroom' is an
example of
a. giving permission b. reporting giving permission
c. reporting, withholding permission. d. warning.
14. The sentence 'you may go' is an example of
a. ordering b. giving permission
c. commanding d. expressing intention
15. The expression 'Don’t let her take photograph until/ unless she's asked the
caretaker' serves the communicative function of
a. commanding b. ordering
c. withholding permission d. advising
16. The statement 'If you don’t eat, you will be hungry' serves the
communicative function of expressing condition (I)
a. strongly agree b. fairly agree
c. disagree d. strongly disagree
17. The expression 'If it goes on raining like this, there will be a lot of
landslides' serves the communicative function of
a. expressing condition(II) b. expressing condition(I)
c. expressing unexpected result d. reporting statement
18. When someone says 'The water was icy cold, however, we went
swimming.' Here the person is
a. expressing condition b. expressing willingness
c. expressing unexpected result d. expressing probability
19. Mahesh says 'I am unlucky'. This can be reported as
a. Mahesh says that I am unlucky. b. Mahesh says that I was unlucky
c. Mahesh says that he is unlucky d. Mahesh said that he was unlucky
20. 'Professor Johnson asked me what my problem was. He asked me if he
could solve my problem. 'Here the person is
a. seeking information b. reporting question
c. complaining d. reporting statement

103
21. The chief said and quote 'Democracy is dead' serves the communicative
function of 'reporting statement'
a. strongly agree b. fairly agree
c. disagree d. strongly disagree
22. He said to my sister 'Did you drink milk?' This can be reported as
a. He asked my sister if she had drunk milk.
b. He asked my sister if milk is drunk.
c. He asked my sister if had she drunk milk.
d. He asked my sister if did she drink milk.
23. The expression 'The superintended told the examinee to punish them if they
would cheat' serves the communicative function of
a. ordering b. clarifying
c. reporting statement d. reporting command
24. The expression 'come with me' serves the communicative function of
a. giving advice b. giving permission
c. giving expression d. giving performance
25. Ram says 'You aren't allowed to go out.' Here Ram is
a. giving permission b. withholding permission
c. suggesting d. offering
26. 'You should buy another one' serves the communicative function of
a. advising b. expressing condition
c. expressing modality d. warning
27. 'In spite of the cold weather, ………' Here the possible answer to fill the
gap is
a. we kept the fire on all day b. we all wore shirt
c. we all wore sweaters d. we all wore warm clothes
28. When someone says 'I don't like to come on time because of my urgency.'
Here the person is
a. giving purpose b giving condition
c. giving reason d. giving dissatisfaction

104
29. The expression 'If he doesn't run fast he will lose the race' serves the
communicative functions of
a. expressing ability to do something b. expressing condition (I)
c. expressing condition (II) d. expressing unexpected result
30. He says 'I can't tell you anything about her'. Here the statement can be
reported as
a. He says that he couldn't tell him anything about her.
b. He says that he couldn't have told anything about her.
c. He says that he couldn't tell me anything about him.
d. He says that he can't tell me anything about her.
31. 'She asked me if she would meet me' is the reporting question of
a. She said to me "Shall we meet him?"
b. She said to me "Shall I meet you ?"
c. She said to me "Shall I meet her?"
d. She said to me "Will I meet you ?"
32. The expression 'The boss of the restaurant told his employees to be honest'
serves the communicative function of
a. reporting command b. giving advise
c. giving instruction d. suggesting
33. 'You mustn't take the drug again' is said for
a. expressing inability b. warning
c. giving advise d. expressing compliments
34. The expression 'If I were you, I would stop writing him' serves the
communicative function of
a. expressing condition(II) b. expressing willingness
c. advising d. giving permission
35. 'They aren't permitted to enter through this gate' is said for
a. giving permission b. giving warning
c. withholding permission d. reporting, withholding permission

105
36. 'If you ………………… the glass, you would have been punished'.
Here the possible answer to fill the gap is
a. have broken b. had broken
c. broke d. break
37. 'If he hadn't come to Nepal, he wouldn't have seen Mt. Everest' is said for
a. expressing condition (I) b. expressing condition (II)
c. expressing inability to do something d. persuading someone to do
something
38. 'Although her parents objected, she still insisted on getting married' is said
for
a. committing b. expressing unexpected result
c. expressing want d. accepting
39. The expression 'If you learn English, you will go to America' serves the
communicative function of
a. expressing condition (I) b. expressing condition (II)
c. expressing unexpected result d. accepting
4o. 'Reporting other people speech' is similar to the communicative function of
a. describing b. quoting
c. telling c. specifying
41. 'The teacher told the student to be straight' is said for
a. warning b. giving direction
c. criticizing d. reporting command
42. 'Don't let your students make noise in the classroom' is an example of
a. reporting withholding permission b. withholding permission
c. suggesting d. warning
43. 'You mustn't spit here' is said for
a. warning b. making request
c. making offers d. expressing intentions
44. The expression 'If he had not come to Nepal, we wouldn't have seen FewaLake' serves the communicative function of
a. expressing condition (I) b. expressing condition (II)
c. expressing unexpected result d. denying

106
45. When some one says 'I had gone to abroad for earning money.' Here the
person is
a. telling purpose b. talking about the past
c. describing purpose d. clarifying
46. 'No roads are good, ……………. Here the possible answer to fill the gap is
a. as they spend huge money
b. even though they spend huge money
c. in spite of they spend huge money
d. because of they spend huge money
47. 'Because of fuel shortage, no vehicles are running' is said for
a. giving purpose b. describing purpose
c. giving reason d. expressing unexpected result
48. When someone says 'Why do you come to school?' Here the person is
a. asking for reason b. seeking permission
c. asking for permission d. asking for purpose
49. The expression 'You should do exercise' is said for
a. giving instruction b. persuading someone to do something
c. advising d. giving permission
50. The expression 'Unless Prabina could dance, she wouldn't be very popular'
serves the communicative function of
a. expressing unexpected result
b. expressing condition (I)
c. expressing condition (II)
d. expressing inability to do something
Thanking you !

107