profile - amazon s3 · 2019-09-11 · tecon vila do conde. we believe the process can be concluded...
TRANSCRIPT


CEO’s Message .......................................................................................................................................................... 3
Introduction .................................................................................................................................................................. 5
Ethics and transparency ............................................................................................................................ 6
• Profile ....................................................................................................... ....................................................................... 7 Mission, Vision and Values Business units Areas of operation Competitive advantages DVA
• Corporate governance ........................................................................................................................... 13 Corporate structure Governance structure Compliance policy Commitments Relationship with shareholders
• Recognition ....................................................................................................................................................... 16 Certificates, awards and ratings
Innovation .................................................................................................................................................................... 18
• Strategy ................................................................................................................................................................ 19 Management methods and tools
• Relationship and engagement with stakeholders ..................................... 20
• Risk management ..................................................................................................................................... 23
Agility and Precision .................................................................................................................................... 25
• Operational performance ........................................................................................................... 26 Highlights of the year
Commitment to results ........................................................................................................................... 30
• Economic and financial performance ......................................................................... 31 Capital markets Investments
Safety ....................................................................................................... ........................................................................... 42
Health and safety
Valuing individuals and respecting diversity ....................................................... 48
• Internal public ............................................................................................................................................. 49 Development and qualification Volunteers and diversity
• Customers ......................................................................................................................................................... 56
• Suppliers ............................................................................................................................................................. 12
Environmental and social responsability ...................................................................... 62
• Communities ................................................................................................................................................. 63 Impact management Social investment
• Environment ................................................................................................................................................ 66
Energy
Emissions
Water
Effluents and waste
Biodiversity
Corporate information ............................................................................................................................ 79
GRI’s Content Summary .......................................................................................................................... 81
Credits .............................................................................................................................................................................. 102
2015 SUSTAINABILITY REPORT

CEO’S MESSAGE GRI G4-1 | G4-2
Company’s results in 2015 were strongly impacted by the weak
performance of the Brazilian economy. GDP’s reduction and high inflation
restricted our growth and affected our profitability. Real devaluation
against U.S. dollar also reduced the volume of imported containers in
the Port of Santos. Our strategy to face this challenging scenario was
to increase productivity in all of the Company’s areas, reduce costs and
improve the level of services being provided.
The total container operation in our port terminals was of 1.407.377
TEU, a decrease of 4.6% in comparison to 2014. Tecon Santos maintained
its leading position in the Port of Santos for container operation
and customs storage, as well as TEV for vehicle operation. Tecon
Imbituba operated 30.831 TEU, a decrease of 27.6% in relation to the
previous year. Tecon Vila do Conde had the best performance closing the
year with the operation of 71.067 TEU, an increase of 9.7% in relation to 2014.
We closed the year with a net loss amounting to R$ 18.1 million and
EBITDA of R$ 146.6 million. EBITDA margin decreased to 15.2% by virtue
of the drop of prices in Santos due to cost inflation, especially managed
costs and the loss of R$ 30.6 million resulting from the recoverability test
of Tecon Imbituba. In the financial area, we highlight cash generation
from operating activities, closing the year in the amount of R$ 167.6
million and the low indebtedness level, with gross debt amounting to R$
339.6 million and net debt amounting to R$ 113.5 million. Unfortunately,
the downgrading of sovereign credit in Brazil by S&P affected the
Company, rating, which was downgraded from brAAA to brAA.
In September, we entered into with the Port Special Office (Secretaria
Especial de Portos, or “SEP”) the early extension of the leasing agreement
of Tecon Santos. We assumed the obligation to invest approximately
R$ 1.3 billion until 2020. This new cycle of investments will enable
the increase in the capacity and productivity of the Terminal. It is worth
to point out that Tecon Santos already operates with productivity
comparable to the best port terminals worldwide. We closed 2015 with
the monthly average of 106 MPH (Hourly Operation) per vessel. The best
performance per vessel of the year was at MSC Bremen, in operation on
April 2015 at Tecon Santos, which reached the total number of 225.26
MPH, 44.14 MPH per container crane.
It is also pending the request for early extension of the leasing agreement of
Tecon Vila do Conde. We believe the process can be concluded throughout
2016, and that the agreement may be extended for another 15 years,
until 2033. Tecon Vila do Conde had a growth of 88.5% over the last
three years and must contribute in a more significant way with cash
generation of the Company as from 2016.
Throughout the year, we made some progress with respect to
Transparency and Anti-corruption Practices with the publication of our
CEO’S MESSAGE / 2015 SUSTAINABILITY REPORT 3

Compliance Policy and the creation of a reporting channel. Managed by
external auditors, such new channel may be accessed through the
Company’s website and is available to all of our relationship targets. We
have improved our sustainability management and will continue to be
committed to all ten principles comprising The Global Compact, an
international initiative headed by the UN that we adopted as reference
since 2013. Our Health and Safety; Greenhouse Gas and Water
Emissions; and Local Development indicators also made progress and
refer to relevant indicators of our business.
For 2016, macroeconomic perspectives indicate a challenging scenario.
Exports must exceed imports due to foreign exchange and the reduced
internal consumption. Coastal shipping must continue to have a positive
and increasing performance. In this regard, in order to improve the results
and recover our margins, we will keep the strategy to use our efforts to
increase productivity and reduce costs in all of the Company’s areas. At
Tecon Vila do Conde and Tecon Imbituba, we will use a strong commercial
effort in order to increase operations by attracting new customers.
We will also continue to anticipate demands and our customers’ needs,
offering services that add value to their products and clearly contributing
to their competitiveness. We believe that by doing so we will keep our
capacity to generate wealth in the long-term to our shareholders,
customers, employees, the community and all society.
Antônio Carlos SepúlvedaCEO
CEO’S MESSAGE / 2015 SUSTAINABILITY REPORT 4

INTRODUCTION GRI G4-42
This is the eighth annual report published by Santos Brasil (the last one
was published in the first quarter of 2015, referring to 2014), the fourth
report prepared pursuant to the Global Reporting Initiative (GRI)
guidelines and the third report pursuant to G4 form (crucial
“acknowledgement” option) – which indicates our continuous search
for improvement and commitment to our Ethics and Transparency.
GRI G4-29 | G4-30 | G4-32
This report reflects 2015 accomplishments, achievements and challenges,
as well as the financial statements of all business units (Tecon Santos,
Tecon Imbituba, Tecon Vila do Conde, Vehicle Terminal and Santos Brasil
Logística), and it is intended to become into an integrated report – in
which sustainability dimensions are connected. Information provided at
previous years has not been rearranged in this report. GRI G4-17 | G4-22
| G4-28 | G4-33
In order to establish content, the Company adopted the materiality principle,
including matters that are relevant to the Company and to its targets. These
principles aim to reflect the impact and influence of our business on social,
environmental and economic-financial scopes – which are referred to and
monitored at the operations and units of the Company. The work was
performed in 2012 and consisted of crosschecking research results with
an internal analysis on material respects to the parties involved. This process
was conducted by the senior management of the Company, in a partnership
with advisory Via Gutenberg. GRI G4-18
In 2014, the Sustainability Committee redefined the key-indicators to
each matter indicated as a priority matter, having an impact within and
outside the Company. Matters deemed relevant in 2012 with strategic
stakeholders and identified as priority have been re-evaluated, such as:
Health and Safety; Transparency and Anti-corruption Practices; CO2
Emissions and Water Consumption; and Local Development. These
matters are relevant for all targets inside and outside the Company, and
they are under discussion in national and international agendas – such as
CO2 emission, highlighted in the year due to the World Weather Conference
in Paris. GRI G4-19 | G4-20
Relevant matters are exposed herein in grouped chapters according to
the Values of Santos Brasil, which were greatly focused on in 2015, when
they were the subject matter of workshop between leaders. The work
was applied by the leaders to their teams and, based on the results, the
description of each Value was prepared (reproduced at the opening of
groups), so that it is evenly understood and relevant to the targets of
the Company, especially the internal target. All communication channels
held with the employees have strengthen, in the year, the concepts of the
Values – which were on the cover page of magazine Viva Voz and were
also referred to in the training sessions on Confidential Portal. GRI G4-31
INTRODUCTION / 2015 SUSTAINABILITY REPORT 5

We conduct our business with ethics and transparency before all interested parties and, for that, we count on different tools that help our employees to do their work as expected by the Company.

PROFILE GRI-G43 | G4-4
ETHICS AND TRANSPARENCY / 2015 SUSTAINABILITY REPORT 7

ETHICS AND TRANSPARENCY / 2015 SUSTAINABILITY REPORT 8
Mission, Vision and Values GRI G4-56
MISSION
Promote competitiveness of our customers through effective, quick and
safe services, respecting people and the environment, ensuring the
generation of value to shareholders and contributing to the social-
economic development of Brazil.
VISION
We aim to be the best port infrastructure and integrated logistics
company in the markets in which we operate.
VALUES
INNOVATION
ENVIRONMENTAL AND SOCIAL
RESPONSIBILITY
AGILITY AND PRECISION
SAFETYETHICS AND TRANSPARENCY
COMMITMENT TO RESULTS
VALUING INDIVIDUALSAND RESPECTING
DIVERSITY

Business units GRI G4-9
TECON SANTOS
• Total area of 595 thousand m2.
• Annual capacity of 2 million TEU
(unit equivalent to a 20-feet container).
• Four internal railway branches.
• The largest STS cranes of the Americas.
VEHICLE TERMINAL (TEV)
• Total area of 164 thousand m2.
• Capacity of light vehicle load/unload operation = 12 simultaneous
car carrier trailers; cars/year = 300 thousand; statics = 10 thousand.
• Eight ramps to operate vehicles.
• Mooring quay of 310 meters.
TECON IMBITUBA
• Total area of 207 thousand m2.
• Annual capacity of 450 thousand TEU.
• Two PT/2 cranes.
• Mooring quay of 660 meters.
IMBITUBA GENERAL CARGO TERMINAL (TCG)
• Total area of 54 thousand m2.
• 8 thousand m2 of covered storages.
• Mooring quay of 660 meters.
PORTO INDÚSTRIA IMBITUBA
• Total area of 2,5 million m2.
• 8 km away from the Port of Imbituba.
• Designed to gather the truck regulator yard, refrigerated warehouses,
Distribution Center, modular areas for small, medium and large
industries, bonded terminal and Vehicle Terminal.
TECON VILA DO CONDE
• Total area of 103 thousand m2.
• Annual capacity: 120 thousand TEU.
• 7.5 thousand m2 covered storages, two MHC cranes and
two container forklifts.
• Mooring quay of 254 meters.
SANTOS BRASIL LOGÍSTICA
• Two Distribution Centers (São Bernardo do Campo and São Paulo,
in the State of São Paulo).
• Two Customs Logistics and Industrial Centers - Clias (Santos
and Guarujá, in the State of São Paulo).
ETHICS AND TRANSPARENCY / 2015 SUSTAINABILITY REPORT 9

ETHICS AND TRANSPARENCY / 2015 SUSTAINABILITY REPORT 10
COMPETITIVE ADVANTAGES
• Leader in container port operation Brazilian market.
• Focus on innovation and operational efficiency.
• The main terminal (Tecon Santos) is the largest and most productive
terminal of Brazil and it is strategically located in the largest Port
of Latin America.
• Operation of the largest Vehicle Terminal of Brazil.
• Provides intelligent solutions to the entire logistics chain:
from port to door.
• Customer Portal and pioneering app of the segment, with
access to the operation and internet controls.
• Environmental management recognized by ISO 14001.
• Labor health and safety practices certified by OHSAS 18001.

ETHICS AND TRANSPARENCY / 2015 SUSTAINABILITY REPORT 11
STATEMENTS OF THE ADDED VALUE FOR THE YEARS ENDED ON DECEMBER 31, 2015 AND 2014 GRI G4-EC1
PARENT COMPANY
31.12.2015 31.12.2014 31.12.2015 31.12.2014
CONSOLIDATEDAMOUNTS EXPRESSED IN THOUSANDS OF REAIS - R$
REVENUES
Sale of goods, products and services
Outras receitas
Provision (reversal) for doubtful accounts and Allowance for loan losses
INPUTS ACQUIRED FROM THIRD PARTIES
Cost of products, goods and services sold
Third party services, materials, energy and others
Losses by depreciation of assets
Others
GROSS ADDED VALUE
DEPRECIATIONS, AMORTIZATIONS AND DEPLETION
NET ADDED VALUE PRODUCED BY THE COMPANY
ADDED VALUE RECEIVED IN TRANSFER
Equity adjustment
Financial revenues
27,108
753,293
(56,167)
724,234
13,202
748,497
1,342
763,041
29,552
1.089,497
(56,945)
1.062,104
14,190
1.126,901
1,901
1.142,992
(116,083)
43,199
52,935
(136,501)
440,269
(100,493)
339,776
9,736
(30,639)
(283,965)
(742)
(113,710)
30,082
68,381
(130,039)
514,131
(111,271)
402,860
38,299
-
(248,910)
(5,161)
(194,390)
52,664
52,664
(184,805)
649,713
(131,587)
518,126
-
(30,639)
(412,391)
(2,557)
(179,252)
34,792
34,792
(193,287)
764,177
(140,241)
623,936
-
-
(378,815)
(6,276)

ETHICS AND TRANSPARENCY / 2015 SUSTAINABILITY REPORT 12
PARENT COMPANY
31.12.2015 31.12.2014 31.12.2015 31.12.2014
CONSOLIDATEDAMOUNTS EXPRESSED IN THOUSANDS OF REAIS - R$
31.12.2015 31.12.2014 31.12.2015 31.12.2014
658,728
658,728
TOTAL ADDED VALUE TO BE DISTRIBUTED
DISTRIBUTION OF THE ADDED VALUE
Personnel
- Direct compensation
- Benefits
- FGTS
Taxes, rates and contributions
- Federal
- State
- Municipal
Third party capital compensation
- Interest
- Leases
Own capital compensation
- Juros sobre o capital próprio
- Dividends
- Additional proposed dividends
- Withheld profits (losses)
392,711
392,711
471,241
471,241
570,790
570,790
172,202
The explanatory notes are part of the accounting statements.
9,511
36,476
218,189
146,945
14,360
34,347
195,652
235,376
14,638
61,170
311,184
208,476
18,949
53,745
281,170
51,836
23,200
68
75,104
63,334
22,984
97
86,415
100,126
33,506
6,026
139,658
128,572
33,982
6,256
168,810
38,313
79,234
117,547
36,678
60,937
97,615
56,171
81,906
138,077
56,911
60,278
117,189
-
-
45,847
15,000
-
-
45,847
15,000
(18,129)
-
(18,129)
21,974 8,738
91,559
(18,129)
-
(18,129)
21,974
8,738
91,559

CORPORATE GOVERNANCE
More than Values, Ethics and Transparency refer to key sustainability
matters which management, professionals’ conduct, the operations and
the relationships with targets of Santos Brasil are based on. This concept
was strengthened in 2015 with the creation of the Compliance Policy, which
purpose is to consolidate guidelines so that Company’s operation is always
in compliance with ethical precepts and national and international laws. In
this regard, we highlight the rules against corruption and harmful acts to the
Government, which align the actions plans to internal strategic goals – rules,
by their turn, by corporate governance principles and good practices.
Another committee was created with the preparation of such new policy:
the Compliance Committee, which is responsible for the analysis of requests
for donations and sponsorships, evaluation of internal controls and business
risks, among other things, and the Confidential Portal, a channel to
report charges, complaints and suggestions managed by an independent
company and available to all of the Company’s professionals and the other
stakeholders to submit demands. In order to communicate the new tool to
the employees, training sessions were promoted which amounted to 3,766
hours and reached 2.3 thousand people (65% of total), except for Santos
Brasil Logística’s employees who, due to a schedule issue, will receive such
training in the beginning of 2016. GRI G4-50 | G4-58 | G4-HR2 | G4-SO4 | G4-
SO3 | G4-HR7
In order to ensure that conflicts of interests are managed and prevented,
the Articles of Incorporation of the Company do not allow the election of
directors who are controlling shareholders or hold offices at companies deemed
to compete against or having a conflict of interest with the Company, except for
the cases expressly approved by the Shareholders’ Meeting. In addition, it also
does not allow that directors having a conflict of interest to vote at the meetings.
GRI G4-41
Still in order to support its commitment with ethics, Santos Brasil has a Code
of Conduct, which instructs daily operations, and the relationship between
employees based on principles that, more than known and put into practice,
must be continuously multiplied. All employees adhere to the document as
soon as they are hired. Another mechanism in this regard is the Personnel
Regulation, which sets forth all rules, duties and rights of employees and
comprises the Individual Work Contract. Viva Voz channels refer to the official
mean of communication of the Company with the internal target, through
which the main changes and new impacting the work and the operations
are communicated. GRI G4-HR2
ÉTICA E TRANSPARÊNCIA / RELATÓRIO DE SUSTENTABILIDADE 2015 13

Corporate structure*
Governance structure GRI G4-34
BOARD OF DIRECTORS GRI G4-38 | G4-LA12 | G4-35 | G4-39 | G4-40 | G4-
47 | G4-48 | G4-49 | G4-51 | G4-52
• Nine effective members (three of whom are independent members)
and six alternates.
• Elected at Annual Shareholders’ Meeting for terms of offices of two years
(current term of office is due until August 2016), reelection being permitted.
• The directors must have recognized professional experience and technical and
academic knowledge, and they must not be executives of the Company.
ETHICS AND TRANSPARENCY / 2015 SUSTAINABILITY REPORT 14
*All companies are directly and fully controlled; except for Convicon Contêineres de Vila
do Conde S.A., which is indirectly controlled.
• They receive a fixed compensation, which is not related to social-
environmental performance.
• Duties: Establish the general guidelines of the business and resolve on
any strategic matters; analyze management reports including
operational performance, environmental, social and financial
information; approve the annual budget and the investment plan;
instruct and inspect the Board of Executive Officers, and oversee
business conduct.
• Employees are not inquired about work relation with
formal representation unions.
• The directors gather, ordinarily, every two months and, extraordinarily,
whenever necessary.
BOARD OF EXECUTIVE OFFICERS GRI G4-48 | G4-51
• Comprised by one CEO and three officers (Chief Economic-Financial
and Investors Relations Officer, Chief Operation Officer and Chief
Commercial Officer).
• Elected by the Board of Directors for terms of office of two years
(current term of office due until August 2016), reelection being permitted.
• A portion of their compensation is fixed and another portion is
variable (Stock Option Plan, established by the Board of Directors).
Bonus goals relate to the financial, operational and safety performance.
• Duties: Manage the business according to the strategies established by
the Board of Directors.
Santos Brasil Logística
S.A.
SANTOS BRASIL PARTICIPAÇÕES S.A.
Terminal de Veículos de
Santos S.A.
Terminal Portuário deVeículos S.A.
Numeral 80Participações
S.A.
ParáEmpreendimentosFinanceiros S.A.
ConviconContêineres de
Vila do Conde S.A.

FISCAL COUNCIL
• Four effective members and four alternates, provided that one effective
member and one alternate are elected by preferred shareholders.
• Operating on a permanent basis.
• Independent operation.
• Duties: Inspect managers’ acts and compliance with legal and statutory
rules, ensure quality and integrity of financial reports and information,
and provide a report on the accounting statements.
Members from the three bodies are indicated in chapter “Corporate Information” hereof.
COMPLIANCE COMMITTEE
• Comprised by at least two and at most five members indicated by the
executive officers of the Company.
• Term of office of two years, reelection being permitted.
• Independent body.
• Duties: Encourage commitment by all employees and senior
management to the Compliance Policy; recommend the approval of
donations and sponsorships; periodically evaluate the internal controls
and business risks; investigate charges received through the reporting
channel and submit evidence to the management of the Company
so that it takes the applicable measures; settle any doubt arising out
in relation to the Compliance Policy, as well as evaluate and settle cases
of conflict between this policy and other policies; and analyze cases
of omissions.
ETHICS AND TRANSPARENCY / 2015 SUSTAINABILITY REPORT 15
SUSTAINABILITY COMMITTEE
• Presided by the CEO of Santos Brasil.
• Comprised by a multitask team.
• Meets every six months.
• Duties: Validate the strategies, the Sustainability Report, monitor
established indicators and support the application of the Sustainability
Policy in all Business Units.
Commitments GRI G4-15 | G4-16
Since 2013, Santos Brasil is a signatory to The Global Compact of the United
Nations (UN), which includes ten principles to fight corruption. Santos
Brasil has also adhered to program called Na Mão Certa, from Childhood
Brasil, which aims to raise awareness to truck drivers to the issue of child
sexual exploitations in Brazilian roads. In addition, Santos Brasil relates
to the Government through entities that represent its segments, such
as the Brazilian Association of Terminals and Customs Facilities (Abtra),
the Brazilian Association of Public Use Container Terminals (Abratec),
the Brazilian Association of Port Terminals (ABTP), The Commercial and
Corporate Association of Guarujá (Aceg), The National Federation of
Port Operators (Fenop), the Federation of Industries of the State of São
Paulo (Fiesp), the Industrial Social Service (Sesi), the Municipal Fund of
the Rights of Child and Adolescents from Guarujá (Fumcad), the Brazilian
Association of Security Professionals (ABSEG) and the American Society
for Industrial Security (Asis).

Accordingly, Santos Brasil contributes to forums and discussions to
create and strengthen governmental policies and to disclose technical
information that may Support federal, state and municipal decisions.
Relationship with shareholders and investors
The Investors Relations area is responsible for ensuring the transparent
disclosure of Company’s information and to meet shareholders and
bank and brokerage company analysts who recommend investment
in the shares of the Company.
Strictly in compliance with laws that refer to disclosure of information,
Santos Brasil makes several interaction channels available, such as
Investors ombudsman, phone numbers, e-mails and meetings at its
headquarters, conference calls, visits to business units, in addition to
presentations in public events promoted by financial institutions.
GRI G4-57
RECOGNITION 2015
Awards
GUIA EXAME DE SUSTENTABILIDADE – The greatest corporate
sustainability award of Brazil that gathers inspiring examples highlighted
Santos Brasil in its 2015 edition.
ETHICS AND TRANSPARENCY / 2015 SUSTAINABILITY REPORT 16
AS 250 MELHORES EMPRESAS DO PAÍS – At Época Negócios magazine
ranking, Santos Brasil was indicated as the company with the best Future
Perspective in the infrastructure segment. Santos Brasil also stood out
for Social-environmental Responsibility (ranking 3rd) and Capacity of
Innovation (ranking 3rd). It ranked 84th in the general survey, advancing
37 positions in relation to the previous year.
PRÊMIO CORPORATIVO TRANSFORMAÇÃO NA CADEIA DE SUPRIMENTOS
– Award received during the III Brazilian Supplier Conference promoted
by Cummins América do Sul for cost and time reduction enabled by the
services provided by Santos Brasil.
EXCELÊNCIA EM TRANSPORTE – Recognition by customer Cosan
Lubrificantes, during the award in Rio de Janeiro. Transportation
Excellence category, in which the company scored 9.35, is a new category
and evaluates, among other things, punctuality, safety and meetings
customers’ calls.

Certificates
ENVIRONMENTAL QUALITY AND MANAGEMENT CERTIFICATE
Santos Brasil adopts an Integrated Management system, which includes
the mains international rules.
• ISO 9001:2008 (quality management) - Tecon Santos, TEV, Tecon
Imbituba, Tecon Vila do Conde, Clia Santos, Clia Guarujá, CD São
Bernardo do Campo e CD São Paulo.
• ISO 14001:2004 (environmental management) - Tecon Santos, TEV,
Clia Santos, Clia Guarujá, CD São Bernardo do Campo and CD São
Paulo. For the first time, container terminals at Vila do Conde (PA) and
Imbituba (SC) were certified by ISO 14001:2004.
• PISAS 18001:2007-Tecon Santos, TEV.
• Health, Safety, Environmental and Quality Evaluation System
(SASSMAQ)
- Tecon Santos, TEV and Santos Brasil Logística units.
• International Ship and Port Facility Security Code (ISPS Code) - Tecon
Santos, Tecon Vila do Conde and Tecon Imbituba.
2014/2015 CARRIER CERTIFICATION PROGRAM – By reaching program
goals and transportation excellence, the Logistics department received a
new award from Cosan, in addition to the Flawless Operation certificate.
ETHICS AND TRANSPARENCY / 2015 SUSTAINABILITY REPORT 17
SETTAPORT FOUNDATION SOCIAL RESPONSIBILITY SEAL – Obtained due
to Company’s incentives to the sports Project of the union that represents
category employees.

Obtained due to Company’s incentives to the sports Project of the union that represents category employees.

STRATEGY GRI G4-EC7
Aligned to its growth strategy – based on innovation, operational efficiency
and cost reduction, Santos Brasil 2015 milestone was the approval, by
the Special Port Office (Secretaria Especial de Portos, or “SEP”), of the
anticipated extension of the leasing agreement of Tecon Santos and the
investment plan of R$ 1.3 billion for expansion and upgrade. SEP’s stamp
indicates that the Company is on the right path, generating value to its
customers and contributing to the development of Brazilian foreign trade.
Resources from the new investment cycle will enable Santos Brasil to
adjust to terminal to the size of vessels that are now using the Port of
Santos after the widening of the channel of access. With the works,
which will begin in 2016 and which are scheduled to be concluded in
four years, the operation capacity will increase from current 2 million
TEU to 2.4 million TEU. In addition, the mooring quay will be expanded
to 1.200 meters through the extension of TEV’s quay, which will enable
simultaneous mooring of three new Post Panamax vessels, with load
capacity from 7,000 to 12,500 TEU. Dredging will also be performed
in order to deepen the berth of the terminal to 15 meters with the
consequent strengthening of the structure of the quay. All four-railway
branches, currently 400 meters long, will be 800 meters long, enabling
the entry of an entire railway composition in the terminal – which is not
possible today.
In line with its growth strategy, the Company is also waiting for the
release, by SEP, to extend the leasing agreement of terminal Vila do
Conde. We expect to obtain such release in the first quarter of 2016
so that the executive project is started. The term to conclude the work,
which will involve the investment of R$ 60 million, is of 2018.
INNOVATION / 2015 SUSTAINABILITY REPORT 19

Management methods and tools
Santos constantly seeks to improve its management, whether through
new tools, whether through the constant wish to improve its relationship
with its targets. In 2015, the Company implanted a new post-sale
system and satisfaction researches led by the Competitive Intelligence
department. The purpose of both initiatives was to bring customer’s voice
to the Company so that it could improve its services and products based
on feedbacks provided by the customers.
In this regard, the first suppliers’ meeting was held that year in which, in
addition to the sustainability strategy, discussed the Qualification Manual
and developed the materiality research (further information is provided
at items “Customers” and “Suppliers,” respectively). In addition, the
Company started to implement a new management software developed
by Falconi advisory in order to improve follow up on goals and ongoing
action plans.
Under management towards sustainability, the following key-indicators
have guided the adoption of actions related to the indicated matters:
Health and Safety, Transparency and Anti-corruption Practices, C02
Emissions and Water Consumption and Local Development.
RELATIONSHIP AND ENGAGEMENT WITH STAKEHOLDERS GRI G4-24 | G4-25 | G4-26 | G4-27
Santos Brasil performs frequent researches in its website to enable
stakeholders to provide their opinion on Management Towards
Sustainability and, especially, on the Sustainability Report, which is
available at the website as well. In 2015, 54 persons spontaneously
participated in this research, 27% of whom were 27% employees, 25%
of whom were students, 8% of whom were suppliers, 8% of whom
were customers and 32% of whom were classified as “others” (including
NGOs, partners, former employees, carriers, dockworkers etc.). Below
please find the mains demands of this and other targets, also ascertained
through other channels, although conversation with suppliers was the
priority in 2015.
INNOVATION / 2015 SUSTAINABILITY REPORT 20

INNOVATION / 2015 SUSTAINABILITY REPORT 21
• Early extension of Tecon Santos concession agreement• Competition in the Port of Santos• Costs and expenses reduced throughout the year• Migration to Novo Mercado segment for corporate govern-ance
e-mail, site, IR Ombudsman, result verification, Apimec meetings and service to analysts
CorporateShareholders
Customers
Government
Employees
Customers
Corporate governance
Internal public
Commercial advisors, Customer Service Department, satisfaction research, post-sale and Company’s website
Monthly magazine, weekly panel, e-mails, internal TV, per-sonal communication and social networks
Specific connection points at organizational structure
• Operating results• Innovations in services being offered• Transparency in performance
• Operating, environmental and safety performance• Delivery of new port access between Highway Cônego Domenico Rangoni and Av. Santos Dumont (process which has taken one year and a half to be concluded)
• Results• Health and safety• Social investment• Volunteering work
MAIN DEMANDSSTAKEHOLDERS CHANNELS CHAPTER/SECTION

INNOVATION / 2015 SUSTAINABILITY REPORT 22
Regular meetings
• Environment• Approach and relationship• Qualification and training to suppliers• Education/qualification courses to young people from communities
Panel, materiality research and monthly meetings
Suppliers Suppliers, third parties and
aggregates
Press
Professional entities
Companies of the industry
Neighboring communities
Environment
Corporate governance
Corporate governance
Corporate governance
Environment
Communities
Communication and press advisory area
• Renewal of the concession anticipation agreement• Downgrading of classification provided by S&P• Formare Aprendiz Program• New phase of Logistics Investment Program (PIL)
Salaries and benefits
• Management towards sustainability• Safety• CO2 Emissions• Communities
• Social investment• Port expansion• Environment
Sustainability Team, social networks (Facebook and Twitter) and community conversations
QSSMA Area
• Reduced carbon emissions• Energy efficiency• Water reuse and reduced water consumption
Forums and segment entities
MAIN DEMANDSSTAKEHOLDERS CHANNELS CHAPTER/SECTION

RISK MANAGEMENT
In its operations, the Company adopts the caution principle, avoiding
materials and methods, which offer a risk to the environment and health
in the event alternatives are available. GRI G4-2
Risk management is continuously performed by a multitask group which is
also responsible for the identification, analysis, evaluation and treatment
of internal controls, proposing measures to reduce or eliminate market
risks (including credit and liquidity risks), regulatory risks, operational risks
and environmental risks inherent to the segment in which it operates.
CREDIT RISK – Financial nature risk related to the risk of the Company
not receiving from customers amounts or credits due by virtue of the
sale of services, which causes losses and consequently increases bad debt
provision. However, during over 18 years of operation (from November
1997 to December 2015), actual losses accrued with unchargeable
titles amounted to R$ 65,177 thousand, which represented only 5.88%
of gross revenues in 2015, and which indicates that credit loss risk is
extremely low.
LIQUIDITY RISK – Represents the possibility of mismatching between
maturity of assets and liabilities, which may result in Company not being
capable of performing its obligations within the established terms. In this
regard, although Current Liquidity index is the lower index over the last
years, mismatching is not attributed to operational activities considering
that, in 2013 and 2014, 41% and 52% of Current Liabilities, respectively,
were comprised of loans and financing especially obtained to purchase
property, plant and equipment. On December 31, 2015, loan, financing
and debentures represented 55% of Current Liabilities.
MARKET RISK – This risk is related to the negative impact on assets and liabilities
amount, caused by oscillations in items such as interest rate or Exchange rate.
Santos Brasil consolidated position at the end of 2015 for loans, financing and
debentures amounted to R$ 339,548 thousand, 18% of which is indexed in a
foreign currency, subject to foreign exchange variation, and 82% of which in
national currency with costs related to the variation of TJLP/URTJLP and CDI.
INNOVATION / 2015 SUSTAINABILITY REPORT 23

REGULATORY RISKS – Expressed by sudden or unexpected changes in
the concession agreement, are minimized through strict compliance with
labor and environmental documents and laws; operational efficiency;
healthy and transparent relationship with governmental instances; and
active participation in entities representing the segment in which Santos
Brasil operates, which entities operate in order to assure the stability of
port segment concession rules.
OPERATING RISKS – Can be mitigated by continuous investments in
technology innovation, such as the adoption of an IT system which is
compatible with customers’ and suppliers’ software; redundant backup
maintenance for network and database; installation of monitoring
cameras in the Distribution centers and on-line tracker at own and third
party fleets. Other operating risks are mitigated through knowledge
management – which prevents the dismissal of operations by virtue of
dismissal of employees – and the adoption of action plans for maintenance
of equipment.
ENVIRONMENTAL RISKS – Both impacts of its operations to the
environment and the effects of weather changes on its activities
are minimized by Santos Brasil through management focused on
sustainability. The Company publishes a Greenhouse Emission (GEE)
report and commits to reduce such emissions; maintains controls over
the operations with chemical products based on rules ISO 14000,
OEISAS 18001 and SASSMAQ; sets forth proper procedures to meet
emergencies related to the risk of oil leakage from its equipment or
substances from the vessels; has sanitation and chemical effluent
treatment stations at Tecon Santos and systems connected to the public
sanitation network or septic tanks at other units; and maintains a
system to collect, segregate, classify and take solid wastes to proper
destination. GRI G4-EC2
INNOVATION / 2015 SUSTAINABILITY REPORT 24

Provide services with speed and accuracy is one of our different elements and a benefit to our customers. So much that, our terminal, for example, is the most productive terminal of Brazil.

In 2015, year in which we had weak signs for a recovery of the flow
of international trade and conservative market initiatives, Santos Brasil
focused its efforts to increase productivity, reduce costs and optimize
capital allocation. These factors, taken jointly, were crucial for the
Company to reach its goals to contribute to customers’ competitiveness
through a fast and safe operation.
Despite the contraction of the economy and Real devaluation, which
reduced demand for port solutions, the Company has improved the
attractiveness of transshipment and coastal shipping services and grew
in this segment. The other operations had a reduced volume, which
affected profitability. However, Santos Brasil believes that this cycle will
fade away and the Port of Santo will grow again based on a two-digit
expansion pace.
On the other hand, Tecon Vila do Conde, in the State of Pará, continued
to grow in a consistent manner: it has been growing by 30% each year,
which feeds the expectancy that it will be consolidated as the cargo
center of the region.
OPERATIONAL PERFORMANCE GRI G4-9
In 2015, the mix of services provided had different changes to long-way
cargo, transshipment and coastal shipping.
Despite the reduction of 10.6% recorded for the operation of import full
containers by Tecon Santos, the Company grew by 3.4%, 19.4% and 0.8%
for operations of full containers for, respectively, export, transshipment
and coastal shipping in the same terminal. The increase in the operation
of this type of cargo results from the combination of macroeconomic
factors, such as reduced internal consumption and devaluation of local
currency, with the commercial strategy adopted by Santos Brasil, which
sees the excessive capacity at Port of Santos as an opportunity to expand
the operation of transshipment and coastal shipping containers. These
services increased its share in the mix of containers operated by Tecon by
4.5% and 1.5% in 2015, respectively. During the year, the Port of Santos
went through a natural reestablishment in the container terminal market,
two terminals of which had a drastic decrease in their operations in the
second half of the year. Tecon Santos, that saw its market share decrease
to the smaller level over the last decade in October 2014 (28.3%),
recorded, in December 2015, a market share of 37.2% in the Port.
The volume of containers stored in port terminals decreased by 11.8%
in 2015 in comparison to 2014. This decrease results from the decreased
operation of full import containers by Tecon Santos by virtue of exchange
devaluation and the reduced internal consumption.
Tecon Imbituba has decrease in the number of containers operated in
2015 (19.9% less than 2014), and its operational performance was
26AGILITY AND PRECISION / 2015 SUSTAINABILITY REPORT

affected by the end of a long-course service which operated in the route
to the Gulf of Mexico and which used to regularly moor in the terminal.
On the other hand, general cargo operation increased by 128.9% in the
operation of the Company in the Southern region of Brazil.
Tecon Vila do Conde had, in 2015, an increased performance of 18.1%
in the number of containers operated in 2014 due to the development of
container transportation through barges, a typical mean of transportation
in the region, which explores and benefits from the capillarity of fluvial
network in the amazon basin.
The consolidation of the three operations of the Company in Port Terminal
segment recorded a decrease of 3.9% in the volume operated in 2015,
with a total of 919,922 containers operated in the period. The mix of
full-empty containers in 2015 had a recovery with 76.9% full containers,
against 73.5% in 2014.
During 2015, Santos Brasil Logística had a decrease of 33.5% in the
volume of stored containers in comparison to 2014. In addition to the
operational result provided by Clias, the Company recorded a decrease
in integrated logistics services in the Distribution Centers of São
Bernardo do Campo and Jaguaré, which includes receipt of cargo by
port terminals, going through Clias and the Distribution Centers, until
roadway transportation of containers and inventory management.
The Vehicle Terminal recorded 211,150 vehicles in the period, an
increase of 10.7% in relation to 190,729 vehicles in 2014. TEV’s
performance was directly impacted by the increase of 30.8% in the
number of exported vehicles.
The Company celebrated two big achievements in the year: in April, the
Company caused Tecon Santos to record a new productivity record per
operation of containers in exceeding its own indicator and reaching the
average of 225.26 operations per hour (MPH) and 44.14 MPH per crane,
during the operation of vessel MSC Bremen. The other achievement
was the record of container terminal at Vila do Conde (PA), which, in
November, reached the monthly average of 27.37 MPH, with a volume
of 3,806 operated containers, the largest indicators ever reached by
the operation. These good indicators result from a quick, accurate and
27AGILITY AND PRECISION / 2015 SUSTAINABILITY REPORT

safe work. The terminal has been quickly expanding its market share
through new services, such as coastal shipping with weekly schedule.
As to Imbituba, the highlight of the year was the record of 84.27 MPH,
reached with vessel Vicent Pinzon. With these indicators, the average
productivity in the terminal was above the goal established for the year:
10% at Tecon Santos, 25% at Tecon Vila do Conde and 29% at Tecon
Imbituba. In the commercial area, the year was also successful. The
Company has entered into new agreements, increasing its market share
at NVOCC, as well as has maintained its portfolio of strategic customers,
a large challenge by virtue of stronger competition. A new navigation
line which meets the Western and Southern regions of Africa was also
initiated in the year at Tecon Santos. By getting this line, with a weekly
schedule at Tecon Santos, Santos Brasil started to operate commercial
routes from and to all continents. As to the internal achievement in the
year, we refer to the new Cargo Re-destination System to cargo agents,
customs forwarders and importers, the main advantage of which is the
guarantee of the correct destination of imported cargo getting to the
Port of Santos and addressed to the terminals of Santos Brasil in Santos
and Guarujá. Information is automatically accessed, in a pioneering way
at the Port of Santos, which eliminates potential typos and mitigate risks
in the communication with the Customs of Santos.
Highlights of the year
28AGILITY AND PRECISION / 2015 SUSTAINABILITY REPORT
(UNITS) 2015 2014 VAR. %
(UNITS) 2015 2014 VAR. %
PORT TERMINALS
CONTAINERS – BERTH OPERATIONS 919.922 957.573 -3,9
Full containers 707.603 703.402 0,6
Empty containers 212.319 254.171 -16,5
BERTH OPERATIONS - GENERAL CARGO (T) 161.711 78.566 105,8
STORAGE OPERATIONS 110.965 125.778 -11,8
LOGISTICS
STORAGE OPERATIONS 52.911 79.611 -33,5
VEHICLE TERMINAL
VEHICLES MOVED 211.150 190.729 10,7
PORT TERMINALS
FULL CONTAINERS 707.603 703.402 0,6
Tecon Santos 666.082 657.290 1,3
Tecon Imbituba 15.176 23.699 -36,0
Tecon Vila do Conde 26.345 22.413 17,5
EMPTY CONTAINERS 212.319 254.171 -16,5
Tecon Santos 183.379 230.431 -20,4
Tecon Imbituba 10.259 8.036 27,7
Tecon Vila do Conde 18.681 15.704 19,0
GENERAL CARGO (t) 161.711 78.566 105,8
Tecon Santos - - -
Tecon Imbituba 149.045 65.108 128,9
Tecon Vila do Conde 12.666 13.458 -5,9

Prospects and opportunities
Adapted to a higher competitiveness at the Port of Santos, Santos Brasil
begins 2016 with the mission of getting ready for the new cycle of in-
vestments. The purpose is to expand by 20.0% the current capacity of
Tecon Santos to meet the future demand. For Tecon Vila do Conde, in its
turn, the perspectives of growing are directed to coastal shipping – using
the waterway capillarity of the region and expanding the transportation
in barges - and intermodality with the same goods being transported
through the waterway, road and railroad modes.
In 2015, it was approved the new depth of the evolution basin of Port
of Imbituba, which now comprises the berthing of ships with a draft
of up to 14.5 meters and 336 meters long. The regular operation, safe
and efficient Tecon Imbituba, whose peculiarity is the high handling of
project cargos, and the differential of providing integrated port and lo-
gistics solutions, according to the peculiarity of each customer, will help
increase the business in Santa Catarina. In 2016, the efforts to increase
the number of lines of navigation that scale the terminal, as well as the
portfolio of customers, importers/exporters will be maintained.
29AGILITY AND PRECISION / 2015 SUSTAINABILITY REPORT

It is only possible to promote competitiveness of our customers, generate value for our shareholders and contribute to the social and economic development of the Country having commitment to the result.

ECONOMIC AND FINANCIAL PERFORMANCE
According to information by the Ministry of Development, Industry and
Foreign Trade in 2015, the Brazilian trade chain (sum of importations
and exportations) enhanced the fall of the previous year. The variation
was less than 20.2%, which led to ending the year with a balance of
US$ 362.6 billion. Both the importations and exportations adversely
affected the trade chain, with respective reductions of 25.1 % and
15.1%. The changes in the trade balance directly affected Santos Brasil,
given that the maritime navigation is the main logistics modal used in the
importation and exportation of products. The most marked reduction of
the importation reflects the exchange rate of the domestic currency that,
in 2015, devalued 45.0% compared to the US Dollar.
With the annual growth rate composed by two digits in the past 17
years, the Port of Santos felt the impact of the economy downturn
and presented an increase below the historic average in the evolution
of the handling of containers in all of its terminals. In 2015, the
Port presented 3.5% of growth in the handling of containers,
below the increase of 8.9% recorded in 2014. The increase of the
volume of containers handled was reached thanks to the increase of
the operations of reshipping containers that presented a growth of
33.7% in the long distance journeys. By removing the reshipping of
containers from the tax base, the long-journey containers presented a
reduction of 7.9% compared to the previous year. However, according
to reports of Companhia Docas do Estado de São Paulo (Codesp),
Tecon Santos ended the year with the index of 34.7% of market share,
maintaining its leadership position in the Port of Santos.
The handling of vehicles in Santos presented a growth of 9.6%. The
currency devaluation and the Brazilian economic situation in 2015 caused
different movements in the handling of vehicles. The total exported
vehicles increased 29.3% in the year. The vehicle importation, in its turn,
presented a fall of 24.5%.
31COMMITMENT TO RESULTS / 2015 SUSTAINABILITY REPORT

Financial performance
Gross Revenue of the services
The growth observed in the gross revenue recorded by the segment of
Port Terminals reflects the partial reversal of a provision made by the
Company referring to the process over the service of segregation and
invoicing of TRAs (Bond Warehousing and Custom Clearance Terminals),
as stated in the accompanying note N ° 17 of the Financial statements
of the Company. The provision reversal incurred in the generation of
extraordinary revenue in the amount of R$ 81.5 million as partial reversal
of the provision and, by excluding such effect, the gross revenue of berth
operations in 2015 presented a reduction of 10.2% compared to the
previous year. The revenue with storage operations in the segment of
Port Terminals fell by 6.3% in the period.
Throughout the year of 2015, the deterioration of the macroeconomic
scenario worsened with the growth of the inflation, devaluation of the
BLR and local consumption fall in Brazil. The structural changes performed
in the Port of Santos affected not only the volume, but also the mix of the
services provided, with consequent increase of the provision of services of
transshipment and coastal shipping, in addition to the importation fall.
In the segment of Logística, the gross revenue of the Company presented
a reduction of 14.6%, below the variation recorded on the number of
warehoused containers. The difference observed results from business
efforts of Santos Brasil in seeking for provision of warehousing services
of fractioned loads.
The Vehicle Terminal-TEV presented a fall of 13.3% in the sales revenue
of 2015. Such change in the revenue was in the opposite direction of
that observed in the number of vehicles handled and is explained by
the less time of storage, consequence of a greater representativeness of
exportation vehicles in the total handled by Santos Brasil in 2015.
Net Revenue of the services
The net consolidated revenue totaled R$ 964.3 million, with a reduction
of 3.9% in relation to that observed in 2014.
(R$ MILLIONS) 2015 2014 VAR. %
32COMMITMENT TO RESULTS / 2015 SUSTAINABILITY REPORT
PORT TERMINALS 824,3 811,3 1,6
Berth operations - containers 504,1 469,7 7,3
Storage operations 320,2 341,6 -6,3
LOGISTICS 243,9 285,5 -14,6
VEHICLE TERMINAL 58,5 67,5 -13,3
Exclusions -17,4 -12,0 45,0
CONSOLIDATED 1.109,3 1.152,3 -3,7

Cost of services provided
In 2015, the Company kept the focus on gain of efficiency and the actions
taken provided the maintenance of the costs consolidated in rated values.
The inflation of the period, measured by the Broad Consumer Price Index
(IPCA), reached 10.7%.
PORT TERMINALS
Although the operational performance presented in 2015, the increase
of the costs with electric power, fuel and freights, as well as the collective
bargaining agreement executed, caused the segment of Port Terminals to
present an increase of 1.3% in costs of the year. The average cost (excluding
depreciation and amortization) by handled/warehoused container in the
port terminals of containers was R$ 409.84 with an increase of 6.3% in
(R$ MILLIONS) 2015 2014 VAR. %
33COMMITMENT TO RESULTS / 2015 SUSTAINABILITY REPORT
PORT TERMINALS
Costs with handling 113,6 113,0 0,5
Costs with personn 183,8 161,3 13,9
Lease and infrastructure 65,5 61,3 6,9
Depreciation and amortization 93,7 100,2 -6,5
Other costs 68,1 82,1 -17,1
TOTAL 524,7 517,9 1,3
LOGISTICS
Costs with moving 39,7 47,7 -16,8
Costs with personnel 60,9 63,6 -4,2
Depreciation and amortization 14,5 14,2 2,1
Other costs 44,7 47,5 -5,9
TOTAL 159,8 173,0 -7,6
VEHICLE TERMINAL
Costs with moving 15,8 14,6 8,2
Lease and infrastructure 5,3 5,2 1,9
Depreciation and amortization 9,0 9,0 0,0%
Other costs 5,4 4,8 12,5
TOTAL 35,5 33,6 5,7
Exclusions -15,6 -10,8 44,4
Consolidated 704,4 713,7 -1,3

relation to the average cost of R$ 385.56 recorded in 2014. The increase
of the unit average cost results from the decrease in the volume operated
and warehoused, resulting in a reduction of the scale economy.
Costs with handling (freelance workers, channel-TUPe rate other
variable costs): the increase of 0.5% is a result, in addition to more
participation of full containers in the total handled, of the increase in the
cost referring to freights for the removal of the importation containers
discharged in other terminals, in addition to costs with electric power
and fuel and adjustments for inflation to rates paid by Santos Brasil to
Companhia Docas.
Costs with personnel: presented an increase of 13.9%, caused: (i) by the
collective bargaining agreement executed in 2015; (ii) by the readaptation
of the Company’s staff to the current operating environment; and (iii) by
the provision for the participation of the employees in the results of the year.
Lease and infrastructure: the increase of 6.9% includes the adjustments
for inflation to the rates paid by the Company at the Port of Santos.
Furthermore, the extension of the concession agreement of Tecon Santos
for another 25 years, executed in September 2015, resulted in a new rate
charged over the minimum contractual handling established.
Depreciation and amortization: the extension of the concession
agreement of Tecon Santos changed the estimates of depreciation
enabling the depreciation of the assets to be carried out by the estimated
useful life without the limit of the end of the concession in 2022, in
addition to the amortization of the concession to be extended until 2047.
Such accounting changes resulted in reduction of 6.5% in the heading of
the segment in 2015.
Other costs: Presented retraction of 17.1% and summed up R$ 68.1
million. Among the main reductions, we highlight the lowest costs with
malfunctions, maintenance of the terminal and court proceedings.
LOGISTICS
Costs with moving (fuels, freights and other variable costs): The
reduction of 16.8% is due to the reduction of scale of the operation that,
in 2015, presented a reduction of 33.5% in the number of warehoused
containers. The variation less than that observed in the operating activity
is related to the increases observed with costs with fuels, freights, tolls
and energy.
Costs with personnel: In 2015, the costs with personnel presented a
reduction of 4.2% because of readaptation of the segment to the level of
observed services.
Other costs: Presented a reduction of 5.9% in 2015 due to: (i) the
reduction with rent expenses; and (ii) less expenses with damage repair.
34COMMITMENT TO RESULTS / 2015 SUSTAINABILITY REPORT

VEHICLE TERMINAL
The costs with moving present 8.2% of growth in 2015, a change similar
to that observed in the total vehicles handled, re¬sulting in 5.7% of
growth in the total costs of the segment.
Other costs: Presented a reduction of 5.9% in 2015 due to: (i) the reduction
with rent expenses; and (ii) less expenses with damage repair.
Operational expenses
(R$ MILLIONS) 2015 2014 VAR. %
PORT TERMINALS
Sales 83,8 24,3 244,9
General, administrative and others 50,0 28,4 76,1
Depreciation and amortization 0,4 0,5 -20,0
TOTAL 134,2 53,2 152,3
LOGISTICS
Sales 30,3 14,9 102,7
General, administrative and others 9,9 10,7 -7,5
Depreciation and amortization 0,1 0,2 -50,0
TOTAL 40,2 25,8 55,8
VEHICLE TERMINAL
Sales 1,4 0,4 250,0
General, administrative and others -0,1 0,6 -116,7%
Depreciation and amortization 0,0 0,0 -
TOTAL 1,3 1,0 30,0
CORPORATE
General and administrative 55,3 41,0 34,9
Depreciation and amortization 13,9 16,2 -14,2
TOTAL 69,2 57,2 21,0
Consolidated 244,9 137,2 78,5
35COMMITMENT TO RESULTS / 2015 SUSTAINABILITY REPORT

PORT TERMINALS
Sales: Presented an increase of 244.9% in 2015, with total of R$ 83.8
million. Such amount contemplates: (i) expenses of R$ 51.4 million
with provision of outstanding billings resulting from partial reversal of
the provision occurred in the first quarter of the; and (ii) R$ 7.0 million
referring to the change in the criterion of provision for bad debt; The
expense incurred with adjusted sales for such effects is R$ 25.4 million,
an amount 4.5% higher than that in 2014.
General, administrative and other: The partial reversal of the
provision referring to the processes of segregation and immediate
delivery of containers generated R$ 8.8 million of revenues with
adjustments for inflation to the reversed amounts. In the last quarter
of 2015 it was performed the recoverability test of Tecon Imbituba
and it was recognized a loss of R$ 30.6 million. Excluding the effects
of the adjustment to the reversal and the loss of reassessment, the
general, administrative expenses sum up R$ 28.2 million, with a fall
of 0.7% compared to the expenses of 2014.
LOGISTICS
Sales: The increase of 102.7% in the segment expenses in 2015 was
driven by the start of the provision of services of bonded warehouse of
fractioned loads at the Company’s Clias.
CORPORATE
The increase of 34.9% observed in the corporate expenses contemplates
R$ 3.6 million in costs incurred in the process of contractual extension
of Tecon Santos and increase of R$ 7.6 million in non-recurrent expenses
with legal advisory. The general and administrative expenses of the
corporate segment adjusted by exceptional factors sum up R$ 44.0
million, an increase of 7.3% in relation to 2014.
The Company’s expenses presented an increase by 78.5%, with total of R$
244.9 million in 2015. By adjusting the expenses by the main mentioned
events, the result of 2015 presents R$ 153.5 million in expenses, an
amount 11.9% higher than that of 2014.
36COMMITMENT TO RESULTS / 2015 SUSTAINABILITY REPORT

EBITDA and EBITDA margin
The consolidated EBITDA was R$ 146.6 million, with margin of 15.2%.
It is relevant to emphasize that the results of the Company presented
extraordinary events that exerted impact on the EBITDA and on the EBITDA
margin. The accounting result can receive the following adjustments from
extraordinary effects occurred in 2015: (i) revenue of R$ 81.5 million
of the partial reversal of a provision referring to the process over the
segregation service, delivery and invoicing of TRAs (Bond Warehousing
and Custom Clearance Terminals); (ii) R$ 8.8 million of revenues without
adjustment for inflation to reversed amounts; (iii) expenses of R$ 51.4
million with provision of outstanding billing by virtue of the reversal; (iv)
R$ 7.0 million referring to change in the criterion of provision for bad
debt; (v) R$ 3.6 million in expenses incurred in the process of contractual
extension of Tecon Santos; (vi) increase of R$ 7.6 million in non-recurrent
expenses with legal advisory; and (vii) loss of R$ 30.6 million resulting from
test of recoverability of Tecon Imbituba. Excluding the effects previously
mentioned, the recurrent EBITDA of 2015 sums up R$ 195.8 million with
margin of 21.7%.
The fall of the EBITDA margin results from: (i) the reduction of the volume
of handled and warehoused containers in the port terminals of Santos,
Imbituba and in the segment of Logística; (ii) from the change in the mix
of services provided, with increase of the transshipment operations; and (iii)
from the impacts caused by the macroeconomic scenario on the operations
and costs of the Company.
The EBITDA presented by the segment of Port Terminals presented a fall
of 35.3% in 2015 impacted: (i) by the reduction in the total number
of handled and warehoused containers; (ii) by more participation of the
transshipment operations in the total number of handled containers. In
2015, the EBITDA of the segment of Logística recorded a reduction of
62.7%, with total of R$ 21.5 million and 10.4% of margin. Such variation
derives from the decrease of the number of warehoused containers,
and from the increase of the provision of services of warehousing for
fractional loads, which service incurs more expenses.
Reflection of the increase in the participation of vehicle of exportation in
the operating mix, the Vehicle Terminal recorded an EBITDA of R$ 22.7
million, with margin of 45.0% and 30.2% of fall compared to 2014.
(RS MILLIONS) 2015 MARGIN % 2014 MARGIN % VAR. %
37COMMITMENT TO RESULTS / 2015 SUSTAINABILITY REPORT
PORT TERMINALS 157,7 21,8% 243,8 34,1% -35,3
LOGISTICS 21,5 10,4% 57,6 23,8% -62,7
VEHICLE TERMINAL 22,7 45,0% 32,5 55,9% -30,2
CORPORATE -55,3 - -41,0 - 34,9
Consolidated 146,6 15,2% 292,9 29,2% -49,9

Net profit
The net result of the Company was affected by: (i) non-recurrent
expenses generated in the process of contractual concession period
Tecon Santos; (ii) different mix of service profile, with more participation
of transshipment operations; and (iii) partial reversal of the provision over
segregation processes and immediate delivery. In 2015, Santos Brasil
accumulated net loss of R$ 18.1 million.
According to the Company’s Articles of Incorporation, about the net
profit of the year the following deduction or increased will be applicable,
performed decreasingly and in the following order:
(a) five percent (5%) for the establishment of the Legal Reserve, which
shall not exceed twenty percent (20%) of the corporate capital. The
establishment of the Legal Reserve can be waived in the year in which the
balance of the same, increased by the amount of the reserves of capital
exceeds thirty percent (30%) of the Corporate Capital;
(b) Amount allocated to establish Reserves for Contingencies and reversal
of those already established in previous years;
(c) Profits to Realize and Reversal of Profits previously recorded on such
reserve that have been realized in the year;
(d) twenty five (25%) for payment of minimum compulsory dividend; and
(e) the remaining portion of the adjusted net profit after paying the
minimum compulsory dividend shall be allocated to the Reserve for
Investment and Expansion, which purpose is to: (i) assure funds for
investments in assets comprising the fixed assets, without prejudice to
profits according to Art. 196 of the Law N° 6.404/76; and (ii) increase of
working capital; and it can also be used in (iii) operations of redemption,
reimbursement or purchase of share of the Company, and the
Shareholders’ Meeting can decide to waive it, in the event of payment of
additional dividends to the minimum compulsory dividend.
38COMMITMENT TO RESULTS / 2015 SUSTAINABILITY REPORT
(R$ MILLIONS) 2015 2014 VAR. %
456,6
551,7
2011 2012 2013 2014 2015
528,0
292,9
146,640,6%
42,7%38,3%
29,2%
15,2%
EBITDA (in millions of R$) and EBITDA margin (%)
EBITDA 146,6 292,9 -49,9
Depreciation and amortization 131,6 140,3 -6,2
EBIT 15,0 152,6 -90,2
Financial Result -29,2 -25,5 14,5
IRPJ/CSLL -3,9 -35,6 -89,0
PROFIT FOR THE PERIOD -18,1 91,5 -

Net profit (in millions of R$) and net margin (%)
Debts and cash and cash equivalents
On December 31, 2015, the Company had R$ 226.1 million in
availabilities, resulting in R$ 113.5 million of net debt and leverage
ratio of 0.6x net debt /EBITDA. The total indebtedness consolidated recorded
on December 31, 2015 reached R$ 339.6 million. In August 2015, there
was fundraising of R$ 115 million via debenture issuance, with cost of CDI +
1.4% per annum, and period of three years. Such issuance had as purpose
to increase the Working Capital of the Company.
Capital markets
No encerramento de 2015, o valor patrimonial por Unit equivalente reg-
istrado foi de R$ 10,66, enquanto o valor de fechamento negociado na
Bolsa de Valores de São Paulo (BM&FBovespa) no dia 30 de dezembro foi
de R$ 12,60 (R$ 14,00 no ano anterior), atingindo valor de mercado de
R$ 1.678,5 milhões. No ano, o volume financeiro médio de negociação
diária atingiu R$ 1,8 milhão.
50
60
70
80
90
100
110
120
02/01/2015
02/02/2015
02/03/2015
02/04/2015
02/05/2015
02/06/2015
02/07/2015
02/08/2015
02/09/2015
02/10/2015
02/11/2015
02/12/2015
STBP11 IBOV
39COMMITMENT TO RESULTS / 2015 SUSTAINABILITY REPORT
246,6270,2
2011 2012 2013 2014 2015
255,0
91,5
-18,1
13,0%22,0%
18,0%
9,0%
(R$ MILLIONS) MOEDA 31/12/2015 31/12/2014 VAR. %
Short term DOMESTIC 107,5 132,2 -18,7
FOREIGN 33,4 25,8 29,5
Long term DOMESTIC 169,4 164,3 3,1
FOREIGN 29,3 35,6 -17,7
TOTAL INDEBTEDNESS 339,6 357,9 -5,1
CASH AND CASH EQUIVALENTS 226,1 218,4 3,5
NET DEBT 113,5 139,5 -18,6
Progress of STBP11 x IBOV - 2015 (base 100)

The shares are traded at BM&FBovespa in the form of units, and each unit
is comprised of one ordinary share and four preferred shares. The rights
of the shares are provided for in articles 5, 6 and 7 of the Company’s
Articles of Incorporation, which address the total corporate capital and its
division into ordinary and preferred shares; preferences and advantages
of the preferred shareholders, who, in their turn, are not entitled to vote
on the resolutions of the Shareholders’ Meeting; and the autonomy to
increase its capital irrespective of any decision of the Meeting up to the
limit of two billion, one thousand (2,000,001,000) shares, ordinary and/
or preferred, upon resolution by the Board of Directors.
The financial statements of Santos Brasil and its subsidiaries are audited
by Deloitte Touche Tohmatsu Auditores Independentes. The policy of the
Company in hiring services not related to external audit aims to assess
the existence of conflict of interests, assuring, among others, that the
auditor should not audit his/her own work, hold management positions
at his/her customer and promote the interests of his/her customer.
In 2015, it was contracted a review of the compliance with clauses in
business and audit agreements in economic calculations – services that
represented nearly 17% of the services of external audit hired for the year.
Investments
In 2015, Santos Brasil invested R$ 26.7 million, with a higher volume
of funds allocated to Tecon Santos and to Logística. Of the total, the
company allocated its own funds to 70.1% of the projects. For the
remaining 29.9%, the Company used financings for equipment and
importation. Most of the funds invested in 2014 had as purpose the gain
of efficiency. The total value represents a reduction of 6.0% in relation to
R$ 28.4 million invested in 2014.
40COMMITMENT TO RESULTS / 2015 SUSTAINABILITY REPORT

INVESTMENT MILLIONS OF R$ PURPOSE ORIGIN OF FUNDS
PORT TERMINALS
TECON SANTOS 11,0
Scope for advanced extension 0,2 Requirement of management/inspection entities Own
Readjustment of Tecon Santos 3,1 Requirement of management/inspection entities Own
Sustainability projects and cut of expenses 3,2 Improvement of productivity/operational performance Own
Maintenance 0,7 Improvement of productivity/operational performance Own
Various projects 3,8 Improvement of productivity/operational performance Own
TECON IMBITUBA 1,1
Improvements in legal aspects 0,2 Requirement of management/inspection entities Own
Adjustments, expansion of customs areas 0,3 Improvement of productivity Own
Various projects 0,6 Improvement of productivity Own
TECON VILA DO CONDE 1,8
Expansion of patio in 10 thousand meters 0,1 Own
Acquisition of equipment Reach Stacker 1,0 Requirement of management/inspection entities Financing (Finimp)
Acquisition of equipment 0,5 Improvement of productivity/safety Own
Various projects 0,2 Operational maintenance Own
VEHICLE TERMINAL 0,9
TEV Access 0,8 Continuous improvement and increase of operational performance Own
Vehicle Terminal adjustment 0,1 Operational maintenance Own
LOGISTICS 11,9
Acquisition of mobile workshop truck 0,2 Continuous improvement and increase of operational performance Own
Acquisition of five Reach Stacker 7,2 Improvement of productivity/safety Financing (Finimp)
Adjustment of CLIA Guarujá – Fire Department 1,3 Federal Revenue requirement Own
Sustainability projects and cut of expenses 1,3 Improvement of productivity/operational performance Own
Various projects 1,9 Improvement of productivity/operational performance Own
Adjustment of Vehicle Terminal 0,1 Operational maintenance Own
CONSOLIDATED 26,7
41COMMITMENT TO RESULTS / 2015 SUSTAINABILITY REPORT

For us, the safety is directly linked to ensuring the integrity of all those who pass through our operations, to trust of our customers that all the cargos will arrive at their destinations without any harm or damage and to the quality that only a service rendered with safety in all of its processes can have.

HEALTH AND SAFETY
The Sustainability Committee of Santos Brasil continuously monitors
the Health and safety, elected as one of the issues essential to directing
actions, studies, programs, indicators and goals of the Company. The
concepts and procedures that surround the matter are fully absorbed and
expressed in tools of prevention such as the Spot Observation of Safety
(OPS!), which in 2015 recorded 713 notes, 373 of which have been
completed; the Safety Observation System (SOS), which promoted 3.840
audits with 12,914 people observed and 8.498 persons contacted in the
year; and the five Golden Rules. In order to measure the efficacy of the
prevention actions, indicators such as Frequency Rate and Seriousness
Rate of the accidents are maintained and monitored. Thus, it is possible
to check the status of the operations and identify the steps required for
the reduction of the number of occurrences.
For the first time the Company ended the year meeting the goals set,
presenting a reduction of 38% for the Seriousness Rate and of 4% for the
Rate of Frequency. The dockworkers, recently included in the workforce
of Tecon Vila do Conde and Tecon Imbituba, were not considered in the
final calculation of this document. In 2016, they will be included again in
the calculations of the safety indicators.
Following the same direction, Santos Brasil invests in programs and
trainings to promote the excellence of its services, ensuring a healthy and
safe working environment. Its goal is to reach, until early 2019, the level
of interdependence in the safety culture, which means the employees
should care for their own safety and for their co-workers’ safety. In 2015,
legal trainings held comprised 38.547 hours.
The temporary port workers providing service at Tecon Santos were also
included in the daily dialogues of safety at the entry of shifts, when the
instructions on the operation of ships are disseminated.
The Conferences on Safety (Sipatp and Sipat) are held quarterly, which
address matters related to the quality, health, safety and the environment.
Four conferences were held in 2015 involving 11,206 professionals, of
the Company, temporary professionals (managed by the Manpower
Management Agency -OGMO) and provider of services. GRI G4-LA8 | G4-PR1
The professionals with high incidence or high risk of diseases related to
the professional activity are those holding the position of Operator of
Mobile Equipment (OCT and trucks). Their working hours are monitored
through record sheets, in other words, there is no specific operating
or political instruction for that, according to the Law 13.130/15 and
Regulation of Personnel. In 2015, 7,062,046 kilometers were run with
no lethal accident. GRI G4-LA7 | LT9 | LT12
In addition to reflecting the reduction of the number of accidents, those
actions contribute to projecting the Company and strengthening between
the customers and the society its commitment to the safety.
43SAFETY / 2015 SUSTAINABILITY REPORT

An example in this regard was the visit made by representatives of the
U.S. Coastguard to Tecon Santos to evaluate the practices of safety
adopted; the Company was praised for excellence in the application of
the procedures recommended by the International Code for Safety of
Ships and Port Facilities (ISPS Code).
44SAFETY / 2015 SUSTAINABILITY REPORT

SAFETY MANAGEMENT GRI G4-LA6 | G4-LA7
SAFETY OCCURRENCES |GRI G4-LA6|
Number of accidents without loss of time
7 2 7 0 0 1 2 2 1 0 0 0 0 0 1
17 21 18 2 1 3 1 6 4 0 0 1 11 12 7
7 2 7 0 0 1 2 2 1 0 0 0 0 0 1
14 21 18 2 1 3 1 6 4 0 0 1 11 12 7
4,18 5.59 5,20 10,31 4,3 11,61 2,63 11,72 5,77 0 0 8,64 4,55 4,78 3,14
546 355 197 15 4 25 10 67 23 0 0 3 111 93 67
0,35% 0,42% - 0,15% - 0,17% - 0,09% 1,02% 0,93%
134 112 56,92 77 17,19 96,8 26 130,92 33,16 0 0 25,93 46 38,24 30,10
0 0 0 0 0 0 0 0 0 0 0 0 0 0 0
0 0 0 0 0 0 0 0 0 0 0 0 0 0 0
0 0 0 0 0 0 0 0 0 0 0 0 0 0 0
0 0 0 0 0 0 0 0 0 0 0 0 0 0 0
3 0 0 0 0 0 0 0 0 0 0 0 0 0 0
Number of accidents with loss of time
Own
Men
Men
Women
Women
2013 2014 2015 2013 2014 2015 2013 2014 2015 2013 2014 2015 2013 2014 2015
TECON SANTOS TECON IMBITUBA TECON VILA DO CONDE LOGISTICSTEV
45SAFETY / 2015 SUSTAINABILITY REPORT
Frequency Rate (accidents with loss of time)
Rate of occupational illnesses
Absenteeism rate
Men
Men
Days lost
Number of deaths
Women
Women
Seriousness Rate
0 0 0 0 0 0 0 0 0 0 0 0 0 0 0
0 0 0 0 0 0 0 0 0 0 0 0 0 0 0
0 0 0 0 0 0 0 0 0 0 0 0 0 0 0

46SAFETY / 2015 SUSTAINABILITY REPORT
SAFETY OCCURRENCES |GRI G4-LA6|
Third parties 2013 2014 2015 2013 2014 2015 2013 2014 2015 2013 2014 2015
TECON SANTOS TECON IMBITUBA TECON VILA DO CONDE LOGISTICS
Separate (OGMO)
Number of injuries
Number of injuries
Number of occupational illnesses
Number of occupational illnesses
Number of days lost with employee leave
Deaths
Deaths
8 8 10 0 0 1 0 1 0 0 2 1
14 8 7 2 3 0 0 1 0 - - -
162 32 31 15 70 0 0 0 0 - - -
0 0 0 0 0 0 0 0 0 - - -
0 0 0 0 0 0 0 0 0 0 0 0
0 0 0 0 0 0 0 0 0 0 0 0
0 0 0 0 0 0 0 0 0 - - -
2013 2014 2015 2013 2014 2015 2013 2014 2015 2013 2014 2015

FREQUENCY RATE - SANTOS BRASIL (ALL UNITS)
SERIOUSNESS RATE - SANTOS BRASIL (ALL UNITS)
47SAFETY / 2015 SUSTAINABILITY REPORT
NOTE: The dockworkers of Tecon Imbituba and Tecon Vila do Conde,
recently included in the workforce, were left out of the final calculation
in 2015. In total accounting, eight dockworkers were left out, one
being of Tecon Imbituba and seven of Tecon Vila do Conde. In the
next report, those employees were again included in the indicators’
calculation.
2014
5,61
4,89 5,175,44
5,76
1,72
5,39
7,15
3,44
6,74
3,41
0
10,22
5,57
3,83
2015 Meta Jan Fev Mar Abr Mai Jun Jul Ago Set Out Nov Dez
2014
82,34
46,63
75,88 72,57
55,71
24,02
88,05
64,35
8,60
74,11
42,61
0
49,4046,44
36,34
2015 Meta Jan Fev Mar Abr Mai Jun Jul Ago Set Out Nov Dez

The human capital is an essential tool for the compliance with our goals. Therefore, we promote the professional development and improvement in the life quality of our employees.

VALUING INDIVIDUALS AND RESPECTING DIVERSITY / 2015 SUSTAINABILITY REPORT 49
INTERNAL PUBLIC
With 217 hiring’s, in late 2015, Santos Brasil had 3.545 professionals, in
addition to 77 apprentices and 17 trainees. Of the total, most of them
(86%) was male sex, which is justified due to the business nature. The
Company seeks to provide the teams a healthy working environment,
opportunities for promotion and salaries consistent with the market, with
the position held and with the area of expertise. For the executive officers,
annual and biannual surveys are conducted, through specific consultation,
in order to assess salary position. The model of remuneration variable for
executives (except for statutory executive officers) is set by the area of HR
and Management jointly with the statutory executive officers. GRI G4-52
Santos Brasil also keeps a package of benefits that changes among the
units and includes a life insurance, health insurance plan extensive to
dependents and sick pay, among others, and focus on health and safety
of all. In the year, 28% of the professionals participated as representatives
of formal committees related to the topic and 100 were members of the
Committee for Accident Prevention of the Port Terminals (CPATP) and the
Internal Commission for Accident Prevention (Cipa). With professional
entities, the Company executes collective bargaining agreements that
also include matters of health and safety, and are extensive to 100% of
the professionals.
GRI G4-9 | G4-LA2 | G4-LA5 | G4-LA6 | G4-LA8 | G4-11
Tecon Santos also keeps a private pension plan of Brasilprev that allows
the employee to elaborate a safe income plan/personal investment, aiming
at the future financial stability in cases of dismissal and retirement. The
plan has rules set by the Company and follows the directives of Banco do
Brasil. GRI G4-EC3

VALUING INDIVIDUALS AND RESPECTING DIVERSITY / 2015 SUSTAINABILITY REPORT 50

VALUING INDIVIDUALS AND RESPECTING DIVERSITY / 2015 SUSTAINABILITY REPORT 51
2015 EMPLOYEE PROFILE – BY REGION AND EMPLOYMENT CONTRACT GRI G4-10 | G4-LA1
Undetermined 2.752 246 171 376 3.545period
Apprentices 63 7 7 0 77
Interns 16 1 0 0 17
TOTAL 2.831 254 178 376 3.639
BAIXADASANTISTA
PLANALTO PAULISTA
IMBITUBA (SC)
VILA DO CONDE (PA) TOTAL
2015 EMPLOYEE PROFILE - BY GENDER AND AGE GROUP GRI G4-10 | G4-LA1
Up to 30 years old 217 42,97 5,96 653 20,84 17,94 870
From 30 to 50 years old 266 52,78 7,31 2.135 68,10 58,67 2.401
Over 50 years old 22 4,37 0,60 346 11,04 9,51 368
TOTAL 505 100 13,85 3.134 100 86,15 3.639
WOMEN
NUMBER NUMBER% WOMEN % MEN% GENERAL % GENERALAGE GROUP
MEN TOTAL

VALUING INDIVIDUALS AND RESPECTING DIVERSITY / 2015 SUSTAINABILITY REPORT 52
2015 EMPLOYEE PROFILE – BY SCHOOL LEVEL GRI G4-LA12
2015 NEW HIRINGS - BY AGE GROUP GRI G4-LA1
Masters’ Degree
Post Graduate Degree
Higher Education
Non-Concluded Higher Education
Concluded Technical Education
Non-Concluded Technical Education
Concluded High School
Non-Concluded High School
Concluded Elementary School
Non-Concluded Elementary School
No School Level
Tecon Santos
Logística
TEV
Tecon Imbituba
Tecon Vila Conde
Tecon Santos
Logística
TEV
Tecon Imbituba
Tecon Vila Conde
2
66
524
130
151
17
2.268
132
288
61
0
24
9
0
23
64
120
18
15
0
3
10
46
4
1
0
8
3
16
29
23
0
6
23
81
39
18
0
34
80
171
TOTAL 3.545
TOTAL
TOTAL
SCHOOL LEVEL NUMBER OF EMPLOYEES
UP TO 30 YEARS OLDUNIT
UNIT
30 TO 50 YEARS OLD
OVER 50 YEARS OLD
2015 NEW HIRINGS - BY GENDER
MEN WOMEN
Tecon Santos
Logística
TEV
Tecon Imbituba
Tecon Vila Conde
2
8
0
0
0
10
0
0
0
0
0
0
0
0
0
37
90
127
55
25
0
0
0
80TOTAL
UNIT SANTOS PLANALTO IMBITUBA BARCARENA
2015 NEW HIRINGS – BY REGION

VALUING INDIVIDUALS AND RESPECTING DIVERSITY / 2015 SUSTAINABILITY REPORT 53
2015 TURNOVER (%) GRI G4-LA1
BY UNIT BY REGION
Logística
Tecon Santos
TEV
Tecon Imbituba
Tecon Vila Conde
Pará
Santa Catarina
São Paulo
Distrito Federal
TOTAL TURNOVER
% %COMPANY COMPANY
9,75
5,29
5,06
9,04
16,94
6,98
9,04
5,29
6,88
0,00
RATIO BETWEEN THE LOWEST SALARY AND MINIMUM SALARY (BY GENDER) GRI G4-EC5
TOTAL 2832 253 178 376 3639
COMPANY GENDER
Women
Women
Women
Women
Women
Men
Men
Men
Men
Men
MINIMUM SALARY BY COMPANY
NATIONAL MINI-MUM SALARY - 2015
DIFFERENCE %
Logística
Tecon Santos
Tecon Imbituba
Tecon Vila Do Conde
TEV
R$ 1.078,37
R$ 1.211,59
R$ 1.146,91
R$ 1.355,41
R$ 1.341,58
R$ 1.468,92
R$ 1.080,31
R$ 1.080,31
R$ 1.146,91
R$ 1.604,00
R$ 788,00
R$ 788,00
R$ 788,00
R$ 788,00
R$ 788,00
R$ 788,00
R$ 788,00
R$ 788,00
R$ 788,00
R$ 788,00
R$ 290,37
R$ 423,59
R$ 358,91
R$ 567,41
R$ 553,58
R$ 680,92
R$ 292,31
R$ 292,31
R$ 358,91
R$ 816,00
36,85
53,76
45,55
72,01
70,25
86,41
37,10
37,10
45,55
103,55

VALUING INDIVIDUALS AND RESPECTING DIVERSITY / 2015 SUSTAINABILITY REPORT 54
Development and qualification
Santos Brasil invests in the qualification of its professionals, as it
understands they are essential to the excellence of the services and
satisfaction of the customers. Annually, it implements the Training
Plan, which covers programs for continued learning and training and
development of technical and managerial skills. It involves assessment,
with issue of behavioral report, and feedback, that contributes to the
assessed person identifying his/her gaps in an objective manner and
preparing a development plan with the support of his/her manager. In
2015, 20.492 hours of training were given, which correspond to an
average of 13.13 hours per professional. One of the initiatives was the
PROFESSIONAL QUALIFICATION GRI G4-LA9
NUMBER OF EMPLOYEES TOTAL TRAINING HOURS AVERAGE TRAINING HOURS
MENMENMEN WOMENWOMENWOMEN TOTALTOTALTOTAL
EMPLOYEE CATEGORY
Administrative
Operational
Officers
Supervisors
Coordinators
Managers
TOTAL
440
2.518
12
99
42
24
3.135
304
161
-
21
14
4
504
744
2.679
12
120
56
28
3.639
2.518
8.786
9
2.772
2.195
255
16.535
2.155
607
-
652
528
15
3.957
4.673
9.393
9
3.424
2.723
270
20.492
5,72
3,49
0,75
28,00
52,26
10,63
5,27
7,09
3,77
0,00
31,05
37,71
3,75
7,85
12,81
7,26
0,75
59,05
89,98
14,38
13,13
Program for Training Leaders, which, until 2018, must involve 100% of
leaders of the Company. All the professionals (100%) also had the same
integration training, which includes seven hours of institutional topics
and eight hours of topics such as occupational and property safety.
GRI G4-LA10 | G4-HR2 | G4-HR7
Furthermore, except for managers and directors – annually assessed by the
Business Plan -, all employees undergo a performance and professional
skills review. The performance goals are agreed-upon in the beginning of
the year. The feedbacks are constant, but in December and January, it is
disclosed a process through which the employees report their results and
prepare, with the manager, a Plan for Individual Development (PDI).
GRI G4- LA11
NUMBER OF EMPLOYEES WITH PERFORMANCE REVIEW GRI G4-LA11
Administrative
Operational
Officers
Supervisors
Coordinators
Managers
415
2.501
0
99
40
0
3.055
689
2.642
0
120
54
3
3.508
274
141
0
21
14
3
453
EMPLOYEE CATEGORY MEN WOMEN TOTAL
TOTAL

VALUING INDIVIDUALS AND RESPECTING DIVERSITY / 2015 SUSTAINABILITY REPORT 55
Volunteers and diversity
Santos Brasil encourages its professionals to devote time and willingness
for the exercise of social actions – a purpose strengthened throughout
the year by the Volunteer Registration System. The tool makes easier the
access of those working in shifts/ scale to the information on opportunities
for action, in addition to disclosing the main actions carried out in all the
units, encouraging each other towards a chain of solidarity. In 2015, the
system had 42 new registrations in the program I am a Volunteer, closing
with 180 active volunteers.
The diversity is also internally stimulated. So much so that 20 apprentices
hired in 2015, through the Program for Operating Learning developed in
partnership with Sest Senat, eight (40%) are disabled people. This audient
was distributed at the end of the period as follows: 35 at Tecon Santos,
13 at Logística, three at Tecon Vila do Conde and one at Tecon Imbituba.
The topic is addressed on the Code of Conduct, which prohibits any type
of discrimination. There is no difference of treatment as to gender by
professionals holding the same position in the Company’s remuneration
policy.

VALUING INDIVIDUALS AND RESPECTING DIVERSITY / 2015 SUSTAINABILITY REPORT 56
CUSTOMERS
Promoting competitiveness of the customers is always offering the best
port and logistics solutions and services tailored to each type of business.
To that end, Santos Brasil has an ally: the technology, which provides
transparency to the processes and facilitates the daily routine of users and
their services.
Example in 2015 was the launching of the free application for smartphones
and tablets, exclusive for requests for services and consultations of
information referring to the handling of cargos in real time. The area
for customers can be accessed through the login and password already
used on the Customer’s Portal, available on the Company’s site. The
main purpose is to increase the efficiency and agility of the procedures
carried out by the customers of Tecon Santos and two Custom Logistics
and Industrial Centers (Clias). The tool places the Company ahead of
the market and was introduced in the 21st Intermodal South America -
International Fair of Logístics, Freight Transportation and Foreign Trade,
held in São Paulo.
Other online instrument developed along the year enables customers to
calculate the final value of importation services of Tecon Santos and of
the Logísticas units in Baixada Santista. Available on the website and on
APP, the project is another feature that has been aggregated in stages to
the Financial Portal, which, opened in 2014, already provided facilities for
expeditors, NVOCC’s, freight forwarders and foreign trade companies in
accessing invoices, bank payment slip, and electronic tax invoices.
The unit Logística has also received investments in innovation. Early in
2015, it completed its new monitoring system of trucks, which increases
the productivity of its own and aggregated fleets, in addition to providing
more safety to drivers and cargos. With the innovation, the Company
automatically updates the data referring to the status of travels of loaded
and unloaded vehicles, assuring updated information to customer and
driver on the location of the cargo and the average time to reach the
destination.

VALUING INDIVIDUALS AND RESPECTING DIVERSITY / 2015 SUSTAINABILITY REPORT 57
All the initiatives contribute to expanding internal and external information
safety. So much so that in 2015, no claims related to breach of privacy
and loss of customers’ data were recorded. GRI G4-PR8
Satisfaction
In order to assure the work quality and customers’ satisfaction,
Santos Brasil completed in 2015 the implementation of a new after-
sales procedure, whose main purpose, throughout the year, was to
fully evaluate the customer’s satisfaction, addressing matters such as
customer’s service, services provided, communication and finance. To
that end, the Company began to use the methodology Net Promoter
Score (NPS), which identifies the level of satisfaction with the services
provided and how much the customers can contribute to promoting the
Santos Brasil brand. In that new format, 400 customers were approached
throughout the year, through telephone interviews and 17,720 answers
through a questionnaire on the company’s site. The result ascertained
was a NPS 58, 6% above the market benchmark*. The Customers Service
area also promoted a survey with more than one thousand users who,
throughout the year, answered questionnaires about aspects related to
customers’ service, such as cordiality, time required and request solution.
The procedure of customers’ service as well as registration of claims was
reviewed and the points of improvement verified were compiled in an
*source benchmark: npsbenchmarks.com
action plan, in progress. The procedure to negotiate customers’ claims
was also reviewed, in partnership with the area of Quality, and the results
and the improvement implemented are presented in an internal forum
called All for Customer, which has the participation of all managers of
the Company. For 2016, the aim is to consolidate such model and extend
the research basis so the segmentation per business unit will have more
critical mass. GRI G4-PR5
SUPPLIERS
At the end of 2015, Santos Brasil kept around 1,183 suppliers active in
its registration, which operated in a chain comprised of segments, such
as cargo transportation, energetic inputs, infrastructure, machines and
equipment, fuels and manufacturing, among others (see table on page
59). With them, the Company seeks to build a partnership relationship,
sharing its beliefs and strategies, including those related to social and
environmental issues. GRI G4-12
For this reason, Santos Brasil holds100% of the product purchase and
service provision agreements (there were 207 in 2015) specific clauses
on those topics and in line with the Global Compact, that address the
prohibition of child labor, forced labor and labor analogous to slavery,
in addition to specifications on safety and occupational health. In order

VALUING INDIVIDUALS AND RESPECTING DIVERSITY / 2015 SUSTAINABILITY REPORT 58
to assure the compliance by the companies with those requirements,
Santos Brasil establishes in the agreements its right to conduct audits at
the business partners’ facilities. Furthermore, the suppliers are subject to
audits within the scope of the maintenance of ISO 14001 certificate. In
2015, the area of QSSMA promoted documentary audit on 131 supplying
companies (no visits were made in loco in the year). As result of all those
mechanisms employed, no illegalities were found on the third parties’
operations within the period. For 2016, the purpose of Santos Brasil is to
approve companies that already provide internal services, with criticality
of A and B safety, as per the approved schedule. GRI G4-HR5 | G4-HR6 |
G4-LA15
For the new service providers, the requirements are the same. In the year,
it was added to the Company’s registration 188 suppliers, selected based
on criteria related to labor practices, environmental issues, impacts on
the society and human rights. GRI G4-LA14 | G4-SO9 | G4-HR10 | G4-EN32
Although the Company does not control the energy consumption outside
its facilities, it encourages the suppliers to replace fuels and/or vehicles
to prioritize the use of biofuels such as ethanol and biodiesel, instead of
ordinary diesel oil. In 2015, it consulted ten third party companies – work
that will be extended in 2016 to other service providers. In the case of
trucks, it must encourage the purchase of vehicles with system of post-
treatment of gases with selective catalytic reduction (SCR) and the use
of non-inflammable and non-toxic urea and water based additive, which
contributes to a reduction of the biodiesel consumption. GRI G4-EN7
To be entitled to one of its strategic focus, the Local Development, Santos
Brasil also privileges the contracting of suppliers of the locations where it
operates. In 2015, of the R$ 120.543 thousand allocated to purchases,
88.3% corresponded to local suppliers, which means 13.5 percentage
points above the 74.8% of the previous period. GRI G4-EC9
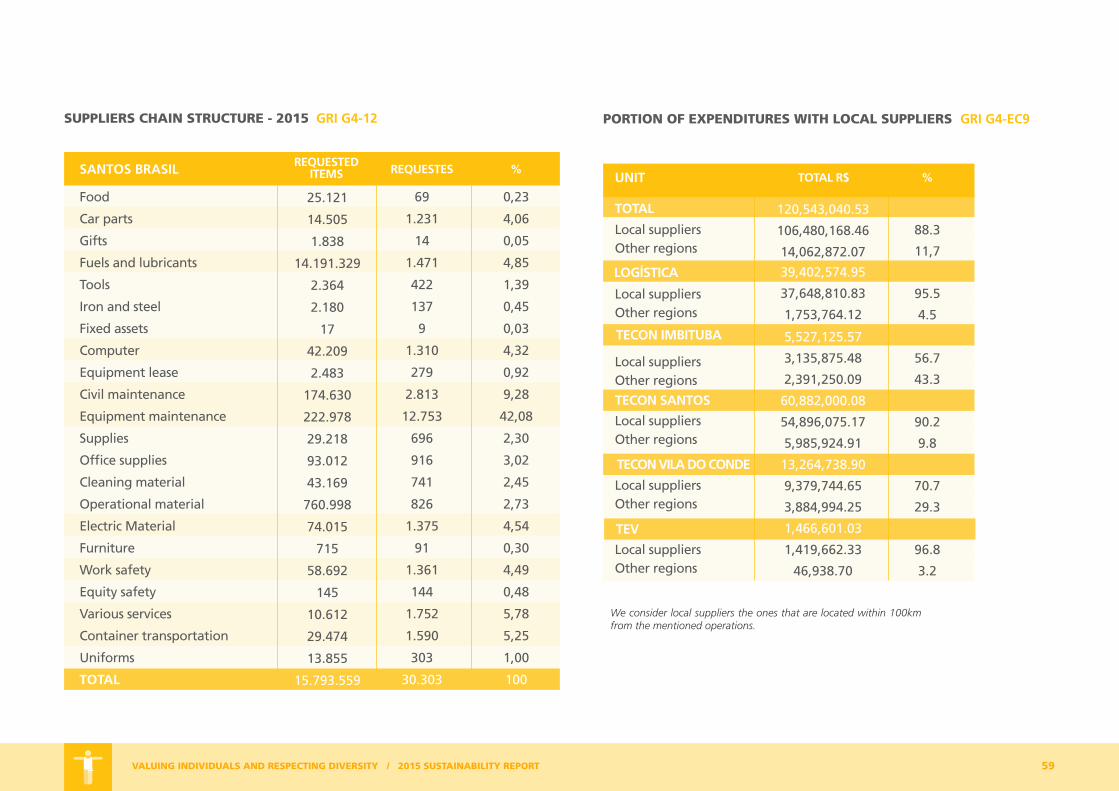
VALUING INDIVIDUALS AND RESPECTING DIVERSITY / 2015 SUSTAINABILITY REPORT 59
SUPPLIERS CHAIN STRUCTURE - 2015 GRI G4-12
Food
Car parts
Gifts
Fuels and lubricants
Tools
Iron and steel
Fixed assets
Computer
Equipment lease
Civil maintenance
Equipment maintenance
Supplies
Office supplies
Cleaning material
Operational material
Electric Material
Furniture
Work safety
Equity safety
Various services
Container transportation
Uniforms
69
1.231
14
1.471
422
137
9
1.310
279
2.813
12.753
696
916
741
826
1.375
91
1.361
144
1.752
1.590
303
30.303
0,23
4,06
0,05
4,85
1,39
0,45
0,03
4,32
0,92
9,28
42,08
2,30
3,02
2,45
2,73
4,54
0,30
4,49
0,48
5,78
5,25
1,00
100
25.121
14.505
1.838
14.191.329
2.364
2.180
17
42.209
2.483
174.630
222.978
29.218
93.012
43.169
760.998
74.015
715
58.692
145
10.612
29.474
13.855
15.793.559
SANTOS BRASIL REQUESTED ITEMS REQUESTES %
TOTAL
PORTION OF EXPENDITURES WITH LOCAL SUPPLIERS GRI G4-EC9
TOTAL
LOGÍSTICA
Local suppliersOther regions
Local suppliersOther regions
Local suppliersOther regions
Local suppliersOther regions
Local suppliersOther regions
Local suppliersOther regions
88.3
11,7
95.5
4.5
120,543,040.53
106,480,168.46
14,062,872.07
39,402,574.95
37,648,810.83
1,753,764.12
UNIT TOTAL R$ %
We consider local suppliers the ones that are located within 100km from the mentioned operations.
TECON IMBITUBA
TECON SANTOS
TECON VILA DO CONDE
TEV
5,527,125.57
3,135,875.48
2,391,250.09
60,882,000.08
54,896,075.17
5,985,924.91
13,264,738.90
9,379,744.65
3,884,994.25
1,466,601.03
1,419,662.33
46,938.70
56.7
43.3
90.2
9.8
70.7
29.3
96.8
3.2

VALUING INDIVIDUALS AND RESPECTING DIVERSITY / 2015 SUSTAINABILITY REPORT 60
Engagement
Santos Brasil endeavors to walk alongside its suppliers. In order to
strengthen the engagement with this audience, in 2015 it promoted the 1st
Panel of Suppliers, which brought together, in Santos (SP), representatives
of nearly 60 companies. With the participation of the main executives
of the Company, the service providers were sensitized to engage in a
shared management, responsible for and based on pillars of sustainability
of Santos Brasil. During the event, the Company’s sustainability strategy
was presented, and the main criteria of qualification of suppliers were
shared, including the standards required in terms of e safety and human
resources. It was also launched the Manual of Qualification of Suppliers,
which is available on the site of Santos Brasil for consultations. GRI G4-13

One cannot talk about growth without thinking about sustainable development. Therefore, we support initiatives for the local development and are pioneers in environmental management at the Port of Santos.

ENVIRONMENTAL AND SOCIAL RESPONSABILITY / 2015 SUSTAINABILITY REPORT
COMMUNITIES
Santos Brasil develops a number of actions to strengthen the coexistence
with the communities of the surrounding of its operations, which also
cover one of the priority issues of its Management towards sustainability,
The Local Development.
The efforts for 100% of its operations to be accompanied by engagement
programs of the community gave a significant jump in 2015 by involving
voluntary employees in the Environmental Journey, which led to the
initiative of going beyond the walls of the Company. In total, 250
employees were trained to act as multipliers. All the contents of the
training were developed in partnership with Sabesp, which also provided
course material for the dissemination of the environmental education
topic, with focus on the rational use of the water among the residents
and the surrounding entities. In 2015, the Environmental Journey also
addressed the importance of recycling and the proper disposal of electronic
waste, under penalty of contamination of the groundwater. In addition
to promoting awareness actions for employees and dissemination of
information through internal communication channels, Santos Brasil
is committed to the theme of supporting the Center of Recycling of
Electronic Garbage of Settaport Foundation that maintains points of
collection in the municipalities of the Baixada Santista. GRI G4-S01
Like in the previous year, in 2015 the Company paid special attention to
the community of Guarujá, resuming the attendance in ordinary meetings
of the Municipal Council for Child and Adolescent Defense (CMDCA)
and allocating funds to the Municipal Fund for the Child and Adolescent
(Fumcad) of the city. The subsidy is intended, as a matter of priority, for
the maintenance of social projects for professional training of the youths
and for the social inclusion.
Also in Guarujá, the Company maintains the practice of involving local
leaderships and persons responsible for projects supported in monthly
meetings of rendering accounts. In partnership with the Elos Institute,
in 2015, it conducted a dialogue with the Aldeia Community, in which
it presented its strategy of sustainability and the outcomes of a survey
conducted with the local families in the previous year.
By the third consecutive year, Santos Brasil also promoted the Faça Bonito
action, of awareness of its truck drivers and employees about the sexual
exploitation of children and teenagers on roads. Since 2009, the Company
is signatory of the Na Mão Certa Program and, in 2015, it conducted for
the first time training of 55 leaders of Tecon Vila do Conde in order for
them to become children and adolescent protection agents in the state
of Pará.
In 2016, Santos Brasil intends to keep this line of work focused on the
communities of the surrounding and the initiatives governed by the
Policies of Sustainability and of Private Social investment – approved
in 2015 to enhance the purpose of the Company of privileging the
education, including environmental education.
62

ENVIRONMENTAL AND SOCIAL RESPONSABILITY / 2015 SUSTAINABILITY REPORT 63

ENVIRONMENTAL AND SOCIAL RESPONSABILITY / 2015 SUSTAINABILITY REPORT 64
Impact management GRI G4-SO2 | G4-EC8
The Company’s operating units caused indirect impacts on the economic
development of the locations where they are installed, both positive
(hiring of services, creation of Jobs, increase of income of the families and
local economy upturn), and negative, deriving from truck traffic, such as
risk of accidents, traffic jam and emissions of Greenhouse Gases (GEE).
In the community of Guarujá, for example, more than 550 thousand
trucks circulated in 2015 – demand that changes the daily routine of the
communities of the surroundings of Tecon Santos. In order to mitigate
impacts like those, the focus of the private social investment is on the
sustainable development of the locations and social inclusion, with
emphasis on education.
One of the examples of successful action of impact mitigation is the
new Vicente de Carvalho/Guarujá access, which, from the beginning of
the operation, on January 15, until the end of 2015, has not recorded
material occurrences and was vital to reducing the impact of the vehicle
flow bound for the terminals of the left margin of the local traffic.
Social investment
The initiatives of Santos Brasil with educational trend focus especially on
the Formare Program developed in partnership with Fundação lochpe and
that, in 2015, was restructured and transformed into Formare Aprendiz
– a modality more related to the current needs of the community, of
the market and of the Company. Within the scope of the initiative, the
course of Administrative Assistance began, aimed at young families in
a situation of economic and social disadvantage, between 18 and 19
years living in Guarujá, who are studying in the 3rd year of High School
or have completed the course at the public schools of the municipality.
20 places were offered for classes that will be given at full time from
January of 2016 at Tecon Santos. With ending scheduled for April of

ENVIRONMENTAL AND SOCIAL RESPONSABILITY / 2015 SUSTAINABILITY REPORT 65
2017, the program evaluates the participants by performance, marks
and attendance. They receive course material, uniform, meals in the
Company, minimum salary, transportation vouchers, life insurance and
food basket. More than 200 students, 79 of which were hired by the
Company have already participated in the Formare Santos Brasil Program,
since the initiative was adopted in 2009. GRI G4-EC8
Santos Brasil also supports the social inclusion through sports, such as
the case of the Nostra Aldeia Project, developed in the community of
same name, in Guarujá (SP), and that offers lessons of jiu-jitsu to nearly
one hundred children and teenagers. Performed by the Palavra de Vida
Association has the formal sponsorship of Santos Brasil since 2012, in
addition to the participation of its voluntary employees. Also since 2012,
the Company sponsors Project developed by Settaport Foundation, the
purpose of which is to democratize the access to educational sports and
promote the social inclusion of children and teenagers of Guarujá and
Santos. It offers soccer and judo lessons, benefitted 160 students in 2015.
ENVIRONMENT
The efforts undertaken by Santos Brasil to mitigate the environmental
impacts of its activities obtained relevant recognition in 2015, when the
North American government invited the Company, through the U.S.
Trade and Development Agency (USTDA), to participate in the technical
committee that visited ports of that country to identify green and
sustainable technologies.
The sustainability is included in the operating aspect of the Company,
which maintains efficient the management of wastes and makes
continuous investments in eco-efficiency, decommissioning unnecessary
equipment and planning to gradually migrating its energetic consumption
from diesel to electrical.

ENVIRONMENTAL AND SOCIAL RESPONSABILITY / 2015 SUSTAINABILITY REPORT 66
All the operating units adopt management system based on ISO 14001
standard, identifying the aspects and impacts inherent to its activities
and services and systematically monitoring the applicability of the legal
requirements. As regards logistics company, the main environmental
impacts measured, managed and treated are related to carbon dioxide
emissions (CO2) and the release of treated effluent into water bodies.
Santos Brasil holds in its purposes and goals, programs to reduce those
indicators. GRI G4-EN12 | G4-EN27 | G4-EN30
Energy GRI G4-EN6
The consumption of energy inside the Company totaled 38,622.09 MWh
in 2015 (equal to 139.039,51 gigajoules), 12.86% less that in 2014. One
of the initiatives was the substitution of lighting of the units for the LED
technology, which reduces up to 64.3% the emissions of CO2 compared
to ordinary light bulbs. In 2015, the substitution was completed in some
rooms of the Administrative building II and Gate of Operation of Tecon
Santos, in addition to the business office downtown in Santos. At the
end of the period, the studies for implementation of LED in the operating
areas of Tecon Santos were at their final stages, through which the idea
was to reduce the consumption up to 40%. The purpose is that all the
administrative areas and repair shops have lighting replaced with LED
until the end of 2016.
Other actions on the same line are the awareness of the administrative
teams, as to the proper use and savings with electric power, reduction of
points of light in the repair shop of maintenance of the its own fleet and
reduction of Btus in cooling administrative rooms.
Emissions
In 2015, the company improved its result in monitored kg/TEU by obtaining
a reduction of 10% of the emissions of Greenhouse Gases (GEE) in its
operations. The intensity of the emissions at Tecon Santos, main operation
of the Company, was equal to 16.69 kg/CO2 per handled TEU. At Tecon
Vila do Conde and Tecon Imbituba, the result found was 37.89 kg/CO2 and
27.91 kg/CO2 respectively. Clias ended the year with the indicator at 26.82
kg/CO2 per TEU. In the transportation operations, the indicator was at 0.97
kg/CO2 per kilometer run and, in the operation of the distribution centers,
the information ascertained was 1.31 kg/CO2e per handled pallet.
The direct emissions of GEE summed up 26,263.24 tons of equivalent
carbon (CO2e) and those from the acquisition of energy were 4,809.24 tons
of CO2e. The total consolidated was 31,072.48 tons of CO2e, reduction of
13.7% in relation to the previous year, in which 36.016,82 tons of CO2e
had been recorded. The measure is made according to the methodology of
the Brazilian Program GHG Protocol. GRI G4-EN19

ENVIRONMENTAL AND SOCIAL RESPONSABILITY / 2015 SUSTAINABILITY REPORT 67
The positive results reflect the efforts of the Company to guarantee the
efficiency of its operations. One of the main initiated was the Green Fleet
Program, which from the end of 2014 contributed to a relative reduction
(per kilometer run of the vehicles) of nearly 8% in the first year of
implementation of the program. All vehicle are annually tested for opacity
to assure a minimum level of emission of pollutant. No other indirect
sources, whose emissions of GEE were relevant. GRI G4-EN19 | G4-EN17
In the past three years, the Company invested R$ 21 million in the
modernization of its fleet, comprised of 143 trucks and 228 trailers,
prioritizing more operationally and environmentally efficient vehicles. The
process called Green Buy, to buy trucks, prioritizes for makes equipped
with system of post-treatment of gases with Selective Catalytic Reduction
(SCR), that respect the rules of the National Environment Council
(Conama).
At the end of 2015, 90% of the fleet of trucks used diesel S-10, which
emits less sulfur in the atmosphere. More than 70% of the vehicles of the
fleet already met the Euro 5 standard, which determines the reduction of
emissions of diesel vehicles. The Company also makes available the S-10
fuel with affordable prices to the aggregates for the road transportation.
In 2015, such action involved 137,368.65 liters. With the substitution of
fuel for S-10, there has already been a reduction of the emission, among
other substances, sulfur derivatives. There is also the addition of Arla 32
to the exhaust system, combined with the technology of the catalysts
(Euro V) in 90% of their vehicles, which provides a significant reduction
of the emission of NOx. GRI G4- EN21
Furthermore, Santos Brasil encourages its own fleet to act as co-liable in
the use of fuel and reduction of the emission of pollutants. Such control
is made on a monthly basis, through monitoring and disclosure of the
average fuel consumption of each professional, within the Sustainable
Driver Program. The initiative, which rewards drivers for performance
in the exercise of its activities, evaluated 100% of the professionals of
the road transportation. The fuel consumption goal for the year, of 2.61
km/L, was met in August and, maintained until the end of the period. It
was verified also a reduction of 15% in the number of malfunctions in
relation to the previous year (from 253 to 217 occurrences).

ENVIRONMENTAL AND SOCIAL RESPONSABILITY / 2015 SUSTAINABILITY REPORT 68
CONTAINER TERMINALS AND CLIAS – KGCO2/TEU
GPL Energy Biodisel total
2014
0,18
3,52
2015
0,15
3,17
Jan
0,12
4,17
Fev
0,16
3,98
Mar
0,16
3,71
Abr
0,19
3,90
Mai
0,152,65
Jun
0,18
3,25
Jul
0,162,50
Ago
0,172,34
Set
0,15
2,76
Out
0,14
2,62
Nov
0,102,83
Dez
0,17
3,31
14,78 13,38 14,23 13,24 13,91 14,99 11,89 14,51 12,79 12,31 13,47 12,83 12,94 13,46
18,48
0
5
10
15
20
16,70
18,5217,38 17,79
19,08
14,69
17,95
15,44 14,8216,39 15,59 15,86
16,94
DISTRIBUTION CENTERS - KGCO2/MOVING PALLET
GPL Energy Biodisel total
2014
0,22
2015
0,25
Jan
0,29
Fev
0,24
Mar
0,27
Abr
0,31
Mai
0,25
Jun
0,28
Jul
0,25
Ago
0,22
Set
0,23
Out
0,23
Nov
0,17
Dez
0,24
0,62 0,83 0,68 0,96 0,84 0,97 0,78 1,03 0,77 0,78 0,68 0,80 0,72 0,90
0,03
0,05 0,07
0,05 0,000,09
0,03
0,08
0,040,00 0,07
0,04 0,12
0,06
0,87
0
1
2
1,12 1,04
1,241,10
1,38
1,05
1,38
1,06
1,00 0,981,07 1,01
1,20
*Emissions of CDs obtained by using GLP.
GRI G4-EN5 | G4-EN15 | G4-EN16
TOTAL
DIRECT EMISSIONS (SCOPE 1)* TONS OF CO2e
Tecon Santos
Tecon Vila do Conde*
Tecon Imbituba*
Santos Brasil Logística
15.140,11
2.090,04
565,38
8.467,71
26.263,24
TOTAL
INDIRECT EMISSIONS (SCOPE 2) TONS OF CO2e
Tecon Santos
Tecon Vila do Conde*
Tecon Imbituba*
Santos Brasil Logística
3.705,83
196,32
96,60
810,50
4.809,24
TOTAL
DIRECT EMISSIONS (SCOPE 1) +INDIRECT EMISSIONS (SCOPE 2)
31.072,48
TONS OF CO2e

ENVIRONMENTAL AND SOCIAL RESPONSABILITY / 2015 SUSTAINABILITY REPORT 69
EMISSIONS IN SANTOS BRASIL LOGÍSTICA - Clias
YEARS
2012
2013
2014
2015
2.878
3.034
3.057
2.163
*
*
23,89
26,82
TONS OF CO2e KG OF CO2e BY TEU
*Data not informed.
EMISSIONS IN TECON IMBITUBA
YEARS
2013
2014
2015
433,20
752,68
661,98
30,48
17,49
27,91
TONS OF CO2e KG OF CO2e BY TEU
EMISSIONS IN TECON SANTOS
YEARS
2011
2012
2013
2014
2015
18.618
23.230
28.992
23.648
18.846
12,52
13,76
16,31
17,35
16,69
TONS OF CO2e KG OF CO2e BY TEU
EMISSIONS IN TECON VILA DO CONDE
YEARS
2013
2014
2015
1.249
2.031
2.286
36,73
30,72
37,89
TONS OF CO2e KG DE CO2e POR TEU
ROAD TRANSPORTATION TERMINAL (TTR) KGCO²/KM RUN
2014 2015 Jan Fev Mar Abr Mai Jun Jul Ago Set Out Nov Dez
1,02
0
10,96 1,00 0,97 0,98 0,97 0,97 0,94 0,93 0,93 0,95 0,95 0,94 0,97
0,98
Biodisel target
EMISSIONS IN SANTOS BRASIL LOGÍSTICA - CDs
YEARS
2012
2013
2014
2015
172
259
436
301
0,35
0,42
0,81
1,31
TONS OF CO2e KG OF CO2e BY PALLET

ENVIRONMENTAL AND SOCIAL RESPONSABILITY / 2015 SUSTAINABILITY REPORT
2011 2013 2014 20152012
12,52
18,618
13,76
23,230
16,31
28,992
17,35
23,648
16,69
18,846
70
Ton of CO2e Kg of CO2e by TEU
EMISSIONS IN TECON SANTOS
INTENSITY OF EMISSIONS BY UNIT - SCOPE 1
EMISSIONS OF GREENHOUSE GASES BY MOVEMENT
Tecon Santos
Tecon Imbituba
Tecon Vila do Conde
Clia Santos
Clia Guarujá
CD São Paulo
CD São Bernardo
TTR
SANTOS BRASIL LOGÍSTICA
11,82 Kg of CO2e/TEU
22,67 Kg of CO2e/TEU
36,74 Kg of CO2e/TEU
23,11 Kg of CO2e/TEU
15,11 Kg of CO2e/TEU
0,24 Kg of CO2e/pallet moved
0,32 Kg of CO2e/ pallet moved
0,96 Kg of CO2e/Km run
INTENSITY OF EMISSIONS BY UNIT - SCOPE 2
EMISSIONS OF GREENHOUSE GASES BY MOVEMENT
Tecon Santos
Tecon Imbituba
Tecon Vila do Conde
Clia Santos
Clia Guarujá
CD São Paulo
CD São Bernardo
TTR
SANTOS BRASIL LOGÍSTICA
2,89 Kg of CO2e/TEU
3,87 Kg of CO2e/TEU
3,47 Kg of CO2e/TEU
7,06 Kg of CO2e/TEU
6,33 Kg of CO2e/TEU
1,42 Kg of CO2e/handled pallet
0,63 Kg of CO2e/handled pallet
0,008 Kg of CO2e/Km run
EMISSIONS IN SANTOS BRASIL LOGÍSTICA - TTR
YEARS
2012
2013
2014
2015
5.087
4.894
6.092
6.814
0,99
1,01
1,03
0,97
TONS OF CO2e KG OF CO2e BY PALLET

ENVIRONMENTAL AND SOCIAL RESPONSABILITY / 2015 SUSTAINABILITY REPORT 71
WATER
The consumption of water of Santos Brasil reduced from 80,022m3 in
2014 to 69,651m3 in 2015, 12.9% less in comparison between the years.
The Company monitors its consumption of water through the indicator
m3 per capita. The result in 2015 was 1.55, 20% less than the total
verified in 2014.
Adopted since May 2014, the dry cleaning of vehicles and equipment
for road transportations – pioneer model at Port of Santos – achieved
a savings of nearly 3.82 million liters of water in 2015. The initiative
is adopted in the entire fleet of Santos Brasil Logística, which includes
two Custom Logistics and Industrial Centers (Clias), one unit and two
Distribution centers (CDs), totaling 143 trucks and 228 semitrailers. In
one year, 2,545 dry cleanings were performed, and each one of them
represents a saving of 1.5 thousand liters of water, a quantity required for
cleaning one truck alone using the conventional cleaning.
The technique uses wet cloth moistened with a biodegradable product.
A team of five people can wash seven to eight vehicles per day. In
addition to gains to the environment with water savings, the dry cleaning
provides reduction of the pollutant gases emissions. This is because, by
being cleaned according to the conventional method, the trucks need to
be taken to an accredited facility, in São Vicente (SP). Now they can be
cleaned at the units Logísticas, which also contributed to reducing the
traffic on the roads of Baixada Santista.
The commitment to the efficiency of the operations also led the Company
to extend, within the period, the facilities with new treatments to reuse
the water in the toilets, gardens and washing equipment. At Tecon
Santos, the tertiary treatment allows the reuse of 100m3 of water per day,
of which 60m3 are stored and used in construction works and gardening.
In 2016, the resource will also be used in module 4 in the toilets. In Clia
Santos, there is the rain water reuse for washing machines in the repair
shops. GRI G4-EN10

ENVIRONMENTAL AND SOCIAL RESPONSABILITY / 2015 SUSTAINABILITY REPORT 72

ENVIRONMENTAL AND SOCIAL RESPONSABILITY / 2015 SUSTAINABILITY REPORT 73
SANTOS BRASIL | M³ PER CAPITA
2014 2015 Jan Fev Mar Abr Mai Jun Jul Ago Set Out Nov Dez
1,86
1,551,45
1,57
0,67
1,66
2,272,41
1,60
1,39 1,38
0,92
1,581,63
WATER CONSUMPTION IN L GRI G4-EN8
PERIOD TECON VILA DO CONDE
TECON IMBITUBA
TECON SANTOS
CLIA GUARUJÁ
CLIA SANTOS
CD SÃO BERNARDO
CD SÃO PAULO TTR TOTAL
SANTOS BRASIL
Jan
Feb
Mar
Apr
May
Jun
Jul
Aug
Sep
Oct
Nov
Dec
TOTAL (l)
TOTAL (m³)
135.000
132.000
132.000
133.000
131.400
131.400
131.400
133.680
132.740
138.000
133.920
134.560
1.599.100
1.599
120.000
120.000
114.000
89.000
218.000
127.000
200.000
57.000
66.000
60.000
50.000
72.000
1.293.000
1.293
4.653.000
3.879.000
1.194.000
4.338.000
6.257.000
7.078.000
4.510.000
3.872.000
3.697.000
1.726.000
4.213.000
4.467.000
9.884.000
49.884
217.000
216.000
233.000
241.000
300.160
316.160
180.000
208.000
176.640
202.240
225.280
211.200
2.726.680
2.727
755.000
722.000
528.000
627.000
731.000
487.000
642.000
448.000
592.000
777.000
591.000
575.000
7.475.000
7.475
800.000
368.000
296.000
402.000
332.000
253.000
248.000
240.000
233.000
280.000
243.000
503.000
4.198.000
4.198
239.000
132.000
110.000
98.000
119.000
116.000
142.000
86.000
84.000
87.000
82.000
78.000
1.373.000
1.373
83.000
98.000
71.000
34.000
168.840
177.662
101.001
117.000
99.360
113.760
126.720
118.800
1.309.143
1.309
7.002.000,00
5.667.000,00
2.678.000,00
5.962.000,00
8.257.400,00
8.686.222,16
6.154.401,00
5.161.680,00
5.080.740,00
3.384.000,00
5.664.920,00
6.159.560,00
69.857.923,16
69.858

ENVIRONMENTAL AND SOCIAL RESPONSABILITY / 2015 SUSTAINABILITY REPORT 74
Public spring supply and sources of thermal waters.
Public spring supply and artersian well.
Public spring supply and artersian well.
Public spring supply.
WATER CONSUMPTION BY SOURCE (M³)
UNIT REDE PÚBLICA TOTAL WATER SOURCES AFFECTED BY WATER REMOVAL
Tecon Santos
Clia Guarujá
Clia Santos
CD São Paulo
CD SBC
TTR
49.884
2.727
7.475
1.373
4.198
1.309
49.884
2.727
7.475
1.373
4.198
1.309
TOTAL 66.966 66.966

ENVIRONMENTAL AND SOCIAL RESPONSABILITY / 2015 SUSTAINABILITY REPORT 75
Effluents and waste
Set in 2014 within the scope of the evaluation of the unit indicators, the
goals of effluents and waste reduction for 2015 were fully met. Through
management tools and awareness practices, the fall was by 20.69% in
comparison from January to November of 2014 and to the same period
of 2015 in all units.
Tecon Santos generated in the year 52,482m3 of sanitary effluents,
treated in its own Treatment Station (ETE) before discharging in the
maritime channel – about which the Company has no information/results
of the studies on biodiversity. The related habitat that can be affected
is the mangrove located to the right of the Vehicle Terminal (TEV) side.
The receptor body is a protected area and the discharges are permitted
provided that granted by the managing authority and they comply with
the parameters required by the legislation. The oily effluents of Tecon
Santos, in their turn, receive treatment in a physical-chemical station, also
of its own, with daily capacity of 41.3m3. GRI G4- EN26
For sanitary effluents generated in the units of Logística and of Tecon
Imbituba tanks are used, the wastes of which are monthly collected and
sent for treatment in their own regional units. The sanitary effluent of
Tecon Vila do Conde is treated by Companhia Docas do Pará (CDP),
through its own system. In case of oily effluents, the units separate them
through a Separation System of Water and Oil (SAO), treat the material
and promote the collection and analysis of the wastewater (treated
effluent) in an accredited and certificated laboratory. GRI G4-EN22
In addition to that, in order to reduce the quantity of hazardous waste
(Class 1) discharged and extend the use of the oil of the equipment – until
then changed every 2 thousand hours of use -, flushing machines and
filter cutter were purchased. The first one, intended to increase the useful
life of the hydraulic oil, come into use already; the filter cutter equipment
will begin to operate in 2016.
In 2015, Santos Brasil generated 294.77 tons of hazardous waste and
1,696.86 tons of non-hazardous waste, which represents a reduction of
43.69% in comparison with the volume of the previous year. Of this total,
922.57 tons were allocated to recycling, 259.26 tons were recovered and
858.25 tons were allocated to landfills. GRI G4-EN23

ENVIRONMENTAL AND SOCIAL RESPONSABILITY / 2015 SUSTAINABILITY REPORT 76
Biodiversity
In late 2015, Santos Brasil had 824,571.24 m2 of leased area and 1,844
meters of area of public utilization inside the protected area. Distributed in
the surroundings of its units, such locations are ensured by the Company
through its management system, which encompasses the scope of ISO,
14001 standard, of environmental preservation. Among the directives of
the certificate, there is the identification and monitoring of the impacts of
the operations on the environment.
This commitment of the Company is expressed also in the partnership,
renewed in 2015, with the Right Whale Project NGO, that is involved
in work to protect, preserve and recover the right whale population in
Brazilian waters. Santos Brasil is the sponsor of the scientific researches of
conservation of the habitat of the species. GRI G4-EN13

ENVIRONMENTAL AND SOCIAL RESPONSABILITY / 2015 SUSTAINABILITY REPORT 77
PROPERTIES IN HIGH BIODIVERSITY AREA. GRI G4-EN11
597.324,24
165.426,00
11.821,00
50.000,00
980
310
300
254
UNITBIOME
WHERE IT IS INSERTED
SURROUNDING AREAS AND UNDER
PROTECTED INFLUENCE
LEASED AREA WITHIN PROTECTED
AREA (M2)
AREA OF PUBLIC UTILIZATION WITHIN PROTECTED AREA (BROADSIDE) IN METERS
Tecon Santos
TEV
Tecon Imbituba
Tecon Vila do Conde
Atlantic Rainforest
Atlantic Rainforest
Atlantic Rainforest
Amazônia
Estuary/ Mangrove
Estuary/ Mangrove
Atlantic Ocean
Right Margin of Pará River

CORPORATE INFORMATION
Board of Directors
Carlos Geraldo Langoni (Chairman)
Verônica Valente Dantas (Vice-Chairman)
Marcos Nascimento Ferreira
Maria Amalia Delfim de Melo Coutrim
Daniel Pedreira Dorea
Fabio Perrone Campos
Mello Alcides Lopes Tápias (Independent)
Plans Jurgen Friedrich Peters (Independent)
Wallim Cruz de Vasconcellos Junior (Independent)
Alternates
Marcus Vinícius Gomes Bitencourt
Eduardo Carvalho da Silva Faoro
Eduardo de Britto Pereira de Azevedo
Marcelo de Freitas Lapa Santos
Pedro Corrêa da Veiga Murgel
Ricardo Schenker Wajnberg
Fiscal Council
Gilberto Braga (Chairman)
Leonardo Guimarães Pinto
Antonio Carlos Pinto de Azeredo
Axel Erhard Brod
Alternates
Norberto Aguiar Tomaz
Heldo Jorge dos Santos Pereira Junior
Roberto Francisco Silva
Donald Ward Mcdarby Junior
Board of Executive Officers
Antônio Carlos Duarte Sepúlveda - Chief Executive Officers
Washington Cristiano Kato - Economic and Financial Officer and Investor
Relations Officer
Caio Marcelo Morei Corrêa - Operations Officer
Administrative Offices
SÃO PAULO GRI G4-5
R. Eduardo de Souza Aranha, 387, 2nd floor - Vila Olímpia
Postal Code: 04543-121 - São Paulo (SP)
Phone: 55 (11) 3279-3279
E-mail: [email protected]
SANTOS
R. Brás Cubas, 37, 5o andar - Centro
Postal Code: 11013-919-Santos (SP)
Phone: 55 (13)2102-9000
E-mail: [email protected]
CORPORATE INFORMATION / 2015 SUSTAINABILITY REPORT 78

Commercial Offices
SANTOSR. Praça Antônio Telles, 12, 6o andar - Centro
Postal Code: 11013-020-Santos (SP)
Phone: 55 (13)2102-9000
E-mail: [email protected]
IMBITUBAAv. Nereu Ramos, 866, salas 1, 3, 5 e 7 - Centro
Postal Code: 88780-000 - Imbituba (SC)
Phone: 55 (48) 3255-0667
E-mail: [email protected]
BELÉMAv. Presidente Vargas, 158, 10° andar, sala 1001 - Campina
Postal Code: 66010-000-Belém (PA)
Phone: 55 (91) 3230-2397
E-mail: [email protected]
Operations
TECON SANTOSVia Santos Dumont, S/N - Postal Code: 11460-970 - Guarujá (SP)
Phone: 55 (13) 3344-1000
TECON IMBITUBAAv. Presidente Vargas, s/n° - Área Portuária - Centro
Postal Code: 88780-000 - Imbituba (SC)
Phone: 55 (48) 3255-3495
E-mail: [email protected]
TECON VILA DO CONDE
Rod. PA 481, km 21, S/N - Complexo Portuário de Vila do Conde
Postal Code: 68447-000 - Barcarena (PA)
Phone: 55 (91) 3322-7575
Logistics
Av. Marginal Via Anchieta, 820 - Alemoa
Postal Code: 11095-000-Santos (SP)
Phone: 55 (13) 3209-6000
Via Cônego Domênico Rangoni, 3105 - Vila Áurea - Vicente de Carvalho
Postal Code: 11454-630-Guarujá (SP)
Phone: 55 (13) 2127-1199
Distribution Centers
Est. Sadae Takagi, 2.600, sala 4 - Cooperativa Postal Code: 09852-070 -
São Bernardo do Campo (SP)
Telephone: 55 (11)4393-4900
Av. Alexandre Mackenzie, 141, Armazém I - Bairro Jaguaré
Postal Code: 05322-000 - São Paulo (SP)
Phone: 55 (11) 3254-0000
Vehicle Terminal
Via Santos Dumont, S/N
Postal Code: 11451-970 -Guarujá
Phone: 55 (13) 3344-1000
CORPORATE INFORMATION / 2015 SUSTAINABILITY REPORT 79

GRI’S CONTENT SUMMARY OPTION “IN ACCORDANCE” - CORE
INDEX / 2015 SUSTAINABILITY REPORT 80
Declaration of the main decision maker of the organization on the relevance of the sustainability for the organization and its strategy of sustainability.
Nome of the organization.
Main products, brands and services.
Location of the organization’s headquarters.
Number of countries where the organization operates.
Nature of the property and legal status of the organization.
Markets in which the company operates.
Main impacts, risks and opportunities.
G4-1 3
7
7
78
7
7
7
3, 23
G4-3
G4-4
G4-5
G4-6
G4-7
G4-8
G4-2
GENERAL STANDARD CONTENT
PAGE/ANSWERS EXTERNAL VERIFICATION
GLOBAL COMPACT PRINCIPLE
Strategy and analysis
Organizational profile
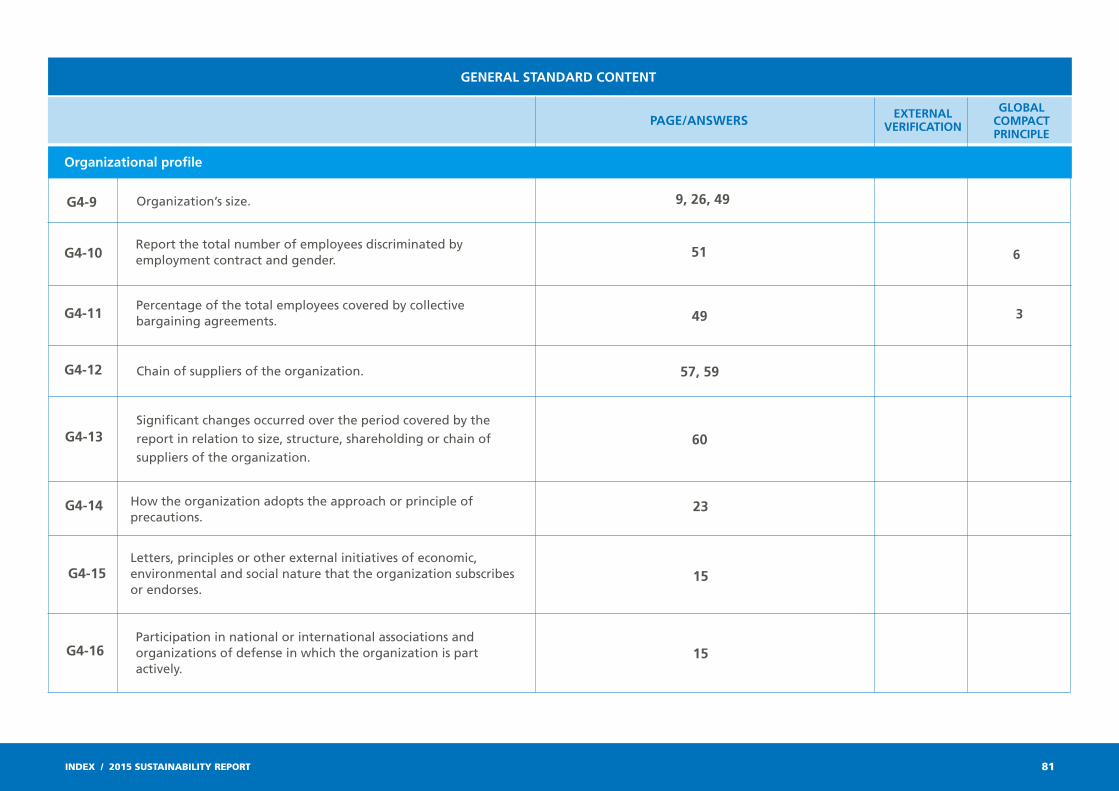
INDEX / 2015 SUSTAINABILITY REPORT 81
Organization’s size.
Percentage of the total employees covered by collective bargaining agreements.
Chain of suppliers of the organization.
Significant changes occurred over the period covered by the report in relation to size, structure, shareholding or chain of suppliers of the organization.
How the organization adopts the approach or principle of precautions.
Letters, principles or other external initiatives of economic, environmental and social nature that the organization subscribes or endorses.
Participation in national or international associations and organizations of defense in which the organization is part actively.
Report the total number of employees discriminated by employment contract and gender.
G4-9
G4-11
G4-12
G4-13
G4-14
G4-15
G4-16
G4-10
GENERAL STANDARD CONTENT
Organizational profile
6
3
9, 26, 49
51
49
57, 59
60
23
15
15
PAGE/ANSWERS EXTERNAL VERIFICATION
GLOBAL COMPACT PRINCIPLE

INDEX / 2015 SUSTAINABILITY REPORT 82
Entities included in the consolidated financial statements.
Groups of stakeholders engaged by the organization.
Material aspects identified in the process of identification of the report content.
Limit of the material aspect inside the organization.
Limit of the material aspect outside the organization.
Effect of any restatements of information provided in previous reports and the reasons for such restatements.
Significant changes in relation to periods covered by previous reports in scope and limits of the aspect.
Base used for the identification and selection of stakeholders for engagement.
Process adopted to define the report’s contents and the limits of the aspects.
G4-17
G4-24
G4-19
G4-20
G4-21
G4-22
G4-23
G4-25
G4-18
GENERAL STANDARD CONTENT
Identified material aspects and limits
Limit stakeholders engagement
5
5
5
5
5
20
20
5
There was no significant changes.
PAGE/ANSWERS EXTERNAL VERIFICATION
GLOBAL COMPACT PRINCIPLE

INDEX / 2015 SUSTAINABILITY REPORT 83
Approach adopted by the organization to engage stakeholders.
Option of agreement chosen by the a organization
Period covered by the report.
Date of the latest report.
Report issuance cycle.
Point of contact for questions about the report and its contents.
Current policies and practice adopted by the organization to submit the report to an external checking.
Main topic and concerns raised during the stakeholders’ engage-ment.
G4-26
G4-32
G4-28
G4-29
G4-30
G4-31
G4-33
G4-27
GENERAL STANDARD CONTENT
Limit stakeholders engagement
Report’s profile
20
20
5
5
5
5
5
Except for the financial statements, there is no exter-nal checking for the Report.
PAGE/ANSWERS EXTERNAL VERIFICATION
GLOBAL COMPACT PRINCIPLE

INDEX / 2015 SUSTAINABILITY REPORT 84
Governance structure of the organization.
Frequency with which the highest governance body analyzes impacts, risks and opportunities deriving from economic, environmental and social issues.
Report the roles played by the highest governance body and by the senior executives in the development, approval of and updating on the purpose, declaration of Mission, Vision and Values and on the definition of strategies, policies and goals related to economic, environmental and social impacts of the organization.
Composition of the highest governance body and its committees.
If the chairman of the highest governance body is also an executive officer.
Selection and appointment processes for the highest governance body and its committees.
Processes used by the highest governance body to ensure the prevention and management of conflicts of interest.
Highest-level body or position that formally analyzes and approves the Sustainability Report.
Process adopted to communicate critical concerns to the highest governance body.
Process used for the delegation of authority on economic, environmental and social topics by the highest governance body.
G4-34
G4-47
G4-38
G4-39
G4-40
G4-41
G4-42
G4-48
G4-49
G4-35
GENERAL STANDARD CONTENT
Governance
14
14
14
14
14
13
5
14
14
14
PAGE/ANSWERS EXTERNAL VERIFICATION
GLOBAL COMPACT PRINCIPLE

INDEX / 2015 SUSTAINABILITY REPORT 85
Report the nature and total number of critical concerns communicated to the highest governance body and the mechanism(s) adopted to address and resolve them.
Internal and external mechanisms adopted by the organization to request for guidelines on ethical behaviors and in conformity with the legislation, such as relationship channels.
Compensation policies applied to the highest level of governance and to senior executives.
Process adopted to determine compensation.
Values, principles, standards and rules of behavior of the organization.
10
10
10Internal and external mechanisms adopted by the organization to communicate concerns about non-ethical behaviors or inconsistent with the legislation.
G4-50
G4-51
G4-52
G4-57
G4-56
G4-58
GENERAL STANDARD CONTENT
Governance
Ethics and integrity
13
14
14, 49
13
16
13
PAGE/ANSWERS EXTERNAL VERIFICATION
GLOBAL COMPACT PRINCIPLE

INDEX / 2015 SUSTAINABILITY REPORT 86
Management Method
Management Method
Direct generated and distributed economic value.
Financial Implication of the climate changes.
There is no calculation of the financial implications.
Financial statements
7, 8 and 9
Coverage of obligations foreseen on the defined benefit pension plan of the organization.
G4-DMA
G4-DMA
G4-EC1
G4-EC2
G4-EC3
SPECIFIC STANDARD CONTENT
CATEGORY: ECONOMIC
Aspect: Economic development
Aspect: Presence in the market
11, 12, 31, 32
11
49
19, 26, 29
OMISSIONSPAGE/ANSWERS EXTERNAL VERIFICATION
GLOBAL COMPACT PRINCIPLE

INDEX / 2015 SUSTAINABILITY REPORT 87
Variation of the proportion of the lowest salary, itemized by gender, compared to the local minimum salary in relevant operating units.
Development and impact of investments in infrastructure and offered services.
Significant indirect economic impacts, including the extension of the impacts.
1 and 6
Management Method
G4-EC5
G4-DMA
G4-EC7
G4-EC8
SPECIFIC STANDARD CONTENT
CATEGORY: ECONOMIC
Aspect: Presence in the market
Aspect: Indirect economic impacts
Aspect: Purchase practices
Proportion of costs spent on local suppliers in relevant operating units.
Management MethodG4-DMA
G4-EC9
53
26
19
64
57
58, 59
There is no level of development of the investments and expected impacts.
OMISSIONSPAGE/ANSWERS EXTERNAL VERIFICATION
GLOBAL COMPACT PRINCIPLE

INDEX / 2015 SUSTAINABILITY REPORT 88
Management Method
Energy consumption outside the organization.
Energetic Intensity
Energy consumption reduction
G4-DMA
G4-EN4
G4-EN5
G4-EN6
SPECIFIC STANDARD CONTENT
CATEGORY: ENVIRONMENTAL
Aspect: Energy
Aspect: Water
Water sources significantly affected by water withdrawal.
Total percentage and volume recycled and reused water.
Total withdrawal of water per source.
Management MethodG4-DMA
G4-EN8
G4-EN9
G4-EN10
7 and 8
8 and 9
8
8
8
8
66
68
66
71
74
74
71
There is no monitoring of consumption of energy by the chain.
OMISSIONSPAGE/ANSWERS EXTERNAL VERIFICATION
GLOBAL COMPACT PRINCIPLE

INDEX / 2015 SUSTAINABILITY REPORT 89
Management Method
Operating units owned, leased or managed inside or in the surroundings of protected areas and of high value for the biodiversity located outside the protected areas.
Description of significant impacts of activities, products and services on the biodiversity in protected areas and of high value for the biodiversity located outside protected areas.
G4-DMA
G4-EN11
G4-EN12
G4-EN13
SPECIFIC STANDARD CONTENT
CATEGORY: ENVIRONMENTAL
Aspect: Biodiversity
Aspect: Emissions
Direct Emissions of Greenhouse Effect (GEE) (Scope 1).
Indirect emissions of Greenhouse Effects (GEE) form purchase of energy (Scope 2).
Protected or restored habitats.
Management MethodG4-DMA
G4-EN15
G4-EN16
8
8
7 and 8
7 and 8
8
76
77
66
76
66
68
68
OMISSIONSPAGE/ANSWERS EXTERNAL VERIFICATION
GLOBAL COMPACT PRINCIPLE

INDEX / 2015 SUSTAINABILITY REPORT 90
Other indirect emissions of Greenhouse Effect (GEE) (Scope 3).
Reduction of emissions of Greenhouse Effect (GEE).
Emissions of NOx, SOx and other significant atmospheric emissions.
G4-EN17
G4-EN19
G4-EN21
SPECIFIC STANDARD CONTENT
CATEGORY: ENVIRONMENTAL
Aspect: Emissions
Aspect: Effluents and waste
Total discharge of water itemized by quality and destination.
Total weight of residues itemized by type and method of disposal.
Total number and volume of significant leaks.
Identification, size, status of protection and value of the biodiversity of related water bodies and habitats, sig-nificantly affected by discharges and drainage of water performed by the organization.
There were no significant leaks in the units of Santos Brasil in 2015.
Management MethodG4-DMA
G4-EN22
G4-EN23
G4-EN24
G4-EN26
8
8 and 9
7 and 8
8
8
8
8
67
67
67
75
75
75
75
OMISSIONSPAGE/ANSWERS EXTERNAL VERIFICATION
GLOBAL COMPACT PRINCIPLE

INDEX / 2015 SUSTAINABILITY REPORT 91
Extension of the mitigation of environmental impacts of products and services.
G4-DMA
G4-EN27
`SPECIFIC STANDARD CONTENT
CATEGORY: ENVIRONMENTAL
Aspect: Products and services
Aspect: Compliance
Aspect: Transports
Monetary value of significant fines and total number of non-pecuniary sanctions applied resulting from non-conformity with environmental laws and regulations.
Material environmental impacts, resulting from transportation of products and other goods and materials used in the operations of the organization, as well as from transportation of its employees.
Management Method
Management Method
Management Method
G4-DMA
G4-DMA
G4-EN29
G4-EN30
7, 8 and 9
8
8
There are no indicators of mitigation for all the as-pects.
R$12.750,00 (Cetesb)
64
66
13
65, 67
66
OMISSIONSPAGE/ANSWERS EXTERNAL VERIFICATION
GLOBAL COMPACT PRINCIPLE

INDEX / 2015 SUSTAINABILITY REPORT 92
Percentage of new suppliers selected based on environmental criteria.
G4-DMA
G4-EN32
SPECIFIC STANDARD CONTENT
CATEGORY: ENVIRONMENTAL
CATEGORY: SOCIAL / LABOR PRACTICES OF DECENT WORK
Aspect: Suppliers’ environmental evaluation
Aspect: Employment
Aspect: Occupational health and safety
Total number and rates of new hiring of employees and rotation by age group, gender and region.
Benefits granted to employees.
Management Method
Management Method
Management Method
Percentage of workforce represented in formal commit-tees of health and safety.
G4-DMA
G4-DMA
G4-LA5
G4-LA1
G4-LA2
8
6
6
There is no control of itemization of rotation by gender.
57
58
49
51, 52, 53
49
43
49
OMISSIONSPAGE/ANSWERS EXTERNAL VERIFICATION
GLOBAL COMPACT PRINCIPLE

INDEX / 2015 SUSTAINABILITY REPORT 93
Types and rates of injuries, occupational diseases, missed days, absenteeism and number of work-related deaths itemized by region and gender.
Employees with high incidence of high risk of diseases related to their position.
G4-LA6
SPECIFIC STANDARD CONTENT
CATEGORY: SOCIAL / LABOR PRACTICES OF DECENT WORK
Aspect: Occupational health and safety
Aspect: Training and education
Topics related to health and safety covered by formal agreements with unions.
Management Method
Average number of hours of training per year, by employee, itemized by gender and employee category.
Skills management and continuous learning programs that contribute to the continued employability of employee in the period of preparation for retirement.
G4-LA7
G4-DMA
G4-LA9
G4-LA10
G4-LA8
6
The rates of missed days and absenteeism are not itemized by gender.
43, 45
45
43, 49
54
54
54
OMISSIONSPAGE/ANSWERS EXTERNAL VERIFICATION
GLOBAL COMPACT PRINCIPLE

INDEX / 2015 SUSTAINABILITY REPORT 94
Percentage of employees that regularly received analysis of performance and development career itemized by gender and employee category.
SPECIFIC STANDARD CONTENT
Aspect: Training and education
Aspect: Diversity and equal opportunities
Aspect: Evaluation of suppliers in labor practices
Formation of groups responsible for the governance and discrimination of employees per employee category according to gender, age group, minorities and other indicators of diversity.
Percentage of new suppliers selected based on criteria related to labor practices.
Significant impacts for labor practices on the chain of suppliers.
Management Method
Management Method
G4-DMA
G4-DMA
G4-LA12
G4-LA14
G4-LA15
G4-LA11 6
6
CATEGORY: SOCIAL / LABOR PRACTICES OF DECENT WORK
54
55
52
57
58
58
OMISSIONSPAGE/ANSWERS EXTERNAL VERIFICATION
GLOBAL COMPACT PRINCIPLE

INDEX / 2015 SUSTAINABILITY REPORT 95
Number of complaints and claims related to labor practices registered, processes and solved through formal mechanism. 243 cases were recorded in the year.
SPECIFIC STANDARD CONTENT
Aspect: Investments
Aspect: Child labor
Aspect: Compulsory work or similar to slave work
Total number of hours of training of employees in policies of human rights.
Operations and suppliers identified as of risk for the occur-rence of cases of child labor.
Management Method
Management Method
Management Method
G4-DMA
G4-DMA
G4-DMA
G4-HR2
G4-HR5
G4-LA16
1
5
CATEGORY: SOCIAL / LABOR PRACTICES OF DECENT WORK
HUMAN RIGHTS
19
13, 54
15, 57, 58
58
15, 57, 58
Aspect: Complaint mechanisms and claims related to labor practices
OMISSIONSPAGE/ANSWERS EXTERNAL VERIFICATION
GLOBAL COMPACT PRINCIPLE

INDEX / 2015 SUSTAINABILITY REPORT 96
Operations and suppliers identified as of significant risk for the occurrence of forced labor or similar to slavery. 58
SPECIFIC STANDARD CONTENT
Aspect: Compulsory work or similar to slave work
Aspect: Safety practices
Aspect: Evaluation
Aspect: Evaluation of suppliers in Human rights
Percentage of personnel of safety that received training in policies or procedures of the organization related to human rights.
Total number and percentage of operations submitted to analysis or assessments of human rights of impacts related to human rights.
Management Method
Management Method
Management Method
Percentage of new suppliers selected based on criteria related to human rights.
G4-DMA
G4-DMA
G4-DMA
G4-HR7
G4-HR9
G4-HR10
G4-HR6
1
1
2
HUMAN RIGHTS
54
13, 54
57, 58
We do not have such analysis.
57, 58
58
OMISSIONSPAGE/ANSWERS EXTERNAL VERIFICATION
GLOBAL COMPACT PRINCIPLE

INDEX / 2015 SUSTAINABILITY REPORT 97
SPECIFIC STANDARD CONTENT
Aspect: Local communities
Aspect: Fighting corruption
Percentage of operations with implemented programs of engagement of the local community.
Operations with significant negative real and potential impacts on the local communities.
The social programs assist 100% of the surrounding communities, but the engagement and assessment of impacts do not take place fully in all of them.
No cases recorded
Management Method
Management Method
Number and percentage of operations submitted to assessment of risks related to corruption.
Communication and training in policies and procedures of fight against corruption.
Confirmed corruption cases
G4-DMA
G4-DMA
G4-SO1
G4-SO2
G4-SO3
G4-SO4
G4-SO5
1
1
10
10
10
SOCIETY
62
64
13
13
13
OMISSIONSPAGE/ANSWERS EXTERNAL VERIFICATION
GLOBAL COMPACT PRINCIPLE

INDEX / 2015 SUSTAINABILITY REPORT 98
SPECIFIC STANDARD CONTENT
Aspect: Public policies
Aspect: Unfair competition
Aspect: Compliance
Aspect: Evaluation of suppliers in impacts on society
Total value of financial contributions to politicians and political parties and discriminated by country and receiver/ beneficiary.
The Company does not make contributions of this type.
No records in 2015.
No records in 2015.
Management Method
Management Method
Management Method
Management Method
Total number of court actions filed for unfair competition, anti-trust and monopoly practices and their results.
Monetary value of significant fines and total number of applied non-pecuniary sanctions because of non-conformity with laws and regulations.
Percentage of new suppliers selected based on criteria related to impact on the society.
A Notice of Violation (21583599) was received in the year, with application of fine in the amount of R$ 212,241.45.
G4-DMA
G4-DMA
G4-SO6
G4-SO7
G4-DMA
G4-DMA
G4-SO8
G4-SO9
10
SOCIETY
62
13
57, 58, 60
57
OMISSIONSPAGE/ANSWERS EXTERNAL VERIFICATION
GLOBAL COMPACT PRINCIPLE

INDEX / 2015 SUSTAINABILITY REPORT 99
SPECIFIC STANDARD CONTENT
Aspect: Customers’ health and safety
Aspect: Labelling of products and services
Number de complaints and claims related to impacts on the society registered, processed and solved through formal mechanism.
The Company is not manufacturer of products and its services do not affect the society’s health and safety.
Management Method
Management Method
Management Method
Percentage of the significant categories of products and services for which impacts on health and safety are assessed in order to seek for improvements.
Number of cases of non-conformity with regulations and voluntary codes related to impacts caused by products and services in health and safety
Outcomes of customer’s satisfaction survey.
The Company is not manufacturer of products and its services do not affect the society’s health and safety.
All the activities and services have risk analysis indicating possible deviations and the required mitigating and emergency actions, called Table of Hazard and Risks
G4-DMA
G4-SO11
G4-DMA
G4-DMA
G4-PR1
G4-PR2
G4-PR5
SOCIETY
Aspect: Complaint mechanisms and claims related to impacts on society
13
56, 57
26, 57
57
LIABILITY FOR THE PRODUCT
OMISSIONSPAGE/ANSWERS EXTERNAL VERIFICATION
GLOBAL COMPACT PRINCIPLE

INDEX / 2015 SUSTAINABILITY REPORT 100
SPECIFIC STANDARD CONTENT
Aspect: Customers’ privacy
Management Method
Total number of confirmed complaints and claims related to breach of privacy and loss of customers’ data.
G4-DMA
G4-PR8
LIABILITY FOR THE PRODUCT
13, 56, 57
57
OMISSIONSPAGE/ANSWERS EXTERNAL VERIFICATION
GLOBAL COMPACT PRINCIPLE

CREDITS
General coordination
Corporate Communication and Sustainability
Investor Relations
Content and writing
KMZ Contents
Graphic project and formatting
Casa de Arte SP
CREDITS / 2015 SUSTAINABILITY REPORT 101