profile information - kansas state department of … finance/budget/budget... · • derby middle...
TRANSCRIPT

PROFILE INFORMATION
2016-17
USD 260 Derby
School Finance Kansas State Department of Education Landon State Office Building 900 SW Jackson Street, Suite 356 Topeka, Kansas 66612-1212 www.ksde.org

i
• Budget General Information (characteristics of district)
• Supplemental Information for Tables in Summary of Expenditures
• KSDE Website Information Available
• Summary of Expenditures (Sumexpen.xlsx)

1
2016-17 Budget General Information USD #: 260
Introduction
The Derby School District, covering 50 square miles, is a suburban school district which is part of the Wichita metropolitan area consisting of approximately 500,000 people. Although more than 20,000 people call Derby home, the population of our district boundaries includes large sections of Sedgwick County. The Oaklawn/Sunview area, McConnell Air Force Base, Towne Parc, Oak Knoll and Salem Township are all included within our boundaries. This makes our district population near 40,000. USD 260 serves approximately 6,950 students through nine elementary schools, two middle schools and one high school. All day kindergarten is offered at each of our elementary schools. The students are exposed to a district wide K-12 curriculum that supports Reading/Language Arts, Math, Science, Social Studies, computer technology, Music Education, and a variety of electives ranging from foreign languages to business courses to the arts. Our students consistently score above the state and national norms in the assessments that are given K-12. The public voted to approve a $66.7 million bond issue in April, 2012. Construction was completed on two elementary building additions, remodeling at the high school and middle school, a new second middle school and a new central kitchen. An auxiliary gymnasium was also added at Derby Middle School while the Derby Sixth Grade Center was razed. This completes all of the scheduled bond projects. Over 1,000 certified and classified employees in the district support student learning. Of our certified staff, slightly more than 60% have attained a Master’s degree with 36% at a Master’s plus 30 hours or above on our salary schedule. District health, dental, and short-term disability insurance plans are made available to staff through our cafeteria plan. The district continually strives to provide optimal working conditions for all staff members.
Board Members Matt Hoag, President 2607 Rough Creek Rd., Derby, KS 67037 R. Matthew Joyce, Vice-President 218 Mallard Drive, Derby, KS 67037 Jose Martinez 1406 Cresthill Rd., Derby, KS 67037 Carolyn Muehring 1518 Cardinal Court, Derby, KS 67037 Tom Ostrander 2224 E. Glen Hill Dr., Derby, KS 67037 Tina Prunier 1306 Meadowhaven, Derby, KS 67037 Janet Sprecker 818 Rough Creek Loop, Derby, KS 67037
Key Staff Superintendent: Craig Wilford Associate or Assistant Superintendents: Heather Bohaty – Assistant
Superintendent/Human Resources, Dr. Charlene Laramore – Assistant Superintendent/Curriculum and Instruction.
Business Office Staff: Don Adkisson – Director of Budget and Finance/Treasurer, Gerie Allen –Budget/Accounting Coordinator, Barbara Woodworth – Payroll/Benefits Coordinator, Erica Smith, Purchasing/Accounts Payable Coordinator, Dani

2
Patterson – Secretary/Travel, Jacqui Pierce – Accounting Assistant, Jenny Ramsey – Payroll Assistant, Denise Bird – Finance Office Assistant/Student Records, Christine Pitzer – Retirement Specialist.
Curriculum & Instruction Staff: Robin Folkerts – Instructional Coordinator, Kelley Graham – Grant Coordinator, Kelly Kitterman – ELL Testing Coordinator, Pam Lewis – Secretary.
Other Key Contacts: Joe Dessenberger – Director of Operations, Dr. Vince Evans – Director of Special Services, Dennis Elledge – Director of Technology, Ginny Atkison-Hall – Safety & Security Officer, Anthony DiGregorio – Transportation/Supply Supervisor, Martha Lawson – Food Services Supervisor, Litona Hoyt – Board Clerk
The District’s Accomplishments and Challenges
Accomplishments: Our students, staff and buildings have a long-standing tradition of excellence. Below you will find a partial listing of some of our shining successes from the 2015-2016 school year. • Derby High School Cheerleaders has 13 All-Americans and 1 Top All-American at NCA Cheer Camp, the most of any school. • Derby High School Student Council hosted Regional Student Council conference. • Derby Middle School named a 2015 Jostens’ National Yearbook Program of Excellence and featured in the 2016 Jostens Look Book. • Students from Cooper Elementary, El Paso Elementary and Wineteer Elementary had students perform in the South Central Kansas Music Educator’s Association Honor Choir. • Derby High School’s news magazine, Panther’s Tale, placed third in Best of Show category at National Convention. Sierra Bauman received highest rating in news writing and honorable mention in logo design. • Derby High School’s Robotics Club placed fifth in BEST (Boosting Engineering Science and Technology) competition at Wichita State University. • Derby North Middle School Scholar’s Bowl team earns second place in the Pioneer League Championship. • Three Derby High School students selected to perform in the Kansas South Central District Orchestra. • Two students competed in the Kansas Historical Society’s photo contest, “Your Kansas Community”. Paige Schroeder, Derby North seventh grader, placed first and Kyle Miller, Swaney Elementary third grader, placed second out of more than 500 students. • Heidi Nichols, Tanglewood Elementary student, raises over $4,000 for Jump Rope for Heart. • Derby High School’s boys swim team competes in Swim to a Wish, where they swam over 100 continuous miles. • Derby High School had seven students place in National History Day. • All 12 schools worked together to participated in “Food Friday on a Thursday” to collect nearly 6,000 cans of food for the local food bank. • Derby High School senior, Haley Mills, won the Derby Optimist Club’s $500 essay contest with the theme, “Lead by Example, Reality of Fiction?”

3
• Derby High School students Jacob Barta and Mason Klish presented at the Kansas Academy of Science meeting. They were the only high school students. • Derby High School’s AFJROTC unit earned the Distinguished Unit Award (DUA). The award recognizes the personal growth and accomplishments of the cadets, contributions of the instructors as mentors and the support of the school and local community. Derby High School sports: - Football - AVCTL League, District, Regional, Sectional, Sub-State and State Champions. 6A and All-Classes - Volleyball - AVCTL League Champions, Sub-State Runner-up - Girls Golf - AVCTL League Champions, Regional Runner-up - Girls Tennis - Regional Champions - Boys Bowling - AVCTL League and Regional Champions, Third Place at - Girls Basketball - AVCTL League and Sub-State Champions - Wrestling - Regional Runner-up Staff Honors: • Jed Heath, Derby North Middle School teacher, named a recipient of the Kansas State Department of Education’s Horizon Award. • Derby High School Success 101 given 2 awards and 1 medal at the Focus on Freshmen training. One award was created specifically for DHS by Academic Innovations for Outstanding Teamwork. • Laura Leis (elementary) and Lisa Stansfield (secondary) recognized as district’s Kansas Teacher of the Year Nominees. • Park Hill Elementary Structured Learning Teacher, Kim Vortherms, named the Kansas Council for Exceptional Children (KCEC) Special Educator of the Year. • Stephanie Dunback, Cooper Elementary, named a Golden Apple recipient from KAKE TV, Davis-Moore and Freddy’s Frozen Custard. • Amy Steadman, Derby North Middle School, named a Golden Apple recipient from KAKE TV, Davis-Moore and Freddy’s Frozen Custard. • Carolyn Redford, Substitute Coordinator, earned a $2,500 referral for Aesop. • Misti Dailey, Tanglewood Elementary teacher, achieved National Board Certification. • Mandy Rohr, Derby Middle School Assistant Principal, selected as a Kansas Association of Middle School Administrators Exemplary Middle School Assistant. • Park Hill Elementary kindergarten teacher, Alison Beckwith, named Wichita Wingnuts Teacher of the Month, presented by National Teachers Hall of Fame. • Derby Public Schools received eight awards in the 2015 Kansas Association of School Boards and the Kansas Public Relations Association Publications Contest, including the highest recognition for the Derby School News. • State Football Coach of the Year, Brandon Clark • Regional Wrestling Coach of the Year, Bill Ross • AVCTL Bowling Coach of the Year, Alexis Ijams • AVCTL League Girls’ Basketball Coach of the Year, Jodie Karsak Building Honors: • Oaklawn Elementary wins Derby Public Library’s Summer Reading Challenge. • SJCF Architecture wins outstanding design award for Derby North Middle School. • Derby High School presented Golden Football from the NFL (National Football League).

4
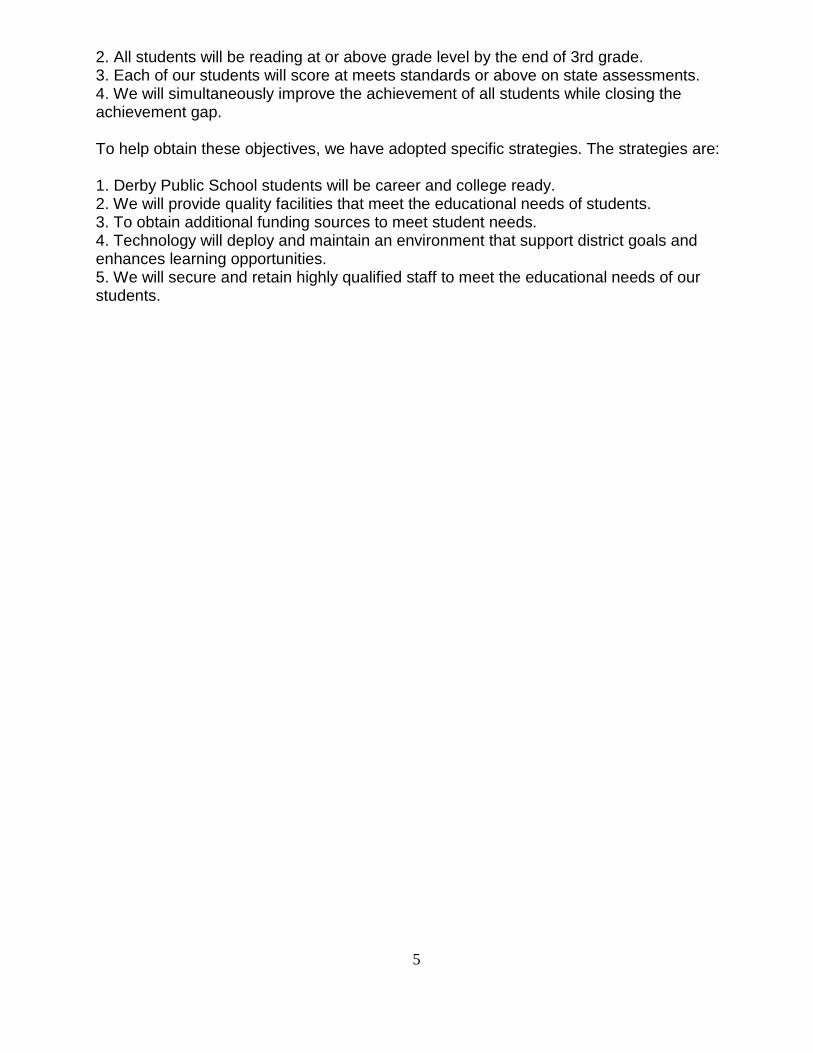
• Derby North Middle School named Elephant Conservation sponsors at the Sedgwick County Zoo. • Oaklawn Elementary named Challenge Award recipient by the Confidence in Kansas Public Task Force. • Credit Union of America presented a check of $16,100 to Derby High School’s Athletics and Activities Fund. Grants Received: 1. National Math and Science Initiative (in partnership with the Department of Defense) Grant for $428,992.00 - to enhance the AP Program at the Derby High School and provide special training for teachers throughout the district to help prepare more students to take AP classes. 2. Kansas Leadership Center grant for $25,000 – in partnership with the City of Derby, the Derby Recreation Commission and the Derby Chamber of Commerce to send at least 10 people to Kansas Leadership ‘You.Lead.Now’ training. 3. Staff Wellness Steering Committee to designed and implemented the Derby Staff Wellness Program throughout the district and managed the $10,000 donated by Aetna towards Derby’s staff wellness plan. 4. Bonus $3,550 from the Early Childhood Block Grant for meeting program and data collection goals- for teacher Professional Development and supplies. 5. Perkins Supplemental Grant of $1,500 to buy two 3D scanners and related iPads and software. 6. Project Lead the Way grant to provide Computer Science Teacher Training to one teacher - $2,400. 7. Credit Union of America Awarded $1,515 grant as part of their “Teacher Grants…Ideas Financed” program: - Kay Jacobs, Derby High School, $400 - Claravon Mathews, Derby Middle School, $500 - Sarah Mercer, Pleasantview Elementary, $225 - Lachelle King, Cooper Elementary, $140 - Amy Steadman, Derby North Middle School, $250 8. Terry Swan, Swaney Elementary’s media paraprofessional, received $1,000 EMC Reading Caravan Grant. 9. Derby Education Foundation grant recipients: - Amy Steadman, $500 for Middle School student entry fees for National History Day competition. - Shelby Kraus, $500 to buy green t-shirts for ‘new to district’ military students at Derby High School. - Brian Ball, Derby North teacher, $300 to fund materials to teach classes how to make bricks. 10. Cooper Elementary received a $500 Kansas Book Festival Grant. Challenges: Derby Public Schools continues to face challenges to ensure all of our students are successful. The District implemented a five-year strategic plan which was adopted by the Board of Education on July 9, 2012. This plan is designed to achieve four objectives that are: 1. 100% of our students will graduate.
5
2. All students will be reading at or above grade level by the end of 3rd grade. 3. Each of our students will score at meets standards or above on state assessments. 4. We will simultaneously improve the achievement of all students while closing the achievement gap. To help obtain these objectives, we have adopted specific strategies. The strategies are: 1. Derby Public School students will be career and college ready. 2. We will provide quality facilities that meet the educational needs of students. 3. To obtain additional funding sources to meet student needs. 4. Technology will deploy and maintain an environment that support district goals and enhances learning opportunities. 5. We will secure and retain highly qualified staff to meet the educational needs of our students.

6
Supplemental Information for the Following Tables 1. Summary of Total Expenditures by Function (All Funds) 2. Summary of General Fund Expenditures by Function 3. Summary of Supplemental General Fund Expenditures by Function 4. Summary of General and Supplemental General Fund Expenditures by Function 5. Summary of Special Education Fund by Function 6. Instruction Expenditures (1000) 7. Student Support Expenditures (2100)
8. Instructional Support Expenditures (2200) 9. General Administration Expenditures (2300) 10. School Administration Expenditures (2400)
11. Central Services Expenditures (2500) 12. Operations and Maintenance Expenditures (2600)
13. Transportation Expenditures (2700) 14. Other Support Services Expenditures (2900)
15. Food Service Expenditures (3100)
16. Community Services Operations (3300) 17. Capital Improvements (4000) 18. Debt Services (5100)
19. Miscellaneous Information – Transfers (5200) 20. Miscellaneous Information Unencumbered Cash Balance by Fund 21. Reserve Funds Unencumbered Cash Balance 22. Other Information – Enrollment Information 23. Miscellaneous Information Mill Rates by Fund 24. Other Information – Assessed Valuation and Bonded Indebtedness
7
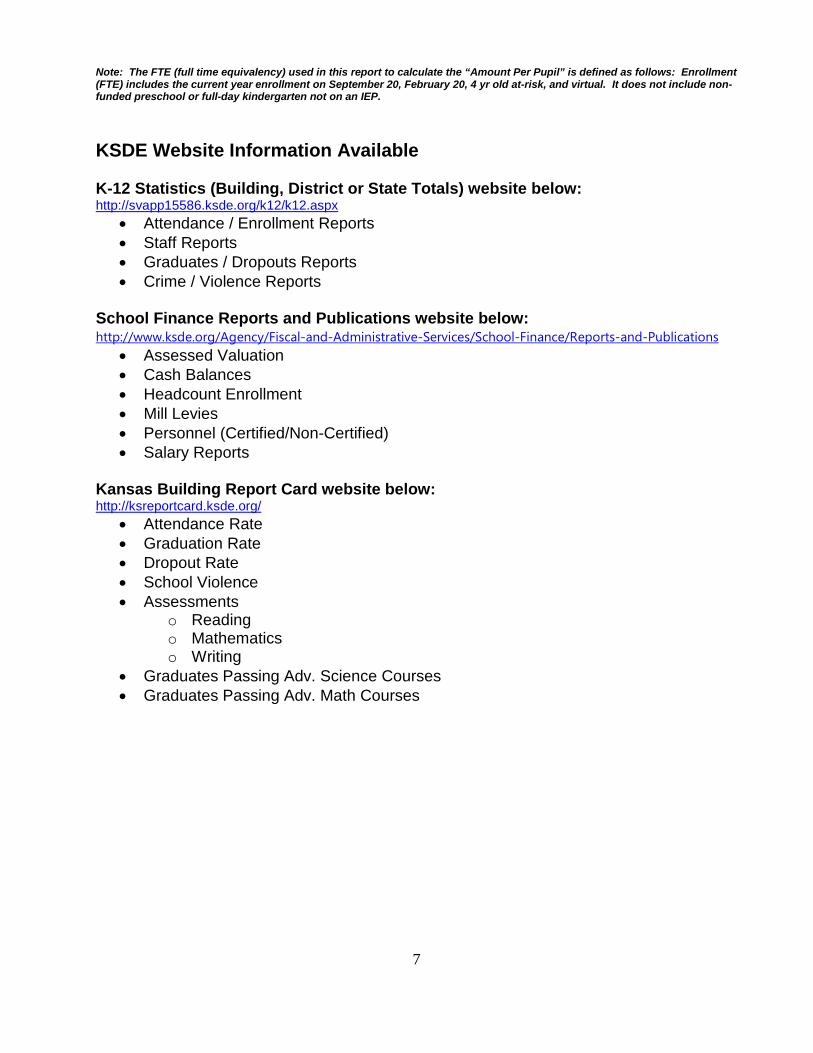
Note: The FTE (full time equivalency) used in this report to calculate the “Amount Per Pupil” is defined as follows: Enrollment (FTE) includes the current year enrollment on September 20, February 20, 4 yr old at-risk, and virtual. It does not include non-funded preschool or full-day kindergarten not on an IEP. KSDE Website Information Available K-12 Statistics (Building, District or State Totals) website below: http://svapp15586.ksde.org/k12/k12.aspx
• Attendance / Enrollment Reports • Staff Reports • Graduates / Dropouts Reports • Crime / Violence Reports
School Finance Reports and Publications website below: http://www.ksde.org/Agency/Fiscal-and-Administrative-Services/School-Finance/Reports-and-Publications
• Assessed Valuation • Cash Balances • Headcount Enrollment • Mill Levies • Personnel (Certified/Non-Certified) • Salary Reports
Kansas Building Report Card website below: http://ksreportcard.ksde.org/
• Attendance Rate • Graduation Rate • Dropout Rate • School Violence • Assessments
o Reading o Mathematics o Writing
• Graduates Passing Adv. Science Courses • Graduates Passing Adv. Math Courses

USD# 260
Summary of Total Expenditures By Function (All Funds)
% % % % %2014-2015 of 2015-2016 of inc/ 2016-2017 of inc/
Actual Tot Actual Tot dec Budget Tot decInstruction 42,903,876 61% 43,010,302 60% 0% 46,435,479 59% 8%Student Support Services 3,847,868 5% 4,073,912 6% 6% 4,542,375 6% 11%Instructional Support Services 1,981,562 3% 1,408,855 2% -29% 1,648,836 2% 17%Administration & Support 4,712,780 7% 4,992,147 7% 6% 5,369,665 7% 8%Operations & Maintenance 7,220,081 10% 8,608,850 12% 19% 7,558,083 10% -12%Transportation 1,319,626 2% 1,457,413 2% 10% 1,639,812 2% 13%Food Services 2,986,526 4% 3,108,893 4% 4% 3,461,996 4% 11%Capital Improvements 936,011 1% 76,618 0% -92% 1,068,900 1% 1295%Debt Services 4,251,395 6% 4,967,594 7% 17% 6,373,606 8% 28%Other Costs 346,393 0% 527,966 1% 52% 380,429 0% -28%
Total Expenditures* 70,506,118 100% 72,232,550 100% 2% 78,479,181 100% 9%
Amount per Pupil $10,934 $11,184 2% $12,106 8%
Current Expenditures** 60,556,529 100% 61,352,844 100% 1% 66,576,682 100% 9%Amount per Pupil $9,391 $9,499 1% $10,270 8%
Instruction*** (Total Expenditures) 40,671,671 58% 41,157,697 57% -1% 43,942,271 56% -1%Instruction*** (Current Expenditures) 40,671,671 67% 41,157,697 67% 0% 43,942,271 66% -1%
Note: Percentages on charts are within +-1% due to rounding used. Pie graph percentages may differ from charts for this reason also.
Further definition of what goes into each category:Instruction - 1000 Transportation - 2700Student Support Services - 2100 Food Service - 3100Instructional Support Services - 2200 Other Costs - 2900 and 3300Administration & Support - 2300, 2400 and 2500 Capital Improvements - 4000Operations & Maintenance - 2600 Debt Services - 5100
Transfers - 5200
Percent of Expenditures
* The funds that are included in the categories above are: General, Supplemental General, Bilingual Education, At Risk(4yr Old), At Risk(K-12), Virtual Education, Capital
Outlay, Driver Education, Extraordinary School Program, Summer School, Special Education, Vocational Education, Professional Development, Bond & Interest #1, Bond &
Interest #2, No-Fund Warrant, Special Assessment, Parent Education, School Retirement, Student Materials Revolving & Textbook Rental, Tuition Reimbursement,
Gifts/Grants, KPERS Special Retirement Contribution, Contingency, Special Liability Expense, Federal Funds, Adult Education, Adult Supplemental Education, Activity Fund
and Special Education Coop Fund.
*** Instruction excludes Capital Outlay and Bond Debt expenditures (Code 16, Code 62, Code 63)
** Current Spending excludes Capital Outlay and Bond Debt expenditures (Code 16, Code 62, Code 63)
05,000,000
10,000,00015,000,00020,000,00025,000,00030,000,00035,000,00040,000,00045,000,00050,000,000
46,435,479
4,542,3751,648,836
5,369,665 7,558,083
1,639,812 3,461,9961,068,900
6,373,606
380,429
Summary of Total Expenditures by Function (All Funds)
2014-2015
2015-2016
2016-2017
Instruction59%
Student Support Services6%
Instructional Support2%
Administration & Support7%
Operations & Maintenance10%
Transportation2%
Food Services4%
Capital Improvements1% Debt Services
8%Other Costs
1%
Summary of Total Expenditures by Function
Instruction
Student Support Services
Instructional Support
Administration & Support
Operations & Maintenance
Transportation
Food Services
Capital Improvements
Debt Services
Other Costs
10/12/2016 8:15 AM Sumexpen.xlsx Page 1 of 31

USD# 260
Summary of General Fund Expendituresby Function
% % % % %2014-2015 of 2015-2016 of inc/ 2016-2017 of inc/
Actual Tot Actual Tot dec Budget Tot dec
Instruction 19,899,538 82% 20,779,041 82% 4% 22,080,746 82% 6%
Student Support 1,796 0% 15,460 0% 761% 0 0% -100%
Instructional Support 21,082 0% 16,775 0% -20% 27,439 0% 64%
Administration & Support 3,140,404 13% 3,379,655 13% 8% 3,512,618 13% 4%
Operations & Maintenance 238,161 1% 220,842 1% -7% 258,483 1% 17%
Transportation 726,853 3% 736,292 3% 1% 832,239 3% 13%
Capital Improvements 0 0% 0 0% 0% 0 0% 0%
Other Costs 156,456 1% 137,403 1% -12% 140,000 1% 2%
Total Expenditures 24,184,290 100% 25,285,468 100% 5% 26,851,525 100% 6%
Amount per Pupil $3,750 $3,915 4% $4,142 6%
The Summary of General Fund Expenditures chart information comes from pages 6-13 and only uses the 'General Fund' line items.
0
5,000,000
10,000,000
15,000,000
20,000,000
25,000,000
Instruction StudentSupport
InstructionalSupport
Administration& Support
Operations &Maintenance
Transportation CapitalImprovements
Other Costs
22,080,746
0 27,439
3,512,618
258,483832,239
0 140,000
Summary of General Fund Expenditures
2014-2015
2015-2016
2016-2017
Instruction82%
Administration & Support13%
Operations & Maintenance
1%
Transportation3%
Other Costs1%
Summary of General Fund Expenditures by Function
Instruction
Student Support
Instructional Support
Administration & Support
Operations & Maintenance
Transportation
Capital Improvements
Other Costs
10/12/2016 8:15 AM Sumexpen.xlsx Page 2 of 31

USD# 260
Summary of Supplemental General Fund Expendituresby Function
% % % % %2014-2015 of 2015-2016 of inc/ 2016-2017 of inc/
Actual Tot Actual Tot dec Budget Tot dec
Instruction 2,520,772 24% 3,172,616 29% 26% 2,583,176 24% -19%
Student Support 1,312,090 12% 1,416,645 13% 8% 1,464,334 14% 3%
Instructional Support 1,525,458 14% 1,100,118 10% -28% 1,214,083 11% 10%
Administration & Support 1,004,402 10% 1,023,024 9% 2% 1,093,184 10% 7%
Operations & Maintenance 4,160,318 40% 4,367,731 39% 5% 4,272,798 40% -2%
Transportation 8,447 0% 3,332 0% -61% 3,440 0% 3%
Capital Improvements 0 0% 0 0% 0% 0 0% 0%
Other Costs 553 0% 23,323 0% 4118% 25,383 0% 9%
Total Expenditures 10,532,040 100% 11,106,789 100% 5% 10,656,398 100% -4%
Amount per Pupil $1,633 $1,720 5% $1,644 -4%
The Summary of Supplemental General Fund Expenditures chart information comes from pages 6-13 and only uses the 'Supplemental
General Fund' line items.
0
500,000
1,000,000
1,500,000
2,000,000
2,500,000
3,000,000
3,500,000
4,000,000
4,500,000
Instruction StudentSupport
InstructionalSupport
Administration& Support
Operations &Maintenance
Transportation CapitalImprovements
Other Costs
2,583,176
1,464,3341,214,083
1,093,184
4,272,798
3,440 0 25,383
Summary of Supplemental General Expenditures by Function
2014-2015
2015-2016
2016-2017
Instruction24%
Student Support14%
Instructional Support12%
Administration & Support10%
Operations & Maintenance
40%
Summary of Supplemental General Fund Expenditures by Function
Instruction
Student Support
Instructional Support
Administration & Support
Operations & Maintenance
Transportation
Capital Improvements
Other Costs
10/12/2016 8:15 AM Sumexpen.xlsx Page 3 of 31
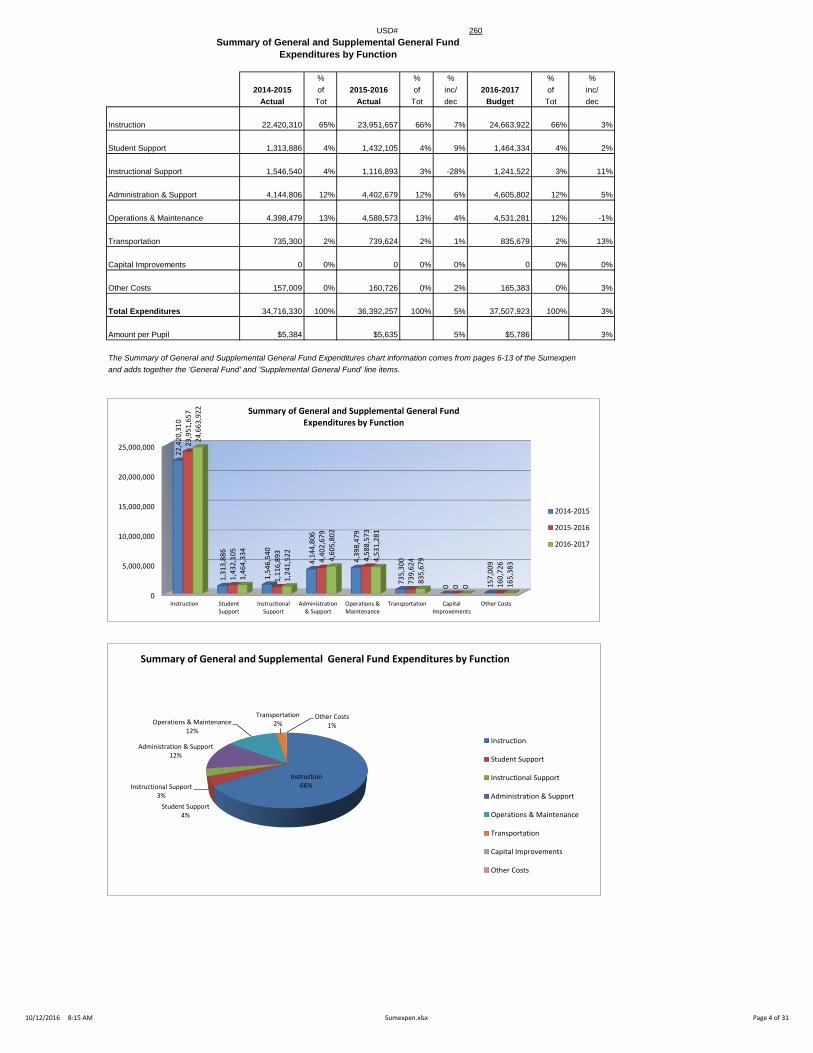
USD# 260Summary of General and Supplemental General Fund
Expenditures by Function
% % % % %2014-2015 of 2015-2016 of inc/ 2016-2017 of inc/
Actual Tot Actual Tot dec Budget Tot dec
Instruction 22,420,310 65% 23,951,657 66% 7% 24,663,922 66% 3%
Student Support 1,313,886 4% 1,432,105 4% 9% 1,464,334 4% 2%
Instructional Support 1,546,540 4% 1,116,893 3% -28% 1,241,522 3% 11%
Administration & Support 4,144,806 12% 4,402,679 12% 6% 4,605,802 12% 5%
Operations & Maintenance 4,398,479 13% 4,588,573 13% 4% 4,531,281 12% -1%
Transportation 735,300 2% 739,624 2% 1% 835,679 2% 13%
Capital Improvements 0 0% 0 0% 0% 0 0% 0%
Other Costs 157,009 0% 160,726 0% 2% 165,383 0% 3%
Total Expenditures 34,716,330 100% 36,392,257 100% 5% 37,507,923 100% 3%
Amount per Pupil $5,384 $5,635 5% $5,786 3%
The Summary of General and Supplemental General Fund Expenditures chart information comes from pages 6-13 of the Sumexpen
and adds together the 'General Fund' and 'Supplemental General Fund' line items.
0
5,000,000
10,000,000
15,000,000
20,000,000
25,000,000
Instruction StudentSupport
InstructionalSupport
Administration& Support
Operations &Maintenance
Transportation CapitalImprovements
Other Costs
22
,42
0,3
10
1,3
13
,88
6
1,5
46
,54
0
4,1
44
,80
6
4,3
98
,47
9
73
5,3
00
0 15
7,0
09
23
,95
1,6
57
1,4
32
,10
5
1,1
16
,89
3
4,4
02
,67
9
4,5
88
,57
3
73
9,6
24
0 16
0,7
26
24
,66
3,9
22
1,4
64
,33
4
1,2
41
,52
2
4,6
05
,80
2
4,5
31
,28
1
83
5,6
79
0 16
5,3
83
Summary of General and Supplemental General FundExpenditures by Function
2014-2015
2015-2016
2016-2017
Instruction66%
Student Support4%
Instructional Support3%
Administration & Support12%
Operations & Maintenance12%
Transportation2%
Other Costs1%
Summary of General and Supplemental General Fund Expenditures by Function
Instruction
Student Support
Instructional Support
Administration & Support
Operations & Maintenance
Transportation
Capital Improvements
Other Costs
10/12/2016 8:15 AM Sumexpen.xlsx Page 4 of 31

USD# 260
Summary of Special Education Fundby Function
% % % % %2014-2015 of 2015-2016 of inc/ 2016-2017 of inc/
Actual Tot Actual Tot dec Budget Tot dec
Instruction 6,927,840 72% 6,942,272 72% 0% 7,284,870 70% 5%
Student Support 2,017,304 21% 2,071,789 21% 3% 2,367,893 23% 14%
Instructional Support 3,706 0% 3,746 0% 1% 4,000 0% 7%
Administraton & Support 192,605 2% 213,367 2% 11% 235,861 2% 11%
Operations & Maintenance 0 0% 0 0% 0% 0 0% 0%
Transportation 473,701 5% 467,608 5% -1% 516,713 5% 11%
Capital Improvements 0 0% 0 0% 0% 0 0% 0%
Other Costs 0 0% 0 0% 0% 0 0% 0%
Total Expenditures 9,615,156 100% 9,698,782 100% 1% 10,409,337 100% 7%
Amount per Pupil $1,491 $1,502 1% $1,606 7%
The Summary of Special Education Fund Expenditures chart information comes from pages 6-13 and only uses the 'Special Education Fund'
line items. (Total expenditures excludes Special Ed Coop Fund because it would include expenditures for all schools participating in the Coop.)
0
1,000,000
2,000,000
3,000,000
4,000,000
5,000,000
6,000,000
7,000,000
8,000,000
Instruction StudentSupport
InstructionalSupport
Administraton& Support
Operations &Maintenance
Transportation CapitalImprovements
Other Costs
6,9
27
,84
0
2,0
17
,30
4
3,7
06
19
2,6
05
0
47
3,7
01
0 0
6,9
42
,27
2
2,0
71
,78
9
3,7
46
21
3,3
67
0
46
7,6
08
0 0
7,2
84
,87
0
2,3
67
,89
3
4,0
00
23
5,8
61
0
51
6,7
13
0 0
Summary of Special Education Fund Expenditures by Function
2014-2015
2015-2016
2016-2017
Instruction70%
Student Support23%
Administraton & Support2%
Transportation5%
Summary of Special Education Fund by Function
Instruction
Student Support
Instructional Support
Administraton & Support
Operations & Maintenance
Transportation
Capital Improvements
Other Costs
10/12/2016 8:15 AM Sumexpen.xlsx Page 5 of 31
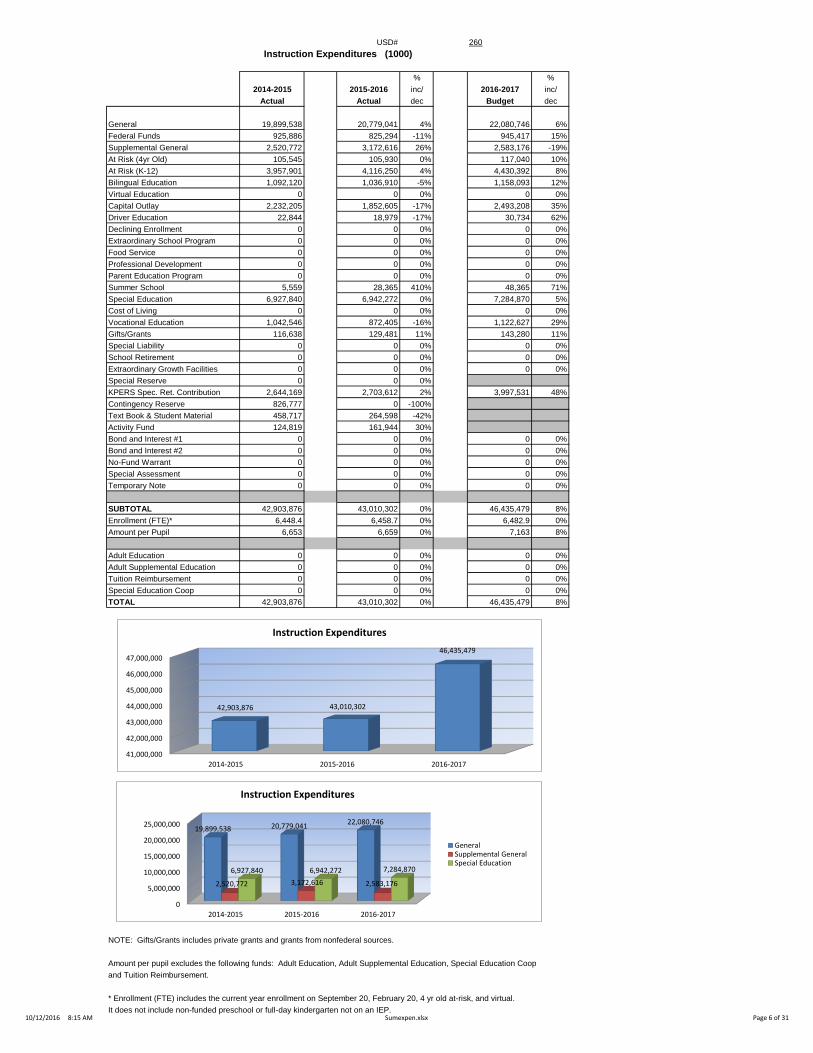
USD# 260Instruction Expenditures (1000)
% %2014-2015 2015-2016 inc/ 2016-2017 inc/
Actual Actual dec Budget dec
General 19,899,538 20,779,041 4% 22,080,746 6%Federal Funds 925,886 825,294 -11% 945,417 15%Supplemental General 2,520,772 3,172,616 26% 2,583,176 -19%At Risk (4yr Old) 105,545 105,930 0% 117,040 10%At Risk (K-12) 3,957,901 4,116,250 4% 4,430,392 8%Bilingual Education 1,092,120 1,036,910 -5% 1,158,093 12%Virtual Education 0 0 0% 0 0%Capital Outlay 2,232,205 1,852,605 -17% 2,493,208 35%Driver Education 22,844 18,979 -17% 30,734 62%Declining Enrollment 0 0 0% 0 0%Extraordinary School Program 0 0 0% 0 0%Food Service 0 0 0% 0 0%Professional Development 0 0 0% 0 0%Parent Education Program 0 0 0% 0 0%Summer School 5,559 28,365 410% 48,365 71%Special Education 6,927,840 6,942,272 0% 7,284,870 5%Cost of Living 0 0 0% 0 0%Vocational Education 1,042,546 872,405 -16% 1,122,627 29%Gifts/Grants 116,638 129,481 11% 143,280 11%Special Liability 0 0 0% 0 0%School Retirement 0 0 0% 0 0%Extraordinary Growth Facilities 0 0 0% 0 0%Special Reserve 0 0 0%KPERS Spec. Ret. Contribution 2,644,169 2,703,612 2% 3,997,531 48%Contingency Reserve 826,777 0 -100%Text Book & Student Material 458,717 264,598 -42%Activity Fund 124,819 161,944 30%Bond and Interest #1 0 0 0% 0 0%Bond and Interest #2 0 0 0% 0 0%No-Fund Warrant 0 0 0% 0 0%Special Assessment 0 0 0% 0 0%Temporary Note 0 0 0% 0 0%
SUBTOTAL 42,903,876 43,010,302 0% 46,435,479 8%Enrollment (FTE)* 6,448.4 6,458.7 0% 6,482.9 0%Amount per Pupil 6,653 6,659 0% 7,163 8%
Adult Education 0 0 0% 0 0%Adult Supplemental Education 0 0 0% 0 0%Tuition Reimbursement 0 0 0% 0 0%Special Education Coop 0 0 0% 0 0%TOTAL 42,903,876 43,010,302 0% 46,435,479 8%
NOTE: Gifts/Grants includes private grants and grants from nonfederal sources.
Amount per pupil excludes the following funds: Adult Education, Adult Supplemental Education, Special Education Coopand Tuition Reimbursement.
* Enrollment (FTE) includes the current year enrollment on September 20, February 20, 4 yr old at-risk, and virtual. It does not include non-funded preschool or full-day kindergarten not on an IEP.
0
5,000,000
10,000,000
15,000,000
20,000,000
25,000,000
2014-2015 2015-2016 2016-2017
19,899,538 20,779,04122,080,746
2,520,772 3,172,616 2,583,176
6,927,840 6,942,272 7,284,870
Instruction Expenditures
GeneralSupplemental GeneralSpecial Education
41,000,000
42,000,000
43,000,000
44,000,000
45,000,000
46,000,000
47,000,000
2014-2015 2015-2016 2016-2017
42,903,876 43,010,302
46,435,479
Instruction Expenditures
10/12/2016 8:15 AM Sumexpen.xlsx Page 6 of 31

USD# 260
Student Support Expenditures (2100)
% %2014-2015 2015-2016 inc/ 2016-2017 inc/
Actual Actual dec Budget dec
General 1,796 15,460 761% 0 -100%Federal Funds 35,484 75,371 112% 81,057 8%Supplemental General 1,312,090 1,416,645 8% 1,464,334 3%At Risk (4yr Old) 0 0 0% 0 0%At Risk (K-12) 0 3,725 0% 0 -100%Bilingual Education 0 0 0% 0 0%Virtual Education 0 0 0% 0 0%Capital Outlay 1,676 2,802 67% 0 -100%Driver Training 0 0 0% 0 0%Declining Enrollment 0 0 0% 0 0%Extraordinary School Program 0 0 0% 0 0%Food Service 0 0 0% 0 0%Professional Development 0 0 0% 0 0%Parent Education Program 241,066 224,000 -7% 243,325 9%Summer School 0 0 0% 0 0%Special Education 2,017,304 2,071,789 3% 2,367,893 14%Cost of Living 0 0 0% 0 0%Vocational Education 0 0 0% 0 0%Gifts/Grants 2,448 2,369 -3% 2,548 8%Special Liability 0 0 0% 0 0%School Retirement 0 0 0% 0 0%Extraordinary Growth Facilities 0 0 0% 0 0%Special Reserve 0 0 0%KPERS Spec. Ret. Contribution 228,868 261,751 14% 383,218 46%Contingency Reserve 7,136 0 -100%Text Book & Student Material 0 0 0%Activity Fund 0 0 0%Bond and Interest #1 0 0 0% 0 0%Bond and Interest #2 0 0 0% 0 0%No-Fund Warrant 0 0 0% 0 0%Special Assessment 0 0 0% 0 0%Temporary Note 0 0 0% 0 0%
SUBTOTAL 3,847,868 4,073,912 6% 4,542,375 11%Enrollment (FTE)* 6,448.4 6,458.7 0% 6,482.9 0%Amount per Pupil 597 631 6% 701 11%
Adult Education 0 0 0% 0 0%Adult Supplemental Education 0 0 0% 0 0%Tuition Reimbursement 0 0 0% 0 0%Special Education Coop 0 0 0% 0 0%TOTAL 3,847,868 4,073,912 6% 4,542,375 11%
NOTE: Gifts/Grants includes private grants and grants from nonfederal sources.
Amount per pupil excludes the following funds: Adult Education, Adult Supplemental Education, Special Education Coopand Tuition Reimbursement.
* Enrollment (FTE) includes the current year enrollment on September 20, February 20, 4 yr old at-risk, and virtual. It does not include non-funded preschool or full-day kindergarten not on an IEP.
3,400,000
3,600,000
3,800,000
4,000,000
4,200,000
4,400,000
4,600,000
2014-2015 2015-2016 2016-2017
3,847,868
4,073,912
4,542,375
Student Support Expenditures
10/12/2016 8:15 AM Sumexpen.xlsx Page 7 of 31

USD# 260
Instructional Support Expenditures (2200)
% %2014-2015 2015-2016 inc/ 2016-2017 inc/
Actual Actual dec Budget dec
General 21,082 16,775 -20% 27,439 64%Federal Funds 223,690 129,275 -42% 193,908 50%Supplemental General 1,525,458 1,100,118 -28% 1,214,083 10%At Risk (4yr Old) 0 0 0% 0 0%At Risk (K-12) 0 0 0% 0 0%Bilingual Education 0 0 0% 0 0%Virtual Education 0 0 0% 0 0%Capital Outlay 561 426 -24% 0 -100%Driver Training 0 0 0% 0 0%Declining Enrollment 0 0 0% 0 0%Extraordinary School Program 0 0 0% 0 0%Food Service 0 0 0% 0 0%Professional Development 125,000 89,686 -28% 125,000 39%Parent Education Program 0 0 0% 0 0%Summer School 0 0 0% 0 0%Special Education 3,706 3,746 1% 4,000 7%Cost of Living 0 0 0% 0 0%Vocational Education 0 0 0% 0 0%Gifts/Grants 2,675 0 -100% 0 0%Special Liability 0 0 0% 0 0%School Retirement 0 0 0% 0 0%Extraordinary Growth Facilities 0 0 0% 0 0%Special Reserve 0 0 0%KPERS Spec. Ret. Contribution 75,329 68,829 -9% 84,406 23%Contingency Reserve 4,061 0 -100%Text Book & Student Material 0 0 0%Activity Fund 0 0 0%Bond and Interest #1 0 0 0% 0 0%Bond and Interest #2 0 0 0% 0 0%No-Fund Warrant 0 0 0% 0 0%Special Assessment 0 0 0% 0 0%Temporary Note 0 0 0% 0 0%
SUBTOTAL 1,981,562 1,408,855 -29% 1,648,836 17%Enrollment (FTE)* 6,448.4 6,458.7 0% 6,482.9 0%Amount per Pupil 307 218 -29% 254 17%
Adult Education 0 0 0% 0 0%Adult Supplemental Education 0 0 0% 0 0%Tuition Reimbursement 0 0 0% 0 0%Special Education Coop 0 0 0% 0 0%TOTAL 1,981,562 1,408,855 -29% 1,648,836 17%
NOTE: Gifts/Grants includes private grants and grants from nonfederal sources.
Amount per pupil excludes the following funds: Adult Education, Adult Supplemental Education, Special Education Coopand Tuition Reimbursement.
* Enrollment (FTE) includes the current year enrollment on September 20, February 20, 4 yr old at-risk, and virtual. It does not include non-funded preschool or full-day kindergarten not on an IEP.
0
200,000
400,000
600,000
800,000
1,000,000
1,200,000
1,400,000
1,600,000
1,800,000
2,000,000
2014-2015 2015-2016 2016-2017
1,981,562
1,408,855
1,648,836
Instructional Support Expenditures
10/12/2016 8:15 AM Sumexpen.xlsx Page 8 of 31

USD# 260
General Administration Expenditures (2300)
% %2014-2015 2015-2016 inc/ 2016-2017 inc/
Actual Actual dec Budget dec
General 4,067 2,365 -42% 0 -100%Federal Funds 6,657 3,031 -54% 7,500 147%Supplemental General 711,678 731,640 3% 775,692 6%At Risk (4yr Old) 0 0 0% 0 0%At Risk (K-12) 0 0 0% 0 0%Bilingual Education 0 0 0% 0 0%Virtual Education 0 0 0% 0 0%Capital Outlay 4,883 2,373 -51% 0 -100%Driver Training 0 0 0% 0 0%Declining Enrollment 0 0 0% 0 0%Extraordinary School Program 0 0 0% 0 0%Food Service 0 0 0% 0 0%Professional Development 0 0 0% 0 0%Parent Education Program 0 0 0% 0 0%Summer School 0 0 0% 0 0%Special Education 192,605 213,367 11% 235,861 11%Cost of Living 0 0 0% 0 0%Vocational Education 0 0 0% 0 0%Gifts/Grants 0 0 0% 0 0%Special Liability Expense 0 0 0% 0 0%School Retirement 0 0 0% 0 0%Extraordinary Growth Facilities 0 0 0% 0 0%Special Reserve 0 0 0%KPERS Spec. Ret. Contribution 44,143 57,134 29% 71,227 25%Contingency Reserve 4,384 0 -100%Text Book & Student Material 0 0 0%Activity Fund 0 0 0%Bond and Interest #1 0 0 0% 0 0%Bond and Interest #2 0 0 0% 0 0%No-Fund Warrant 0 0 0% 0 0%Special Assessment 0 0 0% 0 0%Temporary Note 0 0 0% 0 0%
SUBTOTAL 968,417 1,009,910 4% 1,090,280 8%Enrollment (FTE)* 6,448.4 6,458.7 0% 6,482.9 0%Amount per Pupil 150 156 4% 168 8%
Adult Education 0 0 0% 0 0%Adult Supplemental Education 0 0 0% 0 0%Tuition Reimbursement 0 0 0% 0 0%Special Education Coop 0 0 0% 0 0%TOTAL 968,417 1,009,910 4% 1,090,280 8%
NOTE: Gifts/Grants includes private grants and grants from nonfederal sources.
Amount per pupil excludes the following funds: Adult Education, Adult Supplemental Education, Special Education Coopand Tuition Reimbursement.
* Enrollment (FTE) includes the current year enrollment on September 20, February 20, 4 yr old at-risk, and virtual. It does not include non-funded preschool or full-day kindergarten not on an IEP.
900,000
920,000
940,000
960,000
980,000
1,000,000
1,020,000
1,040,000
1,060,000
1,080,000
1,100,000
2014-2015 2015-2016 2016-2017
968,417
1,009,910
1,090,280
General Administration Expenditures
10/12/2016 8:15 AM Sumexpen.xlsx Page 9 of 31

USD# 260
School Administration Expenditures (2400)
% %2014-2015 2015-2016 inc/ 2016-2017 inc/
Actual Actual dec Budget dec
General 2,638,395 2,778,221 5% 2,883,621 4%Federal Funds 0 0 0% 0 0%Supplemental General 161,651 150,637 -7% 169,157 12%At Risk (4yr Old) 0 0 0% 0 0%At Risk (K-12) 0 0 0% 0 0%Bilingual Education 0 0 0% 0 0%Virtual Education 0 0 0% 0 0%Capital Outlay 31,404 25,273 -20% 0 -100%Driver Training 0 0 0% 0 0%Declining Enrollment 0 0 0% 0 0%Extraordinary School Program 0 0 0% 0 0%Food Service 0 0 0% 0 0%Professional Development 0 0 0% 0 0%Parent Education Program 0 0 0% 0 0%Summer School 0 0 0% 0 0%Special Education 0 0 0% 0 0%Cost of Living 0 0 0% 0 0%Vocational Education 0 0 0% 0 0%Gifts/Grants 0 0 0% 0 0%Special Liability Expense 0 0 0% 0 0%School Retirement 0 0 0% 0 0%Extraordinary Growth Facilities 0 0 0% 0 0%Special Reserve 0 0 0%KPERS Spec. Ret. Contribution 208,712 214,449 3% 339,910 59%Contingency Reserve 10,513 0 -100%Text Book & Student Material 0 0 0%Activity Fund 0 0 0%Bond and Interest #1 0 0 0% 0 0%Bond and Interest #2 0 0 0% 0 0%No-Fund Warrant 0 0 0% 0 0%Special Assessment 0 0 0% 0 0%Temporary Note 0 0 0% 0 0%
SUBTOTAL 3,050,675 3,168,580 4% 3,392,688 7%Enrollment (FTE)* 6,448.4 6,458.7 0% 6,482.9 0%Amount per Pupil 473 491 4% 523 7%
Adult Education 0 0 0% 0 0%Adult Supplemental Education 0 0 0% 0 0%Tuition Reimbursement 0 0 0% 0 0%Special Education Coop 0 0 0% 0 0%TOTAL 3,050,675 3,168,580 4% 3,392,688 7%
NOTE: Gifts/Grants includes private grants and grants from nonfederal sources.
Amount per pupil excludes the following funds: Adult Education, Adult Supplemental Education, Special Education Coopand Tuition Reimbursement.
* Enrollment (FTE) includes the current year enrollment on September 20, February 20, 4 yr old at-risk, and virtual. It does not include non-funded preschool or full-day kindergarten not on an IEP.
2,800,000
2,900,000
3,000,000
3,100,000
3,200,000
3,300,000
3,400,000
2014-2015 2015-2016 2016-2017
3,050,675
3,168,580
3,392,688
School Administration Expenditures
10/12/2016 8:15 AM Sumexpen.xlsx Page 10 of 31

USD# 260
Central Services Expenditures (2500)
% %2014-2015 2015-2016 inc/ 2016-2017 inc/
Actual Actual dec Budget dec
General 497,942 599,069 20% 628,997 5%Federal Funds 0 0 0% 0 0%Supplemental General 131,073 140,747 7% 148,335 5%At Risk (4yr Old) 0 0 0% 0 0%At Risk (K-12) 0 0 0% 0 0%Bilingual Education 0 0 0% 0 0%Virtual Education 0 0 0% 0 0%Capital Outlay 6,371 7,108 12% 45,000 533%Driver Training 0 0 0% 0 0%Declining Enrollment 0 0 0% 0 0%Extraordinary School Program 0 0 0% 0 0%Food Service 0 0 0% 0 0%Professional Development 0 0 0% 0 0%Parent Education Program 3,316 3,316 0% 3,316 0%Summer School 0 0 0% 0 0%Special Education 0 0 0% 0 0%Cost of Living 0 0 0% 0 0%Vocational Education 0 0 0% 0 0%Gifts/Grants 0 0 0% 0 0%Special Liability 0 0 0% 0 0%School Retirement 0 0 0% 0 0%Extraordinary Growth Facilities 0 0 0% 0 0%Special Reserve 0 0 0%KPERS Spec. Ret. Contribution 25,427 58,985 132% 61,049 3%Contingency Reserve 29,559 4,432 -85%Text Book & Student Material 0 0 0%Activity Fund 0 0 0%Bond & Interest #1 0 0 0% 0 0%Bond & Interest #2 0 0 0% 0 0%No-Fund Warrant 0 0 0% 0 0%Special Assessment 0 0 0% 0 0%Temporary Note 0 0 0% 0 0%
SUBTOTAL 693,688 813,657 17% 886,697 9%Enrollment (FTE)* 6,448.4 6,458.7 0% 6,482.9 0%Amount per Pupil 108 126 17% 137 9%
Adult Education 0 0 0% 0 0%Adult Supplemental Education 0 0 0% 0 0%Tuition Reimbursement 0 0 0% 0 0%Special Education Coop 0 0 0% 0 0%TOTAL 693,688 813,657 17% 886,697 9%
NOTE: Gifts/Grants includes private grants and grants from nonfederal sources.
Amount per pupil excludes the following funds: Adult Education, Adult Supplemental Education, Special Education Coopand Tuition Reimbursement.
* Enrollment (FTE) includes the current year enrollment on September 20, February 20, 4 yr old at-risk, and virtual. It does not include non-funded preschool or full-day kindergarten not on an IEP.
0
100,000
200,000
300,000
400,000
500,000
600,000
700,000
800,000
900,000
2014-2015 2015-2016 2016-2017
693,688
813,657
886,697
Central Services Expenditures
10/12/2016 8:15 AM Sumexpen.xlsx Page 11 of 31

USD# 260
Operations and Maintenance Expenditures (2600)
% %2014-2015 2015-2016 inc/ 2016-2017 inc/
Actual Actual dec Budget dec
General 238,161 220,842 -7% 258,483 17%Federal Funds 0 0 0% 0 0%Supplemental General 4,160,318 4,367,731 5% 4,272,798 -2%At Risk (4yr Old) 0 0 0% 0 0%At Risk (K-12) 175 0 -100% 0 0%Bilingual Education 0 0 0% 0 0%Virtual Education 0 0 0% 0 0%Capital Outlay 2,485,349 3,796,410 53% 2,771,385 -27%Driver Training 1,328 3,665 176% 8,950 144%Declining Enrollment 0 0 0% 0 0%Extraordinary School Program 0 0 0% 0 0%Food Service 18,967 9,047 -52% 36,064 299%Professional Development 0 0 0% 0 0%Parent Education Program 0 0 0% 0 0%Summer School 913 1,465 60% 0 -100%Special Education 0 0 0% 0 0%Cost of Living 0 0 0% 0 0%Vocational Education 0 0 0% 0 0%Gifts/Grants 130,936 6,402 -95% 0 -100%Special Liability 0 0 0% 0 0%School Retirement 0 0 0% 0 0%Extraordinary Growth Facilities 0 0 0% 0 0%Special Reserve 0 0 0%KPERS Spec. Ret. Contribution 183,284 203,288 11% 210,403 3%Contingency Reserve 650 0 -100%Text Book & Student Material 0 0 0%Activity Fund 0 0 0%Bond and Interest #1 0 0 0% 0 0%Bond and Interest #2 0 0 0% 0 0%No-Fund Warrant 0 0 0% 0 0%Special Assessment 0 0 0% 0 0%Temporary Note 0 0 0% 0 0%
SUBTOTAL 7,220,081 8,608,850 19% 7,558,083 -12%Enrollment (FTE)* 6,448.4 6,458.7 0% 6,482.9 0%Amount per Pupil 1,120 1,333 19% 1,166 -13%
Adult Education 0 0 0% 0 0%Adult Supplemental Education 0 0 0% 0 0%Tuition Reimbursement 0 0 0% 0 0%Special Education Coop 0 0 0% 0 0%TOTAL 7,220,081 8,608,850 19% 7,558,083 -12%
NOTE: Gifts/Grants includes private grants and grants from nonfederal sources.
Amount per pupil excludes the following funds: Adult Education, Adult Supplemental Education, Special Education Coopand Tuition Reimbursement.
* Enrollment (FTE) includes the current year enrollment on September 20, February 20, 4 yr old at-risk, and virtual. It does not include non-funded preschool or full-day kindergarten not on an IEP.
6,500,000
7,000,000
7,500,000
8,000,000
8,500,000
9,000,000
2014-2015 2015-2016 2016-2017
7,220,081
8,608,850
7,558,083
Operations and Maintenance Expenditures
10/12/2016 8:15 AM Sumexpen.xlsx Page 12 of 31

USD# 260
Transportation Expenditures (2700)
% %2014-2015 2015-2016 inc/ 2016-2017 inc/
Actual Actual dec Budget dec
General 726,853 736,292 1% 832,239 13%Federal Funds 184 0 -100% 0 0%Supplemental General 8,447 3,332 -61% 3,440 3%At Risk (4yr Old) 0 0 0% 0 0%At Risk (K-12) 313 3,019 865% 0 -100%Bilingual Education 0 0 0% 0 0%Virtual Education 0 0 0% 0 0%Capital Outlay 9,973 147,771 1382% 160,000 8%Driver Training 0 0 0% 0 0%Declining Enrollment 0 0 0% 0 0%Extraordinary School Program 0 0 0% 0 0%Food Service 0 0 0% 0 0%Professional Development 0 0 0% 0 0%Parent Education Program 0 0 0% 0 0%Summer School 0 0 0% 0 0%Special Education 473,701 467,608 -1% 516,713 11%Cost of Living 0 0 0% 0 0%Vocational Education 30,584 21,532 -30% 31,450 46%Gifts/Grants 0 0 0% 0 0%Special Liability 0 0 0% 0 0%School Retirement 0 0 0% 0 0%Extraordinary Growth Facilities 0 0 0% 0 0%Special Reserve 0 0 0%KPERS Spec. Ret. Contribution 69,571 77,859 12% 95,970 23%Contingency Reserve 0 0 0%Text Book & Student Material 0 0 0%Activity Fund 0 0 0%Bond and Interest #1 0 0 0% 0 0%Bond and Interest #2 0 0 0% 0 0%No-Fund Warrant 0 0 0% 0 0%Special Assessment 0 0 0% 0 0%Temporary Note 0 0 0% 0 0%
SUBTOTAL 1,319,626 1,457,413 10% 1,639,812 13%Enrollment (FTE)* 6,448.4 6,458.7 0% 6,482.9 0%Amount per Pupil 205 226 10% 253 12%
Adult Education 0 0 0% 0 0%Adult Supplemental Education 0 0 0% 0 0%Tuition Reimbursement 0 0 0% 0 0%Special Education Coop 0 0 0% 0 0%TOTAL 1,319,626 1,457,413 10% 1,639,812 13%
NOTE: Gifts/Grants includes private grants and grants from nonfederal sources.
Amount per pupil excludes the following funds: Adult Education, Adult Supplemental Education, Special Education Coopand Tuition Reimbursement.
* Enrollment (FTE) includes the current year enrollment on September 20, February 20, 4 yr old at-risk, and virtual. It does not include non-funded preschool or full-day kindergarten not on an IEP.
0
200,000
400,000
600,000
800,000
1,000,000
1,200,000
1,400,000
1,600,000
1,800,000
2014-2015 2015-2016 2016-2017
1,319,626
1,457,413
1,639,812
Transportation Expenditures
10/12/2016 8:15 AM Sumexpen.xlsx Page 13 of 31

USD# 260
Other Support Services Expenditures (2900)
% %2014-2015 2015-2016 inc/ 2016-2017 inc/
Actual Actual dec Budget dec
General 138,904 131,233 -6% 155,746 19%Federal Funds 0 0 0% 0 0%Supplemental General 553 23,323 4118% 25,383 9%At Risk (4yr Old) 0 0 0% 0 0%At Risk (K-12) 0 0 0% 0 0%Bilingual Education 0 0 0% 0 0%Virtual Education 0 0 0% 0 0%Capital Outlay 50,360 70,059 39% 59,300 -15%Driver Training 0 0 0% 0 0%Declining Enrollment 0 0 0% 0 0%Extraordinary School Program 0 0 0% 0 0%Food Service 0 0 0% 0 0%Professional Development 0 0 0% 0 0%Parent Education Program 0 0 0% 0 0%Summer School 0 0 0% 0 0%Special Education 0 0 0% 0 0%Cost of Living 0 0 0% 0 0%Vocational Education 0 0 0% 0 0%Gifts/Grants 0 3,911 0% 0 -100%Special Liability 0 0 0% 0 0%School Retirement 0 0 0% 0 0%Extraordinary Growth Facilities 0 0 0% 0 0%Special Reserve 0 0 0%KPERS Spec. Ret. Contribution 0 0 0% 0 0%Contingency Reserve 120 162,037 ######Text Book & Student Material 0 0 0%Activity Fund 0 0 0%Bond and Interest #1 0 0 0% 0 0%Bond and Interest #2 0 0 0% 0 0%No-Fund Warrant 0 0 0% 0 0%Special Assessment 0 0 0% 0 0%Temporary Note 0 0 0% 0 0%
SUBTOTAL 189,937 390,563 106% 240,429 -38%Enrollment (FTE)* 6,448.4 6,458.7 0% 6,482.9 0%Amount per Pupil 29 60 105% 37 -39%
Adult Education 0 0 0% 0 0%Adult Supplemental Education 0 0 0% 0 0%Tuition Reimbursement 0 0 0% 0 0%Special Education Coop 0 0 0% 0 0%TOTAL 189,937 390,563 106% 240,429 -38%
NOTE: Gifts/Grants includes private grants and grants from nonfederal sources.
Amount per pupil excludes the following funds: Adult Education, Adult Supplemental Education, Special Education Coopand Tuition Reimbursement.
* Enrollment (FTE) includes the current year enrollment on September 20, February 20, 4 yr old at-risk, and virtual. It does not include non-funded preschool or full-day kindergarten not on an IEP.
0
50,000
100,000
150,000
200,000
250,000
300,000
350,000
400,000
2014-2015 2015-2016 2016-2017
189,937
390,563
240,429
Other Support Services Expenditures
10/12/2016 8:15 AM Sumexpen.xlsx Page 14 of 31

USD# 260
Food Services Expenditures (3100)
% %2014-2015 2015-2016 inc/ 2016-2017 inc/
Actual Actual dec Budget dec
General 0 0 0% 0 0%Federal Funds 0 0 0% 0 0%Supplemental General 0 0 0% 0 0%At Risk (4yr Old) 0 0 0% 0 0%At Risk (K-12) 0 0 0% 0 0%Bilingual Education 0 0 0% 0 0%Virtual Education 0 0 0% 0 0%Capital Outlay 0 0 0% 0 0%Driver Training 0 0 0% 0 0%Declining Enrollment 0 0 0% 0 0%Extraordinary School Program 0 0 0% 0 0%Food Service 2,915,516 3,034,487 4% 3,374,023 11%Professional Development 0 0 0% 0 0%Parent Education Program 0 0 0% 0 0%Summer School 0 0 0% 0 0%Special Education 0 0 0% 0 0%Cost of Living 0 0 0% 0 0%Vocational Education 0 0 0% 0 0%Gifts/Grants 0 0 0% 0 0%Special Liability 0 0 0% 0 0%School Retirement 0 0 0% 0 0%Extraordinary Growth Facilities 0 0 0% 0 0%Special Reserve 0 0 0%KPERS Spec. Ret. Contribution 71,010 74,406 5% 87,973 18%Contingency Reserve 0 0 0%Text Book & Student Material 0 0 0%Activity Fund 0 0 0%Bond and Interest #1 0 0 0% 0 0%Bond and Interest #2 0 0 0% 0 0%No-Fund Warrant 0 0 0% 0 0%Special Assessment 0 0 0% 0 0%Temporary Note 0 0 0% 0 0%
SUBTOTAL 2,986,526 3,108,893 4% 3,461,996 11%Enrollment (FTE)* 6,448.4 6,458.7 0% 6,482.9 0%Amount per Pupil 463 481 4% 534 11%
Adult Education 0 0 0% 0 0%Adult Supplemental Education 0 0 0% 0 0%Tuition Reimbursement 0 0 0% 0 0%Special Education Coop 0 0 0% 0 0%TOTAL 2,986,526 3,108,893 4% 3,461,996 11%
NOTE: Gifts/Grants includes private grants and grants from nonfederal sources.
Amount per pupil excludes the following funds: Adult Education, Adult Supplemental Education, Special Education Coopand Tuition Reimbursement.
* Enrollment (FTE) includes the current year enrollment on September 20, February 20, 4 yr old at-risk, and virtual. It does not include non-funded preschool or full-day kindergarten not on an IEP.
2,700,000
2,800,000
2,900,000
3,000,000
3,100,000
3,200,000
3,300,000
3,400,000
3,500,000
2014-2015 2015-2016 2016-2017
2,986,526
3,108,893
3,461,996
Food Service Expenditures
10/12/2016 8:15 AM Sumexpen.xlsx Page 15 of 31

USD# 260
Community Services Operations (3300)
% %2014-2015 2015-2016 inc/ 2016-2017 inc/
Actual Actual dec Budget dec
General 156,456 137,403 -12% 140,000 2%Federal Funds 0 0 0% 0 0%Supplemental General 0 0 0% 0 0%At Risk (4yr Old) 0 0 0% 0 0%At Risk (K-12) 0 0 0% 0 0%Bilingual Education 0 0 0% 0 0%Virtual Education 0 0 0% 0 0%Capital Outlay 0 0 0% 0 0%Driver Training 0 0 0% 0 0%Declining Enrollment 0 0 0% 0 0%Extraordinary School Program 0 0 0% 0 0%Food Service 0 0 0% 0 0%Professional Development 0 0 0% 0 0%Parent Education Program 0 0 0% 0 0%Summer School 0 0 0% 0 0%Special Education 0 0 0% 0 0%Cost of Living 0 0 0% 0 0%Vocational Education 0 0 0% 0 0%Gifts/Grants 0 0 0% 0 0%Special Liability 0 0 0% 0 0%School Retirement 0 0 0% 0 0%Extraordinary Growth Facilities 0 0 0% 0 0%Special Reserve 0 0 0%KPERS Spec. Ret. Contribution 0 0 0% 0 0%Contingency Reserve 0 0 0%Text Book & Student Material 0 0 0%Activity Fund 0 0 0%Bond and Interest #1 0 0 0% 0 0%Bond and Interest #2 0 0 0% 0 0%No-Fund Warrant 0 0 0% 0 0%Special Assessment 0 0 0% 0 0%Temporary Note 0 0 0% 0 0%
SUBTOTAL 156,456 137,403 -12% 140,000 2%Enrollment (FTE)* 6,448.4 6,458.7 0% 6,482.9 0%Amount per Pupil 24 21 -12% 22 2%
Adult Education 0 0 0% 0 0%Adult Supplemental Education 0 0 0% 0 0%Tuition Reimbursement 0 0 0% 0 0%Special Education Coop 0 0 0% 0 0%TOTAL 156,456 137,403 -12% 140,000 2%
NOTE: Gifts/Grants includes private grants and grants from nonfederal sources.
Amount per pupil excludes the following funds: Adult Education, Adult Supplemental Education, Special Education Coopand Tuition Reimbursement.
* Enrollment (FTE) includes the current year enrollment on September 20, February 20, 4 yr old at-risk, and virtual. It does not include non-funded preschool or full-day kindergarten not on an IEP.
125,000
130,000
135,000
140,000
145,000
150,000
155,000
160,000
2014-2015 2015-2016 2016-2017
156,456
137,403
140,000
Community Services Operations (3300)
10/12/2016 8:15 AM Sumexpen.xlsx Page 16 of 31

USD# 260
Capital Improvements Expenditures (4000)
% %2014-2015 2015-2016 inc/ 2016-2017 inc/
Actual Actual dec Budget dec
General 0 0 0% 0 0%Federal Funds 0 0 0% 0 0%Supplemental General 0 0 0% 0 0%At Risk (4yr Old) 0 0 0% 0 0%At Risk (K-12) 0 0 0% 0 0%Bilingual Education 0 0 0% 0 0%Virtual Education 0 0 0% 0 0%Capital Outlay 875,412 7,285 -99% 0 -100%Driver Training 0 0 0% 0 0%Declining Enrollment 0 0 0% 0 0%Extraordinary School Program 0 0 0% 0 0%Food Service 0 0 0% 0 0%Professional Development 0 0 0% 0 0%Parent Education Program 0 0 0% 0 0%Summer School 0 0 0% 0 0%Special Education 0 0 0% 0 0%Cost of Living 0 0 0% 0 0%Vocational Education 0 0 0% 0 0%Gifts/Grants 0 0 0% 0 0%Special Liability 0 0 0% 0 0%School Retirement 0 0 0% 0 0%Extraordinary Growth Facilities 0 0 0% 0 0%Special Reserve 0 0 0%KPERS Spec. Ret. Contribution 0 0 0% 0 0%Contingency Reserve 0 0 0%Text Book & Student Material 0 0 0%Activity Fund 0 0 0%Bond and Interest #1 0 0 0% 0 0%Bond and Interest #2 0 0 0% 0 0%No-Fund Warrant 0 0 0% 0 0%Special Assessment 60,599 69,333 14% 1,068,900 1442%Temporary Note 0 0 0% 0 0%
SUBTOTAL 936,011 76,618 -92% 1,068,900 1295%Enrollment (FTE)* 6,448.4 6,458.7 0% 6,482.9 0%Amount per Pupil 145 12 -92% 165 1290%
Adult Education 0 0 0% 0 0%Adult Supplemental Education 0 0 0% 0 0%Tuition Reimbursement 0 0 0% 0 0%Special Education Coop 0 0 0% 0 0%TOTAL 936,011 76,618 -92% 1,068,900 1295%
NOTE: Gifts/Grants includes private grants and grants from nonfederal sources.
Amount per pupil excludes the following funds: Adult Education, Adult Supplemental Education, Special Education Coopand Tuition Reimbursement.
* Enrollment (FTE) includes the current year enrollment on September 20, February 20, 4 yr old at-risk, and virtual. It does not include non-funded preschool or full-day kindergarten not on an IEP.
0
200,000
400,000
600,000
800,000
1,000,000
1,200,000
2014-2015 2015-2016 2016-2017
936,011
76,618
1,068,900
Capital Improvements (4000)
10/12/2016 8:15 AM Sumexpen.xlsx Page 17 of 31

USD# 260
Debt Services Expenditures (5100)
% %2014-2015 2015-2016 inc/ 2016-2017 inc/
Actual Actual dec Budget dec
General 0 0 0% 0 0%Federal Funds 0 0 0% 0 0%Supplemental General 0 0 0% 0 0%At Risk (4yr Old) 0 0 0% 0 0%At Risk (K-12) 0 0 0% 0 0%Bilingual Education 0 0 0% 0 0%Virtual Education 0 0 0% 0 0%Capital Outlay 183,732 187,377 2% 185,692 -1%Driver Training 0 0 0% 0 0%Declining Enrollment 0 0 0% 0 0%Extraordinary School Program 0 0 0% 0 0%Food Service 0 0 0% 0 0%Professional Development 0 0 0% 0 0%Parent Education Program 0 0 0% 0 0%Summer School 0 0 0% 0 0%Special Education 0 0 0% 0 0%Cost of Living 0 0 0% 0 0%Vocational Education 0 0 0% 0 0%Gifts/Grants 0 0 0% 0 0%Special Liability 0 0 0% 0 0%School Retirement 0 0 0% 0 0%Extraordinary Growth Facilities 0 0 0% 0 0%Special Reserve 0 0 0%KPERS Spec. Ret. Contribution 0 0 0% 0 0%Contingency Reserve 0 0 0%Text Book & Student Material 0 0 0%Activity Fund 0 0 0%Bond and Interest #1 4,067,663 4,780,217 18% 6,187,914 29%Bond and Interest #2 0 0 0% 0 0%No-Fund Warrant 0 0 0% 0 0%Special Assessment 0 0 0% 0 0%Temporary Note 0 0 0% 0 0%
SUBTOTAL 4,251,395 4,967,594 17% 6,373,606 28%Enrollment (FTE)* 6,448.4 6,458.7 0% 6,482.9 0%Amount per Pupil 659 769 17% 983 28%
Adult Education 0 0 0% 0 0%Adult Supplemental Education 0 0 0% 0 0%Tuition Reimbursement 0 0 0% 0 0%Special Education Coop 0 0 0% 0 0%TOTAL 4,251,395 4,967,594 17% 6,373,606 28%
NOTE: Gifts/Grants includes private grants and grants from nonfederal sources.
Amount per pupil excludes the following funds: Adult Education, Adult Supplemental Education, Special Education Coopand Tuition Reimbursement.
* Enrollment (FTE) includes the current year enrollment on September 20, February 20, 4 yr old at-risk, and virtual. It does not include non-funded preschool or full-day kindergarten not on an IEP.
0
1,000,000
2,000,000
3,000,000
4,000,000
5,000,000
6,000,000
7,000,000
2014-2015 2015-2016 2016-2017
4,251,395
4,967,594
6,373,606
Debt Services (5100)
10/12/2016 8:15 AM Sumexpen.xlsx Page 18 of 31

USD# 260
Transfers (5200)
% %2014-2015 2015-2016 inc/ 2016-2017 inc/
Actual Actual dec Budget dec
General 13,590,091 23,356,907 72% 17,144,748 -27%Federal Funds 0 0 0% 0 0%Supplemental General 2,235,548 1,660,799 -26% 2,111,190 27%At Risk (4yr Old) 0 0 0% 0 0%At Risk (K-12) 0 0 0% 0 0%Bilingual Education 0 0 0% 0 0%Virtual Education 0 0 0% 0 0%Capital OutlayDriver Training 0 0 0% 0 0%Declining Enrollment 0 0 0% 0 0%Extraordinary School Program 0 0 0% 0 0%Food Service 0 0 0% 0 0%Professional Development 0 0 0% 0 0%Parent Education Program 0 0 0% 0 0%Summer School 0 0 0% 0 0%Special Education 0 0 0% 0 0%Cost of Living 0 0 0% 0 0%Vocational Education 0 0 0% 0 0%Gifts/Grants 0 0 0% 0 0%Special Liability 0 0 0% 0 0%School Retirement 0 0 0% 0 0%Extraordinary Growth Facilities 0 0 0% 0 0%Special Reserve 0 0 0% 0 0%KPERS Spec. Ret. Contribution 0 0 0% 0 0%Contingency Reserve 195,990 0 -100% 0 0%Text Book & Student Material 0 0 0% 0 0%Activity Fund 0 0 0% 0 0%Bond and Interest #1 0 0 0% 0 0%Bond and Interest #2 0 0 0% 0 0%No-Fund Warrant 0 0 0% 0 0%Special Assessment 0 0 0% 0 0%Temporary Note 0 0 0% 0 0%
SUBTOTAL 16,021,629 25,017,706 56% 19,255,938 -23%Enrollment (FTE)* 6,448.4 6,458.7 0% 6,482.9 0%Amount per Pupil 2,485 3,873 56% 2,970 -23%
Adult Education 0 0 0% 0 0%Adult Supplemental Education 0 0 0% 0 0%Tuition Reimbursement 0 0 0% 0 0%Special Education Coop 0 0 0% 0 0%TOTAL 16,021,629 25,017,706 56% 19,255,938 -23%
NOTE: Gifts/Grants includes private grants and grants from nonfederal sources.
Amount per pupil excludes the following funds: Adult Education, Adult Supplemental Education, Special Education Coopand Tuition Reimbursement.
* Enrollment (FTE) includes the current year enrollment on September 20, February 20, 4 yr old at-risk, and virtual. It does not include non-funded preschool or full-day kindergarten not on an IEP.
0
5,000,000
10,000,000
15,000,000
20,000,000
25,000,000
30,000,000
2014-2015 2015-2016 2016-2017
16,021,629
25,017,706
19,255,938
Transfers (5200)
10/12/2016 8:15 AM Sumexpen.xlsx Page 19 of 31

USD# 260Miscellaneous Information
Unencumbered Cash Balance by Fund
July 1, 2014 July 1, 2015 July 1, 2016General 0 0 0Federal Funds -127,817 -8,659 -22,062Supplemental General 404,620 568 326,185At Risk (4yr Old) 0 0 0At Risk (K-12) 300,002 450,000 197,006Bilingual Education 236,885 386,858 209,948Virtual Education 0 0 0Capital Outlay 3,423,774 933,833 1,961,049Driver Training 21,000 28,816 32,304Declining Enrollment 0 0 0Extraordinary School Program 0 0 0Food Service 734,084 796,780 748,047Professional Development 0 0 35,314Parent Education Program 0 0 19,326Summer School 28,178 33,571 30,365Special Education 813,443 1,137,632 1,034,853Cost of Living 0 0 0Vocational Education 93,760 333,333 201,522Gifts/Grants 110,185 29,337 56,158Special Liability 0 0 0School Retirement 0 0 0Extraordinary Growth Facilities 0 0 0Special Reserve 0 0 0KPERS Spec. Ret. Contribution 0 0 0Contingency Reserve 2,065,482 1,428,495 2,780,396Text Book & Student Material 241,823 371,756 900,553Activity Fund 13 826 1,811Bond and Interest #1 3,497,704 4,032,189 4,175,871Bond and Interest #2 0 0 0No Fund Warrant 0 0 0Special Assessment 53,675 68,983 516,828Temporary Note 0 0 0
SUBTOTAL 11,896,811 10,024,318 13,205,474Enrollment (FTE)* 6,448.4 6,458.7 6,482.9Amount per Pupil 1,845 1,552 2,037
Adult Education 0 0 0Adult Supplemental Education 0 0 0Tuition Reimbursement 0 0 0Special Education Coop 0 0 0TOTAL 11,896,811 10,024,318 13,205,474
NOTE: Gifts/Grants includes private grants and grants from nonfederal sources.
Amount per pupil excludes the following funds: Adult Education, Adult Supplemental Education, Special Education Coopand Tuition Reimbursement.
* Enrollment (FTE) includes the current year enrollment on September 20, February 20, 4 yr old at-risk, and virtual. It does not include non-funded preschool or full-day kindergarten not on an IEP.
0
2,000,000
4,000,000
6,000,000
8,000,000
10,000,000
12,000,000
14,000,000
July 1, 2014 July 1, 2015 July 1, 2016
11,896,811
10,024,318
13,205,474
Unencumbered Cash Balances by Fund
10/12/2016 8:15 AM Sumexpen.xlsx Page 20 of 31

USD# 260
Reserve FundsUnencumbered Cash Balance
July 1, 2014 July 1, 2015 July 1, 2016Special Reserve 0 0 0TOTAL OTHER 0 0 0Amount per Pupil $0 $0 $0
*School districts are authorized by law to self insure rather than purchase insurance for the following categories: Worker's Comp,Health Insurance, Life Insurance, Property and Casualty (Risk Management) and Disability Income Insurance. Monies are placedin the Self Insured Fund to pay for claims which may arise from the categories listed above.
0
0
0
0
0
1
1
1
1
1
1
July 1, 2014 July 1, 2015 July 1, 2016
0 0 0
Unencumbered Cash Balances by Fund (Reserve Funds Only)
10/12/2016 8:15 AM Sumexpen.xlsx Page 21 of 31

USD# 260
2012-2013 2013-2014 % 2014-2015 % 2015-2016 % 2016-2017 %Actual Actual inc/ Actual inc/ Actual inc/ Budget inc/
dec dec dec dec
Enrollment (FTE)* 6,296.4 6,382.1 1% 6,406.2 0% 6,424.8 0% 6,435.4 0%
Enrollment (FTE)** 6,356.0 6,426.3 1% 6,448.4 0% 6,458.7 0% 6,482.9 0%Number of Students - Free Meals 2,378 2,497 5% 2,490 0% 2,541 2% 2,592 2%Number of Students - Reduced Meals 719 718 0% 858 19% 819 -5% 855 4%
*FTE for state aid and budget authority purposes for general fund (excludes 4 yr old at-risk).
** Enrollment (FTE) includes the current year enrollment on September 20, February 20, 4 yr old at-risk, and virtual. It does not include non-funded preschool or full-day kindergarten not on an IEP.
Enrollment Information
6250.0
6300.0
6350.0
6400.0
6450.0
6500.0
2012-2013 2013-2014 2014-2015 2015-2016 2016-2017
6356.0
6426.3
6448.46458.7
6482.9
Enrollment (FTE)** Used for Calculating "Amount per Pupil"
0
500
1000
1500
2000
2500
3000
2012-2013 2013-2014 2014-2015 2015-2016 2016-2017
23782497 2490 2541 2592
719 718858 819 855
Low Income Students
Free Meals
Reduced Meals
6200.0
6250.0
6300.0
6350.0
6400.0
6450.0
2012-2013 2013-2014 2014-2015 2015-2016 2016-2017
6296.4
6382.16406.2
6424.86435.4
FTE Enrollment for Budget Authority
10/12/2016 8:15 AM Sumexpen.xlsx Page 22 of 31

USD# 260
Miscellaneous InformationMill Rates by Fund
2014-2015 2015-2016 2016-2017Actual Actual Budget
General 20.000 20.000 20.000Supplemental General 15.127 17.897 14.514Adult Education 0.000 0.000 0.000Capital Outlay 6.014 7.992 8.000Declining Enrollment 0.000 0.000 0.000Cost of Living 0.000 0.000 0.000Special Liability 0.000 0.000 0.000School Retirement 0.000 0.000 0.000Extraordinary Growth Facilities 0.000 0.000 0.000Bond and Interest #1 7.946 7.918 8.051Bond and Interest #2 0.000 0.000 0.000No Fund Warrant 0.000 0.000 0.000Special Assessment 0.192 1.359 1.360Temporary Note 0.000 0.000 0.000TOTAL USD 49.279 55.166 51.925Historical Museum 0.000 0.000 0.000Public Library Board 0.000 0.000 0.000Public Library Brd & Emp Benf 0.000 0.000 0.000Recreation Commission 5.600 5.581 5.587
Rec Comm Employee Bnfts 1.415 1.409 1.911TOTAL OTHER 7.015 6.990 7.498
0.000
10.000
20.000
30.000
40.000
50.000
60.000
70.000
80.000
2014-2015 2015-2016 2016-2017
49.27955.166
51.925
Total USD Mill Rates
General39%
Supplemental General28%
Capital Outlay15%
Bond and Interest #115%
Special Assessment3%
Miscellaneous Information Mill Rates by Fund (Total USD)
General
Supplemental General
Adult Education
Capital Outlay
Special Liability
School Retirement
Declining Enrollment
Cost of Living
Bond and Interest #1
Bond and Interest #2
Extraordinary Growth Facilities
No Fund Warrant
Special Assessment
Temporary Note
10/12/2016 8:15 AM Sumexpen.xlsx Page 23 of 31

USD# 260Other Information
2014-2015 2015-2016 2016-2017Actual Actual Budget
Assessed Valuation $392,727,553 $388,230,280 $404,947,727
Total USD Debt $66,415,000 $63,455,000 $62,190,000
$375,000,000
$380,000,000
$385,000,000
$390,000,000
$395,000,000
$400,000,000
$405,000,000
2014-2015 2015-2016 2016-2017
$392,727,553
$388,230,280
$404,947,727
Assessed Valuation
$60,000,000
$61,000,000
$62,000,000
$63,000,000
$64,000,000
$65,000,000
$66,000,000
$67,000,000
2014-2015 2015-2016 2016-2017
$66,415,000
$63,455,000
$62,190,000
Total USD Debt
10/12/2016 8:15 AM Sumexpen.xlsx Page 24 of 31
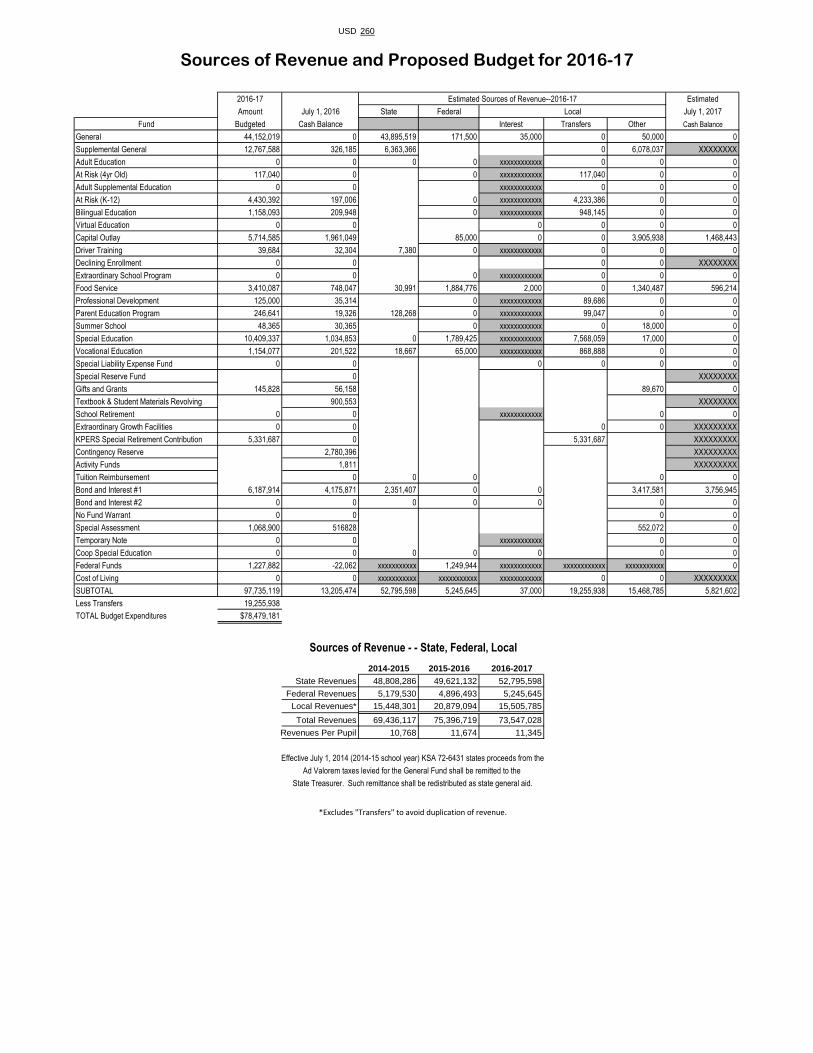
USD 260
2016-17 Estimated Sources of Revenue--2016-17 Estimated
Amount July 1, 2016 State Federal Local July 1, 2017
Fund Budgeted Cash Balance Interest Transfers Other Cash Balance
General 44,152,019 0 43,895,519 171,500 35,000 0 50,000 0
Supplemental General 12,767,588 326,185 6,363,366 0 6,078,037 XXXXXXXX
Adult Education 0 0 0 0 xxxxxxxxxxxx 0 0 0
At Risk (4yr Old) 117,040 0 0 xxxxxxxxxxxx 117,040 0 0
Adult Supplemental Education 0 0 xxxxxxxxxxxx 0 0 0
At Risk (K-12) 4,430,392 197,006 0 xxxxxxxxxxxx 4,233,386 0 0
Bilingual Education 1,158,093 209,948 0 xxxxxxxxxxxx 948,145 0 0
Virtual Education 0 0 0 0 0 0
Capital Outlay 5,714,585 1,961,049 85,000 0 0 3,905,938 1,468,443
Driver Training 39,684 32,304 7,380 0 xxxxxxxxxxxx 0 0 0
Declining Enrollment 0 0 0 0 XXXXXXXX
Extraordinary School Program 0 0 0 xxxxxxxxxxxx 0 0 0
Food Service 3,410,087 748,047 30,991 1,884,776 2,000 0 1,340,487 596,214
Professional Development 125,000 35,314 0 xxxxxxxxxxxx 89,686 0 0
Parent Education Program 246,641 19,326 128,268 0 xxxxxxxxxxxx 99,047 0 0
Summer School 48,365 30,365 0 xxxxxxxxxxxx 0 18,000 0
Special Education 10,409,337 1,034,853 0 1,789,425 xxxxxxxxxxxx 7,568,059 17,000 0
Vocational Education 1,154,077 201,522 18,667 65,000 xxxxxxxxxxxx 868,888 0 0
Special Liability Expense Fund 0 0 0 0 0 0
Special Reserve Fund 0 XXXXXXXX
Gifts and Grants 145,828 56,158 89,670 0
Textbook & Student Materials Revolving 900,553 XXXXXXXX
School Retirement 0 0 xxxxxxxxxxxx 0 0
Extraordinary Growth Facilities 0 0 0 0 XXXXXXXXX
KPERS Special Retirement Contribution 5,331,687 0 5,331,687 XXXXXXXXX
Contingency Reserve 2,780,396 XXXXXXXXX
Activity Funds 1,811 XXXXXXXXX
Tuition Reimbursement 0 0 0 0 0
Bond and Interest #1 6,187,914 4,175,871 2,351,407 0 0 3,417,581 3,756,945
Bond and Interest #2 0 0 0 0 0 0 0
No Fund Warrant 0 0 0 0
Special Assessment 1,068,900 516828 552,072 0
Temporary Note 0 0 xxxxxxxxxxxx 0 0
Coop Special Education 0 0 0 0 0 0 0
Federal Funds 1,227,882 -22,062 xxxxxxxxxxx 1,249,944 xxxxxxxxxxxx xxxxxxxxxxxx xxxxxxxxxxx 0
Cost of Living 0 0 xxxxxxxxxxx xxxxxxxxxxx xxxxxxxxxxxx 0 0 XXXXXXXXX
SUBTOTAL 97,735,119 13,205,474 52,795,598 5,245,645 37,000 19,255,938 15,468,785 5,821,602
Less Transfers 19,255,938
TOTAL Budget Expenditures $78,479,181
2014-2015 2015-2016 2016-2017State Revenues 48,808,286 49,621,132 52,795,598
Federal Revenues 5,179,530 4,896,493 5,245,645Local Revenues* 15,448,301 20,879,094 15,505,785Total Revenues 69,436,117 75,396,719 73,547,028
Revenues Per Pupil 10,768 11,674 11,345
*Excludes "Transfers" to avoid duplication of revenue.
Sources of Revenue and Proposed Budget for 2016-17
Sources of Revenue - - State, Federal, Local
Effective July 1, 2014 (2014-15 school year) KSA 72-6431 states proceeds from the
Ad Valorem taxes levied for the General Fund shall be remitted to the
State Treasurer. Such remittance shall be redistributed as state general aid.

USD 260 - Derby - Summary
41,000,000
42,000,000
43,000,000
44,000,000
45,000,000
46,000,000
47,000,000
2014-2015 2015-2016 2016-2017
Instruction Expenditures
6200.0
6250.0
6300.0
6350.0
6400.0
6450.0
2012-2013 2013-2014 2014-2015 2015-2016 2016-2017
FTE Enrollment for Budget Authority
0.000
10.000
20.000
30.000
40.000
50.000
60.000
70.000
80.000
2014-2015 2015-2016 2016-2017
Total USD Mill Rates
0
2,000
4,000
6,000
8,000
10,000
12,000
14,000
Amount Per Pupil By Function (All Funds)
010,00020,00030,00040,00050,00060,00070,00080,00090,000
85,597
55,620 60,042
29,794
Average Salary
05,000,000
10,000,00015,000,00020,000,00025,000,00030,000,00035,000,00040,000,00045,000,00050,000,000
Summary of Total Expendituresby Function (All Funds)
0
5,000,000
10,000,000
15,000,000
20,000,000
25,000,000
General and Supplemental General FundExpenditures by Function
0.0002.0004.0006.0008.000
10.00012.00014.00016.00018.00020.000
Mill Rates by Fund

Intentionally left blank

Intentionally left blank

Intentionally left blank

Intentionally left blank

Intentionally left blank