profile of certain elected officials in f1innesota · certain elected officials in f1innesota gary...
TRANSCRIPT
PROFILEOFCERTAIN ELECTED OFFICIALSINf1INNESOTA
GARY R. CURRIEJANUARY} 1977
STATE OF MINNESOTA
HOUSE OF REPRESENTATIVES
RESEARCH DEPARTMENT
17 STATE CAPITOL
ST. PAUL) MINNESOTA 55155
This document is made available electronically by the Minnesota Legislative Reference Library as part of an ongoing digital archiving project. http://www.leg.state.mn.us/lrl/lrl.asp
t.
PROFILEOFCERTAIN ELECTED OFFICIALSINrlINNESOTA
GARY Re CURRIE
JANUARY; 1977
STATE OF MINNESOTA
HOUSE OF REPRESENTATIVES
RESEARCH DEPARTMENT
17 STATE CAPITOL
ST. PAUL; MINNESOTA 55155
I .
This profile of certain elected officials in Hinnesota is a result
of a survey and research conducted in 1975 and 1976. It is based
on data coJ.lected on officials who "ere in office in 1975. The
State Senators and State Representatives included in the profile
were members of the Sixty-Ninth Legislature. The United States
Senators and Representatives were me3bers of the Ninety-Fourth
Congress. Tmffiship supervisors were not included in the survey.
~'U,VJI-lJu<..r vr J.n ...·.'·l\ UN
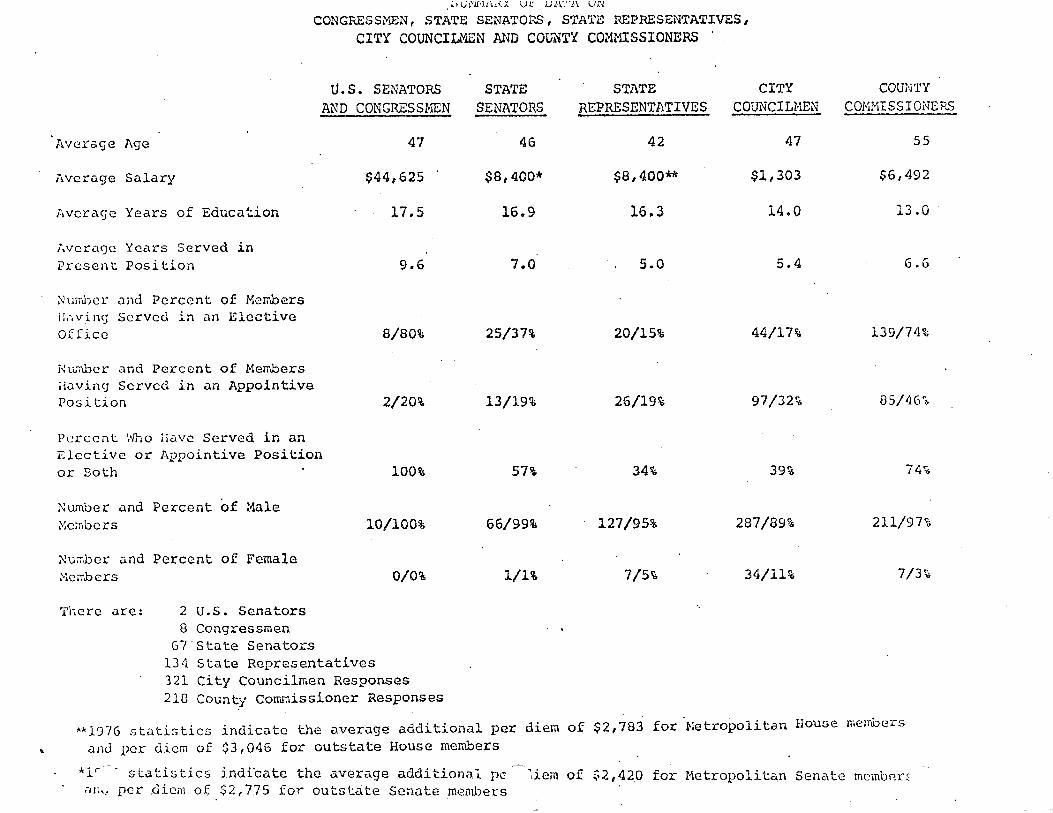
CONGRESSl"£N, STATE SENATORS, STA'l'E REPRESENTATIVES,
CITY COUNCILMEN AND COu~TY COMMISSIONERS
U.S. SENATORS STATE STATE CITY COUl'JTYAND CONGRESSMEN SENATORS REPRESENTATIVES COUNCILMEN COMivlISSIONERS
Average Age 47 46 42 47 S5
Average Salary $44,625 $8,400* $8,400** $1,303 $6,492
Average Years of Education 17.5 16.9 16~3 14.0 13 .0
hverage Years Served inPresent Position 9.6 7.0 5.0 5.4 6.6
;'JurrJ)(,r .:lI1d Percent of MembersII ... vinc.; Served in an ElectiveOffice 8/80% 25/37% 20/15% 44/179.0 139/74%
i-itLO\l)er and Percent of Members,ltiving Served in tin AppointivePosi tion 2/20% 13/19% 26/19% 97/32!6 85/46"1>
Percent \fno Belva Served in anElective or Appointive Positionor Both 100% 57% 34% 39!6 74%
Nw~ber and Percent of Male:-~Cirlbers 10/100% 66/99% 127/95% 287/89% 211/97%
~u~ber and Percent of Female~embcrs 0/0% 1/1% 7/5ft; 34/11% 7/3<:0
There are: 2 U.S. Senators8 Congressmen
G7State Senators134 State Representatives321 City Councilmen Responses210 County Corrmissioner Responses
~k197G statistics indicate the average additional per diem of $2,783 for "Netropolitan House members.. ()nd per diem of $3,046 for outstate House members
*1' " statistics indicate the average additional pc ;iem of ~2 420 for Metropolitan Sen~te .' c_ d . [ <,' ~ , . . c, mcmo~r,r1rh". per . ~em 0; y2,7.75 for outr>tate Senaternembers
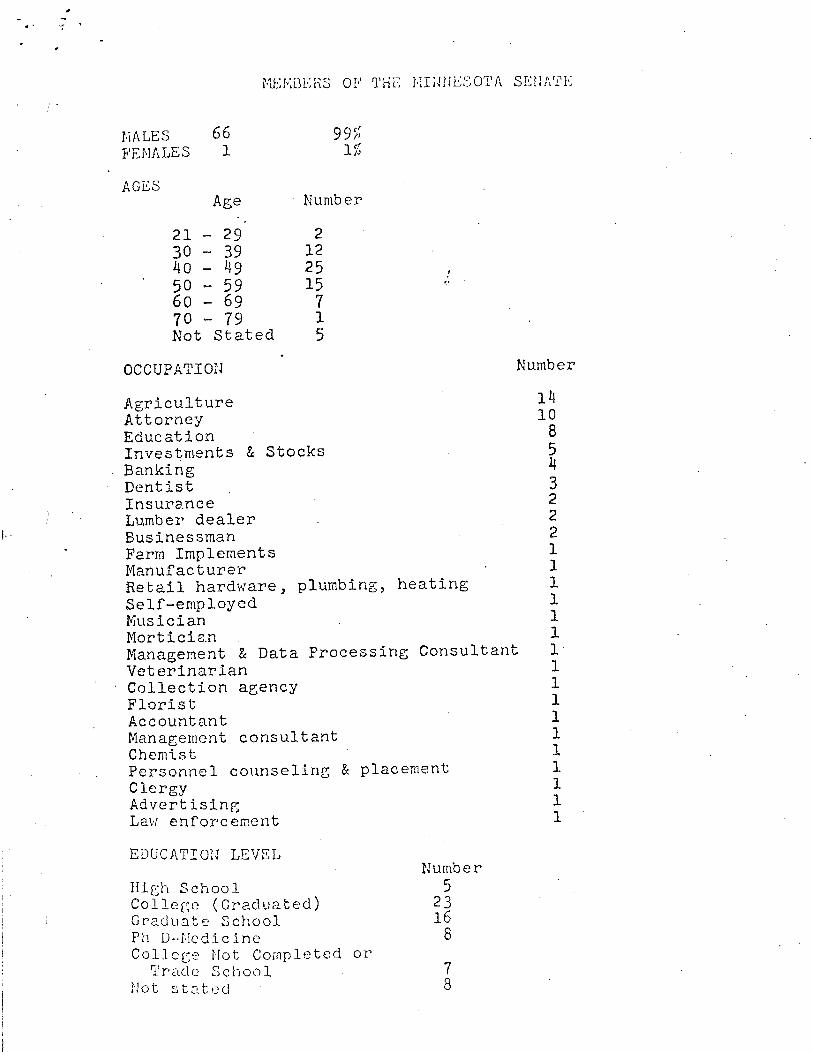
NElmEHS OF 'l'HE IUIHlES01'A SEtH','Ei':
r·iALES 66 99%F'EN!\LES 1 1<1IJ
AGESAge Number
21 - 29 230 - 39 1240 - 49 25 :50 - 59 15 -,'
60 - 69 770 - 79 1Not Stated 5
OCCUPATION Number
Agriculture 14Attorney 10Education 8Investments & Stocks 5Banking 4Dentist 3Insurance 2Lumber dealer 2Businessman 2Farm Implements 1Il'1anufacturer 1Retail hardware, plumbing, heating 1Self-employed 1Musician 1Mortician 1Managenent & Data Processing Consultant 1Veterinarian 1Collection agency 1Florist 1Accountant 1Management consultant 1Chemist 1Personnel connselin~ & placement 1Clergy 1Advertisinp; 1La\'! enforcement 1
EDUCATI01~ LEVEL
IUr;h Schoo 1Colle~c (Graduated)Graduate SchoolPh D-f.ledicincCollc~e Not Comnletcd or
'l'racle School 'not stC'tt(;c]
Number5
2316
8
78
·,.
-2-
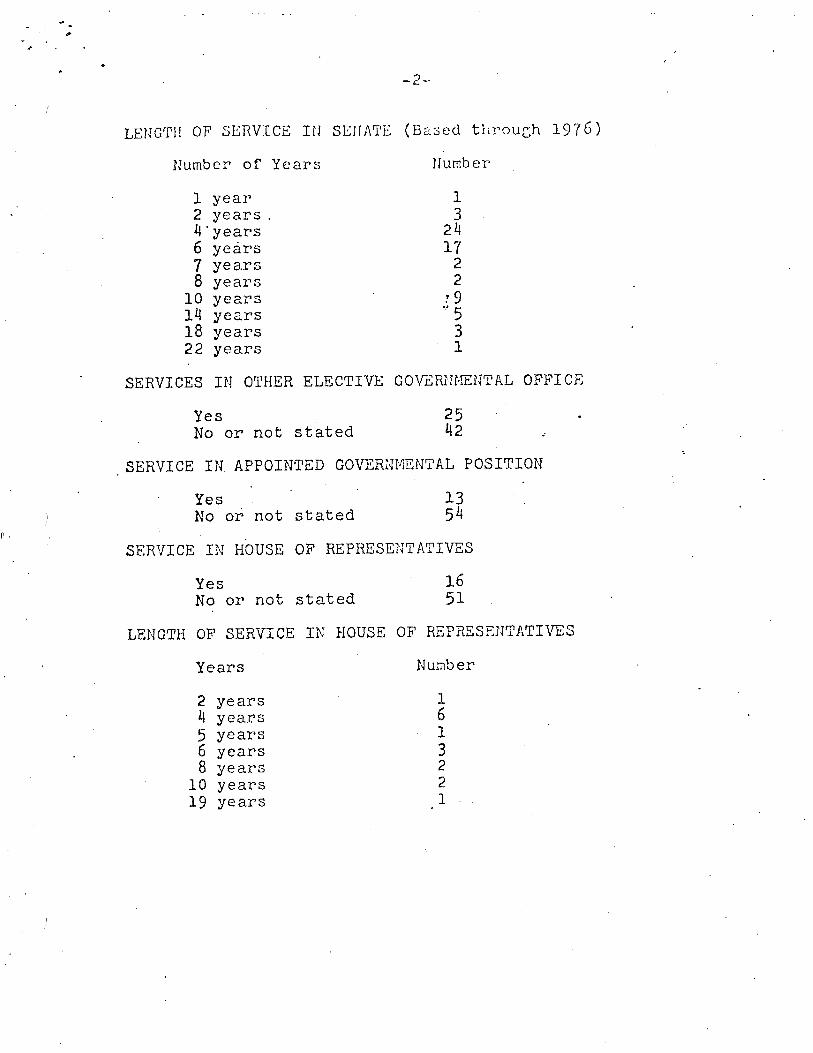
LENGTH OF SETIVI CE ItJ SEn NI'E (B2.3Cd throuGh 1976)
Number of Years
1 year2 years.4'years6 years7 years8 years
10 years14 years18 years22 years
Humber
13
2417
22
; 9.. 5
31
SERVICES IN OTHER ELECTIVE GOVER.Hi,rENTAL OFFICE
YesNo or not stated
2542
SERVICE IN APPOINTED GOVERNMENTAL POSITION
I' .
YesNo or not stated
1354
SERVICE IN HOUSE OF REPRESENTATIVES
YesNo or not stated
1651
LENGTH OF SERVICE IN HOUSE OF REPRESENTATI\TES
Years NUIilber
2 years 14 years 65 years 16 years 38 years 2
10 years 219 years 1
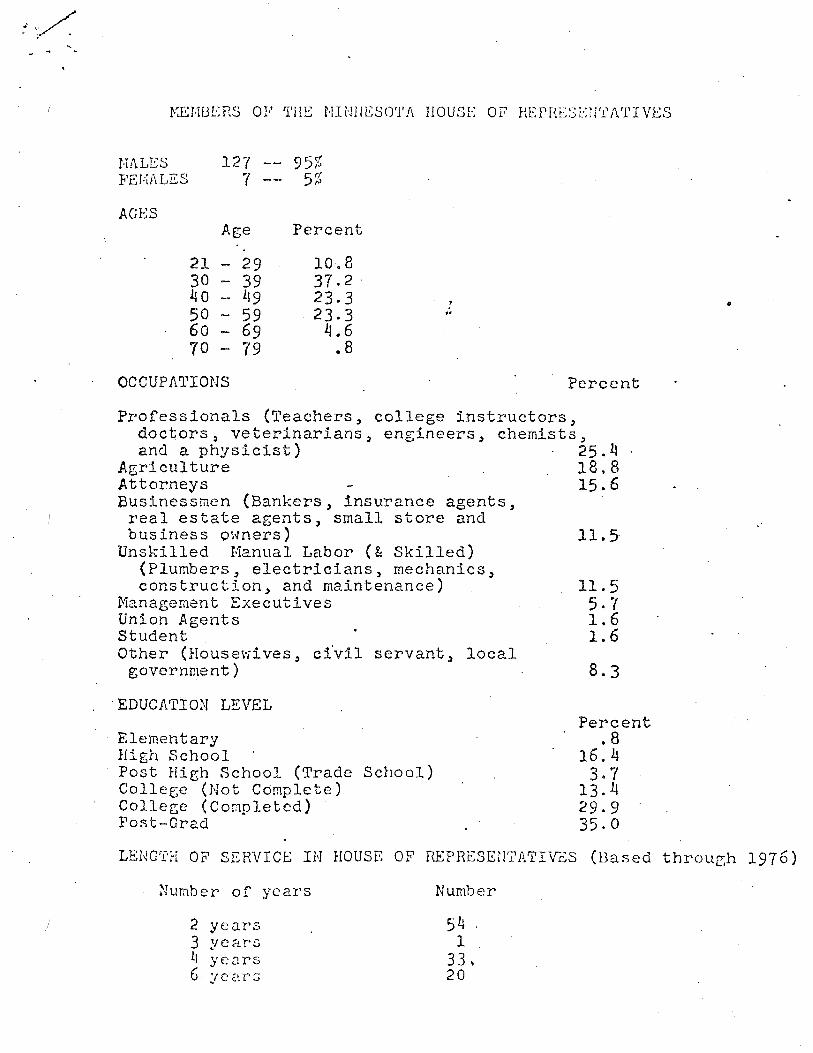
11.5
11.55.71.61.6
'>" /-'./"
r.EJ.1IJEnS Or-' 'l'EE rnUHESOTft HOUSE 0[0' J{Erm~S!:;n(.cNrIVES
NALES 127 95%PEf..UtLES ~{ 5%
AGESAge Percent
21 29 10'.830 - 39 37.2 'lto - 119 23.3 ,50 - 59 23.3 ,.
60 69 4.670 - 79 .8
OCCUPATIONS Percent
Professionals (Teachers, college instructors,doctors, veterinarians, engineers, chemists,and a physicist) 25.4
Agriculture 18.8Attorneys 15.6Businessmen (Bankers, insurance agents,real estate asents, small store andbusiness o'..,rners)
Unskilled I~anual Labor (& Skilled)(Plumbers, electricians, mechanics,construction, and maintenance)
Management ExecutivesUnion AgentsStudentOther (Housewives, cfvil servant, local
government)
..
'EDUCATION LEVEL
. ElementaryHigh SchoolPost Hieh School (Trade School)Colleee (Not Cdmplete)Collece (Completed)Post-Grad
Percent.8
16.43.7
13.1129.935.0
LEHGTH OF SERVICE IN HOUSE OF flliPRESEil?J1.TIvr:S (Based throuc:h 1976)
~Iumber of years
2 years3 years11 yc ars6 yc <'~1~0
Number
54 '1
33.20
-2-
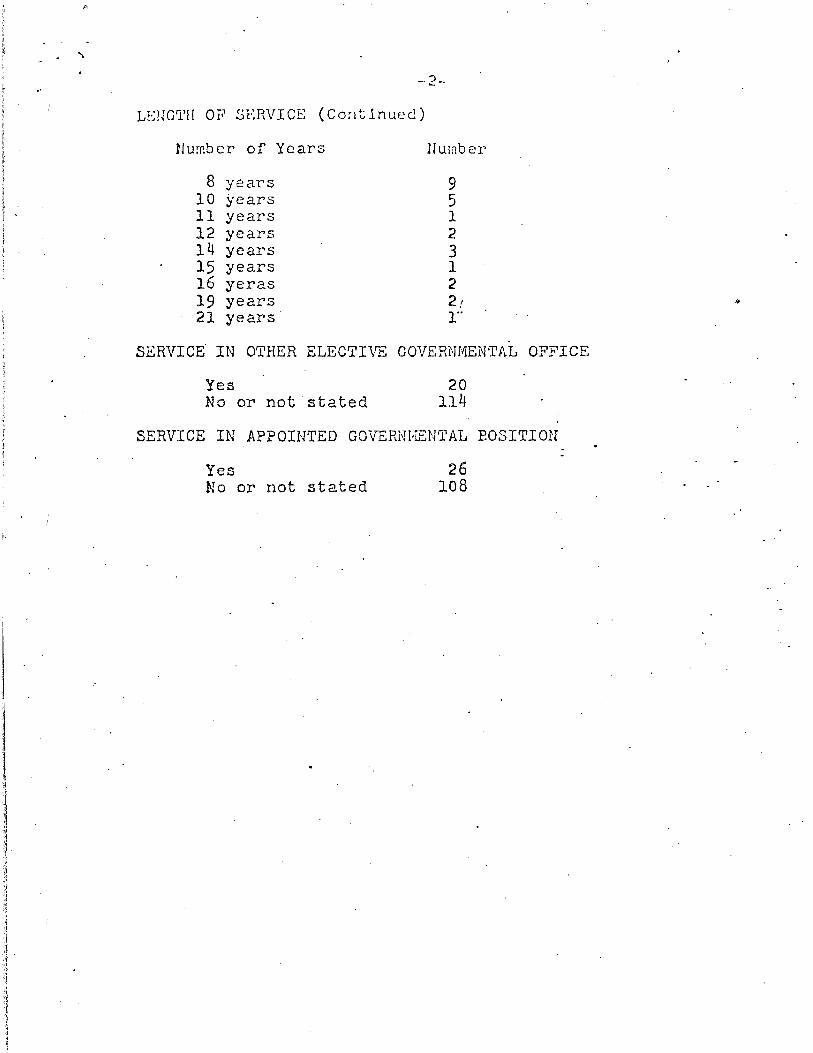
LElW'l'j{ OF SERVICE (Continued)
Number of Years
8 years10 years11 years12 years14 years15 years16 yeras19 years21 years
Humber
95123122;r
SERVICE" IN OTHER ELECTIVE GOVERWftENTAL OFFICE
Yes 20No or not stated 114
SERVICE IN APPOINTED GOVERNr·IENTAL POSITION
Yes 26No or not stated 108
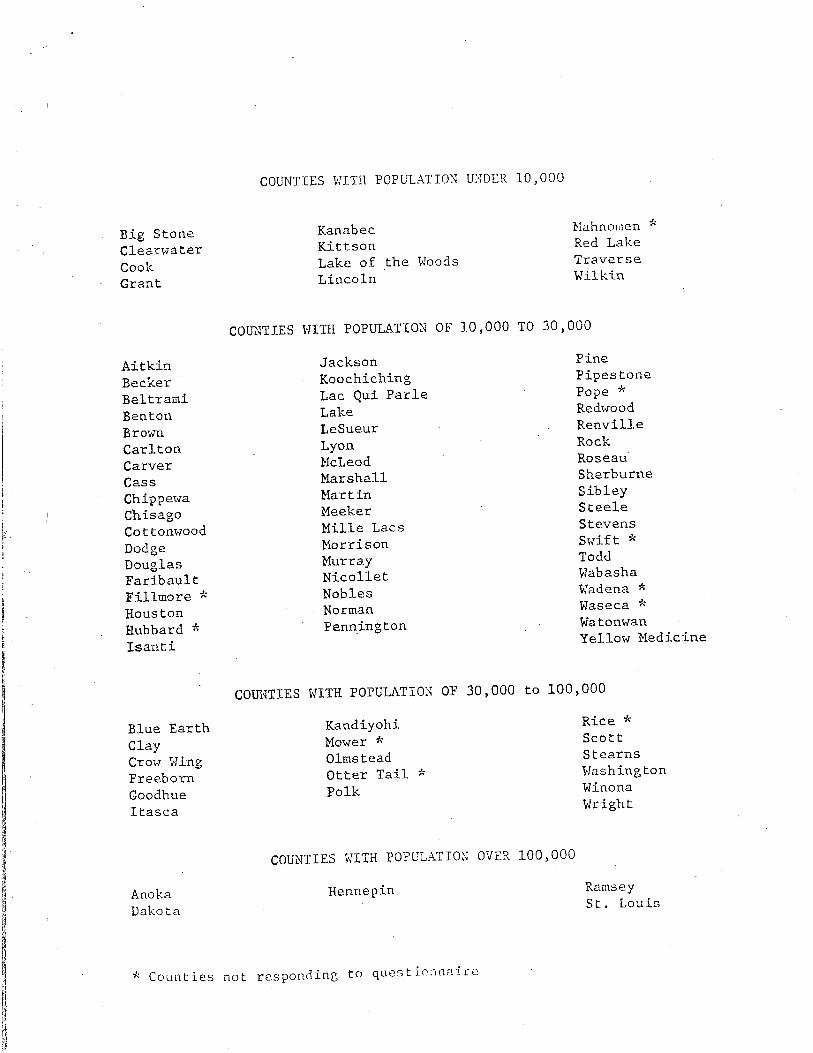
Big StoneClearwaterCookGrant
COUNTIES HITH POPULATIO:;r UNDER 10,000
KanabecKittsonLake of the WoodsLincoln
Hahnomen *Red LakeTraverseWilkin
COUNTIES WITH POPULATION OF 10,000 TO 30)000
* Counties not responding to questi0nnairc
com~TIES WITH POPULATIO~ OF 30,000 to 100,000
AitkinBeckerBeltramiBentonBrownCarltonCarverCassChippe~va
ChisagoCottomvoodDodgeDouglasFaribaultFillmore *HoustonHubbard *Isanti
Blue EarthClayCrOy7 WingFreebornGoodhueItasca
AnokaDakota
JacksonKoochichingLac Qui ParleLakeLeSueurLyonHcLeodMarshallHartinMeekerMille LacsHarrisonMurrayNicolletNoblesNormanPennington
KandiyohiHower *OlmsteadOtter Tail *Polk
COUNTIES WITH POPULATION OVER 100,000
Hennepin
PinePipestonePope *Red~-TOod
RenvilleRockRoseauSherburneSibleySteeleStevensS~vift *ToddWabashaWadena *Waseca *WatonwanYellow Nedicine
Rice *ScottStearnsvlashingtonWinona\~right
RamseySt. Louis
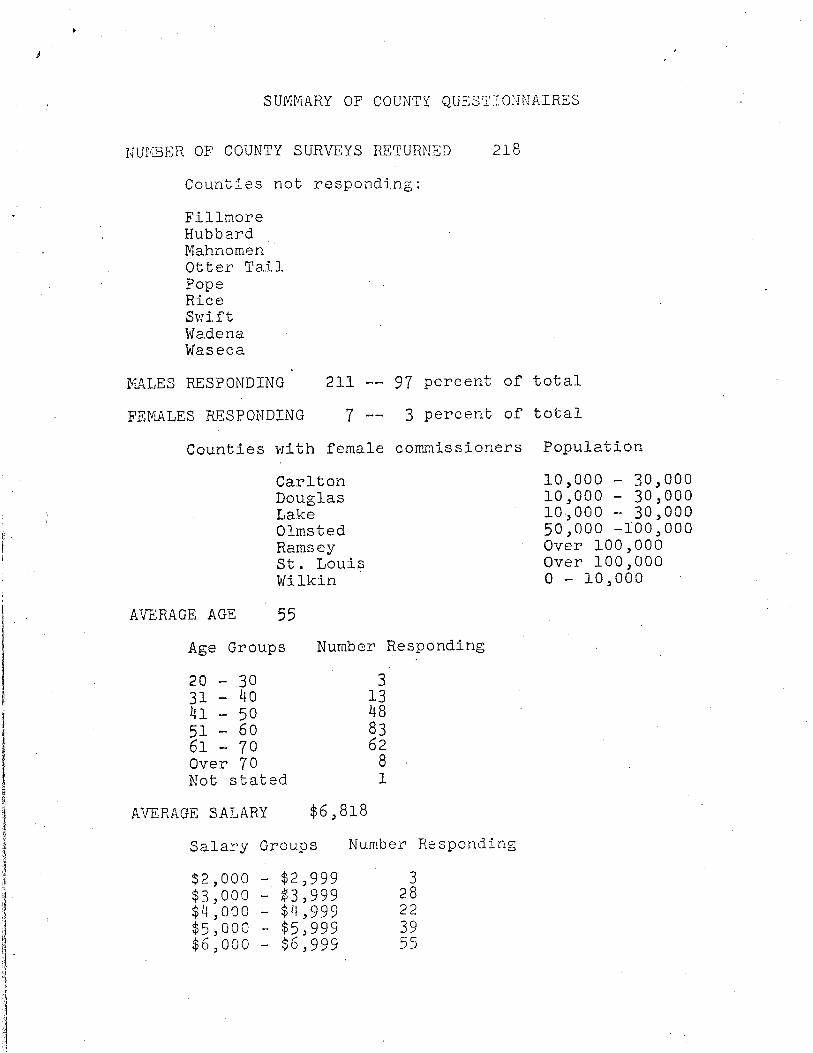
SUMMARY OF COUNTY QUSSTIO~NAIRES
rWf'ffiER OF COUNTY SURVEYS RETURNED 218
Coun~ies not responding:
FillmoreHubbardMahnomenOtter TailPopeRiceSHiftWadenaWaseca
~ffiLES RESPONDING 211
FElf~LES RESPONDING 7
97 percent of total
3 percent of total
Counties with female commissioners Population
I' .
fI
CarltonDouglasLakeOlmstedRamseyst. LouisWilkin
AVERAGE AGE 55
10,000 - 30,00010,000 - 30,00010,000 - 30,00050,000 -100,000Over 100,000Over 100,000o - 10,000
Age Groups Number Responding
20 - 30 331 - 40 1341 50 4851 60 8361 - 70 62Over 70 8Not stated 1
AVERAGE SALARY $6,818
Salary Groups Number Responding
$2,000 - $2,999 3$3,000 - ~3,999 28$4,000 - $4,999 22$5,000 - $5,999 39$6,000 - $6,999 55
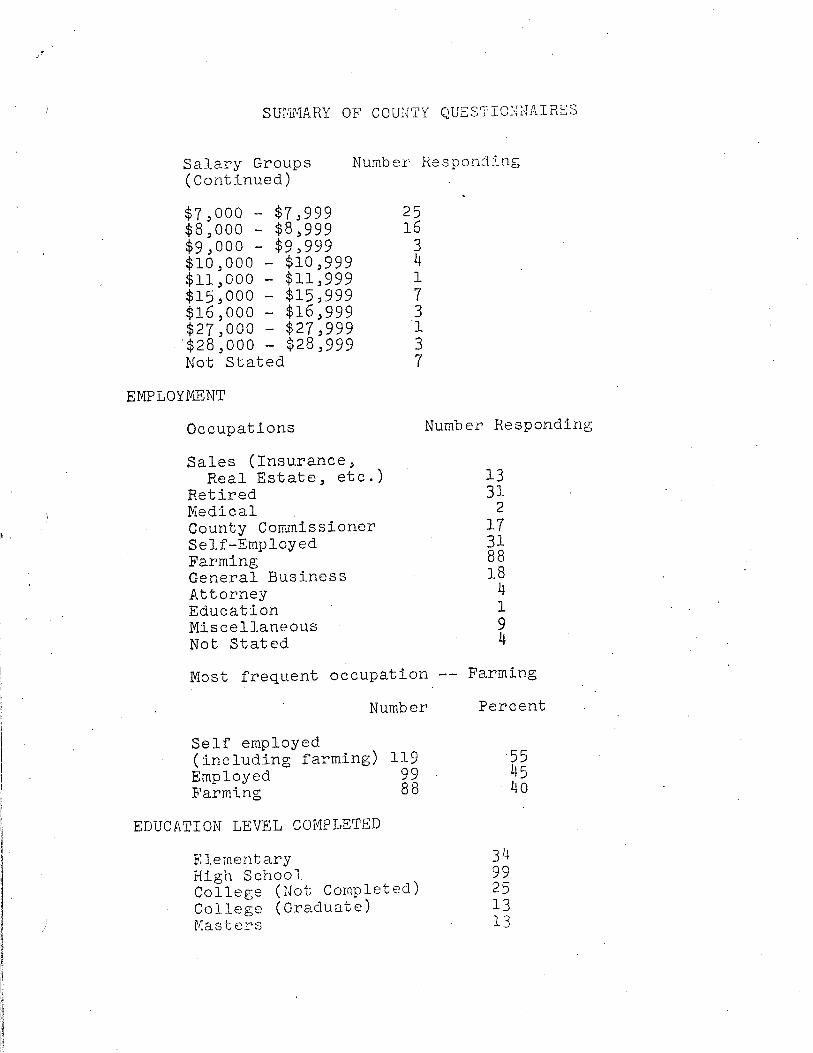
SUf.lI"1ARY OF COU:~TY QUESTIO:WAIRES
Salary Groups Number Responj~ng
(Continued)
$7,000 - $7,999 25$8,000 - $8,999 16$9,000 - $9,999 3$10,000 - $10,999 4$11,000 - $11,999 1$15,000 - $15,999 7$16,000 - $16,999 3$27,000 - $27,9991
'$28,000 - $28,999 3Not Stated 7
EMPLOYf1ENT
v '
Occupations
Sales (Insurance,Real Estate, etc.)
RetiredMedicalCounty CowmissionerSelf-EmployedFarmingGeneral BusinessAttorneyEducationMiscellaneousNot Stated
Number Responding
1331
217318818
4194
Most frequent occupation
Number
Self employed(including farming) 119Employed 99Farming 88
EDUCATION LEVEL COMPLETED
ElementaryHigh SchoolCollege (Not Completed)College (Graduate)r1as t ers
Farming
Percent
554540
3499251313
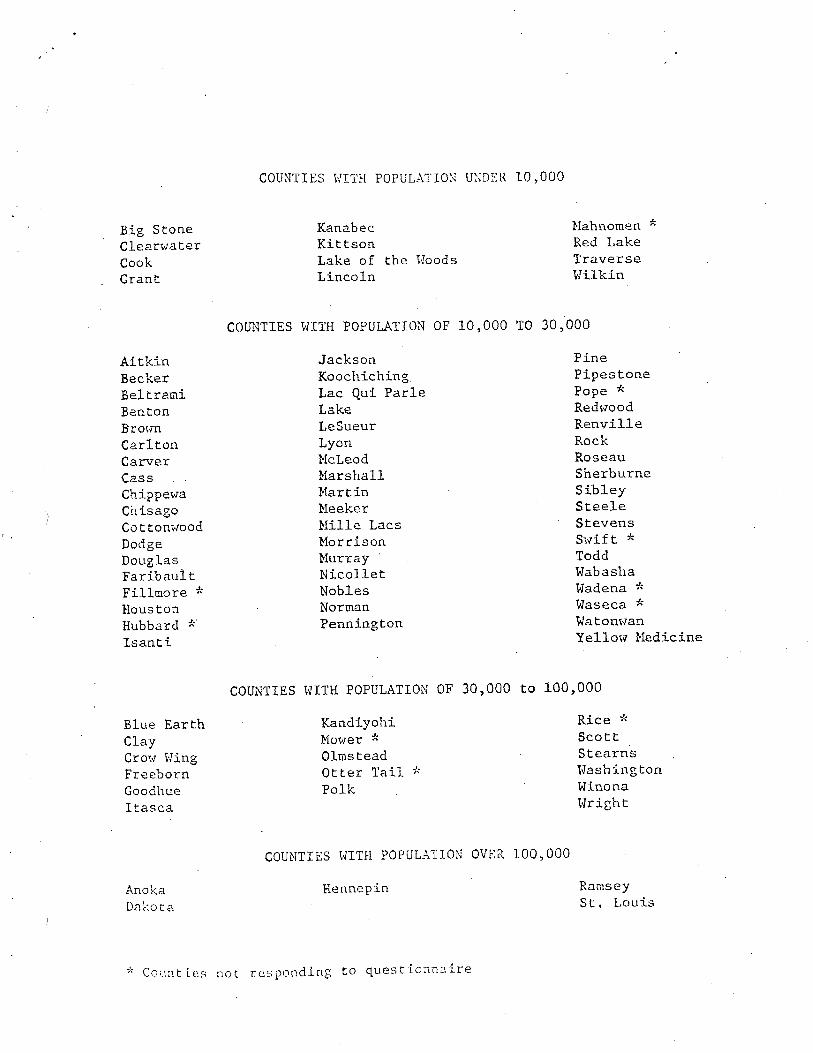
Big StoneClearwaterCookGrant
COUNTIES WITH POPULATION UNDER 10,000
KanabecKittsonLake of the WoodsLincoln
'Hahnomen *Red LakeTraverse\-lilkin
COUNTIES WITH POPULATION OF 10,000 TO 30,000
AitkinBeckerBeltramiBentonBrOlmCarltonCarverCassChippewaC£lisagoCottonwoodDodgeDouglasFaribaultFillmore *HoustonHubbard *Isanti
JacksonKoochichingLac Qui ParleLakeLeSueurLyonHcLeodMarshallMartinHeekerHille LacsMorrisonHurrayNicolletNoblesNormanPennington
PinePipestonePope *RedwoodRenvilleRockRoseauSherburneSibleySteeleStevensSwift *ToddWabashaWadena *Waseca *WatomvanYellow Medicine
com~TIES WITH POPULATION OF 30,000 to 100,000
Blue EarthClayCrO\v HingFreebornGoodhueItasca
AnokaDakota
KandiyohiMower *OlmsteadOtter Tail -{.:Polk
COUNTIES WITH POPULATION OVER 100,000
Hennepin
Rice *ScottStearnsl~ashington
WinonaWright
RamseySt. Louis
* Counties not responding to questionnaire
,'t"I,",?,i",):':'1""I(~~j:'t(:.1... '~~~~"f
" }t ",~",
t~f:~;:{;~'p.\:j'\\:'f:\ I
'jVs~'(j
~'1'','.i'~/iJ:J~
i:lI,~"'~',' .
;~ ,Lt'(:~\(".:
\:'1,~
r~~~F~},~r',',
~,'.
r:I"
t.,,\,~~~:L'"
"i:~:j;';~iI·tI'~I'P,,';.;.~ ~ 'I; "" ".'. ~~
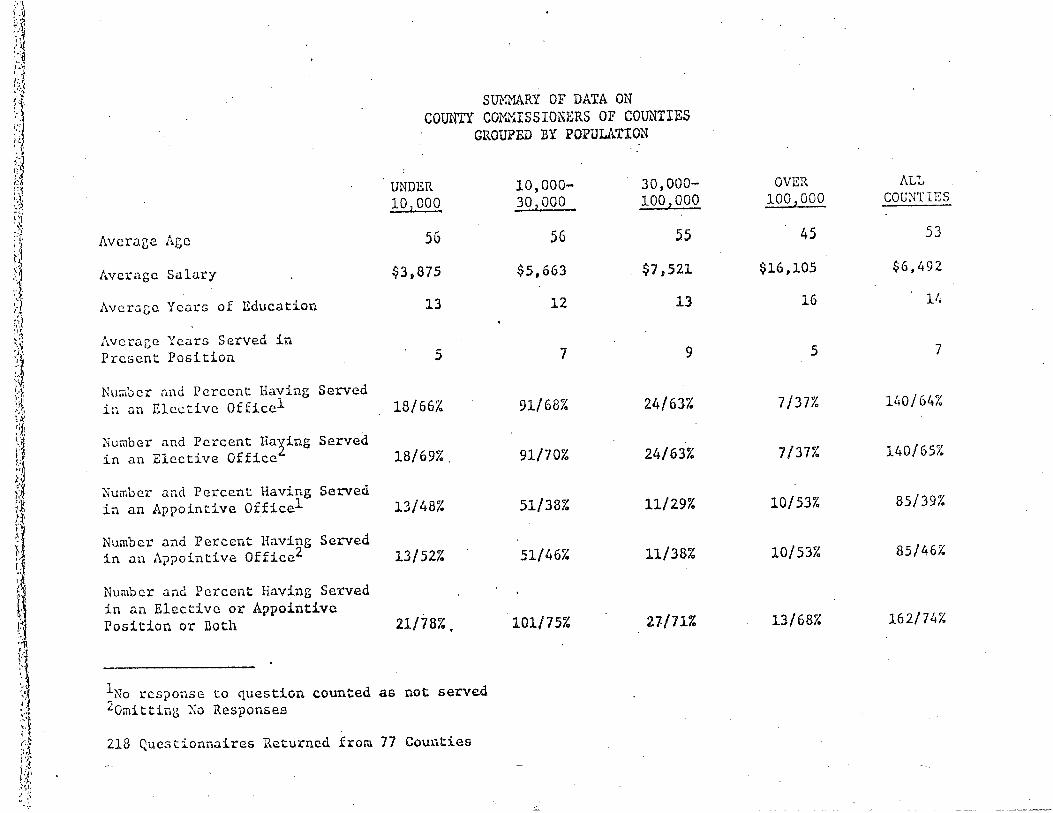
SUMMARY OF DATA ONCOUNTY COMXISSIONERS OF COUNTIES
GROUPED BY POPULATION
UNDER 10,000- 30,000- OVER ALL10 l 000, 30,000 100,000 100,000 COU~TIES
Average Age 56 56 55 45 53
Average Salary $3,875 $5,663 $7.521 $16,105 $6,492
Average Years of Education 13 12 13 16 14
Average Years Served inPresent Position 5 7 9 5 7
NUli1bcr \lnd Percent Having Servedin an Elective Office1 18/66% 91/687- 24/637- 7/377- 140/64%
~uwbcr and Percent Ha2ing Served18/69%, 91/70% 24/63% 7/37% 140/65%in an Elective Office
~umber and Percent Having Servedin an Appointive Office1 13/48% 51/38% 11/29% 10/537- 85/397-
Number and Percent Having Servedin an Appointive Office2 13/52% 51/46% 11/38% 10/53% 85/46%
Number and Percent Having Servedin an Elective or AppointivePosition or Both 21/78% . 101/15% 21/71% 13/68% 162/747.
INa response to question counted as not served20mitting ~o Responses
218 Questionnaires Returned from 71 Counties
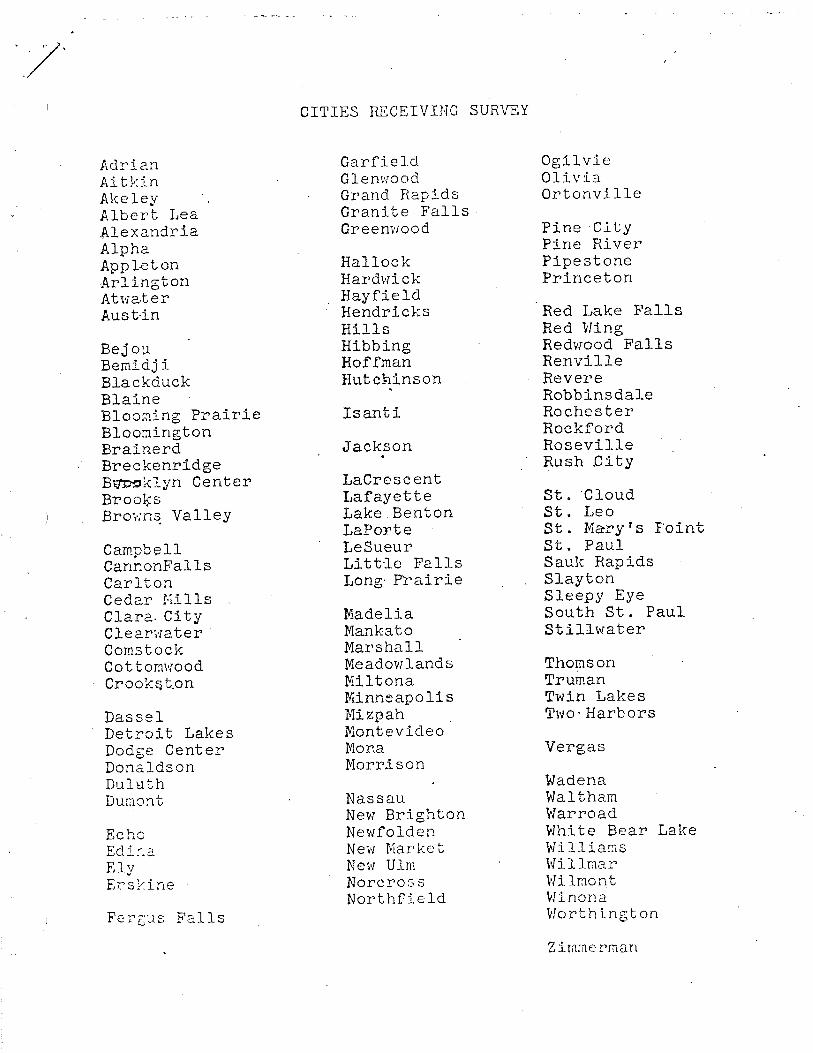
Adri2.nAitkinAkeleyAlbert Lea,AlexandriaAlphaAppl-etonArlingtonAtHa.terAust·in
BejouBemidjiBlackduckBlaineB100~ing PrairieBloor:J.ingtonBrainerdBreckenridgeB!J'P':Ok1:,-'n CenterBrool;.sBrm·:n~ Valley
CampbellCanr:onFa11sCarltonCedar HillsClara- CityClear"laterComstockCot tOr:l'doodCrook~t.on
DasselDetroit LakesDodge CenterDonaldsonDul':.lthDuno:lt
EchoEdi:--.2.ElyEr sl~ine
CITIES RECEIVING SURVEY
Garfie1dGlenwoodGrand RapidsGranite FallsGreemlood
HallockHardwickHayfieldHendricksHillsHibbingHoffmanHutcbinson
Isanti
Jackson.LaCrescentLafayetteLake BentonLaPorteLeSueurLitt-Ie FallsLong- Prairie
MadeliaMankatoMarshallMeadowlandsMiltonaMinneapolisMizpahMontevideoMor.aMorrison
NassauNe"" BrightonNewfoldenNeVI MarketNew UlmNorcrossNorthfield
OgilvieOliviaOrtonville
Pine -CityPine RiverPipestonePrinceton
Red Lake FallsRed \'lingRedl'rood FallsRenvilleRevereRobbinsdaleRochesterRockfordRosevilleRush .City
St. CloudSt. LeoSt. Mary's :PointSt. PaulSauIe RapidsSlaytonSleepy EyeSouth St. PaulSt il1\l[ater
ThomsonTrumanTwin LakesTwo'Harbors
Vergas
WadenaWalthamWarroadvlhi t e Bear LakeWilliamsWillmar\'1i lmont\>li nonaVlorthington
Zimmerman
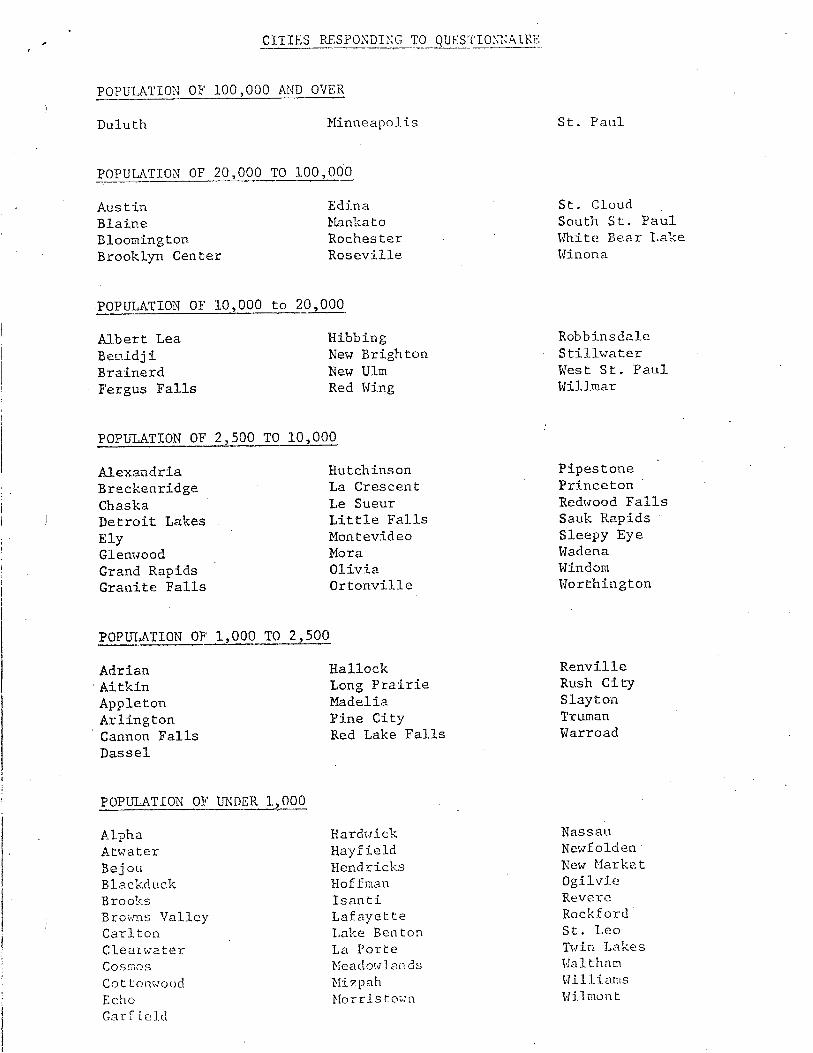
CITIES RESPO~DI~G TO QUESTIO:-:~,AlRE
POPULATION OF 100,000 AND OVER
Duluth Hinneapolis St. Paul
POPULATION OF 20,000 TO 100,000
AustinBlaineBloomingtonBrooklyn Center
EdinaHankatoRochesterRoseville
St. CloudSouth St. Paul\fuite Bear Lake\Hnona
POPULATION OF 10,000 to 20,000
Albert LeaBenidjiBrainerdFergus Falls
HibbingNew BrightonNew U1mRed "ling
RobbinsdaleStillwaterWest St. Paul\oJ'illmar
POPULATION OF 2,500 TO 10,000
AlexandriaBreckenridgeChaskaDetroit Lak.esElyGlemwodGrand RapidsGranite Falls
HutchinsonLa CrescentLe SueurLittle FallsNontevideoMoraOliviaOrtonville
PipestonePrincetonRediolOod FallsSauk RapidsSleepy EyevladenaWindomHorthington
POPULATION OF' 1,000 TO 2,500
Adrian. AitkinAppletonArlingtonCannon FallsDassel
POPULATION OF UNDER 1,000
AlphaAt,,:aterBejouBlackduckBrooksBro;,rns ValleyCarltonClean'laterCos",osCot tOl1\.Jood
EchoGar field
HallockLong PrairieMadeliaPine CityRed Lake Falls
HardHickHayfieldHendricksHoffmanIsantiLafayetteLake BentonLa PorteNeadO\ollandsHi7pahHorris to'.;n
RenvilleRush CitySlaytonTrumanWarroad
NassauNeiolfoldenNew HarketOgilvieRevereRockfordSt. LeoTHin LakesHalthamHilliarnsHilmont
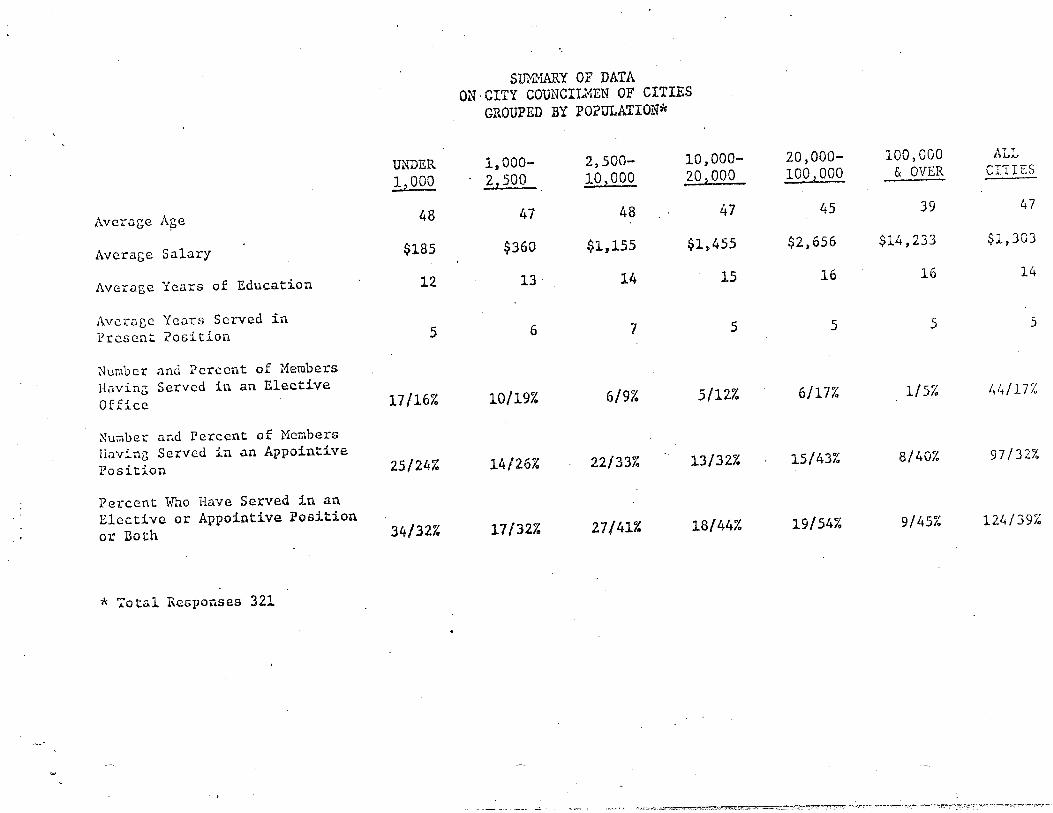
Sl1MYlARY OF DATAON·CITY COUNCILY,EN OF CITIES
GROUPED BY POPULATION*
UNDER 1,000- 2,500- 10,000- 20,000- 100,000 ALL
1,000 2,500 10,000 ,20) 000 100,000 & OVER CITIES
Avcl".:lge Af;e 48 47 48 47 45 39 47
Average Salary $185 $360 $1,155 $1,455 $2,656 $14,233 $1,303
Average Years of Education 12 13· 14 15 16 16 14
AvcrllCc Ycars Served inPresent Position 5 6 7 5 5 5 5
~u~ber and Percent of MembersHavin<; Served in an ElectiveOffice 17/167- 10/197- 6/9% 5/12% 6/17% 1/5% 44/1n
~umber and Percent of MembersHaving Served in an AppointivePosition 25{24% 14/26% 22/33% 13/32% 15/43% 8/40% 97/32%
Percent Who Have Served in anElective or Appointive Positionor noth 34/32% 17/32% 27/41% 18/44% 19/54% 9/45% 124/39/;
* Total Responses 321
n_~",",t"<J.$,:,~~."·"L-··~··~\t~~_";J_>.. ':.I·-:::::.....~~·~·-,-...c~_"'l''''''~'·~~~"':'· ...,......"'·,~~..",._~"' ...,..,,~.~',~,.,.~',,: ..;.'~~~.".~""" ..:"f"rc"..~_~, __"';_~.,~
I,
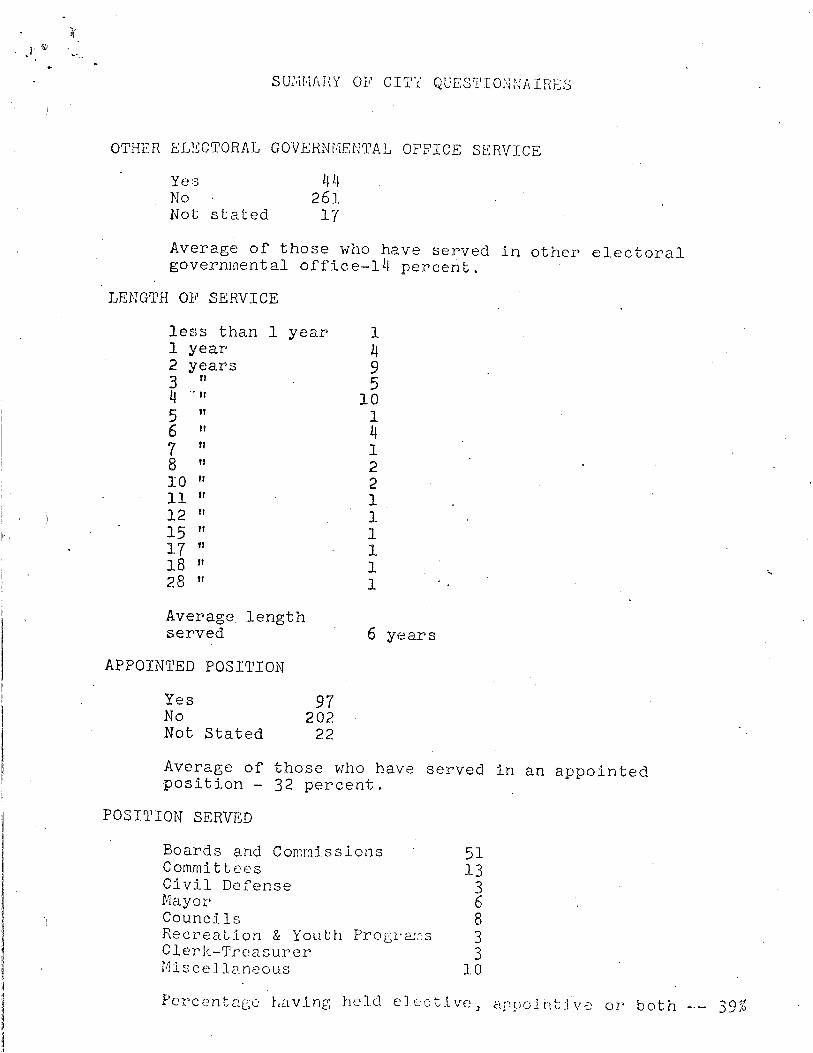
OTHER ELECTORAL GOVERNMENTAL OFFICE SERVICE
Yes 44No 261Not stated 17
Average of those who have served in other electoralgovernmental office-14 percent.
LENGTH OF SERVICE
less than 1 year 11 year 42 years 93 II 54 .. " 105 II 16 It 47 II 18 " 210 II 211 II 112 tI 115 II 117 II 118 II 128 tl 1
Average lengthserved
APPOINTED POSITION
Yes 97No 202Not Stated 22
6 years
Average of those who have served in an appointedposition - 32 percent.
POSITION SERVED
Boards and Commissions 51Committees 13Civil Defense 3Mayor 6Councils 8Recreation & Youth Progr2~s 3Clerk-Treasurer 3Miscellnneous 10
f'Cl'cent cl C;c havIng heJel elective, c~P1ioinLLve or both -- 39%
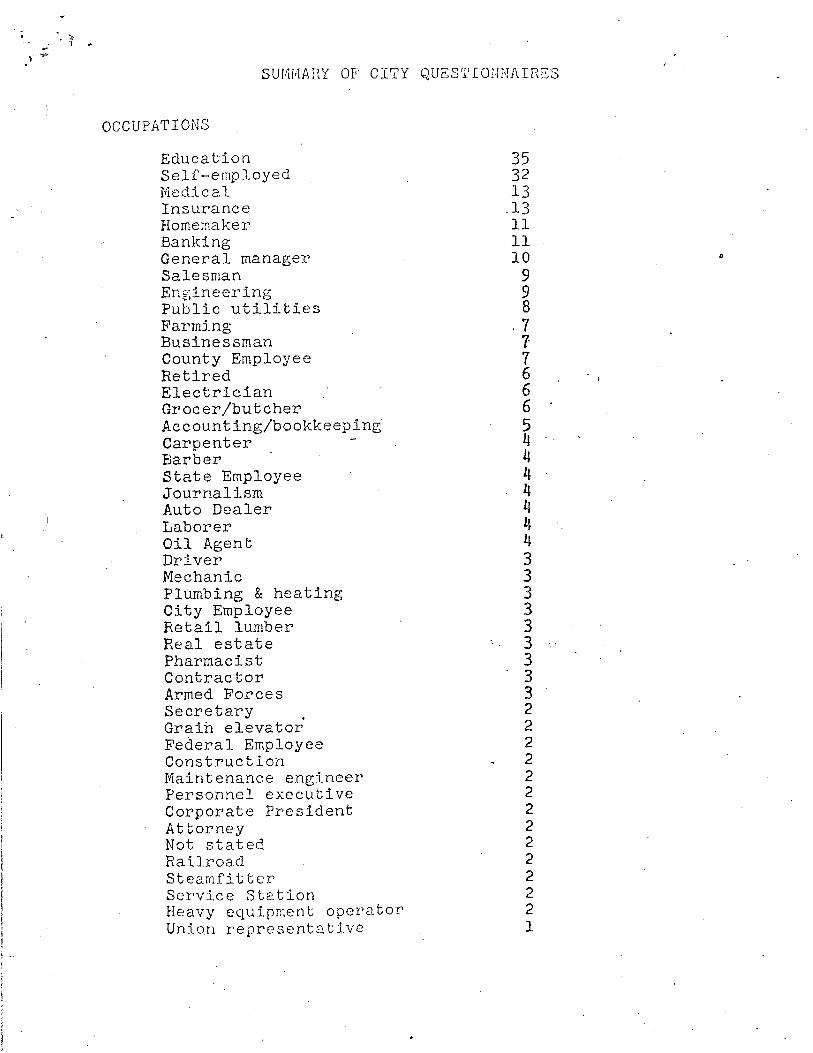
SUf1filARY OF CI'l'Y QUES'1' ImmAIRES
OCCUPA'l'IONS
EducationSelf-employed.filedicalInsuranceHomemakerBankingGeneral managerSalesmanEnE:ineeringPublic utilitiesFarmingBusinessmanCounty EmployeeRetiredElectricianGrocer/butcherAccounting/bookkeepingCarpenterBarberState EmployeeJournalismAuto DealerLaborerOil AgentDriverMechanicPlloobing & heatingCity EmployeeRetail lumberReal estatePharmacistContractorArmed ForcesSecretary .Grain elevatorFederal EmployeeConstructionMaintenance engineerPersonnel executiveCorporate PresidentAttorneyNot statedRailroadSteamfitterServi.ce StationHeavy equipment operatorUnion representative
353213
.13111110
998
.7776665444444433333333322222222222221
•
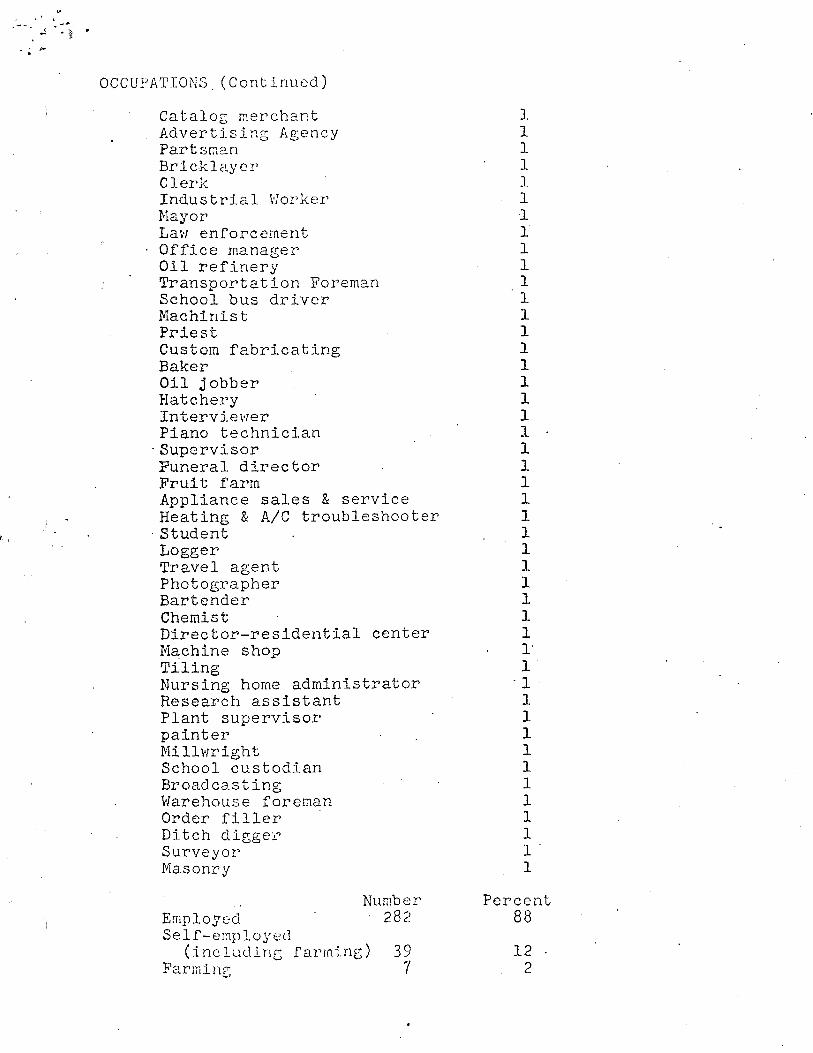
OCCUPATIONS (Continued)
t.,
Catalog n:erchantAdvertising AgencyPartsr;:anBricklayerClerkIndustrial WorkerNayorLa\'! enforcementOffice managerOil refineryTransportation ForemanSchool bus driverNachinistPriestCustom fabricatingBakerOil jobberHatcheryIntervie\'ferPiano technician
'SupervisorFuneral directorFruit farmAppliance sales & serviceHeating & AIC troubleshooter
. StudentLoggerTravel agentPhotographerBartenderChemistDirector-residential centerNachine shopTilingNursing home administratorResearch assistantPlant supervisorpainter1\11 Ill-frightSchool custodianBroadcastingWarehouse foremanOrder filler 'Ditch digge:i.'>SurveyorMasonry
11111111111111111111111111111111I'l'
'I111111111I'1
122
Percent88
397
Number282Employed
Se 1 f-el:1p loyecl(inclu.dine; farrnine)
Parmlnr-~,
MINNESOTA HOUSE OF REPRESENTATIVES
RESEARCH DEPARTHENT
The HOUSE OF REPRESENTATIVES RESEARCH DEPA]j}ffiNT WqS establishedin 1967 to assist Representatives in the development, introduction,and evaluation of legislation. The department is non-partisanand serves the entire membership of the House. All work forRepresentatives is carried out in an objective manner and aconfidential relationship with each Representative is preserved.
During the LEGISLATIVE SESSION each legislative analyst in thedepartment works in one or more areas and is available as aresource person to the corresponding House committee. Analystsalso provide research assistance, issue analysis and backgroundinformation directly to House members.
During the INTERIM the department conducts in-depth research onpertinent issues and provides research support for active committees.The staff develops materials and drafts legislation and amendmentsfor the committees. Analysts also continue to provide researchassistance to individual House members.