profile of sustainability in some mediterranean tourist destinations · 2015-08-04 · 5...
TRANSCRIPT

Profile of sustainability in some Mediterranean tourist destinations
Synthesis: Cabras and Castelsardo, Sardinia (Italy) Based on the case studies by Alessio SATTA, Barbara PINTUS, Manuela PUDDU
Loïc BOURSE
Plan Bleu UNEP/MAP Regional Activity Centre
Sophia Antipolis October 2011


The study is financed under the FEMIP Trust Fund. This Fund, which was established in 2004 and has been financed – to date – by 15 EU member States and the European Commission, is intended to support the development of the private sector via the financing of studies and technical assistance measures and the provision of private equity.
This study also benefited from the support of:
The analysis and conclusions of this report do not necessarily reflect the option of the European Investment Bank, nor of the Agencia Española de Cooperación para el Desarrollo, nor of the Agence Française de Développement.

3
CONTENTS
Introduction 5
I. Tourism and economic development 8 1. Changes in the tourism offer and demand .................................................................................. 8 2. Revenue from tourism ......................................................................................................... 10
II. Tourism and socio-territorial development 11
III. Tourism and the environment 13 1. Water and energy consumption; production and treatment of solid and liquid waste ............................. 13 2. Land pressure associated with tourism ..................................................................................... 15 3. Biodiversity ....................................................................................................................... 17
IV. Tourism and governance 18
Conclusion 19
Bibliography 21
List of figures and tables 22
Appendices 23

5
Introduction The case studies by Satta and al. on Cabras and Castelsardo in Sardinia (Italy) are part of the Plan Bleu project “Profiles of sustainability in some Mediterranean tourist destinations”. It is based on an experimental method and involves measuring and assessing the impacts of tourism from the perspective of the key goals of the Mediterranean Strategy for Sustainable Development (MSSD), and taking into account environmental, social and economic issues in the destinations studied. A “profile of sustainability” has been produced for eleven tourist destinations1 across eight Mediterranean countries using the DPSIR approach (Drivers – Pressures – State – Impacts – Responses).
Firstly, the sustainability of the destination was studied using economic performance indicators (e.g. accommodation occupancy rates), territorial, demographic and sociological indicators (e.g. the effect of seasonality on employment, income levels of the local population, the quality of essential amenities and services) and environmental indicators (e.g. damage to the landscape associated with coastal development). Secondly, thought was given to political measures that could be taken to improve the sustainability of the destination. This systemic and territorial approach was used to examine the destination, which is the basic unit of tourism development, as well as taking into account several different levels (local, national and regional) and the various stakeholders across the region, while relating the Mediterranean tourist system with the other priority areas from the MSSD: water, transport, waste, energy, etc.
In selecting the destinations to be studied, Plan Bleu defined a methodology requiring that each destination studied should be an administrative unit on the Mediterranean coast with significant international and/or domestic tourism, that is also home to a permanent population but is not a major city. Based on the variables identified and the data supplied by the experts who authored the case studies, Plan Bleu proposed a classification of destinations (Figure 1):
- Type one (Torremolinos, Alanya and Djerba) are international destinations with extensive tourist amenities, and are characterised by a range of hotel accommodation, particularly 4 and 5 star hotels, with a wide selection of leisure activities (health spas, marinas, golf courses, casinos, etc.) and a dependence on tour operators (TO). The sea, beach and associated activities are the main attraction, so these mass tourism destinations are referred to as “3 S” destinations (Sea, Sand and Sun).
- Type two (El Alamein, Siwa Oasis and Marsa Matrouh) are domestic destinations with extensive tourist amenities, and are characterised by mainly hotel accommodation (4 and 5 stars) with leisure amenities (health spas, marinas, golf courses, casinos, etc.) and a significant range of cultural centres and/or historical sites. Type two destinations are distinguished from type one on the basis of the origin of the tourists - internal demand as opposed to foreign tourists.
- Type three (Cabras, Castelsardo, the Tetouan coast and Tipaza) are destinations attracting domestic tourists who mainly stay in accommodation other than hotels (residential accommodation, bed and breakfasts, camp sites, etc.). Other factors that attract tourists to these destinations are their significant cultural and natural heritage (markets selling local products, nature reserves, etc.).
- Type four (Rovinj) are destinations that are in rejuvenation phase, and represent destinations with primarily international customers, where Tour Operators do not play a significant role and whose accommodation options are primarily facilities other than hotels.
1 Torremolinos (Spain), Cabras and Castelsardo (Sardinia, Italy), Rovinj (Croatia), Alanya (Turkey), El Alamein, Marsa Matrouh and Siwa Oasis (Egypt), Djerba (Tunisia), Tipaza (Algeria), the Tetouan Coast (Morocco).

6
Figure 1: Graph showing the types of tourist destinations studied
Source: Principal Component Analysis by Loïc Bourse based on data produced by the experts and processed by Ioannis Spilanis, 2011. Guide (see also Figure 16 in the Appendix): Axes 1 and 2 explain 64% of the data variance. Axis 1 alone explains 39% of the information:
- on the right side, it represents domestic tourism with visitors using accommodation other than hotels (residential accommodation or camping), focusing on cultural products (e.g. markets selling local goods, craft demonstrations, etc.) and/or natural features (e.g. national parks, nature reserves and marine nature reserves);
- on the left side, it represents the international character of tourism characterised by widespread use of charter planes (influence of Tour Operators), extensive tourist amenities and a high density of hotel accommodation in the administrative area.
Axis 2 explains 25% of the information: - on the top part, it represents tourism characterised by international visitors using accommodation other than hotels; - on its bottom part, it represents tourism with extensively equipped hotels with historical sites and primarily domestic visitors.
Cabras and Castelsardo fall under the category “domestic tourist destinations with significant cultural and natural heritage”. Cabras is characterised by mainly domestic customers, Bed & Breakfast (B&B), camping and residential accommodation, as well as well as a rich natural and cultural heritage (Figure 1). Visitors to Castelsardo are predominantly domestic tourists and the main difference between Cabras and Castelsardo lies in the type of accommodation offered: in Castelsardo, the majority is hotel accommodation (Figure 1). Furthermore, Castelsardo places more emphasis on promoting its historical and architectural heritage while Cabras promotes the quality of the natural environment and its marine protected area (MPA) to attract visitors. In both cases, tourism began being developed in the 1990s, which makes Cabras and Castelsardo emerging tourist destinations. This accounts for Cabras being in involvement phase and Castelsardo in development phase (Figure 2).

7
Figure 2: Interpretation of “domestic tourist destinations with significant cultural and natural heritage” based on the Butler model (BUTLER 1980)
Emergence of the destination: 1990s
Emergence of the destination: 1990s
Source: The data was produced by experts then scaled and centred, Bourse, 2011.
Two main factors have played a role in promoting tourism in Sardinia:
- the improvement of transportation networks in the 1960s (improvement of maritime transport, a railway line and development of road networks) (BERGERON 1973);
- government support through the regional Ministry of Tourism and the Office of Tourism Development, which implemented a funding policy to attract investors and incentives to encourage tourists to visit Sardinia (reductions on transportation costs) (BERGERON 1973).
The development of transportation routes and tourism was instrumental both in opening up the island to the rest of the world and improving economic performance in Sardinia, although agriculture remains the main economic sector. However, negative externalities were also generated, particularly with respect to coastal development. Up until the 1950s, Alghero was the only proper tourist destination and was visited mainly by a wealthy British clientele. In the 1960s, the eastern and northern parts of the island began to see extensive tourist development with the construction of marinas (BERGERON 1973). Along with the development of “sea tourism” and urbanisation came the migration of the Sardinian population and the tourist clientele. Tourism has therefore been a aggravating factor in overpopulation and high population densities in the main port towns and municipalities (GENTILESCHI 1991).
On the basis of these observations, and with a view to presenting the Cabras and Castelsardo profile of sustainability, this summary of the case study is structured in four sections – corresponding to the four main variables identified in the MSSD (PLAN BLEU 2009) – through which we will discuss various indicators (SPILANIS & VAYANNI 2011), in particular:
- economic indicators: the number of hotel beds, the number and size of accommodation facilities, occupancy rates, the effect of seasonality and revenue per bed;
- environmental indicators: water and energy consumption, production and treatment of solid and liquid waste, land pressure and biodiversity;

8
- “governance” indicators: implementation of an internationally-defined model of governance, local governance practices and the categories of stakeholders involved in governance.
In the conclusion, we will bring these four variables together in graphic form and assess the state of sustainability at the destination, then we will present Satta et al.’s proposals for political measures with regard to the improvement of sustainability in Cabras and Castelsardo.
I. Tourism and economic development The data produced by Satta and al. is presented below in order to summarise the consequences and economic impact of tourism for Cabras and Castelsardo, focusing on changes in the tourism offer and revenue from tourism.
1. Changes in the tourism offer and demand With respect to changes in the tourism product, the accommodation offer must first be examined. Tourism in Cabras and Castelsardo is mainly based on promoting leisure and exploration activities centred on the natural heritage and showcasing cultural heritage, focusing mainly on gastronomy. Cabras is therefore characterised by a heritage tourism product which focuses on nature and culture in addition to water sports. 90% of the accommodation offer in Cabras is based on establishments “other” than hotels (Figure 3 (a)): camping is the most widely offered accommodation with 785 campsites, followed by residential accommodation (376 beds), B&B (250 beds) and farm accommodation (192 beds). Hotels represent only about 10% of the total offer (Figure 3 (a)), with 158 beds available as follows: 98 beds in 1, 2 and 3 star hotels and 20 beds in 4 and 5 star hotels.
Figure 3: Changes in the tourist accommodation offer in Cabras and Castelsardo based on the number of beds and spaces (%
of the total accommodation offer)
Source: Data provided by Satta and al., 2011.
The accommodation offer in Castelsardo is different from Cabras as it relies mainly on hotels, which make up more than 50% of the total offer. However, with 46.6% of the total offer in 2007, establishments “other” than hotels are a growing portion of the accommodation offer (Figure 3 (b)). The “other” category has therefore surpassed entry-level hotel accommodation, which has fallen below 40%. Nevertheless, hotels remain the main accommodation in Castelsardo and although the entry-level hotel offer has been declining since 2007, the luxury hotel offer has increased with roughly 20% of the total accommodation offer. Another characteristic that is different from Cabras is the “other” accommodation category, which relies less on camping and rather on residential accommodation (331 beds) and accommodation in religious establishments (220 beds); B&Bs and hostels round out the offer with 135 and 65 beds respectively.

9
Another element to be examined in terms of tourism demand is seasonality. The occupancy rates in Cabras and Castelsardo remain low. The best rates for these destinations were measured in August 2007, with 24.30% for Cabras and 40% for Castelsardo (Figure 4 (e) and (f)). The seasonal factor is a major phenomenon for both destinations as tourism activities operate for seven months in Castelsardo (early April to mid-October) and just four months in Cabras (early May to late September).
Figure 4: Changes in monthly occupancy rates for tourist accommodation in Cabras and Castelsardo
Source: Data collected by Satta and al., 2011.
The highly seasonal nature of tourism can be explained by several factors:
(1) The geographical location of Cabras (the destination is far from ports and airports and therefore the destinations that attract the most tourists, i.e. southern Sardinia), means it comes right at the end of the tourist circuit in Sardinia. In most cases, the tourists who stay in Cabras have already visited other sites on the island and end their holiday by spending just a few days in the town. In fact, the average length of stay is short and has become even shorter, falling from 4.5 days in 1996 to 2.46 days in 2006, which has a negative impact on the economic performance of accommodation establishments. Furthermore, the composition of the tourist clientele does not allow the effects of seasonality to be counter-balanced. Cabras attracts mainly domestic visitors (in 2009, 65% of overnight stays were spent by nationals) travelling to the destination for
10
summer holidays (Figure 4 (c)). Therefore, despite the fact that the number of foreigners is increasing, from a few hundred in 1996 to 5000 in 2006, foreign demand is not high enough to reduce the effects of seasonality. On the one hand there are not enough foreigners, and on the other, they visit Cabras during the same time of year as the domestic tourists (Figure 4 (a)).
(2) Seasonal effects are less significant in Castelsardo than in Cabras. The first reason can be explained by the fact that Castelsardo is a larger destination in terms of accommodation capacity, making it a proper holiday destination and not just a stopover. The second reason lies in the presence of leisure activities in addition to the natural, historical and architectural heritage, making Castelsardo a product that is marketed through the traditional channels of travel agencies and all inclusive packages. However, figures 4 (b), 4 (c) and 4 (d) show that the seasonal factor is a phenomenon resulting mainly from the type of demand: in 2009, domestic tourists represented 69.12 % of overnight stays compared to 30.8% for foreigners. Furthermore, despite the fact that the number of foreign visitors is on the increase, from 8,829 overnight stays in 2005 to 32,593 in 2009, it is not yet high enough to balance total “domestic + foreign” demand.
Finally, in both Cabras and Castelsardo, the main factor attracting tourists is water-related leisure activities that can for the most part only be enjoyed in the summer. The cultural heritage of Castelsardo does however contribute to slightly reducing the effects of seasonality.
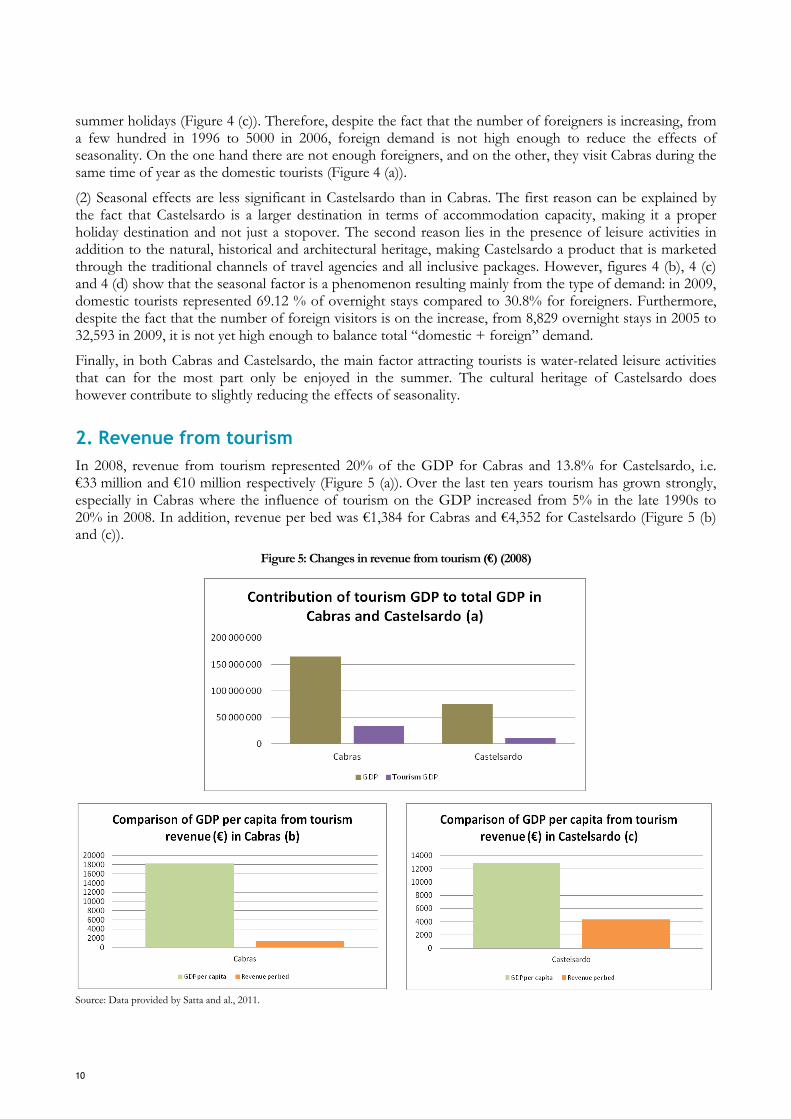
2. Revenue from tourism In 2008, revenue from tourism represented 20% of the GDP for Cabras and 13.8% for Castelsardo, i.e. €33 million and €10 million respectively (Figure 5 (a)). Over the last ten years tourism has grown strongly, especially in Cabras where the influence of tourism on the GDP increased from 5% in the late 1990s to 20% in 2008. In addition, revenue per bed was €1,384 for Cabras and €4,352 for Castelsardo (Figure 5 (b) and (c)).
Figure 5: Changes in revenue from tourism (€) (2008)
Source: Data provided by Satta and al., 2011.

11
By comparing the revenue per bed with the GDP per person in 2008, which was €18,268 in Cabras, or roughly €2,000 more than the average in Sardinia, and €12,838 in Castelsardo, or roughly €3,500 less than the average in Sardinia, the following observation can be made: the destination where tourism plays the greatest influence on the GDP (Cabras) is the destination where revenue per bed is the lowest, but also where the GDP per person is the highest. Though surprising, this observation could lead to the following conclusion: although Cabras has a low accommodation capacity, less than 20,000 visitors per year, is strongly affected by seasonality, and has short average stays, it nonetheless has better economic results than Castelsardo. However these conclusions are most likely distorted by the influence of the informal economy in tourism-related activities; the real economy of tourism is significantly under-estimated. The calculations do not take into account the underground economy which, according to Satta et al., accounts for roughly 80% of the island’s economy; that leaves just 20% for the official and declared economy.
II. Tourism and socio-territorial development Demographic changes do not follow the same trends in Cabras and Castelsardo. In Cabras, after a period of demographic decline, the population has grown slowly from 8,972 residents in 1993 to 8,701 residents in 2003 and 9,092 in 2009. The population of Castelsardo has grown steadily over the last twenty years, increasing from 5,235 residents in 1992 to 5,815 in 2009. In both cases, demographic growth remains low and can be explained by several factors:
- population growth is highly dependent on natural increase, which remains low (0.75% for Cabras and 1.31% for Castelsardo);
- a weak though positive net migration rate which, as a result, has little effect on demographic growth (the migration rate in Castelsardo is 0.37% and 0.12% in Cabras, after being negative in the early 2000s);
- the aging population (in Castelsardo, the number of individuals over the age of 65 was 1,105 for a total population of 5,235 people, i.e. 21% of the total population; in Cabras, there were 1,740 individuals over the age of 65 for a total population of 9,092 inhabitants, i.e. 19% of the total population).
Figure 6: Demographic changes for Cabras and Castelsardo (2002-2008)
Source: Based on Satta and al.’s data, 2011.
In general, neither destination attracts people of working age, thus creating direct repercussions on the demographics of these towns. People of working age leave the area and fewer people of child-bearing age remain. As a result, the rate of natural increase remains low and there is an increase in the number of elderly people. The growing number of retirees moving into residential areas is another type of population movement that adds to this phenomenon.

12
Consequently, while the population movements tend to suggest that the destinations studied are not areas that attract active populations despite a relatively significant tourism sector in the local economy, the question can be raised as to what employment opportunities these territories offer. Figure 7 (a) shows that the employment structure relies mainly on the service sector, which accounts for roughly 60% of jobs in the area. The economic fabric of these destinations is also made up agriculture in Cabras and industry and construction work in Castelsardo.
Figure 7: Share of tourism in the number of jobs (%) (2001)
Source: Data provided by Satta and al., 2011.
In 2001, jobs in tourism accounted for 10% of employment in the service sector in Cabras and 41% in Castelsardo (Figure 7 (b)). Gender inequalities in terms of access to tourism-related jobs is also seen with fewer woman employed than men. A significant difference between the two destinations can nevertheless be observed as there is little discrimination against women in Cabras in comparison with Castelsardo. Women represent 49% of tourism jobs in Cabras, as opposed to just 32% in Castelsardo.
Furthermore, Figure 8 (a) highlights the large number of seasonal contracts. In 2008, 78% of jobs in the tourism sector in Castelsardo were seasonal contracts. In addition, Figure 8 (c) shows that, in all sectors, the unemployment rate in Cabras is 18% (18 out of 100 active individuals are unemployed) and 10% in Castelsardo. It should also be noted that the unemployment rate among women is slightly higher than for men.
Therefore in the case of Cabras, in addition to the low profitability per bed, tourism has created few jobs. Based on the “number of jobs created per bed” indicator, 0.23 jobs per bed can be counted for Cabras. In Castelsardo, the ability of the tourism sector to create jobs is not much better. According to the same indicator, tourism only creates 0.25 jobs per bed. Thus by cross-referencing data related to the social impacts of tourism with economic results for these destinations, it can be hypothesised that the GDP value for tourism in Cabras, excluding the underground economy, can only be explained by a high added value based on few employees and a flexible labour force as a result of a high unemployment rate, the availability of family labour and forms of multiple job-holding.

13
Figure 8: Employment conditions in the tourism sector (%)
Source: Data provided by Satta and al., 2011.
III. Tourism and the environment With economic and socio-territorial variables having been examined, the environmental consequences of tourism shall be addressed with respect to three components: water and energy consumption and the production and treatment of solid and liquid waste; the footprint of tourism in terms of land use; the state of biodiversity in Cabras and Castelsardo.
1. Water and energy consumption; production and treatment of solid and liquid waste Firstly, several observations can be made for both destinations with respect to the question of water. The first observation concerns the amount of drinking water lost in the water mains network (Figure 9 (a)). According to Satta and al.’s data, 357,055 m3 of water is lost annually in Castelsardo and 456,996 m3 in Cabras, in other words, 37% of the drinking water produced for each destination (water mains network efficiency approximately 63%). The second observation pertains to the small proportion of total drinking water consumed by tourism (Figure 9 (b)): tourism accounts for 1.38% of total water consumption in Cabras and 8.89% in Castelsardo. It might therefore be concluded that tourism has little impact on water resources. Indeed, the water tourism consumption amounted to 0.46 m3 per night for each of the two destinations. Furthermore, in 2006, Sardinian Governament drew an "Acqueducts Plan" and they made an extimation of water demand until 2041, considering both residents and tourists, and dimensioned the network according to these requirments.

14
Figure 9: Capacity to supply water consumption in the tourism sector (m3) (2008)
Source: Data provided by Satta and al., 2011.
As for electricity consumption, tourism accounts for 10% of total consumption in Cabras and 16% in Castelsardo. Although tourism has a relatively low impact on energy consumption, it is important to note that in just four years the electricity consumed annually by tourism increased by 68% in Castelsardo, from 718,229 Kwh in 2001 to 1,209,812 Kwh in 2005, and by 63% in Cabras, from 570,121 Kwh in 2001 to 929,809 Kwh in 2009. This trend of increasing energy consumption can be seen in the total consumption for all uses. Two theories can be put forward to explain this phenomenon: a larger population and the increased use of electrical equipment in tourist accommodations and homes (thermal comfort during the summer, air-conditioning).
Figure 10: Relationship between annual electricity consumption from tourism and total annual consumption in Kwh
Source: Data provided by Satta and al., 2011.
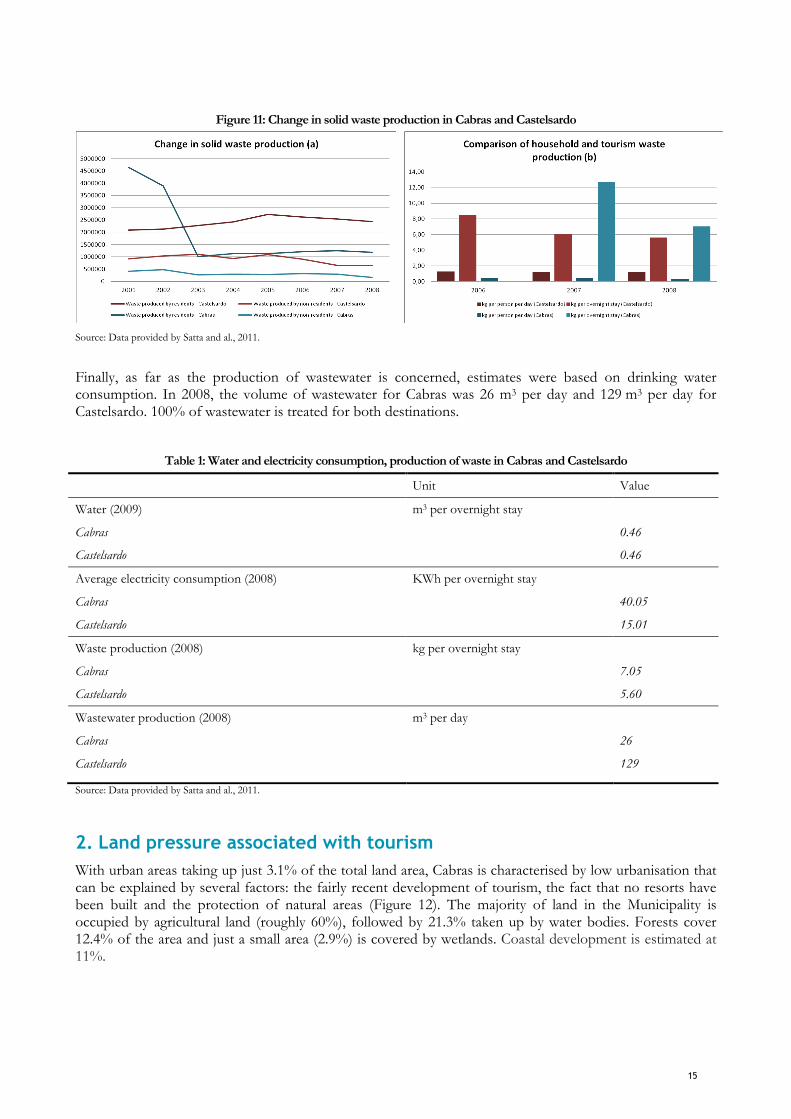
Concerning the total production of solid waste, a significant decrease since 2003 can be observed for Cabras whereas Castelsardo has seen a constant rise (Figure 11 (a)). The production of solid waste specifically from tourism seems to have decreased in both destinations. This can be explained by the decrease in overnight stays spent by tourists since 2006 in both destinations. In 2008, the average production of solid waste from tourism was 5.6 kg per overnight stay in Castelsardo and 7.05 kg per overnight stay in Cabras (Figure 11 (b)). These results are much higher than the national average which is roughly 1.5-1.8 kg per person per day. This could mean that a large number of tourists are not recorded.
15
Figure 11: Change in solid waste production in Cabras and Castelsardo
Source: Data provided by Satta and al., 2011.
Finally, as far as the production of wastewater is concerned, estimates were based on drinking water consumption. In 2008, the volume of wastewater for Cabras was 26 m3 per day and 129 m3 per day for Castelsardo. 100% of wastewater is treated for both destinations.
Table 1: Water and electricity consumption, production of waste in Cabras and Castelsardo
Unit Value
Water (2009) m3 per overnight stay
Cabras 0.46
Castelsardo 0.46
Average electricity consumption (2008) KWh per overnight stay
Cabras 40.05
Castelsardo 15.01
Waste production (2008) kg per overnight stay
Cabras 7.05
Castelsardo 5.60
Wastewater production (2008) m3 per day
Cabras 26
Castelsardo 129
Source: Data provided by Satta and al., 2011.
2. Land pressure associated with tourism With urban areas taking up just 3.1% of the total land area, Cabras is characterised by low urbanisation that can be explained by several factors: the fairly recent development of tourism, the fact that no resorts have been built and the protection of natural areas (Figure 12). The majority of land in the Municipality is occupied by agricultural land (roughly 60%), followed by 21.3% taken up by water bodies. Forests cover 12.4% of the area and just a small area (2.9%) is covered by wetlands. Coastal development is estimated at 11%.
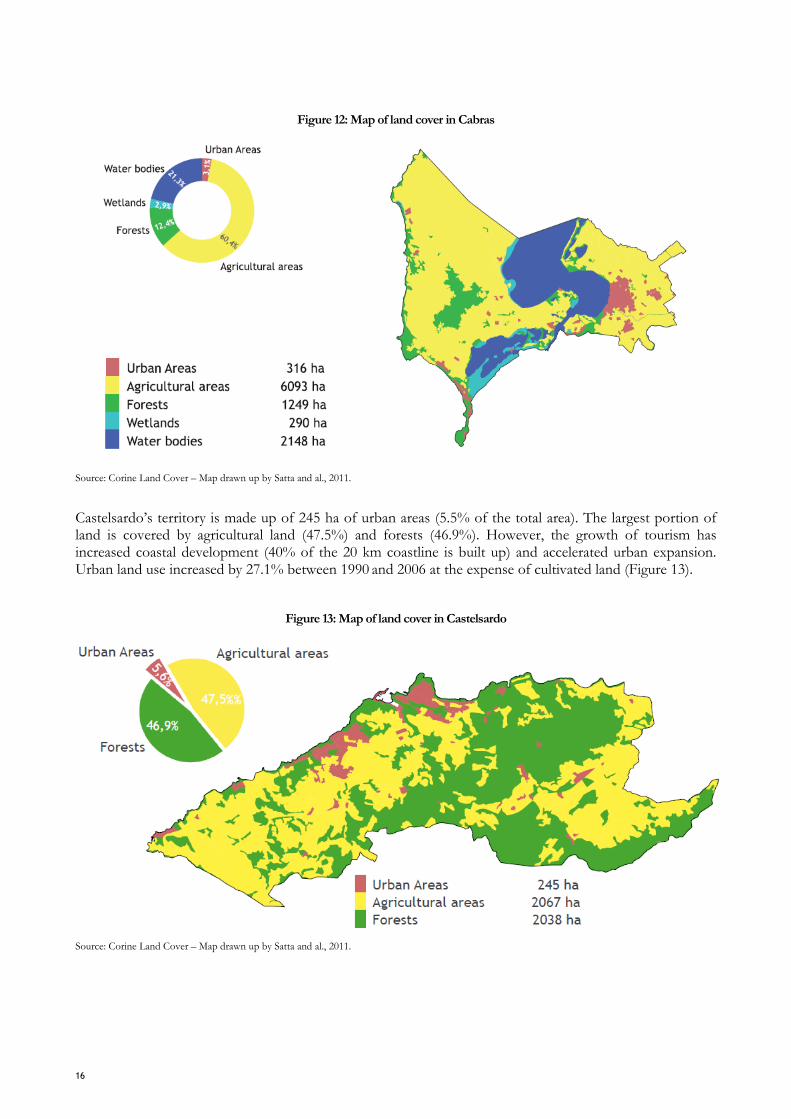
16
Figure 12: Map of land cover in Cabras
Source: Corine Land Cover – Map drawn up by Satta and al., 2011.
Castelsardo’s territory is made up of 245 ha of urban areas (5.5% of the total area). The largest portion of land is covered by agricultural land (47.5%) and forests (46.9%). However, the growth of tourism has increased coastal development (40% of the 20 km coastline is built up) and accelerated urban expansion. Urban land use increased by 27.1% between 1990 and 2006 at the expense of cultivated land (Figure 13).
Figure 13: Map of land cover in Castelsardo
Source: Corine Land Cover – Map drawn up by Satta and al., 2011.

17
3. Biodiversity Cabras and Castelsardo are located in an area of significant marine biodiversity where four species are threatened (Figure 14 (c) and (d)). The local authorities in Cabras, with the support of the regional and national government, have created a Marine Protected Area (MPA), as well as Sites of Community Importance (SCI) and Special Areas of Conservation (SAC). These areas cover a total of 294 km2 managed by the Municipality of Cabras. However when the MPA was created in 1997 in Cabras, residents were quite reluctant: families of fisherman perceived the move as bringing more difficulties than advantages. With relaxed restrictions granted as a result of pressure from fisherman, the enhanced visibility of the destination with MPA status, new infrastructures and recovery of a portion of the public and international funds that come with the status, it is undeniable from listening to the locals that they are now enthusiastic about preserving their environment. With tourism continuing to grow, there is less feeling of being invaded by tourists as the MPA has generated economic benefits: international tourists come to Cabras specifically because it is a protected environment.
Figure 14: Cabras and Castelsardo and Mediterranean biodiversity, as defined by the IUCN (CUTTELOD and al. 2008)
a. Species richness of terrestrial amphibians, mammals, dragonflies and reptiles in the Mediterranean basin.
b. Species richness of threatened terrestrial amphibians, mammals, dragonflies and reptiles in the Mediterranean basin.
c. Species richness of marine mammals in the Mediterranean Sea.
d. Species richness of threatened marine mammals in the
Mediterranean Sea.
Source: CUTTELOD, A. and al., 2008. The Mediterranean : a Biodiversity Hotspot under Threat. The IUCN Red List of Threatened Species.

18
IV. Tourism and governance Tourism in Cabras and Castelsardo is mainly governed through political measures aimed at protecting the environment. This “environmental governance of tourism” involves several levels of territorial governance in producing standards and implementing regulatory frameworks.
The first level is the international level. In 1992, the United Nations drafted Agenda 21, a global regulatory framework based on voluntary participation, that is then implemented at national and local levels. In Cabras, Agenda 21 is manifested through two projects: the PONTIS project and the “A21 Progetto Pilota”. The actions undertaken within the scope of the PONTIS project aim at involving and informing the public, improving solid waste collection, promoting alternative energy solutions, supporting the production of local products and preserving local biodiversity. The PONTIS project also operates on the basis of a decision-making process which brings together a range of political stakeholders (the Municipality of Cabras), business stakeholders (tourism bodies from the “Cabras Sistema Ospitale”), academic representatives (Cabras primary school, the National Council for Research and the International Marine Centre) and voluntary-sector bodies (Cabras Yachting Association, “Giovanni Marongiu” cultural centre, Italia Nostra, Ippocampos Arborea). Furthermore, the “A21 Progetto Pilota” project aims to implement educational and informative actions with the support of the Environmental Education Centre (CEA).
The second level is the national level. Several actions have been carried out by the Italian government with respect to protecting coastal and marine areas, particularly in terms of managing wastewater and solid waste, sand extraction, managing coastal erosion and protecting marine flora and fauna. These actions form part of a regulatory framework, Decree No. 152/2006, concerning waste management (including hazardous waste), the assessment of environmental impacts and the protection of water. In addition, the Italian Ministry of the Environment, Land and Sea has established the “national system for environmental information, training and education” (INFEA), which dates back to 1995. The aim is to raise public awareness and promote the generation of sustainable energy through a decision-making process that brings together private businesses, public authorities, energy bodies, industrial associations and NGOs.
The third level is the local level, involving the local authorities, the Region and the Municipality. Over the last five years, the Sardinian regional government has developed a strategy based on an operational programme for the period 2007-2013. The programme is divided into four specific sectors: energy, cultural and natural heritage, urban development and the economic competitiveness of Small and Medium Enterprises (SME). Plans have been drafted for each of these sectors: the Sardinia Landscape Plan (PPR), the Regional Sustainable Tourism Development Plan (PRST), the Hydrogeological Network Plan (PAI), the regional forest environment plan (PARPP) and the water protection plan (PTA). These regional plans remain ineffective due to a lack of human and financial resources from the local authorities and a lack of consistency between the actions of the various municipalities, which seem to be somewhat disorganised. Furthermore, the regulatory framework stemming from decentralisation makes the task all the more difficult as initiatives taken by municipalities often conflict with policies defined at the regional level.
Nonetheless, in the case of Cabras, these various plans have provided environmental management tools, leading to awareness-raising campaigns with the local population and tourists. The Municipality of Cabras is particularly active: since 2004, in conjunction with the creation of a Marine Protected Area (MPA), it initiated a tourism planning process, in partnership with local bodies, called “Sardinia – Sinis Peninsula / Penisola del Sinis”. The process uses a systematic approach and is financed by the Municipality of Cabras as well as grants from the Ministry of the Environment and the autonomous region of Sardinia. The objectives of the project are to promote the natural and socio-economic potentials of the region by defining a local tourism product. Several types of stakeholders are involved in this process:
- business operators working to build the identity of the destination around the cultural and natural heritage;
- the network of associations specialised in promoting tourist routes that create opportunities for tourists to meet local artisanal food producers;

19
- small businesses working to promote local artisanal production such as wine, oil, fish and seafood products, etc.
The Municipality of Cabras has supported other initiatives such as the execution of a memorandum of understanding signed by forty farmers aimed at developing and promoting local agriculture.
Conclusion In order to summarise the profile of sustainability for Cabras and Castelsardo, we compared it with the other destinations studied in the “Profiles of sustainability – Mediterranean Destinations” project: a second Principal Component Analysis (Figure 15) compares the sustainability of each destination with the mean and standard deviation2 for all sites studied and for each indicator used, based on the MSSD variables. This second Principal Component Analysis (PCA) does not incorporate information regarding governance because the “governance” variable can be considered more as a component used to explain the results and the economic, social, territorial and environmental impact of tourism on the destinations. In other words, the results observed correlate closely with the policy choices implemented in each destination. For instance, in destinations where the availability of water is not a problematic issue, this is due to the fact that the authorities have invested in infrastructure projects such as dams and desalination plants. In contrast, in destinations where, for instance, the land pressure caused by tourist and residential accommodation facilities is high, this is often because of a failure to enforce the regulatory framework or a lack of regulation, as well as because of property-related and financial speculation.
The PCA results are used to distinguish between four types of “sustainability profile” for the destinations:
- destinations with a high level of economic performance, where social protection offers cohesion and the environmental impact of tourism is high (e.g. Torremolinos),
- destinations that are economically competitive, socially fragmented and where the environmental impact is significant (e.g. Djerba and Alanya),
- destinations that, in economic terms, are emerging or in rejuvenation phase, that are socially fragmented and where the environmental impact is either controlled (e.g. Rovinj) or geographically limited (e.g. Matrouh Governorate),
- destinations whose economic performance is poor, that are socially fragmented and where the environmental impact is low or controlled, but where land pressure is a threat (e.g. Cabras, Castelsardo, Tipasa and the Tétouan Coast).
Cabras and Castelsardo, which are “domestic tourist destinations with significant cultural and natural heritage”, have poor socio-economic performance. These two destinations do have levels of daily spending per tourist that are higher than the mean for the destinations studied, but the wealth generated by tourism (in terms of revenue per bed) is significantly below average, and seasonality is high. From a social standpoint, Cabras and Castelsardo are facing fairly difficult conditions. Tourism creates relatively few jobs and there is a large gap between the active population and the inactive population as a result of high unemployment. This situation is likely to be accentuated by the ageing population and the tradition of emigration out of Sardinia. In contrast with this fairly negative socio-economic performance, the environmental performance and impacts seem positive. However, solid waste management remains a major issue since the production of solid waste through tourism is significantly higher than the mean for the destinations as a whole and infrastructure is currently lagging behind the needs.
2 Standard deviation is the difference between the largest value and the smallest value in a sample.

20
Figure 15 : Graph showing the profiles of sustainability for the tourist destinations studied
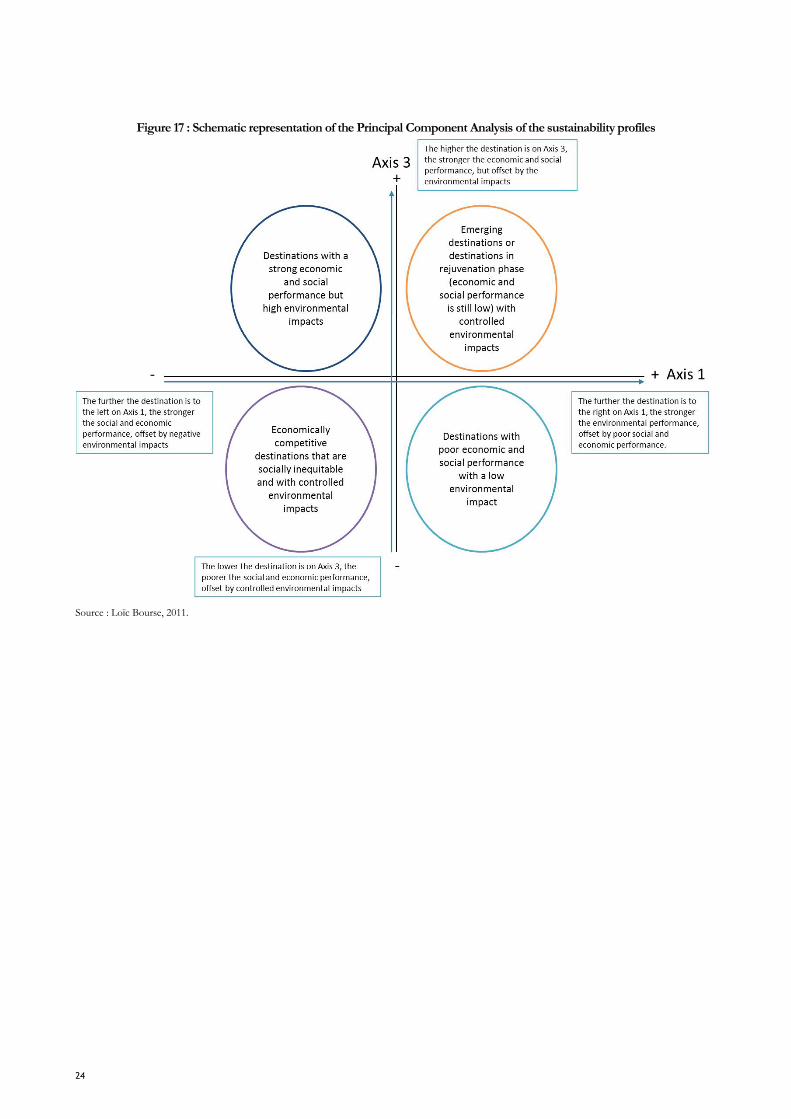
Source: Principal Component Analysis by Loïc Bourse, 2011. Guide (see also Figure 17 in the Appendix): Axes 1 and 3 explain 61% of the data variance. Axis 1 alone explains 53% of the data:
- The further the destination is to the right on Axis 1, the higher the environmental performance and the lower the social and economic performance in the destination,
- The further the destination is to the left on Axis 1, the higher the economic and social performance of the destination, alongside more negative environmental impacts.
Axis 3 explains 8% of the data: - The higher the destination is on Axis 3, the higher the economic and social performance of the destination, with high environmental impacts, - The lower the destination is on Axis 3, the lower the social and economic performance in the destination, with controlled or low environmental
impacts.

21
Bibliography BERGERON, R., 1973. L’évolution récente de l’économie sarde. Revue de géographie de Lyon, 48(1), p.61-97.
BUTLER, R.W., 1980. The concept of a tourist area cycle of evolution: implications for management of resources. Canadian Geographer / Le Géographe canadien, 24(1), p.5-12.
CUTTELOD, A. et al., 2008. The Mediterranean/: a Biodiversity Hotspot under Threat. The IUCN Red List of Threatened Species.
GENTILESCHI, M.L., 1991. Tourisme et peuplement de la côte en Sardinia: les tendances en cours. Méditerranée, 72(1), p.43-53.
PLAN BLEU, 2009. Etat de l’environnement et du développement en Méditerranée, Sophia Antipolis: Plan Bleu, PNUE/PAM.
SATTA, A., PINTUS, B. and PUDDU, M., 2011a. Profile of Sustainability of a tourism destination in Sardinia/: Castelsardo, Sophia Antipolis: Plan Bleu.
SATTA, A., PINTUS, B. and PUDDU, M., 2011b. Profile of Sustainability of a tourism destination in Sardinia/: Cabras, Sophia Antipolis: Plan Bleu.
SPILANIS, I. & VAYANNI, H., 2011. Tourism results and impacts to the destinations’ sustainability, Sophia Antipolis: Plan Bleu.
22
List of figures and tables Figure 1: Graph showing the types of tourist destinations studied ............................................................ 6 Figure 2: Interpretation of “domestic tourist destinations with significant cultural and natural heritage” based on the Butler model (BUTLER 1980) ................................................................................ 7 Figure 3: Changes in the tourist accommodation offer in Cabras and Castelsardo based on the number of beds and spaces (% of the total accommodation offer) ........................................................... 8 Figure 4: Changes in monthly occupancy rates for tourist accommodation in Cabras and Castelsardo .......................................................................................................................................................... 9 Figure 5: Changes in revenue from tourism (€) (2008) .............................................................................. 10 Figure 6: Demographic changes for Cabras and Castelsardo. 2002-2008 ............................................... 11 Figure 7: Share of tourism in the number of jobs (%) (2001) ................................................................... 12 Figure 8: Employment conditions in the tourism sector. (%) .................................................................. 13 Figure 9: Capacity to supply water consumption in the tourism sector (m3) (2008) ............................. 14 Figure 10: Relationship between annual electricity consumption from tourism and total annual consumption in Kwh. ..................................................................................................................................... 14 Figure 11: Change in solid waste production in Cabras and Castelsardo ................................................ 15 Figure 12: Map of land cover in Cabras ....................................................................................................... 16 Figure 13: Map of land cover in Castelsardo ............................................................................................... 16 Figure 14: Cabras and Castelsardo and Mediterranean biodiversity, as defined by the IUCN (CUTTELOD et al. 2008) .............................................................................................................................. 17 Figure 15 : Graph showing the profiles of sustainability for the tourist destinations studied ............. 20 Figure 16: Schematic representation of the classification based on a Principal Component Analysis 23 Figure 17 : Schematic representation of the Principal Component Analysis of the sustainability profiles ............................................................................................................................................................... 24
Table 1: Water and electricity consumption, production of waste in Cabras and Castelsardo ............ 15 Table 2 : Destination Datasheet of Cabras .................................................................................................. 25 Table 3 : Destination Datasheet of Castelsardo .......................................................................................... 26

23
Appendices
Figure 16: Schematic representation of the classification based on a Principal Component Analysis
Source: Loïc Bourse, 2011.
24
Figure 17 : Schematic representation of the Principal Component Analysis of the sustainability profiles
Source : Loïc Bourse, 2011.

25
Table 2 : Destination Datasheet of Cabras
Year Value (1 : yes ; 0 : no)
Demand Residents (%) 2009 75,93% Non-residents (%) 2009 24,06% Charter passengers/total passengers 2009 0% Airport 2011 0 Harbour 2011 0 Accommodation offer Number of beds 2009 976 Hotel beds / total number of beds (%) 2009 8,97% Holiday village beds (%) 2009 0% Other beds (%) 2009 46,45% Campsite spaces (%) 2009 44,58% Leisure amenities Spas / health clubs 2011 0 Sports amenities 2011 1 Casino 2011 0 Golf courses 2011 0 Leisure parks 2011 0 Marinas 2011 1 Conference and exhibition centres 2011 1 Beaches 2011 1 Natural and cultural heritage Historic monuments 2011 1 Places of worship 2011 1 Museums 2011 1 Cultural events (festivals or traditional events) 2011 1 Nature reserves 2011 1 Places selling local products (craft markets) 2011 1 Cultural activities 2011 1 Economic performance Number of overnight stays 2009 22 808 Daily spending per tourist (€) 2009 87 Revenue per bed (€) 2009 1 384 Revenue per overnight stay (€) 2009 90 Seasonality Mean annual occupancy rate 2009 4,16% Social performance Direct employment per bed (number of jobs) 2001 0,25 Unemployment 2001 19,02% Level of education of employees: higher education no data Level of education of employees: secondary education no data Level of education of employees: primary education no data Level of education of employees: no qualifications no data Demographic indicators Total population 2009 9092 Dependent population 2008 30,48% Life expectancy 2008 81,2 yrs Population growth rate 2008 0,88% Migration rate 2008 0,12% Environmental performance Water consumption 2008 0,46 m3/night spent Energy consumption 2005 40,05 kwh/night spent Waste production 2008 7,05 kg/tourist/day Wastewater production 2008 26 m3/day
Land area of tourist accommodation / total area governed by local authority 2009 11,13

26
Table 3 : Destination Datasheet of Castelsardo
Year Value (1 : yes ; 0 : no)
Demand Residents (%) 2009 69,13% Non-residents (%) 2009 30,87% Charter passengers/total passengers 2009 0% Airport 2011 0 Harbour 2011 1 Accommodation offer Number of beds 2010 2017 Hotel beds / total number of beds (%) 2010 61,77% Holiday village beds (%) 2010 0% Other beds (%) 2010 38,23% Campsite spaces (%) 2010 0% Leisure amenities Spas / health clubs 2011 0 Sports amenities 2011 1 Casino 2011 0 Golf courses 2011 0 Leisure parks 2011 0 Marinas 2011 1 Conference and exhibition centres 2011 1 Beaches 2011 1 Natural and cultural heritage Historic monuments 2011 1 Places of worship 2011 1 Museums 2011 1 Cultural events (festivals or traditional events) 2011 1 Nature reserves 2011 0 Places selling local products (craft markets) 2011 1 Cultural activities 2011 0 Economic performance Number of overnight stays 2009 105 570 Daily spending per tourist (€) 2009 89 Revenue per bed (€) 2009 4 352 Revenue per overnight stay (€) 2009 89 Seasonality Mean annual occupancy rate 2009 14,25% Social performance Direct employment per bed (number of jobs) 2001 0,23 Unemployment 2001 10,47% Level of education of employees: higher education no data Level of education of employees: secondary education no data Level of education of employees: primary education no data Level of education of employees: no qualifications no data Demographic indicators Total population 2009 5815 Dependent population 2008 30,82% Life expectancy 2008 81,2 yrs Population growth rate 2008 1,67% Migration rate 2008 0,37% Environmental performance Water consumption 2008 0,46 m3/night spent Energy consumption 2005 15 kwh/night spent Waste production 2008 5,6 kg/tourist/day Wastewater production 2008 129 m3/day
Land area of tourist accommodation / total area governed by local authority 2009 44,35