profile of the pharmaceutical manufacturing industry
TRANSCRIPT

Sector Notebook Project Pharmaceutical Industr y
EPA/310-R-97-005
EPA Office of Compliance Sector Notebook Project:
Profile of the Pharmaceutical M anufactur ing Industr y
September 1997
Office of ComplianceOffice of Enforcement and Compliance Assurance
U.S. Environmental Protection Agency401 M St., SW (MC 2221-A)
Washington, DC 20460
Sector Notebook Project Pharmaceutical Industr y
This report is one in a series of volumes published by the U.S. Environmental Protection Agency (EPA) to provide information of general interest regarding environmental issues associated with specific industrial sectors. The documents were developed under contract by Abt Associates (Cambridge, MA), Science Applications International Corporation (McLean, VA) , and Booz-Allen & Hamilton, Inc. (McLean, VA). This publication may be purchased from the Superintendent of Documents, U.S. Government Printing Office. A listing of available Sector Notebooks and document numbers is included on the following page.
All telephone orders should be directed to:
Superintendent of DocumentsU.S. Government Printing OfficeWashington, DC 20402(202) 512-1800FAX (202) 512-22508:00 a.m. to 4:30 p.m., EST, M-F
Using the form provided at the end of this document, all mail orders should be directed to:
U.S. Government Printing OfficeP.O. Box 371954Pittsburgh, PA 15250-7954
Complimentary volumes are available to certain groups or subscribers, such as public and academic libraries, Federal, State, and local governments, and the media from EPA’s National Center for Environmental Publications and Information at (800) 490-9198. For further information, and for answers to questions pertaining to these documents, please refer to the contact names and numbers provided within this volume.
Electronic versions of all Sector Notebooks are available free of charge at the following web address: www.epa.gov/oeca/sector. Direct technical questions to the “Feedback” button at the bottom of the web page.
Cover photographs courtesy of Pharmaceutical Research and Manufacturers of America.
Sector Notebook Project ii September 1997

Sector Notebook Project Pharmaceutical Industr y
Sector Notebook Contacts
The Sector Notebooks were developed by the EPA’ s Office of Compliance. Questions relating to the Sector Notebook Project can be directed to:
Seth Heminway, Coordinator, Sector Notebook ProjectUS EPA Office of Compliance401 M St., SW (2223-A)Washington, DC 20460(202) 564-7017
Questions and comments regarding the individual documents can be directed to the appropriate specialists listed below.
Document Number Industr y EPA/310-R-95-001. Dry Cleaning IndustryEPA/310-R-95-002. Electronics and Computer Industry*EPA/310-R-95-003. Wood Furniture and Fixtures IndustryEPA/310-R-95-004. Inorganic Chemical Industry*EPA/310-R-95-005. Iron and Steel IndustryEPA/310-R-95-006. Lumber and Wood Products IndustryEPA/310-R-95-007. Fabricated Metal Products Industry*EPA/310-R-95-008. Metal Mining IndustryEPA/310-R-95-009. Motor Vehicle Assembly IndustryEPA/310-R-95-010. Nonferrous Metals IndustryEPA/310-R-95-011. Non-Fuel, Non-Metal Mining IndustryEPA/310-R-95-012. Organic Chemical Industry*EPA/310-R-95-013. Petroleum Refining IndustryEPA/310-R-95-014. Printing IndustryEPA/310-R-95-015. Pulp and Paper IndustryEPA/310-R-95-016. Rubber and Plastic IndustryEPA/310-R-95-017. Stone, Clay, Glass, and Concrete IndustryEPA/310-R-95-018. Transportation Equipment Cleaning Ind.EPA/310-R-97-001. Air Transportation IndustryEPA/310-R-97-002. Ground Transportation IndustryEPA/310-R-97-003. Water Transportation IndustryEPA/310-R-97-004. Metal Casting IndustryEPA/310-R-97-005. Pharmaceuticals IndustryEPA/310-R-97-006. Plastic Resin and Man-made Fiber Ind.EPA/310-R-97-007. Fossil Fuel Electric Power Generation Ind.EPA/310-R-97-008. Shipbuilding and Repair IndustryEPA/310-R-97-009. Textile IndustryEPA/310-R-97-010. Sector Notebook Data Refresh-1997EPA/310-R-98-001. Aerospace IndustryEPA/310-R-98-002. Agricultural Chemical, Pesticide, and
Fertilizer IndustryEPA/310-R-98-003. Agricultural Crop Production IndustryEPA/310-R-98-004. Agricultural Livestock Production Ind.EPA/310-R-98-005. Oil and Gas Exploration and Production
IndustryEPA/310-R-98-008. Local Government Operations*Spanish translations available.
Contact Phone (202) Joyce Chandler 564-7073 Steve Hoover 564-7007 Bob Marshall 564-7021 Walter DeRieux 564-7067 Maria Malave 564-7027 Seth Heminway 564-7017 Scott Throwe 564-7013 Jane Engert 564-5021 Anthony Raia 564-6045 Jane Engert 564-5021 Rob Lischinsky 564-2628 Walter DeRieux 564-7067 Tom Ripp 564-7003 Ginger Gotlif fe 564-7072 Seth Heminway 564-7017 Maria Malave 564-7027 Scott Throwe 564-7013 Virginia Lathrop 564-7057 Virginia Lathrop 564-7057 Virginia Lathrop 564-7057 Virginia Lathrop 564-7057 Jane Engert 564-5021 Emily Chow 564-7071 Sally Sasnett 564-7074 Rafael Sanchez 564-7028 Anthony Raia 564-6045 Belinda Breidenbach 564-7022 Seth Heminway 564-7017 Anthony Raia 564-6045 Amy Porter 564-4149
Ginah Mortensen (913)551-7864 Ginah Mortensen (913)551-7864 Dan Chadwick 564-7054
John Dombrowski 564-7036
Sector Notebook Project iii September 1997

Page iv intentionally left blank.
Sector Notebook Project Pharmaceutical Industr y
Table of Contents
List of Tables . . . . . . . . . . . . . . . . . . . . . . . . . . . . . . . . . . . . . . . . . . . . . . . . . . . . . . . . . . . . . . vii
List of Figures . . . . . . . . . . . . . . . . . . . . . . . . . . . . . . . . . . . . . . . . . . . . . . . . . . . . . . . . . . . . viii
List of Acronyms . . . . . . . . . . . . . . . . . . . . . . . . . . . . . . . . . . . . . . . . . . . . . . . . . . . . . . . . . . . ix
I. INTRODUCTION TO THE SECTOR NOTEBOOK PROJECT . . . . . . . . . . . . . . . . . . . . . .1A. Summary of the Sector Notebook Project . . . . . . . . . . . . . . . . . . . . . . . . . . . . . . . . .1B. Additional Information . . . . . . . . . . . . . . . . . . . . . . . . . . . . . . . . . . . . . . . . . . . . . . .2
II. INTRODUCTION TO THE PHARMACEUTICAL INDUSTRY . . . . . . . . . . . . . . . . . . . . . 3A. Introduction, Background, and Scope of the Notebook . . . . . . . . . . . . . . . . . . . . . . .3B. Characterization of the Pharmaceutical Industry . . . . . . . . . . . . . . . . . . . . . . . . . . . . . 3
1. Product Characterization . . . . . . . . . . . . . . . . . . . . . . . . . . . . . . . . . . . . . . . .52. Industry Size . . . . . . . . . . . . . . . . . . . . . . . . . . . . . . . . . . . . . . . . . . . . . . . . .63. Geographic Distribution . . . . . . . . . . . . . . . . . . . . . . . . . . . . . . . . . . . . . . . .114. Economic Trends and International Competition . . . . . . . . . . . . . . . . . . . . . . 13
III. INDUSTRIAL PROCESS DESCRIPTION . . . . . . . . . . . . . . . . . . . . . . . . . . . . . . . . . . . .17A. Industrial Processes in the Pharmaceutical Industry . . . . . . . . . . . . . . . . . . . . . . . . .17
1. Research and Development . . . . . . . . . . . . . . . . . . . . . . . . . . . . . . . . . . . . .172. Production of Bulk Pharmaceutical Substances . . . . . . . . . . . . . . . . . . . . . .193. Formulation, Mixing, and Compounding . . . . . . . . . . . . . . . . . . . . . . . . . . .32
B. Raw Material Inputs and Pollutant Outputs . . . . . . . . . . . . . . . . . . . . . . . . . . . . . . .381. Raw Materials . . . . . . . . . . . . . . . . . . . . . . . . . . . . . . . . . . . . . . . . . . . . . . .402. Air Emissions and Control Systems . . . . . . . . . . . . . . . . . . . . . . . . . . . . . . . . 433. Wastewater . . . . . . . . . . . . . . . . . . . . . . . . . . . . . . . . . . . . . . . . . . . . . . . . .464. Solid Wastes . . . . . . . . . . . . . . . . . . . . . . . . . . . . . . . . . . . . . . . . . . . . . . . . . 50
C. Management of TRI Chemicals in the Production Process . . . . . . . . . . . . . . . . . . . .51
IV. CHEMICAL RELEASE AND TRANSFER PROFILE . . . . . . . . . . . . . . . . . . . . . . . . . . .53A. EPA Toxic Release Inventory for the Pharmaceutical Industry . . . . . . . . . . . . . . . . . 57B. Summary of Selected Chemicals Released . . . . . . . . . . . . . . . . . . . . . . . . . . . . . . . .68C. Other Data Sources . . . . . . . . . . . . . . . . . . . . . . . . . . . . . . . . . . . . . . . . . . . . . . . . .72D. Comparison of Toxic Release Inventory Among Selected Industries . . . . . . . . . . . . 74
V. POLLUTION PREVENTION OPPORTUNITIES . . . . . . . . . . . . . . . . . . . . . . . . . . . . . . .77A. Material Substitutions . . . . . . . . . . . . . . . . . . . . . . . . . . . . . . . . . . . . . . . . . . . . . . .79B. Process Modifications . . . . . . . . . . . . . . . . . . . . . . . . . . . . . . . . . . . . . . . . . . . . . . .83C. Good Operating Practices . . . . . . . . . . . . . . . . . . . . . . . . . . . . . . . . . . . . . . . . . . . .87D. Recycling, Recovery, and Reuse . . . . . . . . . . . . . . . . . . . . . . . . . . . . . . . . . . . . . . .90E. Pollution Prevention Research . . . . . . . . . . . . . . . . . . . . . . . . . . . . . . . . . . . . . . . . .92
Sector Notebook Project v September 1997

Sector Notebook Project Pharmaceutical Industr y
VI. SUMMARY OF APPLICABLE FEDERAL STATUTES AND REGULATIONS . . . . . . 93A. General Description of Major Statutes . . . . . . . . . . . . . . . . . . . . . . . . . . . . . . . . . . .93B. Industry Specific Requirements . . . . . . . . . . . . . . . . . . . . . . . . . . . . . . . . . . . . . . .105C. Pending and Proposed Regulatory Requirements . . . . . . . . . . . . . . . . . . . . . . . . . .110D. Other Federal Regulations Affecting the Pharmaceutical Industry . . . . . . . . . . . . . 111E. Other Statutes and Regulations Affecting the Pharmaceutical Industry . . . . . . . . . . 114
VII. COMPLIANCE AND ENFORCEMENT HISTORY . . . . . . . . . . . . . . . . . . . . . . . . . . . 117A. Pharmaceutical Industry Compliance History . . . . . . . . . . . . . . . . . . . . . . . . . . . . . 121B. Comparison of Enforcement Activity Between Selected Industries . . . . . . . . . . . . . 123C. Review of Major Legal Actions . . . . . . . . . . . . . . . . . . . . . . . . . . . . . . . . . . . . . . .128
1. Review of Major Cases . . . . . . . . . . . . . . . . . . . . . . . . . . . . . . . . . . . . . . . . 1282. Supplementary Environmental Projects (SEPs) . . . . . . . . . . . . . . . . . . . . . .129
VIII. COMPLIANCE ACTIVITIES AND INITIA TIVES . . . . . . . . . . . . . . . . . . . . . . . . . . . 131A. Sector-related Programs and Activities . . . . . . . . . . . . . . . . . . . . . . . . . . . . . . . . .131B. EPA Voluntary Programs . . . . . . . . . . . . . . . . . . . . . . . . . . . . . . . . . . . . . . . . . . .131C. Trade Association/Industry Sponsored Activity . . . . . . . . . . . . . . . . . . . . . . . . . . .138
1. Environmental Programs . . . . . . . . . . . . . . . . . . . . . . . . . . . . . . . . . . . . . . . 1382. Summary of Trade Associations . . . . . . . . . . . . . . . . . . . . . . . . . . . . . . . . .140
IX. CONTACTS/ACKNOWLEDGMENTS/REFERENCES . . . . . . . . . . . . . . . . . . . . . . . . . 143
Sector Notebook Project vi September 1997

Sector Notebook Project Pharmaceutical Industr y
Li st of Tables
Table 1: Summary Statistics for the Pharmaceutical Industry . . . . . . . . . . . . . . . . . . . . . . . . . . .8Table 2: Pharmaceutical Industry (SIC 283) Facilit y Size . . . . . . . . . . . . . . . . . . . . . . . . . . . . .10Table 3: Employment Size Distribution for Medicinals and Botanicals and Pharmaceutical
PreparationsEstablishments . . . . . . . . . . . . . . . . . . . . . . . . . . . . . . . . . . . . . . . . . . . . .10Table 4: Top U.S. Pharmaceutical Companies by Sales . . . . . . . . . . . . . . . . . . . . . . . . . . . . . .11Table 5: Examples of Pharmaceutical Products by Bulk Manufacturing Process . . . . . . . . . . . . 20Table 6: Pharmaceutical Dosage Forms . . . . . . . . . . . . . . . . . . . . . . . . . . . . . . . . . . . . . . . . . .34Table 7: Summary of Typical Material Inputs and Pollution Outputs in the Pharmaceutical
Industry . . . . . . . . . . . . . . . . . . . . . . . . . . . . . . . . . . . . . . . . . . . . . . . . . . . . . . . . . . . .39Table 8: Solvents Used in the Chemical Synthesis Process . . . . . . . . . . . . . . . . . . . . . . . . . . . .41Table 9: Solvents Used in Biological and Natural Product Extraction . . . . . . . . . . . . . . . . . . . . 42Table 10: Solvents Used in Fermentation Processes . . . . . . . . . . . . . . . . . . . . . . . . . . . . . . . . .42Table 11: Chemicals Discharged in Wastewater by the Pharmaceutical Manufacturing Industry 48Table 12: Wastewater Treatment Technology Trends . . . . . . . . . . . . . . . . . . . . . . . . . . . . . . .49Table 13: Source Reduction and Recycling Activity for the Pharmaceuticals Industry . . . . . . . 52Table 14: 1995 Releases for Pharmaceutical Facilit ies (SIC 2833 & 2834) in TRI . . . . . . . . . . 58Table 15: 1995 Transfers for Pharmaceutical Facilit ies (SICs 2833 & 2834) in TRI . . . . . . . . . 62Table 16: Top 10 TRI Releasing Pharmaceutical Manufacturing Facilit ies . . . . . . . . . . . . . . . . 66Table 17: Top 10 TRI Releasing Facilit ies Reporting Pharmaceutical
Manufacturing SIC Codes to TRI . . . . . . . . . . . . . . . . . . . . . . . . . . . . . . . . . . . . . . . . . 67Table 18: Air Pollutant Releases by Industry Sector (tons/year) . . . . . . . . . . . . . . . . . . . . . . . .73Table 19: Toxics Release Inventory Data for Selected Industries . . . . . . . . . . . . . . . . . . . . . . .76Table 20: Five-Year Enforcement and Compliance Summary for the Pharmaceutical Industry 121Table 21: Five-Year Enforcement and Compliance Summary for Selected Industries . . . . . . . 124Table 22: One-Year Enforcement and Compliance Summary for Selected Industries . . . . . . . 125Table 23: Five-Year Inspection and Enforcement Summary by Statute for Selected Industries 126Table 24: One-Year Inspection and Enforcement Summary by Statute for Selected Industries 127Table 25: Pharmaceutical Industry Participation in the 33/50 Program . . . . . . . . . . . . . . . . . . 133
Sector Notebook Project vii September 1997

Sector Notebook Project Pharmaceutical Industr y
Li st of Figures
Figure 1: Percent of Total Value of Shipments by Sector . . . . . . . . . . . . . . . . . . . . . . . . . . . . . .8Figure 2: Employment in the Pharmaceutical Industry . . . . . . . . . . . . . . . . . . . . . . . . . . . . . . . .9Figure 3: Geographic Distribution of Pharmaceutical Facilit ies (SIC 2833 and 2834) . . . . . . . . 11Figure 4: World Sales of Pharmaceuticals, 1995 . . . . . . . . . . . . . . . . . . . . . . . . . . . . . . . . . . . . 14Figure 5: Simplified Process Flow Diagram for Chemical Synthesis . . . . . . . . . . . . . . . . . . . . . 22Figure 6: Typical Design of a Kettle-Type Batch Reactor . . . . . . . . . . . . . . . . . . . . . . . . . . . . . 23Figure 7: Cross-Section of Typical Top-Suspended Centrifugal Filter . . . . . . . . . . . . . . . . . . . 25Figure 8: Cross-Section of Typical Tumble Dryer . . . . . . . . . . . . . . . . . . . . . . . . . . . . . . . . . .27Figure 9: Simplified Process Flow Diagram for Natural/Biological Extraction . . . . . . . . . . . . . 29Figure 10: Simplified Process Flow Diagram for the Fermentation Process . . . . . . . . . . . . . . . . 30Figure 11: Simplified Process Flow Diagram for Compounding and Formulating . . . . . . . . . . . 32Figure 12: Summary of TRI Releases and Transfers by Industry . . . . . . . . . . . . . . . . . . . . . . . . 75
Sector Notebook Project viii September 1997

Sector Notebook Project Pharmaceutical Industr y
Li st of Acronyms
AFS - AIRS Facilit y Subsystem (CAA database)AIRS - Aerometric Information Retrieval System (CAA database)BIFs - Boilers and Industrial Furnaces (RCRA)BOD - Biochemical Oxygen DemandCAA - Clean Air ActCAAA - Clean Air Act Amendments of 1990CDER - Center for Drug Evaluation and ResearchCERCLA - Comprehensive Environmental Response, Compensation and Liabilit y ActCERCLIS - CERCLA Information SystemCFCs - ChlorofluorocarbonsCO - Carbon MonoxideCOD - Chemical Oxygen DemandCSI - Common Sense InitiativeCTM - Clinical Trial MaterialCWA - Clean Water ActD&B - Dun and Bradstreet Marketing IndexELP - Environmental Leadership ProgramEPA - United States Environmental Protection AgencyEPCRA - Emergency Planning and Community Right-to-Know ActFDA - Food and Drug AdministrationFIFRA - Federal Insecticide, Fungicide, and Rodenticide ActFINDS - Facilit y Indexing SystemHAPs - Hazardous Air Pollutants (CAA)HSDB - Hazardous Substances Data BankIDEA - Integrated Data for Enforcement AnalysisIND - Investigational New DrugLDR - Land Disposal Restrictions (RCRA)LEPCs - Local Emergency Planning Committees MACT - Maximum Achievable Control Technology (CAA)MCLGs - Maximum Contaminant Level GoalsMCLs - Maximum Contaminant LevelsMEK - Methyl Ethyl KetoneMSDSs - Material Safety Data Sheets NAAQS - National Ambient Air Quality Standards (CAA)NAFTA - North American Free Trade AgreementNAICS - North American Industrial Classification SystemNCDB - National Compliance Database (for TSCA, FIFRA, EPCRA)NCP - National Oil and Hazardous Substances Pollution Contingency PlanNDA - New Drug ApplicationNEIC - National Enforcement Investigation CenterNESHAP - National Emission Standards for Hazardous Air PollutantsNO2 - Nitrogen DioxideNOV - Notice of ViolationNOx - Nitrogen Oxides
Sector Notebook Project ix September 1997

Sector Notebook Project Pharmaceutical Industr y
NPDES - National Pollution Discharge Elimination System (CWA)NPL - National Priorities ListNRC - National Response CenterNSPS - New Source Performance Standards (CAA)OAR - Office of Air and RadiationOECA - Office of Enforcement and Compliance AssuranceOPA - Oil Pollution ActOPPTS - Office of Prevention, Pesticides, and Toxic SubstancesOSHA - Occupational Safety and Health AdministrationOSW - Office of Solid WasteOSWER - Office of Solid Waste and Emergency ResponseOW - Office of WaterP2 - Pollution PreventionPCS - Permit Compliance System (CWA Database)PhRMA - Pharmaceutical Research and Manufacturers of AmericaPOTW - Publicly Owned Treatments WorksRCRA - Resource Conservation and Recovery ActRCRIS - RCRA Information SystemSARA - Superfund Amendments and Reauthorization ActSDWA - Safe Drinking Water ActSEPs - Supplementary Environmental ProjectsSERCs - State Emergency Response Commissions SIC - Standard Industrial ClassificationSO2 - Sulfur DioxideSOx - Sulfur OxidesTOC - Total Organic CarbonTRI - Toxic Release InventoryTRIS - Toxic Release Inventory SystemTCRIS - Toxic Chemical Release Inventory SystemTSCA - Toxic Substances Control ActTSS - Total Suspended SolidsUIC - Underground Injection Control (SDWA)UST - Underground Storage Tanks (RCRA)VOCs - Volatile Organic Compounds
Sector Notebook Project x September 1997

Pharmaceutical Industr y Sector Notebook Project
I . INTRODUCTI ON TO THE SECTOR NOTEBOOK PROJECT
I .A. Summary of the Sector Notebook Project
Integrated environmental policies based upon comprehensive analysis of air, water and land pollution are a logical supplement to traditional single-media approaches to environmental protection. Environmental regulatory agencies are beginning to embrace comprehensive, multi-statute solutions to facilit y permitting, enforcement and compliance assurance, education/ outreach, research,and regulatory development issues. The central concepts driving the new policydirectionare that pollutant releases to each environmental medium (air, water and land) affect each other, and that environmental strategies must actively identifyand address these inter-relationships by designing policies for the “whole” facilit y. One way to achieve a whole facilit y focus is to design environmental policies for similar industrial facilit ies. By doing so, environmental concerns that are common to the manufacturing of similar products can be addressed in a comprehensive manner. Recognition of the need to develop the industrial “sector based” approach within the EPA Office of Compliance led to the creation of this document.
The Sector Notebook Project was originally initiated by the Office of Compliance within the Office of Enforcement and Compliance Assurance (OECA) to provide its staff and managers with summary information for eighteen specific industrial sectors. As other EPA offices, states, the regulated community, environmental groups, and the public became interested in this project, the scope of the original project was expanded to its current form. The abilit y to design comprehensive, common sense environmental protection measures for specific industries is dependent on knowledge of several inter-related topics. For the purposes of this project, the key elements chosen for inclusion are: general industry information (economic and geographic); a description of industrial processes; pollution outputs; pollution prevention opportunities; Federal statutory and regulatory framework; compliance history; and a description of partnerships that have been formed between regulatory agencies, the regulated community and the public.
For any given industry, each topic listed above could alone be the subject of a lengthy volume. However, in order to produce a manageable document, this project focuses on providing summary information for each topic. This format provides the reader with a synopsis of each issue, and references if more in-depth information is available. The contents of each profile were researched from a variety of sources, and were usually condensed from more detailed sources. This approach allowed for a wide coverage of activities that can be further explored based upon the citations and references listed at the end of this profile. As a check on the information included, each notebook went through an external review process. The Office of Compliance appreciates the efforts of all those who participated in this process who
Sector Notebook Project 1 September 1997

Pharmaceutical Industr y Sector Notebook Project
enabled us to develop more complete, accurate and up-to-date summaries. Many of those who reviewed this notebook are listed as contacts in Section X and may be sources of additional information. The individuals and groups on this list do not necessarily concur with all statements within this notebook.
I .B. Addit ional Information
Providing Comments
OECA’s Office of Compliance plans to periodically review and update the notebooks and will make these updates available both in hard copy and electronically. If you have any comments on the existing notebook, or if you would like to provide additional information, please send a hard copy and computer disk to the EPA Office of Compliance, Sector Notebook Project, 401 M St., SW (2223-A), Washington, DC 20460. Comments can also be uploaded to the Enviro$en$e World Wide Web for general access to all users of the system. Follow instructions in Appendix A for accessing this system. Once you have logged in, procedures for uploading text are available from the on-line Enviro$en$e Help System.
Adapting Notebooks to Particular Needs
The scope of the industry sector described in this notebook approximates the national occurrence of facilit y types within the sector. In many instances, industries within specific geographic regions or states may have unique characteristics that are not fully captured in these profiles. The Office of Compliance encourages state and local environmental agencies and other groups to supplement or re-package the information included in this notebook to include more specific industrial and regulatory information that may be available. Additionally, interested states may want to supplement the "Summary of Applicable Federal Statutes and Regulations" section with state and local requirements. Compliance or technical assistance providers may also want to develop the "Pollution Prevention" section in more detail. Please contact the appropriate specialist listed on the opening page of this notebook if your office is interested in assisting us in the further development of the information or policies addressed within this volume. If you are interested in assisting in the development of new notebooks for sectors not already covered, please contact the Office of Compliance at 202-564-2395.
Sector Notebook Project 2 September 1997

Pharmaceutical Industr y Intr oduction
I I . INTRODUCTI ON TO THE PHARM ACEUTI CAL I NDUSTRY
This section provides background information on the size, geographic distribution, employment, production, sales, and economic condition of the pharmaceutical industry. Facilit ies described within this document are described in terms of their Standard Industrial Classification (SIC) codes.
I I .A. Intr oduction, Background, and Scope of the Notebook
The Standard Industrial Classification (SIC) code established by the U.S. Office of Management and Budget (OMB) to track the flow of goods and services within the economy is 283 for the pharmaceuticals industry. The industry is further categorized by four 4-digit SIC codes consisting of:
Medicinals and Botanicals (SIC 2833) Pharmaceutical Preparations (SIC 2834) In Vivo and in Vitro Diagnostic Substances (SIC 2835) Biological Products, except diagnostics (SIC 2836)
OMB is in the process of changing the SIC code system to a system based on similar production processes called the North American Industrial Classification System (NAICS). In the NAIC system, medicinals and botanicals are classified as NAIC 325411 and pharmaceutical preparations are classified as NAIC 325412.
According to the U.S. Census of Manufacturers, in 1992 the Medicinals and Botanicals and Pharmaceutical Preparations categories accounted for 64 percent of establishments and 81 percent of the value of shipments in the industry. In comparison, the In Vitro and In Vivo Diagnostic Products and Biological Products categories are relatively small. Together they accounted for the remaining 36 percent of establishments and 19% of the value of shipments in the industry. In general, the industrial processes and subsequent environmental impacts of the In Vitro and In Vivo Diagnostic Products and Biological Products categories are different from those of the Medicinals and Botanicals and Pharmaceutical Preparations categories. This notebook concentrates on the two larger categories (SIC 2833 and 2834) within SIC 283.
I I .B. Characterization of the Pharmaceutical Industr y
As defined by its SIC Code, the pharmaceuticals industry (SIC 283) consists of establishments that are primarily involved in fabricating or processing medicinal chemicals and pharmaceutical products. The industry also includes establishments that formulate pharmaceutical products and are involved in grinding, grading, and milling of botanical products. The Census of Manufacturers defines an establishment as a single physical location or a
Sector Notebook Project 3 September 1997

Pharmaceutical Industr y Intr oduction
facilit y where manufacturing occurs. If more than one distinct line of manufacturing occurs at the same location, the Bureau of Census requires separate reports for each activity.
Although the industry is part of the two-digit SIC code 28 for Chemicals and Allied Products, it differs significantly from the rest of the chemicals industry in its industrial processes and regulatory requirements. For example, in its industrial processes, the pharmaceuticals industry uses more batch operations than the chemicals industry as a whole. Since some of the bulk manufacturing operations involve extracting relatively small, highly concentrated quantities of active ingredients from much larger volumes of raw material, the industry’s production yield for these operations is correspondingly low.
The pharmaceuticals industry also receives extensive regulatory oversight by the U.S. Food and Drug Administration (FDA). In 1996, the Center for Drug Evaluation and Research, FDA approved 131 new drug applications (NDAs), of which 53 were new molecular entities. According to the Congressional Office of Technology Assessment (OTA) in 1993, it costs an average of $359 million to develop a new drug and complete the drug approval process. Total drug development and agency review time averaged 15.3 years for drugs approved from 1990 through 1995. More information on the typical industrial processes and regulatory requirements of this industry is provided in Sections III and VI, respectively.
When a pharmaceutical company discovers a compound that may have medical potential, the company usually applies for a patent. Patents are valid for 20 years from the date of application. Any drug made from the compound may be marketed only after approval by the federal Food and Drug Administration (FDA). The drug development process, beginning with initial toxicology testing, followed by clinical trials for safety and effectiveness, and review of the application by the FDA averages fifteen years. When the company’s patent or period of exclusivity has expired, other companies may rely on the original manufacturer’s data on safety and effectiveness to obtain approval to market a generic version of the drug. Companies wanting to manufacture the same drug once it is off-patent are required to obtain FDA marketing approval, based on evidence that the generic version is “bioequivalent,” i.e., differs in the rate and extent of drug absorption by no more than 25 percent nor less than the 20 percent from the original drug (FDA, 1996). While companies that specialize in the development and marketing of brand-name, innovator drugs1 may have subsidiaries that
1 The term “brand name” is used interchangeably with “pioneer drug” or “innovator’s drug product”. The terms reflect the fact that the drug product is the first to contain a particular active ingredient or ingredients to receive FDA approval for a specified use. The term “generic” drug is used to describe a product that contains the same active ingredients but not necessarily the same excipients (inactive ingredients) as a so-called “pioneer drug”.
Sector Notebook Project 4 September 1997

Pharmaceutical Industr y Intr oduction
manufacture generic products, most generic drug companies do not conduct research intended to identify and develop innovator drugs (PhRMA, 1997).
Because of the high cost and time to approval, effective patent protection is an essential component in the decision to invest in drug development and marketing. This is especially true for international companies interested in marketing drugs in several countries, each with its own approval procedure and marketing requirements. While the International Conference on Harmonization is proposing harmonized rules for drug registration and approval for Europe, Japan and the United States, each country retains its own approval system. In other countries, especially developing countries, the issue of adequate patent protection is a central concern of pharmaceutical manufacturers (PhRMA, 1997).
Discovery of new compounds followed by further research and development (R&D) is one of the primary functions of the industry. The pharmaceutical production process starts with an extensive research stage, which can last several years. Following the discovery of a new drug that appears to have efficacy in treating or preventing illness, pre-clinical tests and clinical trials are conducted. Then a New Drug Application (NDA) is submitted to the FDA for approval. According to a primary trade association for pharmaceutical companies producing brand name drugs, the Pharmaceutical Research and Manufacturers of America (PhRMA), it takes an average of 15 years to bring a new drug to market, from time of discovery to approval (PhRMA, 1996). It is only after FDA approval has been secured that market distribution in the U.S. can begin.
The competition for discovering new drugs and bringing them to market is extremely high. As a result, a significant proportion of the industry’s sales are reinvested into research and development (R&D). According to PhRMA, total R&D expenditures, both domestically and abroad, by its members, will be close to $19 billio n dollars in 1997. PhRMA estimates that over 21% of total sales will be reinvested into R&D by its members (PhRMA, 1997).
I I .B.1. Product Characterization
The pharmaceutical industry manufactures bulk substance pharmaceutical intermediates and active ingredients which are further processed into finished products.
Medicinals and Botanicals (SIC 2833)
Companies in the Medicinals and Botanicals industry category are primarily engaged in 1) manufacturing bulk organic and inorganic medicinal chemicals and their derivatives and 2) processing (grading, grinding, and milling) bulk botanical drugs and herbs. The industry is made up of establishments or
Sector Notebook Project 5 September 1997

Pharmaceutical Industr y Intr oduction
facilit ies that manufacture products of natural origin, hormonal products, and basic vitamins, as well as those that isolate active medicinal principals such as alkaloids from botanical drugs and herbs (OMB, 1987). These substances are used as active ingredients for the Pharmaceutical Preparations industry category. Companies often produce both Medicinals and Botanicals and Pharmaceutical Preparations at the same facilit y.
Pharmaceutical Preparations (SIC 2834)
The Pharmaceutical Preparations industry category is made up of companies that manufacture, fabricate, and process raw materials into pharmaceutical preparations for human and veterinary uses. Finished products are sold in various dosage forms including, for example, tablets, capsules, ointments, solutions, suspensions, and powders. These are 1) preparations aimed for use mainly by dental, medical, or veterinary professionals, and 2) those aimed for use by patients and the general public (OMB, 1987). A more in depth discussion of these finished products is provided in Section III.A.3. Pharmaceutical products also are often classified in terms of their availabilit y to the general public.
Both prescription and over-the-counter (OTC) drugs are available to the public. Prescription drugs can be purchased only with a prescription from a licensed health care professional authorized to prescribe, while OTC drugs may be purchased without a prescription. The FDA will consider approving the switch of a drug from prescription to OTC when the manufacturer presents evidence that consumers can self-diagnose the condition for which the drug is approved, i.e., cold or seasonal allergy, and directions for use can be written for the consumer (PhRMA, 1997).
In Vivo and In Vitro Diagnostic Substances (SIC 2835) and Biological Products (SIC 2836)
The In Vivo and In Vitro Diagnostic Substances industry category (SIC 2835) includes facilit ies that manufacture in vivo (tested inside a living organism) and in vitro (tested outside of a living organism) diagnostic substances. They produce chemical, biological, and radioactive substances used in diagnosing and monitoring health. The Biological Products industry category (SIC 2836) produces bacterial and virus vaccines, toxoids, serums, plasmas, and other blood derivatives for human and veterinary use, other than in vitro and in vivo diagnostic substances (OMB, 1987).
I I .B.2. Industr y Size
According to the U.S. Census of Manufactures for the pharmaceuticals industry as a whole (SIC 283), in 1992 there were a total of 1,425 establishments employing 194,000 people (excluding Puerto Rico). It is possible that some of the smaller facilit ies identified by the Census are actually
Sector Notebook Project 6 September 1997

Pharmaceutical Industr y Intr oduction
sales, marketing or distribution centers in which no manufacturing operations take place. Such possible misclassifications have no significant effect on the census statistics other than on the number of companies and establishments. (U.S. Department of Commerce, 1995) The value of total shipments was over $67 billio n (see Table 1). Pharmaceutical Preparations (SIC 2834) was the largest sector in terms of number of facilities (48 percent), employment (63 percent), and value of shipments (75 percent). The remaining facilit ies, employment, and value of shipments were divided evenly among the remaining sectors within the industry. One exception is the In Vivo and In Vitro Diagnostic Products sector (SIC 2835) which claims a higher portion of employment than SIC codes 2833 and 2836. Figure 1 displays the value of shipments by sector, and Figure 2 displays employment by sector.
A relatively significant number of pharmaceutical establishments are located in Puerto Rico. This is in part the result of the federal government’s policy decision to encourage job creation by offering tax incentives to manufacturers to locate new plants in Puerto Rico. A 1996 tax law phases-out those tax incentives over the next ten years.
The effects of the tax incentive are illustrated by the concentration of pharmaceutical plants in Puerto Rico. According to the 1992 Economic Census of Outlying Areas, which covers statistics for Puerto Rico, there were a total of 88 establishments in Puerto Rico. Of these 88, 74 establishments were in the Pharmaceutical Preparations industry, 8 were in the Medicinals and Botanicals industry, and the remaining six establishments were in the In Vitro and In Vivo Diagnostic Products industry, and the Biological Products, except diagnostic substances industry. The total value of shipments of the 88 establishments located in Puerto Rico was about $12 billio n. Pharmaceutical Preparations accounted for about 92 percent of this. The pharmaceutical industry in Puerto Rico employed about 25,000 people in the 88 establishments in 1992.
Sector Notebook Project 7 September 1997

Pharmaceutical Industr y Intr oduction
Sector Notebook Project September 19978
Figure 1: Percent of Total Value of Shipments by Sector
Source: 1992 U.S. Census of Manufacturers.
Table 1: Summary Statistics for t he Pharmaceutical Industry50 STATES PUERTO RICO
IndustryNumber of
EstablishmentsNumber ofCompanies1
Value ofShipments(millio ns of
dollars)2Employmen
t(000's)
Number ofEstablishments
Value ofShipments(millio ns of
dollars)2Employment
(000's)
SIC 2833 225 208 6,438 13 8 N/A3 N/A3
SIC 2834 691 585 50,418 123 74 11,097 22
SIC 2835 234 205 6,838 40 5 477 1
SIC 2836 275 193 3,974 18 1 N/A3 N/A3
Total 1,425 1,191 67,668 194 88 11,924 25Source: 1992 Census of Manufacturers, Industry Series: Drugs, US Department of Commerce, Bureau of the Census,1995 and 1992 Economic Census of Outlying Areas, Manufacturers: Puerto Rico, US Department of Commerce,Bureau of the Census, 1994.
1Defined as a business organization consisting of one establishment or more under common ownership or control.2Value of all products and services sold by establishments in the pharmaceuticals industry.3Certain census data are not available for Puerto Rico. Information is withheld to avoid disclosing data for individualfacilities.

Pharmaceutical Industr y Intr oduction
Sector Notebook Project September 19979
Figure 2: Employment in the Pharmaceutical Industry
Source: 1992 U.S. Census of Manufacturers.
As shown in Table 2, many facilit ies within the pharmaceutical industry aresmall. Almost 70 percent of the facilit ies employ fewer than 50 people.However, a relatively small number of large companies account for a largeportion of the total value of shipments, as well as employment. For example,according to the 1992 U.S. Census of Manufacturers, only 36 facilit ies (lessthan three percent) employed more than 1,000 people in the 50 states (i.e., notincluding Puerto Rico). However, these 36 facilit ies accounted for over 38%of the total value of shipments for the industry. In comparison, 968 facilit ies(almost 70 percent) employ fewer than 50 people. However, these facilit iesaccounted for less than four percent of the industry’s value of shipments.

Pharmaceutical Industr y Intr oduction
Table 2: Pharmaceutical I ndustry (SIC 283) Facility Size1
Number of Employees Number of Facilit ies Percent of Total Facilit ies (% )
Percent of Total Value of Shipments (% )
fewer than 10 479 34 0.6
10 to 49 489 34 3.2
50 to 249 292 20 19
250 to 999 129 9.1 392
1,000 or more 36 2.5 382
Total 1,425 100 100 Source: 1992 Census of Manufacturers, Industry Series: Drugs, Bureau of the Census, 1995.1 Does not include Puerto Rico - information withheld to avoid disclosing data for individual facilities.2 Some information withheld to avoid disclosing individual facility data. Values may be somewhat higher.
Medicinals and Botanicals (SIC 2833) and Pharmaceutical Preparations (SIC 2834)
The establishment size distributions for Pharmaceutical Preparations and Medicinals and Botanicals are similar (see Table 3). The Pharmaceutical Preparations sector, however, has a somewhat higher proportion of large facilit ies. As is the case with the pharmaceuticals industry as a whole, a relatively small number of large establishments account for the majority of the total value of shipments for the Pharmaceutical Preparations industry. Value of shipment data is not available by establishment size for the Medicinals and Botanicals sector.
Table 3: Employment Size Distr ibution for Medicinals and Botanicals and Pharmaceutical Preparations Establishments 1
Medicinals and Botanicals Pharmaceutical Preparations
Number of Employees
Number of Facilit ies
Percent of Facilit ies
Percent of Value of
Shipments Number of Facilit ies
Percent of Facilit ies
Percent of Value of
Shipments
< than 10 104 46 N/A2 225 33 0.4
10 to 49 76 34 N/A2 211 30 2
50 to 249 35 16 N/A2 142 21 10
250 or more 10 4 N/A2 113 16 88
Total 225 100 100 691 100 100
Source: 1992 U.S. Census of Manufacturers.1 Not including Puerto Rico.2 Information has been withheld to avoid disclosing individual establishment data.
Sector Notebook Project 10 September 1997

Pharmaceutical Industr y Intr oduction
Table 4 lists the largest U.S. pharmaceutical companies in terms of U.S. prescription sales.
Table 4: Top U.S. Pharmaceutical Companies by Sales Rank Company 1996 Rx Sales
(milli ons of dollars)
1 Glaxo Wellcome 5,803
2 Johnson & Johnson 5,275
3 American Home Products 5,251
4 Bristol-Myers Squibb 5,160
5 Merck & Co 5,026
6 Pfizer 4,511
7 Novartis 3,786
8 SmithKline Beecham 3,589
9 Lilly 3,567
10 Abbott 3,423
11 Schering-Plough 3,272
12 Hoechst Marion Roussel 2,474
13 Roche 2,316
14 Amgen 1,860
15 Bayer 1,854
Source: IMS America.
I I .B.3. Geographic Distr ibution
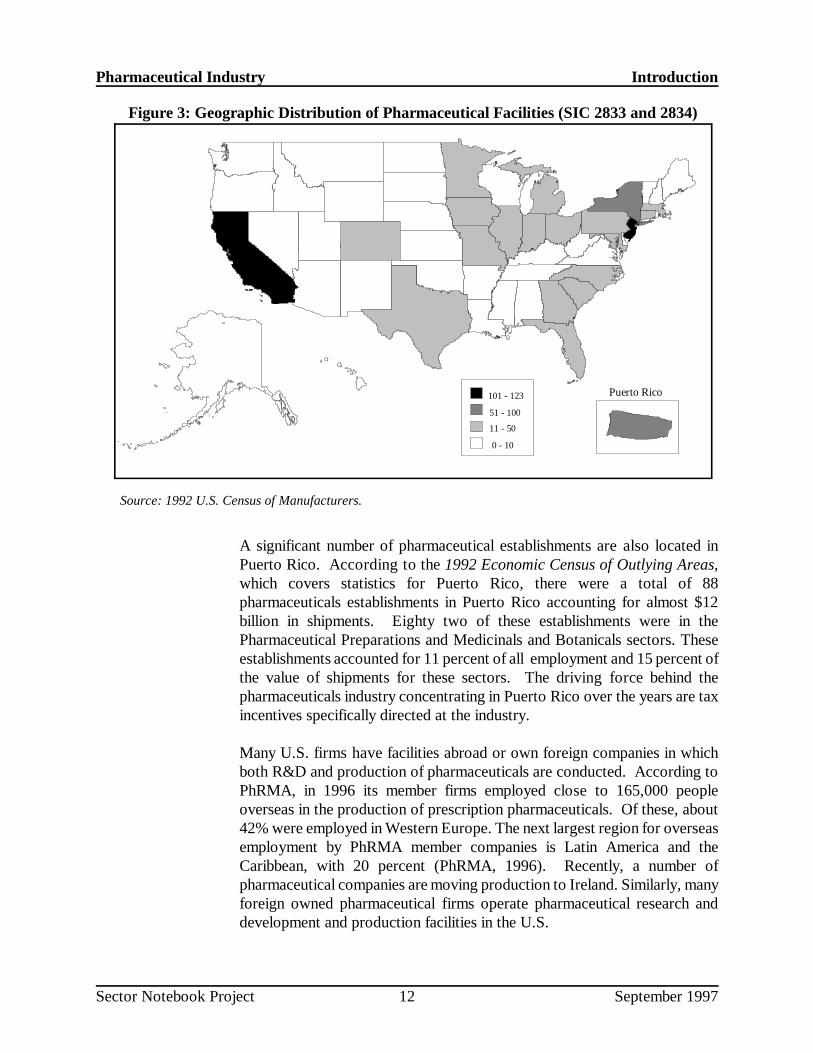
The U.S. pharmaceuticals industry has traditionally been concentrated in New Jersey, California, and New York (see Figure 3). These three states account for about one third of the facilit ies, employees, and value of shipments. Historically, the industry concentrated here because these were vocational centers. Other states, such as Massachusetts, North Carolina and Maryland, have seen recent growth in the pharmaceuticals industry, especially in biotechnology and research and development.
Sector Notebook Project 11 September 1997
Pharmaceutical Industr y Intr oduction
Figure 3: Geographic Distr ibution of Pharmaceutical Facilities (SIC 2833 and 2834)
Puerto Rico
0 - 10
101 - 123
51 - 100
11 - 50
Source: 1992 U.S. Census of Manufacturers.
A significant number of pharmaceutical establishments are also located in Puerto Rico. According to the 1992 Economic Census of Outlying Areas, which covers statistics for Puerto Rico, there were a total of 88 pharmaceuticals establishments in Puerto Rico accounting for almost $12 billio n in shipments. Eighty two of these establishments were in the Pharmaceutical Preparations and Medicinals and Botanicals sectors. These establishments accounted for 11 percent of all employment and 15 percent of the value of shipments for these sectors. The driving force behind the pharmaceuticals industry concentrating in Puerto Rico over the years are tax incentives specifically directed at the industry.
Many U.S. firms have facilit ies abroad or own foreign companies in which both R&D and production of pharmaceuticals are conducted. According to PhRMA, in 1996 its member firms employed close to 165,000 people overseas in the production of prescription pharmaceuticals. Of these, about 42% were employed in Western Europe. The next largest region for overseas employment by PhRMA member companies is Latin America and the Caribbean, with 20 percent (PhRMA, 1996). Recently, a number of pharmaceutical companies are moving production to Ireland. Similarly, many foreign owned pharmaceutical firms operate pharmaceutical research and development and production facilit ies in the U.S.
Sector Notebook Project 12 September 1997

Pharmaceutical Industr y Intr oduction
I I .B.4. Economic Trends and International Competit ion
Changes in the U.S. Health Care Industry
During the early 1990s the United States pharmaceutical industry faced major challenges associated withthe changing nature of health care delivery coupled with intense market competition. In 1995 about 62 percent of prescriptions were paid for by insuring third parties, up from 39 percent in 1990. Third parties, including managed care organizations and Medicaid, consider cost in choosing which drugs are approved for reimbursement. Techniques such as substituting generic drugs for branded drugs are also used. Low priced generic drugs rapidly capture a large share of prescriptions once the originating drug’s patent expires. Likewise, intense R&D rivalries between companies now mean that new products may have major competition within months after their FDA approval, as was the case for three competing protease inhibitors approved between December 1995 and April 1996. Companies have responded to shorter product life cycles and cost containment pressures by forming an increasing number of strategic alliances and merging. However, a steady stream of new product introductions has contributed to steady industry growth driven by an increasing volume of prescriptions. In 1997, research-based companies’ net sales in the United States are projected to reach $66.1 billio n, a 5.5 percent increase over 1996 (PhRMA, 1997).
Consolidation of the Pharmaceuticals Industry
Competitive pressures are forcing many companies to restructure and form mergers and strategic alliances. Increasing competition from both domestic and foreign firms, as well as from the generic drug market, has forced mergers between the larger pharmaceutical companies and mid-sized companies. In 1989, three major mergers occurred between large and mid-sized pharmaceutical companies. In 1995, this number increased to seven. In 1996, there were three mergers.
As a result of generic competition, some brand name firms are becoming involved with companies that manufacture generic drugs by purchasing existing companies, setting up their own generic drug ventures, or forming partnerships (PhRMA, 1996). Also, many smaller biotech and R&D companies are merging with large pharmaceutical companies. Strategic alliances often involve domestic and foreign pharmaceutical companies, biotech firms, university research centers, government agencies such as the National Institute of Health, and contract research organizations. Such mergers and alliances allow companies to draw upon each others’ research expertise, bring products to market more rapidly, and more effectively market products once they are approved by FDA.
Sector Notebook Project 13 September 1997

Pharmaceutical Industr y Intr oduction
Changes in Geographical Concentrations
An increasing number of establishments owned by U.S. companies are locating outside the U.S. A number of forces are driving these changes, including the growing international market for pharmaceutical products, foreign registration requirements and patent laws, laws allowing sales only if the products are manufactured in the country; and tax incentives.
International Trade and Competition
The U.S. pharmaceuticals industry accounts for about one-third of all pharmaceuticals marketed worldwide (see Figure 4). The major U.S. trading partners are Europe, Japan, Canada, and Mexico. The largest importer of U.S. pharmaceuticals is the European Community (EC). In 1993, the EC alone imported nearly 50% of all U.S. exports (ITA, 1994). Canada and Mexico combined imported 15 percent of all U.S. exports of pharmaceutical products in 1993. The North American Free Trade Agreement (NAFTA), however, has increased the volume of trade with Canada and Mexicoinrecent years.
Although Japan still r emains one of the largest importers of U.S. pharmaceuticals, Japanese pharmaceutical companies have been investing heavily in their own R&D, thereby reducing Japan’s import share of U.S. exports in recent years.
In 1993, European and Japanese pharmaceutical companies accounted for 27 percent and 22 percent of all pharmaceuticals marketed worldwide, respectively (PhRMA, 1996). China and the countries of the former Soviet Union are potentially large markets for U.S. pharmaceuticals. However, China is also increasing its production of pharmaceuticals and the former countries of the Soviet Union pose some major challenges for U.S. producers in terms of testing and licensing regulations (International Trade Administration, 1994).
Major issues affecting the international competitiveness of U.S. pharmaceutical firms include price controls and intellectual property protection abroad. Other trade barriers include foreign pricing systems that favor locally produced pharmaceuticals, discriminatory registration requirements, and requirements that foreign companies enter into joint ventures with domestic firms.
Sector Notebook Project 14 September 1997

Pharmaceutical Industr y Intr oduction
Figure 4: World Sales of Pharmaceuticals, 1995
Middle East 2%
Southeast Asia & China
6%Canada 3%
United States 30%
Australasia 1%
Europe 27%
Africa 2%
Japan 22%
Latin America 7%
Source: Pharmaceutical Research and Manufacturers of America, 1997 based on data provided by IMS America, 1996.
Sector Notebook Project 15 September 1997

Page 16 intentionally left blank.

Pharmaceutical Industr y Industr ial Process Description
III. INDUSTRIAL P ROCESS DESCRIPTION
This section describes the major industrial processes within the pharmaceutical industry, including the materials and equipment used, and the processes employed. The section is designed for those interested in gaining a general understanding of the industry, and for those interested in the inter-relationship between the industrial process and the topics described in subsequent sections of this profile -- pollutant outputs, pollution prevention opportunities, and Federal regulations. This section does not attempt to replicate published engineering information that is available for this industry. Refer to Section IX for a list of reference documents that are available.
This section specifically contains a description of commonly used production processes, associated raw materials, and the materials either recycled or transferred off-site. This discussion, coupled with schematic drawings of the identified processes, provides a description of where wastes may be produced in the process. A more in-depth description of the major wastes produced by pharmaceutical manufacturing can be found in Section III.B .
Additionally, it is important to understand the regulatory framework in which pharmaceutical products are manufactured. To protect the public from unsafe or ineffective pharmaceutical products, Congress established a stringent regulatory system to control the research and development, manufacture and marketing of pharmaceutical products. The US Food and Drug Administration (FDA) was delegated the responsibilit y for: (i) evaluating the safety and efficacy of new drugs; (ii) determining if the benefits of the drug outweigh the risks and warrant approval for sale; and (iii) reviewing toxicological performance of active pharmaceutical ingredients. For most new pharmaceutical compounds, FDA oversight begins soon after the discovery of the compound.
III. A. Industr ial Processes in the Pharmaceutical Industr y
The production of pharmaceutical products can be broken down into three main stages: 1) research and development; 2) the conversion of organic and natural substances into bulk pharmaceutical substances or ingredients through fermentation, extraction, and/or chemical synthesis; and 3) the formulation of the final pharmaceutical product.
III. A.1. Research and Development
New drug development involves four principal phases: Pre-Clinical Research and Development; Clinical Research and Development; Review of New Drug Application; and Post Marketing Surveillance. Pre-Clinical Research and Development begins after a promising compound has been discovered and isolated in the laboratory. In this phase, the compound is subjected to
Sector Notebook Project 17 September 1997

Pharmaceutical Industr y Industr ial Process Description
extensive laboratory and animal tests to determine whether the compound is biologically active and safe. The average time to complete this phase is six years.
After completing the Pre-Clinical Research and Development and before testing the drug in humans, an application is filed with FDA known as an Investigational New Drug Application (IND). The application must show the results of the pre-clinical testing and detail the plans for human clinical tests. It must also contain information about the chemical structure of the compound and a general description as to how the compound is manufactured.
Clinical Research and Development is typically conducted in three phases, with each phase involving progressively more people. The first phase, which typically lasts about a year, is aimed at establishing the drug’s safety and involves a small number of healthy volunteers. The second phase, which lasts about two years, helps the scientists determine the drug’s effectiveness. In the third phase, the drug is used in clinics and hospitals, and scientists must confirm the results of earlier tests and identify any adverse reactions. Altogether the three phases of Clinical Research and Development take about six years.
In the first phase of Clinical Research and Development, a small amount of the compound is manufactured in a pilot plant for use in the clinical trials. This batch of compound is called Clinical Trial Material (CTM). At this time, the manufacturing steps of the compound are also optimized and improved. During this phase, attention to waste minimization considerations is most effective.
After Clinical Research and Development is completed, the company files, with the FDA, a New Drug Application (NDA) containing comprehensive data about the compound. The NDA must include data to demonstrate that the drug is safe and effective for use under the conditions described in its labeling. FDA regulations require that the NDA contain specific and detailed information on: the components and composition of the drug; the methods and controls used inthe manufacturing; processing and packaging of the drug; and, data from all pre-clinical and clinical investigations. In 1993, the median total approval time for NDAs was 21 months. This has been significantly reduced and in 1996, the median total approval time for NDAs was 15 months.
Each step in the manufacturing process, and the identity and quality of each ingredient used in the process, must be specified in the NDA and approved by the FDA. Once the NDA is approved, certain changes cannot be made without the filing and approval by the FDA of a supplemental application, known as an SNDA. The level of reporting depends on the type of change
Sector Notebook Project 18 September 1997

Pharmaceutical Industr y Industr ial Process Description
and may require substantial investment of resources to implement. FDA approval may take several years to obtain depending on the nature of the change, and some changes even require new clinical studies.
Based on data from a 1995 study by the Center for the Study of Drug Development at Tufts University, a pharmaceutical Research and Development (R&D) facilit y discovering and developing a new medicinal agent will evaluate approximately 5,000 to 10,000 compounds. About 250 of these substances may hold therapeutic promise and enter preclinical testing. However, only about five will go on to limited human clinical testing. Subsequently, only one, after 15.3 years of research and development, will be introduced commercially as a new drug (PhRMA, 1997).
Basic research is responsible for identifying and isolating or synthesizing each new chemical entity that will be evaluated for its potential therapeutic effectiveness. Once a lead compound has been identified and characterized, some 1,000 related chemical substances will be synthesized and studied by laboratory assay systems. These assay systems are designed to identity which compounds exhibit the most specific and potent biological effect. For each compound tested, generally some 5-10 separate chemical reactions will be needed to synthesize the compound. The results of biological testing will t hen guide the direction of subsequent synthetic operations. If the results are unsatisfactory, then the process starts anew.
Should a substance show promise in the laboratory assays, limited animal studies are started. If there is no activity in the animal, other related compounds will be evaluated or the program will be discontinued. Once biologically active substances are identified, they will undergo further chemical modification to refine their efficacy and safety.
Once an active candidate has been identified, it will be proposed for formal development. Pharmaceutical development includes the evaluation of synthetic methods on a larger scale and the assessment of various ways of formulating the drug to provide optimum delivery. Up to this point, only small amounts have been synthesized for evaluation. More will be needed for the extensive animal testing required by FDA. Even larger amounts will be required for the extensive clinical studies in humans required before federal approval.
III. A.2. Production of Bulk Pharmaceutical Substances
Bulk pharmaceutical substances typically consist of structurally complex organic chemical compounds which are manufactured via a series of intermediate steps and reactions under precise conditions. These substances are used in the manufacture of the dosage form of a formulated pharmaceutical product and are manufactured by: (1) chemical synthesis; (2) fermentation; (3) isolation/recovery from natural sources, or (4) a combination
Sector Notebook Project 19 September 1997

Pharmaceutical Industr y Industr ial Process Description
of these processes. Examples of different drugs produced by each of these processes are presented in Table 5.
Table 5: Examples of Pharmaceutical Products by Bulk Manufactur ing Process
Chemical Synthesis Natural Product Extraction Fermentation
Antibiotics Antihistamines Cardiovascular Agents Central Nervous System (CNS)
Stimulants CNS Depressants Hormones Vitamins
Antineoplastic Agents Enzymes and Digestive Aids CNS Depressants Hematological Agents Insulin Vaccines
Antibiotics Antineoplastic Agents Therapeutic Nutrients Vitamins Steroids
Most pharmaceutical substances are manufactured utiliz ing “batch” processes. In a batch process, a particular substance or “ intermediate”2 is manufactured in a “campaign” for periods ranging from a few days to several months until sufficient material is manufactured to satisfy the projected sales demand. At the end of the manufacturing campaign, another pharmaceutical intermediate or substance is made. The same equipment with potentially different configurations and the same operating personnel are often used to make a different intermediate or substance, utiliz ing different raw materials, executing different processes, and generating different waste streams.
When the same equipment is used for manufacturing different intermediates and/or different bulk substances, the equipment is thoroughly cleaned and validated prior to its reuse. Where cleaning of a specific type of equipment is difficult or where a sufficient volume of a certain intermediate or bulk substance is made every year, the equipment may be dedicated to the batch manufacturing of a particular intermediate or bulk substance. Where the equipment is dedicated to the production of successive batches of the same intermediate or bulk substance, the equipment may not be washed and cleaned between batches. Instead, the cleaning schedule will depend on whether there is a potential for carryover of contaminants or degraded materials that could affect the final product.
The specific methods and materials (e.g., water, steam, detergents, and/or organic solvents) used to clean the equipment are based on the abilit y of the cleaning process to remove residues of raw materials, intermediates, precursors, degradation products, and isomers (FDA, 1996).
2 An intermediate is a material produced during a manufacturing process that must undergo further molecular change or processing before it becomes a bulk pharmaceutical substance.
Sector Notebook Project 20 September 1997

Pharmaceutical Industr y Industr ial Process Description
Raw materials are checked for their identity and quality before use in the manufacturing processes. Additionally, in-process testing, as well as qualit y assurance/qualit y control (QA/QC) testingin onsite laboratories, is performed during drug product manufacturing. In-process testing may include simple pH measurements or checks on color, while QA/QC testing typically includes more sophisticated analyses such as chromatography. “Upon completion of the manufacturing operation, batch-production records are checked by competent and responsible personnel for actual yield against theoretical yield of a batch and to ensure that each step has been performed and signed for” (McGraw Hill Encyclopedia of Technology).
Chemical Synthesis
Most of the compounds used today as pharmaceutical products are prepared by chemical synthesis, generally by a batch process (Watthey, 1992). Cardiovascular agents, central nervous system agents, vitamins, antibiotics, and antihistamines are just a few examples of the bulk pharmaceutical substances made by this process.
The manufacture of pharmaceutical compounds using chemical synthesis involves a complex series of processes including many intermediate stages and chemical reactions performed in a step-by-step fashion. Depending on the process, the operator (or a programmed computer) adds reagents, increases or decreases the flow rate of chilled water or steam, and starts and stops pumps to draw the reactor contents into another vessel. At other stages in the process, solutions may be pumped through filters or centrifuges, recycled within the process, or pumped to recycling or disposal facilit ies. Co-products, such as salts, may be sold for reuse. Spent acids, metals, and catalysts may be recovered and reused onsite or sold for reuse.
The material from each intermediate step may be isolated and transferred to the next step of the process for continued processing until the final compound is derived. These steps may be all conducted at the same manufacturing site, or if the intermediate is isolated, it may be transferred to another site for further processing.
It is impossible to provide a single process flow diagram for this industry since each bulk pharmaceutical substance is different in its manufacture and several intermediates may be produced in a step-wise fashion prior to the manufacture of the final active ingredient. However, an example chemical synthesis process has been provided as Figure 5 to show the equipment used and where wastes or emissions might be generated.
Sector Notebook Project 21 September 1997

Pharmaceutical Industr y Industr ial Process Description
Figure 5: Simplified Process Flow Diagram for Chemical Synthesis
Reaction Vessel
Chemicals (reactants)
Reaction Residues
Sealed - jacket for cooling/heating
media
Process Condenser
Separation - extraction - decanting - centrifugation - filtration
Spent solvents to recovery/disposal
Air Emissions Control Device
Solvent Vapors
Wastewater Treatment
Solvent Vapors
Crystallization
Process Condenser
Wastewater Treatment
Solvent Vapors
Purification - recrystallization - centrifugation - filtration
Drying
Solvent Vapors
Solvent vapors
Product
Solvent Vapors
Wastewater
Wastewater Wastewater
Source: Adapted from Economic Impact and Regulatory Flexibility Analysis of Proposed Effluent Guidelines for the Pharmaceutical Manufacturing Industry, 1995.
Reactors
The most common type of reactor vessel is the kettle-type reactor. These reactors typically range in capacity from 50 to several thousand gallons. The vessels are made of either stainless steel or glass-lined carbon steel.
A diagram of a typical reactor vessel is shown in Figure 6. “Reactors are equipped to provide a range of capabilit ies that may be required during the batch reaction step. This equipment may include: a jacket for heating and cooling, hookups for charging raw materials and for discharging the contents of the reactor, an agitation and recycle line for mixing, control systems for temperature and pressure, a condenser system for controlling vent losses, a return line for refluxing condensables, a steam ejector for vacuum operation, a nitrogen supply for padding and purging the reactor, and a manway for taking samples and adding solid catalysts, reactants, and other solid materials to the reactor” (USEPA 1993).
Sector Notebook Project 22 September 1997

Pharmaceutical Industr y Industr ial Process Description
Figure 6: Typical Design of a Kettle-Type Batch Reactor
Condensed Steam and Organics
Pressure Relief Valve
Steam-Jet Ejector
Steam
Nitrogen
Solvent, Raw Material, and Reactant
Addition
Manway
Reactor Jacket
Steam
Cooling Water or Coolant
Steam Trap
Condensed Steam Drain Valve
Agitator
Reactor Discharge
Recycle Line
Cooling Water or Coolant
Source: Adapted from Control of Volatile Organic Compound Emissions from Batch Processes, EPA Guideline Series, 1993.
Raw materials or ingredients, including solvents, used to produce the intermediate or bulk substances are charged into the reactor vessel. Liquid ingredients are drawn into the reactor either by pumping or through vacuum from drums and storage tanks. Solids may be charged manually or via mechanical means such as through a vacuum system.
Once the reactor vesselsare charged withthe raw materials, the reaction takes place. “The reactor can be operated at atmospheric pressure, elevated pressure, or under vacuum. Because of their flexibilit y, reactors may be used in a variety of ways. Besides hosting chemical reactions, they can act as mixers, heaters, holding tanks, crystallizers, and evaporators.” (USEPA, 1979) Typical reactions performed include alkylations, hydrogenations, brominations, etc. Temperature, pressure, and the degree of mixing are carefully monitored to achieve the desired product and to ensure worker safety.
Sector Notebook Project 23 September 1997
Pharmaceutical Industr y Industr ial Process Description
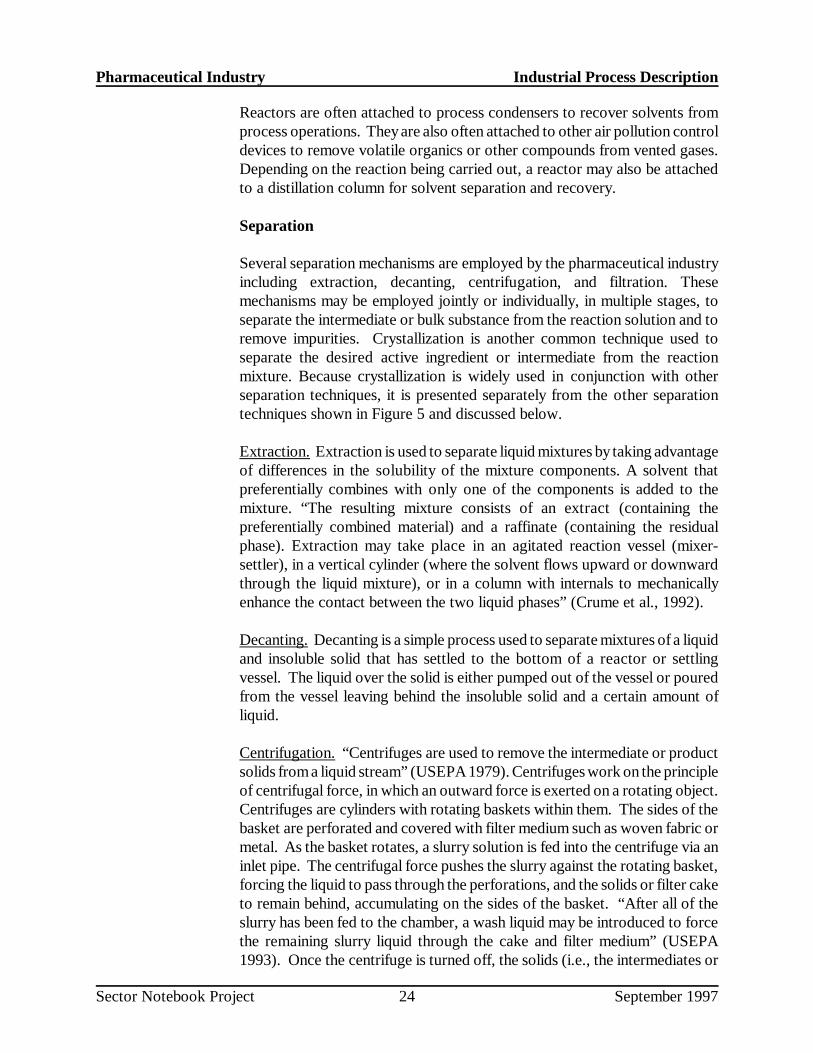
Reactors are often attached to process condensers to recover solvents from process operations. Theyare also often attached to other air pollution control devices to remove volatile organics or other compounds from vented gases. Depending on the reaction being carried out, a reactor may also be attached to a distillation column for solvent separation and recovery.
Separation
Several separation mechanisms are employed by the pharmaceutical industry including extraction, decanting, centrifugation, and filtration. These mechanisms may be employed jointly or individually, in multiple stages, to separate the intermediate or bulk substance from the reaction solution and to remove impurities. Crystallization is another common technique used to separate the desired active ingredient or intermediate from the reaction mixture. Because crystallization is widely used in conjunction with other separation techniques, it is presented separately from the other separation techniques shown in Figure 5 and discussed below.
Extraction. Extractionisused to separate liquid mixtures by taking advantage of differences in the solubility of the mixture components. A solvent that preferentially combines with only one of the components is added to the mixture. “The resulting mixture consists of an extract (containing the preferentially combined material) and a raffinate (containing the residual phase). Extraction may take place in an agitated reaction vessel (mixer-settler), in a vertical cylinder (where the solvent flows upward or downward through the liquid mixture), or in a column with internals to mechanically enhance the contact between the two liquid phases” (Crume et al., 1992).
Decanting. Decanting is a simple process used to separate mixtures of a liquid and insoluble solid that has settled to the bottom of a reactor or settling vessel. The liquid over the solid is either pumped out of the vessel or poured from the vessel leaving behind the insoluble solid and a certain amount of liquid.
Centrifugation. “Centrifuges are used to remove the intermediate or product solids from a liquid stream” (USEPA1979).Centrifugeswork on the principle of centrifugal force, in which an outward force is exerted on a rotating object. Centrifuges are cylinders with rotating baskets within them. The sides of the basket are perforated and covered with filter medium such as woven fabric or metal. As the basket rotates, a slurry solution is fed into the centrifuge via an inlet pipe. The centrifugal force pushes the slurry against the rotating basket, forcing the liquid to pass through the perforations, and the solids or filter cake to remain behind, accumulating on the sides of the basket. “After all of the slurry has been fed to the chamber, a wash liquid may be introduced to force the remaining slurry liquid through the cake and filter medium” (USEPA 1993). Once the centrifuge is turned off, the solids (i.e., the intermediates or
Sector Notebook Project 24 September 1997
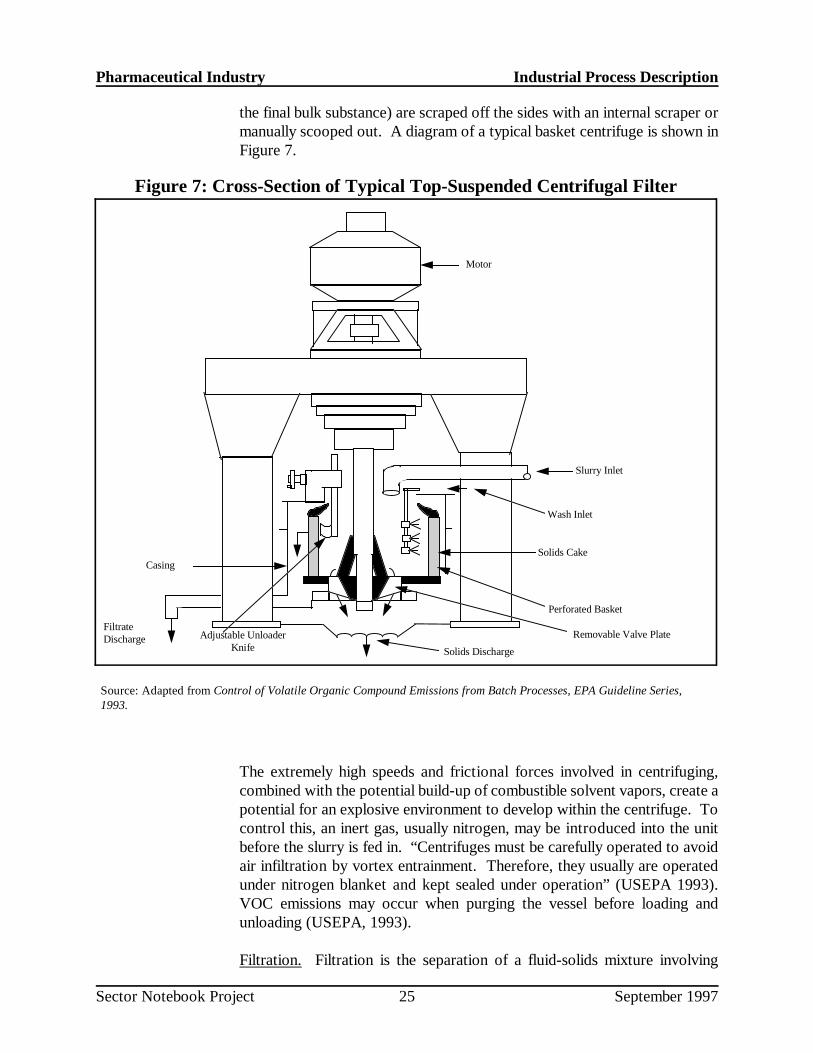
Pharmaceutical Industr y Industr ial Process Description
the final bulk substance) are scraped off the sides with an internal scraper or manually scooped out. A diagram of a typical basket centrifuge is shown in Figure 7.
Figure 7: Cross-Section of Typical Top-Suspended Centri fugal Filter
Motor
Slurry Inlet
Wash Inlet
Solids Cake
Perforated Basket
Removable Valve Plate
Solids Discharge
Casing
Filtrate Discharge Adjustable Unloader
Knife
Source: Adapted from Control of Volatile Organic Compound Emissions from Batch Processes, EPA Guideline Series, 1993.
The extremely high speeds and frictional forces involved in centrifuging, combined with the potential build-up of combustible solvent vapors, create a potential for an explosive environment to develop within the centrifuge. To control this, an inert gas, usually nitrogen, may be introduced into the unit before the slurry is fed in. “Centrifuges must be carefully operated to avoid air infiltration by vortex entrainment. Therefore, they usually are operated under nitrogen blanket and kept sealed under operation” (USEPA 1993). VOC emissions may occur when purging the vessel before loading and unloading (USEPA, 1993).
Filt ration. Filt ration is the separation of a fluid-solids mixture involving
Sector Notebook Project 25 September 1997
Pharmaceutical Industr y Industr ial Process Description
passage of most of the fluid through a porous barrier (the filter medium) which retains most of the solid particulates contained in the mixture (Perry’s 1984). In the pharmaceutical industry, “filtration is used to remove solids from a liquid,whether these solids be product, process intermediates, catalysts or carbon particulates (e.g., from a decoloring step)” (USEPA 1979). Batch filtration systems widely used by the pharmaceutical industry are the plate-and-frame filter, cartridge filters, the nutsche filter, and combination filter/dryers.
“The normal filtration procedure is simply to force or draw the mother liquor through a filt ering medium. Following filt ration, the retained solids are removed” (USEPA, 1979). The wet cake may then go through a reslurry process where it is washed and filtered again. “This option is usually carried out when a highly specialized product requiring high purity is desired or when solvents were not removed as part of the original slurry filtration (USEPA, 1993).
Crystallization
After the reaction takes place, the intermediate or final bulk substance (which is usually in solid form) can be separated from the reaction solution by crystallization. Crystallization is one of the most common separation techniques and is often used alone or in combination with one or more of the separation techniques described above. In crystallization, a supersaturated solution is created in which crystals of the desired compound are formed. Supersaturation depends on the solubilit y of the desired compound. If the compound’s solubilit y increases with temperature, supersaturation can be achieved by cooling the solution. If the solubili ty is independent of or decreases with temperature, then evaporating a portion of the solvent will create supersaturation. “If neither cooling nor evaporation is desirable, supersaturation may be induced by adding a third component. The third component forms a mix with the original solvent in which the solute is considerably less soluble” (USEPA 1979). If crystallization is done through cooling of a solution there will be relatively lit tle VOC emissions, especially if the equipment is fully enclosed. “However, when crystallization is done by solvent evaporation in a vacuum environment, there is a greater potential for emissions” (USEPA 1993). Further separation of the crystals from the supersaturated solution can be done by centrifuging or filtration.
Purification
Once the intermediate or the bulk substance has been separated, it may need to be purified. Depending on the intermediate or the bulk substance produced, there may be several purification steps involved to produce the desired active ingredient. In vitamin production, for example, there are at least three to four purification steps. Purification typically is achieved through additional
Sector Notebook Project 26 September 1997

Pharmaceutical Industr y Industr ial Process Description
separation steps such as those described above. Purification is often achieved through recrystallization. Washing with additional solvents and filt ration may also be used.
Drying
The final step in the chemical synthesis process is drying of the intermediate or final bulk substance. Drying is done by evaporating the solvents from the solids. Solvents released from drying operations may be condensed for reuse or disposal (USEPA 1993).
There are several different types of dryersused by the pharmaceutical industry including tray dryers, rotary dryers, drum or tumble dryers, or pressure filter dryers. “The selection of the dryer type depends primarily on the characteristics of the solid” (USEPA 1993).
Prior to 1980, probably the most common type of dryer used by the industry was the vacuum tray dryer. In a vacuum tray dryer, “the filtered solid is placed on trays which are then manually stacked on shelves in the dryer. When the dryer is closed, the trays are heated to remove any liquids. A vacuum is applied within the dryer so that drying can take place at lower temperatures when needed” (USEPA, 1993).
More often today, tumble dryers or combination filter/dryers are used. In a combination filter/dryer “the equipment not only acts as a filter, but can also function as a product dryer after the slurry has been compressed and filtered into cake form. Heat is introduced to the filter/dryer through a hot gaseous medium which is blown up through the cake until the desired level of dryness is achieved” (USEPA 1993). VOC emissions may occur since the gas will entrain evaporated solvent which must be vented from the drying filter/dryer.
Tumble dryers consist of revolving conical shells ranging in capacity from 20 to 100 gallons. “The rotation of the dryer tumbles the product to enhance solvent evaporation and may also perform a blending function” (USEPA 1979). These dryers may be operated under a vacuum or using hot air circulation. When operated under a vacuum, heat is supplied through conduction from heated surfaces. Some air will pass through the equipment due to inward leakage. Thus, the vacuum exhaust will contain VOCs (USEPA, 1993). A diagram of a simple tumble dryer is shown in Figure 8.
Sector Notebook Project 27 September 1997

Pharmaceutical Industr y Industr ial Process Description
Figure 8: Cross-Section of Typical Tumble Dryer
Chain Casing
Steam or Hot Water Inlet
Concrete or Structural Foundation
Discharge Opening
Vacuum Connection
Cover
Source: Adapted from Control of Volatile Organic Compound Emissions from Batch Processes, EPA Guideline Series, 1993.
Natural and Biological Product Extraction
Natural product extraction, as the name suggests, involves isolating an active ingredient from natural sources, such as plants, roots, parasitic fungi or animal glands. This process is often used to produce allergy relief medicines, insulin, morphine, anti-cancer drugs, or other pharmaceuticals withunique properties. Blood fractionation, used to produce plasma, is also part of the natural product extraction process (USEPA 1995). A simplified diagram of natural product extraction processes and its associated wastes, is shown in Figure 9.
The desired active ingredient, usually present in raw materials at very low concentrations, must be extracted for the final product. Therefore, a defining characteristic of this process is that the volume of finished product is often an order of magnitude smaller than that of the raw materials used. At each step in the extraction process, the volume of material being processed is reduced significantly. This inherent nature of the process makes it an expensive one
Sector Notebook Project 28 September 1997

Pharmaceutical Industr y Industr ial Process Description
to utilize (USEPA 1995).
Figure 9: Simplified Process Flow Diagram for Natural/Biological Extr action
M i x i n g & W a s h i n g
R a w M a te r i a l (a n i m a l t i s s u e p la n t t i s s u e ,
ro o ts , p la s m a )
W a s t e w a t e r (B O D , C O D , T S S )
E x t ra c ti o n
H 2 O
E v a p o ra t io n
W a s t e w a t e r (B O D , C O D ,
T S S , a m m o n i u m s a lts , s o lv e n t s )
S l u d g e (s o lv e n ts , o r g a n i c
m a te r i a l )
S o l v e n t v a p o r s (p h e n o l , c h l o ro fo rm ,
m e th e l y n e c h l o r .)
A c t iv e I n g r e d ie n t
T o C o m p o u n d i n g & F o r m u l a t io n
O r g a n ic S o l v e n ts (m e th e l y n e c h lo ri d e , c h l o ro fo rm , a l c o h o l ,
to lu e n e ) S c r u b b e r
W a s t e w a t e r (a c id i c o r
b a s i c , s o lv e n ts )
H 2 O
Source: Adapted from Economic Impact and Regulatory Flexibility Analysis of Proposed Effluent Guidelines for the Pharmaceutical Manufacturing Industry, 1995.
Because of the large volume reductions involved, an assembly-line processing method, consisting of several operation stations is used. At each subsequent operation station, a little more of the inert material is removed and the active ingredient is extracted. As the volume of material being processed decreases, the size of the containers carrying the material also decreases, from containers capable of carrying 75-100 gallons to, in some cases, laboratory size equipment (USEPA 1995).
Active ingredients are recovered by precipitation, purification and solvent extraction methods. In precipitation, solubilit y is changed by pH adjustment, salt formation, or addition of an anti-solvent. Solvents are used as extractive agents to remove the active ingredient from the raw materials, such as plant and animal tissues. Solvents are also used to remove fats and oils, which may contaminate the product (USEPA 1995). Such solvents remove the fats and oils, without damaging the essential active ingredient(s) found in the raw materials. Ammonia is also used in the extraction stages as a method of controlling the pH when extracting from animal and plant sources. Ammonium salts are used as buffering chemicals, and aqueous or anhydrous ammonia is used as an alkalizing agent. The high degree of solubilit y of
Sector Notebook Project 29 September 1997

Pharmaceutical Industr y Industr ial Process Description
ammoniumsaltspreventsunwanted precipitation. Also, ammonium salts have the advantage of not reacting with animal and/or plant tissues (USEPA 1995).
Sector Notebook Project 30 September 1997

Pharmaceutical Industr y Industr ial Process Description
Fermentation
Most steroids, antibiotics, and certain food additives (such as vitamins) are commonly known pharmaceuticals which are produced by fermentation. In fermentation, microorganisms (e.g., bacteria, yeast or fungi) are typically inoculated in a liquid broth supplemented with nutrients that are acclimated to an environment (e.g., temperature, pH, oxygen), conducive to rapid growth). These microorganisms produce the desired product (e.g., antibiotic, steroid, vitamin, etc.) as a by-product of normal metabolism. Fermentation involves three main steps: 1) inoculum and seed preparation, 2) fermentation, and 3) product recovery. A diagram of a fermentation process and the wastes produced in this process is shown in Figure 10.
Figure 10: Simplified Process Flow Diagram for t he Fermentation Process
Fermentation Broth
Seed
Heat
Filter
H2O
Product Dissolved or Precipitated
Wastewater (solvents,
copper, zinc, BOD, COD, TSS,
low pH)
Sludge (sugars,
starches, fermentation broths, corn steep
liquor)
Separations Active Ingredient
Inoculation Tank
Nutrients (sugars, starches)
Gas (NO2CO2, sulfur)
Solvents or Metal Salts
(MiBK, Cu, Zn)
Filter Cake
Organic Solvents (acetone, MiBK,
1,2-dichloroethane)
To Compounding & Formulation
Wastewater (solvents)
Source: Adapted from Economic Impact and Regulatory Flexibility Analysis of Proposed Effluent Guidelines for the Pharmaceutical Manufacturing Industry, 1995.
Sector Notebook Project 31 September 1997

Pharmaceutical Industr y Industr ial Process Description
Seed Preparation
The fermentation process begins with the introduction of the microbial strain to a primary seed fermentation, which is commonly performed using shaking-flask culture techniques at the laboratory scale. Once grown, the suspension is then transferred to further seed stages, which may be additional flask fermentations, stirred tanks or both. The purpose of this “seed-train” is to generate enough inoculum for the production fermentor (typically 1-10% of the production tank volume). Generally, special seed tanks are used for the fermentor inoculum which are miniature versions (1-10% of size) of the production fermentor. If a seed tank becomes contaminated, it is emptied, sterilized, and reinoculated.
Fermentation
Once the fermentor inoculum is ready, it is charged into a sterilized fermentor. During fermentation, the fermentor is usually agitated and aerated. The pH, temperature, and dissolved oxygen content of the fermentation broth may be monitored during fermentation. Fermentation may last from hours to weeks, depending on the process. A fermentor “broth” is produced, which is then filtered or centrifuged to separate out the solids (USEPA 1991).
Product Recovery
Filt ration removes any larger residues from the broth, but it does not isolate the active ingredient from the residues. This must be done by product recovery processes. Product recovery is achievable through three different methods: solvent extraction, direct precipitation and ion exchange, or adsorption (USEPA 1995). Sometimes, the active material is contained within the cells of the microorganism. Cell wall breakage by heat or ultrasound, for example, may be required to recover the material.
In solvent extraction the active ingredient is removed from the aqueous broth by contacting it with an organic solvent, in which the product is more soluble than it is in water. Removal of the active agent from the solvent can be achieved by crystallization (USEPA 1995).
The direct precipitation method of product recovery involves precipitation of the active ingredient, as a metal salt from the broth using, for example, copper (Cu) and/or zinc (Zn) as precipitating agents. The actual choice of the precipitating agent depends on the properties of the desired active ingredient. The broth is then filtered and the product is recovered from the solid residues (USEPA 1991).
Additionally, ion exchange or adsorption may be used for product recovery. Ion exchange resin (or alternatively, activated carbon) is contacted with the
Sector Notebook Project 32 September 1997

Pharmaceutical Industr y Industr ial Process Description
broth and the product adsorbs onto the resin. The product is recovered from the resin by using a solvent or by washing the resin with an acidic or basic solution. It is then crystallized.
III. A.3. Formulation, Mixing, and Compounding
“The primary objective of mixing, compounding, or formulating operations are to convert the manufactured bulk substances into a final, usable form.” (USEPA 1995) Figure 11 shows a simplified process flow diagram for compounding, formulation and packaging. Common dosage forms of pharmaceutical products include tablets, capsules, liquids, creams and ointments, as well as aerosols, patches and injectable dosages. Table 6 lists common pharmaceutical dosage forms and their uses.
Figure 11: Simplif ied Process Flow Diagram for Compounding and Formulating
Mixing & Granulation
Active Ingredient (Drug)
Tableting & Encapsulation
Washing Equipment
Tablets and Capsules
Non-Contact Cooling Water Excipients &
Binders (sugars, starches)
Solvent Emission - VOCs
Wastewater (solvents,
detergents)
Aqueous-based Solvents
Wastewater (waste starches,
sugars BOD, COD, TSS)
Fugitive emissions, vent emissions
Tablet Dust
Source: Adapted from Economic Impact and Regulatory Flexibility Analysis of Proposed Effluent Guidelines for the Pharmaceutical Manufacturing Industry, 1995.
Sector Notebook Project 33 September 1997

Pharmaceutical Industr y Industr ial Process Description
As with the bulk manufacturing operations, many final products are produced in batch utiliz ing a campaign regimen. At the end of the production campaign, another product may be formulated and packaged using the same equipment and the same personnel. Additionally, formulation and packaging is performed in accordance with “good manufacturing practices” (GMP). GMP is regulated by the FDA and sets forth the minimum methods to be used in, and the facilit ies and controls to be used for the manufacture, processing, packing, or holding of a drug to assure that such drug meets the safety requirements and the quality and purity characteristics that it purports or is represented to possess.
Following formulation, the finished product may be packaged at the same site or it may be transferred to another site. Packaging includes placing the final formulated products into containers, labeling, and preparing for shipping. “The packaging components of a pharmaceutical product are vital to its safe and effective use. Besides serving the patient as a convenient unit of use, the composite package (unit container, labeling, and shipping components) must provide appropriate identification and necessary information for proper use including warnings and (pre)cautions and preservation of the product’s chemical and physical integrity” (Kirk-Othmer, 1994).
Batch production records are used and describe each manufacturing step in detail. At various stages in the formulation and packaging process, quality control checks are utilized. All raw materials are checked prior to use in a process and the final dosage forms require a myriad of tests to assure therapeutic benefit. For example, the content uniformity, color, homogeneity, dissolution, stabilit y, identity, and potency of the product must be determined and meet stated ranges. Representative samples are collected at the end of the formulation stage and submitted to the chemical and/or microbiological laboratories for final assaying. Representative samples are also collected during packaging operations. The quality control unit of the pharmaceutical manufacturing company has the responsibilit y and authority to approve or reject all raw materials, in-process materials, packaging materials including containers, closures, and labeling materials, as well as the final product.
The equipment used to formulate and package the final product is cleaned, maintained, and sanitized at appropriate intervals. Actual maintenance and cleaning schedules and results are documented. As described under bulk manufacturing, the methods, equipment, and materials used (e.g., water wash, steam, detergents, organic solvents) to clean the equipment are specified on a per product basis.
Sector Notebook Project 34 September 1997

Pharmaceutical Industr y Industr ial Process Description
Table 6: Pharmaceutical Dosage Forms Dosage Constituents, proper ties Uses Form
Solids
powders, comminuted or blended, dissolved or mixed with water external, internal bulk
effervescent CO2 -releasing base ingredients oral
insufflation insufflator propels medicated powder into body cavity body cavities
lyophilized reconstitution by pharmacist of unstable products various uses including parenteral and oral
capsules small-dose bulk powder enclosed in gelatin shell, active ingredient plus internal diluent
troches, prepared by piping and cutting or disk candy technology; compounded with slow dissolution in mouth lozenges glycerogelatin
compressed dissolved or mixed with water; great variety of shapes and formulations oral and external tablets
pellets for prolonged action implantation
coated tablets coating protective, slow release oral
Liquid Solutions
syrups sweetener, solvent, medicinal agent flavoring agent, medicinal
spirits alcohol, water, volatile substances flavor or medicinal
collodions pyroxylin in ether, medicinal agent (castor oil, camphor) external for corns and bunions
parenteral sterile, pyrogen-free, isotonic, pH close to that of blood; oily or aqueous intravenous, intramuscular, solutions solution subcutaneous injection
ophthalmic sterile, isotonic, pH close to that of tears; viscosity builder eye treatment
nasal aqueous, isotonic, pH close to that of nasal fluids; sprays or drops nose treatment
mouthwash, aqueous, antiseptic refreshment, short term gargles bacterial control
inhalations administered with mechanical devices medication of trachea or bronchioles
Liquid Dispersions
suspensions powder suspended in water, alcohol, glycol, or an oil oral dosing, skin application
emulsions, oil-in-water or water-in-oil oral, external or injection lotions
Semisolid and plastic dispersions
ointments hydrocarbon (oily), adsorptive water-washable, or water-soluble bases; external emulsifying agents, glycols, medicating agent
pastes and ointments with high dispersed solids and waxes, respectively external cerates
suppositories theobroma oil, glycinerated gelatin, or polyethylene glycol base plus insertion into body cavity medicinal agent
Source: Adapted from Zanowaik, P.,1995, “ Pharmaceuticals” in Kirk-Othmer, Encyclopedia of Chemical Technology, vol. 18, 4th edition.
Sector Notebook Project 35 September 1997

Pharmaceutical Industr y Industr ial Process Description
Tablets
Tablets account for the majority of solid medications taken orally in the United States. “Tablets can be made to achieve rapid drug release or to produce delayed, repeated or prolonged therapeutic action” (Kirk-Othmer, 1994). Tablets can be compressed or molded, and may be coated.
To prepare a tablet, the active pharmaceutical ingredient is combined with a filler, such as sugar or starch, and a binder, such as corn syrup or starch. The filler is added to ensure that the active ingredient is diluted to the proper concentration. A binder is needed to bind tablet particles together. A lubricant, such as magnesium sterate or polyethylene glycol, may be added to facilit ate equipment operation, or to slow disintegration or dissolution of the active ingredient.
Tablets are produced by compression of powder blends or granulations. In direct compression, the ingredients are blended and then compressed into the final tablet without modifying the physical nature of the material itself. “The most widely used and most general method of tablet preparation is the wet-granulation method” (Remington, 1995). In wet granulation, the active ingredient is powdered and mixed with the filler. This mixture is then wetted and blended with the binder, forming a solution. Coarse granules form which are mixed with lubricants such as magnesium stearate and then compressed into tablets. Slugging or dry granulation is used when tablet ingredients are sensitive to moisture or temperatures associated with drying or when the tablet ingredients have sufficient inherent binding or cohesive properties. Dry granulation includes weighing, mixing, slugging, dry screening, lubrication, and compression. Slugging requires large heavy presses to compress larger tablets, between 20-30 grams in weight. These large tablets are then ground and screened to a desired mesh size then recompressed into final tablets (USEPA, 1991).
Coating may be used to offer protection from moisture, oxygen, or light, to mask unpleasant taste or appearance, and to impart distinctive colors to facilit ate patient recognition. “Enteric coatings are used to delay the release of the active ingredient in the stomach and prolong therapeutic activity. The latter are used for drugs that are unstable to gastric pH or enzymes, cause nausea and vomiting, or irritation to the stomach, or should be present in high concentrations in the intestines” (Kirk-Othmer, 1994). Coating is done in a rotary drum. The coating solution is poured onto the tablets. In many operations, aqueous coating solutions are now used instead of solvent based (usually methylene chloride) solutions. As the drum rotates, the tablets become coated. Once coated, they are dried in the drum and may be sent to another rotary drum for polishing. Polishing works by the friction created
Sector Notebook Project 36 September 1997
Pharmaceutical Industr y Industr ial Process Description
when the tablets rotate and rub against each other. Un-coated tablets may also be polished.
Once the tablets pass quality control requirements, they may be held or sent directly to packaging. Coated tablets are stamped with identifying information (e.g., brand name, code number) in a rotary ink press.
Capsules
After tablets, the most common solid oral dosage form is the capsule. Capsules come in soft and hard shelled varieties. Hard capsules or “dry-filled” capsules are formed by dipping metal pins into a solution of gelatin of a specific temperature. The temperature controls the viscosity of the gelatin and hence the thickness of the capsule walls. When the pins are removed from the solution, a hard coating of gelatin forms on the pins. The coating is dried and trimmed. “These capsules are filled by introducing the powdered material into the longer end or body and the capsule and then slipping on the cap.” (Remington, 1995)
Soft shelled capsules are formed by placing two continuous gelatin films between rotary die plates. As the plates are brought together, the two gelatin films join and seal, forming the two halves of the capsule. As the two halves join, the ingredients, which can be a liquid, paste or powder, are injected into the capsules. “Commercially fille d soft gelatin capsules come in a wide choice of sizes and shapes: they may be round, oval, oblong, tube or suppository-shaped” (Remington).
Liquid Dosage
In formulating a liquid product, the ingredients are first weighed and then dissolved in an appropriate liquid. The solutions are mixed in glass-lined or stainless steel vessels, after which they are stored in tanks before final packaging. Preservatives may be added to prevent mold and bacterial growth. If the liquid will be used for injection or ophthalmic use, sterilization is required. In this case, the container, which has also been previously sterilized/depyrogenated, is filled with liquid which has either been rendered sterile by aseptic filtration in a sterile environment and/or the entire container and its contents are terminally heat sterilized in an autoclave.
Ointments and Creams
Ointments are usually made byblendingthe bulk active ingredient with a base, such as a petroleum derivative or wax. The mixture is cooled, rolled out, and poured into tubes by machines and packaged (USEPA, 1991).
Sector Notebook Project 37 September 1997

Pharmaceutical Industr y Industr ial Process Description
Creams are semisolid emulsions and are either oil-in-water or water-in-oil, rather than being petroleum based. “Generally, the ingredients of the two phases are heated separately, then are mixed and stirred vigorously to achieve emulsification” (Kirk-Othmer, 1994).
As with all other dosage forms, equipment is washed and cleaned based on batch record requirements. However, because of the greasy nature of ointment and cream production, cleaning often is done with detergents.
Sector Notebook Project 38 September 1997
Pharmaceutical Industr y Industr ial Process Description
III. B. Raw Material Inputs and Pollutant Outputs
Pharmaceutical batch processes use numerous raw materials and generate wastes and emissions. In general, the waste and emissions generated depend on the raw materials and equipment used, as well as the manufacturing process employed. In designing bulk manufacturing processes, consideration is given to the availabilit y of the starting materials and their toxicity, as well as the wastes (e.g., mother liquors, filter residues, and other by-products) and the emissions generated. A description of some of the considerations given is provided in Section V, Pollution Prevention Opportunities.
When bulk manufacturing reactions are complete, the solvents are physically separated from the resulting product. Due to purity concerns, solvents often are not reused in a pharmaceutical process. They may be sold for non-pharmaceutical uses, used for fuel blending operations, recycled, or destroyed through incineration.
This section describes the raw materials and associated waste streams and some of the more common technologies used to control these wastes. Much of this information is summarized in Table 7.
Sector Notebook Project 39 September 1997

Pharmaceutical Industr y Industr ial Process Description
Table 7: Summary of Typical Material Inputs and Pollution Outputs in the Pharmaceutical Industr y
Process Inputs (examples of some commonly used chemicals provided)
Air Emissions Wastewater Residual Wastes
Chemical Synthesis
- Reaction
Solvents, catalysts, reactants, e.g. benzene, chloroform, methylene chloride, toluene, methanol, ethylene glycol, methyl isobutyl ketone (MiBK), xylenes, hydrochloric acid, etc.
VOC emissions from reactor vents, manways, material loading and unloading, acid gases (halogen acids, sulfur dioxide, nitrous oxides); fugitive emissions, from pumps, sample collections, valves, tanks
Process waste waters with spent solvents, catalysts, reactants; pump seal waters, wet scrubber wastewater; equipment cleaning wastewater; wastewater maybe high in BOD, COD, TSS with pH of 1-11.
Reaction residues and reactor bottom wastes
- Separation Separation and extraction solvents, e.g.. methanol, toluene, hexanes, etc.
VOC emissions from filtering systems which aren’t contained; and fugitive emissions from valves, tanks and centrifuges
Equipment cleaning wash waters, spills, leaks, spent separation solvents
- Purification Purification solvents e.g.. methanol, toluene, acetone, hexanes, etc.
Solvent vapors from purif ication tanks; fugitive emissions
Equipment cleaning wash waters, spills, leaks, spent purif ication solvents
- Drying Finished active drug(s) or intermediates
VOC emissions from manual loading and unloading of dryers
Equipment cleaning wash waters, spills, leaks
Natural Product Extr action
Plants, roots, animal tissues, extraction solvents, e.g.. ammonia, chloroform, phenol, toluene, etc.
Solvent vapors & VOC’s from extraction chemicals
Equipment cleaning wash waters, spent solvents (ammonia); natural product extraction wastewater have low BOD, COD, TSS and pH of 6-8.
Spent raw materials (plants, roots etc.)
Fermentation Inoculum, sugars, starches, nutrients, phosphates, fermentation solvents, e.g.. ethanol, amyl alcohol, methanol, MiBK, acetone, etc.
Odoriferous gases, extraction solvent vapors, particulates
Spent fermentor broth, fermentation wastewater containing sugars, starches, nutrients, etc.; wastewater tends to have high BOD, COD, TSS and have pH of 4-8.
Waste filter cake, fermentation residues
Formulation Active drug, binders (starches), sugar, syrups, etc.
Tablet dusts, other particulates
Equipment cleaning wash waters (spent solvents), spills, leaks; wash waters typically contain low levels of BOD, COD, TSS and have pH of 6-8.
Particulates, waste packaging, rejected tablets, capsules etc.
Source: Development Document for Proposed Effluent Limitations Guidelines and Standards for the Pharmaceutical Manufacturing Point Source Category, US EPA, Washington, DC., February 1995.
Sector Notebook Project 40 September 1997

Pharmaceutical Industr y Industr ial Process Description
III. B.1. Raw Materials
“The pharmaceutical manufacturing industry draws upon worldwide sources for the myriad of raw materials it needs to produce medicinal chemicals. Fermentation operations require many new raw materials falling into general chemical classifications such as carbohydrates, carbonates, steep liquors, nitrogen, and phosphorus compounds, anti-foam agents, and various acids and bases. These chemicals are used as carbon and nutrient sources, as foam control additives, and for pH adjustment in fermentation processes. Various solvents, acids, and bases are also required for extraction and purification processes.
Hundreds of raw materials are required for the chemical synthesis processes used by the industry. These include organic and inorganic compounds and are used in gas, liquid, and solid forms. Plant and animal tissues are also used by the pharmaceutical manufacturing industry to produce various biological and natural extraction products” (EPA, 1995).
Each manufacturing or formulation plant is special, differing from other similar pharmaceutical plants in size, types of intermediates, bulk substances, or products produced, amounts and types of solvents used, and thus, in the raw materials used and wastes/emissions generated. Most bulk pharmaceutical reactions require organic solvents to dissolve chemical intermediates and reagents. Because of the high reactivity of many pharmaceutical reagents and intermediates, pharmaceutical solvents must be non-reactive, provide an environment which allows efficient heat transfer during endothermic or exothermic reactions, and facilit ate effic ient electron transfer. Often halogenated solvents, such as methylene chloride, provide the optimum choice for pharmaceutical reactions. The most commonly used solvent in the pharmaceutical industry is methanol, an oxygenated organic solvent. Other common solvents used are ethanol, acetone, and isopropanol. Tables 8, 9, and 10 show the typical solvents (and whether or not they are priority pollutants or hazardous air pollutants) used in chemical synthesis, biological and natural extraction, and fermentation processes, respectively.
Final bulk substances from the bulk manufacturing processes are used in formulation operations, along with other raw materials or ingredients. The production of these ingredients is described under Section III.A .2.
Sector Notebook Project 41 September 1997

Pharmaceutical Industr y Industr ial Process Description
Table 8: Solvents Used in the Chemical Synthesis Process
Chemical Priorit y Pollutant Under the
Clean Water Act
Hazardous Air Pollutant
under the Clean Air
Act
Chemical Priorit y Pollutant Under the
Clean Water Act
Hazardous Ai r
Pollutant under the Clean Air
Act
Acetone Ethylene glycol X
Acetonitrile X Formaldehyde X
Ammonia (aqueous) Formamide
n-Amyl acetate Furfural
Amyl Alcohol n-Heptane
Aniline X n-Hexane X
Benzene X X Isobutyraldehyde
2-Butanone (MEK) X Isopropanol
n-Butyl acetate Isopropyl acetate
n-Butyl alcohol Isopropyl ether
Chlorobenzene X X Methanol X
Chloroform X X Methylamine
Chloromethane X X Methyl cellulose
Cyanide X Methylene chloride X X
Cyclohexane Methyl formate
o-Dichlorobenzene (1,2-Dichlorobenzene)
X Methyl isobutyl ketone (MiBK)
X
1,2-Dichlorobenzene X 2-Methylpyridine
Diethylamie Petroleum naphtha
Diethyl Ether Phenol X X
N,N-Dimethyl acetamide
Polyethylene glycol 600
Diethylamine n-Propanol
N,N-Dimethylaniline X Pyridine
N,N-Dimethylformamide
X Tetrahydrofuran
Dimethyl sulfoxide Toluene X X
1,4-Dioxane X Trichlorofloromethane
Ethanol Triethylamine X
Ethyl acetate Xylenes X
Source: adapted from Development Document for Proposed Effluent Guidelinesand Standards for the Pharmaceutical Manufacturing Point Source Category, 1995 and US Environment Laws, 1994.
Sector Notebook Project 42 September 1997

Pharmaceutical Industr y Industr ial Process Description
Table 9: Solvents Used in Biological and Natural Product Extr action Chemicals Priorit y
Pollutants under the
Clean Water Act
Hazardous Ai r
Pollutants under the Clean Air
Act
Chemicals Priorit y Pollutants under the
Clean Water Act
Hazardous Ai r
Pollutants under the Clean Air
Act
Acetone Ethylene glycol X
Acetonitrile X Formaldehyde X
Ammonia (aqueous) n-Heptane
n-Amyl acetate n-Hexane X
Amyl alcohol Isopropanol
n-Butyl alcohol Isopropyl acetate
Chloroform X X Isopropyl ether
1,2-Dichloroethane X Methanol X
Diethylamine Methylene chloride
X X
Diethyl ether Petroleum naphtha
N,N-Diethylformamide
X Phenol X X
Dimethyl sulfoxide n-Propanol
1,4-Dioxane X Pyridine
Ethanol Tetrahydrofuran
Ethyl acetate Toluene X X
Source: adapted fromDevelopment Document for Proposed Effluent Guidelines and Standards for the Pharmaceutical Manufacturing Point Source Category, 1995 and US Environment Laws, 1994.
Table 10: Solvents Used in Fermentation Processes Chemicals Priorit y
Pollutants Under the Clean Water
Act
Hazardous Ai r
Pollutants under the Clean Air
Act
Chemicals Priorit y Pollutants Under the Clean Water
Act
Hazardous Ai r
Pollutants under the Clean Air
Act
Acetone n-Heptane
Acetonitrile X n-Hexane X
Ammonia (aqueous) Isopropanol
n-Amyl acetate Isopropyl acetate
Amyl alcohol Methanol X
n-Butyl acetate Methyl cellulose
n-Butyl alcohol Methylene chloride
X X
Chloroform X X Methyl isobutane ketone (MiBK)
X
Sector Notebook Project 43 September 1997

Pharmaceutical Industr y Industr ial Process Description
Table 10: Solvents Used in Fermentation Processes N,N-Diethylformamide
X Petroleum naphtha
Ethanol Phenol X X
Ethyl acetate Toluene X X
Formaldehyde X Triethylamine X
Source: adapted from Development Document for Proposed Effluent Guidelines and Standards for the Pharmaceutical Manufacturing Point Source Category, 1995 and US Environment Laws, 1994.
III. B.2. Air Emissions and Control Systems
Both gaseous organic and inorganic compounds, as well as particulates, may be emitted during pharmaceutical manufacturing and formulation. Some of the volatile organic compounds (VOC) and inorganic gases that are emitted are classified as hazardous air pollutants (HAPs) under the Clean Air Act.
The type and amount of emissions generated are dependent on the operations conducted by the facility, as well as how the product is manufactured or formulated. “Each (pharmaceutical) plant is unique, differing from other plants in size, types of products manufactured, amounts and types of VOC used, and air pollution control problems encountered” (EPA, 1979).
Bulk Manufacturing
As previously described, the industry manufactures most bulk pharmaceutical substances and intermediates in campaigns via batch processes. Following the completion of one campaign, another bulk substance or intermediate is typically made using the same equipment (e.g., reactors, filters, dryers). The reactants and solvents used in manufacturing the next bulk substance or intermediate may vary greatly from the ones previously used. While some reactions may require the use of halogenated solvents, the next reaction may use another solvent or no solvent at all.
This wide variations in bulk manufacturing makes predicting typical or annual average emissions difficult. This is because the emission generated are predicated on what bulk substance or intermediate is manufactured and over what length of time, and which equipment and raw materials are used. Some bulk substances and intermediates are made frequently, while others may be made only once every two to three years over a one to two week period. This has often prevented the calculation of typical emission rates for each operation. However, an approximate ranking of emission sources has been established by EPA and is presented below in order of decreasing magnitude. The first four sources generally will account for the majority of emissions from a bulk manufacturing plant.
�Dryers
Sector Notebook Project 44 September 1997

Pharmaceutical Industr y Industr ial Process Description
Dryers
�Reactors�Distillation units�Storage and transfer of materials�Filt ration�Extraction�Centrifugation�Crystallization
are one of the largest sources of VOC emissions in bulkmanufacturing. In addition to the loss of solvent during drying, manual loading and unloading of dryers can release solvent vapors into ambient air, especially when tray dryers are used. VOCs are also generated from reaction and separation steps via reactor vents and manways. Centrifuges may be a source of VOC emissions, especially in top loading types, where solids are manually scooped out.
Typical controls for these emission sources, excluding storage and transfer operations, include condensers, scrubbers, carbonabsorbers and, on occasion, incinerators. “Storage and transfer emissions can be controlled by vapor return lines, vent condensers, conservation vents, vent scrubbers, pressure tanks and carbon absorbers. Floating roofs may be feasible controls for large vertical storage tanks” (EPA, 1979).
Formulation
Both particulates and VOCs may be formed during mixing, compounding, formulation, and packaging steps. Because these compounds may pose a danger to workers, through direct inhalation, they are a principal concern. Depending on the process and the batch record requirements, the particulates (e.g., tablet dusts) may be recycled back into the formulation process. However, sometimes the particulates are collected for destruction or disposal.
As in bulk manufacturing, the type and quantity of compounds emitted depends on the operation. For example, formulation facilit ies may or may not emit VOCs. Some formulation operations do not require the use of solvents, some may only use solvents for cleaning, and some may use solvents in granulation and coating operations. In some facilit ies, organic compounds, such as ethanol or isopropyl alcohol, might be used in the formulation of the product and VOCs may be emitted during mixing, formulation, and/or packaging.
Air Pollution Control Equipment
More than one type of air control equipment may be used at any one time in any one facilit y. A description of the various equipment used by the industry
Sector Notebook Project 45 September 1997

Pharmaceutical Industr y Industr ial Process Description
is provided below.
Condensers. Condensers are widely used in the pharmaceutical industry to recover solvents from process operations (a process condenser) and as air pollution control devices to remove VOCs from vented gases. Process condensers differ from condensers used as air pollution control devices as the primary purpose of a process condenser is to recover material as an integral part of a unit operation. The process condenser is the first condenser located after the process equipment and supports a vapor-to-liquid phase change for the vapors produced in the process equipment. Examples of process condensers include distillation condensers, reflux condensers, process condensers in line before the vacuum source, and process condensers used in stripping or flashing operations. The primary purpose of a condenser used as an air pollution control device is to remove VOCs prior to venting.
Condensation is the process of converting a gas or vapor to liquid. In this method, gas streams from vents containing VOCs are cooled to below their saturation temperatures, converting the gas into a VOC liquid. This removes some VOCs from the gas, but some remains. The amount of VOCs remaining in the gas depends on the temperature and vapor-liquid equilibrium of the VOC. Lowering the temperature of the condenser generally lowers the content of VOC in the gas stream.
“In the most common type, surface condensers, the coolant does not directly contact condensable vapors, rather heat is transferred across a surface (usually a tube wall) separating vapor and coolant. In this way the coolant is not contaminated with condensed VOC and may be directly reused. The type of coolant used depends on the degree of cooling needed for a particular situation” (EPA, 1979). Coolants in common use are water, chilled water, brine, and glycol.
Scrubbers. Scrubbers or gas absorbers are used to remove one or more constituents from a gas stream by treatment with a liquid. “Absorption is important in the pharmaceutical industry because many VOCs and other chemicals being used are soluble in water or aqueous solutions. Therefore, water, caustic or acidic scrubbers can be applied to a variety of air pollution problems” (USEPA 1979).
When using a scrubber as an air pollution control device, the solubilit y of the constituents in the gas stream in the absorbing liquid must be determined. “The rate of transfer of the soluble constituents from the gas to the liquid phase is determined by diffusional processes occurring on each side of the gas liquid interface” (Theodore and Bonicore, 1989).
The main types of scrubbers used are packed tower, plate or tray tower,
Sector Notebook Project 46 September 1997

Pharmaceutical Industr y Industr ial Process Description
venturi scrubber, and spray tower. Each type of scrubber is designed to provide intimate contact between the scrubbing liquid and the gaseous constituents so that mass transfer between phases is promoted. The degree of control achieved is dependent on the residence time of the gas and liquids, the interfacial area, and the physical and thermodynamic properties of the VOC species involved.
Combustion or Incineration. Another method used for controlling VOC emissions is combustion or incineration. “In general, factors that influence the efficiency of combustion are: (1) temperature, (2) degree of mixing, (3) residence time in the combustion chamber, and (4) type of VOC combusted. Since more waste streams contain dilute VOC concentrations, they require that supplemental fuel maintain the necessary combustion temperatures” (EPA, 1979). Although combustion systems can achieve high removal efficiencies, these systems are typically more expensive to install, operate, and maintain, and have secondary emissions associated with their operation. Additionally, a scrubber may be required to control inorganic gases produced as by-products of combustion.
“Equipment used to control waste gases by combustion can be divided into three categories: direct combustion or flaring (not often used by the pharmaceutical industry), thermal oxidation, and catalytic oxidation. A direct combustor or flare is a device in which air and all the combustible waste gases react at the burner. In contrast, in thermal oxidation, the combustible waste gases pass over or around a burner flame into a residence chamber where oxidation of the waste gases is completed. Catalytic oxidation is very similar to thermal oxidation. The main difference is that after passing through the flame area, the gases pass over a catalyst bed which promotes oxidation at a lower temperature than does thermal oxidation” (Theodore and Buonicore, 1989). Efficiency rates of catalytic oxidizers in destroying VOCs can reach close to 98% (Buonicore and Davis, 1992).
Adsorption. Adsorption is another method for removing VOCs from gas streams. This method filters out the volatiles by passing them through a packed column of activated carbon, silicates, aluminas, aluminosilicates, or any other surface which is porous and has a microcrystalline structure. As the gas stream passes through the column, the VOCs adsorb to the surface of the media. The adsorption material in the column eventually becomes saturated, and must be either regenerated or disposed. Most sorbents may be regenerated repeatedly by passing hot gas or steam through the bed. VOCs will desorb into the gas or steam. The high VOC concentration in the gas or steam can then be removed through condensation. Adsorption can be about 98% efficient in removing VOCs in the waste gas stream (Crume and Portzer, 1992).
Sector Notebook Project 47 September 1997

Pharmaceutical Industr y Industr ial Process Description
III. B.3. Wastewater
Pharmaceutical manufacturers use water for process operations, as well as for other non-process purposes. However, the use and discharge practices and the characteristics of the wastewater will vary depending on the operations conducted at the facilit y. Additionally, in some cases, water may be formed as part of a chemical reaction.
Process water includes any water that, during manufacturing or processing, comes into direct contact with or results from the use of any raw material or production of an intermediate, finished product, byproduct, or waste. Process wastewater includes water that was used or formed during the reaction, water used to clean process equipment and floors, and pump seal water. Non-process wastewater includes noncontact cooling water (e.g., used in heat exchangers), noncontact ancillary water (e.g., boiler blowdown, bottle washing), sanitary wastewater, and wastewater from other sources (e.g., storm water runoff).
Based on the responses from 244 facilit ies to a 1990 308 Questionnaire, EPA estimated the average daily wastewater generation by the pharmaceutical manufacturing industry to be 266 million gallons. Additionally, EPA learned that more than half of the responding facilit ies have implemented water conservation measures. Such measures include: careful monitoring of water use, installation of automatic monitoring and alarm systems or in-plant discharges, implementation of alternative production processes, reuse of non-contact water as process makeup water and treatment of contact cooling water to allow reuse.
Pharmaceutical manufacturers generate process wastewater containing a variety of conventional parameters (e.g., BOD, TSS, and pH) and other chemical constituents. The top ten chemicals discharged by the pharmaceutical industry are provided in Table 11. Of these compounds, two are “priority pollutants” 3. The top four compounds are oxygenated organic solvents (e.g., methanol, ethanol, acetone, and isopropanol).
3 Priority pollutants are the pollutants listed in 40 CFR part 403, Appendix A.
Sector Notebook Project 48 September 1997

Pharmaceutical Industr y Industr ial Process Description
Table 11: Chemicals Discharged in Wastewater by the Pharmaceutical Manufactur ing Industry
Constituent Name Quanti ty
Discharged (lbs/yr ) Percent of Total
Loading # of Facilit ies Report ing
Constituents
Methanol 15,388,273 28 82
Ethanol 6,802,384 12 97
Acetone 4,573,766 8.4 55
Isopropanol 4,565,370 8.4 85
Acetic acid 4,328,691 7.9 44
Methylene chloride 3,590,640 6.6 47
Formic acid 2,136,059 3.9 9
Ammonium hydroxide 1,365,741 2.5 32
N1N-Dimethylacetamide 1,046,333 1.9 7
Toluene 783,364 1.4 43
Source: adapted fromDevelopment Document for Proposed Effluent Guidelines and Standards for the Pharmaceutical Manufacturing Point Source Category, 1995 and US Environment Laws, 1994.
Most process wastewater receives some treatment, either in-plant at the process unit prior to commingling with other facilit y wastewater or prior to discharge to a permitted outfall. Table 12 provides a trend analysis prepared by EPA of wastewater treatment technologies used by the pharmaceutical industry. EPA found that “since 1986, the use of neutralization, equalization, activated sludge, primary clarification, multimedia filtration, steam stripping, secondary clarification, granular activated carbon, and oxidation have all increased, while the use of aerated lagoons, chlorination, waste stabilization ponds, and trickling filters have decreased slightly” (USEPA 1995).
More than half of the surveyed facilit ies provide pH adjustment or neutralization to adjust the pH prior to discharge. Additionally, because wastewater treatment can be sensitive to spikes of high flow or high constituent concentration, many treatment systems include equalization. Advanced biological treatment is used to treat biochemical oxygen demand (BOD5), chemical oxygen demand (COD), total suspended solids (TSS), as well as various organic constituents. Biological systems can be divided into two basic types: aerobic (treatment takes place in the presence of oxygen) and anaerobic (treatment takes places in the absence of oxygen). Very few pharmaceutical facilit ies (only two) use anaerobic treatment. However, more than 30 percent use aerobic systems such as activated sludge, aerated lagoons, trickling filter, and rotating biological contactors (RBC).
Sector Notebook Project 49 September 1997

Pharmaceutical Industr y Industr ial Process Description
Table 12: Wastewater Treatment Technology Trends
Tr eatment Technology Percentage of Facilities Using
Technology Pr ior to 1986 Percentage of Facilities Using
Technology in 1989/1990
Neutralization 26.0 44.3
Equalization 20.1 28.6
Activated sludge 16.9 20.5
Settleable solids removal 13.3 NA
Primary sedimentation 12.0 NA
Aerated lagoon 7.5 4.9
Primary clarif ication 3.9 9.8
Chlorination 3.6 2.5
Polishing ponds 3.2 NA
Waste stabilization pond 2.9 2.5
Trickling filter 2.9 2.0
Multimedia filtr ation 2.3 6.1
Stream stripping 1.9 5.7
Evaporation 1.9 NA
Secondary clarif ication 1.6 20.9
Granular activated carbon 1.3 3.3
Oxidation 1.0 2.0
Dissolved air flotation 1.0 NA
pH adjustment NA 50.0
Phase separation NA 12.3
Note: Total percentage is not 100 because facilities may use multiple treatment technologies. NA - Not available.
Source: adapted from Development Document for Proposed Effluent Guidelines and Standards for the Pharmaceutical Manufacturing Point Source Category, 1995 and US Environment Laws, 1994.
Although the pharmaceutical industry has routinely utilized recovery systems to recover and reuse solvents, only four facilit ies were identified by EPA as using stream stripping to remove gases and/or organic chemicals from wastewater streams. Sixty one facilit ies were identified that use distillation either to recover a specific solvent from a process stream or to treat one or more process waste streams. However, according to PhRMA, it is likely that
Sector Notebook Project 50 September 1997

Pharmaceutical Industr y Industr ial Process Description
these facilit ies use this method to recover a specific solvent from a specific process stream rather than to treat wastewater from numerous operations since the treatment technology is not applicable to the wide range of waste characteristics common in the pharmaceutical industry.
III. B.4. Solid Wastes
Both nonhazardous and hazardous wastes are generated during all three stages of pharmaceutical manufacturing. These wastes can include off-spec or obsolete raw materials or products, spent solvents, reaction residues, used filt er media, still bottoms, used chemical reagents, dusts from filt ration or air pollution control equipment, raw material packaging wastes, laboratory wastes, spills, as well as wastes generated during packaging of the formulated product.
Filter cakes and spent raw materials (plants, roots, animal tissues etc.) from fermentation and natural product extraction are two of the largest sources of residual wastes in the pharmaceutical industry. Other wastes include reaction residues and filtrates from chemical synthesis processes. These wastes may be stripped of any solvents which remain in them, and then disposed as either hazardous or nonhazardous wastes. Typically, solid wastes are shipped off-site for disposal or incineration.
A number of practices are implemented by the industry to reduce waste generation and material losses. Typical practices include process optimization, production scheduling, materials tracking and inventory control, special material handling and storage procedures, preventive maintenance programs, and waste stream segregation.
Sector Notebook Project 51 September 1997

Pharmaceutical Industr y Industr ial Process Description
III. C. Management of TRI Chemicals in the Production Process
The Pollution Prevention Act of 1990 (PPA) requires facilit ies to report information about the management of Toxics Release Inventory (TRI) chemicals in waste and efforts made to eliminate or reduce those quantit ies. These data have been collected annually in Section 8 of the TRI reporting Form R beginning with the 1991 reporting year. The data summarized below cover the years 1994 through 1997 and are meant to provide a basic understanding of the quantities of waste handled by the industry, the methods typically used to manage this waste, and recent trends in these methods. TRI waste management data can be used to assess trends in source reduction within individual industries and facilit ies, and for specific TRI chemicals. This information could then be used as a tool in identifying opportunities for pollution prevention compliance assistance activities.
While the quantities reported for 1994 and 1995 are estimates of quantities already managed, the quantities reported for 1996 and 1997 are projections only. The PPA requires these projections to encourage facilit ies to consider future waste generation and source reduction of those quantities as well as movement up the waste management hierarchy. Future-year estimates are not commitments that facilit ies reporting under TRI are required to meet.
Table 13 shows that the TRI reporting pharmaceutical facilit ies managed about 382 million pounds of production related wastes (total quantity of TRI chemicals in the waste from routine production operations in Column B) in 1995. From the yearly data presented in Column B, the total quantity of production related wastes increased between 1994 and 1995. This is probably in part because the number of chemicals on the TRI list almost doubled between those years. The quantity of wastes generated was also projected to increase in 1996 and 1997. The effect of production increases on the amount of wastes generated has not been evaluated.
Values in Column C are intended to reveal the percentage of TRI chemicals that are either transferred off-site or released to the environment. Column C is calculated by dividing the total TRI transfers and releases (reported in Sections 5 and 6 of the TRI Form R) by the total quantity of production-related waste (reported in Section 8 of Form R). Column C shows a decrease in the portion either transferred off-site or released to the environment from 50 percent in 1994 to 46 percent in 1995. The waste released to the environment or transferred off-site for disposal decreased slightly in 1995 to about 10 percent of total wastes generated, as shown in Column J. This decreasing trend is projected to continue through 1997.
Sector Notebook Project 52 September 1997

Pharmaceutical Industr y Industr ial Process Description
The overall proportions of wastes managed off-site (Columns D, E, and F) and onsite (Columns G, H, and I) change very little from year to year. About 50 percent of the industry’s TRI wastes were managed on-site through recycling, energy recovery, or treatment as shown in columns D, E, and F, respectively. Almost all of these on-site managed wastes were recycled or treated on-site. Only about two percent were used in energyrecovery. Waste that is transferred off-site can be divided into portions that are recycled off-site, recovered for energy off-site, or treated off-site as shown in columns G, H, and I, respectively. The remaining portion of the production related wastes, 10 percent, shown in column J, is either released to the environment through direct discharges to air, land, water, and underground injection, or it is disposed off-site.
Table 13: Source Reduction and Recycling Activity for t he Pharmaceuticals Industry as Report ed within TRI
A B C On-Site Off-Site
J
Year
Quantity of Production-
Related Waste
(106 lbs.)a
% Released and
Transferred b
% Released
and Disposedc
Off-site
D E F G H I
% Recycled
% Energy Recovery % Treated
% Recycled
% Energy Recovery % Treated
1994 324 50% 13.9% 2.0% 33.5% 5.3% 21.7% 13.3% 10.8%
1995 382 46% 16.8% 1.6% 34.3% 4.7% 21.6% 11.7% 9.7%
1996 404 NA 18.7% 1.6% 37.1% 5.1% 18.8% 10.4% 8.4%
1997 414 NA 20.4% 1.6% 35.9% 5.5% 18.4% 9.9% 8.3%
Source: Toxics Release Inventory Database, 1995.a Within this industry sector, non-production related waste < 1% of production related wastes for 1995.b Total TRI transfers and releases as reported in Section 5 and 6 of Form R as a percentage of production related wastes.c Percentage of production related waste released to the environment and transferred off-site for disposal.
Sector Notebook Project 53 September 1997

Pharmaceutical Industr y Industr ial Process Description
Sector Notebook Project 54 September 1997

Pharmaceutical Industr y Releases and Transfers Profile
IV. CHEMICAL RELEAS E AND TRANSFER PROFILE
This section is designed to provide background information on the pollutant releases that are reported by this industry. The best source of comparative pollutant release information is the Toxic Release Inventory (TRI). Pursuant to theEmergencyPlanningand Community Right-to-Know Act, TRI includes self- reported facilit y release and transfer data for over 600 toxic chemicals. Facilities within SIC Codes 20 through 39 (manufacturing industries) that have more than 10 employees, and that are above weight-based reporting thresholds are required to report TRI on-site releases and off-site transfers. The information presented within the sector notebooks is derived from the most recently available (1995) TRI reporting year (which includes over 600 chemicals), and focuses primarily on the on-site releases reported by each sector. Because TRI requires consistent reporting regardless of sector, it is an excellent tool for drawing comparisons across industries. TRI data provide the type, amount and media receptor of each chemical released or transferred.
Although this sector notebook does not present historical information regarding TRI chemical releases over time, please note that in general, toxic chemical releases have been declining. In fact, according to the 1995 Toxic Release Inventory Public Data Release, reported onsite releases of toxic chemicals to the environment decreased by 5 percent (85.4 million pounds) between 1994 and 1995 (not including chemicalsadded and removed from the TRI chemical list during this period). Reported releases dropped by 46 percent between 1988 and 1995. Reported transfers of TRI chemicals to off-site locations increased by 0.4 percent (11.6 million pounds) between 1994 and 1995. More detailed information can be obtained from EPA's annual Toxics Release Inventory Public Data Release book (which is available through the EPCRA Hotline at 800-535-0202), or directly from the Toxic Release Inventory System database (for user support call 202-260-1531).
Wherever possible, the sector notebooks present TRI data as the primary indicator of chemical release within each industrial category. TRI data provide the type, amount and media receptor of each chemical released or transferred. When other sources of pollutant release data have been obtained, these data have been included to augment the TRI information.
TRI Data Limitations
Certain limitations exist regarding TRI data. Release and transfer reporting are limited to the approximately 600 chemicals on the TRI list. Therefore, a large portion of the emissions from industrial facilit ies are not captured by TRI. Within some sectors, (e.g. dry cleaning, printing and transportation equipment cleaning) the majority of facilit ies are not subject to TRI reporting because they are not considered manufacturing industries, or because they are below TRI reporting thresholds. For these sectors, release information from
Sector Notebook Project 55 September 1997

Pharmaceutical Industr y Releases and Transfers Profile
other sources has been included. In addition, many facilit ies report more than one SIC code reflecting the multiple operations carried out onsite. Therefore, reported releases and transfers may or may not all be associated with the industrial operations described in this notebook.
The reader should also be aware that TRI "pounds released" data presented within the notebooks is not equivalent to a "risk" ranking for each industry. Weighting each pound of release equally does not factor in the relative toxicity of each chemical that is released. The Agency is in the process of developing an approach to assign toxicological weights to each chemical released so that one can differentiate between pollutants with significant differences in toxicity. As a preliminary indicator of the environmental impact of the industry's most commonly released chemicals, the notebook briefly summarizes the toxicological properties of the top five chemicals (by weight) reported by each industry.
Definitions Associated with Section IV Data Tables
General Definitions
SIC Code -- the Standard Industrial Classification (SIC) is a statistical classification standard used for all establishment-based Federal economic statistics. The SIC codes facilit ate comparisons between facilit y and industry data.
TRI Facilities -- are manufacturing facilit ies that have 10 or more full- time employees and are above established chemical throughput thresholds. Manufacturing facilit ies are defined as facilit ies in Standard Industrial Classification primary codes 20-39. Facilities must submit estimates for all chemicals that are on the TRI list and are above throughput thresholds.
Data Table Column Heading Definit ions
The following definitions are based upon standard definitions developed by EPA’s Toxic Release Inventory Program. The categories below represent the possible pollutant destinations that can be reported.
RELEASES -- are an on-site discharge of a toxic chemical to the environment. This includes emissions to the air, discharges to bodies of water, releases at the facilit y to land, as well as contained disposal into underground injection wells.
Releases to Air (Point and Fugitive Air Emissions) -- Include all air emissions from industry activity. Point emissions occur through confined air streams as found in stacks, vents, ducts, or pipes. Fugitive emissions include
Sector Notebook Project 56 September 1997

Pharmaceutical Industr y Releases and Transfers Profile
equipment leaks, evaporative losses from surface impoundments and spills, and releases from building ventilation systems.
Releases to Water (Surface Water Discharges) -- encompass any releases going directly to streams, rivers, lakes, oceans, or other bodies of water. Releases due to runoff, including storm water runoff, are also reportable to TRI.
Releases to Land -- occur within the boundaries of the reporting facilit y. Releases to land include disposal of toxic chemicals in landfills, land treatment/application farming,surface impoundments, and other land disposal methods (such as spills, leaks, or waste piles).
Underground Injection -- is a contained release of a fluid into a subsurface well for the purpose of waste disposal. Wastes containing TRI chemicals are injected into either Class I wells or Class V wells. Class I wells are used to inject liquid hazardous wastes or dispose of industrial and municipal wastewaters beneath the lowermost underground source of drinking water. Class V wells are generally used to inject non-hazardous fluid into or above an underground source of drinking water. TRI reporting does not currently distinguish between these two types of wells, although there are important differences in environmental impact between these two methods of injection.
TRANSFERS -- is a transfer of toxic chemicals in wastes to a facilit y that is geographically or physically separate from the facilit y reporting under TRI. Chemicals reported to TRI as transferred are sent to off-site facilit ies for the purpose of recycling, energy recovery, treatment, or disposal. The quantities reported represent a movement of the chemical away from the reporting facilit y. Except for off-site transfers for disposal, the reported quantit ies do not necessarily represent entry of the chemical into the environment.
Tr ansfers to POTWs -- are wastewater transferred through pipes or sewers to a publicly owned treatments works (POTW). Treatment or removal of a chemical from the wastewater depend on the nature of the chemical, as well as the treatment methods present at the POTW. Not all TRI chemicals can be treated or removed by a POTW. Some chemicals, such as metals, may be removed, but are not destroyed and may be disposed of in landfills or discharged to receiving waters.
Tr ansfers to Recycling -- are sent off-site for the purposes of regenerating or recovery by a variety of recycling methods, including solvent recovery, metals recovery, and acid regeneration. Once these chemicals have been recycled, they may be returned to the originating facilit y or sold commercially.
Sector Notebook Project 57 September 1997

--
Pharmaceutical Industr y Releases and Transfers Profile
Transfers to Energy Recovery -- are wastes combusted off-site in industrial furnaces for energy recovery. Treatment of a chemical by incineration is not considered to be energy recovery.
Tr ansfers to Treatment -- are wastes moved off-site to be treated through a variety of methods, including neutralization, incineration, biological destruction, or physical separation. In some cases, the chemicals are not destroyed but prepared for further waste management.
Tr ansfers to Disposal are wastes taken to another facilit y for disposal generally as a release to land or as an injection underground.
Sector Notebook Project 58 September 1997

Pharmaceutical Industr y Releases and Transfers Profile
IV.A. EPA Toxic Release Inventory for the Pharmaceutical Industr y
This section summarizes TRI data of pharmaceutical facilit ies reporting SIC codes 2833 and 2834 as the primary SIC code for the facilit y. Of the 916 pharmaceutical establishments reported by the 1992 Census of Manufacturers, 200 reported to TRI in 1995.
According to 1995 TRI data, the reporting facilit ies released (discharged to the air, water, or land without treatment) and transferred (shipped off-site) a total of 177 million pounds of pollutants, made up of 104 different chemicals. This represents about 3 percent of the 5.7 billio n pounds of TRI chemicals released and transferred by all manufacturers that year. In comparison, the chemical industry (SIC 28) as a whole produced 1.7 billio n pounds that year, accounting for about 30 percent of all releases and transfers.
Of the pharmaceutical industry’s TRI releases, 57 percent go to the air, 25 percent to underground injection, 17 percent to surface waters, and 1 percent to the land. This release profile differs from other TRI industries which average approximately 59 percent to air, 30 percent to water, and 10 percent to land. Table 14 lists the pharmaceutical industry’s TRI reported chemical releases.
Of the pharmaceutical industry’s transfers, about 55 percent are transferred for energy recovery off-site, 19 percent for treatment off-site, 13 percent are transferred to POTWs, 12 percent for recycling off-site, and about 1 percent for disposal off-site. Table 15 liststhe pharmaceuticalindustry's TRI reported toxic chemical transfers.
Of the top ten most frequently reported toxic chemicals on the TRI list, the prevalence of volatile chemicals explains the air intensive toxic chemical loading of the pharmaceutical industry. Seven of the ten most commonly reported toxic chemicals are highly volatile. Six of the ten are volatile organic compounds (methanol, dichloromethane, toluene, ethylene glycol, N,N-Dimethylformamide, and acetonitrile). These are primarily solvents used to extract active ingredients and for cleaning equipment. The primary means of release to the environment are from fugitive air and point air sources. Large quantities of methanol, N,N-Dimethylformamide, and acetonitrile, however, are released via underground injection. Other commonly reported chemicals released and transferred are acids (hydrochloric, sulfuric, and phosphoric) which can be used for pH control or as catalysts.
Sector Notebook Project 59 September 1997

Sector N
otebook Project
60 S
eptember 1997
Pharm
aceutical Industry
Table 14: 1995 Releases for Pharmaceutical Facilities (SIC 2833 & 2834) in TRI, by Number of Facilities Reporting (Releases reported in pounds/year)
�������� ���� � ��������� ��������
�������� ���
����� ���
����� ����������
����������� ���������
���� ��������
����� ��������
���� ��������
��� ��������
�������� ��� ��������� ��������� ������� ��������� ����� ���������� ������ ��������������� �� ��������� ��������� ������ ������ � ��������� ������� ������������ ���� ����� ��� ����� ����� ��������� ����� �� ������ ������� �� � � ������� ����� ������� �� ������� ������� ������ ����� � ��������� ������ ������� �� ������� ������� ��������� � ������� ��������� ������ ���������� ���� �� ����� ����� �� � � ������ ��� �������� ������ �� ������ ����� ������ � ��� ������ ����� ������������ �� ������� ������� ����� ������� � ������� ������ ��������������������� �� ������ ������ ������ ��������� ����� ��������� ������ �������� �� ����� ����� ������ � � ������ ����� �������� �� ������� ������� ����� ����� � ������� ������ ������������� �� ������ ������ ������ ����� � ������ ����� ���� ��������� �� ��� ������ ������ ������� ������� ������� ������ ���������� �� ������ ������ ����� � � ������� ������ ������� ������� �� ������� ������� ��� ����� � ������� ������ ������ �������� ������ �� ������� ������� ������ ����� � ������� ������ ������ ������ �������� �� ������ ������� � � � ������� ����� ������ ���� �� ������ ����� ����� ����� � ������ ����� ������ ���� �� ����� ������ �� � � ������ ����� ������ ���������� ����� �� ����� ������ � ������ � ������ ����� �������� ���� �� ������ ����� � � � ������ ����� ������� ��������� �� � � ��������� � ������ ��������� ������� ������������ � ����� ����� ����� � � ����� ��� ����������� � ������ ������� ��� ������ � ������� ������ ����������������������� � ������ ������� � � � ������� ������ ������� ������ ������ � ����� ������ � � � ������ ����� ���������� ������� � ������ ������ ����� ������ � ������ ������ ������ ����� ������ � ������ ������ �� ������ � ������� ������ ����������� � ��� ����� � � � ����� ��� �������� � ����� ����� � ������ � ������ ����� ������ ��������� � � �� � � � �� ��
Releases and Transfers P
rofile
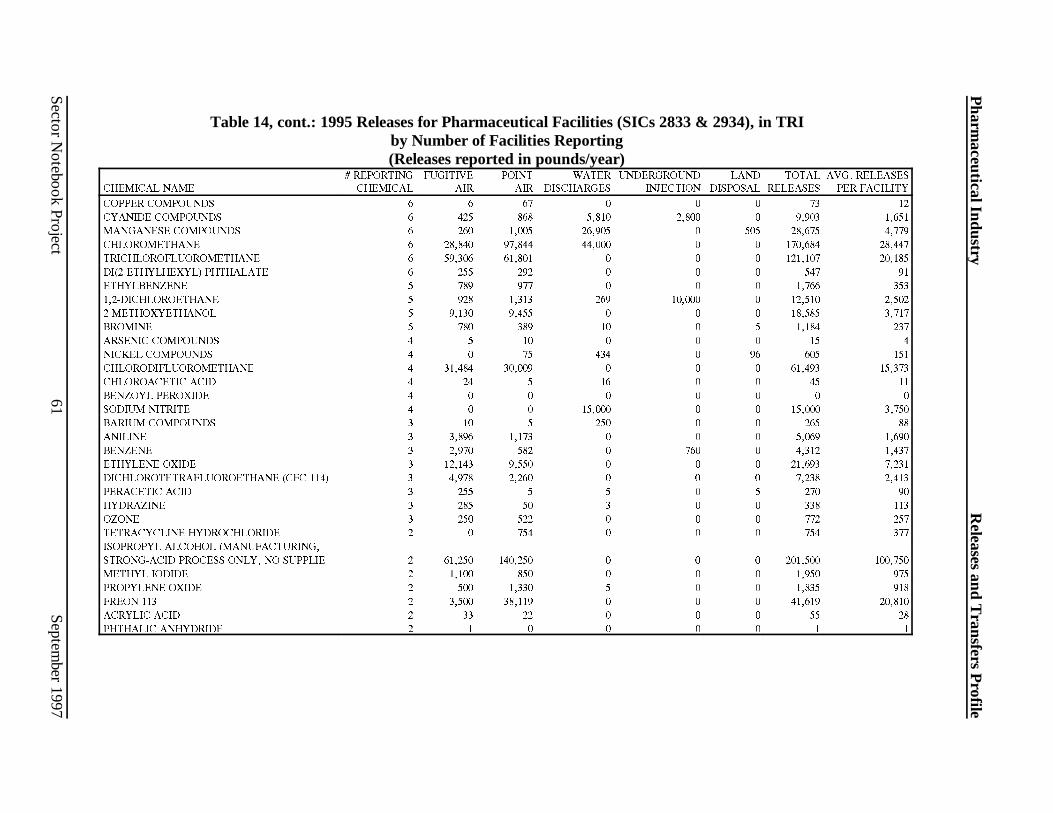
Sector N
otebook Project
61 S
eptember 1997
Pharm
aceutical Industry
Table 14, cont.: 1995 Releases for Pharmaceutical Facilities (SICs 2833 & 2934), in TRI by Number of Facilities Reporting (Releases reported in pounds/year)
�������� ���� � ��������� ��������
�������� ���
����� ���
����� ����������
����������� ���������
���� ��������
����� ��������
���� �������� ��� ��������
������ ��������� � � �� � � � �� �� ������� ��������� � ��� ��� ����� ����� � ����� ����� ��������� ��������� � ��� ����� ������ � ��� ������ ����� ������������� � ������ ������ ������ � � ������� ������ ���������������������� � ������ ������ � � � ������� ������ ���������������� ��������� � ��� ��� � � � ��� �� ������������ � ��� ��� � � � ����� ��� ������������������ � ��� ����� ��� ������ � ������ ����� ���������������� � ����� ����� � � � ������ ����� ������� � ��� ��� �� � � ����� ��� ������� ��������� � � �� � � � �� � ������ ��������� � � �� ��� � �� ��� ��� ��������������������� � ������ ������ � � � ������ ������ ������������ ���� � �� � �� � � �� �� ������� �������� � � � � � � � � ������ ������� � � � ������ � � ������ ����� ������ ��������� � �� � ��� � � ��� �� ������� � ����� ����� � � � ����� ����� ������� � ����� ��� � ��� � ����� ����� �������� ����� � ������ ����� � � � ������ ����� ������������������������� ��������� � ����� ����� � � � ����� ����� ��������� ���� � ��� � � � � ��� �� ��������� � ��� �� � � � ��� ��� ����� � ��� ��� � � � ��� ��� ������������ ������������� � � ��� � � � ��� ��� ��������� ������� ��������������� ����������� ������� ����� �� ������� � ������ ������� � � � ������� ������� ������ ������ � ����� ��� � � � ����� ��� ��������� ����� � ��� ����� � � � ����� ��� ����� ��� � ����� ������ � � � ������ ������ ������� ���� � �� �� � � � �� �� �������� ��������� � � � � � � � �
Releases and Transfers P
rofile

Sector N
otebook Project
62 S
eptember 1997
Pharm
aceutical Industry
Table 14, cont.: 1995 Releases for Pharmaceutical Facilities (SICs 2833 & 2934) in TRI, by Number of Facilities Reporting (Releases reported in pounds/year)
CHEMICAL NAME # REPORTING
CHEMICAL FUGITIVE
AIR POINT
AIR WATER
DISCHARGES UNDERGROUND
INJECTION LAND
DISPOSAL TOTAL
RELEASES AVG. RELEASES
PER FACILITY BENZOYL CHLORIDE 2 0 2 0 0 0 2 1 BENZYL CHLORIDE 2 5 5 0 0 0 10 5 EPICHLOROHYDRIN 2 290 50 0 0 0 340 170 M-XYLENE 2 1,565 571 250 0 0 2,386 1,193 PHENOL 2 255 255 0 0 0 510 255 DIETHANOLAMINE 2 500 1,000 5 0 0 1,505 753 1,4-DIOXANE 2 270 260 0 0 0 530 265 DIMETHYLAMINE 2 23,500 15,250 250 0 250 39,250 19,625 TETRACHLOROETHYLENE 2 2,239 14,000 0 0 0 16,239 8,120 DIAZINON 2 5 278 5 0 0 288 144 ZINC (FUME OR DUST) 2 0 2 0 0 0 2 1 TITANIUM TETRACHLORIDE 2 5 10 0 0 0 15 8 HYDROGEN FLUORIDE 2 250 8,350 0 0 0 8,600 4,300 ABAMECTIN 2 0 0 16 0 0 16 8 ANTIMONY COMPOUNDS 1 5 5 0 0 0 10 10 CHROMIUM COMPOUNDS 1 0 0 0 43,000 0 43,000 43,000 COBALT COMPOUNDS 1 0 0 0 0 0 0 0 SELENIUM COMPOUNDS 1 0 3 0 0 0 3 3 FAMPHUR 1 0 0 0 0 0 0 0 CARBON TETRACHLORIDE 1 60 400 67 0 0 527 527 PHENYTOIN 1 0 0 0 0 0 0 0 DICHLORVOS 1 5 250 5 0 0 260 260 1,1,1-TRICHLOROETHANE 1 76,500 52,500 0 0 0 129,000 129,000 BROMOMETHANE 1 50 21 0 0 0 71 71 CHLOROETHANE 1 163 0 0 0 0 163 163 CARBON DISULFIDE 1 2,450 21,000 0 0 0 23,450 23,450 PHOSGENE 1 240 5 0 5 0 250 250 DIMETHYL SULFATE 1 0 8 0 0 0 8 8 ISOBUTYRALDEHYDE 1 11 25 0 0 0 36 36 SEC-BUTYL ALCOHOL 1 250 71,799 0 0 0 72,049 72,049 METHYL CHLOROCARBONATE 1 250 0 5 0 5 260 260 QUINOLINE 1 5 0 5 0 5 15 15
Releases and Transfers P
rofile

Sector N
otebook Project
63 S
eptember 1997
Pharm
aceutical Industry
Table 14, cont.: 1995 Releases for Pharmaceutical Facilities (SICs 2833 & 2934) in TRI, by Number of Facilities Reporting (Releases reported in pounds/year)
CHEMICAL NAME # REPORTING
CHEMICAL FUGITIVE
AIR POINT
AIR WATER
DISCHARGES UNDERGROUND
INJECTION LAND
DISPOSAL TOTAL
RELEASES AVG. RELEASES
PER FACILITY BIPHENYL 1 5 0 0 0 0 5 5 O-XYLENE 1 2,400 54 0 0 0 2,454 2,454 1,2-DICHLOROBENZENE 1 244 2,490 0 0 0 2,734 2,734 1,2,4-TRIMETHYLBENZENE 1 250 250 5 0 0 505 505 CUMENE 1 250 250 5 0 0 505 505 ACETOPHENONE 1 5 5 0 0 0 10 10 NITROBENZENE 1 3,891 321 0 0 0 4,212 4,212 ALLYL CHLORIDE 1 321 27 0 0 0 348 348 CHLOROMETHYL METHYL ETHER 1 0 0 0 0 0 0 0 MALEIC ANHYDRIDE 1 5 5 0 5 0 15 15 CHLOROBENZENE 1 12 11 0 0 0 23 23 CYCLOHEXANOL 1 93 133 0 0 0 226 226 2-ETHOXYETHANOL 1 29 91 0 0 0 120 120 PROPYLENE 1 5 5 0 0 0 10 10 N,N-DIMETHYLANILINE 1 5 35 0 0 0 40 40 MALATHION 1 0 2 0 0 0 2 2 THIABENDAZOLE 1 175 3,504 0 0 0 3,679 3,679 ETHYL CHLOROFORMATE 1 250 250 5 0 5 510 510 1,3-DICHLOROBENZENE 1 1,200 80 0 0 0 1,280 1,280 LITHIUM CARBONATE 1 0 0 0 0 0 0 0 N-METHYL-2-PYRROLIDONE 1 7 0 0 0 0 7 7 TETRACHLORVINPHOS 1 5 5 5 0 0 15 15 TRIFLURALIN 1 6,900 250 0 0 0 7,150 7,150 BENFLURALIN 1 750 250 0 0 0 1,000 1,000 PROMETRYN 1 0 0 0 0 0 0 0 NICKEL 1 0 0 250 0 0 250 250 THIOPHANATE-METHYL 1 0 187 0 0 0 187 187 SODIUM AZIDE 1 0 0 0 0 0 0 0 VINCLOZOLIN 1 0 0 0 0 0 0 0 PERMETHRIN 1 0 0 0 0 0 0 0 PROPICONAZOLE 1 0 0 0 0 0 0 0
____ _________ _________ ________ ________ _______ ________ _________ 200 6,664,939 10,500,358 4,936,137 7,438,370 375,274 29,915,078 149,575
Releases and Transfers P
rofile

Sector N
otebook Project
64 S
eptember 1997
Pharm
aceutical Industry
Table 15: 1995 Transfers for Pharmaceutical Facilities (SICs 2833 & 2834) in TRI, by Number and Facilities Reporting (Transfers reported in pounds/year)
�������� ����
� ��������� ��������
���� ���������
�������� ���������
��������� ���������
��������� ���������
������ �������� ���������
����� ���������
��� ��������
��� ��������
�������� ��� ���������� ������ ��������� ��������� ���������� ���������� ������� ��������������� �� ������� ������ ��������� ��������� ��������� ���������� ������� ������������ ���� ����� ��� ����� ����� ��������� ����� �� ����� � �� ������ �� ������ ��� ������� �� ������� ����� ��������� ��������� ���������� ���������� ������� ������� �� ��������� ����� � ������� ����� ��������� ������ ���������� ���� �� ����� � � �� � ����� ��� �������� ������ �� ������� ����� ������� ������ ������ ��������� ������ ������������ �� ������ � ��������� ��������� ��������� ��������� ������� ��������������������� �� ������� ������� ������� ������� ��������� ��������� ������� �������� �� � � � � � � � �������� �� ������ ����� ������� ��������� ��������� ��������� ������� ������������� �� ������� �� ����� ������� ������� ������� ������ ���� ��������� �� ����� ������� � ������ ����� ������� ������ ���������� �� ������� ��� ������ ������� ������ ������� ������ ������� ������� �� ������� � � ������� ������� ��������� ������� ������ �������� ������ �� ������� � ����� ������� ��������� ��������� ������� ������ ������ �������� �� ����� � ��� ����� ��������� ��������� ������� ������ ���� �� ������ � � ������ �� ������� ����� ������ ���� �� � � ������� ��� � ������� ������ ������ ���������� ����� �� ������ � � ������� ��������� ��������� ������� �������� ���� �� � � � � � � � ������� ��������� �� ������� � � ��� � ������� ������ ������������ � ������� ����� � ��� � ������� ������ ����������� � ��� ��� ��� ������ ������� ������� ������ ����������������������� � � � ������ ������� � ������� ������ ������� ������ ������ � ������� � � �� ������� ������� ������ ���������� ������� � ����� ����� � ��� ������� ������� ������ ������ ����� ������ � ����� � ��� ����� ������� ������� ������ ����������� � � � � �� ��� ��� �� �������� � ������� � ������ ����� ������ ������� ������ ������ ��������� � ��� ����� � ����� � ������ �����
Releases and Transfers P
rofile

Sector N
otebook Project
65 S
eptember 1997
Pharm
aceutical Industry
Table 15, cont.: 1995 Transfers for Pharmaceutical Facilities (SICs 2833 & 2834) in TRI, by Number and Facilities Reporting (Transfers reported in pounds/year)
�������� ����
� ��������� ��������
���� ���������
�������� ���������
��������� ���������
��������� ���������
������ �������� ���������
����� ���������
��� ��������
��� ��������
������� ��������� � ��� � � ��� � ��� �� ��������� ��������� � ����� ����� � ��� � ������ ����� ������������� � �� � � �� � �� �� ���������������������� � � � ������� ������� ������� ������� ������ ���������������� ��������� � ��� ������ ��������� � ��� ��������� ������� ������������ � ��� � � ����� ������ ������ ������ ������������������ � ����� ��� ������� ����� ������ ������� ������ ���������������� � ������� � � � ��������� ��������� ������� ������� � ��������� ������� � � � ��������� ������� ������� ��������� � �� ����� � ����� � ������ ����� ������ ��������� � � ��� ������ �� � ������ ������ ��������������������� � � � � � � � � ������������ ���� � � � � ����� � ����� ��� ������� �������� � ����� ��� � ����� ����� ����� ����� ������ ������� � ������� � � ������ � ������� ������ ������ ��������� � ��� �� � �� � ��� �� ������� � ����� ������ � ������ ��� ������ ������ ������� � ��� �� � ������ ������� ������� ������� �������� ����� � � � � ��� � ��� ��� ������������������������� ��������� � � � ����� ������ � ������ ����� ��������� ���� � � � � � � � � ��������� � � � � � � � � ����� � � � � � � � � ������������ ������������� � ����� ��� � ��� � ����� ��� ��������� ������� ��������������� ����������� ������� ����� �� ������� � ����� � � � � ����� ��� ������ ������ � � � � � � � � ��������� ����� � ������ � � � ��� ������ ������ ����� ��� � � � � ������ �� ������ ����� ������� ���� � � � � ����� � ����� ����� �������� ��������� � � � � � � � � ������� �������� � � � � � � � �
Releases and Transfers P
rofile

Sector N
otebook Project
66 S
eptember 1997
Pharm
aceutical Industry
Table 15, cont.: 1995 Transfers for Pharmaceutical Facilities (SICs 2833 & 2834) in TRI, by Number and Facilities Reporting (Transfers reported in pounds/year)
CHEMICAL NAME
# REPORTING CHEMICAL
POTW TRANSFERS
DISPOSAL TRANSFERS
RECYCLING TRANSFERS
TREATMENT TRANSFERS
ENERGY RECOVERY TRANSFERS
TOTAL TRANSFERS
AVG TRANSFER
PER FACILITY
BENZYL CHLORIDE 2 5 . . 10 . 15 8 EPICHLOROHYDRIN 2 0 0 . . . 0 0 M-XYLENE 2 20 . . 87,148 78,059 165,227 82,614 PHENOL 2 250 . . 548 . 798 399 DIETHANOLAMINE 2 1,500 . . . 47,916 49,416 24,708 1,4-DIOXANE 2 4,170 2 . 300 8,960 13,432 6,716 DIMETHYLAMINE 2 0 38,000 . 2,100 . 40,100 20,050 TETRACHLOROETHYLENE 2 0 . 510 . 49,005 49,515 24,758 DIAZINON 2 0 1,060 . 1,609 . 2,669 1,335 ZINC (FUME OR DUST) 2 0 1,223 . . . 1,223 612 TITANIUM TETRACHLORIDE 2 0 . . . . 0 0 HYDROGEN FLUORIDE 2 0 . . . . 0 0 ABAMECTIN 2 0 . . 5,582 . 5,582 2,791 ANTIMONY COMPOUNDS 1 0 53,200 . . . 53,200 53,200 CHROMIUM COMPOUNDS 1 250 260 . 5 . 515 515 COBALT COMPOUNDS 1 2,920 . . . . 2,920 2,920 SELENIUM COMPOUNDS 1 260 . . 13,641 . 13,901 13,901 FAMPHUR 1 0 . . 1,540 . 1,540 1,540 CARBON TETRACHLORIDE 1 40 . . 45,782 . 45,822 45,822 PHENYTOIN 1 0 19,300 . . . 19,300 19,300 DICHLORVOS 1 0 250 . 250 . 500 500 1,1,1-TRICHLOROETHANE 1 0 . 106,250 . . 106,250 106,250 BROMOMETHANE 1 0 . . . . 0 0 CHLOROETHANE 1 0 . . 2,489 . 2,489 2,489 CARBON DISULFIDE 1 1,120 . . 18 11,390 12,528 12,528 PHOSGENE 1 0 . . . . 0 0 DIMETHYL SULFATE 1 0 . . . . 0 0 ISOBUTYRALDEHYDE 1 0 . 8,647 640 . 9,287 9,287 SEC-BUTYL ALCOHOL 1 0 . . . . 0 0 METHYL CHLOROCARBONATE 1 0 . . . . 0 0 QUINOLINE 1 0 . . 250 . 250 250
Releases and Transfers P
rofile

Sector N
otebook Project
67 S
eptember 1997
Pharm
aceutical Industry
Table 15, cont.: 1995 Transfers for Pharmaceutical Facilities (SICs 2833 & 2834) in TRI, by Number and Facilities Reporting (Transfers reported in pounds/year)
CHEMICAL NAME
# REPORTING CHEMICAL
POTW TRANSFERS
DISPOSAL TRANSFERS
RECYCLING TRANSFERS
TREATMENT TRANSFERS
ENERGY RECOVERY TRANSFERS
TOTAL TRANSFERS
AVG TRANSFER
PER FACILITY
BIPHENYL 1 0 . . . . 0 0 O-XYLENE 1 0 . . 100,000 61,800 161,800 161,800 1,2-DICHLOROBENZENE 1 6,480 . . 14,000 91,891 112,371 112,371 1,2,4-TRIMETHYLBENZENE 1 4,800 . . . . 4,800 4,800 CUMENE 1 1,167 . . . . 1,167 1,167 ACETOPHENONE 1 0 . . . . 0 0 NITROBENZENE 1 5 . . 5,914 . 5,919 5,919 ALLY L CHLORIDE 1 0 . . . . 0 0 CHLOROMETHYL METHYL ETHER 1 0 . . . . 0 0 MALEIC ANHYDRIDE 1 0 . . . . 0 0 CHLOROBENZENE 1 0 . . . 179,228 179,228 179,228 CYCLOHEXANOL 1 0 . . . . 0 0 2-ETHOXYETHANOL 1 4 . . 25,004 . 25,008 25,008 PROPYLENE 1 0 . . . . 0 0 N,N-DIMETHYLANILINE 1 10,000 . . . 328,000 338,000 338,000 MALATHION 1 0 26 . 273 . 299 299 THIABENDAZOLE 1 271 . . . 2,160 2,431 2,431 ETHYL CHLOROFORMATE 1 0 . . . . 0 0 1,3-DICHLOROBENZENE 1 1,400 . . . . 1,400 1,400 LITHIUM CARBONATE 1 0 . . 750 . 750 750 N-METHYL-2-PYRROLIDONE 1 249,000 . . . . 249,000 249,000 TETRACHLORVINPHOS 1 0 4,200 . . . 4,200 4,200 TRIFLURALIN 1 0 18,000 . . . 18,000 18,000 BENFLURALIN 1 0 14,000 . . . 14,000 14,000 PROMETRYN 1 0 . . 203 . 203 203 NICKEL 1 0 18 400,000 . . 400,018 400,018 THIOPHANATE-METHYL 1 0 . . 2,677 . 2,677 2,677 SODIUM AZIDE 1 0 . . . . 0 0 VINCLOZOLIN 1 0 . . 1,030 . 1,030 1,030 PERMETHRIN 1 0 . . . . 0 0 PROPICONAZOLE 1 0 . . 1,025 . 1,025 1,025
____ _________ _________ _________ _________ _________ __________ ����������
200 19,119,179 1,394,801 18,168,783 27,330,633 81,213,752 147,239,047 736,195
Releases and Transfers P
rofile

1
2
3
4
5
6
7
8
9
10
Pharmaceutical Industr y Releases and Transfers Profile
The TRI database contains a detailed compilation of self- reported, facilit y-specific chemical releases. The top reporting facilit ies for the pharmaceutical industry are listed below in Tables 16. Facilit ies that have reported only the SIC codes covered under this notebook as a primary SIC code appear on the first list. Table 17 contains additional facilit ies that have reported the SIC code covered within this report, and one or more SIC codes that are not within the scope of this notebook. Therefore, the second list includes facilit ies that conduct multiple operations -- some that are under the scope of this notebook, and some that are not. Currently, the facilit y-level data do not allow pollutant releases to be broken apart by industrial process.
Table 16: Top 10 TRI Releasing Pharmaceutical Manufacturing Facilitiesa
Rank Facility Total TRI Releases in
Pounds
Pharmacia & Upjohn Co., Portage, Michigan 8,307,190
Warner-Lambert Co., Holland, Michigan 2,594,111
Eli Lilly & Co. - Tippecanoe Labs, Shadeland, Indiana 2,504,810
Upjohn Mfg., Co., Barceloneta, Puerto Rico 2,001,450
Pfizer Inc., Groton, Connecticut. 1,761,385
Eli Lilly & Co - Clinton Laboratories, Clinton, Indiana 1,282,605
Abbott Chemicals, Inc., Barceloneta, Puerto Rico 1,193,707
Pfizer Inc., Southport, North Carolina 1,164,350
Schering-Plough Products, Inc., Las Piedras, Puerto Rico 756,089
Biokyowa Inc., Cape Girardeau, Missouri 669,869
Source: US EPA 1995 Toxics Release Inventory Database.
a Being included on this list does not mean that the release is associated with non-compliance with environmental laws.
Sector Notebook Project 68 September 1997

Pharmaceutical Industr y Releases and Transfers Profile
Table 17: Top 10 TRI Releasing Facilities Reporting Pharmaceutical Manufacturing SIC Codes to TRIa
Rank SIC Codes
Report ed in TRI Facility Total TRI Releases in
Pounds
1 2834 Pharmacia & Upjohn Co., Portage, Michigan 8,307,190
2 2819, 2834, 2842, 2865, 2869, 2873, 2879
Monsanto Co., Luling, Louisiana 5,698,031
3 2834 Warner-Lambert Co., Holland, Michigan 2,594,111
4 2834 Eli Lilly & Co. - Tippecanoe Labs, Shadeland, Indiana
2,504,810
5 2834 Upjohn Mfg., Co., Barceloneta, Puerto Rico 2,001,450
6 2833 Pfizer Inc., Groton, Connecticut. 1,761,385
7 2834, 2869, 2969 Ethyl Corp., Orangeburg, South Carolina 1,284,456
8 2833, 2834 Eli Lilly & Co - Clinton Laboratories, Clinton, Indiana
1,282,605
9 2819, 2821, 2824, 2834, 2865, 2869, 2879, 2979
Dow Chemical Co., Midland, Michigan 1,228,629
10 2833, 2834 Abbott Chemicals, Inc., Barceloneta, Puerto Rico 1,193,707
Source: US EPA Toxics Release Inventory Database, 1995.
a Being included on this list does not mean that the release is associated with non-compliance with environmental laws.
Sector Notebook Project 69 September 1997

Pharmaceutical Industr y Releases and Transfers Profile
IV. B. Summary of Selected Chemicals Released
The following is a synopsis of current scientific toxicity and fate information for the top chemicals (by weight) that facilit ies within both SIC 2833 and 2834 self-reported as released to the environment based upon 1994 TRI data. Because this section is based upon self-reported release data, it does not attempt to provide information on management practices employed by the sector to reduce the release of these chemicals. Information regarding pollutant release reductions over time may be available from EPA’s TRI and 33/50 programs, or directly from the industrial trade associations that are listed in Section VIII of this document. Since these descriptions are cursory, please consult the sources referenced below for a more detailed description of both the chemicals described in this section, and the chemicals that appear on the full list of TRI chemicals appearing in Section IV.A.
The brief descriptions provided below were taken from the Hazardous Substances Data Bank (HSDB) and the Integrated Risk Information System (IRIS). The discussions of toxicity describe the range of possible adverse health effects that have been found to be associated with exposure to these chemicals. These adverse effects may or may not occur at the levels released to the environment. Individuals interested in a more detailed picture of the chemical concentrations associated with these adverse effects should consult a toxicologist or the toxicity literature for the chemical to obtain more information. The effects listed below must be taken in context of these exposure assumptions that are more fully explained within the full chemical profiles in HSDB. For more information on TOXNETa , contact the TOXNET help line at 1-800-231-3766.
Methanol (CAS: 67-56-1)
Toxicity. Methanol is readily absorbed by the gastrointestinal tract and the respiratory tract, and is toxic to humans in moderate to high doses. In the body, methanol is converted into formaldehyde and formic acid. Methanol is excreted as formic acid. Observed toxic effects at high dose levels generally
a TOXNET is a computer system run by the National Library of Medicine that includes a number of toxicological databases managed by EPA, National Cancer Institute, and the National Institute for Occupational Safety and Health. For more information on TOXNET, contact the TOXNET help line at 800-231-3766. Databases included in TOXNET are: CCRIS (Chemical Carcinogenesis Research Information System), DART (Developmental and Reproductive Toxicity Database), DBIR (Directory of Biotechnology Information Resources), EMICBACK (Environmental Mutagen Information Center Backfile), GENE-TOX (Genetic Toxicology), HSDB (Hazardous Substances Data Bank), IRIS (Integrated Risk Information System), RTECS (Registry of Toxic Effects of Chemical Substances), and TRI (Toxic Chemical Release Inventory). HSDB contains chemical-specific information on manufacturing and use, chemical and physical properties, safety and handling, toxicity and biomedical effects, pharmacology, environmental fate and exposure potential, exposure standards and regulations, monitoring and analysis methods, and additional references.
Sector Notebook Project 70 September 1997

Pharmaceutical Industr y Releases and Transfers Profile
include central nervous system damage and blindness. Long-term exposure to high levels of methanol via inhalation cause liver and blood damage in animals.
Ecologically, methanol is expected to have low toxicity to aquatic organisms. Concentrations lethal to half the organisms of a test population are expected to exceed one mg methanol per liter water. Methanol is not likely to persist in water or to bioaccumulate in aquatic organisms.
Carcinogenicity. There is currently no evidence to suggest that methanol is carcinogenic.
Environmental Fate. Liquid methanol is likely to evaporate when left exposed. Methanol reacts in air to produce formaldehyde which contributes to the formation of air pollutants. In the atmosphere it can react with other atmospheric chemicals or be washed out by rain. Methanol is readily degraded by microorganisms in soils and surface waters.
Physical Properties. Methanol is a colorless, highly flammable liquid. Methanol is miscible in water and has a boiling point of 147 degrees F.
Methylene Chloride (Dichloromethane) (CAS: 75-09-2)
Toxicity. Short-term exposure to methylene chloride (MC) is associated with central nervous system effects, including headaches, giddiness, stupor, irritabilit y, and numbness, and tingling in the limbs. More severe neurological effects are reported from longer-term exposure, apparently due to increased carbon monoxide in the blood from the break down of MC. Contact with MC causes irritation of the eyes, skin, and respiratory tract.
Occupational exposure to MC has also been linked to increased incidence of spontaneous abortions in women. Acute damages to the eyes and upper respiratory tract, unconsciousness, and death were reported in workers exposed to high concentrations of MC. Phosgene (a degradation product of MC) poisoning has been reported to occur in several cases where MC was used in the presence of an open fire.
Populations at special risk from exposure to MC include obese people (due to accumulation of MC in fat), and people with impaired cardiovascular systems.
Carcinogenity. MC is a probable human carcinogen via both inhalation and oral exposure, based on limited evidence in humans, and sufficient evidence in animals.
Sector Notebook Project 71 September 1997

Pharmaceutical Industr y Releases and Transfers Profile
Environmental Fate. When spilled on land, MC is rapidly lost from the soil surface through volatilization. The remainder leaches through the subsoil into the groundwater.
Biodegradation is possible in natural waters but will probably be very slow compared withevaporation. Little is known about bioconcentration in aquatic organisms or adsorption to sediments but these are not likely to be significant processes. Hydrolysis is not an important process under normal environmental conditions.
MC released into the atmosphere degrades via contact with other gases with a half- life of several months. A small fraction of the chemical diffuses to the stratosphere where it rapidly degrades through exposure to ultraviolet radiation and contact with chlorine ions. Being a moderately soluble chemical, MC is expected to partially return to earth in rain.
Physical Properties. Methylene chloride is a colorless liquid. It is soluble to 2 percent in water and has a boiling point of 104 degrees F.
Ammoniaa (CAS: 7664-41-7)
Toxicity. Anhydrous ammonia is irritating to the skin, eyes, nose, throat, and upper respiratory system.
Ecologically, ammonia is a source of nitrogen(an essential element for aquatic plant growth), and may therefore contribute to eutrophication of standing or slow-moving surface water, particularly in nitrogen-limit ed waters such asthe Chesapeake Bay. In addition,aqueous ammonia is moderately toxic to aquatic organisms.
Carcinogenicity. There is currently no evidence to suggest that ammonia is carcinogenic.
Environmental Fate. Ammonia combines with sulfate ions in the atmosphere and is washed out by rainfall, resulting in rapid return of ammonia to the soil and surface waters.
Ammonia is a central compound in the environmental cycling of nitrogen. Ammonia in lakes, rivers, and streams is converted to nitrate.
a The reporting standards for ammonia were changed in 1995. Ammonium sulfate is deleted from the list and threshold and release determinations for aqueous ammonia are limited to 10 percent of the total ammonia present in solution. This change will r educe the amount of ammonia reported to TRI. Complete details of the revisions can be found in 40 CFR Part 372.
Sector Notebook Project 72 September 1997

Pharmaceutical Industr y Releases and Transfers Profile
Physical Properties. Ammonia is a colorless gas at atmospheric pressure, but is shipped as a liquefied compressed gas. It is soluble to about 34 percent in water and has a boiling point of -28 degrees F. Ammonia It is corrosive and has a pungent odor.
Toluene (CAS: 108-88-3)
Toxicity. Inhalation or ingestion of toluene can cause headaches, confusion, weakness, and memory loss. Toluene may also affect the way the kidneys and liver function.
Reactions of toluene (see environmental fate) in the atmosphere contribute to the formation of ozone in the lower atmosphere. Ozone can affect the respiratory system, especially in sensitive individuals such as asthma or allergy sufferers.
Some studies have shown that unborn animals were harmed when high levels of toluene were inhaled by their mothers, although the same effects were not seen when the mothers were fed large quantities of toluene. Note that these results may reflect similar difficulties in humans.
Carcinogenicity. There is currently no evidence to suggest that toluene is carcinogenic.
Environmental Fate. A portion of releases of toluene to land and water will evaporate. Toluene may also be degraded by microorganisms. Once volatilized, toluene in the lower atmosphere will react with other atmospheric components contributing to the formation of ground-level ozone and other air pollutants.
Physical Properties. Toluene liquid with a sweet, pungent odor. It is soluble to 0.07 percent in water and has a boiling point of 232 degrees F.
Sector Notebook Project 73 September 1997

Pharmaceutical Industr y Releases and Transfers Profile
IV.C. Other Data Sources
The toxic chemical release data obtained from TRI captures many of the facilit ies in the pharmaceutical industry. It also allows for a comparison across years and industry sectors. Reported chemicals are limited however to the approximately 600 reported chemicals. Most of the hydrocarbon emissions from pharmaceutical facilit ies are not captured by TRI. The EPA Office of Air Quality Planning and Standards has compiled air pollutant emission factors for determining the total air emissions of priority pollutants (e.g., total hydrocarbons, SO2, NO2, CO, particulates, etc.) from many chemical manufacturing sources.
The EPA Office of Air’s Aerometric Information Retrieval System (AIRS) contains a wide range of information related to stationary sources of air pollution, including the emissions of a number of air pollutants which may be of concern within a particular industry. With the exception of volatile organic compounds (VOCs), there is little overlap with the TRI chemicals reported above. Table 18 summarizes annual releases of carbon monoxide (CO), nitrogen dioxide (NO2), particulate matter of 10 microns or less (PM10), total particulate (PT), sulfur dioxide (SO2), and volatile organic compounds (VOCs).
Sector Notebook Project 74 September 1997

Pharmaceutical Industr y Releases and Transfers Profile
Table 18: Air Pollutant Releases by Industr y Sector (tons/year)
Industr y Sector CO NO2 PM10 PT SO2 VOC
Metal Mining 4,670 39,849 63,541 173,566 17,690 915
Nonmetal Mining 25,922 22,881 40,199 128,661 18,000 4,002
Lumber and Wood Production
122,061 38,042 20,456 64,650 9,401 55,983
Furniture and Fixtures 2,754 1,872 2,502 4,827 1,538 67,604
Pulp and Paper 566,883 358,675 35,030 111,210 493,313 127,809
Printing 8,755 3,542 405 1,198 1,684 103,018
Inorganic Chemicals 153,294 106,522 6,703 34,664 194,153 65,427
Organic Chemicals 112,410 187,400 14,596 16,053 176,115 180,350
Petroleum Refining 734,630 355,852 27,497 36,141 619,775 313,982
Rubber and Misc. Plastics 2,200 9,955 2,618 5,182 21,720 132,945
Stone, Clay and Concrete 105,059 340,639 192,962 662,233 308,534 34,337
Iron and Steel 1,386,461 153,607 83,938 87,939 232,347 83,882
Nonferrous Metals 214,243 31,136 10,403 24,654 253,538 11,058
Fabricated Metals 4,925 11,104 1,019 2,790 3,169 86,472
Electronics and Computers 356 1,501 224 385 741 4,866
Motor Vehicles, Bodies, Parts and Accessories
15,109 27,355 1,048 3,699 20,378 96,338
Dry Cleaning 102 184 3 27 155 7,441
Ground Transportation 128,625 550,551 2,569 5,489 8,417 104,824
Metal Casting 116,538 11,911 10,995 20,973 6,513 19,031
Pharmaceuticals 6,586 19,088 1,576 4,425 21,311 37,214
Plastic Resins and Manmade Fibers
16,388 41,771 2,218 7,546 67,546 74,138
Textiles 8,177 34,523 2,028 9,479 43,050 27,768
Power Generation 366,208 5,986,757 140,760 464,542 13,827,511 57,384
Shipbuilding and Repair 105 862 638 943 3,051 3,967
Source: U.S. EPA Office of Air and Radiation, AIRS Database, 1997.
Sector Notebook Project 75 September 1997

Pharmaceutical Industr y Releases and Transfers Profile
IV.D. Comparison of Toxic Release Inventory Among Selected Industr ies
The following information is presented as a comparison of pollutant release and transfer data across industrial categories. It is provided to give a general sense as to the relative scale of releases and transfers within each sector profiled under this project. Please note that the following figure and table do not contain releases and transfers for industrial categories that are not included in this project, and thus cannot be used to draw conclusions regarding the total release and transfer amounts that are reported to TRI. Similar information is available within the annual TRI Public Data Release Book.
Figure 12 is a graphical representation of a summary of the 1995 TRI data for the pharmaceutical industry and the other sectors profiled in separate notebooks. The bar graph presents the total TRI releases and total transfers on the vertical axis. The graph is based on the data in Table 19 and is meant to facilit ate comparisons among the relative amounts of releases, transfers, and releases per facilit y both within and among these sectors. The reader should note, however, that differences in the proportion of facilit ies captured by TRI exist among industry sectors. This can be a factor of poor SIC matching and relative differences in the number of facilit ies reporting to TRI from the various sectors. In the case of the pharmaceutical industry, the 1995 TRI data presented here covers 200 facilit ies. Only those facilit ies listing primary SIC codes falling within SIC 2833 and 2834 were used.
Comparisons of the reported pounds released or transferred per facilit y in Table 19 demonstrate that the pharmaceutical industry is above average in its pollutant releases and transfers per facilit y when compared to other TRI industries. Of the twenty manufacturing SIC codes listed in the TRI database, the mean amount of pollutant release per facilit y (including pharmaceutical facilit ies) was approximately 101,000 pounds. The TRI releases of the average pharmaceutical facilit y (SIC 2833 and 2834) were 150,000 pounds, making the industry 1.5 times higher in per facilit y releases than for other industries. For transfers, the mean of pharmaceutical facilit ies was about 4.6 times as much as that of all TRI manufacturing facilit ies (161,000 pounds transferred off-site per facilit y compared to 736,000 pounds per pharmaceutical facilit y). This comparison is difficult to interpret due to the divergent nature of the industries listed in Table 19 and the differences in the raw materials and processes used to manufacture the specific industry’s products. The batch nature and large volumes of raw materials used to produce the relatively small amounts of high purity pharmaceutical products may account for the higher rate released and transferred by the pharmaceutical industry.
Sector Notebook Project 76 September 1997

Pharmaceutical Industr y Releases and Transfers Profile
Figure 12: Summary of TRI Releases and Transfers by Industry
0
100
200
300
400
500
600
22
24
25
2611
-263
1
2711
-278
9
2812
-281
9
2821
, 282
3, 2
824
2833
, 283
4
2861
-286
9
2911
30
32
331
332,
336
333,
334
34
36
371
3731
SIC Range
Tot
al P
ound
s (m
illio
ns)
Total Releases Total Transfers
Source: US EPA 1995 Toxics Release Inventory Database.
SIC Range
Industry Sector SIC Range
Industry Sector SIC Range
Industry Sector
22 Textiles 2833, 2834
Pharmaceuticals 333, 334 Nonferrous Metals
24 Lumber and Wood Products
2861-2869
Organic Chem. Mfg. 34 Fabricated Metals
25 Furniture and Fixtures 2911 Petroleum Refining 36 Electronic Equip. and Comp.
2611-2631 Pulp and Paper 30 Rubber and Misc. Plastics
371 Motor Vehicles, Bodies, Parts, and Accessories
2711-2789 Printing 32 Stone, Clay, and Concrete
3731 Shipbuilding
2812-2819 Inorganic Chemical Manufacturing
331 Iron and Steel
Sector Notebook Project 77 September 1997

Pharmaceutical Industr y Releases and Transfers Profile
2821, 2823, 2824
Plastic Resins and Manmade Fibers
332, 336 Metal Casting
Sector Notebook Project 78 September 1997

Sector N
otebook Project
79 S
eptember 1997
Pharm
aceutical Industry
Industry Sector
Table 19: Toxics Release Inventory Data for Selected Industr ies
SIC Range
# TRI Facilities
TRI Releases TRI Transfers
Total Releases +Transfers (million lbs.)
Average Releases + Transfers per Facilit y
(pounds)
Total Releases
(million lbs.)
Ave. Releases per
Facility (pounds)
Total Transfers
(million lbs.)
Ave. Trans. per Facility (pounds)
Textiles 22 339 17.8 53,000 7.0 21,000 24.8 74,000
Lumber and Wood Products 24 397 30.0 76,000 4.1 10,000 34.1 86,000
Furniture and Fixtures 25 336 37.6 112,000 9.9 29,000 47.5 141,000
Pulp and Paper 2611-2631 305 232.6 763,000 56.5 185,000 289.1 948,000
Printing 2711-2789 262 33.9 129,000 10.4 40,000 44.3 169,000
Inorganic Chem. Mfg. 2812-2819 413 60.7 468,000 21.7 191,000 438.5 659,000
Plastic Resins and Manmade Fibers
2821,2823, 2824
410 64.1 156,000 192.4 469,000 256.5 625,000
Pharmaceuticals 2833, 2834 200 29.9 150,000 147.2 736,000 177.1 886,000
Organic Chemical Mfg. 2861-2869 402 148.3 598,000 208.6 631,000 946.8 1,229,000
Petroleum Refining 2911 180 73.8 410,000 29.2 162,000 103.0 572,000
Rubber and Misc. Plastics 30 1,947 143.1 73,000 102.6 53,000 245.7 126,000
Stone, Clay, and Concrete 32 623 43.9 70,000 31.8 51,000 75.7 121,000
Iron and Steel 331 423 90.7 214,000 513.9 1,215,000 604.6 1,429,000
Metal Casting 332, 336 654 36.0 55,000 73.9 113,000 109.9 168,000
Nonferrous Metals 333, 334 282 201.7 715,000 164 582,000 365.7 1,297,000
Fabricated Metals 34 2,676 83.5 31,000 350.5 131,000 434.0 162,000
Electronic Equip. and Comp.
36 407 4.3 11,000 68.8 169,000 73.1 180,000
Motor Vehicles, Bodies, Parts, and Accessories
371 754 79.3 105,000 194 257,000 273.3 362,000
Shipbuilding 3731 43 2.4 56,000 4.1 95,000 6.5 151,000
Releases and Transfers P
rofile
Source: US EPA Toxics Release Inventory Database, 1995.

Pharmaceutical Industr y Releases and Transfers Profile
Sector Notebook Project 80 September 1997
Pharmaceutical Industr y Pollution Prevention Opportunities
V. POLLUTIO N PREVENTIO N OPPORTUNITIES
The best way to reduce pollution is to prevent it in the first place. Some companies have creatively implemented pollution prevention techniques that improve effic iency and increase profits while at the same time minimizing environmental impacts. This can be done in many ways, such as reducing material inputs, re-engineering processes to reuse by-products, improving management practices, and employing substitution of toxic chemicals. Some smaller facilit ies are able to actually get below regulatory thresholds just by reducing pollutant releases through aggressive pollution prevention policies.
The Pollution Prevention Act of 1990 established a national policy of managing waste through source reduction, which means preventing the generation of waste. The Pollution Prevention Act also established as national policy a hierarchy of waste management options for situationsin which source reduction cannot be implemented feasibly. In the waste management hierarchy, if source reduction is not feasible the next alternative is recycling of wastes, followed by energy recovery, and waste treatment as a last alternative.
In order to encourage these approaches, this section provides both general and company-specific descriptions of pollution prevention activities that have been implemented within the pharmaceutical industry. While the list is not exhaustive, it does provide core information that can be used as the starting point for facilit ies interested in beginning their own pollution prevention projects. When possible, this section provides information from real activities that can be, or are being, implemented by this sector -- including a discussion of associated costs, time frames, and expected rates of return. This section provides summary information from activit ies that may be, or are being implemented by this sector. Please note that the activit ies described in this section do not necessarily apply to all facilit ies that fall within this sector. Facilit y-specific conditions must be carefully considered when pollution prevention options are evaluated, and the full impacts of the change must be examined to determine how each option affects air, land and water pollutant releases.
The bulk manufacturing processes of the pharmaceutical industry are characterized by a low ratio of finished product to raw material. Therefore, large quantities of residual waste are generated, especially in fermentation and natural product extraction. Chemical synthesis processes generate wastes containing hazardous spent solvents and reactants, combined with residual wastes such as reaction residues. Equipment cleaning water and residue, often containing hazardous chemicals, also are a major waste stream (U.S. EPA, 1991).
Sector Notebook Project 81 September 1997
Pharmaceutical Industr y Pollution Prevention Opportunities
Source reduction is one method by which the industry aims to reduce these wastes. However, source reduction methods such as process modifications and material substitutions may not be as easily implemented in the pharmaceutical industry as in other manufacturing sectors. This is because any significant change to the production process of an existing product, may need approval from the Food and Drug Administration (FDA). If a company wishes to change the method of making a drug or active ingredient that goes into it, the FDA requires the company to prove that the ‘new’ drug is of the same or better qualit y as the old drug and that any reformulation will not adversely affect the identity, strength, qualit y, purity, or bioavailabilit y of the drug. The process of gathering information to support the change and awaiting FDA review and approval can be lengthy, time-consuming and expensive.
As a result, many pharmaceutical companies are looking at ways to minimize waste in future production processes at the research and development stage. Incorporating pollution prevention at the start of a new drug development process is much more economical, efficient, and environmentally sound (see Section VI. D. for further details). The factors affecting the pharmaceutical industry’s pollution prevention efforts were documentedbyPhRMA members in a 1997 document entitled Pharmaceutical Industry Waste Minimization Initiatives.
Many pharmaceutical companies have already implemented pollution prevention programs in their manufacturing facilit ies. Although pollution prevention may not always be a substitute for control technologies, it is often viable and is an increasingly popular method for meeting environmental compliance requirements. Some examples of innovative waste reduction programs that incorporate source reduction as well as recycling and reuse are presented in the case studies that appear in this section.
Sector Notebook Project 82 September 1997

Pharmaceutical Industr y Pollution Prevention Opportunities
V.A. Material Substitutions
Substituting raw materials to lessen the volume and/or toxicity of waste generated is a type of source reduction (U.S. EPA, 1991). One of the most common opportunities for material substitutions in the pharmaceuticals industry is found in the tablet coating process. Until recently, many tablet coating operations involved the use of methylene chloride and other chlorinated solvents. By switching to aqueous-based coating films, many firms have reduced the hazardous waste content in their air and effluent waste streams, as well as the cost of purchasing chemicals. Aqueous-based cleaning solutions are also being used more frequently for equipment cleaning instead of solvent-based solutions (U.S. EPA, 1991).
Sector Notebook Project 83 September 1997

Sc er n o et w n o t mawh s ro C- a o
armaceut Cs ar a r n e s Ich o y ugus a b re
dr u e C s 134a do deplo ma n he b a ve l A
g. o er an o n acl e an m s Th o rd n h ch ne b
ated wi ay i g. sh wat ana i ed. In alon t m o sa
yea a sa e $ ogra d o o h
At s P int A e k e ved e ne (ductio o ati TC r f d o h n
o er s, prin in an ur n b t u or n en o i g equi t a pet
s te m wh ergy eco n an of te
�At e c erc u d p eno h osa me c r s d oua een e t v eri h ni ia
fe at n on ne t g en a less- doov oc e en o n m ba
n n on r i ductki and co or r er
t h rok a in k ope an ve fa tchemi sub t e o e Th e n
cen e ion n d t er f e addi no u e i olat an o recove th nt v equi
o o con o o t they cr
i
l
Pharmaceutical Industr y Pollution Prevention Opportunities
POLLUTIO N PREVENTIO N CASE STUDIES
Material Substitution
� h i g-Pl ugh Pharmaceuticals will mark a ne inhaler for the treatme t f as h , ich i free of chlorofluo carbons (CFCs). The CF free inh ler was devel ped by 3M
Ph icals. CF e used as a propell nt in mete ed-dose i hal r (MDI). n a new MDI, whi was appr ved b the FDA in A t, 1996, CFCs h ve een placed by hy ofl oroalkane-134a (HFA-134a). Unlik FC , HFA es not ete the ozone. The pr duct will be rketed u der t rand n me Pro nti ® HF .
�Schering-Plough Laboratories is switching to a coated natural kraft (CNK) paperboard for its packagin CNK is str ng d less expensive than the previ us packagi g m terial, as well as recy abl d co po table. e paperb a is ot bleached wit lori , ut is co th white cl coat n Instead of mineral-based varni es and inks, er d soy-b sed mater als are us New Jersey e, he co pany is expected t ve $225,000 per r nd could v up to 1.2 million if the pr m expan s t t er divisions.
� it West o , P , facilit y, M rc r mo 1,1,1-Trichloro tha TCA) from its pro n per ons. A was used in st ipping labels o f bottles an t er cleani g p ation t g, d manufact i g. A citrus ased solvent was subs it ted f
cleani g packaging equipm t. F r cleaning manufactur n pmen , roleum-based solvent was sub titu d, the waste fro ich is used for en r very i f-si facilit y.
th same fa ilit y, M k substit te h l for t imer l, a r u y-ba e comp nd. Thimerosal h d b used as a biocid o inacti ate bact a during t e i t l stages of
rment ion i the producti of a vacci . Substi utin ph ol, hazar us, FDAappr ed bi id abled Merck t achieve an 85 percent reductio in ercury sed waste. I additio , the substituti esulted in ncreased pro yields, improved microbial
netics, st savings f aw mat ials.
�At i s C e ee pl nt Riverside, PA, Merc devel d innovati new manu c uring stry which sti ut s toluene f r dichlorom thane. e change has r sulted i a 98
per t r duct i releases an ransf s o dichlorom thane. In tio , because t l en s less v ile d m re easily red, e co rols and reco ery pment on the new pr cess are able t tr l t luene releases such hat have in eased only slightly.
Material Substitution (cont.)
�Riker Laboratories in Northbridge, CA recently replaced several different organic solvent coating materials used on medicine tablets with a water-based coating material. Differences in the new coating material required that new spray equipment be installed. However, the company saves $15,000 per year not purchasing these organic solvents and determined that $180,000 in pollution control equipment was no longer needed. They estimate that the investment will pay for itself in less than one year. The substitution prevents 24 tons per year in organic solvent emissions, reduced exposure risks to workers, and has made it easier for the company to comply with strict California air emission standards.
�In producing the anti-viral drug 6-aminopenicillanic acid, Bristol-Myers Squibb used to extract the intermediate, penicillin V from an aqueous fermentation broth. The broth was filtered and the intermediate then was extracted in several centrifuge steps using the toxic solvent methyl isobutyl ketone (MiBK). The extraction was a major source of fugitive emissions. The broth now is f ltered through a membrane and the intermediate is extracted using n-butyl acetate, a non-toxic chemical, in closed centrifuges, reducing fugitive emissions. The overall capital investment for this project came to almost $10 million. However, the annual operating cost reductions, coupled with a 10 percent increase in throughput, generate $4.9 million in additional cash flow. Based on this, the project will generate a return on investment of 28 percent and a payback period of 2.7 years. In addition the project reduced hazardous waste by 20,000 pounds and eliminated over one million pounds of MiBK releases to the air and water.
�Glaxo-Wellcome, Inc. developed an innovative aqueous coating method that eliminated the use of methylene chloride, isopropyl alcohol, methanol, and ethanol in their Zantac tablet coating operations performed at their Zebulon, North Carolina facilit y. Glaxo-Wellcome overcame a number of obstacles before using the aqueous-based coating material on the Zantac production line. First, the pharmaceutical active readily degraded at the extreme heat and moisture encountered during aqueous coating. Also, the pharmaceutical active migrates through the aqueous coating causing discolorization and degradation of the tablet coating film. To implement the use of the substitute materials, Glaxo-Wellcome had to make extensive changes to the coater spray assemblies, revamped the coater air hand ing system with larger fans and heating coils, and installed a dehumidifying system. The capital investment for this equipment was $1.5 million. However, the company annually saves $286,800 in organic solvent purchases and $322,900 in disposal costs of the more than 479 tons of hazardous waste generated by the old system every year. The estimated payback period for the modifications is three years. In addition, the new system cut VOC emissions to the air from almost 15,000 pounds per year to zero.
Sector Notebook Project 84 September 1997

Pharmaceutical Industr y Pollution Prevention Opportunities
Material Substitution (cont.)
�The Pharmacia and Upjohn, Inc. Sterile Manufacturing area in Kalamazoo has received FDA approval for a Thimerosal-free formulation of one of its products. This new formulation will eliminate the use of Thimerosal, a mercury based preservative, in the manufacture of the drug Atgam. Atgam will be manufactured without any preservative using new closed column chromatography and Restrictive Access Barrier technology. Atgam is used to prevent organ transplant rejection and in the treatment of aplastic anemia.
�The Eli L illy Cleaning Technology Center in late 1996 initiated a formal screening program to identify potential aqueous based cleaners as replacements for the various organic and chlorinated solvents currently used in bulk pharmaceutical manufacturing equipment cleanings. In one product line, 8,700 liters of acetone per cleaning was replaced with an alkaline aqueous based cleaner for an estimated annual reduction of 17,400 liters of acetone. An acid aqueous based cleaner replaced methanol in another product line, resulting in methanol reductions of 25,800 liters per year. In cleaning operations associated with another product, an alkaline aqueous based cleaner replaced 117,000 liters of methanol and 600 liters of ethylene dichloride per cleaning. This resulted in an estimated annual reduction of 368,000 liters of methanol and 1,200 liters of ethylene dichloride.
Sector Notebook Project 85 September 1997

Pharmaceutical Industr y Pollution Prevention Opportunities
V.B. Process Modifications
Process modifications are alterations to or modernization of existing processes to reduce waste generation. Process modifications can involve re-designing chemical transfer systems to reduce spillage and other material losses. For example, in batch operations, each loading and unloading of the reactors and other equipment increases the risk of chemical spills and solvent vapor releases. Batch operations often require more frequent reactor clean outs using significant volumes of cleaning solution and solvents. With continuous operations, the reactor is loaded once and solvents and reactants are fed into the reactor continually, thereby reducing the risk of pollutant releases (US EPA, 1991).
Thus switching from batch to continuous operations for certain products may potentially reduce large volumes of wastes. Switching to a continuous or partially continuous process may be possible for a facilit y that is the primary producer of a product which is in constant demand. For example, Hoffmann La Roche’s facilit y in Nutley, NJ is one of the primary producers of Vitamin E in the country. Consequently, much of their vitamin production equipment is dedicated and run as semi-continuous operations.
Process changes that optimize reactions and raw material use can reduce waste and releases to the environment (US EPA, 1995). Modifications as simple as careful monitoring of reaction parameters (temperatures, pH, etc.) candramatically improve manufacturing efficiency. Production inmanyof the large pharmaceutical companies is computerized and highly automated. Computers equipped with computer aided design (CAD) programs visually simulate the production process on the screen. The automated system allows production managers to turn on the batch process and control temperatures, pressure, and other process parameters, from the keyboard. While, the system runs, production personnel are free to do other things such as check equipment or take product samples. Such careful automated monitoring may insure against the formation of fouling waste at the bottom of reactor vessels, thereby reducing the need for additional cleaning, as well as lessening the risk of damaged batches of product which have to be disposed (US EPA, 1991).
Sector Notebook Project 86 September 1997

Pharmaceutical Industr y Pollution Prevention Opportunities
POLLUTIO N PREVENTIO N CASE STUDIES
Process Modifications
�As part of their “Environment 2000" program, Bristol-Myers Squibb has started to look at Product Life Cycle (PLC) management as a way to implement pollution prevention. PLC involves investigating the environmental impacts of a product at every stage of production: R&D, manufacturing, and packaging. Pollution prevention options are now being investigated at the very beginning of drug development. This eliminates the possibilit y of lengthy Supplementary Drug Approval applications with FDA. Using PLC management, Bristol-Myers Squibb discovered the use of a filtration membrane for their 6-aminopenicillanic acid production (see Section V.A. Case Studies).
�At its East Hanover, NJ facilit y, Sandoz Pharmaceutical Co. changed processes in its reactors, to reduce solvent usage. An inert atmosphere above the reaction mixture is used during synthesis to protect the reaction from exposure to oxygen. In the previous process, nitrogen flowed continuously over the mixture, carrying away with it a certain amount of solvent vapors. The nitrogen gas blanketing process uses a non-flowing nitrogen layer that only bleeds out a very small amount of nitrogen and solvent.
�In their main drug development lab in Tippecanoe, IN, Eli Lilly and Company has implemented a pollution prevention program. Beginning in the R&D phase, the company assesses the environmental impacts of every new product and determines where wastes can be minimized. As a result, Eli L illy developed a new process which eliminated the use of methylene chloride, aluminum wastes, use of an odoriferous raw material, and all distillation steps from production of a drug under development for the treatment of osteoporosis.
�One of Hoffmann La Roche’s major manufacturing processes uses glycol ether as an extractive solvent, much of which had to be disposed of as wastewater. After the product is recovered, the glycol ether is distilled and reused. The overhead from the distillation is primarily water with some glycol ether which is disposed as wastewater. The process was redesigned to increase per pass recycle of the glycol ether in the distillation column by 12%. As a result, use of the chemical was reduced by about 60% and solvent releases decreased by 300,000 pounds per year and the batch cycle time was reduced by four hours. Annual savings are $250,000.
Sector Notebook Project 87 September 1997
Pharmaceutical Industr y Pollution Prevention Opportunities
Process Modifications (cont.)
�At one of its facilit ies, Hoffman La Roche was using 110,000 gallons of methanol per year for cleaning equipment during product changeovers. Methanol was being used for all cleaning and rinsing stages. To reduce methanol usage and the associated waste disposal costs, a new method was developed whereby a two-stage water-based cleaning is done before a final methanol rinse. This reduced the amount of methanol used to about 30,000 gallons per year and saves about $49,000 per year.
�In one of its manufacturing processes, Hoffman La Roche extracted a synthesized pharmaceutical intermediate from toluene into water, and then from water into chloroform. Because toluene was soluble in the extraction, it contaminated the chloroform and created a waste stream of the mixed solvents. The company eliminated the waste stream by steam-distillin g the toluene from the water so that the toluene never came in contact with the chloroform. Chloroform use decreased by 76 percent which was sufficient to remove this material from the list of chemicals the facilit y was required to include in its Toxic Release Inventory report. The project saved $22,000 per year.
�At its West Point, PA facilit y, Merck Co. made a simple change in the sequence of process steps used to manufacture a vaccine, which resulted in a substantial reduction of mercury-based wastes. Thimerisol, a mercury-based chemical, was used as a preservative during an intermediate process step. Thus any waste stream produced during the rest of the process was contaminated with mercury. A process change was initiated to add thimerosal at the end of the process. By elimating mercury in waste streams generated prior to the addition of thimerisol, mercury contaminated wastes generated during manufacturing were dramatically reduced.
�At its Flint River plant in Albany, Georgia, Merck used steam jets to produce a vacuum in the process vessel during the production of an antibiotic. This results in dichloromethane being mixed with steam and subsequently evaporating into the air. The steam jets were replaced with liquid ring vacuum pumps which reduced air emissions. Dichloromethane emissions were further reduced by maintaining the vacuum pump seal fluid at subzero temperatures which condenses the dichloromethane vapor so it can be recycled and reused.
�Pharmacia and Upjohn’s wastewater treatment process was modified to significantly reduce waste disposed by its Underground Injection Control operation. A modification suggested by an employee eliminated about 1 million pounds of solid waste. This modification involved substituting a bag filter for a precoat vacuum filter. The precoat vacuum filter used a diatomaceous filter medium, which generated large volumes of solid waste. The bag filter creates much less waste per volume of liquid filtered. The used filter bags are incinerated on site, thereby greatly reducing landfill wastes.
Sector Notebook Project 88 September 1997

Pharmaceutical Industr y Pollution Prevention Opportunities
Process Modifications (cont.)
�In converting to a new process for bioconversion of a steroid intermediate, Pharmacia and Upjohn, Inc. has eliminated approximately 90,000 pounds of dimethylformamide waste and approximately 190,000 pounds of filter aid waste per year. In addition, solvent handling was reduced from about 6 million pounds to about 600,000 pounds and aqueous waste was reduced more than 4 million pounds per year.
Sector Notebook Project 89 September 1997

Pharmaceutical Industr y Pollution Prevention Opportunities
V.C. Good Operating Practices
One of the easiest and most economical ways to achieve source reduction is to implement good operating practices. Pharmaceutical companies already follow a list of Good Manufacturing Practices (GMP) guidelines outlined by the FDA. In some cases these involve good operating practices that will reduce raw materials use and waste generation. As a result, many companies have developed environmental policies for all of their facilit ies, both in the U.S. and abroad. Typically, policies may be written for employee training, employee health and safety, hazardous chemical spill cleanup procedures, equipment maintenance procedures, leak detection, and emergency response procedures.
Management commitment. Good operating practices start with on-site commitment and understanding of the need and methods for pollution prevention, from top management levels to the plant floor. Without facilit y-wide efforts to reduce pollution, source reduction may not be successful (US EPA, 1991).
Employee training. An employee training program is essential to the success of a source reduction program. Employees should be trained in safe handling of equipment, chemicals, and wastes. They should also be informed of any potentially harmful health effects of the hazardous chemicals they handle. As well as being trained in proper operation of equipment and chemical handling, employees should be trained in spill cleanup and methods for detecting chemical releases (US EPA, 1991).
Maintenance programs. Maintenance programs should target both preventive and corrective maintenance of equipment. This means that equipment should be regularly checked and cleaned to insure its proper functioning, and damaged equipment should be repaired quickly. Routine cleaning, minor adjustments, testing and replacement of parts, should be a part of the maintenance program. Additionally, good record keeping of equipment checks, repairs, cleaning, and equipment failure will help to reduce the likelihood of future equipment breakdowns and any associated pollution releases (US EPA, 1991).
Inventory control. The wide range of chemicals used in the pharmaceutical industry makes it essential to instigate an effic ient inventory tracking system, such as a “first-in, first-out” policy and chemicals must be properly labeled with their name, date of purchase, and date of expiration. This helps to insure that older, un-used chemicals do not have to be needlessly discarded (US EPA, 1991). In addition, having one person responsible for the distribution of chemicals and supplies insures a more efficient tracking system (US EPA, 1995). Inventory tracking is a valuable and easy method for reducing wastes.
Sector Notebook Project 90 September 1997

Pharmaceutical Industr y Pollution Prevention Opportunities
Spill prevention and storage. Spill and leak prevention are crit ical to pollution prevention. Tightly secured storage tanks are a key to avoiding spills. Containers should have good valves with tight stopping devices to avoid the spilling or dripping of hazardous chemicals. Storage containers should have legible signs indicating the contents of the container, health hazard warnings (where necessary), and spill cleanup procedures in case of emergencies. Large drums can be raised above the ground to avoid corrosion. An organized storage area facilit ates fast and easy removal of chemicals, as well as reduction and cleanup of spills (U.S. EPA, 1991).
Sector Notebook Project 91 September 1997

Pharmaceutical Industr y Pollution Prevention Opportunities
POLLUTIO N PREVENTIO N CASE STUDIES
Good Operating Practices
�At its Kenilworth, NJ facilit y, Schering-Plough Pharmaceuticals has a central warehouse with a computerized inventory system. Raw materials come into the warehouse in large volumes. Materials are weighed according to batch requirements, labeled, and then sent to different process areas throughout the facilit y. This eliminates excess raw material wastes and ensures that only the amounts needed are used.
�Sandoz Pharmaceuticals has also developed a system to improve scheduling of batch operations in their facilit ies worldwide and domestically. Accurate scheduling reduces the chances of excess wastes and costs, which occur when a batch changeover takes place.
�At its Nutley, NJ plant, Hoffmann La Roche was able to identify and repair more than 900 sources of fugitive emissions. In addition, the company installed ultra-low temperature condensers to remove solvents from vent streams. The captured solvents are recycled or treated off-site.
�The Pharmacia and Upjohn, Inc. Puerto Rico Technical Operations group was the first offshore location to implement the company’s pollution prevention program. The local pollution prevention team helps the plant set pollution prevention goals. The team reports progress toward meeting goals annually. As a result, the Butyl Alcohol recovery efficiency at the facilit y has been increased to 95% and Acetone to 96%. The facilit y has been tracking waste indices (Tons of waste generated vs. Kilograms of product produced) and results for several wastes show reductions over a four-year period. The pollution prevention program has been fully implemented at all Pharmacia and Upjohn U.S. sites. Under the program individual business units set goals and report on progress annually. More than 300 pollution prevention projects, many of them in the research and development areas, have been recorded since the program started in 1990.
�The Chemical and Fermentation operation at Pharmacia and Upjohn, Inc. in Kalamazoo has begun using interlocked valve systems on jacketed coolers. The new valve systems help prevent the inadvertent discharge of methanol, used as refrigerant, to surface waters. They also have begun using new drip-less pipe couplers to reduce solvent losses and spills from hose connections.
Sector Notebook Project 92 September 1997

Pharmaceutical Industr y Pollution Prevention Opportunities
V.D. Recycling, Recovery, and Reuse
“Recovery and recycling include direct reuse of waste material, recovering used materials for a separate use, and removing impurities from waste to obtain relatively pure substances” (EPA 1991). Although “strict quality control requirements of the pharmaceutical industry often restrict reuse opportunities, some do exist” (EPA 1991) and are considered valuable by the industry since they reduce the volume of raw materials used and the amount of waste generated and disposed.
Except for in-process recycling, EPA does not consider recycling, recovery, and reuse to be source reduction techniques. However, in-process recycling, which includes the reuse or recirculation of a chemical within a process and may include recovery or reclamation, is considered a source reduction technique. The pharmaceutical industry often uses this form of recycling which is dedicated to and physically integrated with the pharmaceutical manufacturing process by means of piping or another form of conveyance.
Recycling and recovery provides the pharmaceutical industry a great opportunity to reduce the volume and toxicity of spent solvents. As described in Section 3, solvents are used for a wide range of applications, from synthesis, extraction, and purification of active ingredients to cleaning process equipment. The types of solvent recovery employed include distillation, evaporation, decantation, centrifugation, and filtration. However, limit ations exist with both on and off-site recycling and recovery since several types of solvents (including water), reactants, and other contaminants may be present. These materials must be extracted to allow the solvent to be reused either in a pharmaceutical process or in another process. Additionally, special techniques and equipment must be used to break azeotropes formed during the chemical reactions.
In addition to solvents, some residual wastes may also be recovered and reused. For example, filter cakes from fermentation processes are usually disposed of in landfills. An alternative being used in some facilit ies is to collect the waste filter cakes, recover any valuable by-products, and then sell the cakes to be used as fertilizers or soil additives. To be used as a fertilizer, the nitrogen, phosphorus, and potassium content must be greater than 5%, which sometimes can be achieved by reducing the moisture content in the filter cake (US EPA, 1991).
Sector Notebook Project 93 September 1997

Pharmaceutical Industr y Pollution Prevention Opportunities
POLLUTIO N PREVENTIO N CASE STUDIES
Recycling, Recovery, and Reuse
�Nycomed Inc. manufactures bulk pharmaceutical products by batch processing. In processing a product for medical diagnostic imaging, the company installed closed loop distillation units to recover all of its methanol washes and methanol-containing wastewater. The methanol recovery system can distill approximately 2,000 gallons per day of 70 percent methanol to more than 99.5 percent methanol, which can be reused in the same process. Nycomed Inc. eliminated water discharges of methanol, reduced hazardous waste, and saved approximately 680,000 pounds of methanol in the first half of 1992, saving $54,438 in the same period.
�The Pharmacia and Upjohn, Inc. Chemical and Fermentation operation in Kalamazoo reuses more than 195 million pounds of solvent annually. Approximately 80% of the site’s total solvent requirement and 90% of the site’s chlorinated solvent requirement is met by reused solvent. The reused solvent demand is met through a combination of in process solvent reuse (150 million pounds) and distillation (45 million pounds). There are now six centralized distillation units. On site solvent reuse and recovery in chemical processes helped the company exceed its 33/50 Program goals. The achievement was commemorated by a National Performance Review Environmental Champion Award given to the company by Vice President Al Gore in 1995.
�Pharmacia and Upjohn, Inc. Chemical Process Research and Development developed a proprietary distillation process for splitting Tetrahydrofuran from a mixture of alcohol, water, and other wastes. Without the new process, Tetrahydrofuran forms azeotropic mixtures with alcohol which cannot be distilled. This process now recovers approximately 1 million pounds of THF per year.
�Pharmacia and Upjohn, Inc. is evaluating the possibilit ies of reusing waste solvent condensate produced from their cryogenic air pollution control equipment. They have identified one methylene chloride rich stream to recover as a trial. An estimated 2.5 million pounds of this waste solvent is generated annually. Recovery by an off-site recycler or on site reclamation are being further evaluated.
Sector Notebook Project 94 September 1997

Pharmaceutical Industr y Pollution Prevention Opportunities
V.E. Pollution Prevention Research
Because of comprehensive regulations from both the FDA and the EPA, pharmaceutical companies are continuously researching new and innovative ways to reduce their wastes. Many companies are starting to look at pollution prevention options early in development and are collaborating with universities and other research institutions to develop new technologies that will help reduce or eliminate wastes. Some of these technologies, still in the research and testing stages, are discussed below.
Solvent Minimization
One potential research area which has been identified is in supercritical solvents. Supercritical fluids are known to be very effective solvents and can function as an alternative to traditional chlorinated and other toxic solvents used inpharmaceutical separations. These solvents are in a supercriticalstate, meaning that they are at a very high temperature and/or pressure. A relatively small change inthe temperature and/or pressure in supercritical state can lead to large changes in the solubilit y of chemicals in the solvent. This increase in solubilit y is ideal for separations because the overall volume of solvent needed is reduced (NJIT, 1991).
Separation Improvements
Separation of active ingredients from solvents is one of the most important processes in the pharmaceutical industry. Research has been conducted to find separation methods which generate fewer by-products and less waste.
One technology with such a potential is inorganic membrane reactors. “They are in effect reactors with built-in separators which may have potential for reaction sequences with much better reactor utilization and product concentrations” (NJIT, 1991). Inorganic membranes enable a continuous removal of product and a controlled addition of reactant. This increases the potential for higher yields and greater selectivity by chemicals, which could reduce the volume of solvents required, thereby reducing costs and wastes. Also, because the reaction and separation are combined in a single step, the emissions associated with the traditional transfer step between reaction and separation are eliminated (NJIT, 1991).
Sector Notebook Project 95 September 1997

Pharmaceutical Industr y Pollution Prevention Opportunities
Sector Notebook Project 96 September 1997

Pharmaceutical Industr y Federal Statutes and Regulations
VI . SUMMARY OF APPLICABLE FEDERAL STATUTES AND REGULATI ONS
This section discusses the Federal regulations that may apply to this sector. The purpose of this section is to highlight and briefly describe the applicable Federal requirements, and to provide citations for more detailed information. The three following sections are included:
Section VI.A contains a general overview of major statutesSection VI.B contains a list of regulations specific to this industrySection VI.C contains a list of pending and proposed regulationsSection VI .D contains a general overview of other federal statutes applicableto the industrySection VI .E. contains a general overview of state regulations affecting theindustry.
The descriptions within Section VI are intended solely for general information. Depending upon the nature or scope of the activities at a particular facilit y, these summaries may or may not necessarily describe all applicable environmental requirements. Moreover, they do not constitute formal interpretations or clarifications of the statutes and regulations. For further information readers should consult the Code of Federal Regulations and state or local regulatory agencies. EPA Hotline contacts are also provided for each major statute.
VI.A. General Description of Major Statutes
Resource Conservation And Recovery Act (RCRA)
RCRA of 1976, which amended the Solid Waste Disposal Act, addressessolid (Subtitle D) and hazardous (Subtitle C) waste management activities. The Hazardous and Solid Waste Amendments (HSWA) of 1984 strengthened RCRA’s waste management provisions and added Subtitle I, which governs underground storage tanks (USTs).
Regulations promulgated pursuant to Subtitle C of RCRA (40 CFR Parts 260-299) establish a “cradle-to-grave” system governing hazardous waste from the point of generation to disposal. RCRA hazardous wastes include the specific materials listed in the regulations (commercial chemical products, designated with the code "P" or "U"; hazardous wastes from specific industries/sources, designated with the code "K"; or hazardous wastes from non-specific sources, designated with the code "F") or materials which exhibit a hazardous waste characteristic (ignitabilit y, corrosivity, reactivity, or toxicity and designated with the code "D").
Regulated entities that generate hazardous waste are subject to waste accumulation, manifesting, and record keeping standards. Facilities must
Sector Notebook Project 97 September 1997

Pharmaceutical Industr y Federal Statutes and Regulations
obtain a permit either from EPA or from a State agency which EPA has authorized to implement the permitting program if they store hazardous wastes for more than 90 days before treatment or disposal. Facilit ies may treat hazardous waste stored in less-than-ninety-day tanks or containers without a permit. Subtit le C permits contain general facilit y standards such as contingency plans, emergency procedures, record keeping and reporting requirements, financial assurance mechanisms, and unit-specific standards. RCRA also contains provisions (40 CFR Part 264 Subpart S and §264.10) for conducting corrective actions which govern the cleanup of releases of hazardous waste or constituents from solid waste management units at RCRA-regulated facilit ies.
Although RCRA is a Federal statute, many States implement the RCRA program. Currently, EPA has delegated its authority to implement various provisions of RCRA to 47 of the 50 States and to two U.S. territories. Delegation has not been given to Alaska, Hawaii, or Iowa.
Most RCRA requirements are not industry specific but apply to any company that generates, transports, treats, stores, or disposes of hazardous waste. Here are some important RCRA regulatory requirements:
Identification of Solid and Hazardous Wastes (40 CFR Part 261) lays out the procedure every generator should follow to determine whether the material in question created is considered a hazardous waste, solid waste, or is exempted from regulation.
Standards for Generators of Hazardous Waste (40 CFR Part 262) establishes the responsibilit ies of hazardous waste generators including obtaining an EPA ID number, preparing a manifest, ensuring proper packaging and labeling, meeting standards for waste accumulation units, and record keeping and reporting requirements. Generators can accumulate hazardous waste for up to 90 days (or 180 days depending on the amount of waste generated) without obtaining a permit.
Land Disposal Restrictions (LDRs) (40 CFR Part 268) are regulations prohibiting the disposal of hazardous waste on land without prior treatment. Under the LDRs program, materials must meet LDR treatment standards prior to placement in a RCRA land disposal unit (landfill, land treatment unit, waste pile, or surface impoundment). Generators of waste subject to theLDRsmust provide notification of such to the designated TSD facilit y to ensure proper treatment prior to disposal.
Used Oil Management Standards (40 CFR Part 279) impose management requirements affecting the storage, transportation,
Sector Notebook Project 98 September 1997

Pharmaceutical Industr y Federal Statutes and Regulations
burning, processing, and re-refining of the used oil. For parties that merely generate used oil, regulations establish storage standards. For a party considered a used oil processor, re-refiner, burner, or marketer (one who generates and sells off-specification used oil), additional tracking and paperwork requirements must be satisfied.
RCRA contains unit-specific standards for all units used to store, treat, or dispose of hazardous waste, including Tanks and Containers. Tanks and containers used to store hazardous waste with a high volatile organic concentration must meet emission standards under RCRA. Regulations (40 CFR Part 264-265, Subpart CC) require generators to test the waste to determine the concentration of the waste, to satisfy tank and container emissions standards, and to inspect and monitor regulated units. These regulations apply to all facilit ies that store such waste, including large quantity generators accumulating waste prior to shipment off-site.
Underground Storage Tanks (USTs) containing petroleum and hazardous substances are regulated under Subtitle I of RCRA. Subtitle I regulations (40 CFR Part 280) contain tank design and release detection requirements, as well as financial responsibilit y and corrective action standards for USTs. The UST program also includes upgrade requirements for existing tanks that must be met by December 22, 1998.
Boilers and Industr ial Furnaces (BIFs) that use or burn fuel containing hazardous waste must comply with strict design and operating standards. BIF regulations (40 CFR Part 266, Subpart H) addressunit design, provide performance standards, requireemissions monitoring, and restrict the type of waste that may be burned.
EPA's RCRA/Superfund/UST Hotline, at (800) 424-9346, responds to questions and distributes guidance regarding all RCRA regulations. The RCRA Hotline operates weekdays from 9:00 a.m. to 6:00 p.m., ET, excluding Federal holidays.
Comprehensive Environmental Response, Compensation, And Liability Act (CERCLA)
CERCLA, a 1980 law commonly known as Superfund, authorizes EPA to respond to releases, or threatened releases, of hazardous substances that may endanger public health, welfare, or the environment. CERCLA also enables EPA to force parties responsible for environmental contamination to clean it up or to reimburse the Superfund for response costs incurred by EPA. The Superfund Amendments and Reauthorization Act (SARA) of 1986 revised various sections of CERCLA, extended the taxing authority for Superfund,
Sector Notebook Project 99 September 1997

Pharmaceutical Industr y Federal Statutes and Regulations
and created a free-standing law, SARA Title III, also known as the Emergency Planning and Community Right-to-Know Act (EPCRA).
The CERCLA hazardous substance release report ingregulations (40 CFR Part 302) direct the person in charge of a facility to report to the National Response Center (NRC) any environmental release of a hazardous substance which equals or exceeds a reportable quantity. Reportable quantities are defined and listed in 40 CFR §302.4. A release report may trigger a response by EPA, or by one or more Federal or State emergency response authorities.
EPA implements hazardous substance responses according to procedures outlined in the National Oil and Hazardous Substances PollutionContingency Plan (NCP) (40 CFR Part 300). The NCP includes provisions for permanent cleanups, known as remedial actions, and other cleanups referred to as "removals." EPA generally takes remedial actions only at sites on the National Priorities List (NPL), which currently includes approximately 1300 sites. Both EPA and states can act at other sites; however, EPA provides responsible parties the opportunity to conduct removal and remedial actions and encourages community involvement throughout the Superfund response process.
EPA's RCRA/Superfund and EPCRA Hotline, at (800) 424-9346, answers questions and references guidance pertaining to the Superfund program. The CERCLA Hotline operates weekdays from 9:00 a.m. to 6:00 p.m., ET, excluding Federal holidays.
Emergency Planning And Community Right-To-Know Act (EPCRA)
The Superfund Amendments and Reauthorization Act (SARA) of 1986 created EPCRA, also known as SARA Title III, a statute designed to improve community access to information about chemical hazards and to facilit ate the development of chemical emergency response plans by State and local governments. EPCRA required the establishment of State emergency response commissions (SERCs), responsible for coordinating certain emergency response activities and for appointing local emergency planning committees (LEPCs).
EPCRA and the EPCRA regulations (40 CFR Parts 350-372) establish four types of reporting obligations for facilit ies which store or manage specified chemicals:
EPCRA §302 requires facilit ies to notify the SERC and LEPC of the presence of any "extremely hazardous substance" (the list of such substances is in 40 CFR Part 355, Appendices A and B) if it has such substance in excess of the substance's threshold planning quantity, and
Sector Notebook Project 100 September 1997

Pharmaceutical Industr y Federal Statutes and Regulations
directs the facilit y to appoint an emergency response coordinator.
EPCRA §304 requires the facilit y to notify the SERC and the LEPC in the event of a release equaling or exceeding the reportable quantity of a CERCLA hazardous substance or an EPCRA extremely hazardous substance.
EPCRA §311 and §312 require a facilit y at which a hazardous chemical, as defined by the Occupational Safety and Health Act, is present in an amount exceeding a specified threshold to submit to the SERC, LEPC and local fire department material safety data sheets (MSDSs) or lists of MSDS's and hazardous chemical inventory forms (also known as Tier I and II forms). This information helps the local government respond in the event of a spill or release of the chemical.
EPCRA §313 requires manufacturing facilit ies included in SIC codes 20 through 39, which have ten or more employees, and which manufacture, process, or use specified chemicals in amounts greater than threshold quantities, to submit an annual toxic chemical release report. This report, commonly known as the Form R, covers releases and transfers of toxic chemicals to various facilit ies and environmental media, and allows EPA to compile the national Toxic Release Inventory (TRI) database.
All information submitted pursuant to EPCRA regulations is publicly accessible, unless protected by a trade secret claim.
EPA's RCRA, Superfund and EPCRA Hotline, at (800) 424-9346, answers questions and distributes guidance regarding the emergency planning and community right-to-know regulations. The EPCRA Hotline operates weekdays from 9:00 a.m. to 6:00 p.m., ET, excluding Federal holidays.
Clean Water Act (CWA)
The primary objective of the Federal Water Pollution Control Act, commonly referred to as the CWA, is to restore and maintain the chemical, physical, and biological integrity of the nation's surface waters. Pollutants regulated under the CWA include "priority" pollutants and various toxic pollutants; "conventional" pollutants, such as biochemical oxygen demand (BOD), total suspended solids (TSS), fecal coliform, oil and grease, and pH; and "non-conventional" pollutants which are pollutants not identified as either conventional or priority.
The CWA regulates both direct and indirect discharges. The National Pollutant Discharge Elimination System (NPDES) program (CWA §402)
Sector Notebook Project 101 September 1997
Pharmaceutical Industr y Federal Statutes and Regulations
controls direct discharges into navigable waters. Direct discharges or "point source" discharges are from sources such as pipes and sewers. NPDES permits, issued by either EPA or an authorized State (EPA has authorized 42 States to administer the NPDES program), contain industry-specific, technology-based and/or water qualit y-based limits, and establish pollutant monitoring requirements. A facilit y that intends to discharge into the nation's waters must obtain a permit prior to initiating its discharge. A permit applicant must provide quantitative analytical data identifying the types of pollutants present in the facilit y's effluent. The permit will t hen set forth the conditions and effluent limitations under which a facilit y may make a discharge.
A NPDES permit may also include discharge limits based on Federal or State water quality criteria or standards that were designed to protect designated uses of surface waters, such as supporting aquatic life or recreation. These standards, unlike the technological standards, generally do not take into account technological feasibilit y or costs. Water qualit y criteria and standards vary from state to state, and site to site, depending on the use classification of the receiving body of water. Most states follow EPA guidelines, which propose aquatic life and human health criteria for many of the 126 priority pollutants.
Storm Water Discharges
In 1987 the CWA was amended to require EPA to establish a program to address storm water discharges. In response, EPA promulgated the NPDES storm water permit application regulations. These regulations require that facilit ies with the following storm water discharges apply for an NPDES permit: (1) a discharge associated with industrial activity; (2) a discharge from a large or medium municipal storm sewer system; or (3) a discharge which EPA or the State determines to contribute to a violation of a water quality standard or is a significant contributor of pollutants to waters of the United States.
The term "storm water discharge associated with industrial activity" means a storm water discharge from one of 11 categories of industrial activity defined at 40 CFR 122.26. Six of the categories are defined by SIC codes while the other five are identified through narrative descriptions of the regulated industrial activity. If the primary SIC code of the facilit y is one of those identified in the regulations, the facilit y is subject to the storm water permit application requirements. If any activity at a facilit y is covered by one of the five narrative categories, storm water discharges from those areas where the activities occur are subject to storm water discharge permit application requirements.
Sector Notebook Project 102 September 1997
Pharmaceutical Industr y Federal Statutes and Regulations
Those facilit ies/activit ies that are subject to storm water discharge permit application requirements are identified below. To determine whether a particular facilit y falls within one of these categories, the regulation should be consulted.
Category i: Facilit ies subject to storm water effluent guidelines, new source performance standards, or toxic pollutant effluent standards.
Category ii: Facilit ies classified as SIC 24-lumber and wood products (except wood kitchen cabinets); SIC 26-paper and allied products (except paperboard containers and products); SIC 28-chemicals and allied products (except drugs and paints); SIC 291-petroleum refining; and SIC 311-leather tanning and finishing, 32 (except 323)-stone, clay, glass, and concrete, 33-primary metals, 3441-fabricated structural metal, and 373-ship and boat building and repairing.
Category iii: Facilit ies classified as SIC 10-metal mining; SIC 12-coal mining; SIC 13-oil and gas extraction; and SIC 14-nonmetallic mineral mining.
Category iv: Hazardous waste treatment, storage, or disposal facilit ies.
Category v: Landfills , land application sites, and open dumps that receive or have received industrial wastes.
Category vi: Facilit ies classified as SIC 5015-used motor vehicle parts; and SIC 5093-automotive scrap and waste material recycling facilit ies.
Category vii: Steam electric power generating facilit ies.
Category viii: Facilit ies classified as SIC 40-railroad transportation; SIC 41-local passenger transportation; SIC 42-trucking and warehousing (except public warehousing and storage); SIC 43-U.S. Postal Service; SIC 44-water transportation; SIC 45-transportation by air; and SIC 5171-petroleum bulk storage stations and terminals.
Category ix: Sewage treatment works.
Category x: Construction activities except operations that result in the disturbance of less than five acres of total land area.
Sector Notebook Project 103 September 1997

Pharmaceutical Industr y Federal Statutes and Regulations
Category xi: Facilit ies classified as SIC 20-food and kindred products; SIC 21-tobacco products; SIC 22-textile mill products; SIC 23-apparel related products; SIC 2434-wood kitchen cabinets manufacturing; SIC 25-furniture and fixtures; SIC 265-paperboard containers and boxes; SIC 267-converted paper and paperboard products; SIC 27-printing, publishing, and allied industries; SIC 283-drugs; SIC 285-paints, varnishes, lacquer, enamels, and allied products; SIC 30-rubber and plastics; SIC 31-leather and leather products (except leather and tanning and finishing); SIC 323-glass products; SIC 34-fabricated metal products (except fabricated structural metal); SIC 35-industrial and commercial machinery and computer equipment; SIC 36-electronic and other electrical equipment and components; SIC 37-transportation equipment (except ship and boat building and repairing); SIC 38-measuring, analyzing, and controlling instruments; SIC 39-miscellaneous manufacturing industries; and SIC 4221-4225-public warehousing and storage.
Pretreatment Program
Another type of discharge that is regulated by the CWA is one that goes to a publicly-owned treatment works (POTWs). The national pretreatment program (CWA §307(b)) controls the indirect discharge of pollutants to POTWs by "industrial users." Facilit ies regulated under §307(b) must meet certain pretreatment standards. The goal of the pretreatment program is to protect municipal wastewater treatment plants from damage that may occur when hazardous, toxic, or other wastes are discharged into a sewer system and to protect the quality of sludge generated by these plants. Discharges to a POTW are regulated primarily by the POTW itself, rather than the State or EPA.
EPA has developed technology-based standards for industrial users of POTWs. Different standards apply to existing and new sources within each category. "Categorical" pretreatment standards applicable to an industry on a nationwide basis are developed by EPA. In addition, another kind of pretreatment standard, "local limits," are developed by the POTW in order to assist the POTW in achieving the effluent limitations in its NPDES permit.
Regardless of whether a State is authorized to implement either the NPDES or the pretreatment program, if it develops its own program, it may enforce requirements more stringent than Federal standards.
Spill Prevention, Control and Countermeasure Plans
The 1990 Oil Pollution Act requires that facilit ies that could reasonably be expected to discharge oil in harmful quantit ies prepare and implement more
Sector Notebook Project 104 September 1997

Pharmaceutical Industr y Federal Statutes and Regulations
rigorous Spill Prevention Control and Countermeasure (SPCC) Plan required under the CWA (40 CFR §112.7). There are also criminal and civil penalties for deliberate or negligent spills of oil. Regulations covering response to oil discharges and contingency plans (40 CFR Part 300), and Facilit y Response Plans to oil discharges (40 CFR §112.20) and for PCB transformersand PCB-containing items were revised and finalized in 1995.
EPA’s Office of Water, at (202) 260-5700, will dir ect callers with questions about the CWA to the appropriate EPA office. EPA also maintains a bibliographic database of Office of Water publications which can be accessed through the Ground Water and Drinking Water resource center, at (202) 260-7786.
Safe Drinking Water Act (SDWA)
The SDWA mandates that EPA establish regulations to protect human health from contaminants in drinking water. The law authorizes EPA to develop national drinking water standards and to create a joint Federal-State system to ensure compliance with these standards. The SDWA also directs EPA to protect underground sources of drinking water through the control of underground injection of liquid wastes.
EPA has developed primary and secondary drinking water standardsunderits SDWA authority. EPA and authorized states enforce the primary drinking water standards, which are, contaminant-specific concentration limits that apply to certain public drinking water supplies. Primary drinking water standards consist of maximum contaminant level goals (MCLGs), which are non-enforceable health-based goals, and maximum contaminant levels (MCLs), which are enforceable limit s set as close to MCLGs as possible, considering cost and feasibilit y of attainment.
The SDWA Underground Injection Control (UIC) program(40CFRParts 144-148) is a permit program whichprotectsunderground sources of drinking water by regulating five classes of injection wells. UIC permits include design, operating, inspection, and monitoring requirements. Wells used to inject hazardous wastes must also comply with RCRA corrective action standards in order to have RCRA permit by rule status, and must meet applicable RCRA land disposal restrictions standards. The UIC permit program is primarily state-enforced, since EPA has authorized all but a few states to administer the program.
The SDWA also provides for a Federally- implemented Sole Source Aquifer program, which prohibits Federal funds from being expended on projects that may contaminate the sole or principal source of drinking water for a given
Sector Notebook Project 105 September 1997

Pharmaceutical Industr y Federal Statutes and Regulations
area, and for a State-implemented Wellhead Protection program, designed to protect drinking water wells and drinking water recharge areas.
EPA’s Safe Drinking Water Hotline, at (800) 426-4791, answers questions and distributes guidance pertaining to SDWA standards. The Hotline operates from 9:00 a.m. through 5:30 p.m., ET, excluding Federal holidays.
Toxic Substances Control Act (TSCA)
TSCA granted EPA authority to create a regulatory framework to collect data on chemicals in order to evaluate, assess, mitigate, and control risks which may be posed by their manufacture, processing, and use. TSCA provides a variety of control methods to prevent chemicals from posing unreasonable risk.
TSCA standards may apply at any point during a chemical’s life cycle. Under TSCA §5, EPA has established an inventory of chemical substances. If a chemical is not alreadyon the inventory, and has not been excluded by TSCA, a premanufacture notice (PMN) must be submitted to EPA prior to manufacture or import. The PMN must identify the chemical and provide available information on health and environmental effects. If available data are not sufficient to evaluate the chemicals effects, EPA can impose restrictions pending the development of information on its health and environmental effects. EPA can also restrict significant new uses of chemicals based upon factors such as the projected volume and use of the chemical.
Under TSCA §6, EPA can ban the manufacture or distribution in commerce, limit the use, require labeling, or place other restrictions on chemicals that pose unreasonable risks. Among the chemicals EPA regulates under §6 authority are asbestos, chlorofluorocarbons (CFCs), and polychlorinated biphenyls (PCBs).
EPA’s TSCA Assistance Information Service, at (202) 554-1404, answers questions and distributes guidance pertaining to Toxic Substances Control Act standards. The Service operates from 8:30 a.m. through 4:30 p.m., ET, excluding Federal holidays.
Clean Air Act (CAA)
The CAA and its amendments, including the Clean Air Act Amendments (CAAA) of 1990, are designed to “protect and enhance the nation's air resources so as to promote the public health and welfare and the productive capacity of the population.” The CAA consists of six sections, known as Titles, which direct EPA to establish national standards for ambient air quality and for EPA and the States to implement, maintain, and enforce these standards through a variety of mechanisms. Under the CAAA, many facilit ies
Sector Notebook Project 106 September 1997

Pharmaceutical Industr y Federal Statutes and Regulations
will be required to obtain permits for the first time. State and local governments oversee, manage, and enforce many of the requirements of the CAAA. CAA regulations appear at 40 CFR Parts 50-99. Pursuant to Title I of the CAA, EPA has established national ambient air qualit y standards (NAAQSs) to limit levels of "criteria pollutants," including carbon monoxide, lead, nitrogen dioxide, particulate matter, volatile organic compounds (VOCs), ozone, and sulfur dioxide. Geographic areas that meet NAAQSs for a given pollutant are classified as attainment areas; those that do not meet NAAQSs are classified as non-attainment areas. Under §110 of the CAA, each State must develop a State Implementation Plan (SIP) to identify sources of air pollution and to determine what reductions are required to meet Federal air quality standards. Revised NAAQSs for particulates and ozone were proposed in 1996 and may go into effect as early as late 1997.
Title I also authorizes EPA to establish New Source Performance Standards (NSPSs), which are nationally uniform emission standards for new stationary sources falling within particular industrial categories. NSPSs are based on the pollution control technology available to that category of industrial source.
Under Title I, EPA establishes and enforces National Emission Standards for Hazardous Air Pollutants (NESHAPs), nationallyuniform standards oriented towards controlling particular hazardous air pollutants (HAPs). Title I, section 112(c) of the CAA further directed EPA to develop a list of sources that emit any of 189 HAPs, and to develop regulations for these categories of sources. To date, EPA has listed 174 categories and developed a schedule for the establishment of emission standards. The emission standards will be developed for both new and existing sources based on "maximum achievable control technology (MACT)." The MACT is defined as the control technology achieving the maximum degree of reduction in the emission of the HAPs, taking into account cost and other factors.
Title II of the CAA pertains to mobile sources, such as cars, trucks, buses, and planes. Reformulated gasoline, automobile pollution control devices, and vapor recovery nozzles on gas pumps are a few of the mechanisms EPA uses to regulate mobile air emission sources.
Title IV of the CAA establishes a sulfur dioxide emissions program designed to reduce the formation of acid rain. Reduction of sulfur dioxide releases will be obtained by granting to certain sources limited emissions allowances, which, beginning in 1995, will be set below previous levels of sulfur dioxide releases.
Title V of the CAA of 1990 created a permit program for all "major sources" (and certain other sources) regulated under the CAA. One purpose of the operating permit is to include in a single document all air emissions requirements that apply to a given facilit y. States are developing the permit
Sector Notebook Project 107 September 1997

Pharmaceutical Industr y Federal Statutes and Regulations
programs in accordance with guidance and regulations from EPA. Once a State program is approved by EPA, permits will be issued and monitored by that State.
Title VI of the CAA is intended to protect stratospheric ozone by phasing out the manufacture of ozone-depleting chemicals and restrict their use and distribution. Production of Class I substances, including 15 kinds of chlorofluorocarbons (CFCs) and chloroform, were phased out (except for essential uses) in 1996.
EPA's Clean Air Technology Center, at (919) 541-0800, provides general assistance and information on CAA standards. The Stratospheric Ozone Information Hotline, at (800) 296-1996, provides general information about regulations promulgated under Title VI of the CAA, and EPA's EPCRA Hotline, at (800) 535-0202, answers questions about accidental release prevention under CAA §112(r). In addition, the Clean Air Technology Center’s website includes recent CAA rules, EPA guidance documents, and updates of EPA activities (www.epa.gov/ttn then select Directory and then CATC).
Sector Notebook Project 108 September 1997

Pharmaceutical Industr y Federal Statutes and Regulations
VI .B. Industr y Specific Requir ements
The pharmaceutical industry is affected by several major federal environmental statutes. In addition, the industry is subject to numerous laws and regulations from state and local governments designed to protect and improve the nation’s health, safety, and environment. A summary of the major federal regulations affecting the pharmaceutical industry follows.
Clean Air Act (CAA)
The original CAA authorized EPA to set limits on pharmaceutical plant emissions. Some of these new source performance standards (NSPS) apply to pharmaceutical manufacturers including those for flares (40 CFR Part 60 Subpart A), and storage of volatile organic liquids (40 CFR Part 60 Subpart Kb). The Clean Air Act Amendments of 1990 set control standards by industrial sources for 41 pollutants to be met by 1995 and for 148 other pollutants to be reached by 2003. Under the air toxics provisions of the CAAA, more sources are covered including small businesses. The Hazardous Organic National Emissions Standard for Hazardous Air Pollutants, also known as HON, covers hundreds of chemicals and thousandsof process units. The pharmaceutical industry is affected by standards for equipment leaks (40 CFR Part 63 Subpart H), equipment leaks from pharmaceutical processes using carbon tetrachloride or methylene chloride (40 CFR Part 63 Subpart I), and standards for emissions from halogenated solvent cleaning (40 CFR Part 63 Subpart T). The HON also includes innovative provisions such as emissions trading, that offer industry flexibilit y in complying with the rule's emissions goals.
Specific industries are regulated under other National Emission Standards for Hazardous Air Pollutants (NESHAP). These standards are being developed for the pharmaceutical industry (see Section VI. C). Title V of the CAA introduces a new permit system that will r equire all major sources to obtain operating permits to cover all applicable control requirements. States were required to develop and implement the program in 1993 and the first permits were issued in 1994. In December 1994, Schering-Plough Pharmaceutical’s facilit y in Kenilworth, New Jersey, was the first in the nation to receive a facilit y-wide permit under this Title V program.
Clean Water Act (CWA)
The Clean Water Act, first passed in 1972 and amended in 1977 and 1987, gives EPA the authority to regulate effluents from sewage treatment works, chemical plants, and other industrial sources into waters. The act sets “best available” technology standards for treatment of wastes for both direct and indirect (to a Publicly Owned Treatment Works (POTW)) discharges. In 1983, EPA proposed effluent guidelines for the pharmaceutical manufacturing
Sector Notebook Project 109 September 1997

Pharmaceutical Industr y Federal Statutes and Regulations
point source category. These guidelines are currently undergoing revisions (see Section VI. C). The implementation of the guidelines is left to the states who issue National Pollutant Discharge Elimination System (NPDES) permits for each facility.
The pharmaceutical manufacturing effluent guidelines for point source category (40 CFR Part 439) is divided into processspecific effluent guidelines as follows:
Fermentation - 40 CFR Part 439 Subpart A, Natural product extraction - 40 CFR Part 439 Subpart B, Chemical synthesis - 40 CFR Part 439 Subpart C, Mixing, compounding, formulation - 40 CFR Part 439 Subpart D, and Research - 40 CFR Part 439 Subpart E.
Each Subpart consists of effluent limitations representing the amount of effluent reduction possible by using either best practicable control technologies (BPT), best conventional pollution technologies (BCT), or best available technologies (BAT). BPTs are used for discharges from existing point sources to control conventional and non-conventional pollutants as well as some priority pollutants. BCTs are used for discharges from point sources to control conventional pollutants. Finally, BATs are used to control priority pollutants and non-conventional pollutants when directly discharged into the nation’s waters. Standards are provided for cyanide, biologic oxygen demand (BOD), chemical oxygen demand (COD), total suspended solids (TSS) and pH. Guidelines for BCT and BAT for the research category, new source performance standards (NSPS), and pre-treatment standards for new and existing sources, are being revised and are in the final rule stage (see Section VI . C).
The Storm Water Rule (40 CFR §122.26) requires pharmaceutical facilit ies discharging storm water associated with industrial activities (40 CFR §122.26 (b)(14)(xi)) to apply for storm water permits.
Safe Drinking Water Act Underground Injection Control Program
The federal Underground Injection Control (UIC) program was established under the provisions of the SDWA of 1974. This federal program prescribes minimum requirements for effective state UIC programs. Since ground water is a major source of drinking water in the United States, the UIC program requirements were designed to prevent contamination of Underground Sources of Drinking Water (USDW) resulting from the operation of injection wells. A USDW is defined as an “aquifer or its portion which supplies any public water system or contains a sufficient quantity of ground water to supply a public water system, or contains less than 10,000 millig rams per lit er total dissolved solids and is not an exempted aquifer.”
Sector Notebook Project 110 September 1997

Pharmaceutical Industr y Federal Statutes and Regulations
Since the passage of the Safe Drinking Water Act, state and federal regulatory agencies have modified existing programs or developed new strategies to protect ground water by establishing regulations to control the permitting, construction, operation, monitoring, and closure of injection wells. In Michigan, where all five of the pharmaceutical industry’s injection wells are located, the state has not sought authority to implement the federal UIC program but does regulate use of injection wells through state law. The EPA is the responsible regulatory agency for implementing the UIC program in the state.
The five wells used by the pharmaceutical companies in Michigan are termed hazardous Class I injection wells since they inject hazardous waste into formations below the USDW. The process of selecting a site for a Class I disposal well involves evaluating many conditions with the most important being the determination that the underground formations possess the natural abilit y to contain and isolate the injected waste. A detailed study is conducted to determine the suitabilit y of the underground formation for disposal. The receiving formation must be far below any usable ground waters and be separated from them by confining layers of rock, which prevent fluid migration into the ground water. The injection zone in the receiving formation must be of sufficient size and have sufficient pore space to accept and maintain the injected wastes.
Class I injection wells are regulated in 40 CFR Part 146, Subpart G. Subpart G requires facilit ies with injection wells to submit operating reports and to submit plans for testing and monitoring the wastes, hydrogeologic conditions, condition of the well materials, mechanical integrity of the well, and ambient conditions in adjacent aquifers. Subpart G also sets criteria for siting Class I hazardous waste injection wells, construction requirements, corrective action procedures, operating requirements, and closure plans.
Resource Conservation and Recovery Act (RCRA)
The Resource Conservation and Recovery Act (RCRA) was enacted in 1976 to address problems related to hazardous and solid waste management. RCRA gives EPA the authority to establish a list of solid and hazardous wastes and to establish standards and regulations for the treatment, storage, and disposal of these wastes. Regulations in Subtitle C of RCRA address the identification, generation, transportation, treatment, storage, and disposal of hazardous wastes. These regulations are found in 40 CFR Part 124 and CFR Parts 260-279. Under RCRA, persons who generate waste must determine whether the waste is defined as solid waste or hazardous waste. Solid wastes are considered hazardous wastes if they are listed by EPA as hazardous or if they exhibit characteristics of a hazardous waste: toxicity, ignitabilit y, corrosivity, or reactivity.
Sector Notebook Project 111 September 1997

Pharmaceutical Industr y Federal Statutes and Regulations
Products, intermediates, and off-specification products potentially generated at pharmaceutical facilit ies that are considered hazardous wastes are listed in 40 CFR Part 261.33(f). Some of the handling and treatment requirements for RCRA hazardous waste generators are covered under 40 CFR Part 262 and include the following: determining what constitutes a RCRA hazardous waste (Subpart A); manifesting (Subpart B); packaging, labeling, and accumulation time limits (Subpart C); and record keeping and reporting (Subpart D).
Many pharmaceutical facilit ies store some hazardous wastes at the facilit y for more than 90 days, and are therefore, a storage facilit y under RCRA. Storage facilit ies are required to have a RCRA treatment, storage, and disposal facilit y (TSDF) permit (40 CFR Part 262.34). Some pharmaceutical facilit ies are considered TSDF facilit ies and are subject to the following regulations covered under 40 CFR Part 264: contingency plans and emergency procedures (40 CFR Part 264 Subpart D); manifesting, record keeping, and reporting (40 CFR Part 264 Subpart E); use and management of containers (40 CFR Part 264 Subpart I); tank systems (40 CFR Part 264 Subpart J); surface impoundments (40 CFR Part 264 Subpart K); land treatment (40 CFR Part 264 Subpart M); corrective action of hazardous waste releases (40 CFR Part 264 Subpart S); air emissions standards for process vents of processes that process or generate hazardous wastes (40 CFR Part 264 Subpart AA); emissions standards for leaks in hazardous waste handling equipment (40 CFR Part 264 Subpart BB); and emissions standards for containers, tanks, and surface impoundments that contain hazardous wastes (40 CFR Part 264 Subpart CC).
A number of RCRA wastes have been prohibited from land disposal unless treated to meet specific standards under the RCRA Land Disposal Restriction (LDR) program. The wastes covered by the RCRA LDRs are listed in 40 CFR Part 268 Subpart C and include a number of wastes commonly generated at pharmaceutical facilit ies. Standards for the treatment and storage of restricted wastes are described in Subparts D and E, respectively.
Many pharmaceutical manufacturing facilities are also subject to the underground storage tank (UST) program (40 CFR Part 280). The UST regulations apply to facilit ies that store either petroleum products or hazardous substances (except hazardous waste) identified under the Comprehensive Environmental Response, Compensation, and Liabilit y Act. UST regulations address design standards, leak detection, operating practices, response to releases, financial responsibility for releases, and closure standards.
Sector Notebook Project 112 September 1997

Pharmaceutical Industr y Federal Statutes and Regulations
Comprehensive Environmental Response Compensation and Liability Act (CERCLA)
The Comprehensive Environmental Response Compensation and Liabilit y Act of 1980 (CERCLA) and the Superfund Amendments and Reauthorization Act of 1986 (SARA) provide the basic legal framework for the federal “Superfund” program to clean up abandoned hazardous waste sites (40 CFR Part 305). The 1986 SARA legislation extended these taxes for five years and adopted a new broad-based corporate environmental tax, applicable to the allied chemicals (SIC 28) industry, which includes the pharmaceuticals industry. In 1990, Congress passed a simple reauthorization that did not substantially change the law but extended the program authority until 1994 and the taxing authority until the end of 1995. A comprehensive reauthorization was considered in 1994, but not passed. Since the expiration of the taxing authority on December 31, 1995, taxes for Superfund have been temporarily suspended. The taxes can only be reinstated by reauthorization of Superfund or an omnibus reconciliation act which could specifically reauthorize taxing authority. The allied chemical industry pays about $300 milli on a year in Superfund chemical feedstock taxes. Superfund’s liabilit y standard is such that Potentially Responsible Parties (PRPs) may pay the entire cost of clean-up at sites, even though they may be responsible for only a fraction of the waste.
Title III of the 1986 SARA amendments (also known as Emergency Response and Community Right-to-Know Act, EPCRA) requires all manufacturing facilit ies, including pharmaceutical facilit ies, to report annual information to the public about stored toxic substances as well as release of these substances into the environment (42 U.S.C. 9601). This is known as the Toxic Release Inventory (TRI). EPCRA also establishes requirements for federal, state, and local governments regarding emergency planning. In 1994, over 300 more chemicals were added to the list of chemicals for which reporting is required.
Toxic Substances Control Act (TSCA)
The pharmaceutical industry is specifically excluded from some of the requirements of TSCA. Any drugs manufactured, processed, and distributed in commerce are excluded by definition from the Inventory Reporting Regulations (40 CFR Part 710.4(c)) and the Pre-Manufacturing Notice requirements (40 CFR 720.30(a)) of TSCA.
Sector Notebook Project 113 September 1997

Pharmaceutical Industr y Federal Statutes and Regulations
VI .C. Pending and Proposed Regulatory Requir ements
Clean Air Act (CAA)
Under the Clean Air Act, National Emissions Standards for Hazardous Air Pollutants (NESHAPS) are being developed for the pharmaceutical manufacturing industry.
Clean Water Act (CWA)
As part of the Clean Water Act revision process, the effluent guidelines for the pharmaceutical industry (40 CFR 439) are currently being revised and reviewed. A major part of the review considers the inclusion of limitations for toxic and non-conventional volatile organic pollutants. Additionally, the 1983 New Source Performance Standards (NSPS) for conventional pollutants will also be reevaluated.
Sector Notebook Project 114 September 1997

Pharmaceutical Industr y Federal Statutes and Regulations
VI .D. Other Federal Regulations Affecting the Pharmaceutical Industr y
Food and Drug Administration (FDA)
The Food and Drug Administration (FDA) is part of the Department of Health and Human Services. FDA has the statutory authority to regulate a wide range of products such as prescription and over-the-counter drugs, foods, biologics (e.g.,blood plasma, vaccines), medical devices (e.g., needles, heart valves), veterinary drugs, cosmetics and consumer goods that emit radiation. This authority has been granted to FDA by Congress under various laws including the Federal Food, Drug and Cosmetic Act and the Public Health Service Act.
There are five Centers within FDA that deal with FDA-regulated articles: Center for Drug Evaluation and Research (CDER), Center for Biologics Evaluation and Research (CBER), Center for Veterinary Medicine (CVM), Center for Devices and Radiological Health (CDRH), and Center for Food Safety and Applied Nutrit ion (CFSAN). The Centers review scientific information provided by persons wishing to place FDA-regulated articles into interstate commerce in order to determine whether regulatory requirements are met. FDA has offices throughout the U.S. where testing of FDA-regulated articles is performed and where investigators are based. Investigators go to U.S. and foreign manufacturing facilit ies and other types of facilit ies involved in FDA-regulated activit ies to verify that they are in compliance with FDA regulations.
FDA’s general approach toregulating various articles is similar, however, due to the diverse nature of these products, there are regulatory requirements tailored to each type of FDA-regulated article. Below is a summary of information relating to the type of products regulated by CDER. Additional information on other FDA-regulated articles may be located in 21 CFR or by contacting FDA directly.
The manufacturing facilit ies that produce drugs for human use are regulated by CDER. The methods, facilit ies, and controls used for the manufacture, processing, and packing of a drug are reviewed by FDA to determine whether they are adequate to ensure and preserve the drug’s identity, strength, quality and purity. These characteristics are critical to ensure the safety and efficacy of a drug for human use. CDER conducts a scientific review of manufacturing methods and process controls for the drug substance and drug product. Field investigators conduct on-site reviews to verify the accuracy of the information submitted to CDER and to determine facilit y compliance with FDA’s Good Manufacturing Practices (GMPs).
FDA’s review of a pharmaceutical facilit y does not include auditing compliance with regulations pertaining to the protection of the environment.
Sector Notebook Project 115 September 1997

Pharmaceutical Industr y Federal Statutes and Regulations
However, in accordance with the National Environmental Policy Act of 1969 (NEPA), which requires all Federal agencies to assess the environmental impacts of their actions, CDER has integrated the consideration of the environmental impacts of approving drug product applications into its regulatory process (21 CFR Part 25). When an environmental review under NEPA is required, the review focuses on the environmental impacts of consumer use and disposal of the drug and is based on information submitted by the manufacturers, or on a manufacturer’s certification that an application falls within an established category of applications excluded from the requirement to submit information.
After the original approval from CDER, an applicant may wish or need to make changes in the method of manufacture, testing, etc. described in their application. An applicant is required to notify FDA about each change in each condition established in an approved application (e.g., ingredients, solvents, processes) beyond the variations already provided for in the application (21 CFR §314.70(a)). Depending on the type of change, the applicant notifies FDA about it in (1) a supplement requiring FDA approval before the change is made (§314.70(b)), (2) a supplement for changes that may be made before FDA approval (§314.70(c)), or (3) an annual report (§314.70(d)). Changes requiring FDA approval before they are made may include changes in the synthesis of the drug product or changes in solvents; the addition or deletion of an ingredient; and changes in the method of manufacture or in-process control of the drug product manufacturing process. The regulations specify the method of reporting certain changes. CDER also provides additional guidance on the method of reporting changes and documentation needed to support changes in guidance for industry (e.g., “Guidance for Industry, Immediate Release Solid Oral Dosage Forms, Scale-Up and Post Approval Changes: Chemistry Manufacturing and Controls, In Vitro Dissolution Testing and In Vivo Bioequivalence Documentation,” November 1995).
The changes in a manufacturing process that a manufacturer may wish to undertake to prevent or reduce pollution would most likely be reported in a supplement requiring FDA approval before the change could be made (e.g., §§314.70(b)(1)(iv) and 314.70(b)(2)(v)). Changes such as these often require the manufacturer, before submitting the supplemental applicationto the FDA, to generate data that demonstrate the proposed change does not adversely affect the identity, strength, quality or purity of the drug. An applicant may ask FDA to expedite its review if a delay in making the change would impose an extraordinary hardship on the applicant (§314.70(b)). For changes relating to pollution prevention, “expedited review” is typically reserved for those changes mandated by the Federal, State or local environmental protection agencies, which must be accomplished within a specified time frame. The granting of an expedited review does not change the type of documentation that needs to be submitted to CDER to support the change.
Sector Notebook Project 116 September 1997

Pharmaceutical Industr y Federal Statutes and Regulations
Summary of FDA Regulations Applicable to the Pharmaceutical Industry
Statutory Authority
The Federal Food Drug and CosmeticAct, principally Sections 201, 301, 501, 502, 503, 505, 506, 507, 512, 701, 704.
CDER Regulations
21 CFR Parts 300-499
Manufactur ing Information Submittal
Manufacturing Information Submitted to CDER in Investigational New Drug Applications (INDs), New Drug Applications (NDAs), Antibiotic Applications, Abbreviated New Drug Applications (ANDAs), and Abbreviated Antibiotic Drug Applications (AADAs)
INDs: §312.23(a)(7)(i)
Other applications: §§314.50(d)(1)(i) and 314.50(d)(1)(ii)(a)
Reporting Changes in Manufactur ing Methods and Controls to CDER
IND Information amendments: §312.31
Supplements and other changes to an approved application: §314.70
Good Manufacturing Practices (GMPs)
Current Good Manufacturing Practice in Manufacturing, Processing, Packing, or Holding of Drugs; General, Part 210
Current Good Manufacturing Practice for Finished Pharmaceuticals: Part 211
Sector Notebook Project 117 September 1997

Pharmaceutical Industr y Federal Statutes and Regulations
VI .E. Other Statutes and Regulations Affecting the Pharmaceutical Industr y
State Statutes and Regulations
Most states have long-established broad-based environmental regulatory programs. Many of these regulatory schemes were enacted to implement federal programs and have been granted local primacy by the USEPA. Generally, the state programs are allowed to be more restrictive than federal requirements and, in some cases, they are.
Some states with high concentrations of pharmaceutical manufacturing facilit ies, have their own regulations pertaining specifically to the industry. For example, both New York and New Jersey have Reasonably Achievable Control Technology (RACT) requirements for process specific volatile organic compound (VOC) emissions. Other states may have similar requirements under their own State Implementation Plans (SIPs).
International Standards
The U.S. Pharmaceutical industry is largely an international industry in which many companies have manufacturing facilit ies and sales and distribution operations in countries other than the U.S. In addition to U.S. federal statutes and regulations there are international laws, regulations, treaties, conventions and initiatives which are drivers of the environmental programs of pharmaceutical companies. The Basel Convention, ISO 14000 standards, the environmental requirements of NAFTA, and the evolving European Union Directives and Regulations are a few examples of important international environmental standards and programs which affect this industry.
Drug Enforcement Administration Regulations
Pharmaceutical manufacturing operations may also be regulated under the Controlled Substances Act. This Act regulates the manufacture, distribution, and dispensing of controlled substances and is enforced by the Drug Enforcement Administration (DEA). Examples of pharmaceutical products regulated under this Act include Demerol, Percodan, Ritalin, Valium, and Darvon. A list of controlled substances can be found in �1308 of 21 CFR.
Sector Notebook Project 118 September 1997

Pharmaceutical Industr y Federal Statutes and Regulations
The statute provides “closed” system for virtually every person who legitimately handles controlled substances, other than the ultimate user. As a means of controlling the distributionof regulatedproducts, DEA sets quotas limit ing the quantit ies which may be manufactured or produced to that amount which is necessary to meet the legitimate needs of the United States. The regulations set specific requirements for how such compounds are handled and stored at a manufacturing facilit y. In addition, when disposed of, these substances must be destroyed in the presence of DEA personnel in accordance with the regulations found in 21 CFR, Section 1307.21.
Sector Notebook Project 119 September 1997

Page 116 intentionally left blank.

Pharmaceutical Industr y Compliance and Enforcement History
VI I . COMPLI ANCE AND ENFORCEMENT HI STORY
Background
Until recently, EPA has focused much of its attention on measuring compliance with specific environmental statutes. This approach allows the Agency to track compliance with the Clean Air Act, the Resource Conservation and Recovery Act, the Clean Water Act, and other environmental statutes. Within the last several years, the Agency has begun to supplement single-media compliance indicators with facilit y-specific , multimedia indicators of compliance. In doing so, EPA is in a better position to track compliance with all statutes at the facilit y level, and within specific industrial sectors.
A major step in building the capacity to compile multimedia data for industrial sectors was the creation of EPA's Integrated Data for Enforcement Analysis (IDEA) system. IDEA has the capacity to “read into” the Agency's single-media databases, extract compliance records, and match the records to individual facilit ies. The IDEA system can match Air, Water, Waste, Toxics/Pesticides/EPCRA, TRI, and Enforcement Docket records for a given facilit y, and generate a list of historical permit, inspection, and enforcement activity. IDEA also has the capabilit y to analyze data by geographic area and corporate holder. As the capacity to generate multimedia compliance data improves, EPA will make available more in-depth compliance and enforcement information. Additionally, sector-specific measures of success for compliance assistance efforts are under development.
Compliance and Enforcement Profile Description
Using inspection, violation, and enforcement data from the IDEA system, this section provides information regarding the historical compliance and enforcement activity of this sector. In order to mirror the facilit y universe reported in the Toxic Chemical Profile, the data reported within this section consists of records only from the TRI reporting universe. With this decision, the selection criteria are consistent across sectors with certain exceptions. For the sectors that do not normally report to the TRI program, data have been provided from EPA's Facilit y Indexing System (FINDS) which tracks facilit ies in all media databases. Please note, in this section, EPA does not attempt to define the actual number of facilit ies that fall within each sector. Instead, the section portrays the records of a subset of facilit ies within the sector that are well defined within EPA databases.
As a check on the relative size of the full sector universe, most notebooks contain an estimated number of facilit ies within the sector according to the Bureau of Census (See Section II). With sectors dominated by small businesses, such as metal finishers and printers, the reporting universe within
Sector Notebook Project 121 September 1997

Pharmaceutical Industr y Compliance and Enforcement History
the EPA databases may be small in comparison to Census data. However, the group selected for inclusion in this data analysis section should be consistent with this sector's general makeup.
Following this introduction is a list defining each data column presented within this section. These values represent a retrospective summary of inspections and enforcement actions, and solely reflect EPA, State, and local compliance assurance activities that have been entered into EPA databases. To identify any changes in trends, the EPA ran two data queries, one for the five calendar years (April 1, 1992 to March 31, 1997) and the other for the most recent twelve-month period (April 1, 1996 to March 31, 1997). The five-year analysis gives an average level of activity for that period for comparison to the more recent activity.
Because most inspections focus on single-media requirements, the data queries presented in this section are taken from single media databases. These databases do not provide data on whether inspections are state/local or EPA-led. However, the table breaking down the universe of violations does give the reader a crude measurement of the EPA's and states' efforts within each media program. The presented data illustrate the variations across EPA Regions for certain sectors.a This variation may be attributable to state/local data entry variations, specific geographic concentrations, proximity to population centers, sensitive ecosystems, highly toxic chemicals used in production, or historical noncompliance. Hence, the exhibited data do not rank regional performance or necessarily reflect which regions may have the most compliance problems.
Compliance and Enforcement Data Definitions
General Definitions
Facility I ndexing System (FINDS) -- this system assigns a common facilit y number to EPA single-media permit records. The FINDS identification number allows EPA to compile and review all permit, compliance, enforcement and pollutant release data for any given regulated facilit y.
Integrated Data for Enforcement Analysis (IDEA) -- is a data integration system that can retrieve information from the major EPA program office databases. IDEA uses the FINDS identification number to link separate data records from EPA’s databases. This allows retrieval of records from across
a EPA Regions include the following states: I (CT, MA, ME, RI, NH, VT); II (NJ, NY, PR, VI); III (D C, DE, MD, PA, VA, WV); IV (AL, FL, GA, KY, MS, NC, SC, TN); V (IL, IN, MI, MN, OH, WI); VI (AR, LA, NM, OK, TX); VII (IA , KS, MO, NE); VIII (CO, MT, ND, SD, UT, WY); IX (AZ, CA, HI, NV, Pacific Trust Territories); X (AK, ID, OR, WA).
Sector Notebook Project 122 September 1997
Pharmaceutical Industr y Compliance and Enforcement History
media or statutes for any given facilit y, thus creating a �master list” of records for that facilit y. Some of the data systems accessible through IDEA are: AIRS (Air Facilit y Indexing and Retrieval System, Office of Air and Radiation), PCS (Permit Compliance System, Office of Water), RCRIS (Resource Conservation and Recovery Information System, Office of Solid Waste), NCDB (National Compliance Data Base, Office of Prevention, Pesticides, and Toxic Substances), CERCLIS (Comprehensive Environmental and Liabilit y Information System, Superfund), and TRIS (Toxic Release Inventory System). IDEA also contains information from outside sources such as Dun and Bradstreet and the Occupational Safety and Health Administration (OSHA). Most data queries displayed in notebook sections IV and VII were conducted using IDEA.
Data Table Column Heading Definit ions
Facilities in Search -- are based on the universe of TRI reporters within the listed SIC code range. For industries not covered under TRI reporting requirements (metal mining, nonmetallic mineral mining, electric power generation, ground transportation, water transportation, and dry cleaning), or industries in which only a very small fraction of facilit ies report to TRI (e.g., printing), the notebook uses the FINDS universe for executing data queries. The SIC code range selected for each search is defined by each notebook's selected SIC code coverage described in Section II.
Facilities Inspected --- indicates the level of EPA and state agency inspections for the facilit ies in this data search. These values show what percentage of the facilit y universe is inspected in a one-year or five-year period.
Number of Inspections -- measures the total number of inspections conducted in this sector. An inspection event is counted each time it is entered into a single media database.
Average Time Between Inspections -- provides an average length of time, expressed in months, between compliance inspections at a facilit y within the defined universe.
Facilities with One or More Enforcement Actions -- expresses the number of facilit ies that were the subject of at least one enforcement action within the defined time period. This category is broken down further into federal and state actions. Data are obtained for administrative, civil/ judicial, and criminal enforcement actions. Administrative actions include Notices of Violation (NOVs). A facilit y with multiple enforcement actions is only counted once in this column, e.g., a facilit y with 3 enforcement actions counts as 1 facilit y.
Sector Notebook Project 123 September 1997

--
Pharmaceutical Industr y Compliance and Enforcement History
Total Enforcement Actions -- describes the total number of enforcement actions identified for an industrial sector across all environmental statutes. A facilit y with multiple enforcement actions is counted multiple times, e.g., a facilit y with 3 enforcement actions counts as 3.
State Lead Actions shows what percentage of the total enforcement actions are taken by state and local environmental agencies. Varying levels of use by states of EPA data systems may limit the volume of actions recorded as state enforcement activity. Some states extensively report enforcement activities into EPA data systems, while other states may use their own data systems.
Federal Lead Actions -- shows what percentage of the total enforcement actions are taken by the United States Environmental Protection Agency. This value includes referrals fromstate agencies. Many of these actions result from coordinated or joint state/federal efforts.
Enforcement to Inspection Rate -- is a ratio of enforcement actions to inspections, and is presented for comparative purposes only. This ratio is a rough indicator of the relationship between inspections and enforcement. It relates the number of enforcement actions and the number of inspections that occurred within the one-year or five-year period. This ratio includes the inspections and enforcement actions reported under the Clean Water Act (CWA), the Clean Air Act (CAA) and the Resource Conservation and Recovery Act (RCRA). Inspections and actions from the TSCA/FIFRA/ EPCRA database are not factored into this ratio because most of the actions taken under these programs are not the result of facilit y inspections. Also, this ratio does not account for enforcement actions arising from non-inspection compliance monitoring activit ies (e.g., self- reported water discharges) that can result in enforcement action within the CAA, CWA, and RCRA.
Facilities with One or M ore Violations Identified -- indicates the percentage of inspected facilities having a violation identified in one of the following data categories: In Violation or Significant Violation Status (CAA); Reportable Noncompliance, Current Year Noncompliance, Significant Noncompliance (CWA); Noncompliance and Significant Noncompliance (FIFRA, TSCA, and EPCRA); Unresolved Violation and Unresolved High Priority Violation (RCRA). The values presented for this column reflect the extent of noncompliance within the measured time frame, but do not distinguish between the severity of the noncompliance. Violation status may be a precursor to an enforcement action, but does not necessarily indicate that an enforcement action will occur.
Sector Notebook Project 124 September 1997

Pharmaceutical Industr y Compliance and Enforcement History
Media Breakdown of Enforcement Actions and Inspections -- four columns identify the proportion of total inspections and enforcement actions within EPA Air, Water, Waste, and FIFRA/TSCA/EPCRA databases. Each column is a percentage of either the �Total Inspections,” or the �Total Actions” column.
VII .A. Pharmaceutical Industr y Compliance History
Table 20 provides an overview of the reported compliance and enforcement data for the pharmaceutical industry over the past five years (April 1992 to April 1997). These data are also broken out by EPA Region thereby permitting geographical comparisons. A few points evident from the data are listed below.
�Region II has more than twice the number of pharmaceutical facilit ies than any other Region and more than half of all inspections nationally were carried out in this Region. The high rate of inspections in relation to the number of facilit ies is reflected in the Region’s relatively low average time between inspections (6 months)
�Regions VI had only five pharmaceutical facilit ies (identified by the IDEA system) and a relatively high average time between inspections. However, in the past five years four enforcement actions were brought against facilit ies in the Region, giving it one of the highest enforcement to inspection rates.
�Region X had only one pharmaceutical facilit y identified by the IDEA system. In the past five years this facilit y was inspected twice and had two enforcement action brought against it.
Sector Notebook Project 125 September 1997

--
--
--
Sector N
otebook Project Table 20: Five-Year Enforcement and Compliance Summary for the Pharmaceutical Industr y
A B C D E F G H I J Region Facilitie s
in Search
Facilitie s Inspecte
d
Number of Inspections
Average Months Between
Inspections
Facilitie s with 1 or
More Enforcement
Actions
Total Enforcemen
t Actions
Percent State Lead
Actions
Percent Federal
Lead Actions
Enforcement to Inspection
Rate
I 8 5 11 44 0 0 0% 0%
II 60 53 624 6 21 95 84% 16% 0.15
III 18 16 111 10 3 3 100% 0% 0.03
IV 24 17 227 6 4 12 83% 17% 0.05
V 22 16 143 9 4 5 60% 40% 0.03
VI 5 5 17 18 1 4 0% 100% 0.24
VII 12 8 37 19 1 1 100% 0% 0.03
VIII 6 5 22 16 0 0 0% 0%
IX 8 3 7 69 0 0 0% 0%
X 1 1 2 30 1 2 50% 50% 1.00
TOTA L
164 129 1,201 8 35 122 80% 20% 0.10
Pharm
aceutical Industry
126S
eptember 1997
Com
pliance and Enforcement H
istory

Pharmaceutical Industr y Compliance and Enforcement History
VI I .B. Comparison of Enforcement Activity B etween Selected Industr ies
Tables 21 and 22 allow the compliance history of the pharmaceutical industry to be compared with the other industries covered by the industry sector notebooks. Comparisons between Tables 21 and 22 permit the identification of trends in compliance and enforcement records of the industry by comparing data covering the last five years to that of the past year. Some points evident from the data are listed below.
�The pharmaceutical industry had one of the highest inspection rates as indicated by its relatively low average time between inspections (8 months) compared to other industries.
�Compared to other sectors, the pharmaceutical industry had a relatively high enforcement to inspection rate (0.07) and a relatively high percent of facilit ies inspected with violations (105 percent).
Tables 23 and 24 provide a more in-depth comparison between the pharmaceuticalindustry and other sectors by breaking out the compliance and enforcement data by environmental statute. As in Tables 21 and 22, the data cover the last five years (Table 23) and the previous year (Table 24) to facilit ate the identification of recent trends. A few points evident from the data are listed below.
�Over the past five years, about 80 percent of the industry’s inspections were for CAA and RCRA. Over the past year CAA and RCRA inspections accounted for almost 90 percent of inspections. This trend is primarily due to an increase in CAA inspections and a decrease in CWA and FIFRA/TSCA/EPCRA/Other inspections.
�The percentage of CAA enforcement actions increased from 49 percent over the past five years to 71 percent in the past year. At the same time the percentage of CWA enforcement actions decreased from 25 percent to 14 percent.
Sector Notebook Project 127 September 1997

Pharmaceutical Industr y Compliance and Enforcement History
Tab
le 2
1: F
ive-
Yea
r En
forc
emen
t and
Com
plia
nce
Sum
mar
y fo
r S
elec
ted
Indu
stri
es
J E
nfor
cem
ent
to
Insp
ecti
on
Rat
e
0.0
7
0.0
4
0.0
5
0.05
0.06
0.1
0
0.0
4
0.1
0
0.0
6
0.0
8
0.0
9
0.10
0.1
1
0.0
8
0.2
5
0.0
6
0.0
8
0.0
7
0.0
8
0.1
1
0.0
8
0.0
6
0.0
7
0.1
3
0.0
6
0.0
9
0.1
0
0.0
6
0.0
2
I P
erce
nt
Fed
eral
Le
ad
Act
ions
47
%
11
%
21
%
23%
10%
30
%
19
%
20
%
12
%
26
%
24
%
20%
35
%
26
%
32
%
18
%
25
%
29
%
29
%
22
%
25
%
20
%
18
%
16
%
16
%
39
%
12
%
24
%
5%
H
Per
cent
S
tate
Lea
d A
ctio
ns
53
%
89
%
79
%
77%
90%
70
%
81
%
80
%
88
%
74
%
76
%
80%
65
%
74
%
68
%
82
%
75
%
71
%
71
%
78
%
75
%
80
%
82
%
84
%
84
%
61
%
88
%
76
%
95
%
G
Tot
al
Enf
orce
men
t A
ctio
ns 11
1
13
2
30
9
622 83
26
5
91
47
8
42
8
23
5
21
9
122
46
8
10
2
76
3
27
6
27
7
30
5
19
1
17
4
60
0
25
1
41
3
32
77
4
70
97
78
9
66
F
Fac
ilitie
s w
ith 1
or
Mor
e E
nfor
cem
ent
Act
ions
63
88
14
9
385 53
13
4
65
15
0
23
8
89
93
35
15
3
47
12
4
17
8
97
12
1
11
3
68
36
5
15
0
25
3
20
37
5
36
48
40
3
55
E
Ave
rage
M
onth
s B
etw
een
Insp
ecti
ons 4
6
52
46
25
15
15
13
6 46
9 8 8 6 12
3 25
11
5 16
7 22
17
13
9 36
38
27
14
95
D
Num
ber
of
Insp
ecti
ons
1,6
00
3,7
48
6,0
71
12,8
26
1,46
5
2,7
67
2,3
79
4,6
30
7,6
91
3,0
87
2,4
30
1,20
1
4,2
94
1,2
93
3,0
81
4,3
83
3,4
74
4,4
76
2,5
35
1,6
40
7,9
14
4,5
00
5,9
12
24
3
12
,90
4
81
6
97
3
14
,21
0
3,8
13
C
Fac
ilitie
s In
spec
ted
37
8
74
1
1,9
02
2,80
3
267
47
3
38
6
43
0
2,0
92
28
6
26
3
129
35
5
16
4
14
8
98
1
38
8
27
5
42
4
16
1
1,8
58
86
3
92
7
37
3,2
63
19
2
23
1
2,1
66
2,3
60
B
Fac
iliti
es
in
Sear
ch
1,2
32
3,2
56
4,6
76
5,25
6
355
71
2
49
9
48
4
5,8
62
44
1
32
9
164
42
5
26
3
15
6
1,8
18
61
5
34
9
66
9
20
3
2,9
06
1,2
50
1,2
60
44
7,7
86
51
4
44
4
3,2
70
6,0
63
A
Indu
stry
Sec
tor
Met
al M
inin
g
Coa
l Min
ing
Oil
and
Gas
Ext
ract
ion
Non
-Met
allic
Min
eral
Min
ing
Tex
tiles
Lum
ber
and
Woo
d
Furn
iture
Pulp
and
Pap
er
Prin
ting
Inor
gani
c C
hem
ical
s
Res
ins
and
Man
ma
de F
iber
s
Pha
rmac
euti
cals
Org
anic
Che
mic
als
Agr
icul
tura
l Che
mic
als
Petr
oleu
m R
efin
ing
Rub
ber
and
Pla
stic
Ston
e, C
lay,
Gla
ss a
nd C
oncr
ete
Iron
and
Ste
el
Met
al C
astin
gs
Non
ferr
ous
Met
als
Fabr
ica
ted
Met
al P
rodu
cts
Ele
ctro
nics
Aut
omob
ile A
ssem
bly
Ship
build
ing
and
Rep
air
Gro
und
Tra
nspo
rtat
ion
Wat
er T
rans
port
atio
n
Air
Tra
nspo
rtat
ion
Foss
il F
uel E
lect
ric
Pow
er
Dry
Cle
anin
g
Sector Notebook Project 128 September 1997

Pharm
aceutical IndustryC
ompliance and Enforcem
ent History
Sector N
otebook Project
Septem
ber 1997129
Table 22: One-Year Enforcement and Compliance Summary for Selected Industr ies
A C D E F G HFacilitie s with 1 or More
ViolationsFacilitie s with 1 or more
Enforcement Actions TotalEnforcement
ActionsIndustry SectorFacilitie s in
SearchFacilitie sInspected
Number ofInspections Number Percent* Number Percent*
Enforcement toInspection Rate
Metal Mining 1,232 142 211 102 72% 9 6% 10 0.05
Coal Mining 3,256 362 765 90 25% 20 6% 22 0.03
Oil and Gas Extraction 4,676 874 1,173 127 15% 26 3% 34 0.03
Non-Metallic Mineral Mining 5,256 1,481 2,451 384 26% 73 5% 91 0.04
Textiles 355 172 295 96 56% 10 6% 12 0.04
Lumber and Wood 712 279 507 192 69% 44 16% 52 0.10
Furniture 499 254 459 136 54% 9 4% 11 0.02
Pulp and Paper 484 317 788 248 78% 43 14% 74 0.09
Printing 5,862 892 1,363 577 65% 28 3% 53 0.04
Inorganic Chemicals 441 200 548 155 78% 19 10% 31 0.06
Resins and Manmade Fibers 329 173 419 152 88% 26 15% 36 0.09
Pharmaceuticals 164 80 209 84 105% 8 10% 14 0.07
Organic Chemicals 425 259 837 243 94% 42 16% 56 0.07
Agricultural Chemicals 263 105 206 102 97% 5 5% 11 0.05
Petroleum Refining 156 132 565 129 98% 58 44% 132 0.23
Rubber and Plastic 1,818 466 791 389 83% 33 7% 41 0.05
Stone, Clay, Glass and Concrete 615 255 678 151 59% 19 7% 27 0.04
Iron and Steel 349 197 866 174 88% 22 11% 34 0.04
Metal Castings 669 234 433 240 103% 24 10% 26 0.06
Nonferrous Metals 203 108 310 98 91% 17 16% 28 0.09
Fabricated Metal 2,906 849 1,377 796 94% 63 7% 83 0.06
Electronics 1,250 420 780 402 96% 27 6% 43 0.06
Automobile Assembly 1,260 507 1,058 431 85% 35 7% 47 0.04
Shipbuilding and Repair 44 22 51 19 86% 3 14% 4 0.08
Ground Transportation 7,786 1,585 2,499 681 43% 85 5% 103 0.04
Water Transportation 514 84 141 53 63% 10 12% 11 0.08
Air Transportation 444 96 151 69 72% 8 8% 12 0.08
Fossil Fuel Electric Power 3,270 1,318 2,430 804 61% 100 8% 135 0.06
Dry Cleaning 6,063 1,234 1,436 314 25% 12 1% 16 0.01
*Percentages in Columns E and F are based on the number of facilities inspected (Column C). e violations and actions canoccur without a facility inspection.
Table 23: Five-Year Inspection and Enforcement Summary by Statute for Selected Industr ies
Industry Sector Facilit iesInspected
TotalInspections
TotalEnforcement
Actions
Clean Air Act Clean Water Act RCRAFIFRA/TSCA/EPCRA/Other
% of TotalInspections
% ofTotal
Actions
% of TotalInspections
% ofTotal
Actions
% of TotalInspections
% ofTotal
Actions
% of TotalInspections
% ofTotal
Actions
Metal Mining 378 1,600 111 39% 19% 52% 52% 8% 12% 1% 17%
Coal Mining 741 3,748 132 57% 64% 38% 28% 4% 8% 1% 1%
Oil and Gas Extraction 1,902 6,071 309 75% 65% 16% 14% 8% 18% 0% 3%
Non-Metallic Mineral Mining 2,803 12,826 622 83% 81% 14% 13% 3% 4% 0% 3%
Textiles 267 1,465 83 58% 54% 22% 25% 18% 14% 2% 6%
Lumber and Wood 473 2,767 265 49% 47% 6% 6% 44% 31% 1% 16%
Furniture 386 2,379 91 62% 42% 3% 0% 34% 43% 1% 14%
Pulp and Paper 430 4,630 478 51% 59% 32% 28% 15% 10% 2% 4%
Printing 2,092 7,691 428 60% 64% 5% 3% 35% 29% 1% 4%
Inorganic Chemicals 286 3,087 235 38% 44% 27% 21% 34% 30% 1% 5%
Resins and Manmade Fibers 263 2,430 219 35% 43% 23% 28% 38% 23% 4% 6%
Pharmaceuticals 129 1,201 122 35% 49% 15% 25% 45% 20% 5% 5%
Organic Chemicals 355 4,294 468 37% 42% 16% 25% 44% 28% 4% 6%
Agricultural Chemicals 164 1,293 102 43% 39% 24% 20% 28% 30% 5% 11%
Petroleum Refining 148 3,081 763 42% 59% 20% 13% 36% 21% 2% 7%
Rubber and Plastic 981 4,383 276 51% 44% 12% 11% 35% 34% 2% 11%
Stone, Clay, Glass and Concrete 388 3,474 277 56% 57% 13% 9% 31% 30% 1% 4%
Iron and Steel 275 4,476 305 45% 35% 26% 26% 28% 31% 1% 8%
Metal Castings 424 2,535 191 55% 44% 11% 10% 32% 31% 2% 14%
Nonferrous Metals 161 1,640 174 48% 43% 18% 17% 33% 31% 1% 10%
Fabricated Metal 1,858 7,914 600 40% 33% 12% 11% 45% 43% 2% 13%
Electronics 863 4,500 251 38% 32% 13% 11% 47% 50% 2% 7%
Automobile Assembly 927 5,912 413 47% 39% 8% 9% 43% 43% 2% 9%
Shipbuilding and Repair 37 243 32 39% 25% 14% 25% 42% 47% 5% 3%
Ground Transportation 3,263 12,904 774 59% 41% 12% 11% 29% 45% 1% 3%
Water Transportation 192 816 70 39% 29% 23% 34% 37% 33% 1% 4%
Air Transportation 231 973 97 25% 32% 27% 20% 48% 48% 0% 0%
Fossil Fuel Electric Power 2,166 14,210 789 57% 59% 32% 26% 11% 10% 1% 5%
Dry Cleaning 2,360 3,813 66 56% 23% 3% 6% 41% 71% 0% 0%
B
Percentages can exceed 100% becaus

Pharmaceutical Industr y Compliance and Enforcement History
Tab
le 2
4: O
ne-Y
ear
Insp
ectio
n an
d En
forc
emen
t Sum
mar
y by
Sta
tute
for
Sel
ecte
d In
dust
ries
FIF
RA
/TS
CA
/ E
PC
RA
/Oth
er
% o
f T
otal
A
ctio
ns
30
%
0%
0%
0%
0%
40
%
9%
1%
0%
6%
5%
0%
0%
9%
10
%
0%
0%
0%
0%
7%
0%
5%
0%
0%
1%
9%
0%
0%
0%
% o
f To
tal
Insp
ecti
ons
0%
0%
0%
0%
0%
0%
0%
0%
0%
0%
0%
0%
0%
0%
0%
0%
0%
0%
0%
0%
0%
0%
0%
0%
0%
0%
0%
0%
0%
RC
RA
% o
f T
otal
A
ctio
ns
30
%
5%
24
%
2%
8%
25
%
45
%
7%
23
%
25
%
5%
14%
34
%
36
%
15
%
23
%
30
%
24
%
35
%
30
%
57
%
53
%
47
%
50
%
44
%
45
%
25
%
5%
38
%
% o
f To
tal
Insp
ecti
ons
8%
4%
9%
3%
17%
44
%
32
%
14
%
33
%
39
%
38
%
45%
47
%
30
%
34
%
35
%
28
%
26
%
30
%
41
%
43
%
43
%
41
%
35
%
26
%
38
%
57
%
9%
30
%
Cle
an W
ater
Act
% o
f T
otal
A
ctio
ns
40
%
14
%
9%
9%
17%
5%
0%
19
%
0%
9%
38
%
14%
13
%
0%
8%
13
%
7%
29
%
8%
20
%
2%
5%
6%
50
%
10
%
36
%
42
%
21
%
6%
% o
f To
tal
Insp
ecti
ons
40
%
40
%
10
%
10%
17%
6%
2%
32
%
4%
26
%
24
%
11%
13
%
22
%
17
%
10
%
10
%
23
%
10
%
15
%
11
%
14
%
7%
11
%
11
%
24
%
15
%
32
%
1%
Cle
an A
ir A
ct
% o
f T
otal
A
ctio
ns
0%
82
%
68
%
89%
75%
30
%
45
%
73
%
77
%
59
%
51
%
71%
54
%
55
%
67
%
64
%
63
%
47
%
58
%
43
%
41
%
37
%
47
%
0%
46
%
9%
33
%
73
%
56
%
% o
f T
otal
In
spec
tion
s
52
%
56
%
82
%
87%
66%
51
%
66
%
54
%
63
%
35
%
38
%
43%
40
%
48
%
49
%
55
%
62
%
52
%
60
%
44
%
46
%
44
%
53
%
54
%
64
%
38
%
28
%
59
%
69
%
Tot
al
Enf
orce
men
t A
ctio
ns
10
22
34
91
12
52
11
74
53
31
36
14
56
11
13
2
41
27
34
26
28
83
43
47
4
10
3
11
12
13
5
16
Tot
al
Insp
ecti
ons
21
1
76
5
1,1
73
2,45
1
295
50
7
45
9
78
8
1,3
63
54
8
41
9
209
83
7
20
6
56
5
79
1
67
8
86
6
43
3
31
0
1,3
77
78
0
1,0
58
51
2,4
99
14
1
15
1
2,4
30
1,4
36
Fac
ilitie
s In
spec
ted
14
2
36
2
87
4
1,48
1
172
27
9
25
4
31
7
89
2
20
0
17
3
80
25
9
10
5
13
2
46
6
25
5
19
7
23
4
10
8
84
9
42
0
50
7
22
1,5
85
84
96
1,3
18
1,2
34
Indu
stry
Sec
tor
Met
al M
inin
g
Coa
l Min
ing
Oil
and
Gas
Ext
ract
ion
Non
-Met
allic
Min
eral
Min
ing
Tex
tiles
Lum
ber
and
Woo
d
Furn
iture
Pulp
and
Pap
er
Prin
ting
Inor
gani
c C
hem
ical
s
Res
ins
and
Man
ma
de F
iber
s
Pha
rmac
euti
cals
Org
anic
Che
mic
als
Agr
icul
tura
l Che
mic
als
Petr
oleu
m R
efin
ing
Rub
ber
and
Pla
stic
Ston
e, C
lay,
Gla
ss a
nd C
oncr
ete
Iron
and
Ste
el
Met
al C
astin
gs
Non
ferr
ous
Met
als
Fabr
ica
ted
Met
al
Ele
ctro
nics
Aut
omob
ile A
ssem
bly
Ship
build
ing
and
Rep
air
Gro
und
Tra
nspo
rtat
ion
Wat
er T
rans
port
atio
n
Air
Tra
nspo
rtat
ion
Foss
il F
uel E
lect
ric
Pow
er
Dry
Cle
anin
g
Sector Notebook Project 130 September 1997

Pharmaceutical Industr y Compliance and Enforcement History
VI I .C. Review of Major Legal Actions
This section provides summary information about major cases that have affected this sector, and Supplementary Environmental Projects (SEPs). SEPs are compliance agreements that reduce a facilit y's stipulated penalty in return for an environmental project that exceeds the value of the reduction. Often, these projects fund pollution prevention activities that can significantly reduce the future pollutant loadings of a facilit y.
VI I .C.1. Review of Major Cases
As indicated in EPA’s Enforcement Accomplishments Report, FY1995 and FY1996 publications, 5 significant enforcement actions were resolved between 1994 and 1996 for the pharmaceutical industry.
In the Matter of Ciba-Geigy, Inc.: On November 7, 1994, Region II issued an administrative consent order to Ciba-Geigy, Inc., assessing a penalty of $130,000 for violations of EPCRA at its Toms River, New Jersey, facilit y. The order was based upon an inspection of Ciba-Geigy’s facilit y that resulted in a sixteen count complaint alleging that Ciba-Geigy failed to report that it used certain of the following: copper compounds; glycol ethers; chromium compounds; cobalt compounds; C.I. Disperse Yellow 3; diethanolamine and ethylene glycol during the calendar years 1988 through 1991.
Ciba-Geigy Superfund Site: On October 18, 1995, Region II issued an administrative order on consent under Sections 104, 107, and 122 of CERCLA to the Ciba-Geigy Corporation. The order requires Ciba-Geigy to perform, under EPA oversight, a feasibilit y study for Operable Unit Two to develop and evaluate remedial alternatives for approximately twenty-one potential source areas of groundwater contamination on the site. The estimated cost of the work that Ciba-Geigy will perform is $20 million. In addition, Ciba-Geigy will also pay all of EPA’s unreimbursed past response costs, $797,000, plus all of EPA’s future response costs, including oversight costs.
The site is on the National Priorities List and located in Toms River, Ocean County, New Jersey. Groundwater at the site is contaminated with organic and inorganic compounds, and emanates from surface and subsurface former disposal areas on the site. Pursuant to a settlement with EPA in 1994, Ciba-Geigy is currently remediating the groundwater contamination. EPA recently completed a baseline public health risk assessment or source area surface soils, as well as a remedial investigation to examine the nature and extent of the contamination in the source areas at the site. In performing the feasibilit y study for the source areas, Ciba-Geigy has agreed to adopt EPA’s risk assessment and remedial investigation report.
Sector Notebook Project 131 September 1997

Pharmaceutical Industr y Compliance and Enforcement History
Takeda Chemical Products USA, Inc. (NC): On August 31, 1995, Region IV entered into a consent agreement/consent order (CACO) resolving claims against Takeda Chemical Products USA, Inc., for violations of RCRA at its vitamin manufacturing plant in Wilmington, North Carolina. As part of a solvent extraction process, Takeda generated a by-product referred to as DAS-fuel, which Takeda intended to burn for energy recovery. Prior to receiving any permits to burn the DAS-fuel, Takeda generated DAS-fuel and stored it on-site for a period in excess of 90 days without a permit or interim status, and later shipped it off-site. EPA determined that the DAS-fuel (essentially spent toluene mixed with DAS water and polymers) was F005 hazardous waste. As a result, on September 24, 1994, Region IV issued a complaint for illegal storage of hazardous waste, failure to make a hazardous waste determination, and failure to manifest the DAS-fuel shipped off-site. The CACO requires Takeda to pay a civil penalty of $99,000, but allows Takeda to bring DAS-fuel back on-site for reprocessing, provided Takeda manages any waste it produces as a result as a hazardous waste.
Abbott Laboratories: A consent agreement and final order was signed in September 1995, concerning Abbott LaboratoriesCorporation’sviolations of RCRA standards applicable to the burning of hazardous waste in boilers and industrial furnaces (BIF) at its North Chicago, Illinois facilit y. Negotiations with Abbott Laboratories after issuance of the complaint in February 1994 resulted in a penalty of $182,654. Abbott also agreed to conduct a supplemental environmental project (SEP) that will allow Abbott to recover and recycle the methylene chloride produced in its manufacturing processes and will reduce fugitive methylene chloride emissions. The SEP involves three separate, albeit similar, operations, replacing “wet” vacuum pump systems with “dry” pumps and high efficiency condensers. The projected cost of the SEP is $480,000.
VII .C.2. Supplementary Envir onmental Projects (SEPs)
Supplemental environmental projects (SEPs) are enforcement options that require the non-compliant facilit y to complete specific projects. Information on SEP cases can be accessed via the internet at EPA’s Enviro$en$e website: http://es.inel.gov/sep.
Sector Notebook Project 132 September 1997

Page 130 intentionally left blank.VIII. COMPLIANCE ACTIVITIES AND INITIATIVES
This section highlights the activit ies undertaken by this industry sector and public agencies to voluntarily improve the sector's environmental performance. These activities include those independently initiated by industrial trade associations. In this section, the notebook also contains a listing and description of national and regional trade associations.
VIII. A. Sector-related Programs and Activities
The Pharmaceutical Research and Manufacturers of America (PhRMA) and EPA are considering developing compliance and regulations guides, concerning the interactions of EPA and FDA regulations for the pharmaceutical industry.
VIII. B. EPA Voluntary Programs
33/50 Program
The 33/50 Program is a ground breaking program that has focused on reducing pollution from seventeen high-priority chemicals through voluntary partnerships with industry. The program's name stems from its goals: a 33% reduction in toxic releases and transfers by 1992, and a 50% reduction by 1995, against a baseline of 1.5 billio n pounds of releases and transfers in 1988. The results have been impressive: 1,300 companies have joined the 33/50 Program (representing over 6,000 facilit ies) and have reached the national targets a year ahead of schedule. The 33% goal was reached in 1991, and the 50% goal -- a reduction of 745 million pounds of toxic wastes -- was reached in 1994. The 33/50 Program can provide case studies on many of the corporate accomplishments in reducing waste.
Table 25 lists those companies participating in the 33/50 program that reported the SIC codes 2833 and 2834 to TRI. Some of the companies shown also listed facilit ies that are not producing pharmaceuticals. The number of facilit ies within each company that are participating in the 33/50 program and that report pharmaceutical SIC codes is shown. Where available and quantifiable against 1988 releases and transfers, each company’s 33/50 goals for 1995 and the actual total releases and transfers and percent reduction between 1988 and 1994 are presented. At the time of publication of this document (August 1997) 1995 33/50 Program TRI data were not available.
Table 20 shows that 34 companies comprised of 160 facilit ies reporting SIC 2833 and 2834 are participated in the 33/50 program. For those companies shown with more than one pharmaceutical manufacturing facilit y, all facilit ies may not be participating in 33/50. The 33/50 goals shown for companies with multiple pharmaceutical facilit ies, however, are company-wide, potentially aggregating more than one facilit y and facilities not carrying out pharmaceutical operations. In addition to company-wide goals, individual
Pharmaceutical Industr y Activities and Initiatives
facilit ies within a company may have their own 33/50 goals or may be specifically listed as not participating in the 33/50 program. Since the actual percent reductions shown in the last column apply to all of the companies’ pharmaceutical manufacturing facilit ies and only pharmaceutical manufacturing facilit ies, direct comparisons to those company goals incorporating non-pharmaceutical facilities or excluding certain facilit ies may not be possible. For information on specific facilit ies participating in 33/50, contact David Sarokin (202-260-6907) at the 33/50 Program Office.
Sector Notebook Project 134 September 1997

--
--
Pharmaceutical Industr y Activities and Initiatives
Table 25: Pharmaceutical Industry Part icipation in the 33/50 Program Parent Company (Headquarters Location)
Company-Owned Pharmaceutical
Facilities Reporting 33/50
Chemicals
Company-wide % Reduction Goal1 (1988-
1995)
1988 TRI Releases and Transfers of
33/50 Chemicals (pounds)
1994 TRI Releases and Transfers of
33/50 Chemicals (pounds)
Actual % Reduction for
Pharmaceutical Facilities (1988
- 1994)
3M Minnesota Mining & Mfg.. Company -St. Paul, MN
2 70 885, 011 194, 850 78
Abbott Laboratories -North Chicago, IL
6 20 3, 017, 869 2, 869, 793 5.0
American Home Products Corporation -Madison ,NJ
19 50 1, 828, 970 930, 992 49
Anabolic Incorporated -Irvine, CA
1 75 39, 602 0 100
Baxter International Inc. -Deerfield, IL
8 80 921, 282 33, 312 96
Boehringer Ingelheim Corp. -Ridgefield, CT
2 50 198, 500 247, 166 -24.5
Bristol-Myers Squibb Co. -New York, NY
15 50 4, 876, 002 2, 305, 269 53
Burroughs Wellcome Co. -Durham, NC
2 26 469, 075 193, 171 59
Ciba-Geigy Company -Tarrytown, NY
14 50 2, 613, 266 1, 179, 471 55
Coating Place Incorporated -Verona, WI
1 *** 149, 000 0 100
Dow Chemical Company -Midland, MI
1 50 115, 000 109, 100 5
Eastman Kodak Company -Rochester, NY
1 50 87, 350 15, 766 82
Eli L illy and Company -Indianapolis, IN
7 50 5, 749, 879 1, 194, 760 79
Fisons Company -Rochester, NY
1 *** 3, 395 2, 229 34
Ganes Chemicals Inc. -Carlstadt, NJ
2 *** 67, 018 19, 586 71
Hoechst Celanese Company -Corpus Christi, TX
1 50 0 0
Hoffmann-La Roche Inc. -Nutley, NJ
5 62 2, 154, 667 1, 230, 361 43
Johnson & Johnson -New Brunswick, NJ
2 65 258, 090 234, 444 9
Mallin ckrodt Group Inc. -Saint Louis, MO
1 50 0 500
Sector Notebook Project 135 September 1997

--
--
Pharmaceutical Industr y Activities and Initiatives
Table 25: Pharmaceutical Industry Part icipation in the 33/50 Program Merck & Company Inc. -Whitehouse Station, NJ
Monsanto Company -Saint Louis, MO
7
3
50
25
5, 863, 293 927, 225 84
9, 200 3, 480 62
Par Pharmaceutical Inc. -Spring Valley, NY
1 *** 194, 099 0 100
Perrigo Company -Allegan, MI
2 95 638, 235 0 100
Pfizer Incorporated -New York, NY
10 50 2, 492, 314 3, 250, 940 -30
Sandoz Corporation New York, NY
18 50 572, 915 100, 439 82
Schering-Plough Corp. -Madison, NJ
7 70 3, 181, 202 1, 867, 558 41
Smithkline Beecham Americas -Philadelphia, PA
6 81 2, 882, 573 35, 469 99
Solvay America Inc. -Houston, TX
1 * 0 36, 474
Syntex USA Incorporated -Palo Alto, CA
3 33 1, 093, 051 393, 493 64
Tishcon Corporation -Westbury, NY
2 ** 3, 900 113, 000 -2797
United Organics Corp. -Williamston, NC
1 * 0 5, 950
Upjohn Company -Kalamazoo, MI
3 50 7, 128, 339 5, 654, 150 21
Upsher-Smith Laboratories Inc. -Minneapolis, MN
1 100 94, 000 320, 000 -240
Warner-Lambert Company -Morris Plains, NJ
4 40 197, 540 242, 638 -22
Total 160 47, 784, 637 23, 711, 586 50
Source: US EPA 33/50 Program Office, 1996. 1995 33/50 TRI data was not available at time of publication. 1 Company-wide Reduction Goals aggregate all company-owned facilities which may include facilities not producing pharmaceuticals. * = Reduction goal not quantifiable against 1988 TRI data. ** = Use reduction goal only. *** = No numeric reduction goal.
Environmental Leadership Program
The Environmental Leadership Program (ELP) is a national initiative developed by EPA that focuses on improving environmental performance, encouraging voluntary compliance, and building working relationships with stakeholders. EPA initiated a one year pilot program in 1995 by selecting 12 projects at industrial facilit ies and federal installations that demonstrate the
Sector Notebook Project 136 September 1997

Pharmaceutical Industr y Activities and Initiatives
principles of the ELP program. These principles include: environmental management systems, multimedia compliance assurance, third-party verification of compliance, public measures of accountabilit y, pollution prevention, community involvement, and mentor programs. In return for participating, pilot participants received public recognition and were given a period of time to correct any violations discovered during these experimental projects.
EPA is making plans to launch its full -scale Environmental Leadership Program in 1997. The full-scale program will be facilit y-based with a 6-year participation cycle. Facilit ies that meet certain requirements will be eligible to participate, such as having a community outreach/employee involvement programs and an environmental management system (EMS) in place for 2 years. (Contact: http://es.inel.gov/elp or Debby Thomas, ELP Deputy Director, at 202-564-5041)
Project XL
Project XL was initiated in March 1995 as a part of President Clinton’s Reinventing Environmental Regulation initiative. The projects seek to achieve cost effective environmental benefits by providing participants regulatory flexibilit y onthe condition that they produce greater environmental benefit s. EPA and program participants will negotiate and sign a Final Project Agreement, detailing specific environmental objectives that the regulated entity shall satisfy. EPA will provide regulatory flexibilit y as an incentive for the participants’ superior environmental performance. Participants are encouraged to seek stakeholder support from local governments, businesses, and environmental groups. EPA hopes to implement fift y pilot projects in four categories, including industrial facilit ies, communities, and government facilit ies regulated by EPA. Applications are being accepted on a rolling basis.
In 1996, EPA accepted a proposal by Merck to deliver superior environmental protection while allowing flexible operation at its pharmaceutical manufacturing facilit y near Elkton, Virginia. Merck, along with its stakeholders, developed a simplified air permit for the facilit y that will cap total air emissions of criteria pollutants at less than recent actual levels and allow the facilit y to make changes and additions to its manufacturing processes as soon as they are needed without prior approval. The upfront environmental benefit which will enable Merck to operate flexibly under the emissions cap will come from converting the coal burning powerhouse to natural gas. This conversion will r educe the site's actual air emissions by over 900 tons per year of criteria pollutants, and 50 tons per year of hazardous air pollutants.
Under the proposal, EPA and the Virginia Department of Environmental
Sector Notebook Project 137 September 1997

Pharmaceutical Industr y Activities and Initiatives
Quality (VADEQ) will adopt the Prevention of Significant Deterioration (PSD) permit through different mechanisms under their respective jurisdictions. EPA plans to promulgate a site-specific rule making in order to make adjustments to current applicable regulations to allow for the flexible operation of the permit. The Virginia State Air Pollution Control Board will promulgate a variance to make the PSD permit legally enforceable under state laws. These proposed actions and the draft permit were subject to public comment and it is expected that the permit will be issued to Merck during 1997.
For additional information regarding XL projects, including application procedures and criteria, see the May 23, 1995 Federal Register Notice. (Contact: Fax-on-Demand Hotline 202-260-8590, Web: http://www.epa.gov/ ProjectXL, or Christopher Knopes at EPA’s Office of Policy, Planning and Evaluation 202-260-9298)
Climate Wise Program
Climate Wise is helping US industries turn energy effic iency and pollution prevention into a corporate asset. Supported by the technical assistance, financing information and public recognition that Climate Wise offers, participating companies are developing and launching comprehensive industrial energy efficiency and pollution prevention action plans that save money and protect the environment. The nearly 300 Climate Wise companies expect to save more than $300 million and reduce greenhouse gas emissions by 18 million metric tons of carbon dioxide equivalent by the year 2000. Some of the actions companies are undertaking to achieve these results include: process improvements, boiler and steam system optimization, air compressor system improvements, fuel switching, and waste heat recovery measures including cogeneration. Created as part of the President’s Climate Change Action Plan, Climate Wise is jointly operated by the Department of Energy and EPA. Under the Plan many other programs were also launched or upgraded including Green Lights, WasteWi$e and DoE’s Motor Challenge Program. Climate Wise provides an umbrella for these programs which encourage company participation by providing information on the range of partnership opportunities available. (Contact: Pamela Herman, EPA, 202-260-4407 or Jan Vernet, DoE, 202-586-4755)
Energy Star Buildings Program
EPA’s ENERGY STAR Buildings Program is a voluntary, profit-based program designed to improve the energy-efficiency in commercial and industrial buildings. Expanding the successful Green Lights Program, ENERGY STAR
Buildings was launched in 1995. This program relies on a 5-stage strategy designed to maximize energysavingsthereby loweringenergy bills, improving occupant comfort, and preventing pollution -- all at the same time. If
Sector Notebook Project 138 September 1997

Pharmaceutical Industr y Activities and Initiatives
implemented in every commercial and industrial building in the United States, ENERGY STAR Buildings could cut the nation’s energy bill by up to $25 billio n and prevent up to 35% of carbon dioxide emissions. (This is equivalent to taking 60 million cars of the road). ENERGY STAR Buildings participants include corporations; small and medium sized businesses; local, federal and state governments; non-profit groups; schools; universities; and health care facilities. EPA provides technical and non-technical support including software, workshops, manuals, communication tools, and an information hotline. EPA’s Office of Air and Radiation manages the operation of the ENERGY STAR Buildings Program. (Contact: Green Light/Energy Star Hotline at 1-888-STAR-YES or Maria Tikoff Vargas, EPA Program Director at 202-233-9178 or visit the ENERGY STAR Buildings Program website at http://www.epa.gov/appdstar/buildings/)
Green Lights Program
EPA’s Green Lights program was initiated in 1991 and has the goal of preventing pollution by encouraging U.S. institutions to use energy-efficient lighting technologies. The program saves money for businesses and organizations and creates a cleaner environment by reducing pollutants released into the atmosphere. The program has over 2,345 participants which include major corporations, small and medium sized businesses, federal, state and local governments, non-profit groups, schools, universities, and health care facilit ies. Each participant is required to survey their facilit ies and upgrade lighting wherever it is profitable. As of March 1997, participants had lowered their electric bills by $289 million annually. EPA provides technical assistance to the participants through a decision support software package, workshops and manuals, and an information hotline. EPA’s Office of Air and Radiation is responsible for operating the Green Lights Program. (Contact: Green Light/Energy Star Hotline at 1-888-STARYES or Maria Tikoff Vargar, EPA Program Director, at 202-233-9178 the )
WasteWi$e Program
The WasteWi$e Programwas started in 1994 by EPA’s Office of SolidWaste and Emergency Response. The program is aimed at reducing municipal solid wastes by promoting waste prevention, recycling collection and the manufacturing and purchase of recycled products. As of 1997, the program had about 500 companies as members, one third of whom are Fortune 1000 corporations. Members agree to identify and implement actions to reduce their solid wastes setting waste reduction goals and providing EPA with yearly progress reports. To member companies, EPA, in turn, provides technicalassistance,publications, networking opportunities, and nationaland regional recognition. (Contact: WasteWi$e Hotline at 1-800-372-9473 or Joanne Oxley, EPA Program Manager, 703-308-0199)
Sector Notebook Project 139 September 1997

Pharmaceutical Industr y Activities and Initiatives
NICE3
The U.S. Department of Energy is administering a grant program called The National Industrial Competitiveness through Energy, Environment, and Economics (NICE3). By providing grants of up to 45 percent of the total project cost, the program encourages industry to reduce industrial waste at its source and become more energy-efficient and cost-competitive through waste minimization efforts. Grants are used by industry to design, test, and demonstrate new processes and/or equipment with the potential to reduce pollution and increase energy efficiency. The program is open to all industries; however, priority is given to proposals from participants in the forest products, chemicals, petroleum refining, steel, aluminum, metal casting and glass manufacturing sectors. (Contact: http//www.oit.doe.gov/access/ nice3, Chris Sifri, DOE, 303-275-4723 or Eric Hass, DOE, 303-275-4728)
Design for the Environment (DfE)
DfE is working with several industries to identify cost-effective pollution prevention strategies that reduce risks to workers and the environment. DfE helps businesses compare and evaluate the performance, cost, pollution prevention benefits, and human health and environmental risks associated with existing and alternative technologies. The goal of these projects is to encourage businesses to consider and use cleaner products, processes, and technologies. For more information about the DfE Program, call (202) 260-1678. To obtain copies of DfE materials or for general information about DfE, contact EPA’s Pollution Prevention Information Clearinghouse at (202) 260-1023 or visit the DfE Website at http://es.inel.gov/dfe.
VIII. C. Trade Association/Industr y Sponsored Activity
VIII. C.1. Environmental Programs
The Pharmaceuticals Research and Manufacturers of America (PhRMA) coordinates the research-based pharmaceutical industry’s response to industry-specific environmental issues, such as the pharmaceutical MACT. PhRMA works through an environmental committee, a series of subcommittees responsible for regulatory areas such as water and air, and ad hoc work groups to address narrowly-focused issues.
The research-based pharmaceutical industry also relies on other broad-based trade associations for issues that affect the larger business community. Several of the PhRMA members are also members of the Chemical Manufacturers Association (CMA) and therefore are part of CMA’s Responsible Care® Initiative.
Sector Notebook Project 140 September 1997

Pharmaceutical Industr y Activities and Initiatives
In addition, many pharmaceutical companies have been implementing their own environmental programs and initiatives to reduce the environmental impacts of their products and manufacturing processes. These programs are both company-wide and at the facilit y level. More information on such programs can be obtained by contacting individual companies and facilit ies.
Sector Notebook Project 141 September 1997

Pharmaceutical Industr y Activities and Initiatives
VIII. C.2. Summary of Trade Associations
Pharmaceutical Researchand Manufacturersof America (PhRMA)1100 15th Street, NWWashington, D.C. 20035Phone: (202) 835-3400Fax: (202) 835-3414
Budget:$20,000,000 Staff: 80 Members: 40 companies Affilia tes: 30 companies
The Pharmaceutical Research and Manufacturers of America (PhRMA) is a non-profit organization which was established in 1958. Its main function is to assist research-based pharmaceutical companies in discovery, development, and marketing of new drugs for humans. Comprised of most of the largest pharmaceutical companies in the United States, PhRMA members are primarily engaged in research and development of new medicines. To be a member of PhRMA, a company must be heavily involved in research and development (R&D) and must also manufacture and market finished dosage-form drugs under their own brand name. PhRMA member companies invest nearly $19 billio n a year in discovering and developing new drugs. Additionally, PhRMA members account for approximately 90% of total pharmaceutical sales in the United States.
Generic Pharmaceutical Industry Association 1620 I Street, NW Washington, D.C. 20006-4005 Phone: (202) 833-9070 Fax: (202) 833-9612
The Generic Pharmaceutical Industry Association
Budget: $1-2,000,000 Staff: 6 Members: 46 companies
(GPIA) is a primary trade association for manufacturers and distributors of generic drugs. Its main publicationis “GPIA News”.
National Pharmaceutical Alliance(NPA)421 King Street, Suite 222,Alexandria, VA 22314Phone: (703) 836-8816 Budget: $250-500,000Fax: (703) 549-4749 Members: 165 companies
The National Pharmaceutical Alliance (NPA) is an organization which represents theinterests of small pharmaceutical companies and allied industries. Members of NPAdevelop bioequivalent versions of major branded products, create products ofalternative combinations, strengths, and/or dosage forms, and market products whichare not produced by larger companies and which would not be available to the public
Sector Notebook Project 142 September 1997

Pharmaceutical Industr y Activities and Initiatives
otherwise. NPA assists in meeting these goals for its member companies. NPA alsopublishes a bi-monthly journal called “NPA & News, Washington Report.”
American Pharmaceutical Association(APhA)2215 Constitution Ave. NWWashington, DC 20037Phone: (202) 628-4410 Budget: $12,000,000Fax: (202) 783-2351 Members: 44,000
The American Pharmaceutical Association (APhA) is a professional society that includes pharmacists in all practice settings, educators, students, researchers, editors and publishers of pharmaceutical literature, pharmaceutical chemists and scientists, and food and drug officials. APhA promotes quality health care and comprehensive pharmaceutical care through the appropriate use of pharmacy services. APhA works to: represent the interests of the profession before governmentalbodies;interprets and disseminates informationon developments in health care; and assure qualitypharmacy services and patient care. APhA fosters professional education and training of pharmacists; supports the Academy of Pharmaceutical Research and Science, the Academy of Pharmacy Practice and Management, and the Academy of Students of Pharmacy. APhA also publishes a quarterly newsletter, Academy Reporter, and monthly journals including, American Pharmacy (Journal of the American Pharmaceutical Association) and Journal of Pharmaceutical Sciences.
United States Pharmacopeial Convention (USP) 12601 Twinbrook Pky. Rockville, MD 20852 Phone: (301) 881-0666 Budget: $20,000,000
Members: 395Fax: (301) 816-8247
The United States Pharmacopeial Convention (USP) is a recognized authority in medicine, pharmacy, and allied sciences. USP revises and publishes legally recognized compendia of drug standards including the National Formulary.
Sector Notebook Project 143 September 1997

Pharmaceutical Industr y Activities and Initiatives
National Association of Pharmaceutical Manufacturers (NAPM)320 Old Country Road -Suite 205Garden City, NY 11530Phone: (516) 741-3699Fax: (516) 741-3696
Nonprescription Drug Manufacturers Association1150 Connecticut Avenue, NWWashington, DC 20036Phone: (202) 429-9260Fax: (202) 223-6835
National Wholesale Druggist’s Association1821 Michael Faraday DriveSuite 400Reston, VA 22090Phone: (703) 787-0000 ext. 240Fax: (703) 787-6930
Sector Notebook Project 144 September 1997
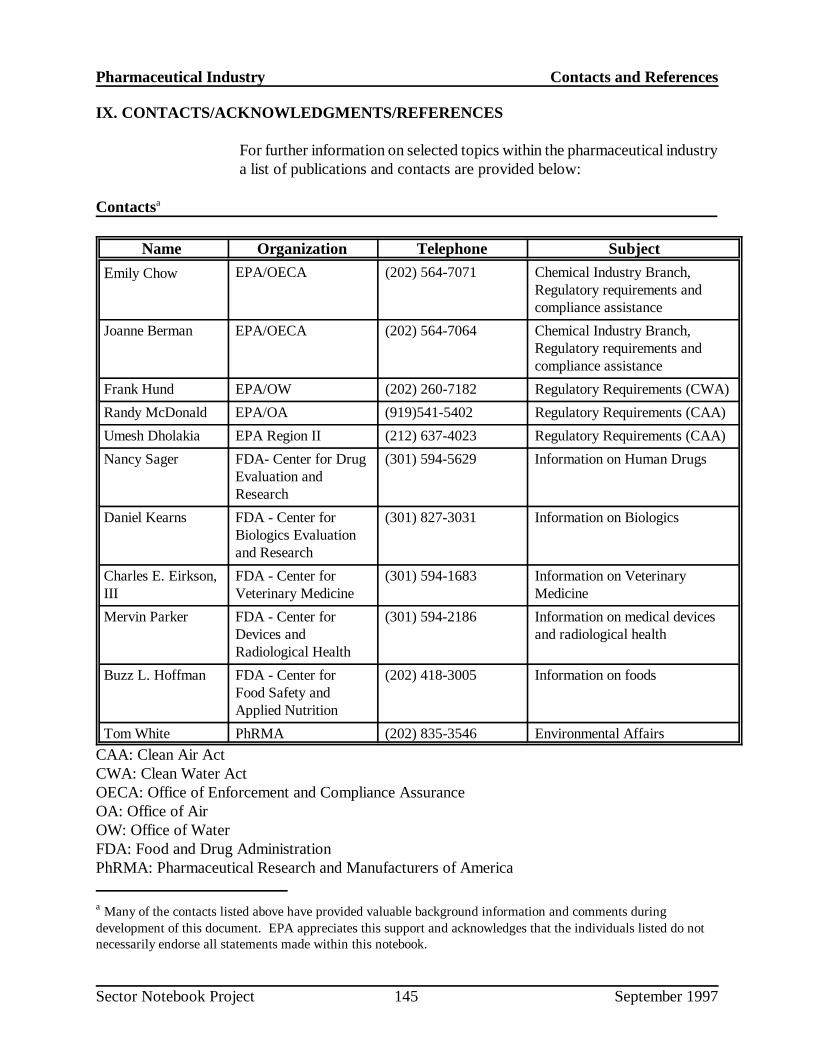
Pharmaceutical Industr y Contacts and References
IX. CONTACTS/ACK NOWLEDGM ENTS/REFERENCES
For further information on selected topics within the pharmaceutical industry a list of publications and contacts are provided below:
Contactsa
Name Organization Telephone Subject
Emily Chow EPA/OECA (202) 564-7071 Chemical Industry Branch, Regulatory requirements and compliance assistance
Joanne Berman EPA/OECA (202) 564-7064 Chemical Industry Branch, Regulatory requirements and compliance assistance
Frank Hund EPA/OW (202) 260-7182 Regulatory Requirements (CWA)
Randy McDonald EPA/OA (919)541-5402 Regulatory Requirements (CAA)
Umesh Dholakia EPA Region II (212) 637-4023 Regulatory Requirements (CAA)
Nancy Sager FDA- Center for Drug Evaluation and Research
(301) 594-5629 Information on Human Drugs
Daniel Kearns FDA - Center for Biologics Evaluation and Research
(301) 827-3031 Information on Biologics
Charles E. Eirkson, III
FDA - Center for Veterinary Medicine
(301) 594-1683 Information on Veterinary Medicine
Mervin Parker FDA - Center for Devices and Radiological Health
(301) 594-2186 Information on medical devices and radiological health
Buzz L. Hoffman FDA - Center for Food Safety and Applied Nutrition
(202) 418-3005 Information on foods
Tom White PhRMA (202) 835-3546 Environmental Affairs
CAA: Clean Air ActCWA: Clean Water ActOECA: Office of Enforcement and Compliance AssuranceOA: Office of AirOW: Office of WaterFDA: Food and Drug AdministrationPhRMA: Pharmaceutical Research and Manufacturers of America
a Many of the contacts listed above have provided valuable background information and comments during development of this document. EPA appreciates this support and acknowledges that the individuals listed do not necessarily endorse all statements made within this notebook.
Sector Notebook Project 145 September 1997
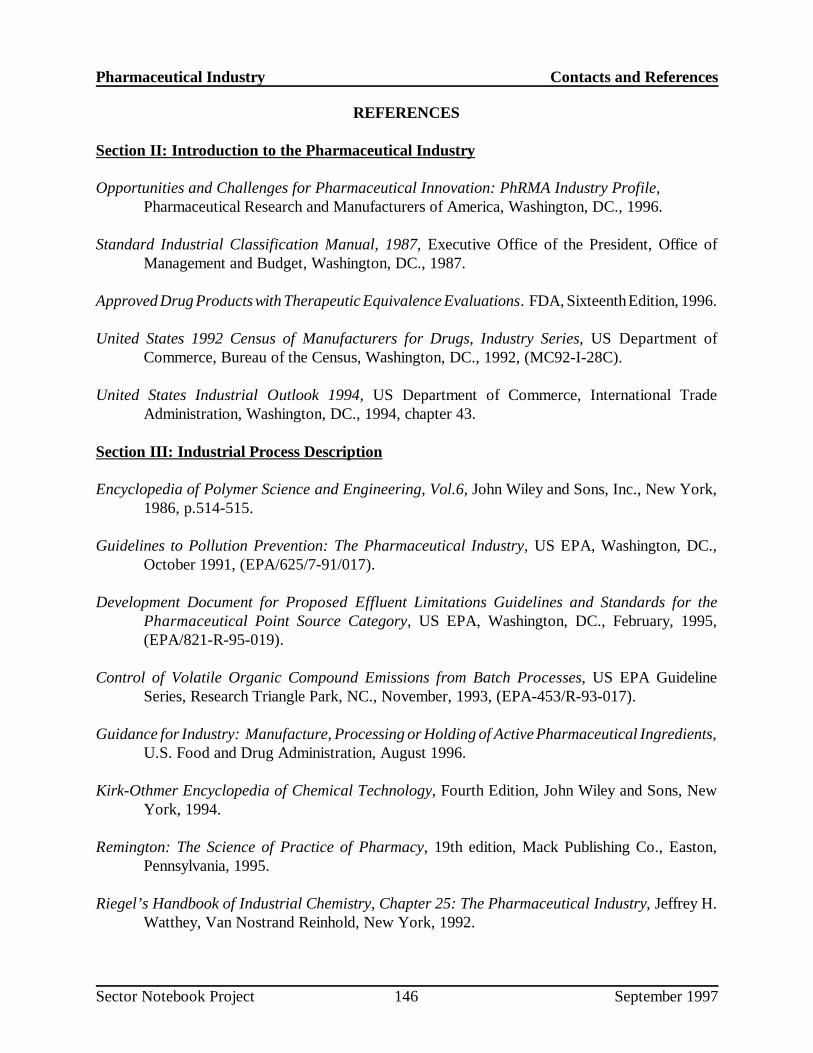
Pharmaceutical Industr y Contacts and References
REFERENCES
Section II : Intr oduction to the Pharmaceutical Industr y
Opportunities and Challenges for Pharmaceutical Innovation: PhRMA Industry Profile, Pharmaceutical Research and Manufacturers of America, Washington, DC., 1996.
Standard Industrial Classification Manual, 1987, Executive Office of the President, Office of Management and Budget, Washington, DC., 1987.
Approved Drug Products with Therapeutic Equivalence Evaluations. FDA, Sixteenth Edition, 1996.
United States 1992 Census of Manufacturers for Drugs, Industry Series, US Department of Commerce, Bureau of the Census, Washington, DC., 1992, (MC92-I-28C).
United States Industrial Outlook 1994, US Department of Commerce, International Trade Administration, Washington, DC., 1994, chapter 43.
Section III: Industr ial Process Description
Encyclopedia of Polymer Science and Engineering, Vol.6, John Wiley and Sons, Inc., New York, 1986, p.514-515.
Guidelines to Pollution Prevention: The Pharmaceutical Industry, US EPA, Washington, DC., October 1991, (EPA/625/7-91/017).
Development Document for Proposed Effluent Limitations Guidelines and Standards for the Pharmaceutical Point Source Category, US EPA, Washington, DC., February, 1995, (EPA/821-R-95-019).
Control of Volatile Organic Compound Emissions from Batch Processes, US EPA Guideline Series, Research Triangle Park, NC., November, 1993, (EPA-453/R-93-017).
Guidance for Industry: Manufacture, Processing or Holding of Active Pharmaceutical Ingredients, U.S. Food and Drug Administration, August 1996.
Kirk-Othmer Encyclopedia of Chemical Technology, Fourth Edition, John Wiley and Sons, New York, 1994.
Remington: The Science of Practice of Pharmacy, 19th edition, Mack Publishing Co., Easton, Pennsylvania, 1995.
Riegel’s Handbook of Industrial Chemistry, Chapter 25: The Pharmaceutical Industry, Jeffrey H. Watthey, Van Nostrand Reinhold, New York, 1992.
Sector Notebook Project 146 September 1997
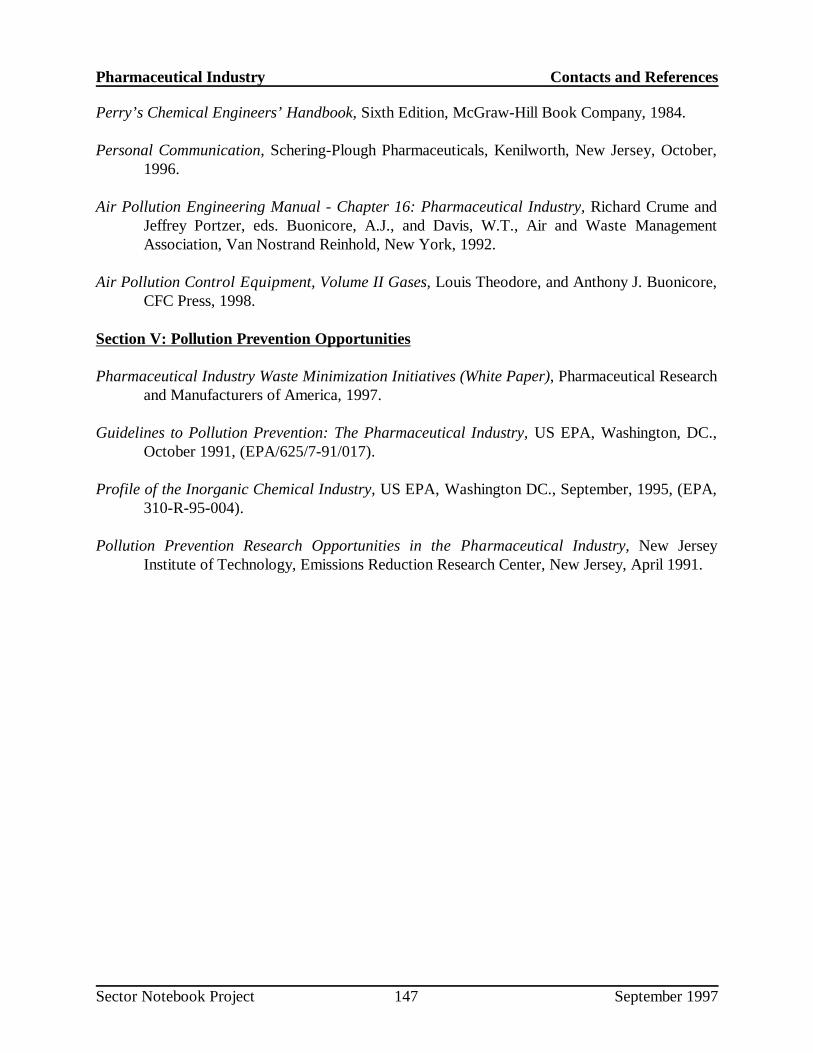
Pharmaceutical Industr y Contacts and References
Perry’s Chemical Engineers’ Handbook, Sixth Edition, McGraw-Hill Book Company, 1984.
Personal Communication, Schering-Plough Pharmaceuticals, Kenilworth, New Jersey, October, 1996.
Air Pollution Engineering Manual - Chapter 16: Pharmaceutical Industry, Richard Crume and Jeffrey Portzer, eds. Buonicore, A.J., and Davis, W.T., Air and Waste Management Association, Van Nostrand Reinhold, New York, 1992.
Air Pollution Control Equipment, Volume II Gases, Louis Theodore, and Anthony J. Buonicore, CFC Press, 1998.
Section V: Pollution Prevention Opportunities
Pharmaceutical Industry Waste Minimization Initiatives (White Paper), Pharmaceutical Research and Manufacturers of America, 1997.
Guidelines to Pollution Prevention: The Pharmaceutical Industry, US EPA, Washington, DC., October 1991, (EPA/625/7-91/017).
Profile of the Inorganic Chemical Industry, US EPA, Washington DC., September, 1995, (EPA, 310-R-95-004).
Pollution Prevention Research Opportunities in the Pharmaceutical Industry, New Jersey Institute of Technology, Emissions Reduction Research Center, New Jersey, April 1991.
Sector Notebook Project 147 September 1997