profile of veterans: 2009 to 24 years 25 to 34 years 35 to 54 years 55 years or older male...
TRANSCRIPT
Profile of Veterans: 2011 Data from the American Community Survey
Prepared by the National Center for Veterans Analysis and Statistics
March 2013
NCVAS National Center for Veterans Analysis and Statistics
Official Veteran Population
• The Department of Veterans Affairs (VA) released the Veteran
Population Model 2011 (VetPop2011) which provides the latest official
Veteran population projection.
• VetPop2011 is an actuarial projection model developed by the Office
of the Actuary for Veteran population projection from Fiscal Year (FY)
2011 to FY2040.
• Using the best available Veteran data by the end of FY2010,
VetPop2011 projects future living Veteran counts by key demographic
characteristics.
• The official Veteran population projection as of 9/30/2011 is
22,676,149 Veterans, of which 2,224,547 were women.
• For more information, please go to:
http://www.va.gov/vetdata/Veteran_Population.asp
2
Data Source and Methods
• Data for this analysis come from the 2011 American Community Survey (ACS) Public Use Microdata Sample • The ACS is an ongoing survey that provides annual data on the social and
economic characteristics of the U.S. population. • The ACS uses a series of monthly samples to produce annually updated data
for the same small areas (census tracts and block groups)formerly surveyed via the decennial census long-form sample.
• The universe for this analysis is the civilian population 17 years and older living in the United States and Puerto Rico • This universe includes a weighted estimate of 21.6 million Veterans, of
which 1.6 million were women. • The universe includes a weighted estimate of 244 million civilian
population, of which 222.3 million were non-Veterans.
• All comparative statements have undergone statistical testing and
are significant at the 90-percent confidence level.
3
Veteran and Non-Veteran Comparisons
Veterans = 21,596,951
Non-Veterans = 222,306,675
4
Male Veterans Male Non-Veterans
Source: U.S. Census Bureau, American Community Survey PUMS, 2011 Prepared by the National Center for Veterans Analysis and Statistics
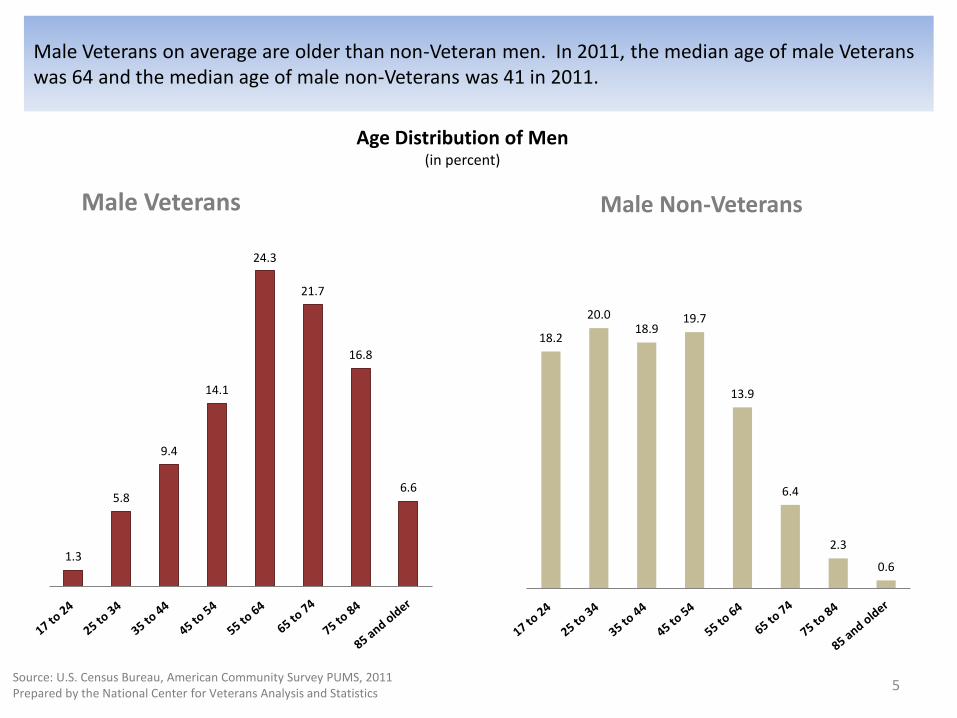
Age Distribution of Men (in percent)
Male Veterans on average are older than non-Veteran men. In 2011, the median age of male Veterans was 64 and the median age of male non-Veterans was 41 in 2011.
1.3
5.8
9.4
14.1
24.3
21.7
16.8
6.6
18.2
20.0 18.9
19.7
13.9
6.4
2.3
0.6
5
Female Veterans Female Non-Veterans
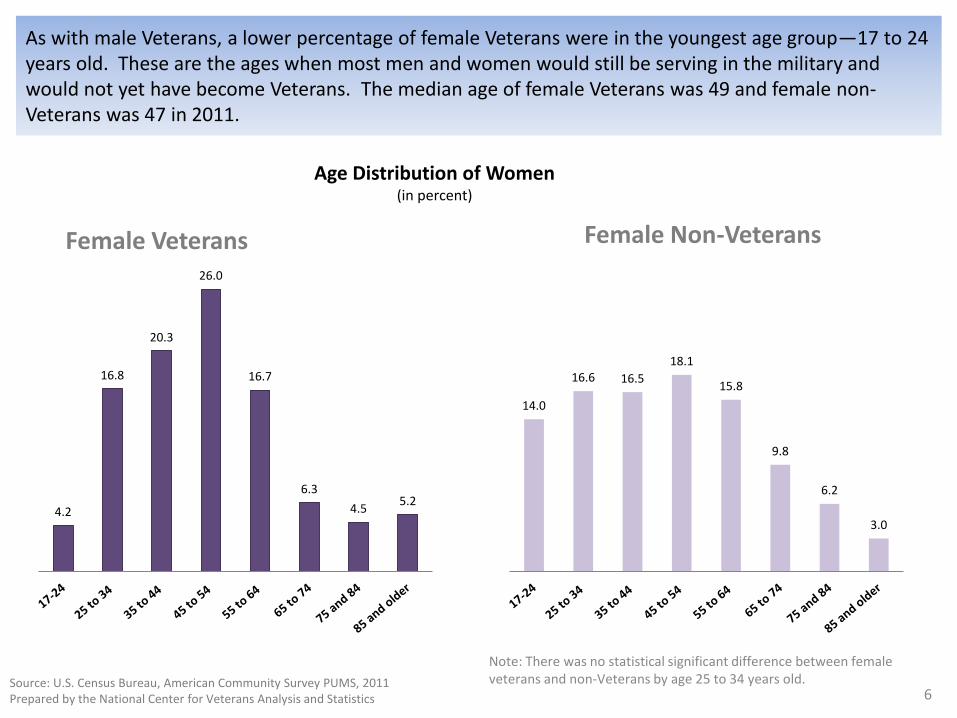
As with male Veterans, a lower percentage of female Veterans were in the youngest age group—17 to 24 years old. These are the ages when most men and women would still be serving in the military and would not yet have become Veterans. The median age of female Veterans was 49 and female non-Veterans was 47 in 2011.
Age Distribution of Women (in percent)
Source: U.S. Census Bureau, American Community Survey PUMS, 2011 Prepared by the National Center for Veterans Analysis and Statistics
4.2
16.8
20.3
26.0
16.7
6.3
4.5 5.2
14.0
16.6 16.5
18.1
15.8
9.8
6.2
3.0
6
Note: There was no statistical significant difference between female veterans and non-Veterans by age 25 to 34 years old.
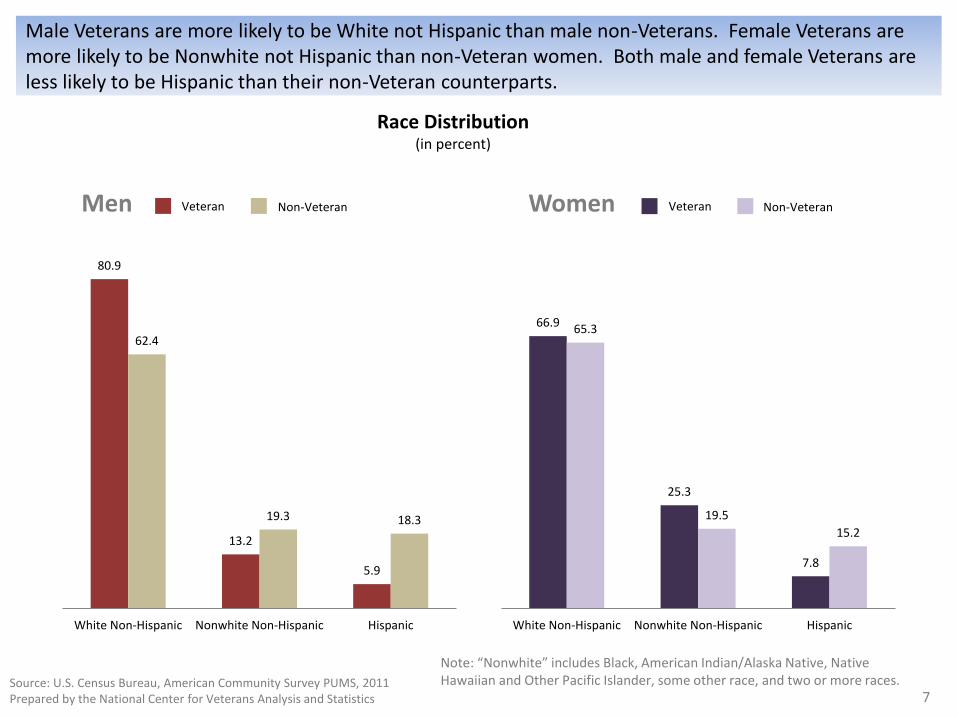
Male Veterans are more likely to be White not Hispanic than male non-Veterans. Female Veterans are more likely to be Nonwhite not Hispanic than non-Veteran women. Both male and female Veterans are less likely to be Hispanic than their non-Veteran counterparts.
Men Women
Source: U.S. Census Bureau, American Community Survey PUMS, 2011 Prepared by the National Center for Veterans Analysis and Statistics
Race Distribution (in percent)
Note: “Nonwhite” includes Black, American Indian/Alaska Native, Native Hawaiian and Other Pacific Islander, some other race, and two or more races.
Veteran Non-Veteran Veteran Non-Veteran
80.9
13.2
5.9
62.4
19.3 18.3
White Non-Hispanic Nonwhite Non-Hispanic Hispanic
66.9
25.3
7.8
65.3
19.5
15.2
White Non-Hispanic Nonwhite Non-Hispanic Hispanic
7
Men Women
Source: U.S. Census Bureau, American Community Survey PUMS, 2011 Prepared by the National Center for Veterans Analysis and Statistics
Veteran Non-Veteran Veteran Non-Veteran
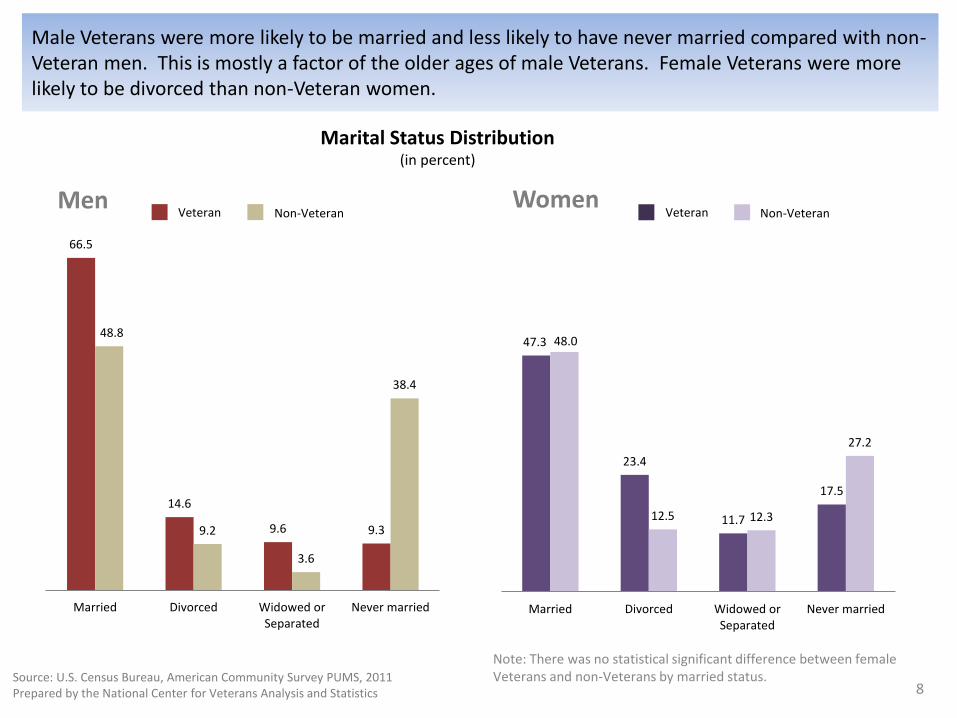
Marital Status Distribution (in percent)
Male Veterans were more likely to be married and less likely to have never married compared with non-Veteran men. This is mostly a factor of the older ages of male Veterans. Female Veterans were more likely to be divorced than non-Veteran women.
66.5
14.6
9.6 9.3
48.8
9.2
3.6
38.4
Married Divorced Widowed orSeparated
Never married
47.3
23.4
11.7
17.5
48.0
12.5 12.3
27.2
Married Divorced Widowed orSeparated
Never married
8
Note: There was no statistical significant difference between female Veterans and non-Veterans by married status.
Occupation of Employed Men (in percent)
Class of Worker of Employed Men (in percent)
Veteran Non-Veteran Veteran Non-Veteran
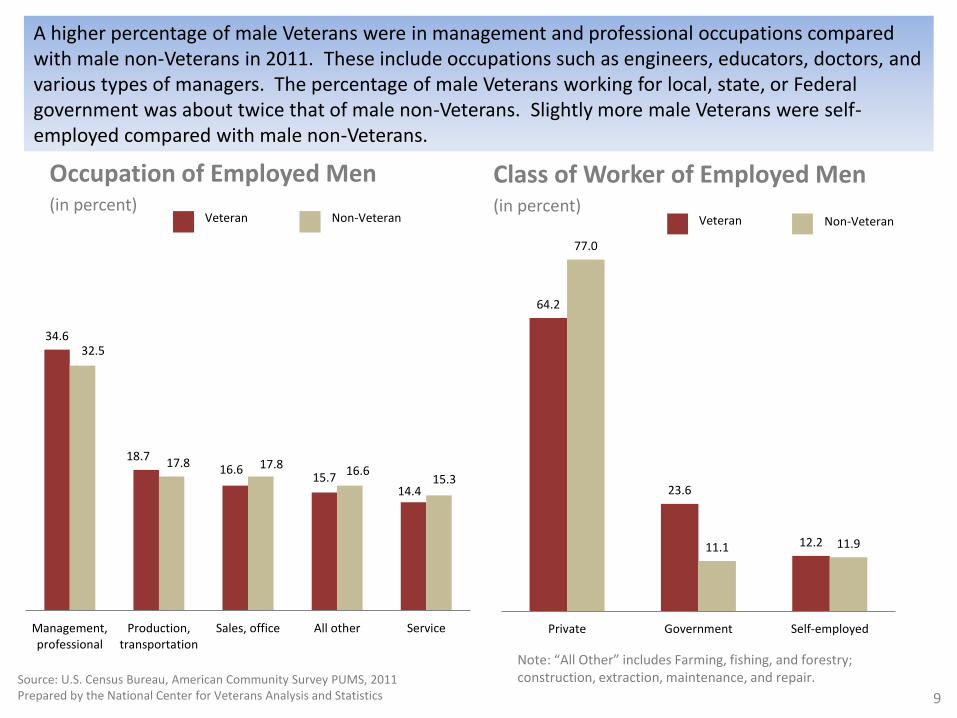
A higher percentage of male Veterans were in management and professional occupations compared with male non-Veterans in 2011. These include occupations such as engineers, educators, doctors, and various types of managers. The percentage of male Veterans working for local, state, or Federal government was about twice that of male non-Veterans. Slightly more male Veterans were self-employed compared with male non-Veterans.
Source: U.S. Census Bureau, American Community Survey PUMS, 2011 Prepared by the National Center for Veterans Analysis and Statistics
Note: “All Other” includes Farming, fishing, and forestry; construction, extraction, maintenance, and repair.
34.6
18.7 16.6
15.7 14.4
32.5
17.8 17.8 16.6 15.3
Management,professional
Production,transportation
Sales, office All other Service
64.2
23.6
12.2
77.0
11.1 11.9
Private Government Self-employed
9
Occupation of Employed Women (in percent)
Class of Worker of Employed Women (in percent) Veteran Non-Veteran Veteran Non-Veteran
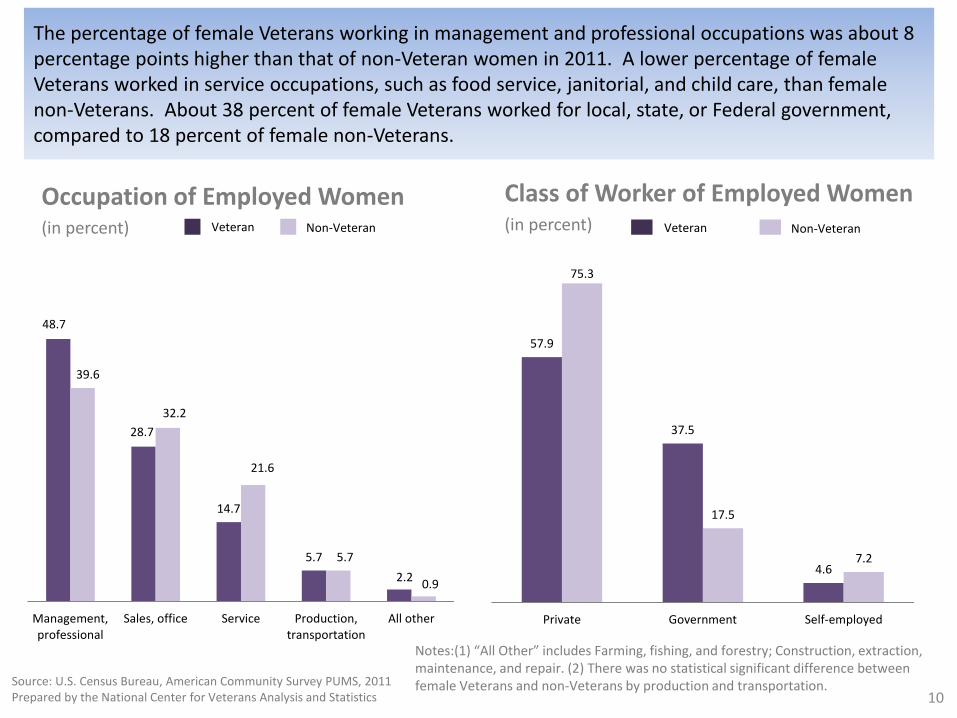
The percentage of female Veterans working in management and professional occupations was about 8 percentage points higher than that of non-Veteran women in 2011. A lower percentage of female Veterans worked in service occupations, such as food service, janitorial, and child care, than female non-Veterans. About 38 percent of female Veterans worked for local, state, or Federal government, compared to 18 percent of female non-Veterans.
Source: U.S. Census Bureau, American Community Survey PUMS, 2011 Prepared by the National Center for Veterans Analysis and Statistics
Notes:(1) “All Other” includes Farming, fishing, and forestry; Construction, extraction, maintenance, and repair. (2) There was no statistical significant difference between female Veterans and non-Veterans by production and transportation.
48.7
28.7
14.7
5.7
2.2
39.6
32.2
21.6
5.7
0.9
Management,professional
Sales, office Service Production,transportation
All other
57.9
37.5
4.6
75.3
17.5
7.2
Private Government Self-employed
10
Men Women Veteran Non-Veteran Veteran Non-Veteran
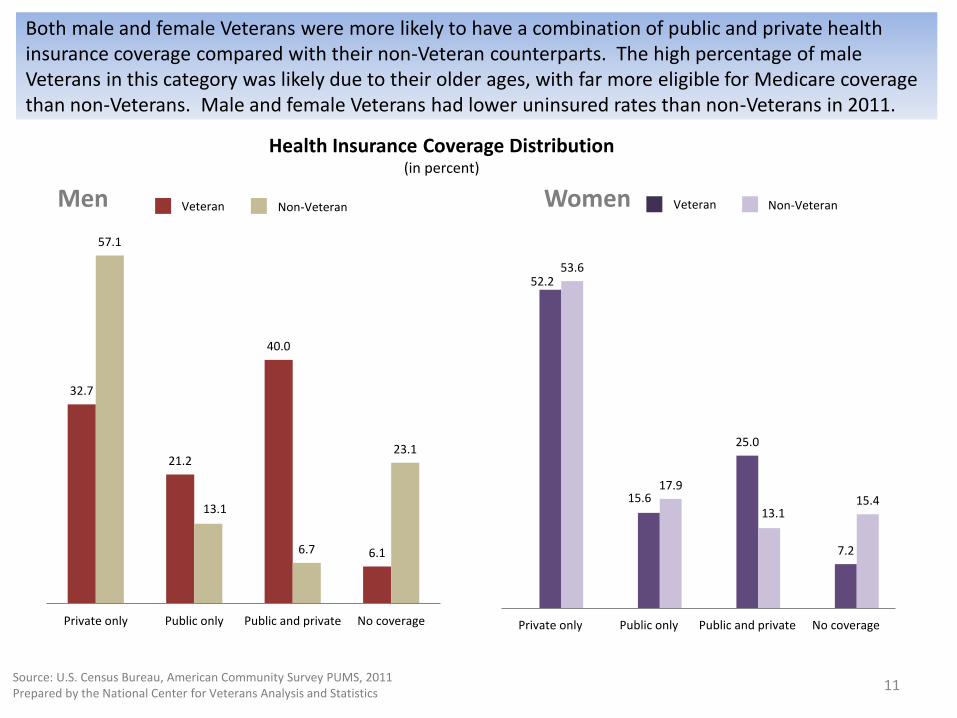
Both male and female Veterans were more likely to have a combination of public and private health insurance coverage compared with their non-Veteran counterparts. The high percentage of male Veterans in this category was likely due to their older ages, with far more eligible for Medicare coverage than non-Veterans. Male and female Veterans had lower uninsured rates than non-Veterans in 2011.
Source: U.S. Census Bureau, American Community Survey PUMS, 2011 Prepared by the National Center for Veterans Analysis and Statistics
Health Insurance Coverage Distribution (in percent)
32.7
21.2
40.0
6.1
57.1
13.1
6.7
23.1
Private only Public only Public and private No coverage
52.2
15.6
25.0
7.2
53.6
17.9
13.1 15.4
Private only Public only Public and private No coverage
11
Men Women Veteran Non-Veteran
Veteran Non-Veteran
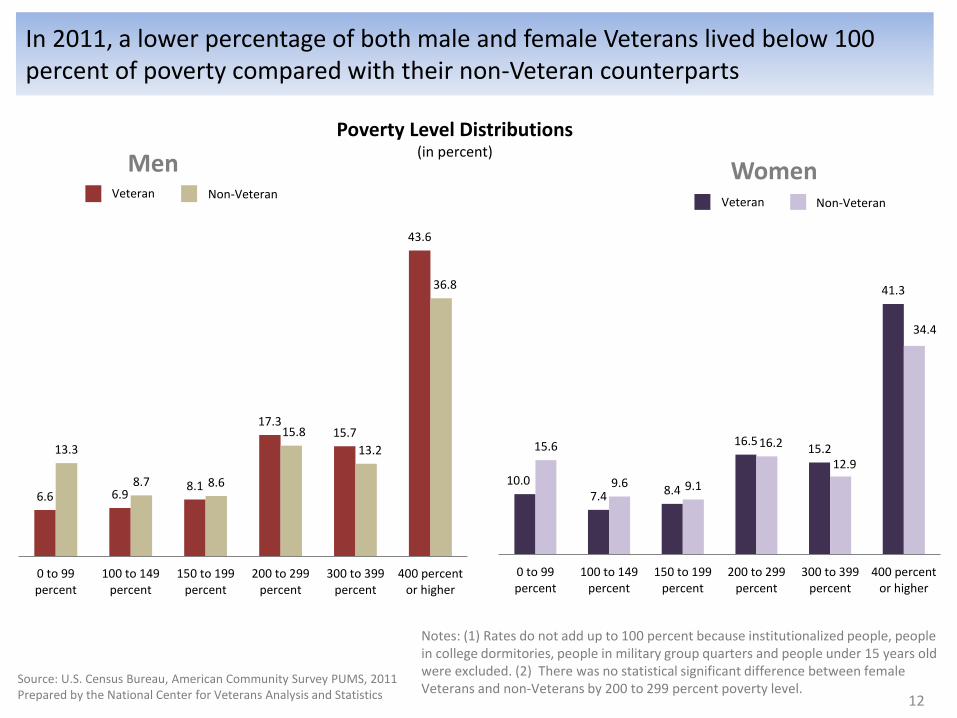
In 2011, a lower percentage of both male and female Veterans lived below 100 percent of poverty compared with their non-Veteran counterparts
Notes: (1) Rates do not add up to 100 percent because institutionalized people, people in college dormitories, people in military group quarters and people under 15 years old were excluded. (2) There was no statistical significant difference between female Veterans and non-Veterans by 200 to 299 percent poverty level.
Poverty Level Distributions (in percent)
6.6 6.9 8.1
17.3 15.7
43.6
13.3
8.7 8.6
15.8
13.2
36.8
0 to 99percent
100 to 149percent
150 to 199percent
200 to 299percent
300 to 399percent
400 percentor higher
10.0 7.4 8.4
16.5 15.2
41.3
15.6
9.6 9.1
16.2
12.9
34.4
0 to 99percent
100 to 149percent
150 to 199percent
200 to 299percent
300 to 399percent
400 percentor higher
Source: U.S. Census Bureau, American Community Survey PUMS, 2011 Prepared by the National Center for Veterans Analysis and Statistics 12
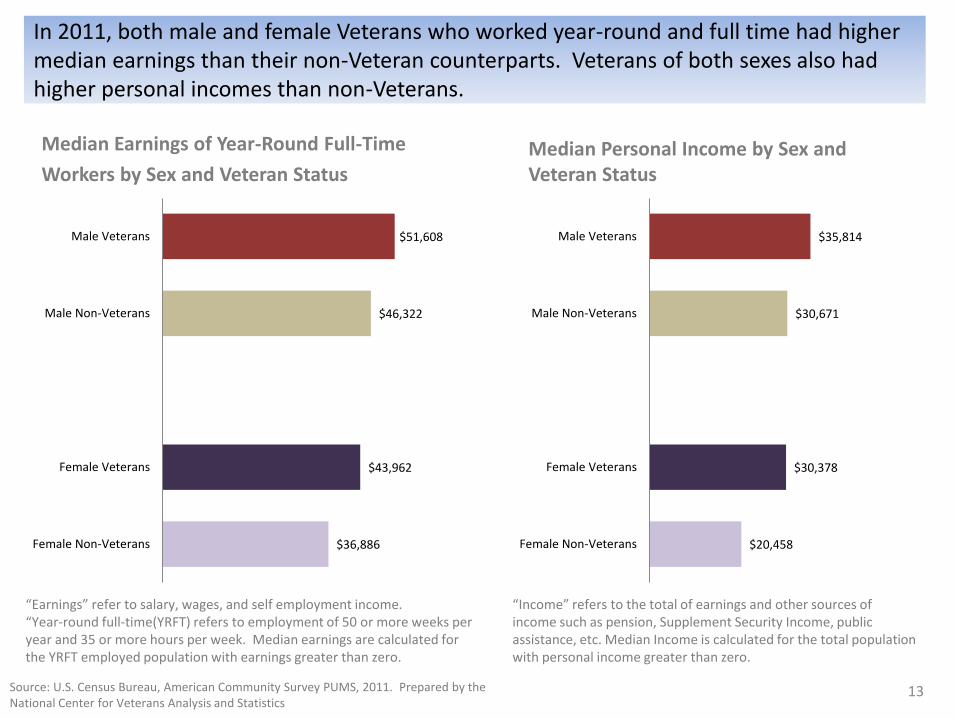
In 2011, both male and female Veterans who worked year-round and full time had higher median earnings than their non-Veteran counterparts. Veterans of both sexes also had higher personal incomes than non-Veterans.
Median Earnings of Year-Round Full-Time
Workers by Sex and Veteran Status Median Personal Income by Sex and Veteran Status
Source: U.S. Census Bureau, American Community Survey PUMS, 2011. Prepared by the National Center for Veterans Analysis and Statistics
“Earnings” refer to salary, wages, and self employment income. “Year-round full-time(YRFT) refers to employment of 50 or more weeks per year and 35 or more hours per week. Median earnings are calculated for the YRFT employed population with earnings greater than zero.
$51,608
$46,322
$43,962
$36,886
Male Veterans
Male Non-Veterans
Female Veterans
Female Non-Veterans
$35,814
$30,671
$30,378
$20,458
Male Veterans
Male Non-Veterans
Female Veterans
Female Non-Veterans
“Income” refers to the total of earnings and other sources of income such as pension, Supplement Security Income, public assistance, etc. Median Income is calculated for the total population with personal income greater than zero.
13
Veteran Comparisons
Male Veterans = 20,013,903
Female Veterans= 1,583,048
14
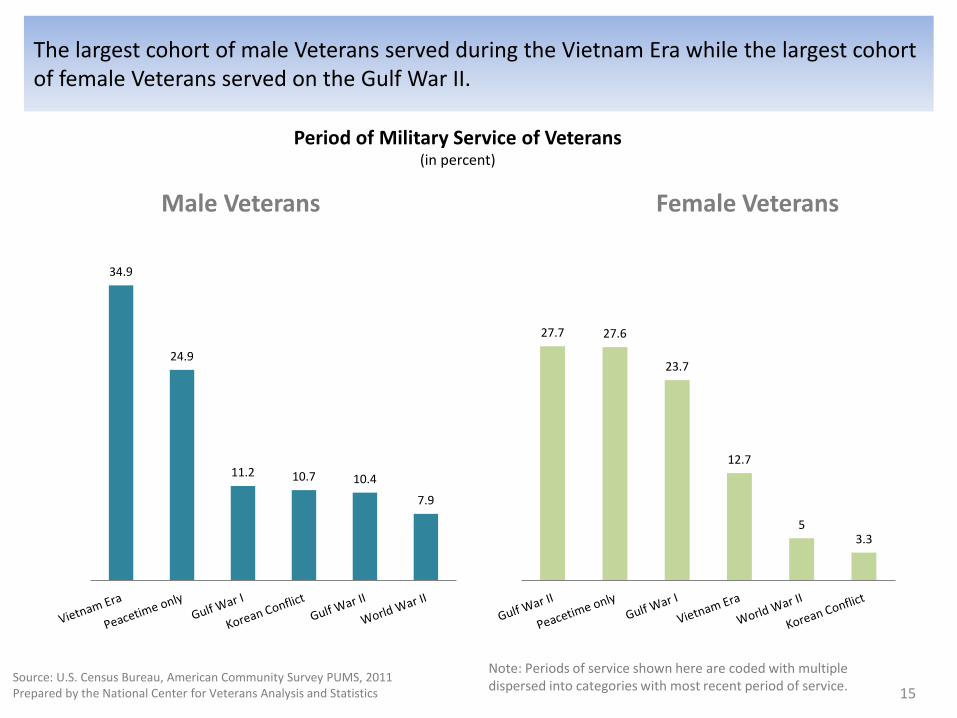
The largest cohort of male Veterans served during the Vietnam Era while the largest cohort of female Veterans served on the Gulf War II.
Male Veterans Female Veterans
Note: Periods of service shown here are coded with multiple dispersed into categories with most recent period of service.
Source: U.S. Census Bureau, American Community Survey PUMS, 2011 Prepared by the National Center for Veterans Analysis and Statistics
Period of Military Service of Veterans (in percent)
34.9
24.9
11.2 10.7 10.4
7.9
27.7 27.6
23.7
12.7
5 3.3
15
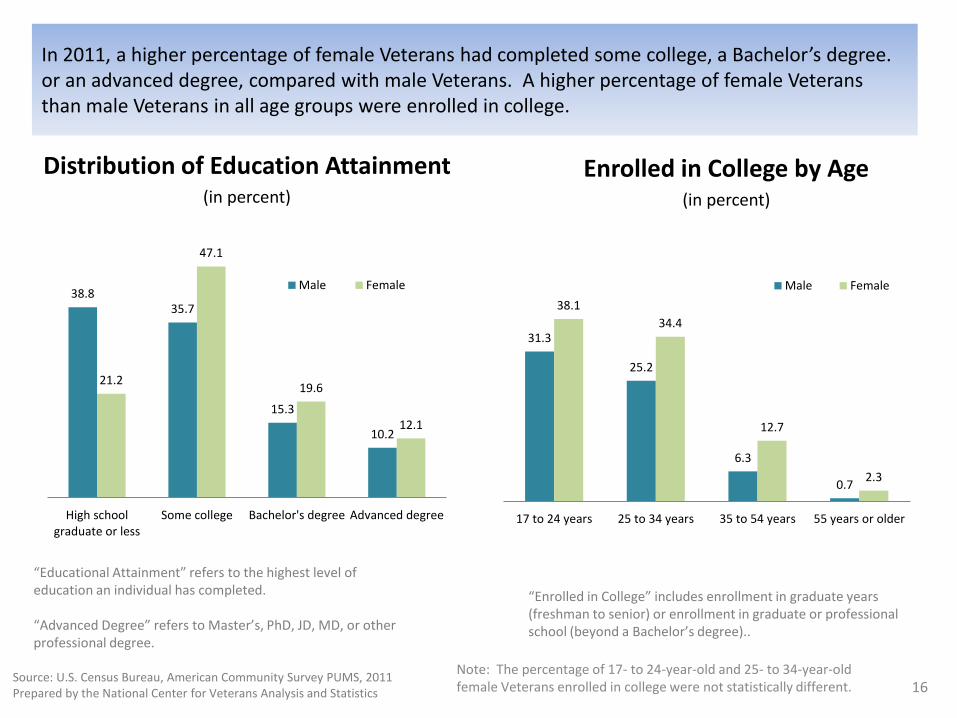
In 2011, a higher percentage of female Veterans had completed some college, a Bachelor’s degree. or an advanced degree, compared with male Veterans. A higher percentage of female Veterans than male Veterans in all age groups were enrolled in college.
“Enrolled in College” includes enrollment in graduate years (freshman to senior) or enrollment in graduate or professional school (beyond a Bachelor’s degree)..
Source: U.S. Census Bureau, American Community Survey PUMS, 2011 Prepared by the National Center for Veterans Analysis and Statistics
Enrolled in College by Age (in percent)
Distribution of Education Attainment (in percent)
38.8 35.7
15.3
10.2
21.2
47.1
19.6
12.1
High schoolgraduate or less
Some college Bachelor's degree Advanced degree
Male Female
31.3
25.2
6.3
0.7
38.1
34.4
12.7
2.3
17 to 24 years 25 to 34 years 35 to 54 years 55 years or older
Male Female
“Educational Attainment” refers to the highest level of education an individual has completed. “Advanced Degree” refers to Master’s, PhD, JD, MD, or other professional degree.
16 Note: The percentage of 17- to 24-year-old and 25- to 34-year-old female Veterans enrolled in college were not statistically different.
Source: U.S. Census Bureau, American Community Survey PUMS, 2011 Prepared by the National Center for Veterans Analysis and Statistics
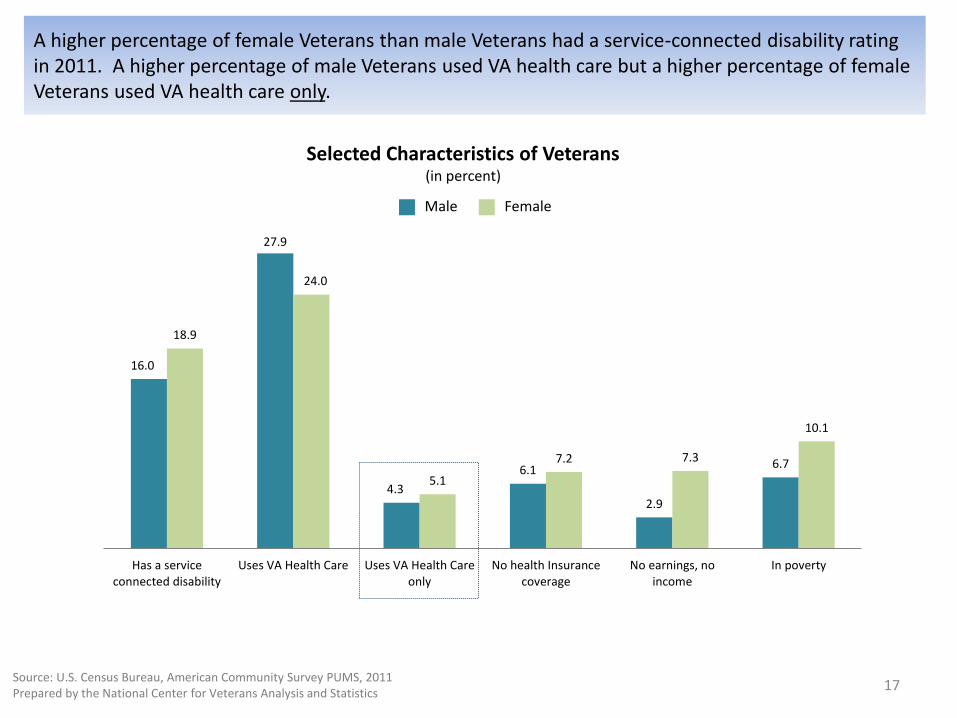
A higher percentage of female Veterans than male Veterans had a service-connected disability rating in 2011. A higher percentage of male Veterans used VA health care but a higher percentage of female Veterans used VA health care only.
Female Male
Selected Characteristics of Veterans (in percent)
16.0
27.9
4.3
6.1
2.9
6.7
18.9
24.0
5.1
7.2 7.3
10.1
Has a serviceconnected disability
Uses VA Health Care Uses VA Health Careonly
No health Insurancecoverage
No earnings, noincome
In poverty
17
Male Veterans Female Veterans
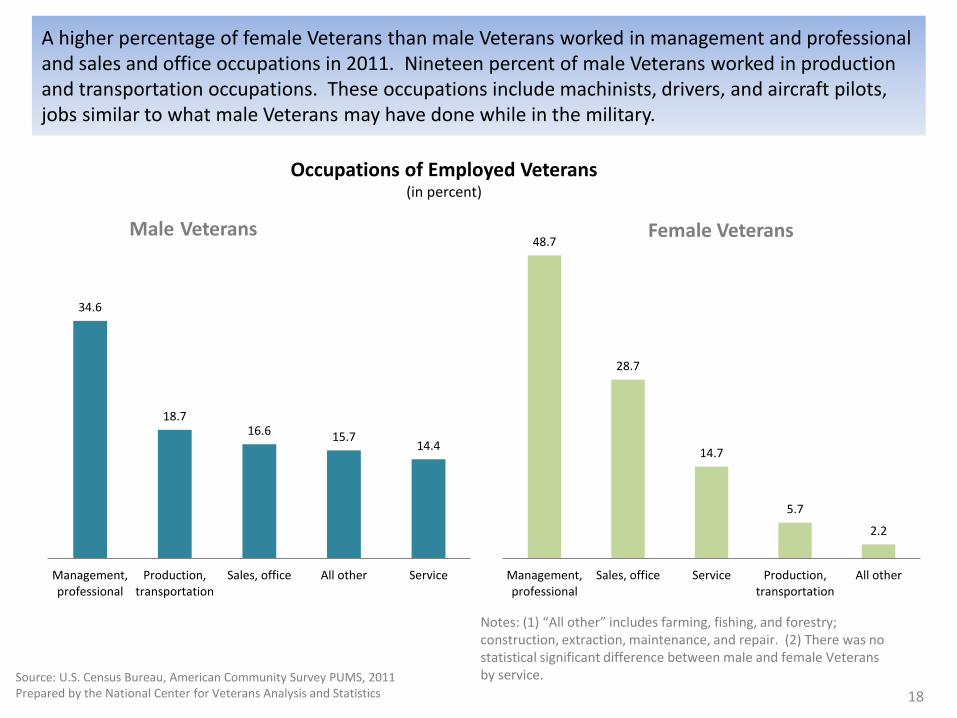
A higher percentage of female Veterans than male Veterans worked in management and professional and sales and office occupations in 2011. Nineteen percent of male Veterans worked in production and transportation occupations. These occupations include machinists, drivers, and aircraft pilots, jobs similar to what male Veterans may have done while in the military.
Notes: (1) “All other” includes farming, fishing, and forestry; construction, extraction, maintenance, and repair. (2) There was no statistical significant difference between male and female Veterans by service. Source: U.S. Census Bureau, American Community Survey PUMS, 2011
Prepared by the National Center for Veterans Analysis and Statistics
Occupations of Employed Veterans (in percent)
34.6
18.7 16.6 15.7
14.4
Management,professional
Production,transportation
Sales, office All other Service
48.7
28.7
14.7
5.7
2.2
Management,professional
Sales, office Service Production,transportation
All other
18
Summary of Veteran and Non-Veteran Comparisons
According to data from the 2011 American Community Survey, male Veterans were older, more likely
to be White non-Hispanic, more likely to be married, less likely to be uninsured, less likely to live
below poverty, and had higher personal incomes than male non-Veterans. Employed male Veterans
were more likely to work in management and professional occupations or production and
transportation occupations , and more likely to work for local, state, or Federal governments than
their non-Veteran counterparts. Male Veterans who worked year-round and full-time earned about
$5,300 more than similar non-Veterans. Some differences between male Veterans and non-Veterans
may be attributable to age. The median age of male Veterans in 2011 was 64 years while the median
age of male non-Veterans was 41 years.
A lower percentage of female Veterans were in the youngest age group—17 to 24 years old than
female non-Veterans. These are the ages when most men and women would still be serving in the
military and would not yet have become Veterans. The median age of female Veterans was 49 and
female non-Veterans was 47 in 2011. Female Veterans were more likely to be Nonwhite non-Hispanic,
more likely to be divorced, less likely to be uninsured, less likely to live below poverty, and had
higher personal incomes than female non-Veterans. Employed female Veterans were more likely to
be in management and professional occupations, less likely to be in service occupations, and more
likely to work in local, state, or Federal government than female non-Veterans. Female Veterans who
worked year-round and full-time earned about $7,000 more than similar non-Veterans.
19
The largest living cohort of male Veterans served during the Vietnam Era (August 1964 to April
1975) while the largest living cohort of female Veterans served during Gulf War II (September
2001 or later) and peacetime periods.
Compared with male Veterans, female Veterans were more likely to have completed some
college, a Bachelor’s degree, or an advanced degree, enrolled in college, more likely to have a
service-connected disability rating, less likely to use VA health care at all but more likely to use
only VA health care, and less likely to be insured, have no earnings or income, and live in
poverty.
Employed female Veterans were more likely to work in management and professional
occupations and sales and office occupations than employed male Veterans.
Some differences between male and female Veterans may be attributable to age as male
Veterans are significantly older than female Veterans. The median age of male Veterans was 64
years in 2011, compared with 49 years for female Veterans.
Summary of Veteran Comparisons
20
Contact Information
Department of Veterans Affairs
Office of Policy and Planning
National Center for Veterans Analysis and Statistics
For general inquiries, please email us at [email protected].
21