profile: or tambo district municipality
TRANSCRIPT


PROFILE: OR TAMBO DISTRICT MUNICIPALITY
2

PROFILE: OR TAMBO DISTRICT MUNICIPALITY 3
CONTENT
1. Executive Summary ............................................................................................ 6
2. Introduction: Brief Overview ................................................................................ 8
2.1 Location ............................................................................................................................ 8
2.2 Historical perspective ....................................................................................................... 9
2.3 Spatial Pattern .................................................................................................................. 9
2.4 Land Ownership .............................................................................................................. 15
3. Social Development Profile ............................................................................... 15
3.1 Key Social Demographics ................................................................................................ 15
3.1.1 Population ....................................................................................................................... 15
3.1.2 Gender, Age and Race .................................................................................................... 16
3.1.3 Households ..................................................................................................................... 17
3.2 Health Profile .................................................................................................................. 17
3.3 COVID-19 ................................................................................................................................ 18
3.4 Poverty Dimensions ................................................................................................................ 20
3.4.1 Distribution .......................................................................................................................... 20
3.4.2 Inequality ............................................................................................................................. 21
3.4.3. Unemployment and Employment ....................................................................................... 22
3.4.4 Crime .................................................................................................................................... 23
3.5 Levels of Education ................................................................................................................. 24
4. Drivers of the Economy ........................................................................................ 28
4.1 Economic overview ................................................................................................................. 28
4.2 Primary sector......................................................................................................................... 29
4.3 Secondary sector .................................................................................................................... 30
4.4 Tertiary sector......................................................................................................................... 31
4.5 Informal economy .................................................................................................................. 31
5. Service Delivery .................................................................................................... 32
5.1 Water and Sanitation .............................................................................................................. 32
5.2 Human Settlements ................................................................................................................ 33
5.3 Waste Management ............................................................................................................... 34
5.4 Roads and Transport ............................................................................................................... 35
5.5 Electricity ................................................................................................................................ 36
6. Governance and Management ............................................................................. 37
6.1 Municipality Performance ...................................................................................................... 37
6.2 Municipal Capacity ................................................................................................................. 37
6.3 Traditional Affairs Governance ............................................................................................... 37
7. Projects to diversity and grow people and the economy ....................................... 38
7.1 Catalytic projects ............................................................................................................ 38
7.2 Environmental management and climate change.......................................................... 39
8. Key Recommendations ..................................................................................... 40

PROFILE: OR TAMBO DISTRICT MUNICIPALITY
4

PROFILE: OR TAMBO DISTRICT MUNICIPALITY 5
CO
VID
-19 V
uln
era
bility
Index
Harry
Gw
ala
S
ourc
e: C
SIR
/NC
DM
`

PROFILE: OR TAMBO DISTRICT MUNICIPALITY
6
1. Executive Summary
The OR Tambo District Municipality (ORTDM) occupies the eastern
coastal portion of the Province, sharing provincial boundaries with
KwaZulu-Natal and district boundaries with Amatole, Chris Hani,
Ukhahlamba and Alfred Nzo. The District extends over 12,141 km2 and
incorporates a number of the former Transkei magisterial districts into
5 local municipalities. These are King Sabata Dalindyebo, Nyandeni,
Port St Johns, Ingquza Hill and Mhlontlo local municipalities.
The District includes the bulk of the Wild Coast and is home to Luchaba Nature
Reserve, next to Umtata Dam and a string of coastal nature reserves including
Mkambati, Silaka, and Hluleka and indigenous forest reserves including Mt Thesiger,
Mt Sullivan, Ntlopeni, Lotana, Mbotyi, Egosa, Ntsubane as well as a proclaimed marine
reserve, adjacent to Mkambati. OR Tambo includes moderate and high rainfall areas,
principally along its sub-tropical coast, but also in pockets of mountainous areas, and
has a diversity of vegetation, from grasslands and thicket to forests and bushveld. The
District is considered to have the richest natural resources and the most fertile areas
in the country, with good soils and climatic conditions.
OR Tambo District is one of the four Integrated Sustainable Rural Development
Programme nodes in the Eastern Cape. The District has a population of 1,514,306 in
2019 and is the second most populous, after Amathole, accounting for 26.20% of the
Provincial population. However, OR Tambo occupies only 9.52% of provincial land,
making it the one of the most densely populated district, at around 108 people per km2.
Furthermore, women constitute 53% of the population and people aged under 20 years
account for 50%. OR Tambo has a Gini coefficient index of 0.56. The overwhelming
majority 66.5% of the population (using the lower poverty line) is living in poverty with
only 15% in the employment.
OR Tambo District Municipality is classified as a Category C2 municipality, indicating
a largely rural character and low urbanisation rate, as well as limited municipal staff
and budget capacity. All, but KSD, local municipalities are classed as Category B4
rural, reflecting limited institutional capacity and areas characterised by small centres,
limited SMMEs and market opportunities, dependence on public support and LED
activities.

PROFILE: OR TAMBO DISTRICT MUNICIPALITY 7
As of 14 June 2020, OR Tambo District accounted for 1516 COVID-19 cases, with 836
recoveries and 47 deaths. 7 quarantine sites has been activated with a total bed
capacity 90 beds. These are all located in Mthatha within the King Sabata Dalindyebo
local municipality. The District has developed a COVID-19 Disaster Management Plan,
which serves to outline the institutional arrangements and other response modalities
that would be utilised to contain the spread on the virus.
In 2018, OR Tambo District had a GDP of R 41.4 billion (up from R 20.2 billion in
2008), which accounted for a contribution of 11% to the Eastern Cape Province GDP
and ranked third relative to the other districts in the province. The community services
sector was the largest accounting for R 14.5 billion or 38.4% of the total GVA of the
district economy. The sector that contributes the second most to the GVA was the
trade sector at 23.0%, followed by the finance sector with 19.5%. The sector that
contributed the least was the mining sector with a contribution of R 77.4 million or
0.20% of the total GVA of the district.
In order to address the short to medium term challenges facing the district and create
conditions for the development of a sustainable regional economy, the following
interventions are proposed: Strengthen safety net for poor and child headed
households, accelerate the delivery of household infrastructure and services, grow
export focussed agricultural and agro-processing sector, strengthen the regional N2
coastal corridor link, activate large scale community-empowering tourism, safeguard
natural resource base and resolve mining vs tourism trade-off, expansion of the
forestry sector, develop oceans corridor, investing in skills development to promote
agriculture and support for Small Business/ Incubator focusing on agriculture.
PROFILE: OR TAMBO DISTRICT MUNICIPALITY
8
2. Introduction: Brief Overview 2.1 Location
2.2
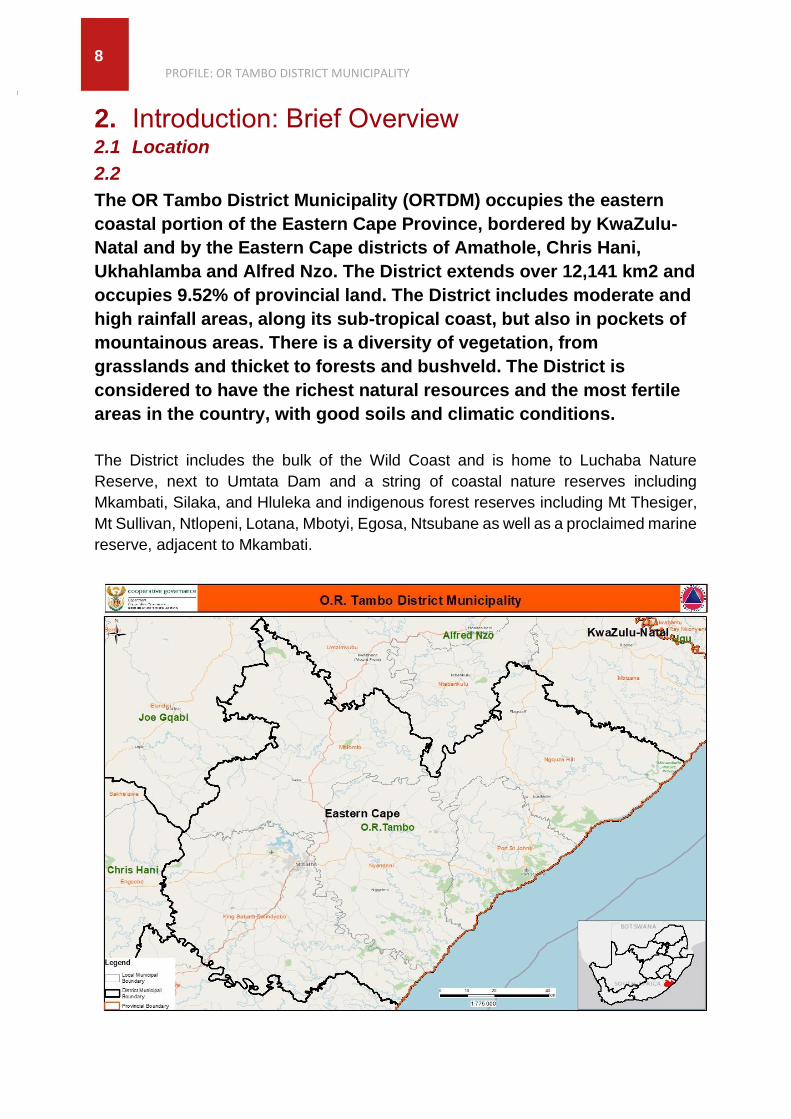
The OR Tambo District Municipality (ORTDM) occupies the eastern
coastal portion of the Eastern Cape Province, bordered by KwaZulu-
Natal and by the Eastern Cape districts of Amathole, Chris Hani,
Ukhahlamba and Alfred Nzo. The District extends over 12,141 km2 and
occupies 9.52% of provincial land. The District includes moderate and
high rainfall areas, along its sub-tropical coast, but also in pockets of
mountainous areas. There is a diversity of vegetation, from
grasslands and thicket to forests and bushveld. The District is
considered to have the richest natural resources and the most fertile
areas in the country, with good soils and climatic conditions.
The District includes the bulk of the Wild Coast and is home to Luchaba Nature
Reserve, next to Umtata Dam and a string of coastal nature reserves including
Mkambati, Silaka, and Hluleka and indigenous forest reserves including Mt Thesiger,
Mt Sullivan, Ntlopeni, Lotana, Mbotyi, Egosa, Ntsubane as well as a proclaimed marine
reserve, adjacent to Mkambati.

PROFILE: OR TAMBO DISTRICT MUNICIPALITY 9
2.2 Historical perspective
The OR Tambo District is named after Oliver Reginald Kaizana Tambo (27 October
1917 – 24 April 1993), who was a South African anti-apartheid politician and
revolutionary who served as President of the African National Congress (ANC) from
1967 to 1991. The District covers about 80% of the former Transkei magisterial
districts, the homeland of the Xhosa during the Apartheid era which had Mthatha as
the capital. The District is also host to the village of Mvezo, where the late former
President Nelson Mandela was born into the Madiba clan of the Thembu royal family.
The Nelson Mandela National Museum, situated in Mthatha.
2.3 Spatial Pattern
The OR Tambo District is one of the four Integrated Sustainable Rural Development
Programme (ISRDP) nodes in the Eastern Cape Province. The District has a long-term
vision: the “District Development Plan (DDP) Vision 2030” which the district adopted
in 2017. The DDP has five (5) Key Catalytic Programmes as follows:
1. District entities repositioned to drive Inclusive Economic Development (including
Ntinga OR Tambo Development Agency, PSJ Development Agency and Kei
Fresh)
2. Transformed Land Ownership, Development and Land Management
3. Agricultural Revitalization in the District
4. ICT enabled Socio Economic Development
5. Optimized Management of Water Services (resources and services)

PROFILE: OR TAMBO DISTRICT MUNICIPALITY
10
The OR Tambo District is formed by five local municipalities as discussed below:

PROFILE: OR TAMBO DISTRICT MUNICIPALITY 11
King Sabata Dalindyebo (KSD) Local Municipality is named in tribute of the
freedom fighter and King of the Aba Thembu nation who was forced to exile as result
of his resistance to apartheid and the Bantustan mode of governance. He died in exile
in 1986 and reburied at the Great Place of Bumbane outside Mthatha in 1989.
At 3 091 Km2 KSD is the largest of the five municipalities the district accounting for a
quarter of its geographical area. The municipality was formed before the local
government elections in the year 2000, when the Mqanduli and Mthatha Transitional
and Rural Councils were merged. The majority population of the municipality resides
in the rural areas, where they still practice cultural tradition. The municipality has both
an urban and a rural character, including a prominent national urban settlement and
regional economic hub, as well as dispersed village-type rural settlements. Mthatha is
a major transport and regional service centre, dissected by the N2 running southwest
to northeast through the town.
King Sabata Dalindyebo Municipality still retains many of the earliest buildings of the
neoclassical style that was popular during the colonial times. Key towns are Mqanduli
and Mthatha (previously Umtata). Mthatha is the economic centre of the District and
the host to both the Local and District Municipality’s Offices. The main economic
activities are community services (48%), finance (21%), and trade (18%). There is also
a presence of agriculture and forestry activities.
Nyandeni Local Municipality derives its name from the isiXhosa word “inyanda”,
which is a bundle of wood that is carried by Pondo women on their heads for making
a cooking fire. The municipality derives its name from an old story of how the King of
eastern Pondoland, Ndamase, crossed the great Umzimvubu River. It is said that his
subjects were confused on how to cross the river because it was flooded. He thought
of a plan to tie the sticks together and place them on the water like a raft and ride the
“inyanda” across the river. He built his house about 70km from the river, and that place
was called Nyandeni.
The municipality shares boundaries with Mhlontlo to the north, to the east is Port St
Johns, and to the west is King Sabata Dalindyebo, and to the south the Indian Ocean.
At 2 474 km2 the municipality makes up almost a quarter of the district’s geographical
area. It is situated approximately 30km south of Mthatha and 50km north of Port St
Johns, and is bordered by a 20km stretch of the coastal belt on the eastern part and
Umzimvubu River on the western part.
Towns include Libode and Nqeleni. This municipality is predominantly rural with widely
dispersed traditional and village-type settlements. Most of the inhabitants of the
PROFILE: OR TAMBO DISTRICT MUNICIPALITY
12
municipality still rely on subsistence agriculture in areas marked by communal tenure.
The LM is regarded as having considerable agricultural potential, although there has
been limited exploitation of this potential. Key economic activities are community
services (63.4%), trade (16.1%), and finance (10.4%).
”INGQUZA HILL LOCAL MUNICIPALITY DERIVES
ITS NAME FROM THE MOUNTAIN RANGE OF
THE SAME NAME WHICH TRANSVERSES THE
MUNICIPALITY AND WAS THE SCENE OF
THE 1950 – 1962 MPONDO REVOLT.”
Port St Johns Local Municipality derives its name from Portuguese Sao Joao,
presumably named either after a ship which was shipwrecked near Port Edward, 21 of
the 600 soldiers survived eventually finding their way to Mozambique through the
coastline. Prior to shipwrecking the ship has coasted via the area with its mountain
which also coincidentally has an outline of the face of an apostle. The area was settled
in about 1884.
The municipality is bounded by Lusikisiki in the north, Mthatha in the south, and Libode
in the west. At 1 291 km2 It is the smallest of the five municipalities in the district,
making up 11% of its geographical area. It comprises coastal and inland areas that fall
under the jurisdiction of the former Transkei. The seat of the municipality is in the main
town of Port St Johns, which is known for its beautiful beaches and mountainous
terrain, with hills, cliffs and sandy dunes. The town itself is located at the mouth of the
Umzimvubu River, approximately 90km east of Mthatha. The municipality’s beautiful
scenery, its natural vegetation and the pristine beaches referred to above are the main
attractions for tourism. It has land for commercial use and an environmentally-friendly
residential area. There are 1 053 types of plants and 164 plant families found around
Port St Johns. This unique vegetation harbours rare bird species, providing evidence
of the rich biodiversity in Port St Johns. The key economic activities are tourism and
agriculture.
PROFILE: OR TAMBO DISTRICT MUNICIPALITY 13
Ingquza Hill Local Municipality derives its name from the mountain range of the
same name which transverses the municipality and was the scene of the 1950 – 1962
Mpondo Revolt.
This municipality was formerly known as Qaukeni and its main towns are Flagstaff and
Lusikisiki. It shares boundaries with Ntabankulu and Mbizana Local Municipalities to
the north, and Port St Johns and the Indian Ocean to the South. Ingquza Hill
municipality is characterized by limited coastal settlements and widely dispersed
settlements in traditional rural villages. The municipal area is furthermore
characterized by large forest areas in close proximity to the coastline, with a total of
ten rivers flowing through it. The Mkambati Nature Reserve is situated within the
coastal zone. The LM is believed to hold significant Tourism, Forestry, and Marine
Aquaculture potential. However, the key economic activities are construction (11.9%),
finance (7.7%), electricity (4.5%), community services (2.5%), agriculture, and
trade/manufacturing.
Mhlontlo LM is named in honour of a chief of the Pondomise people who was stripped
of his chieftainship by the government of the time because the Pondomise people killed
the magistrate of Qumbu.
The municipality lies on the north-east side of the Eastern Cape provincial boundary
alongside the N2 route between Mthatha and Mt Frere, and the R396 between Tsolo
and Maclear. It shares boundaries with the Umzimvubu Local Municipality to the north,
King Sabata Dalindyebo Local Municipality to the south, Nyandeni Local Municipality
to the east, and Elundini Local Municipality to the west. At 2 880 km2 it makes up a
quarter of the district’s geographical area.
This municipality is predominantly rural and hosts Tsolo and Qumbu as local service
centres, and six rural nodes namely; Sulenkama, St Curthberts, Caba, Shawbury and
Langeni Forest. The N2 runs through the municipality from the southwest to the
northeast. The majority of the land is used for agricultural purposes and subsistence
farming, notably for grazing, in areas marked by communal tenure. The area boasts
several tourist attractions including the Tsitsa Falls and Tina Falls, the Tina River
ribbon and the Mabeleni Dam, which is famous for its trout fishing.
Key towns are Qumbu and Tsolo. The latter used to host an agricultural college. The
key economic drivers are wholesale and retail trade (10.8%), agriculture, forestry and
fishing (3.3%)

PROFILE: OR TAMBO DISTRICT MUNICIPALITY
14
The OR Tambo District reviewed its Spatial Development Framework in 2017 and it
identifies the following nodes and corridors:
Nodes:
• District Centre (DC): - Mthatha is the only primary node in the district
• Sub-District Centre (S-DC): Lusikisiki and Port St. Johns are the secondary nodes
of the district.
• Local Centre (LC): Qumbu, Tsolo, Libode, Ngqeleni, Mqanduli and Flagstaff
• Sub-Local Centre (SLC): Tabase, Majola, Zincuka, Gwadana, Bolotwa, Nqadu,
Baziya, Kwaaiman, Mvezo, Qolokweni, Nkozo, Mthontsana, Mpeko, Mqhekezweni,
Mbotyi, Msikaba
• First Order Coastal Nodes: Coffee Bay, Umtata Mouth, Port St Johns
• Second Order Coastal Nodes: Msikaba, Mbotyi, Umngazi Mouth, Mngazana,
Sinangwana, Presley Bay, Lwandile, Hole in the Wall
Activity corridors
• Primary corridor (PC): East London/Mthatha–Kokstad N2 and Railway Corridor
• Mobility routes (MB): N2, R61, Ugie-Langeni Road, R394 and proposed N2 Toll
Road
• Special Routes-Tourism Focus (SP-TF): Wild Coast Meander, Thunga Thunga
Route, Mandela Route, R394- Mthatha via Mqanduli
The O.R Tambo District Local Economic Development Strategy identifies a number
of proposed strategic developments which will effect major structural changes to the
region’s economic and spatial configuration. These major projects emerge from the
National Strategic Integrated Project (SIP 3) interlinked with the Provincial Integrated
Wild Coast Development Programme (IWCDP). The highlighted projects include:
• N2 Wild Coast Toll Road- specifically the new routing between Mthatha and
Port Edward
• Wild Coast Meander- a low-volume road along the Wild Coast linking Port St
Johns, Mthatha Mouth and Coffee Bay
• Wild Coast Special Economic Zone (SEZ) - the SEZ includes the development
of an agro-processing hub/ zone in the vicinity of the Mthatha airport, and a
tourism corridor linking Mvezo, Coffee Bay and Mthatha Mouth.
• Formal establishment of Coffee Bay/ Hole in the Wall as a town.
PROFILE: OR TAMBO DISTRICT MUNICIPALITY 15
2.4 Land Ownership
Most of the land in the OR Tambo District is either government-owned or falls under a
Tribal Authority. Legal forms of land tenure in the District include: freehold (mainly
concentrated in the urban centres or townships, certain shops in rural areas, providing
security to the owner), Permission-To- Occupy (mainly in the rural owners where there
is no right of ownership), leasehold and grazing rights on commonage. The District has
initiated the Land and Investment Conference in order to ensure transformation in land
ownership, land management, land security, and to enable communities to benefit from
land development and to secure long-term investments.
3. Social Development Profile 3.1 Key Social Demographics
Population
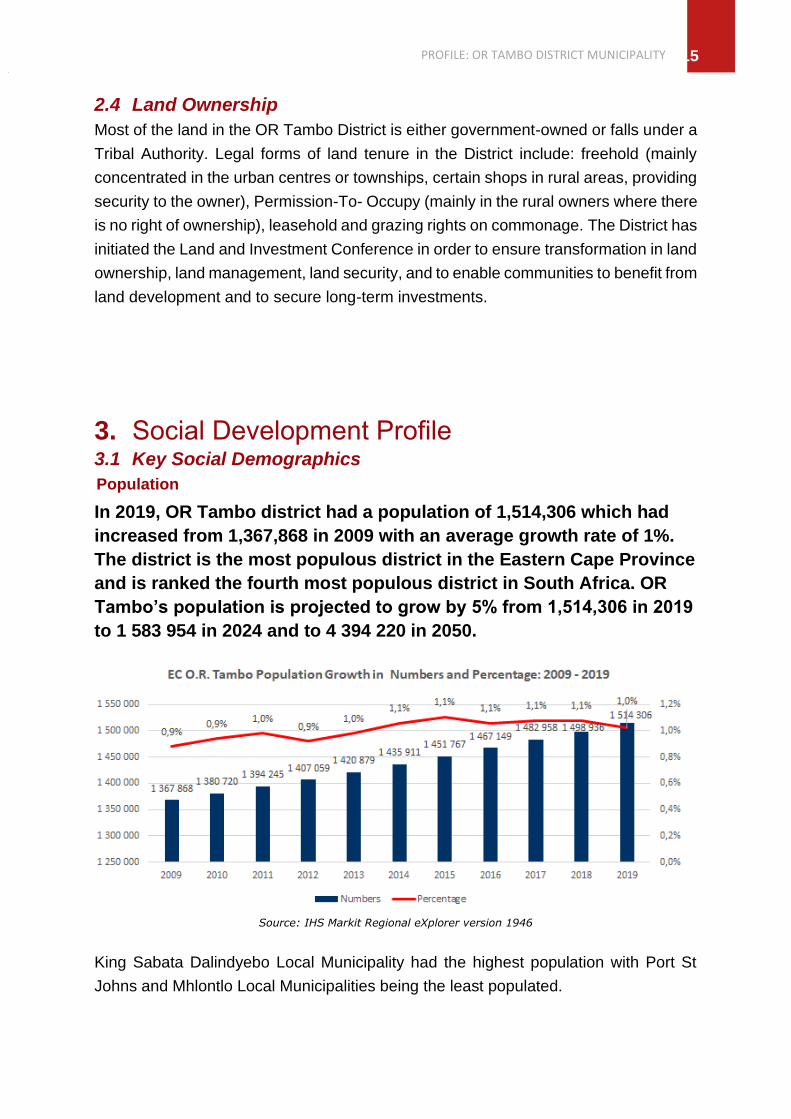
In 2019, OR Tambo district had a population of 1,514,306 which had
increased from 1,367,868 in 2009 with an average growth rate of 1%.
The district is the most populous district in the Eastern Cape Province
and is ranked the fourth most populous district in South Africa. OR
Tambo’s population is projected to grow by 5% from 1,514,306 in 2019
to 1 583 954 in 2024 and to 4 394 220 in 2050.
Source: IHS Markit Regional eXplorer version 1946
King Sabata Dalindyebo Local Municipality had the highest population with Port St
Johns and Mhlontlo Local Municipalities being the least populated.
PROFILE: OR TAMBO DISTRICT MUNICIPALITY
16
Gender, Age and Race
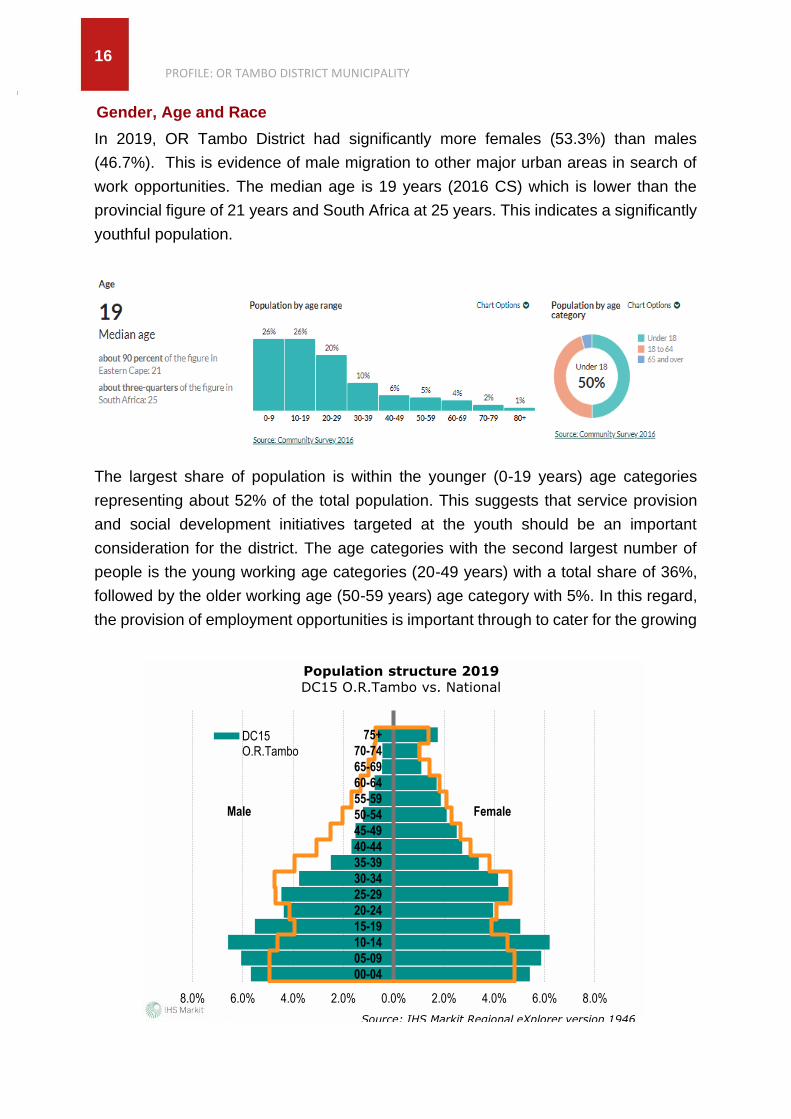
In 2019, OR Tambo District had significantly more females (53.3%) than males
(46.7%). This is evidence of male migration to other major urban areas in search of
work opportunities. The median age is 19 years (2016 CS) which is lower than the
provincial figure of 21 years and South Africa at 25 years. This indicates a significantly
youthful population.
The largest share of population is within the younger (0-19 years) age categories
representing about 52% of the total population. This suggests that service provision
and social development initiatives targeted at the youth should be an important
consideration for the district. The age categories with the second largest number of
people is the young working age categories (20-49 years) with a total share of 36%,
followed by the older working age (50-59 years) age category with 5%. In this regard,
the provision of employment opportunities is important through to cater for the growing
8.0% 6.0% 4.0% 2.0% 0.0% 2.0% 4.0% 6.0% 8.0%
00-04
05-09
10-14
15-19
20-24
25-29
30-34
35-39
40-44
45-49
50-54
55-59
60-64
65-69
70-74
75+
Population structure 2019
DC15 O.R.Tambo vs. National
DC15O.R.Tambo
Male Female
Source: IHS Markit Regional eXplorer version 1946

PROFILE: OR TAMBO DISTRICT MUNICIPALITY 17
population. The OR Tambo District’s population consist of 99% African, 0.2% White,
0.5% Coloured and 0.3% Asian people.
3.1.3 Households
In 2016, the OR Tambo District had 314,079 households, which had increased to
354,168 households in 2019.
The average size of a household has remained the same at 4.3 while that of the
province has decreased from 3.9 to 3.7. In OR Tambo District, 14,313 households are
child-headed within the 15-19 age group, with 837 households headed by children in
the 10-14 age group and 57.2% of households were headed by women.
3.2 Health Profile
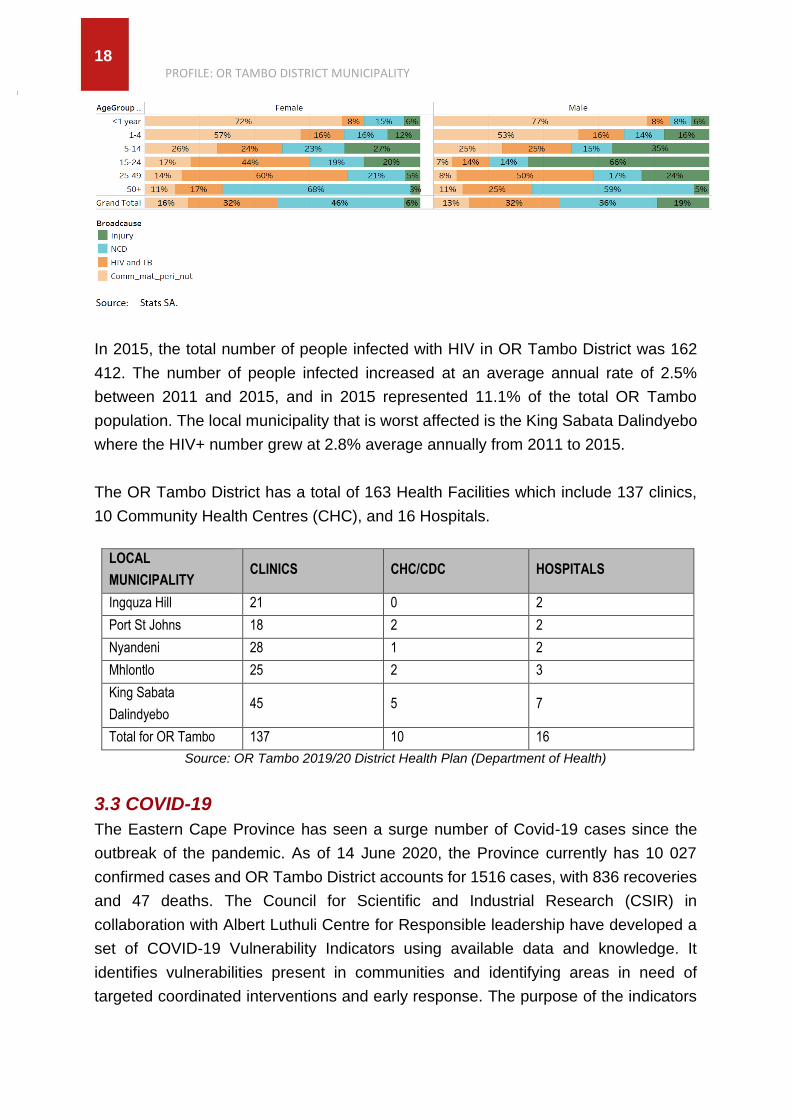
The leading cause of death for children below the age of 5 years is diarrheal diseases
at 26.3% of total deaths followed by lower respiratory diseases at 17.0% in that age
group. For age group 5-14, the leading cause of death is TB at 13.7% followed by
HIV/AIDS at 11.9%. For the 15-24 and 25-64 age groups is HIV at 16.3% and 27.7%
respectively. The leading cause of death for those above 65 is cerebrovascular disease
which accounts for 15.7% of the deaths. In terms of maternal conditions, the top three
causes of death included indirect maternal diseases which accounted for 29.9% of
deaths followed hypertension in pregnancy at 20.3% and other maternal diseases at
18.4% and respectively.
PROFILE: OR TAMBO DISTRICT MUNICIPALITY
18
In 2015, the total number of people infected with HIV in OR Tambo District was 162
412. The number of people infected increased at an average annual rate of 2.5%
between 2011 and 2015, and in 2015 represented 11.1% of the total OR Tambo
population. The local municipality that is worst affected is the King Sabata Dalindyebo
where the HIV+ number grew at 2.8% average annually from 2011 to 2015.
The OR Tambo District has a total of 163 Health Facilities which include 137 clinics,
10 Community Health Centres (CHC), and 16 Hospitals.
LOCAL
MUNICIPALITY CLINICS CHC/CDC HOSPITALS
Ingquza Hill 21 0 2
Port St Johns 18 2 2
Nyandeni 28 1 2
Mhlontlo 25 2 3
King Sabata
Dalindyebo 45 5 7
Total for OR Tambo 137 10 16
Source: OR Tambo 2019/20 District Health Plan (Department of Health)
3.3 COVID-19
The Eastern Cape Province has seen a surge number of Covid-19 cases since the
outbreak of the pandemic. As of 14 June 2020, the Province currently has 10 027
confirmed cases and OR Tambo District accounts for 1516 cases, with 836 recoveries
and 47 deaths. The Council for Scientific and Industrial Research (CSIR) in
collaboration with Albert Luthuli Centre for Responsible leadership have developed a
set of COVID-19 Vulnerability Indicators using available data and knowledge. It
identifies vulnerabilities present in communities and identifying areas in need of
targeted coordinated interventions and early response. The purpose of the indicators
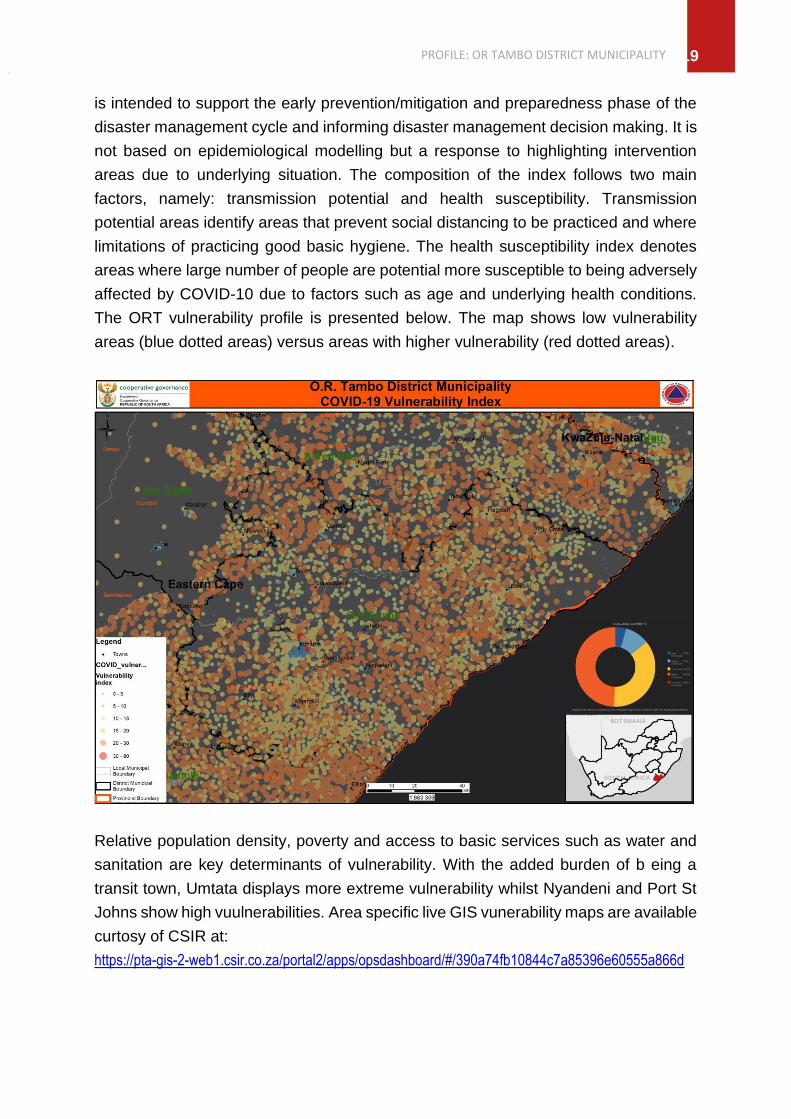
PROFILE: OR TAMBO DISTRICT MUNICIPALITY 19
is intended to support the early prevention/mitigation and preparedness phase of the
disaster management cycle and informing disaster management decision making. It is
not based on epidemiological modelling but a response to highlighting intervention
areas due to underlying situation. The composition of the index follows two main
factors, namely: transmission potential and health susceptibility. Transmission
potential areas identify areas that prevent social distancing to be practiced and where
limitations of practicing good basic hygiene. The health susceptibility index denotes
areas where large number of people are potential more susceptible to being adversely
affected by COVID-10 due to factors such as age and underlying health conditions.
The ORT vulnerability profile is presented below. The map shows low vulnerability
areas (blue dotted areas) versus areas with higher vulnerability (red dotted areas).
Relative population density, poverty and access to basic services such as water and
sanitation are key determinants of vulnerability. With the added burden of b eing a
transit town, Umtata displays more extreme vulnerability whilst Nyandeni and Port St
Johns show high vuulnerabilities. Area specific live GIS vunerability maps are available
curtosy of CSIR at:
https://pta-gis-2-web1.csir.co.za/portal2/apps/opsdashboard/#/390a74fb10844c7a85396e60555a866d

PROFILE: OR TAMBO DISTRICT MUNICIPALITY
20
The District has developed a COVID-19 Disaster Management Plan, which serves to
outline the institutional arrangements and other response modalities that would be
utilised by the District in its effort to contain the spread on the virus. Accordingly, the
District has established the relevant structures at political and technical level which
include the District Command Council and Command Centre.
The OR Tambo District has a total of 39 quarantine facilities identified with a total bed
capacity of 1360. Out of the 39 facilities, 7 of these facilities has been activated with a
total bed capacity 90 beds. These are all located in Mthatha within the King Sabata
Dalindyebo local municipality.
LOCAL MUNICIPALITY NAME OF FACILITY PRIVATE
OR STATE OWNED
BEDS
AVAILABLE STATUS
King Sabata Dalindyebo La Maison Guest House Private 15 Activated
King Sabata Dalindyebo Real Vision Guest House Private 9 Activated
King Sabata Dalindyebo Twin Lodge Guest House Private 18 Activated
King Sabata Dalindyebo Mthatha Rest Lodge Private 10 Activated
King Sabata Dalindyebo Lat Grande Lodge Private 12 Activated
King Sabata Dalindyebo Sikhumbule Nathi Guest House Private 11 Activated
King Sabata Dalindyebo Idwala Lam Guest House Private 15 Activated
TOTAL FOR
OR TAMBO 90
3.4 Poverty Dimensions
3.4.1 Distribution
In 2019, there were 1,006,431 people living in poverty, using the lower poverty line
definition, across the OR Tambo District which accounts for 66.5% of the total
population. This is significantly higher percentage of the population when compared to
the Eastern Cape provincial figure which was at 54.3%. OR Tambo was ranked fourth
in terms of the poorest districts in the country. 3 out of the 10 poorest local
municipalities in the country are in OR Tambo District which are Port St Johns (73.5%),
Nyandeni (72.5%) and Ingquza Hill (72.3%).
According to the 2016 Community Survey, 18 % of households in OR Tambo skipped
a meal in the last 12 months and 27 % of households ran out of money to buy food. As
a consequence of the poverty levels, there is a cumulative total of 683,584 grant
dependents in the district. The number of beneficiaries per grant type is indicated in
the table below:

PROFILE: OR TAMBO DISTRICT MUNICIPALITY 21
GRANT TYPE TOTAL BENEFICIARIES
Care Dependency Grant 5,206
Child Support Grant 510,208
Combination (Care Dependency and Child Support) 1,099
Disability Grant 33,619
Foster Care Grant 19,585
Grant-In-Aid 5,532
Old Age Grant 108,335
TOTAL 683,584
Source: SASSA (as of 30 April 2020)
3.4.2 Inequality
OR Tambo District has a Gini coefficient of 0.56, which is below the provincial index
value of 0.62. In terms of the Gini coefficient for each of the local municipalities within
the District, King Sabata Dalindyebo has the highest Gini coefficient, with an index
value of 0.58. The lowest Gini coefficient can be observed in Nyandeni with an index
value of 0.51.
In OR Tambo District, an estimated population of 400 941 earn an amount ranging
from R1-400 per month which is the highest form of income followed by income levels
of R801-R1,600 income per month. An estimated 599 829 of the population within
0.50
0.52
0.54
0.56
0.58
0.60
0.62
0.64
0.66
2008 2009 2010 2011 2012 2013 2014 2015 2016 2017 2018
Gini coefficient
O.R.Tambo, Eastern Cape and National Total, 2008-2018
O.R.Tambo Eastern Cape National Total
Source: IHS Markit Regional eXplorer version 1750
PROFILE: OR TAMBO DISTRICT MUNICIPALITY
22
receive no income at all. The average annual household income was R14 600, which
is significantly lower than the national average at R29 400.
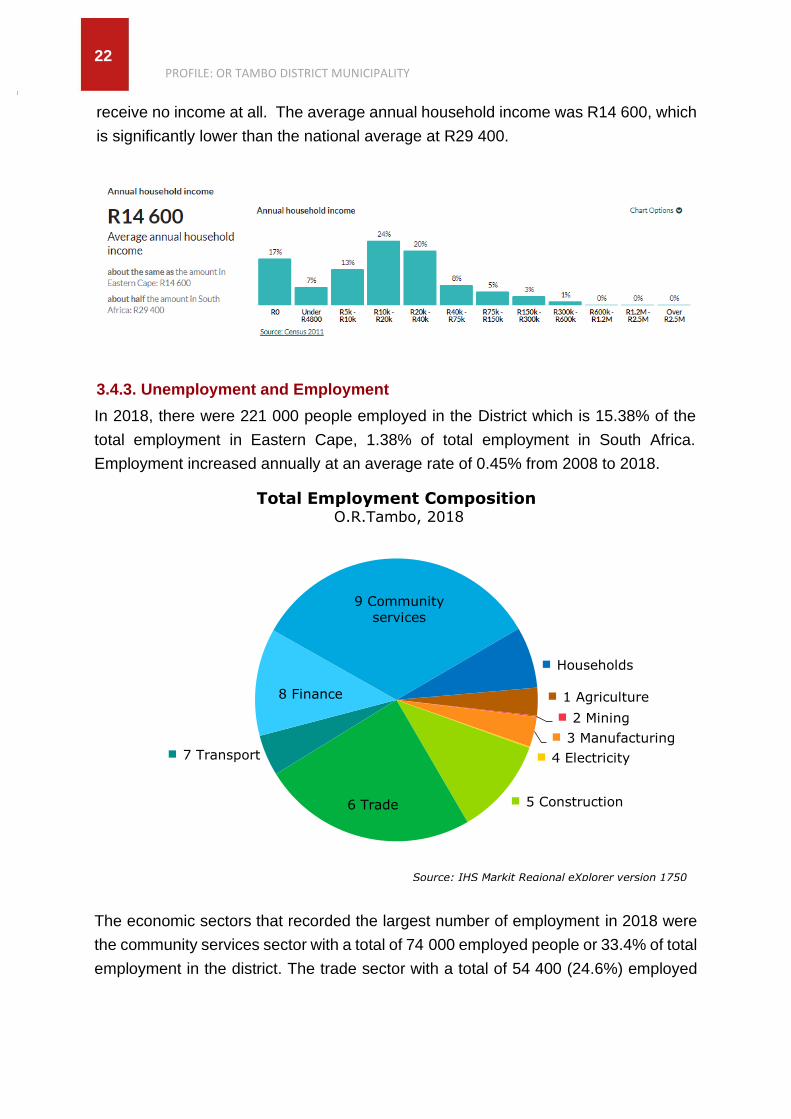
3.4.3. Unemployment and Employment
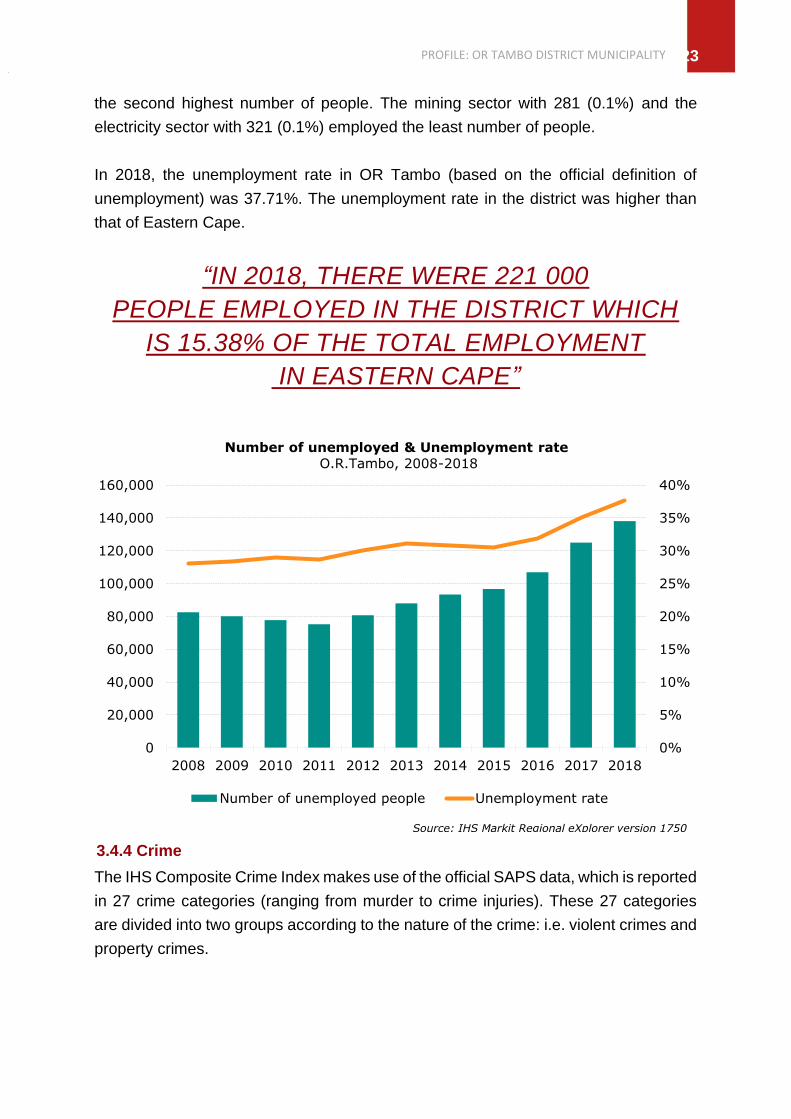
In 2018, there were 221 000 people employed in the District which is 15.38% of the
total employment in Eastern Cape, 1.38% of total employment in South Africa.
Employment increased annually at an average rate of 0.45% from 2008 to 2018.
The economic sectors that recorded the largest number of employment in 2018 were
the community services sector with a total of 74 000 employed people or 33.4% of total
employment in the district. The trade sector with a total of 54 400 (24.6%) employed
1 Agriculture
2 Mining
3 Manufacturing
4 Electricity
5 Construction6 Trade
7 Transport
8 Finance
9 Community
services
Households
Total Employment Composition O.R.Tambo, 2018
Source: IHS Markit Regional eXplorer version 1750
PROFILE: OR TAMBO DISTRICT MUNICIPALITY 23
the second highest number of people. The mining sector with 281 (0.1%) and the
electricity sector with 321 (0.1%) employed the least number of people.
In 2018, the unemployment rate in OR Tambo (based on the official definition of
unemployment) was 37.71%. The unemployment rate in the district was higher than
that of Eastern Cape.
“IN 2018, THERE WERE 221 000
PEOPLE EMPLOYED IN THE DISTRICT WHICH
IS 15.38% OF THE TOTAL EMPLOYMENT
IN EASTERN CAPE”
3.4.4 Crime
The IHS Composite Crime Index makes use of the official SAPS data, which is reported
in 27 crime categories (ranging from murder to crime injuries). These 27 categories
are divided into two groups according to the nature of the crime: i.e. violent crimes and
property crimes.
0%
5%
10%
15%
20%
25%
30%
35%
40%
0
20,000
40,000
60,000
80,000
100,000
120,000
140,000
160,000
2008 2009 2010 2011 2012 2013 2014 2015 2016 2017 2018
Number of unemployed & Unemployment rate
O.R.Tambo, 2008-2018
Number of unemployed people Unemployment rate
Source: IHS Markit Regional eXplorer version 1750

PROFILE: OR TAMBO DISTRICT MUNICIPALITY
24
For the period 2007/2008 to 2017/2018, the overall crime in OR Tambo District has
decreased at an average annual rate of 1.79%. Violent crime decreased by 1.96%
since 2007/2008, while property crimes decreased by 0.22% between the 2007/2008
and 2017/2018 financial years. The ratio of police stations to population is low,
although average geographical coverage is comparatively high.
3.5 Levels of Education
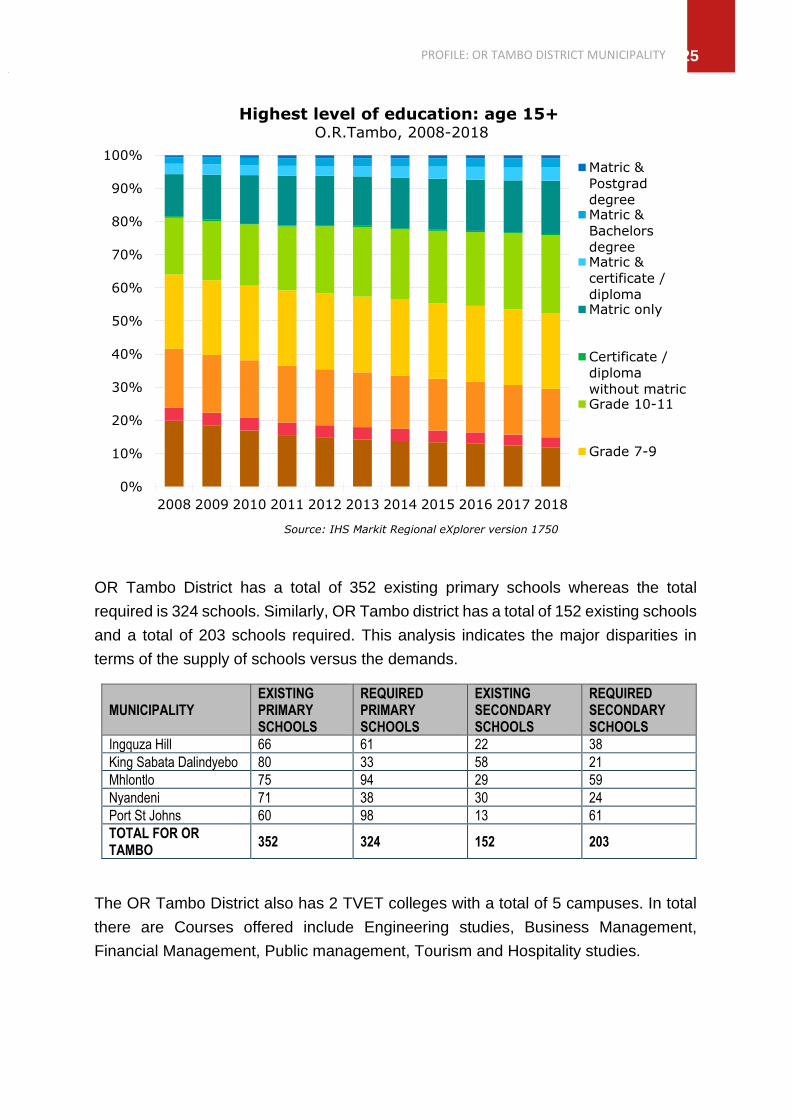
Within OR Tambo District, the number of people without any schooling decreased from
2008 to 2018 with an average annual rate of -3.19%, while the number of people within
the 'matric only' category, increased from 80,100 to 124,000. The number of people
with 'matric and a certificate/diploma' increased with an average annual rate of 4.94%,
with the number of people with a 'matric and a Bachelor's' degree increasing with an
average annual rate of 5.11%. Overall improvement in the level of education is visible
with an increase in the number of people with 'matric' or higher education.
0
10
20
30
40
50
60
70
80
90
100
2007/2008 2008/2009 2009/2010 2010/2011 2011/2012 2012/2013 2013/2014 2014/2015 2015/2016 2016/2017 2017/2018
Overall, Violent and Property Crime Index O.R.Tambo, 2007/2008-2017/2018
OverallCrime Index Violent Crime Index Property Crime Index
Source: IHS Markit Regional eXplorer version 1750
PROFILE: OR TAMBO DISTRICT MUNICIPALITY 25
OR Tambo District has a total of 352 existing primary schools whereas the total
required is 324 schools. Similarly, OR Tambo district has a total of 152 existing schools
and a total of 203 schools required. This analysis indicates the major disparities in
terms of the supply of schools versus the demands.
MUNICIPALITY EXISTING PRIMARY SCHOOLS
REQUIRED PRIMARY SCHOOLS
EXISTING SECONDARY SCHOOLS
REQUIRED SECONDARY SCHOOLS
Ingquza Hill 66 61 22 38
King Sabata Dalindyebo 80 33 58 21
Mhlontlo 75 94 29 59
Nyandeni 71 38 30 24
Port St Johns 60 98 13 61
TOTAL FOR OR TAMBO
352 324 152 203
The OR Tambo District also has 2 TVET colleges with a total of 5 campuses. In total
there are Courses offered include Engineering studies, Business Management,
Financial Management, Public management, Tourism and Hospitality studies.
0%
10%
20%
30%
40%
50%
60%
70%
80%
90%
100%
2008 2009 2010 2011 2012 2013 2014 2015 2016 2017 2018
Highest level of education: age 15+ O.R.Tambo, 2008-2018
Matric &
Postgrad
degreeMatric &
Bachelors
degreeMatric &
certificate /
diplomaMatric only
Certificate /
diploma
without matricGrade 10-11
Grade 7-9
Source: IHS Markit Regional eXplorer version 1750

PROFILE: OR TAMBO DISTRICT MUNICIPALITY
26
NAME OF INSTITUTION CAMPUSES TOTAL NUMBER OF
STUDENTS ENROLLED
Ingwe TVET Ngqungqushe 5016
King Sabata Dalindyebo TVET
Libode 878
Mapuzi 493
Mthatha 7456
Ntabozuku 820
Walter Sisulu University Zamukulungisa 14 892
TOTAL 29 555
“OR TAMBO DISTRICT HAS A TOTAL OF 352
EXISTING PRIMARY SCHOOLS WHEREAS THE
TOTAL REQUIRED IS 324 SCHOOLS.”

PROFILE: OR TAMBO DISTRICT MUNICIPALITY 27
PROFILE: OR TAMBO DISTRICT MUNICIPALITY
28
4. 4. Drivers of the Economy 4.1 Economic overview
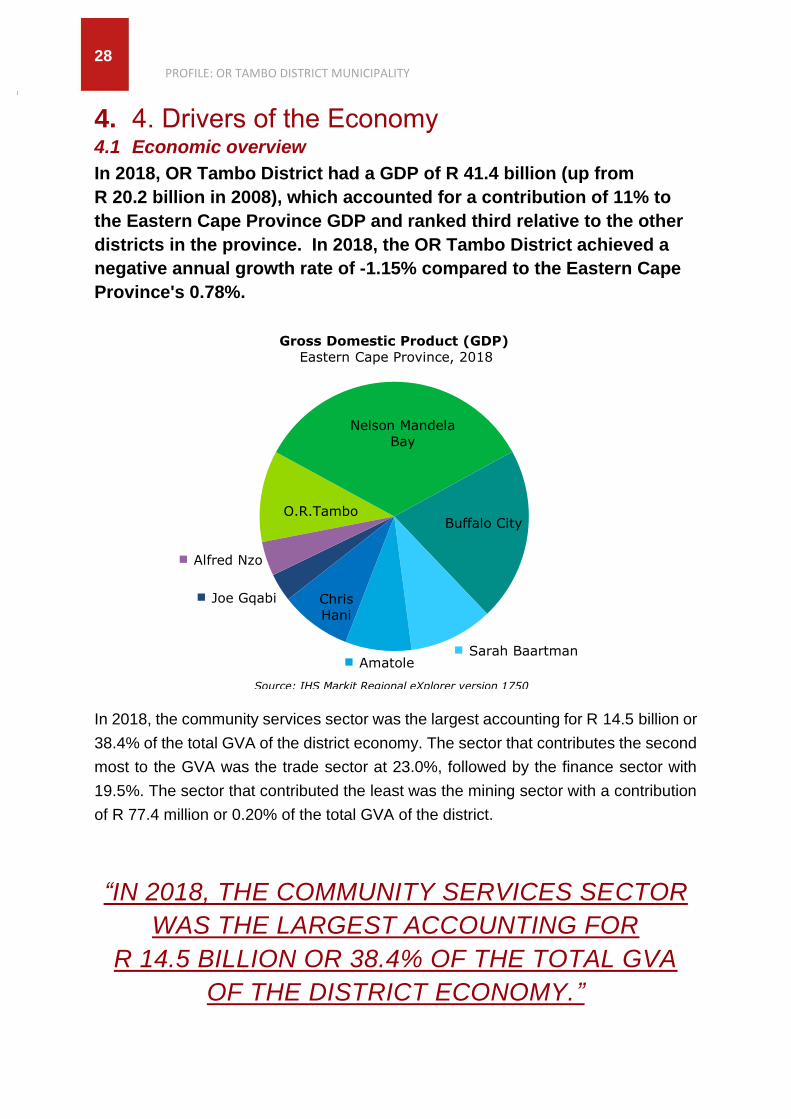
In 2018, OR Tambo District had a GDP of R 41.4 billion (up from
R 20.2 billion in 2008), which accounted for a contribution of 11% to
the Eastern Cape Province GDP and ranked third relative to the other
districts in the province. In 2018, the OR Tambo District achieved a
negative annual growth rate of -1.15% compared to the Eastern Cape
Province's 0.78%.
In 2018, the community services sector was the largest accounting for R 14.5 billion or
38.4% of the total GVA of the district economy. The sector that contributes the second
most to the GVA was the trade sector at 23.0%, followed by the finance sector with
19.5%. The sector that contributed the least was the mining sector with a contribution
of R 77.4 million or 0.20% of the total GVA of the district.
“IN 2018, THE COMMUNITY SERVICES SECTOR
WAS THE LARGEST ACCOUNTING FOR
R 14.5 BILLION OR 38.4% OF THE TOTAL GVA
OF THE DISTRICT ECONOMY.”
O.R.Tambo
Nelson Mandela
Bay
Buffalo City
Sarah BaartmanAmatole
Chris
Hani
Joe Gqabi
Alfred Nzo
Gross Domestic Product (GDP)
Eastern Cape Province, 2018
Source: IHS Markit Regional eXplorer version 1750

PROFILE: OR TAMBO DISTRICT MUNICIPALITY 29
OR Tambo Eastern
Cape National
Total OR Tambo as % of province
OR Tambo as % of national
Agriculture 0.5 6.7 106.1 6.8% 0.43%
Mining 0.1 0.4 350.9 17.4% 0.02%
Manufacturing 1.9 43.6 572.9 4.3% 0.33%
Electricity 1.4 9.0 166.0 15.6% 0.84%
Construction 1.2 13.3 170.3 9.1% 0.71%
Trade 8.7 67.9 652.7 12.8% 1.33%
Transport 2.2 30.3 426.7 7.4% 0.53%
Finance 7.4 61.4 854.4 12.0% 0.86%
Community services 14.5 102.7 1,041.3 14.1% 1.39%
Total Industries 37.8 335.3 4,341.3 11.3% 0.87%
The OR Tambo District has identified the following five (5) priority areas as key
contributors to the economy and job creation in partnerships with the private sector.
These are Green Economy, Agriculture, Mining, Manufacturing and Tourism.
4.2 Primary sector
The primary sector consists of two broad economic sectors namely the mining and the
agricultural sector.
Between 2008 and 2018, the agriculture sector experienced the highest positive
growth in 2017 with an average growth rate of 13.2%. The mining sector reached its
-20%
-15%
-10%
-5%
0%
5%
10%
15%
2008 2009 2010 2011 2012 2013 2014 2015 2016 2017 2018
Gross value added (GVA) by primary sector O.R.Tambo, 2008-2018
Agriculture Mining
Source: IHS Markit Regional eXplorer version 1750
PROFILE: OR TAMBO DISTRICT MUNICIPALITY
30
highest point of growth of 5.2% in 2014. The agricultural sector experienced the lowest
growth for the period during 2016 at -14.7%, while the mining sector reaching its lowest
point of growth in 2009 at -12.8%.
In OR Tambo District, the agriculture sector has been identified as the sector with the
highest growth potential up to 2023, but prone to very high volatility because of
uncertain weather conditions, pests and other natural causes.
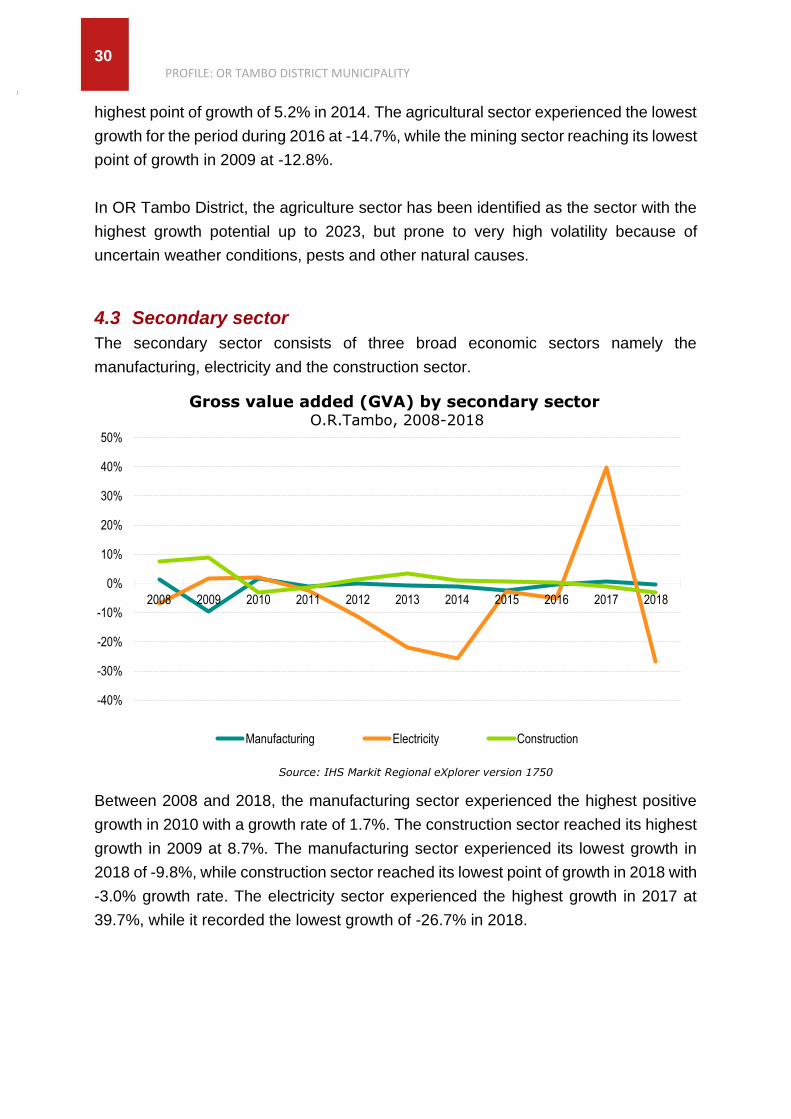
4.3 Secondary sector
The secondary sector consists of three broad economic sectors namely the
manufacturing, electricity and the construction sector.
Between 2008 and 2018, the manufacturing sector experienced the highest positive
growth in 2010 with a growth rate of 1.7%. The construction sector reached its highest
growth in 2009 at 8.7%. The manufacturing sector experienced its lowest growth in
2018 of -9.8%, while construction sector reached its lowest point of growth in 2018 with
-3.0% growth rate. The electricity sector experienced the highest growth in 2017 at
39.7%, while it recorded the lowest growth of -26.7% in 2018.
-40%
-30%
-20%
-10%
0%
10%
20%
30%
40%
50%
2008 2009 2010 2011 2012 2013 2014 2015 2016 2017 2018
Gross value added (GVA) by secondary sector O.R.Tambo, 2008-2018
Manufacturing Electricity Construction
Source: IHS Markit Regional eXplorer version 1750

PROFILE: OR TAMBO DISTRICT MUNICIPALITY 31
4.4 Tertiary sector
The tertiary sector consists of four broad economic sectors namely the trade, transport,
finance and the community services sector.
The trade sector experienced the highest positive growth in 2008 with a growth rate of
3.1%. The transport sector reached its highest point of growth in 2014 at 1.8%. The
finance sector experienced the highest growth rate in 2008 when it grew by 5.4% and
recorded the lowest growth rate in 2009 at -1.6%. The Trade sector also had the lowest
growth rate in 2009 at -3.6%. The community services sector, which largely consists
of government, experienced its highest positive growth in 2008 with 3.6% and the
lowest growth rate in 2009 with -0.7%.
4.5 Informal economy
The number of people employed in the informal sector counted 56 000 or 25.28% of
the total employment. Informal employment in OR Tambo decreased from 58 200 in
2008 to an estimated 56 000 in 2018.
“THE TRADE SECTOR EXPERIENCED THE
HIGHEST POSITIVE GROWTH IN 2008 WITH
A GROWTH RATE OF 3.1%.”
-5%
-4%
-3%
-2%
-1%
0%
1%
2%
3%
4%
5%
6%
2008 2009 2010 2011 2012 2013 2014 2015 2016 2017 2018
Gross value added (GVA) by tertiary sector
O.R.Tambo, 2008-2018
Trade Transport Finance Community services
Source: IHS Markit Regional eXplorer version 1750
PROFILE: OR TAMBO DISTRICT MUNICIPALITY
32
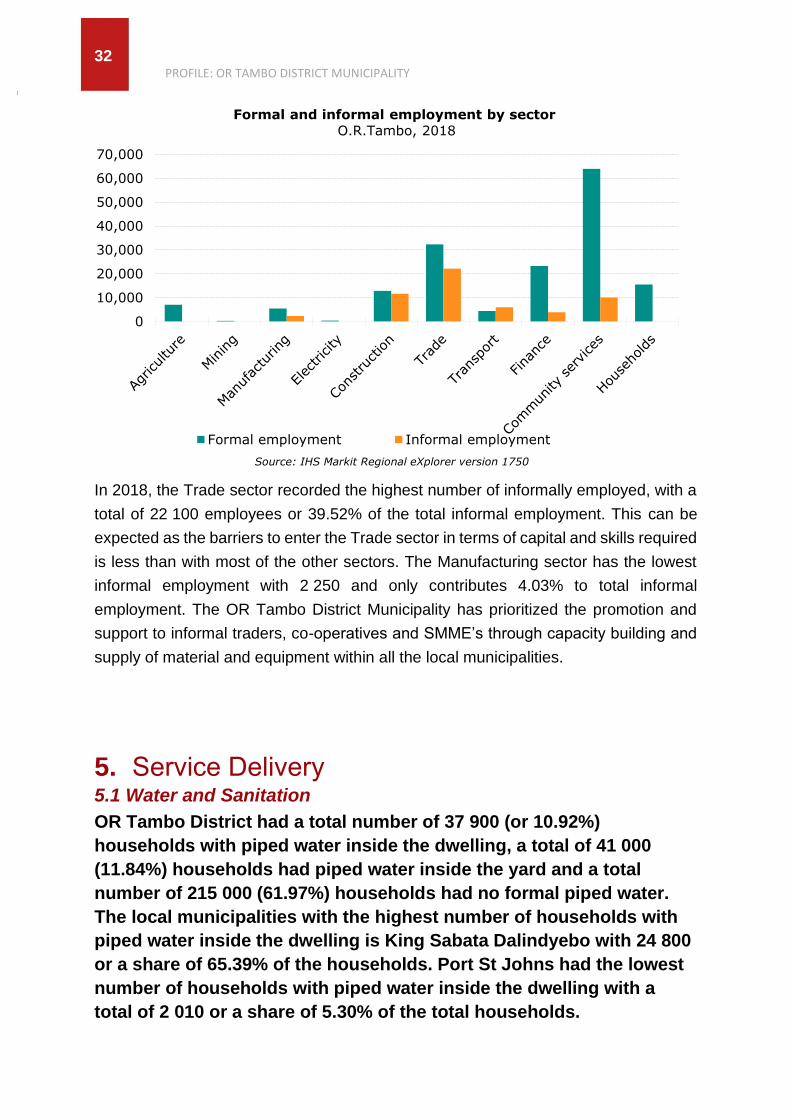
In 2018, the Trade sector recorded the highest number of informally employed, with a
total of 22 100 employees or 39.52% of the total informal employment. This can be
expected as the barriers to enter the Trade sector in terms of capital and skills required
is less than with most of the other sectors. The Manufacturing sector has the lowest
informal employment with 2 250 and only contributes 4.03% to total informal
employment. The OR Tambo District Municipality has prioritized the promotion and
support to informal traders, co-operatives and SMME’s through capacity building and
supply of material and equipment within all the local municipalities.
5. Service Delivery 5.1 Water and Sanitation
OR Tambo District had a total number of 37 900 (or 10.92%)
households with piped water inside the dwelling, a total of 41 000
(11.84%) households had piped water inside the yard and a total
number of 215 000 (61.97%) households had no formal piped water.
The local municipalities with the highest number of households with
piped water inside the dwelling is King Sabata Dalindyebo with 24 800
or a share of 65.39% of the households. Port St Johns had the lowest
number of households with piped water inside the dwelling with a
total of 2 010 or a share of 5.30% of the total households.
0
10,000
20,000
30,000
40,000
50,000
60,000
70,000
Formal and informal employment by sector
O.R.Tambo, 2018
Formal employment Informal employment
Source: IHS Markit Regional eXplorer version 1750

PROFILE: OR TAMBO DISTRICT MUNICIPALITY 33
Piped water
inside
dwelling
Piped
water in
yard
Communal
piped water:
less than 200m
from dwelling
(At RDP-level)
Communal
piped water:
more than
200m from
dwelling
(Below RDP)
No formal
piped water Total
Ingquza Hill 2,210 2,580 3,890 1,700 55,100 65,400
Port St Johns 2,010 1,570 3,600 571 28,300 36,000
Nyandeni 6,200 2,860 11,700 3,080 47,700 71,600
Mhlontlo 2,680 4,470 9,780 3,640 26,800 47,400
King Sabata
Dalindyebo 24,800 29,600 10,500 4,420 57,000 126,000
TOTAL
ORTAMBO 37,867 41,042 39,555 13,406 214,875 346,745
OR Tambo District had a total number of 67 700 flush toilets (19.54%), 204 000
Ventilation Improved Pit (VIP) (58.79%) and 49 600 (14.30%) of total households pit
toilets. The local municipality with the highest number of flush toilets is King Sabata
Dalindyebo with 38 900 or a share of 57.41%. The local municipality with the lowest
number of flush toilets is Mhlontlo Local Municipality with a total of 5 080 or 7.50% of
the total flush toilets in the District.
Flush toilet
Ventilation
Improved Pit
(VIP)
Pit toilet Bucket
system No toilet Total
Ingquza Hill 7,750 42,600 11,000 895 3,140 65,400
Port St Johns 8,930 16,100 5,480 459 5,030 36,000
Nyandeni 7,090 52,200 7,370 239 4,700 71,600
Mhlontlo 5,080 28,100 10,400 191 3,660 47,400
King Sabata
Dalindyebo 38,900 64,900 15,300 575 6,690 126,000
TOTAL
OR TAMBO 67,742 203,854 49,575 2,359 23,216 346,745
5.2 Human Settlements
In OR Tambo District, 1.3% of the households are informal dwellings which is lower
than the provincial figure of 7.3% and 33% are formal dwellings which is significantly
lower than the provincial figure of 56%. A further 54% of the dwellings are traditional
dwellings. 78.9% of the houses are fully owned or paid off which is higher than the
provincial figure of 69.1%. There are 9% of the dwellings where people are renting.

PROFILE: OR TAMBO DISTRICT MUNICIPALITY
34
The local municipality with the highest number of very formal dwelling units is the King
Sabata Dalindyebo Local Municipality with 16 200 or a share of 88.53%. The local
municipality with the lowest number of very formal dwelling units is the Nyandeni with
a total of 380 or a share of 2.08% of the total very formal dwelling units in the district.
Very Formal Formal Informal Traditional Other
dwelling type Total
Ingquza Hill 628 26,300 11,400 26,700 394 65,400
Port St Johns 456 10,300 6,690 18,600 43 36,000
Nyandeni 380 24,800 12,800 33,200 386 71,600
Mhlontlo 634 16,800 7,670 22,200 143 47,400
King Sabata
Dalindyebo 16,200 55,800 19,500 34,000 861 126,000
TOTAL
OR TAMBO 18,286 133,914 58,000 134,717 1,828 346,745
The OR Tambo District has experienced a number of disasters in the recent past and
the demand for temporary shelters and permanent housing has increased rapidly.
There is need for an integrated human settlement plan to address the housing
backlogs, informal settlements, eradication of mud houses and rectification of defective
structures.
“THE DISTRICT HAS EXPERIENCED A NUMBER
OF DISASTERS AND THE DEMAND FOR
TEMPORARY SHELTERS AND PERMANENT
HOUSING HAS INCREASED RAPIDLY.”
5.3 Waste Management
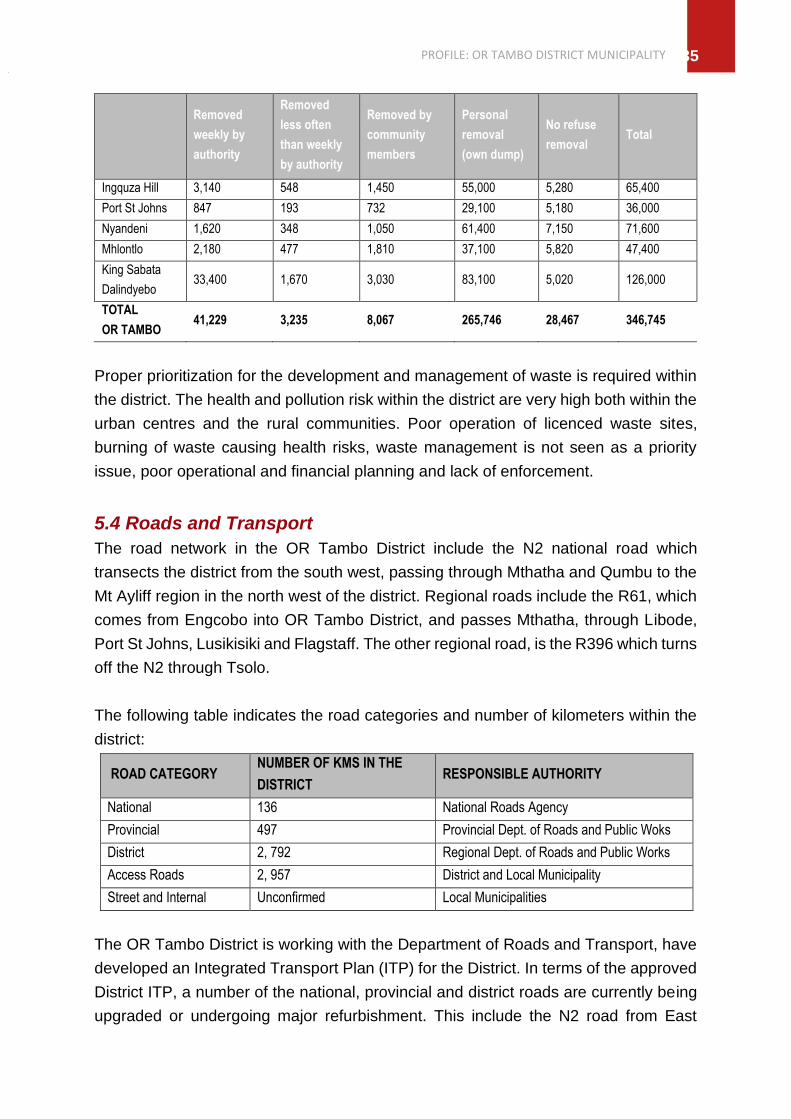
OR Tambo District had a total number of 41 200 (11.89%) households which had their
refuse removed weekly by the authority, a total of 3 240 (0.93%) households had their
refuse removed less often than weekly by the authority and a total number of 266 000
(76.64%) households which had to remove their refuse personally (own dump). The
local municipality with the highest number of households where the refuse is removed
weekly by the authority is King Sabata Dalindyebo with 33 400 or a share of 81.12%.
The local municipality with the lowest number of households where the refuse is
removed weekly by the authority is Port St Johns Local Municipality with a total of 847
or a share of 2.05%.
PROFILE: OR TAMBO DISTRICT MUNICIPALITY 35
Removed
weekly by
authority
Removed
less often
than weekly
by authority
Removed by
community
members
Personal
removal
(own dump)
No refuse
removal Total
Ingquza Hill 3,140 548 1,450 55,000 5,280 65,400
Port St Johns 847 193 732 29,100 5,180 36,000
Nyandeni 1,620 348 1,050 61,400 7,150 71,600
Mhlontlo 2,180 477 1,810 37,100 5,820 47,400
King Sabata
Dalindyebo 33,400 1,670 3,030 83,100 5,020 126,000
TOTAL
OR TAMBO 41,229 3,235 8,067 265,746 28,467 346,745
Proper prioritization for the development and management of waste is required within
the district. The health and pollution risk within the district are very high both within the
urban centres and the rural communities. Poor operation of licenced waste sites,
burning of waste causing health risks, waste management is not seen as a priority
issue, poor operational and financial planning and lack of enforcement.
5.4 Roads and Transport
The road network in the OR Tambo District include the N2 national road which
transects the district from the south west, passing through Mthatha and Qumbu to the
Mt Ayliff region in the north west of the district. Regional roads include the R61, which
comes from Engcobo into OR Tambo District, and passes Mthatha, through Libode,
Port St Johns, Lusikisiki and Flagstaff. The other regional road, is the R396 which turns
off the N2 through Tsolo.
The following table indicates the road categories and number of kilometers within the
district:
ROAD CATEGORY NUMBER OF KMS IN THE
DISTRICT RESPONSIBLE AUTHORITY
National 136 National Roads Agency
Provincial 497 Provincial Dept. of Roads and Public Woks
District 2, 792 Regional Dept. of Roads and Public Works
Access Roads 2, 957 District and Local Municipality
Street and Internal Unconfirmed Local Municipalities
The OR Tambo District is working with the Department of Roads and Transport, have
developed an Integrated Transport Plan (ITP) for the District. In terms of the approved
District ITP, a number of the national, provincial and district roads are currently being
upgraded or undergoing major refurbishment. This include the N2 road from East
PROFILE: OR TAMBO DISTRICT MUNICIPALITY
36
London to Durban, and the R61 from Queenstown to Port St Johns. The focus is on
roads that connect the province to national centres, roads that connects cities, towns
and villages to each other, roads to public facilities, roads that may unlock economic
opportunities (Industrial estates, tourism nodes and intensive agricultural nodes) as
well as roads to public facilities and tourism destinations.
In OR Tambo District, there is the Kei Rail initiative, which is aimed at revitalizing the
rail line from Mthatha to East London. Substantial investment has been made in re-
commissioning this rail line. It is envisaged that this rail line will be the central economic
driver underpinning the Kei Development Corridor.
The Mthatha Airport is another key transport facility which is fully functional and
compliant with Civil Aviation Authority (CAA) safety standards. The airport currently
has a 2 kilometre runway and there is currently a process to upgrade airport.
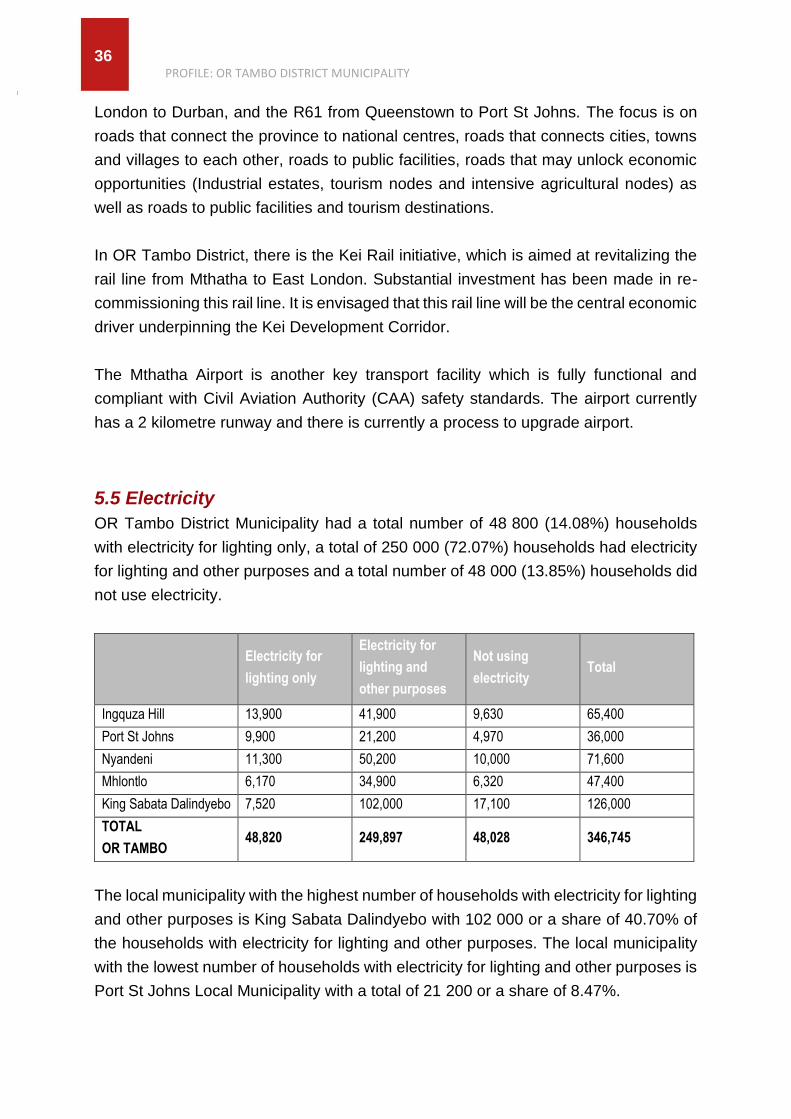
5.5 Electricity
OR Tambo District Municipality had a total number of 48 800 (14.08%) households
with electricity for lighting only, a total of 250 000 (72.07%) households had electricity
for lighting and other purposes and a total number of 48 000 (13.85%) households did
not use electricity.
Electricity for
lighting only
Electricity for
lighting and
other purposes
Not using
electricity Total
Ingquza Hill 13,900 41,900 9,630 65,400
Port St Johns 9,900 21,200 4,970 36,000
Nyandeni 11,300 50,200 10,000 71,600
Mhlontlo 6,170 34,900 6,320 47,400
King Sabata Dalindyebo 7,520 102,000 17,100 126,000
TOTAL
OR TAMBO 48,820 249,897 48,028 346,745
The local municipality with the highest number of households with electricity for lighting
and other purposes is King Sabata Dalindyebo with 102 000 or a share of 40.70% of
the households with electricity for lighting and other purposes. The local municipality
with the lowest number of households with electricity for lighting and other purposes is
Port St Johns Local Municipality with a total of 21 200 or a share of 8.47%.
PROFILE: OR TAMBO DISTRICT MUNICIPALITY 37
6. Governance and Management 6.1 Municipality Performance
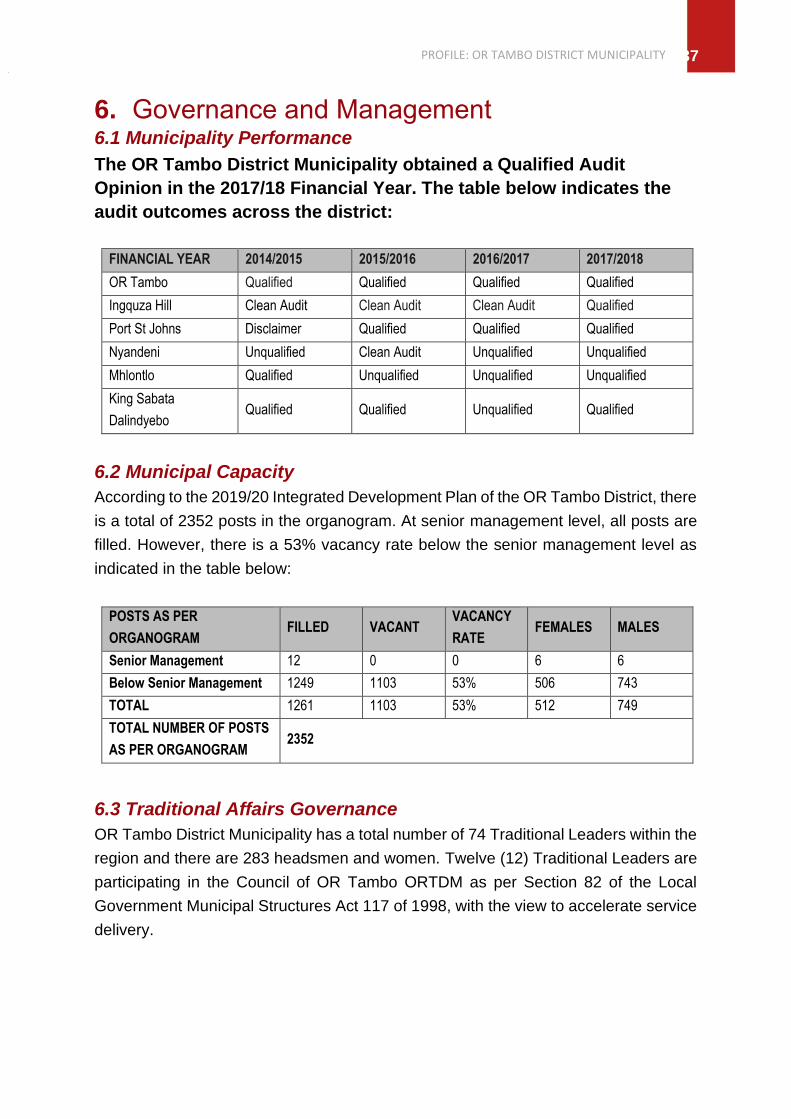
The OR Tambo District Municipality obtained a Qualified Audit
Opinion in the 2017/18 Financial Year. The table below indicates the
audit outcomes across the district:
FINANCIAL YEAR 2014/2015 2015/2016 2016/2017 2017/2018
OR Tambo Qualified Qualified Qualified Qualified
Ingquza Hill Clean Audit Clean Audit Clean Audit Qualified
Port St Johns Disclaimer Qualified Qualified Qualified
Nyandeni Unqualified Clean Audit Unqualified Unqualified
Mhlontlo Qualified Unqualified Unqualified Unqualified
King Sabata
Dalindyebo Qualified Qualified Unqualified Qualified
6.2 Municipal Capacity
According to the 2019/20 Integrated Development Plan of the OR Tambo District, there
is a total of 2352 posts in the organogram. At senior management level, all posts are
filled. However, there is a 53% vacancy rate below the senior management level as
indicated in the table below:
POSTS AS PER
ORGANOGRAM FILLED VACANT
VACANCY
RATE FEMALES MALES
Senior Management 12 0 0 6 6
Below Senior Management 1249 1103 53% 506 743
TOTAL 1261 1103 53% 512 749
TOTAL NUMBER OF POSTS
AS PER ORGANOGRAM 2352
6.3 Traditional Affairs Governance
OR Tambo District Municipality has a total number of 74 Traditional Leaders within the
region and there are 283 headsmen and women. Twelve (12) Traditional Leaders are
participating in the Council of OR Tambo ORTDM as per Section 82 of the Local
Government Municipal Structures Act 117 of 1998, with the view to accelerate service
delivery.
PROFILE: OR TAMBO DISTRICT MUNICIPALITY
38
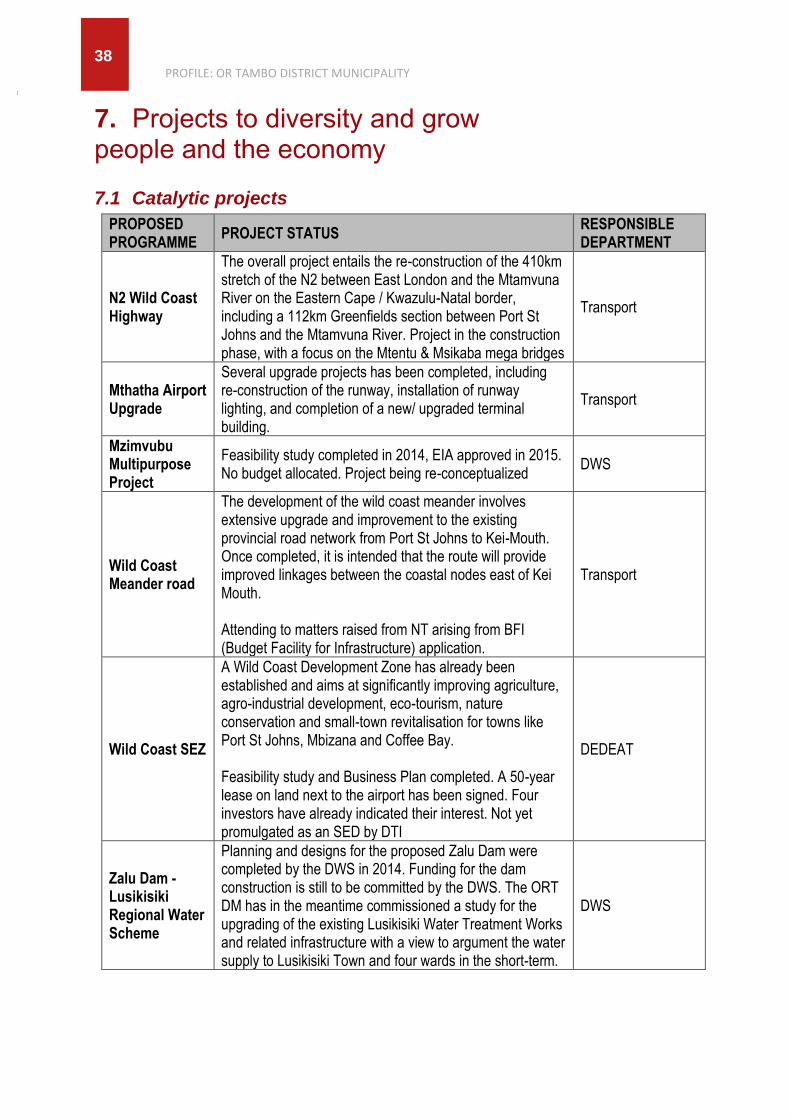
7. Projects to diversity and grow people and the economy
7.1 Catalytic projects
PROPOSED PROGRAMME
PROJECT STATUS RESPONSIBLE DEPARTMENT
N2 Wild Coast Highway
The overall project entails the re-construction of the 410km stretch of the N2 between East London and the Mtamvuna River on the Eastern Cape / Kwazulu-Natal border, including a 112km Greenfields section between Port St Johns and the Mtamvuna River. Project in the construction phase, with a focus on the Mtentu & Msikaba mega bridges
Transport
Mthatha Airport Upgrade
Several upgrade projects has been completed, including re-construction of the runway, installation of runway lighting, and completion of a new/ upgraded terminal building.
Transport
Mzimvubu Multipurpose Project
Feasibility study completed in 2014, EIA approved in 2015. No budget allocated. Project being re-conceptualized
DWS
Wild Coast Meander road
The development of the wild coast meander involves extensive upgrade and improvement to the existing provincial road network from Port St Johns to Kei-Mouth. Once completed, it is intended that the route will provide improved linkages between the coastal nodes east of Kei Mouth. Attending to matters raised from NT arising from BFI (Budget Facility for Infrastructure) application.
Transport
Wild Coast SEZ
A Wild Coast Development Zone has already been established and aims at significantly improving agriculture, agro-industrial development, eco-tourism, nature conservation and small-town revitalisation for towns like Port St Johns, Mbizana and Coffee Bay. Feasibility study and Business Plan completed. A 50-year lease on land next to the airport has been signed. Four investors have already indicated their interest. Not yet promulgated as an SED by DTI
DEDEAT
Zalu Dam - Lusikisiki Regional Water Scheme
Planning and designs for the proposed Zalu Dam were completed by the DWS in 2014. Funding for the dam construction is still to be committed by the DWS. The ORT DM has in the meantime commissioned a study for the upgrading of the existing Lusikisiki Water Treatment Works and related infrastructure with a view to argument the water supply to Lusikisiki Town and four wards in the short-term.
DWS

PROFILE: OR TAMBO DISTRICT MUNICIPALITY 39
7.2 Environmental management and climate change
The OR Tambo district has a distinct advantage of being a region with substantial water
resources. The district lies within the Umzimvubu, Keiskamma Water Management
Area and the Mvoti-Umzimvubu Water Management Area. These are catchment areas
with excess runoff of water, which means development of these water resources is
possible.
However, there are a number of conservation areas within the OR Tambo District
Municipal area. Provincial nature reserves include Silaka Nature Reserve near Port St
Johns, Hluleka Nature Reserve near Presley Bay, Luchaba Nature Reserve next to
Umtata Dam and Mkambati Nature Reserve on the northern Pondoland Coast. There
are a large number of indigenous forest reserves along the coast. Some of the larger
ones on the Pondoland Coast are Mount Thesiger, Mount Sullivan, Ntlopeni, Lotana,
Mbotyi, Egosa and Ntsubane. There is also a proclaimed marine reserve adjacent to
the Mkambati Nature Reserve.
Climate change already causes and will continue to cause a number of challenges for
OR Tambo District Municipality, linked to impacts such as increased temperatures,
extreme weather events (e.g. flooding and drought), sea level rise and climate
variability. To respond to these changes OR Tambo District Municipality has initiated
and developed the Municipal Climate Change Strategy and Action Plan. This is a
phased programme, which has focused on climate change adaptation and enhancing
the Municipality’s ability to cope with climate change impacts. The likely climate change
impacts have been assessed and plans, programmes and projects developed to assist
the Municipality in dealing with these impacts.
“THE OR TAMBO DISTRICT HAS A DISTINCT
ADVANTAGE OF BEING A REGION WITH
SUBSTANTIAL WATER RESOURCES.”

PROFILE: OR TAMBO DISTRICT MUNICIPALITY
40
8. Key Recommendations In order to address the short to medium term challenges facing the
district and create conditions for the development of a sustainable
regional economy, the following interventions are proposed:
a. Strengthen safety net for poor and child headed households
Given the high levels of poverty as well as high numbers of child and women headed
households in the district, there is a need for a special programmes to address these
challenges. In this regard, there is a need to:
• Update and agree on database of all poor, female and child headed households.
• Extend the social package (social grants, free basic services) to child and
female headed households.
• Implement Child Care Programmes.
b. Accelerate the delivery of household infrastructure and services
According to StatsSA (CS 2016), OR Tambo is one of the 10 districts with the lowest
infrastructure quality index with high backlogs with regards to basic services. In this
regard, there is a need to:
• Accelerate basic service provision to households.
• Fast track completion of bulk and link projects.
c. Grow export focussed agricultural and agro-processing sector
The Agricultural sector has been identified as the sector with the highest growth
potential, but prone to very high volatility as a result of uncertain weather conditions,
pests and other natural causes. To further develop and increase the contribution of
Agriculture to the GVA of the district, there is a need to:
• Undertake Export opportunity mapping
• Mobilise small farmers into export agricultural value chain
• Establish incubation hubs and processing facilities linked into export value chain
d. Strengthen the regional N2 coastal corridor link
The Draft National Spatial Development Framework (NSDF) has identified the N2 link
as a corridor that can catalyse the development of the agricultural tourism and
industrial development. This will involve:
• Accelerating the completion of the N2 link
• Completing the spatial corridor plan for development and management of
coastal link
• Completing robust community consultations on inclusive corridor development

PROFILE: OR TAMBO DISTRICT MUNICIPALITY 41
e. Activate large scale community-empowering tourism
The District is endowed with several tourism destinations such as Port St Johns,
Lusikisiki, Coffee Bay, Qunu, Mthatha and Mhlontlo. The District encapsulates a large
portion of the Wild Coast belt and is home to some pristine nature reserves. In order
to maximum on the tourism potential, there is a need to:
• Finalise tourism plan and identification of tourism business opportunities
• Develop large pool of local tourism practitioners and operators
• Package and deliver tourism training and qualifications
• Unlock special funding and finance for community scale tour operators
f. Safeguard natural resource base and resolve mining vs tourism trade-off
The Provincial Spatial Development Framework provides for the safeguarding of all-
natural resources across the district and province. In this regard, there is a need to:
• Update cost-benefit studies.
• Undertake open consultative process to interrogate mining vs tourism
feasibilities and cost-benefit analysis.
g. Expansion of the forestry sector
The District recognises that unlocking the potential in forestry and agriculture in the
District can lead to job growth, poverty reduction and sustainable livelihoods. Forestry
initiatives encompass both commercialised forestry operations, involving plantations
for timber. The proposals for forestry expansion include:
• Identify areas for regional commercial forestry expansion and afforestation of
State Forests especially in Mhlontlo, Nyandeni and Ngquza Hill LM
• Afforestation through creating forest pockets in each municipality in order to
provide wood energy to rural areas
h. Develop oceans corridor
The proposal entails developing a regional road that will run along the coast in an
attempt to connect the proposed small rural beach towns to form some sort of string of
beads to ensure connectivity and accessibility to these towns. This will contribute to
tourism expansion and economic expansion
i. Investing in skills development to promote agriculture
In order to realise the agriculture potential in the region, there is a need to build more
agricultural colleges to enable communities to acquire skills in subsistence and small
PROFILE: OR TAMBO DISTRICT MUNICIPALITY
42
scale maize, vegetable, fruit, and tea production; and small scale livestock rearing
(cattle, sheep and goats); forestry and aquaculture.
j. Support for Small Business/ Incubator focusing on agriculture
Through SEDA there is an MOU that was signed in August 2018 with Ntinga
Development Agency to support SMMEs from the District to have products of scale
and quality to supply Kei Fresh Produce Market, Umzikantu Red Meat Abattoir and
Adam Kok Farms. The Incubator will be based in Ingwe TVET College based in
Lusikisiki. This incubator will serve both the students who are being trained in the
college with business skills so that they can be able to start and run their businesses
rather than looking for jobs.
k. Expansion of Furniture tech incubator to Lusikisiki
The department already has two incubators in Umthatha that are focusing on furniture
manufacturing (Furntech) and the other focusing on construction. The Furntech
incubator will be expanded to Lusikisiki to support the entrepreneurs who come from
Lusikisiki and surrounding areas. The expansion of timber production in the areas will
also feed in into this incubator and ensure processing of timber locally.

PROFILE: OR TAMBO DISTRICT MUNICIPALITY 43