program and compliance management
DESCRIPTION
Program and Compliance Management. V I R T U A L L Y. Workshop: Your Data/Your Story. Outline. Using the most recent WIASRD data (4 qtrs ending 9/30/12) Who You’re Serving What They’re Getting With What Results Recommendation: Print no more than two slides a page. - PowerPoint PPT PresentationTRANSCRIPT

1
Program and Compliance ManagementProgram and Compliance Management
Workshop: Workshop:
Your Data/Your StoryYour Data/Your Story
V I R T U A L L V I R T U A L L YY
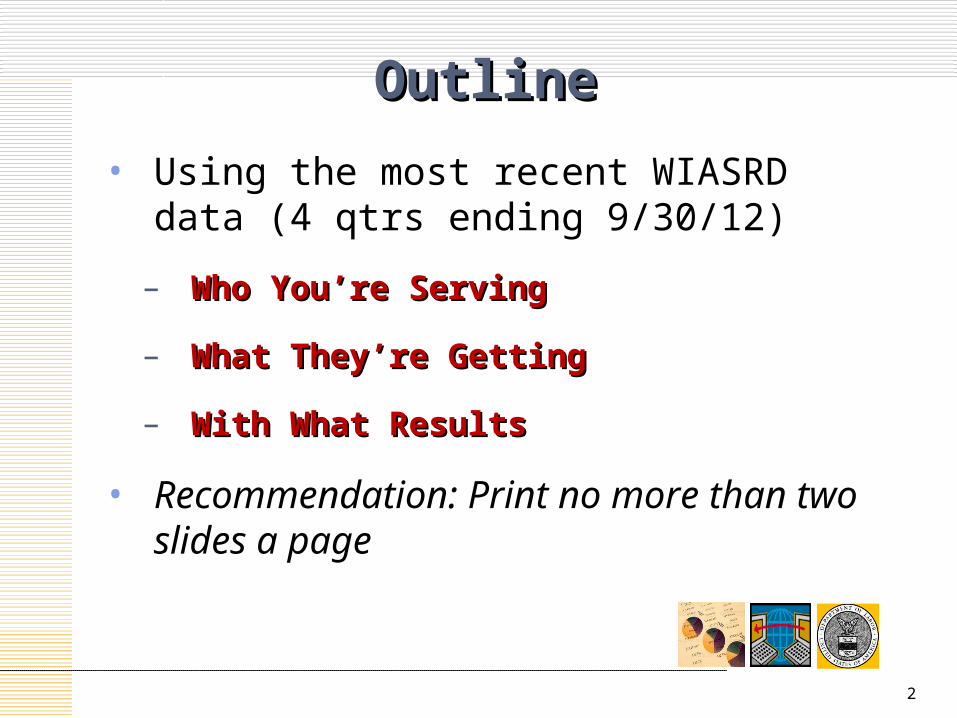
OutlineOutline
• Using the most recent WIASRD data (4 qtrs ending 9/30/12)
– Who You’re ServingWho You’re Serving
– What They’re GettingWhat They’re Getting
– With What ResultsWith What Results
• Recommendation: Print no more than two slides a page
2

Relative to:
Target Groups
Characteristics
Service Levels
Who You’re ServingWho You’re Serving
3

Adults and Dislocated WorkersAdults and Dislocated Workers
• The following analyses include frequently referenced populations (e.g., in State Strategic Plans)
• Disabled
• LEP
• Public Assistance
• Educational Level
• Veterans
4
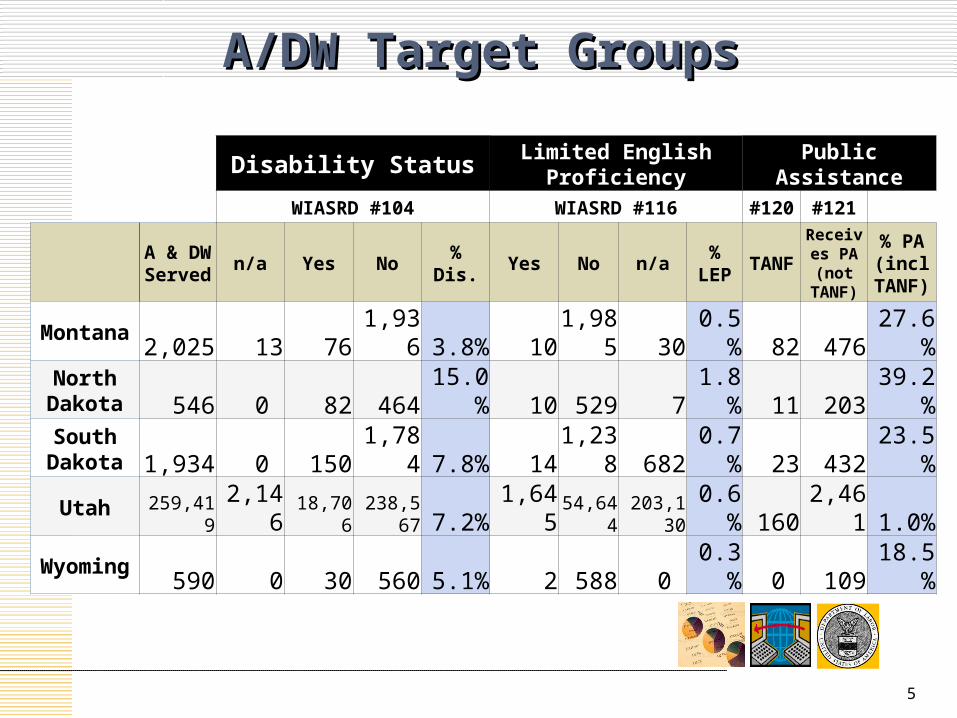
A/DW Target GroupsA/DW Target Groups
Disability Status Limited English Proficiency Public Assistance
WIASRD #104 WIASRD #116 #120 #121
A & DW Served n/a Yes No % Dis. Yes No n/a % LEP TANF
Receives PA (not TANF)
% PA (incl
TANF)
Montana 2,025 13 76 1,936 3.8% 10 1,985 30 0.5% 82 476 27.6%North
Dakota 546 0 82 464 15.0% 10 529 7 1.8% 11 203 39.2%South
Dakota 1,934 0 150 1,784 7.8% 14 1,238 682 0.7% 23 432 23.5%
Utah259,419 2,146 18,706 238,567 7.2% 1,645 54,644 203,130 0.6% 160 2,461 1.0%
Wyoming 590 0 30 560 5.1% 2 588 0 0.3% 0 109 18.5%
5
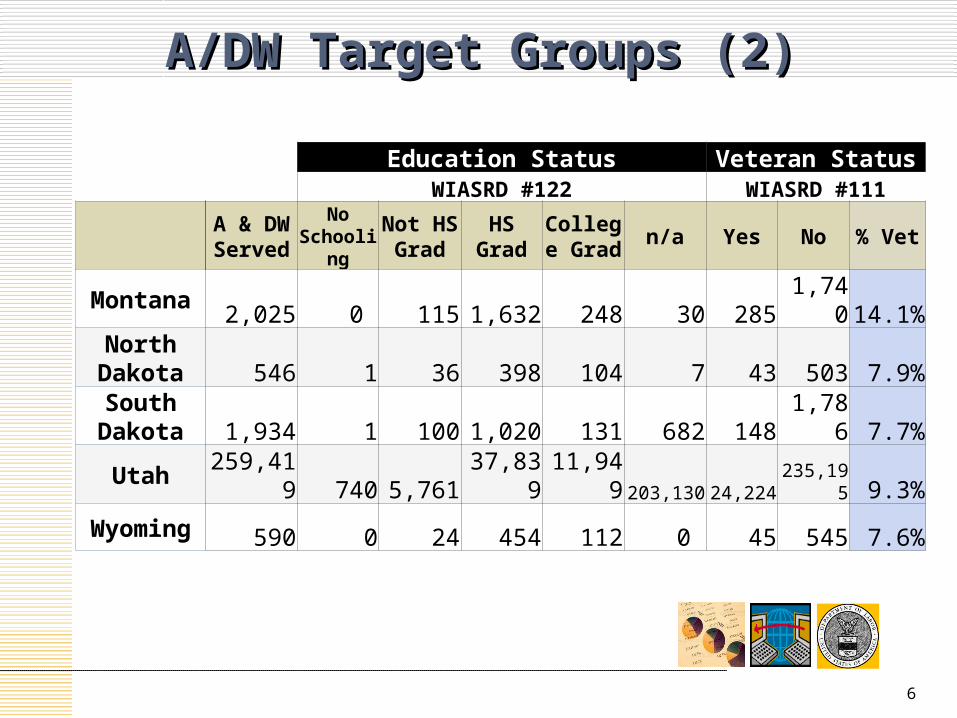
A/DW Target Groups (2)A/DW Target Groups (2)
Education Status Veteran StatusWIASRD #122 WIASRD #111
A & DW Served
No Schooling
Not HS Grad HS Grad College
Grad n/a Yes No % Vet
Montana 2,025 0 115 1,632 248 30 285 1,740 14.1%North
Dakota 546 1 36 398 104 7 43 503 7.9%South
Dakota 1,934 1 100 1,020 131 682 148 1,786 7.7%
Utah 259,419 740 5,761 37,839 11,949 203,130 24,224 235,195 9.3%
Wyoming 590 0 24 454 112 0 45 545 7.6%
6

YouthYouth
• The following analyses reflect priorities for the WIA Youth program nationally
• Age and School Status
• Basic Skills Deficiency
• Other Barriers
• What do the data indicate? What jumps out at you?
7

Age and School StatusAge and School Status
AgeAge School Status at ParticipationSchool Status at Participation Make-Up of O/S YouthMake-Up of O/S Youth
YOUTHNumber Served
10/1/11-9/30/12
14-18 19-21 % Older Youth
In-school
Out-of-school
% O/S Youth
HS Dropout
HS Graduate
NATION 219,076 144,935 74,141 33.8% 115,509 103,553 47.3% 54,784 48,769
Region 4 25,956 15,663 10,293 39.7% 11,958 13,987 53.9% 6,930 7,057
Montana 473 363 110 23.3% 296 177 37.4% 116 61
North Dakota 439 295 144 32.8% 275 164 37.4% 58 106
South Dakota 427 167 260 60.9% 110 317 74.2% 143 174
Utah 2,860 1,833 1,027 35.9% 1,171 1,689 59.1% 995 694
Wyoming 745 582 163 21.9% 442 303 40.7% 205 98
8

Basic Skills DeficiencyBasic Skills Deficiency
9
WIASRD #130WIASRD #130
YOUTHNumber Served
10/1/11-9/30/12
n/a Basic skills deficiency
No basic skills deficiency % BSD
Nation 219,076 21 137,380 81,675 62.7% Region 4 25,956 14 14,929 11,013 57.5% Montana 473 2 392 79 82.9% North Dakota 439 0 314 125 71.5% South Dakota 427 0 168 259 39.3% Utah 2,860 0 2,249 611 78.6% Wyoming 745 0 249 496 33.4%
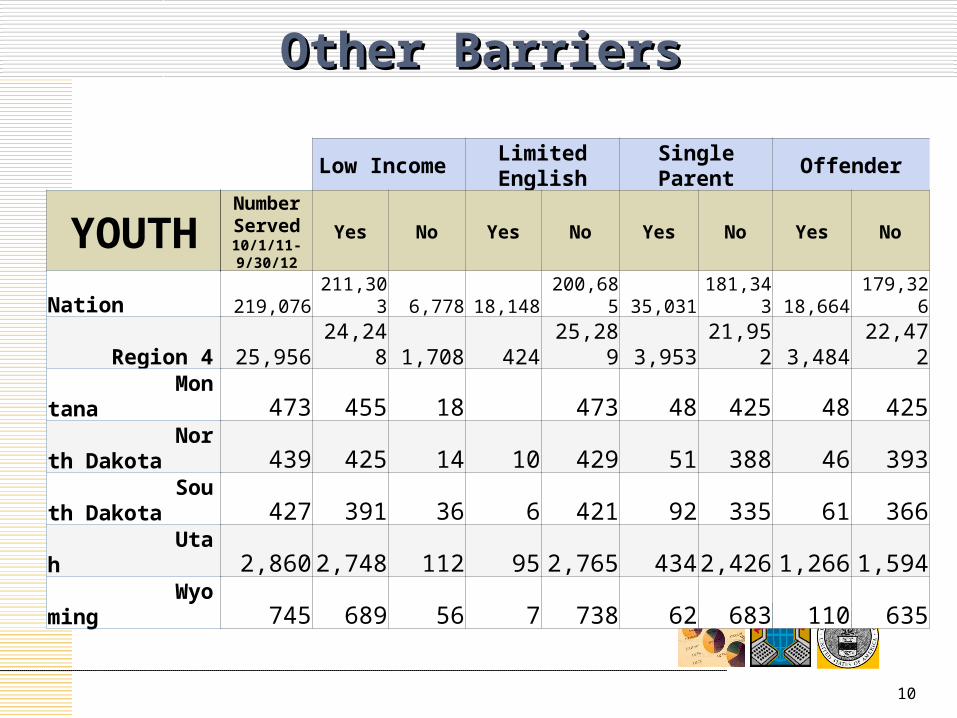
Other BarriersOther Barriers
Low Income Limited English Single Parent Offender
YOUTHNumber Served 10/1/11-9/30/12
Yes No Yes No Yes No Yes No
Nation 219,076 211,303 6,778 18,148 200,685 35,031 181,343 18,664 179,326
Region 4 25,956 24,248 1,708 424 25,289 3,953 21,952 3,484 22,472
Montana 473 455 18 473 48 425 48 425 North Dakota 439 425 14 10 429 51 388 46 393 South Dakota 427 391 36 6 421 92 335 61 366 Utah 2,860 2,748 112 95 2,765 434 2,426 1,266 1,594 Wyoming 745 689 56 7 738 62 683 110 635
10
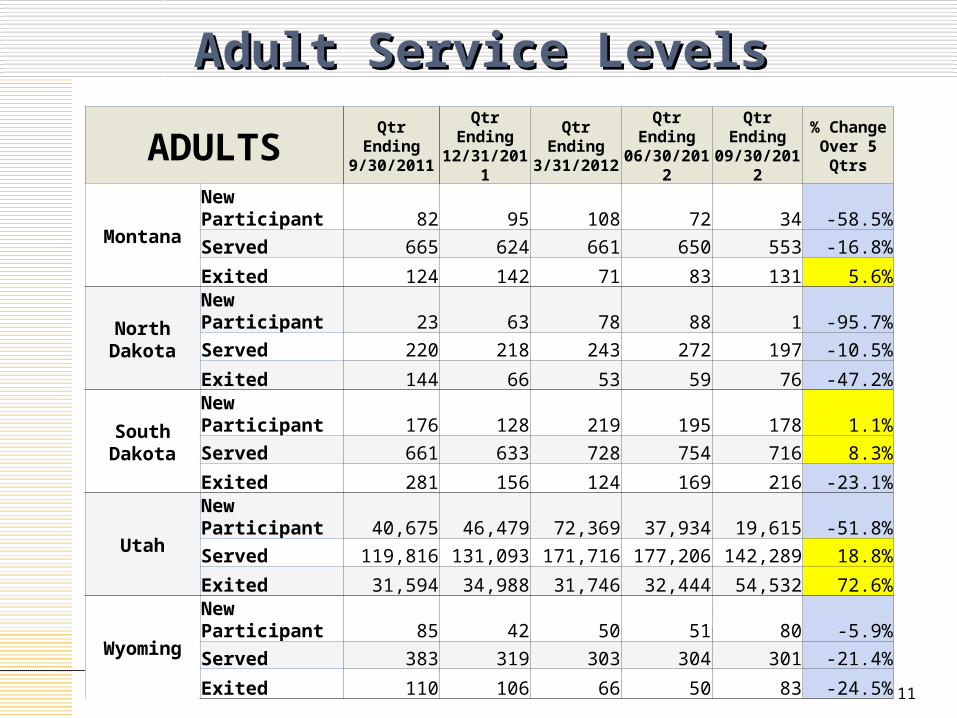
Adult Service LevelsAdult Service Levels
ADULTS Qtr Ending 9/30/2011
Qtr Ending 12/31/2011
Qtr Ending 3/31/2012
Qtr Ending 06/30/2012
Qtr Ending 09/30/2012
% Change Over 5 Qtrs
MontanaNew Participant 82 95 108 72 34 -58.5%Served 665 624 661 650 553 -16.8%
Exited 124 142 71 83 131 5.6%
North DakotaNew Participant 23 63 78 88 1 -95.7%Served 220 218 243 272 197 -10.5%
Exited 144 66 53 59 76 -47.2%
South DakotaNew Participant 176 128 219 195 178 1.1%Served 661 633 728 754 716 8.3%
Exited 281 156 124 169 216 -23.1%
UtahNew Participant 40,675 46,479 72,369 37,934 19,615 -51.8%Served 119,816 131,093 171,716 177,206 142,289 18.8%
Exited 31,594 34,988 31,746 32,444 54,532 72.6%
WyomingNew Participant 85 42 50 51 80 -5.9%Served 383 319 303 304 301 -21.4%
Exited 110 106 66 50 83 -24.5%
11
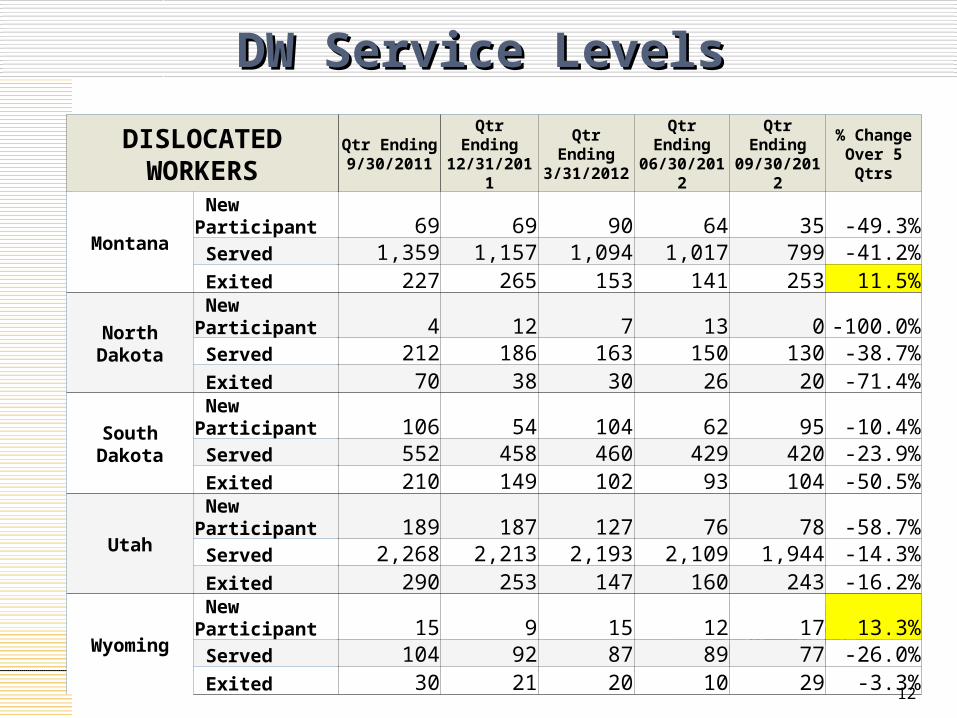
DW Service LevelsDW Service Levels
DISLOCATED WORKERS Qtr Ending 9/30/2011
Qtr Ending 12/31/2011
Qtr Ending 3/31/2012
Qtr Ending 06/30/2012
Qtr Ending 09/30/2012
% Change Over 5 Qtrs
Montana New Participant 69 69 90 64 35 -49.3% Served 1,359 1,157 1,094 1,017 799 -41.2% Exited 227 265 153 141 253 11.5%
North Dakota New Participant 4 12 7 13 0 -100.0% Served 212 186 163 150 130 -38.7% Exited 70 38 30 26 20 -71.4%
South Dakota New Participant 106 54 104 62 95 -10.4% Served 552 458 460 429 420 -23.9% Exited 210 149 102 93 104 -50.5%
Utah New Participant 189 187 127 76 78 -58.7% Served 2,268 2,213 2,193 2,109 1,944 -14.3% Exited 290 253 147 160 243 -16.2%
Wyoming New Participant 15 9 15 12 17 13.3% Served 104 92 87 89 77 -26.0% Exited 30 21 20 10 29 -3.3%
12

YOUTH Service LevelsYOUTH Service Levels
YOUTH Qtr Ending 9/30/2011
Qtr Ending 12/31/2011
Qtr Ending 3/31/2012
Qtr Ending 06/30/2012
Qtr Ending 09/30/2012
% Change Over 5 Qtrs
Montana New Participant 34 39 36 59 11 -67.6% Served 416 367 357 369 334 -19.7% Exited 83 84 46 47 46 -44.6%
North Dakota New Participant 17 29 37 85 53 211.8% Served 281 264 263 317 302 7.5% Exited 142 46 38 31 68 -52.1%
South Dakota New Participant 75 48 63 52 52 -30.7% Served 275 260 277 252 239 -13.1% Exited 53 63 46 77 65 22.6%
Utah New Participant 244 322 316 259 189 -22.5% Served 2,060 2,096 2,244 2,347 2,294 11.4% Exited 187 228 168 156 242 29.4%
Wyoming New Participant 85 43 86 150 63 -25.9% Served 503 446 473 538 508 1.0% Exited 172 100 59 85 93 -45.9%
13

Relative to: Adults and Dislocated Workers
Receipt of Core, Intensive, Training
Type of Training for those trained
Youth Program Elements
Leveraged Resources Reported Co-Enrollment
Discretionary Grants?
What They’re GettingWhat They’re Getting
14

Adults/DWAdults/DW
Adults and Dislocated Workers (Exited Between 7/1/11-6/30/12) Core Intensive Training
Nation Exited 1,045,898 374,844 204,183 % Exited 64.4% 23.1% 12.6% Region 4 Exited 240,762 35,576 23,817 % Exited 80.2% 11.9% 7.9% Montana Exited 20 501 653 % Exited 1.7% 42.7% 55.6% North Dakota Exited 6 106 226 % Exited 1.8% 31.4% 66.9% South Dakota Exited 62 528 512 % Exited 5.6% 47.9% 46.5% Utah Exited 128,601 20,051 4,556 % Exited 83.9% 13.1% 3.0% Wyoming Exited 0 43 311 % Exited 0 12.1% 87.9%
15

Type of Training (WIASRD #340)Type of Training (WIASRD #340)Adults and Dislocated Workers who Adults and Dislocated Workers who
Received TrainingReceived Training
Adults and Dislocated Workers
Exiters Who Rec'd Training
On-the-job training
Skill upgrading and retraining
Entrepren. Training
Adult ed and Literacy with
training
Customized training
Other occupational
training
Nation 204,183 20,645 28,035 755 4,784 7,584 142,380 Region 4 23,817 1,584 2,146 116 1,231 1,137 17,603 Montana 653 43 9 2 599 North Dakota 226 20 1 205 South Dakota 512 77 4 1 430 Utah 4,556 132 1,801 1,043 1,580 Wyoming 311 10 299 1 1
16
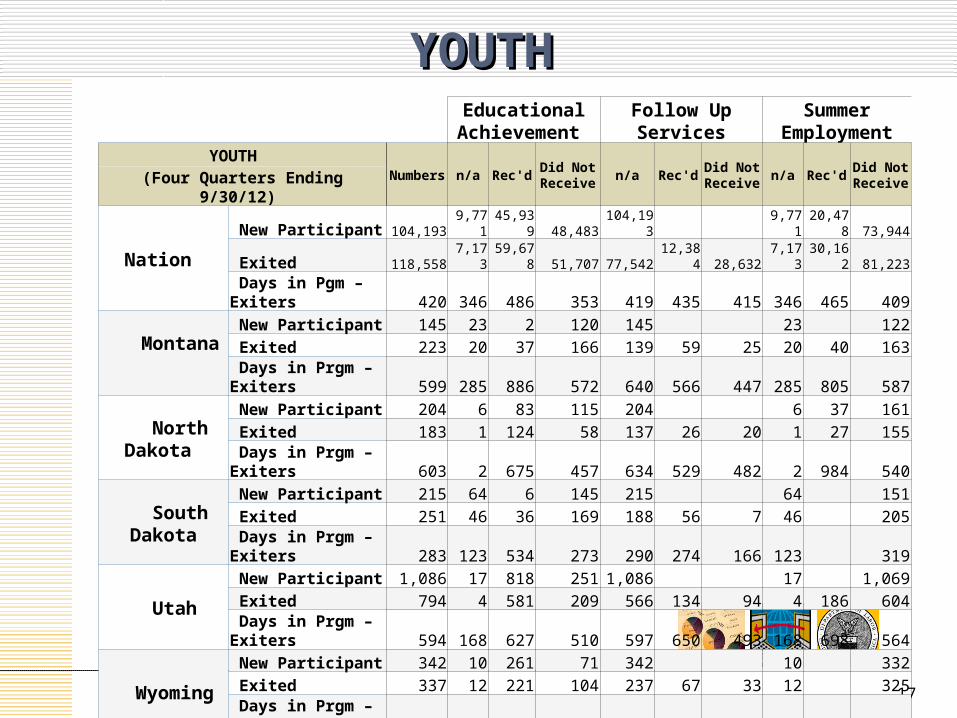
YOUTHYOUTH
17
Educational Achievement Follow Up Services Summer
EmploymentYOUTH
Numbers n/a Rec'd Did Not Receive n/a Rec'd Did Not
Receive n/a Rec'd Did Not Receive(Four Quarters Ending 9/30/12)
Nation New Participant 104,193 9,771 45,939 48,483 104,193 9,771 20,478 73,944
Exited 118,558 7,173 59,678 51,707 77,542 12,384 28,632 7,173 30,162 81,223
Days in Pgm – Exiters 420 346 486 353 419 435 415 346 465 409
Montana New Participant 145 23 2 120 145 23 122 Exited 223 20 37 166 139 59 25 20 40 163 Days in Prgm – Exiters 599 285 886 572 640 566 447 285 805 587
North Dakota New Participant 204 6 83 115 204 6 37 161 Exited 183 1 124 58 137 26 20 1 27 155 Days in Prgm – Exiters 603 2 675 457 634 529 482 2 984 540
South Dakota New Participant 215 64 6 145 215 64 151 Exited 251 46 36 169 188 56 7 46 205 Days in Prgm – Exiters 283 123 534 273 290 274 166 123 319
Utah New Participant 1,086 17 818 251 1,086 17 1,069 Exited 794 4 581 209 566 134 94 4 186 604 Days in Prgm – Exiters 594 168 627 510 597 650 493 168 698 564
Wyoming New Participant 342 10 261 71 342 10 332 Exited 337 12 221 104 237 67 33 12 325 Days in Prgm – Exiters 360 139 408 282 373 346 292 139 368

YOUTH (2)YOUTH (2)
18
Supportive Services Youth Needs Add'l Assistance
Add'l Support for Youth Services
YOUTH (Four Quarters ending 9/30/12) Numbers n/a Rec'd Did Not
Receive n/a Yes No n/a Rec'd Did Not Receive
NationNew Participant 104,193 33,917 70,276 68,081 36,112 9,771 46,441 47,981Exited 118,558 45,470 73,088 73,873 44,685 7,173 60,370 51,015Days in Program - Exiters 420 467 390 402 449 346 429 419
MontanaNew Participant 145 103 42 13 132 23 26 96Exited 223 202 21 17 206 20 95 108Days in Program - Exiters 599 612 468 655 594 285 682 584
North DakotaNew Participant 204 72 132 80 124 6 128 70Exited 183 113 70 97 86 1 140 42Days in Program - Exiters 603 617 579 736 452 2 612 587
South DakotaNew Participant 215 52 163 170 45 64 8 143Exited 251 56 195 180 71 46 153 52Days in Program - Exiters 283 363 260 298 245 123 377 145
UtahNew Participant 1,086 1,008 78 1,081 5 17 1,013 56Exited 794 706 88 776 18 4 714 76Days in Program - Exiters 594 617 408 592 653 168 614 427
WyomingNew Participant 342 162 180 238 104 10 96 236Exited 337 183 154 244 93 12 91 234Days in Program - Exiters 360 362 357 378 312 139 395 357

Leveraging ResourcesLeveraging ResourcesCo-Enrollment of Adults/Dislocated WorkersCo-Enrollment of Adults/Dislocated Workers
Adult Education Trade Adjustment Wagner-Peyser
A/DW Served (10/1/11-9/30/12) Yes No Yes No Yes No
Nation 2,298,260 2,703 2,295,557 50,104 2,248,156 2,052,540 245,720
Region 4 465,200 77 465,123 4,134 461,066 427,729 37,471
Montana 2,025 2,025 687 1,338 2,021 4
North Dakota 546 546 100 446 527 19
South Dakota 1,934 1,934 50 1,884 1,934
Utah 259,419 259,419 505 258,914 259,325 94
Wyoming 590 1 589 3 587 579 11
19
Leveraging Resources (2)Leveraging Resources (2)Co-Enrollment of Adults/Dislocated WorkersCo-Enrollment of Adults/Dislocated Workers
Veterans' Programs Voc Rehab Voc Ed
A/DW Served (10/1/11-9/30/12) Yes, DVOP/LVER Yes, VWIP No Yes No Yes No
Nation 2,298,260 52,123 830 2,245,307 884 2,297,376 1,934 2,296,326
Region 4 465,200 6,473 55 458,672 9 465,191 465,200
Montana 2,025 2 2,023 2,025 2,025
North Dakota 546 26 520 546 546
South Dakota 1,934 1,934 1,934 1,934
Utah 259,419 659 258,760 259,419 259,419
Wyoming 590 33 557 1 589 590
20

Leveraging ResourcesLeveraging ResourcesCo-Enrollment of YouthCo-Enrollment of Youth
YouthBuild Job Corps Adult Education Wagner-Peyser Voc Rehab Voc Ed
YOUTH Served 10/1/11-9/30/12 No Yes No Yes No Yes No Yes No Yes No Yes
Nation 219,076 218,896 180 219,010 66 218,114 962 118,915 100,161 218,715 361 218,816 260
Region 4 25,956 25,954 2 25,955 1 25,906 50 7,495 18,461 25,953 3 25,956
Montana 473 473 473 473 473 473 473
ND 439 439 439 439 52 387 439 439
SD 427 427 427 427 427 427 427
Utah 2,860 2,858 2 2,860 2,860 1 2,859 2,860 2,860
Wyoming 745 745 745 745 28 717 744 1 745
21

MT Discretionary GrantsMT Discretionary GrantsAre You Plugged In?Are You Plugged In?
Grantee CityType of Grant
Amount Begin Date End Date
Rural Employment Opportunities, Inc.
HELENA NFJP $597,263.0007/01/201
106/30/201
3
Rural Employment Opportunities, Inc.
HELENA NFJP $596,133.0007/01/201
106/30/201
3
MT Department of Labor and Industry
HELENA SCSEP $557,549.0007/01/201
206/30/201
3
Flathead Valley Community College
KalispellCommunity-Based
$2,951,196.00
07/01/2010
06/30/2013
Flathead Valley Community College
Kalispell TAACCT$2,999,969.0
010/01/201
209/30/201
6
Career Training Institute Helena YouthBuild$1,012,000.0
003/15/201
105/31/201
4
Montana State University- Northern
Havre YouthBuild$1,100,000.0
006/01/201
105/31/201
4
22

ND Discretionary GrantsND Discretionary GrantsAre You Plugged In?Are You Plugged In?
Grantee CityType of Grant
Amount Begin Date End Date
NORTH DAKOTA DEPARTMENT OF HUMAN SERVICES
Bismarck SCSEP $535,827.0007/01/201
206/30/201
3
UNITED TRIBES TECHNICAL COLLEGE
BismarckJob
Accelerator$999,175.00
10/01/2011
09/30/2015
United Tribes Technical College
Bismarck TAACCT$18,947,635.0
010/01/201
109/30/201
4
BISMARCK STATE COLLEGE Bismarck TAACCT$14,642,938.0
010/01/201
209/30/201
6
Lake Region State CollegeDevils Lake
TAACCT $2,990,355.0010/01/201
209/30/201
6
23

SD Discretionary GrantsSD Discretionary GrantsAre You Plugged In?Are You Plugged In?
Grantee CityType of Grant Amount
Begin Date End Date
BLACK HILLS SPECIAL SERVICES COOPERATIVE
Sturgis NFJP $620,254.00 07/01/2011 06/30/2013
BLACK HILLS SPECIAL SERVICES COOPERATIVE
Sturgis NFJP $619,080.00 07/01/2011 06/30/2013
STATE OF SOUTH DAKOTA PIERRE SCSEP $615,477.00 07/01/2012 06/30/2013SOUTH DAKOTA DEPARTMENT OF LABOR AND REGULATION
PIERRE Disability Initiative
$998,873.50 10/01/2011 09/30/2014
SOUTH DAKOTA DEPARTMENT OF LABOR AND REGULATION
PIERRE Disability Initiative
$998,873.50 10/01/2011 09/30/2014
SOUTH DAKOTA DEPARTMENT OF LABOR
PIERRE Green Jobs $2,500,000.00
01/29/2010 06/30/2013
The University of South Dakota VERMILLION Green Jobs $5,000,000.00
03/01/2010 06/30/2013
WATERTOWN SCHOOL DISTRICT DBA LAKE AREA TECHNICAL INSTITUTE
WATERTOWN
TAACT $2,701,202.00
10/01/2011 09/30/2014
Mitchell Technical Institute Mitchell TAACT $2,533,052.00
10/01/2012 09/30/2016
24

UT Discretionary GrantsUT Discretionary GrantsAre You Plugged In?Are You Plugged In?
Grantee City Type of Grant AmountBegin Date
End Date
PRIVATE INDUSTRY COUNCIL INC DBA FUTURES THROUGH
OGDEN NFJP $289,213.00 07/01/2011 06/30/2013
PRIVATE INDUSTRY COUNCIL INC DBA FUTURES THROUGH
OGDEN NFJP $288,666.00 07/01/2011 06/30/2013
UTAH DEPARTMENT OF HUMAN SERVICES
SALT LAKE CITY
SCSEP $593,754.00 07/01/2012 06/30/2013
SALT LAKE COMMUNITY COLLEGE
SALT LAKE CITY
Community-Based
$2,702,436.00 07/01/2010 06/30/2013
SOUTHERN UTAH UNIVERSITY CEDAR CITY Earmark $400,000.00 06/01/2011 05/31/2013
UTAH DEPARTMENT OF WORKFORCE SERVICES
SALT LAKE CITY
Green Jobs $4,600,000.00 01/29/2010 06/30/2013
SALT LAKE COMMUNITY COLLEGE
SALT LAKE CITY
TAACT $2,701,202.00 10/01/2011 09/30/2014
UTAH VALLEY UNIVERSITY OREM TAACT $3,000,000.00 10/01/2012 09/30/2016
Ogden-Weber Applied Technology College
Ogden YouthBuild $1,095,006.00 03/15/2011 05/31/2014
25

WY Discretionary GrantsWY Discretionary GrantsAre You Plugged In?Are You Plugged In?
Grantee City Type of Grant AmountBegin Date
End Date
WYOMING DEPARTMENT OF WORKFORCE SERVICES
CHEYENNE SCSEP $472,321.00 07/01/2012 06/30/2013
WYOMING DEPARTMENT OF WORKFORCE SERVICES
CHEYENNE Green Jobs $4,495,704.00 01/29/2010 06/30/2013
WYOMING DEPARTMENT OF WORKFORCE SERVICES
CHEYENNE High Growth $4,924,211.00 04/02/2012 04/01/2016
CENTRAL WYOMING COLLEGE
RIVERTON Prisoner Reentry $1,273,846.00 07/01/2012 12/31/2014
Northern Wyoming Community College District
Sheridan TAACT $2,701,203.00 10/01/2011 09/30/2014
Casper College Casper TAACT $2,305,079.00 10/01/2012 09/30/2016
26
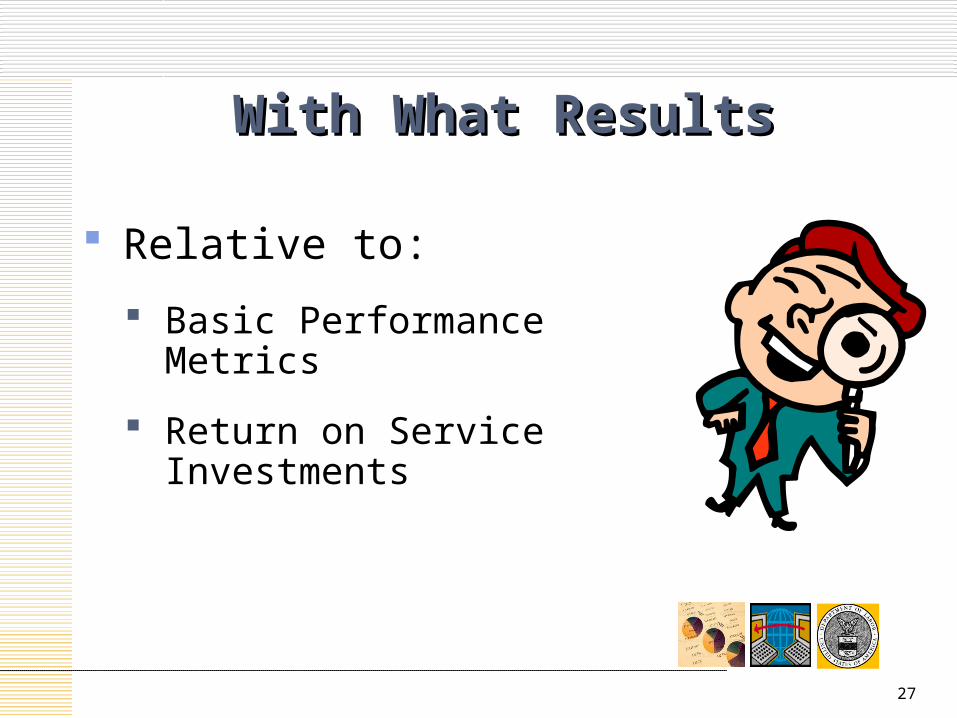
Relative to:
Basic Performance Metrics
Return on Service Investments
With What ResultsWith What Results
27
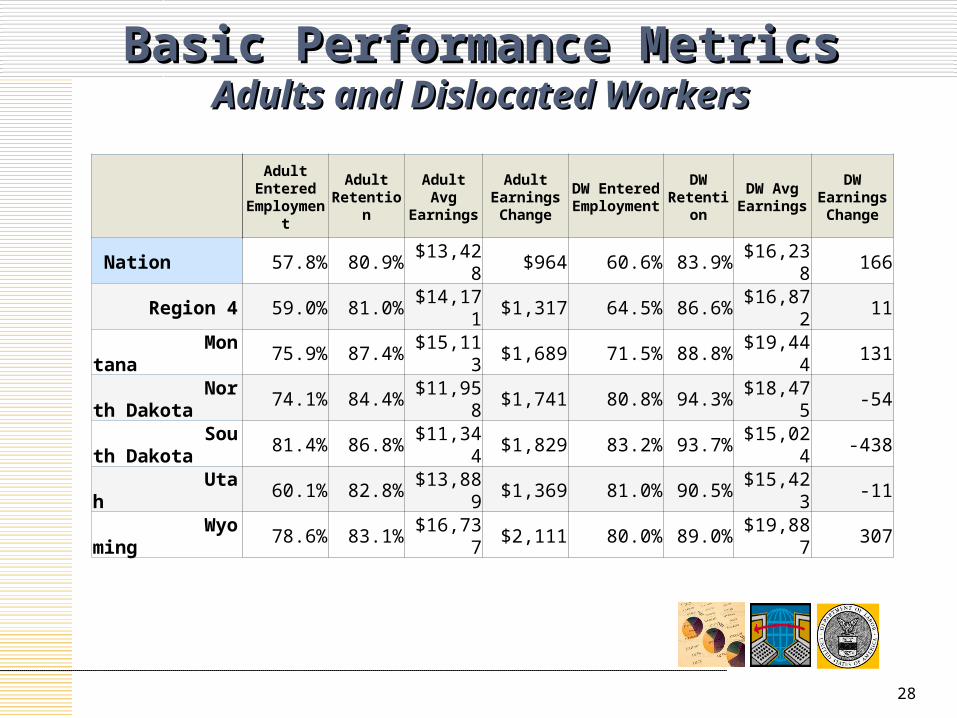
Basic Performance MetricsBasic Performance MetricsAdults and Dislocated WorkersAdults and Dislocated Workers
Adult
Entered Employment
Adult Retention
Adult Avg Earnings
Adult Earnings Change
DW Entered Employment
DW Retention
DW Avg Earnings
DW Earnings Change
Nation 57.8% 80.9% $13,428 $964 60.6% 83.9% $16,238 166
Region 4 59.0% 81.0% $14,171 $1,317 64.5% 86.6% $16,872 11
Montana 75.9% 87.4% $15,113 $1,689 71.5% 88.8% $19,444 131
North Dakota 74.1% 84.4% $11,958 $1,741 80.8% 94.3% $18,475 -54
South Dakota 81.4% 86.8% $11,344 $1,829 83.2% 93.7% $15,024 -438
Utah 60.1% 82.8% $13,889 $1,369 81.0% 90.5% $15,423 -11
Wyoming 78.6% 83.1% $16,737 $2,111 80.0% 89.0% $19,887 307
28

Basic Performance MetricsBasic Performance MetricsYouthYouth
Youth
PlacementYouth
DegreeLiteracy
NumeracyOY
CredentialOY Earnings
Change
Nation 59.4% 57.9% 48.4% 38.1% $47
Region 4 66.3% 61.1% 48.4% 34.0% $42
Montana 68.8% 61.3% 52.6% 24.0% $84
North Dakota 73.4% 69.8% 53.8% 46.7% $301
South Dakota 64.2% 61.1% 31.5% 27.2% $123
Utah 58.3% 52.2% 37.1% 39.8% $6
Wyoming 67.7% 61.8% 18.8% 34.4% $410
29

Your Training InvestmentsYour Training InvestmentsMontanaMontana
MONTANA(WIASRD #342)
As % of All
Exiters
den Adult EER
Adult Entered Employment
den Adult Avg
Earnings
Adult Avg Earnings
den Adult Earn
Change
Adult Earnings Change
den DW EER DW EER
den DW Avg
Earnings
DW Avg Earnings
den DW Earn
Change
DW Earnings Change
ONet Summary 100.0% 156 82.7% 153 $14,093 630 $2,183 467 77.5% 284 $18,868 629 801 (53) Transport/Material Moving 18.1% 33 84.8% 24 $15,651 114 $2,038 68 77.9% 57 $24,172 114 4,655 (29) Healthcare Practition/Tech 12.9% 31 96.8% 37 $18,639 74 $6,897 31 83.9% 19 $17,133 73 699 (47) Construction/Extraction 12.7% 9 88.9% $17,516 82 $943 78 70.5% 45 $19,074 82 509 (51) Production 9.0% 4 75.0% $11,872 62 $450 63 81.0% 40 $18,754 62 -909 (31) Healthcare Support 8.6% 36 83.3% 47 $10,153 82 $3,577 25 88.0% 15 $10,418 82 -187 (49) Installation/Maint/Repair 6.4% 5 100.0% $17,708 48 $885 46 69.6% 29 $18,920 48 -1,231 (17) Architecture/Engineering 5.1% 2 50.0% $11,024 11 -$1,025 17 88.2% $21,631 11 -2,618 (43) Office/Admin Support 5.1% 4 100.0% $10,281 35 $1,201 32 71.9% 19 $12,614 35 -615 (11) Management Occupations 3.7% 4 75.0% $15,722 24 $2,071 17 88.2% 12 $25,843 24 -252 (21) Community/Social Services 2.9% 6 50.0% $17,154 9 $1,938 12 66.7% $14,280 9 -655 (25) Education/Training/Library 2.5% 4 75.0% $11,408 20 $2,043 14 78.6% 9 $22,542 20 5,770 (15) Computer/Math. Science 2.5% 2 $11,464 12 $506 13 76.9% $12,438 12 -2,300 (41) Sales 2.1% 3 33.3% $9,289 10 $1,290 9 77.8% $16,040 10 -702 (19) Life/Physical/Social Science 2.0% 4 75.0% $9,226 10 $208 11 72.7% $15,278 10 -108 (13) Business/Financial Ops Mgrs 1.7% 1 $17,894 13 $801 8 75.0% $17,953 13 2,507 (39) Personal Care/Service 1.4% 3 100.0% 7 71.4% $11,112 1,890 (35) Food Preparation/Serving 1.4% 1 100.0% 3 100.0% $4,869 -7,221 (33) Protective Support 0.9% 2 50.0% $7,528 -$142 6 100.0% $18,403 -3,141 (27) Art/Des/Enter./Sports/Med 0.5% 2 100.0% $13,676 $4,611 2 100.0% $12,356 1,272 (37) Bldg/Grounds Clean/Maint. 0.5% 3 100.0% $2,442 -12,480 (23) Legal 0.2% (45) Farming/Fishing/Forestry 0.2% $1,691 2 50.0% 1,691Other 2 100.0% $9,273 -5,151
30
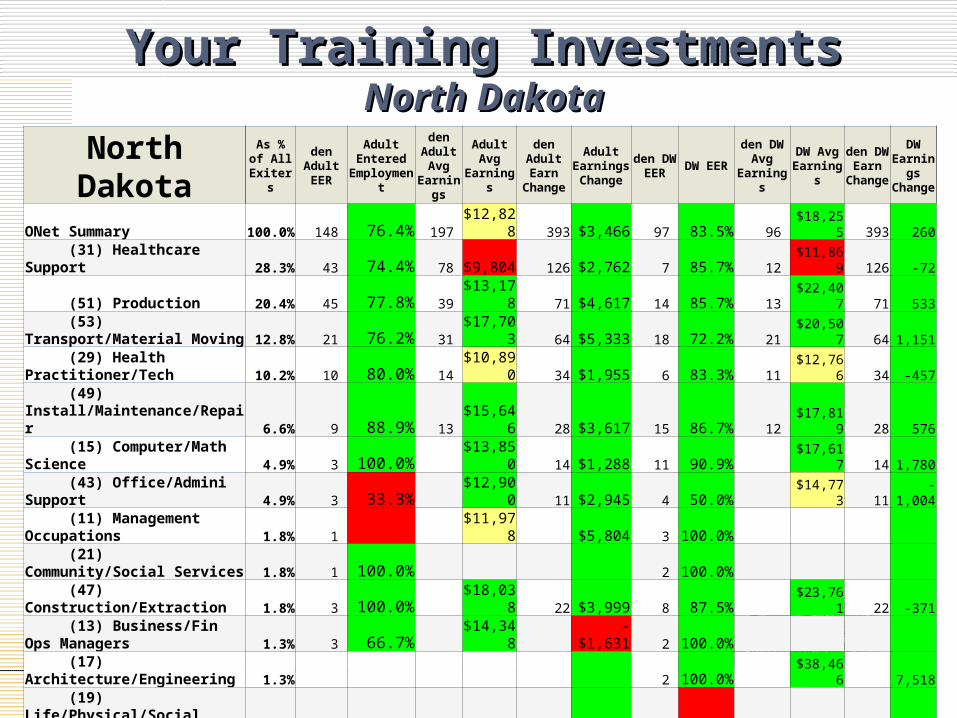
Your Training InvestmentsYour Training InvestmentsNorth DakotaNorth Dakota
31
North DakotaAs % of
All Exiters
den Adult EER
Adult Entered
Employment
den Adult Avg
Earnings
Adult Avg Earnings
den Adult Earn
Change
Adult Earnings Change
den DW EER DW EER
den DW Avg
Earnings
DW Avg Earnings
den DW Earn
Change
DW Earnings Change
ONet Summary 100.0% 148 76.4% 197 $12,828 393 $3,466 97 83.5% 96 $18,255 393 260
(31) Healthcare Support 28.3% 43 74.4% 78 $9,804 126 $2,762 7 85.7% 12 $11,869 126 -72
(51) Production 20.4% 45 77.8% 39 $13,178 71 $4,617 14 85.7% 13 $22,407 71 533
(53) Transport/Material Moving 12.8% 21 76.2% 31 $17,703 64 $5,333 18 72.2% 21 $20,507 64 1,151
(29) Health Practitioner/Tech 10.2% 10 80.0% 14 $10,890 34 $1,955 6 83.3% 11 $12,766 34 -457
(49) Install/Maintenance/Repair 6.6% 9 88.9% 13 $15,646 28 $3,617 15 86.7% 12 $17,819 28 576
(15) Computer/Math Science 4.9% 3 100.0% $13,850 14 $1,288 11 90.9% $17,617 14 1,780
(43) Office/Admini Support 4.9% 3 33.3% $12,900 11 $2,945 4 50.0% $14,773 11 -1,004
(11) Management Occupations 1.8% 1 $11,978 $5,804 3 100.0%
(21) Community/Social Services 1.8% 1 100.0% 2 100.0%
(47) Construction/Extraction 1.8% 3 100.0% $18,038 22 $3,999 8 87.5% $23,761 22 -371
(13) Business/Fin Ops Managers 1.3% 3 66.7% $14,348 -$1,631 2 100.0%
(17) Architecture/Engineering 1.3% 2 100.0% $38,466 7,518
(19) Life/Physical/Social Science 0.9% 1
(23) Legal 0.9% 2 100.0% $24,136 $2,516 1 100.0% $22,556 -386
(25) Education/Training/Library 0.9% 1 100.0% $34,852 34,552
(35) Food Preparation/Serving 0.4% 1 100.0% -17,438
(33) Protective Support 0.4% $20,237 $19,989
(39) Personal Care/Service 0.4% 2 100.0% $7,002 -$2,785 1 100.0% $9,757 -7,566
(27) Art/Des/Entert/Sports/Medi 1
(41) Sales 1

Your Training InvestmentsYour Training InvestmentsSouth DakotaSouth Dakota
32
South DakotaAs % of
All Exiters
den Adult EER
Adult EER
den Adult Avg
Earnings
Adult Avg
Earnings
den Adult Earn
Change
Adult Earnings Change
den DW EER
DW EER den DW Avg Earn
DW Avg Earnings
den DW Earn
Change
DW Earnings Change
ONet Summary 100.0% 220 80.0% 267 $11,752 693 $2,189 310 83.9% 259 $15,670 693 -269 (53) Transport/Material Move 13.9% 31 77.4% 47 $12,288 115 $1,824 39 84.6% 39 $17,236 115 839 (31) Healthcare Support 11.7% 39 82.1% 31 $9,079 81 $1,802 23 91.3% 24 $12,974 81 -1,156 (43) Office/Admin Support 11.5% 30 83.3% 34 $11,397 87 $1,195 35 82.9% 34 $12,038 87 -908 (29) Health Practitioner/Tech 10.4% 24 83.3% 47 $13,721 107 $3,256 49 83.7% 40 $13,082 107 -1,529 (51) Production 9.6% 26 84.6% 25 $14,253 51 $4,396 20 90.0% 17 $14,382 51 843 (11) Management Occupations 9.0% 10 70.0% 11 $10,292 38 $1,421 26 84.6% 17 $16,021 38 -1,029 (15) Computer/Math Science 5.7% 7 100.0% 10 $11,603 32 $2,211 22 68.2% 14 $18,841 32 886 (17) Architecture/Engineering 5.7% 9 44.4% $10,452 21 $275 26 88.5% 14 $16,989 21 521 (13) Bus./Fin Operations Mgrs 4.7% 4 100.0% $9,402 23 $2,182 16 81.3% 14 $20,380 23 1,470 (49) Install/Maint./Repair 3.5% 10 70.0% 12 $12,584 37 $1,968 15 80.0% 14 $18,277 37 286 (47) Construction/Extraction 2.5% 5 80.0% $13,544 23 $2,468 13 100.0% 13 $22,706 23 2,704 (00) n/a 2.0% 15 86.7% 22 $9,483 36 $2,908 2 50.0% 36 107 (21) Community/Social Svcs 1.6% 1 100.0% $8,173 $612 6 66.7% $18,322 -3,901 (33) Protective Support 1.4% 2 50.0% $13,947 $4,973 4 75.0% $16,843 825 (41) Sales 1.4% 2 50.0% $5,087 -$1,639 4 75.0% $16,838 -7,794 (23) Legal 1.2% 2 50.0% $3,754 $528 5 80.0% $9,292 -1,546 (39) Personal Care/Service 1.2% $941 (25) Educ/Trng/Library 1.2% 1 100.0% $15,976 $3,597 3 100.0% $16,441 -3,110 (37) Bldg/Grounds Clean/Maint. 1.0% (27) Art/Enter/Sports/Media 0.8% $333 1 100.0% $11,795 1,636 (19) Life/Physical/Social Science 0.4% 2 100.0% $15,600 $3,900 1 100.0% $15,016 -302 (35) Food Preparation/Serving
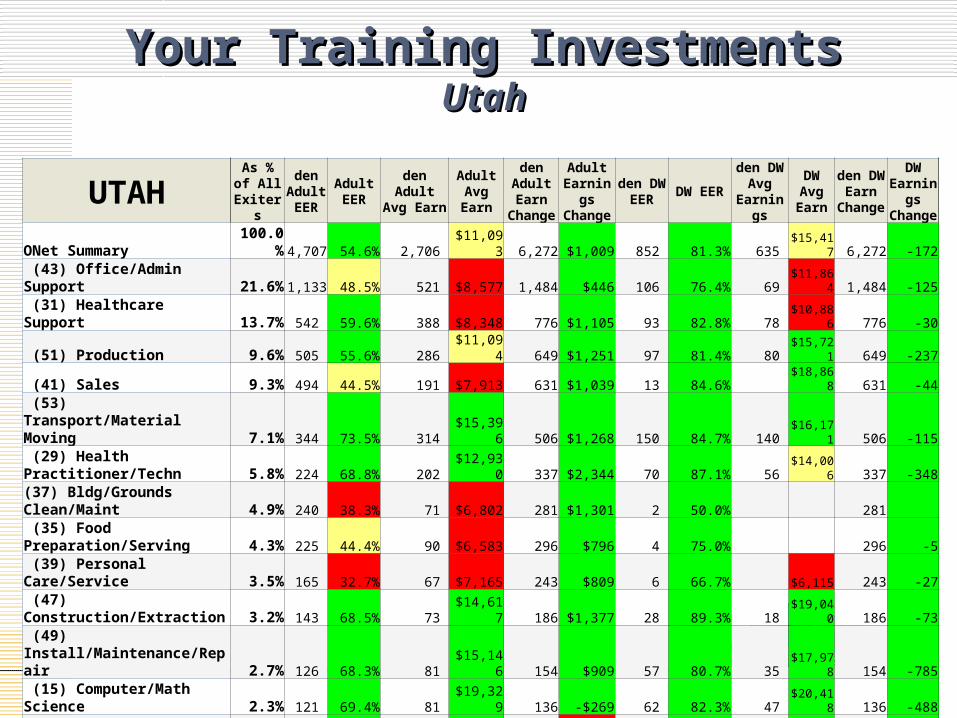
Your Training InvestmentsYour Training InvestmentsUtahUtah
33
UTAHAs % of
All Exiters
den Adult EER
Adult EER
den Adult Avg Earn
Adult Avg Earn
den Adult Earn
Change
Adult Earnings Change
den DW EER DW EER
den DW Avg
Earnings
DW Avg Earn
den DW Earn
Change
DW Earnings Change
ONet Summary 100.0% 4,707 54.6% 2,706 $11,093 6,272 $1,009 852 81.3% 635 $15,417 6,272 -172 (43) Office/Admin Support 21.6% 1,133 48.5% 521 $8,577 1,484 $446 106 76.4% 69 $11,864 1,484 -125 (31) Healthcare Support 13.7% 542 59.6% 388 $8,348 776 $1,105 93 82.8% 78 $10,886 776 -30 (51) Production 9.6% 505 55.6% 286 $11,094 649 $1,251 97 81.4% 80 $15,721 649 -237 (41) Sales 9.3% 494 44.5% 191 $7,913 631 $1,039 13 84.6% $18,868 631 -44 (53) Transport/Material Moving 7.1% 344 73.5% 314 $15,396 506 $1,268 150 84.7% 140 $16,171 506 -115 (29) Health Practitioner/Techn 5.8% 224 68.8% 202 $12,930 337 $2,344 70 87.1% 56 $14,006 337 -348(37) Bldg/Grounds Clean/Maint 4.9% 240 38.3% 71 $6,802 281 $1,301 2 50.0% 281 (35) Food Preparation/Serving 4.3% 225 44.4% 90 $6,583 296 $796 4 75.0% 296 -5 (39) Personal Care/Service 3.5% 165 32.7% 67 $7,165 243 $809 6 66.7% $6,115 243 -27 (47) Construction/Extraction 3.2% 143 68.5% 73 $14,617 186 $1,377 28 89.3% 18 $19,040 186 -73 (49) Install/Maintenance/Repair 2.7% 126 68.3% 81 $15,146 154 $909 57 80.7% 35 $17,978 154 -785 (15) Computer/Math Science 2.3% 121 69.4% 81 $19,329 136 -$269 62 82.3% 47 $20,418 136 -488 (11) Management Occupations 2.2% 102 56.9% 56 $14,522 113 -$817 41 70.7% 19 $17,376 113 -920 (33) Protective Support 1.6% 59 72.9% 84 $15,434 101 $3,578 27 88.9% 26 $15,625 101 138
(27) Art/Des/Enter/Sport/Media 1.5% 44 56.8% 31 $10,569 59 $1,806 11 63.6% $13,591 59 30 (19) Life/Physical/Social Science 1.5% 25 52.0% 9 $15,599 23 -$2,445 9 77.8% $18,369 23 -1,504 (21) Community/Social Services 1.3% 48 56.3% 27 $10,587 64 $1,413 10 60.0% $10,598 64 -108 (17) Architecture/Engineering 1.3% 55 80.0% 38 $19,184 58 -$1,132 41 85.4% 27 $18,991 58 -2,653 (25) Education/Training/Library 1.3% 54 53.7% 48 $11,413 95 $2,907 10 80.0% $15,683 95 -246 (13) Business/Fin Ops Managers 0.8% 37 67.6% 26 $15,419 46 $1,154 9 77.8% $17,924 46 -1,097 (23) Legal 0.6% 19 68.4% 20 $10,118 30 $2,656 6 66.7% $18,847 30 1,725 (45) Farming/Fishing/Forestry 0.0% 1 100.0% $15,541 $876 Military 1 $6,793 -$658
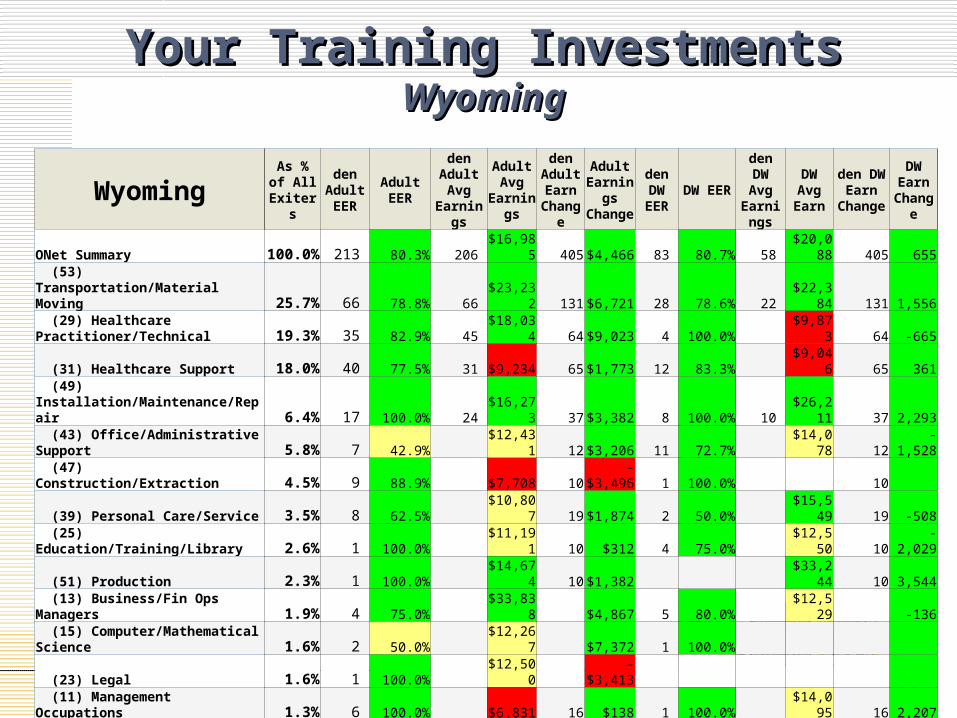
Your Training InvestmentsYour Training InvestmentsWyomingWyoming
34
WyomingAs % of
All Exiters
den Adult EER
Adult EERden Adult
Avg Earnings
Adult Avg
Earnings
den Adult Earn
Change
Adult Earnings Change
den DW EER
DW EERden DW
Avg Earnings
DW Avg Earn
den DW Earn
Change
DW Earn
Change
ONet Summary 100.0% 213 80.3% 206 $16,985 405 $4,466 83 80.7% 58 $20,088 405 655 (53) Transportation/Material Moving 25.7% 66 78.8% 66 $23,232 131 $6,721 28 78.6% 22 $22,384 131 1,556 (29) Healthcare Practitioner/Technical 19.3% 35 82.9% 45 $18,034 64 $9,023 4 100.0% $9,873 64 -665 (31) Healthcare Support 18.0% 40 77.5% 31 $9,234 65 $1,773 12 83.3% $9,046 65 361 (49) Installation/Maintenance/Repair 6.4% 17 100.0% 24 $16,273 37 $3,382 8 100.0% 10 $26,211 37 2,293 (43) Office/Administrative Support 5.8% 7 42.9% $12,431 12 $3,206 11 72.7% $14,078 12 -1,528 (47) Construction/Extraction 4.5% 9 88.9% $7,708 10 -$3,496 1 100.0% 10 (39) Personal Care/Service 3.5% 8 62.5% $10,807 19 $1,874 2 50.0% $15,549 19 -508 (25) Education/Training/Library 2.6% 1 100.0% $11,191 10 $312 4 75.0% $12,550 10 -2,029 (51) Production 2.3% 1 100.0% $14,674 10 $1,382 $33,244 10 3,544 (13) Business/Fin Ops Managers 1.9% 4 75.0% $33,838 $4,867 5 80.0% $12,529 -136 (15) Computer/Mathematical Science 1.6% 2 50.0% $12,267 $7,372 1 100.0% (23) Legal 1.6% 1 100.0% $12,500 -$3,413 (11) Management Occupations 1.3% 6 100.0% $6,831 16 $138 1 100.0% $14,095 16 2,207 (27) Art/Design/Entert/Sports/Media 1.3% 3 100.0% $11,472 -$4,487 1 100.0% $20,030 2,971 (21) Community/Social Services 1.0% 3 100.0% $10,913 $7,326 (33) Protective Support 1.0% 1 100.0% $20,514 $9,423 2 50.0% (17) Architecture/Engineering 0.6% 2 50.0% $16,882 -$5,921 2 50.0% $31,504 -13,743 (19) Life/Physical/Social Science 0.6% 2 100.0% $11,413 $3,804 1 100.0% (37) Bldg/Grounds Clean/Maint. 0.3% 2 50.0% $1,239 $619 (41) Sales 0.3% 2 50.0% $1,964 $1,964 (35) Food Preparation/Serving 0.3% (45) Farming/Fishing/Forestry 1 100.0% $10,493 -$1,605

Youth “Returns”Youth “Returns”
Supportive Services Additional Support Follow Up Services
Youth (4 Qtrs ending 9/30/12) Rec'd Did Not
Receive Rec'd Did Not Receive Rec'd Did Not
Receive
Nation
Youth Placement 59.4% 64.2% 56.3% 54.9% 64.8% 70.5% 54.5%Youth Degree 57.9% 62.0% 55.3% 53.2% 64.1% 68.9% 52.9%Literacy Numeracy 48.4% 53.4% 44.3% 47.3% 50.8% 55.1% 44.7%Youth Retention 62.9% 66.5% 60.9% 60.3% 67.0% 69.7% 59.7%
Montana
Youth Placement 68.8% 69.5% 62.5% 69.5% 70.6% 69.7% 74.5%Youth Degree 61.3% 60.7% 68.4% 59.8% 65.8% 61.0% 62.5%Literacy Numeracy 52.6% 54.7% 25.0% 43.5% 59.3% 25.0% 57.1%Youth Retention 63.5% 63.2% 66.7% 56.3% 69.2% 61.7% 67.9%
North Dakota
Youth Placement 73.4% 79.4% 61.6% 75.5% 66.0% 80.2% 70.0%Youth Degree 69.8% 83.6% 37.8% 75.1% 56.7% 74.4% 66.7%Literacy Numeracy 53.8% 66.7% 15.4% 55.0% 50.0% 50.0% 50.0%Youth Retention 77.2% 80.5% 69.7% 78.3% 78.4% 83.3% 68.5%
South Dakota
Youth Placement 64.2% 77.8% 60.4% 66.1% 33.3% 67.4% 66.7%Youth Degree 61.1% 55.6% 62.3% 62.2% 63.0% 100.0%Literacy Numeracy 31.5% 33.3% 30.8% 22.0% 58.3% 11.1% Youth Retention 74.1% 75.0% 73.8% 74.1% 72.7% 100.0%
Utah
Youth Placement 58.3% 60.2% 46.9% 59.8% 50.0% 66.6% 41.9%Youth Degree 52.2% 54.1% 40.5% 53.8% 42.3% 58.8% 39.6%Literacy Numeracy 37.1% 38.1% 25.0% 37.8% 27.3% 30.4% 4.7%Youth Retention 59.8% 57.9% 72.7% 57.7% 76.2% 61.8% 54.0%
Wyoming
Youth Placement 67.7% 68.0% 67.4% 76.8% 65.3% 66.5% 69.9%Youth Degree 61.8% 66.9% 57.0% 68.8% 61.1% 58.1% 67.7%Literacy Numeracy 18.8% 20.7% 10.5% 17.4% 20.3% 5.0% 16.7%Youth Retention 71.2% 69.7% 72.4% 85.7% 69.5% 72.3% 69.7%
35

Youth “Returns” (2)Youth “Returns” (2)
Educ. Achievement Services Enrolled in Education Summer Employment Leadership
Development
Rec'd Did Not Receive Yes No Rec'd Did Not
Receive Rec'd Did Not Receive
Nation
Youth Placement 63.2% 54.5% 61.0% 53.4% 56.2% 60.5% 65.8% 56.7%Youth Degree 64.4% 49.9% 57.9% 51.5% 60.9% 66.2% 54.9%Literacy Numeracy 52.9% 42.4% 54.7% 37.0% 45.6% 49.8% 50.9% 48.5%Youth Retention 65.8% 59.5% 66.2% 47.4% 66.6% 62.3% 67.1% 61.7%
Montana
Youth Placement 65.1% 71.1% 67.5% 72.7% 74.6% 68.2% 65.1% 71.1%Youth Degree 79.5% 58.5% 61.3% 75.4% 57.8% 73.0% 60.8%Literacy Numeracy 40.0% 53.3% 65.7% 31.8% 53.1% 53.3% 51.4%Youth Retention 58.5% 64.2% 65.8% 50.0% 69.2% 59.3% 56.3% 64.4%
North Dakota
Youth Placement 73.2% 73.2% 73.6% 71.4% 76.3% 72.6% 85.7% 70.8%Youth Degree 76.9% 50.0% 69.8% 69.8% 70.1% 66.7% 70.8%Literacy Numeracy 61.5% 46.2% 61.4% 12.5% 100.0% 52.9% 75.0% 52.1%Youth Retention 79.5% 74.5% 78.6% 63.2% 78.8% 78.1% 73.9% 79.5%
South Dakota
Youth Placement 76.7% 61.4% 65.3% 62.7% 65.3% 65.8% Youth Degree 59.5% 62.0% 61.1% 60.9% 61.5% Literacy Numeracy 30.8% 30.0% 33.3% 30.3% 30.2% 26.7% 50.0%Youth Retention 72.0% 75.8% 76.1% 66.7% 74.1% 74.1%
Utah
Youth Placement 59.0% 57.3% 58.5% 57.5% 59.2% 58.4% 61.0% 54.2%Youth Degree 54.9% 35.1% 52.2% 61.2% 48.4% 60.9% 38.7%Literacy Numeracy 40.5% 26.5% 39.8% 26.4% 46.7% 34.6% 40.3% 27.5%Youth Retention 59.9% 57.4% 60.4% 57.4% 67.4% 54.3% 58.4% 60.7%
Wyoming
Youth Placement 65.9% 73.1% 66.8% 75.0% 67.6% 73.5% 64.4%Youth Degree 68.9% 47.5% 61.8% 62.6% 63.9% 61.8%Literacy Numeracy 23.8% 22.1% 19.6% 20.5% 19.0%Youth Retention 70.4% 79.6% 71.0% 73.7% 72.1% 77.4% 69.7%
36

37
Thank you!