program on farmer-managed irrigation systems ic …publications.iwmi.org/pdf/h_15865.pdf'c c ic...
TRANSCRIPT

' c c
i c 'i c
r I L
lr L'
I C
FINAL REPORT
Program on Farmer-Managed Irrigation Systems and Support Services
PHASE II
SELF-ASSESSMENT OF PERFORMANCE OF FARMER-MANAGED IRRIGATION
IN BICOL, PHILIPPINES
October 1994
Submitted to the
International Fund for Agricultural Development and the Bundesministerium fur Wirtschaftliche Zusammenarbeit und Entwicklung (BMZ)
Government of the Federal Republic of Germany
by the
International Irrigation Management Institute PO BOX 2075, Colombo, Sri Lanka
c

Contents
Figures . . . . . . . . . . . . . . . . . . . . . . . . . . . . . . . . . . . . . . . . . . . . . . . . . . . . . . . . . . . . . . . . . . vii Tables . . . . . . . . . . . . . . . . . . . . . . . . . . . . . . . . . . . . . . . . . . . . . . . . . . . . . . . . . . . . . . . . . . . . ix Acknowledgements . . . . . . . . . . . . . . . . . . . . . . . . . . . . . . . . . . . . . . . . . . . . . . . . . . . . . . . . . xi
1 . II .
111 .
IV . V .
VI .
INTRODUCTION . . . . . . . . . . . . . . . . . . . . . . . . . . . . . . . . . . . . . . . . . . . . . . . . . . . . . . 1
PROJECT OBJECTIVES . . . . . . . . . . . . . . . . . . . . . . . . . . . . . . . . . . . . . . . . . . . . . . . . 3
DESCRIPTION OF PROJECT SITE AND PROFILE OF FARMER-LEADERS . . . . . . . . . . 3
A . The Project Site . . . . . . . . . . . . . . . . . . . . . . . . . . . . . . . . . . . . . . . . . . . . . . . . . . . . . 3 B . Profile of the Farmer-Leaders . . . . . . . . . . . . . . . . . . . . . . . . . . . . . . . . . . . . . . . . . . . 7
8.1 BRlSDAFlA . . . . . . . . . . . . . . . . . . . . . . . . . . . . . . . . . . . . . . . . . . . . . . . . . . . . 7 8.2 LAPSEFIA . . . . . . . . . . . . . . . . . . . . . . . . . . . . . . . . . . . . . . . . . . . . . . . . . . . . 11
CONCEPTUAL FRAMEWORK . . . . . . . . . . . . . . . . . . . . . . . . . . . . . . . . . . . . . . . . . . . 12
INTERVENTION ACTIVITIES AND METHODOLOGIES . . . . . . . . . . . . . . . . . . . . . . . . . 12
1 . Introduction and Institutionalizing of the Self-Assessment Mechanism . . . . . . . . . 12 2 . improving iA Collection Efficiency . . . . . . . . . . . . . . . . . . . . . . . . . . . . . . . . . . . . 16
4 . Introduction of Self-Assessment Mechanism for O&M Personnel 3 . Spot Mapping for Baseline Data Generation . . . . . . . . . . . . . . . . . . . . . . . . . . . . 16
of the NIA System Office . . . . . . . . . . . . . . . . . . . . . . . . . . . . . . . . . . . . . . . . . . 19
INDICATORS OF SUCCESS OF INTERVENTION ACTIVITIES . . . . . . . . . . . . . . . . . . . 21
A . Indicators of Performance Used 8 . Project Outcome . . . . . . . . . . .
. . . . . . . . . . . . . . . . . . . . . . . . . . . . . . . . . . 21
. . . . . . . . . . . . . . . . . . . . . . . . . . . . . . . . . . 23
1 . Compliance of the Farmers to the Cropping Calendar . . . . . . . . . . . . . . . . . . . . . 25 2 . Status of Farm Lots Harvested . . . . . . . . . . . . . . . . . . . . . . . . . . . . . . . . . . . . . . 28 3 . Water Management . . . . . . . . . . . . . . . . . . . . . . . . . . . . . . . . . . . . . . . . . . . . . . 30
3.1 Water Allocation and Distribution . . . . . . . . . . . . . . . . . . . . . . . . . . . . . . . . . 30 3.2 Communication . . . . . . . . . . . . . . . . . . . . . . . . . . . . . . . . . . . . . . . . . . . . . . 31 3.3 Conflict Management . . . . . . . . . . . . . . . . . . . . . . . . . . . . . . . . . . . . . . . . . . 31 3.4 Task Distribution . . . . . . . . . . . . . . . . . . . . . . . . . . . . . . . . . . . . . . . . . . . . . 33
4 . Organizational Planning . . . . . . . . . . . . . . . . . . . . . . . . . . . . . . . . . . . . . . . . . . . 33 5 . System Maintenance . . . . . . . . . . . . . . . . . . . . . . . . . . . . . . . . . . . . . . . . . . . . . 33
7 . Upward Linkage . . . . . . . . . . . . . . . . . . . . . . . . . . . . . . . . . . . . . . . . . . . . . . . . 37 6 . Financial Aspect . . . . . . . . . . . . . . . . . . . . . . . . . . . . . . . . . . . . . . . . . . . . . . . . 34
iii

VII. LESSONS AND CHALLENGES . . . . . . . . . . . . . . . . . . . . . . . . . . . . . . . . . . . . . . . . . . 40
VIII. PLANNED FUTURE ACTIVITIES . . . . . . . . . . . . . . . . . . . . . . . . . . . . . . . . . . . . . . . . . 43
Annex I NIA-IA Obligations in the Three Types of O&M Contracts . . . . . . . . . . . . . . . . . . . . . 45
Annex II Procedures for Spot Map Preparation . . . . . . . . . . . . . . . . . . . . . . . . . . . . . . . . . . . 51
Annex 111 Spot Map (Not to Scale) . . . . . . . . . . . . . . . . . . . . . . . . . . . . . . . . . . . . . . . . . . . . . 55
iv
FINAL REPORT
Program on Farmer-Managed Irrigation Systems and Support Services
PHASE II
Volume 3 Overview of the Program
Volume 2 Comparison ofSuppott Services for Farmer-Managed Irrigation Systems in Sri Lanka and Nepal
Volume 3 Irrigation Resource Inventory: AMethodology and Decision Support Tool forAssisting Farmer-Managed Irrigation Systems
Volume 4 Farmer-Managed Irrigation Systems in Chitral, Pakistan: Technology, Management Performance and Needs for Support
Volume 5 Self-Assessment of Performance of Farmer-Managed Irrigation in Bicol, Philippines
Volume 6 Farmer-Managed Groundwater Irrigation within the Eastern Gandak Irrigation System in Bihar, India
Volume 7 Lift Irrigation in West Africa: Challenges for Sustainable Local Management
V
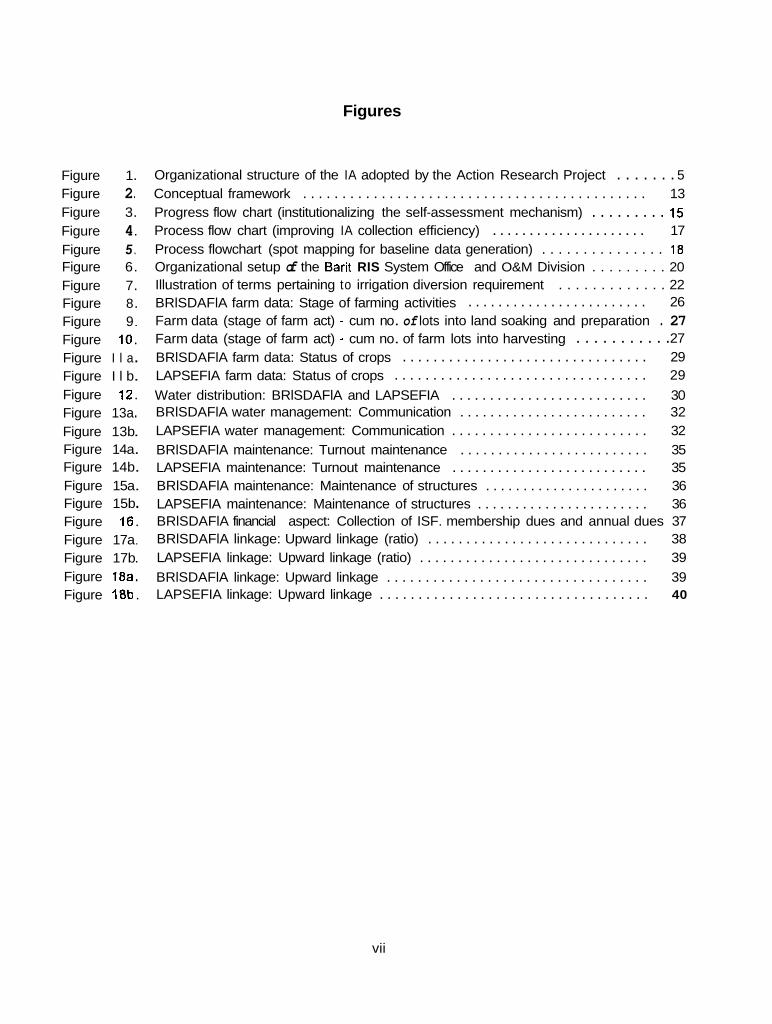
Figure 1 . Figure 2 . Figure 3 . Figure 4 . Figure 5 . Figure 6 . Figure 7 . Figure 8 . Figure 9 . Figure I 0 . Figure I l a . Figure I l b . Figure 12 . Figure 13a . Figure 13b . Figure 14a . Figure 14b . Figure 15a . Figure 15b . Figure 16 . Figure 17a . Figure 17b . Figure 18a . Figure 18b .
Figures
Organizational structure of the IA adopted by the Action Research Project . . . . . . . 5 Conceptual framework . . . . . . . . . . . . . . . . . . . . . . . . . . . . . . . . . . . . . . . . . . . . 13 Progress flow chart (institutionalizing the self-assessment mechanism) . . . . . . . . . 15 Process flow chart (improving IA collection efficiency) . . . . . . . . . . . . . . . . . . . . . 17 Process flowchart (spot mapping for baseline data generation) . . . . . . . . . . . . . . . 18 Organizational setup of the Barit RIS System Office and O&M Division . . . . . . . . . 20 Illustration of terms pertaining to irrigation diversion requirement . . . . . . . . . . . . . 22 BRlSDAFlA farm data: Stage of farming activities . . . . . . . . . . . . . . . . . . . . . . . . 26 Farm data (stage of farm act) - cum no . of lots into land soaking and preparation . 27
. . . . . . . . . . . 27 BRlSDAFlA farm data: Status of crops . . . . . . . . . . . . . . . . . . . . . . . . . . . . . . . . 29 LAPSEFIA farm data: Status of crops . . . . . . . . . . . . . . . . . . . . . . . . . . . . . . . . . 29 Water distribution: BRlSDAFlA and LAPSEFIA . . . . . . . . . . . . . . . . . . . . . . . . . . 30 BRlSDAFlA water management: Communication . . . . . . . . . . . . . . . . . . . . . . . . . 32 LAPSEFIA water management: Communication . . . . . . . . . . . . . . . . . . . . . . . . . . 32 BRlSDAFlA maintenance: Turnout maintenance . . . . . . . . . . . . . . . . . . . . . . . . . 35 LAPSEFIA maintenance: Turnout maintenance . . . . . . . . . . . . . . . . . . . . . . . . . . 35 BRlSDAFlA maintenance: Maintenance of structures . . . . . . . . . . . . . . . . . . . . . . 36 LAPSEFIA maintenance: Maintenance of structures . . . . . . . . . . . . . . . . . . . . . . . 36 BRlSDAFlA financial aspect: Collection of ISF. membership dues and annual dues 37 BRlSDAFlA linkage: Upward linkage (ratio) . . . . . . . . . . . . . . . . . . . . . . . . . . . . . 38 LAPSEFIA linkage: Upward linkage (ratio) . . . . . . . . . . . . . . . . . . . . . . . . . . . . . . 39
LAPSEFIA linkage: Upward linkage . . . . . . . . . . . . . . . . . . . . . . . . . . . . . . . . . . . 40
Farm data (stage of farm act) - cum no . of farm lots into harvesting
BRlSDAFlA linkage: Upward linkage . . . . . . . . . . . . . . . . . . . . . . . . . . . . . . . . . . 39
vii

c c
Tables c
c r L
Table 1.
Table 2.
Table 3.
Table 4.
Table 5.
IA profile as of wet season (July to December), 1992 . , , , , . . . . . , . . . . . . . . . . , . . . 4
Turnout service area leaders' profile . . . . . . . . . . . . . . . . . . . . . . . . . . . . . . . . . , . , . 8
The capability of farmer-leaders to record data, as of February 1992 . . . . . . . . . . . . . 14
Information generated by the TSALs and the respective uses . . , . . . . . . . . . . . . . . . 24
Comparative collection efficiency, wet season (July to December), 1991 and 1992 . . . 25
ix

Acknowledgements
IN ADDITION TO the authors, Fay M. Lauraya, Antonia Lea R. Sala, Ma. Juliet Caceres, IlMl wishes to acknowledge the hard work and support of Study Team members Julieta Garbiles, Ma. Lourdes Sapinoso and Gabriel G. Armena of Bicol University. We appreciate the cooperation of the Bicol University Research and Statistics Center, Bicol University College of Arts and Sciences, Bicol University Development Foundation, lnc. and the National Irrigation Administration Region V.
xi

[I
c I L- I t [I
c c
c I] c c c P
L
Self-Assessment of Performance of Farmer-Managed Irrigation in Bicol, Philippines
Fay M. Lauraya, Antonia Lea R. Sala and Ma. Juliet Caceres
I. INTRODUCTION
RECOGNIZING THE LlMiTATlONS of expanding areas under irrigation, recent development efforts in irrigated agriculture have placed emphasis on devising new management schemes to increase productivity in this sector. One such scheme is the devolution of tasks by government agencies to farmer organizations in areas ranging from O&M and fee collections to full management turnover which in the Philippines is popularly called the participatory approach pioneered by the National Irrigation Administration (NIA). Past studies on the impact of farmers' involvement in irrigation systems management provide evidence that turnover of management responsibilities to Irrigators' Associations (Ins) has led to significant improvement in system performance. The study of the Institute of Philippine Culture (IPC) using four national systems under NIA's participatory program as samples showed that the systems improved in financial viability and gained in their areas and cropping intensities after farmers were engaged in system management (Jopillo and de 10s Reyes 1988). In addition, Wijayaratna, in his paper assessing the Philippine experience in Irrigation Turnover and Self-Management, reported that access to water, reliability, adequacy and equity in water distribution also improved, farmer satisfaction increased and conflicts over water distribution reduced following full or partial turnover of system management to IAs (Wijayaratna 1993). A Bicol University-IIMI research on the performance of IAs revealed that IA performance efficiency significantly contributes to system peiformance. This research then concluded that system performance can be enhanced by strengthening the IAs' capability for irrigation management and maximizing farmers' involvement in systems management and planning process (Lauraya and Sala 1990).
In recent years, IAs in the country have been assuming important system management responsi- bilities particularly those under Types I, II and 111 contracts.' In the Type I contract the IA simply undertakes the routine maintenance works of a certain length of the irrigation canal system. Under the Type II contract, farmer organizations assume the system operations and irrigation service fee (ISF) collection functions. Systems operations include: 1) planning the O&M activities and undertaking the O&M from the turnout to the main farm and supplementary farm ditches; 2) planning, implementation and monitoring of the cropping calendar; 3) water allocation and distribution; 4) conflict management; and 5) maintaining linkage between the farmer-users and the NIA. Collection functions include: 1) planning effective collection strategies; 2) distribution of ISF bills; and 3) undertaking ISF collection. Meanwhile, under the Type 111 contract, water users assume complete responsibility for partial or complete management of the irrigation system. IAs under the Type I and Type II contracts are given incentives
'Prior to the implementation of the Types I , iI and 1 1 1 contracts, NIA Classified IAs into three stages of development and correspondingly the contracts entered into were referred to as Stage I , II and 111. There were slight differences in the NIA-IA obligations under these Stage cont,acts but IAs stand to gain a higher share from iSF collection. Starting 1990, IAs undertaking 08M functions for the first time were contracted by NIA using the Type I , II and 111 contracts, but the Stage contracts continued to be enforced for those IAs that had such contracts with the NIA. Hence, BRlSDAFlA is a Type II contract while LAPSEFIA carries a Stage II contract. Part VII ofthis report further elaborates on the basic differences between the two types of contracting schemes.
1

for their participation in the O&M and irrigation service fee collection. Under Type Ill contract, the IA shall amortize the investment and rehabilitation costs of the whole or part of the system in not more than 50 years. A detailed presentation of the NIA-IA obligations as well as the corresponding incentives in the three types of contracts is made in Annex I. Although the farmer-leaders of IAs undergo leadership training before their organizations assume the tasks specified in the O&M contract, in many cases, they do not have successfully internalized mechanisms that strengthen management capabilities to face the challenges of their new management responsibilities.
Farmer-leaders of IAs themselves have recognized the need to improve their management capability to steer the organization towards the vision of self-reliance and governance. Introducing a systematic process for planning and monitoring IA activities was seen as an ideal entry point for strengthening the managerial capability of the IA leaders.
Thus, in 1991, a participatory assessment among farmer-leaders was initiated in two iAs of the Barit River Irrigation System, a national system in Nabua, Camarines Sur (about 400 km south of Manila). Referred to as self-assessment of performance technique, it was conceived initially as a tool to countercheck the impact evaluation results of the 13-month action research project' under the USAID- sponsored Accelerated Agricultural Production Program (AAPP). Noting the positive response of the farmer-leaders to this self-assessment process and its significance as a self-correcting mechanism to improve IA performance. the project was extended for another two years with the aim of institutionalizing the self-assessment process and further developing it into a management information system for the iAs as a whole. In jointly managed systems such as the National Systems where the NIA shares management responsibilities with the IA, the need to corroborate plans reflective of both the farmers' and government management needs becomes imperative. As conceived therefore, data generated by the IA shall eventually be linked to the NIA's information needs. Such would reduce the agency's work in collecting data at the grass-roots level because farmers are now being trained to have the capacity to gather and consequently analyze irrigation data. Most importantly, the farmers' perceived inadequacies, particularly in repairs and maintenance could be regularly integrated into the agency's plans. It is expected that once this Management Information System is institutionalized, it would help strengthen the O&M of the systems. Hence, the self-assessment process could lead to the enhancement of system performance and to the eventual spin-off improvement in agricultural productivity.
Documented herein are the intervention activities implemented during the initial 13-month period-March 1992 to March 1993, and the project's impact as indicated by some performance indicators. This report is organized into 7 parts. Following the introduction, Part II outlines the objectives of the two-year intervention project. Part 111 describes the project site and the profile of the farmer- leaders who are the key participants of the self-assessment process. This section also includes a presentation of the vision of the farmer-leaders on what they want the IA to become in the future. Part IV provides a description of the project's conceptual framework. Part V documents the process and methodologies of the intervention activities carried out during the 13-month period. There were four major activities introduced and this section traces the chronological sequence of the process Of implementation including the rationale for pursuing the said activities. Part VI presents some indicators of success of the intervention activities. It also defines the indicators of performance used in the self- assessment process. The final section, Part VII, delves on the lessons and challenges that need to be confronted forthe success of the project. Specifically, it provides recommendations on how to encourage adoption of the self-assessment process in the IA.
'The project title was Organizational Development Program for Strengthening IAs and NIA-IA Partnership implemented by the Bicol University, Ateneo de Naga, NIA V under the supewision of IlMl Philippines Field ORce.
2

c
c
I C
II. PROJECT OBJECTIVES
THE SELF-ASSESSMENT SCHEME is a learning process wherein farmers and farmer-leaders are being trained to systematically record and evaluate their performance and use these data for planning and decision- making functions. Specifically, its objectives are:
1. to monitor and evaluate performance of irrigation systems in general and IAs in particular;
2. to introduce a learning process to identify and characterize the types of strategies that could be used internally to catalyze collective action and thereby improve system performance as an alternative for external cataiysffintervention;
3. to strengthen the IA's managerial capability by introducing a systematic process for participatory planning and monitoring IA activities (both for operations and organization):
4. to improve farmers' capacity to analyze the performance data they themselves have collected; and
5. to link the self-assessment scheme with NIA's information system.
111. DESCRIPTION OF PROJECT SITE AND PROFILE OF FARMER-LEADERS
A. The Project Site
THE PROJECT COVERED two IAs of the Barit River Irrigation System (ERIS) in camarines SUP namely: Barit River Irrigation System Division A Farmer Irrigation Association (ERISDAFIA) and the La Purisima, Sta. Eulalia Farmer Irrigator's Association (LAPSEFIA). These two IAs are located at the extreme points of the main canal, BRISDAFIA at the head and LAPSEFIA at the tail end. The characteristics of these two IAs are shown in Table 1.
The ERISDAFIA has 57 turnout service areas spread across 15 barangays. The total service area is 740 ha of which 683.5 had been reported as irrigated area by the TSA leaders during the wet season of 1992 (July-December). The total number of farmers is about 1,831 with only 104 or 5.7 percent as registered members. Although it appears that the number of registered members is quite small, this should not be interpreted as that only this number of members participate in IA activities such as rabus (voluntary work), meetings, payment of irrigation service fees and the like. As observed, the only difference delineating members from nonmembers is that the former have paid the required membership fee (registration fee) while the latter have not. All water users, whether registered as members of the IA or not, benefit from water-service delivery and are expected to participate in IA activities. However, since membership fee is one source of IAs' income, it should seriously contemplate on strategies that would motivate farmers to register as IA members. This concern holds true for both IAs covered by the project.
'Camarines Sur is one of the six provinces of the Bicol Region. It has the biggest potential irrigable area . . (406,171 hectares) among the six provinces, of which 63 percent had been developed for irrigation as of 1989.
3 , .

Table 7. /A protile as of wet season (July to December), 7992.
Potential farmer members
Registered members
Number of turnout service area leaders (TSALs)
Data obtained from spot maps prepared by the IA.
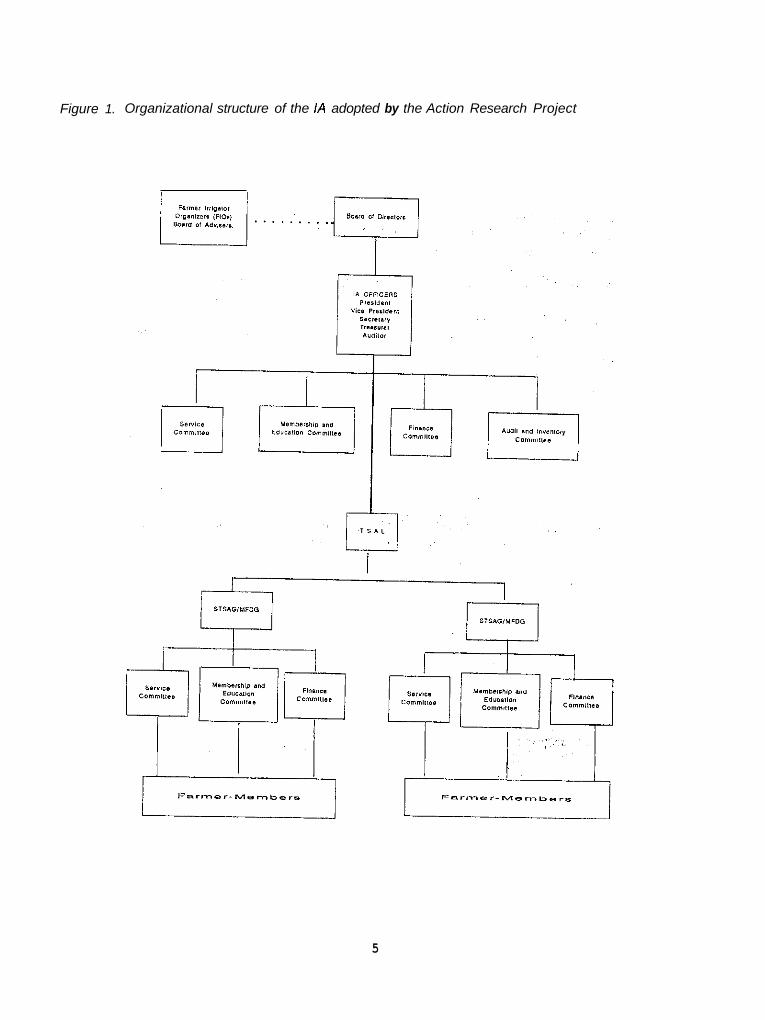
The average landownership is 0.35 ha while the average farm lot size is 0.22 ha. Each turnout service area is headed by a leader (TSAL) who automatically becomes a member of the Board of Directors (BOD). This Board is considered as the central governing body of the organization, empowered to formulate policies and elect the executive officers comprising the President, two Vice Presidents, the Secretary, the Assistant Secretary, the Treasurer and the Auditor. Except for the President, each officer chairs the four standing committees of the IA, namely: Service, Education and Training, Finance and Audit. The Farmer Irrigator Organizers (FIO) who were tapped by the NIA to organize the IA are now considered as the Association's Board of Advisers. A sample organizational structure is shown in Figure 1 which is also the same structure adopted by the LAPSEFIA.
The relatively large membership of the Board weakens its dynamism to govern given the statutory rule of constiiuting a quorum, that is, 50 percent of its members to be present, in order to formulate resolutions or declare decisions on issues. It has been noted that during the past BOD meetings, the required quorum has seldom been attained. In addition, the Association faces several challenges that need to be overcome in order for it to stand independently as a private entity and succeed in its task of providing satisfactory irrigation services to farmer-members. As identified by farmer-leaders themselves during the IA Planning Workshop last November, 1992, in connection with the BU-IIMI Project entitled "An Integrated Development Approach for Improving IA Performance," such challenges include the following:
4
c ii
Figure 1. Organizational structure of the /A adopted by the Action Research Project
5

1. Low commitment of members to the /A. This lukewarm attitude of farmers towards the Association could be due to an interplay of several factors. First, as the IA is located at the upstream portion of the water system, there is water sufficiency in most parts of its service area. Farmers do not feel the urgency to undertake the required maintenance tasks as there is always plenty of water whether or not they maintain the canals. Another factor is the inabillty of the IA to provide more services to the members other than water delivery. Since farmers benefit from water-delivery service whether or not they become registered members or participate in the IA, there is no incentive for farmers to actively get involved in IA activities. The IA leaders have recognized that their organization should be able to offer services beyond water delively exclusively for members' benefit to elicit their commitment to the IA.
2. lnactive leaders at the TSA level. More than half of the TSA leaders of this IA are preoccupied with secondaly economic activities which compete with the time that otherwise could have been devoted to the fulfillment of their functions as TSA leaders. It should be mentioned that these leaders undertake their duties and responsibilities without any compensation. Given their low farm income, it is quite justifiable to think of material incentives to motivate these leaders to turn in good management performance.
3. Poor maintenance of facilities and unregulated use o f water resulfing in inequity o f water distribution in certain parts of the /A as well as water inadequacy in the other /As located downstream. Some portions of BRlSDAFlA suffer from flooding while other parts experience water inadequacy within the same cropping season. These concerns are interrelated to the first two problems cited above. In addition, the TSA leaders complain about the lack of control struc- tures like the steel gate which weakens their ability to regulate water flow in their areas of responsibility.
4. Lack of a systematic collecfion process for irrigation service fees and membership dues. The IA has a service area of 740 hectares (ha) and it has only 9 authorized IA collectors. On the average, each collector is expected to cover about 80 ha. Although the IA had assumed the collection functions from the NIA for the irrigation service fees since 1991, the NIA continues to provide them assistance in undertaking this function. It is the NIA which prepares the bills and sets the target collection for the IA collectors Since the NIA also has its own constraints, the bills are usually delayed and thus the irrigation service fees could not be collected simultaneously with the harvest period. Fiestas (community celebrations to honor a patron saint) are usually observed afler the harvest and it has been the practice ofthe farmers to overspend during these occasions. If a collector arrives afler these fiestas, it is seldom that farmers are able to pay. It is therefore important that collection be timed with the harvest period.
Low /A share from irrigation service fee collection. This problem is both an outcome of Situation number 4 and the very minimal share of the IA in the IA-NIA sharing system stipulated in the Type II contract. This concern is elaborated in Part VII of this report.
5.
The LAPSEFIA has 52 turnout service areas dispersed across 9 barangays. Total farm lots inventoried through the spot maps prepared by the TSA leaders aggregated to 3,024 covering 853.8 ha of irrigated area. These farm lots are tilled by 2,157 farmers of whom there are 741 (34%) registered members to date. The average farm lot size is 0.2823 ha while the average landownership is 0.3958 ha.
6
I c ~c I
I [
The IA at present carries a Stage II contract with the NIA and given its commendable performance on collection and maintenance, this IA would be ready to assume full management responsibility in the very near future under the NIA's full turnover scheme or Stage 111 contracting system.
Being at the tail end, the IA suffers from water inadequacy, particularly during the peak of the dry season. This threat, however, is cushioned by the dedication of its leaders and the high sense of cooperation among the farmer-members. The IA is now looking at the prospects of venturing into non- water services to complement the delivery of irrigation service to the farmers.
8. Profile of the Farmer-Leaders
Described herein are the characteristics of the turnout service area leaders (TSALs) in the two IAs covered by the study to provide a backdrop on the intervention strategies adopted and the project outcome after the 13-month period of project implementation. The data used in this section were based on a one-page Personal Profile Questionnaire distributed to all TSA leaders in January, 1993. For BRISDAFIA, 46 out of the 56 TSA leaders completed the questionnaires while 43 out of 49 TSA leaders from LAPSEFIA provided the needed information. Details of the succeeding discussion are presented in Table 2.
8.1 BRISDAFIA
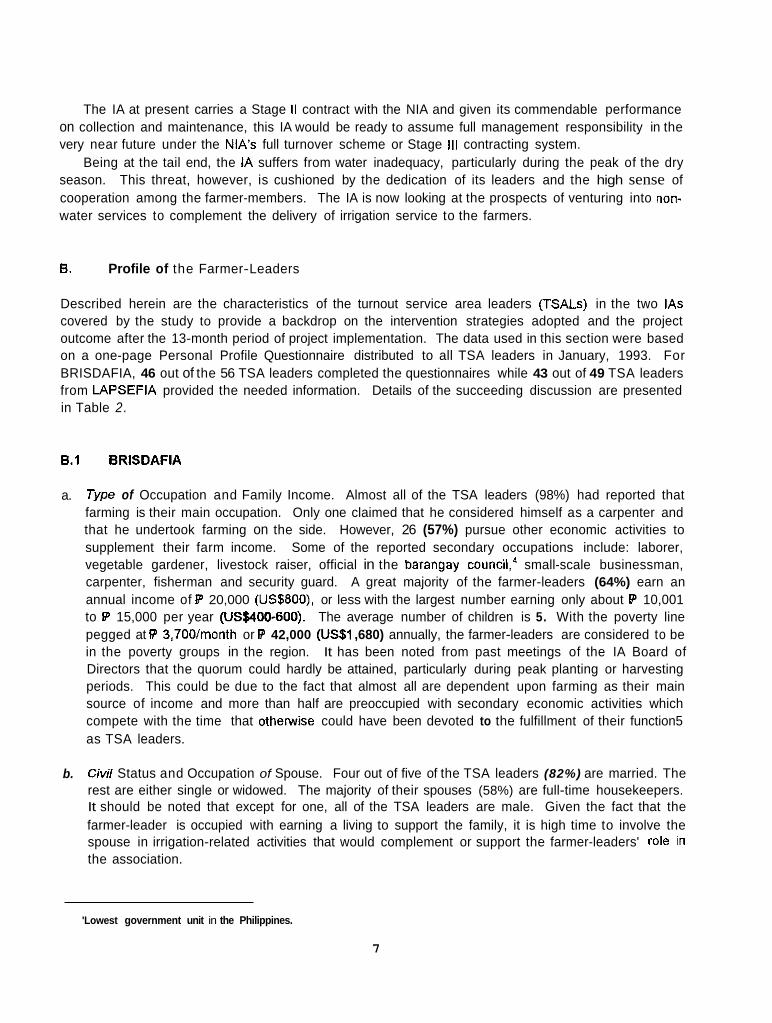
a. Type of Occupation and Family Income. Almost all of the TSA leaders (98%) had reported that farming is their main occupation. Only one claimed that he considered himself as a carpenter and that he undertook farming on the side. However, 26 (57%) pursue other economic activities to supplement their farm income. Some of the reported secondary occupations include: laborer, vegetable gardener, livestock raiser, official in the barangay c o ~ n c i l , ~ small-scale businessman, carpenter, fisherman and security guard. A great majority of the farmer-leaders (64%) earn an annual income of W 20,000 (US$SOO), or less with the largest number earning only about W 10,001 to W 15,000 per year (US$400-600). The average number of children is 5. With the poverty line pegged at I? 3,7001month or fp 42,000 (US$l ,680) annually, the farmer-leaders are considered to be in the poverty groups in the region. It has been noted from past meetings of the IA Board of Directors that the quorum could hardly be attained, particularly during peak planting or harvesting periods. This could be due to the fact that almost all are dependent upon farming as their main source of income and more than half are preoccupied with secondary economic activities which compete with the time that otheiwise could have been devoted to the fulfillment of their function5 as TSA leaders.
b. Civil Status and Occupation of Spouse. Four out of five of the TSA leaders (82%) are married. The rest are either single or widowed. The majority of their spouses (58%) are full-time housekeepers. It should be noted that except for one, all of the TSA leaders are male. Given the fact that the farmer-leader is occupied with earning a living to support the family, it is high time to involve the spouse in irrigation-related activities that would complement or support the farmer-leaders' role in the association.
'Lowest government unit in the Philippines.
7

Table 2. Turnout service area leaders' prole.
Category
Main Occupation Farmer Carpenter No response
Total Occupation (other than
farming) Mini-grocery store operator
(with about US$200 capitalization)
Pensioner Laborer
1 Fishing \ Palay trader ~ Welder ' Photographer
Electrician : Vegetable gardening ~ Livestock raising
I
Barangay council official Small-scale business
~ Carpenter ' Sub-contractor (houselbldg) ~ Furniture maker i Fishing ~ Security guard i No secondary occupation
No response Total Civil Status
~.~ ~
Single Married Widowler Separated No response
Total ~~
BRlSDAFlA NO. of TSALsi
45.
1~
46 .~
7
5
3 3 1 11
1 :
3 :
I
l j
1 20
46 ~
2 41 3 ,
r
46
.. .-
LAPSEFIA ~~
70 No. of TSALsi
97.83 40
1 !
43 ~
2.17 3 ;
100 1 I
!
~~. , ~ . .
I 3 '
:
1 1 1 1 1
15.22
10.87 I 6.52 ~ I ! 6.52 1 6.52 I 2.17
2.17 ~
i
I 2.17 ~
~
i ~
100 .~ 43 j~
I 2.17 2.17 I 43.48 I
32 ~
i 4.35 1
89.13 37 6.52 2 ;
3
43 I
% i ,
~
93.02 i 6.98 I 100'
I . ,
~
6.98
, 4.65 1 2.33, 2.33 2.33 2.33
2.33 i 2.33
, I
74.42 ~
1001
2.33 : 86.05 1 4.65
6.98 ' 100 !
I! ~
(Continued)
a

Table 2 (Continued)
6.52 17.39 15.22
. ~~~~~~~~~ ~ . ~ ~
Spouse's Occupation Housekeeper Teacher Daycare worker Contract worker Dressmaker Farmer Weaver No response
Total Number of Children
~~~~~~ ~ ~
1 2 3 4 5 6 7 8 9 10 1 1 12 No response Average number of children
TOM
Age ~ ~ ~ ~ ~~~~~~ ~~~~~~~~~
25 - 30 31 -35 36 - 40 41 - 45 46 - 50 51 -55 56 - 60 61 - 65 66 - 70 71 -75 76 and above No response
Total ~
29 2 1 1 1 1
1 1 46 ~.
5 ' 4 4 , 4 4 4' 5' 1 2
1 2!
5 ! 10 1
es , 1 , 1~ 11 31
7i
6! 6 ,
6: 4:
81
1 2 46 j
9
31
3 1 8 43
~
3 1 3 4 2 3 3 6 6 1 1 2 8 6 43
I 1 3 3 1 8 7 5 4 2
72.09
6.98 2.33 18.60 100
6.98 2.33 6.98 9.30 4.65 6.98 6.98 13.95 13.95 2.33 2.33 4.65 18.60
100
2.33 2.33 6.98 6.98 2.33 18.60 16.28 11.63 9.30 4.65
__ - - -. --
18.60 100.00
(Continued)

Table 2 (Continued).
2 4 4
Educational A ttalnment No grade completed Some elementary Elementary graduate Some high school High school graduate Post-secondary course Some college College graduate No response
rota1 Annual Income
-
P 1,000 and below 1,001 - 5,000 5,001 - 10,000
10,001 - 15,000 15,001 - 20,000 20,001 - 25,000 25,001 - 30,000 30,001 - 35,000 35,001 - 40,000 40,001 - 45,000 45,001 - 50,000 50,001 - 55,000 55,001 - 60,000
No response rota1 __
4.65 9.30 9.30
1 8 6 4 6 2 7
-1
15.22 10.87 10.87 28.26 4.35 6.52 6.52
17.39 100
4.35 15.22 13.04 32.61 4.35 8.70 6.52 2.17 4.35
2.17
~-
6.52 100 .- -
2.33 18.60 13.95 9.30
13.95
16.28
6 15
131-- -7
1
10

c e c c r
I L
' E
c. Average Age and Educational Attainment. The average age of the farmer-leaders is 56 years which is slightly higher than the average age of members which is 52 years. Electing the older members to occupy important positions in the IA is perhaps an unconscious adherence to the belief of giving respect to elders and heeding their counsel sharpened by experience. The average educational attainment of the farmer-leaders is high school education which is again higher than that obtained by members which is at elementary level.
Vision of the TSALs of the /A. When asked what they want the IA to be in the future, more than half (58%) expressed the desire to improve water-delivery service of the IA, convert it into a cooperative and go into the provision of support services to the members. Other responses include: improve its management, attend to the condition of the irrigation facilities, inform farmers of their obligation to pay irrigation fees, compensate the leaders for their services to the IA and campaign among fellow farmers to register as members. It is sad to note, however, that some of the farmer-leaders (24%) in this IA have not expressed their views on what they believe the direction that the IA should take in the future.
d.
8.2 LAPSEFIA
a. Type of Occupafion and Annual Family Income. As in BRISDAFIA, the majority of the farmer- leaders (93%) confirmed that farming is their main occupation. Only 25 percent had secondary activities to supplement their farm income. More than half earn an income of P 20,000 (US$SOO) or more per year which indicates that farmer-leaders in this IA are relatively better off than their counterparts in BRISDAFIA. The average number of children is 6.
6. Civil Status and Occupation of Spouse. The farmer-leaders are predominantly male (only one is Most of their spouses (72%) are housekeepers while three (7%) female) and married (86%).
reported that they are involved in farming.
c. Average Age and Educafional Attainment. The average age and educational attainment are more or less similar to those of their counterparts in BRISDAFIA, that is, 56 years and high-school level.
Vision of the TSALs for the /A. The farmer-leaders of this IA articulated their thoughts on how they pictured the IA in the future. Their outlooks were more or less directed towards the same vision as that of those in BRISDAFIA: improving the performance of the IA, varying only on how to make such a dream a reality. The greatest number of farmer-leaders eyed the possibility of a cooperative and, alongside with water delivery, venturing into the provision of capital to members to improve produc- tion. About one fourth (21%) manifested their desire to take over full management of the system. Some (16.3%) placed emphasis on improving the irrigation facilities and the need to inform members on its proper use and protection. Others saw the need to have a set of honest leaders and united members as the basic foundation of a progressive association.
d.
11
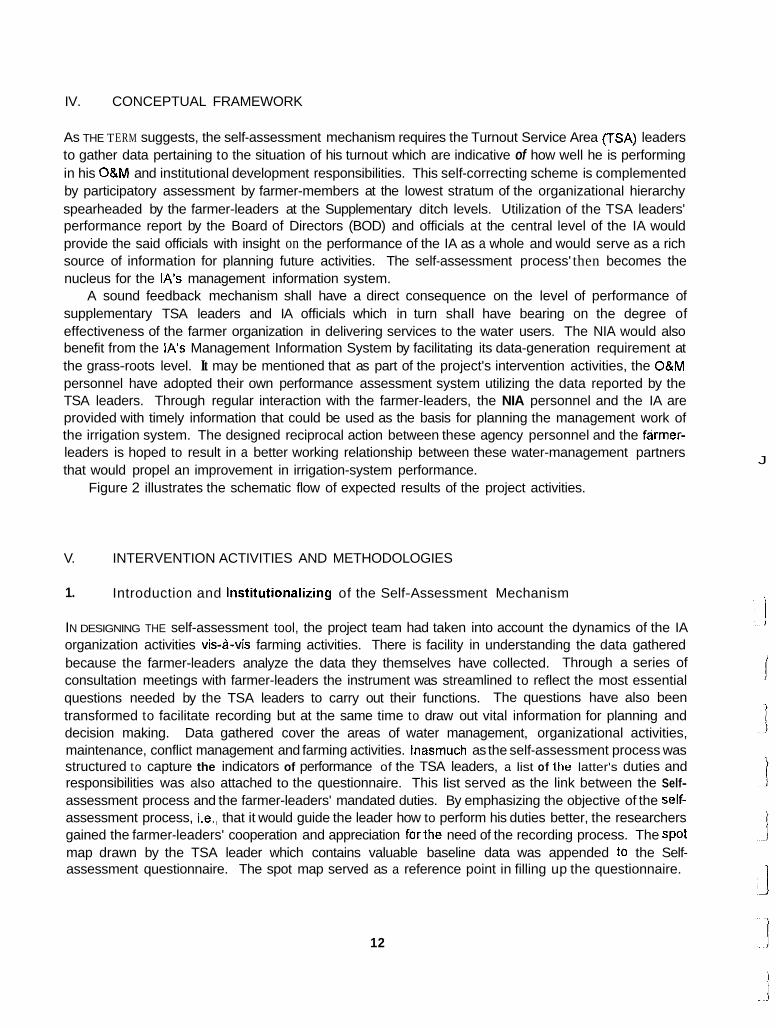
IV. CONCEPTUAL FRAMEWORK
As THE TERM suggests, the self-assessment mechanism requires the Turnout Service Area (TSA) leaders to gather data pertaining to the situation of his turnout which are indicative of how well he is performing in his O&M and institutional development responsibilities. This self-correcting scheme is complemented by participatory assessment by farmer-members at the lowest stratum of the organizational hierarchy spearheaded by the farmer-leaders at the Supplementary ditch levels. Utilization of the TSA leaders' performance report by the Board of Directors (BOD) and officials at the central level of the IA would provide the said officials with insight on the performance of the IA as a whole and would serve as a rich source of information for planning future activities. The self-assessment process' then becomes the nucleus for the INS management information system.
A sound feedback mechanism shall have a direct consequence on the level of performance of supplementary TSA leaders and IA officials which in turn shall have bearing on the degree of effectiveness of the farmer organization in delivering services to the water users. The NIA would also benefit from the IAs Management Information System by facilitating its data-generation requirement at the grass-roots level. It may be mentioned that as part of the project's intervention activities, the O&M personnel have adopted their own performance assessment system utilizing the data reported by the TSA leaders. Through regular interaction with the farmer-leaders, the NIA personnel and the IA are provided with timely information that could be used as the basis for planning the management work of the irrigation system. The designed reciprocal action between these agency personnel and the farmer- leaders is hoped to result in a better working relationship between these water-management partners that would propel an improvement in irrigation-system performance.
Figure 2 illustrates the schematic flow of expected results of the project activities.
V. INTERVENTION ACTIVITIES AND METHODOLOGIES
1.
IN DESIGNING THE self-assessment tool, the project team had taken into account the dynamics of the IA organization activities vis-a-vis farming activities. There is facility in understanding the data gathered because the farmer-leaders analyze the data they themselves have collected. Through a series of consultation meetings with farmer-leaders the instrument was streamlined to reflect the most essential questions needed by the TSA leaders to carry out their functions. The questions have also been transformed to facilitate recording but at the same time to draw out vital information for planning and decision making. Data gathered cover the areas of water management, organizational activities, maintenance, conflict management and farming activities. Inasmuch as the self-assessment process was structured to capture the indicators of performance of the TSA leaders, a list of the latter's duties and responsibilities was also attached to the questionnaire. This list served as the link between the Self- assessment process and the farmer-leaders' mandated duties. By emphasizing the objective of the self- assessment process, i.e., that it would guide the leader how to perform his duties better, the researchers gained the farmer-leaders' cooperation and appreciation forthe need of the recording process. The Spot map drawn by the TSA leader which contains valuable baseline data was appended to the Self- assessment questionnaire. The spot map served as a reference point in filling up the questionnaire.
Introduction and Institutionalizing of the Self-Assessment Mechanism
J
12

c
I c
‘ r
T m .-
A series of test-runs were conducted specifically to review whether the self-assessment tool has adequately covered all areas of TSAL performance; to evaluate the facility of accomplishing or answering the questions; and to clarify the importance of the self-assessment process among farmer-leaders by linking it to their duties and responsibilities embodied in the farmer-organization (IA) bylaws. A significant outcome of these series of meetings with the TSALs was the discussion of common issues or problems encountered and the sharing of actual experiences among the farmer-leaders. The self-assessment tool served as a guide for them to systematically evaluate the f a n situation and, as a consequence, to catalyze action for resolution of problems.
However, because of the farmer-leaders' low educational attainment and rather advanced age (average age is 56) the learning process in recording the required data (although the tool was already simplified) necessitated a longer period of time. The project team deemed it necessary to visit each TSAL to give him further training in filling up the form. This function is slowly being transferred to the IA official assigned to supervise a group of TSALs who shall eventually take over the monitoring task at the end of the project life. Eventually, it is expected that the IA officials shall use the self-assessment results as a means to gauge the level of performance of the TSALs. On their part, the TSALs would be able to assess which functions they were able to carry out effectively and which functions needed to be improved. As of now, data analysis among TSA leaders is limited to the data needed by the NIA such as those for the preparation of the List of Planted Area (LIPA) and the report on damaged farm areas due to pests, flood or drought, needed for determining which farm lots are eligible to be exempted from the payment of the irrigation-service fee. Figure 3 illustrates the specific activities undertaken to date.
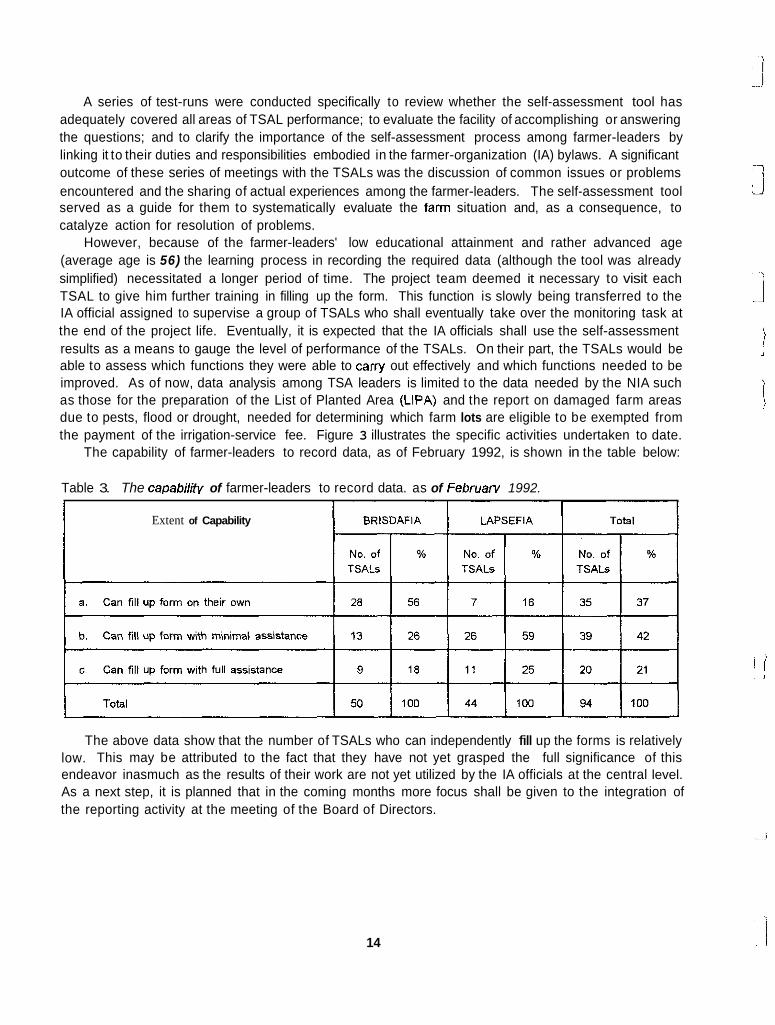
The capability of farmer-leaders to record data, as of February 1992, is shown in the table below:
Table 3. The capability of farmer-leaders to record data. as of February 1992.
Extent of Capability
The above data show that the number of TSALs who can independently fill up the forms is relatively low. This may be attributed to the fact that they have not yet grasped the full significance of this endeavor inasmuch as the results of their work are not yet utilized by the IA officials at the central level. As a next step, it is planned that in the coming months more focus shall be given to the integration of the reporting activity at the meeting of the Board of Directors.
14

Figure 3. Progress flow chart (institutionalizing the self-assessment mechanism).
I I Enhancement of eeif-assessment form by incorporating TSAL guide on his duties and responsibilities in the questionnaire and attaching the turn-out service area spot-map
I I
1 Consultation with iA Officials to elicit comments on revised form and incorporating local practices. Specified IA officials' role in monitoring TSALs' performance through the use of this form
1 i Finalized form for distribution
Conducted dry-run In fliiing up forms an each iA official area
Project Team meets wlth TSALs of each IA olficlai area to check progress in fillmg up forms
Project Team visits each TSAL to assess progress in filling up forms
I TSALs fill up forms on their own I
Analysis and use of data far LIPA and exemption report preparation
15

2. Improving IA Collection Efficiency
Since results of the participatory-assessment process showed that most problems at the turnout level are caused by dysfunctional structures or canals needing repair works, the IAs are pressured to act on these problems to ensure continued member participation. In this regard, the IAs have to generate funds internally by way of increasing collection from irrigation fees. One important performance indicator that NIA uses in assessing the level of IAs share in the fees collected is collection efficiency, which is the ratio of the actual and the target ISF collections, especially in IAs which assume the collection function, as in the case of LAPSEFIA and BRISDAFIA. These two IAs feel the need to install a mechanism that would improve their present collection efficiency. Records show that prior to the implementation of this project, the collection efficiency in these two IAs was very low-less than 50 percent on the average. As a resul, BRISDAFIA failed to receive any ISF share and feelings of disenchantment prevailed over IA collectors as they did not get a single centavo for their efforts. In view of this, the project team in consultation with the IA officials and the NIA staff introduced a more systematic bill distribution and collection process. In addition, an incentive mechanism for IA collectors was designed separately for each IA to elicit the commitment of collectors to reach the collection target and a contest was launched forthe best collector and theTSAL with 100 percent collection efficiency. Figure 4 highlights the sequen- tial activities undertaken. It should be mentioned that these activities were conducted at the onset of the wet cropping season for 1992 (July) with the intent of attaining a higher collection efficiency affer the introduction of the said activities.
3.
The spot mapping activity was conceived when IA officials expressed their desire to have a profile of the IA and the TSAs which reflects a baseline information about their area of responsibility and which could be readily used when establishing linkages with other agencies. In addition, spot maps were deemed an important tool in the self-assessment process in that a leader shall have a defined and clear picture of his area of responsibility including an accurate estimate of the size of farms and number of farmers under his jurisdiction. With the spot map, the TSAL can as well easily indicate the status of canals, main farm ditches (MFDs), supplementary farm ditches (SFDs) and facilities. Specificaily, the spot map contains:
Spot Mapping for Baseline Data Generation
1. The boundary of the TSA, STSA and MFD,
2 . The lot number and lot area,
3. The structures and facilities,
4.
5. The tenurial status.
The names of owners and tillers, and
Spot mapping was the initial activity of the TSAL. Figure 5 contains the chronological flow of activities conducted toward spot-map preparation.
16

" c
IC
Figure 4. Process flow chart (improving IA collection efficiency).
Consultation with iA Offlcials lo assess weaknesses of past performance 01 IAs in bill distribution and ISF collection
BU team assisted IAs revise indivlduai billing form 7 BU team assisted IAS devise process for bill distribution m
BU team develops incentive mechanism lorlA collections
Meeting with IA officials to discuss proposed mcentlve scheme
Devise monitoring form for collection and remittance
Meeting with farmer-collectors lo introduce forms
1 Contest for collectors and TSA Leaders
17

II] - 4
Y m
<
-+ . I
e ?
- I ' i

c E [
c D I2 1
It should be noted that the entire process ate up too much time because so many lots were without lot numbers and area sizes so that the TSALs could not complete maps on their own. Added to this, there were farmers who refused to have their lots measured. On the one hand, validation of spot maps by the NIA personnel took a long time because of other priority assignments. However, the length of time spent in spot-map preparation is justifiable considering its importance to both the IA and the NIA. Because of its simplicity, spot maps can be used by leaders with low-education status and they are cost- effective compared to parcellary maps.
The detailed procedures for spot-map preparation which were distributed to the TSALs are attached as Annex 2 in both the local dialect and in English. Also a sample of a spot map made by the leaders is appended (Annex 3).
The NIA management acknowledged the importance of this endeavor because information to be generated shall have a number of uses and advantages:
1. Update the list of registered members needed for LlPA preparation. In the process of preparing the spot maps, initial findings disclosed that, for years, a number of water users have not paid ISF since they were not registered members and since their farm lots were not reflected on the parcellary map.
2. Determine area harvested, area benefited and area planted. These are required for ISF computation. In the past, it was the responsibility of the OBM personnel to generate the said data who in turn sought the assistance of the FiOs and the TSALs.
Area served during wet and dry seasons. The data are specially relevant to LAPSEFIA since seasonal discrepancies arise due to submerging of areas during the wet season.
3.
As of February, 1993, most of the maps (76%) were validated and are now being used by the TSALs in the self-assessment process. Initial results showed that there are a number of farm lots not presently registered with the IA and the NIA which though using irrigation water are not billed. For the next cropping season, it is expected that there will be an increase in irrigation service fee collection due to the inclusion of newly identified water users in the IAINIA's billing list.
4. Introduction of Self-Assessment Mechanism for 08M Personnel of the NIA System Office
Under the farmer-agency joint irrigation management contract, the NIAs responsibilities in O&M activities are given flesh by the Water Masters and Ditch Tenders. Figure 6 illustrates the organizational setup of the Barit River Irrigation System Office and 08M Division. Each Ditch Tender is given a specific area of assignment within the IA's service area and he has a corresponding number of farmer-leaders as counterparts for the O&M task. In BRISDAFIA. Ditch Tenders and the Water Master are responsible for the maintenance of the main canals and laterals while the TSA leaders take charge of the O&M function from the turnout to the main and supplementary farm ditches. Meanwhile, in LAPSEFIA, the NIA O&M personnel are responsible for the main canal maintenance while the TSA leaders assume the maintenance task from the lateral down to the main and supplementary farm ditches. Since their duties are complementary, it was logical that the Ditch Tender should also gather field information that would reflect his performance. The scheme requires the Ditch Tenderwater Master to be in contact with farmer-leaders to monitor their performance as well as to thrash out problems. Considering that the data collected by the Ditch Tenders cover not only their area of responsibility but those of the TSA leaders
19

Figure 6. Organizational setup of the Barif RlS System Office OdM Division
Irrigation Superintendent c Assiqant Irrigation
Superintendent (A'S)
1 Operation and Maintenance Division
Water Master Division A
BRlSDAFlA
E I 3 Ditch Tenders
Water Master Division A
NiBFiA
2 Ditch Tenders
Water Master Division A
LAPSEFIA
I 2 Ditch Tenders
1 J
20
as well, the Water Master who consolidates the said report is provided with a complete picture of the system for his own planning and decision-making function, vital at his supervisory level. Eventually, it is planned that the data shall be channeled to higher-management levels. As of February 1993, the consensus arrived at during the BU-NIA Region and Systems level meeting was to reconcile the self- assessment form for O&M staff with existing forms used by the NIA Central Office (IMIS) and those prescribed at the regional level. The ultimate aim is to develop a single form that would satisfy the data needs of the NIA Central, Regional and Systems levels as well as those of the IAs and the TSA leaders taking into account timeliness, data utility and facility in data recording. The significance of this self- assessment scheme is not only the linking of the IA and NIA information system but that the O&M personnel are given on-ihe-job training in institutional tasks by making them frontliners in dealing with the farmers. Inasmuch as the bulk of irrigation problems brought out by farmers deals with O&M aspects, indeed the Ditch Tenders and Water Masters are the NIA's best representatives in the field. This activity is supportive of NIA's long-term plan of handing over the institutional development task to the Water Masters. Under the project scheme, the Water Masters were designated by the Irrigation Superintendent as NIA's official representative in all IA activities such as BOD and Turnout Service Area Group meetings, membership campaigns, and the like. He was also given authority to act on NIA-IA matters that do not require higher-level decisions. On the other hand, the Ditch Tenders were assigned to monitor a specified number of TSA leaders with regard to the accomplishment of the self-assessment forms. With the recent streamlining of the Institutional Development Officers (IDOs) due to financial constraints, the Water Master has fully assumed all the official duties of the IDOs in the two IAs covered by the project.
VI. INDICATORS OF SUCCESS OF INTERVENTION ACTIVITIES
A. indicators of Performance Used
THE ULTIMATE TEST of IA performance is whether the organization has satisfied the general objective of ensuring adequate and timely delivery as well as equitable distribution of irrigation water among beneficiaries. In this context, the self-assessment process captures the Performance of TSALs who are the principal actors involved in the execution of the abovementioned function. The questionnaire which is filled up by the TSAL monthly, incorporates a number of performance indicators which revolve around the five major activities required in managing the irrigation system. These are: water allocation and distribution, system maintenance and repair, financial management, planning of organizational activities, and conflict management.
The extent of efficiency in water allocation and distribution at the TSA level is manifested by the actual number of farmers who have adhered to the cropping calendar, the number of farm lots whose water supply is perceived to be adequate, and conversely, the number of lots damaged due to pests, flooding, drought, etc. These pieces of information are specially important in LAPSEFIA as it is perennially beset by water-adequacy problems due to its tail-end location. For efficient utilization of scarce water, therefore, strict enforcement of the cropping calendar and adherence to rotation schedules are imperative. The self-assessment questionnaire reflects how well these functions are carried out by examining the number of farm lots in each stage of farming activity and the number of farmers who practiced rotation monthly. Ideally. if there is compliance to cropping schedules, the monthly variation in the number of farm lots in various stages of production is expected to be minimal.
21

As an indicator of system maintenance and repair, the status of canals (SFD, MFD, laterals, main) as well as structures within the jurisdiction of the TSA is assessed and recorded, the results of which would disclose how active the leaders and Ditch Tenders are in initiating and renderlng maintenance and repair works. Figure 7 illustrates the layout of the main and lateral canals as well as the main and supplementary farm ditches. Adopting the scale of 1 to 3, the canals were evaluated in terms of their cleanliness with 1 corresponding to very clean and 3 to dirty. For the irrigation structures such as the division box, steel gates, and foot bridge, their conditions were determined using the same scale with 1 referring to dysfunctional condition and 3 to functional.
J
Figure 7. lllusfration of terms pertaining to irrigation diversion requirement.
n
W
n <
W ; W v)
i SERVICE ROAD ~
LATERAL CANAL J 1 _j
HEAD GATE I \
J
22

Similarly, since the viability of singularly functioning IAs is basically determined by its effectiveness in ISF collection, the extent of motivation and groundworking activities undertaken by the TSAL for this purpose is reflected by the collection efficiency attained at the TSA level.
The extent to which the TSALs foster membership involvement in irrigation activities is also revealed by the number of meetings held and the rate of membership participation not only in meetings but in scheduled voluntary works.
Finally, the number of conflicts that have arisen and resolved per month are likewise monitored and would reflect the extent of ingenuity and concern of the leader in minimizing conflicts and resolving them.
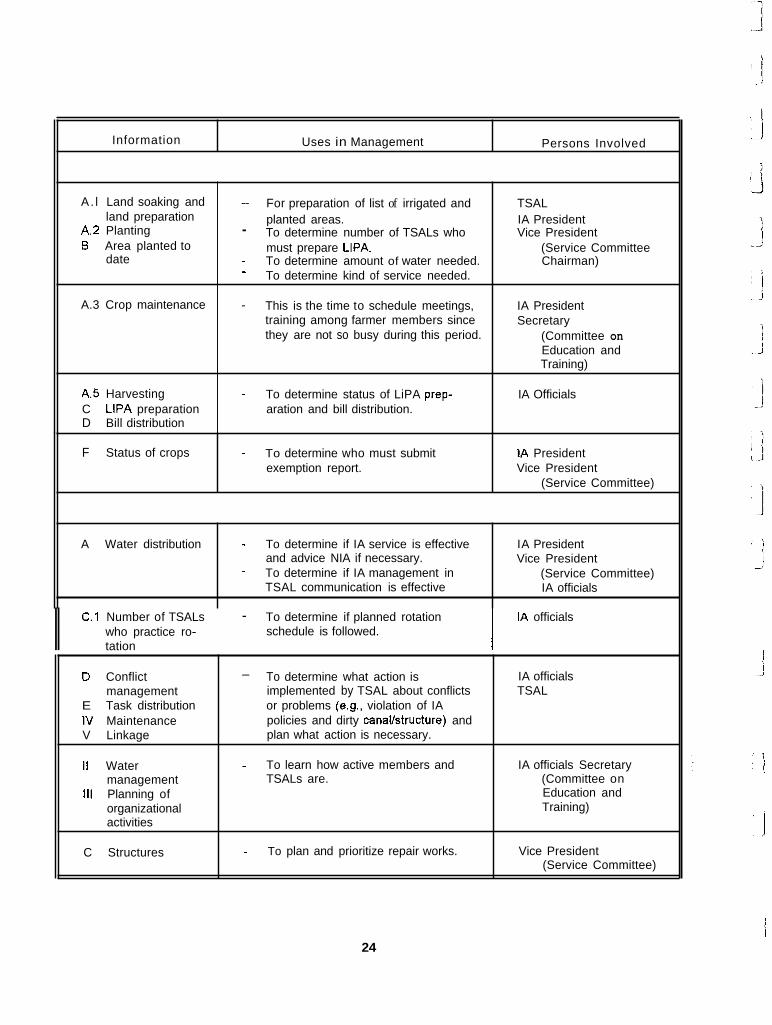
Aside from assessing the performance of the TSAL, the self-assessment instrument generates valuable inputs crucial for planning and decision making at the IA and NIA levels. Table 4 highlights these items of information, their specific uses and persons responsible for action.
B. Project Outcome
The impact of the various strategies implemented is best manifested by the significant rise in the collection efficiency of the two IAs. Conventionally, the NIA computes this indicator in two ways: one, current collection efficiency which reflects the ratio of current actual collection to current target collec- tions; and, overall collection efficiency which is the ratio of current plus back account collections to current target collection. The first measure is used as the basis for determining the share in collections that would accrue to the IA while the second is adopted for the preparation of NIAs Irrigation Management Information System (IMIS).
The table below reflects the comparative collection figures in the two IAs before and after project introduction.
It is transparent that the IAs have achieved a marked improvement in the collection efficiency as a result of the intervention efforts. While BRlSDAFlA attained a 19 percent increase in current collection efficiency, LAPSEFIA realized 13 percent. In addition, the efforts devoted to this function can be discerned if one focuses on the absolute change in current and back actual collections. For instance, LAPSEFIA and BRlSDAFlA registered a 99 percent and 47 percent increase, respectively, in actual current collection in 1992 compared to the previous year. Meanwhile, back-account collections increased by 52 percent for BRlSDAFlA and 103 percent for LAPSEFIA. The overaii collection efficiency in BRlSDAFlA and LAPSEFIA, therefore, climbed by 19 percent and 26 percent, respectively. If one compares these levels to the present average collection performance (includes both current and back accounts) of IAs with similar contracting arrangements with the NIA nationwide, which is 56 percent, it can be concluded that the two IAs have performed relatively better insofar as this indicator is concerned. Nonetheless. the achievement of BRlSDAFlA was not enough to qualify this IA for a share in the total current collections since the existing IA-NIA sharing scheme entitles the association to a minimum share beginning at 51 percent level.
At present, the Barit River Irrigation System is experiencing a vicious circle in that operation and maintenance are neglected because of inadequate funds caused by low irrigation service fee (ISF) collections. Paradoxically, the latter is brought about by the poor maintenance service. Since it has been shown that the self-assessment process can be a tool to inspire ISF collection, it can be viewed as a means to break that vicious circle. It is anticipated that the IA as well as the NIA performance levels would further be enhanced once the self-assessment process is well internalized by the farmers, and, most importantly, linked to the data needs of the NIA.
Uses in Management Information Persons Involved
C.1 Number of TSALs - To determine if planned rotation IA officials who practice ro- schedule is followed. ll tation
A . l Land soaking and land preparation
A 2 Planting B Area planted to
date
A.3 Crop maintenance
A.5 Harvesting C LIPA preparation D Bill distribution
- For preparation of list of irrigated and TSAL
- To determine number of TSALs who Vice President
- To determine amount of water needed. Chairman) -
- This is the time to schedule meetings, IA President
planted areas. IA President
must prepare LiPA. (Service Committee
To determine kind of service needed.
training among farmer members since they are not so busy during this period.
Secretary (Committee on Education and Training)
- To determine status of LiPA prep- IA Officials aration and bill distribution.
24
F Status of crops - To determine who must submit IA President exemption report. Vice President
(Service Committee)
A Water distribution - To determine if IA service is effective and advice NIA if necessary. To determine if IA management in TSAL communication is effective
- IA President Vice President
(Service Committee) IA officials
D Conflict management
E Task distribution IV Maintenance V Linkage
II Water management
111 Planning of organizational activities
C Structures
IA officials TSAL
- To determine what action is implemented by TSAL about conflicts or problems (e.g.. violation of IA policies and dirty canallstructure) and plan what action is necessary.
- To learn how active members and IA officials Secretary TSALs are. (Committee on
Education and Training)
- To plan and prioritize repair works. Vice President (Service Committee)

c
BRlSDAFlA
1991 1992 Yo Category
C
LAPSEFIA
1991 1992 Yo
r
f. Overall collection
The preparation of the spot maps resulted in a rise in the billed area which would consequently increase the ISF collection. Specifically, 28.3 hectares were identified as benefited areas but were not reflected in the NIAs master list. If one would compute for the added revenue given the present rate of irrigation service fee, the newly identified areas would mean a marginal increase of I? 42,462 (US$1,698) per year.
These promising results could be attributed to the improved performance of the TSA leaders as shown by the self-assessment results. The foregoing discussion presents the results of the self- assessment done by farmer-leaders from October, 1992 to March, 1993. The two IAs practice two cropping seasons annually. In the previous year, the wet season started in June and ended in November while the dry season began in December, 1992 and ended in May, 1993. The period under study covered the last two months of the wet season in 1992 and the first three months of the dry season in 1993.
1.
In the first part of the self-assessment instrument. the TSA leaders were asked to record the number of farm lots under their area of responsibility that are into the different stages of farming activities per month. This information is deemed useful in assessing the extent of compliance ofthe cropping calendar developed for the two IAs. It should be noted that based from the schedule, the first two months irfthe assessment period corresponded to the harvest months for the 1992 wet season. Water release which signaled the start of the dry season was done in December 6, 1992. The last three weeks for December and the early part of January were therefore appropriated for land soaking and prepapation while planting was scheduled for from the last part of January until the first week of February. Crop maintenance was undertaken in February and March while April was set as the start of the harvest season.
Compliance of the Farmers to the Cropping Calendar
25

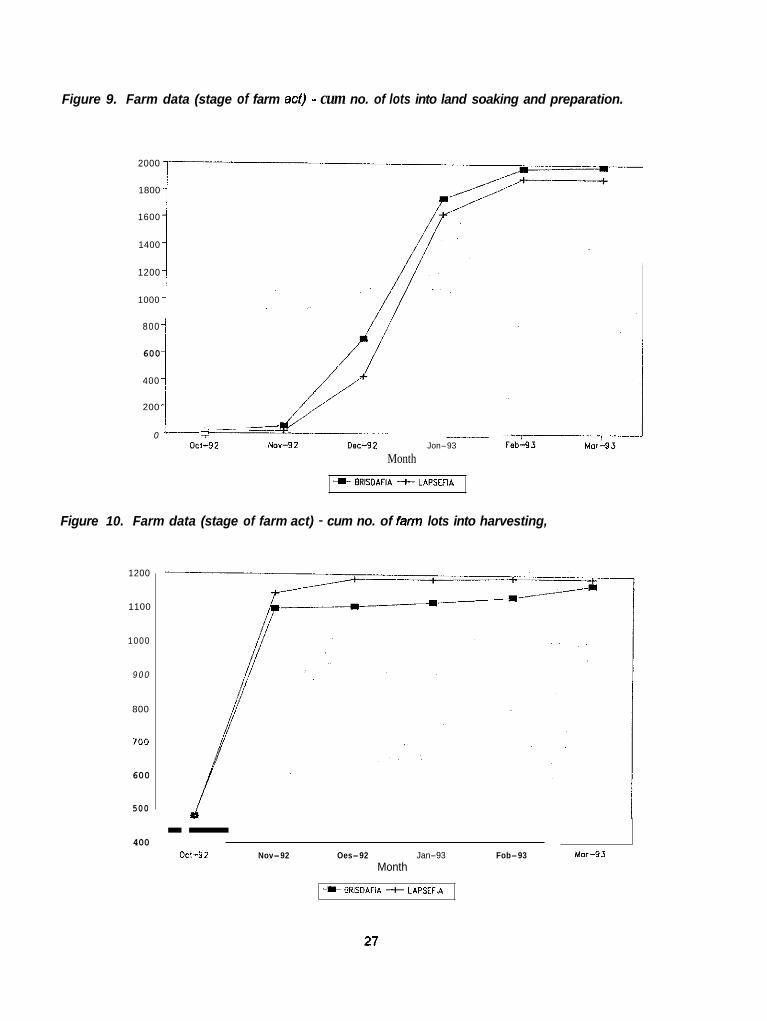
Results of the self-assessment showed (Figure 8) that even if October and November were designated as harvest months, there were 18 (0.5% oftotal number) farm lots in LAPSEFIA and 55 (2%) farmers in ERISDAFIA already into land soaking and preparation. Although terminal drainage was instituted in October 31, 1992, this group of farmers felt that the absence of irrigation water would not adversely affect their planting operations because from experience, water requirements are sustained by rainfall as these months fall within the rainy season. From the cumulative graph (Figure 9) of farm lots which are into land soaking and operation, it can be gleaned that the majority of farmers in both IAs complied with the cropping calendar, i.e, this number peaked in January and began to taper off in February and March as these were the scheduled planting months.
Data on harvesting disclosed that more than 400 farm lots in LAPSEFIA were harvested in October and then increased to more than 600 in November. In other words, a total of 1,143 farm lots represent- ing 39 percent of the total number of farm lots have already undertaken harvesting at the end of November. The remaining few (42) farm lots were harvested in December while the majority were probably harvested before October as no harvesting was done in the succeeding months. Comparing these findings with the cropping calendar, it can be discerned that less than half of the farm lots were in consonance with the schedule during the wet season. Meanwhile, in ERISDAFIA, a cumulative number of 1,104 farm lots comprising 34 percent have harvested within October and December (Figure 10). Again, since no harvesting was done after December, it is implied that the majority (66%) of the members have harvested before October and similarly did not follow the cropping schedule for the wet season in 1992. This contention is substantiated by the fact that from October to December, the total farm lots not planted in BRISDAFIA consistently increased totaling 2,209 (69%) of the total number of farm lots as at the end of December.
Figure 8. BRlSDAFlA farm data: Stage of farming activities.
2000
1800
i600
1400
1200
l0DO
800
600
400
200
0
Month
26
c
[I
c c
c c' c II] t
Figure 9. Farm data (stage of farm act) - cum no. of lots into land soaking and preparation.
2000
1800
1600
1400
1200
1000
800
600
400
200
0 ' T ___ ocl-92 Nov-92 Dec-92 Jon-93
Month
* 0RISOAFlA f LAPSEnA
Figure 10. Farm data (stage of farm act) - cum no. of farm lots into harvesting,
1200
1100
1000
9 0 0
800
700
600
500
400 -- ocl-92 Nov-92 Oes-92 Jan-93 Fob-93
Month
-S ORISOAFIA -t LAPSEFIA
Mor-93
27

During the following season (dry) the number of farm lots which were into land soaking and preparation significantly increased in December and January for both IAs signifying that unlike in the previous season (wet 1992 discussed above), a large number of farmers in both IAs complied with the cropping schedule. However, there were still some (8% in both IAs) who undertook this activity only in February. If the cropping calendar was strictly enforced then data should have yielded a zero response during this period. In reality, though, since a number of control structures such as steel gates are rendered dysfunctional, it is really very difficult to enjoin members to adhere to the cropping calendar. Ultimately, its noncompliance shall redound to a shortfall in water supply especially in LAPSEFIA, it being at the tail end.
With respect to crop maintenance, the number of farm lots in this phase showed an upward trend starting in January and peaking in March. Again, these data reflect synchronization with the cropping calendar. Given these findings, the harvesting period is expected to start in April which is once more according to schedule.
It is gratifying to note that, seemingly, the TSA leaders accurately monitored and recorded the specific data required, since, as a whole, the resulting information did not disclose any glaring inconsistencies and deviation from actual observation. Undoubtedly, the preparation of spot maps made the task easier for the leaders. If done repeatedly, the farmer-leaders would certainly gain the mastery of recording and, consequently, would produce more accurate and reliable farm data deemed useful for LlPA preparation and exemption reports. At present, it is the NIA staff who are still doing this job although the O&M contract stipulates that the said activity be undertaken by the IA, specifically by the TSA leaders. It is hoped that the self-assessment exercise would eventually prepare the leaders for these tasks and henceforth ease the heavy workload of the NIA O&M personnel.
2.
This section shows the percentage of farm lots in satisfactory condition and those damaged due to flooding or drought. Looking at the graph (Figures I l a and 11 b), one would notice a decreasing trend in the number of farm lots in Satisfactory condition from October to December. This observation should not be interpreted unfavorably because only those farm lots which were in the maintenance stage were assessed as to their condition. Farm lots which have completed the harvesting stage were no longer included in the assessment. Since the number of harvested farm lots increased from October to December, the farm lots whose conditions were to be evaluated correspondingly and successively de- creased. This procedure does not elicit very useful data and, hence, the instrument should be improved to take this weakness into account.
In the following dry season (December-March), the percentage of farm lots in good condition exhibited an upward trend while reports on damaged farm lots remained negligible. It is worth mentioning that in BRISDAFIA, about two percent of the farmers were still in the harvesting stage in January when, in fact, land soaking and preparation were the scheduled activities for this month as reflected in the cropping calendar. This group consisted mainly of those who practiced a third cropping as supply of irrigation water is almost continuous in this IA. Likewise, in LAPSEFIA, about 3 percent Of
the farm lots were just being harvested in February when supposedly this month was scheduled for crop maintenance. This group represented those who started the cropping season late because of the delay of water delivery in the farthest end of the system.
Status of Farm Lots Harvested
28

r- r
Figure I la . BRlSDAFlA farm data: Status of crops.
c 90 ~
80-
70 -
60 -
50 -
40 -
30-
- - /- I-----_- 0 -- c -I -?
Nov-92 Der-92 Ian-93 Feb-93 Mw-93
ill oct-92
Month
Figure Ilb. LAPSEFIA farm data: Status of crops.
Month
-I- C.2 + C.3 -* D
29
3. Water Management
3.1 Water Allocation and Distribution
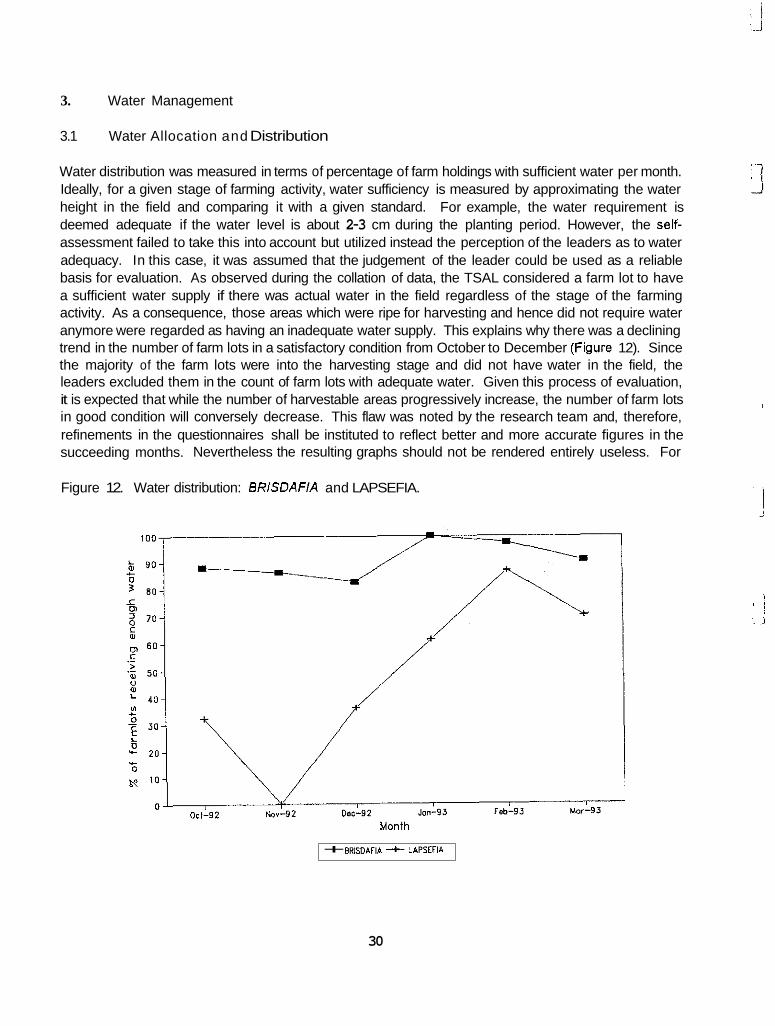
Water distribution was measured in terms of percentage of farm holdings with sufficient water per month. Ideally, for a given stage of farming activity, water sufficiency is measured by approximating the water height in the field and comparing it with a given standard. For example, the water requirement is deemed adequate if the water level is about 2-3 cm during the planting period. However, the self- assessment failed to take this into account but utilized instead the perception of the leaders as to water adequacy. In this case, it was assumed that the judgement of the leader could be used as a reliable basis for evaluation. As observed during the collation of data, the TSAL considered a farm lot to have a sufficient water supply if there was actual water in the field regardless of the stage of the farming activity. As a consequence, those areas which were ripe for harvesting and hence did not require water anymore were regarded as having an inadequate water supply. This explains why there was a declining trend in the number of farm lots in a satisfactory condition from October to December (Fuure 12). Since the majority of the farm lots were into the harvesting stage and did not have water in the field, the leaders excluded them in the count of farm lots with adequate water. Given this process of evaluation, it is expected that while the number of harvestable areas progressively increase, the number of farm lots in good condition will conversely decrease. This flaw was noted by the research team and, therefore, refinements in the questionnaires shall be instituted to reflect better and more accurate figures in the succeeding months. Nevertheless the resulting graphs should not be rendered entirely useless. For
Figure 12. Water distribution: ERlSDAFlA and LAPSEFIA.
' 1 I il
I
J
+ BRISOAFIA --C LAPSEFIA
30
one, comparable figures of the percentage of farm lots receiving enough water during the start of the dry season (December) showed that almost 100 percent of farm lots was reported to be enjoying a sufficient water supply in January in BRISDAFIA while the number only peaked in February in LAPSEFIA. This simply indicated that BRISDAFIA, being at the upstream, made use of irrigation water first and only when almost all their water requirements were met did the upstream farmers allow water to flow to the tail end (LAPSEFIA). This is the primary reason why LAPSEFIA perennially experiences water inadequacy problems (almost 1/4 of the irrigated area during the 1991 dry season suffered from drought). It should be emphasized that the main source of irrigation water of these two IAs is the Buhi Lake and there are competing water users such as the fishermen. There is an existing agreement between the Buhi Municipal Government and the NIA that only when the water level has exceeded the minimum requirements of fishermen will the NIA be able to source water for irrigation from the lake. As the dry season progresses, the available water in the dam also diminishes so that there is not enough pressure for the water to reach downstream.
The initial solution thought of was to advance the cropping calendar for LAPSEFIA relative to BRISDAFIA. Such a strategy was not effective since it was observed that farmers in BRISDAFIA did not adhere to the set schedule for two reasons: there were undisciplined farmers who resorted to illegal checking during night time to avoid being caught, and in some areas, water continued to flow to the farm ditches due to the dysfunctional control structures.
NIA is aware that water supply will almost always be inadequate for the two IAs during the dry season and that long-term solutions must be explored, i.e., provision of an alternative water source. Meantime, it was planned that the Irrigation Superintendent (IS) would coordinate with the Department of Agriculture for cloud seeding particularly during critical months.
3.2 Communication
One of the functions of the TSA leaders is to inform his members about the cropping calendar and the schedule of water delivery ahead of time to allow the farmers to adequately prepare for the forthcoming activities. Considering that January was the start of the dry season, the TSA leaders should have provided the farmers with the schedule as early as December. Figures 13a and 13b only reflect the number of farmers who were aware of the water supply schedule as of December since water flow commenced in January. In this case, the TSA leaders need not perform the task of informing the members as the water is already available in the ditches. Comparatively, the leaders of LAPSEFIA performed better in this aspect, with about 78 percent ofthe farmers knowing about the water schedule against approximately only 43 percent in BRISDAFIA. This result is consistent with the observation of the researchers that indeed, LAPSEFIA leaders are more active in performing their functions. Likewise, there were more farmers in BRISDAFIA than in LAPSEFIA who did not comply with the cropping calendar, probably because they were unaware of the schedule in the first place.
3.3 Conflict Management
It has been experienced that the number of irrigation-related problems rises at the onset of the cropping period when farmers make demands that their farm lots be irrigated first and during the land soaking and crop maintenance phase when the need for irrigation water is at the peak. True enough, the number of conflicts declined during the harvest period (October - November) but reached the highest in December or during the start of the dry season. The number of conflicts consistently declined from December to January. It went up again in February and March, the land-preparation and crop- maintenance months. This finding just highlights the difference in water adequacy in the two IAs.
31

Figure 13a. BRlSDAf /A water management: Communication.
___-_ 45 ,
3c 1 25 I 15
0 5y____::- Oct-92 Nov-92 Dec-92 Jm-93 Feb-93 Mar-9.5
Monlh
/ - . I - E . l f 8 . 2 1
figure 13b. LAPSEFlA water management: Communication.
80
70
6C
50
40
30
2 0
10
C L
Nov-92 D ~ G - 9 2 Jon-93 fab-93 Mar-93 Monlh
Od-92
-1
i
i i
32

The farmer-leaders only started to monitor the number of conflicts resolved in January. Results show that in BRiSDAFIA, of the six conflicts experienced by the TSAs on the average in January, not one was resolved in the same month. Of the two conflicts recorded in February, only one was resolved. On the other hand, in LAPSEFIA, it is observed that while the number of conflicts rises, the number resolved also correspondingly increases. Again, these findings imply that the TSA leaders in LAPSEFIA are more able to face conflicts and to resolve them.
3.4 Task Distribution
It is common practice in the two IAs to undertake cleaning of canals and minor repairs a few weeks before the schedule of water inflow after terminal drainage. In BRISDAFIA, the average number of farmers assigned tasks per TSA was observed to be the highest in December, as this was the period when canals and structures ought to be cleaned and repaired in preparation for the start of the cropping calendar. As the dry season progresses, the number of assigned tasks declines. It is expected that this figure will again increase in June when the wet season begins. In LAPSEFIA, water delivery was carried out only in January, or a month later compared to BRISDAFIA. This schedule was consistent with the agreement between the IA Presidents and NIA that BRISDAFIA was to be the first to be supplied with irrigation water because from experience, any plans of allowing farmers in LAPSEFIA to plant ahead are never realized given that most of the control structures are dysfunctional. Being so, the number of farmers given tasks in LAPSEFIA peaked in January and correspondingly declined in the subsequent months. Figure 9 details these aspects.
4. Organizational Planning
Ideally. the planning of IA activities should be done during the farmers' assembly or meeting. As mandated in the IA bylaws, TSALs are to initiate monthly meetings with farmers within their area of responsibility in order that problems met or required activities during the month could be discussed and planned in a participatory manner. Unresolved problems could be brought out in the monthly BOD meetings, if necessary. However, results revealed that meetings at the TSA level are seldom held. When queried, TSALs confirmed that they stopped calling for meetings since farmer members did not attend meetings. Instead, they resorted to passing on information from one farmer to another or using the public address system to disseminate important activities like rabus schedule or dates of irrigation fee collection. The TSALs were almost unanimous in claiming that they, as leaders, no longer place a premium on attendance to meetings as long as farmers maintained the ditches and participated in rabus. In instances where meetings are really needed, TSALs coordinate with fertilizer dealers or sales representatives to provide the necessary attractions to draw attendance. However, it has been observed that farmers do attend if they think that the meetings are important. Examples of these are meetings where extension workers from the Department of Agriculture are invited to share information on farm technologies. Therefore, TSALs should call meetings when these are demanded by the membership.
5. System Maintenance
The TSA leaders' performance with regard to maintenance was assessed in terms of the status of cleanliness of the farm ditches, laterals and main canals (although the latter two items are the
33
responsibility of the NIA as far as BRISDAFIA is concerned while only the main canals are NIA's responsibility with respect to LAPSEFIA). Using a rating of 1 to 3 with 1 representing very clean and 3 as dirty, Figure 14a shows that BRISDAFIA leaders reported that the main farm ditches (MFD) and supplementary farm ditches (SFD) were dirty (rating of 2.5 and 2.7 respectively) during the months of October and November. Its maintenance status however slightly improved and in January and February was at its best, with almost a 2 rating or fairly clean. The lateral and main canals were rated almost in the same manner. In LAPSEFIA (Figure 14b). all the facilities were rated poorly during the months of October and November. However, the status of these facilities improved starting in December and they were best maintained in January and February. These results are consistent with the maintenance and rabus activities undertaken. For instance in BRISDAFIA, it was in January that the highest number of small groups were engaged in voluntary work, the same period when the farm ditches were given the best rating for cleanliness. This is a good indication that the TSA leaders were using the assessment resuit to schedule the required maintenance work. Based on these and previous years' assessment, it could already be established that maintenance activities are attended to only at the onset of the cropping calendar.
Another piece of information being gathered by the TSA leaders pertains to the condition of the structures such as the division box, the steel gate and the foot bridge. The maintenance of these structures is the responsibility of the NIA. Assigning the values of 1 to 3, with 1 representing dysfunctional condition and 3 as functional, Figures 15a and 15b show that in both IAs the steel gates had the lowest rating which indicate that most of these were considered as dysfunctional throughout the assessment period. In BRISDAFIA, the division boxes were dysfunctional in October and November, but were repaired and made functional in December. In LAPSEFIA, the division boxes and the foot bridge were in good condition throughout the rating period. Considering the importance of the steel gates as control structures for implementing the cropping calendar, the TSA leaders have been requesting the NIA to repair the said structures but the latter has not been able to act on these complaints due to lack of funds. As a consequence, the TSA leaders blame not only these damaged structures as they cannot regulate the use of water among the members of the turnout but the failure to implement the cropping calendar more effectively. In both IAs, the wide gap between the condition of the steel gate structure and the foot bridge is quite apparent. The TSA leaders had their own interpretation of these data. According to them, the steel gates are purposely destroyed by the farmers as it is seen as an obstructive device for having a continuous flow of water. Most farmers associate water adequacy with free flowing supply of water regardless of the stage of the crop, except, of course, during the harvest period. On the other hand, the foot bridges are very functional to the community and, therefore, farmers protect and maintain them.
6. Financial Aspect
Figure 16 shows that in BRISDAFIA, the highest number of farmers who paid the ISF was in December. l fwe compare this to the peak harvest season which is October and November, it could be said that the collection effort was late since it is logical to assume that farmers would be in a better position to pay their financial obligations at harvest time. Looking at the case of LAPSEFIA, the biggest number Of
farmers paid their dues in November, the peak of the harvest season. As a consequence, the latter attained a much higher collection efficiency.
. .
i l
i j
I 34

ii
c
c'
c
L-
Figure 14a. BRlSDAFlA maintenance: Turnout maintenance
1.5
1 ' -__ Nou-92 oec-92 Jon-93 Feb-93 Mar-93 Ocl-92
py + A.2 -* A.3 S A.4 1
Figure 14b. LAPSEFIA maintenance: Turnout maintenance
3
2.8
2.6
2.4
2.2
2
1 .a
1.6 Osl-92 Nou-92 Oec-92 Jon-93 Feb-93 Mor-93
Month
1- A.1 + A.2 -)lt A S 8 A.4
35
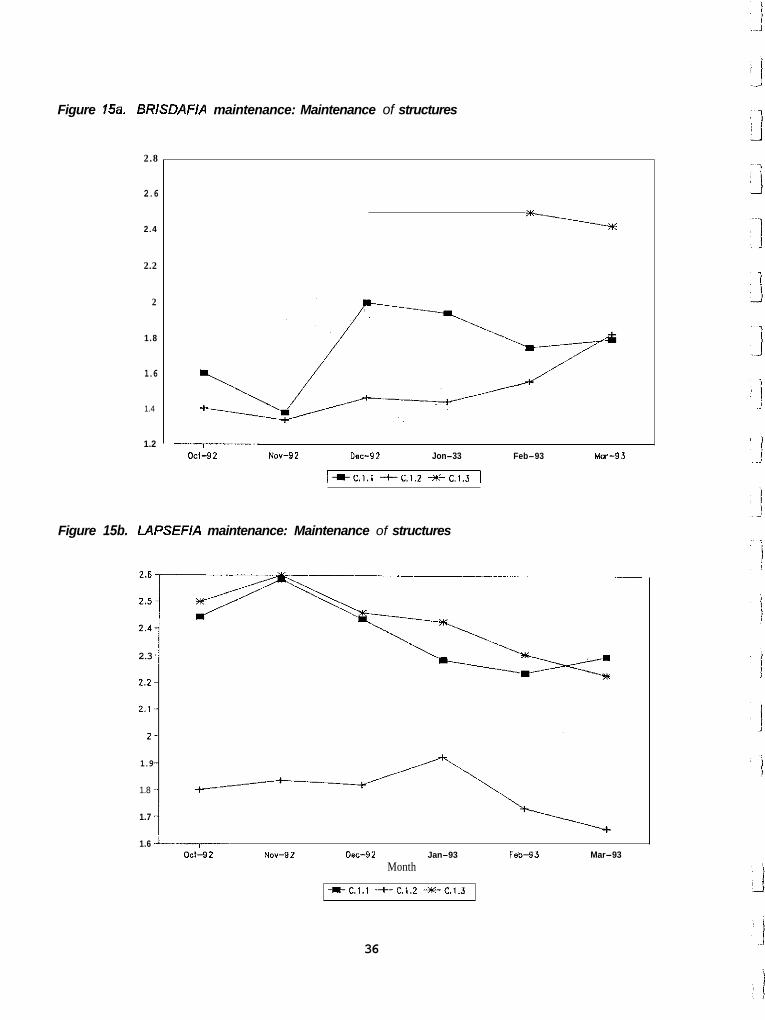
Figure 15a. BRlSDAFlA maintenance: Maintenance of structures
2.8
2.6
2.4
2.2
2
1.8
1.6
1.4
1.2 I---- - OCl-92 NOv-92 0%-32 Jon-33 Feb-93 Moi-93
I-)C.l.l fC.I.2 %-C.1.3 1
Figure 15b. LAPSEFIA maintenance: Maintenance of structures
-_ - -. . ..
2.3
1.9
1.8
1.7
1.6 '-7- OCI-92 No"-92 Oec-32 Jan-93 Fsb-93 Mar-93
Month
36

Figure 16. BRISDAFIA financial aspect: CoMection of ISF, membership dues and annual dues.
Month
I+ A.1 -+ A 2 * 6.3 1
It should be noted that the percentage of farmers who made good their obligations was quite low. This, however, should not be counted against the TSA leaders' performance because they were not involved in the collection process, and, therefore have no updated information as to the actual number of farmers who settled their irrigation service fee (ISF) dues.
Such deficiency, however, was duly recognized by the IAs, and they predict that collection efficiency would be improved ifthe TSA leaders are tapped to undertake this function. On the other hand, the very low number of members who paid the membership and annual dues is an indication of the TSA leaders' poor performance in increasing the number of registered farmers in their area of responsibility. This issue has been brought to the attention of the BOD and activities have been lined up to address this problem.
7. Upward Linkage
This pertains to the ratio of problems reported to the IA or BOD to the number of problems experienced per month at the TSA level and the ratio of problems acted on by the IA or BOD to the number of problems reported. In BRISDAFIA (Figure 17a) there is a consistent decline in the first ratio which could be an indication that the TSA leaders are not reporting the problems encountered within the TSA level to the IA. This is primarily because most TSA leaders fail to attend the BOD meetings. Further, it is erroneous to conclude that they were resolved at the TSA level because, as discussed previously, only a very minimal number of conflicts were acted upon by the TSA leaders. In fact, Figure 18a shows that the absolute number of problems encountered increased but the number reported to the BOD level generally declined. Meanwhile, a different situation prevailed in LAPSEFIA (Figure 17b) in that, except
37

for October and November, the ratio of problems encountered was not within the TSA leaders level to resolve and so they were elevated to the BOD for resolution. Evidence of these is reflected in the nature of conflicts encountered in the said IA, typical of which is water inadequacy which, truly, only the IA officers and BOD members can jointly decide.
As regards the second ratio, only about 11 percent of the total number of problems reported was acted upon by the BRlSDAFlA BOD during the last 2 months of the wet season. In the dry season, this increased to about 26 percent in January but dropped to almost zero in February. The overall low performance of this IA in responding to the problems brought out was caused by the interplay of several factors, noteworthy of which were: inability to reach a quorum during the BOD meeting, inadequacy of funds for maintenance and repair works which are the bulk of problems raised and preoccupation to elect new officers as required by the IA bylaws.
In LAPSEFIA, an increasing trend which started from zero in October and peaked at 100 percent in January was observed but suddenly declined in February but rose again to 100 percent in March. So, one could discern how well the BOD and IA leaders cope with the problems faced by the organization. These reflect the relative maturity of this IA as an independent entity. As mentioned earlier, this IA, being at the tail end, usually confronts water-adequacy problems. Because this adequacy is dependent upon the quantity of water that reaches the IA's area of responsibility, problems in this respect could be beyond its control.
Figure 17a. BRlSDAFlA linkage: Upward linkage (ratio).
i I
Monih
I * A Z / A l 4- AS/AZ I
i i i
38

c [:
Figure 17b. LAPSEFlA linkage: Upward linkage (ratio).
c f' c c' ci c c
Figure 18a. BRlSDAFlA linkage: Upward linkage.

ZQ-
10-
1 6 -
1 4 -
I Z -
10-
8 -
6 -
4-
2 -
Figure 18b. LAPSEFlA linkage: Upward linkage.
-
I NUV-92 OX-92 101-93 Fb-93 uor-9s Qcl-92
VII. LESSONS AND CHALLENGES
AFTER THE MORE than 13 months of field exposure, with the project team devoting at least an aggregate of 78 person-hours per week in direct contact with farmers, farmer-leaders and NIA personnel, it is worthy to devote serious thinking on certain issues which would not only enhance the implementation of future project activities but would be of help to others who are interested in replicating the self- assessment process technique. The following discussions focus on only one issue, that is, how to encourage the adoption of the self-assessment process in the IA.
As in any social intervention, its long-term sustainability could be achieved if it produces useful results. Indeed, the success of the self-assessment process is an integrated effect of the contributions of three principal actors; the TSA leaders, the IA, and the NIS. Only when the TSA leader could perceive the importance of the self-assessment process will he be motivated to continue what has been started even without prodding and assistance from external catalysts. Internalization of the process would be achieved through the following seven actions:
I . Ufilization of Self-Assessment Process Results. For instance, the farm data elicited should be used as input for preparing the LlPA which in turn is the basis for preparing bills by the NIA. To date, the NIA prepares the LlPA based on an outdated master list. Employing the validated spot maps, the TSALs are in a position to produce an accurate and updated LIPA. If this materializes it wouM give the leader credence and recognition which is deemed as a source of motivation. In the same manner, developing the capability of the leaders to undertake this task would ease the heavy workload of the NIA O&M personnel.
i
40

2. Provision of Incentives to lmprove Performance. In the two IAs under study, the TSA leaders are not provided with funds which they can use to act on matters within their authority. Aside from these, their efforts are not compensated monetarily. A challenge that the IA should consider is how to provide real incentives to farmer-leaders to turn in higher performance and act on the problems and issues resulting from the feedback mechanism instituted. As Goonesekera concludes (cited in Merrey, Rao and Martin 1988), there is a need to provide irrigation managers with financial incentives to provide good management. This need is articulated in the vision of TSA leaders that the IA should have sufficient funds to pay their honoraria. The IAs potential source of fund is its share in the ISF collection. If the NIA agrees to increase the IA's percentage share the NIA stands to benefit as well and the IA would be able to provide better maintenance service to its members which, in turn, increases the ISF collection.
3. lntegration of the Self-Assessment Process to Overall Planning and Decision Making of \As. Another strategy for the sustenance of the process is the utilization of the output of the TSAL at the IA level. It is envisioned that during BOD meetings, part of the regular agenda is the reporting of TSAL PerfOrmaflCe using the self-assessment instrument as the guide. This scheme would provide top-level management an accurate picture of the condition of the IA as a whole which is needed to diagnose areas needing action. As an initial step, the TSA leaders were formed into groups of 7 members each to be supervised by an IA official. The latter is then tasked to regularly monitor the extent of accomplishment in filling up the forms and consolidate the reports to be presented during BOD meetings. Eventually, it is foreseen that the officials will take over the role of the project team.
4. Fund Sourcing. To augment the very limited financial resources of the IA, there is a need to examine ways to generate additional funds. Experience shows that one source of disillusionment among members and TSALs is when problems brought to the IA requiring immediate attention are unacted upon due to lack of funds. To ensure the continuity of the self-assessment process, it is imperative that fund sourcing be considered as top priority. One area that the IA can explore is the possibility of making the collection system more efficient by involving TSALs in the collection function. Another source of possible funds is the registration and annual dues from members. At present, there is a very small number of registered members.
5. lntegration of Self-Assessment Process to the NlA lnformation System. The NIA is currently implementing a management information system on a pilot basis which requires data from the TSALs. This scheme however, does not have a capability-building component to ensure accuracy of data generated by the TSALs and, hence, as practiced, the NIA personnel are burdened with these additional tasks. Considering that the primary concern of the self-assessment process is to strengthen the capability of TSALs to record data, this project actually complements NIAs envisioned information system. Having this in view, the project team has taken into account the NIA data requirements in the design of the self-assessment instrument. What remains to be done is for NIA to test the capability of TSALs to feed in its data needs.
6. Compliance of NlA to the O&M Conrract. For jointly managed systems such as the two IAs under study, it is inevitable that NIA should play a significant role in the management of the irrigation system. In particular, it needs to act on O&M issues which are under its jurisdiction as stipulated iwthe contract. At present, however, it is faced with budgetary constraints limiting its ability to comply with its responsibilities, specifically maintenance of main canals and repairs of control structures: This has caused disenchantment among IA members and leaders. Indeed, the Financial Report of the NIA Barit River Irrigation System Office, for January to December 1992, showed that it did not spend any amount
41

for O&M activities except for the payment of salaries of its O&M personnel. If this persists, the rate of deterioration of the structures and facilities is expected to accelerate. The ray of hope given by the NIA that the requests of the farmers will be adequately served is the implementation of the physical rehabil- itation component of the Irrigation Operation Support Project (IOSP II), which is funded with foreign borrowings. This program is expected to commence during the last quarter of 1993 and if, for any reason, it does not materialize, again the farmers would be doubly frustrated. Continued inaction on the physical repairs and maintenance required by the farmers may pose as a stumbling block for the success of the self-assessment process. Since it is foreseen that a scarcity of budget will prevail in the long run, the logical course of action is for NIA to assess the capability of the IA for full management turnover. The utility of the self-assessment process shall be more appreciated under this condition because almost all factors are already within the control of the IA.
7. Effecting a More Equitable Sharing System for ISF Collection between the /As and the NIA. This is a concern of those IAs carrying a Type II contract whereby the collection function is undertaken by the IA. It is perceived that the present sharing scheme is partial towards the NIA since the IA only stands to gain a minimal share based on a graduated scheme starting at 2 percent of the target current collection once it has attained 51 percent collection efficiency. To illustrate, BRlSDAFlA will get only a minimum amount of P 3,765 (US$151) for a collection of P 188,249 (US$7,530). However, to reach this level of collection, the IA employed 9 collectors who need to devote at least 30 days per cropping season. If all of the share shall be allocated to these collectors, each shall receive only P 418 (US$17) for a month's labor. This figure is very much lower than the minimum wage of P 2,07O/month (US$83). And to think that the transporlation expenses required are shouldered by the IA collectors assigned to cover 80 hectares each on the average. The management cost for the IA is not even accounted for as yet. BRlSDAFlA has undertaken the collection function for the past two cropping seasons, and sad to say that although their performance has increased, it was not enough to reach the point where they could avail of the sharing scheme. Hence, for these two cropping seasons, the collection cost had been underwritten by the IA. Even if one assumes a 75 percent collection efficiency for the target collection of P 369,116 (US$14,764) for the wet season, 1992, and the total IA share percentage increases to 10 percent of the total current collection, still the IA stands to gain a very minimal amount of only P 27,684 (US$1,107). If the collection is paid at the rate of the minimum wage for 1 month of work, the required amount for this represents 67 percent of the IA share and only I? 9,135 (US$365) will be left to cover maintenance and management costs. This scenario, however, would require a magnanimous effort on the part of the IA. It has been gathered from unofficial sources that the average collection efficiency for current accounts of IAs nationwide is only 48 percent. As a result, IAs have been clamoring for a more equitable sharing system.
Based on feedback from IA leaders, the Stage I I contract provides a better incentive to the IAs. Shawn below is the NIA-IA sharing system under the Stage II contracting scheme:
Collection efficiency IA share 53.14% and below 20% of actual collections Above 53.14% 20% of actual collections for collection efficiency of 53.14%, and
40% of actual collection in excess of 53.14%.
Unfortunately, the Stage II contracting scheme had been replaced by the implementation of the Type II contract. The Chief of the NIA Central Office Institutional Development Division (IDD), Avelino Mejia admits that formerly the NIA was more liberal in the sharing arrangements, but now the ceiling on funds going to the farmer is much lower (IIMI Review 1989).
42
i

L'
c If the rationale behind involving the IAs in systems management is to help the NIA recoup the
development cost of irrigation, the present sharing system is quite restrictive rather than a boost to participation. Ultimately, it is anticipated that IAs would rescind the Type II contract and return to NIA the collection function which it may not be in a position to effectively carry out, given its present retrenchment policy.
r L
[:
f t
c
VIII. PLANNED FUTURE ACTIVITIES
1. INmxarroN OF THE Self-Assessment Mechanism at the Turnout Level into the /A lnformation System as a Whole. This requires the preparation of a consolidated report format for use by the IA official to summarize performance of TSALs under his supervision to facilitate reporting to Board of Directors meeting conducted monthly. Inasmuch as performance of TSALs will be reported at the IA Central Official level, recognition of their performance may serve as a motivation for TSALs to make the self-assessment process a part of their regular activities. The end-goal is to integrate the self- assessment mechanism into IAs planning and decision-making function.
2 . Link the Self-Assessment Process of the IA to the NIA lnformation System. The plan is to develop a single self-assessment form for O&M personnel that would satisfy the data requirements of the NIA at the central, regional and systems levels which would utilize the data generated by the self- assessment questionnaire accomplished by the TSALs.
3. lmprove the Present Level of TSALs' Capability to Record Performance. Along this line, the project team's activity shall be to teach the IA officials on how to record and report the TSALs' performance to the Board. This shall complement the continuous monitoring and assistance given by the team to the individual TSALs. Farmer-leaders who are unable to record data, despite intensive assis- tance from the team, shall be identified. The second line leader shall then be requested to take charge of recording the performance data in consultation with the farmer-leader.
43

Annex I
NIA-IA Obligations in the Three Types of 0&M Contracts
1. Type I Contract: Maintenance Contract
Under this contract, the Irrigators' Association (IA) undertakes routine maintenance works of a certain length of the irrigation canal systems The following are the IAs' obligations:
1.1.
1.2.
1.3.
I .4.
1.5.
1.6.
1.7.
The IA undertakes grass cutting, clearing, desilting and reshaping slopes for the entire length of canals for at least once a month:
Fills up potholes and open cuts along canal embankments and drains accumulated water from depressed portions of canal embankments;
Undertakes minor repairs of irrigation facilities which do not require equipment and construction materials;
Undertakes on a monthly basis, as the need requires, oiling and greasing of steel gates including turnout gates, particularly the lifting mechanisms;
Protects and safeguards from destruction all irrigation facilities and structures;
Prevents any person from constructing open cuts andlor installing additional turnouts without joint clearances from both the NIA and the IA; and
Removes debris from canals and conveyance structures that restrict the normal flow of irrigation water. I .
In undertaking the Type I Contract the IA will be paid P 1,100 upon satisfactory maintenance, weeding, trimming canal embankments, reshaping and removal of debris of a 3.5-kilometer (km) length of unlined canals or 7 km of lined canals. Desilting activities undertaken will be paid for by volume of accomplishment as per agreement entered by and between the NIA and the IA.
NIA's Obligations in Type I Contract
1.8. Provides the association with a list of facilities and structures for maintenance as contained in the inventory jointly undertaken by both parties;
Undertakes repair/restoration works of facilities and structures jointly with the asso&ation;
Provides the association with a regular supply of used oil and grease for the maintenance Of
irrigation facilities;
1.9.
1.10.
45

1.1 1. Develops and implements programs to build up the organizational capability of the association, particularly in effectively implementing the maintenance activities;
Conducts regular inspection of the facilities and structures under contract by the association and provides necessary guidance if deficiencies are found: and
1.12.
1.13. Assists the association in the preparation of its policies and procedures in undertaking its maintenance responsibilities.
2. Type I I Contract: System Operations and ISF Collection
I A Obligations on Systems Operations
2.1.
2.2.
2.3.
2.4.
2.5.
2.6.
2.7.
Formulates and firms up with the NIA, operations and maintenance plan, one month before the start of the next cropping season and discusses the monthly status of the O&M plan implementation with the NIA;
Disseminates information on water delivery and planting schedule to the irrigation water users within the IA-contracted service area;
Delivers and distributes irrigation water equitably to the IA farmer-members;
Monitors the status of farming activities and submits to the NIA the weekly report on irrigated and planted areas;
Resolves conflicts arising from water distribution between and among the IA members and other IA internal conflicts that may arise;
Informs the NIA through its representative(s), problems and conflicts on operations beyond the association's capacity to resolve; and
Attends meetings and conferences called by the NIA to discuss major problems encountered and formulates solutions thereof.
IA Obligations in ISF Collection
2.8. Provides the NIA, before the start of each season, with an updated master list of farmer-member beneficiaries. should there be changes in the existing master list;
Formulates effective and workable policies to effect a systematic ISF collection scheme with the concurrence of the Irrigation Superintendent;
Distributes Irrigation Service Fee (ISF) bills promptly to each of the farmer-member beneficiaries including members' bank accounts;
2.9.
2.10.
46

' c EI r ' f c c
C
c c' f c c c
2.11. Collects ISF (current and back accounts) from farmer-member beneficiaries and remits to the NIA such collection every Friday. The IA must obtain and use its own official receipts for ISF collection and forfinancial control purposes, duly countersigned by the irrigation Superintendents;
Assists the NIA in the verification and assessment of farm lots requested for exemption from payment of ISF; and
Presents to the IA members either through the general assembly or per T S A meeting, the updated status of members' ISF payment, within one month after the end ofthe cropping period.
The incentives received by the IA under Type II Contract in all national irrigation systems (NIS) are
2.12.
2.13.
as follows:
Percent Collection Incentives to the Efficiency IA
0 - 50 0 51 - 60 2% 61 - 70 5% 71 - 90 10% 91 - 100 15%
NIA Obligations in System Operations
2.14.
2.15.
To prepare plan and programs on water delivery schedules in consultation with the IA;
To provide the IA with all relevant training programs to enhance the IA leaders'lmembers' capabilities to manage systems operations and ISF collection activities, effectively and efficiently;
To provide technical assistance and recommendations based on submitted reports of the IAs to improve its management and technical activities;
To appraise the IA on the NIAs current policies relative to systems operations and ISF collection when the need arises;
To undertake all rehabilitation works and repairs of major damages to the mainllateral canals and other appurtenant structures including the access/service roads:
To authorize the IA to expand the service area of the system without sacrificing any portion of the programmed area:
To facilitate resolution of problems and conflicts beyond the IAs capacity to resolve;
To formulate with the IA system operations plan within one month before the start of the cropping season;
To assist in the preparation of planslfeasibility studies of projects the IA may wish to venture in;
2.16.
2.17.
2.18.
2.19.
2.20.
2.21.
2.22.
47

2.23.
2.24.
To conduct regular audit of the IA's books of accounts;
To review and approve implementation plans for operations within one mont afler submission to the NIA by the IA;
To monitor the IAs activities in the implementation ofjoint-water delivery and planting schedules; and
To allocate and deliver an adequate amount of water up to the lateral headgate for the IA's contracted area programmed for irrigation in a particular cropping season.
2.25.
2.26.
NIA's Obligation in ISF Collection
2.27. To prepare Irrigation Service Fee (ISF) bills based on the verified list of irrigated planted area (LIPA) submitted by the IA President. The said LIPA must be duly approved by the Irrigation Superintendent;
To assess and verify farm lots requested for exemptions from payment of ISF;
To issue the NIA official receipts to the IA for all collections remitted by the IA;
To apply the present discounting policies under a procedure to be worked out between the NIA and the IA; and
To grant to the IA a collection incentive bonus as provided in the contract.
2.28.
2.29.
2.30.
2.31.
3.
In this type of contract, the IA assumes full management of the system operations and maintenance. It will amortize the development cost incurred in the construction and rehabilitation of the whole or part of the system not to exceed 50 years. Below are some of the obligations of both the NIA and the IA.
Obligations of the Irrigators' Association
Type 111 Contract: Turnover of the Whole or Part of the Irrigation Systems
3.1.
3.2.
3.3.
Provides the best talents, skills and judgement in accordance with known accepted management practices, exercises utmost care, diligence and efficiency in the discharge of its duties and tasks; works for the best interest of the farmers in general; and takes all reasonable steps to keep expenses to a minimum, consistent with sound financial practices;
Undertakes and manages water allocation and distribution to the different rotational areas from the main lateral canal of the system. This includes water distribution from turnouts and its main farm ditches to the different supplementary farm ditches (SFDs). This water distribution scheme is to be adopted on the NIA-IA jointly approved cropping pattern;
Performs maintenance of the main and lateral canals and main farm ditches/supplemefltary farm ditches which includes cutting of grass and the removal of silt and other materials that obstruct
I
I
1 48

z c c
3.4.
3.5.
3.6.
3.7.
3.8.
3.9.
3.10.
3.1 1 .
3.12.
3.13.
normal water flow in the canals. The maintenance will cover the entire length of the main canal and laterals including main farm ditches and supplementary farm ditches within the system;
Undertakes repair works which are considered minor and within the capacity of the IA. Minor damages to canals will be repaired by the IA provided, however, that in case there is a need for materials, construction materials that the IA cannot provide shall be supplied by the NIA while the labor will be provided by the IA. This provision of construction materials for repair by the NIA shall be for a period of two years from the date of turnover of the system to the IA;
Undertakes all maintenance and repair works of the terminal facilities;
Prepares the list of irrigated planted area (LIPA) through the rotational area (RA) leaders which shall be submitted by the IA President to the NIA for preparation of bills;
Distributes bills for ISF to the farmer-beneficiaries through the RA leaders:
Collects irrigation service fees (ISF) from irrigation users of one and one-half (1.5) cavans' of palay for the wet season crop, and two cavans of palay for the dry season crop, or its equivalent in cash based on the prevailing government support price of paiay. Collection shall be done by RA bill collectors who in turn shall remit the same to the NIA every Friday or any day that may be agreed upon;
Resolves conflicts between and among the IA members arising from water distribution and allocation, organization management, and other IA internal conflicts that may arise;
Informs the NIA through its representative on problems and conflicts on operation and maintenance beyond the IA's capacity to resolve;
Attends meetingslconlerences called by the NIA to discuss major problems encountered and to formulate solutions thereof:
Makes available to the NIA for training, all persons who shall be ultimately responsible for operation, maintenance and management of the irrigation system; and
Submits for approval to the NiA all plans on management of OBM of the system two months before the start of the cropping season and submits reports on these plan implementations. specified periods and other reports that may be required by the NIA from time to time.
Obligations of the NIA
3.14. Provides available managerial and technical training and development programs for all levels to the IA necessary in managing the operation and maintenance ofthe system towards its viability;
1 cavan = 50 kilograms.
49

3.15.
3.16.
3.17.
3.18.
3.19.
3.20.
3.21
3.22
Appraises the IA of current policies of the contracting agency andlor laws and decrees affecting the NIA concerning irrigation and organization management;
Authorizes the IA to expand service area of the system without sacrificing any portion of the programmed sewice areas;
Undertakes all rehabilitation works and repairs of major damages to the main and laterallsub- lateral canals and other major appurtenant structures including the access and service roads, subject to repayment in accordance with the NIA policies:
Provides the IA necessary and available supplies, tools, equipment and vehicles and other resources based on the approved plans, provided, the IA will shoulder the cost for such supplies and other resources including equipment rentals, in accordance with the existing NIA policies:
Provides technical analysis and recommendation based on the submitted reports of the IA to improve its management and technical activities;
Facilitates resolutions of problems and conflicts beyond the IAs capacity to resolve;
Facilitates resolutions of productionlmarketing-related problems presented by the IA to the NIA; and
Reviews and approves implementation plans for operation within one month after submission to the NIA by the IA.
50
Annex I I
c
c
Procedures for Spot Map Preparation
Questions and Answers on Spot Map Preparation
1. What is a spot map?
It is a documenffmap to be prepared by the TSAL which reflects the actual location and subdivision of farm lots, their corresponding farm areas and lot numbers, laterals or main canals and supplementary ditches, drainage and irrigation structures within the jurisdiction of the leader. It also shows the names of cultivators as well as their tenurial statuses.
2. What are its uses and benefits?
a. Used as basis in preparing the IA profile. This document is required if the IA intends to tap government agencies and development organizations for any form of suppofl services.
b. Used as basis to accurately prepare the LIPA. For example, those farm lots benefiting from irrigation water but are unregistered with the NIA can already be identified and billed. ISF collection is thereby expected to increase and the list of registered members shall be updated; deceased members and those who have changed ownership due to inheritance and purchase will already be replaced. It should be noted that since the IA organization in 1975, no updating of records and parcellary maps has been done.
c. With the spot maps, the TSAL shall have clearly delineated his area of responsibility. It has been observed that, earlier, some TSA leaders did not have an accurate idea of the boundaries of their turnouts so that when preparing the LIPA. double-counting of some farm lots was experienced and, worse, other farm lots were not accounted for.
d. Used as a guide in filling up the monthly self-assessment questionnaire. For instance, leaders can readily determine the exact number of farm lots with inadequate water and easily pinpoint areas which require cleaning as well as identify locations of structures needing repair. A more realistic evaluation of the status of the TSA is therefore achieved so that the planning process which stems from this assessment is made easier and more responsive.
3. Who are involved?
Persons Responsible Tasks
a. STSAGIMFDGITSA Leaders - Conduct meetings to discuss how the spot maps could be prepared.
51

b. FIO
c. IA President
d. BU Research Assistants
i
Conduct a walk-thru in their respective areas of responsibility.
Prepare spot maps. For identifying farm lots which are unregistered with the NIA but which are using irrigation water. If no farm area is available from any official document (e.g., title, tax declaration), draw the shape of the lots and, together with the owner/cultivator measure the sides. Submit the details to the Water Master who will compute for the farm area based on the given data.
Affix signatures to authenticate the validity of the maps.
Confer with owners of unregistered lots and request documents that would show the farm area to be used for billings. In the absence of such documents, the accuracy of the farm area computed by the Water Master should be affirmed by the owner.
Submit maps to FIO
Validate spot maps.
Confer with TSAlSTSAGlMFDG leaders if revision is to be made.
Affix signature.
Submit to IA President.
Conduct IA officers’ meeting to further validate the spot maps. If corrections are to be incorporated, meet with the TSALs involved and finalize spot maps.
Affix signatures.
Submit to BU Research Assistants
Monitor progress of the TSAL in preparing the spot maps.
Submit to the Water Masters/Ditch Tenders.
i _-I
i
i ii
52
e. Water MasterslDitch Tenders - Assist the TSAL in preparing the spot maps.
Compare the spot maps with the parcellary maps. If differences arise, consult with the TSAL and conduct a walk-thru to resolve such.
f. BU Team
Indicate the lot number and determine areas of farms whose lengths and shapes have been determined by the TSAL.
Affix signature and submit to the BU Team
Monitor the TSAL in spot map preparation
Finalize the spot maps
Submit the spot maps to CO which in turn will be given to the FIO. The FIO shall then return them to the TSA leaders.
4. What are the detailed steps to be followed in preparing the spot maps?
a. Indicate familiar landmarks to be used as reference points (e.g., main canals, laterals, drainage ditch, facilities). Identify farm lots contiguous to these landmarks. Once these are identified, the location of adjoining farm lots can readily be pinpointed.
If there is a turnout, use this symbol number per MFDISFD to distinguish one from the other.
b. . If the TSA has more than one MFDISFD, place a
c. Indicate the names of the actual tillers and determine their tenurial statuses. Use these codes: Tenant (T), leaseholder (L), owner-cultivator (OC)
d. Determine boundaries of STSAG and MFDG.
When is the expected date o f submission? 5.
Persons Responsible
STSAGIMFDGnSA Leaders IA President to the BU Research Assistant BU Research Assistant to the Water Master Water Master to the BU Team BU Team to the Research Assistant Research Assistant to the FIO FlOs to the TSAL
53
Date of Submission . ~~~~~~ ~~
April 14, 1992 (14 days to prepare) April 20 (7 days to collect) April 23 May 8 (15 days for finalization) May 22 May 24 Mav 26

I
c
c r L
Annex 111
Spot Map (Not to Scale) ,--
. .
55