program performance monitoring and evaluationpdf.usaid.gov/pdf_docs/pnaca981.pdf · and were...
TRANSCRIPT

Draft Final Report
PROGRAM PERFORMANCE
MONITORING AND EVALUATION PLAN
December 1992
Prepared By: Bob Shoemaker, W O N 1 Gayle Schwartz, AFRjDP Larry Nowels, CRS Samuel Taddesse, MSI
Submit To: Gary Nelson, Director Dirk Dijkerman, Program Officer
This report was prepared during a technical assistance TDY from December 8 through December 19 under PRISM Project for A.I.D.'s Center for Development Information and Evaluation (CDIE). The PRISM project is being conducted through a contract to Management Systems International (MSI), with support from Labat-Anderson, Inc. and Research Triangle Institute
- - (RTI).
TABLE OF CONTENTS
. . . . . . . . . . . . . . . . . . . . . . . . . . . . . . . . . . CHAPTER I . INTRODUCTION 1 . . . . . . . . . . . . . . . . . . . . . . . . . . . . . . . . . A . Purpose and Scope of Work 1
. . . . . . . . . . . . . . . . . . . . . . . . . . . . . . . . . . . . B . TDY Process and Tools 2 1 . Theprocess . . . . . . . . . . . . . . . . . . . . . . . . . . . . . . . . . . . . . . . 2 2 . PRISM Monitoring and Evaluation Workshop . . . . . . . . . . . . . . . 2 . . . . . . . . . . . . . . 3 The Program Performance MER Planning Matrix 2
. . . . . . . . . . . . . . . . . . . . . . . . . . . . . . C . Progress Made During the TDY 3 D . Organization of the Report . . . . . . . . . . . . . . . . . . . . . . . . . . . . . . . . . . 4
CHAPTER I1 . THE MISSION'S STRATEGIC PLAN AND PERFORMANCE MONITORING. EVALUATION AND REPORTING . . . . . . . . 5
A . Introduction . . . . . . . . . . . . . . . . . . . . . . . . . . . . . . . . . . . . . . . . . . . . 5 B . Monitoring and Evaluating Program Goals and Sub-Goals . . . . . . . . . . . . 5
. . . . . . . . . . . . . . C . Strategic Objectives . Monitoring and Evaluation Plan 10 1 . STRATEGIC OBJECTIVE No . 1: . . . . . . . . . . . . . . . . . . . . . . 10
a . Results and Performance Indicators . . . . . . . . . . . . . . . . . 10 . . . . . . . . . . . . . . . . . . . . . . b . Data Collection Instruments 11
. . . . . . . . . . . . . . . . . . . . . . . . . . . c Methodological Issues 11 d . Baseline and Performance Targets . . . . . . . . . . . . . . . . . 12
. . . . . . . . . . . . . . . . . . . . . . . 2 . STRATEGIC OBJECTIVE No 2: 14 a . Results and Performance Indicators . . . . . . . . . . . 14
. . . . . . . . . . . . . . . . . . . . . . . . . . . . . . b . Data Collection 15 . . . . . . . . . . . . . . . . . . . . . . . . . . . c Methodological Issues 15
. . . . . . . . . . . . . . . . . . d Baseline and Performance Targets 16 . . . . . . . . . . . . . . . . . . . . . . . 3 . STRATEGIC OBJECTIVE No 3: 22
a . Results and Performance Indicators . . . . . . . . . . . 22 . . . . . . . . . . . . . . . . . . . . . . . . . b . Data Collection 23
. . . . . . . . . . . . . . . . . . . . . . c Methodological Issues 25 d . Baseline and Performance Targets . . . . . . . . . . . . 25
. . . . . . . . . . . . . . . . . . . . . . . . . . . . . . 4 . Targets of Opportunity 28
. . . . . . . . . . . . . . . CHAPTER m . NEXT STEPS AND ANALYTICAL AGENDA 30 A . Design of Scope of Work for Special Studies . . . . . . . . . . . . . . . . . . . . 30 B . Design of Survey and Other Questionnaire Forms . . . . . . . . . . . . . . . . . 30 C . Design of Data Collection Forms for Contractors and Collaborators . . . . 31 D . Automated MIS for Project and Program Monitoring . . . . . . . . . . . . . . . 31 E . Strategic Working Group Management Proposal . . . . . . . . . . . . . . . . . . 31
ANNEXES :
Annex 1: USAIDIRwanda - MER Work Schedule . . . . . . . . . . . . . . . . . . . . . . . 33 Annex 2: Strategic Objective No. 1 - MER Planning Matrix . . . . . . . . . . . . . . . . 35 Annex 3: Strategic Objective No. 2 - MER Planning Matrix . . . . . . . . . . . . . . . . 42 Annex 4: Strategic Objective No. 3 - MER . . . . . . . . . . . . . . . . . . . . . . . . . . . . 60 Annex 5: Implementation Schedule for Data Collection and Baseline and Target Establishment . . . . . . . . . . . . . . . . . . . . . . . . . . . . . . . . . . 73

CHAPTER I. INTRODUCTION
This Mission Program Performance Monitoring, Evaluation and Reporting plan was developed under PRISM Phase I1 technical assistance for USAID/Rwanda during December 8 through December 19. Technical assistance was provided by the Center for Development Information and Evaluation (CDIE) under the PRISM contract with the Africa Bureau. The team which assisted USAID/Rwanda in this activity included the team leader, Bob Shoemaker (an economist and a democracy/governance officer, AFRIONI); Gayle Schwartz, (a data specialist, AFRDP); Larry Nowels (a specialist in foreign affairs, Congressional Research Services (CRS)); and Samuel Taddesse (a senior economist/evaluation specialist and MSI consultant).
A. Purpose and Scope of Work
The primary purpose of the PRISM Phase I1 assistance was to assist USAWRwanda to establish an Assessment of Program Impact Monitoring, Evaluation and Reporting system. Specifically, the purpose of the second visit by the PRISM team as defined by the Mission was (1) to develop or refine program performance indicators for the Mission's Program Objective Tree and (2) to develop a cost effective system to monitor, analyze and report progress toward achievement of targets and strategic objectives. The review of the Mission's program strategy and the establishment of the Mission's program-level Monitoring, Evaluation and Reporting (MER) plan included:
1. Reviewing the Mission's program goal, sub-goals, strategic objectives and targets;
2. Identifying the specific results sought under each objective and indicators to measure the results;
3. Identifying data sources for all indicators used to measure the goal, sub-goal, strategic objective and target results;
4. Developing a plan to obtain the data for each indicator;
5 . Establishing quantitative/qualitative targets to be achieved annually;
6. Identifying office responsibilities for obtaining and updating data for each indicator;
7. Defining and establishing the methodology for upward aggregation and linkage of data from targets to strategic objectives; and
8. Establishing a monitoring system implementation schedule.

B. TDY Process and Tools
1. The Process
The TDY was organized on a participatory basis, with the team assisting strategic objective working groups to develop the MER plan. A schedule of meetings and activities with the working groups is included in Annex 1.
2. PRISM Monitoring and Evaluation Workshop
A three-hour workshop on development of a program-level MER plan was held on the second day of the MER team's arrival. Workshop participants reviewed the objective tree methodology and were introduced to the program performance monitoring and evaluation planning methodology. The workshop addressed the following topics:
Establishing linkages along all levels of the Mission's program objective tree
Types of data: establishing the results sought and identifying performance indicators
Data collection: frequency of measurement, defining data sources, instrument design, data pre-test, and collection schedule
Performance evaluation: evaluation methodology, linking project outputs to program performance indicators, establishing performance levels, and defining and monitoring critical assumptions
Reporting data: identifying audiences, user-friendly reports, formal reporting cycles, and report distribution
Data use for decision-making: management organization, resource allocation, program refocus and project design, and monitoring and evaluation planning
The workshop also addressed next steps, which consist mostly of program management steps to complete the program level MER system. This topic is addressed in Chapter 111, with respect to the MER Implementation Plan and Budget.
3. The Program Performance MER Planning Matrix
A planning matrix was developed by the PRISM team to serve as a tool for devising each strategic objective's monitoring and evaluation plan. That matrix was used by the working groups to review and assess for the Goal, Sub-Goal, Strategic Objective and Targets certain critical elements, including:
specific results supporting project and non-project activities indicators

data collection instruments frequency of data collection implementors other donors and collaborators USAID proportion of program funding measurement validity baseline data performance targets project-program linkages critical assumptions management responsibility
The MER planning matrices are included for each strategic objective in as complete a fashion as was permitted by each strategic objective working group's progress. Partial matrices (the most useful parts) are included for the goal and sub-goals. Expected performance targets do not need to be set at the goal and sub-goal levels.
C. Progress Made During the TDY
Good progress was made during the TDY in laying out results, indicators, measurement specifications, data sources, and why the indicators are appropriate to gauge progress toward a specific objective. Strategic Objective working groups met with the PRISM team most days and tried to carry forward progress in between meetings. Working groups have identified performance indicators required to measure progress at all levels of the Mission's program objective tree.
Certain critical questions in the MER planning matrices still need to be answered in order to achieve a reasonably complete MER plan for each strategic objective. It is mainly in the following areas where information is absent:
baseline data to project performance targets; without baseline data impact cannot be accurately predicted for some programs
8 donor coordination and amount of donor funding (where relevant and possible to do this), and USAID's proportion of total funding directed at achievement of each specific result, which will allow more accurate statements of association or attribution to be made.
projection of expected performance at each level of the Mission's program objective tree. Particular attention should be given to (1) developing measurement techniques for evaluating impact for some targets; and (2) the rationalization of upward linkages from projects to targets and from targets to strategic objectives so that impact can be measured more accurately.
. completion of the implementation schedule for the Mission's analytical agenda as it relates to the implementation of the MER plan and the Assessment of Program Impact (API) reporting schedule.
D. Organization of the Report
Chapter 11 presents USAID/Rwanda's program goal, sub-goals, strategic objectives, targets, and the associated performance indicators. It presents the Mission's monitoring-evaluation-reporting plan. Specifically, a step-by-step process of developing the plan for each strategic objective is provided. This process includes a range of activities from identifying specific results to be measured, selecting data collection instruments, discussion of methodological issues, establishing baseline data and annual targets. A data management budget and implementation schedule are also presented. A planning matrix -- discussed earlier -- used for each strategic objective is included as an annex to the report.
"Next Steps" comprises the last chapter, Chapter III. Several annexes are included to assist the Mission in developing its monitoring system.

CHAPTER 11. THE MISSION'S STRATEGIC PLAN AND PERFORMANCE MONITORING, EVALUATION AND REPORTING
A. Introduction
Program performance monitoring, evaluation and reporting are at the heart of managing the program information for strategic management (PRISM). Program-level monitoring and evaluation plans are concrete evidence that program managers have gone through a sound, logical planning process. This process includes, minimally, the following ingredients:
a thinking through a country development needs assessment designing programs for strategic impact stating clearly the expected results
8 selecting indicators to accurately measure impact developing and using cost effective methods for collecting data and measuring indicators
What follows is a brief review of program-level MER requirements for USAID/Rwanda at the highest program levels.
B. Monitoring and Evaluating Program Goals and Sub-Goals
Program goals and sub-goals are briefly reviewed in relation to the indicators agreed to in the PRISM Phase I1 exercise. More detailed information on underlying theory and rationale for the indicators is available in the Phase I report.
MISSION PROGRAM GOAL: Increased participatory economic growth.
The desired results under this program goal are (1) accelerated and sustained economic growth and (2) increased participation of medium and small scale enterprises and farmers in the production of economic goods and services. Achievement of the goal can be measured in terms of the following indicators:
a % increase in real per capita Gross Domestic Product (GDP) % increase in the number of medium and small scale enterprises % increase in GDP share of medium and small scale enterprises

The Mission has identified three Sub-Goals that directly support this program goal:
SUB-GOAL No. 1: Decreased population growth.
SUB-GOAL No. 2: Improved democratic governance.
SUB-GOAL No. 3: Increased real income in the agrarian sector.
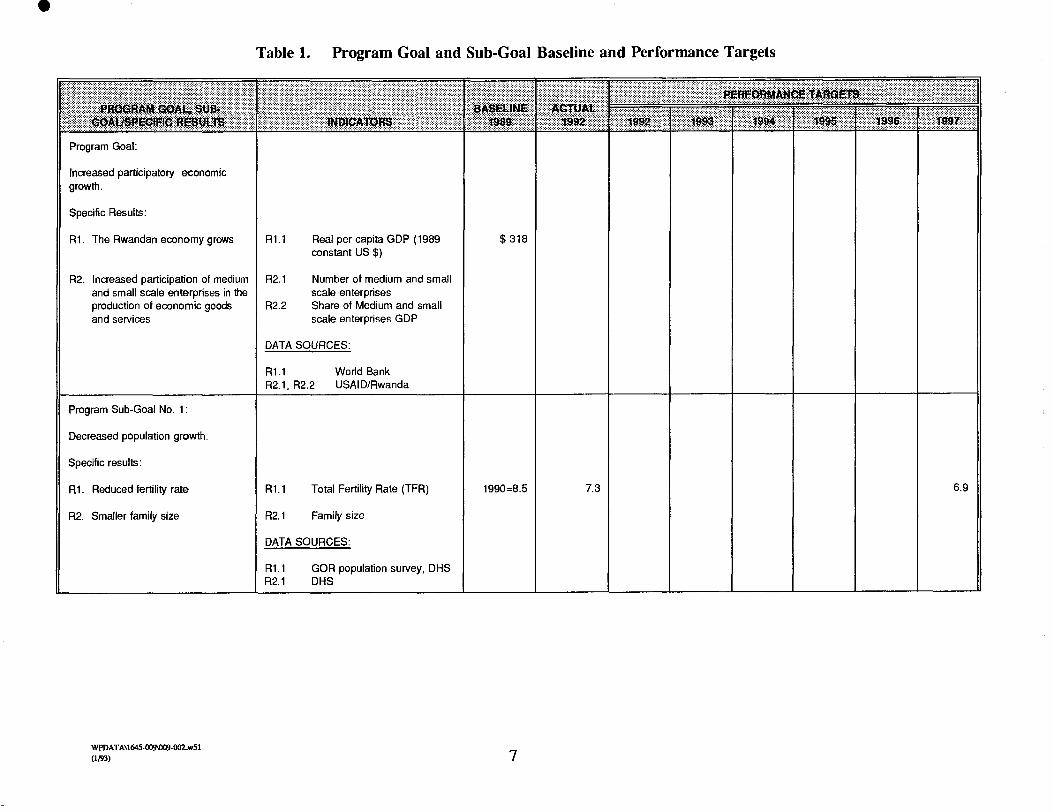
The specific results, performance indicators and data sources for each of these sub-goals are summarized in Table 1 below. The Mission's program objective tree is shown as Figure 1.
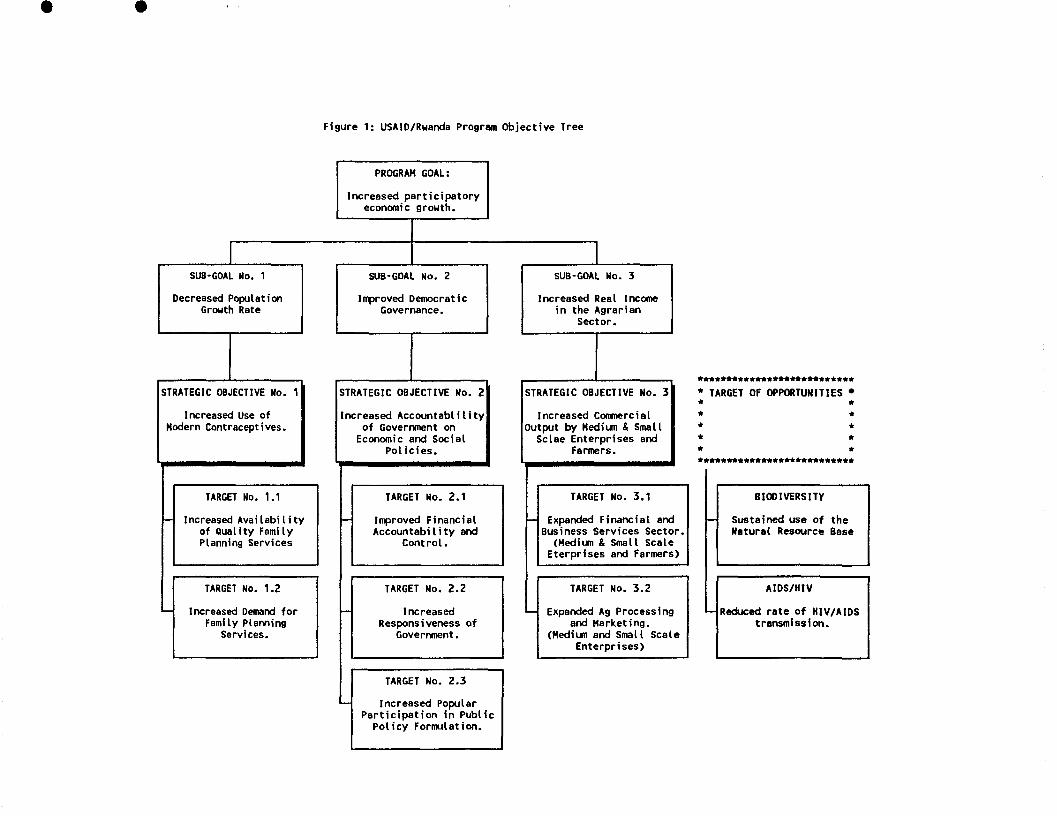
Figure 1: USAID/Ruanda Program Object ive Tree
PROGRAM GOAL: 1 lncreased p a r t i c i p a t o r y
SUB-GOAL No. 1
Decreased Population Growth Rate
SUB-GOAL No. 2
Improved Democratic Governance.
STRATEGIC OBJECTIVE No. 1
Increased Use of Modern Contraceptives.
Increased Accountabl i l i t y o f Government on
Economic and Social Pol ic ies.
I I TARGET No. 1.1 I I I TARGET No. 2.1 I Increased Avai lab i 1 i t y Improved Financial
of Quality Family Accountabi l i ty and Planning Services
SUB-GOAL No. 3 1 lncreased Real Income
i n the Agrarian Sector.
............................. TARGET OF OPPORTUNITIES *
Increased Comnercial * Output by Medium & Small *
Sclae Enterprises and t
Farmers. * ........................... I
I TARGET No. 3.1
Expanded Financial and Business Services Sector
(Medim 8 Small Scale Eterpr ises and Farmers)
TARGET No. 1.2
lncreased Demand f o r Family Planning
Services.
I I I TARGET No. 2.2 I I I TARGET No. 3.2
I n Increased Expanded Ag Processing Responsiveness o f and Marketing.
G o v e r m n t . (Medium and Small Scale
1 Enterprises)
Reduced r a t e o f HlV/AIDS t rammi s s i on.
- I I TARGET No. 2.3
Increased Popular P a r t i c i p a t i o n i n Publ ic
P o l i c y Formulation.
1 Sustained use o f the Natural Resource Base
I I
Table 1. Program Goal and Sub-Goal Baseline and Performance Targets
Program Goal:
Increased participatory economic growth.
Specific Results:
R1. The Rwandan economy grows
)I R2. Increased participation of medium and small scale enterprises in the production of economic goods and services
Program Sub-Goal No. 1 :
Decreased population growth
Specific results:
R1. Reduced fertility rate
R2. Smaller family size
R1.l Real per capita GDP (1989 constant US $)
R2.1 Number of medium and small scale enterprises
R2.2 Share of Medium and small scale enterprises GDP
DATA SOURCES:
R1.l World Bank R2.1. R2.2 USAID/Rwanda
R1.l Total Fertility Rate (TFR)
R2.1 Family size
DATA SOURCES:
R1.l GOR population survey, DHS R2.1 DHS

Program Sub-Goal No. 2:
Improved democratic governance.
Specific Results:
R1. Accountable branches of Government at national and local levels
R2. Broad public understanding and assimilation of democratic governance principleslpractices
R1.l Competitive election system at local and national levels
R1.2 % of operating budget from local sources
R2.1 Public confidence in Government
DATA SOURCES:
R1.l US Embassy R1.2 USAIDIRwanda, MININTER,
Journal Officiel R2.1 Public Opinion Survey,
Rwandan Media
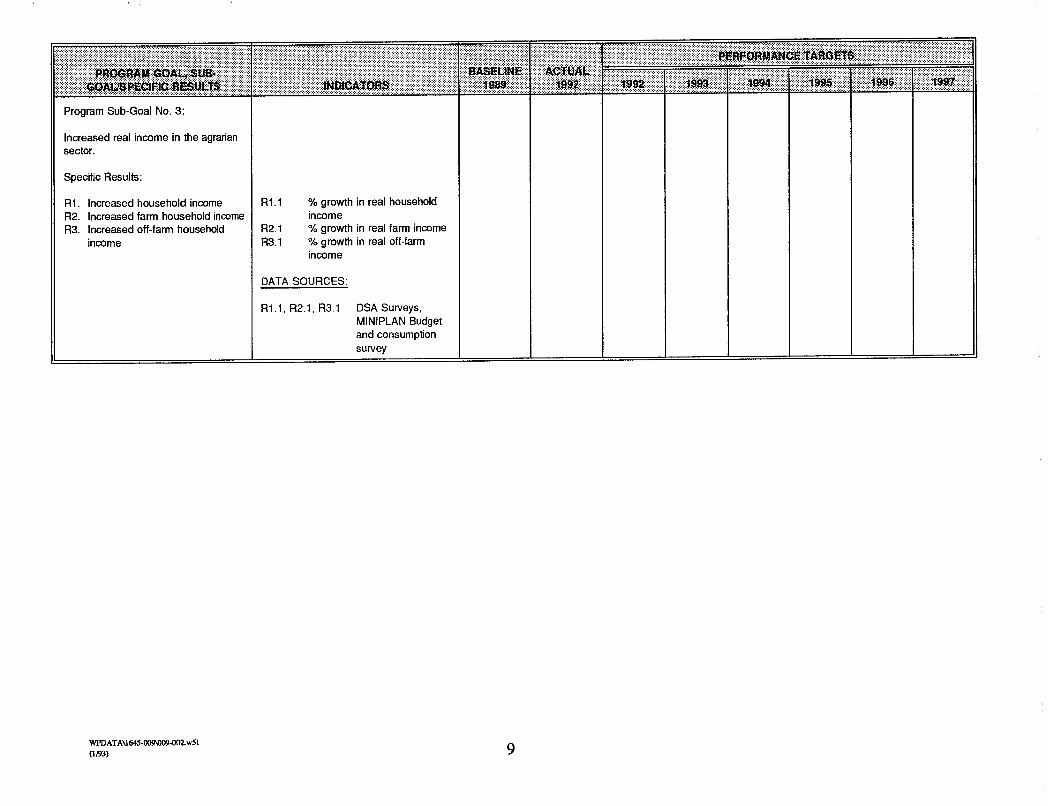
11 Program Sub-Goal No. 3:
lncreased real income in the agrarian sector.
)I Specific Results:
R l . lncreased household income R2. lncreased farm household income R3. lncreased off-farm household
R1.l % growth in real household income
R2.1 % growth in real farm income R3.1 % growth in real off-farm
income
DATA SOURCES:
R1.l, R2.1, R3.1 DSA Surveys, MINIPLAN Budget and consumption survey
I

C. Strategic Objectives - Monitoring and Evaluation Plan
1. STRATEGIC OBJECTIVE No. 1: Increased use of modern contraceptives
a. Results and Performance Indicators
The results and performance indicators for Strategic Objective No. 1 are summarized in the table below. The Targets under this objective suggest that the Mission's bilateral and centrally funded activities will help the Ministry of Health (MOH) and National Population Office (ONAPO) increase accessibility to family planning services through both private and public means, provide a greater mix of family planning methods, increase the proportion of family planning users adopting longer term methods of modern contraception, and encourage more Rwandans to desire family planning services. In addition, resources will be devoted to integrating family planning into the national health services to increase efficiency, convenience, and the awareness of the importance of reproductive health care. This activity will include support for the MOH decentralization of authority to the regional level; improvement of MOH planning and management; enhancement of counselling and referral services; and improvement of Information, Education and Communication (IEC) strategies. The strategic objective working group has identified the specific results, indicators, strategies and activities that support achievement of the results under this strategic objective. See Annex 2 - Strategic Objective No. 1 - Program Performance Monitoring and Evaluation Planning Matrix for the specific details.
This strategic objective directly links to Sub-Goal No. 1: Decreased population growth rate. Given its limited resource base, Rwanda cannot sustain its present 3% annual population growth rate. An aggressive effort to reduce the fertility rate will require increasing the contraceptive prevalence rate. This is to some extent accomplished by ensuring access to modern contraceptives and educating the population on the importance of family planning.
11 STRATEGIC OBJECTIVE NO. 1: Increased use of modern contraceptives
SPECIFIC RESULTS
R 1. Increased number of Rwandans using modern contraceptives
PERFORMANCE INDICATORS
R1.l Contraceptive Prevalence Rate
R1.2 Couple Years of Protection
DATA SETS
% of women (15- 49) currently using modern contraception
Volume of contraceptives used andlor administered

b. Data Collection Instruments
1. Measurement Techniques
As shown in the Program Performance Monitoring and Evaluation Planning Matrix, the data sets for measuring performance indicators will be acquired from different sources. The two primary data sets are the USAID funded Demographic and Health Survey @HS) and ONAPO service statistics. Each of the selected program indicators including those used for the Program Sub-Goal and Strategic Objective will draw upon data from both sources. The baseline data will be based on the 1992 Demographic and Health Surveys. Another DHS is scheduled in 1997 at the end of the strategy period. ONAPO and MOH service statistics will be used to demonstrate impact in the intervening years. Historic trends show that annual services statistics concur with the data collected every five years by the DHS. In a few instances (i.e., desired family size, expressed desire for family planing, Couple Years of Protection), population based surveys and social marketing data may be used as supplemental data sources. Under consideration at the Mission is a proposal to conduct a less rigorous national DHS each year rather than the extensive survey presently conducted every five years.
Other than the DHS, only one specialized survey appears to be required. This is a survey to measure IEC of family planning and health services. Survey design and administration will be defined as part of the Mission's analytical agenda.
ii. Budget
The cost for all data collection and evaluation is approximately $500,000 and is built into the two primary programs, MCHIFPII and RIM.
c. Methodological Issues
i. Data Quality
DHS data are the best data available for the indicators selected to measure impact. The survey is administered by Macro International, leading experts in demographic surveys. Those administering the survey in 1992 felt that the quality of the Rwandan data is very high.
USAID has invested considerable resources over the years in improving the quality of ONAPO and MOH FPIMCH service statistics. These are believed to be of reasonable quality. Comparisons with DHS data have determined that the two sources reinforce each other.
ii. Attribution and Linkage Issues
At present there appear to be no serious issues of linkage or attribution. Historically, USAID has been the major donor in family planning in Rwanda. USAID was recently succeeded as the lead donor by the World Bank when it introduced a new population program. WE3 and USAID programs are remarkably similar. The current WB project design includes a concessional loan program, a separate accountinglauditing facility, evaluations, and many other services which are

presently donated and/or administered by USAID. It is unclear to USAID why the WB program was designed as such and why the GOR agreed to the conditions guiding the provision of services. Implementation of the program has been stalled by both GOR and rhe WB, and discussions are underway to determine if the WB program will be implemented in its present design, redesigned, or scrapped. US AID'S major contribution to the Rwanda's population program is in the area of technical assistance. This service is not provided by the WB project in its current design. If USAID were to cease providing technical assistance, the national population program would be seriously hampered. One and a half years remain in the USAID population program and it is estimated that it will take that long for the WE3 program, in any form, to begin implementation. At that time USAID and other donors will have a better understanding of the WB program and niches available for USAID to fill.
d. Baseline and Performance Targets
Baseline data for most indicators can be provided by the 1992 DHS. For a few indicators (i.e., knowledge of family planning methods and sources), data will be captured in the IEC survey yet to be designed. Also available are data for many of the program indicators for years prior to the start of the current CPSP. The Mission has indicated that it would like to incorporate these data into reporting requirements because they best illustrate the significant impact USAID has made in the population area. The Mission is concerned that only using 1992 data for the baseline will not adequately capture achievements. The baseline data and performance targets for many of the indicators remain to be entered into Table 2.

Strategic Objective No. 1
lncreased used of modern contraceptives.
Specific Results:
R1. lncreased number of Rwandans using modern contraceptives
Target No. 1.1 :
lncreased availability of quality family planning services.
Specific Results:
R1. lncreased no. of family planning delivery points a. Clinical b. Other (CBD and CSM)
R2. lncreased no. of clinical delivery points offering more method choices
Target No. 1.2:
lncreased demand for family planning services.
Specific Results:
R1. lncreased no. of Rwandans wanting Family Planning Services
Table 2: Strategic Objective No. 1 - Baseline and Performance Targets
R1.l Contraceptive Prevalence Rate (CPR)
R1.2 Couple Years Protection
R1.l No. of service delivery points: a. Clinical services b. CBD CSM
R2.1 % of clinical health centers offering 4 or more modern methods
R1.l Desired family size (MaIelFemale)
R1.2 Expressed desire for Family Planning (MaleIFemale)

2. STRATEGIC OBJECTIVE No. 2: Increased accountability of Government on economic and social policies.
a. Results and Performance Indicators
Under Strategic Objective No. 2 the specific results sought and the associated performance indicators are summarized below. The Targets under this objective aim at (1) improved financial accountability and control (in the government sector); (2) increased responsiveness of government; and (3) increased popular participation in public policy formulation. In support of these objectives, the Mission will provide assistance to (a) non-governmental agencies (NGOs), (b) private voluntary organizations (PVOs), (c) the press, (d) local governments and (e) the National Assembly in order to improve their institutional capacity to demand and supply improved democratic governance.
The Mission and the MER Team have identified the specific results, indicators and project and non-project activities that support achievement of results under this strategic objective and the associated program targets.
STRATEGIC OBJECTIVE No. 2: Increased accountability of Government on social and economic policies.
SPECIFIC RESULTS
R 1. Nationall Commune level transparent accountable budget processes
R2. Effective budget process being used by:
- Executive bureaucracy, - Natl Assembly - public interest groups
R3. National/Commune level governments economic/social sector policy-making based on open public dialogue.
PERFORMANCE INDICATORS
Public documentation of budget process
Public interest groups/Natl Assembly/media/ position papers1 analyses/public debate on budget issues
Govt using formal analysis in policy formulation
-- -
DATA SETS
# and frequency of publications on government budget and expenditures
# of public policy issues brought to the attention of government polic y-maken
Quality index to measure the quality of policy papers prepare by public sector staff
Annex 3: Strategic Objective No. 2 - MER Planning Matrix included below summarizes the strategies and indicators, how they are evaluated and the data sources in greater detail.
b. Data Collection
1. Measurement Techniques
Major reliance will be placed on the financial and staff resources of the Democratic Initiatives and Governance P I G ) Project for data collection and analysis at all levels of the matrix. Due to the quantitative and non-conventional nature of many of the indicators, a significant amount of new data will need to be collected, processed, and analyzed. This will involve collection and synthesis of data generated by public and non-public organizations, as well as generation of new data through case studies and surveys. In collaboration with Mission Program Office staff, DIG project staff will plan and coordinate the data collection efforts using widely accepted measurement techniques.
The key instruments of success for management of the information to be gathered under Strategic Objective No. 2 are: (1) a clearer definition of specific data sets, (2) identification of the gaps between data sets and the data being generated by various groups participating in activities and projects that will contribute improved democratic governance, and (3) identification/coordination of the entities responsible for collecting and analyzing the data needed to fill the gap.
ii. Budget
The specific data needs for measuring progress under the indicators for Strategic Objective No. 2 have not yet been fully determined. The Mission plans to engage an information specialist to identify specific data needs and develop a comprehensive plan and cost estimate for collection, analysis, and dissemination of information to relevant users. It is anticipated that most of the cost of data collection and analysis related to this strategic objective will be met with DIG Project funds. Some of these costs, however, will be met from other project funds including PRIME, PVO support, Cooperative Support and, eventually, the Support to Economic Reform (SER) projects. The data collection implementation plan for this strategic objective needs to be completed.
c. Methodological Issues
1. Data Quality
The quality of data collected under the DIG Project and other on-going Mission projects can be controlled by project personnel. The same may not be true, however, of data emanating from other (e-g. GOR) sources. Thus it may be necessary to provide technical assistance to these entities to build their capacity in order to enhance the quality of the data they collect. These needs will be identified by the information specialist referred to above. The information specialist should also define and establish methodologies for establishing base lines for selected indicators and for projecting the performance targets for each indicator over the planning period.
ii. Issues of Attribution and Linkages
It is widely acknowledged that democracy/governance programs present difficult issues regarding attribution. The primary focus of the Mission's efforts to improve democratic governance is to bring about behavioral changes. Many such changes can, and normally do, have numerous causes, and can require considerable time to become accepted norms. Thus, the objective is to establish plausible linkages. The linkages described in the MER Planning Matrix were selected with this in mind. However, a more in depth effort is required. This will be a major task of the information specialist.
d. Baseline and Performance Targets
1. Basis for Setting Baseline
The baseline and performance targets for each indicator under the strategic objective and target remain to be entered in Table 3 below. The basis and methodology for establishing the baseline is yet to be determined. The project/program implementors are expected to develop the baseline data. The implementation schedule for developing the baseline and determining the performance targets needs to be finalized.
ii. Basis for Performance Projection
The basis for projecting out performance targets has not yet been established. Performance targets for each indicator under the strategic objective and the associated targets are summarized in Table 3 below.

Table 3: Strategic Objective No.2 - Baseline and Performance Targets
Strategic Objective No. 2:
Increased accountability of Govt. on social and economic policies.
Specific Results:
K1. National/Commune level transparent accountable budget processes
R2. Effective budget process being used by
-Executive bureaucracy -Natl Assembly -public interest groups
R3. National/Commune level govt economic/social sector policy-making based on open public dialogue
Public documentation of budget process
Public interest groups/Natl Assembly/media/ position papers/ analyses/public debate on budget issues
Govt using formal analysis in policy formulation

I1 Target No. 2.1:
Improved financial accountability and control.
I1 Specific Results:
R1. Restructured National and Commune level budget making, tracking and control ins truments/process
R2. S ystematic/independent auditing of govt expenditures
R1.l Accurate, accessible, open budget information
R2.1 Number of audits performed
R2.2 Number of audit recommendations closed

Target No. 2.2:
Increased responsiveness of Govt.
Specific Results:
National Assembly: R 1. More efficient/transparent
internal Natl Assembly operations
R2. Improved economic and social policy/budgetary analysis
increased number of constituent demands addressed by Natl Assembly
Timely publication of Natl Assembly documents
Increased number of Natl Assembly legislative initiatives and changes to Executive initiatives enacted

R3. Increased legislative oversight
Commune level: R4. More efficient/transparent
operations
R5. Greater public interest group/NGO participation in local government
R3.1 Numberldiversity of oversight hearings held
Commune level: R4.1 Number of
independently funded Commune level initiatives taken
R4.2 Local citizens participating in scheduled "Town Meetings" or hearings
R4.3 Number of Commune level public announcements
R5.1 Formal integration of public interest groups/NGOs in Commune governance functions
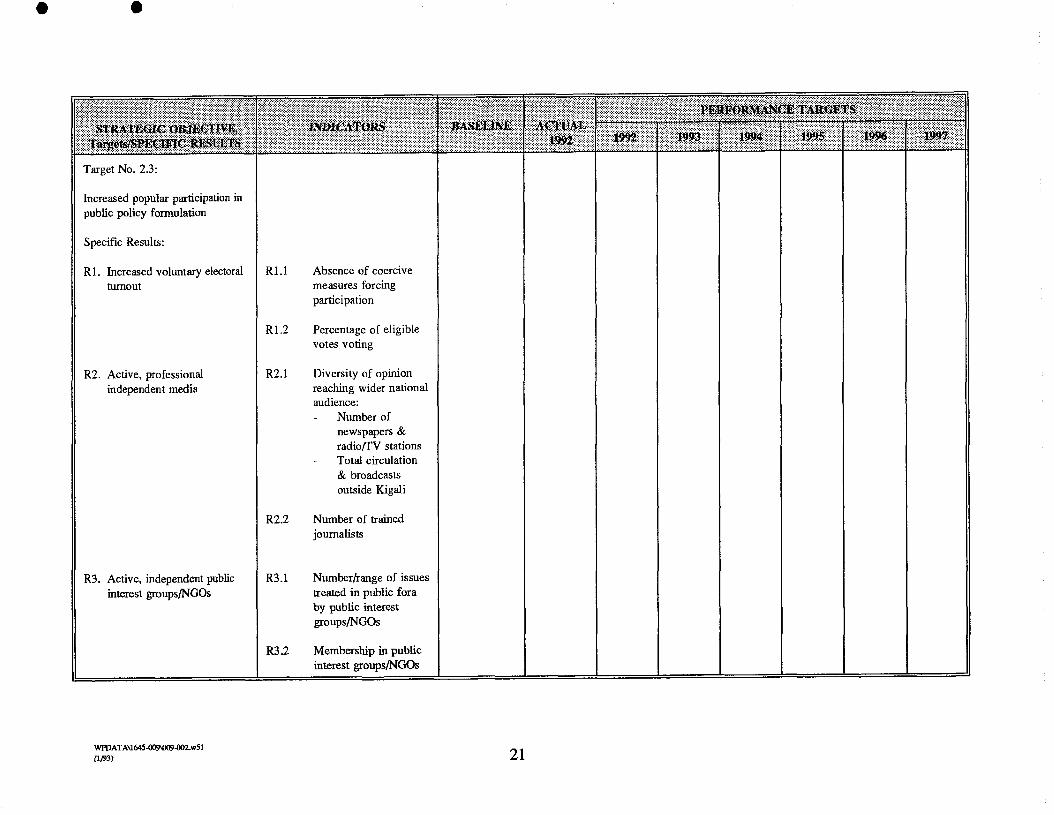
Target No. 2.3:
Increased popular participation in public policy formulation
Specific Results:
R 1. Increased voluntary electoral turnout
R2. Active, professional independent media
R3. Active, independent public interest groups/NGOs
Absence of coercive measures forcing participation
Percentage of eligible votes voting
Diversity of opinion reaching wider national audience: - Number of
newspapers & radioflV stations
- Total circulation & broadcasts outside Kigali
Number of trained journalists
Numberhange of issues treated in public fora by public interest groups/NGOs
Membership in public interest groups/NGOs
3. STRATEGIC OBJECTIVE No. 3: Increased commercial output by medium and small scale enterprises and farmers.
a. Results and Performance Indicators
Under Strategic Objective No. 3 the specific results sought and the performance indicators are summarized in the table below. The Targets under this objective suggest that the Mission's project and non-project activities will (1) improve the economic and regulatory environment; (2) improve farmers and small and medium scale enterprises access to commercial credit; and (3) improve the marketing capabilities of small and medium size firms and farms to increase their marketed output of goods and services. USAID will assist the GOR to create an enabling policy and regulatory environment in order to accelerate the expansion of medium and small scale enterprises. It will also provide technical assistance, training and grants to both individual Rwandan firms and to PVOs and NGOs in order to enhance the marketing and management capabilities of medium and small scale enterprises.
The working group has identified the specific results, indicators and project and non-project activities that support achievement of results under this strategic objective and the associated targets. Annex 4: Strategic Objective No. 3 - the Program Performance Monitoring and Evaluation Planning Matrix summarizes the strategies and indicators and how they are evaluated and the data sources.
This strategic objective directly feeds into Sub-Goal No. 3: Increased real income in the agrarian sector. Given that over 90 percent of Rwandans are engaged in agricultural and rural activities, real incomes are linked directly to agricultural activities. Rwanda is one of the most intensively farmed countries and with limits on the expansion of arable land, the avenues available for increasing rural incomes are: (1) increased crop yield through the application of improved technology; and (2) increased value-added marketing and processing by creating an enabling environment.

STRATEGIC OBJECTIVE No. 3:
SPECIFIC RESULTS
R1. Increased commercial activities
R2. Increased non-farm activities
R3. Increased non-farm employment
R4. Increased small business support services
Increased commercial output by medium and small scale enterprises and farmers.
PERFORMANCE INDICATORS
% increase in the real value and volume of marketed goods and services
% increase in the real off-farm income % increase in # of new businesses (formal and informal)
% increase in off-farm employment
% increase in the number of organizations providing business support services to SMEs and farmers
Increase in the types of business support services provided to SMEs and farmers including commercial credlt
DATA SETS
value of marketed agricultural and non- agricultural goods, volume of marketed agricultural and non-agricultural goods, value of marketing services
income from employment away from once own farm # of new formal and informal businesses created
# of individuals employed by other farmers and businesses
# of PVOs, NGOs and private businesses providing business support services to SMEs and farmers # of the different types of business support services provided to SMEs and farmers i.e., credit, accounting and book- keeping, management training, marketing information, etc.
b. Data Collection
1. Measurement Techniques
As shown in the Program Performance Monitoring and Evaluation Planning Matrix (Annex 4), the data sets for measuring the performance indicators will be compiled from various sources. The Department of Agricultural Statistics (DSA) in the Ministry of Agriculture and the Ministry of Plan (MINIPLAN) will be primary sources of data. The DSA, through a monthly household income and expenditure survey gathers data on income and marketed output by rural households. The DSA and the MINIPLAN surveys needs to be complemented by a survey of medium and small scale enterprise activities. The key determinants of success for the management of the information to be gathered under Strategic Objective No. 3 are (1) a clearer definition of farm
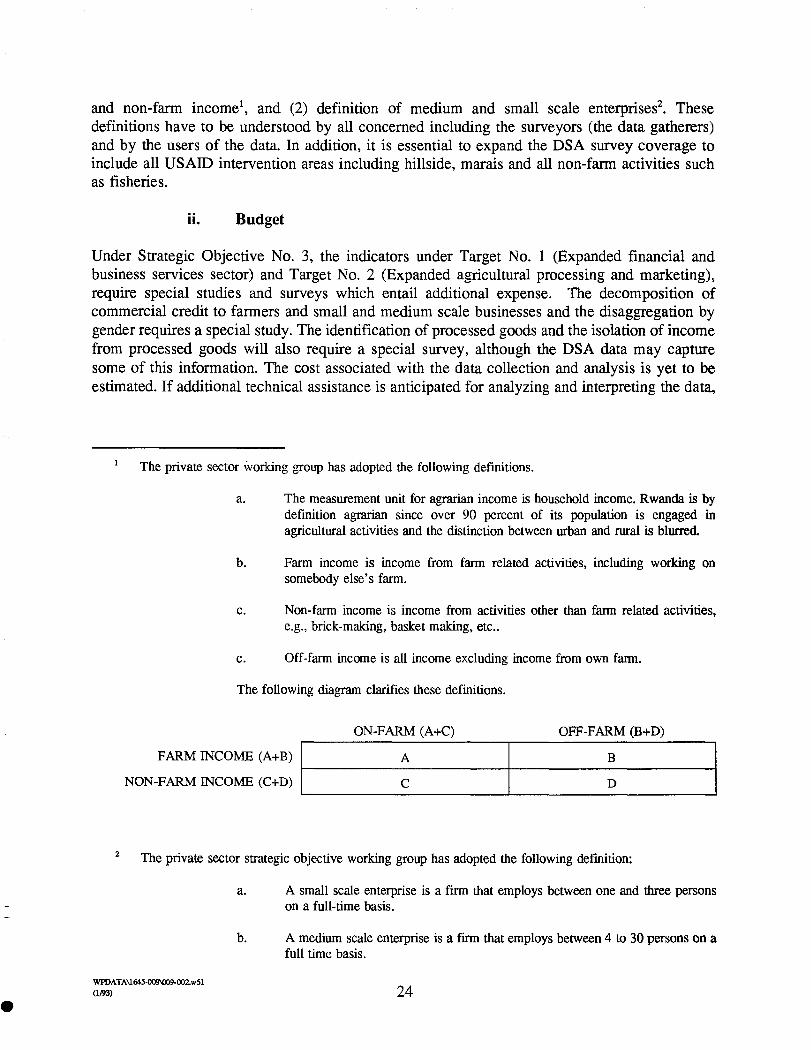
and non-farm income1, and (2) definition of medium and small scale enterprises2. These definitions have to be understood by all concerned including the surveyors (the data gatherers) and by the users of the data. In addition, it is essential to expand the DSA survey coverage to include all USAID intervention areas including hillside, marais and all non-farm activities such as fisheries.
ii. Budget
Under Strategic Objective No. 3, the indicators under Target No. 1 (Expanded financial and business services sector) and Target No. 2 (Expanded agricultural processing and marketing), require special studies and surveys which entail additional expense. The decomposition of commercial credit to farmers and small and medium scale businesses and the disaggregation by gender requires a special study. The identification of processed goods and the isolation of income from processed goods will also require a special survey, although the DSA data may capture some of this information. The cost associated with the data collection and analysis is yet to be estimated. If additional technical assistance is anticipated for analyzing and interpreting the data,
The private sector working group has adopted the following definitions.
a. The measurement unit for agrarian income is household income. Rwanda is by definition agrarian since over 90 percent of its population is engaged in agricultural activities and the distinction between urban and rural is blurred.
b. Farm income is income from farm related activities, including working on somebody else's farm.
c. Non-farm income is income from activities other than farm related activities, e.g., brick-making, basket making, etc..
c. Off-farm income is all income excluding income from own farm.
The following diagram clarifies these definitions.
NON-FARM INCOME (CcD) 1 C I D I
ON-FARM (A+C) OFF-FARM @+D)
The private sector strategic objective working group has adopted the following definition:
FARM INCOME (A+B)
a. A small scale enterprise is a firm that employs between one and three persons on a full-time basis.
b. A medium scale enterprise is a firm that employs between 4 to 30 persons on a full time basis.
A B

the cost of such assistance should be incorporated in the budget estimate. The data collection implementation plan for this objective needs to be completed.
c. Methodological Issues
1. Data Quality
USAID has provided considerable technical assistance to the Ministry of Agriculture and the Ministry of Plan in order to enhance their data collection and analysis capacity on a sustained basis. Indeed, the DSA is in effect a USAID project-driven department whose main function is to gather and analyze household income and expenditures. The data are reasonably accurate and reliable, although currently it does not capture information from all project areas - i.e. hillside, marais and fisheries under the NRM project. When the USAID funded project ends, the DSA may not, however, have the sustained capacity to gather and analyze data to the same extent as the current project.
The structure of the SME survey data is yet to be defined. Furthermore, it remains to be decided as to who shall conduct the required survey. Prior to contracting the data gathering, the Mission should identify the data sets that need to be gathered and pre-test samples of each data set and determine whether or not the data sets are reliable and that they yield useful information. The study should also define and establish the methodology for establishing a baseline and for projecting the performance targets for each indicator over the planning period.
ii. Issues of Attribution and Linkages
There are several methodological issues that need to be addressed with regard to attribution. The USAID-assistance to SMEs and farmers is, to a large extent, policy related and its direct assistance to farmers and SMEs is dependent on the effectiveness of the PVOs and NGOs with whom it has planned to work. The degree of collaboration with other donors needs to be spelled out clearly and monitored.
d. Baseline and Performance Targets
I. Basis for Setting Baseline
The baseline and performance targets for each indicator under the strategic objective and target remain to be entered in Table 4 below. The basis and methodology for establishing the baseline is yet to be determined. The projectlprogram implementors are expected to develop the baseline data. The implementation schedule for developing the baseline and determining the performance targets needs to be finalized.
ii. Basis for Performance Projection
The basis for projecting out performance targets has not yet been established. Performance targets for each indicator under the strategic objective and the associated program outputs are to be summarized in Table 4 below.

11 Strategic Objective No. 3:
lncreased commercial output by medium and small enterprises and farmers.
II Specific Results:
R1. lncreased commerc~al activities
R2. lncreased non-farm activities
R3. lncreased non-farm employment
Table 4: Strategic Objective No. 3 - Baseline and Performance Targets
1.1 % increase in real value and volume of marketed goods and services
2.1 % increase in real off-farm income
2.2 % increase in # of business (formal and informal)
1 % increase in non-farm employment
1 % increase in # of organizations providing business support sewices to SMEs and Farmers
4.2 Increase in the diversity of business support services provided to SMEs and Farmers

Target No. 3.1 :
Expanded financial and business services sector.
Specific Results:
R1. lncreased financial services to SMEs and farmers
R2. More SMEs having access to business support services
Target No. 3.2: + Expanded agricultural processing and marketing.
11 Specific Results:
II R1. lncreased agricultural value- added processing
R2. lncreased number of marketing organizations
1.1 % increase in formal and informal commercial credit extended to SMEs and Farmers
2.1 % increase in the # of SMEs and Farmers accessing support services
2.2 % increase in the # of new firms providing business support services
1.1 % increase in the real value of processed agricultural product by SMEs and Farmers
2.1 % increase in the real value and volume of marketed agricultural products
4. Targets of Opportunity
The Mission has two targets of opportunity: sustained use of the natural resource base and reduced rate of HIV/AIDS transmission. These targets of opportunity were partly selected because of their unique significance to the country and because of interest raised by AIDtW.
Biodiversity. One specific result sought under this target of opportunity is the reduction of the degradation of the flora and fauna, parks, reserves, and natural forests. The Rwandan Government, recognizing the country's significant wealth of plant and animal species unique to the region, has taken steps to preserve natural resources and biodiversity, including the set-aside of nearly one-fifth of the country for parks and reserves. USAID's efforts to support environment programs in Rwanda began in the late 1980s with the Natural Resources Management Project (NRMP), portions of which deal with conserving biodiversity. An evaluation team recently submitted a report on NRMP which the Mission believes will assist in an effort to redesign aspects of the project.
Various NRMP activities contribute to reducing the degradation of the managed areas in Rwanda. The Mission is assisting the Environment Ministry both to improve its capacity to manage Rwanda's natural resources and to improve the government's environmental policy, legal, and regulatory framework, including the development of an environmental code. Under the target of opportunity, the Mission is supporting research efforts to advance the development of technology packages needed for conserving biodiversity resources. The Mission further emphasizes the linkage between these efforts in the policy and technology areas with expansion of tourism and private sector development. One result sought is to generate increased financial resources -- through eco-tourism -- that will be re-invested to strengthen the management of parks, reserves, and natural forests. Performance will be measured by monitoring the establishment and enforcement of an environmental code; tracking research efforts and new technologies that result; and measuring growth in tourism and how much of the revenues generated return to the managed areas. Specific results, indicators, and data sets for this target of opportunity are summarized below.
HIV/AIDS Prevention. Though closely linked to population and family planning, the Mission has chosen to define its intervention activities as a target of opportunity. Rwanda is an AIDSCAP focus country and a $10 million HIVIAIDS project is presently being designed with the assistance of the AIDSCAP team lead by A.I.D./R&D/H/AIDS. The team has completed a very preliminary project design assessment and will be working with the Mission in early CY93 to begin the PID and PP process. The Mission staff felt that at the time of the MER team visit, they were not far enough along in the design process to identify expected results, strategies and indicators, especially without the expertise of the AIDSCAP team. The Mission agreed to work with the AIDSCAP team to define and incorporate indicators into their Monitoring and Evaluation system. The target of opportunity as presently stated is "Reduced rate of HIVIAIDS transmission." This to be achieved through targeted IEC, condom social marketing and STD programs in Rwanda's large urban center.

TARGET OF OPPORTUNITY NO. 1: Sustained use of the natural resource base.
SPECIFIC RESULTS
R1. Development of an enforced environment code
R2. Accelerated generation of technologies needed for managed areas
R3 Revenue generation to finance administration of managed areas
PERFORMANCE INDICATORS
Approved environment code
Reduced poaching of natural resources
Number of completed studies
Number of technology packages identified
Percent increase in revenues
Percent of revenues re- invested in managed areas
DATA SETS
R 1.1 Ministry of the Environment?
R1.2 Ministry of Environment
R2.1 NRM Project
R3.1 Ministry of Tourism
R3.2 Ministry of Tourism; Ministry of the Environment

CHAPTER 111. NEXT STEPS AND ANALYTICAL AGENDA
A. Design of Scope of Work for Special Studies
As discussed in Chapter 11, measuring performance in terms of achievement of desired results will require collecting data sets for each performance indicator using various sources including sector assessment studies, special studies and surveys. It should be recognized that special studies are intended to go beyond project evaluation or research studies. Their purpose is to elucidate linkages between projects and programs or to clarify impact at the program level.
To determine if any special studies are warranted beyond those already envisioned, PRISM objective working groups should review all indicators. The project-program linkages should be carefully established in order to be able to aggregate and summarize data from the project level up to the program level. The special surveys and studies currently envisioned by each strategic working group are listed in the table below.
Strategic Objective No. 2: Increased accountability of Government on economic and social policies.
Strategic Objective No. 3: Increased commercial output by medium and small scale enterprises and farmers.
1. A survey to measure IEC of family planning and health services including knowledge of long-term family planning methods, source, importance of reproductive health
2. Development of the Comprehensive Reproductive health Services Quality Index
1. Survey of DIGS and NGOs 2. Public opinion surveys 3. Analysis of official and media
reports/documents 4. Exit poll surveys 5. Survey of selected business associations
1. Medium and Small Scale Enterprises Survey to gather employment, income, volume of marketed goods, value of marketed goods, types of marketed goods
2. Special credit study to collect data on formal and informal commercial credit to SMEs and farmers
3. Special studies to collect data on hillside and marais crop production and fisheries
B. Design of Survey and Other Questionnaire Forms
All such designs of surveys and questionnaires ( focus group interviews, etc.) should be done in the context of program performance reporting. The Program Performance M&E Plan will help and should be completed for each strategic objective by the PRISM working group. The plan can be used for establishing the schedule for data collection activities. Project and program managers will need to oversee the construction of data collection instruments in order to ensure that program-level measures are considered and, where relevant, included.

C. Design of Data Collection Forms for Contractors and Collaborators
At the project level, monitoring tasks are clearly delegated to contractors and cooperating agencies. Program-level concerns are those of USAID managers and they must ensure that such concerns are reflected in project M&E plans. Implementation of the program-level monitoring plan developed herein is an early priority for program managers. USAID offices may decide that additional human resources are needed to operationalize the system.
D. Automated MIS for Project and Program Monitoring
An automated MIS would be a useful way to operationalize the M&E plan outlined here. CDIE in cooperation with LAC Bureau and IRM is in the process of developing software which will incorporate and make the linkage between project and program level data. IRM is in the process of establishing a timetable for providing TA and software to the Missions. The USAIDBwanda and AfricaDP should follow up with CDIE and IRM to try to have this assistance in a timely fashion.
E. Strategic Working Group Management Proposal
The PRISM team strongly recommends to Mission management that it convene the PRISM working groups to continue the process of detailing the program level monitoring plan. It is proposed that the group meet -- for the next several months -- twice per month, two-three hours per meeting. More frequent meetings may be needed during January, to complete as many elements of the information system. Furthermore, it is suggested that PRISM working group participants be assigned with specific tasks which they would then bring to the groups for review. This should allow for time efficiency.
The following is a draft schedule of activities which will need to be carried out over the next several months:
1. Resolve outstanding issues and complete as much of the Planning Matrix as it appears appropriate and possible to complete (end-January)
2. Complete program results-project outputs linkage analysis (mid to late - January)
3. Estimate the program budget for each Strategic Objective and the associated Targets (to the extent that this is possible) (by late January)
4. Complete assessment of data collection needs and analysis of data collection budget (late January)
5. Complete a Data Collection Implementation Schedule (by 1ateJanuary). The format outlined in Annex 5 may be used for this purpose.
6. Complete baseline and performance targets (by mid-February)

ANNEXES

ruesday Dec 8
Wednesday Dec 9
Thursday Dec 10
Friday Dec 11
Annex 1: USAIDtRwanda - MER WORK SCHEDULE
December 8 - December 19, 1992
SCHEDULED MEETING
08:OO - l0:OO AM Meet on Private Sector Strategic Objective
10::30 - 12:30 AM Meeting on Pop/Health Objective
02:30 - 04:OO PM MER Workshop
08:OO - 10:OO AM Meet on Democracy/ Governance Strategic Objective
10::30 - 12:30 AM Meeting on Pop/Health Objective
02:30 - 04:OO PM Visit MINIPLAN -
08:OO - 10:OO AM Meet on Democracy1 Governance Strategic Objective
10::30 - 12:30 AM Meeting on Biolversity Target of Opportunity
02:30 - 04:OO PM Visit DSA
Team check-in and Introduction
Review strategic objective, identify specific results, indicators, data sources, baseline and projected performance targets.
Mission-wide review of MER Methodology
Refine performance indicators and identify data collection instruments and data sources. Establish data collection schedule and budget, and facilitate development of baseline and performance targets.
Determine type and quality of data sets
Refine performance indicators and identify data collection instruments and data sources. Establish data collection schedule and budget, and facilitate development of baseline and performance targets.
Determine type and quality of data sets

Monday Dec 14
Tuesday Dec 15
Wednesday Dec 16
Thursday Dec 17
Friday Dec 18
Saturday Dec 19
SCHEDULED MEETDIG
08:OO - 10:OO AM Mid-term Review with Management
10::30 - 12:30 AM Follow-on meeting with Private Sector Working Group
02:30 - 04:30 PM Follow-on meeting with DIG Working Group
08:OO - 10:OO AM Follow-on meeting with DIG Working Group
10::OO - 11:OO AM Debrief the Ambassador on AREAF
10:30 - 12:30 PM Follow-on meeting with Pop/Health Working Group
01:30 - 04:30 PM Follow-on Meeting with DIG Working Group
08:00 - 10:30 AM Follow-on meeting with the DIG Working Group
10:30 - 12:30 PM Follow-on meeting with Private Sector Working Group
8:00 AM - 5:00 PM Write MER report
09:OO - 11:OO AM Final Report-Out and Debriefing
12:00 - 04:00 PM Clean-up of report
MER Team Departs
SO Working Groups report-out status of the MER exercise and review issues to be resolved by management
Continue refinement of indicators and data sources and develop baseline and performance target data.
Continue revision and refinement of the MER matrix
Continue revision and refinement of the MER matrix
Continue revision and refinement of the MER manix
Complete the MER matrix.
Draft and distribute MER report by close of business
Working Groups Report-Out MER results to Mission Staff and MER Team Debrief management.

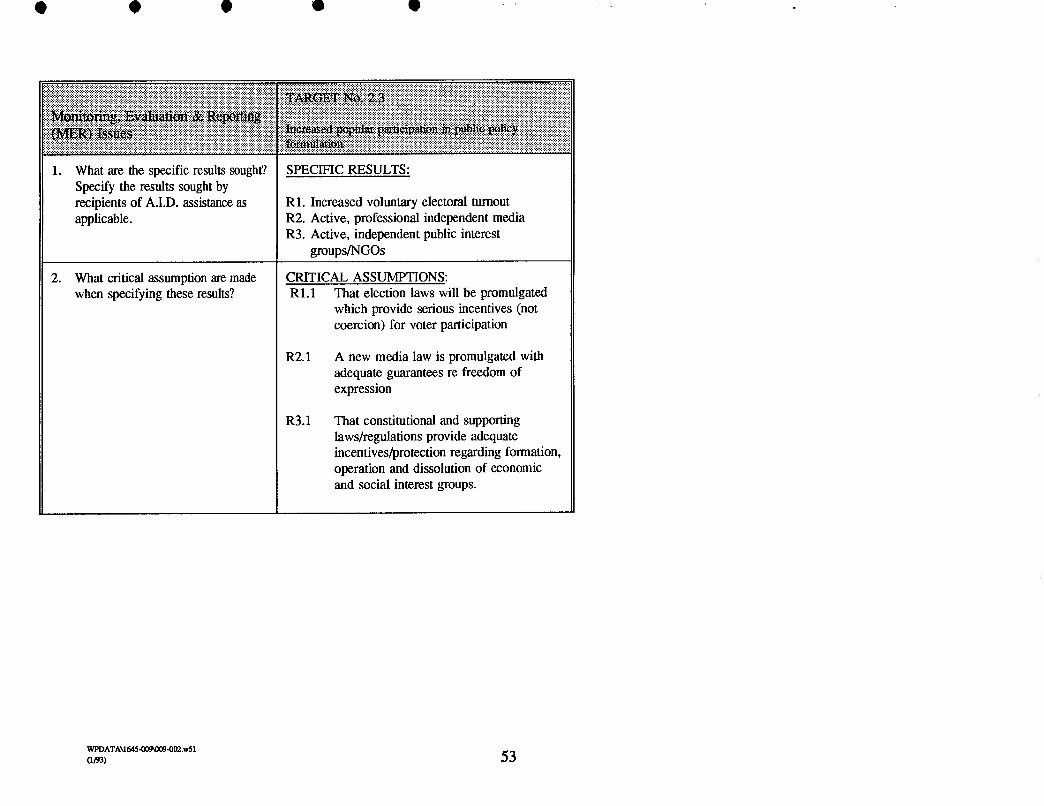
1. What are the specific results sought? Specify the results sought by recipients of A.I.D. assistance as applicable.
2. What critical assumption are made when specifying these results?
Annex 2: Strategic Objective No. 1 - MER Planning Matrix
SPECIFIC RESULTS: 1. Reduced fertility rate 2. Smaller family size
SPECIFIC RESULTS : 1. Increased no. of Rwandans
using modem contraceptive methods
SPECIFIC RESULTS: 1. Increased no. of family
planning delivery points a. Clinical b. Other (CBD and
CSM) 2. Increased no. of clinical
delivery points offering more method choices
CRITICAL ASSUMPTIONS: 1. GOR and donors continue
to support population and family planning objectives through budgetary andlor political means
--
CRITICAL ASSUMPTIONS: 1. Correct use of modem
contraceptives 2. New methods will be
incorporated into program as technology becomes available
CRITICAL ASSUMPTIONS: 1. Construction of new
delivery points avails family planning services to a wider audience
SPECIFIC RESULTS: 1. Increased no. of
Rwandans wanting Family Planning Services
CRITICAL ASSUMPTIONS: 1. Elevated knowledge of
family planning and client confidence will increase service utilization

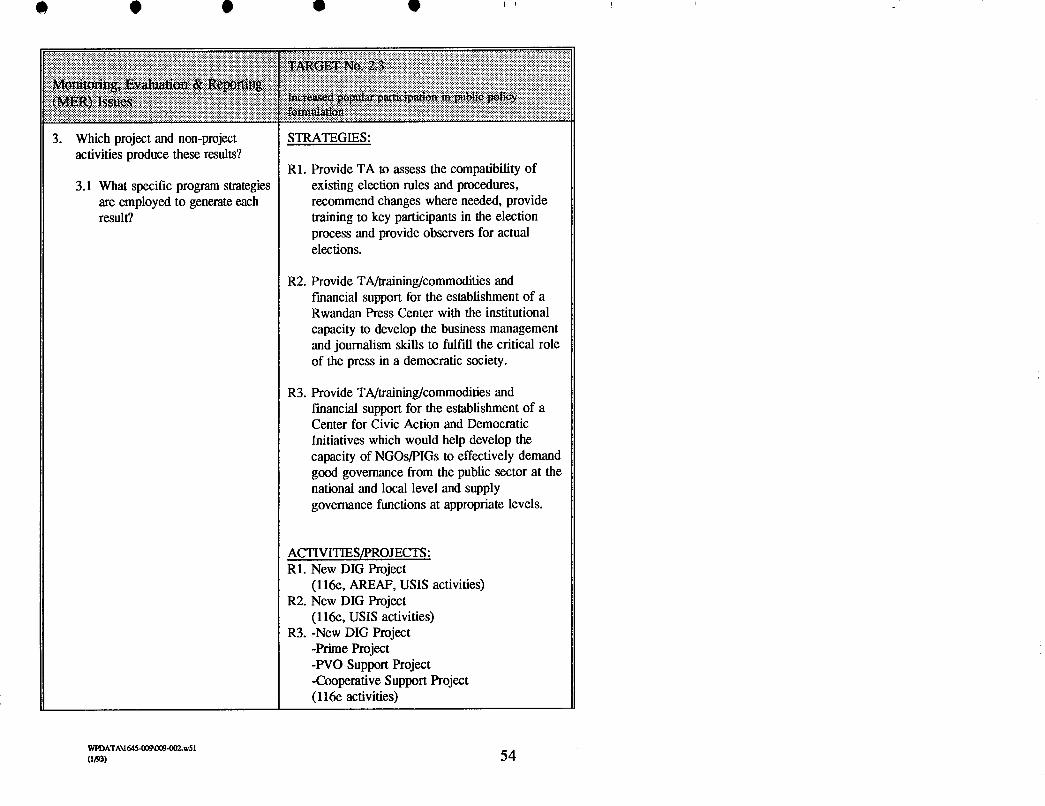
3. Which project and non-project activities produce these results?
3.1 What specific program strategies are employed to generate each result?
4. What specific results at the target (program outcome) level generate each specific result at the strategic objective level? (use Table 1)
4.1 What specific project outputs (i.e, number trained, etc.) generate the specific results at the target (program outcome) level?
STRATEGIES: nla
ACTIVITIES/PROJECTS: 1. MCH/FP II Project 2. Rwanda Integrated
MCH/FP Project
LINKAGE ANALYSIS
STRATEGIES: nla
ACTIVITIESIPROJECTS: 1. MCH/FP 11 Project 2. Rwanda Integrated MCH/FP
Project (RIM)
LINKAGE ANALYSIS
By making modem contraceptives more widely available and accessible, and by encouraging demand through IEC, more Rwandans will choose to use modem contraceptive methods.
STRATEGIES: MCH/FF II: Training, policy reform, equipment and contraceptive commodities supply, local cost support; & RIM: MOH regional support, management and technical training, equipment; leading to more delivery points offering more modem methods
ACTIVITIES/PROJECTS : 1. MCH/FP II Project 2. Rwanda Integrated
M C W Project (RIM)
LINKAGE ANALYSIS
Increased accessibility is attained by increasing the number of delivery points and the supply and variety of FP methods through both private and public mechanisms.
STRATEGIES: More information, education and communication on the benefits of FP services provided to the communities
ACTIVITIES/PROJECTS : 1. M C W 11 Project 2. Rwanda Integrated
M C W Project (RIM)
LINKAGE ANALYSIS
An increase in variety and number of contraceptive choice, improved understanding of comprehensive reproductive health care and the source for these services will lead to an increase in the demand for family planning services.

5. Which donors and host government (HG) entities are working towards the achievement of these results?
5.1 Which of these donors collaborate with A.I.D.?
6. How much funding is each donors, HG entities and USAID providing for achieving each result? (Use Table 2)
6.1 How much funding is provided by collaborating donors?
What % is A.I.D. funding relative to the total funding? (use Table 2)
7.1 What % of its total portfolio funding is A.I.D. allocating for achieving each result? (use Table 3 far budget analysis)
DONORS
COLLABORATORS:
PROGRAM FUNDING:
Total funding for the two primary project, MCH/FPII and RIM is $23,785,000
DONORS:
COLLABORATORS:
PROGRAM FUNDING:
DONORS: 1. WB on health center
construction 2. GTZ on training,
commodities, IEC 3. UNFPA on research,
commodities
COLLABORATORS: MOH, ONAPO, ARBEF, UNR
PROGRAM FUNDING:
DONORS: 1. WB on center
construction 2. GTZ on training,
commodities, IEC 3. UNFPA on research,
commodities
COLLABORATORS: MOH, ONAPO, ARBEF, UNR
PROGRAM FUNDING:

8. What specific performance indicators are used to measure progress towards achieving the results sought?
11 8.1 What is the scope of each 11 indicator (i.e., program
II target population, geographic area, gender,
II etc)
9. How are each of these indicators measured?
9.1 What specific data sets are required for measuring these indicators?
10. How are data sets aggregated across projects and program targets to measure performance at the strategic objective level? (Use Table 4)
measurement unit of each data set?
INDICATORS: 1. Total fertility rate (TFR)
1. Population Based Surveys
1. Demographic and Health Survey (DHS)
Average # children that would be born alive to a woman during her reproductive years (15-49) if she were to pass through all her childbearing years conforming to the age- specific fertility rates of a given year.
INDICATORS: 1.1 Contraceptive Prevalence
Rate (CPR) 1.2 Couple Years of Protection
( C W
1.1 DHS and ONAPO Monthly Service Statistics
1.2 ONAPO Monthly Service Statistics and Warehouse Reports, ARBEF/SOMARC Monthly Social Marketing Sales Data
1.1 % of women (15-49) currently using modem contraception
1.2 See No. 15.
INDICATORS: 1.1 No. of service delivery
points: a. Clinical senices b. CBD
CSM
2.1 % of clinical health centers offering 4 or more modem methods
1 . 1 ONAPO Monthly Utilization Statistics
1 . 1 ONAPO, ARBEF Utilization Statistics
2. ONAPO Service Statistics
1 . 1 No. health centers and secondary posts offering FP
1.lb. No. CBD & CSM outlets
2. No. health centers and secondary posts offering four or more FP methods
INDICATORS: 1.1 Desired family size
(MaleFernale) 1.2 Expressed desire for
Family Planning (MaleFernale)
1.1 Population Based Surveys, DHS
1.2 Population Based Surveys, DHS
1.1 Stated number of children desired by men and women (separately)
1.2 % of men and women of reproductive age not wanting any more children or desiring to space their children

1 1. What data collection instruments (i.e., data sources) are used for gathering the required data sets?
1 1.1 What is the estimated cost of data collection & analysis for each type of data collection instrument? (use Table 5 - Data Collection & Analysis Budget)
12. How frequently are the data sets collected on each indicator? (Use Table 6 - Data Collection & Analysis Implementation Schedule)
12.1 By when should the data sets be available to users?
12.2 In what form should data sets be available to users?
13. Which offices within the USAID management have responsibility for implementing program strategies and managing each result?
INSTRUMENTS: 1. DHS
1. Every 4-5 years.
- Data by early 1993 - Preliminary tabulations by
early 1993 - Final report by 8/93.
RESPONSIBLE OFFICES: - Health and Population
Office
INSTRUMENTS: 1.1 DHS and ONAPO Service
Statistics 1.2 ONAPO Service Statistics,
Social Marketing Sales Data
1.1 DHS, every 4-5 years; ONAPO statistics monthly
1.2 Monthly, Quarterly, Annually
1.1 - Data by early 1993 - Preliminary tabulations
by early 1993 - Final report by 8/93.
1.2 - Data available
RESPONSIBLE OFFICES:: - Health and Population Office
INSTRUMENTS: 1. la. ONAPO Service
Statistics I. 1 b. ONAPO & ARBEF
Service Statistics 2. ONAPO Service
Statistics
I. 1 a. Quarter1 y 1 . lb. Monthly, Quarterly 2. Quarterly
RESPONSIBLE OFFICES: - Health and Population
Office
INSTRUMENTS: 1.1 Population Based
Surveys, DHS 1.2 Population Based
Surveys, DHS
1.1 DHS, every 4-5 years 1.2 DHS, every 4-5 years
RESPONSIBLE OFFICES: - Health and Population
Office
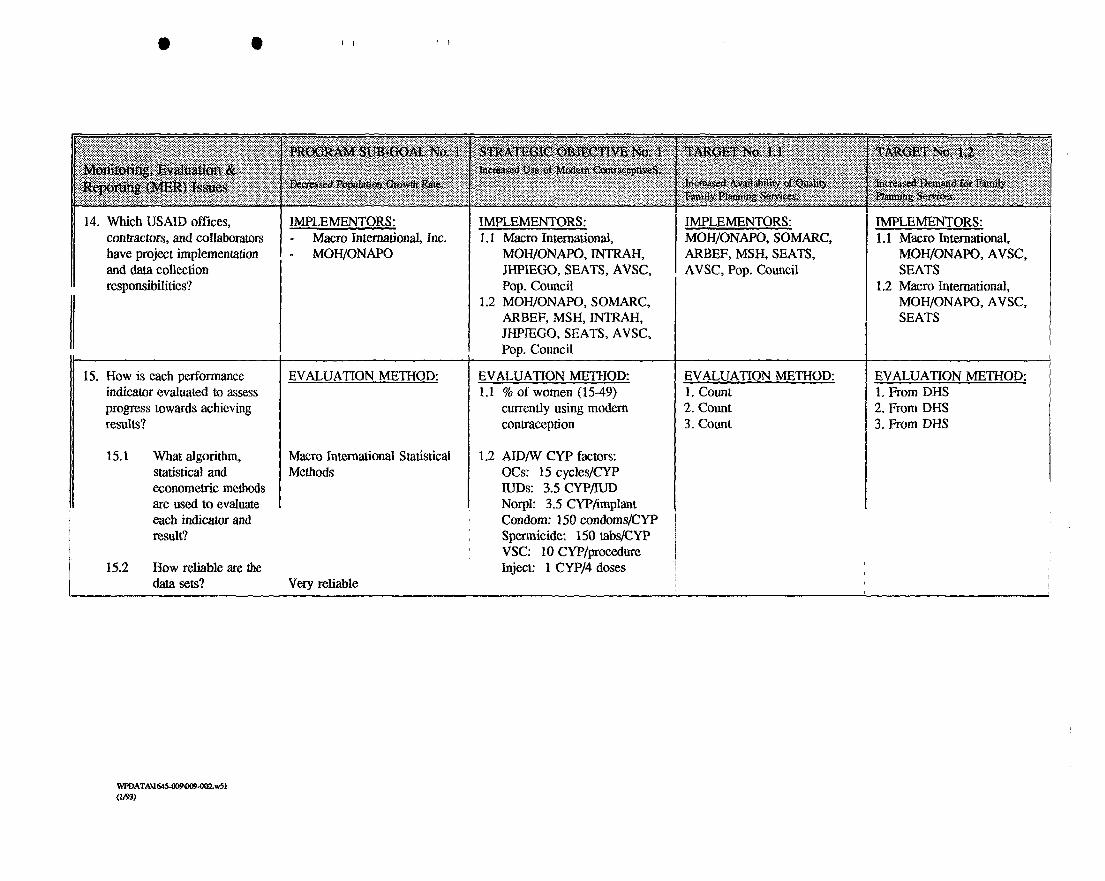
14. Which USAID offices, contractors, and colIaborators have project implementation and data collection responsibilities?
15. How is each performance indicator evaluated to assess progress towards achieving results?
15.1 What algorithm, statistical and econometric methods are used to evaluate each indicator and result?
15.2 How reliable are the data sets?
IMPLEMENTORS: - Macro International, Inc. - MOHDNAPO
EVALUATION METHOD:
Macro International Statistical Methods
Very reliable
IMPLEMENTOR S: 1.1 Macro International,
MOH/ONAPO, INTRtU-I, JHPIEGO, SEATS, AVSC, Pop. council
1.2 MOHDNAPO, SOMARC, ARBEF, MSH, INTRAH, JHPIEGO, SEATS, AVSC, Pop. Council
EVALUATION METHOD: 1.1 % of women (15-49)
currently using modem contraception
1.2 AIDW CYP factors: OCs: 15 cycles/CYP IUDs: 3.5 CYP/nJD Norpl: 3.5 CYP/implant Condom: 150 condoms1CYP Spermicide: 150 tabs/CYP VSC: 10 CYPfprocedure Inject: 1 CYPJ4 doses
IMPLEMENTORS: MOH/ONAPO, SOMARC, ARBEF, MSH, SEATS, AVSC, Pop. Council
EVALUATION METHOD 1. Count 2. Count 3. Count
IMPLEMENTORS: 1.1 Macro International,
MOH/ONAPO, AVSC, SEATS
1.2 Macro International, MOH/ONAPO, AVSC, SEATS
EVALUATION METHOD: 1. From DHS 2. From DHS 3. From DHS

16. What are the baseline data for each indicator? (use Table 7 for baseline and projected performance program targets)
16.1 What time period /year does the baseline data reflect (i.e., a point in time, a business cycle, etc.)?
16.2 What program target population does the baseline data cover?
16.3 How is each baseline data determined?
17. What are the annual projected performance targets for each performance indicator by year? (use Table 7)
17.1 How are these performance targets determined?
17.2 What critical assumptions are made when determining these performance targets?
BASELINE DATA: - 1983 National Fertility
Study - 1992 DHS (preliminary)
- Women of Reproductive Age (15-49)
EXPECTED RESULTS: 1983 = 8.5 1992 = 6.5 (preliminary) 1993 = 1994 = 1995 = 1996 = 1997 =
BASELINE DATA: 1.1 - 1992 DHS Survey
- 1991 ONAPO Service Statistics
1.2 - 1991 ONAPO Service Statistics
- 1991ARBEFSales Records
EXPECTED RESULTS: 1991 = 1992 = 1993 = 1994 = 1995 = 1996 = 1997 =
BASELINE DATA: 1 . 1 19910NAPOService
Statistics 1.lb. 1991 ONAPO &
ARBEF Service Statistics
2. 1991 ONAPO Service Statistics
EXPECTED RESULTS:
BASELINE DATA: 1.1 1992 DHS Survey 1.2 1992 DHS Survey
EXPECTED RESULTS: 1992 = 1993 = 1994 = 1995 = 1996 = 1997 =

1. What are the specific results sought? Specify the results sought by recipients of A.I.D. assistance as applicable.
Annex 3: Strategic Objective No. 2 - MER Planning Matrix
SPECIFIC RESULTS:
Accountable branches of Govt at national & local levels Broad public understanding and assimilation of democratic governance principles/practices
SPECIFIC RESULTS:
NationaVCommune level transparent accountable budget processes Effective budget process being used by -Executive bureaucracy -Natl Assembly -public interest groups NationaVCommune level govt economic/social sector policy- making based on open public dialogue
SPECIFIC RESULTS :
R 1. Restructured National and Commune level budget making, tracking and control instruments1 process
R2. S ystematicJindependent auditing of government expenditures
I SPECIFIC RESULTS:
National Assembly: R1. More efficient/
transparent internal Natl Assembly operations
R2. Improved economic and social policylbudgetary analysis
R3. Increased legislative oversight
Commune level: R4. More efficient/
transparent govt operations
R5. Greater public interest group/NGO participation in local government/governance
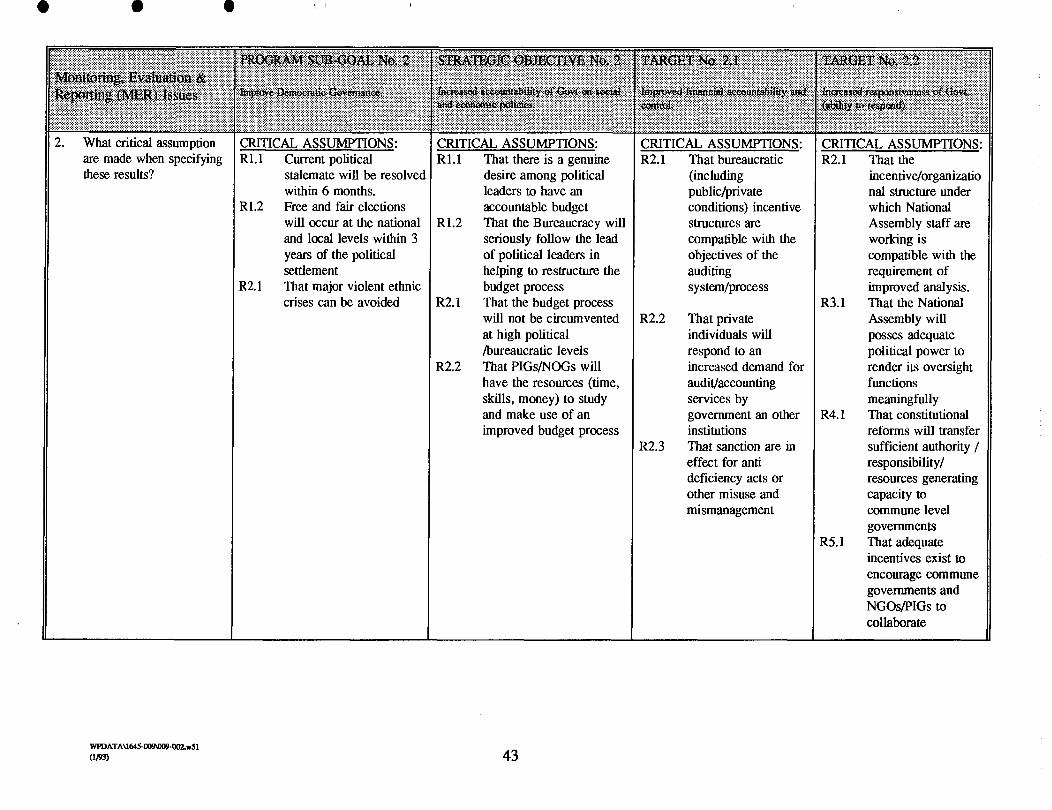
2. What critical assumption are made when specifying these results?
CRITICAL ASSUMPTIONS: Current political stalemate will be resolved within 6 months. Free and fair elections will occur at the national and local levels within 3 years of the political settlement That major violent ethnic crises can be avoided
CRITICAL ASSUMPTIONS: That there is a genuine desire among political leaders to have an accountable budget That the Bureaucracy will seriously follow the lead of political leaders in helping to restructure the budget process That the budget process will not be circumvented at high political /bureaucratic levels That PIGsjNOGs will have the resources (time, skills, money) to study and make use of an improved budget process
CRITICAL ASSUMPTIONS: That bureaucratic (including public/private conditions) incentive structures are compatible with the objectives of the auditing sy stem/process
That private individuals will respond to an increased demand for auditlaccounting services by government an other institutions That sanction are in effect for anti deficiency acts or other misuse and mismanagement
CRITICAL ASSUMPTIONS: That the incentive/organizatio nal structure under which National Assembly staff are working is compatible with the requirement of improved analysis. That the National Assembly will posses adequate political power to render its oversight functions meaningfully That constitutional reforms will transfer sufficient authority / responsibility1 resources generating capacity to commune level governments That adequate incentives exist to encourage commune governments and NGOsPIGs to collaborate

3. What specific program strategies are employed to generate each result?
3.1 Which project and non-project activities produce these results?
STRATEGIES:
ACTIVITIES/PROJECTS:
-New Democratic Initiative & Governance Project (DIG) -Africa Regional Electoral Assistance Fund (AREAF) -Democracy and Human Rights Fund (1 16e) -Democracy Support Activities by USIS
-New DIG Project -Policy Reforms in Manufacturing and Employment Project (PRIME) -PVO Support Project -Cooperative Support Project -Support for Economic Reform Project (SER) (will
STRATEGIES :
R1. -New DIG Project -Planned SER Project -Planned Budget Reform project -RIM
R2. -New DIG Project -Planned SER Project
R3. -New DIG Project
STRATEGIES
Provide resources at the national level to guide the budget restructuring process.
Provide TA, commodities and training to GOR in collaboration with the IBRD/IMF and other donors to assist in the reform of the auditing system
R1. -New DIG Project -Planned SER Project
R2. New DIG Project
STRATEGIES:
1. Provide TA, commodities and training to assist the Natl Assembly to become more functionally and substantively independent form the executive and to improve its policy/budget analysis capacity, its capacity to communicate with its constituents and its legislative and oversight capacity
R1. New DIG Project (116e activities)
R2. New DIG Project R3. New DIG project (116e
activities) R4. New DIG Project R5. -New DIG Project
-Prime Project -PVO Support Project -Cooperative Support Project
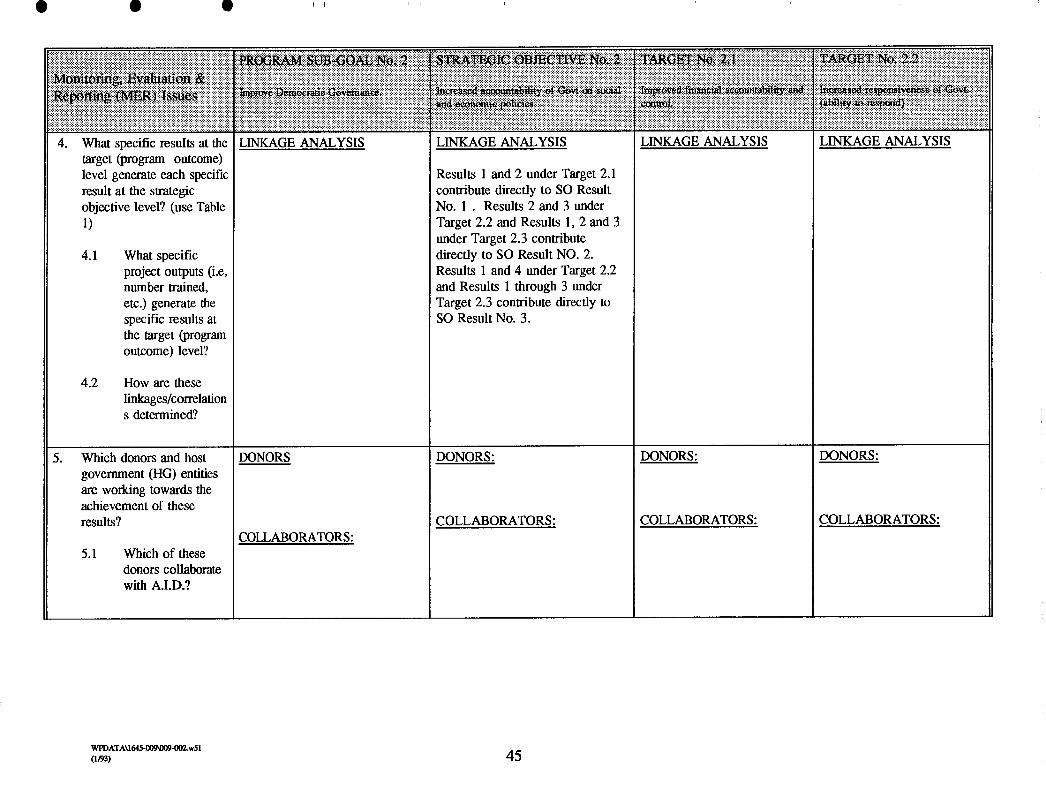
4. What specific results at the target (program outcome) level generate each specific result at the strategic objective level? (use Table 1)
4.1 What specific project outputs (i.e, number trained, etc.) generate the specific results at the target (program outcome) level?
4.2 How are these linkages/correlation s determined?
5. Which donors and host government (HG) entities are working towards the achievement of these results?
5.1 Which of these donors collaborate with A.I.D.?
LINKAGE ANALYSIS
DONORS
COLLABORATORS:
LINKAGE ANALYSIS
Results 1 and 2 under Target 2.1 conmbute directly to SO Result No. 1 . Results 2 and 3 under Target 2.2 and Results 1, 2 and 3 under Target 2.3 contribute directly to SO Result NO. 2. Results 1 and 4 under Target 2.2 and Results 1 through 3 under Target 2.3 contribute directly to SO Result No. 3.
DONORS:
COLLABORATORS:
LINKAGE ANALYSIS
DONORS:
COLLABORATORS:
LINKAGE ANALYSIS
DONORS:
COLLABORATORS:

donors, HG entities and USAID providing for achieving each result? (Use Table 2)
6.1 How much funding is provided by collaborating donors?
What % is A.I.D. funding relative to the total funding? (use Table 2)
7.1 What % of its total portfolio funding is A.I.D. allocating for achieving each result? (use Table 3 for budget analysis)

11 8. What specific performance indicators are used to measure progress towards achieving the results sought?
8.1 What is the scope of each indicator (i.e., program targel population, geographic area,
I gender, etc)
INDICATORS: I lND1cAToRS:
R 1.1 Competitive election R1.l Public documentation of system-local & natl levels budget process
R1.2 % of operating budget from R2.1 Public interest groups/ Natl local sources Assembly/media position
R2.1 Public confidence in Govt papers/analyses/public debate on budget issues
in policy formulation R3.1 Govt
A
using analysis
INDICATORS :
R 1.1 Accurate, accessible, open, budget information
R2.1 # of audits performed R2.2 # of audit
recommendations closed
- INDICATORS:
Natl Assembly: R1.l Increased number of
constituent demands addressed by Natl Assembly
R1.2 Timely publication of Natl Assembly documents
R2.1 Increased number of Natl Assembly legislative initiatives and changes to Executives initiatives enacted
Commune level:
R4.1 Number of independently funded Commune level initiatives taken
R4.2 Local citizens participating in scheduled Town Meetings
R4.3 Number of Commune- level public announcements
R5.1 Formal integration of public interest groups/NGOs in Commune governance functions

9. How are each of these indicators measured?
9.1 What specific data sets are required for measuring these - indicators?
10. How are data sets aggregated across projects and program targets to measure performance at the strategic objective level? (Use Table 4)
10.1 What are the measurement unit of each data set?
R 1.1 Data published by MININTER National Election Commission
R1.2 DIG Project MININTER
R2.1 Opinion Survey implemented by DIG
R1.l SER Project MIN F1 Documentation
R2.1 SER and DIG project staff review of official documents
R3.1 SER and DIG projects review of official and media documents
R1.l SER and DIG project official publication, media output, PIG publications
R2.1 SER Project R3.1 SER Project
R1.l DIG Project staff review of NA documents and survey of PIGSINGOs
R1.2 DIG Project - Review of NA documents
R2.1 DIG Project Review of NA documents
R4.1 DIG Project - Review of MWITER documents
R4.2 DIG Project - Review of Commune Government Documents
R4.3 DIG Project - Review of press reports (Press Center)
R5.1 DIG Project - Review of Commune Govt documents and press reports; survey of NGOs/ PIGS

instruments (i.e., data sources) are used for gathering the required data sets?
11.1 Whatisthe estimated cost of data collection & analysis for each type of data collection instrument? (use Table 5 - Data Collection & Analysis Budget)
12. How frequently are the data sets collected on each indicator? (Use Table 6 - Data Collection & Analysis Implementation Schedule)
12.1 By when should the data sets be available to users?
12.2 In what form should data sets be available to users?
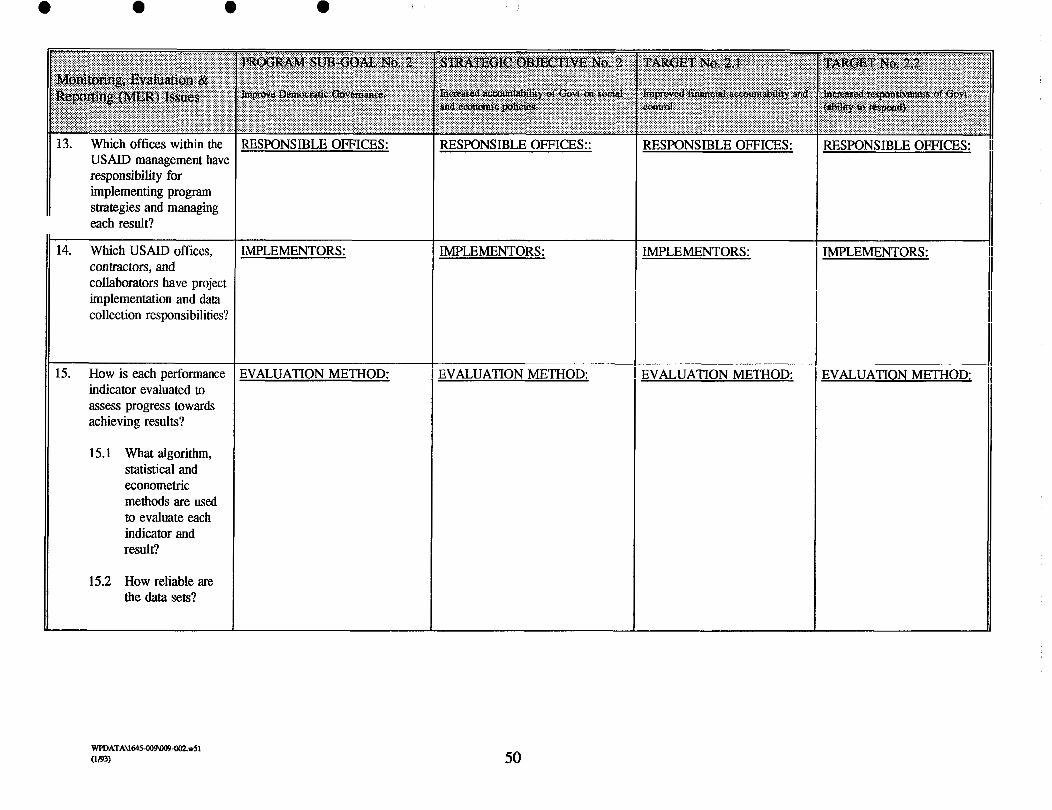
13. Which offices within the USAID management have responsibility for implementing program strategies and managing each result?
RESPONSIBLE OFFICES: RESPONSIBLE OFFICES::
14. Which USAID offices, contractors, and collaborators have project implementation and data collection responsibilities?
1) 15. How is each performance indicator evaluated to assess progress towards achieving results?
15.1 What algorithm, statistical and econometric methods are used to evaluate each indicator and result?
15.2 How reliable are the data sets?
IMPLEMENTORS:
EVALUATION METHOD:
IMPLEMENTORS:
EVALUATION METHOD:
RESPONSIBLE OFFICES:
IMPLEMENTORS:
EVALUATION METHOD:
RESPONSIBLE OFFICES:
IMPLEMENTORS :
EVALUATION METHOD:

for each indicator? (use Table 7 for baseline and projected performance program targets)
16.1 What time period /year does the baseline data reflect (i.e., a point in time, a business cycle, etc.)?
16.2 What program target population does the baseline data cover?
16.3 How is each baseline data determined?

What are the annual projected performance targets for each performance indicator by year? (use Table 7)
17.1 How are these performance targets determined?
17.2 What critical assumptions are made when determining these performance targets?
EXPECTED RESULTS: 1992 = 1993 = 1994 = 1995 = 1996 = 1997 =
EXPECTED RESULTS: 1992 = 1993 = 1994 = 1995 = 1996 = 1997 =
EXPECTED RESULTS: EXPECTED RESULTS:
1. What are the specific results sought? Specify the results sought by recipients of A.I.D. assistance as applicable.
2. What critical assumption are made when specifying these results?
SPECIFIC RESULTS:
R 1. Increased voluntary electoral turnout R2. Active, professional independent media R3, Active, independent public interest
groups/NGOs
CRITICAL ASSUMPTIONS: R1.l That election laws will be promulgated
which provide serious incentives (not coercion) for voter participation
R2.1 A new media law is promulgated with adequate guarantees re freedom of expression
R3.1 That constitutional and supporting laws/regulations provide adequate incentives/protection regarding formation, operation and dissolution of economic and social interest groups.
3. Which project and non-project activities produce these results?
3.1 What specific program strategies are employed to generate each result?
STRATEGIES:
R1. Provide TA to assess the compatibility of existing election rules and procedures, recommend changes where needed, provide training to key participants in the election process and provide observers for actual elections.
R2. Provide TA/training/commodities and financial support for the establishment of a Rwandan Press Center with the institutional capacity to develop the business management and journalism skills to fulfill the critical role of the press in a democratic society.
R3. Provide TA/training/commodities and financial support for the establishment of a Center for Civic Action and Democratic Initiatives which would help develop the capacity of NGOsIPIGs to effectively demand good governance from the public sector at the national and local level and supply governance functions at appropriate levels.
ACTIVITJES/PROJECTS: R1. New DIG Project
(1 16e, AREAF, USIS activities) R2. New DIG Project
(1 16e, USIS activities) R3. -New DIG Project
-Prime Project -PVO Support Project -Cooperative Support Project (1 16e activities)
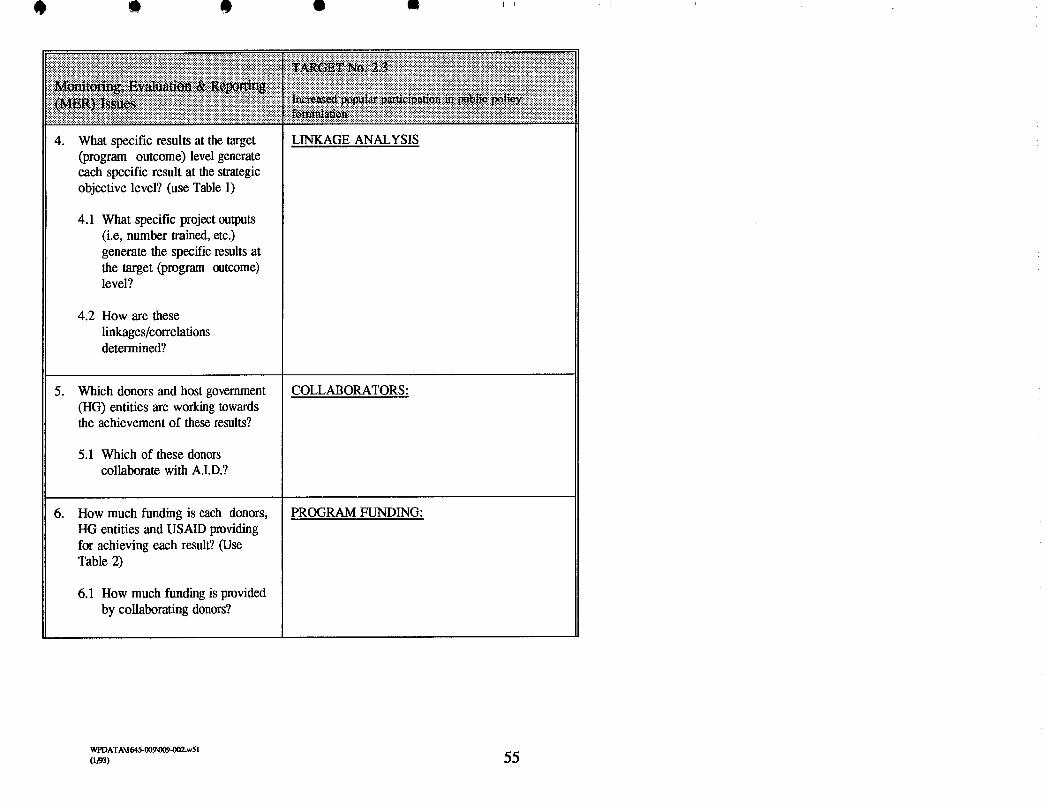
4. What specific results at the target (program outcome) level generate each specific result at the strategic objective level? (use Table 1)
4.1 What specific project outputs (i.e, number trained, etc.) generate the specific results at the target (program outcome) level?
4.2 How are these linkages/correlations determined?
5. Which donors and host government (HG) entities are working towards the achievement of these results?
5.1 Which of these donors collaborate with A.I.D.?
6. How much funding is each donors, HG entities and USAID providing for achieving each result? (Use Table 2)
6.1 How much funding is provided by collaborating donors?
LINKAGE ANALYSIS
COLLABORATORS:
PROGRAM FUNDING:

7. What % is A.I.D. funding relative to the total funding? (use Table 2)
7.1 What % of its total portfolio funding is A.I.D. allocating for achieving each result? (use Table 3 for budget analysis)
8. What specific performance indicators are used to measure progress towards achieving the results sought?
8.1 What is the scope of each indicator (i.e., program target population, geographic area, gender, etc)
- --
9. How are each of these indicatom measured?
9.1 What specific data sets are required for measuring these indicators?
INDICATORS :
R1.l Absence of coercive measures forcing participation
R1.2 % of eligible voters voting
R2.1 Diversity of opinion reaching wider national audience - No. of newspapers & radio/TV stations - Total circulation & broadcasts outside Kigali
R2.2 Number of trained journalists
R3.1 Numberlrange of issues treated in public fora by public interest groups1NGOs
R3.2 Membership in public interest groups/NGOs
R1.l Exit Poll Surveys to CCOAIB Reports from member NGO
R1.2 Voting Records R2.1 From Ring Press Center (DIG) R2.2 DIG Press Center R3.1 NGO Center CCOAIB R3.2 Press CenterICCOAIDlNGOs; Ministry of
Justice Registration record; USAID surveys of selected business associations
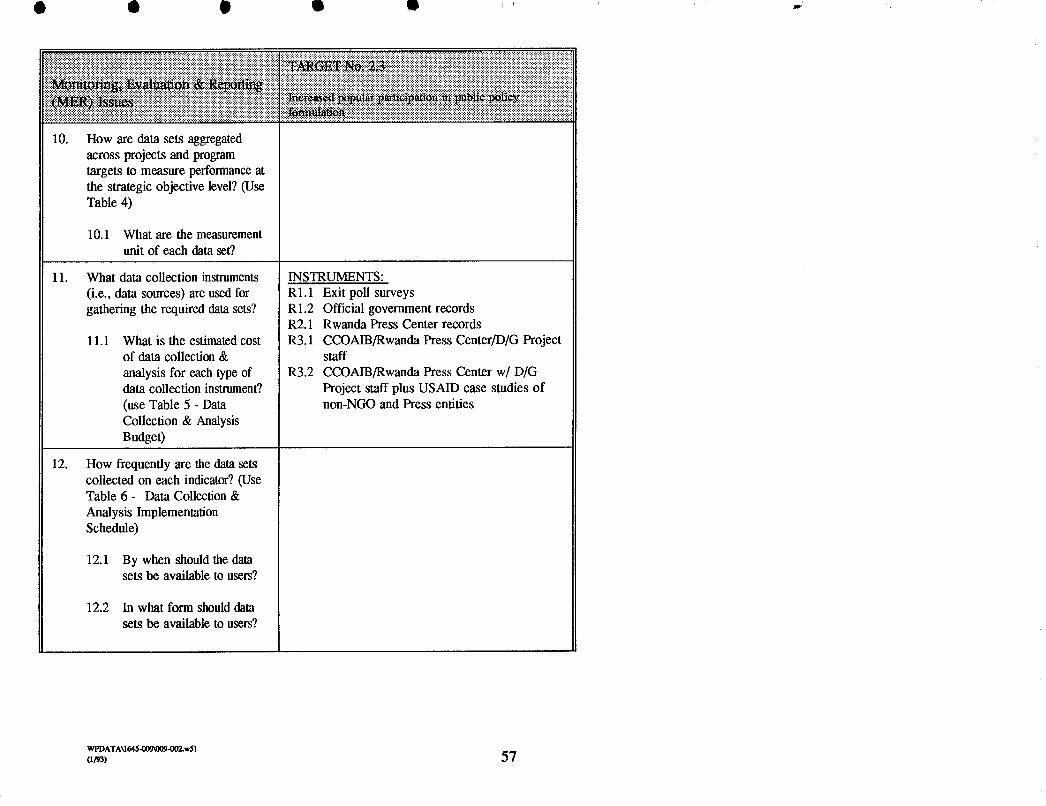
10. How are data sets aggregated across projects and program targets to measure performance at the strategic objective level? (Use Table 4)
10.1 What are the measurement unit of each data set?
11. What data collection instruments (i.e., data sources) are used for gathering the required data sets?
1 1.1 What is the estimated cost of data collection & analysis for each type of data collection instrument? (use Table 5 - Data Collection & Analysis Budget)
12. How frequently are the data sets collected on each indicator? (Use Table 6 - Data Collection & Analysis Implementation Schedule)
12.1 By when should the data sets be available to users?
12.2 In what form should data sets be available to users?
INSTRUMENTS: R 1.1 Exit poll surveys R 1.2 Official government records R2.1 Rwanda Press Center records R3.1 CCOAIB/Rwanda Press CenterPIG Project
staff R3.2 CCOAIBJRwanda Press Center w/ DIG
Project staff plus USAID case studies of non-NGO and Press entities
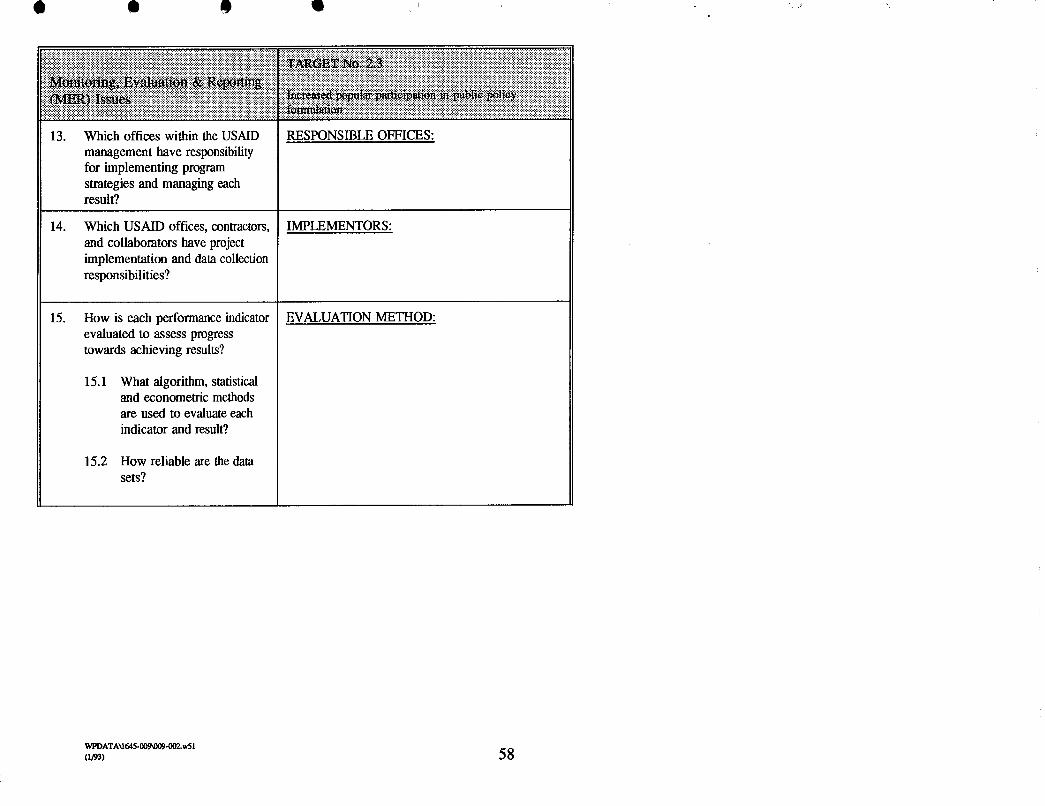
13. Which offices within the USAID management have responsibility for implementing program strategies and managing each result?
14. Which USAID offices, contractors, and collaborators have project implementation and data collection responsibilities?
How is each performance indicator evaluated to assess progress towards achieving results?
15.1 What algorithm, statistical and econometric methods are used to evaluate each indicator and result?
15.2 How reliable are the data sets?
RESPONSIBLE OFFICES:
IMPLEMENTORS:
EVALUATION METHOD:
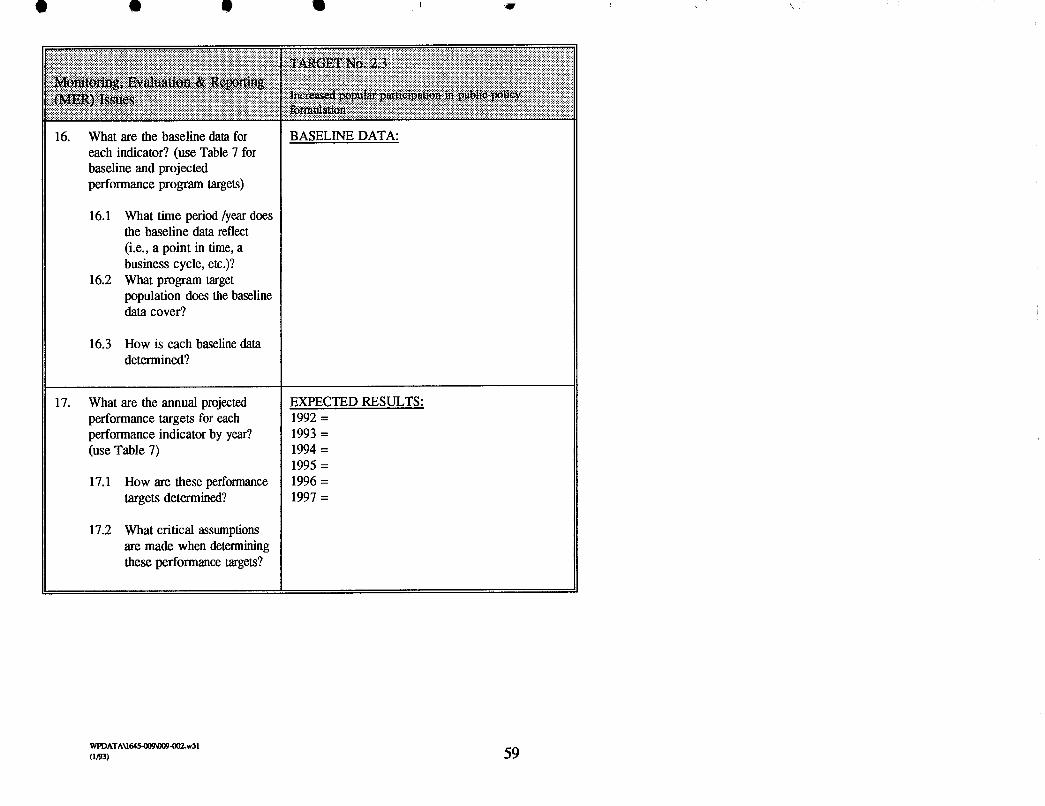
16. What are the baseline data for each indicator? (use Table 7 for baseline and projected performance program targets)
16.1 What time period /year does the baseline data reflect (i.e., a point in time, a business cycle, etc.)?
16.2 What program target population does the baseline data cover?
16.3 How is each baseline data determined?
17. What are the annual projected performance targets for each performance indicator by year? (use Table 7)
17.1 How are these performance targets determined?
17.2 What critical assumptions are made when determining these performance targets?
BASELINE DATA:
EXPECTED RESULTS: 1992 = 1993 = 1994 = 1995 = 1996 = 1997 =
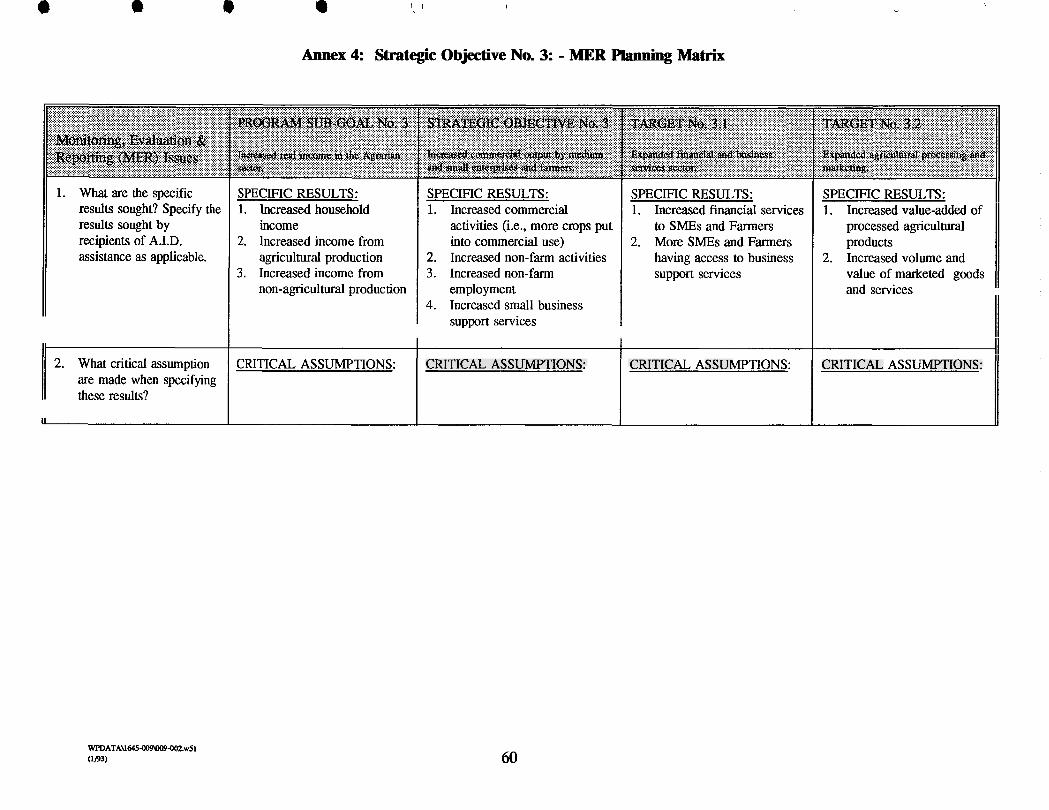
0 I I I
Annex 4: Strategic Objective No. 3: - MER Planning Matrix
1. What are the specific results sought? Specify the results sought by recipients of A.I.D. assistance as applicable.
2. What critical assumption are made when specifying these results?
SPECIFIC RESULTS: 1. Increased household
income 2. Increased income from
agricultural production 3. Increased income from
non-agricultural production
CRITICAL ASSUMPTIONS:
SPECIFIC RESULTS: 1. Increased commercial
activities (i.e., more crops put into commercial use)
2. Increased non-farm activities 3. Increased non-farm
employment 4. Increased small business
support services
SPECIFIC RESULTS: 1. Increased financial services
to SMEs and Farmers 2. More SMEs and Farmers
having access to business support services
CRITICAL ASSUMPTIONS: CRITICAL ASSUMPTIONS:
SPECIFIC RESULTS: 1. Increased value-added of
processed agricultural products
2. Increased volume and value of marketed goods and services
CRITICAL ASSUMPTIONS:
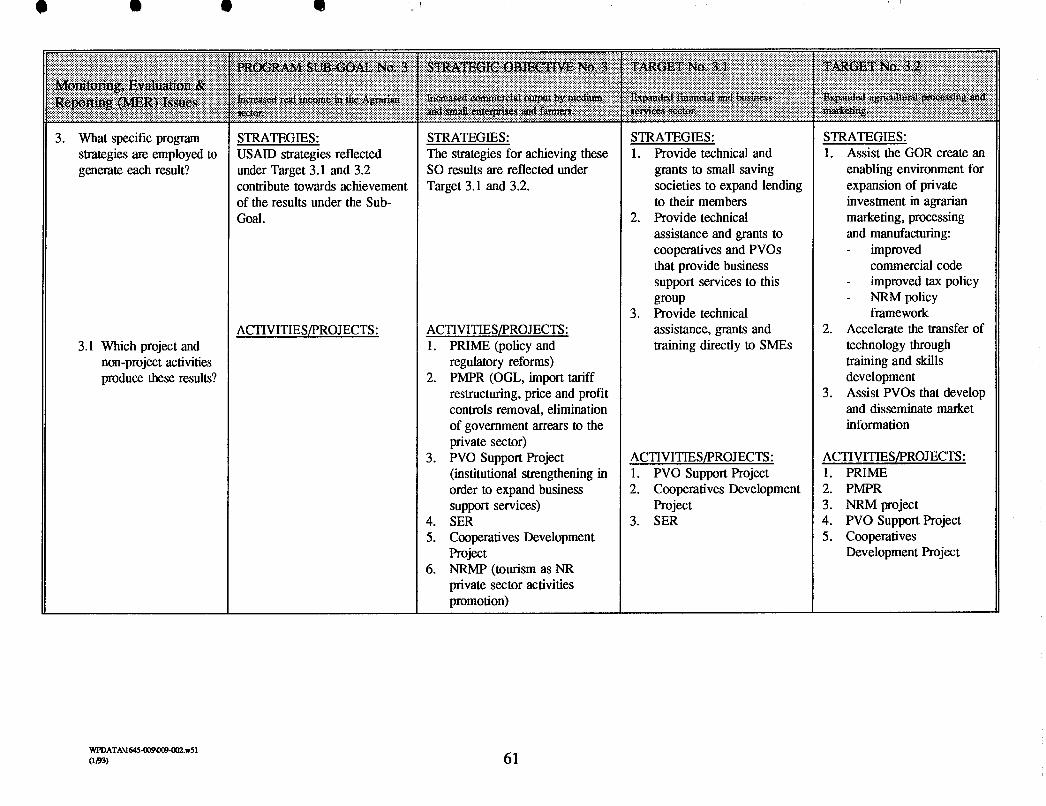
3. What specific program strategies are employed to generate each result?
3.1 Which project and non-project activities produce these results?
STRATEGIES: USAID strategies reflected under Target 3.1 and 3.2 contribute towards achievement of the results under the Sub- Goal.
STRATEGIES: The strategies for achieving these SO results are reflected under Target 3.1 and 3.2.
ACTIVITIES/PROJECTS: 1. PRIME (policy and
regulatory reforms) 2. PMPR (OGL, import tariff
restructuring, price and profit controls removal, elimination of government arrears to the private sector)
3. PVO Support Project (institutional strengthening in order to expand business support services)
4. SER 5. Cooperatives Development
Project 6. NRMP (tourism as NR
private sector activities promotion)
STRATEGIES: Provide technical and grants to small saving societies to expand lending to their members Provide technical assistance and grants to cooperatives and PVOs that provide business support services to this group Provide technical assistance, grants and training directly to SMEs
ACTIVITIESIPROJECTS: 1. PVO Support Project 2. Cooperatives Development
Project 3. SER
STRATEGIES: Assist the GOR create an enabling environment for expansion of private investment in agrarian marketing, processing and manufacturing: - improved
commercial code - improved tax policy - NRM policy
framework Accelerate the transfer of technology through training and skills development Assist PVOs that develop and disseminate market information
ACTIVITIES/PROJECTS : 1. PRIME 2. PMPR 3. NRM project 4. PVO Support Project 5. Cooperatives
Development Project

II 4. What specific results at the target (program outcome) level generate each specific result at the strategic objective level? (use Table 1)
4.1 What specific project outputs (i.e, number trained, etc.) generate the specific results at the target (program outcome) level?
LINKAGE ANALYSIS LINKAGE ANALYSIS
Result 1 (increased financial services) under Target 3.1 directly contributes to increased commercial activities. Result 2 (more access to business services) under Target 3.1 directly contributes towards the increase in small business support services. Result 1 (Increased value-added processing) and Result 2 (increased value and volume of marketed goods and services) under Target 3.2 directly contribute to the increase in off- farm activities including off-farm employment.
LINKAGE ANALYSIS
Direct USAID interventions that augment the availability of credit to SMEs (such as grants); and the provisioning of technical assistance and training to increase the availability and accessibility of business support services to SMEs directly contribute to the achievement of the results under this Target.
LINKAGE ANALYSIS
Specific USAID technical assistance to the GOR that create an enabling policy and regulatory environment; and the direct USAID will provide technical assistance and training to NGOs, PVOs, and individual firms to enhance SMEs ag processing and marketing capabilities directly contribute to the achievement of the results under this Target.

5. Which donors and host government (HG) entities are working towards the achievement of these results?
5.1 Which of these donors collaborate with A.I.D.?
6. How much funding is each donors, HG entities and USAID providing for achieving each result? (Use Table 2)
, 6.1 How much funding is provided by collaborating donors?
DONORS:
COLLABORATORS:
PROGRAM FUNDING:
DONORS: French, Belgian, WB, IMF, UNDP, the swiss, CIDA, GTZ Minisby of Plan, MINIMART, r n I C O M
COLLABORATORS: 1. the French, Belgians, WB,
IMF on structural adjustment and macro policy reforms
2. WB on private sector development including training and credit mechanisms for medium and large enterprises
3. WB on privatization 4. the Swiss on cooperatives
development
PROGRAM FUNDING:
DONORS:
COLLABORATORS:
PROGRAM FUNDING:
DONORS:
COLLABORATORS:
PROGRAM FUNDING:

7. What % is A.I.D. funding relative to the total funding? (use Table 2)
7.1 What % of its total portfolio funding is A.I.D. allocating for achieving each result? (use Table 3 for budget analysis)
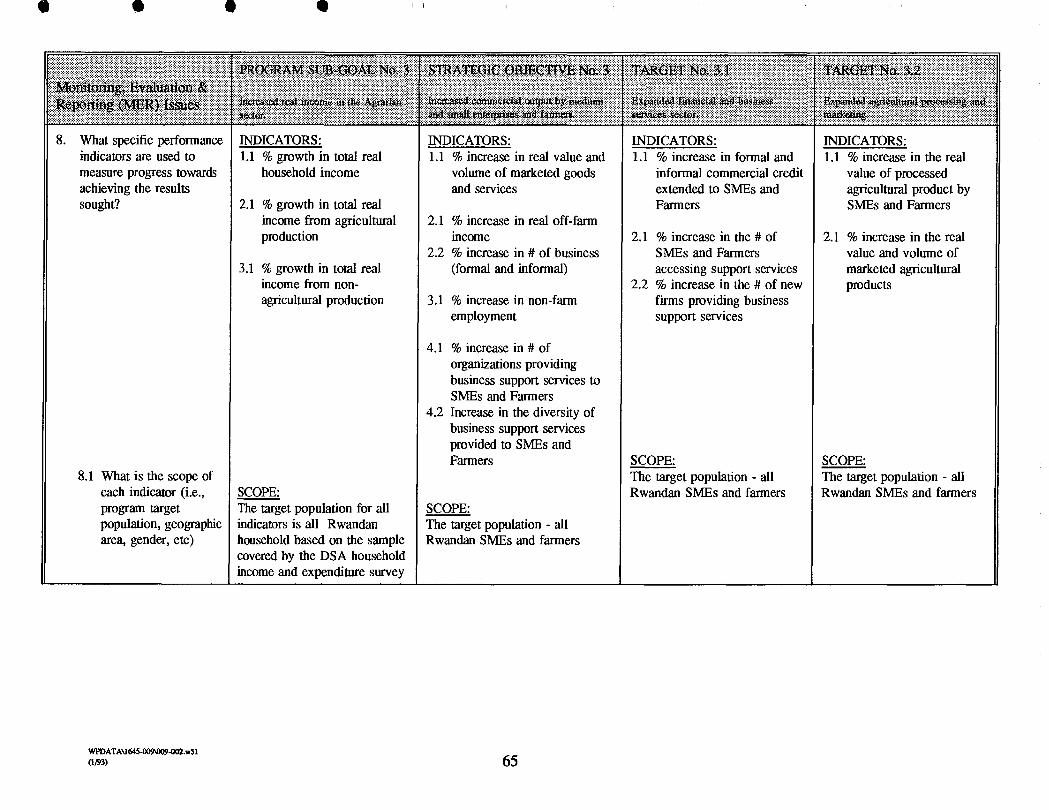
8. What specific performance indicators are used to measure progress towards achieving the results sought?
8.1 What is the scope of each indicator (i.e., program target population, geographic area, gender, etc)
INDICATORS: 1.1 % growth in total real
household income
2.1 % growth in total real income from agricultural production
3.1 % growth in total real income from non- agricultural production
SCOPE: The target population for all indicators is all Rwandan household based on the sample covered by the DSA household income and expenditure survey
INDICATORS: 1.1 % increase in real value and
volume of marketed goods and services
2.1 % increase in real off-farm income
2.2 % increase in # of business (formal and informal)
3.1 % increase in non-farm employment
4.1 % increase in # of organizations providing business support services to SMEs and Farmers
4.2 Increase in the diversity of business support services provided to SMEs and Farmers
SCOPE: The target population - all Rwandan SMEs and farmers
INDICATORS: 1.1 % increase in formal and
informal commercial credit extended to SMEs and Farmers
2.1 % increase in the # of SMEs and Farmers accessing support services
2.2 % increase in the # of new firms providing business support services
SCOPE: The target population - all Rwandan SMEs and farmers
INDICATORS: 1.1 % increase in the real
value of processed agricultural product by SMEs and Farmers
2.1 % increase in the real value and volume of marketed agricultural products
SCOPE: The target population - all Rwandan SMEs and farmers

3. What specific program strategies are employed to generate each result?
3.1 Which project and non-project activities produce these results?
STRATEGIES: USAID strategies reflected under Target 3.1 and 3.2 contribute towards achievement of the results under the Sub- Goal.
STRATEGIES: The strategies for achieving these SO results are reflected under Target 3.1 and 3.2.
ACTIVITIES/PROJECTS: 1. PRIME (policy and
regulatory reforms) 2. PMPR (OGL, import tariff
restructuring, price and profit controls removal, elimination of government arrears to the private sector)
3. PVO Support Project (institutional strengthening in order to expand business support services)
4. SER 5. Cooperatives Development
Project 6. NRMP (tourism as NR
private sector activities promotion)
STRATEGIES: Provide technical and grants to small saving societies to expand lending to their members Provide technical assistance and grants to cooperatives and PVOs that provide business support services to this group Provide technical assistance, grants and training directly to SMEs
ACTIVITIESIPROJECTS: 1. PVO Support Project 2. Cooperatives Development
Project 3. SER
STRATEGIES: Assist the GOR create an enabling environment for expansion of private investment in agrarian marketing, processing and manufacturing: - improved
commercial code - improved tax policy - NRM policy
framework Accelerate the transfer of technology through training and skills development Assist PVOs that develop and disseminate market information
ACTIVITIES/PROJECTS : 1. PRIME 2. PMPR 3. NRM project 4. PVO Support Project 5. Cooperatives
Development Project

II 4. What specific results at the target (program outcome) level generate each specific result at the strategic objective level? (use Table 1)
4.1 What specific project outputs (i.e, number trained, etc.) generate the specific results at the target (program outcome) level?
LINKAGE ANALYSIS LINKAGE ANALYSIS
Result 1 (increased financial services) under Target 3.1 directly contributes to increased commercial activities. Result 2 (more access to business services) under Target 3.1 directly contributes towards the increase in small business support services. Result 1 (Increased value-added processing) and Result 2 (increased value and volume of marketed goods and services) under Target 3.2 directly contribute to the increase in off- farm activities including off-farm employment.
LINKAGE ANALYSIS
Direct USAID interventions that augment the availability of credit to SMEs (such as grants); and the provisioning of technical assistance and training to increase the availability and accessibility of business support services to SMEs directly contribute to the achievement of the results under this Target.
LINKAGE ANALYSIS
Specific USAID technical assistance to the GOR that create an enabling policy and regulatory environment; and the direct USAID will provide technical assistance and training to NGOs, PVOs, and individual firms to enhance SMEs ag processing and marketing capabilities directly contribute to the achievement of the results under this Target.
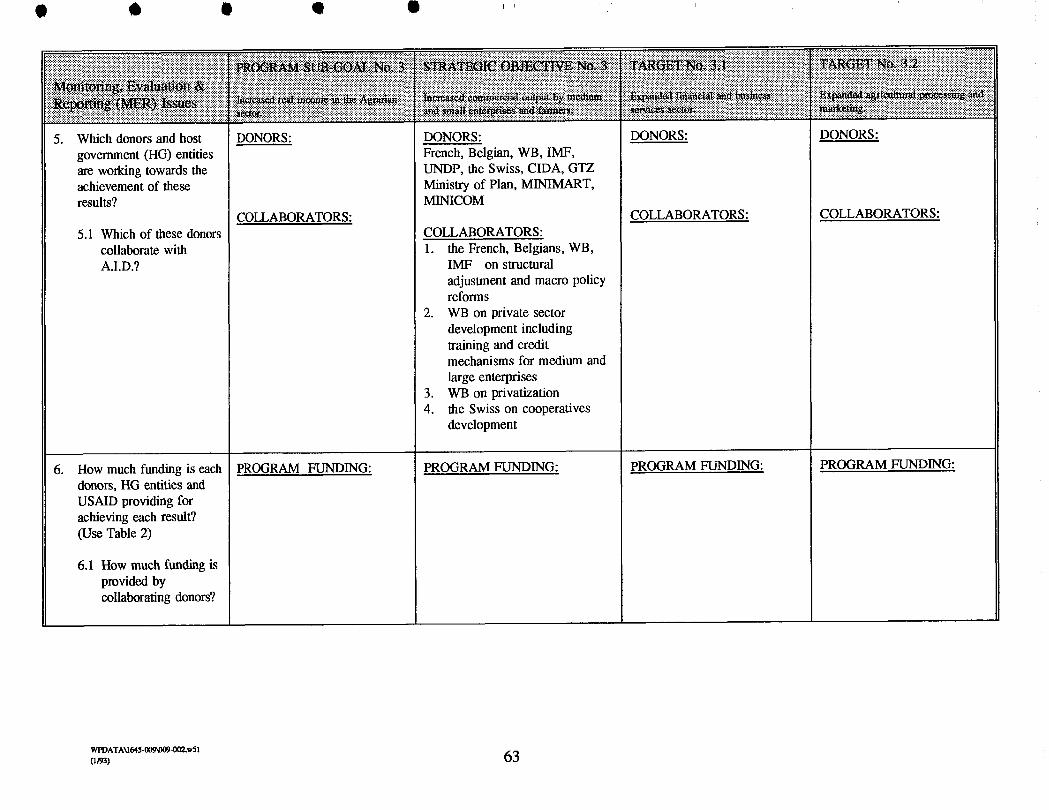
5. Which donors and host government (HG) entities are working towards the achievement of these results?
5.1 Which of these donors collaborate with A.I.D.?
6. How much funding is each donors, HG entities and USAID providing for achieving each result? (Use Table 2)
, 6.1 How much funding is provided by collaborating donors?
DONORS:
COLLABORATORS:
PROGRAM FUNDING:
DONORS: French, Belgian, WB, IMF, UNDP, the swiss, CIDA, GTZ Minisby of Plan, MINIMART, r n I C O M
COLLABORATORS: 1. the French, Belgians, WB,
IMF on structural adjustment and macro policy reforms
2. WB on private sector development including training and credit mechanisms for medium and large enterprises
3. WB on privatization 4. the Swiss on cooperatives
development
PROGRAM FUNDING:
DONORS:
COLLABORATORS:
PROGRAM FUNDING:
DONORS:
COLLABORATORS:
PROGRAM FUNDING:
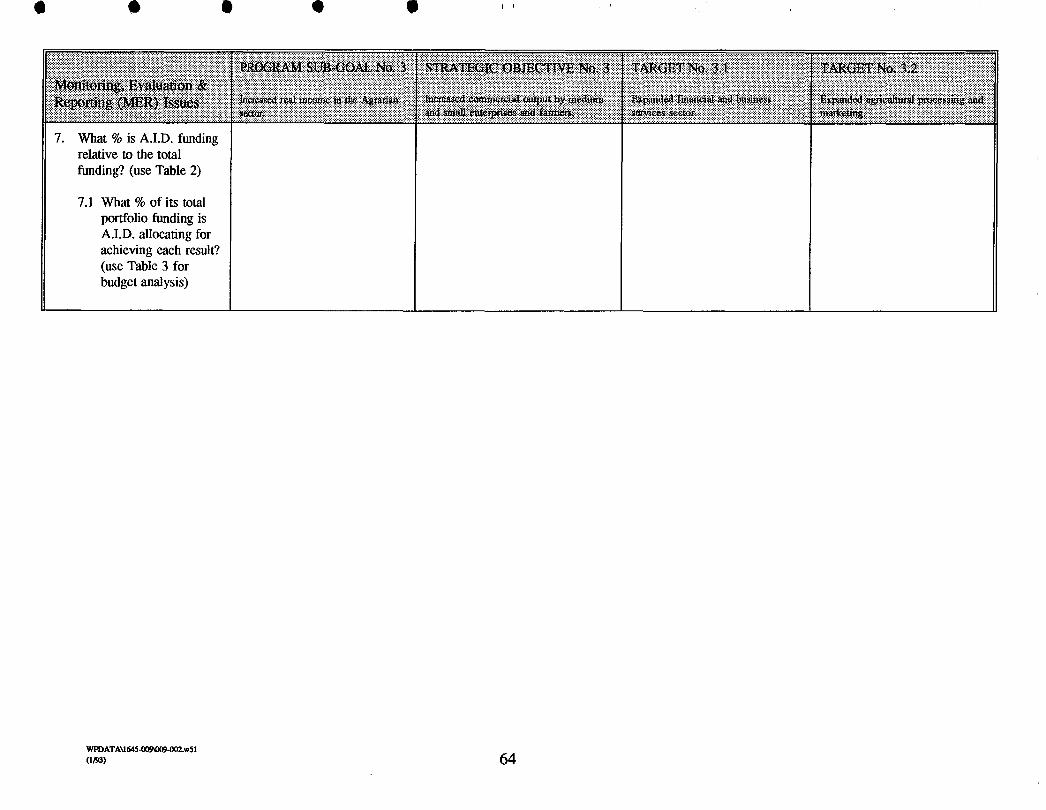
7. What % is A.I.D. funding relative to the total funding? (use Table 2)
7.1 What % of its total portfolio funding is A.I.D. allocating for achieving each result? (use Table 3 for budget analysis)

8. What specific performance indicators are used to measure progress towards achieving the results sought?
8.1 What is the scope of each indicator (i.e., program target population, geographic area, gender, etc)
INDICATORS: 1.1 % growth in total real
household income
2.1 % growth in total real income from agricultural production
3.1 % growth in total real income from non- agricultural production
SCOPE: The target population for all indicators is all Rwandan household based on the sample covered by the DSA household income and expenditure survey
INDICATORS: 1.1 % increase in real value and
volume of marketed goods and services
2.1 % increase in real off-farm income
2.2 % increase in # of business (formal and informal)
3.1 % increase in non-farm employment
4.1 % increase in # of organizations providing business support services to SMEs and Farmers
4.2 Increase in the diversity of business support services provided to SMEs and Farmers
SCOPE: The target population - all Rwandan SMEs and farmers
INDICATORS: 1.1 % increase in formal and
informal commercial credit extended to SMEs and Farmers
2.1 % increase in the # of SMEs and Farmers accessing support services
2.2 % increase in the # of new firms providing business support services
SCOPE: The target population - all Rwandan SMEs and farmers
INDICATORS: 1.1 % increase in the real
value of processed agricultural product by SMEs and Farmers
2.1 % increase in the real value and volume of marketed agricultural products
SCOPE: The target population - all Rwandan SMEs and farmers

11 9. How are each of these indicators measured?
9.1 What specific data sets are required for measuring these indicators?
MEASUREMENT: 1.1 Household income is
measured as the total income derived from: (a) agricultural production (farm output times market price); (b) income from off-farm employment; and (c) income fiom non-farm activities including ag processing
1.2 Income from agricultural production is measured by estimating farm output by crop and multiplying by prevailing market price of each crop
1.3 Income from non- agricultural production is measured by the salaries and wages received from employment to other farmers and non-farm employers
DATA SETS: 1.1 Farm output by crop;
market price by crop; consumer price index (i.e., inflation rate); off-farm salaries and wages; volume of processed goods by category; price of processed goods by category
MEASUREMENT: 1.1 Value of marketed goods is
calculated based on the volume of goods sold times the market price adjusted for inflation
2.1 Off-farm income based on salary and wages received from employment to other farmers and businesses
3.1 Non-farm employment is measured as employment on- farm and off-farm that exclude the production of crops
DATA SETS: 1.1 volume of marketed goods by
crop or category; price per unit of marketed goods (both crops and processed goods)
2.1 Income fmm salary and wages
2.2 # of new businesses
MEASUREMENT: 1.1 For the formal sector
commercial credit is measured as loans given to SMEs. For the informal sector commercial credit is measured through a special survey
2.1 A special survey will be used to estimate the number of SMEs and individuals that accessed support services
2.2 Special study will be used to estimate new business formations
DATA SETS: 1.1 Formal and informal sector
credit to SMEs 2.1 # of SMEs and individuals
accessing business support services
2.2 # of new businesses
MEASUREMENT: 1.1 Processed agricultural
products will be estimated using a special survey
2.1 Value and volume of marketed goods will be estimated using a special survey
DATA SETS: 1.1 Value and volume of
processed goods by crop/category
2.1 Value and volume of marketed goods by crop/category

9.2 What are the measurement units of each data set?
10. How are data sets aggregated across projects and program targets to measure performance at the strategic objective level? (Use Table 4)
1.2 Farm output by crop; market price by crop; inflation rate
1.3 Off-farm salaries and wages; inflation rate
MEASUREMENT UNIT: Income and price expressed in Rwanda Francs (RF); farm output expressed in metric tons; non-farm output measured either as number of items or volume (liters, tons, kilograms, etc); inflation rate expressed as a %
3.1 # of farmers employed away from their own farms
4.1 # of organizations providing business support services including credit
4.2 types of business support services
MEASUREMENT UNIT: Income and price expressed in Rwanda Francs (RF); farm output expressed in metric tons; non- farm output measured either as number of items or volume (liters, tons, kilograms, etc); inflation rate expressed as a %
MEASUREMENT UNIT: Credit expressed in Rwandan Franc (RF);
MEASUREMENT UNIT: Value in RF and volume in tons.

1 1. What data collection instruments (i.e., data sources) are used for gathering the required data sets?
11.1 What is the estimated cost of data collection & analysis for each type of data collection instrument? (use Table 5 - Data Collection & Analysis Budget)
INSTRUMENTS: 1.1 DSA Household Survey
2.1 DSA Household Survey
3.1 DSA Household Survey
COST:
INSTRUMENTS: 1.1 DSA Household Survey
2.1 DSA Household Survey 2.2 Special SME Survey
3.1 DSA Household Survey
4.1 Special SME Survey 4.2 Special SME Survey
COST:
INSTRUMENTS: 1.1 Special SME Survey
2.1 Special SME Survey 2.2 Special SME Survey
INSTRUMENTS: 1.1 Special SME Survey
2.1 Special SME Survey
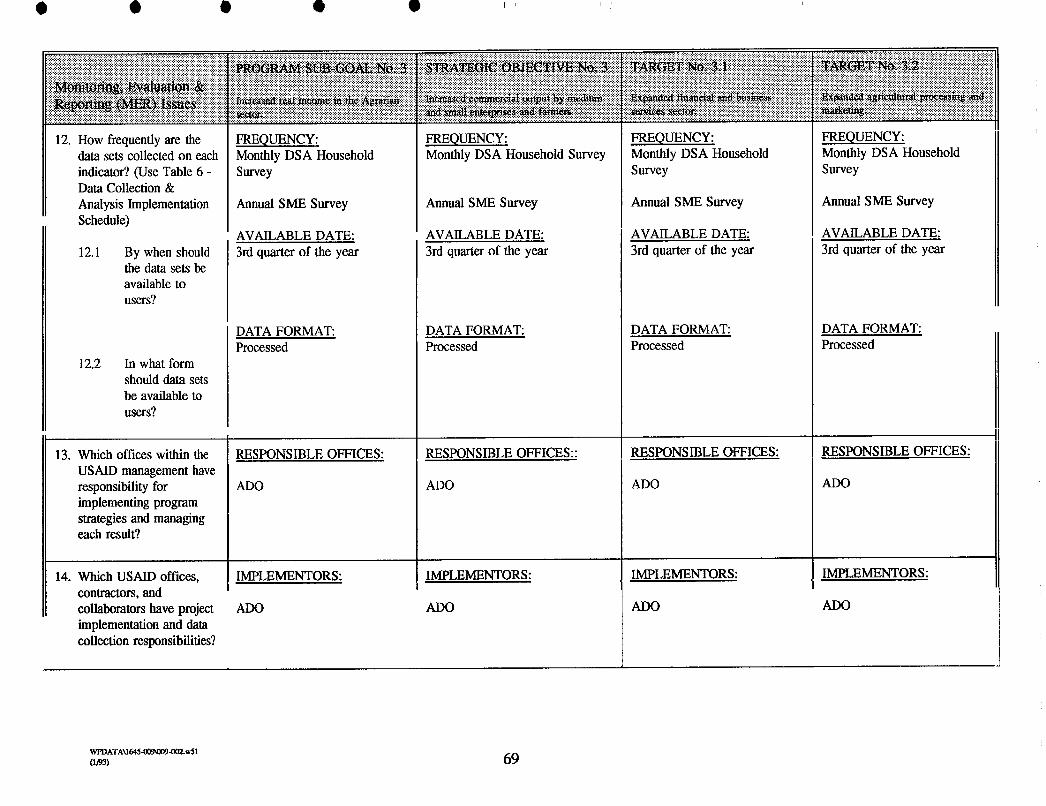
12. How frequently are the data sets collected on each indicator? (Use Table 6 - Data Collection & Analysis Implementation Schedule)
By when should the data sets be available to users?
In what form should data sets be available to users?
13. Which offices within the USAID management have responsibility for implementing program strategies and managing each result?
14. Which USAID offices, contractors, and collaborators have project implementation and data collection responsibilities?
FREQUENCY: Monthly DSA Household Survey
Annual SME Survey
AVAILABLE DATE: 3rd quarter of the year
DATA FORMAT: Processed
RESPONSIBLE OFFICES:
ADO
IMPLEMENTORS:
ADO
FREQUENCY: Monthly DSA Household Survey
Annual SME Survey
AVAILABLE DATE: 3rd quarter of the year
DATA FORMAT: Processed
RESPONSIBLE OFFICES::
ADO
IMPLEMENTORS:
ADO
FREQUENCY: Monthly DSA Household Survey
Annual SME Survey
AVAILABLE DATE: 3rd quarter of the year
DATA FORMAT: Processed
RESPONSIBLE OFFICES:
ADO
IMPLEMENTORS:
ADO
FREQUENCY: Monthly DSA Household Survey
Annual SME Survey
AVAILABLE DATE: 3rd quarter of the year
DATA FORMAT: Processed
RESPONSIBLE OFFICES:
ADO
IMPLEMENTORS:
ADO
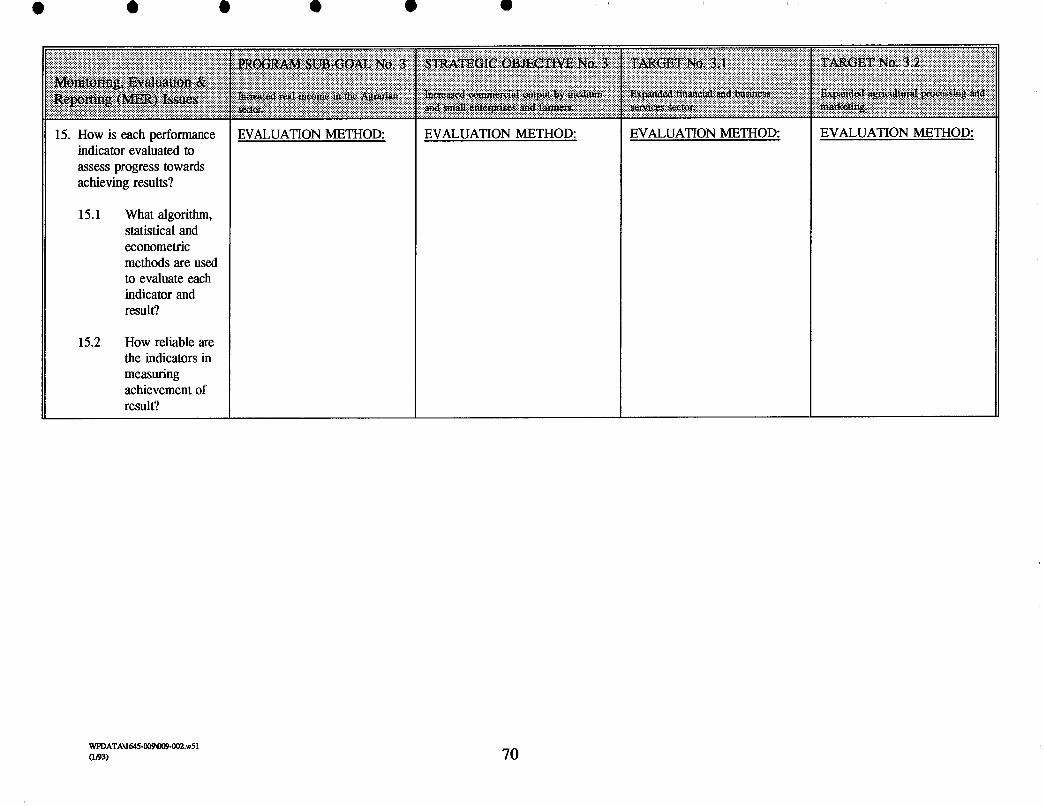
indicator evaluated to assess progress towards achieving results?
15.1 What algorithm, statistical and econometric methods are used to evaluate each indicator and result?
15.2 How reliable are the indicators in measuring achievement of result?

for each indicator? (use Table 7 for baseline and projected performance program targets)
16.1 What time period /year does the baseline data reflect (i.e., a point in time, a business cycle, etc.)?
16.2 What program target population does the baseline data cover?
16.3 How is each baseline data determined?

17. What are the annual projected performance targets for each performance indicator by year? (use Table 7)
17.1 How are these performance targets determined?
17.2 Whatcritical assumptions are made when determining these performance targets?
EXPECTED RESULTS: 1992 = 1993 = 1994 = 1995 = 1996 =
EXPECTED RESULTS: 1992 = 1993 = 1994 = 1995 = 1996 =
EXPECTED RESULTS: 1992 = 1993 = 1994 = 1995 = 1996 =
EXPECTED RESULTS: 1992 = 1993 = 1994 = 1995 = 1996 =
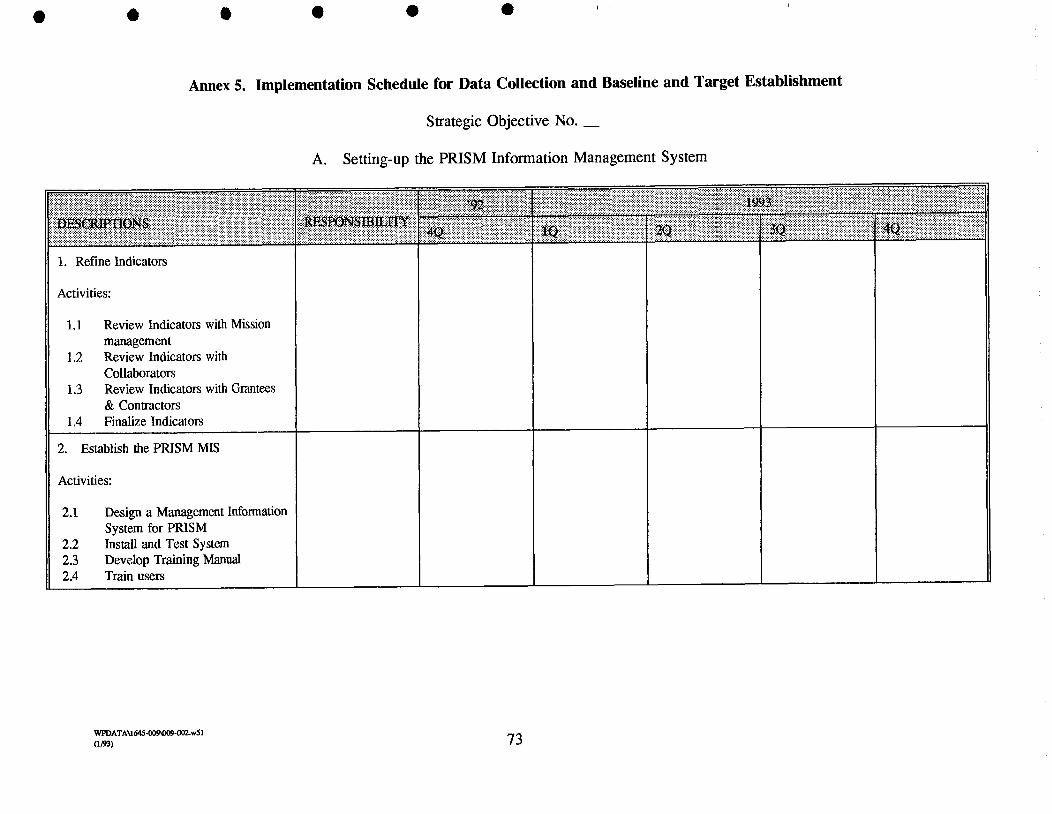
11 1. Refine Indicators
II Activities:
Annex 5, Implementation Schedule for Data Collection and Baseline and Target Establishment
Strategic Objective No. -
A. Setting-up the PRISM Information Management System
1 .I Review Indicators with Mission management
1.2 Review Indicators with Collaborators
1.3 Review Indicators with Grantees & Contractors
1.4 Finalize Indicators
2. Establish the PRISM MIS
II Activities:
2.1 Design a Management Information System for PRISM
2.2 Install and Test System 2.3 Develop Training Manual 2.4 Train users


5. Collect Data
Activities
5.1 Data Collection (specify who does collection)
5.2 Data compilation (specify who does the compilation)
5.3 Data Validation (specify who does the validation)
5.4 Data Dissemination for use by Specific Offices (specify who gets what data by when)
6. Establish Baseline and Set Performance Targets
Activities:
6.1 Define Methodology for Establish the Baseline for each Indicator
6.2 Specify the Reference Period and Target Population for each Indicator
6.3 Establish the Baseline Data for each Indicator
6.4 Define Methodology for Establishing Performance Targets
6.5 Establish Performance Targets for each Indicator
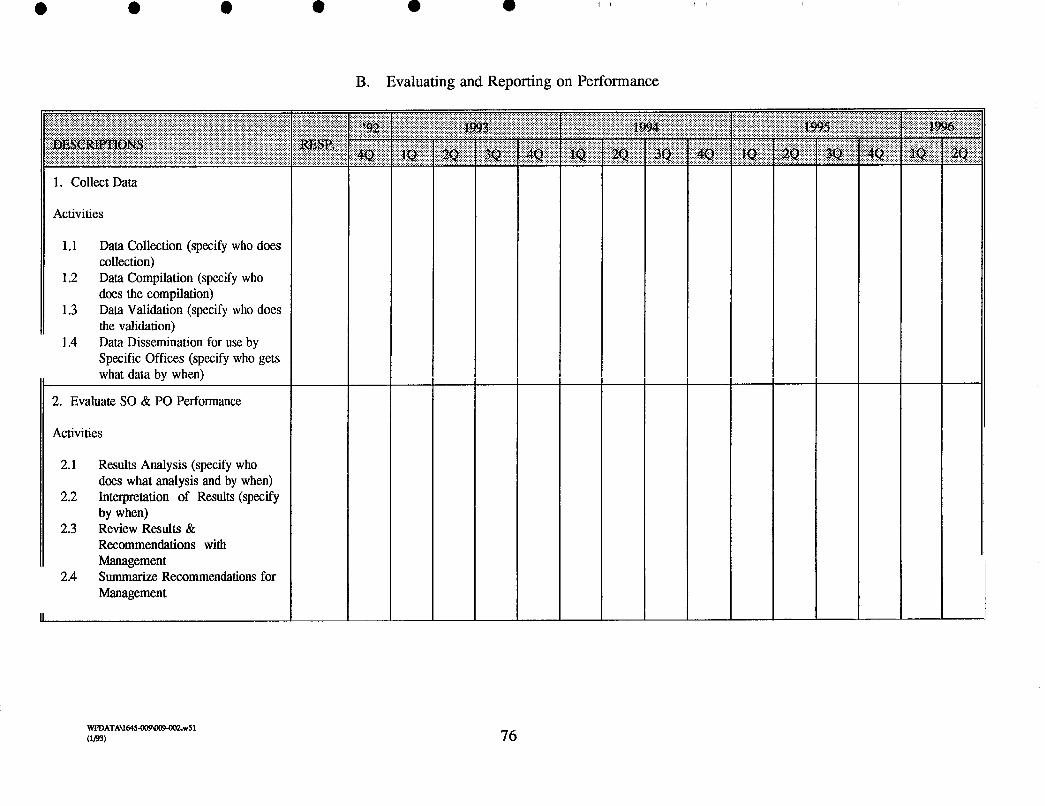
1. Collect Data
Activities
1.1 Data Collection (specify who does collection)
1.2 Data Compilation (specify who does the compilation)
1.3 Data Validation (specify who does the validation)
1.4 Data Dissemination for use by Specific Offices (specify who gets what data by when)
2. Evaluate SO & PO Performance
Activities
2.1 Results Analysis (specify who does what analysis and by when)
2.2 Interpretation of Results (specify by when)
2.3 Review Results & Recommendations with Management
2.4 Summarize Recommendations for Management
B. Evaluating and Reporting on Performance
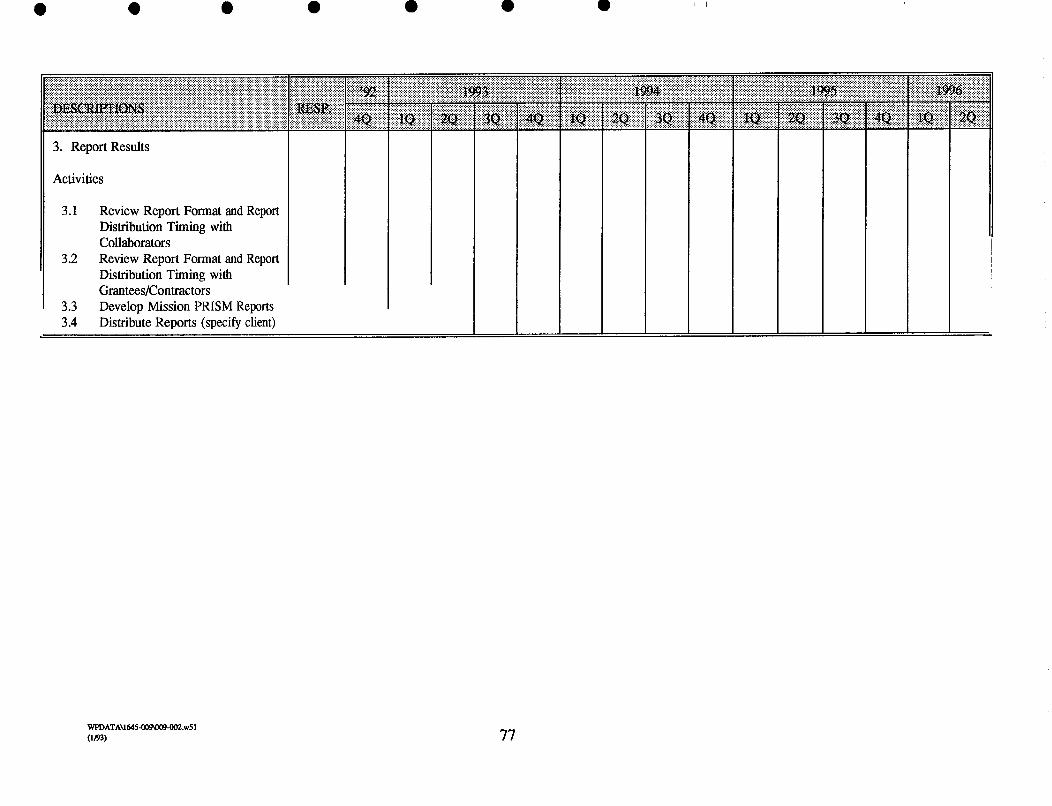
3. Report Results
Activities
3.1 Review Report Format and Report Distribution Timing with Collaborators
3.2 Review Report Format and Report Distribution Timing with Grantees/Contractors
3.3 Develop Mission PRISM Reports 3.4 Distribute Reports (specify client)