program review for: management · subsequent year through 2008. ... through multiple choice...
TRANSCRIPT

Program Review for:
Management
Department Head:
Dr. Ken Chadwick
Department of Management and Marketing
Report Completed by:
Dr. Ken Chadwick with the assistance of all management faculty
Date of Review:
Spring 2015

ii
TABLE OF CONTENTS
Introductory Review ................................................................................................................2
1. Program Mission ................................................................................................................5
1.1 Mission Statement for the Program ..................................................................................5
1.2 Relationship to Institutional Mission ...............................................................................5
2. Program Curriculum ........................................................................................................ 5
2.1 Most Recent Curriculum Study ........................................................................................5
2.2 Major/Minor .....................................................................................................................6
2.3 Student Learning Outcomes and Assessment ..................................................................6
2.4 General Education Requirements ...................................................................................40
2.5 Anticipated Changes ......................................................................................................42
3. Program Rationale ............................................................................................................42
3.1 Similar Programs Nearby ...............................................................................................42
3.2 Relationship with These Programs .................................................................................42
4. Assessing Demand for Program ......................................................................................44
4.1 Types of Jobs in Which Graduates Could be Expected to be Employed .......................44
4.2 National, State, and Area Need for Graduates ...............................................................44
4.3 Degrees Awarded, Number Currently Employed, Government and Other Agencies....46
5. Outside Interest in the Program ......................................................................................46
5.1 Interest on the Part of Local Groups ..............................................................................46
5.2 Formal Agreements with Industry, Government and Other Agencies ...........................49
6. Students ..............................................................................................................................51
6.1 Enrollment ......................................................................................................................51
6.2 Admissions Policies and Practices .................................................................................52
6.3 Attrition and Graduation Record ....................................................................................53
6.4 Career Counseling ..........................................................................................................55
6.5 Follow-up and Student Placement ..................................................................................55
7. Faculty ................................................................................................................................57
7.1 Faculty Who Are Direct Participants in the Program ....................................................57
7.2 Narrative of Faculty Accomplishments ..........................................................................60

iii
7.3 Staffing Changes ............................................................................................................62
7.4 Strengths or Specialists Not Existing in Present Faculty ...............................................62
7.5 Special Faculty Services .................................................................................................63
8. Department Objectives Related to the Program ............................................................63
8.1 Annual Plans for the Program ........................................................................................63
8.2 Changes in Departmental/Program Objectives ..............................................................64
8.3Anticipated Changes in Department/Program Objectives...............................................64
8.4 Are Resources Adequate Relative to Other Programs in the College ............................64
9. Informational Resources/Libraries .................................................................................65
10. Facilities-Equipment .......................................................................................................65
10.1 Current Facilities and Equipment .................................................................................65
10.2 Needed Additional Facilities ........................................................................................66
10.3 Needed Additional Equipment .....................................................................................66
Conclusion ..............................................................................................................................67
Appendix A – Enrollment and Faculty Fact Sheet ..................................................................68
Appendix B – Matrix Linking Program Curriculum to Gen. Ed .............................................70
Appendix C – Evaluation Team Report ...................................................................................76
Appendix D - Use of Results of Program Review ...................................................................78

1
NARRATIVE
Introductory Review
Briefly summarize actions taken to address concerns/recommendations from the previous five-
year review. (Refer to Appendix C and Appendix D (Form A) generated from last report.
Append these following the Narrative.) If this is a new program with no previous review, then
state the year this program was first offered.
The only weakness/recommendation from the previous five-year review (May 2010) was,
“Objectives could be better aligned with program goals with additional emphasis on higher order
thinking.” In 2009, the department developed new student learning outcomes and objectives
based on data collected from the previous five years, previous reviewer comments and advice
and feedback from Renee Hicks. By 2010, the department had only recently begun collecting
data using the revised set of outcomes and objectives. As a result, I decided to keep the same
outcomes and objectives in place so as to assess trends in learning outcomes based ono the 2009
plan.
Revised May 2006

2
APPENDIX C
EVALUATION TEAM REPORT
Program: Bachelor of Science in Management
Department: Management and Marketing
Department Head: Dr. Ken Chadwick
Date of this report: May 4, 2010
Primary Reader: Dr. Susan Roark
Secondary Reader: Dr. Sue Westbook
1. Is program relevant to the university mission? Is it essential to the university? (Sec. 1)
Comments: The program is relevant to the university mission. By drawing on the broader
mission of the university, the programs in the college strive to contribute to a global economy
and diverse work force. The program is essential to the university in its provision of graduates to
the region’s workforce.
2. Is curriculum appropriately reviewed and revised to meet the needs of students and
community? (Sec. 2.1)
Comments: The program was reviewed in 2004 and has made curriculum changes in each
subsequent year through 2008. Accreditation through AACSB also provides a mechanism for
systematic program review and improvement. Changes have been made in the curriculum since
2004 and every subsequent year through 2008. Trend data is provided through the assessment of
student learning.
3. Are Student Outcomes Objectives measurable? Assessed appropriately? Are
improvements/changes made for improved learning based on assessments? (Sec. 2.3)
Comments: New student learning outcomes were developed in spring 2009 and are assessed
through multiple choice questions administered during the final exam of key management
courses. Many of the student learning outcomes are knowledge based although they are aligned
with goals focusing on higher order thinking. Although data have not been collected for these
student learning outcomes, prior to spring 2009, data were provided on the previous SLOs for the
past five semesters. Improvements in the program were made based on these data.
4. Based on data provided, does the program compare favorably with institutions
within a 100 mile radius? (Sec. 3)
Comments: The management program compares favorably with other programs within a 100
mile radius in regard to degree hours. Differences in programs are evident in the concentrations

3
offered within the management programs within the area with Nicholls being the only institution
offering a concentration in Health Care Management.
5. Based on demand and interest in the program and a 5-year projection in graduates, how would
you assess the future of the program? (Sec. 4, 5, 6)
Comments: No five-year projection is provided; however, the management program offers a
broad focus so that graduates may be employed in a variety of settings. Data provided show that
the demand for management graduates has increased in Louisiana at a higher rate than the United
States, and the increase in graduates gives support to these data. The management program has
established relationships with local, state, and not-for-profit organizations and agencies.
6. Is the faculty profile appropriate to accomplish the program’s mission? How would you rate
the Teaching, Research and Service of the faculty in the program? (Sec. 7)
Comments: For the past five years, approximately 50 percent of the full-time faculty are very
active in research and service. Faculty teaching workload is considerably less than the other
units within the institution and less than the University of Louisiana System policy for a
minimum teaching load of 24 credit hours.
7. Is there a pattern of "continuous improvement" demonstrated over the past five years, as
evidenced in the Annual Plans? (Sec. 8)
Comments: The management program indicates overall department progress toward
continuous improvement. Also, the assessment plan for the student learning outcomes indicates
a pattern of continuous improvement in the program itself.
8. Are departmental support, equipment and facilities appropriate to meet the needs of the
program? (Sec. 8, 9, 10)
Comments: Faculty have been successful and are motivated to continue obtaining outside
funding through grant writing for additional equipment. Therefore, support, equipment and
facilities are appropriate to meet the needs of the program.
9. Overall strengths and weakness of academic program based on report and presentation.
STRENGTHS WEAKNESSES
Faculty research and service Objectives could be better aligned with
program goals with additional emphasis on
higher order thinking
Facilities and equipment
Student learning outcomes assessment plan
Recommendations: Minor revision to program outcomes using a single higher order verb.

4
APPENDIX D
Nicholls State University: FORM A (revised 2006) Use of Results of Program Review Date: May 28, 2010
Name of Department:
Name of Degree Program:
Management and Marketing
Management
Describe at least one improvement or change (action plan) that will be made in the degree
program (listed above) as a result of this review. NOTE: Progress towards the completion of this action plan should be documented in the
departmental annual plan, Part l.C. This evidence of action taken will be reviewed as part of
the e program's next five-year review.
As per the recommendations of the evaluation team, the student learning outcomes will
be revised using a single higher order verb. ________________________
Signature of Department Head

5
1. Program Mission
1.1 Mission Statement for the Program:
MISSION STATEMENT
MANAGEMENT PROGRAM
Consistent with the University and the College of Business Administration, the Management
program prepares students from the Bayou Region of South Louisiana and beyond to contribute
to a dynamic regional and global economy as well-educated, responsible, and engaged
management professionals through quality teaching, applied and pedagogical research, and
service.
1.2 Relationship to Institutional Mission:
In developing the mission statement for Management we sought to draw from the broader
mission statements of Nicholls State University and the College of Business Administration. In
doing so, we focus on the development of a program designed to prepare students to effectively
compete as well-educated and responsible citizens in increasingly complex regional, national,
and international business environments.
NSU Mission Statement
Nicholls State University is a student-centered regional institution dedicated to the education of a
diverse student body in a culturally rich and engaging learning environment through quality
teaching, research, and service. Nicholls supports the educational, cultural, and economic needs
of its service region and cultivates productive, responsible, and engaged citizens.
CBA Mission Statement
The College of Business Administration prepares students from the Bayou Region of South
Louisiana and beyond to contribute to a dynamic regional and global economy as well-educated,
responsible, and engaged business professionals through quality teaching, applied and
pedagogical research, and service.
2. Program Curriculum
2.1 Most Recent Curriculum Study:
a. Last in-depth study:
The last program review was submitted in December 2009.
b. Changes to the curriculum were as follows:
2010

6
No changes.
2011
The Health Care Concentration in Management eliminated due to lack of resources.
Human Resources Concentration – removed requirement to choose one course from MNGT 370,
469 or 486 and added those three hours to an expanded list of approved electives
2012
Clarified that students must take 300 or 400 level courses for the management minor
2013
In a collaborative effort with industry, the College of Business developed and implemented the
concentration in Maritime Management. The program has over 80 students enrolled as of fall
2014.
2014
No changes.
2.2 Major/Minor:
a. Major: The degree requires 120 for all students in the major. This includes those
concentrating in Human Resources or Maritime Management.
b. Minor: The curriculum does not require a minor but does provide a minor in
management. The minor requires 18 hours of 300 or 400 level coursework.

7
2.3 Student Learning Outcomes and Assessment (Specifically reference SLOs from
Departmental Annual Plans):
Year: 2010-2011
Program Learning Outcome 1
Program Learning Outcome
Students pursuing the management degree will be able to demonstrate understanding of the key
principles of management and apply core concepts of management through the following
objectives:
1.1 Demonstrate knowledge of the macro level (strategic planning) and micro level (problem
solving/decision making) aspects of the Planning function of management.
1.2 Demonstrate knowledge of the macro level (organizational structure) and micro (HRM)
level aspects of the Organizing function of management.
1.3 Identify the key elements of the macro level (corp. governance/vision) and micro level
(leadership/ motivation/communication/HR) aspects of the Directing function of management.
1.4 Identify the key elements of the macro level (financial controls/quality) and micro level
(individual and group performance/corporate culture) aspects of the Control function of
management.
Action Plan for 2010-11
In the fall of 2009 the management faculty met to develop/revise outcomes, objectives and
assessment procedures for the major. This included the assessment of students’ ability to
demonstrate an understanding of the key principles of management and apply core concepts of
management through the following objectives:
Assessment Methods
Embedded exam questions
ETS Exam
Targets (Expected Results)
75% of our Management majors will meet or exceed expectations
E = 100% of questions correct

8
M = 67% of questions correct
B < 67% of questions correct
Satisfactory achievement will be indicated with an average score at or above the national average
on the management portion of the ETS Exam
Results (attach evidence)
1.1
88% of MNGT students assessed exceeded or met expectations.
1.2
88% of MNGT students assessed exceeded or met expectations.
1.3
63% of MNGT students assessed exceeded or met expectations.
1.4
100% of MNGT students assessed exceeded or met expectations.
ETS
National Average - 55.2%
Management Majors - Fall 2010 - 55%, Spring 2011 - 61%.
Use of Results (Action Plan for 2011-12)
Students performed well but the outcomes, objectives and assessment procedures were revised in
Fall 2009. As a result, further monitoring of results is needed to better assess knowledge in the
field.
The COB has subscribed to a new “premium” package for ETS which will allow for more
precise assessment of student strengths and weaknesses in the field.
Program Learning Outcome 2
Program Learning Outcome

9
Students pursuing the management degree will be able to recognize and correctly apply human
resource management practices and apply core concepts of management through the following
objectives.
2.1 Identify appropriate recruitment and selection practices.
2.2 Identify key training and development issues.
2.3 Distinguish between different types of compensation and benefits
2.4 Recognize potential legal issues in human resource management.
2.5 Recognize key concepts of diversity.
Action Plan for 2010-11
In the fall of 2009 the management faculty met to develop/revise outcomes, objectives and
assessment procedures for the major. This included the assessment of students’ ability to
demonstrate an understanding of human resource management practices and apply core concepts
of management.
Assessment Methods
Embedded exam questions
ETS Exam
Targets (Expected Results)
75% of our Management majors will meet or exceed expectations
E = 100%
M = 50%
B = < 50%
Satisfactory achievement will be indicated with an average score at or above the national average
on the management portion of the ETS Exam
Results (attach evidence)
2.1 - 100% of MNGT students exceeded or met expectations.
2.2 - 71% of MNGT students exceeded or met expectations.

10
2.3 - 92% of MNGT students exceeded or met expectations.
2.4 - 100% of MNGT students exceeded or met expectations.
2.5 - 92% of MNGT students exceeded or met expectations.
ETS
National Average - 55.2%
Management Majors - Fall 2010 - 55% Spring 2011 - 61%.
Use of Results (Action Plan for 2011-12)
Students performed well but the outcomes, objectives and assessment procedures were revised in
Fall 2009. As a result, further monitoring of results is needed to better assess knowledge in the
field.
The COB has subscribed to a new “premium” package for ETS which will allow for more
precise assessment of student strengths and weaknesses in the field.
Program Learning Outcome 3
Program Learning Outcome - Students pursuing the management degree will be able to
recognize and apply appropriate techniques in the applications associated with an organization's
operations and apply core concepts of management through the following objectives:
3.1 Construct an optimum sales and inventory plan
3.2 Apply time scheduling techniques in project management
3.3 Identify key components in supply chain management
3.4 Compute forecasts using appropriate models
3.5 Identify methods of facility location, layout, and appropriate production processes
3.6 Demonstrate knowledge of quality practices
Action Plan for 2010-11
In the fall of 2009 the management faculty met to develop/revise outcomes, objectives and
assessment procedures for the major. This included the assessment of our students' to recognize
and apply appropriate techniques in the applications associated with an organization's operations.
Assessment Methods

11
Embedded exam questions
ETS Exam
Targets (Expected Results)
75% of our Management majors will meet or exceed expectations
E = 100%
M = 50%
B = < 50%
ETS
Satisfactory achievement will be indicated with an average score at or above the national average
on the management portion of the ETS Exam
Results (attach evidence)
3.1 - 86% of MNGT students exceeded or met expectations.
3.2 - 100% of MNGT students exceeded or met expectations.
3.3 - 86% of MNGT students exceeded or met expectations.
3.4 - 100% of MNGT students exceeded or met expectations.
3.5 - 53% of MNGT students exceeded or met expectations.
3.6 - 92% of MNGT students exceeded or met expectations.
ETS
National Average - 55.2%
Management Majors - Fall 2010 - 55%, Spring 2011 - 61%.
Use of Results (Action Plan for 2011-12)
Students performed well but the outcomes, objectives and assessment procedures were revised in
Fall 2009. As a result, further monitoring of results is needed to better assess knowledge in the
field.

12
The COB has subscribed to a new “premium” package for ETS which will allow for more
precise assessment of student strengths and weaknesses in the field.
Program Learning Outcome 4
Program Learning Outcome - Students pursuing the management degree will be able to
demonstrate knowledge and ability to apply organizational behaviors topics and apply core
concepts of management through the following objectives:
4.1 Identity key employee behaviors linked to organizational goals
4.2 Recognize major motivational theories
4.3 Identify features that characterize teams
4.4 Demonstrate competence on leadership theories
4.5 Demonstrate knowledge of conflict management
Action Plan for 2010-11
In the fall of 2009 the management faculty met to develop/revise outcomes, objectives and
assessment procedures for the major. This included the assessment of our students' ability to
demonstrate knowledge and ability to apply organizational behaviors topics.
Assessment Methods
Embedded exam questions
ETS Exam
Targets (Expected Results)
75% of our Management majors will meet or exceed expectations
E = 100% of questions correct
M = 67% of questions correct
B < 67% of questions correct
ETS

13
Satisfactory achievement will be indicated with an average score at or above the national average
on the management portion of the ETS Exam
Results (attach evidence)
4.1 - 94% of MNGT students exceeded or met expectations
4.2 - 56% of MNGT students exceeded or met expectations
4.3 - 56% of MNGT students exceeded or met expectations
4.4 - 75% of MNGT students exceeded or met expectations
4.5 - 69% of MNGT students exceeded or met expectations
ETS
National Average - 55.2%
Management Majors - Fall 2010 - 55%, Spring 2011 - 61%.
Use of Results (Action Plan for 2011-12)
Students performed well but the outcomes, objectives and assessment procedures were revised in
Fall 2009. As a result, further monitoring of results is needed to better assess knowledge in the
field.
The COB has subscribed to a new “premium” package for ETS which will allow for more
precise assessment of student strengths and weaknesses in the field.
Program Learning Outcome 5
Program Learning Outcome - Students pursuing the management degree will be able to
identify and /or differentiate the critical components of the strategic management process and
apply the core concepts of management through the following objectives:
5.1 Identify key components of the external analysis
5.2 Identify key components of the internal analysis
5.3 Differentiate between corporate-level and business-level strategies in organizations
5.4 Identify means of implementing strategies within organizations

14
Action Plan for 2010-11
In the fall of 2009 the management faculty met to develop/revise outcomes, objectives and
assessment procedures for the major. This included the assessment of our students' to identify
and /or differentiate the critical components of the strategic management process
Assessment Methods
Embedded exam questions
ETS Exam
Targets (Expected Results)
75% of our Management majors will meet or exceed expectations
ETS
Satisfactory achievement will be indicated with an average score at or above the national average
on the management portion of the ETS Exam
Results (attach evidence)
5.1 - 85% of MNGT students exceeded expectations.
5.2 - 90% of MNGT students exceeded expectations.
5.3 - 85% of MNGT students exceeded expectations.
5.4 - 70% of MNGT students exceeded expectations.
ETS
National Average - 55.2%
Management Majors - Fall 2010 - 55%, Spring 2011 - 61%.
Use of Results (Action Plan for 2011-12)
Students performed well but the outcomes, objectives and assessment procedures were revised in
Fall 2009. As a result, further monitoring of results is needed to better assess knowledge in the
field.
The COB has subscribed to a new “premium” package for ETS which will allow for more
precise assessment of student strengths and weaknesses in the field.

15
Year: 2011-2012
Program Learning Outcome
Students pursuing the management degree will be able to demonstrate understanding of the key
principles of management and apply core concepts of management through the following
objectives:
1.1 Demonstrate knowledge of the macro level (strategic planning) and micro level (problem
solving/decision making) aspects of the Planning function of management.
1.2 Demonstrate knowledge of the macro level (organizational structure) and micro (HRM)
level aspects of the Organizing function of management.
1.3 Identify the key elements of the macro level (corp. governance/vision) and micro level
(leadership/ motivation/communication/HR) aspects of the Directing function of management.
1.4 Identify the key elements of the macro level (financial controls/quality) and micro level
(individual and group performance/corporate culture) aspects of the Control function of
management.
Action Plan for 2011-12
In the fall of 2009 the management faculty met to develop/revise outcomes, objectives and
assessment procedures for the major. As a result, we will continue to monitor results to attempt
to identify significant trends before making any revisions to our assessment of student learning
outcomes.
Assessment Methods
Embedded exam questions
ETS Exam
Targets (Expected Results)
75% of our Management majors will meet or exceed expectations
E = 100% of questions correct
M = 67% of questions correct
B < 67% of questions correct

16
ETS
Satisfactory achievement will be indicated with an average score at or above the national average
of 57.3%.
Results (attach evidence)
1.1 - 67% of MNGT students exceeded or met expectations.
1.2 - 82% of MNGT students exceeded or met expectations.
1.3 - 67% of MNGT students exceeded or met expectations.
1.4 - 96% of MNGT students exceeded or met expectations.
ETS
National Average – 57.3%
Management Majors - Fall 2011 - 61%, Spring 2011 - 65%.
Use of Results (Action Plan for 2012-13)
Student performance was inconsistent for the year, but the outcomes, objectives and assessment
procedures were revised in fall 2009. As a result, further monitoring of results is needed to
better assess knowledge in the field and recognize significant trends in our assessments
The COB has subscribed to a new “premium” package for ETS which will allow for more
precise assessment of student strengths and weaknesses in the field.
Program Learning Outcome 2
Program Learning Outcome - Students pursuing the management degree will be able to
recognize and correctly apply human resource management practices through the following
objectives:
2.1 Identify appropriate recruitment and selection practices.
2.2 Identify key training and development issues.
2.3 Distinguish between different types of compensation and benefits
2.4 Recognize potential legal issues in human resource management.

17
2.5 Recognize key concepts of diversity.
Action Plan for 2011-12
In the fall of 2009 the management faculty met to develop/revise outcomes, objectives and
assessment procedures for the major. As a result, we will continue to monitor results to attempt
to identify significant trends before making any revisions to our assessment of student learning
outcomes.
Assessment Methods
Embedded exam questions
ETS Exam
Targets (Expected Results)
75% of our Management majors will meet or exceed expectations
E = 100% of questions correct
M = 67% of questions correct
B < 67% of questions correct
ETS
Satisfactory achievement will be indicated with an average score at or above the national average
on the management portion of the ETS Exam
Results (attach evidence)
2.1 - 57% of MNGT students exceeded or met expectations.
2.2 - 55% of MNGT students exceeded or met expectations.
2.3 - 97% of MNGT students exceeded or met expectations.
2.4 - 90% of MNGT students exceeded or met expectations.
2.5 - 87% of MNGT students exceeded or met expectations.
ETS

18
National Average – 57.3%
Management Majors - Fall 2011 - 61%, Spring 2012 - 65%.
Use of Results (Action Plan for 2012-13)
Student performance was inconsistent but the outcomes, objectives and assessment procedures
were revised in fall 2009. As a result, further monitoring of results is needed to better assess
knowledge in the field and recognize significant trends in our assessments.
The COB has subscribed to a new “premium” package for ETS which will allow for more
precise assessment of student strengths and weaknesses in the field.
Program Learning Outcome 3
Program Learning Outcome - Students pursuing the management degree will be able to
recognize and apply appropriate techniques in the applications associated with an organization's
operations through the following objectives:
3.1 Construct an optimum sales and inventory plan
3.2 Apply time scheduling techniques in project management
3.3 Identify key components in supply chain management
3.4 Compute forecasts using appropriate models
3.5 Identify methods of facility location, layout, and appropriate production processes
3.6 Demonstrate knowledge of quality practices
Action Plan for 2011-12
In the fall of 2009 the management faculty met to develop/revise outcomes, objectives and
assessment procedures for the major. As a result, we will continue to monitor results to attempt
to identify significant trends before making any revisions to our assessment of student learning
outcomes.
Assessment Methods
Embedded exam questions
ETS Exam
Targets (Expected Results)

19
75% of our Management majors will meet or exceed expectations
3.1
E = 100% of questions correct
M = 67% of questions correct
B < 67% of questions correct
3.2
E = 100% of questions correct
M = 50% of questions correct
B < 50% of questions correct
3.3
E = 100% of questions correct
M = 67% of questions correct
B < 67% of questions correct
3.4
E = 100% of questions correct
M = 50% of questions correct
B < 50% of questions correct
3.5
E = 100% of questions correct
M = 50% of questions correct
B < 5 0% of questions correct
3.6
E = 100% of questions correct

20
M = 67% of questions correct
B < 67% of questions correct
ETS
Satisfactory achievement will be indicated with an average score at or above the national average
on the management portion of the ETS Exam
Results (attach evidence)
3.1 - 91% of MNGT students exceeded or met expectations.
3.2 - 100% of MNGT students exceeded or met expectations.
3.3 - 83% of MNGT students exceeded or met expectations.
3.4 - 94% of MNGT students exceeded or met expectations.
3.5 - 100% of MNGT students exceeded or met expectations.
3.6 - 81 % of MNGT students exceeded or met expectations.
ETS
National Average – 57.3%
Management Majors - Fall 2011 - 61%, Spring 2012 - 65%.
Use of Results (Action Plan for 2012-13)
Students performed well but the outcomes, objectives and assessment procedures were revised in
fall 2009. As a result, further monitoring of results is needed to better assess knowledge in the
field and recognize significant trends in our assessments.
The COB has subscribed to a new “premium” package for ETS which will allow for more
precise assessment of student strengths and weaknesses in the field.
Program Learning Outcome 4
Program Learning Outcome - Students pursuing the management degree will demonstrate
knowledge and ability to apply organizational behavior topics through the following objectives:
4.1: Identity key employee behaviors linked to organizational goals

21
4.2: Recognize major motivational theories
4.3: Identify features that characterize teams
4.4: Demonstrate competence on leadership theories
4.5: Demonstrate knowledge of conflict management
Action Plan for 2011-12
In the fall of 2009 the management faculty met to develop/revise outcomes, objectives and
assessment procedures for the major. As a result, we will continue to monitor results to attempt
to identify significant trends before making any revisions to our assessment of student learning
outcomes.
Assessment Methods
Embedded exam Questions
ETS exam
Targets (Expected Results)
75% of our Management majors will meet or exceed expectations
4.1
E = 100% of questions correct
M = 67% of questions correct
B < 67% of questions correct
4.2
E = 100% of questions correct
B < 100% of questions correct
4.3
E = 100% of questions correct
M = 50% of questions correct
B < 50% of questions correct

22
4.4
E = 100% of questions correct
M = 50% of questions correct
B < 50% of questions correct
4.5
E = 100% of questions correct
M = 50% of questions correct
B < 50% of questions correct
ETS
Satisfactory achievement will be indicated with an average score at or above the national average
on the management portion of the ETS Exam
Results (attach evidence)
4.1 - 57 % of MNGT students exceeded or met expectations.
4.2 - 55 % of MNGT students exceeded or met expectations.
4.3 - 97 % of MNGT students exceeded or met expectations.
4.4 - 90 % of MNGT students exceeded or met expectations.
4.5 - 87 % of MNGT students exceeded or met expectations.
ETS
National Average – 57.3%
Management Majors - Fall 2011 - 61%, Spring 2012 - 65%.
Use of Results (Action Plan for 2012-13)
Students’ performance was inconsistent, but the outcomes, objectives and assessment procedures
were revised in Fall 2009. As a result, further monitoring of results is needed to better assess
knowledge in the field.

23
The COB has subscribed to a new “premium” package for ETS which will allow for more
precise assessment of student strengths and weaknesses in the field.
Program Learning Outcome 5
Program Learning Outcome - Students pursuing the management degree will be able to
identify and/or differentiate the critical components of the strategic management process through
the following objectives:
5.1: Identify key components of the external analysis
5.2: Identify key components of the internal analysis
5.3: Differentiate between corporate-level and business-level strategies in organizations
5.4: Identify means of implementing strategies within organizations
Action Plan for 2011-12
In the fall of 2009 the management faculty met to develop/revise outcomes, objectives and
assessment procedures for the major. As a result, we will continue to monitor results to attempt
to identify significant trends before making any revisions to our assessment of student learning
outcomes.
Assessment Methods
Embedded exam questions
ETS exam
Targets (Expected Results)
75% of our majors will meet or exceed expectations
ETS Exam
E = 100% of questions correct
M = 67% of questions correct
B < 67% of questions correct
ETS

24
Satisfactory achievement will be indicated with an average score at or above the national average
on the management portion of the ETS Exam
Results (attach evidence)
5.1 - 73 % of MNGT students exceeded or met expectations.
5.2 - 71 % of MNGT students exceeded or met expectations.
5.3 - 85% of MNGT students exceeded or met expectations.
5.4 - 68 % of MNGT students exceeded or met expectations.
ETS
National Average – 57.3%
Management Majors - Fall 2011 - 61%, Spring 2012 - 65%.
Use of Results (Action Plan for 2012-13)
Student performance was inconsistent but the outcomes, objectives and assessment procedures
were revised in fall 2009. As a result, further monitoring of results is needed to better assess
knowledge in the field and recognize significant trends in our assessments.
The COB has subscribed to a new “premium” package for ETS which will allow for more
precise assessment of student strengths and weaknesses in the field.

25
Year: 2012-2013
Program Learning Outcome 1
Program Learning Outcome - Students pursuing the management degree will be able to
demonstrate understanding of the key principles of management.
1-1: Demonstrate knowledge of the macro level (strategic planning) and micro level (problem
solving/decision making) aspects of the Planning function of management.
1-2: Demonstrate knowledge of the macro level (organizational structure) and micro level
(HRM) aspects of the Organizing function of management.
1-3: Identify the key elements of the macro level (corp. governance/vision) and the micro level
(leadership/motivation/communication/HR) aspects of the Directing function of management.
1-4: Identify the key elements of the macro level (financial controls/quality) and micro level
(individual and group performance/corp. culture) aspects of the Control function of management.
Action Plan for 2012-13
In the fall of 2009 the management faculty met to develop/revise outcomes, objectives and
assessment procedures for the major. As a result, we will continue to monitor results to attempt
to identify significant trends before making any revisions to our assessment of student learning
outcomes.
Assessment Methods -
Embedded exam questions
ETS Test
Targets (Expected Results)
75% of our Management majors will meet or exceed expectations
E = 100% of questions correct
M = 67% of questions correct
B < 67% of questions correct
ETS
Satisfactory achievement will be indicated with an average score at or above the national average
on the management portion of the ETS Exam
Results (attach evidence)
Embedded exam questions

26
1.1 - 67% of MNGT students exceeded or met expectations.
1.2 - 81% of MNGT students exceeded or met expectations.
1.3 - 67% of MNGT students exceeded or met expectations.
1.4 - 97% of MNGT students exceeded or met expectations.
ETS
National Average – 57.3%
Management Majors - Fall 2012 - 60%, Spring 2013 - 62%.
Use of Results (Action Plan for 2013-14)
Student performance was inconsistent.
In the fall of 2009 the management faculty met to develop/revise outcomes, objectives and
assessment procedures for the major. As a result, we will continue to monitor results to attempt
to identify significant trends before making any revisions to our assessment of student learning
outcomes.
Program Learning Outcome 2
Program Learning Outcome - Students pursuing the management degree will be able to
recognize and correctly apply human resource management practices.
Assess Student ability to:
2-1: Identify appropriate recruitment and selection practices.
2-2: Identify key training and development issues.
2-3: Distinguish between different types of compensation and benefits.
2-4: Recognize potential legal issues in human resource management.
2-5: Recognize key concepts of diversity.
Action Plan for 2012-13
In the fall of 2009 the management faculty met to develop/revise outcomes, objectives and
assessment procedures for the major. As a result, we will continue to monitor results to attempt
to identify significant trends before making any revisions to our assessment of student learning
outcomes.
Assessment Methods
Embedded exam questions
ETS exam

27
Targets (Expected Results)
75% of our Management majors will meet or exceed expectations
E = 100% of questions correct
M = 67% of questions correct
B < 67% of questions correct
ETS
Satisfactory achievement will be indicated with an average score at or above the national average
on the management portion of the ETS Exam
Results (attach evidence)
Not assessed in 2012-2013, will be assessed again in 2013-2014.
Use of Results (Action Plan for 2013-14)
In the fall of 2009 the management faculty met to develop/revise outcomes, objectives and
assessment procedures for the major. As a result, we will continue to monitor results to attempt
to identify significant trends before making any revisions to our assessment of student learning
outcomes.
Program Learning Outcome 3
Program Learning Outcome - Students pursuing the management degree will be able to
recognize and apply appropriate techniques in the applications associated with an organization’s
operations.
Assess student ability to:
3-1 Construct an optimum sales and inventory plan
3-2: Apply time scheduling techniques in project management
3-3: Identify key components in supply chain management
3-4: Compute forecasts using appropriate models
3-5: Identify methods of facility location, layout, and appropriate production processes
3-6: Demonstrate knowledge of quality practices
Action Plan for 2012-13
In the fall of 2009 the management faculty met to develop/revise outcomes, objectives and
assessment procedures for the major. As a result, we will continue to monitor results to attempt

28
to identify significant trends before making any revisions to our assessment of student learning
outcomes.
Assessment Methods - Use of embedded questions and ETS exam
Embedded exam questions
ETS Test
Targets (Expected Results)
75% of our Management majors will meet or exceed expectations
E = 100% of questions correct
M = 67% of questions correct
B < 67% of questions correct
ETS
Satisfactory achievement will be indicated with an average score at or above the national average
on the management portion of the ETS Exam
Results (attach evidence)
Embedded exam questions
3-1 - 82% of students met or exceeded expectations
3-2 - 96% of students met or exceed
3-3 - 96% of students met or exceeded expectations
3-4 - 98% of students met or exceeded expectations
3-5 - 96% of students met or exceeded expectations
3-6 - 92% of students met or exceeded expectations.
ETS
National Average – 57.3%
Management Majors - Fall 2012 - 60%, Spring 2013 - 62%.

29
Use of Results (Action Plan for 2013-14)
Students performed well on each of the six objectives
In the fall of 2009 the management faculty met to develop/revise outcomes, objectives and
assessment procedures for the major. As a result, we will continue to monitor results to attempt
to identify significant trends before making any revisions to our assessment of student learning
outcomes.
Program Learning Outcome 4
Program Learning Outcome - Students pursuing the management degree will demonstrate
knowledge and ability to apply organizational behavior topics.
Assess student ability to:
Obj 1: Identify key employee behaviors linked to organizational
Obj 2: Recognize major motivational theories
Obj 3: Identify features that characterize teams
Obj 4: Demonstrate competence on leadership theories
Obj 5: Demonstrate knowledge of conflict management
Action Plan for 2012-13 - In the fall of 2009 the management faculty met to develop/revise
outcomes, objectives and assessment procedures for the major. As a result, we will continue to
monitor results to attempt to identify significant trends before making any revisions to our
assessment of student learning outcomes.
Assessment Methods -
Embedded exam questions
ETS Test
Targets (Expected Results)
75% of our Management majors will meet or exceed expectations
E = 100% of questions correct
M = 67% of questions correct
B < 67% of questions correct

30
ETS
Satisfactory achievement will be indicated with an average score at or above the national average
on the management portion of the ETS Exam
Results (attach evidence)
Not assessed in 2012-2013, will be assessed again in 2013-2014.
Use of Results (Action Plan for 2013-14)
In the fall of 2009 the management faculty met to develop/revise outcomes, objectives and
assessment procedures for the major. As a result, we will continue to monitor results to attempt
to identify significant trends before making any revisions to our assessment of student learning
outcomes.
Program Learning Outcome 5
Program Learning Outcome - Students pursuing the management degree will be able to
identify and/or differentiate the critical components of the strategic management process.
Assess student ability to
5-1: Identify key components of the external analysis
5-2: Identify key components of the internal analysis
5-3: Differentiate between corporate-level and business-level strategies in organizations
5-4: Identify means of implementing strategies within organizations
Action Plan for 2012-13 - In the fall of 2009 the management faculty met to develop/revise
outcomes, objectives and assessment procedures for the major. As a result, we will continue to
monitor results to attempt to identify significant trends before making any revisions to our
assessment of student learning outcomes.
Assessment Methods -
Embedded exam questions
ETS Test

31
Targets (Expected Results) -
75% of our Management majors will meet or exceed expectations
E = 100% of questions correct
M = 67% of questions correct
B < 67% of questions correct
ETS
Satisfactory achievement will be indicated with an average score at or above the national average
on the management portion of the ETS Exam
Results (attach evidence)
Embedded exam questions
5-1 – 76.5% of students met or exceeded expectations
5-2 – 76.0% of students met or exceeded expectations
5-3 – 88.2% of students met or exceeded expectations
5-4 – 88.2% of students met or exceeded expectations
ETS
National Average – 57.3%
Management Majors - Fall 2012 - 60%, Spring 2013 - 62%.
Use of Results (Action Plan for 2013-14)
Students exceeded expectations on each of the objectives.
In the fall of 2009 the management faculty met to develop/revise outcomes, objectives and
assessment procedures for the major. As a result, we will continue to monitor results to attempt
to identify significant trends before making any revisions to our assessment of student learning
outcomes

32
Year: 2013-2014
Program Learning Outcome- Students pursuing the management degree will be able to
demonstrate understanding of the key principles of management.
Assess student ability to:
1-1: Demonstrate knowledge of the macro level (strategic planning) and micro level (problem
solving/decision making) aspects of the Planning function of management.
1-2: Demonstrate knowledge of the macro level (organizational structure) and micro level
(HRM) aspects of the Organizing function of management.
1-3: Identify the key elements of the macro level (corp. governance/vision) and the micro level
(leadership/motivation/communication/HR) aspects of the Directing function of management.
1-4: Identify the key elements of the macro level (financial controls/quality) and micro level
(individual and group performance/corp. culture) aspects of the Control function of management.
Action Plan for 2013-14 -
In the fall of 2009 the management faculty met to develop/revise outcomes, objectives and
assessment procedures for the major. As a result, we will continue to monitor results to attempt
to identify significant trends before making any revisions to our assessment of student learning
outcomes.
Assessment Methods
Embedded exam questions
ETS Test
Targets (Expected Results)
75% of our Management majors will meet or exceed expectations
E = 100% of questions correct
M = 67% of questions correct
B < 67% of questions correct
ETS
Satisfactory achievement will be indicated with an average score at or above the national average
on the management portion of the ETS Exam

33
Results (attach evidence)
Embedded exam questions
1.1 - 79% of MNGT students exceeded or met expectations.
1.2 - 97% of MNGT students exceeded or met expectations.
1.3 - 70% of MNGT students exceeded or met expectations.
1.4 - 97% of MNGT students exceeded or met expectations.
ETS
National Average – 2013 - 57.0% 2014 - 54.6%
Management Majors - Fall 2013 - 62% Spring 2014 - 58%.
(Note: The test forms changed in 2014 so there are separate national average figures for 2013
and 2014.)
Use of Results (Action Plan for 2014-15)
Over the past couple of assessment periods students have performed well in all areas except
1.3. Faculty met to assure consistent emphasis of the target concepts and agreed on areas that
need to be covered. Changes will be implemented into their courses. In addition, the faculty
reviewed assessment questions to determine if improvements could be made to assure they were
successfully assessing the most critical areas. Several questions were revised that were
determined to be poorly written, confusing or inconsistent with the target objectives. The
instructors will use the revised instrument for future assessment.
Program Learning Outcome 2
Program Learning Outcome - Students pursuing the management degree will be able to
recognize and correctly apply human resource management practices.
Assess Student ability to:
2-1: Identify appropriate recruitment and selection practices.
2-2: Identify key training and development issues.
2-3: Distinguish between different types of compensation and benefits.
2-4: Recognize potential legal issues in human resource management.
2-5: Recognize key concepts of diversity
Action Plan for 2013-14 - In the fall of 2009 the management faculty met to develop/revise
outcomes, objectives and assessment procedures for the major. As a result, we will continue to

34
monitor results to attempt to identify significant trends before making any revisions to our
assessment of student learning outcomes.
Assessment Methods
Embedded exam questions
ETS Test
Targets (Expected Results)
75% of our Management majors will meet or exceed expectations
E = 100% of questions correct
M = 67% of questions correct
B < 67% of questions correct
ETS
Satisfactory achievement will be indicated with an average score at or above the national average
on the management portion of the ETS Exam
Results (attach evidence)
2.1 - 96% of MNGT students exceeded or met expectations.
2.2 - 96% of MNGT students exceeded or met expectations.
2.3 - 100% of MNGT students exceeded or met expectations.
2.4 - 85% of MNGT students exceeded or met expectations.
2.5 - 98% of MNGT students exceeded or met expectations.
ETS
National Average – 2013 - 57.0% 2014 - 54.6%
Management Majors - Fall 2013 - 62% Spring 2014 - 58%.
(Note: The test forms changed in 2014 so there are separate national average figures for 2013
and 2014.)
Use of Results (Action Plan for 2014-15)
Students have performed well in this area. Faculty will continue to assess learning outcomes.

35
Program Learning Outcome 3
Program Learning Outcome - Students pursuing the management degree will be able to
recognize and apply appropriate techniques in the applications associated with an organization’s
operations.
Assess student ability to:
3-1 Construct an optimum sales and inventory plan
3-2: Apply time scheduling techniques in project management
3-3: Identify key components in supply chain management
3-4: Compute forecasts using appropriate models
3-5: Identify methods of facility location, layout, and appropriate production processes
3-6: Demonstrate knowledge of quality practices
Action Plan for 2013-14 -
In the fall of 2009 the management faculty met to develop/revise outcomes, objectives and
assessment procedures for the major. As a result, we will continue to monitor results to attempt
to identify significant trends before making any revisions to our assessment of student learning
outcomes.
Assessment Methods
Embedded exam questions
ETS Exam
Targets (Expected Results)
75% of our Management majors will meet or exceed expectations
E = 100% of questions correct
M = 67% of questions correct
B < 67% of questions correct
ETS
Satisfactory achievement will be indicated with an average score at or above the national average
on the management portion of the ETS Exam
Results (attach evidence)
Embedded exam questions

36
3-1 - 84% of students met or exceeded expectations
3-2 - 91% of students met or exceed
3-3 - 89% of students met or exceeded expectations
3-4 - 93% of students met or exceeded expectations
3-5 - 93 of students met or exceeded expectations
3-6 - 91% of students met or exceeded expectations.
ETS
National Average – 2013 - 57.0% 2014 - 54.6%
Management Majors - Fall 2013 - 62% = Spring 2014 - 58%.
(Note: The test forms changed in 2014 so there are separate national average figures for 2013
and 2014.)
Use of Results (Action Plan for 2014-15)
Students have performed well in this area. Faculty will continue to assess learning outcomes.
Program Learning Outcome 4
Program Learning Outcome - Students pursuing the management degree will demonstrate
knowledge and ability to apply organizational behavior topics
Assess student ability to:
4-1: Identify key employee behaviors linked to organizational
4-2: Recognize major motivational theories
4-3: Identify features that characterize teams
4-4: Demonstrate competence on leadership theories
4-5: Demonstrate knowledge of conflict management
Action Plan for 2013-14 -
In the fall of 2009 the management faculty met to develop/revise outcomes, objectives and
assessment procedures for the major. As a result, we will continue to monitor results to attempt
to identify significant trends before making any revisions to our assessment of student learning
outcomes.
Assessment Methods
Embedded exam questions
ETS Test
Targets (Expected Results)

37
75% of our Management majors will meet or exceed expectations
4.1
E = 100% of questions correct
M = 67% of questions correct
B < 67% of questions correct
4.2
E = 100% of questions correct
B < 100% of questions correct
4.3
E = 100% of questions correct
M = 50% of questions correct
B < 50% of questions correct
4.4
E = 100% of questions correct
M = 50% of questions correct
B < 50% of questions correct
4.5
E = 100% of questions correct
M = 50% of questions correct
B < 50% of questions correct
ETS

38
Satisfactory achievement will be indicated with an average score at or above the national average
on the management portion of the ETS Exam
Results (attach evidence)
4.1 - 50% of MNGT students exceeded or met expectations.
4.2 - 61% of MNGT students exceeded or met expectations.
4.3 - 100% of MNGT students exceeded or met expectations.
4.4 - 83% of MNGT students exceeded or met expectations.
4.5 - 72% of MNGT students exceeded or met expectations.
ETS
National Average – 2013 - 57.0%, 2014 - 54.6%
Management Majors - Fall 2013 - 62%, Spring 2014 - 58%.
(Note: The test forms changed in 2014 so there are separate national average figures for 2013
and 2014.)
Use of Results (Action Plan for 2014-15)
Over the past few assessment periods students have underperformed in areas 4.1 and
4.2. Faculty will assess and identify ways to improve student learning/retention in this area.
Program Learning Outcome 5
Program Learning Outcome - Students pursuing the management degree will be able to
identify and/or differentiate the critical components of the strategic management process.
Assess student ability to:
5-1: Identify key components of the external analysis
5-2: Identify key components of the internal analysis
5-3: Differentiate between corporate-level and business-level strategies in organizations
5-4: Identify means of implementing strategies within organizations
Action Plan for 2013-14 -
In the fall of 2009 the management faculty met to develop/revise outcomes, objectives and
assessment procedures for the major. As a result, we will continue to monitor results to attempt
to identify significant trends before making any revisions to our assessment of student learning
outcomes
Assessment Methods

39
Embedded exam questions
ETS Test
Targets (Expected Results)
Embedded exam questions
75% of our Management majors will meet or exceed expectations
E = 100% of questions correct
M = 67% of questions correct
B < 67% of questions correct
ETS
Satisfactory achievement will be indicated with an average score at or above the national average
on the management portion of the ETS Exam
Results (attach evidence)
Embedded exam questions -
5-1 - 100% of students met or exceeded expectations
5-2 - 76% of students met or exceed
5-3 - 94% of students met or exceeded expectations
5-4 - 100% of students met or exceeded expectations
ETS
National Average – 2013 - 57.0%, 2014 - 54.6%
Management Majors - Fall 2013 - 62%, Spring 2014 - 58%.
(Note: The test forms changed in 2014 so there are separate national average figures for 2013
and 2014.)
Use of Results (Action Plan for 2014-15)
Students have performed well in this area. Faculty will continue to assess learning outcomes.

40
2.4 General Education Requirements (See Appendix B):
a. List those courses in your curriculum which may be completed to fulfill general
education requirements.
There are no courses in Management that can be used to satisfy General Education requirements.
b. Explain how courses in your curriculum which are NOT designated as General
Education Courses reinforce or supplement the General Education goals and learning
outcomes.
The management curriculum was developed, and is continually refined, to reinforce or
supplement the University’s General Education, and the College of Business’s, goals and
learning outcomes. Several examples of how specific management courses reinforce the General
Education goals and learning outcomes are described below.
1. Effective communication
Expected Outcome/Goal: Upon completion of their degree program, students will be able to
effectively use the English language, writing and speaking with clarity, coherence, and
persuasiveness.
MNGT 301 (Principles of Management) requires students to compile presentations on the
practical relevance of materials covered in the course. Students also choose a publicly traded
company to profile and determine its level of success in the company’s industry. These projects
draw on students’ ability to clearly write and organize logical arguments as well as present these
arguments to a captive audience.
MNGT 305 (Entrepreneurship) involves making and justifying decisions relating to the
marketing, finance, and overall operations of a proposed business venture. These decisions are
built into a group business plan that is turned in at the end of the semester. The arguments and
projections found within the business plan are also pitch by student teams, requiring a clear and
coherent presentation of the analyzed material.
MNGT 470 (Organizational Structure and Behavior) Students are required to work in groups to
analyze and present a case to the class. The student must be able to synthesize information and
present it in an organized and comprehensive manner using strong verbal skills. They must also
do a written executive summary of the case summarizing their analysis.
MNGT 370 (Human Relations and Interpersonal Skills) requires students to present a relevant
book using effective analysis of audience, time, purpose, visual aids, lead the class in an activity,
and use strong oral presentation skills. The course also requires role playing to develop
listening, conflict management, negotiation and other interpersonal communication skills.

41
Students must also participate in an ethical dilemma debate where they must use persuasion,
active listening, and communication skills.
MNGT 420 (Multinational Management) students formally present current topics in
multinational management and are evaluated on: proper organization of materials and arguments
made; effectiveness and professionalism of delivery; the proper use of visual aids; and the ability
to respond to audience questions.
2. Quantitative Reasoning and Mathematics
Expected Outcome/Goal: Upon completion of their degree program, students will be able to
comprehend and to use quantitative concepts and methods to interpret and to critically
evaluate data and to effectively problem-solve in a variety of contexts demanding quantitative
literacy.
Students in MNGT 368 (Operations Management) are required to recognize and apply
optimization, statistical and heuristic decision models in managing the production function. An
understanding of core concepts and techniques is needed to demonstrate the ability to effectively
assess the data and demonstrate its use in decision-making.
Students in MNGT 367 (Human Resource Management) are required to calculate and analyze
employee turnover figures. Students must also understand correlation coefficients to determine
if a test used for employee selection is valid.
3. Computer Literacy
Expected Outcome/Goal: Upon completion of their degree program, students will be able to
demonstrate competence in computer literacy, including fundamental concepts of computing
and fluency in the use of contemporary computing and information technology.
All students in the Management curriculum are expected to possess at least a basic level of
competence in computer literacy. In addition, all Management faculty incorporate the use of
Moodle as a means of providing information and feedback to students.
Specifically, courses such as MNGT 305 (Entrepreneurship) and MNGT 470 (Organizational
structure and behavior) require students to collect, organize, and make presentations using word
processing and/or electronic presentation software.

42
2.5 Anticipated Changes:
What changes, if any, are planned in the program curriculum during the next several
years? Be specific. Why are these changes planned? How will these changes affect its
enrollment, staffing and costs?
If the Maritime Management Concentration continues to grow, or, as some have suggested, it
becomes a separate degree program (major) in the college, it may increase class sizes and the
number of course offerings needed to effectively deliver the material. This may require
additional staffing and/or result in additional costs. The concentration, although self-supporting
through contributions from regional businesses, may at some point require state funding.
3. Program Rationale
3.1 Similar Programs Nearby:
List of similar programs and the names of institutions (public and private) offering
the same or a similar program within a 100-mile radius.
Seven institutions within a 100-mile radius of Nicholls State University offer a bachelor’s degree
in Management (or a degree name with a similar meaning). They are:
Louisiana State University
Loyola
Southeastern Louisiana University
Southern University at Baton Rouge
Tulane University
University of Louisiana of Lafayette
University of New Orleans
None of these institutions offer a program (concentration) in maritime management.
3.2 Relationship With These Programs:
How does your program compare with program outcomes in other universities?
What are the similarities and differences in your curriculum and credit hours to
these universities?
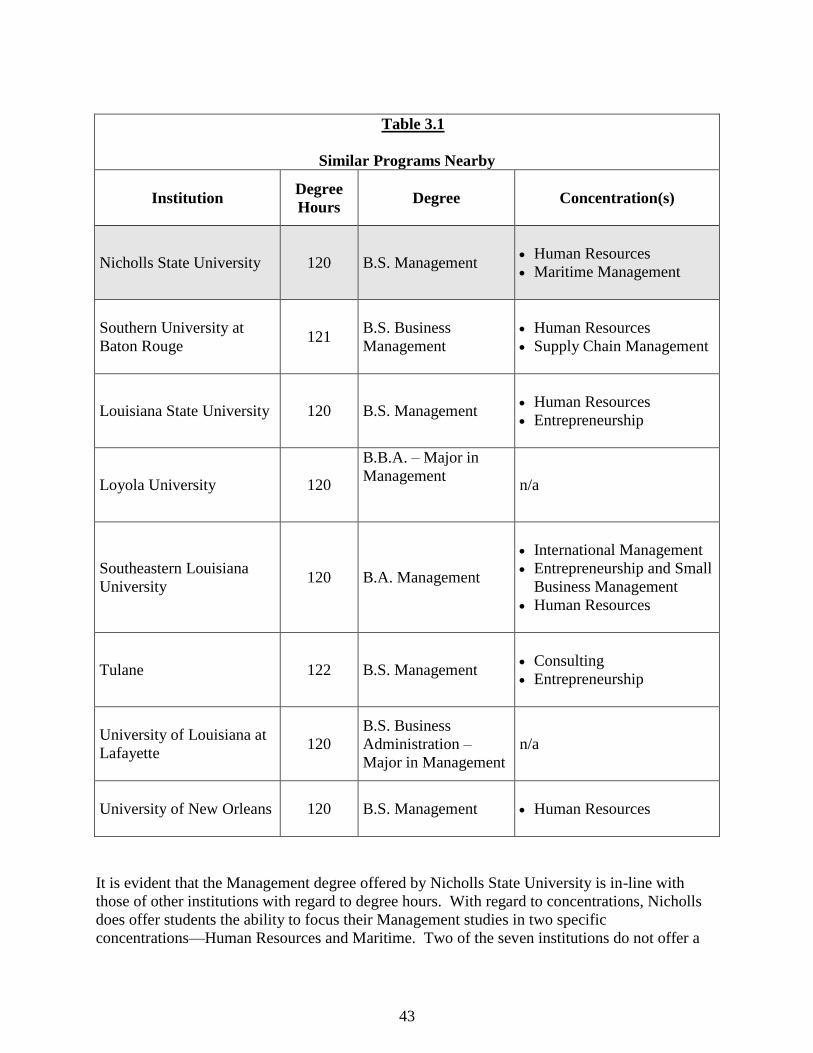
Contained in the table below are the aforementioned institutions (along with Nicholls State
University) and their respective Management programs. The table notes the number of degree
hours, the actual degree granted, and concentrations offered (if any).
43
Table 3.1
Similar Programs Nearby
Institution
Degree
Hours Degree Concentration(s)
Nicholls State University 120
B.S. Management
Human Resources
Maritime Management
Southern University at
Baton Rouge
121 B.S. Business
Management
Human Resources
Supply Chain Management
Louisiana State University 120 B.S. Management
Human Resources
Entrepreneurship
Loyola University
120
B.B.A. – Major in
Management
n/a
Southeastern Louisiana
University 120 B.A. Management
International Management
Entrepreneurship and Small
Business Management
Human Resources
Tulane
122 B.S. Management
Consulting
Entrepreneurship
University of Louisiana at
Lafayette
120
B.S. Business
Administration –
Major in Management
n/a
University of New Orleans
120 B.S. Management Human Resources
It is evident that the Management degree offered by Nicholls State University is in-line with
those of other institutions with regard to degree hours. With regard to concentrations, Nicholls
does offer students the ability to focus their Management studies in two specific
concentrations—Human Resources and Maritime. Two of the seven institutions do not offer a

44
concentration as an option. Similar to Nicholls, four institutions offer specific concentrations in
Human Resources Management. Nicholls is unique in the fact that it is the only institution
offering a concentration in Maritime Management. Not only is this concentration unique to the
state, but, we believe, the country. We know of no other program that provides a concentration
in our particular focus—the oil and gas sector of the maritime industry.
4. Assessing Demand for Program
4.1 List the types of jobs in which graduates with this degree could be expected to be
employed.
Managers are needed in virtually every business, as well as in governmental agencies,
educational institutions, religious organizations and churches, and non-profit associations. As a
result, management graduates have a wide variety of career paths from which to choose. The
management program prepares students to manage people, financial resources and operations at
every level of organizations across many industries. Most job titles below are from graduate
surveys.
Compensation and Benefits Managers
Coordinator for Advancement
Corporate Operations Asst.
Commercial Project Manager
Department Supervisor
Emergency Management Directors
Food Service Managers
Human Resources Managers
Industrial Production Managers
Logistics Coordinator
Management Analysts
Medical and Health Services Managers
Meeting, Convention, and Event Planners
Materials/Project Coordinator
Operations Research Analysts
Parts Representative
Production Assistant
Property, Real Estate, and Community
Association Managers
Public Relations and Fundraising Managers
Purchasing Managers
Recruiting Coordinator
Training and Development Managers
Transportation Assistant
Sales Managers
Social and Community Service Managers
Service Center Manager
Sales
4.2 Specify regional need for graduates as per Louisiana Economic Development forecast
and Louisiana Workforce Commission projections and surveys.
The following table shows a sample of occupations commonly held by individuals with
management degrees in both the U.S. and State of Louisiana and the projected growth rates in
these jobs from 2012 to 2022. Management graduates are well-positioned for employment in
these positions. (http://www.bls.gov/ooh/management/ )
(http://www.laworks.net/LaborMarketInfo/LMI_OccAllProj.asp?years=20122022)

45
Table 4.1
Occupations in Management and Expected Job Demand Growth
Occupation*
United States Louisiana
Human Resources Managers, All Other +13% +18%
Medical & Health Services Manager +23% +21%
Managers, All Others +7% +21%
First-line Supervisors/Managers of Office and
Administrative Support workers
+6% +30%
Chief Executives +11% +27%
Financial Managers +9% +30%
Purchasing Managers +4% +12%
General & Operations Managers +2% +15%
Managers, All Others +7% +21%
Compensation & Benefits Managers +3% +27%
First-line Supervisors/Managers of Retail Sales
Workers
+12.1% +30%
Training & Development Specialists +15% +11%
First-Line Supervisors/Managers of Production &
Operating Workers
-2% +30%
Administrative Services Managers +12% +14% *
List is intended as a sample only and is not all-inclusive.
Regionally, new data released shows that Louisiana ranks first in the nation in economic
impact from America’s domestic maritime industry. The report shows the state’s 54,850
maritime jobs pump more than $11.3 billion annually into the Louisiana economy. According to
a study commissioned by the Transportation Institute and conducted by Pricewaterhouse-
Coopers (PWC), Louisiana also ranks first in the country in maritime jobs per capita, with one in
every 83 jobs connected to the state’s domestic maritime industry, nearly twice that of any other
state. Louisiana also ranks third in the nation in shipbuilding, according to a recent study by the
U.S. Maritime Administration covering commercial and military construction. Shipbuilding
accounts for 29,250 jobs and more than $2.23 billion in annual economic impact for the state.
Across America, the domestic maritime industry includes approximately 40,000 vessels,
supports 478,440 jobs, and has an annual economic impact of $92.5 billion, according to the
Transportation Institute’s findings. In total, approximately 54,850 jobs in Louisiana are a direct
result of the maritime industry. Obviously, this information strongly suggests there will continue
to be robust demand for our students receiving the management degree with the maritime
concentration. (http://www.americanmaritimepartnership.com/2014/04/09/louisiana-ranked-top-
maritime-state-nation/)

46
4.3 Provide data on degrees awarded, number currently employed and projected demand
for graduates indicating sources of data for projections. Explain projections.
The following table contains the number of management graduates of the over the last five years
according to the Office of Assessment and Institutional Research.
Table 4.3
Number of Degrees Awarded
2009-10 2010-11 2011-12 2012-13 2013-14
40 47 47 41 49
Data on graduates currently employed is not available, although anecdotal evidence suggests that
graduates with good academic records and work histories have no problems finding entry-level
positions and opportunities for career development.
The following management occupations all require a bachelor's degree and one year or less of
experience, the change in employment in thousands of workers from 2010 to 2020 and the
percentage increase of employment across the U.S.:
Occupation
Employment Increase
(in thousands), 2010
to 2020
Percent
Increase
Meeting, Convention, and Event
Planners 31.3 43.7
Medical and Health Services
Managers 68 22.4
Management Analysts 157.2 21.9
Operations Research Analysts 9.4 14.6
Training and Development Managers 4.3 14.6
Sales Managers 40.1 11.7
Industrial Production Managers 13.7 9.1
Purchasing Managers 4.9 7.2
Source: Bureau of Labor Statistics, Employment Projections,
http://www.bls.gov/emp/
5. Outside Interest in the Program
5.1 Identify interest on the part of local groups, industry, research centers, and other educational
institutions, or state agencies (example: Hospitals, culinary institutes, business.)

47
The College of Business Administration has developed specific articulation agreements with
regional community and technical colleges, specifically with Baton Rouge Community College,
Delgado Community College, River Parishes Community College and L.E. Fletcher Technical
College.
As a vital regional resource, the College recognizes a responsibility to extend its teaching and
problem solving abilities to the community. The College offers this service by providing
continuing education seminars, continuing education courses, and consulting services through
individual efforts of the faculty. The faculty advances the welfare of the University, the
community, and academic and professional organizations through professional interaction.
Management faculty members are active in local organizations and are often interviewed by
local media in search of an expert opinion.
Students are exposed to local business leaders when they appear in class as guest speakers and
when they attend meetings set up by various student organizations. Management majors are
eligible for internships. Students interested in an internship must meet requirements set by the
College of Business Administration.
Besides these scholarships and contributions, the College of Business has received
approximately $350,000 to offer a new concentration in Maritime Management.
The Maritime Management Concentration is the only four-year business program in the state
designed specifically to address the needs of the oil and gas sector of the maritime industry.
Funded and developed by regional maritime related firms, the program is designed to create
additional value for both students and employers. Financial partners in the program include:
Aries Marine Corp.
Bollinger Shipyards Inc.
Candy Fleet, LLC
Cenac Marine Services
Edison Chouest Offshore
Comar Marine, LLC
Galliano Marine Services
Gordon “Bubba” Dove Jr. Foundation
Harvey Gulf International Marine, LLC
L and M Botruc Rental Inc.
Marine Systems Inc., (MSI)
Montco Offshore Inc.
Morgan Stanley
Otto Candies, LLC
Phelps Dunbar, LLP
SEACOR Foundation
SEACOR Marine, LLC
South Central Industrial Association

48
The following monetary awards indicate the support and recognition that industry, government
and other agencies outside the academic community have given the College of Business
Administration:
Argent Bank Professorship in Business Administration $60,000 (Board of Regents
matching contribution $40,000)
Betsy Ayo Professorship in Accounting and Business Law $60,000 (Board of Regents
matching contribution $40,000)
Gerald Gaston Professorship in Business Administration $60,000 (Board of Regents
matching contribution $40,000)
Entergy Endowed Professorship in Information Systems $60,000 (Board of Regents
contribution $40,000)
John C. Daigle Professorship in Free Enterprise $60,000 (Board of Regents contribution
$40,000)
Peltier Foundation Professorship in Business Administration $60,000 (Board of Regents
matching contribution $40,000)
Clarence Riviere Professorship $60,000 (Board of Regents contribution $40,000)
Arlen B. Cenac, Jr. Endowed Chair in Accounting Information Systems $600,000 (Board
of Regents contribution $400,000)
Boysie Bollinger Endowed Professorship in Business $300,000 (Board of Regents
contribution $200,000)
Charlotte Bollinger Endowed Professorship in Business $150,000 (Board of Regents
contribution $100,000)
Otto Candies Endowed Chair in Business Information Systems $600,000 (Board of
Regents contribution $400,000)
Paul Callais Endowed Professorship in Business $150,000 (Board of Regents
contribution $100,000)
John Brady Sr. and Pat Brady Endowed Professorship in Business $300,000 (Board of
Regents contribution $200,000)
Harold Callais Endowed Professorship in Economic Development $300,000 (Board of
Regents contribution $200,000)
Peter Callais Endowed Professorship in Business $150,000 (Board of Regents
contribution $100,000)
Andie Bollinger Endowed Professorship in Business $150,000 (Board of Regents
contribution $100,000)
Harvey Peltier Endowed Professorship in Business Administration $60,000 (Board of
Regents contribution $40,000)
Agnes Candies Endowed Professorship in Business Administration $60,000 (Board of
Regents contribution $40,000)

49
Numerous scholarships and awards for students are funded by individuals in the business
community, corporations and professional organizations. A partial list is included below:
Gerald Gaston College of BA Scholarships – three $500 scholarships presented annually.
Association of Government Accountants Scholarships – two $250 scholarships presented
annually.
Baton Rouge Institute of Management Accountants Scholarships – one $500 scholarships
presented annually.
Mike Bauer Scholarship – one or two $1000 scholarships presented annually.
James J. Buquet, Jr. Business Scholarships – two $400 scholarships presented annually.
Northwestern Mutual Financial Network Scholarships – two $1000 scholarships
presented annually.
Norman Swanner “Big Boy” Memorial Business Scholarships – two $500 scholarships
presented annually.
L.J. Hebert, Jr. Banking Scholarship – one $500 scholarship presented annually.
Ridley J. Gros Scholarship – one $1500 scholarship presented annually.
Glen Walters Marketing Scholarship – one $1000 scholarship presented annually.
Mr. and Mrs. O.J. Cenac Scholarship – two $500 scholarship presented annually.
Irvin Ryker Financial Planning Scholarship – one $1000 scholarship presented annually.
E.R.T. Marquette, CPA Scholarship – one $100 presented annually
South Central Chapter of the Louisiana Society of CPAs Scholarship – one $250
presented annually.
South Central Chapter of the Louisiana Society of CPAs Outstanding Accounting
Graduates Awards –two $125 presented annually.
Also, Several Louisiana Educational Quality Support Fund (LEQSF) & ITS Grants have been
awarded to faculty in the College of Business and the Management Department. Due to these
grants, all classrooms in the College of Business are equipped with state-of-the-art technologies.
5.2 Summarize any formal arrangements with industry, government, and other agencies outside
of the academic community; specifically identify use and composition of advisory board(s) and
describe nature of relationship with these board(s) (frequency of meetings, purpose of advisory
board, etc.).
The College of Business maintains an advisory board made up of local and national business
leaders, which benefits the Management program as well as all other programs within the
college. Additionally, numerous faculty are involved with external constituencies via consulting,
speaking engagements, civic memberships, and research. The College and Department have
established significant relationships with local organizations, state agencies, and non-for-profit
groups.

50
Dr. Ken Chadwick serves as the Program Director of the department’s maritime Management
Program. The program draws on input (both financial and advisory) from dozens of regional
businesses to maintain the program. Pedagogical materials have been developed with the help of
local organizations. Drs. Chadwick, Cashen, and Cater (no longer with Nicholls) have published
case studies of local and regional companies as Olympian Machine, Kleinpeter Farms Dairy of
Baton Rouge, Raising Cane's Chicken Fingers of Baton Rouge, Rabenhorst Funeral Homes of
Baton Rouge, Eagle Consulting of Gibson, LA, Rouse's Supermarkets of Thibodaux, and Emily's
Boutique of Thibodaux. Dr. Chadwick served as the guest speaker for South Central Industrial
Organization and the Bayou Industrial Group. He also serves on the board of directors of Bayou
Council Behavioral Health Services and is a member of the Thibodaux Rotary Club.
Ms. Melanie Boudreaux, MBA, PHR serves as a member and volunteer-leader in the Bayou
Society of Human Resources (SHRM) serving as the mediator between Human Resource
professionals and NSU Business students. Additionally, she is a member of the National Society
of Human Resource Management. In 2014, Ms. Boudreaux was requested by the SHRM
President to be an Ambassador for the Thibodaux Chamber of Commerce.
Dr. Jeff Haynie provides consulting services to organizations seeking an organizational
diagnosis of their climate at no charge. Summary reports from employee responses are generated
and returned to upper management.
Dr. Marilyn Frey has been the Leadership Consultant for the year-long Leadership Terrebonne
program (Sponsored by the Terrebonne Parish Chamber of Commerce) from 2011 to the present.
She has also provided Leadership training to Leadership St. Mary Program (sponsored by the St.
Mary Parish Chamber of Commerce) for 2014. Additionally, Dr. Frey has served as judge and
MC for the first-annual Best of Lafourche awards program, 2014 (Leadership Lafourche,
Lafourche and Thibodaux Chambers of Commerce joint event). Furthermore, she is the NSU
College of Business representative to the Tri-Parish Toastmasters Organization.
Dr. Luke Cashen has served as a board member of the Lafourche Chamber of Commerce from
2010-2012. He has also conducted several workshops for the Chamber and its members where
the focus was on ways the Chamber could increase value to its members and the business
community. Additional focus of these workshops was on increasing membership revenue and
membership involvement in Chamber activities. Furthermore, Dr. Cashen has served as keynote
speaker for the Houma/Terrebonne and St. Mary Rotary Clubs. Lastly, Dr.Cashen has
maintained involvement with industry via directing 15 MBA internships over the past five years
(sample companies: Edison Chouest, Thibodaux Regional Medical Center, LA Small Business
Development Center, Rouses, Terrebonne General Medical Center, Occidental Petroleum,
Danos, Terrebonne Consolidated Government, John Deere, Associated Grocers, and Byron
Talbot Contractors).
Finally, faculty involved in the management program frequently invite local executives as guest
speakers for conferences and classes. Also, job placement and student internships have created
more interactions between management faculty and the industry.

51
6. Students
6.1. Enrollment:
a. What recruitment initiatives are in place other than the university recruitment program?
Faculty volunteers attend annual scholarship banquets to gain a presence at these award
ceremonies for high school students considering Nicholls as their university. As part of the
College of Business’ outreach efforts, the External Relations committee actively recruits students
by participating in high school job fairs as well as student (e.g., University Majors Day) and
community (e.g., Colonel Day) events so potential students are more exposed to the benefits of
the Nicholls College of Business as their school and major of choice.
b. What are the qualities of students attracted to the program, (e.g., standardized test
scores for admission, GPA, etc.)
The following table shows the ACT scores and High School GPA’s for management majors from
2009 - 2014 ACT scores show a steady increase over this time period reflecting the selective
admissions standards of the University. The average ACT score from 2009 -2013 was 21.33.
The current year’s average is 22.18. Average high school GPA’s for management majors also
shows an increasing trend from 3.15 in Fall 2009 to 3.27 for the Fall 2014 semester. Again, this
is most likely attributed to the selective admissions policy changes at the University Level.
References Section 6.1-b
TERM
Number of First-
Time Students
Avg. ACT of First-
Time Students
Avg. High School GPA
of First-Time Students
Number of New
Transfer
Students
Fall 2009 18 21.33 3.15 4
Fall 2010 12 20.75 2.98 4
Fall 2011 14 21.23 3.10 11
Fall 2012 10 21.56 3.11 9
Fall 2013 11 22.18 3.12 6
Fall 2014 34 22.18 3.27 10 Notes: Number of First-Time Freshmen with the Average ACT Composite Score and the Average High School GPA.
c. Explain enrollment trends (number of majors) for the 5-year period under review (See
Appendix A).
Average enrollment for the 5 years from 2009-2010 to 2013-2014 was 164 for Fall and 164 for
Spring (up from 157 for Fall and 149 for Spring for the previous 5 year period. Also, Fall 2014-
2015 enrollment was up to 223 students. The increase in enrollment is reflective of the hard
work of faculty throughout the College of Business. The most recent increase is, in part, a
reflection of the growth of the Maritime Management Concentration.

52
References Section 6.1-c
YEAR
Number of Majors
Fall Spring
Avg. ACT of Majors
Fall Spring
2009-2010 145 157 20.71 20.54
2010-2011 161 154 20.68 20.63
2011-2012 174 164 20.95 21.17
2012-2013 159 165 21.20 21.09
2013-2014 179 180 21.36 21.59
2014-2015 223 21.45
d. Provide a 5-year projected enrollment for the program.
Based on increasing interest in the Maritime Management concentration, the Management
program is expected to increase at a conservative rate over the next 5 years. Otherwise,
enrollment for the next 5-year period can be expected to continue as it has over the past 5-year
period. Projected enrollment for the program, however, is based on maintaining the quality of
the program. In maintaining quality, AACSB accreditation along with the appropriate number of
qualified faculty are essential. AACSB accreditation has allowed the program to establish
relationships with local, regional, and national CPA firms resulting in an increased number of
recruiting and job placement opportunities for students.
6.2. Admissions Policies and Practices:
a. Are there special admissions policies for students wishing to enter this program? If
so, explain. For example, indicate numbers applying, accepted, and enrolling; the
geographic areas from which they came; special recruitment programs for minorities
and other special considerations.
There are no special admissions or recruiting policies for students wishing to enter the
Management Program beyond those for all students to enter the College of Business. All majors
must meet university requirements and have at least 54 hours of course credits with a 2.0 GPA
prior to beginning 300-level courses in the College of Business.
b. List and describe special transfer relationships with other institutions (i.e., 2+2
agreements with A.S. graduates from community colleges, etc.)
Nicholls has several basic special transfer agreements with Fletcher Technical Community
College (FTCC) and River Parish Community College (RPCC) whereby FTCC and RPCC
students are offered some University core courses at Nicholls and allowed dual-
admissions/cross-enrollment and actual transfer from these colleges to Nicholls. Also, when
there exists a four-year degree program (e.g., Petroleum Services) where FTCC students could
continue from their associates, Nicholls allows course transfers from Fletcher for these programs.
Specific for the Nicholls College of Business, Nunez Community College has an agreement
where students in the Associates degree program can transfer to the Bachelor of Science in

53
Business Administration at Nicholls. Of course, many courses taken at FTCC, RPCC, Nunez
Community College, Delgado, South Central Louisiana Technical College, and other state-wide
community colleges have comparable courses to those offered at Nicholls so students obtaining
associates from these institutions will be able to transfer these courses when applicable.
6.3 Award Productivity and Graduation Record (Address data in Appendix A):
a. Explain attrition record of candidates for degrees during the last 5 years. What
strategies are in place to address attrition?
Award productivity (i.e., the number of degrees awarded each year divided by the number that
would be expected to be awarded) has been consistently above that of the university for the past
5 years beginning in 2009. Figure 6.3-displays the comparisons of Management major award
productivity by year with the university’s productivity. As can be seen in the figure, there was a
decline from 2010 to 2012 which may be viewed as attrition. Of course, this trend has been
reversed and is anticipated to positively increase in the near future. Much of this positive trend
has occurred due to introducing the Maritime Management concentration which has been well
received from the student body. Obviously, faculty with discipline-specific knowledge (e.g.,
Management, HR, Maritime) will continue to be matched with students who major in these fields
as part of advising assignments. The quality feedback received from establishing discipline-
specific faculty-advisee relationships allows students to successfully complete the degree and
realize the benefits that come with the major. Nicholls has seen increasing costs making advising
even more beneficial so students understand the return-on-investment gained by majoring in
business. Still, the Management program is always reaching out to local businesses so we are
assured that our current curriculum offerings are properly preparing students for employment
with these organizations.

54
References Section 6.3-a
TERM
Program
FTE
Program
Awards
Program
Award Productivity
University
FTE
University
Awards
University
Award Productivity
2009-2010 140.77 40 0.28 5160.50 938 0.18
2010-2011 150.27 47 0.31 5098.93 959 0.19
2011-2012 164.67 47 0.29 4959.70 910 0.18
2012-2013 157.40 41 0.26 4801.13 914 0.19
2013-2014 172.20 49 0.28 4753.67 967 0.20
2014-2015 123.43 0 0.00 2692.77 Notes: The Award Productivity measure compares the number of degrees awarded each year to the number of degrees that would be expected to be awarded. (One-fourth for Bachelor; One-half for Associate; and Two-Thirds for Masters)
b. Explain number of semesters to graduate. If average number of semesters to graduate
exceeds university average, please explain.
Average number of years to graduate for the 5 year cycle was 4.41 years which is less than the
4.66 year average for the university (based on data provided by AIR).
References Section 6.3-b
YEAR
Avg. # of Years to Graduate
Program NSU
2009-2010 4.57 4.76
2010-2011 5.50 4.57
2011-2012 4.25 4.52
2012-2013 3.67 4.77
2013-2014 4.08 4.69
2014-2015 Note: The Average Number of Years to Graduate is an average of the number of years it takes for students within the same graduation class to graduate. This average only includes students who began their college career at Nicholls as First-Time students.
c. Explain graduation data (trends or fluctuations in number of degrees awarded) for last
5 years. Explain reason for low completer programs if applicable. (Low completer as
defined by Board of Regents: Bachelor or Associate Degrees < 8 graduates per year;
Master or Specialist Degrees < 5 graduates per year; Ph.D. Degree < 2 graduates per
year)
The average number of degrees awarded for the 5 year period is 45 (up from 35 in the previous 5
year period).
There are no low completed programs.

55
References Section 6.3-c
YEAR
Degrees
Awarded
Avg. ACT of
Graduates
2009-2010 40 20.53
2010-2011 47 20.71
2011-2012 47 21.00
2012-2013 41 21.75
2013-2014 49 21.60
2014-2015 0
6.4 Career Counseling:
What advisement and counseling service, other than provided by the university, do you
provide to students?
The Department of Management and Marketing prides itself on being accessible to students for
career counseling and advising throughout their academic career. Beyond the official university
advising period, faculty consistently practice an open-door policy, encouraging students to come
to them with questions on any aspect of their academic careers and their future career choices. In
addition, the College maintains close ties to many regional employers who routinely provide us
with information on job openings in their organizations. This information is disseminated to
students and alumni via email, Moodle, and plasma screens located in Powell and White Halls.
Area businesspeople and recruiters sometimes make presentations to students about career
opportunities and job hunting tips either in classes or to student organizations.
The College internship program has helped many students obtain internships by giving them
real-life, hands-on experience in various areas of management. Many students have obtained
permanent employment through their internship participation. Finally, the Society for Human
Resource Management provides any management major interested in joining with the
opportunity to interact with regional human resource professionals on a regular basis. These
professionals make themselves available to student members for any advice or information they
may seek.
6.5 Follow-up and Student Placement:
a. Provide information with respect to former students in the program (job placement,
continuing degree work, etc.) over the past five (5) years?
Listed below is a sample of information with regard to student placement over the past five
years. This list is not exhaustive. It is designed to demonstrate that Management graduates are
succeeding with job placement. The information listed in the table below reflects available data
provided by students on exit surveys.

56
Table 6.5
Student Placement
Individual
Company
Title
Katie Dufrene SEACOR Marine H R Assistant
Mark Mayberry Bollinger Shipyards
Alistair Moussa SAE Foundation Coord. for Advancement
Brett Landry SEACOR Marine
Lee Holcomb Garber Bros. Towing
Stacy Himel NVI, LLC Corporate Operations Asst.
Nadjah George Hancock/Whitney Bank Recruiting Coordinator
Jeffery Matte Oceaneering Commercial Project Mgr
Jonah Blanchard Chevron/DNOW Materials/Project Coord.
Chelsea Saenz Kongsberg Maritime Logistics Coordinator
Rachel Yezak SafeZone Safety Systems Business Development
Paige Liner Morris P. Hebert Human Resource Intern
Shelly Naquin Busy Bee Clinic Human Resource Assistant
Taylor Ford Rouses Supermarkets Human Resource Assistant
Delilah Duplantis Supreme Services Human Resources
Dillon Cortez JC Penny Assistant Manager
Tyler Duplantis Onshore Construction
Company, LLC
Project Superintendent
Julie Lear D&S Marine Services, LLC Benefits Administrator
Erica Baehr Hunting Energy Services Human Resources Assistant
Lea Ratley RPC, Inc. Payroll Administrator
Caitlin Keehn Enterprise Products Senior Human Resource
Assistant
Emily Doucet Tanks A Lot, Inc. Human Resources/
Accounts Receivable
Mindy Fanguy Morris P. Hebert Human Resource Generalist
b. What percentage of graduates from this major has entered graduate or professional school?
Data specific to management students does not exist. However a survey of fall 2014 graduates
of the Department showed that 41% of students responded that they plan to pursue another
degree or a higher degree after graduation.
7. Faculty

57
7.1 Faculty Who Are Direct Participants in the Program:
Table 7.1
FACULTY PROFILE AND TEACHING LOAD (Report quantity for last 5 years or since last review)
Name
Date of
Employment
Present Rank
Full-Time /
Part-Time
Tenured/
Non-
Tenured
Highest
Degree
Earned
Avg Teaching
Load
No. of Advisees
Assigned by Program
FT PT T NT Credit
Hour
Contact
Hour
Graduate Under-
grad
Luke Cashen Fall 2004 Associate Professor X X Ph.D. 7
7
545
Jim Cater Fall 2006 Assistant Professor X X Ph.D. 10 10 90
Ken Chadwick Fall 2000 Department Head &
Professor
X X D.B.A 7 7 710
Jeff Haynie Fall 2012 Assistant Professor X X Ph.D. 9 9 143
Xun Li Fall 2009 Assistant Professor X X Ph.D. 9 9 245
Marilyn Macik-
Frey
Fall 2007 Assistant Dean
&Associate Professor
X X Ph.D. 7 7 315
Sonya Premeaux Fall 2003 Associate Dean &
Associate Professor
X X Ph.D. 4.5 4.5
Anushiri Rawat Fall 2010 Assistant Professor X X Ph.D. 9 9 118
Otmar Varela Fall 2003 Associate Professor X X Ph.D. 10 10 18
Viraj Varma Fall 2014 Assistant Professor X X Ph.D. 9 9 13
Melanie
Boudreaux
Fall 2013 Instructor X X M.B.A. 12 12 104
Stacy Nichols Fall 2006,
2008
Instructor X X M.B.A. 12 12 157
Table 7.2
FACULTY RESEARCH / SCHOLARLY ACTIVITIES
(Report quantity for last 5 years or since last review)

58
Name
Number of
Refereed
Publications
Number
of
Citations
Grants
Number of
Presentations
Number of
Exhibitions
Number Amount Paper Poster
Luke Cashen 4 3 4 $345,439 4
Melanie Boudreaux (Instructor)
0 0
Ken Chadwick 5 41 1 $100.00 4
Jeff Haynie 5 18 6
Xun Li 9 228 4
Marilyn Macik-Frey 7 39 4
Viraj Varma (new, Fall 2014) 1 4

59
Table 7.3
FACULTY SERVICE AND AWARDS
(Report quantity for last 5 years or since last review)
Name
Committees
National/State
Committees
Professional
Committees
Awards /
Recognition
University College Program Department
Luke Cashen 16 37 1 10 9
Melanie Boudreaux
(Instructor)
1 2 1
Ken Chadwick 5 23 1 10 10
Jeff Haynie 6 6 1 1
Xun Li 4 7 5 9
Marilyn Macik-Frey 9 36 1 6 3
Viraj Varma (new) 1 4 1 1
7.2 Narrative of Faculty Accomplishments:

60
Summarize quality of faculty achievements accomplished in program.
Dr. Ken Chadwick, Professor of Management, has served as the Head of the Department of
Management and Marketing since the fall of 2005. He previously held the Harvey Peltier, Sr.
Endowed Professorship in Business Administration. He currently holds the
Peter Callais Endowed Professorship in Business (awarded and the Otto B. Candies Endowed
Professorship in Maritime Management (both awarded in 2013). He also serves as the Director
of the College’s new Maritime Management program. Dr. Chadwick mainly teaches the senior-
level strategy course. He has presented and published research in several areas of management
with articles appearing in leading academic journals such as the Academy of Management
Journal, Entrepreneurship: Theory and Practice, the Journal of Business Research and SAM
Advanced Management Journal. Dr. Chadwick has also served as Principal or Co-Principal
Investigator on ten grants in the College of Business that were awarded total approximately $
700,000.00.
Dr. Luke Cashen serves as an Associate Professor of Management where he predominantly
teaches undergraduate and graduate courses in Strategic Management. Additionally, he teaches
courses in the areas of Multinational Management and Principles of Management. His teaching
and service to his students have earned him the College of Business 2007and 2011 Excellence in
Teaching Award, as well as the Apple Award: Contributing to the Success of Graduates for the
2006-2007, 2008-2009, 2011-2012, and 2013-2014 academic years. Dr. Cashen has presented
research at national and regional conferences in the areas of restructuring, governance, executive
equity ownership, and institutional theory. Additionally, he has published in peer-reviewed
journals in the same topics. Dr. Cashen actively represents the Department and College through
his service at all levels of the University. Furthermore, he serves as Director of the
Traditional/Evening MBA Program where his duties include managing the program’s day-to-day
issues, as well as promotion and recruitment.
Dr. Marilyn Macik-Frey, Associate Professor of Management has also served as the Assistant
Dean of the College of Business since 2012. She currently holds the Candies Family Endowed
Professorship in Business Administration. She teaches undergraduate level Organizational
Behavior, Human Relations and Interpersonal Skills, Principles of Management and graduate
level Leadership and Ethics courses. She has published in the Journal of Management, Journal
of Management Studies, Journal of Organizational Behavior, Journal of Knowledge
Management, and Journal of Business and Leadership. Her award winning article in the
Consulting Psychology Journal (2004) has been reprinted in the American Psychological
Association’s The Wisdom of Coaching (2007) and she has published several invited book
chapters in her areas of interest. She and her co-authors received the McGraw Hill
Distinguished Paper Award in the Association of Business Communication-Southwest Division
in 2013 for their work related to social media, leadership and crisis communication.
Dr. Xun Li serves as an Assistant Professor of Management, having joined the faculty of the

61
Department of Management and Marketing in the fall of 2009. She teaches classes in Operations
Management and Quantitative Analysis. Dr. Li has presented research at international
conferences in the areas of supply chain management, operations management, decision
sciences, and information privacy. Additionally, she has published in peer-reviewed journals in
the same topics. Dr. Li has been serving on committees focusing on the establishment of internal
relationships with relevant parties, external relationship with communities, and the assessment of
undergraduate programs.
Dr. Jeffrey J. Haynie is an Assistant Professor of Management who currently holds the Entergy
Endowed Professorship in Business. Jeffrey joined the faculty in Fall of 2012 and teaches
various management classes including Principles of Management and Entrepreneurship. His
research interests consist of organizational justice, relational trust, and core self-evaluations.
Several of his academic contributions have been presented at national and regional conferences
along with appearing in peer reviewed journals including Small Group Research and Leadership
Quarterly. He also serves on several college and university committees and is an active member
in both the Academy of Management and Southern Management Association.
Dr. Viraj Varma serves as an Assistant Professor of Management, having joined the faculty of
the Department of Management in the Fall of 2014. He received a PhD in Management, and an
M.S. in Human Resource Management, both from Auburn University. Prior to that, he obtained
an MBA from Indian Institute of Technology Kharagpur, and a B.S. in Mechanical Engineering
from Jadavpur University, both in India. He has also worked in the industry for over nine years
and was involved in power plant operations, project management, software development, and
change management consulting. He is also a certified Senior Professional in Human Resources.
Dr. Varma primarily teaches courses on organizational behavior and human resource
management within the undergraduate, MBA, and EMBA programs. He is an active member of
the Academy of Management, Southern Management Association, Society for Human Resource
Management, and Bayou SHRM. Dr. Varma’s research interests include strategy-as-practice,
organizational change, employee engagement, and strategic human resource management. He
has regularly presented his research at national and international conferences.
Mrs. Melanie Boudreaux serves as an Instructor of Management, having joined the faculty of the
Department of Management in the fall of 2013. She teaches undergraduate level courses
including: Principles of Management, Human Resource Management, Human Resources
Seminar, and Human Relations and Interpersonal Skills. Mrs. Melanie Boudreaux actively
supports the Department of Management and the College of Business through her service. She is
the faculty advisor for the Society of Human Resource Management at Nicholls State University.
She is also a member of the National Society of Human Resource Management and a member of
the local Bayou Society of Human Resource Management. These societies along with the
relationships Melanie has built in the community help connect students to local and national
Human Resource practitioners.
7.3 Staffing Changes:

62
a. What staffing changes have occurred in the last five (5) years?
2010
Dr. Otmar Varela left the faculty
Mrs. Stacey Nichols joined the faculty
2011
Dr. Sonya Premeaux and left the faculty
Dr. Anushri Rawat joined the faculty
2012
Dr. Jim Cater left the faculty
Dr. Jeff Haynie joined the faculty
2013
Mrs. Melanie Boudreaux joined the faculty
Mr. Bill Riviere, Mr. Reed Davison, and Dr. Joe Orgeron join the faulty as adjunct instructors
teaching maritime courses.
2014
Dr. Rawat left the faculty
Dr. Varma joined the faculty
b. What staffing changes are planned (needed) in the next five (5) years?
Although no staffing changes are planned a significant increase in demand for the maritime
management concentration may require an increase in course offerings.
c. Give a rationale.
Student demand for the management concentration has been quite strong since its inception in
fall 2013 (80 + students).
7.4 Strengths or Specialists Not Existing in Present Faculty:
What strengths or specialties not possessed by current faculty would be desirable to
improve the program and its mission?
There are no obvious areas of weakness in meeting the needs of Management students.

63
7.5 Special Faculty Services:
a. What professional development program(s) or activities, other than provided by the
university, does the department have for its faculty?
The Management Department as part of the College of Business regularly provides partial
funding ($1000 per year per faculty member) for faculty members to attend academic
conferences to present scholarly works, such as academic papers and case studies.
The College of Business Administration has a formal mentor program for new faculty
members.
b. What other services are the faculty providing?
Dr. Luke Cashen serves as the Director of the MBA program. Dr. Ken Chadwick serves as the
Head of the Management and Marketing Department, Director of the Maritime Management
Program and Athletic Advisor. Melanie Boudreaux is the faculty advisor for the student
organization--Society of Human Resource Management. Dr. Jeff Haynie serves as the advisor of
the MBA Association. Dr. Marilyn Macik-Frey serves as the assistant Dean to the College.
8. Departmental Objectives Related to the Program (See Part 1 of Level III Annual Plans)
8.1 Annual Plans for Program
What objectives related to your program has your Department achieved within the past five
years? (As reflected in Part I of the Level III Annual Plan Assessments for past five years)
In support of maintaining a commitment to intellectual contribution management faculty
continue to publish and present research.
Faculty members in management, Dr. Marilyn Macik-Frey and Dr. Ken Chadwick, continue
to solicit more internship opportunities through the College. New firms participating include
Edison Chouest Offshore, Bollinger Shipyards, Cajun Cutters, Offshore Marine Contractors,
SEACOR Marine, Oceaneering, Garber Bros., Inc., Crescent Towing, Synergy Bank, D & S
Marine, and others.
The program now accepts transfer credits from community colleges as per agreements.
Management courses have/are been developed in support of Nicholls On-line.
Faculty continue to write grant proposals and receive monetary awards.
In support of efforts to increase visibility management faculty appeared on HTV to promote
the College of Business and the Human Resource Management Concentration. In addition,
Dr. Chadwick has done multiple interviews and spoken to both the South Central Industrial
Association and Bayou Industrial Group BIG in support of the Maritime Concentration.
All faculty members are using Moodle.

64
8.2 Changes in Departmental/Program Objectives:
What changes, if any, have occurred in program objectives within the past five years?
The Management Expected Learning Outcomes were refined in 2009 (reduced to five) to target
specific areas of expected competence.
The current student learning outcomes are:
1. Graduates in Management will be able to demonstrate understanding of the key principles of
management.
2. Graduates in Management will be able to recognize and correctly apply human resource
management practices.
3. Graduates in Management will be able to recognize and apply appropriate techniques in the
applications associated with an organization’s operations.
4. Graduates in Management will demonstrate knowledge and ability to apply organizational
behavior topics.
5. Graduates in Management will be able to identify and/or differentiate the critical components
of the strategic management process.
The outcomes reflect the core components of the management program and can be addressed and
assessed in the management courses—principles, human resources, operations, organization
behavior, and strategy.
8.3 Anticipated Changes in Departmental/Program Objectives:
What changes, if any, in program objectives are being considered for the future (ex:
expansion? downsizing? other?) Why? To what extent will the change in objectives affect
changes in the program? How will these changes affect enrollment, staffing and costs?
No changes currently being considered.
8.4 Do you believe the resources allocated to this academic program are adequate in proportion
to other programs in your college? If not, provide data and information to justify your answer.
The resources allocated to the Management program seem adequate in proportion to the other
programs in the college.
9. Informational Resources/Libraries

65
Are the library resources appropriate for the needs of the program? Why or why not?
Current library resources are appropriate for faculty and students’ informational needs. Research
collections and databases available via the electronic are adequate to support current courses and
research. In addition, when articles/books are not immediately available, the interlibrary loan
services provide a timely response to faculty needs.
10. Facilities-Equipment
10.1 Current Facilities and Equipment
The College has seventeen classrooms available for use in Powell and White Halls that are
equipped with computers containing CD-ROM and DVD drives, Internet access, ceiling-
mounted electronic projection systems, and VCRs. Most have wireless devices and speakers.
The system in 140 Powell Hall has a wireless microphone and a higher-end sound system. Two
rooms in White Hall also have Smart Boards. Three portable laptop/projection systems are also
available. The classrooms that do not have Smart Boards have monitors with Smart technology,
allowing the use of digital ink as an alternative to whiteboard and chalkboards.
The College has a laptop lab serves that as a mobile lab to be used in any classroom... This lab
contains 40 laptops with mice, chargers and independent numeric keypads for data entry. (grant
funded)
The College has the Sales and Interactive Training Lab utilized in the Professional Selling
courses which contains a professional, corporate-style training facility including role-play rooms
that are used to enhance the sales and behavioral skills of students in the program. This facility is
also used for the Annual Bayou Sales Challenge, an intercollegiate sales role-play competition
hosted by the College of Business at Nicholls each fall. (grant funded)
Two computer labs are available in Powell Hall. One lab, 109 Powell, has computers with CD-
ROMs, DVDs, and CD burners, two laser printers, one color inkjet printer, a scanner, and a
copier. These computers all have Internet access and are running Windows XP, MS Office
Professional, SPSS, QM, POM, Excel QM2, and Research Insight. The other lab (110 Powell),
designed for teaching, has 40 computers, including 39 for students and one for faculty, with the
same specifications and software as those in Powell 109. This lab also has a ceiling mounted
projection unit. Additionally, there are two computer labs in While Hall. These labs are
dedicated to the IS program, but when available can be used for other programs as well. (grant
funded)
All faculty and staff in the department have computers and printers in their offices. These
include network and Internet access, as well as a web-based e-mail system and a network
connection to a color printer. Faculty, staff, and students have access to many on-line search
engines and databases through Ellender Memorial Library. Powell and White Halls, as well as
the courtyard between the buildings, have wireless access.

66
The Cliff Gresham Room provides tiered seating for 63 students with fixed tables and chairs.
(funded by donation)
The Entré Lab, as with other business incubators, is designed to provide entrepreneurs with
temporary space and resources to assess the feasibility of a new venture, initiate start-up and
bring their product or service to market. It is the first such incubator of its kind in the area.
Students have access to office space, computers with wireless Internet access, a printer, fax
machine, scanner and binding equipment, telephones, a resource/library room, business planning
software and a high-quality boardroom and projection systems for making presentations to
stakeholders. (grant funded)
Powell Auditorium, 140 Powell, was renovated in Spring 2012. It seats 122 with 6 additional
handicap seating. The chairs are in-line, attached with lumbar support. The tables have wire
management built into the legs with enough power hubs for each student. The room offers dual
projectors, recessed lighting, and built in speaker system. (funded through donations and
building use fees)
The Marilyn Gaubert Ponder Collaborative Learning and Resource Center was developed to
enhance learning beyond the classroom, the Marilyn Gaubert Ponder Collaborative Learning and
Resource Center encourages professional socialization, networking and teamwork among
students. The center contains an electronic stock ticker, two plasma screen televisions airing
business news and current events, various business publications, computer work stations, a
coffee and sandwich shop and comfortable furniture for collaborative work or just relaxation.
(grant funded)
10.2 Needed Additional Facilities:
a) What additional facilities, if any, are needed in order to improve the quality of the
programs being offered?
b) List any such items proposed for the next five years and provide a cost estimate for each
biennium.
No additional facilities are deemed critical for the management program next five years.
10.3 Needed Additional Equipment:
a) What additional fixed and movable equipment, if any is needed in order to improve the
quality of the program being offered?
b) List all items proposed for the next five years and provide a cost estimate.
No additional equipment is deemed critical for improving the quality of the management
program next five years.

67
Conclusion
Briefly summarize the following:
a. major program accomplishments in past five years.
The major accomplishment is the development of the maritime concentration. The concentration
is unique to the state, and, we believe, the country. We know of no other program that provides
a concentration in our area of focus—the oil and gas sector of the maritime industry. Funded
and developed by regional maritime related firms, the program is designed to create additional
value for both students and employers
Since its implementation in the fall of 2013, the concentration has grown to over 80 students. In
addition, the relationship that have been developed or enhanced with regional businesses and
industry associations has created strong partnerships for the College of Business.
b. current and anticipated impediments to program growth and development.
Past, and potential future, budget cuts and faculty turnover. The department (and college) had to
eliminate concentrations that could help drive growth in the department and college (e.g., health
care concentration, entrepreneurship concentration).
In addition, the university needs to focus its limited (and dwindling) resources on its core
purpose “…. the education of a diverse student body in a culturally rich and engaging learning
environment through quality teaching, research, and service…..” To do this, we need more
effort on recruiting and retaining the best students and faculty.
c. vision for program development in next five years.
There has been preliminary discussion of developing the maritime concentration into a major.

68
APPENDIX A
FACT SHEET for 5 YEAR PROGRAM REVIEW
`Date: Feb. 2015
Program: Management & Marketing
Department: Management
Department Head: ken Chadwick
Degree Classification: Undergraduate
References Section 6.1-b
TERM
Number of First-
Time Students
Avg. ACT of First-
Time Students
Avg. High School GPA
of First-Time Students
Number of New
Transfer
Students
Fall 2009 18 21.33 3.15 4
Fall 2010 12 20.75 2.98 4
Fall 2011 14 21.23 3.10 11
Fall 2012 10 21.56 3.11 9
Fall 2013 11 22.18 3.12 6
Fall 2014 34 22.18 3.27 10 Notes: Number of First-Time Freshmen with the Average ACT Composite Score and the Average High School GPA.
References Section 6.1-c
YEAR
Number of Majors
Fall Spring
Avg. ACT of Majors
Fall Spring
2009-2010 145 157 20.71 20.54
2010-2011 161 154 20.68 20.63
2011-2012 174 164 20.95 21.17
2012-2013 159 165 21.20 21.09
2013-2014 179 180 21.36 21.59
2014-2015 223 21.45
References Section 6.3-a
TERM
Program FTE
Program Awards
Program Award
Productivity
University FTE
University Awards
University Award
Productivity
2009-2010 140.77 40 0.28 5160.50 938 0.18
2010-2011 150.27 47 0.31 5098.93 959 0.19
2011-2012 164.67 47 0.29 4959.70 910 0.18
2012-2013 157.40 41 0.26 4801.13 914 0.19
2013-2014 172.20 49 0.28 4753.67 967 0.20
2014-2015 123.43 0 0.00 2692.77

69
Notes: The Award Productivity measure compares the number of degrees awarded each year to the number of degrees that would be expected to be awarded. (One-fourth for Bachelor; One-half for Associate; and Two-Thirds for Masters)
References Section 6.3-b
YEAR
Avg. # of Years to Graduate
Program NSU
2009-2010 4.57 4.76
2010-2011 5.50 4.57
2011-2012 4.25 4.52
2012-2013 3.67 4.77
2013-2014 4.08 4.69
2014-2015 Note: The Average Number of Years to Graduate is an average of the number of years it takes for students within the same graduation class to graduate. This average only includes students who began their college career at Nicholls as First-Time students.
References Section 6.3-c
YEAR
Degrees
Awarded
Avg. ACT of
Graduates
2009-2010 40 20.53
2010-2011 47 20.71
2011-2012 47 21.00
2012-2013 41 21.75
2013-2014 49 21.60
2014-2015 0

70
APPENDIX B
MATRIX LINKING PROGRAM CURRICULUM TO GENERAL EDUCATION GOALS AND
LEARNING OUTCOMES
General education core proficiencies applied in major courses
NOTE: The student learning outcomes for each class are listed below.
Effective Communication
MNGT 301 (Principles of Management) requires students to compile presentations on the
practical relevance of materials covered in the course. Students also choose a publicly traded
company to profile and determine its level of success in the company’s industry. These projects
draw on students’ ability to clearly write and organize logical arguments as well as present these
arguments to a captive audience.
MNGT 305 (Entrepreneurship) involves making and justifying decisions relating to the
marketing, finance, and overall operations of a proposed business venture. These decisions are
built into a group business plan that is turned in at the end of the semester. The arguments and
projections found within the business plan are also pitch by student teams, requiring a clear and
coherent presentation of the analyzed material.
MNGT 470 (Organizational Structure and Behavior) Students are required to work in groups to
analyze and present a case to the class. The student must be able to synthesize information and
present it in an organized and comprehensive manner using strong verbal skills. They must also
do a written executive summary of the case summarizing their analysis.
MNGT 370 (Human Relations and Interpersonal Skills) requires students to present a relevant
book using effective analysis of audience, time, purpose, visual aids, lead the class in an activity,
and use strong oral presentation skills. The course also requires role playing to develop
listening, conflict management, negotiation and other interpersonal communication skills.
Students must also participate in an ethical dilemma debate where they must use persuasion,
active listening, and communication skills.
MNGT 420 (Multinational Management) students formally present current topics in
multinational management and are evaluated on: proper organization of materials and arguments
made; effectiveness and professionalism of delivery; the proper use of visual aids; and the ability
to respond to audience questions.
Quantitative Reasoning and Mathematics
Students in MNGT 368 (Operations Management) are required to recognize and apply
optimization, statistical and heuristic decision models in managing the production function. An
understanding of core concepts and techniques is needed to demonstrate the ability to effectively
assess the data and demonstrate its use in decision-making.

71
Students in (Human Resource Management) are required to calculate and analyze employee
turnover figures. Students must also understand correlation coefficients to determine if a test
used for employee selection is valid.
Computer Literacy
All students in the Management curriculum are expected to possess at least a basic level of
competence in computer literacy. In addition, all Management faculty incorporate the use of
Moodle as a means of providing information and feedback to students.
Specifically, courses such as MNGT 305 (Entrepreneurship), MNGT 330 (Introduction to
Maritime Management) and MNGT 470 (Organizational Structure and Behavior) require
students to collect, organize, and make presentations using word processing and/or electronic
presentation software.
MAJOR
Courses
Effective
Communication
Quantitative
Reasoning
Computer Literacy
** All MNGT courses require some
degree of computer literacy
MNGT
301 SLOs 1,2,3,4,6
MNGT
305 SLO s 1,2 SLOs 3,4,5
MNGT
330 SLOs 2,3,6 SLO 1
MNGT
367 SLOs 1,4 SLOs 3,4
MNGT
368 SLOs 1,2,4 SLO 2
MNGT
370 SLOs 2,4
MNGT
420
MNGT
440 SLOs 2,3,4
MNGT
450 SLO 2
MNGT
470 SLOs 3,4 SLO 8
MNGT
475 SLOs 2,4,6 SLO 5 SLO 5

72
MNGT 301 - Student Outcome Objectives:
1. demonstrate an understanding of the role of managers in organizations, especially related
to how managers deal with the current rate of change, globalization, and technological
advances in organizations
2. demonstrate an understanding of the primary management functions (planning,
organizing, directing, controlling) and their interrelationships
3. demonstrate an understanding of how external and internal business environments
influence strategic decision making
4. demonstrate an understanding of the influence of both organizational and climate on
individual and group behavior
5. define management terminology at the various pertinent levels including the individual-
level (e.g., personality), group-level (e.g., leadership), and organizational-level (e.g.,
culture)
6. communicate the ethical implications of managerial decisions and business activities
7. participate in group work to practice and reinforce management principles (e.g., leading,
conflict management, teamwork, motivation, communication)
8. identify ways management principles impact your individual life as well as determine the
management style that fits you best
MNGT 305 - Student Outcome Objectives:
1. identify and discuss the roles entrepreneurs play in society;
2. identify environmental factors impacting new venture opportunities and threats
3. demonstrate an understanding of industry and competitor analyses
4. assess the feasibility of new venture opportunities;
5. demonstrate an understanding of how to launch and grow new ventures
MNGT 330 - Student Outcome Objectives:
1. Identify vessel types and vessel terminology
2. Demonstrate an understanding of the upstream sector of the offshore energy industry
3. Demonstrate an understanding of offshore energy development and transportation
4. Recognize drivers of demand in the offshore energy industry
5. Understand various aspects internal and external vessel management
6. Demonstrate an understanding of safety and regulatory standards

73
MNGT 367 - STUDENT OUTCOME OBJECTIVES:
1. demonstrate an understanding of human resource management activities (strategic HR
management, equal employment opportunity, staffing, talent management and
development, risk management and worker protection, and employee and labor relations)
2. identify laws, policies, and best practices that impact the way organizations manage their
human resources
3. identify human resource management issues facing local organizations and communicate
the implications these issues have on businesses in real-world settings
4. demonstrate an application of the HR concepts and legal requirements to real-life
scenarios
MNGT 368 - Student Outcome Objectives:
1. Demonstrate an understanding of how goods and services are produced and the overall
management of production systems.
2. Recognize and apply the role of optimization, statistical and heuristic decision models in
the management of production systems.
3. Demonstrate an understanding of the importance of the production function as a tool of
global competitive strategy.
4. Recognize the core concepts and techniques of operations management and relate/apply
to production and service environments.
5. Demonstrate an understanding of how the strategy aspect of a firm is related to operations
management.
MNGT 370 - Student Outcome Objectives:
1. To increase awareness of your strengths and “lesser strengths” in interpersonal
relationships.
2. To build on strengths in interpersonal skills through practice, role-playing, and case
studies.
3. To understand the importance of interpersonal skills in effective leadership,
communication, conflict management, career management, and motivating others.
4. To understand the importance of personal strengths and intrapersonal characteristics in
effective time management, stress management, and career management.
MNGT 420 - Student Outcome Objectives: After completing this courses student will
understand:
1. International trade and the influence of political and legal factors
2. Culture and its impact on business practices
3. How economies are defined and classified around the world
4. Economic cooperation and integration

74
5. International monetary systems
6. Foreign exchange and the global capital markets
7. Importing/Exporting and global sourcing
8. Global strategy and entrepreneurship
9. Talent Management through a global framework
MNGT 440
STUDENT OUTCOME OBJECTIVES:
1. address a variety of human resource management topics as they occur in real-world
settings
2. apply HR common practices to hypothetical cases
3. independently identify laws, policies, and best practices (through outside research) that
impact the way organizations manage their human resources
4. lead and participate in educated discussions and debates on topics relevant to human
resource professionals
MNGT 450 - Student Outcome Objectives:
1. Understand issues and techniques in staffing organizations
2. Analyze factors in the organization’s environment that affect staffing decisions,
including legal issues, measurement in selection, internal and external recruitment, and
selection
3. Apply knowledge of staffing issues to practical situations
MNGT 470
Student Outcome Objectives:
1. Students will understand the domain and causes of individual performance and other
relevant work related behaviors.
2. Students will understand how employees’ personalities, perceptions, emotions, and
attitudes influence their behaviors in work settings.
3. The student will be familiar with major motivational theories.
4. Students will be familiar with the management of individuals and groups based on key
theories in the field.
5. The student will understand the differences between management of individuals and
teams.
6. The course will clarify the role that group process (i.e. cohesiveness, communication,
conflict, decision making and group norms) play in group performance.
7. The student will explore models illustrating how individuals and groups make decisions.
8. The student will analyze the variables explaining organizational effectiveness.
MNGT 475
Student Outcome Objectives:

75
1. understand the strategic importance of compensation to the achievement of organizational
goals
2. identify links between compensation objectives and business strategy
3. understand the contextual influences on compensation practice
4. differentiate among various types of compensation tools
5. build internally and externally consistent pay structures
6. demonstrate an understanding of the importance of non-monetary rewards in an
employee’s compensation package

76
Revised April 2012
APPENDIX C
EVALUATION TEAM REPORT
Program: _______________________________________________________________
Department: ___________________________ Department Head: _________________
Date of this report: ___________________________
1. What actions were taken to address concerns/recommendations from the last five-year
review?
Comments: ____________________________________________________
____________________________________________________
____________________________________________________
____________________________________________________
2. Is program relevant to the university mission? Is it essential to the university? (Sec. 1)
Comments: ____________________________________________________
____________________________________________________
____________________________________________________
____________________________________________________
3. Is curriculum appropriately reviewed and revised to meet the needs of students and
community? (Sec. 2.1)
Comments: ____________________________________________________
____________________________________________________
____________________________________________________
____________________________________________________
4. Are Student Outcomes Objectives measurable? Assessed appropriately? Are
improvements/changes made for improved learning based on assessments? (Sec. 2.3)
Comments: ____________________________________________________
____________________________________________________
____________________________________________________
____________________________________________________
5. Based on data provided, does the program compare favorably with institutions
within a 100 mile radius? (Sec. 3)
Comments: ____________________________________________________
____________________________________________________
____________________________________________________
____________________________________________________

77
6. Based on demand and interest in the program and a 5-year projection in graduates, how
would you assess the future of the program? (Sec. 4, 5, 6)
Comments: ___________________________________________________
____________________________________________________
____________________________________________________
____________________________________________________
7. Is the faculty profile appropriate to accomplish the program’s mission? How would you
rate the Teaching, Research and Service of the faculty in the program? (Sec. 7)
Comments: __________________________________________________
__________________________________________________
__________________________________________________
__________________________________________________
8. Is there a pattern of "continuous improvement" demonstrated over the past five years, as
evidenced in the Annual Plans? (Sec. 8)
Comments: __________________________________________________
__________________________________________________
__________________________________________________
__________________________________________________
9. Are departmental support, equipment and facilities appropriate to meet the needs of the
program? (Sec. 8, 9, 10)
Comments: __________________________________________________
__________________________________________________
__________________________________________________
__________________________________________________
10. Overall strengths and weakness of academic program based on report and presentation.
STRENGTHS WEAKNESSES
Recommendations: __________________________________________________
______________________________________________________
______________________________________________________
______________________________________________________

78
PROVIDE A WRITTEN RESPONSE (Form A.06) TO THIS REPORT TO
ACADEMIC AFFAIRS WITHIN FOUR (4) WEEKS AFTER THE DATE OF THE
PROGRAM REVIEW.
APPENDIX D
FORM A (revised 2006)
Use of Results of Program Review
Date:
Name of Department: Management and marketing
Name of Degree Program: Management
Describe at least one improvement or change (action plan) that will be made in the
degree program (listed above) as a result of the Academic Council’s review.
NOTE: Progress towards the completion of this action plan should be documented in the
departmental annual plan, Part 1.C. This evidence of action taken will be reviewed as
part of the program's next five-year review.
Signature of Department Head ____________________________________
NOTE: Forward one completed copy to the dean of the academic college, one
completed copy to the Vice President for Academic Affairs, and one electronic
copy to the Assistant VPAA within 4 weeks after the date of the Academic
Review.
NOTE: Forward one completed copy to the dean of the academic college, one
completed copy to the Vice President for Academic Affairs, and one electronic copy to
the Assistant VPAA within 4 weeks after the date of the Academic Review.