programa de doctorado en análisis económico
TRANSCRIPT

Programa de Doctorado en Análisis Económico
Innovation in Public Sector Services
PhD Dissertation Héctor Javier Lagunes Marín
Under the supervision of Prof. Dr. Luis Rubalcaba Bermejo
Alcalá de Henares, November 2014

2
One generation departs and another generation comes,
but the world forever stays.
The sun rises and the sun sets;
then it presses on to the place where it rises.
Shifting south, then north,
back and forth shifts the wind, constantly shifting its course.
All rivers flow to the sea,
yet never does the sea become full.
To the place where they flow,
the rivers continue to flow.
All things are wearisome,
too wearisome for words.
The eye is not satisfied by seeing
nor has the ear enough of hearing.
What has been, that will be; what has been done, that will be done. Nothing is new under the
sun!
Even the thing of which we say, “See, this is new!” has already existed in the ages that
preceded us.
There is no remembrance of past generations; nor will future generations be remembered by
those who come after them.
Book of Ecclesiastes

3
To my blood: Hector, Carmen, Luis Daniel, Myriam and Joaquin.

4
Acknowledgements
Although I am the only one who will take credit for the content in this thesis dissertation, I am
aware that the merits that might be found in it are not the result of my only work and effort.
Many people collaborated in some way to it and I want to take this place for publicly give
recognition to them and share any merit. There are, however, some persons to whom I would
like to explicitly give my gratitude.
I want to start by in first place making a recognition to my thesis supervisor, Luis Rubalcaba.
His tutorship went far researching and the academic place. Thank you professor Luis for being
patient, generous and careful to me.
I am especially thankful to all those persons who in some way provided me with comments,
insights, research material and any kind of help for the purpose of developing my thesis
dissertation. Nonetheless, I would like to make explicit my gratitude to some persons in
particular. I want to say thank you to Hugo Hollanders for hosting me at the UNU-MERIT
institute during a 3 months research visiting and also for taking the time to review my work
and make many useful comments and suggestions. In the same way, thanks to Anthony
Arundel, from the University of Tasmania, who was very kind to me during my visit at UNU-
MERIT and also took from his time for reviewing my work. Thanks also to Cristina Suárez, from
the University of Alcala, for her directions on my econometric applications. Thanks to Marielle
Linting, from the University of Leiden, for providing me with the programs for running
categorical component analysis and bootstrap and thanks to Jose A. Sánchez, from CIDE, for
providing me with the information used for analysis in chapter 4.
I would like to also make a recognition to people who gave me support, inspiration and good
company during my days of work. Thanks to people from the Saint Angel parish for their
friendship, thanks to Jorge and Gisela for being good spirited on me and thanks to my fellow
Oscar for being a friend and a mentor.
Overall I must thank to my parents, Hector and Carmen. They were in first place who made
possible my journey towards a PhD title. They have through my whole life given to me all kinds
of support. Thanks mom and dad! I love you.

5
Abstract
Studies already acknowledge some distinctive features of public innovation, such as factors
having an influence in innovation generation, factors enabling the innovation process and also
barriers counteracting the innovation process. Public sector innovation is an issue increasingly
demanding for attention. The present dissertation is aiming on the issue through an empirical-
quantitative approach. What has been stated in theory has only in a few cases been properly
compared to corresponding empirical data. The present study is one more step ahead in that
direction.
A main objective of this dissertation is to challenge conventional thinking about public sector
being a barren ground for innovative activities. There is an emerging tradition of public
innovation studies where it can be observed a tendency to contradict the view of a public
sector where sustainable improvement processes are neglected. The conclusions that may be
obtained after the applied empirical methods are meant to be part of it.
Three particular objectives lead the research questions and analysis presented along
dissertation: 1) making some propositions and giving empirical evidence on the main factors
driving and enabling public innovation to its successful implementation, 2) identifying some
features of the innovation dynamics that can be seen as specific of the public sector and 3)
making an assessment of results of innovation implementation.
Innovation in the public sector is the result of a complex process in which many factors play a
role. Factors are of different kinds and they can be identified under different theoretical views
on public innovation. Lack of the right incentives – market incentives in particular – has been
thought for a while to be at the root of the public sector’s innovation gap. However, despite
lack of market incentives, it is possible to find a set of factors that are useful to innovation
development in public organizations. Chapter 1 is addressed to identify some factors driving
and enabling public sector innovation and to assess their effects on the innovation
performance of public sector organizations. The analysis is based on data at EU level provided
by the Innobarometer 2010 Survey. Results of empirical analysis suggest that factors related to
some degree of use of external sources of information, active involvement of managers and
implicating staff and users in the innovation process have a positive effect on implementation
of service innovations; furthermore, they have a particularly significant effect on the
implementation of services that are new to the whole public sector. In turn, political and
legislative factors seem to be useful for implementing service innovations but their effect on
new service implementation could not be properly assessed.
The use of external sources for innovation has an increasing role in organizations of all kinds;
they can be essential for creating and developing innovation. With a particular theoretical
approach, Chapter 2 provides with a framework to compare how significant it is for public
service innovation the use of internal and external sources of information in innovation
development. At the same time, statistical significance on innovation implementation from the
use of both kinds of sources is assessed basing on evidence from the Innobarometer 2010
Survey. Results indicate a positive and significant relation between both the use of internal and
external sources of information and the implementation of service innovations. They also give
evidence to believe that using external sources of knowledge and information for innovation

6
development is especially important for the implementation of services that are new to the
whole public sector.
High risk aversion is argued to be one of the main causes for the innovation gap between
public organizations and private firms. At the same time, risk aversion is a consequence of
public policy leaded by public accountability instead of market profit. Then, one could
reasonably ask what is worth for public organizations to take the risks of innovation. For
approaching to the answer, the followed method consists in estimating probabilities of
positive and negative effects experienced after implementation of service innovations by
public organizations represented in the Innobarometer 2010 Survey. Chapter 3 presents
empirical evidence for helping to support assumptions about the potential of public
innovations for achieving positive effects after implementation, and also about the risk of
suffering some negative effects. Analysis is based on statistical significance of the effect of
being an organization that has implemented service innovations on the probability of
experiencing certain positive and negative effects from innovation implementation, this
compared to the effect of being an organization that has implemented services that are new to
the whole public sector. Results suggest there is only a slight significant impact from new
service implementation on the probability of having positive effects. In turn, the impact of new
service implementation on the probability of having negative effects is significant and of an
important magnitude.
Chapter 4 presents an alternative view for the analysis of public innovation implementation
and its results. A big portion of public innovation studies are based in the observation of public
organizations in developed countries. Therefore, are their findings equally valid in the context
of developing countries’ public sector? This chapter has as a purpose to approach to the
answer. For doing so, methodology consists in the analysis of initiatives participating in the
Local Governing and Management Award, following a cases-study approach. Results from
observations support the idea that poorly developed institutions often fail in improving from
innovation, since innovations requires an appropriate institutional set-up. Nonetheless, an
important and useful conclusion from this analysis is that innovation may be especially helpful
for developing institutions and, later on, implementing higher leveled innovations.
The central idea in this thesis dissertation suggests a view of public innovation under a multi-
agent framework, in such a way that public organizations keep a high degree of interaction
with other organizations and individuals and also consider various ways for generating
innovative processes, on top of those processes leaded under a rigid hierarchical structure.
Results and conclusions obtained from empirical analysis in previous four chapters are helpful
for supporting validity of the suggested view. The distinct ways for public innovation are
reflected in the importance for new service implementation found in factors such as ideas and
participation from staff, users and suppliers, and also in support from authorities and middle-
level managers. At the same time, results on the importance of using external sources of
information towards implementing new services support an approach for public innovation
which concedes a significant role to collaboration and participation from external agents,
especially users and suppliers.
7
Table of Contents
Towards an enhanced understanding of public innovation: An introduction …………………………… 8
I. Presentation of the study subject, general objectives and main hypothesis ……………………. 9
II. Defining a framework for understanding public innovation …………………………………………… 11
III. Content presentation ……………………………………………………………………………………………………. 17
Chapter 1. Bringing innovation to public sector: Evidence at EU level ……………………………………… 19
1. Introduction …………………………………………………………………………………………………………………… 20
2. Literature review and theoretical framework …………………………………………………………………. 21
3. Research hypotheses ……………………………………………………………………………………………………… 22
4. Data and methodology …………………………………………………………………………………………………… 24
5. Results ……………………………………………………………………………………………………………………………. 27
6. Concluding remarks ………………………………………………………………………………………………………... 35
Annex I. CATPCA Bootstrapping results ………………………………………………………………………………. 37
Annex II. Marginal effects …………………………………………………………………………………………………… 43
Chapter 2. The role of external information sources for service innovation in public
sector ………………………………………………………………………………………………………………………………………. 45
1. Introduction ……………………………………………………………………………………………………………………. 46
2. External sources for public innovation? A specific framework …………………………………………. 46
3. The empirical evidence for Europe: Research hypotheses ………………………………………………. 53
4. Methodology and data description …………………………………………………………………………………. 55
5. Results …………………………………………………………………………………………………………………………….. 58
6. Concluding remarks ………………………………………………………………………………………………………… 61
Chapter 3. Differences in effects from implementation of public innovations …………………………… 63
1. Introduction ……………………………………………………………………………………………………………………. 64
2. Antecedents: The counteracting consequences of risk ……………………………………………………. 65
3. Research hypotheses ………………………………………………………………………………………………………. 67
4. Data and methodology ……………………………………………………………………………………………………. 70
5. Results …………………………………………………………………………………………………………………………….. 73
6. Discussion and final remarks …………………………………………………………………………………………… 78
Annex I. Heckman’s probit selection estimations ………………………………………………………………… 81
Chapter 4. The way of public innovation in developing countries: An approach for
Mexican local governments ……………………………………………………………………………………………………… 85
1. Understanding public innovation in developing countries ……………………………………………….. 86
2. The case of Mexican local government ……………………………………………………………………………. 87
3. Mexican local governments in the way for successful innovation …………………………………….. 89
4. Discussion ……………………………………………………………………………………………………………………….. 100
5. Concluding remarks ………………………………………………………………………………………………………… 102
Concluding remarks ………………………………………………………………………………………………………………….. 104
References ……………………………………………………………………………………………………………………………….. 115

8
Towards an enhanced understanding of public
innovation: An introduction

9
I. Presentation of the study subject, general objectives and main hypothesis
Innovation in the public sector has been one of the most relevant innovation topics in last
years. This is due to the importance of public services in modern economies both in terms of
employment and growth and in terms of welfare generated from services to citizens and
businesses. An innovative public sector is necessary in order to provide better and more
efficient services, and also for helping to deal with societal challenges. This is particularly
relevant in a context where budgetary constraints in many parts of the world, e.g. in Europe
and in the US, are justifying actions to reduce the size of public sector and to increase its
efficiency. Innovation can be the solution for promoting more efficient public services and
increasing quality of performance at the same time.
Public services have often been considered among the low and sluggish productivity growth
activities together to personal services and some professional services (Maroto, 2011; Maroto
& Rubalcaba, 2008), even though performance of public services shows variations among
diverse public service activities such as health, education or public administration (di Meglio et
al., 2013). A major reason behind the low productivity in services is related to the lack of
innovation and the difficulties to integrate technological innovation in services (Baumol, 1966;
2004), public services in particular. However, recent large scale research projects have proved
the importance of innovation affecting performance of public sector. Some good examples of
these are in the projects PUBLIN and ServPPIN, founded by the European Commission; MEPIN,
by the Danish Center for Studies in Research and other Nordic institutions; a pilot survey for
measuring innovation in the public sector, by NESTA and a ‘Better Practice Guide’ on
innovation in the public sector, by the Australian National Audit Office1.
Innovation is a key dimension of the new services economy, also in public sector (Rubalcaba,
2007). There is abundant literature about drivers of innovation in public organizations and
about policy strategies necessary to promote and implement innovations (for a review of
literature about public innovation, see Matthews et al., 2009). However, a more extended
analysis is still needed in order to reach a better understanding of public sector innovation and
its origin.
Unlike previous research on innovation in public services – largely analytical-conceptual or
based on case studies – the present dissertation proposes an empirical-quantitative approach.
Previous studies point to public sector innovation as an issue increasingly demanding for
attention (Langergaard, 2009; Matthews et al., 2009; Windrum, 2008). Nowadays, we count on
a consistent theoretical framework providing useful models to analyse the innovation process
inside public organizations; however, what has been stated in theory has only in a few cases
been properly compared to corresponding empirical data. The present study is one more step
1 Extended information on these research projects and views of their final reports can be found at their
institutional web pages: PUBLIN, http://survey.nifu.no/step/publin ; ServPPIN, http://www.servppin.com ; MEPIN, http://www.nordicinnovation.org/Publications/measuring-public-innovation-in-the-nordic-countries-mepin ; NESTA, http://www.nesta.org.uk/publications/reports/assets/features/innovation_in_public_sector_organisations ; ANAO guide, http://www.anao.gov.au/bpg-innovation/contents.html

10
ahead in that direction. Research carried in this thesis dissertation is based on an analysis
leaded by quantitative methods addressed to test theoretical propositions found in previous
studies of public innovation. Furthermore, results of this empirical analysis are useful for
making nuances on tested theoretical propositions, and also for making new propositions from
findings in the applied methodologies.
Therefore, the empirical approach is in the core of the value added of the present thesis
dissertation. Some of the tools for analysis in the followed methodology were implemented by
first time – as far as it was corroborated – in researching the topic, in particular: a technique
for principal component analysis specially addressed for categorical variables (chapters 1 and
2) and a bootstrapping method for testing data stability (chapter 1). Also, the empirical
analysis was focused in such a way that a distinction is made between ‘service innovations’, as
a broad group where any significant change can be identified as an innovation, and ‘services
new to the public sector’, where only services that were by first time implemented within the
public sector are taken into account; this as a way to highlight novelty, radical change and
improvement for the public sector – instead of only the implementing organization (chapters
1, 2 and 3).
A first objective of this dissertation is to challenge conventional thinking about public sector
being a barren ground for innovative activities. This common idea comes from a bureaucratic
view of public sector organizations, high risk aversion in public policy implementation and lack
of incentives for introducing changes. There is an emerging tradition of public innovation
studies where it can be observed a tendency to contradict the view of a public sector where
sustainable improvement processes are neglected. The conclusions that may be obtained after
the applied empirical methods are meant to be part of it.
A second objective is to make some propositions, and give empirical evidence, on the main
factors driving and enabling public innovation to its successful implementation. Factors are of
different kinds and they can be identified under different theoretical views on public
innovation: political, organizational (systemic), managerial, environmental, industrial (input-
output relations), etc. Lack of the right incentives – market incentives in particular – has been
thought for a while to be at the root of the public sector’s innovation gap. However, despite
lack of market incentives, it is possible to find a set of factors that are useful to innovation
development in public organizations. These might be as powerful for public innovation
creations as powerful are market incentives for private business.
Another objective is in identifying some features of the innovation dynamics that can be seen
as specific of the public sector. These are expected to be found around characteristics that
correspond to the nature of the public sector, such as high risk aversion and interaction with
citizens and enterprises when they both play the role of public organizations’ suppliers and
beneficiaries.
One more objective is in making an assessment of results of innovation implementation, given
that it is a strategy addressed to obtain improvement. To this respect, a particular purpose is in
making an analysis on how well policy recommendations following public innovation theory
can be successfully applied in contexts where political and administrative set-up is more
challenging than those from where public innovation theory was built in first place; that is, to

11
compare pursued innovation in economically developing areas as a contrast of innovation
pursued in economically developed areas.
The usual view of an innovation process as based on public organizations’ hierarchical
structure, decided by higher authorities, implemented by middle-level authorities and staff
and with citizens playing only the role of beneficiaries, is useful and somewhat valid but still
incomplete and generally wrong. Recent studies talk about a different public sector, where
innovation can be also generated by user and employee initiatives and they can (and
somewhat should) also take part in the development process. Plus, public sector organizations
are in more recent time seen as operating in a networked form, with high levels of interaction
and collaboration with other public and private organizations and with users and suppliers as
well. The main idea proposed by this thesis dissertation (that is, the main thesis addressed by
the whole dissertation work) is in stating that this last vision of innovation in public
organizations is more appropriate than the former one. Therefore, dissertation is intended for
concluding that public innovation is a complex process where many factors play a role and
which does not follow one only way within implementing organizations; a process in which
also agents external to implementing organizations have a fundamental participation (as
explained by the multi-agent framework in the next section). This way to understand public
innovation can be more helpful for a more innovative public sector and may also have relevant
consequences for policy design and in how public innovation should be promoted.
In the next section of this introductory part will be described the concepts framing the
understanding of public innovation. Innovation is a wide concept, difficult to define. An
understanding of innovation will highly depend on its application. For example, it can be
observed how studies based on private manufacturing business highlight technology and
engineering improvements towards product development, while studies in industry sectors
with less use of technology and product development less based on R&D activities (like service
business) they use an approach more focused on networked development and changes in form
of organization, systems, methods, concepts, etc. Therefore, studying the innovation that
takes place at the level of public organizations requires building an understanding that attends
to the specifities and objectives behind the particular nature of the public sector. The next
section describes the understanding of innovation that is going guide research carried along
the whole dissertation.
II. Defining a framework for understanding public innovation
Innovation in public sector organizations
Why do public sector organizations innovate? This is a question often replied by comparing the
differences and similarities between innovation in public sector and innovation in private
sector. While profitability and competitiveness have been largely pointed to be at the aim for

12
private sector innovation, these might not be suitable to explain the existence and
importance2 of innovation in a public sector context.
Commercial applications of a technological/scientific improvement, efficiency brought by new
methods or processes and gains in competitive advantage due to improvements or
adaptations to the application of an existing product or service, these are good enough
reasons for private firms to assume the inherent risk of the innovation process and its costs. In
turn, public sector performance is not oriented to a pecuniary profit and – for that reason –
common market incentives (profitability, competitiveness and efficiency) are not what in first
place move public organizations to take on the risky process of innovation. Even the possibility
of being more efficient (i.e. having more available resources in an environment where
budgetary constraints are a constant limitation) might not be enough to overcome the risk
aversion prevalent in public sector, where it rules the sentence: “if it’s not broken there’s no
need to fix it”.
In spite of high risk aversion and lack of the typical pecuniary incentives, public sector
innovation does exist.
In order to speak about innovation in public sector it is important to make a distinction
between two different roles that the public sector takes towards innovation development. In
one of them public sector performs as a provider and sponsor of innovation inside of what is
known as National system of innovation3. Public sector funds and carries innovations by its
own institutions (perhaps with some technical/scientific bias) with the purpose to give local
industry better capabilities and greater competitiveness, and also with the purpose to help to
improve citizens’ quality of life, like in the case of medical solutions. In this case innovation
turns out in new knowledge, useful to many sectors of economic activity. Hence, public sector
performs as a sponsor for economic development, correcting market failures by absorbing risk
and costs that private entities might not be willing to undertake because they are too high or
because their profitability is uncertain. Within this view of public sector innovation it is quite
evident the understanding of its benefits and willingness to assume its costs. However, this
situation is limited to a reduced part of the public sector: that part accounted by budget
addressed to specific development policies.
A second role of public sector with respect to innovation involves to all its organizations and
institutions and has as a purpose not just to support the economy with research and
development activities, but to improve public function in general. Here we understand public
function as public sector delivering services to citizens. That is: public services. In this other
view public innovation is seen as a process adopted by public organizations to improve services
they provide. This second role of public sector towards innovation, the one involving all public
organizations in public services improvement, is what we are trying to focus on.
2 Innovation occurring in public sector out of pecuniary incentives, and its importance for the economy
and social welfare, is well documented in studies such as Borins 2001, Halvorsen et al. 2005, Hartley 2005, Rubalcaba 2006, Windrum 2008, Langergaard and Scheuer 2009, etc.
3 For an extended overview of the ‘national system of innovation’ concept see Freeman (1995) and Nelson (1993)
13
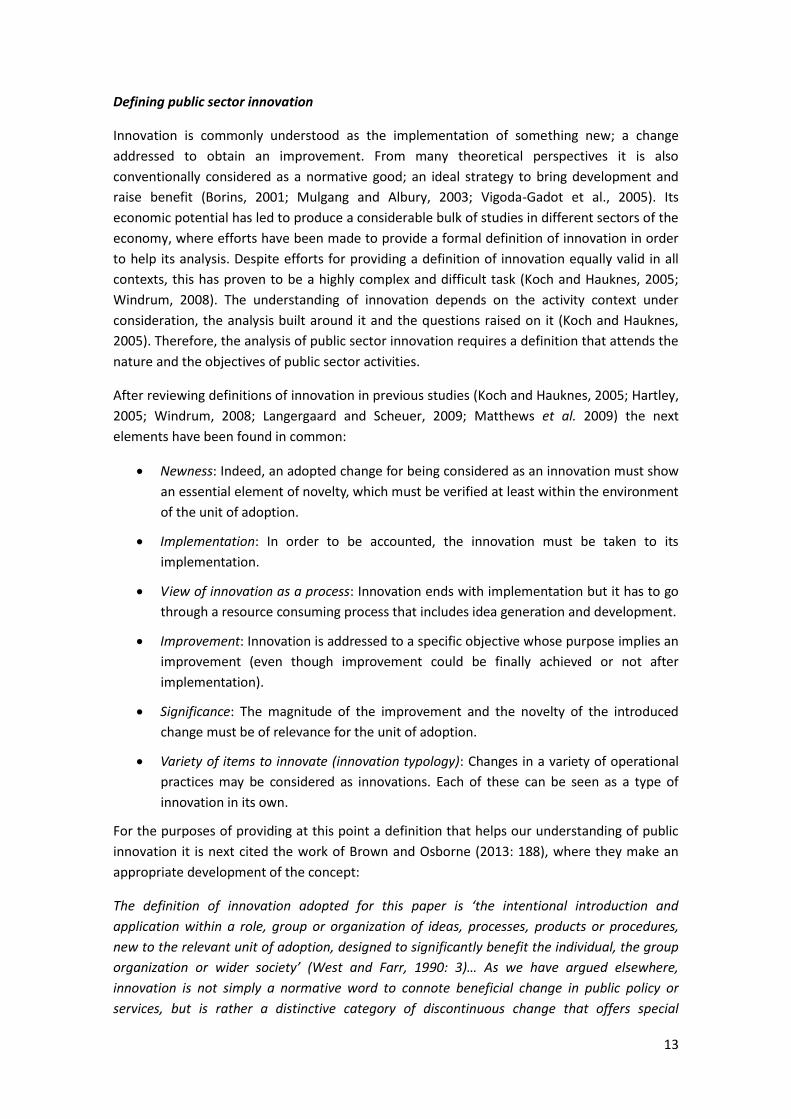
Defining public sector innovation
Innovation is commonly understood as the implementation of something new; a change
addressed to obtain an improvement. From many theoretical perspectives it is also
conventionally considered as a normative good; an ideal strategy to bring development and
raise benefit (Borins, 2001; Mulgang and Albury, 2003; Vigoda-Gadot et al., 2005). Its
economic potential has led to produce a considerable bulk of studies in different sectors of the
economy, where efforts have been made to provide a formal definition of innovation in order
to help its analysis. Despite efforts for providing a definition of innovation equally valid in all
contexts, this has proven to be a highly complex and difficult task (Koch and Hauknes, 2005;
Windrum, 2008). The understanding of innovation depends on the activity context under
consideration, the analysis built around it and the questions raised on it (Koch and Hauknes,
2005). Therefore, the analysis of public sector innovation requires a definition that attends the
nature and the objectives of public sector activities.
After reviewing definitions of innovation in previous studies (Koch and Hauknes, 2005; Hartley,
2005; Windrum, 2008; Langergaard and Scheuer, 2009; Matthews et al. 2009) the next
elements have been found in common:
Newness: Indeed, an adopted change for being considered as an innovation must show
an essential element of novelty, which must be verified at least within the environment
of the unit of adoption.
Implementation: In order to be accounted, the innovation must be taken to its
implementation.
View of innovation as a process: Innovation ends with implementation but it has to go
through a resource consuming process that includes idea generation and development.
Improvement: Innovation is addressed to a specific objective whose purpose implies an
improvement (even though improvement could be finally achieved or not after
implementation).
Significance: The magnitude of the improvement and the novelty of the introduced
change must be of relevance for the unit of adoption.
Variety of items to innovate (innovation typology): Changes in a variety of operational
practices may be considered as innovations. Each of these can be seen as a type of
innovation in its own.
For the purposes of providing at this point a definition that helps our understanding of public
innovation it is next cited the work of Brown and Osborne (2013: 188), where they make an
appropriate development of the concept:
The definition of innovation adopted for this paper is ‘the intentional introduction and
application within a role, group or organization of ideas, processes, products or procedures,
new to the relevant unit of adoption, designed to significantly benefit the individual, the group
organization or wider society’ (West and Farr, 1990: 3)… As we have argued elsewhere,
innovation is not simply a normative word to connote beneficial change in public policy or
services, but is rather a distinctive category of discontinuous change that offers special
14
challenges to policymakers and service manager alike (Osborne and Brown, 2011). This
discontinuity can be in terms of a new public service product, a new policy program or service,
a transformed process or a new configuration of an existing set of relationships to fulfil a task.
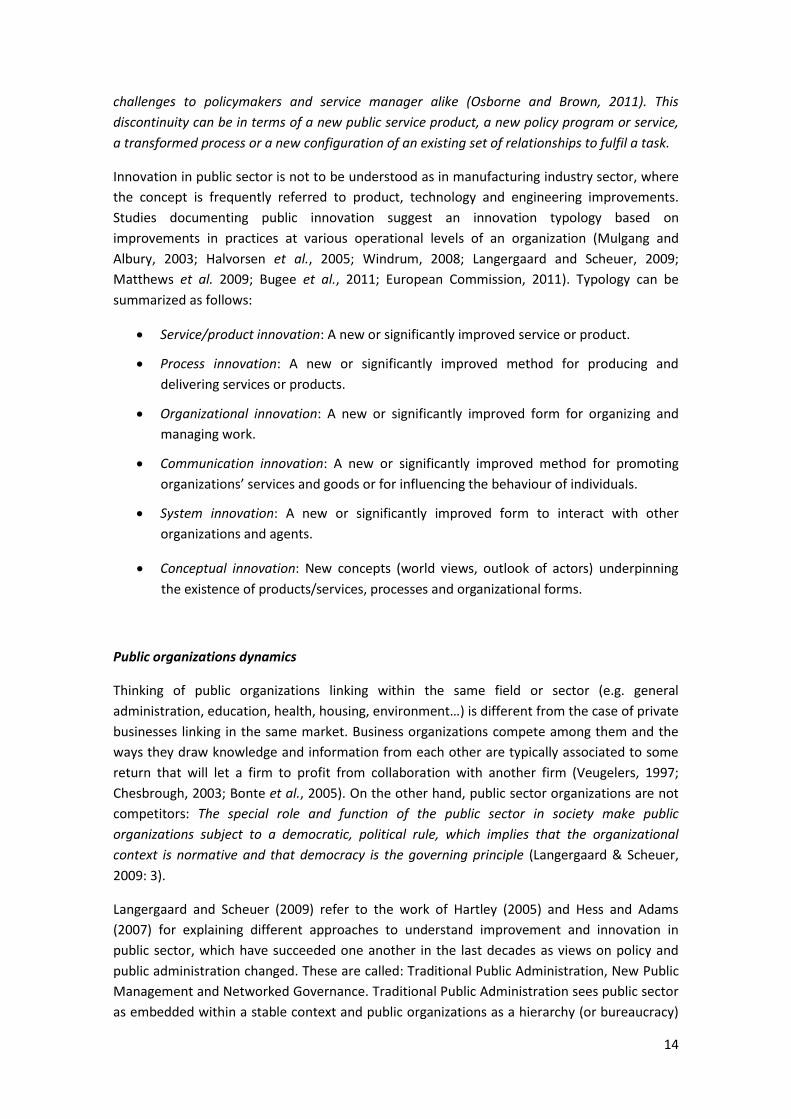
Innovation in public sector is not to be understood as in manufacturing industry sector, where
the concept is frequently referred to product, technology and engineering improvements.
Studies documenting public innovation suggest an innovation typology based on
improvements in practices at various operational levels of an organization (Mulgang and
Albury, 2003; Halvorsen et al., 2005; Windrum, 2008; Langergaard and Scheuer, 2009;
Matthews et al. 2009; Bugee et al., 2011; European Commission, 2011). Typology can be
summarized as follows:
Service/product innovation: A new or significantly improved service or product.
Process innovation: A new or significantly improved method for producing and
delivering services or products.
Organizational innovation: A new or significantly improved form for organizing and
managing work.
Communication innovation: A new or significantly improved method for promoting
organizations’ services and goods or for influencing the behaviour of individuals.
System innovation: A new or significantly improved form to interact with other
organizations and agents.
Conceptual innovation: New concepts (world views, outlook of actors) underpinning
the existence of products/services, processes and organizational forms.
Public organizations dynamics
Thinking of public organizations linking within the same field or sector (e.g. general
administration, education, health, housing, environment…) is different from the case of private
businesses linking in the same market. Business organizations compete among them and the
ways they draw knowledge and information from each other are typically associated to some
return that will let a firm to profit from collaboration with another firm (Veugelers, 1997;
Chesbrough, 2003; Bonte et al., 2005). On the other hand, public sector organizations are not
competitors: The special role and function of the public sector in society make public
organizations subject to a democratic, political rule, which implies that the organizational
context is normative and that democracy is the governing principle (Langergaard & Scheuer,
2009: 3).
Langergaard and Scheuer (2009) refer to the work of Hartley (2005) and Hess and Adams
(2007) for explaining different approaches to understand improvement and innovation in
public sector, which have succeeded one another in the last decades as views on policy and
public administration changed. These are called: Traditional Public Administration, New Public
Management and Networked Governance. Traditional Public Administration sees public sector
as embedded within a stable context and public organizations as a hierarchy (or bureaucracy)

15
resting on legal rational authority and oriented towards procedures. New Public Management
replaces bureaucracy with quasi-market conditions, challenging the hierarchical view of the
public sector and separating organizations’ producing units from political influence as far as
possible. Networked Governance shows a shift to more networked forms of governance in the
public sector, where public (beneficiaries of public services) also takes the role of co-producer
of service and innovation. Referenced studies highlight a recent tendency to approach to
improvement dynamics in public sector under a networked view. As pointed by Langergaard
and Scheuer, a hierarchical understanding of the public sector, where organizations are seen
as passive executors of political decisions – like in the Traditional Administration approach, is
important for our political self-understanding; however, the tendency is today to see public
organizations in terms both of markets, hierarchies and networks.
For progressing in the understanding of public innovation, drawing from studies based on
private sector firms has proven to be useful for providing a frame of analysis. Following the
tendency explained above and having as reference models that explain service innovation in
the private sector, the multi-agent framework is a useful way for understanding public
innovation. Basing on Saviotti and Metcalfe (1984), Gallouj and Weinstein (1997) proposed a
simplified model where service characteristics are a consequence of a combination of two
mechanisms: the utilization of (tangible or intangible) technical characteristics… and the direct
mobilization of [firm’s] competences. Competences may also be a combination of Firm’s
competences and competences of users or another entity, which is to be called co-production.
Later on, Windrum and Garcia-Goñi (2008) took the Saviotti and Metcalfe and Gallouj and
Weinstein approach for proposing an enhanced framework that accounts for multiple agents
(specifically: consumers, policy makers and service providers) taking part in the process of co-
evolving service characteristics. At the same time, reviewed literature on public innovation
frequently mentions about the importance of organizations’ internal competences (e.g. staff
participation and managers actively involved), decisions of political authorities and
participation of users (beneficiaries of public services) and suppliers (procurers). This situation
suggests an adapted multi-agent framework for understanding public innovation.
Figure I. Adapted multi-agent framework for public innovation

16
Figure I represents a multi-agent framework for public innovation, based on previous
frameworks developed by Gallouj and Weinstein and Windrum and Garcia-Goñi. In this
framework, public organizations’ competences combines to competences of higher public
authorities, beneficiaries and suppliers, within a process than can later combine to some
technical characteristics for giving as a result public service provision (i.e. public service
characteristics).
Drivers and Barriers for public innovation
So far, it does exist in the public sector a purpose to generate improvements by introducing
changes (i.e. development and implementation of innovations). Such purpose is aimed not by
traditional market incentives but by a set of elements typically referred to public functions
(Borins 2002; 2006; Halvorsen et al., 2005; Hartley, 2005; Arundel & Hollanders, 2011).
Nevertheless, although improvement is at the aim of innovation, success in improving is not
guaranteed by mere fact of implementation. Innovation brings with it some degree of
uncertainty on resulting effects, and risk of not getting expected effects (thus, losing invested
resources) and of getting some undesirable effects.
Studies already acknowledge some distinctive features of public innovation, such as factors
having an influence in innovation generation, factors enabling the innovation process and also
barriers counteracting and delaying implementation. Among the latter is frequently and
remarkably mentioned a high risk aversion in decision making of public authorities, which
causes the avoidance of practices that might bring with it failure and waste (Vigoda-Gadot et
al., 2005; Potts, 2009; Brown and Osborne, 2013).
A growing interest in benefits expected from innovation has led to emphasize the power of
innovation for improvement, suggesting the strategy to follow for a more innovative public
sector and pointing to the gap that still divides the innovation levels observable in public
organization and private firms, respectively. Private firms will advocate resources for
development of new products and new methods and technology as long as they can expect a
net economic benefit from their innovations. On the other hand, public administration
decisions are not oriented to pecuniary objectives but to public accountability objectives. That
is at the root of public sector’s high risk aversion and the innovation gap between public
organizations and private firms.
Understanding public innovation in developing countries
Public innovation studies highlight the need for more flexible public organizations that allow
for experimentation, waste and failure (Borins, 2006; Potts 2009; Brown and Osborne, 2013),
in such a way that the innovation process is enabled. At the same time, there is a claim for
reforming public administration, so institutional bureaucratization might not be a barrier for
implementing technical instruments and managerial strategies that help for increased
efficiency, quality and effectiveness in public administration. This kind of observations recall
highly regulated organizations with strong hierarchic patterns of authority and whose views on
policy and accountability makes them to avoid implementations that represent a chance of
failure. However, what could be expected about promotion and implementation of innovation
in organizations that do not resemble the latter?

17
Expectations for development and improvement make implementation of innovations
something desirable at all levels of all kinds of organizations. This is also true for regions where
society, economy and public institutions remain at a developing state. Therefore, it arise a
question on whether the understanding of processes enabling public innovation – acquired in
developed contexts – is the same valid for organizations in developing regions. A complete
understanding of public innovation should account for innovation in contexts of developing
economies, where weakness of public institutions might be more challenging for successful
implementation.
III. Content presentation
The content in this thesis dissertation obeys to the objectives mentioned in first section.
Objectives are all tackled to some degree along the next four chapters. Chapters 1 and 2 are to
a higher extent addressed to the observation of the innovation dynamics in public innovation,
with a particular focus on innovation drivers and enablers, while chapters 3 and 4 they are
addressed to analyse the benefits of implemented innovations, including a particular analysis
on some required conditions for letting public innovation to be a source of improvement, as it
is meant to be. Figure II below synthesizes how the study carried in this thesis dissertation is
followed.
Figure II. Content Diagram
Innovation in the public sector is the result of a complex process in which many factors play a
role. Chapter 1 is addressed to identify some factors driving and enabling public sector
innovation and to assess their effects on the innovation performance of public sector
organizations. The analysis is based on data at EU level provided by the Innobarometer 2010

18
Survey. Categorical Principal Component Analysis is used for finding components that are
expected to explain performance of public organizations and a bootstrapping method is
applied to test the stability of extracted components. Results show that components related to
using external sources of information, active involvement of managers and implicating staff
and users in the innovation process have a positive effect on implementation of service
innovations, while the effect of political and legislative factors turns to be somewhat
contradictory.
The use of external sources for innovation has an increasing role in organizations of all kinds;
they can be essential for creating and developing innovation. With a particular theoretical
approach, Chapter 2 provides with a framework to compare how significant it is for public
service innovation the use of internal and external sources of information in innovation
development. At the same time, effects on innovation implementation from the use of both
kinds of sources are assessed basing on evidence from the Innobarometer 2010 Survey.
Results indicate a positive and significant relation between both the use of internal and
external sources of information and the implementation of service innovations. They also give
evidence to believe that using external sources of knowledge and information for innovation
development is especially important for the implementation of services that are new to the
whole public sector.
The aim in Chapter 3 is to present empirical evidence for helping to support assumptions
about the potential of public innovations for achieving positive effects after implementation,
and also about the risk of suffering some negative effects. High risk aversion is argued to be
one of the main causes for the innovation gap between public organizations and private firms.
At the same time, risk aversion is a consequence of public policy leaded by public
accountability instead of market profit. Then, one could reasonably ask what is worth for
public organizations to take the risks of innovation. For approaching to the answer, the
followed method consists in estimating probabilities of positive and negative effects
experienced after implementation of service innovations by public organizations represented
in the Innobarometer 2010 Survey. It is expected that results will help to address a relation
between willingness of an organization to engage in innovations with higher degree of novelty
and the effects obtained from innovation implementation.
In addition, Chapter 4 presents an alternative view for the analysis of public innovation
implementation and its results. A big portion of public innovation studies are based in the
observation of public organizations in developed countries. Therefore, are their findings
equally valid in the context of developing countries’ public sector? This chapter has as a
purpose to approach to the answer. For doing so, methodology consists in the analysis of
initiatives participating in the Local Governing and Management Award, following a cases-
study approach. This contest awards initiatives of Mexican local governments with original
design and remarkable positive impact after implementation. Results from observations
support the idea that poorly developed institutions often fail in improving from innovation,
since innovations requires an appropriate institutional set-up.
At the end of the main four chapters described above a conclusive chapter will gather the
findings that synthesize the efforts in the study presented through this thesis dissertation.

19
Chapter 1. Bringing innovation to public sector:
Evidence at EU level

20
1. Introduction
Despite public sector was thought for a long time to be opposed to innovation, there is wide
evidence in the literature about how innovation exists in public services provision and about
the processes behind innovation (e.g. Windrum and Koch, 2008). Nonetheless, a more
extended analysis is needed in order to reach a better understanding on the relation between
factors driving public innovation and innovation performance, fields that have traditionally
been more researched in the area of private services (Gallouj and Djellal, 2011). Particularly,
there is a gap with respect to empirical studies at international level that may support or revise
theoretical frameworks. This chapter contributes to filling this research gap by analysing which
of the mentioned drivers and enabling factors lead to a better innovation performance of
organizations in public administration.
Unlike previous research on innovation in public services – largely analytical-conceptual or
based on case studies – this research proposes an empirical-quantitative approach. The lack of
empirical research results from a lack in available data about public sector innovation.
However, in 2010 the European Commission released the largest data source on public
innovation till now: The Innobarometer Survey on Public Innovation, which contains responses
from public agencies from the 27 member states of the European Union and also Norway and
Switzerland. The 2010 Innobarometer Survey is therefore the data source used for this study.
The 2010 Innobarometer Survey includes questions about drivers and strategies of innovations
implemented since January 2008. The objective of our analysis is to assess their effects on the
innovation performance of public sector organizations. Innobarometer data will be subject to
Categorical Principal Component Analysis (CATPCA) in order to build variables containing
information about drivers and enablers of public innovation. A bootstrapping method will be
applied to CATPCA results to check for stability of results and to provide robustness to our
analysis.
Previous studies point to public sector innovation as an issue increasingly demanding for
attention (Langergaard, 2009; Matthews et al., 2009; Windrum, 2008). Nowadays, we count on
a consistent theoretical framework providing useful models to analyse the innovation process
inside public organizations; however, what has been stated in theory has only in a few cases
been properly compared to corresponding empirical data. Analysis presented in this chapter is
one more step ahead in that direction.
The chapter is organized as follows. After this introductory part, Section 2 contains a literature
review building the theoretical framework. Section 3 presents the research hypothesis
addressing the study. Section 4 widely describes the methodology that will be applied for
testing proposed hypotheses and also the data base in use. In Section 5 results are presented
and interpreted. The concluding statements correspond to Section 6.

21
2. Literature review and theoretical framework
Drivers and enablers of public innovation
In reviewing previous literature several factors have been identified explaining public sector
innovation. Some of them are found creating pressure for improvements and reforms. These
are related to citizens’ evaluation of government performance, measured by popular opinion
and – in democratic countries – votes; also emerging and changing laws and regulations force
organizations to adapt processes and delivery of services (Halvorsen et al.; 2005, Borins, 2002).
A developing society is another cause that demands the introduction of ‘newness’ to the public
sector (Recascino, 2002), while the use of technological tools makes technological and
scientific developments pushing for public innovation (Arduini et al., 2010; Earl, 2002). Borins
(2001) lists five groups of conditions influencing public organizations to innovate: initiatives
coming from the political system; new leadership; publicly visible failures or problems; internal
problems or difficulties; and new opportunities created by technology or other factors.
There are some other factors stimulating innovation by means of a feeling of dissatisfaction.
Dissatisfaction might be perceived by employees in day-to-day interaction with citizens whose
needs and preferences are not being properly fulfilled by service delivery. Also, dissatisfaction
might be placed in employees, who are willing to provoke a change due to a set of personal
(either selfish or altruistic) motivations (Halvorsen et al., 2005; Borins, 2002). Likewise,
motivation may be really necessary both at front-lines and managerial level in order the get
high performance innovation as shown by Garcia-Goñi et al. (2008) for the health sector.
Along with innovation drivers explained above, there are also factors enabling the innovation
process, whose quality and intensity in application will help to achieve innovation
development and implementation. Public innovation enablers frequently mentioned include:
participation of staff in designing and developing innovations; active involvement of
organizations’ managers for promoting generation of ideas and giving support to their
implementation; rewarding innovative behaviour; allocating resources for innovation; taking
advantage of experiences and information sources outside the organization; making alliances
and networks with other organizations and allowing experimentation and evaluation (Borins,
2006; Vigoda et al., 2005; Koch and Hauknes, 2005; Mulgang and Albury, 2003).
At the same time, organization’s willingness to innovate depends significantly on those
responsible of decision making being aware about potential benefits of innovation as a
strategy of improvement (Borins, 2001; 2006; Mulgang and Albury, 2003; Potts, 2009). Here
we have a positive association between innovation outputs, support and engagement of
managers and authorities to innovation and resources set to innovation activities, with an
emphasis on human resources (employee qualification and participation). It is then believed
that Managers’ involvement in the innovation process as well as use of resources and
employee participation will help to better innovation performance (Vigoda-Gadot et al., 2005;
Klein et al., 2009; Potts, 2009; Arundel and Hollanders, 2011).

22
‘New innovations’ and ‘innovations done before’
Innovation and imitation is a common path for introducing technology shifts in industry
business. Imitators try to catch up profitability and market share from innovators. At the same
time, exclusive use of an innovation gives innovators the opportunity to make it more
profitable. However, from another point of view, imitations can also be called innovations,
given that one of the primary conditions for changes and reforms to be considered as
innovations is that they introduce a significant element of novelty to the organization that
implements them (OECD, 2005). That is why public organizations implementing innovations
previously implemented by another organization can also be considered innovators.
It is expected that the search for competitive advantage will bring private sector firms to
design and implement more and better innovations than other firms, looking for greater
differentiation through completely new products, applications, ways to deliver, ways to
communicate, etc. Due to a lack of competitive incentives4, public sector organizations might
not be similarly motivated as private firms to enter in an intense process of generation of
innovations that are implemented by first time. Studying public organizations as they approach
to introduce innovation not only to their own operational practices but to the whole public
sector might help to identify to which extent specific drivers and enablers of innovation (as
those mentioned before) contribute to better innovation performance in public sector.
3. Research hypotheses
Some factors will influence public organizations to undertake innovation. Averse popular
opinion creating pressure, new policies, laws and regulations (sometimes derived from political
goals), improvements in technology and changes in society drive organizations to introduce
changes and reforms. The innovation process can be brought to an organization through
employee entrepreneurship and managers’ support and involvement. In addition, enablers of
the innovation process facilitate successful innovations. Enablers can be found in the form of
strategies such as participation of employees and final users in the developing process, giving
rewards to innovators, taking advantage of external sources of information, etc.
It is expected that the kinds of factors mentioned above will make a relevant and effective
contribution to public sector innovation. Thus, analysis is addressed to measure the effects of
some identified innovation drivers and enablers on the innovation performance of public
organizations. The data base that will help the analysis provides information on political and
legislative factors making pressure for innovation, factors reflecting support and participation
of organizations’ authorities (managers) and also strategies enabling the innovation process.
4 There are some incentives among public organizations for competing to innovate and they are based
on the idea that public organizations with better performance will be rewarded with a bigger budget. Competition among public organizations would be occurring to enhance budget (Hartley 2005, Roste 2005). However, this view of public management as replicating private firms’ incentives oriented to market goals is out of the framework of analysis of this study as it has been shown that public sector organizations do not share with private firms the same incentives towards their final objectives (see Recascino 2002).

23
Since this is the data we rely on for building our analysis, the focus of research will be on these
kinds of drivers and enablers.
Review of literature points to factors useful to generate and develop innovation. Hypotheses
highlight an assumed link between some of these factors found in the 2010 Innobarometer
Survey and the effective implementation of innovations by public organizations. Hence,
empirical analysis is intended to confirm and asses the existence of that link. Nonetheless,
research questions and subsequent analysis are addressed to service innovations in particular,
leaving aside results that could be obtained from including method and process/organizational
innovations. This is due to the fact that all organizations under analysis have to some extent
implemented innovations of any kind and the only type of innovation identifiable in every case
is service innovation.
Innovation might be taken to public organizations by mandated changes in policy and law
(Langergaard and Scheuer, 2009; Koch and Hauknes, 2005; Borins, 2002). Reference texts (e.g.
Borins, 2002; Potts, 2009; Brown and Osbore, 2013) highlight the role of policy authorities in
addressing the innovation process. Also, it has been remarked how reforms in policy and law
are conditioning the introduction of changes in public organizations’ operations. First research
hypothesis is thus formulated as follows:
H1: Political and legislative factors are a significant driver for implementing public service
innovations.
Factors helping public innovation through managers’ involvement can lead to a successful
innovation process. A key feature in here is how they support innovation (Borins, 2002; 2006;
Klein et al., 2009; Vigoda-Gadot et al., 2005). Managers supporting employees’
entrepreneurship and getting involved in start and development of innovations suggest a
greater understanding of the risks, costs and benefits of innovation. Therefore, managers’
involvement reflects a clearer vision of the objectives of innovation and the process that must
be carried to achieve those (Vigoda-Gadot et al., 2005). Organizations that innovate leaded by
managers’ support and involvement are expected to widen their efforts in order to achieve an
adequate solution, within a process which is closer to what we commonly understand by
‘innovation’: the development of something significantly new. Thus, second hypothesis is
stated as:
H2: Drivers and enablers that imply active involvement of mangers are significant for
implementing public service innovations.
A third group of factors refers to strategies enabling successful innovation processes.
Literature tells about the boundaries of these factors to enhance innovation performance. It
seems obvious to expect that strategies implemented to succeed in innovation will have a
significant effect on the innovation performance of an organization. Nonetheless – now that
extensive data on public innovation has been made available – this is a good opportunity for
empirically testing (and exploring) what was previously set out only at the analytical-
conceptual level. It is expected that, in general, these enablers will show great effects on the
development of innovations, assuming that strategies are implemented for helping a process
24
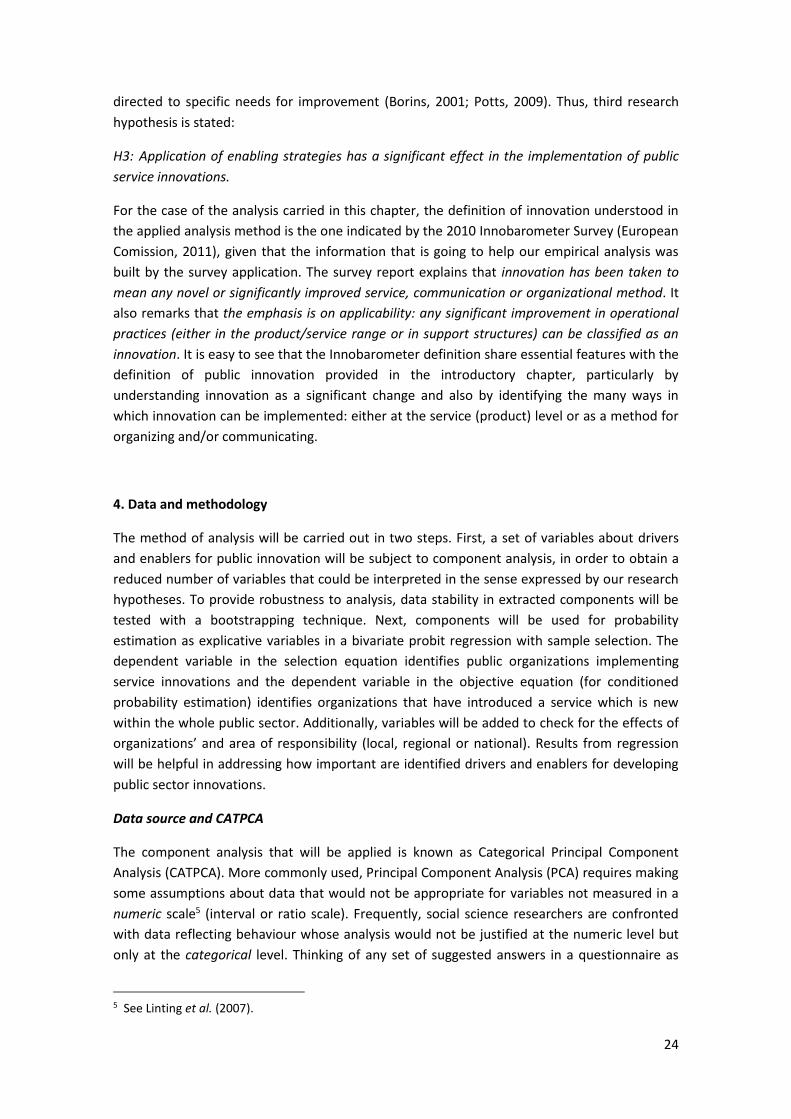
directed to specific needs for improvement (Borins, 2001; Potts, 2009). Thus, third research
hypothesis is stated:
H3: Application of enabling strategies has a significant effect in the implementation of public
service innovations.
For the case of the analysis carried in this chapter, the definition of innovation understood in
the applied analysis method is the one indicated by the 2010 Innobarometer Survey (European
Comission, 2011), given that the information that is going to help our empirical analysis was
built by the survey application. The survey report explains that innovation has been taken to
mean any novel or significantly improved service, communication or organizational method. It
also remarks that the emphasis is on applicability: any significant improvement in operational
practices (either in the product/service range or in support structures) can be classified as an
innovation. It is easy to see that the Innobarometer definition share essential features with the
definition of public innovation provided in the introductory chapter, particularly by
understanding innovation as a significant change and also by identifying the many ways in
which innovation can be implemented: either at the service (product) level or as a method for
organizing and/or communicating.
4. Data and methodology
The method of analysis will be carried out in two steps. First, a set of variables about drivers
and enablers for public innovation will be subject to component analysis, in order to obtain a
reduced number of variables that could be interpreted in the sense expressed by our research
hypotheses. To provide robustness to analysis, data stability in extracted components will be
tested with a bootstrapping technique. Next, components will be used for probability
estimation as explicative variables in a bivariate probit regression with sample selection. The
dependent variable in the selection equation identifies public organizations implementing
service innovations and the dependent variable in the objective equation (for conditioned
probability estimation) identifies organizations that have introduced a service which is new
within the whole public sector. Additionally, variables will be added to check for the effects of
organizations’ and area of responsibility (local, regional or national). Results from regression
will be helpful in addressing how important are identified drivers and enablers for developing
public sector innovations.
Data source and CATPCA
The component analysis that will be applied is known as Categorical Principal Component
Analysis (CATPCA). More commonly used, Principal Component Analysis (PCA) requires making
some assumptions about data that would not be appropriate for variables not measured in a
numeric scale5 (interval or ratio scale). Frequently, social science researchers are confronted
with data reflecting behaviour whose analysis would not be justified at the numeric level but
only at the categorical level. Thinking of any set of suggested answers in a questionnaire as
5 See Linting et al. (2007).

25
categories (measured in a nominal or ordinal scale), CATPCA gives a solution for carrying out
the PCA while overcoming the restrictions imposed on data in the variable reduction problem6.
CATPCA is based on a technique known as optimal quantification which quantifies categories
by assigning to each one a new value, so the new values are expressed in an interval scale
while preserving the relations observed in the original values.
Although PCA has been applied to ordinal variables with acceptable results7, CATPCA shows
better adequacy to ordinal data. Given that selected data for the current analysis offers
variables measured in an ordinal scale, CATPCA is a more suitable method for the intended
analysis.
There is, however, one objection to the validity of component analysis for making concluding
statements. Results of component extraction depend on sample data, which might cause the
use of different samples to lead to significantly different results. To overcome this objection
and to provide robustness to our analysis the CATPCA process will be complemented with a
bootstrapping exercise as a way to test stability of results.
The bootstrapping method – proposed by Linting et al. (2007b) – consists in a nonparametric
procedure for establishing confidence regions for CATPCA results. Confidence regions will be
calculated for eigenvalues and loadings of extracted components. An important characteristic
of the method is that it is a balanced bootstrap: it guarantees every case to appear a number
of times equal to the number of samples generated.
The data used for this analysis comes from the Innobarometer Survey on Innovation in Public
Administration, which was developed by the European Commission and released in October
2010. For the Innobarometer Survey 4.063 organizations were surveyed from the 27 Member
States of the European Union and also Norway and Switzerland. Eligible respondents of the
questionnaire were senior managers responsible for strategic decision-making: typically,
general managers or strategic directors of the institutions. To carry out the application of
CATPCA those organizations which failed to report any innovation since January 2008 will be
removed.
The Innobarometer Survey questionnaire includes questions about drivers and strategies for
innovations made since January 2008. Some questions ask about the level of importance of
various information sources for the development of innovations. Some other questions ask
about the level of importance of various political or legislative factors in driving innovations.
Another group of questions ask about how well are applied some actions supporting the
innovation process. Each question includes a set of eligible answers ranking from 1 to 3 whose
correspondent labels are Not important, Somewhat important and Very important (Not at all,
Partly and Fully for questions about actions supporting innovation); the usual Don’t know/Not
applicable (DK/NA) option applies to all questions. These are the ordinal variables that are
going to be subject to CATPCA.
6 For a detailed and technical overview of CATPCA (also known as nonlinear PCA) see Meulman et al.
(2004).
7 See Arundel and Hollanders (2011).

26
DK/NA is a difficult category to manage in an ordinal scale. However, deleting all cases
reporting an answer like that will lead to lose nearly a third of the available cases. To avoid
that loss of information and following the Arundel & Hollanders (2011) criteria – where the
same data was used for component analysis – all DK/NA answers have been turned into Not
important, assuming that an important information source, policy or strategy is likely to be
remembered. Parallel to the Arundel and Hollanders work, those cases simultaneously
displaying DK/NA responses in all questions were deleted from the sample database. Thus,
our final data set accounts for 3.553 available cases.
Probability estimation: bivariate probit with sample selection
Once the extracted components have proven to be stable their scores will be saved and used
for probability estimation. A bivariate probit regression with sample selection (also known as
Heckman’s probit) was chosen as estimation model in order to fit the database structure and
also for giving a nuance to hypotheses conclusions. The dependent variable in the selection
equation identifies public organizations implementing service innovations and the dependent
variable in the objective equation identify organizations that have introduced a service which
is new within the whole public sector. Results from estimation will be helpful in addressing
how important are drivers and enablers represented in extracted components for developing
public service innovations. Additionally, variables will be included in the selection equation to
check for the effects of organizations’ size and area of responsibility (local, regional or
national), since level of authority and resource availability (reflected in size) is something that
can certainly affect innovation behaviour. The estimation model is then represented as
follows:
P (Z=1|Y=1) = β0 + βiComponenti
P (Y=1) = β0 + β1Size + β2Governance_level + βiComponenti
Survey questionnaire asks public organizations whether or not they have implemented new or
significantly improved services. Those that gave an affirmative response are then asked if any
of the new services they have implemented were – as far as they know – implemented before
any other public organization within their own country. It can then be verified that the survey
addresses a strong relation of dependence between organizations being identified as
introducing services that are new to the whole sector and the fact that they are previously
identified as implementing new or improved services (no matter if they were implemented
within the sector by another organization before). Therefore, a bivariate probit estimation
with sample selection will let know the probability of being an organization that introduces
services new to the whole sector, conditioned to be and organization that implements service
improvements {P(Z=1|Y=1)}. That seems more accurate than just estimate probabilities with
conventional logit or probit estimations.
Variables about organizations’ size and area of responsibility are also drawn from the
Innobarometer dataset. Area of responsibility identifies whether public organizations belong
to a local, regional or national area, according to their own survey responses, and it is
measured in an ordinal scale. The variable about organizations’ size indicates the number of
employees working in each organization and it is also measured in an ordinal scale. Size
categories represent intervals among which respondents must choose the one that correspond

27
to the right number of employees of their organization (less than 10, between 10 and 49,
between 50 and 99, between 100 and 249, between 250 and 499, between 500 and 999, 1000
or more)8.
5. Results
The main feature of our CATPCA application for component extraction is in quantification of
variables. If quantified ordinal variables (now transformed in a numerical scale) were taken to
a conventional PCA the extracted components in the final solution would be exactly the same
of those that would be obtained through CATPCA, even though CATPCA process differs from
that of conventional PCA. Thus, similar treatments usually made on PCA components for
interpretation can also be made on CATPCA components, like rotation and measurement of
variable correlation.
The application of CATPCA on the selected variables gives a solution accounting for 47,7% of
the observed variance. Kept extracted components are those with eigenvalues greater than 1.
They were subject to Varimax rotation for making them easier to interpret. Table 1 shows the
component loadings. Highest correlations are highlighted in bold.
Table 1. CATPCA loadings of variables and extracted components.
External
information sources
Political and legislative
factors
Active involvement of
managers
User and staff
participation
Ideas from management. i .303 .122 .552 .076
Ideas from staff. i .361 .073 .307 .363
Examples of best practice by another government organisation. i
.454 .135 .358 .038
Professional organisations. i .582 .075 .245 .063
Visits to conferences. i .615 .072 .084 -.023
Enterprises as suppliers. i .706 .054 .031 -.008
Enterprises as clients or users.i .738 .070 .036 .159
Citizens as clients or users. i .624 .155 -.001 .240
Mandated decrease in your organisation’s budget. p .027 .659 .032 .098
Mandated increase in your organisation’s budget. p .057 .612 -.091 .096
Importance of new laws or regulations. p .053 .727 .117 .018
Importance of new policy priorities. p .113 .636 .147 .094
Mandated introduction of new e-government or online services. p
.222 .553 .133 -.112
8 Question about organizations’ size include a Don’t know/Refusal option. Frequency of this answer is
very low. It was found that most of these cases (13 out of 15) correspond to local organizations. Given that more than a half of local organizations responded to have between 10 and 49 employees, the 15 cases with DK responses were recoded into this size interval.

28
Managers support trial-and-error testing of new ideas. s
.054 .031 .770 .098
Managers take an active role in developing and implementing innovations. s
.042 .087 .786 .209
Staff has incentives to think of new ideas and take part in their development. s
-.024 .014 .073 .783
Users are involved in the design or planning of new or improved services. s
.133 .059 .059 .761
New or improved services are evaluated after completion. s
.150 .114 .249 .533
i: Information sources for the development of innovations.
p: Political or legislative factors driving innovations.
s: Strategies helping innovation development.
First component shows higher correlations to variables indicating the importance of the use of
information sources that are external to the organization. Second component is mostly
correlated to variables indicating the importance of political and legislative factors driving
innovations. Third component is correlated to variables reflecting the level of implication of
managers in developing innovations. Finally, highest loadings in the fourth component
correspond to variables indicating involvement of staff and users in the innovation process.
To test the stability of components a bootstrapping exercise was carried out setting 1000
samples to generate confidence regions expected to contain true values of component
eigenvalues and loadings at a confidence level of 95%. Confidence regions are displayed in
two-dimension graphics, following the method of Linting et al. (2007b). CATPCA bootstrapping
method turns conventional confidence regions into ellipse areas on a two-dimensional space
by plotting pairs of components. Ellipse areas draw a space containing 95% of eigenvalues and
loadings obtained from CATPCA on bootstrap samples. The closer values generated in the
original CATPCA process are placed to the center of the ellipse the closer they will be to the
mean of values from bootstrap samples. Ellipse width indicates how disperse bootstrap values
are. Stability on CATPCA values becomes evident when ellipse areas are small and original
CATPCA values are close to the center of the ellipse9.
Displaying graphics for confidence ellipses demands a large space. For that reason, full results
of CATPCA bootstrapping are presented in an annex part. Observed bootstrap results suggest
stability on extracted components and, therefore, validity of results in the next step of our
empirical analysis.
Once components have been extracted and interpreted, and stability has been proven, their
scores are saved and used as explicative variables in a bivariate probit regression with sample
selection. The selection equation identifies organizations that implement new or significantly
improved services (i.e. service innovations) no matter they are services or improvements that
were implemented before by another organization. The objective equation explains the
probability of being an organization that introduces services that are new within the whole
9 Thus, accepting stability depends on observer appreciation. A practical application of CATPA
bootstrapping in Linting et al. (2007b) might be useful as a reference to interpret results.

29
public sector. Variables accounting for organizations’ size and level of governance have been
introduced to the selection equation. Table 2 shows estimation results.
Table 2. Results of Heckman’s probit with sample selection
Innovate services (selection)
Introduce new services
Size (number of employees)
10-49 (base) --
50-99 0,1726** --
100-249 0,1111* --
250-499 0,4003*** --
500-999 0,4944*** --
1000 or more 0,64*** --
Area of responsibility
Local (base) --
Regional 0,1541*** --
National 0,1502* --
External information sources 0,1035*** 0,0953***
Political and legislative factors 0,0392* -0,032
Managers actively involved 0,1141*** 0,0202
User and employee participation 0,0672*** 0,0738***
Constant 0,5252*** -0,2277*** LR test of indep. eqns. : Chi2 = 32,52 (Prob > Chi2 = 0.000)
* 90% confidence level; ** 95% confidence level; *** 99% confidence level
The estimated coefficients of variables that define the probability of being observed (i.e. being
identified as an organization that has recently introduced service innovations) are all
statistically significant to some degree. Coefficients suggest that organizations’ size has an
important effect on the probability, this especially true for larger organizations. To be in a
bigger area of responsibility (regional or national, as opposed to local) also has a significant
effect, as well as components representing drivers and enablers. Components’ coefficients
seem to indicate that active involvement of managers and the use of external sources of
information have a more relevant effect than political factors and participation of users and
employees.
In turn, components explaining the probability of being an organization that introduces
services new to the whole sector –conditioned to be previously known as an organization that
introduces service innovations – they show small and not always significant coefficients.
Political and legislative factors (which show a negative effect) and active involvement of
managers does not reach individual significance. In turn, use of external information sources
and user and employee participation does reach individual significance, but their small
coefficients suggest their effect on the conditioned probability is modest.
Constants in both probability estimations might tell something about the resilience of public
organizations to carry implementations with higher degree of novelty. The constant term in
the estimated probability of being observed is positive and large. In turn, that in the estimated
conditioned probability is negative and also of considerable magnitude. A plausible

30
interpretation is that there is a certain inclination among public organizations towards
implementing service innovations, while organizations are also inclined in the opposite sense
towards introducing services that are new within the whole public sector. It might here be
found some evidence on the high public sector aversion to the risk implied in innovation (as
something essentially new) and how it can be to some extent overcome by the drivers and
enablers that are here analyzed.
Coefficients are, however, only a partial reading of the estimation results. A more revealing
way to analyze relevance of variables explaining probabilities is in calculating their predictive
marginal effects.
Predictive marginal effects were calculated for all organization’s size intervals. Marginal effects
were calculated giving specific values for each of the components while holding the rest of
variables at their average value. Results predict the exact magnitude that the probability takes
at specific values of the correspondent component, from changes in the size variable. Specific
values of components were chosen having as reference consecutive increases of 0,5 starting
from their lowest value. Results were plotted and are next displayed for their analysis. All
marginal effects have proven to be statistically significant at a 99% confidence level. Although
the changing variable in marginal effects is not the observed component, but the size variable,
this exercise still works as a way to address differences in the overall probability due to
different values of the one component under analysis. The purpose, though, is in observing
magnitudes of probability at different values of each component.
With respect to marginal effects for the three levels of area of responsibility, it should be
enough to say that they offer a picture very similar to that of the size effects. But this is
something one could have expected since there is an important relation between
organizations’ size and the responsibility area they belong to.
In addition, there were also calculated marginal effects for changes in the value of extracted
components. These represent the magnitude of a change in the predicted probability from a
“one unit” change in the average value of the component under analysis. Effects were
calculated at representative values of organizations’ size and area of responsibility. Results on
these marginal effects are shown in tables in Annex II. They show similar tendencies as those
that will next be reviewed. An important difference, however, is that most of marginal effects
in the predicted conditioned probability from the second component (Political and legislative
factors) does not reach any level of statistical significance. The reason is that significance is
here tested on changes in the average value of the component. When the value of the
component changes the effect on the predicted probability is not found statistically significant.
On the other hand, statistical significance in the following effects was tested on changes in
organizations’ size, from which the overall value of predicted probabilities was calculated.

31
.6.7
.8.9
1
Pr(
Innov)
-2.5 -2 -1.5 -1 -.5 0 .5 1 1.5 2 2.5 3External information sources
10-49 50-99
100-249 250-499
500-999 more 1000
Predictive Margins of size
Figure 1: Predictive marginal effects for organizations’ size at representative values of ‘External information sources’.
.1.2
.3.4
.5
Pr(
Leadin
g=
1|Innov=
1)
-2.5 -2 -1.5 -1 -.5 0 .5 1 1.5 2 2.5 3External information sources
10-49 50-99
100-249 250-499
500-999 more 1000
Predictive Margins of size
As seen in Figure 1, marginal effects at representative values of the ‘External information
sources’ component show a positive relation between discrete values of the component and
the predictive probability of being an organization that introduces new or significantly
improved services (i.e. service innovations). It also shows a positive relation for the probability
of being an organization that introduces services that are new to the whole public sector –
conditioned to be previously known as an organization that introduces service innovations.
There is a small but noticeable gap between the lines representing probabilities of bigger
organizations in the upper part and the lines of smaller organizations at the bottom. This can
be observed in both kinds of probabilities, although differences are more compact among
conditioned probabilities. This might indicate organizations’ size (and other capability
characteristics related to it) loses some relevance when introducing services that are new for
the whole sector.
It is also interesting to observe differences of probabilities when they are predicted in the
lowest and highest values of the external sources component. Differences are slightly larger
for smaller organizations, which is easier to observe in the probability of introducing service
innovations. This probability increases around 17 to 19 percent points for smaller
organizations and around 11 to 13 points for bigger ones, from the lowest to the highest value
of the component. On the other hand, the conditioned probability of organizations introducing
services new for the whole sector increases around 30 percent points for all organizations’
sizes.

32
.7.7
5.8
.85
.9
Pr(
Innov)
-2 -1.5 -1 -.5 0 .5 1 1.5 2 2.5Political and legislative factors
10-49 50-99
100-249 250-499
500-999 more 1000
Predictive Margins of size
Figure 2: Predictive marginal effects for organizations’ size at representative values of ‘Political and
legislative factors’.
.2.2
5.3
.35
Pr(
Leadin
g=
1|Innov=
1)
-2 -1.5 -1 -.5 0 .5 1 1.5 2 2.5Political and legislative factors
10-49 50-99
100-249 250-499
500-999 more 1000
Predictive Margins of size
Figure 2 shows a positive relation between discrete values of the ‘Political and legislative
factors’ component and the predictive probability of being an organization that implements
service innovations. This relation turns to be negative for the probability of being an
organization that introduces services new to the whole public sector. However it is not
possible to determine the effect that different values of the importance of Political and
legislative factors will have on the overall conditioned probability, given that statistical
significance couldn’t be proved on this component’s effects (see Table 2 and Anex II).
Differences between predictive probabilities for the lowest and highest values of the Political
factors component are small (compared to those calculated at ‘External information sources’
values). Differences for organizations introducing service innovations account for about 3 to 6
percent points, while differences in the conditioned probabilities of organizations introducing
services new to the whole sector accounts for about -3 points.
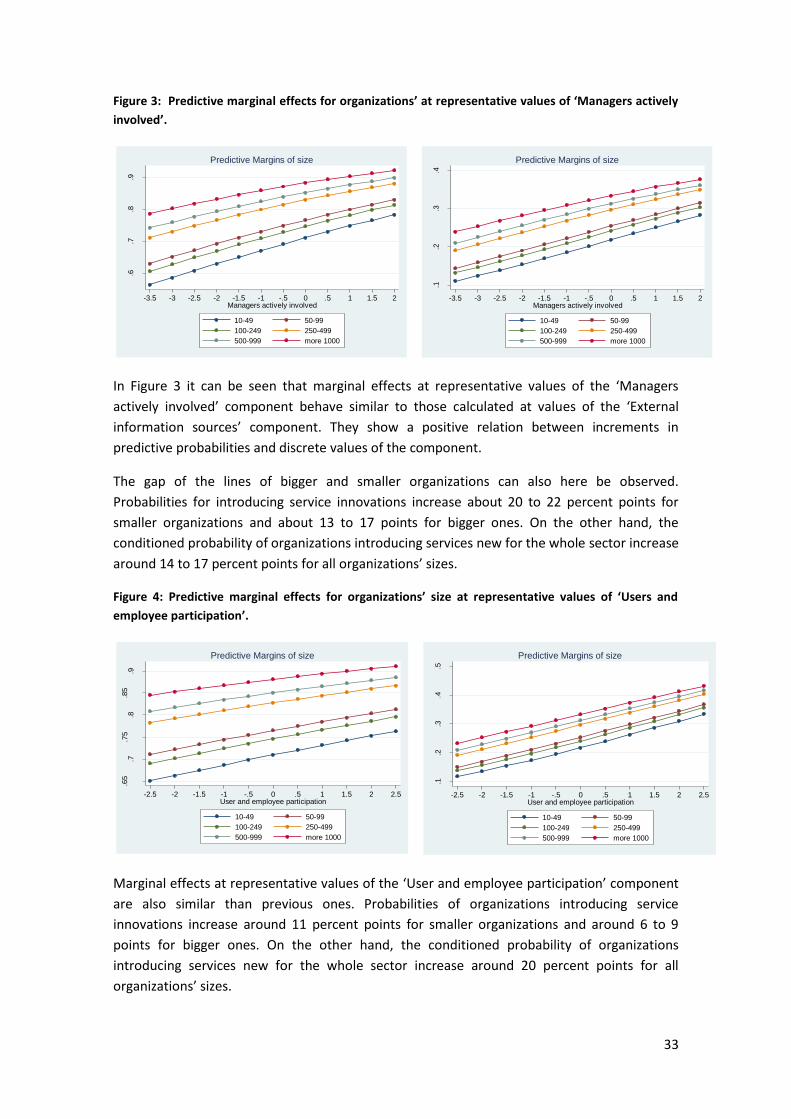
33
.6.7
.8.9
Pr(
Innov)
-3.5 -3 -2.5 -2 -1.5 -1 -.5 0 .5 1 1.5 2Managers actively involved
10-49 50-99
100-249 250-499
500-999 more 1000
Predictive Margins of size
.65
.7.7
5.8
.85
.9
Pr(
Innov)
-2.5 -2 -1.5 -1 -.5 0 .5 1 1.5 2 2.5User and employee participation
10-49 50-99
100-249 250-499
500-999 more 1000
Predictive Margins of size
Figure 3: Predictive marginal effects for organizations’ at representative values of ‘Managers actively
involved’.
.1.2
.3.4
Pr(
Leadin
g=
1|Innov=
1)
-3.5 -3 -2.5 -2 -1.5 -1 -.5 0 .5 1 1.5 2Managers actively involved
10-49 50-99
100-249 250-499
500-999 more 1000
Predictive Margins of size
In Figure 3 it can be seen that marginal effects at representative values of the ‘Managers
actively involved’ component behave similar to those calculated at values of the ‘External
information sources’ component. They show a positive relation between increments in
predictive probabilities and discrete values of the component.
The gap of the lines of bigger and smaller organizations can also here be observed.
Probabilities for introducing service innovations increase about 20 to 22 percent points for
smaller organizations and about 13 to 17 points for bigger ones. On the other hand, the
conditioned probability of organizations introducing services new for the whole sector increase
around 14 to 17 percent points for all organizations’ sizes.
Figure 4: Predictive marginal effects for organizations’ size at representative values of ‘Users and
employee participation’.
.1.2
.3.4
.5
Pr(
Leadin
g=
1|Innov=
1)
-2.5 -2 -1.5 -1 -.5 0 .5 1 1.5 2 2.5User and employee participation
10-49 50-99
100-249 250-499
500-999 more 1000
Predictive Margins of size
Marginal effects at representative values of the ‘User and employee participation’ component
are also similar than previous ones. Probabilities of organizations introducing service
innovations increase around 11 percent points for smaller organizations and around 6 to 9
points for bigger ones. On the other hand, the conditioned probability of organizations
introducing services new for the whole sector increase around 20 percent points for all
organizations’ sizes.

34
Thus, after reviewing probability estimation results and marginal effects, the next overall
conclusions can be stated.
The probability of being identified as an organization introducing service innovations is already
high at a starting point, especially for larger organizations and those at higher levels of
governance. It can be verified that a more intensive use (reflected in the ‘how important’
survey questions on innovation drivers and strategy) of innovation drivers and enablers will
help to increase this probability and the increase will be proportionally bigger for the smallest
organizations. Active involvement of managers in first place and the use of external sources of
information in second place they both appear to have the more powerful effects on the
probability.
The probability of being identified as an organization introducing services that are new within
the whole public sector is low at a starting point, especially for smaller organizations and those
at the local level of governance. Nevertheless, it can be verified that a more intensive use of
innovation drivers and enablers will help to largely increase this probability, except for political
and legislative factors, whose effects couldn’t be determined from estimations and marginal
effects. Proportion of increases looks similar among all organizations’ sizes; however, it can be
verified that increases are still slightly bigger for smaller organizations. Differences in predicted
conditioned probability at representative components’ values are noticeably larger than those
of probability of being observed. Regarding this, the effect of the ‘External information
sources’ component is remarkable.
Results from the empirical analysis are helpful to support to a higher or a lesser extent
propositions stated in research hypotheses. First hypothesis suggests that political and
legislative factors are significant for implementing public service innovation. In Heckman’s
probit estimations, the effect of the political and legislative factors component is barely found
statistically significant, and something similar can be said from results on marginal effects. On
the other hand, when we point only to implementation of services that are new within the
whole public sector, the effect of political and legislative factors is not found statistically
significant and, therefore, cannot be determined from this empirical analysis. Meanwhile, the
second hypothesis suggests that active involvement of managers is also significant for
implementing public service innovations. In this case, empirical results are better conclusive.
Magnitude and statistical significance of component coefficient in Heckman’s estimation is
high for the probability of being observed (i.e. being and organization implementing service
innovations). At the same time, marginal effects are highly significant and of considerable
value (compared to the effects of the rest of components) for the predicted probability of
being an organization introducing services that are new to the whole sector. Finally, third
hypothesis suggests that the application of some enabling strategies has a significant effect in
implementation of public service innovation. To this respect we have analyzed two strategies
in particular: the use of external sources of information and user and staff participation. Both
of them show – as can be seen in results from Heckman’s estimation and marginal effects –
high and significant effects on both the probability of being an organization implementing
service innovations and the probability of being an organization introducing services that are
new to the whole sector.
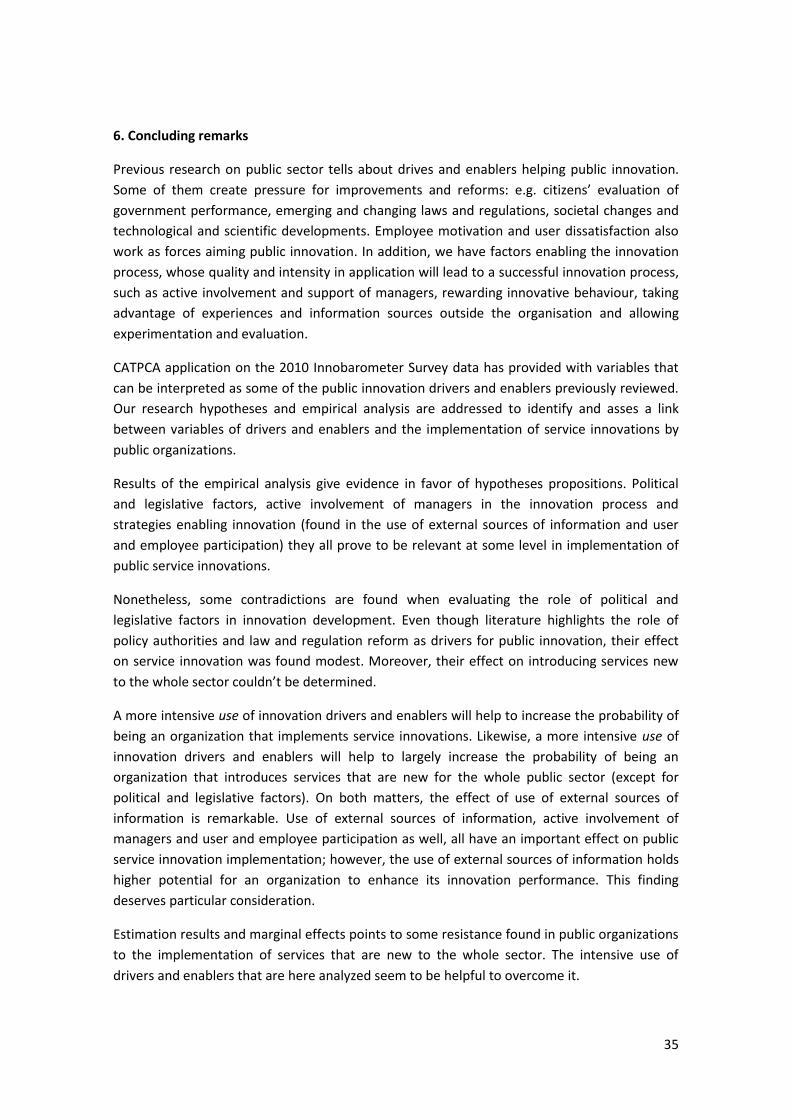
35
6. Concluding remarks
Previous research on public sector tells about drives and enablers helping public innovation.
Some of them create pressure for improvements and reforms: e.g. citizens’ evaluation of
government performance, emerging and changing laws and regulations, societal changes and
technological and scientific developments. Employee motivation and user dissatisfaction also
work as forces aiming public innovation. In addition, we have factors enabling the innovation
process, whose quality and intensity in application will lead to a successful innovation process,
such as active involvement and support of managers, rewarding innovative behaviour, taking
advantage of experiences and information sources outside the organisation and allowing
experimentation and evaluation.
CATPCA application on the 2010 Innobarometer Survey data has provided with variables that
can be interpreted as some of the public innovation drivers and enablers previously reviewed.
Our research hypotheses and empirical analysis are addressed to identify and asses a link
between variables of drivers and enablers and the implementation of service innovations by
public organizations.
Results of the empirical analysis give evidence in favor of hypotheses propositions. Political
and legislative factors, active involvement of managers in the innovation process and
strategies enabling innovation (found in the use of external sources of information and user
and employee participation) they all prove to be relevant at some level in implementation of
public service innovations.
Nonetheless, some contradictions are found when evaluating the role of political and
legislative factors in innovation development. Even though literature highlights the role of
policy authorities and law and regulation reform as drivers for public innovation, their effect
on service innovation was found modest. Moreover, their effect on introducing services new
to the whole sector couldn’t be determined.
A more intensive use of innovation drivers and enablers will help to increase the probability of
being an organization that implements service innovations. Likewise, a more intensive use of
innovation drivers and enablers will help to largely increase the probability of being an
organization that introduces services that are new for the whole public sector (except for
political and legislative factors). On both matters, the effect of use of external sources of
information is remarkable. Use of external sources of information, active involvement of
managers and user and employee participation as well, all have an important effect on public
service innovation implementation; however, the use of external sources of information holds
higher potential for an organization to enhance its innovation performance. This finding
deserves particular consideration.
Estimation results and marginal effects points to some resistance found in public organizations
to the implementation of services that are new to the whole sector. The intensive use of
drivers and enablers that are here analyzed seem to be helpful to overcome it.

36
Finally, organisations’ size and area of responsibility also appear as important features
explaining differences between organizations’ innovation performance. Results suggest there
is greater chance that service innovation (in the form of services new for the whole sector) is
being introduced to the public sector by big national/regional organisations than by small local
ones.
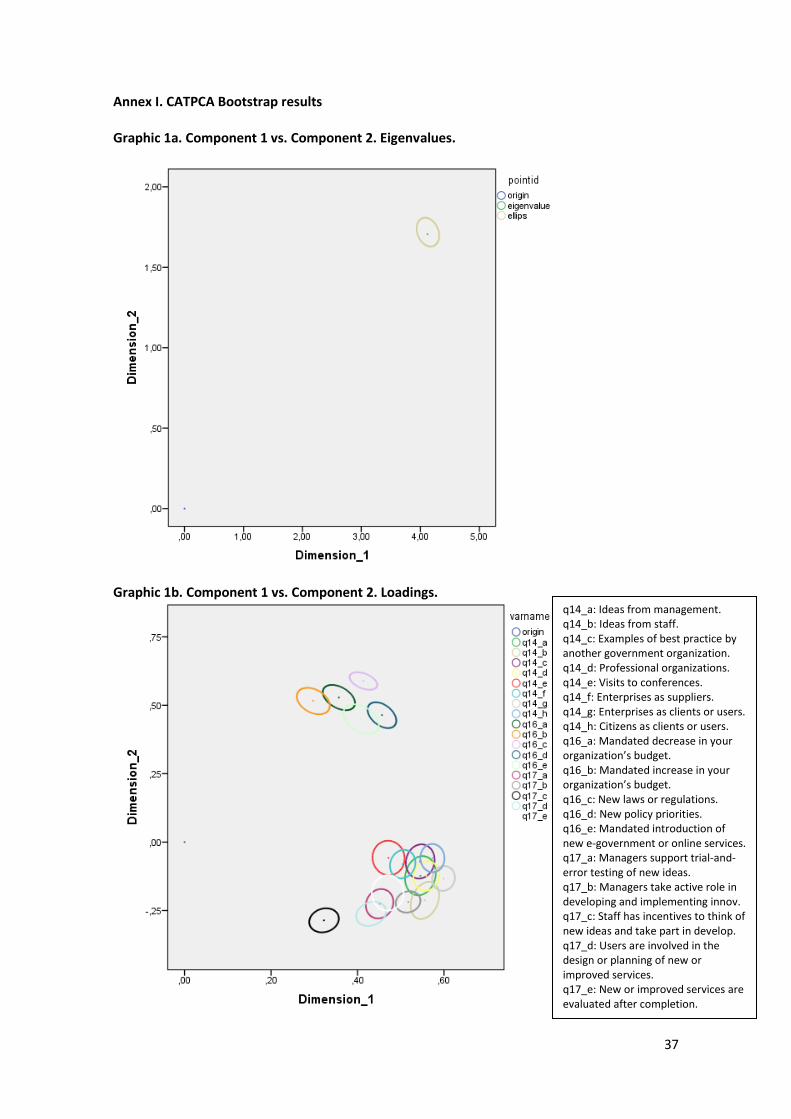
37
Annex I. CATPCA Bootstrap results
Graphic 1a. Component 1 vs. Component 2. Eigenvalues.
Graphic 1b. Component 1 vs. Component 2. Loadings.
q14_a: Ideas from management. q14_b: Ideas from staff. q14_c: Examples of best practice by another government organization. q14_d: Professional organizations. q14_e: Visits to conferences. q14_f: Enterprises as suppliers. q14_g: Enterprises as clients or users. q14_h: Citizens as clients or users. q16_a: Mandated decrease in your organization’s budget. q16_b: Mandated increase in your organization’s budget. q16_c: New laws or regulations. q16_d: New policy priorities. q16_e: Mandated introduction of new e-government or online services. q17_a: Managers support trial-and-error testing of new ideas. q17_b: Managers take active role in developing and implementing innov. q17_c: Staff has incentives to think of new ideas and take part in develop. q17_d: Users are involved in the design or planning of new or improved services. q17_e: New or improved services are evaluated after completion.
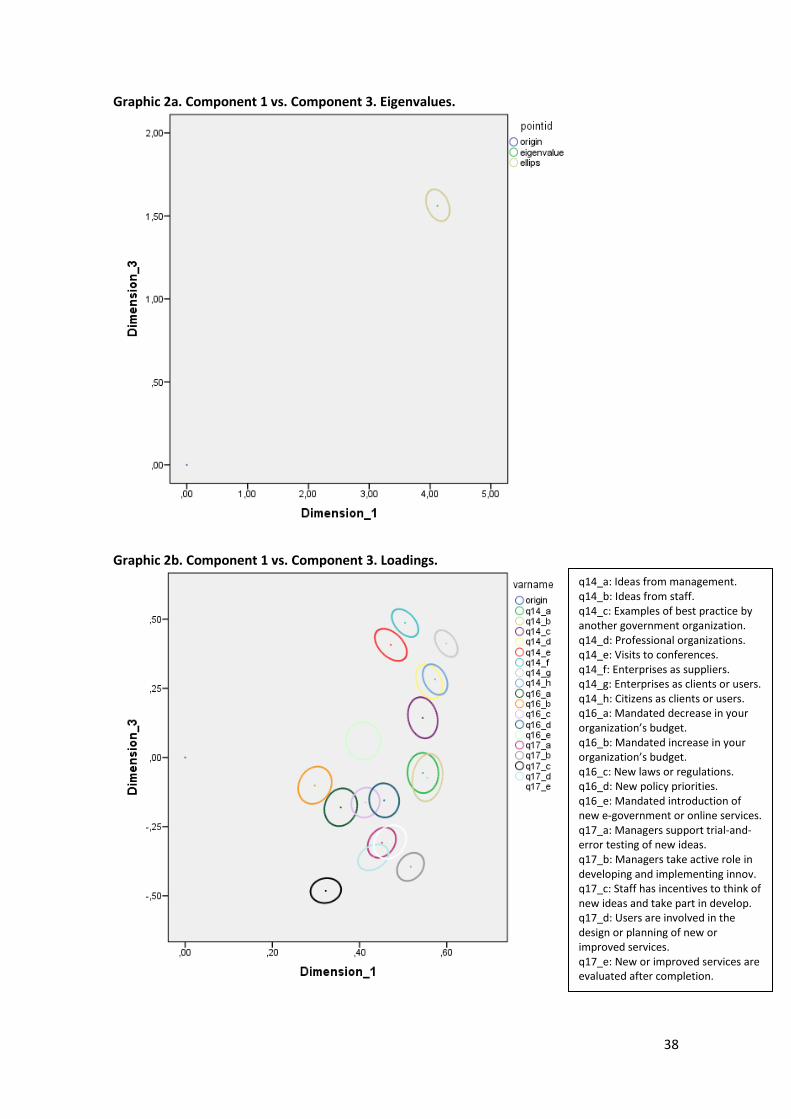
38
Graphic 2a. Component 1 vs. Component 3. Eigenvalues.
Graphic 2b. Component 1 vs. Component 3. Loadings.
q14_a: Ideas from management. q14_b: Ideas from staff. q14_c: Examples of best practice by another government organization. q14_d: Professional organizations. q14_e: Visits to conferences. q14_f: Enterprises as suppliers. q14_g: Enterprises as clients or users. q14_h: Citizens as clients or users. q16_a: Mandated decrease in your organization’s budget. q16_b: Mandated increase in your organization’s budget. q16_c: New laws or regulations. q16_d: New policy priorities. q16_e: Mandated introduction of new e-government or online services. q17_a: Managers support trial-and-error testing of new ideas. q17_b: Managers take active role in developing and implementing innov. q17_c: Staff has incentives to think of new ideas and take part in develop. q17_d: Users are involved in the design or planning of new or improved services. q17_e: New or improved services are evaluated after completion.

39
Graphic 3a. Component 1 vs. Component 4. Eigenvalues.
Graphic 3b. Component 1 vs. Component 4. Loadings.
q14_a: Ideas from management. q14_b: Ideas from staff. q14_c: Examples of best practice by another government organization. q14_d: Professional organizations. q14_e: Visits to conferences. q14_f: Enterprises as suppliers. q14_g: Enterprises as clients or users. q14_h: Citizens as clients or users. q16_a: Mandated decrease in your organization’s budget. q16_b: Mandated increase in your organization’s budget. q16_c: New laws or regulations. q16_d: New policy priorities. q16_e: Mandated introduction of new e-government or online services. q17_a: Managers support trial-and-error testing of new ideas. q17_b: Managers take active role in developing and implementing innov. q17_c: Staff has incentives to think of new ideas and take part in develop. q17_d: Users are involved in the design or planning of new or improved services. q17_e: New or improved services are evaluated after completion.

40
Graphic 4a. Component 2 vs. Component 3. Eigenvalues.
Graphic 4b. Component 2 vs. Component 3. Loadings.
q14_a: Ideas from management. q14_b: Ideas from staff. q14_c: Examples of best practice by another government organization. q14_d: Professional organizations. q14_e: Visits to conferences. q14_f: Enterprises as suppliers. q14_g: Enterprises as clients or users. q14_h: Citizens as clients or users. q16_a: Mandated decrease in your organization’s budget. q16_b: Mandated increase in your organization’s budget. q16_c: New laws or regulations. q16_d: New policy priorities. q16_e: Mandated introduction of new e-government or online services. q17_a: Managers support trial-and-error testing of new ideas. q17_b: Managers take active role in developing and implementing innov. q17_c: Staff has incentives to think of new ideas and take part in develop. q17_d: Users are involved in the design or planning of new or improved services. q17_e: New or improved services are evaluated after completion.

41
Graphic 5a. Component 2 vs. Component 4. Eigenvalues.
Graphic 5b. Component 2 vs. Component 4. Loadings.
Graphic 6a. Component 3 vs. Component 4. Eigenvalues.
q14_a: Ideas from management. q14_b: Ideas from staff. q14_c: Examples of best practice by another government organization. q14_d: Professional organizations. q14_e: Visits to conferences. q14_f: Enterprises as suppliers. q14_g: Enterprises as clients or users. q14_h: Citizens as clients or users. q16_a: Mandated decrease in your organization’s budget. q16_b: Mandated increase in your organization’s budget. q16_c: New laws or regulations. q16_d: New policy priorities. q16_e: Mandated introduction of new e-government or online services. q17_a: Managers support trial-and-error testing of new ideas. q17_b: Managers take active role in developing and implementing innov. q17_c: Staff has incentives to think of new ideas and take part in develop. q17_d: Users are involved in the design or planning of new or improved services. q17_e: New or improved services are evaluated after completion.

42
Graphic 6b. Component 3 vs. Component 4. Loadings.
q14_a: Ideas from management. q14_b: Ideas from staff. q14_c: Examples of best practice by another government organization. q14_d: Professional organizations. q14_e: Visits to conferences. q14_f: Enterprises as suppliers. q14_g: Enterprises as clients or users. q14_h: Citizens as clients or users. q16_a: Mandated decrease in your organization’s budget. q16_b: Mandated increase in your organization’s budget. q16_c: New laws or regulations. q16_d: New policy priorities. q16_e: Mandated introduction of new e-government or online services. q17_a: Managers support trial-and-error testing of new ideas. q17_b: Managers take active role in developing and implementing innov. q17_c: Staff has incentives to think of new ideas and take part in develop. q17_d: Users are involved in the design or planning of new or improved services. q17_e: New or improved services are evaluated after completion.
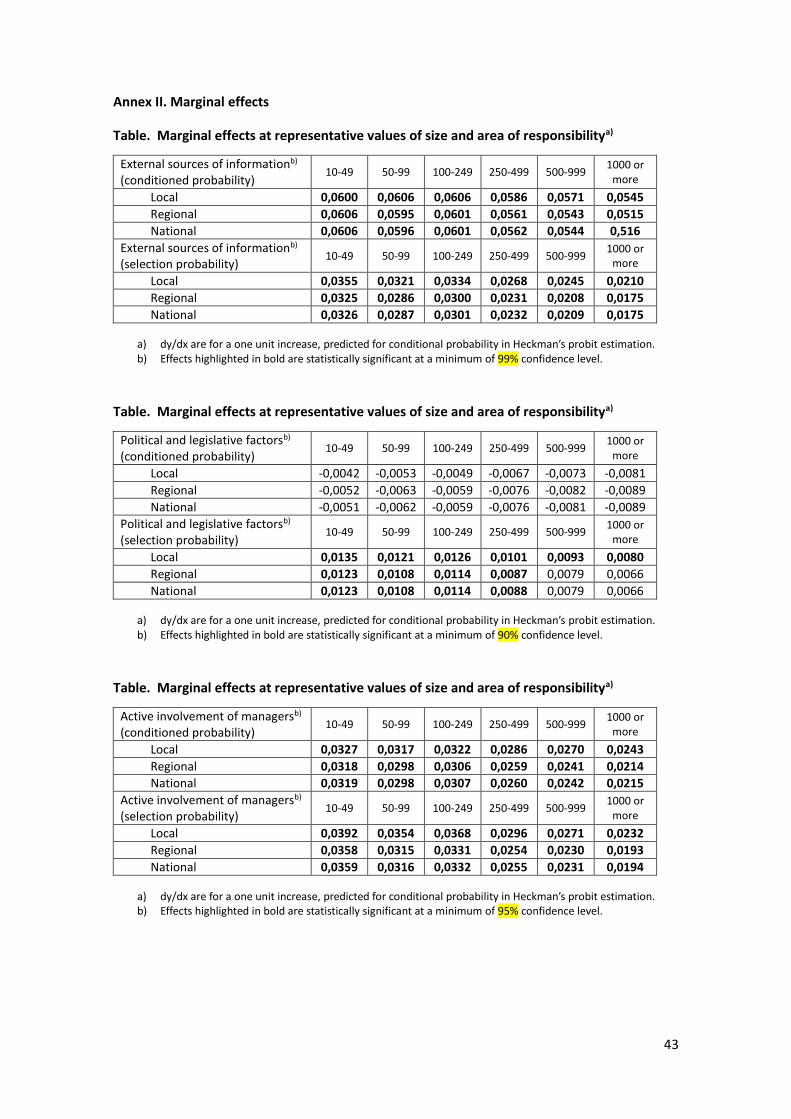
43
Annex II. Marginal effects
Table. Marginal effects at representative values of size and area of responsibilitya)
External sources of informationb) (conditioned probability)
10-49 50-99 100-249 250-499 500-999 1000 or
more
Local 0,0600 0,0606 0,0606 0,0586 0,0571 0,0545
Regional 0,0606 0,0595 0,0601 0,0561 0,0543 0,0515
National 0,0606 0,0596 0,0601 0,0562 0,0544 0,516
External sources of informationb) (selection probability)
10-49 50-99 100-249 250-499 500-999 1000 or
more
Local 0,0355 0,0321 0,0334 0,0268 0,0245 0,0210
Regional 0,0325 0,0286 0,0300 0,0231 0,0208 0,0175
National 0,0326 0,0287 0,0301 0,0232 0,0209 0,0175
a) dy/dx are for a one unit increase, predicted for conditional probability in Heckman’s probit estimation. b) Effects highlighted in bold are statistically significant at a minimum of 99% confidence level.
Table. Marginal effects at representative values of size and area of responsibilitya)
Political and legislative factorsb) (conditioned probability)
10-49 50-99 100-249 250-499 500-999 1000 or
more
Local -0,0042 -0,0053 -0,0049 -0,0067 -0,0073 -0,0081
Regional -0,0052 -0,0063 -0,0059 -0,0076 -0,0082 -0,0089
National -0,0051 -0,0062 -0,0059 -0,0076 -0,0081 -0,0089
Political and legislative factorsb) (selection probability)
10-49 50-99 100-249 250-499 500-999 1000 or
more
Local 0,0135 0,0121 0,0126 0,0101 0,0093 0,0080
Regional 0,0123 0,0108 0,0114 0,0087 0,0079 0,0066
National 0,0123 0,0108 0,0114 0,0088 0,0079 0,0066
a) dy/dx are for a one unit increase, predicted for conditional probability in Heckman’s probit estimation. b) Effects highlighted in bold are statistically significant at a minimum of 90% confidence level.
Table. Marginal effects at representative values of size and area of responsibilitya)
Active involvement of managersb) (conditioned probability)
10-49 50-99 100-249 250-499 500-999 1000 or
more
Local 0,0327 0,0317 0,0322 0,0286 0,0270 0,0243
Regional 0,0318 0,0298 0,0306 0,0259 0,0241 0,0214
National 0,0319 0,0298 0,0307 0,0260 0,0242 0,0215
Active involvement of managersb) (selection probability)
10-49 50-99 100-249 250-499 500-999 1000 or
more
Local 0,0392 0,0354 0,0368 0,0296 0,0271 0,0232
Regional 0,0358 0,0315 0,0331 0,0254 0,0230 0,0193
National 0,0359 0,0316 0,0332 0,0255 0,0231 0,0194
a) dy/dx are for a one unit increase, predicted for conditional probability in Heckman’s probit estimation. b) Effects highlighted in bold are statistically significant at a minimum of 95% confidence level.

44
Table. Marginal effects at representative values of size and area of responsibilitya)
User and staff participation (conditioned probability)
10-49 50-99 100-249 250-499 500-999 1000 or
more
Local 0,0437 0,0443 0,0443 0,0431 0,0422 0,0404
Regional 0,0443 0,0437 0,0441 0,0415 0,0403 0,0384
National 0,0443 0,0437 0,0441 0,0415 0,0404 0,0385
User and staff participation (selection probability)
10-49 50-99 100-249 250-499 500-999 1000 or
more
Local 0,0231 0,0209 0,0217 0,0174 0,0160 0,0137
Regional 0,0211 0,0186 0,0195 0,0150 0,0135 0,0114
National 0,0212 0,0186 0,0196 0,0151 0,0136 0,0114
a) dy/dx are for a one unit increase, predicted for conditional probability in Heckman’s probit estimation. b) Effects highlighted in bold are statistically significant at a minimum of 99% confidence level.

45
Chapter 2. The role of external information sources
for service innovation in public sector

46
1. Introduction
One of the objectives of the present study is to contribute to fill in the gap of empirical work by
using a quantitative approach to analyse a key aspect in factors driving public services
innovation: the use of external sources of information in innovation development.
The discussion about using externals sources for better innovation performance has a basic
reference in studies on manufacturing industry firms (e.g. Cassiman & Veugelers, 2006;
Laursen & Salter, 2006; Sofka & Grimpe 2010) where it was observed a shift in their innovation
production process, from a closed model, mostly reliant on internal activities of R&D, to an
open model, which allows and support integration of knowledge from sources external to the
organisation, as a way to enhance the limited internal capabilities to innovate. Recently and
following the development of the open model approach in the manufacturing sector, the use
of external sources as a factor explaining differences in innovation performance has been
taken to the services sector study field. As a natural step in this conceptual development, our
article tests the role of external sources in public services innovation by measuring the effect
of the use of external sources on public organisations’ innovation performance.
A different framework is needed for public services, since drivers of public innovation are
found to be out of market incentives – usually aiming innovation in private sector – and the
strategies towards its development and implementation are not typically relying on internal
R&D activities, like in the case of product innovation among manufacturing industry firms.
Learning from the outside means relationships with other organizations (public, private third
sector) and citizens than can bring the idea and knowledge for innovation on top of the
internal generation of ideas and knowledge from managers or front-line staff.
The chapter is organized as follows. After this introductory part, section 2 contains a summary
of literature review where the concept of open innovation and use of external sources is
explained. After that it is there proposed a theoretical framework based on the specificities of
public sector innovation. Section 3 presents the research hypothesis addressing the empirical
part of our study. Section 4 widely describes the methodology that will be applied for testing
our hypothesis and also the data base in use. In section 5 results are presented, interpreted
and discussed, and the concluding statements correspond to section 6.
2. External sources for public innovation? A specific framework
Many academics agree to say that studies about public sector innovation are still on an early
stage (e.g. Vigoda-Gadot et al., 2008; Alves, 2013; Osborne & Brown, 2013). To advance on the
development of the subject, drawing from private sector studies on innovation has proven to
be useful for providing a frame of analysis. However, this approach demands a revised
conceptual frame in order to adequate to the particular specifities of the public sector. In
attention to that, we start to establish a conceptual frame by reviewing some studies based on
evidence from private sector firms. Then we focus on public sector innovation specifities
acknowledged in public sector innovation studies. Thus, our frame of analysis will be focused

47
on public sector specifities, but having as reference and starting point the innovation dynamics
already observed in private business sector.
2.1 The open model: using external sources for innovation
The idea of incorporating external sources to the innovation process (rather than only relying
on internal R&D) has been repeatedly issued in the literature about innovation. From different
approaches, studies have pointed to the importance of taking advantage from external sources
to shift innovation benefits (e.g. von Hippel, 1988; Cohen & Levinthal, 1990). However,
competing markets, integration, globalization and development of ICTs have made the use of
external sources almost imperative (Porter & Stern, 2001; Rigby & Zook, 2002; Chesbrough,
2003). On that matter, the conceptual construct known as ‘open innovation’ has emerged as a
new trend in academic studies to explain the dynamics of the innovation process nowadays
(Gassman, 2006).
There is a widening tendency about focusing firm behavior studies on openness and
interaction, strongly suggesting that the link between the firm and its external environment
can play an important role in shaping innovation performance. For that reason, firms should
shift their R&D efforts to the outside by making cooperation agreements, looking for publicly
available information, taking part in networks, going to universities and research institutes,
etc. in order to reach a bigger pool of market opportunities (Nelson & Winter, 1982; Metcalfe,
1994; Sakkab, 2002).
On the other hand, the multiple concepts and approaches brought together in open innovation
makes it a blurry concept that complicates the task of defining a consistent analytical frame
(Dahlander & Gann, 2010). Nonetheless, among the many identified dimensions, modes and
levels of openness (Gassman & Enkel, 2004; Dahlander & Gann, 2010), the use of knowledge
and information gathered from external sources is a primary feature of an open process. Thus,
the use of external sources of knowledge and information is frequently used in studies to make
reference to openness in firms’ innovation processes (e.g. Laursen & Salter, 2006; Santamaria
et al., 2009; Sofka & Grimpe, 2010).
Studies on manufacturing industry suggest that strategies of innovation based on making use
of knowledge and information from external sources lead to better results in innovation
performance and – therefore – to a greater value production. Widely cited, the work of
Laursen and Salter (2006) finds that searching outside the organization does improve
innovation performance and Cassiman and Veugelers (2006) get to similar conclusions.
Another important finding in them is that depending on the specific context of the firm,
external search activities not only complement internal development efforts but they could
also work as a substitute of internal R&D. This is not to mean that firms should abandon inputs
to innovation provided by internal sources – which are still fundamental to the innovation
process – but to put an emphasis on the potential of an adequate strategy of external search
(Pisano, 1990; Veugelers, 1997; Rigby & Zook, 2002; Cassiman & Veugelers, 2006; Grimpe &
Kaiser, 2010). Moreover, Windrum et al. (2013) stress the importance of external sources for
incremental innovation in Europe, what has also been tested in the case of European services
(Battisti et al., 2014).

48
Efforts have been made to translate ideas on the use of external sources and the open model
to a field that counts on the characteristics of services business and products. For many years
the study of innovation has been biased to technology development in a manufacturing
industry context, which has led to concepts and ideas rigidly defined fitting industrial activities
(Miles, 2007). However, innovation in service activities demands a wider conceptualization of
service products and delivery, activities of R&D and how they are organized inside the firm and
also the ways in which service firms can link and engage to external agents for gathering
knowledge and information (Gallouj, 2002; Hipp & Grupp, 2005; Rubalcaba, 2006; Miles,
2007). In fact, there are important difficulties in the applicability of conventional definitions of
R&D to much of the innovation activities in services (Djellal et al., 2003); these activities
involve knowledge and processes different than those involved in manufacturing firms (Djellal
et al., 2003; Miles, 2007).
While studies on manufacturing firms give importance to R&D as the main source where the
innovation process rely, service firms studies does not give the same relevance to conventional
R&D as driving service sector innovation. This is not to mean that service sector firms are not
conducting R&D; they are, in fact10. But, the proportion of activities in service R&D is still fairly
low compared to the weight of the service sector economic value (Evangelista, 2000;
Rubalcaba, 2006; Miles, 2007). Innovation in services mostly relies on sources that are not
directly related to R&D (Barras, 1990; Gallouj, 1998; Howells, 2000; Miles & Tether, 2003;
Miles, 2007; Tether, 2005; Rubalcaba et al., 2012)
There is a general pressure above business organizations to become more innovative and that
is also true for service sector organizations. A competing market is taking service firms – just as
manufacturing firms – to look for competitiveness and differentiation, and innovation is
certainly a powerful tool to get it. Furthermore, the trend to greater liberalization in services
trade adds pressure to service firms to engage in innovation activities (Miozzo & Soete, 2001;
Miles, 2007). The open innovation model and the use of external sources of knowledge is
therefore a promising way to enhance innovation performance for service firms (Gallego et al.,
2013).
It is a new interest in service innovation studies to observe if external sources of knowledge
and information might be as important as internal development sources, like studies on
manufacturing industry suggest (Chesbrough, 2011). Battisti et al. (2014) prove the role of
external sources for incremental innovation in private European firms, but not for radical
innovation, and the importance of public-private innovation networks in services (Gallouj et
al., 2013) proves the role of networking and collaboration between different agents: a
dimension of the service innovation concept (Rubalcaba et al., 2012).
10 For instance, the National Science Foundation reported in 2005 those service sectors to which
substantial R&D is attributed in the United States. These are sectors carrying professional, scientific and
technical services such as computer systems design, scientific R&D, architecture, engineering and
related services (see Miles, 2007)

49
2.2 The role of external sources in public sector services innovation
We have until now reviewed the use of external sources of knowledge and information as a
way to enhance innovation occurring at the business level. Profitability of innovation and
declining results from internal efforts for innovation development appear to be the force
pushing for an open model towards innovation. However, while competitiveness and
profitability have been largely pointed to be at the aim for private sector innovation, these
might not be the right ones to explain innovation within public sector organizations. There is a
consistent bulk of studies that document drivers and enablers of public innovation attending
to the particular nature of the public sector (e.g. Borins 2002; 2006; Halvorsen et al., 2005;
Hartley, 2005; Vigoda-Gadot et al., 2005; Potts, 2009; Arundel & Hollanders, 2011).
Public organizations’ boundaries: internal and external information sources.
As the innovation dynamics evolved in private firms studies so did the way organizations
boundaries are defined. Boundaries are dependent on the approach to how organizations
relate and build networks with other organizations and agents (Dahlander& Gann, 2010).
However, thinking of public organizations linking within the same field or sector (e.g. general
administration, education, health, housing, environment…) is different from the case of
business organizations linking in the same market. Business organizations compete among
them and the ways they draw knowledge and information from each other are typically
associated to some return that will let a firm to profit from collaboration with another firm
(Veugelers, 1997; Chesbrough, 2003; Bonte et al., 2005). On the other hand, public sector
organizations are not competitors: The special role and function of the public sector in society
make public organizations subject to a democratic, political rule, which implies that the
organizational context is normative and that democracy is the governing principle
(Langergaard & Scheuer, 2009: 3).
Langergaard and Scheuer (2009) refer to the work of Hartley (2005) and Hess and Adams
(2007) for explaining different approaches to understand improvement and innovation in
public sector, which have succeeded one another in the last decades as views on policy and
public administration changed. These are called: Traditional Public Administration, New Public
Management and Networked Governance. Traditional Public Administration sees public sector
as embedded within a stable context and public organizations as a hierarchy (or bureaucracy)
resting on legal rational authority and oriented towards procedures. New Public Management
replaces bureaucracy with quasi-market conditions, challenging the hierarchical view of the
public sector and separating organizations’ producing units from political influence as far as
possible. Networked Governance shows a shift to more networked forms of governance in the
public sector, where public (beneficiaries of public services) also takes the role of co-producer
of service and innovation. Referenced studies highlight a recent tendency to approach to
improvement dynamics in public sector under a networked view. As pointed by Langergaard
and Scheuer, a hierarchical understanding of the public sector, where organizations are seen
as passive executors of political decisions – like in the Traditional Administration approach, is
important for our political self-understanding; however, the tendency is today to see public
organizations in terms both of markets, hierarchies and networks.

50
On the specificities of external sources in public sector
To test for patterns of open innovation among public sector organizations has not the same
implications than it does for the manufacturing sector or even for the private services sector.
However, it is a useful model for advancing in understanding public sector innovation. Table 1
depicts conceptual differences framing each reviewed sector.
Table 1. Conceptual framework for innovation in public sector: a comparative view
Manufacturing Business Service Business Public Organizations Incentive system
Market
Market
Non-market Political cycle
Internal sources
- Internal activities of R&D.
- Internal activities of R&D (mostly in ICT services and median and large firms).
- Ideas from authorities (head managers), middle-level managers and staff.
External sources
- Publicly available information and research conducted outside the organisation.
- User /customer driven innovation.
- Knowledge intensive services and innovation networks.
- User/customer driven innovation.
- Information from enterprises and citizens in the role of service users.
- Information and knowledge provided by professional organisations, knowledge-intensive services and civil society.
Internal & external combinations
- Collaboration agreements on R&D with other public/private organisations
- Internally and externally generated information and knowledge (more ‘concept’ focused).
- Multi-agent frameworks
- Public procurement
- Multi-agent frameworks
Innovation modes
- New or substantially improved products. - New or substantially improved production processes. - Organisational and marketing innovations
- New or substantially improved services.
- New or substantially improved ways for service delivering.
- New ways to promote a service, influence user behaviour and new interfaces.
- Non-technological innovations play an important role.
- New or substantially improved services.
- New or substantially improved ways for service delivering.
- Changes in processes and/or work organisation.
- New ways to interact (communicate) with service users and citizens (emphasis on ICT applications and e-government)
Quality/ intensity of innovations
- Radical/High impact: Causes dramatic changes in market and industry. - Incremental/Low impact: Provides new functions and improvements.
- Radical/limited number: New service applications for new and better ways of satisfying needs. - Incremental/higher number: Improvements on existing applications; adaptations.
- New-to-the-whole-sector/limited number: Developed and implemented by first time among the whole public sector.
- Previously developed somewhere else/higher number: Implemented by
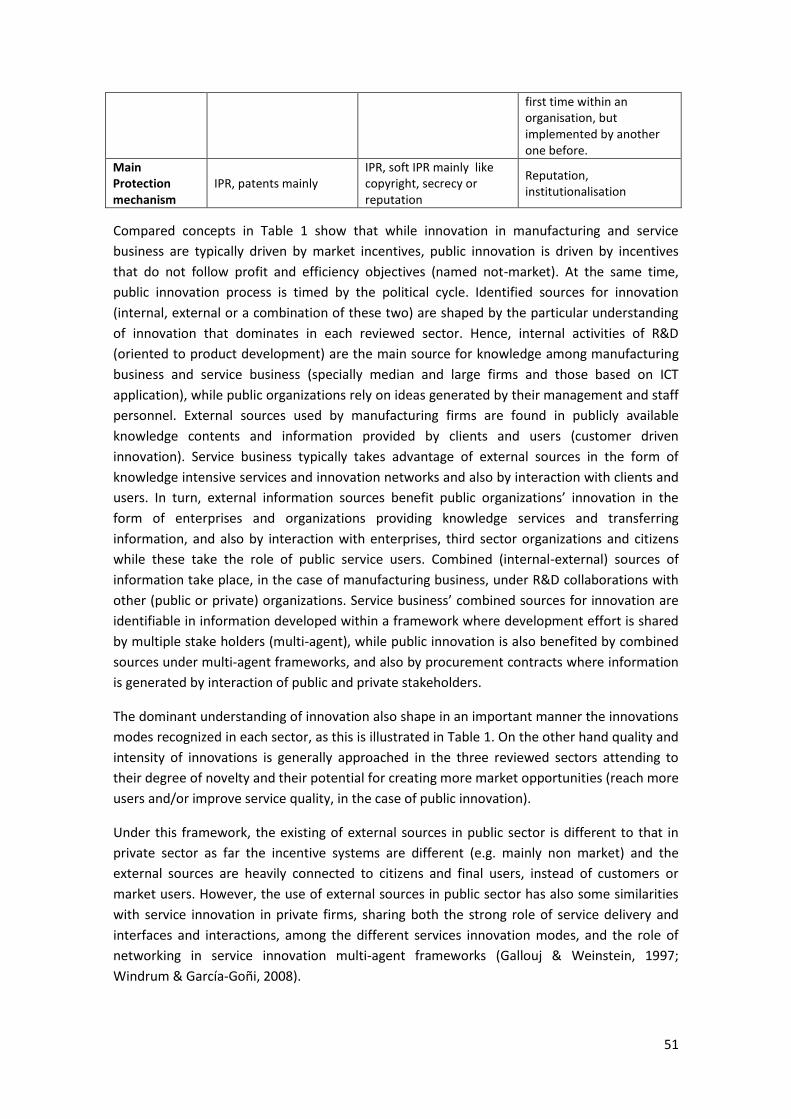
51
first time within an organisation, but implemented by another one before.
Main Protection mechanism
IPR, patents mainly IPR, soft IPR mainly like copyright, secrecy or reputation
Reputation, institutionalisation
Compared concepts in Table 1 show that while innovation in manufacturing and service
business are typically driven by market incentives, public innovation is driven by incentives
that do not follow profit and efficiency objectives (named not-market). At the same time,
public innovation process is timed by the political cycle. Identified sources for innovation
(internal, external or a combination of these two) are shaped by the particular understanding
of innovation that dominates in each reviewed sector. Hence, internal activities of R&D
(oriented to product development) are the main source for knowledge among manufacturing
business and service business (specially median and large firms and those based on ICT
application), while public organizations rely on ideas generated by their management and staff
personnel. External sources used by manufacturing firms are found in publicly available
knowledge contents and information provided by clients and users (customer driven
innovation). Service business typically takes advantage of external sources in the form of
knowledge intensive services and innovation networks and also by interaction with clients and
users. In turn, external information sources benefit public organizations’ innovation in the
form of enterprises and organizations providing knowledge services and transferring
information, and also by interaction with enterprises, third sector organizations and citizens
while these take the role of public service users. Combined (internal-external) sources of
information take place, in the case of manufacturing business, under R&D collaborations with
other (public or private) organizations. Service business’ combined sources for innovation are
identifiable in information developed within a framework where development effort is shared
by multiple stake holders (multi-agent), while public innovation is also benefited by combined
sources under multi-agent frameworks, and also by procurement contracts where information
is generated by interaction of public and private stakeholders.
The dominant understanding of innovation also shape in an important manner the innovations
modes recognized in each sector, as this is illustrated in Table 1. On the other hand quality and
intensity of innovations is generally approached in the three reviewed sectors attending to
their degree of novelty and their potential for creating more market opportunities (reach more
users and/or improve service quality, in the case of public innovation).
Under this framework, the existing of external sources in public sector is different to that in
private sector as far the incentive systems are different (e.g. mainly non market) and the
external sources are heavily connected to citizens and final users, instead of customers or
market users. However, the use of external sources in public sector has also some similarities
with service innovation in private firms, sharing both the strong role of service delivery and
interfaces and interactions, among the different services innovation modes, and the role of
networking in service innovation multi-agent frameworks (Gallouj & Weinstein, 1997;
Windrum & García-Goñi, 2008).
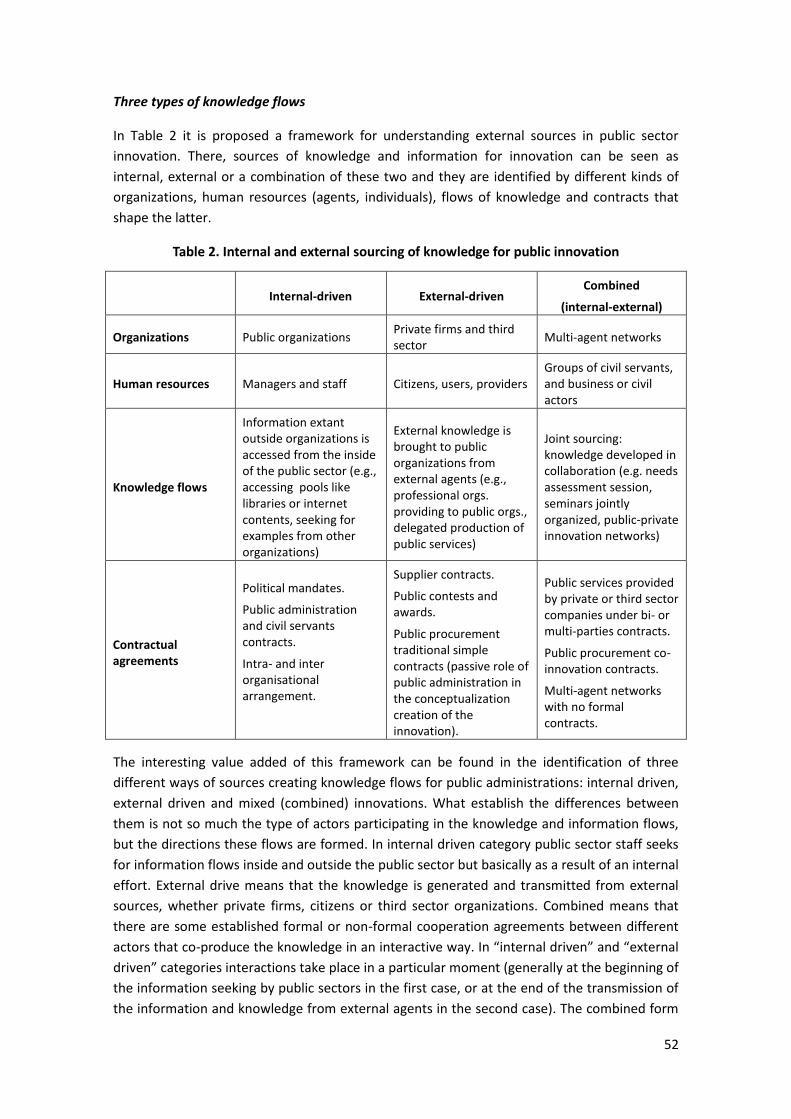
52
Three types of knowledge flows
In Table 2 it is proposed a framework for understanding external sources in public sector
innovation. There, sources of knowledge and information for innovation can be seen as
internal, external or a combination of these two and they are identified by different kinds of
organizations, human resources (agents, individuals), flows of knowledge and contracts that
shape the latter.
Table 2. Internal and external sourcing of knowledge for public innovation
Internal-driven External-driven
Combined
(internal-external)
Organizations Public organizations Private firms and third sector
Multi-agent networks
Human resources Managers and staff Citizens, users, providers Groups of civil servants, and business or civil actors
Knowledge flows
Information extant outside organizations is accessed from the inside of the public sector (e.g., accessing pools like libraries or internet contents, seeking for examples from other organizations)
External knowledge is brought to public organizations from external agents (e.g., professional orgs. providing to public orgs., delegated production of public services)
Joint sourcing: knowledge developed in collaboration (e.g. needs assessment session, seminars jointly organized, public-private innovation networks)
Contractual agreements
Political mandates.
Public administration and civil servants contracts.
Intra- and inter organisational arrangement.
Supplier contracts.
Public contests and awards.
Public procurement traditional simple contracts (passive role of public administration in the conceptualization creation of the innovation).
Public services provided by private or third sector companies under bi- or multi-parties contracts.
Public procurement co-innovation contracts.
Multi-agent networks with no formal contracts.
The interesting value added of this framework can be found in the identification of three
different ways of sources creating knowledge flows for public administrations: internal driven,
external driven and mixed (combined) innovations. What establish the differences between
them is not so much the type of actors participating in the knowledge and information flows,
but the directions these flows are formed. In internal driven category public sector staff seeks
for information flows inside and outside the public sector but basically as a result of an internal
effort. External drive means that the knowledge is generated and transmitted from external
sources, whether private firms, citizens or third sector organizations. Combined means that
there are some established formal or non-formal cooperation agreements between different
actors that co-produce the knowledge in an interactive way. In “internal driven” and “external
driven” categories interactions take place in a particular moment (generally at the beginning of
the information seeking by public sectors in the first case, or at the end of the transmission of
the information and knowledge from external agents in the second case). The combined form

53
means some degree of co-innovation, co-creation or even some co-development like in the
case of public-private-third sector innovation networks that become professional innovation
networks more than social networks (Gallouj et al., 2013). Obviously, the boundaries of the
three categories are not rigid and similar innovation activities may combine several of the
forms or move from one to another.
The contractual arrangement for these information flows, when exist, can vary depending of
the type of agreement. Internal driven arrangements can be formal or informal within the
public organizations (intra or inter-), under the legal contracts regulations staff work and
political mandates representing the contract between societies and the State. External driven
contracts focus on the transmission of knowledge generated in private sector, third sectors or
citizens through supply contracts, contest or awards or traditional public procurement
involving some innovation. Combined form requires innovation networks or platforms or
public procurement with some degrees of co-innovations.
From our framework can be inferred, for example, that information from elected
representatives can be considered internal-driven. Representatives might often be outside the
organization that develops an innovation; however their information form part of an internal-
driven flow, where source-organization interaction takes place at the beginning of the seeking
moment and information transference obeys to political mandate. In turn, an external-driven
source can be identified when the innovation development process is entirely contracted to a
private enterprise or when a professional or third sector organization transfers information
while in the role of public organizations’ suppliers. On the other hand, public organizations and
external stake-holders might join development efforts and form combined sources of
knowledge and information, like in the case of public service users acting as service co-creators
(e.g. established public-private networks, citizens participating in a needs assessment session).
3. The empirical evidence for Europe: Research hypotheses
What we already know about public sector innovation gives us some hints to believe that the
use of external sources is an important driver of innovation development among public
organizations. Our research hypotheses are addressed to test for such idea.
Previous discussion on external sources has proven they can be a key element shifting
internally generated knowledge in private manufacturing firms’ innovation; furthermore, the
fact of service innovation being less reliant on internal R&D efforts suggest that service firms
can benefit from an strategy of innovation development based on the use of external sources
(Djellal et al., 2003; Rubalcaba, 2006; Miles, 2007). Wide differences exist between public and
private sectors with respect to incentives and formal organization; however, more recent
views on the public sector under a networked approach take us to believe that innovation in
public sector is not particularly reliant on organizations’ internal search activities and that the
process of coming up with new ideas and contents towards innovation development can be
enhanced by an adequate strategy of use of external information sources. That is why first
hypothesis is stated as follows:
54
H1: Use of external sources of information in innovation development has a significant effect in
the implementation of services that are new to the whole public sector.
The reference studies by Laursen and Salter (2006) and Cassiman and Veugelers (2006), using
private manufacturing sector data, respectively found effects of substitution and
complementarity between the use of internal and external sources of information as a strategy
for innovation management. These results suggest that using external sources re-enforces the
innovation development process; thus, differences in innovation results among firms might be
explained by the use of external sources. In this case, it is believed that use of external sources
might be more helpful for better innovation results – as pointed by our reference studies – due
to public organizations’ interactivity with external agents and their networked operations
(Hartley, 2005; Langergaard & Scheuer, 2009; Börzel, 2011). This is coherent with multi-agent
frameworks developed by Gallouj and Weinstein (1997) and Windrum and García-Goñi (2008)
for service innovation, although this would not be in line with Battisti et al. (2014) when
showing the higher importance for internal sources (size and R&D) for private sector
innovation in services. We expect a different relationship this time since public sector
innovation cannot rely on R&D, unlike companies seeking for radical innovations do.
Therefore, our second hypothesis is:
H2: Use of external sources of information for innovation development has a greater effect on
introduction of services that are new to the whole public sector than using internal sources.
Two research hypotheses are addressed to the observation of new-to-the-whole-sector
services. This is based on the classification of public organizations used in reporting the results
of the Innobarometer 2010 Survey (European Commission 2011), from where it was obtained
the data for empirical analysis. The survey report makes the classification focusing on
organizations’ service innovations, while not making any remark on this matter from their
innovations in processes and organizational and communication methods. Hence,
organizations are labeled as leading innovators, trailing innovators and not innovators. The
essential characteristic of a leading innovator is that it has introduced a new service before any
other public organization within their country. Trailing innovators do implement service
innovations, either they are new or significantly improved services, but they have never
pioneered the introduction of a new service. Finally, those organizations that do not
implement service innovations are called not-innovators (although, they have certainly
introduced process, communication or organizational innovations).
Searching for competitive advantage leads private sector firms to design and implement more
and better innovations than other firms, becoming innovation leaders. Due to a lack of
competitive incentives11, public sector organizations might not be similarly interested as
11 There are some market-like incentives for public innovation and they are based on the idea that public
organizations which show a better performance will be rewarded with a bigger budget. Competition
among public organisations can exist to enhance budget through improving effectiveness, efficiency and
productivity (Hartley, 2005; Roste, 2005). However, this view of public management as replicating private
firms’ incentives oriented to market goals is out of the framework of analysis of this study as it has been
55
private firms in reaching a leading position; however those public sector organizations with
better innovation strategies will end up in taking leading positions, even if they have not
intentionally looked for it. Studying public organizations as they approach to introduce
innovations not only at their own operational practices but to the whole public sector might
help to identify to which extent the use of internal and external sources of information
contribute to innovation performance in public sector.
The definition of innovation understood in the applied analysis method is the one indicated by
the Innobarometer 2010 Survey. The survey report explains that innovation has been taken to
mean any novel or significantly improved service, communication or organizational method. It
also remarks that the emphasis is on applicability: any significant improvement in operational
practices (either in the product/service range or in support structures) can be classified as an
innovation. It is easy to see that the Innobarometer definition share essential features with the
definition of public innovation provided in the introductory chapter, particularly by
understanding innovation as a significant change and also by identifying the many ways in
which innovation can be implemented: either at the service (product) level or as a method for
organizing and/or communicating.
4. Methodology and data description
The data used for this analysis comes from the Innobarometer Survey on Innovation in Public
Administration, which was carried out by the European Commission in October 2010. For the
Innobarometer Survey 4.063 organizations were surveyed from the 27 Member States of the
European Union and also Norway and Switzerland. Eligible respondents of the questionnaire
were senior managers responsible for strategic decision-making: typically, general managers or
strategic directors of the institutions. Only organizations declaring to be a public organization
will be considered for the analysis. Also, those cases which failed to report any type of
innovation since January 2008 will be removed. This leaves for the analysis 3.310 available
observations on public organizations that have recently implemented any type of innovation.
The analysis method will be carried out in two stages. First, a set of variables about sources of
information for public innovation will be subject to component analysis, in order to obtain a
reduced number of variables that could be interpreted in the sense expressed by research
hypotheses. Next, components will be used for probability estimation as explicative variables
in a bivariate probit regression with sample selection. Results from regression will be helpful in
addressing how important are external and internal sources of information for implementing
innovation into the public sector.
4.1. Component Analysis
The component analysis technique that will be used is known as Categorical Principal
Component Analysis (CATPCA). More commonly used, Principal Component Analysis (PCA)
shown that public sector organizations do not share with private firms the same incentives towards their
final objectives (Recascino, 2002).
56
requires making some assumptions12 about data that are not adequate for variables that are
not measured in a numeric scale (interval or ratio scale). Thinking of any set of suggested
answers in a questionnaire as categories (measured in a nominal or ordinal scale), CATPCA
gives a solution for carrying out the PCA while overcoming the restrictions imposed on data in
the component extraction process13. CATPCA is based on a technique known as optimal
quantification which quantifies categories by assigning to each one a new value, so the new
values are expressed as an interval scale while preserving the relations observed in the original
values. That means that magnitudes of categories’ quantifications in a nominal variable will
not be required to observe a pre-established ordering, neither are they needed to keep
proportional intervals between one to another. Same way, magnitudes of a quantified ordinal
variable are not needed to keep proportional intervals but they do show the same ordering
observed in the original variable. Linting et al. (2007) provides with an in depth technical
explanation of the CATPCA method and a case for practical application and interpretation.
The Innobarometer Survey questionnaire includes questions about drivers and strategies for
innovations implemented since January 2008. There is one question asking about the level of
importance of some information sources for the development of innovations. The variables
that will be subject to CATPCA will be drawn from it. A list of sources is suggested after asking
“Since January 2008, how important were the following information sources for the
development of your innovations?” Respondents answer to each of them by choosing one of
options ranging from 1 to 3, whose correspondent labels are Not important, Somewhat
important and Very important. Sources asked for in the survey are: Ideas from management;
Ideas from staff; Examples of best practice by another government organisation; Professional
organisations; Visits to conferences; Enterprises as suppliers; Enterprises as clients or users;
and Citizens as clients or users.
The first three information and knowledge sources can be categorised internal driven sources
within public administrations while the rest can be categorised as external driven sources or
combined driven sources according to our theoretical framework. The examples of best
practices by another government organizations can represent a bit of a mix of internal and
external since they are internal to the sector but external to the organizations that want to
build on, although in any case it is about information flow seek by the public organization for
further development internally. For statistical purposes we merge the external and combined
categories in a single one since the survey does not permit to work with a clear distinction
between those two.
The Don’t know option is also available to respond to the level of importance of suggested
information sources. Don’t know is a difficult category to manage in an ordinal scale. To solve
that problem, these answers were treated as missing values and imputed with the Not
12 PCA variable reduction problem assumes a linear relation between variables. Also, the objective of
PCA is to reproduce as much as variance is possible from the original variables, while variance is a
concept applied only to continuous numeric variables. See Linting et al. (2007).
13 For a detailed and technical overview of CATPCA – also known as nonlinear PCA – see Meulman et al.
(2004).
57
important category, assuming that an important information source is likely to be
remembered. This decision follows the Arundel and Hollanders (2011) criteria – where the
same data was used for a PCA.
4.2 Probability estimation with sample selection
Once components have been extracted their scores will be saved and used for probability
estimation. A bivariate probit regression with sample selection was chosen as estimation
model in order to fit the structure in data from the Innobarometer Survey. It can be verified
that the survey addresses a strong relation of dependence between organizations being
identified as introducing services that are new to the whole sector and the fact that they are
previously identified as implementing service innovations. Therefore, a bivariate probit
regression with sample selection (also known as Heckman’s probit) will estimate the
probability of being an organization that introduces services new to the whole sector,
conditioned to be and organization that implements service innovations. That will be more
accurate than estimating probabilities with conventional probit estimations. The estimation
model is then represented as follows:
P (Z=1|Y=1) = β0 + βiComponenti [1]
P (Y=1) = β0 + β1Size + β2Area + βiComponenti [2]
The dependent variable Y in the selection equation [2] identifies public organisations
implementing service innovations and the dependent variable Z in the objective equation [1]
identifies organizations that have introduced a service which is new within the whole public
sector. The variable identifying organizations implementing innovations is obtained after the
question “Since January 2008, did your organisation introduce any new or significantly
improved services?” Those that gave an affirmative response are then asked “To the best of
your knowledge, did your organization introduce a new service before any other public
administration in your country since January 2008?” This last question gives the variable that
identifies organizations that have implemented a new service before any other public
organization (named ‘leading innovators’ in the Innobarometer Survey report).
Additionally, two variables will complement the analysis in order to control for the influence
that organizations’ size (measured by the number of its employees) and area of responsibility
might have in the final results:
Organizations’ size: It indicates whether organization’s true number of employees is between
10 and 49, between 50 and 99, between 100 and 249, between 250 and 499, between 500 and
999, or 1000 or more.
Organizations’ geographic area: It indicates whether organizations’ serve at the local, regional
or national area.
As pointed out, all variables taking part in the empirical analysis were drawn from the
Innobarometer Survey. Typically, among suggested responses in the survey there is a Don’t
know/No answer option. Whenever responses of this kind were detected among our variables
(dependent and independent variables as well), they were turned into missing values.

58
5. Results
5.1 Component extraction
The main feature of our CATPCA application for component extraction is in quantification of
variables. If quantified ordinal variables (now transformed in a numerical scale) were taken to
a conventional PCA the extracted components in the final solution would be exactly the same
of those that would be obtained through CATPCA, even though CATPCA process differs from
that of conventional PCA. Thus, similar treatments usually made on PCA components for
interpretation can also be made on CATPCA components, like rotation and measurement of
variable correlation.
The application of CATPCA on the selected variables gives a two component solution
accounting for 52,57% of observed variance. The number of extracted components is based on
the greater than 1 eigenvalues criterion. The extracted components are subject to Varimax
rotation for making them easier to interpret. Table 2 shows the components loadings. Highest
correlations are highlighted in bold.
Table 2. CATPCA loadings for variables and extracted components.
External sources Internal sources
Ideas from management 0,088 0,788
Ideas from staff 0,123 0,801
Examples of best practice by another government organisation
0,351 0,520
Professional organisations 0,539 0,360
Visits to conferences 0,650 0,114
Enterprises as suppliers 0,769 0,043
Enterprises as clients or users 0,759 0,174
Citizens as clients or users 0,544 0,371
First component appear notably correlated to variables referring to sources of information
external to public organizations. Professional organizations as well as conferences are good
examples of external sources from which knowledge developed outside internal boundaries
flows inside public organizations. At the same time, enterprises in the role of both suppliers
and clients they form part of organizations that are contextual to the public sector, but outside
of the boundaries of what is understood as ‘internal’. Similar can be said about citizens in the
role of clients or users. (See Table 1).
The second component shows higher correlations to variables referring to internal sources. It
is clear that ideas from public organizations’ management and staff can be identified as
internal sources for innovation, given that they are part of internal human resources. On the
other hand, examples of best practices by other government organizations are considered to

59
be an internal innovation source since they exemplify access to external information from
internal research efforts (see Table 1), what results coherent with was explained previously.
We let conclude that variance observed in the first component gives evidence on the
importance of using external sources of information for innovation development and the
second one does the same about internal sources.
5.2 Probability estimation: testing research hypotheses
Once components have been extracted and interpreted, their scores are saved and used as
explicative variables in a Heckman’s probit regression. The estimated variable in the selection
equation indicates whether an organization has implemented one or more service innovations.
The dependent variable in the conditional model indicates whether or not a public
organization has implemented a service which is new to the whole sector within the
organization’s country. Table 3 shows estimation results.
Table 3. Results of Heckman’s probit regression
Innovate services Introduce new services
Size (number of employees)
10-49
base --
50-99 0,2189*** (0,072)
--
100-249 0,1372** (0,069)
--
250-499 0,4624*** (0,093)
--
500-999 0,5191*** (0,121)
--
1000 or more 0,7795*** (0,097)
--
Organizations‘ area of responsibility
Local
base --
Regional 0,1791*** (0,063)
--
National 0,2039** (0,091)
--
External information sources 0,1144*** (0,025)
0,1120*** (0,029)
Internal information sources 0,0613** (0,025)
0,0048 (0,026)
Constant 0,4553*** (0,032)
-0,0960*** (0,034)
LR test of indep. eqns. : Chi2 = 54,34 (Prob > Chi2 = 0.000)
*** Statistically significant at 99% confidence level
** Statistically significant at 95% confidence level
Coefficients of variables that explain the probability of being observed (i.e. being identified as
an organization that has recently introduced service innovations) are all significant. Results

60
suggest that organizations’ size has an important effect on the probability, this especially true
for larger organizations. To be serving in a larger area (regional or national, as opposed to
local) also has a relevant effect.
With respect to variables about using internal and external sources, it can be seen in
estimation results that use of internal sources has a significant effect over organizations
implementing service innovations, but not over organizations implementing services that are
new to the whole sector. In turn, use of external sources is a significant aspect for
organizations introducing services new to the public sector. This evidence helps to support the
idea suggested in our first hypothesis: that the use of external sources of information has a
significant effect in the implementation of services that are new to the whole public sector.
Coefficients are, however, a partial reading of the estimation results. A more revealing way to
analyze relevance of components about information sources is in calculating their marginal
effects from Heckman’s probit estimations. Table 4 shows effects predicted by average values
of the two components, at representative values of organizations’ size (number of employees)
and area of responsibility. It can be observed that the probability of implementing a service
new-to-the-whole-sector for an organization with a number of employees between 10 and 49
and in a local area will increase by 0,083 from a one unit increase in the External sources of
information component, while probability will increase by 0,061 for an organization with more
than 1000 employees in a national area. In turn, most of marginal effects predicted for change
in the Internal sources of information component are not statistically significant.
Table 4. Marginal effects at representative values of size and area of responsibilitya)
External sources of informationb) 10-49 50-99 100-249 250-499 500-999 1000 or more Local 0,082 0,081 0,082 0,074 0,072 0,064 Regional 0,081 0,076 0,079 0,068 0,067 0,059 National 0,081 0,076 0,078 0,068 0,066 0,058 Internal sources of informationb) 10-49 50-99 100-249 250-499 500-999 1000 or more Local 0,019 0,017 0,018 0,014 0,013 0,010 Regional 0,018 0,015 0,016 0,012 0,011 0,008 National 0,018 0,015 0,016 0,011 0,011 0,008
a) Effects highlighted in bold are statistically significant at a minimum of 90% confidence level. Noticeably, external sources’ effects are all significant at 99% confidence level.
b) dy/dx are for a one unit increase, predicted for conditional probability in Heckman’s probit estimation.
Magnitudes of marginal effects are larger when predicted for smaller organizations and for
organizations serving in local areas. It could then be expected greater effects for smaller
organizations on the likelihood to introduce services new-to-the-whole-sector from the use of
external information sources for innovation development – this among organizations
implementing service innovations. This finding provides evidence to suggest that use of
external sources can enhance innovation capabilities of public organizations. However, a new
empirical approach (with a new model and variables that allow for observing organizations’
capabilities) is needed in order to have concluding statements on that matter.

61
Results of marginal effects show differences in the impacts over the probability of
implementing services new-to-the-whole-sector from the use of external and internal sources
of information. These results give evidence to support the idea stated in our second
hypothesis: use of external sources has a stronger effect on the introduction of services that
are new the whole sector.
6. Concluding remarks
Increasing studies on external sources and open innovation have strongly emerged in the last
few years in the area of private sector mainly. For private manufacturing firms it means to rely
less in internally driven R&D and to raise efforts towards external search and more
collaborative work. On the other hand, the use of external sources might play a more relevant
role in innovation due to the interactive character of service delivery and the fact that many
service firms rarely count on organized internal R&D. But, in public sector, the use of external
sources could be the core issue in innovation development. External influences driving public
sector organizations to innovate such as technological improvements, societal challenges and
demands from citizens, along with the need for interactivity in service delivering and a broader
concept of what is to be considered as an innovation within the public sector, leads to expect
that the use of external sources will have greater power in driving innovation development
among public organizations in context of multi-agent frameworks where collaborations with
private firms, third sector and citizens can play a major role.
We have proposed a framework in which public service innovation can take benefit from using
external sources, in contexts of lack of market incentives and other specific characteristics
(such as service users, suppliers and third sector organisations playing a role under a multi-
agent approach). The use of external sources in public sector has distinctive characteristics
with respect to private sector but it also shares some communalities, especially when private
based service innovation is considered. The framework proposes three types of knowledge
creation and implementation depending on the use of internal-drive sourcing, external sources
and combined forms of internal plus external. Current trends show a movement from internal
to external and from external to combined, like in the case of public-private sector innovation
networks (Gallouj et al., 2013).
Results from our empirical analysis show that use of external sources is a highly relevant
aspect for public organizations to introduce services that are new to the whole sector, while
the use of internal sources has a significant effect on the implementation of service innovation
but does not appear to be significant for introducing services that are new-to-the-whole-
sector. This evidence is helpful to support the statements of our hypothesis: that the use of
external sources of information is a key element driving development of services that are new
to the whole public sector and that its effect on new service development will be greater than
that of using internal sources.
The relation found between use of external sources and the implementation of services new to
the whole sector takes us to believe that a good way to improve innovativeness of

62
organizations delivering public services is to bring them to take advantage of flows of
information and knowledge coming from external sources.
Organizations’ size and area of responsibility also affect probabilities that an organization
might be introducing services new-to-the-whole-sector. Coefficients in estimation results
indicate that bigger organizations and organizations in bigger areas of responsibility will more
likely be implementing service innovations than their smaller counterparts in local areas, which
make them more likely eligible for introducing services that are new to the sector. However,
results of conditional marginal effects show larger effects from the use of external information
sources for smaller organizations and organizations in local areas of responsibility (see Table
4). While empirical evidence give reasons to believe that the bulk of public sector innovation
takes place in bigger public organizations (with more employees, in bigger areas of
responsibility), this does not necessarily mean that the use of external sources should not be
promoted at all levels of public administrations, especially when results also give evidence to
believe that the effect of the use of external sources of information on the likelihood to
introduce services new-to-the-whole-sector might be of greater value for smaller
organizations.
63
Chapter3. Differences in effects from
implementation of public service innovations

64
1. Introduction
Research on public sector innovation has gained relevance over the last years. Studies already
acknowledge some distinctive features of public innovation, such as factors having an
influence in innovation generation, factors enabling the innovation process and also barriers
counteracting the innovation process. Among the latter is frequently and remarkably
mentioned a high risk aversion in decision making of public authorities, which causes the
avoidance of practices that might bring with it failure and waste.
A growing interest in benefits expected from innovation has led to emphasize the power of
innovation for improvement while suggesting some guidings for a more innovative public
sector and pointing to the gap that still divides the innovation levels observable in public
organization and private firms, respectively. However, it has not been enough mentioned the
consequences for public accountability from a public sector that dares too much with
innovation risks. Private firms will advocate resources for development of new products and
new methods and technology as long as they can expect a net economic benefit from their
innovations. On the other hand, public administration decisions are not oriented to pecuniary
objectives but to public accountability objectives. That is at the root of public sector’s high risk
aversion and the innovation gap between public organizations and private firms. One could
then question if – thinking in terms of public accountability – public sector innovation should
match the level of innovation of private firms, or to which extent improvements achieved
through innovation make up for waste and negative effects derived from its uncertain and
risky nature.
Before to give an answer to such questions, however, it is necessary to know some more about
the effects that could be expected from public sector innovation. It is necessary to have a
reference about the potential of innovation within public organizations for generating
improvements, and the risk of obtaining unwanted effects lying underneath. That is what this
chapter will try to address.
The aim of this research work is to present empirical evidence for helping to support
assumptions about the power of public sector innovations to achieve some positive effects
along with the risk of suffering some negative effects. For that purpose, the followed method
consists in the estimation of the probability of occurrence of positive and negative effects
reported after the implementation of service innovations by public organizations represented
in the Innobarometer 2010 Survey (European Comission, 2011). Variables used for probability
esrtimation give information on implemented service innovations and on organizations’
characteristics related to their capability towards innovation. It is expected that results will
help to address a relation between willingness of an organization to engage in innovations
with higher degree of novelty (assuming these imply higher risk) and the effects obtained from
innovation implementation, while referring to the importance of organizations’ resource
availability as enabling positive effects and limiting the negative ones.
The chapter is organized as follows. After this introductory part, Section 2 contains
antecedents on public innovation literature building our theoretical framework. Section 3
presents the research hypotheses addressing the study. Section 4 widely describes the
methodology that will be applied for testing hypotheses and also the data base in use. In

65
Section 5 results are presented and interpreted. The concluding statements correspond to
Section 6.
2. Antecedents: The counteracting consequences of risk
Risk and uncertainty are claimed to be among the main forces acting against public innovation,
since a high aversion has been identified among public sector organizations (Borins, 2001;
Mulgang and Albury, 2003; Koch and Hauknes, 2005). It can be verified that fear of the
consequences of failure in the experimentation process carried to innovate is counteracting
the levels of innovation in public sector (Potts, 2009; European Comission, 2011; Brown and
Osborne 2013).
One could simply think of risk as the probability of something bad to happen. This conception
of risk implies that the unwanted event is known and there are formed expectations about its
occurrence (Brown and Osborne, 2013). On the other hand, the concept of uncertainty reflects
the unpredictable occurrence of multiple outcomes, either they are good or bad (Brown and
Osborne, 2013). Uncertainty and risk are two parallel – yet different – concepts. The main
difference is on what can be known and what can’t be known. In entrepreneurial organizations
(private and public as well), an often used management strategy to deal with uncertainty is to
gather as much information as possible in order to turn the unmanageable uncertainty into
manageable risk (Bhatta, 2003, Brown and Osborne, 2013), trying to limit the unforeseen
effects.
From an individual focused perspective, public innovation initiatives are stifled because public
organizations’ employees are not rewarded enough for taking risks. Retaliation due to failure is
greater than encouragement of experimentation and a risk rewarding system remains almost
inexistent (Borins, 2001, 2006; Potts, 2009). From a policy focused perspective, avoidance of
risky and uncertain strategies – such as innovation – is strongly related to efficiency criteria
leading public policy. Public sector accountability demands maximizing efficiency (Potts, 2009);
this translates in preferring the implementation of proven strategies rather than those whose
results might cause failure and waste of resources. Novelty placed in innovation brings with it
lack of previous knowledge of the possible outcomes. Emphasis placed in public sector
development through efficiency improvements results in avoidance of initiatives whose
consequences are unforeseen.
Policy based on efficiency criteria corresponds to a static vision of the economy of the public
sector, where an equilibrium point determines a maximum level of efficiency and changes
introduced in public organizations are addressed to take their performances closer to that
maximum (Potts, 2009). Therefore, implemented changes are required to be previously known
as successful methods for achieving the expected outcomes, thus, avoiding any kind of waste
and failure (Potts, 2009). However, a more adequate understanding of public sector
development is on the dynamic vision of evolutionary economics, which consider multiple
successive equilibrium points led by a constantly changing environment. This makes critical the
existence of innovative processes for – at least – keeping current standards in public activities
(Potts, 2009). For that reason, innovation becomes compulsory for public organizations in

66
order to adapt to their changing context and being able of keeping up in value and quality of
services delivered to citizens.
The latter brings a problem of choice for public accountability: between opposing strategies
alternatively driven by efficiency or innovation. To this respect, Potts (2009) refers to the
situation of innovation being stifled because of efficiency driven policies and he explains how
letting waste and failure derived from innovation can even result in increasing efficiency. He
proposes a solution to the risk/efficiency choice problem consisting on selecting a level of
innovation that adapts to environmental changes (just for keeping up), which implies dealing
with risk towards innovation in public sector is something desirable, but yet cautiously and
moderately. We will go back to Potts’ solution in the discussion part of the article.
Leading vs. trailing innovators
As said before, innovation is recognized so far as it is new for the relevant unit of adoption.
Hence, it is considered to be an innovation not only that which introduces an element of
novelty to the whole sector for the first time, but also that which introduces an element of
novelty to any organization in particular, even though it has been implemented somewhere
else before (OECD, 2005). That is why public organizations implementing an innovation
previously developed by another organization can also be considered innovators.
A way to recognize organizations introducing innovations new to the public sector, among all
public organizations that innovate, is to classify them according to the degree of novelty of the
innovations they implement. This can be observed in an ad-hoc classification of public
organizations used in reporting the results of the Innobarometer 2010 Survey (European
Commission 2011). The survey report makes the classification basing on organizations’ service
innovations, while not making any remark on this matter from their innovations in processes
and organizational and communication methods. Hence, organizations are labeled as leading
innovators, trailing innovators and not innovators. The essential characteristic of a leading
innovator is that it has introduced a new service before any other public organization within
their country. Trailing innovators do implement service innovations, either they are new or
significantly improved services, but they have never pioneered the introduction of a new
service. Finally, those organizations that do not implement service innovations are called not-
innovators (although, they have certainly introduced process, communication or organizational
innovations). Later, in our empirical analysis we are going to take back this classification based
on service innovations.
It is expected that the search for competitive advantage will bring private sector firms to
design and implement more and better innovations than other firms, looking for greater
differentiation through completely new products. Due to a lack of competitive incentives14,
14 There are some incentives among public organizations for competing to innovate and they are based on the idea that public organizations with better performance will be rewarded with a bigger budget. Competition among public organizations would be occurring to enhance budget (Hartley 2005, Roste 2005). However, this view of public management as replicating private firms’ incentives oriented to market goals is out of the framework of analysis of this study as it has been shown that public sector organizations do not share with private firms the same incentives towards their final objectives (Recascino 2002).

67
public sector organizations might not be similarly motivated as private firms to enter in an
intense process of generation of services that are implemented by first time; however, we
know for sure that some public organizations will produce more and better innovation
outcomes than the rest, even if they don’t do purposely.
3. Research hypotheses
Innovation as an instrument of improvement is broadly accepted among private firms and so is
the inevitable loses that come from risk in its implementation. Nonetheless, public sector still
suffers from an innovation gap, to an important extent due to a high risk aversion.
Concerning private sector, the multiple effects of innovation can be synthesized into profiting
measures, such as productivity, efficiency, income (see for example: Gunday et al., 2011;
Rosenbusch et al., 2011); however, in public sector, where profitability is not the rule, the
effects of implemented innovations need to be seen in a distinct way, attending to specific
aspects of public good, like improving quality of services, letting a service to be delivered to
more citizens or shifting communication between citizens and public offices. At the same time,
negative effects from innovation need to be acknowledged independently, since they pervert
public good in different ways. For example, the common effect of user resistance might
translate in citizens perceiving service quality diminished, and creating barriers to service
delivery from a failed innovation can reduce citizens’ access to services. On that matter, the
purpose of the present study is to analyze how the chances of getting some specific effects
(positive as well as negative) from innovation are affected by public agencies taking risk by
implementing innovations with greater novelty. To do so, we propose an empirical analysis
addressed to test for the hypotheses that will next be introduced.
In a similar way than innovation literature makes a difference between incremental and radical
innovations – whose characterization attends the extent to which the introduced change
substantially affects the innovated element – we can make a difference between services ‘new
to the whole public sector’ on one hand and services ‘significantly improved’ or ‘new but
previously implemented by another organization’ on the other hand, attending to the
magnitude of their novelty. Thus, we can think of novelty of services new to the whole sector
as greater than that of the rest. Different combinations of risk (in probability of getting bad
outcomes) and uncertainty (in not having antecedents of results of implementation) from
different levels of newness are expected to lead to differences in resulting effects. Classifying
organizations by novelty content in their service innovations can be helpful for analysing the
multiple effects of innovation
The Innobarometer 2010 Survey that will help the analysis already suggests a set of effects
that an organization could obtain from its implemented innovations. The survey asks to every
organization which of them they have experienced. Thus, the analysis method of the present
study is closer to the observation of risk and not that much of uncertainty, as these two
concepts were previously defined. It focuses on a set of known outcomes whose probability of
occurrence is going to be measured. Consequently, due to its immeasurable nature,
uncertainty is going to be left out of research hypotheses and experiment. Moreover, to give a

68
theoretically based justification of this decision, one could think of effects presented on a list
form as a mean to elude uncertainty by turning unmanageable uncertainty into manageable
risk, as explained in the text of Brown and Osborne (2013).
Innobarometer data does not specify number and detail of implemented innovations nor
which of them are new to the whole sector15. However, it does indicate which organizations
have ever introduced services that are new to the whole sector and which have only
implemented service improvements or new services that were implemented by another
organization before. Also, data does not let to establish a correspondence between each
reported effect and the specific implemented innovation that led to it. In consequence,
attending to that limitation, the first research hypothesis is stated as follows.
Hypothesis 1: Chances of getting certain positive effects and risk of suffering certain negative
effects differ depending on whether organizations have implemented services that are new to
the whole public sector.
In explaining efficiency pursuit as the reason behind public innovation being stifled, Potts
(2009) mentions three implicit assumptions under the search for the most efficient way to
achieve a goal (embedded in a static vision of public sector where policy results can just be
replicated and scaled-up and, thus, innovation becomes unnecessary): 1) there is one best way
to efficiently achieve a goal, 2) the best way is known or knowable and 3) this best way can be
rationally chosen and implemented. This indications show public managers’ preference for
proven solutions which offer evidence of effectiveness, instead of those that require some
experimentation.
Although efficient solutions described by Potts are not innovations in straight sense, we can
deduce that innovations previously implemented by other organizations match to some extent
Potts’ assumptions towards a best way to efficiently achieve a goal. The former might help
prevention of risk and approach to the maximum efficiency through the implementation of
solutions whose applicability and results can be traced. Nevertheless, there is still a dose of risk
to expect from this kind of innovations. If we acknowledge the multiple differences that can be
found among organizations and we agree on an ever changing context – as explained by
evolutionary economics – innovations cannot be replicated in the exact same circumstances;
therefore, there always are some elements that could be source of risk (Brown and Osborne,
2013).
Based on an observable positive relation between the magnitude of the novelty of an
implemented change and the risk to which the implementing organization is exposed (Potts,
2009; Brown and Osborne 2013) we can easily believe that leading innovators carry bigger risk
than trailing innovators, which makes more likely for them to get negative effects (i.e.
undesirable outcomes from the innovation process). Hence, the second research hypothesis is
presented with the next form:
15 Survey questionnaire asks to every organization approximately what percentage of the types of services they provide is significantly improved and if they have recently introduced a service which is new within their country’s public sector (see European Comission, 2011)

69
Hypothesis 2: Organizations which have introduced services new to the whole sector bear
higher risk of suffering negative effects.
Definitions of innovation consider novelty placed at the level of the unit of implementation to
be sufficient (in public as well as private sectors), yet private sector studies give special
attention to those innovations with greater sense of novelty among the industry, whose
effects positively impact the implementing firm and then spill over the sector. New commercial
applications are frequently imitated by other firms to reach a part of the new market and
changes in processes and methods are also adopted by other firms to achieve technical
improvement. Firms innovating through imitation can succeed in benefiting from innovation as
much – or even more – as firms that developed an innovation for the first time (Dosi, 1988).
Nonetheless, greater expectations are always placed in new innovations, since they are more
powerful for creating market opportunities in favor of the developing firm (Dosi, 1988).
It is of interest to know about differences on the probability of getting positive effects that
might respectively hold innovations new to the whole sector and previously implemented by
another organization. One could think that a more controlled implementation process will lead
to more chances of positive effects in favor of previously implemented innovations. However,
proving this assertion require comparing identifiable innovations whose results after
implementation are known, which is out of the possibilities of the study because of data
restraints. In turn, we are able to know what happen to organizations which have
implemented services new to the whole sector compared to those that have only made use of
service improvements or new services previously implemented.
First research hypothesis suggests that organizations’ chances to obtain some positive effects
depend on whether or not they have implemented services new to the whole sector. It is now
here suggested that positive effects will more likely be reached by those organizations
implementing the new-to-the-whole-sector services. Given that focus of data and of method of
analysis is more on organizations’ behavior and characteristics and less on single innovations, it
is believed that organizations that are able to develop and implement innovations new to the
whole sector possess better strategies and resources that allow them to take more advantage
of innovation as an instrument of improvement. Indeed, organizations’ capabilities are an
important feature affecting innovation results (Berry, 1994; McAdam and Donaghy, 1999;
Damanpour and Schneider, 2006). Thus, third and final hypothesis suggests:
Hypothesis 3: Organizations which have introduced services new to the whole sector have
greater chance of obtaining positive effects.
For helping our understanding in the current analysis, the definition of innovation is going to
be drawn from the Innobarometer 2010 Survey Report (European Commission, 2011), since
the information that is going to shape our empirical analysis was gathered by this survey
application. The survey report explains that “innovation has been taken to mean any novel or
significantly improved (without indicating what a significant improvement might be) service,
communication or organizational method”. It also remarks that “the emphasis is on
applicability: any significant improvement in operational practices (either in the
product/service range or in support structures) can be classified as an innovation”.

70
4. Data and Methodology
The data used for this analysis comes from the Innobarometer Survey on Innovation in Public
Administration, which was carried out by the European Commission in October 2010. For the
Innobarometer Survey 4.063 organizations were surveyed from the 27 Member States of the
European Union and also Norway and Switzerland. Eligible respondents of the questionnaire
were senior managers responsible for strategic decision-making: typically, general managers or
strategic directors of the institutions. Only organizations declaring to be a public organization
will be considered for the analysis. Also, those cases which failed to report any type of
innovation since January 2008 will be removed. This leaves for the analysis 3.342 available
observations on public organizations that have recently implemented any type of innovation.
The Innobarometer Survey questionnaire includes questions about effects of innovation. The
set of variables that will help to test our hypotheses will be drawn from these. A list of effects
is suggested after asking “Have any of your new or significantly improved services, introduced
since January 2008, had a major positive effect by…” Respondents answer to each of them by
choosing one out of three options: Yes, No, Don’t know. They are allowed to answer ‘Yes’ to
more than one item. Hence, effects are turned into binary variables indicating affirmative
answers. Positive effects suggested in the survey are:
c) Enabling your organization to offer services to more or new types of users.
d) Enabling your organization to better target its services.
e) Improving user satisfaction.
f) Improving user access to information.
g) Enabling faster delivery of services.
The list includes the items ‘Other positive effect’ and ‘No positive effect’, but their estimation
was found troubling; so, it was decided to let in the analysis only those which refer to a specific
effect.
In the exact same way, binary variables representing negative effects are obtained after the
question “Have any of your new or significantly improved services, processes or organizational
methods, introduced since January 2008, had a sustained major negative effect by…” Listed
negative effects that will be taken to analysis are:
a. Creating additional administrative costs.
b. Reducing the type or flexibility of your services.
c. Leading to slower delivery of services.
d. Creating user resistance or dissatisfaction.
Negative effects list also includes the items “Other negative effect” and “No negative effect”
and they were also left out of empirical analysis.

71
An important annotation here is that the way questions are formulated makes listed positive
effects to result only from service innovations, while listed negative effects might be a
consequence of either service or process or organizational innovations. This matching problem
may cause difficulties in comparing estimation results, thus affecting the validity of the
subsequent analysis. However, one should always mind that in our empirical model probability
of an effect depends on whether an organization has ever implemented some kind of
innovation; it does not acknowledges the single innovation that might have caused the effect
neither its qualities (type and degree of novelty). Therefore, whatever the effect under
analysis, it is going to be related to whether or not public organizations have introduced a
new-to-the-whole-sector service. This view does allow for comparing results. It will also define
the focus of the analysis.
Survey questionnaire asks to respondents “Since January 2008, did your organisation introduce
any new or significantly improved services?” Those that gave an affirmative response are then
asked “To the best of your knowledge, did your organization introduce a new service before
any other public administration in your country since January 2008?”
This last question gives the explicative variable that will base our empirical analysis. The
variable identifies organizations that have implemented a new service before any other public
organization in their own country (named ‘leading innovators’ in the survey report). It does not
make specific whether they developed and implemented a service which is completely new or
they were able to copy a service that was before implemented outside the country (it is a first
time implementation within their own country, but it was not originally developed by the
implementing organization).
Additionally, some variables will complement the analysis in order to control for the influence
that the number of innovations implemented by an organization and the size and ability of its
workforce might have in the final results.
Percentage of innovated services: Respondents to the survey questionnaire were asked what
percentage among all different types of services they provide were significantly improved
since January 2008. The corresponding variable indicates whether respondents believed the
right percentage was lower to 25%, between 25 and 49%, between 50 and 74%, or 75% or
more.
Employees meeting in innovation groups: Respondents were asked what per cent of their
employees are taking part in groups that meet to develop innovations. Available responses
are: less than 25%, between 25 and 49%, between 50 and 75%, 75% or more.
Employees with university degree: Respondents were asked what per cent of their employees
have a university degree. Available responses are: None, between 1 and 9%, between 10 and
24%, between 25 and 49%, between 50 and 74%, 75% or more.
Organizations’ size: It indicates whether organization’s true number of employees is between
10 and 49, between 50 and 99, between 100 and 249, between 250 and 499, between 500 and
999, or 1000 or more.

72
Organizations’ area of responsibility: It indicates whether operations of an organization are
taking place at the local, regional or national level.
Organizations’ country: It indicates the country of origin of respondent organizations. It is
expected that country differences will lead to differences in innovation capabilities.
As pointed out, all variables taking part in the empirical analysis were drawn from the
Innobarometer Survey. Typically, among suggested responses in the survey there is a ‘Don’t
know/No answer’ option. Whenever responses of this kind were detected among our variables
(dependent and independent variables as well), they were turned into missing values.
The analysis method consists in estimating probabilities on the set of variables about effects
that an organization might experience from implemented innovations, using probit models. In
order to structure the probability we must take into account that this will happen when the
organization has implemented a service innovation. This probability will be based on a number
of specific characteristics of the organization and a set of unobservable characteristics. In this
context, the model reduces to:
Yi* = ’ Xi + ui , [1]
Si* = ’ Zi + vi, [2]
With Si = 1[’Zi + vi > 0]; Yi = 1[’Xi + ui > 0] Si , Si = 1; Yi is not observable , Si = 0. Where Yi=1
for organizations that experience an effect from implemented innovations; Si =1 for
organizations that introduce a service innovation. ui and vi are, respectively, the error terms for
equations [1] and [2] which are distributed according to a bivariate normal with zero mean and
unit variance and = Corr(ui,vi). The model allows for correlation between unobservable
information of equations [1] and [2]. As is well known, when 0, standard probit model
applied to the equation [1] provides biased results, and, meanwhile, the probit model with
sample selection provides consistent and asymptotically efficient estimators for all model
parameters. If = 0, standard probit model applied to the equation [1] provide consistent and
asymptotically efficient estimators for all model parameters.
Equation [2] is going to be defined by variables which are expected to have an effect on the
innovation capability of public organizations; that is, variables giving information on workforce
size and ability: organization’s area of responsibility, organization´s size, number of employees
with university degree, number of employees meeting in innovation groups, and also a
variable controlling for spatial effects in the country of origin. In turn, equation [1] is going to
be defined by variables giving information on the quantity and degree of novelty of
implemented service innovations: percentage of innovated services and a dummy variable that
indicates organizations that have introduced a new-to-the-whole-sector service. In addition,
the variable about employees meeting in innovation groups will also be part of equation [1]. It
is expected that this variable will also have a significant impact on the estimated probabilities
of the innovation effects, given that public innovation theory mentions the importance of
employee participation for enhanced innovation outcomes. At the same time, it might work as
an indicator of a better planned innovation process, which ultimately leads organizations to
implement successful innovations while being aware of potential risk.
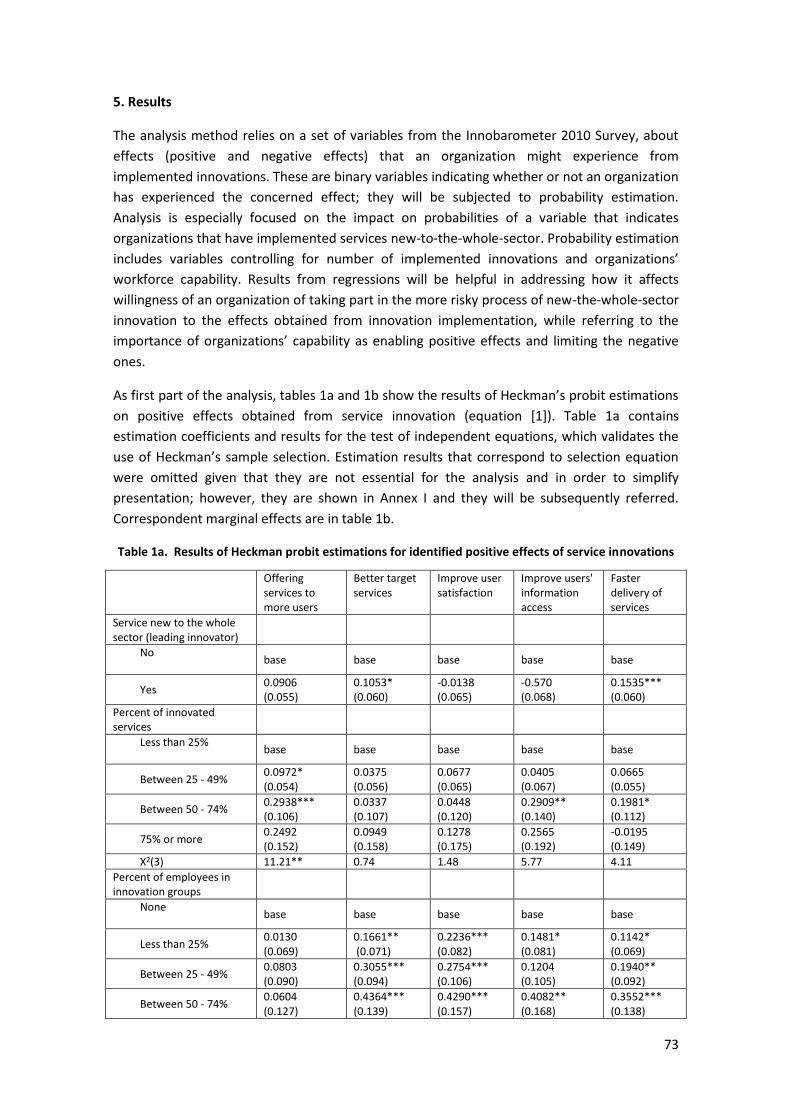
73
5. Results
The analysis method relies on a set of variables from the Innobarometer 2010 Survey, about
effects (positive and negative effects) that an organization might experience from
implemented innovations. These are binary variables indicating whether or not an organization
has experienced the concerned effect; they will be subjected to probability estimation.
Analysis is especially focused on the impact on probabilities of a variable that indicates
organizations that have implemented services new-to-the-whole-sector. Probability estimation
includes variables controlling for number of implemented innovations and organizations’
workforce capability. Results from regressions will be helpful in addressing how it affects
willingness of an organization of taking part in the more risky process of new-the-whole-sector
innovation to the effects obtained from innovation implementation, while referring to the
importance of organizations’ capability as enabling positive effects and limiting the negative
ones.
As first part of the analysis, tables 1a and 1b show the results of Heckman’s probit estimations
on positive effects obtained from service innovation (equation [1]). Table 1a contains
estimation coefficients and results for the test of independent equations, which validates the
use of Heckman’s sample selection. Estimation results that correspond to selection equation
were omitted given that they are not essential for the analysis and in order to simplify
presentation; however, they are shown in Annex I and they will be subsequently referred.
Correspondent marginal effects are in table 1b.
Table 1a. Results of Heckman probit estimations for identified positive effects of service innovations
Offering services to more users
Better target services
Improve user satisfaction
Improve users' information access
Faster delivery of services
Service new to the whole sector (leading innovator)
No
base base base base base
Yes 0.0906 (0.055)
0.1053* (0.060)
-0.0138 (0.065)
-0.570 (0.068)
0.1535*** (0.060)
Percent of innovated services
Less than 25%
base base base base base
Between 25 - 49% 0.0972* (0.054)
0.0375 (0.056)
0.0677 (0.065)
0.0405 (0.067)
0.0665 (0.055)
Between 50 - 74% 0.2938*** (0.106)
0.0337 (0.107)
0.0448 (0.120)
0.2909** (0.140)
0.1981* (0.112)
75% or more 0.2492 (0.152)
0.0949 (0.158)
0.1278 (0.175)
0.2565 (0.192)
-0.0195 (0.149)
Χ2(3) 11.21** 0.74 1.48 5.77 4.11 Percent of employees in innovation groups
None
base base base base base
Less than 25% 0.0130 (0.069)
0.1661** (0.071)
0.2236*** (0.082)
0.1481* (0.081)
0.1142* (0.069)
Between 25 - 49% 0.0803 (0.090)
0.3055*** (0.094)
0.2754*** (0.106)
0.1204 (0.105)
0.1940** (0.092)
Between 50 - 74% 0.0604 (0.127)
0.4364*** (0.139)
0.4290*** (0.157)
0.4082** (0.168)
0.3552*** (0.138)

74
75% or more 0.0844 (0.122)
0.4742*** (0.133)
0.3483** (0.145)
0.0571 (0.140)
0.1357 (0.123)
Χ2(4) 1.35 21.73*** 12.66** 7.29 8.69*
Constant 0.4121*** (0.061)
0.4409*** (0.063)
0.7306*** (0.074)
0.9285*** (0.072)
0.4701*** (0.061)
Test of independent equations (rho = 0)
25.46*** 21.20*** 17.77*** 16.76*** 59.72***
* 90% confidence level; ** 95% confidence level; *** 99% confidence level
Table 1b. Heckman probit marginal effects for identified positive effects of service innovationsa)
Offering services to more users
Better target services
Improve user satisfaction
Improve users' information access
Faster delivery of services
Service new to the whole sector (leading innovator)
No
base base base base base
Yes 0.0332 (0.020)
0.0381* (0.022)
-0.0042 (0.020)
-0.0148 (0.017)
0.0549** (0.021)
Percent of innovated services
Less than 25%
base base base base Base
Between 25 - 49% 0.0356* (0.020)
0.0136 (0.021)
0.0207 (0.020)
0.0105 (0.017)
0.0237 (0.020)
Between 50 - 74% 0.1077*** (0.040)
0.0122 (0.039)
0.0137 (0.037)
0.0754** (0.037)
0.0708* (0.040)
75% or more 0.0913 (0.056)
0.0343 (0.057)
0.0391 (0.054)
0.0665 (0.050)
-0.0070 (0.053)
Percent of employees in innovation groups
None
base base base base base
Less than 25% 0.0048 (0.025)
0.0577** (0.025)
0.0625*** (0.024)
0.0357* (0.020)
0.0396 (0.024)
Between 25 - 49% 0.0289 (0.032)
0.1019*** (0.031)
0.0753*** (0.029)
0.0295 (0.026)
0.0658** (0.031)
Between 50 - 74% 0.0219 (0.045)
0.1394*** (0.040)
0.1094*** (0.036)
0.0859*** (0.031)
0.1145*** (0.041)
75% or more 0.0304 (0.043)
0.1496*** (0.038)
0.0922*** (0.035)
0.0144 (0.034)
0.0468 (0.042)
* 90% confidence level; ** 95% confidence level; *** 99% confidence level.
a) Calculated for discrete change of dummy variable from 0 to 1.
Overall, results of estimations show certain levels of significance for variables explaining
probabilities of experiencing the listed positive effects. Since variables are factor defined, it is
important to know not only individual significance of each of factors’ coefficients but also joint
significance of factor groups formed by each variable. Results of chi squared joint significance
tests alert that the right specification for estimating each of effects’ probabilities might be
different; however, the purpose in this analysis is not to estimate the most efficient
specification, but to compare the explicative power of each of variables addressed to the
concerned innovation effects. In that sense, the leading innovator dummy variable appears to
be relevant in explaining two of the listed positive effects: enabling to better target services
and enabling faster delivery of services. Confidence levels are strictly indicated at the usual
cuts; however, we would like to remark that significance of the leading innovator coefficient is

75
in the very limit of the 90% confidence level when estimating the effect of enabling to offer
services to more or new types of users. Percentage of innovated services seem to be especially
relevant in explaining the effect of offering services to more users (once again, significance of
the ‘75% or more’ coefficient is very close to the 90% confidence level). In turn, percentage of
employees taking part in groups that meet for developing innovations is especially relevant in
explaining probabilities of better targeting services, improving user satisfaction, faster delivery
of services and improving users’ access to information.
Looking at the marginal effects, it can be seen that the impact of the leading innovator variable
on the estimated probabilities is modest. There is more to expect from organizations with
more than 50% of innovated services, this particularly true for the effect of offering services to
more users. Likewise, having more than 50% of employees taking part in innovation groups
seem to be more important than the fact that the organization has implemented a service
which is new to the whole sector. Moreover, it looks like percentage of employees in
innovation groups is the variable that more contributes to explain probabilities of listed
positive effects, except for ‘offering services to more users’, where the impact of the
percentage of innovated services dominates.
As for the results on the estimation of the selection equation, variables about organizations’
size (number of employees), organizations’ country and percentage of employees meeting in
innovation groups are highly significant and show a wide impact in the estimated selection
condition (being an organization that has implemented any service innovation). Unexpectedly,
organizations’ area of responsibility and the percentage of employees with university degree
have not reached statistical significance in any of the estimations. One could then conclude
that, together with differences in innovation performance due to country differences,
organizations’ size and percentage of employees in innovation groups are strongly
conditioning organizations to implement service innovations. It is easy to believe that a bigger
organization, with a bigger area of responsibility, whose employees are better prepared and
more involved in the innovation process, will more probably be taking part in service
innovations and will also obtain better results from implementation. Nonetheless, empirical
evidence does not go along with this assertion in what can be related to employees’ formal
education and organizations’ area of responsibility.
Tables 2a and 2b show the results of Heckman’s probit estimations on negative effects
obtained from service innovation. As in the case of positive effects, estimation results that
correspond to selection equation were here omitted and are presented in Annex I. An
important annotation here is that Heckman’s estimations on the effects of reducing type or
flexibility of services and creating user resistance or dissatisfaction have failed the test of
independence equations. In order to obtain consistent and asymptotically efficient estimators,
standard probit regressions were applied on these two negative effects, following the
specification of equation [1].
Similarly to previous results on the selection for estimating positive effects, variables about
organizations’ size, organizations’ country and percentage of employees meeting in innovation
groups are highly significant and show a wide impact in the estimated selection condition,
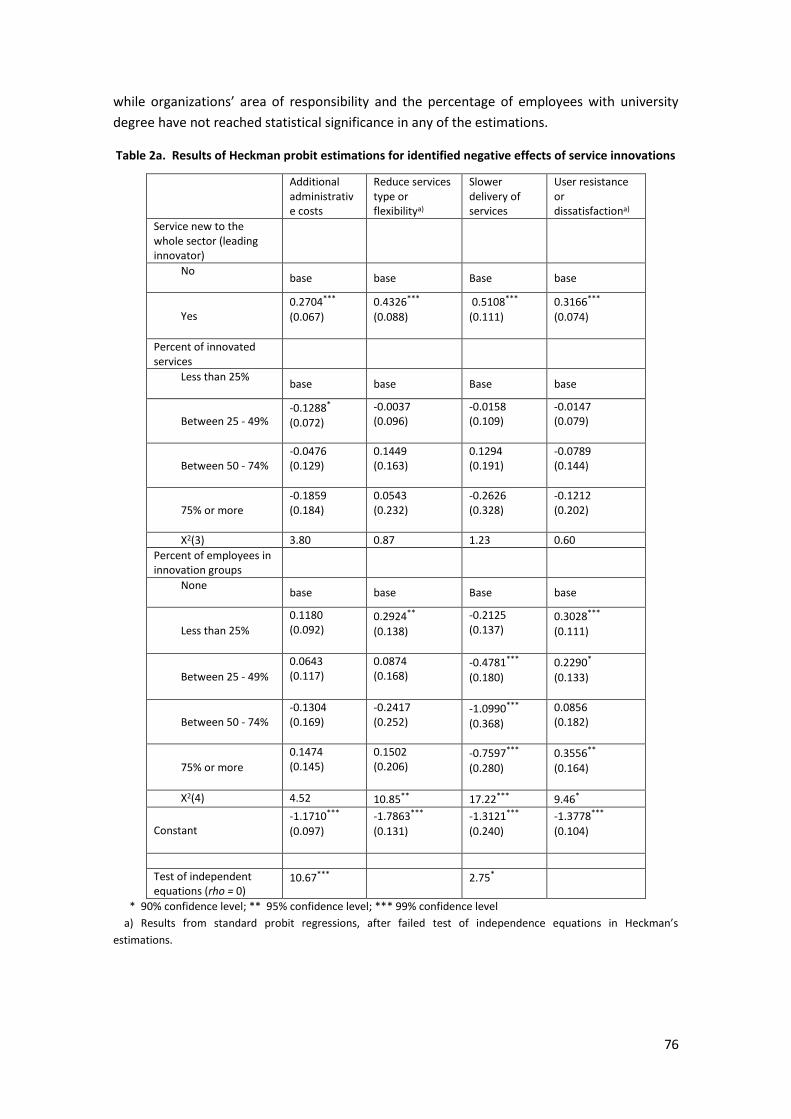
76
while organizations’ area of responsibility and the percentage of employees with university
degree have not reached statistical significance in any of the estimations.
Table 2a. Results of Heckman probit estimations for identified negative effects of service innovations
Additional administrative costs
Reduce services type or flexibilitya)
Slower delivery of services
User resistance or dissatisfactiona)
Service new to the whole sector (leading innovator)
No
base base Base base
Yes 0.2704***
(0.067)
0.4326***
(0.088)
0.5108***
(0.111)
0.3166***
(0.074)
Percent of innovated services
Less than 25%
base base Base base
Between 25 - 49% -0.1288* (0.072)
-0.0037 (0.096)
-0.0158 (0.109)
-0.0147 (0.079)
Between 50 - 74% -0.0476 (0.129)
0.1449 (0.163)
0.1294 (0.191)
-0.0789 (0.144)
75% or more -0.1859 (0.184)
0.0543 (0.232)
-0.2626 (0.328)
-0.1212 (0.202)
Χ2(3) 3.80 0.87 1.23 0.60 Percent of employees in innovation groups
None
base base Base base
Less than 25%
0.1180 (0.092)
0.2924**
(0.138)
-0.2125 (0.137)
0.3028***
(0.111)
Between 25 - 49%
0.0643 (0.117)
0.0874 (0.168)
-0.4781***
(0.180)
0.2290*
(0.133)
Between 50 - 74% -0.1304 (0.169)
-0.2417 (0.252)
-1.0990***
(0.368)
0.0856 (0.182)
75% or more
0.1474 (0.145)
0.1502 (0.206)
-0.7597***
(0.280)
0.3556**
(0.164)
Χ2(4) 4.52 10.85** 17.22*** 9.46*
Constant -1.1710***
(0.097)
-1.7863***
(0.131)
-1.3121***
(0.240)
-1.3778***
(0.104)
Test of independent equations (rho = 0)
10.67*** 2.75*
* 90% confidence level; ** 95% confidence level; *** 99% confidence level
a) Results from standard probit regressions, after failed test of independence equations in Heckman’s
estimations.

77
Table 2b. Heckman probit marginal effects for identified negative effects of service innovationsa)
Additional administrative costs
Reduce services type or flexibilityb)
Slower delivery of services
User resistance or dissatisfactionb)
Service new to the whole sector (leading innovator)
No
base base
Base base
Yes 0.0543*** (0.014)
0.0509*** (0.016)
0.0862*** (0.025)
0.0602*** (0.021)
Percent of innovated services
Less than 25%
base base
Base base
Between 25 - 49% -0.0259* (0.016)
-0.0003 (0.008)
-0.0027 (0.019)
-0.0022 (0.012)
Between 50 - 74% -0.0096 (0.026)
0.0133 (0.017)
0.0218 (0.032)
-0.0115 (0.020)
75% or more -0.0374 (0.038)
0.0046 (0.021)
-0.0443 (0.057)
-0.0172 (0.026)
Percent of employees in innovation groups
None
base base
base base
Less than 25% 0.0254 (0.019)
0.0306** (0.013)
-0.0311 (0.025)
0.0570*** (0.020)
Between 25 - 49% 0.0134 (0.024)
0.0076 (0.015)
-0.0580* (0.031)
0.0412* (0.024)
Between 50 - 74% -0.0242 (0.030)
-0.0157 (0.015)
-0.0868** (0.037)
0.0140 (0.031)
75% or more 0.0322 (0.032)
0.0139 (0.020)
-0.0756** (0.035)
0.0692** (0.035)
* 90% confidence level; ** 95% confidence level; *** 99% confidence level.
a) Calculated for discrete change of dummy variable from 0 to 1.
b) Results from standard probit regressions, after failed test of independence equations in Heckman’s estimations.
Estimation results of negative effects show the leading innovator variable to be significant and
positive in every case. The percentage of improved services was not found statistically
significant in explaining the probability of negative effects. It was expected that higher
proportions of innovated services would help organizations to reduce the probability of getting
negative effects (as greater experience in implementing innovations could help organizations
to identify and avoid some risks). In turn, the percentage of employees in innovation groups is
statistically significant in three of the negative effects; however, its impact on the estimated
probability goes in two directions: positive for reducing types and flexibility of services and
creating user resistance or dissatisfaction, and negative for slower delivery of services.
Heckman’s probit regressions estimate innovation effects’ probabilities only from those
organizations that have recently implemented service innovations. Among these, some
organizations – named ‘leading innovators’ – are known to have introduced a new service

78
which was implemented by first time within the whole country’s public sector. Findings in the
explicative variable identifying leading innovators suggests that probability of experiencing one
of the previously listed positive effects will be higher whenever innovating organizations have
implemented a service which is new within the whole country’s public sector. Findings are,
however, limited for making a strong concluding statement in that sense, given that levels of
individual significance and magnitude of marginal effects tell about short and not always
significant impacts over positive effects’ probabilities. At the same time, results from the
leading innovator variable suggests that probability of experiencing the previously listed
negative effects will be higher whenever innovating organizations have implemented a service
new to the whole country’s sector. This is a conclusion that is better supported by levels of
significance in estimations results; nonetheless, marginal effects still show a short impact of
the observed variable over probabilities of negative effects.
Other variables that also have an impact on estimated probabilities are the percentage of
innovated services and the percentage of employees meeting in innovation groups. There
were good reasons to think that bigger proportions of innovated services and bigger
proportions of employees taking part in the innovation process should be helpful for reaching
the positive effects and for avoiding the negative ones. However, the percentage of innovated
services was only found significant for one of the positive effects (offering services to more
users), while no significance on this variable was found when estimating the negative effects.
On the other hand, the percentage of employees in innovations groups is significant for most
of positive and negative effects; however, it strongly calls the attention that – opposite to
expected – estimation results from this variable suggest that it mostly raises the probability of
negative effects.
An overall conclusion until here is that risk of suffering the listed negative effects is
significantly depending on the fact that organizations had implemented service innovations
that are new to the whole sector, while positive effects can also be positively affected by the
introduction of new services, but not as much as negative effects are. It looks like the mere
fact of being involved to new-to-the-whole-sector innovations is enough to expose
organizations to risk of negative effects, while this degree of novelty is not a guarantee for
positive ones. At the same time, a strategy such as having groups of employees developing
innovations can be particularly helpful to enhance the probability of obtaining positive effects.
Meanwhile, a strategy such as having groups of employees developing innovations can help to
alleviate the risk of negative effects.
6. Discussion and final remarks
As for the three research hypotheses proposed in this article, the empirical experiment gives
evidence in favor of the three of them. First one implies that probability of getting certain
positive and negative effects from innovation implementation significantly differs depending
on whether public organizations have implemented services that are new for all the public
sector. Thus, results of probability estimations show high significance and relevance of
influence of organizations’ characterization on probabilities of studied positive and negative
effects.

79
Second and third research hypotheses imply that risk of suffering negative effects will be
higher for organizations introducing services new to the whole sector than for organizations
which have only implemented service improvements or new services previously implemented
by another public organization, while chance of getting positive effects will be greater for
those organizations introducing services new for the whole public sector. The extent to which
these are supported by the empirical method is next going to be discussed.
Results suggest to some extent that being an organization that has implemented services that
are new to the whole sector give an extra chance to achieve positive effects from innovation.
However, results of the experiment also suggest that workforce taking part in innovation
development is more relevant to explain probability of positive effects. Hence, probability of
getting some determined positive results is not just a matter of organizations undertaking
new-to-the-whole-sector innovations, but that innovations are implemented by an
organization with better workforce capabilities.
Therefore, it is believed that positive effects from innovation are to a greater extent a
consequence of organizations’ ability and capability. Nonetheless, since introducing services
new to the sector has also shown a relevant effect, we still believe there are better results to
expect due to innovations’ newness.
Also, results shows that being an organization that has implemented services that are new to
the whole sector have a strong influence on the risk to suffer a negative effect from
innovation. Organizations that did not introduce new services will be much lesser exposed to
risk of negative effects. Results of estimations do not show the association previously found
between innovation effects and organizations’ capabilities. Therefore, it is believed that
negative effects from innovation certainly are a consequence of novelty implied in public
organizations’ implemented innovations.
The paradigm of innovation is a promise of opportunities for improvement, brought by new
ways of doing things. Indeed, novelty is a central aspect of innovation, but novelty is not
enough for achieving expected improvement. Novelty is useful in creating opportunities, but
opportunities must be worked out. To do so, organizations must manage an adequate
development and implementation process, which demands organization and employee
abilities in order to realize improvement opportunities. In turn, innovation also brings some
risks that are a result of the ‘unknown’ implied by novelty. Risk, derived from uncertainty, is a
concept strongly attached to novelty. Risk in novelty can be managed as it can be measured
and known in its causes and consequences, and that is – again – something that demands
some abilities. However, risk will always be jeopardizing results of innovation, especially when
novelty implied in it is greater.
Conclusions led by the empirical experiment are helpful to illustrate why public organizations
fear novel solutions and the reason behind risk avoidance counteracting the levels of public
sector innovation. In this context, what are the incentives for public organizations to undertake
new-to-the-whole-sector innovations? Does it make sense to encourage a rising of public
sector innovation? Some indications to answer these questions are in the texts of Potts (2009)
and Brown and Osborne (2013). There, avoidance of risk of innovation is understood (and
someway proven right) under public accountability. But it is also said that principles of public

80
accountability should not be taken as far to restraint the necessary changes to go with
changing society and demands for public services. In particular, Potts suggest that levels of
public innovation and experimentation should at least keep pace with changes in economy and
society (what he calls “the red queen solution” (see Potts, 2009)).
Studies about public innovation tell about a gap of innovation between private firms and
public organizations; however, the extent to which this gap should be shortened has not been
properly discussed. A step in that direction is to always have in mind that innovation is an
instrument addressed to an objective of improvement, and not the objective itself. It is
necessary to make a difference between the two natures of private firms and public
organizations, respectively leaded by profitability and public accountability. These two will
determine the role of innovation towards organizations’ goals and how much of risk they are
willing to take to achieve them. Based on the results of the present study and the suggestions
of previous publications, willingness of public organizations to undertake new-to-the-whole-
sector innovations should at least meet changes in the many dimensions (societal, economic,
technological, etc.) that affect public functions.
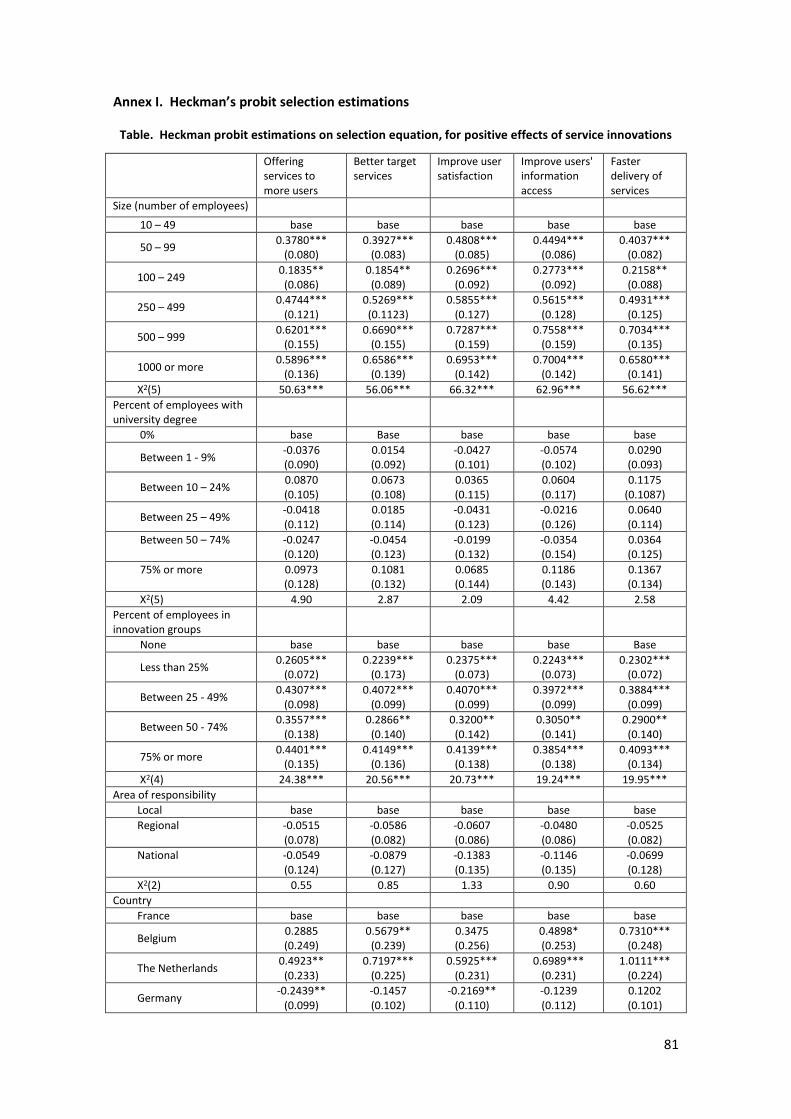
81
Annex I. Heckman’s probit selection estimations
Table. Heckman probit estimations on selection equation, for positive effects of service innovations
Offering services to more users
Better target services
Improve user satisfaction
Improve users' information access
Faster delivery of services
Size (number of employees)
10 – 49 base base base base base
50 – 99 0.3780***
(0.080) 0.3927***
(0.083) 0.4808***
(0.085) 0.4494***
(0.086) 0.4037***
(0.082)
100 – 249 0.1835**
(0.086) 0.1854**
(0.089) 0.2696***
(0.092) 0.2773***
(0.092) 0.2158**
(0.088)
250 – 499 0.4744***
(0.121) 0.5269*** (0.1123)
0.5855*** (0.127)
0.5615*** (0.128)
0.4931*** (0.125)
500 – 999 0.6201***
(0.155) 0.6690***
(0.155) 0.7287***
(0.159) 0.7558***
(0.159) 0.7034***
(0.135)
1000 or more 0.5896***
(0.136) 0.6586***
(0.139) 0.6953***
(0.142) 0.7004***
(0.142) 0.6580***
(0.141)
Χ2(5) 50.63*** 56.06*** 66.32*** 62.96*** 56.62***
Percent of employees with university degree
0% base Base base base base
Between 1 - 9% -0.0376 (0.090)
0.0154 (0.092)
-0.0427 (0.101)
-0.0574 (0.102)
0.0290 (0.093)
Between 10 – 24% 0.0870 (0.105)
0.0673 (0.108)
0.0365 (0.115)
0.0604 (0.117)
0.1175 (0.1087)
Between 25 – 49% -0.0418 (0.112)
0.0185 (0.114)
-0.0431 (0.123)
-0.0216 (0.126)
0.0640 (0.114)
Between 50 – 74% -0.0247 (0.120)
-0.0454 (0.123)
-0.0199 (0.132)
-0.0354 (0.154)
0.0364 (0.125)
75% or more 0.0973 (0.128)
0.1081 (0.132)
0.0685 (0.144)
0.1186 (0.143)
0.1367 (0.134)
Χ2(5) 4.90 2.87 2.09 4.42 2.58
Percent of employees in innovation groups
None base base base base Base
Less than 25% 0.2605***
(0.072) 0.2239***
(0.173) 0.2375***
(0.073) 0.2243***
(0.073) 0.2302***
(0.072)
Between 25 - 49% 0.4307***
(0.098) 0.4072***
(0.099) 0.4070***
(0.099) 0.3972***
(0.099) 0.3884***
(0.099)
Between 50 - 74% 0.3557***
(0.138) 0.2866**
(0.140) 0.3200**
(0.142) 0.3050**
(0.141) 0.2900**
(0.140)
75% or more 0.4401***
(0.135) 0.4149***
(0.136) 0.4139***
(0.138) 0.3854***
(0.138) 0.4093***
(0.134)
Χ2(4) 24.38*** 20.56*** 20.73*** 19.24*** 19.95***
Area of responsibility
Local base base base base base Regional -0.0515
(0.078) -0.0586 (0.082)
-0.0607 (0.086)
-0.0480 (0.086)
-0.0525 (0.082)
National -0.0549 (0.124)
-0.0879 (0.127)
-0.1383 (0.135)
-0.1146 (0.135)
-0.0699 (0.128)
Χ2(2) 0.55 0.85 1.33 0.90 0.60
Country
France base base base base base
Belgium 0.2885 (0.249)
0.5679** (0.239)
0.3475 (0.256)
0.4898* (0.253)
0.7310*** (0.248)
The Netherlands 0.4923**
(0.233) 0.7197***
(0.225) 0.5925***
(0.231) 0.6989***
(0.231) 1.0111***
(0.224)
Germany -0.2439**
(0.099) -0.1457 (0.102)
-0.2169** (0.110)
-0.1239 (0.112)
0.1202 (0.101)

82
Italy 0.5269***
(0.106) 0.5312***
(0.109) 0.4899***
(0.115) 0.5753***
(0.116) 0.8358***
(0.107)
Luxembourg -0.9503**
(0.466) -0.2753 (0.446)
-0.0377 (0.452)
-0.0093 (0.459)
0.3268 (0.420)
Denmark -0.2538 (0.216)
-0.2011 (0.224)
-0.2538 (0.231)
-0.2016 (0.234)
0.0349 (0.230)
Ireland 0.1803 (0.242)
0.3258 (0.244)
0.2016 (0.254)
0.2863 (0.255)
0.5528** (0.247)
United Kingdom 0.1377 (0.139)
0.2293 (0.142)
0.0823 (0.150)
0.1731 (0.151)
0.5070*** (0.143)
Greece -0.0089 (0.148)
0.0234 (0.151)
-0.0943 (0.162)
-0.0125 (0.165)
0.3338** (0.150)
Spain 0.6162***
(0.151) 0.6618***
(0.153) 0.5771***
(0.158) 0.6718***
(0.159) 0.9859***
(0.153)
Portugal 1.1043***
(0.286) 1.2372***
(0.284) 1.1298***
(0.291) 1.1958***
(0.296) 1.5412***
(0.283)
Finland -0.2778* (0.151)
-0.2036 (0.160)
-0.4214** (0.172)
-0.4219** (0.177)
0.0948 (0.159)
Sweden -0.4887***
(0.177) -0.4002**
(0.187) -0.5175***
(0.198) -0.4093**
(0.197) -0.0672 (0.184)
Austria -0.0437 (0.169)
-0.0650 (0.178)
-0.0496 (0.183)
0.0449 (0.187)
0.1966 (0.181)
Cyprus -0.7473 (0.472)
-0.3533 (0.519)
-0.5022 (0.553)
-0.4205 (0.555)
-0.0382 (0.518)
Czech Republic -0.1158 (0.167)
-0.1458 (0.169)
0.1515 (0.179)
0.1049 (0.189)
0.4553*** (0.170)
Estonia -0.0591 (0.213)
0.0233 (0.217)
-0.3135 (0.257)
-0.0173 (0.234)
0.2780 (0.221)
Hungary -0.4035**
(0.162) -0.3139**
(0.159) -0.5448***
(0.164) -0.4580***
(0.170) -0.0089 (0.129)
Latvia 0.1821 (0.213)
0.2882 (0.216)
0.1318 (0.227)
0.3159 (0.225)
0.4071** (0.219)
Lithuania -0.3369 (0.214)
-0.3028 (0.229)
-0.4617* (0.247)
-0.2918 (0.250)
-0.0386 (0.220)
Malta 0.4603 (0.625)
0.5824 (0.621)
0.4693 (0.661)
0.5241 (0.650)
0.6155 (0.674)
Poland -0.0095 (0.109)
0.0199 (0.112)
0.0086 (0.119)
0.1555 (0.121)
0.4627*** (0.111)
Slovakia -0.1134 (0.159)
0.0116 (0.163)
0.0592 (0.172)
0.1474 (0.175)
0.4431*** (0.161)
Slovenia 0.5071* (0.271)
0.6185** (0.273)
0.5416* (0.280)
0.6305** (0.283)
0.8378*** (0.276)
Bulgaria 0.0024 (0.167)
0.0403 (0.169)
-0.0163 (0.180)
0.0737 (0.182)
0.3394** (0.169)
Romania -0.4994***
(0.164) -0.2338 (0.170)
-0.4341** (0.185)
-0.2052 (0.183)
-0.0573 (0.175)
Norway -0.4069**
(0.187) -0.3916* (0.200)
-0.6560*** (0.234)
-0.5887*** (0.226)
-0.1417 (0.177)
Switzerland -0.1089 (0.229)
0.1757 (0.225)
0.1070 (0.230)
0.2226 (0.231)
0.1282 (0.241)
Χ2(28) 170.01*** 148.81*** 151.57*** 152.43*** 185.82***
Constant 0.1592 (0.104)
0.0891 (0.106)
0.1590 (0.110)
0.0711 (0.115)
-0.2445** (0.111)
Test of independent equations (rho = 0)
25.46*** 21.20*** 17.67*** 16.76*** 59.72***

83
Table. Heckman probit estimations on selection equation, for negative effects of service innovations
Additional administrative costs
Slower delivery of services
Size (number of employees)
10 – 49 base base
50 – 99 0.4180***
(0.088) 0.4099***
(0.091)
100 – 249 0.2509***
(0.093) 0.2567***
(0.096)
250 – 499 0.5512***
(0.130) 0.5572***
(0.132)
500 – 999 0.7034***
(0.161) 0.7220***
(0.163)
1000 or more 0.7229***
(0.143) 0.6749***
(0.149)
Χ2(5) 55.93*** 49.83***
Percent of employees with university degree
0% base base
Between 1 - 9% -0.0505 (0.103)
-0.0964 (0.105)
Between 10 – 24% 0.0504 (0.120)
0.0149 (0.122)
Between 25 – 49% -0.0643 (0.127)
-0.0981 (0.130)
Between 50 – 74% -0.0385 (0.135)
-0.0857 (0.138)
75% or more 0.0207 (0.144)
-0.0295 (0.148)
Χ2(5) 2.33 2.80
Percent of employees in innovation groups
None base base
Less than 25% 0.2257***
(0.073) 0.2598***
(0.074)
Between 25 - 49% 0.3957***
(0.100) 0.4385***
(0.101)
Between 50 - 74% 0.2546* (0.143)
0.3520** (0.143)
75% or more 0.4140***
(0.138) 0.4536***
(0.138)
Χ2(4) 19.28*** 23.70***
Area of responsibility
Local base base
Regional -0.0396 (0.087)
-0.0640 (0.090)
National -0.0281 (0.135)
-0.1009 (0.138)
Χ2(2) 0.22 0.88
Country
France base base
Belgium 0.5237**
(0.252) 0.5502**
(0.251)
The Netherlands 0.6744***
(0.235) 0.6906***
(0.237)
Germany -0.1818 (0.116)
-0.1835 (0.119)
Italy 0.5546***
(0.119) 0.6403***
(0.122)

84
Luxembourg -0.1748 (0.483)
-0.0825 (0.487)
Denmark -0.3580 (0.242)
-0.2874 (0.247)
Ireland 0.2865 (0.256)
0.2347 (0.265)
United Kingdom 0.2360 (0.152)
0.1032 (0.157)
Greece -0.0142 (0.173)
-0.1231 (0.178)
Spain 0.6736***
(0.161) 0.6427***
(0.163)
Portugal 1.1722***
(0.298) 1.1602***
(0.297)
Finland -0.1896 (0.177)
-0.2704 (0.181)
Sweden -0.5065**
(0.205) -0.3931* (0.206)
Austria -0.0351 (0.194)
-0.1171 (0.199)
Cyprus -0.5486 (0.599)
-0.2849 (0.583)
Czech Republic 0.3303**
(0.181) 0.3144* (0.184)
Estonia 0.1367 (0.234)
-0.0120 (0.246)
Hungary -0.4303**
(0.179) -0.4614**
(0.186)
Latvia 0.3512 (0.227)
0.2680 (0.233)
Lithuania -0.2309 (0.257)
-0.3297 (0.268)
Malta 0.5460 (0.648)
0.5261 (0.659)
Poland 0.1733 (0.124)
0.1337 (0.127)
Slovakia 0.2294 (0.174)
0.2783 (0.184)
Slovenia 0.6809**
(0.280) 0.5970**
(0.288)
Bulgaria 0.3083* (0.177)
0.1807 (0.184)
Romania -0.0136 (0.181)
-0.1280 (0.187)
Norway -0.6761***
(0.238) -0.7092***
(0.246)
Switzerland 0.1470 (0.239)
0.1610 (0.242)
Χ2(28) 146.90*** 155.93***
Constant 0.0716 (0.117)
0.1112 (0.118)
Test of independent equations (rho = 0)
10.67*** 2.75*

85
Chapter 4. The way of public innovation in
developing countries: An approach for Mexican
local governments

86
1. Understanding public innovation in developing countries
All work reviewed before give a useful insight into the issue of public innovation. However, this
is largely based in situations and applications in the context of developed countries. It is
common to find in them references to OECD countries, Commonwealth countries (Australia
and the United Kingdom, in particular) and western European countries. Therefore, one could
reasonably ask: what is innovation about public institutions in developing countries?
Public innovation studies highlight the need for more flexible public organizations that allow
for experimentation, waste and failure (Borins, 2006; Potts 2009; Brown and Osborne, 2013),
in such a way that innovation is enabled. At the same time, there is a claim for reforming
public administration, so institutional bureaucratization might not be a barrier for
implementing technical instruments and managerial strategies that help for increased
efficiency, quality and effectiveness in public administration. This kind of observations recall
highly regulated organizations with strong hierarchic patterns of authority and whose views on
policy and accountability makes them to avoid implementations that represent a chance of
failure. However, what could be expected about promotion and implementation of innovation
in organizations that do not resemble the latter?
Expectations for development and improvement make implementation of innovations
something desirable at all levels of all kinds of organizations. This is also true for regions where
society, economy and public institutions remain at a developing state. Therefore, it arise a
question on whether the understanding of processes enabling public innovation – acquired in
developed contexts – is the same valid for organizations in developing regions, where
weakness of public institutions might place more barriers to successful implementations.
As said before, it is little what have been said about the issue of public innovation relying on
evidence from developing regions. Some publications, however, have documented results on
the efforts for reforming public institutions and the elements that might have conditioned
success or failure. This review let to know some important features of developing public
institutions that differ from the context where public innovation is commonly observed and
might lead to a different understanding of the innovation process. For example: Samaratunge
and Bennington (2002) review the situation of Sri Lanka after a period of reform, Manning
(2001) makes an analysis from many developing regions, Arellano (2000) explains the situation
of Mexican local government institutions and Cabrero (1997) focus in the case of Latin
American countries facing reforms. Their findings are similar in what makes durable
sustainable reforms a difficult task.
Even if they are democratic states, it is common that local authorities in developing countries
are taken by interest groups that dominate the local stage, which result in discretional governs
that use public administration as a political tool. Thus, articulation of levels of governance that
should be given by law and institutionalization of authority is replaced by negotiation between
local and central powers (Arellano, 2000). Public administration accountability is an issue in
civil servants’ discourse; however, without the adequate instruments for citizens’ participation
and lack of transparency in budget expense, accountability becomes a simulated compliance
(Cabrero, 2005; Arzaluz, 2013). Hence, technical guiding is missed in policy planning, execution
and evaluation (Samaratunge and Bennington, 2002; García, 2005).

87
2. The case of Mexican local government
Some deficiencies in Mexican local governments concerning to innovation development can be
understood through a revision of the history of political and administrative arrangements since
colonial times and after Mexico’s independence. Arellano (2000) describes the idea of
patromonialistic values at the root of incapacity (or unwillingness) of Mexican municipalities to
bear successful reform and innovation. Arellano explains patrimonialism as a tradition
continued by those that held discretional authority and power in local regions since
governance was configured during the Spanish colony. According to this, caciques and similar
forms of local domination have developed the ability to adapt to successive State reforms and
keep their privileges: in patrimonialism legitimacy is kept by tradition and the capacity of
dominant groups to present themselves as advocators of a charity ethic (or welfare state)
(Arellano, 2000, p. 116).
The technocratic vision of government administration as a body led by policy planning and
oriented to efficient and effective goals is not valid in the Mexican case, where public
administration is an instrument for fighting the political arena and public accountability works
as an appeal for justifying discretional decisions in favor of groups and individuals whose
collective benefits are not that clear (Arellano, 2002). In this context there is little place for
processes – such as innovation – based on technical aspects like planning, efficiency, quality,
measure and so.
There is a trend for institutionalize public innovation, framed by theories of change and reform
in governmental institutions. Trying to embed these ideas into the context of Mexico’s public
administration has frequently worked as a mean to reinforce a discretional way for policy
implementation, rather than one guided by technical aspects. In this sense, there is an official
speech claiming for change, reform and innovation as objectives for public administration
improvement, while reform is carried in such a way that the arrangements that serve to keep a
discretional public administration remain unaltered: “change is for all to stay the same”.
Additional to heritage in political uses, lack of social development has led to shortages in
institutional development of Mexican public administration. This is even more sensitive in
municipalities, with less faculties and resource availability than agencies from states or federal
government. Deficiencies of municipal government can be observed in factors at the operative
level, such as: lack of formal education (especially higher education) of employees, high
mobility of personnel in public office positions, lack of learned and established proceedings,
deficient organization and lack of tools and resources for carrying tasks (computing systems,
vehicles, technical support, etc.). Cabrero (2004) details some facts that help to make a picture
of institutional under-development of Mexican municipalities. These can be read in Table 1.

88
Table 1. Lack and deficiencies in Mexican Municipalities
The majority of Mexican municipalities are characterized by a weak normative and compulsory framework:
64% of the country’s municipalities do not even have basic internal by-laws.
Nearly 80% of municipalities do not have regulations for planning.
52% of municipalities do not have regulations for public services.
20% of municipalities do not have strategic planning.
Obsolete administrative systems dominate the municipal scene:
60% of the country’s municipalities do not have an administrative area specialized in expenditure, evaluation and supervision.
Almost half of the municipalities recognize having a goal-fulfillment level of less than 75%.
65% of municipalities do not have a Department of Personnel.
Most municipalities recognize having collected taxes and duties 75% below the estimations.
17% of municipalities still do not have a single computer for administrative work.
Mayors and civil servants are of a weak professional level:
18% of local government leaders do not have middle or higher education studies in any professional field.
Half of local government leaders do not have any previous experience in public administration.
Executive civil servants in municipal administration have little accumulated experience in their jobs: 30% have been working in their jobs for less than one year, 55% for less than three years; only 5% have been working for more than five years in their job.
Like local government leaders, half of the civil servants of primary level do not have any previous experience in public administration either. Source: Cabrero (2004)
Rigid bureaucracies are mentioned in studies on public innovation as a barrier to innovation,
since they do not allow for experimentation and ‘try and error’ processes, needed for
successful innovation implementations to emerge. Thus, claims for a more innovative public
sector imply the opposite: norms and authorities (managers, directors, presidents and any
decision maker) that tolerate certain levels of waste and failure and that encourage employees
to come up with new ideas (and take part in their development) in order to let the innovation
process to take its way (Borins, 2006; Potts, 2009). To this respect, Garcia (2005) argues:
While the need to make a bureaucratic apparatus more flexible might be a goal in some
spheres of Mexico’s public administration, in the great majority of the municipalities the
need to break the bureaucratic inertia in order to be able to innovate does not exist. This
need does not exist because a bureaucratic organization has not yet been developed. (p.
3)… Most local governments have not yet developed an organizational capacity that
could even be defined as bureaucratic, nor do they have the necessary technical,
organizational and institutional tools to face the expectations and needs of their citizens.
(p. 4)
In his work Garcia explains that the lack of systematized procedures and institutional tools in
Mexican municipalities is the reason why they are constantly making use of “innovation” as a
way to sidestep restrictions and policy challenges. However, these innovations – he says – are
no more than temporary solutions to permanent problems. They act as a remedy for a lacking
rational structure and in many times they will not be continued farther than the one period of
governance in which they are implemented. Garcia claims that most of innovations taking

89
place in Mexico’s local governments do not occur in spite of bureaucratic rigidity but rather
because of its absence. He makes a proposition that contradicts typical arguments of literature
of public innovation in developed countries: in order to achieve durable higher leveled
innovations Mexico’s municipalities should regress in the classic sense of promotion of
innovation; that is: to promote systematization, solid organizational structures and a
regulatory framework that allow for innovation sustainability.
Another inconvenience that Mexican municipalities face towards innovation implementation is
the impossibility to combine objectives of efficiency and govern legitimation in
implementation of innovative initiatives. Legitimation is pursued through actions addressed to
highlight efficiency and effectives of performance and to promote citizen’s participation in
public policy planning (Cabrero, 1997). However, there is frequently the case in developing
countries’ local governments, such as Mexico, that actions addressed to improve public
efficiency generate conflict and deteriorate government-citizen relations, while actions
addresses to improve government-citizen relations tend to counteract public efficiency
(Cabrero, 1997).
Focusing in the case of Mexican local governments, reviewed publications suggest some
strategies for fixing the institutional weakness of local public administrations and help for
effective sustainable reforms and higher level innovations that can actually bring expected
development and improvement. These refer to instruments that allow for citizens’
participation in favor of an authentic democratic government, increasing transparency in
administration for reducing discretional budget expense, actions for improving competencies
of public servants (such as reducing mobility in job places due to change of governance periods
and improving levels of preparation and formal education in public servants), establishing
systems, norms and processes that can be a reference for operations after every end of
governance periods.
Propositions aiming for more flexible chains of authority and a management style that
encourages experimentation and is more tolerant to waste and failure, they would be futile in
the context of Mexican local governments, where authority relations (from federal to local) are
elusive, experimentation is the way to go and public accountability does not constraint for
waste and failure. A similar situation can be verified in other developing regions (e.g. Manning
2001; Ziccardi, 2004). Therefore, contrary to relaxing solid bureaucracies, promotion of
innovation within developing public institutions requires reforms that lead to institutional
consolidation and advance in democracy and participation.
3. Mexican local governments in the way for successful innovation
In his work, Garcia (2005) points out differences in capabilities of Mexican municipalities
according to their levels of social development. He suggests that some municipalities with
certain demographic and development features are closer to bureaucratic institutions –
resembling those depicted in publications on management reform and public innovation –
while others remain in a pre-bureaucratic state. His propositions lead to believe that
implementation of innovative initiatives is more feasible in big municipalities with higher levels

90
of social development, while small municipalities with low levels of development do not
provide the institutional foundations for useful sustainable innovations.
The next step in the analysis is to present some evidence on the achievements of Mexican
municipalities towards implementation of innovative governance initiatives. To do so, it is
going to be drawn information from the Government and Local Management Award16 (Premio
Gobierno y Gestión Local). As explained in its own institutional web page, this is a yearly award,
addressed for giving recognition to those programs and local government policies which show
a positive and remarkable impact in design and implementation. Its objective is on identify,
analyze, recognize and disseminate the best local governance experiences in order to
contribute to their institutionalization and for developing better practices of management and
democracy. For being considered for award recognition, municipalities should go through the
award’s submission proceeding by filling in basic information of the initiatives they want to
propose. It is allowed that one single municipality proposes multiple initiatives in the same
year (and it has been the case that one municipality has obtained more than one initiative
awarded). These are recently implemented initiatives and – overall – addressed to improve
attention to citizen needs, to solve a particular problem or to enhance local governance. Thus,
novelty and significance at unit of implementation are constant elements in initiatives taking
part in the contest.
The present analysis is going to rely on information gathered from all participating initiatives
between years 2005 and 2011. We count on small briefings (less than one page) providing
highlights of each of 2.301 initiatives participating in the award along seven years. This
information is going to be complemented with demographic information specifically referred
to population size and social development. Measures of social development come from the
National Population Council17 (CONAPO). CONAPO offers a measure that classifies country
regions and municipalities according to five stages of exclusion18 suffered by their population:
1. High, 2. Medium-high, 3. Medium, 4. Medium-low, and 5. Low. Exclusion is revised every 5
years. During the period that covers the analysis, exclusion reports were released in 2005 and
2010. However, in order to keep consistence in descriptive statistics, and given the low rates of
change in classification, the classification of 2005 will be defined for the whole seven years
period. Likewise, basing on information from the National Institute of Statistic and
Geography19, the National System of Municipal Information20 classifies municipalities according
to the size and concentration of their population21: 1. Rural, 2. Semi-urban, 3. Mixed, 4.
16 http://www.premiomunicipal.org.mx 17 Consejo Nacional de Población http://www.conapo.org.mx 18 For an overview of the ‘exclusion’ technical definition and calculation method see document in http://www.conapo.gob.mx/work/models/CONAPO/indices_margina/marg_local05/libro/IndiceMargLoc2005.pdf 19 Instituto Nacional de Estadística y Geografía http://www.inegi.org.mx 20 Sistema Nacional de Información Municipal http://www.snim.rami.gob.mx 21 Metropolis: more than 50% of population lives in towns with more than 1 million of inhabitants. Big-urban: more than 50% of population lives in towns with more than 100 thousand and less than 1 million of inhabitants. Medium-urban: more than 50% of population lives in towns with more than 15 thousand and less than 100 thousand of inhabitants. Semi-urban: more than 50% of population lives in towns with more than 2.500 and less than 15 thousand of inhabitants. Rural: more than 50% of population lives in towns with less than 2.500 inhabitants. Mixed: population is found distributed as in previous categories, but none of them gathers more than 50% of population.

91
Medium-urban, 5. Big-urban, and 6. Metropolis. Measures on social exclusion and population
will be used as reference to give an idea of differences in capabilities of local administrations.
It can be observed different levels of institutional development among Mexican local
governments, this presumably linked to the level of economic development and the size and
concentration of their respective populations. According to municipalities’ size and levels of
social development, it can be observed differences in resource availability, civil servants
capability and bureaucratization of organizations.
After reviewing the innovation panorama provided by initiatives participating in the award, a
more detailed analysis will be carried by reviewing finalist initiatives. The second stage of the
award contest consists of a pre-selection of initiatives. A specialized commission is in charge of
evaluating participant initiatives and selecting some that show greatest potential according to
the objective of the award. Selected initiatives will go through an in-depth evaluation at the
places they are being implemented and the awarded initiatives will be nominated afterwards
(around five initiatives are awarded each year). Finalist initiatives: those that were pre-
selected by the specialized commission, they are going to be the base for the next part of the
analysis.
For the analysis of finalist initiatives they will only be selected those submitted by
municipalities at opposite ends of CONAPO’s classification of social exclusion: High and Low.
This is under the assumption that municipalities at ends of the classification are better
comparable due to sizes of population and government apparatus, given that metropolis and
big urban centers (with much bigger budgets and more complex government organization) are
found in middle levels of the exclusion classification. The analysis has as purpose to identify
relevant features in design and implementation of innovative initiatives, as read in their
briefings, and build a characterization of initiatives implemented by low and highly excluded
municipalities (different in development of their government institutions). The objective is to
compare characterization with the ideas explained before on innovation and institutional
development.
3.1 Frequencies and percentages of participant and finalist initiatives of the award
The contest for the Government and Local Management Award is carried every year since
2001. For the present analysis we count on information from initiatives between years 2005
and 2011. Total participant initiatives in that period of time sum up for 2.301 in all award
categories, while total finalist initiatives sum up for 175 (a twenty each year, approximately).
Initiatives are classified in categories that indicate the field of government action framing their
implementation (category is selected by submitting municipalities when filling in submission).
However, it can be verified that initiatives generally are not entirely delimited by one single
category, due to the extent of application. Therefore, categories are just a guiding reference.
Graphic-1 shows the sharing of categories among all participant and finalist initiatives during
our period of time.

92
Graphic 1 - Share of categories in total participating and finalist initiatives
Four out of twelve categories gather around half of total participating initiatives: Social policy
(16%), Municipal development (12%), Modernization of administration (12%) and Municipal
infrastructure (11%). The image turns to be more or less similar when we account only for
finalist initiatives: Social policy (15%), Municipal development (14%), Public security (13%) and
Modernization of administration (11%).
Graphic-2 shows percentages of all participating and finalist initiatives, by size and
concentration of population in submitting municipalities. The column called ‘National’ does
not account for initiatives, but for the total number of municipalities within the country
(2.454). It works for comparison purposes, between proportion of submitted initiatives and
proportion of country’s municipalities. It calls the attention that more than 50% of total
initiatives come from municipalities classified as ‘Big-Urban’. That is also true for finalist
initiatives. At the same time, initiatives from municipalities classified as ‘Metropolis’ account
for 12% and 14% of finalist and total participant initiatives, respectively. This observation is
quite remarkable, since Metropolis represent less than 1% of the number of municipalities in
the whole country. Likewise, Big-urban represents 4.5% of country’s municipalities. Therefore,
around 70% of total and finalist initiatives come from Metropolis and Big-urban municipalities,
which these roughly represent 5% of the whole number of municipalities in the country.
Another remarkable observation is that ‘Rural’ represents around 60% of municipalities in the
country, while initiatives coming from rural municipalities barely account for 7% and 12% of
total and finalist initiatives, respectively.
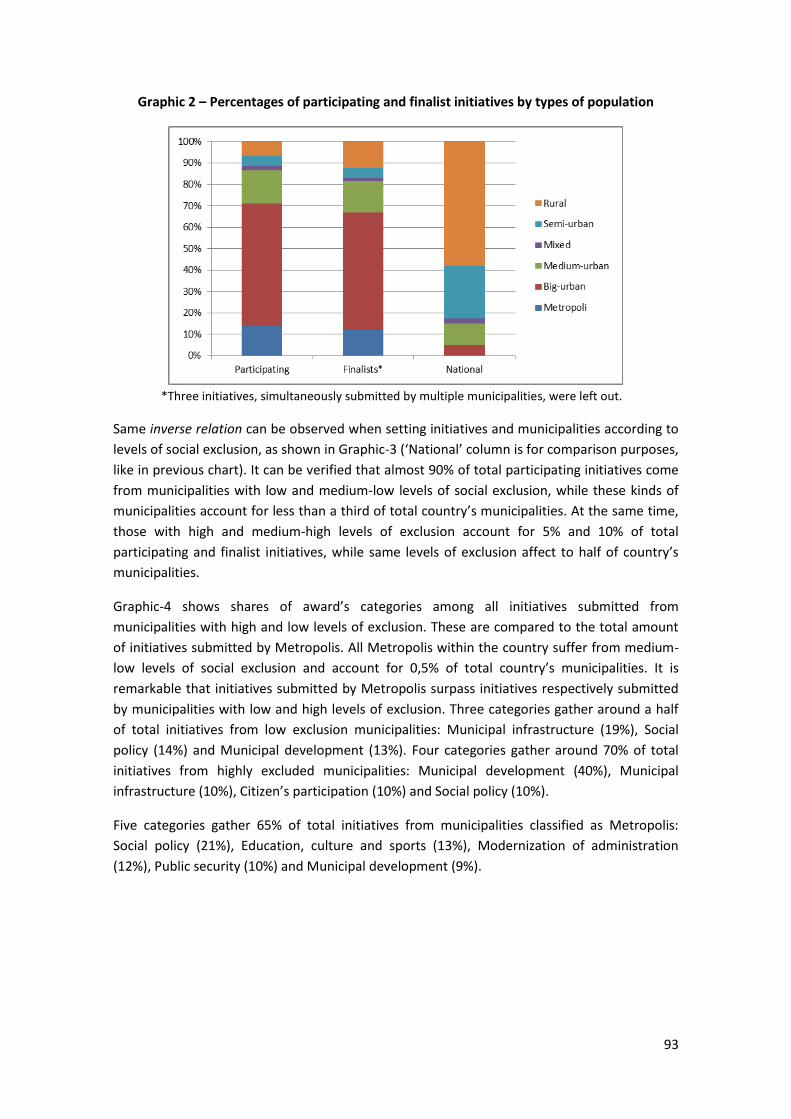
93
Graphic 2 – Percentages of participating and finalist initiatives by types of population
*Three initiatives, simultaneously submitted by multiple municipalities, were left out.
Same inverse relation can be observed when setting initiatives and municipalities according to
levels of social exclusion, as shown in Graphic-3 (‘National’ column is for comparison purposes,
like in previous chart). It can be verified that almost 90% of total participating initiatives come
from municipalities with low and medium-low levels of social exclusion, while these kinds of
municipalities account for less than a third of total country’s municipalities. At the same time,
those with high and medium-high levels of exclusion account for 5% and 10% of total
participating and finalist initiatives, while same levels of exclusion affect to half of country’s
municipalities.
Graphic-4 shows shares of award’s categories among all initiatives submitted from
municipalities with high and low levels of exclusion. These are compared to the total amount
of initiatives submitted by Metropolis. All Metropolis within the country suffer from medium-
low levels of social exclusion and account for 0,5% of total country’s municipalities. It is
remarkable that initiatives submitted by Metropolis surpass initiatives respectively submitted
by municipalities with low and high levels of exclusion. Three categories gather around a half
of total initiatives from low exclusion municipalities: Municipal infrastructure (19%), Social
policy (14%) and Municipal development (13%). Four categories gather around 70% of total
initiatives from highly excluded municipalities: Municipal development (40%), Municipal
infrastructure (10%), Citizen’s participation (10%) and Social policy (10%).
Five categories gather 65% of total initiatives from municipalities classified as Metropolis:
Social policy (21%), Education, culture and sports (13%), Modernization of administration
(12%), Public security (10%) and Municipal development (9%).
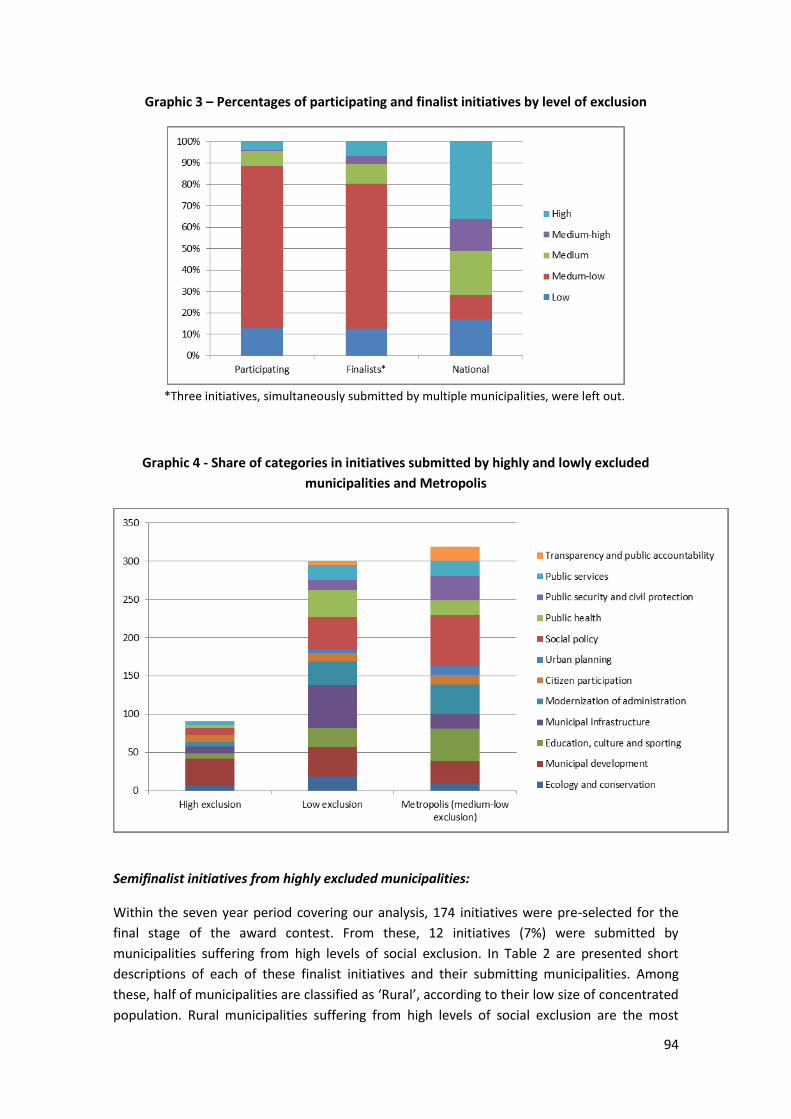
94
Graphic 3 – Percentages of participating and finalist initiatives by level of exclusion
*Three initiatives, simultaneously submitted by multiple municipalities, were left out.
Graphic 4 - Share of categories in initiatives submitted by highly and lowly excluded
municipalities and Metropolis
Semifinalist initiatives from highly excluded municipalities:
Within the seven year period covering our analysis, 174 initiatives were pre-selected for the
final stage of the award contest. From these, 12 initiatives (7%) were submitted by
municipalities suffering from high levels of social exclusion. In Table 2 are presented short
descriptions of each of these finalist initiatives and their submitting municipalities. Among
these, half of municipalities are classified as ‘Rural’, according to their low size of concentrated
population. Rural municipalities suffering from high levels of social exclusion are the most

95
frequent within the country (28% from total number of country’s municipalities). As seen
before, highly excluded rural municipalities are shortly represented among award’s total
participating and finalist initiatives.
Table 2. Semifinalist initiatives from highly excluded municipalities
State Municipality Population Type Initiative short description Award
category
Oaxaca Santiago Comaltepec
1386 RU
Child music band. It was created to preserve traditional music and to breed values into child. Instruments were bought thanks to collaboration in funding from other public instances.
Education, culture and sports
Oaxaca Santiago Yosondúa
7197 RU
New ecological nature park. The project was started by a civil association and sponsored by municipal government. Citizen assemblies and funds from higher government instances took part in the development process.
Municipal development
Jalisco Cabo Corrientes
9034 RU
New eco-tourism attractions. Implementation of new touring routes and attractions. It includes training for local producers, promoting local tourism and restoring public spaces.
Municipal development
San Luis Potosí
Matlapa 29548 RU
Actions for reducing death in birth labor. Actions are focused in diagnosis, information workshops and legal counseling.
Public health
Michoacán Chilchota 30299 SU
Education program for indigenous people. It includes building classrooms and new school spaces and buying new materials. State government participates in literacy activities and it was also created a 'municipal commission for education'.
Education, culture and sports
Michoacán La Huacana 31774 RU
Municipal development strategy. It suggests and implements actions for introducing sustainability in all local government functions.
Municipal development
Michoacán Huetamo 41239 MU
Program of economic incentives. Gives counseling and financial aid to the main economic activities of the region.
Municipal development

96
Yucatán Tizimín 69553 MU
Delivery of basic public infrastructure. Financial resources from a Federal fund were taken to deliver basic public infrastructure to an area with high social exclusion.
Social policy
Chiapas Cintalapa 73668 MU
Transparent public accountability program. Promotes access to information through a web page and a TV cast and also allows for participation of citizens in planning development and investment programs.
Transparency and public accountability
México San José del Rincón
79945 RU
Civilian recruitment for policy functions. Neighbors in communities with greatly dispersed population are enrolled to help in policy functions.
Public security and civil protection
Chiapas Villaflores (1)
93023 MI
Municipal development planning. Design of the plan for development and investment was carried through collective participation of citizens after a hundred of meetings in many areas of the municipality.
Citizen participation
Chiapas Villaflores (2)
93023 MI
Forest fire prevention program. It is based on improvement of technical and material capabilities and participation of citizens and civil organizations.
Ecology and conservation
RU = Rural, SU = Semi-urban, MI = Mixed, MU = Medium-urban
Finalist initiatives from Matlapa, Chilchota, and San Jose del Rincon are good examples of
implementations addressed to improve citizen’s life conditions along with basic public service
provision, not by its technical design nor by strategic investment, but by creative new ways to
deal with resource scarcity and lack of institutionalism.
Remarkable are cases based on extensive citizen participation for designing and implementing
policies and programs. Initiatives from Santiago Yosondua, Cintalapa and Villaflores (2) put in
practice participation at early stages of implementation or as an instrument for an accountable
application of core initiative actions. Meanwhile, the initiative from Villaflores (1) stands out
from its vast implementation of participation strategies. Only the initiative from Villaflores (2)
mentions collaboration of no-state entities.
Initiatives rarely mention considerable investments or great use of technical and financial
resources in implementation. Nonetheless, in few cases where considerable investments are
needed they are provided by funds from higher levels of governance.
Santiago Comaltepec, Santiago Yosondua and Cabo Corrientes are the smallest municipalities
submitting a finalist initiative; their population size makes them to be classified as ‘Rural’.
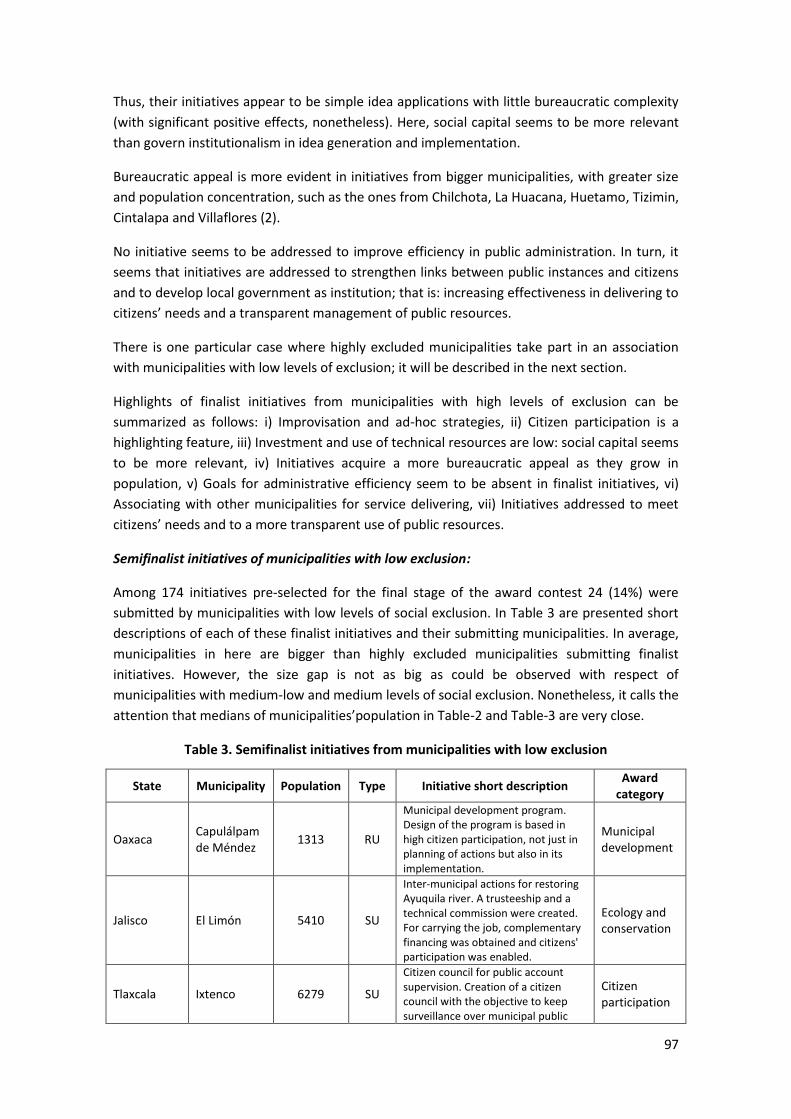
97
Thus, their initiatives appear to be simple idea applications with little bureaucratic complexity
(with significant positive effects, nonetheless). Here, social capital seems to be more relevant
than govern institutionalism in idea generation and implementation.
Bureaucratic appeal is more evident in initiatives from bigger municipalities, with greater size
and population concentration, such as the ones from Chilchota, La Huacana, Huetamo, Tizimin,
Cintalapa and Villaflores (2).
No initiative seems to be addressed to improve efficiency in public administration. In turn, it
seems that initiatives are addressed to strengthen links between public instances and citizens
and to develop local government as institution; that is: increasing effectiveness in delivering to
citizens’ needs and a transparent management of public resources.
There is one particular case where highly excluded municipalities take part in an association
with municipalities with low levels of exclusion; it will be described in the next section.
Highlights of finalist initiatives from municipalities with high levels of exclusion can be
summarized as follows: i) Improvisation and ad-hoc strategies, ii) Citizen participation is a
highlighting feature, iii) Investment and use of technical resources are low: social capital seems
to be more relevant, iv) Initiatives acquire a more bureaucratic appeal as they grow in
population, v) Goals for administrative efficiency seem to be absent in finalist initiatives, vi)
Associating with other municipalities for service delivering, vii) Initiatives addressed to meet
citizens’ needs and to a more transparent use of public resources.
Semifinalist initiatives of municipalities with low exclusion:
Among 174 initiatives pre-selected for the final stage of the award contest 24 (14%) were
submitted by municipalities with low levels of social exclusion. In Table 3 are presented short
descriptions of each of these finalist initiatives and their submitting municipalities. In average,
municipalities in here are bigger than highly excluded municipalities submitting finalist
initiatives. However, the size gap is not as big as could be observed with respect of
municipalities with medium-low and medium levels of social exclusion. Nonetheless, it calls the
attention that medians of municipalities’population in Table-2 and Table-3 are very close.
Table 3. Semifinalist initiatives from municipalities with low exclusion
State Municipality Population Type Initiative short description Award
category
Oaxaca Capulálpam de Méndez
1313 RU
Municipal development program. Design of the program is based in high citizen participation, not just in planning of actions but also in its implementation.
Municipal development
Jalisco El Limón 5410 SU
Inter-municipal actions for restoring Ayuquila river. A trusteeship and a technical commission were created. For carrying the job, complementary financing was obtained and citizens' participation was enabled.
Ecology and conservation
Tlaxcala Ixtenco 6279 SU
Citizen council for public account supervision. Creation of a citizen council with the objective to keep surveillance over municipal public
Citizen participation

98
accountancies.
México Tonatico 10901 SU
Keeping links with emigrated people. Actions addressed to help emigrated people to stay linked to their community. Some other public organizations took part.
Municipal development
Tlaxcala Panotla 22368 SU
Recondition public spaces for sport practice. Financial resources from the three levels of governance were taken to enable spaces to be used for sport practicing.
Municipal infrastructure
Jalisco Ixtlahuacán de los Membrillos
23420 RU
Increasing revenues in real property taxes. A program of incentives for tax payers was implemented. It helped to overcome a situation where tax revenues were inferior to costs of collecting property taxes.
Modernization of administration
Guanajuato Jaral del Progreso (1)
31780 MU Scholarships program. Sponsoring education through scholarships.
Education, culture and sports
Guanajuato Jaral del Progreso (2)
31780 MU
Citizen access. Opening access to citizenry by enabling special modules for attention and giving information on municipality's tasks.
Jalisco Tuxpan 32462 MU
Inter-municipal development plan. Design of the plan was coordinated between municipalities. It included participation of local producers and civil organizations. Links to universities and technology transfer is a remarkable part of the plan.
Municipal development
Jalisco Tamazula de Gordiano
35987 MI Broadcasting council sessions. A TV channel was created for broadcasting sessions of the municipal council.
Municipal development
Guerrero Pungarabato 36466 MU
Inter-municipal actions for development. Include various actions framed by a whole development program: urban waste management, delivering basic services, sponsoring entrepreneurial projects.
Municipal development
Zacatecas Ojocaliente 37545 MU
Hepatitis prevention program. Program includes latrines installation, information rounds and medical analysis and diagnosis.
Public health
Coahuila de Zaragoza
Parras 44715 MU Enabling delegations to help communication between scattered communities and municipality head.
Modernization of administration
Jalisco Zapotlanejo (1)
55827 MU
Urban development program. Building and restoring urban facilities. It includes participation of the three levels of governance and also private organizations and universities.
Urban planning
Jalisco Zapotlanejo (2)
55827 MU
Integral health program. It includes itinerant health services, prevention campaigns, building and restoring clinics and sponsoring eye surgeries.
Public health

99
Veracruz Coatepec 79787 MU Forest and water conservation. Creation of a trusteeship for forest and water conservation purposes.
Ecology and conservation
Guerrero Iguala de la Independen-cia
128444 UG
Inter-municipal urban waste management. It emerged in the context of an already existent association of municipalities. Being in an association has allowed obtaining funds from higher levels of governance.
Municipal infrastructure
Hidalgo Tulancingo de Bravo
129935 MU
Paths for no-motor mobility. Setting of paths to help mobility among communities by means of no-motor vehicles.
Municipal infrastructure
Sonora Navojoa 144598 BU Actions for restoring the Mayo river. Implementing actions to solve river deterioration
Ecology and conservation
Veracruz Córdoba 186623 BU Restoring the urban area known as "Alameda Murillo Vidal"
Municipal infrastructure
Quintana Roo
Othón P. Blanco
219763 BU
Construction of community area. Financial resources from a Federal fund were taken to build and recondition a community urban area.
Urban planning
Puebla Tehuacán 260923 BU
New 'Intra-family violence attention center'. Creation of a center for aiding and counseling people that suffers from family violence.
Social policy
Michoacán Uruapan 279229 BU
New 'Council for municipal development'. A council was created with people representing territories of the municipality. Its purpose is to join citizen participation into planning of infrastructure building.
Municipal infrastructure
Guerrero Acapulco de Juárez
717766 BU Childs' municipal council. New council that meets regularly for ruling on childhood issues.
Citizen participation
RU = Rural, SU = Semi-urban, MI = Mixed, MU = Medium-urban, BU = Big-urban
Implementation of initiatives from municipalities with low exclusion looks more complex in
management and proceedings (they have a more bureaucratic appeal). This is more or less
observable among all initiatives, but especially evident in initiatives such as the ones from El
Limon, Ixtlahuacan de los Membrillos, Tuxpan, Pungarabato and Tehuacan.
Initiatives demanding citizens’ participation are also common here. Initiatives from Ixtenco,
Uruapan and Acapulco de Juarez incorporate participation into the formal organization of the
local government. Collaboration of no-state entities is rare. They are mentioned taking part in
initiatives from Tuxpan and Zapotlanejo (1).
The use of technical and financial resources is more evident in finalist initiatives from
municipalities with low exclusion, like those from El Limon, Panotla, Jaral del Progreso (1),
Tuxpan, Ojocaliente and Navojoa. Also, from initiatives that go through widening public
infrastructure, one could deducepublic expense is bigger in initiatives from lowly excluded
municipalities. Initiatives from Panotla, Zapotlanejo (1), Cordoba and Othon P. Blanco are good
examples of it.

100
Initiatives based in unions of municipalities are frequent. Some of these are made up for
services provision, particularly urban waste management. Award’s contesting allows
municipalities to submit initiatives that are implemented together with other municipalities, as
did by El Limon, Tuxpan, Pungarabato and Iguala de la Independencia. However, municipalities
associated in the implementation of an initiative are allowed to submit and contest
simultaneously. There are two finalist initiatives with significant presence of municipalities
with low exclusion (see Table 4). Noticeably, in one of them appear highly excluded
municipalities taking part.
Overall, initiatives seem addressed to strengthen local government institution (through
promoting transparency and participation) and to improve citizens’ living quality. Initiatives
addressed to improve efficiency or promote modernization of public instances are not
specially highlighted. Certainly, one could think of municipalities associating for service
delivering (waste management, in particular) as driven by management efficiency.
Nevertheless, the initiative from Ixtlahuacan de los Membrillos is the only one that features
the spirit of an efficient public administration (as it is subscribed to the ‘Modernization of
administration’ category). This one of a kind among all finalist initiatives from low and highly
excluded municipalities.
Table 4. Semifinalist initiatives from jointly municipalities’ submissions
State Municipalities Exclusion Type Initiative Category
Jalisco
Concepción de Buenos Aires, Santa María del Oro, La Manzanilla de la Paz, Mazamitla, Quitupan, Tizapan el Alto, Tuxcueca, Valle de Juárez
L, H, L, L, H, L, L, L
SU, RU, RU, SU, RU, SU, SU,SU
Inter-municipal urban waste management
Public services
Mexico
Amecameca, Atlautla, Ayapango, Cocotitlán, Chalco, Ecatzingo, Ixtapaluca, Juchitepec, Ozumba, Temamatla, Tenango del Aire, Tepetlixpa, Tlalmanalco, Valle ChalcoSolidadridad
L, L, L, ML, L, M, ML, L, L, L, L, L, ML, ML
MU, SU, RU, SU, BU, SU, BU, SU, MU, SU, SU, SU, MI, BU
Municipal association for development
Municipal development
L = Low, ML = Medium-low, M = Medium, H = High, RU = Rural, SU = Semi-urban, MI = Mixed, MU = Medium-urban; BU = Big-urban
Highlights of finalist initiatives from municipalities with low levels of exclusion can be
summarized as follows: i) Initiatives look more complex in management and proceedings (they
have a more bureaucratic appeal), ii) Citizens’ participation is incorporated into formal
government organization, iii) Investment and use of technical resources are higher than in
highly excluded municipalities’ initiatives, iv) Unions of municipalities are frequent, v)
Initiatives are mostly addressed to enhance effectiveness in meeting citizens’ needs and to
pursue legitimation; however, efficiency goals are also featured, to a lesser extent.
4. Discussion
Statistics show very low participation rates of initiatives from highly excluded rural
municipalities. On the other hand, initiatives from big urban centers – typically with medium-
101
low or low levels of exclusion – they show an extensive participation. This is opposed to the
proportion that these kinds of municipalities represent among the total number of
municipalities within the country. Suitable reasons for this to be the case might come from
bias in award’s promotion of participation, lack of municipalities’ interest for taking part in the
contest (together with lack of awareness), or that this actually is an indicator of capabilities
and un-capabilities of Mexican local governments. Borins (2001, 2006) makes his analysis
basing on information from the Innovations in American Government Awards22: a contest with
a format very similar to that of the Government and Local Management Award. Borins (2008,
p. 4) says about information from the American Government Award: “Because the awards
program casts its net so widely and generates so much interest, we can be confident that its
pool of applicants represents the range of trends in innovation in government”. Having Borins
argument as reference, if we assume that what can be read from the Local Management
Award is a true image of local governments at national level, one could then interpret the
small participation rates of highly excluded rural municipalities as evidence of their low
capacity for generating novel and significant government actions, while large participation
rates of big urban centers might on the contrary be evidencing a larger capacity.
When grouping initiatives by characteristics of submitting municipalities, it can be observed
different tendencies in award’s categories where initiatives are subscribed. Social policy and
Municipal development are among most frequent categories. This point to the importance of
local government actions addressed to give attention to vulnerable population and to
supplement backwardness of citizens’ life conditions. On the other hand, categories more
related with local government institutional appeal, such as Transparency and public
accountability and Urban planning, they are less frequent.
It is remarkable that more than a third of initiatives from highly excluded municipalities are in
the Municipal development category. In turn, the most frequent category among initiatives
from municipalities with low exclusion is Municipal infrastructure, while initiatives from
metropolis give some importance to categories that are less relevant among other kinds of
municipalities, such as Education, culture and sporting and Modernization of administration.
This gives support to believe that municipalities with low social exclusion (presumably, more
institutionally developed) and metropolis (with larger financial capacity and more complex
organizations) they have partially overcome the pre-bureaucratic stage that hinders the
application of novel, sustainable and significant governance initiatives.
In general terms, initiatives encompass to a certain degree the previously described settings of
Mexican local governments counteracting efficient-effective administrations’ performance. To
this respect, the 2011 executive report of the award remarks: Our municipalities tend to high
rotation in civil servants’ positions, to give little or no continuity to the work of previous
administrations and to start every new governance period with new personnel and new
organization models… The challenge of our local governments is to lead to good results in short
time and with scarce resources. This is embedded in reviewed initiatives, where sidestepping
and ad-hoc design are still noticeable. However, those initiatives submitted by municipalities
with low levels of social exclusion appeal governmental organizations with greater institutional
22 http://www.ash.harvard.edu/Home/Programs/Innovations-in-Government/Awards

102
strength: perhaps a consequence from greater social development. Initiatives that formally
incorporate citizens’ participation into government organization, higher levels of expense and
use of technical resources and certain efficiency pursuing features give evidenced in that
direction.
In municipalities with high levels of exclusion weakness of the local governance institution (in
what is been called the pre-bureaucratic stage) is more tangible. However, the profile of their
finalist initiatives show some interesting characteristics that suggest innovative initiatives can
be a way to enhance local government capability and, in the long run, allow for sustainable
improvement through innovation. High levels of citizens’ participation, use of social capital,
aim for development and association with municipalities with better capabilities give evidence
in that direction.
Initiatives from municipalities with low and high levels of exclusion have in common the aim
for pursuing actions whose results lead to develop life conditions and government legitimacy,
while actions towards a more efficient administration are rare in municipalities with low
exclusion and inexistent in highly excluded municipalities. Here we might have additional
evidence on the dichotomy between efficiency and legitimation. As it can be seen, legitimation
is much more appealed in reviewed initiatives, which lead to believe that strengthening local
government institution is still much needed among Mexican municipalities and it is still a
fundamental objective. It is a requirement for a more efficient public administration, which
allows for sustainable higher leveled innovation.
5. Concluding remarks
Organizations responsible for public administration in developing countries suffer from lack of
legitimacy and institutional weakness. In the particular case of Mexican local government,
where lack is more tangible than in higher levels of governance, institutional weakness lead to
public administrations performing in discretional ways. Lacks in regulation, continuation and
systematization of activities lead to innovation as a policy strategy: innovation is a
consequence of a groping and sidestepping management style. Thus, in most part, innovation
in Mexican local governments does not appear as a virtuous process that brings improvement
and technical enhancement, but as a process that encompasses inefficiency, backwardness
and under use of public resources in its way to achieve some results.
An innovative implementation needs an institutional frame that allow for its systematization
and continuity (i.e. solid institutions and strong regulations). Thus, for innovation to be
successful in improvement it is necessary that public organizations previously went through a
process in a way somewhat opposed to that of innovation: strengthening hierarchies and
authority, processes and regulations, in such a way that they let for well-defined and
established operations that can go over organizational changes due to changes in
administration after elections (and such that it helps to moderate the dynamics of change).
Hence, the paradigm of efficiency and improvement found in innovation require overcoming
the pre-bureaucratic stage of public institutions, where excessive flexibility and lack of
regulation make “innovation” the usual mean to operate. This situation leads to inefficient

103
results and scarce chances to develop improvements. However, in so called pre-bureaucratic
institutions innovation can be of special value and lead to sustainable efficiency and
development when it is addressed to institutional strengthening. That is to say, when creative
initiatives and search for alternative ways generate sustainable processes and help to more
solid institutions.
Observation of initiatives taking part in the Government and Local Management Award gives
evidence to believe that Mexican municipalities with low levels of social exclusion (presumably
with higher institutional development) have more appropriate institutional characteristics for
successfully implementing innovation as a tool for public service improvement. And, on the
contrary, poorly developed Mexican municipalities find more difficulties to achieve
improvement and development through innovation. Observation of initiatives also yields an
important conclusion: Innovation can be of special benefit for poorly developed municipalities
when it is addressed to strengthen the institutional founding of local governments.

104
Concluding remarks

105
Public innovation studies have gained relevance over the last years. There is already an
important bulk of literature laying the basis for a systematic knowledge about the issue. Public
innovation studies are approached from diverse theoretical perspectives. These include the
organizational perspective, the policy perspective, the managerial perspective and also some
well-known theoretical traditions, such as innovation theory and service industry theory.
At the same time, the observation of the innovation process (from idea generation to
implementation) is focused in view of the different actors intervening in the innovation
process, how ideas are generated and how the process is leaded. To this respect, the top-down
approach put emphasis in the hierarchical nature of public organizations by suggesting that
innovation processes start in the form of authority mandates and goes down in the hierarchic
structure to its implementation by middle-level managers and staff. In turn, the bottom-up
approach sees innovation started by staff employees, whose ideas are supported by middle-
level managers and approved by authorities for its implementation. These two approaches are
good to illustrate on the one side the importance of hierarchy, authority and policy goals and,
on the other side, the importance of staff participation, entrepreneurship and involvement of
organizations’ managers.
Both approaches described above are in line with a particular way to understand the
objectives and activities of public sector organizations: Traditional Public Administration,
where activities and goals are oriented by policy decisions and organizations are highly
hierarchical (bureaucratic) resting on legal rational authority and oriented towards procedures.
However a more recent understanding that can be observed in studies on public sector
organizations sees their operations in the form of networks, which makes public beneficiaries
and suppliers (citizens and private organizations in either case) to also play an important role
in the innovation process, from idea generation to implementation.
Thus, it ca be observed diverse sets of factors influencing and enabling innovation generation
as well as diverse agents intervening in the process and diverse approaches helping the
understanding of innovation. This diversity obeys to a wide conceptualization of public
innovation, as explained in the introductory part of the dissertation.
The theoretical foundation of research carried in this thesis dissertation corresponds to the
many approaches previously described. Applied empirical methodologies use a simplified and
compact framing that gathers together concepts and ideas from the many perspectives found
in studies addressed to public innovation. Thus, along with the applied aim under empirical
research methods, there was also the aim to help to a more consolidated theory of public
innovation (public innovation theory is still on an early stage (Alves, 2013)). Chapters follow a
structure where a theoretical frame is build up in first place and then an empirical method is
implemented in order to test some hypotheses addressed by provided frameworks. The
applied methodologies and theoretical propositions (hypotheses) are set up in order to give
answer to questionings about public innovation drivers and enablers, the barriers that
implementing organizations have to face and the kinds of effects that can be obtained after
implementation.

106
Chapters 1 and 2: Drivers and enablers for public innovation
Drivers and enablers of innovation are of different nature and affect public innovation in
different ways and in different phases of the innovation process. It is of interest to know to
which extent the many identifiable drivers and enablers can positively help a successful
innovation process, until innovation implementation. Data available for testing for such a
questioning comes from a large scale survey funded by the European Commission: The
Innobarometer 2010 Survey. It contains information on public organizations implementing
innovations, from the 27 members of the European Union and also Norway and Switzerland.
Information content in the Innobarometer Survey (that is, what can be known about public
innovation from the survey) is what determines in an important manner the hypotheses
suggested after innovation drivers and enablers and also the empirical modeling helping for
testing hypotheses. In particular, the survey does not give information about how the
innovation process takes place in every of the surveyed organizations, but it lets to know
public organizations that succeeded in innovation implementation. Thus, hypotheses on
drivers and enablers refer to how these affects to innovation implementation. They might play
different roles in innovation development; however, this cannot be addressed in the empirical
modeling and the extent to which drivers and enablers can positively affect public innovation is
evaluated by the assessment of a statistical relation between identifiable factors driving and
enabling public innovation and the fact that public organizations have achieved innovation
implementation. In addition, another important aspect that defines the empirical analysis is
that it is focused in the observation of service innovations in particular, given that these are
the kind of innovations better observable in Innobarometer data.
Chapter 1 is specially addressed to the assessment of the effects of drivers and enablers on the
implementation of service innovations. It is there first presented a summary of factors
frequently mentioned in previous literature as relevant for public innovation. From a policy
perspective, policy mandates are of special relevance for generating and implementing
innovation. New laws and regulations, policy turn-around, responses to crisis from authorities
and elected representatives, new trends in public administration; all these are good examples
of political factors that can work as an important source for public innovation. From a
managerial perspective, involvement of managers is considered to be highly relevant for a
successful innovation process. Thus managers are expected to not just command provide with
their own ideas, but to support ideas from staff employees for their development and further
implementation, and also to take part in the development process with supervision and
advice. On the other side, a networked view of public administration suggests that citizens and
private organizations (private firms and civil organizations) should also play a relevant role in
innovation development, given that their interactions with public organizations as
beneficiaries and suppliers is an important input for the development process. Public
innovation studies also mention some strategies that are important to observe for helping to
achieve more and better innovations. These include rewarding innovative behaviour, taking
advantage of experiences and information sources outside the organization, making alliances
and networks with other organizations and allowing experimentation and evaluation.
Hypotheses are addressed to test the importance that public innovation drivers and enablers
have towards implementation of service innovations:

107
H1: Political and legislative factors are a significant driver for implementing public service
innovations.
H2: Drivers and enablers that imply active involvement of mangers are significant for
implementing public service innovations.
H3: Application of enabling strategies has a significant effect in the implementation of public
service innovations.
It is very clear that hypothesis are addressed to the observation of service innovations;
however, the empirical analysis carried for hypothesis testing puts particular interest in the
observation of implementation of services that are new to the whole public sector. There are
two reasons for analyzing new services – which are service innovations in straight sense –
apart from other kinds of service innovations. First one is a methodological reason; this,
following the structure of the Innobarometer Survey questionnaire, where respondents are
first asked whether or not they have recently implemented any service innovation and after
they give an affirmative answer they are asked if at least one of their service innovations
consists in a service which is new to whole country’s public sector. Second reason is
theoretical. It is believed that services that are new to the whole sector are closer to the
understanding of innovation as a paradigm for development, in a similar way that radical
innovations are understood in innovation theory. Special interest in observing this type of
innovations is because they help to observe how innovation is not just improving one
organization in particular, but the whole public sector instead.
The followed method for testing hypotheses consists in estimating the probabilities of being
identified as an organization implementing new services among organizations previously
identified as implementing service innovations. To do so, a bivariate probit regression with
sample selection (also known as Heckman’s probit) is applied. Explicative variables for
probability estimation are the result of a process of component extraction from 18 ordinal
variables in the Innobarometer Survey dataset indicating the level of importance that
respondents give to drivers and strategies for innovation in the innovation development
process. Resulting components are four and they are interpreted as representing the
importance of: Political and legislative factors, Active involvement of managers, Use of
external sources of information and Participation of users and staff. In addition to probability
estimation, marginal effects were also calculated from estimated equations in order to
measure changes in probability from “unitary” changes in components representing drivers
and enablers.
Statistical significance and magnitude of results in probability estimation and marginal effects
support propositions from second and third hypotheses: active involvement of managers and
the application of enabling strategies both are significant for the implementation of service
innovations. Results are not significant enough when it comes to the effects of political and
legislative factors. These might be considered somewhat important for the implementation of
service innovations, but results do not let to evaluate their importance for introducing new
services because of lack of statistical significance. This finding strongly calls the attention given
that literature frequently mentions political factors as particularly important for generating
public innovation. With respect to third hypothesis, Innobarometer data and component
108
extraction have let to analyze two strategies in particular: the use of external sources of
information and user and staff participation. Both of them show high and significant effects on
both the probability of being an organization implementing service innovations and the
probability of being an organization introducing services that are new to the whole sector.
Nonetheless, the effect of use of external sources of information is remarkable, and even
higher than active involvement of managers.
Additional contributions in this chapter are in the methodological field. The component
extraction method applied on the Innobarometer variables is known as Categorical Principal
Component Analysis (CATPCA). It is based on a variable transformation technique called
optimal quantification, which transform ordinal variables into interval scaled variables. This is a
more appropriate component extraction method for ordinal variables than conventional
component analysis. There are references to previous publications that use PCA on ordinal
variables with acceptable results (some examples are mentioned in Arundel and Hollanders,
2011); however, there are not known references to empirical analysis in the approached
research fields that use CATPCA. Another methodological contribution is in the application of a
bootstrapping process on component extraction. This is an instrument addressed to prove
data stability and, therefore, to give robustness to resulting extracted components and the
empirical analysis in general.
Chapter 2 continues in the line of deepen the understanding of factors that enable more and
better innovations within public organizations. Research questions in this chapter are aimed by
one particular finding in previous chapter: the one that points at the use of external sources of
information as a highly relevant enabler for service innovation and introduction of services
that are new to the whole sector as well. Theoretical antecedents and the networked view of
the public sector suggest that there might be an important role for using external sources of
knowledge and information in public innovation.
Studying the implications of using external sources is a growing trend in innovation literature;
however, this has been mainly developed in studies based on manufacturing and service
industry firms. To this respect, one of the key contributions of chapter 2 is in the theoretical
side and it consists in the adaptation of revised theoretical frames in private firm studies to a
frame that takes into consideration fundamental specificities of public organizations. Testing
patterns of use of external sources among public organizations has not the same implications
than it does for the manufacturing sector or even for the private services sector. However, it is
a useful model for advancing in understanding public innovation. Thus, in chapter 2 is offered a
comparative view between revised conceptual frames on innovation from manufacturing
business studies, service business studies and public organizations. Differences observed are
taken as a basis form proposing a new way to understand organizational boundaries; a new
way that corresponds to the specifities of innovation in public organizations. The interesting
value added of proposed boundaries understanding is in the identification of three different
ways of sources creating knowledge flows for public administrations: internal driven, external
driven and mixed (combined) innovations. What establish the differences between them is not
so much the type of actors participating in the knowledge and information flows, but the
directions these flows are formed.

109
Proposed theoretical framework is empirically tested under two hypotheses:
H1: Use of external sources of information in innovation development has a significant effect in
the implementation of services that are new to the whole public sector.
H2: Use of external sources of information for innovation development has a greater effect on
introduction of services that are new to the whole public sector than using internal sources.
Both research hypotheses are addressed to the observation of new-to-the-whole-sector
services. Like in previous chapter, this is aimed by the Innobarometer Survey questionnaire
structure and a classification of public organizations used in reporting survey results.
Classification is made focusing on organizations’ service innovations, while not making any
remark on this matter from their innovations in processes and organizational and
communication methods. Furthermore, studying public organizations as they approach to
introduce innovations to the whole sector might help to identify to which extent the use of
internal and external sources of information contribute to innovation performance in public
sector.
Hypotheses testing follows a method similar to that applied in chapter one. Ordinal variables
about the use of information sources are taken from Innobarometer Survey data and a
component extraction process (CATPCA) is applied on them, giving a two component solution.
These two components respectively represent the importance of using internal and external
information sources in innovation development. Afterwards, a bivariate probit estimation with
sample selection is used for estimating probabilities that organizations might be identified as
introducing services that are new to the whole sector; this following the structure of the
survey questionnaire. Probability estimations are complemented with calculation of marginal
effects.
Statistical significance and magnitude of results in probability estimation and marginal effects
support propositions from both hypotheses above. Estimation results show that use of internal
sources has a significant effect over organizations implementing service innovations, but not
over organizations implementing services that are new to the whole sector. In turn, use of
external sources is a significant aspect for organizations introducing services new to the public
sector. At the same time, results of marginal effects show differences in the impacts over the
probability of implementing services new-to-the-whole-sector from the use of external and
internal sources of information. This evidence helps to conclude that the use of external
sources of information has a significant effect in the implementation of services that are new
to the whole public sector and that it has a stronger effect on the introduction of services that
are new the whole sector than using internal sources.
Applied empirical method has led to other relevant findings in this chapter. One that deserves
particular attention is given by control variables about organizations’ size and area of
responsibility, used in estimations. Results on them suggest that, even though empirical
evidence still gives reasons to believe that the bulk of public innovation takes place in bigger
organizations, the effect of using external sources of information on the likelihood to introduce
services new-to-the-whole-sector might be of greater value for smaller organizations.

110
Chapters 3: Innovation’s barriers and effects
After chapters 1 and 2 – addressed to theoretical understanding and empirical test of public
innovation drivers and enablers, chapter 3 takes on the issue of public innovation effects.
Research in this chapter has as a purpose to support assumptions about the power of public
sector innovations for achieving some positive effects along with the risk of suffering some
negative effects. Public sector’s high risk aversion is named as one of the main barriers for
innovation development. Innovation is often understood as a normative good; something that
in essence brings improvement. Thus, there is frequently the case that policy
recommendations suggest applying strategies that helps to overcome risk aversion. However,
innovation is a costly process because of failure and waste during development process and
after implementation. Uncertainty implied in innovation brings to implementing organizations
high risk for waste and failure. Risk aversion is due to public accountability; therefore, it
becomes necessary to know not only about what can innovation be good for public
organizations but also about the bad consequences for public accountability from taking on
innovation.
Theoretical antecedents and assumptions on the issue of public accountability and risk and
improvement in public innovation have led to three research hypotheses:
H1: Chances of getting certain positive effects and risk of suffering certain negative effects
differ depending on whether organizations have implemented services that are new to the
whole public sector.
H2: Organizations which have introduced services new to the whole sector bear higher risk of
suffering negative effects.
H3: Organizations which have introduced services new to the whole sector have greater chance
of obtaining positive effects.
Hypotheses’ testing once again relies on European data from the Innobarometer 2010 Survey.
Questionnaire asks respondents about effects they might have experienced after innovation
implementation. The set of variables helping the empirical analysis is drawn from responses to
those questions. The analysis method consists in estimating probabilities on the set of
variables about positive and negative effects, using Heckman’s probit estimation models.
Heckman’s probit regressions estimate the probability that organizations implementing service
innovations might experience certain positive and negative effects, from the fact that they
have (or have not) recently implemented a service which is new to the whole public sector.
Like in previously applied methodologies, estimation results are complemented with
calculation of marginal effects.
Estimations show that variables explaining probabilities of experiencing the listed positive
effects are not always statistically significant. The variable that indicates implementation of
new services appears to be relevant in explaining only two of the listed positive effects.
Looking at the marginal effects, it can be seen that the impact of the variable on the estimated
probabilities is modest. In turn, estimation results of negative effects show the leading

111
innovator variable to be significant and positive in every case; nonetheless, marginal effects
show that impacts of the observed variable over probabilities of negative effects are yet short.
Empirical results are useful for supporting the idea expressed in first hypothesis: that
probability of getting certain positive and negative effects from innovation implementation
significantly differs depending on whether public organizations have implemented services
that are new for all the public sector. On the other hand, the extent to which results can
support second and third hypotheses requires a further discussion.
Second and third research hypotheses imply that risk of suffering negative effects will be
higher for organizations introducing services new to the whole sector than for organizations
which have only implemented service improvements or new services previously implemented
by another public organization, while chance of getting positive effects will be greater for
those organizations introducing services new for the whole public sector. Results of the
experiment suggest that workforce taking part in innovation development is more relevant to
explain probability of positive effects. However, since introducing new services has also shown
a significant effect, there are still reasons for expecting better results after implementation
due to innovations’ newness. On the other hand, results do not show the association
previously found between innovation negative effects and organizations’ workforce capability.
Therefore, it is believed that negative effects from innovation certainly are a consequence of
novelty implied in public organizations’ implemented innovations.
Results from the applied experiment are helpful to illustrate why public organizations fear
novel solutions and the reason behind risk avoidance counteracting the levels of public sector
innovation. Indeed, novelty is a central aspect of innovation, but novelty is not enough for
achieving expected improvement. Novelty is useful in creating opportunities, but opportunities
must be worked out, which demands organization and employee abilities in order to realize
improvement opportunities. In turn, novelty also brings an amount of risk that will always be
jeopardizing results of innovation and causing waste, especially when novelty is greater.
Therefore, does it make sense to encourage a rising of public sector innovation? The texts of
Potts (2009) and Brown and Osborne (2013) explain avoidance of innovation’s risk under the
necessity of keeping public accountability. But, they also suggest that principles of public
accountability should not be taken as far to restraint the also necessary changes to go with
changing society and demands for public services. In particular, Potts suggest that levels of
public innovation and experimentation should at least keep pace with changes in economy and
society.
Chapter 4: Public innovation and developing economies
Using different data, different method of analysis and different theoretical approach, chapter 4
looks somewhat apart from the continuity of previous chapters. However, it shares the same
objectives about deepen knowledge on enablers of public innovation and assessing the results
of innovation implementation, as explained in the introductory part of this thesis dissertation.
Research carried in this chapter is nevertheless guided by a very particular objective: to
question and give some evidence on the extent to which findings in public innovation studies
holds for public administrations in developing economies.

112
Public innovation literature is largely based in situations and applications in the context of
developed countries. Studies highlight the need for more flexible public organizations that
allow for experimentation, waste and failure and bureaucratization is frequently mentioned as
an obstacle for the innovation process. This kind of observations recall highly regulated
organizations with strong hierarchies. On the other hand, policy studies focused on public
administration in developing economies describe a public sector where policy follows
discretional criteria, government use public administration as a political tool, levels of
governance are articulated by negotiation between local and central powers, there is a lack of
instruments for public accountability and technical guidance is missed in policy planning and
evaluation. High levels of regulation and bureaucratization are not the same observable in
administrations from developing regions and, therefore, it could be the case that the
understanding of processes enabling public innovation might show particular features in
organizations where weakness of public institutions might place more barriers to successful
implementations.
The analysis method applied for approaching to the question expressed above is based on
information from Mexican local government administrations. Thus, a second objective
addressing the analysis is to comprehend what makes sustainable innovation in under-
developed public administrations at the local level of Mexican government.
Research method is based in case-study analysis of finalist and semifinalist initiatives
participating in the contest entitled “Local Government and Management Award”, between
years 2005 and 2011. This contest awards initiatives of Mexican local governments with
original design and remarkable positive impact after implementation. These are recently
implemented initiatives and overall addressed to improve attention to citizen needs or to solve
a particular problem. Thus, novelty and significance at unit of implementation are constant
elements in initiatives taking part in the contest. It can be observed different levels of
institutional development among Mexican local administrations, this presumably linked to the
level of economic development (or marginality) in their respective populations. For the
analysis are only selected initiatives from municipalities with the highest and the lowest levels
of economic marginality (according to official social development classification). The purpose
on this comes from the assumption that municipalities at opposite ends of social development
classification are better comparable due to their population and town council size; metropolis
and big urban municipalities – with bigger budgets and more complex councils – they are
found in middle positions of the classification. Case-study is complemented with descriptive
statistics of the total participant local government initiatives, based on demographic
characteristics of the municipalities where they were implemented.
Findings in the observed local government initiatives led to conclude that municipalities with
low levels of social exclusion have more appropriate institutional characteristics for
successfully implementing innovation for public service improvement and poorly developed
Mexican municipalities find more difficulties to achieve improvement and development
through innovation. However, innovation can be of special benefit for poorly developed
municipalities when it is addressed to strengthen the institutional founding of local
governments. In order to achieve durable higher leveled innovations, Mexico’s municipalities
should regress in the classic sense of promotion of innovation; that is: to promote
113
systematization, solid organizational structures and a regulatory framework that allow for
innovation sustainability (see García, 2005). This might be suggested not just for the case of
Mexican municipalities but for all administrations in developing regions.
Conclusion on dissertation
The central idea in this thesis dissertation – presented in first section of the introductory part –
suggests a view of public innovation under a multi-agent framework, in such a way that public
organizations keep a high degree of interaction with other organizations and individuals. This
view should also consider various ways for generating innovative processes, on top of those
processes leaded under a rigid hierarchical structure, and should also consider participation of
those who will benefit from the resulting innovation and from employees at the bottom of
hierarchies. Results and conclusions obtained from empirical analysis in previous four chapters
are helpful for supporting validity of the suggested view. The distinct ways for public
innovation are reflected in the importance for new service implementation found in factors
such as ideas and participation from staff, users and suppliers, and also in support from
authorities and middle-level managers. In addition, it has been also shown how social
participation can play an important role in idea generation and in development and
implementation of innovative initiatives. At the same time, results on the importance of using
external sources of information towards implementing new services support an approach for
public innovation which concedes a significant role to collaboration and participation from
external agents, especially users and suppliers.
Research limitations and caveats
Research carried in this thesis dissertation bears with some limitations due to lack of
theoretical foundation and empirical data. It has frequently been said that – despite there is
already a consistent bulk of studies – public innovation theory is still a recent and developing
issue. It has not been yet developed an adequate theoretical model for explaining public
innovation. Empirical models used for analysis were built under assumptions based on
reviewed literature; nevertheless, they did not has as a purpose to represent a theoretical
model but to find statistical significance in suggested relations between variables representing
some theoretical concepts.
At the same time, there are some other source problems in data that limit validity of empirical
results. Released in 2011, Innobarometer 2010 Survey is still the larger available survey data
source. Data was collected through a questionnaire which asks public organizations’ managers
about what they believe to be important in the development process of innovations in the
organization they represent. Therefore, data from the survey does not represent what is truly
important for public innovation but interviewees’ believes about it (although both things might
coincide). Another limitation due to data comes from the question from which was obtained
the variable identifying organizations that introduced services that are new to the whole public
sector: responses do not make specific whether services which are completely new were
developed by the implementing organization or they were copied from abroad (i.e. they are a
first time implementation within their own country but were not originally developed by the
implementing organization). This last observation suggests a careful interpretation of results
while making concluding statements about effects of innovation drivers and enablers on

114
development of new services. That is the reason why empirical analysis in chapters using
Innobarometer data makes too much emphasis on innovation ‘implementation’.
Implementation is, therefore, interpreted as the culmination of an adequate process of
innovation development.
Further research
There is still much light to shed in researching public innovation. Further research should lead
to refine the boundaries of the concept and provide a more solid theoretical framework, for
which synthesizing previous approaches may be helpful (like in the case of this thesis
dissertation). In particular, it is still needed to converge in a model than can help the analysis.
Results in the present empirical analysis suggest deepening in findings with respect to the
networked view of public innovation. It has been demonstrated the importance of
participation of citizens and private organizations (as both suppliers and beneficiaries) in the
innovation process; thus, it is of special relevance to develop a better understanding of the
role they play. On the other hand, from a policy perspective, importance of political factors for
driving innovation have been properly justified in theory, but the present empirical analysis
was not enough for making and adequate assessment and test of this assumed importance.
Further research should also help to evaluate and define how much of a key element political
factors might be in public innovation development.

115
References

116
Alves, H. (2013). Co-creation and innovation in public services. The Service Industries Journal,
33(7–8), 671 – 682.
Amara, N. & Landry, R. (2005) Sources of information as determinants of novelty of innovation
in manufacturing firms: evidence from the 1999 statistics Canada innovation survey;
Technovation; Vol. 25, Iss: 3, pp. 245-259
Arduini, D., Belotti, F., Denni, M., Giungato, G. & Zanfei, A. (2010) Technology adoption and
innovation in public services the case of e-government in Italy; Information Economics and
Policy; 22:257-275
Arellano, D. (2000): Challenges for the New Public Management in Mexico: Patrimonialism and
Colonial Values. Ciencia Ergo Sum, Vol. 7, No. 2, 112-120
Arellano, D. (2002): Nueva Gestión Pública: ¿el meteorito que mató al dinosaurio? Lecciones
para la reforma administrativa en países como México. Reforma y Democracia, No. 23.
Arundel, A., & Hollanders, H. (2011). A taxonomy of innovation: How do public sector agencies
innovate? Results of the 2010 European Innobarometer survey of public agencies. Pro Inno
Europe, Inno Metrics Report. http://ec.europa.eu/enterprise/policies/innovation/files/psi-
studies/taxonomy-of-innovation-how_en.pdf
Arundel, A.; Hubber, D. (2013): From too little to too much innovation? Issues in measuring
innovation in the public sector. Structural Change and Economic Dynamics, 27, 146-159.
Arzaluz, S. (2013): La institucionalización de la participación ciudadana en municipios
mexicanos: Notas a partir del premio Gobierno y Gestión Local. Gestión y Política Pública, Vol.
22, No. 1, 161-202.
Barras, R. (1990). Interactive innovation in financial and business services: the vanguard of the
service revolution. Research Policy, 19, 215 – 237.
Battisti, G., Gallego, J., Rubalcaba, L., & Windrum, P. (2014). Open innovation in services:
knowledge sources, IPRs and Internationalisation. The Economic of Innovation and New
Technology (forthcoming)
Baumol, W.J. (1966). Macroeconomics of unbalanced growth: The anatomy of urban crisis. The
American Economic Review, 57(3), 415 – 426.
Baumol, W.J. (2004). Four Sources of Innovation and Stimulation of Growth in the Dutch
Economy. In G. Gelauf & L. Klomp (Eds.), Fostering Productivity: Patterns, Determinants and
Policy Implications (pp. 185 – 198).Emerald Group Publishing Limited.
Bhatta, G. (2003) Don’t just do something, stand there! Revisiting the issue of risks in
innovation in the public sector; The Innovation Journal; Peer reviewed articles 05/05/2003
http://www.innovation.cc/scholarly-style/bhatta-risks.pdf
Barras, R. (1990). Interactive innovation in financial and business services: the vanguard of the
service revolution. Research Policy, 19, 215 – 237.
117
Berry, F.S. (1994) Innovation in public management: The adoption of strategic planning; Public
Administration Review; Vol. 54, No. 4, pp. 322-330
Berry, W.D. (ed.) (1993): Understanding regression assumptions. Newbury Park, CA: Sage.
Bloch, C; Bugge, M.M. (2013): Public sector innovation – From theory to measurement.
Structural Change and Economic Dynamics, 27, 133-145.
Bonte, W., & Keilbach, M. (2005). Concubinage or marriage? Informal and formal cooperation
in innovation. International Journal of Industrial Organization, 23, 279 – 302.
Borins, S. (2001). Encouraging innovation in the public sector.Journal of Intellectual Capital,
2(3), 310 – 319.
Borins, S. (2002). Leadership and Innovation in the Public Sector. Leadership and Organization
Development Journal, 23(8), 467 – 476.
Borins, S. (2006). The Challenge of Innovating in Government (2nd Ed.) The IBM Center for the
Business of Government.
Borins, S. (ed.) (2008): Innovations in government: research recognition and replication.
Washington, DC: Brookings Institution Press.
Börzel, T.A. (2011). Networks: Reified metaphor or governance panacea? Public Administration,
89(1), 49 – 63.
Bugge, M.M., Mortensen, P.S., & Bloch, C. (2011). Measuring Public Innovation in Nordic
Countries. NIFU, Report 40/2011. http://www.nifu.no/files/2012/11/NIFUrapport2011-40.pdf
Brown, L. & Osborne S.P. (2013): Risk and Innovation. Towards a framework for risk
governance in public services; Public Management Review; Vol. 15, No. 2, pp. 186-218.
Cabrero, E. (1997): El modelo de la Nueva Gestión Pública frente a los municipios
latinoamericanos: ¿Funcionan las recetas? Management International, Vol. 1, No. 2, 73-80.
Cabrero, E. (2004): Capacidades institucionales en gobiernos sub-nacionales de México ¿Un
obstáculo para la descentralización fiscal? Gestión y Política Pública, Vol. 13, No. 3, 753-784.
Cabrero, E. (2005): Between New Public Management and New Public Governance: The Case of
Mexican Municipalities. International Public Management Review, Vol. 6, Iss. 1, 76-99.
Cassiman, B, & Veugelers, R. (2006). In search of complementarity in innovation strategy:
Internal R&D and external knowledge acquisition. Management Science, 52(1): 68 – 82.
Chesbrough, H. (2003). Open innovation: The new imperative for creating and profiting from
technology. Boston, MA: Harvard Business School Press.
Chesbrough, H. (2011). Open services innovation: Rethinking your business to grow and
compete in a new era. San Francisco, CA: Jossey-Bass

118
Cohen, W.M., & Levinthal, D.A. (1990). Absorptive capacity: a new perspective of learning and
innovation. Administrative Science Quarterly, 35, 128 – 152.
Corrocher, N., Cusmano, L., Morrison, A. (2009) Modes of innovation in knowledge-intensive
business services evidence from Lombardy; Journal of Evolutionary Economics; 19:173-196.
Dahlander, L., & Gann, D.M. (2010). How open is innovation? Research Policy, 39, 699 – 709.
Damanpour, F. & Schneider, M. (2006) Phases of the adoption of innovation in organizations:
Effects of environment, organization and top managers; British Journal of Management; Vol.
17, 215-236
Djellal, F., Francoz, D., Gallouj, C., Gallouj, F., & Jacquin, Y. (2003). Revising the definition of
research and development in the light of the specificities of services. Science and Public Policy,
30(6), 415 – 429.
Dosi, G. (1988). Sources, procedures and microeconomic effects of innovation. Journal of
Economic Literature, 26(3), 1120 – 1171.
Earl, L. (2002) Innovation and Change in the Public Sector: A Seeming Oxymoron; Working
Paper 88F0006XIE No. 01
European Commission (2011) Innobarometer 2010 Analytical Report, Innovation in Public
Administration; Flash Eurobarometer No. 305
http://ec.europa.eu/public_opinion/flash/fl_305_en.pdf
Evangelista, R. (2000). Sectoral patterns of technological change in services. Economics of
Innovation and New Technology, 9, 183 – 221.
Freeman, C. (1995) The ‘National System of Innovation’ in historical perspective; Cambridge
Journal of Economics; 19, 5-24.
Frenz, M., Lambert, R. (2009) Exploring non-technological and mixed modes of innovation
across countries; in OECD, Innovation in Firms: A microeconomic perspective; OECD, Paris.
Gallego, J., Rubalcaba, L., & Suarez, C. (2013). Knowledge for Innovation in Europe: The Role of
external knowledge on firms’ cooperation strategies. Journal of Business Research, 66(10), 2034
– 2041.
Gallouj, F. (1998).Innovating in reverse: services and the reverse product cycle. European
Journal of Innovation Management, 1(3), 123 – 138.
Gallouj, F. (2002).Innovation in services and the attendant old and new myths. The Journal of
Socioeconomics, 31(2), 137 – 154.
Gallouj, F., and Djellal, F. (2011) Handbook of service innovation. Edward Elgar.
Gallouj, F., Rubalcaba, L., & Windrum, P. (2013). Public Private Innovation Networks in
Services. Cheltenham: Edward Elgar.
Gallouj, F., & Weinstein, O. (1997). Innovation in services. Research policy, 26(4), 537 – 556.

119
García, G. (2005): Emergence and sustainability of the innovation process of Mexico’s local
government. Ash Institute for Democratic Government and Innovation.
http://www.innovations.harvard.edu/cache/documents/7933.pdf
Garcia-Goñi, M., Maroto, A.&Rubalcaba, L. (2007) Workers’ motivation in European health
services. Health Policy, Vol 84/2-3: 344-358.
Grimpe, C., & Kaiser, U. (2010). Balancing internal and external knowledge acquisition: The
gains and pains from R&D outsourcing. Journal of Management Studies, 47(8), 1483 – 1509.
Gassman, O. (2006). Opening up the innovation process: Towards an agenda. R&D
Management, 36(3), 223 – 228.
Gassman, O. & Enkel, E. (2004). Towards a theory of open innovation: Three core process
archetypes. https://www.alexandria.unisg.ch/Publikationen/274
Gunday, G., Ulusoy, G., Kilik, K. & Alpkan, L. (2011) Effects of innovation types on firm
performance; International Journal of Production Economics; Vol. 133, Iss. 2, pp. 662-676
Hall, M. & Holt, R. (2008) New Public Management and cultural change: the case of UK public
sector project sponsors as leaders; in Windrum and Koch: Innovation in Public Sector Services:
Entrepreneurship, Creativity and Management; Edward Elgar.
Halvorsen, T., Hauknes, J., Miles, I., &Roste, R. (2005) On the differences between public and
private sector innovation; Publin Report D9.
http://unpan1.un.org/intradoc/groups/public/documents/apcity/unpan046809.pdf
Hartley, J. (2005): Innovation in Governance and Public Services: Past and Present, Public
Money and Management, January 2005, pp. 27-34.
Hess, M. & Adams, D. (2007). Innovation in Public Management: The role and function of
community knowledge. The Innovation Journal: The Public Sector Innovation Journal, 12(1),
Article 2:1-20.
Hipp, C., & Grupp, H. (2005). Innovation in the service sector: the demand for service-specific
innovation measurement concepts and typologies. Research Policy, 34(4), 517 – 535.
von Hippel, E. (1988). The sources of innovation. New York: Oxford University Press.
Howells, J. (2000): Services and systems of innovation. In B. Andersen, J. Howells., R. Hull, I.
Hollenstein, H. (2003) Innovation modes in the Swiss service sector: a cluster analysis based on
firm level data; Research Policy; 32:845-863.
Hughes, A., Moore, K. &Kataria, M. (2011) Innovation in Public Sector Organisations, A pilot
survey for measuring innovation across the public sector; NESTA, Index Report: March 2011.
Jensen, M.B., Johnson, B., Lorenz, B., Lundval, B.A. (2007) Forms of knowledge and modes of
innovation; Research Policy; 36:680-693.

120
de Jong, J.P.G.& Marsili, O. (2006) The fruit flies of innovations: A taxonomy of innovative small
firms; Research Policy; 35:213-229.
Koch, P., & Hauknes, J. (2005). On innovation in the public sector. PUBLIN Report D20.
http://survey.nifu.no/step/publin/reports/d20-innovation.pdf
Klein, P.; McGahan, A.; Pitelis, C.; Mahoney, J.T. (2009): Toward a Theory of Public
Entrepreneurship. European Management Review. Available at SSRN:
http://ssrn.com/abstract=1351494 or http://dx.doi.org/10.2139/ssrn.1351494
Knell, M., & Srholec, M. (2010) The novelty of innovation and the level of development; paper
for the Biannual conference of the European Association for Comparative Economic Studies,
August 26-28, Tartu, Estonia.
Langergaard, L., &Scheuer, D. (2009). Specificities of public sector service innovation.
ServPPInReport D2.1
http://www.servppin.com/uploadFiles/ServPPIN_papers/Files_WP2/Specificities%20of%20pub
lic%20sector%20service%20innovation.pdf
Laursen K., & Salter, A. (2006). Open for innovation: the role of openness in explaining
innovation performance among UK manufacturing firms. Strategic Management Journal, 27,
131 – 150.
Linting, M.(2007) Nonparametric inference in nonlinear principal components analysis:
Exploration and beyond; Data Theory Group, Department of Education, Faculty of Social and
Behavioural Sciences, Leiden University.
Linting, M., Meulman, J.J., Groenen, P.J.F., & van der Kooij, A.J. (2007a). Nonlinear principal
components analysis: Introduction and application. Psychological Methods, 12(3), 336 – 358.
Linting, M., Meulman, J.J., Groenen, P.J.F. & van der Kooij, A.J. (2007b) Stability of nonlinear
principal components analysis: An empirical study using the balanced bootstrap; Psychological
Methods; Vol. 12(3), 359-379.
McAdam, R. & Donaghy, J. (1999) Business process re-engineering in the public sector;
Business Process Management Journal; Vol. 5, No. 1, pp. 33-49
Manning, N. (2001): The legacy of the New Public Management in Developing Countries.
International Review of Administrative Sciences, Vol. 67, 297-312.
Matthews, M., Lewis, C. & Cook, G. (2009). Public Sector Innovation: A Review of the Literature.
Supplement to the ANAO’s Better Practice Guide: Innovation in the Public Sector: Enabling
Better Performance, Driving New Directions; Australian National Audit Office.
Maroto, A. (2011). Productivity growth and cyclical behavior in service industries: the Spanish
case. Services Industries Journal, 31(5), 725 – 745.
Maroto, A. & Rubalcaba, L. (2008) Structure, size and reform of the public sector in Europe; in
Windrum and Koch: Innovation in Public Sector Services: Entrepreneurship, Creativity and
Management; Edward Elgar.

121
Maroto, A., & Rubalcaba, L. (2008). Service Productivity Revisited. The Service Industries
Journal, 28(3), 337 – 353.
Maroto, A., & Rubalcaba, L. (2012). The Role of R&D in Shaping Public Sector Typologies: An
European Perspective. Modern Economy, 3(7), 873 – 883.
di Meglio, G., Maroto, A., Stare, M., & Rubalcaba, L. (2013). Public services in the enlarged EU:
An assessment of performance and efficiency. Environment and Planning C. (forthcoming).
Metcalfe, J.S. (1994). The economics of evolution and the economics of technology policy.
Economic Journal, 104, 931 – 944.
Meulman, J. J., Heiser,W. J., & SPSS. (1999). SPSS Categories 10.0. Chicago: SPSS.
Meulman, J.J., Van der Kooij, A. J. &Heiser, W. J. (2004) Principal components analysis with
nonlinear optimal scaling transformations for ordinal and nominal data; in D. Kaplan:
Handbook of quantitativemethodology for the social sciences; London: Sage Publications.
Miles, I. (2007): Research and Development (R&D) beyond manufacturing: The strange case of
services R&D. R&D Management, 37(3), 249 – 268.
Miles & J. Roberts (Eds.), Knowledge and innovation in the new service economy (pp. 215 –
228), Cheltenham: Edward Elgar.
Miles, I., & Tether, B. (2003). Innovation in the Service Economy. IPTS Report No 71, pp. 45 – 51.
Miozzo, M, & Soete, L. (2001): Internationalization of services: A technological perspective.
Technological Forecasting and Social Change, 67(4), 159 – 185.
Nelson, R.R., & Winter, S. (1982). An Evolutionary Theory of Economic Change. Cambridge, MA:
Harvard University Press.
Nelson, R.R. (1993) National Innovation Systems: a comparative analysis; New York, NY: Oxford
University Press
OECD (Organisation for Economic Co-operation and Development) (2005), Oslo Manual:
Guidelines for Collecting and Interpreting Innovation Data. OECD, Paris.
Recascino, L. (2002) Public management reform: competing drivers of change; Public
Administration Review; Vol. 62, No. 5, pp. 555-567.
Roste, R. (2005) Studies of Innovation in the Public Sector, a Theoretical Framework; PUBLIN
Report D16.
Rubalcaba, L., Michel, S., Sundbo, J., Brown, S.W. &Reynoso, J. (2012) Shaping, organizing, and
rethinking service innovation: a multidimensional framework, Journal of Service Management,
Vol. 23 Iss: 5, pp.696 – 715.
Rubalcaba, L., Windrum, P., Gallouj, F., di Meglio, G., Pyka, A., Sundbo, J. &Webber, M. (2011)
The contribution of public and private services to European growth and welfare, and the role
of public-private innovation networks. ServPPIN Final Report. ServPPIN Working Papers.

122
Saviotti, P.P. & Metcalfe, J.S. (1984) a theoretical approach to the construction of technological
output indicators. Research policy; 13, 141 – 151-
Sellenthin, M.O. & Hommen, L. (2002) How innovative is Swedish industry? A factor and cluster
analysis of CIS 2. International Review of Applied Economics; 16: 319-331
Sirilli, G. & Evangelista, R. (1998) Technological innovation in services and manufacturing:
results from Italian surveys; Research Policy; Vol. 27, Iss: 9, pp. 881-899
Vigoda-Gadot, E., Shoham, A., Schwabsky, N. & Ruvio, A. (2005) Public sector innovation for
the managerial and the post-managerial era: Promises and realities in a globalizing public
administration; International Public Management Journal; Vol. 8, No.1, pp. 57-81.
Windrum, P. (2008) Innovation and entrepreneurship in public service; in Windrum and Koch:
Innovation in Public Sector Services: Entrepreneurship, Creativity and Management; Edward
Elgar.
Windrum, P. and Koch, P. (2008) Innovation in Public Sector Services: Entrepreneurship,
creativity and management. Edited by, Edward Elgar
Osborne, S.P., & Brown, L. (2011). Innovation, Public Policy and Public Services Delivery in the
UK: The Word that Would Be King? Public Administration, 89:4 pp 1335–50.
Osborne, S.P., & Brown, L. (2013). Innovation in public services. In S.P. Osborne & L. Brown
(Eds.), Handbook of innovation in public services (pp. 1 – 14), Cheltenham: Edward Elgar.
Pisano, G. (1990). The R&D boundaries of the firm: An empirical analysis. Administrative
Science Quarterly, 35, 153–176.
Potts, J. (2009). The innovation deficit in public services: The curious problem of too much
efficiency and not enough waste and failure. Innovation: Management, Policy & Practice, 11(1),
34 – 43.
Porter, M.E., & Stern, S. (2001). Innovation: Location matters. Sloan Management Review,
42(4), 28 – 36.
Recascino, L. (2002). Public management reform: competing drivers of change. Public
Administration Review, 62(5), 555 – 567.
Rigby, D., & Zook, C. (2002). Open-market innovation. Harvard Business Review, 80(10), 80 –
89.
Rosenbusch, N., Brinckmann, J. & Bausch, A. (2011) Is innovation always beneficial? A meta-
analysis of the relationship between innovation and performance in SMEs; Journal of Business
Venturing; Vol. 26, Iss. 4, pp. 441-457
Roste, R. (2005). Studies of Innovation in the Public Sector, a Theoretical Framework. PUBLIN
Report D16. http://survey.nifu.no/step/publin/reports/d16litteraturesurvey.pdf

123
Rubalcaba, L. (2006). Which policy for innovation in services? Science and Public Policy, 33(10),
745 – 756.
Rubalcaba, L. (2007). The New Service Economy: Challenges and Policy implications for Europe.
Cheltenham: Edward Elgar.
Rubalcaba, L., Michel, L., Sundbo, J., Brown, S.W., & Reynoso, J. (2012). Shaping, organizing,
and rethinking service innovation: a multidimensional framework. Journal of Service
Management,23(5), 696 – 715.
Sakkab, N.Y. (2002). Connect and develop complements research and develop at P&G.
Research-Technology Management, 45(2), 38 – 45.
Samaratunge, R; Bennington, L. (2002): New Public Management: Challenge for Sri Lanka. Asian
Journal of Public Administration, Vol. 24, No. 1, 87-109.
Santamaria, L., Nieto, M.J., & Barge-Gil, A. (2009). Beyond formal R&D: Taking advantage of
other sources of innovation in low – and medium – technology industries. Research policy,
38(3), 507 – 518.
Sofka, W., & Grimpe, C. (2010). Specialized search and innovation performance – evidence
across Europe. R&D Management, 40(3), 310 – 323.
Tether, B. S. (2005). Do services innovate (differently)? Insights from the European
Innobarometer Survey. Industry& Innovation, 12(2), 153 – 184.
Veugelers, R. (1997). Internal R&D expenditures and external technology sourcing. Research
Policy, 26(3), 303 – 316.
Vigoda-Gadot, E., Shoham, A., Schwabsky, N., & Ruvio, A. (2005). Public sector innovation for
the managerial and the post-managerial era: Promises and realities in a globalizing public
administration. International Public Management Journal, 8(1), 57 – 81.
Vigoda-Gadot, E., Shoham, A., Schwabsky, N., & Ruvio, A. (2008). Public sector innovation for
Europe: A multinational eight country exploration of citizens’ perspectives. Public
Administration, 86(2), 307 – 329.
West, M. A. & Farr, J. L. (1990). Innovation and Creativity at Work: Psychological and
Organisational Strategies. Chichester: Wiley.
Windrum, P. (2008). Innovation and entrepreneurship in public service. In P. Windrum & P.
Koch (Eds.), Innovation in Public Sector Services: Entrepreneurship, Creativity and Management
(pp. 3 – 20), Cheltenham: Edward Elgar.
Windrum, P., Battisti, G., Gallego, J., & Rubalcaba, L. (2013). Paradigm Shift? Open Innovation
and the Innovative Performance of EU Firms. In Academy of Management Proceedings (Vol.
2013, No. 1, p. 15296). Academy of Management.
Windrum, P., & Koch, P. (2008). Innovation in Public Sector Services: Entrepreneurship, creativity
and management. Cheltenham: Edward Elgar.

124
Windrum, P. & García-Goñi, M. (2008). A neo-Schumpeterian model of health services
innovation. Research Policy, 37, 649 – 672.
Ziccardi, A. (2004): Globalización, pobreza y democracia participativa. Revista Mexicana de
Sociología, Vol. 66, Número especial (Oct. 2004), 181-196.