programa de doctorado en ingeniería de biosistemas tesis
TRANSCRIPT

universidaddeleón
Departamento de Ingeniería y Ciencias Agrarias
Instituto de Medio Ambiente, Recursos Naturales
y Biodiversidad
León, 2017
Programa de Doctorado en Ingeniería de Biosistemas
Tesis doctoral
Evaluación de Trichoderma spp. en el control
biológico de Rhizoctonia solani y la respuesta
defensiva en plantas de alubia pertenecientes a
la IGP “Alubia La Bañeza-León”
Evaluation of Trichoderma spp. in the biological control of
Rhizoctonia solani and the defensive response in bean plants from
PGI “Alubia La Bañeza-León”
Sara Mayo Prieto

Departamento de Ingeniería y Ciencias Agrarias
Instituto de Medio Ambiente, Recursos Naturales y Biodiversidad
Evaluación de Trichoderma spp. en el control biológico de Rhizoctonia solani y la respuesta defensiva en plantas de alubia pertenecientes a la IGP “Alubia La Bañeza-León”
Evaluation of Trichoderma spp. in the biological control of Rhizoctonia solani and the defensive response in bean plants from PGI “Alubia La Bañeza-
León”
Tesis doctoral
Memoria presentada para optar al título de
Doctor en Ingeniería de Biosistemas
Presenta:
Sara Mayo Prieto
Directores:
Dr. Pedro Antonio Casquero Luelmo
Dr. Santiago Gutiérrez Martín
León, 2017
universidad deleón


Esta memoria ha sido realizada gracias a la beca concedida (FPU12/00677) por el
Ministerio de Educación, Cultura y Deporte (España) de acuerdo a la Resolución del 25 de
abril de 2012 (BOE de 22 de mayo) y la Resolución del 20 de diciembre de 2012 y por la
beca de movilidad para la realización de estancias breves con Resolución del 9 de
diciembre de 2014 (BOE de 22 de diciembre). También al Ministerio de Economía y
Competitividad por el proyecto nacional de “Farnesol as self-regulatory molecule in
Trichoderma. Tyrosol and farnesol Signaling in Trichoderma-Bean interaction” (AGL2012-
40041-C02-02). Y a la Junta de Castilla y León, Consejería de Educación por el proyecto
“Effect of terpenes and physiologically related compounds produced by Trichoderma
parareesei in the development of common bean (Phaseolus vulgaris L.) and in defensive
responses of this plant”. Además, a la Universidad de León por la beca proporcionada
para la realización de una estancia breve de acuerdo al programa de “Ayuda a bolsas y
estancias cortas 2014”.


A mi familia, en especial a mis padres
porque sin ellos no sería lo que soy hoy

Agradecimientos
Quisiera empezar agradeciendo a mis tutores Pedro Casquero y Santiago
Gutiérrez por haberme dado la oportunidad de hacer un doctorado, por
vuestra infinita paciencia, por hacerme ver la luz al final del túnel en
momentos que ni siquiera sabía que estaba en uno y por enseñarme muchas
más cosas de lo que está escrito en esta tesis.
A Piedad Campelo y Alicia Lorenzana, porque sin vuestro trabajo previo no
habría ni siquiera podido iniciarlo y por mostrarme el apoyo y la ayuda
incondicional en todo este tiempo. Al Laboratorio de Diagnóstico de Plagas
y Enfermedades de la Universidad de León, en especial a Mari Fe Marcos, por
tu ayuda indispensable en la determinación de aislamientos y sobre todo
por haberme enseñado tantas cosas del trabajo con fitopatógenos.
A mis compañeros y amigos Óscar González y Álvaro Rodríguez, porque con
vosotros empecé esta aventura y sin vosotros, esto no hubiera sido igual (no
lo cambiaría por nada), porque he vivido experiencias que siempre llevaré
grabadas. Desireé Rodríguez y Julia García, por ayudarme a desconectar y
estar siempre dispuestas a echar un cable. También quiero agradecer a Paulo
H. da Silva y Guzmán Carro, que, aunque llegasteis un poco después, me
habéis ayudado mucho y habéis hecho que los días de trabajo duro no lo
fueran tanto. Al igual que a Víctor Suárez y Samuel Álvarez que trajisteis aire
fresco al laboratorio, a veces tan necesario.
A Mónica G. Malmierca por ensañarme todo lo que sabes a cerca de la
extracción de RNA y DNA y hacer que fuera mucho más sencillo de lo que
parecía.
Vorrei anche ringraziare i miei colleghi di Milano. Grazie a Francesca
Sparvoli per avermi accolta presso il tuo laboratorio e avermi trattata al pari
di tutti gli altri. A Eleonora Cominelli, per avermi insegnato tutto di qPCR e
per la tua infinita pazienza con il mio povero italiano. Ai miei colleghi di
studio, Alessia Losa, Roberto Russo e Remo Chiozzotto, e anche a Roberto
Bollini e Gloria Daminati, per avermi capita nel mio “itagnolo” facendomi
dimenticare che ero in Italia e facendomi sentire come a casa mia in
Spagna. Ai miei colleghi di pranzo, Anna Paola Casazza, Elena Ponzzoni,
Floriana Gabazzi, Luca Braglia, Aldo Grasso per avermi fatta sentire come
una di voi e avermi aiutata a imparare molte cose in più dell’italiano. A
Antonella Manca, per essere stata a mio fianco quando avevo bisogno di
parlare in spagnolo con qualcuno.
Vorrei anche ringraziare i miei colleghi di Napoli. Grazie a Matteo Lorito e
Sheridan L. Woo, per avermi accolta nel loro laboratorio. A Roberta Marra e
Francesco Vinale per avermi insegnato tutto o quasi tutto sulla
metabolomica e tante altre cose sulla cultura napoletana. A Adriana Saco

per avermi aiutata con il DNA e non solo. A Emanuela Monetti per tutti i
momenti divertenti a tuo fianco ed a Mauro Senatore, Giada D´Errico,
Stefania Lanzuise, Luigi de Vitto, Federica Lacatena, Filomena Grasso,
Roberta Quadro, Roberta Panza, Susy Bottiglieri e Judyta Strakowska per
avermi aiutata a fare più facile il mio soggiorno lì e, soprattutto, per i
momenti indimenticabili a vostro fianco.
A todos los becarios que habéis trabajado conmigo y aportado vuestro grano
de arena en los ensayos y todos me habéis enseñado algo: Julie Zamorano,
Carla Escapa, Mónica Clemente, Juanjo Garrido, Cristian Domínguez, Daniel
Martínez, Jessica Cavalheiro, Erica Losada, Laura Rodríguez, Raquel
Domínguez, Héctor Izquierdo y Alejandra Porteous.
A los técnicos de laboratorio, Javier Quiroga, Elisa Baelo y Ruth Llorente, por
vuestra predisposición a ayudarme en tareas tan tediosas pero necesarias de
muchos ensayos.
A los agricultores por dejarnos entrar en vuestras fincas para tomar
muestras, por vuestro tiempo y disposición para todo lo que se necesitara.
A mis amigas, Verónica Marbán, Mónica Ferrero, Silvia del Cojo, Marcia
Barquero e Iris Marcano por estar tan pendientes de mí y entenderme incluso
aquellas veces en las que ni yo misma me comprendía.
Por encima de todo, quiero dar las gracias a aquellos miembros de mi
familia que día a día estáis a mi lado y siendo mi pilar en los buenos, pero,
sobre todo, en los malos momentos.

Resumen
La alubia o judía grano (Phaseolus vulgaris L.) es la leguminosa de grano, dedicada al consumo humano, más importante a nivel mundial. Se ve afectada por numerosos fitopatógenos siendo Rhizoctonia solani el principal causante de pudrición de raíz en el 91,8 % de las plantas de alubia afectadas por el mal del pie de la judía en la provincia de León. Es importe encontrar una solución que proporcione un control de la misma, garantizando la seguridad alimentaria y ambiental sin mermar la calidad del producto. Conociendo la variabilidad de las enfermedades en los lugares originales y correlacionándola con las variedades locales de alubia se puede proporcionar información útil para controlar una fitopatología usando los propios recursos que el medio proporciona. Es por ello que la selección de un agente de biocontrol como Trichoderma es una opción para el control de dichas enfermedades, que aparece con frecuencia en el suelo, con alto potencial oportunista, simbionte no virulento, con una gran adaptabilidad a diversas condiciones ecológicas y capaz de reducir los efectos negativos de la enfermedad ya que está involucrado en la respuesta defensiva de la planta.
Se ha obtenido 58 aislamientos de Trichoderma spp. procedentes de las zonas de cultivo pertenecientes al sello de calidad IGP “Alubia La Bañeza-León”, de los cuales 23 han sido extraídos de semilla y 35 de muestras de suelo. También se ha trabajado con otros 2 aislamientos que procedían de otros estudios.
Se ha evaluado cada aislamiento en condiciones in vitro para conocer la capacidad de inhibición de cada aislamiento de Trichoderma frente a R. solani mediante estudios de confrontación directa y de actividad antifúngica en membranas. Los porcentajes de inhibición de la mayoría de los aislamientos han variado entre 86 % y 50 %, sin que haya habido diferencias significativas entre los extraídos de semilla y los de suelo.
Posteriormente se ha evaluado una selección de aislamientos de Trichoderma en condiciones invivo, siendo 15 de semilla y 30 de suelo. Se ha observado que existen diferencias significativas en el desarrollo de las plantas de alubia, siendo aquellas que han sido inoculadas con aislamientos extraídos de suelo las que han mostrado mayores dimensiones en todos los parámetros evaluados. Se han seleccionado dos aislamientos, T. harzianum T019 y T. velutinum T028, uno extraído de semilla y otro de suelo respectivamente, para el estudio de la respuesta defensiva en alubia.
Con el aislamiento T. harzianum T019, se ha visto que en la interacción con R. solani se ha inducido la expresión de 7 genes de defensa de la alubia y los niveles de ergosterol y escualeno han sido también elevados lo que puede explicar los posibles efectos en el desarrollo de la planta, así como su respuesta defensiva en presencia del patógeno.
En el caso de T. velutinum T028, se ha observado también una modificación en el nivel de expresión de los genes de defensa estudiados, dando una idea de la forma en la que la planta ha respondido frente a la presencia de R. solani y/o T. velutinum. Además, se ha estudiado la producción de metabolitos por parte de la planta de alubia como respuesta al agente de biocontrol y al patógeno, observándose 36 compuestos que han presentado diferencias significativas respecto al control en presencia de R. solani y/o T. velutinum.


Abstract
The common bean (Phaseolus vulgaris L.) is the most important food legume crop worldwide. It is affected by numerous phytopathogens being Rhizoctonia solani the main cause of root rot in 91.8 % of bean plants affected by a disease in the Province of León. It is important to find a strategy to control this disease, ensuring also the food and environmental safety without compromising the quality of the product. By studying the variability of the disease at a particular place and connecting it with the local varieties of bean, it can provide useful information to control a phytopathology using resources that already exist in the same medium. Then, to select a biocontrol agent (BCA) as Trichoderma would be an option to control these diseases. This BCA is present in the soil, with high opportunistic potential, non-virulent symbiont, with great adaptability to various ecological conditions and can reduce the negative effects of the disease, due to its availity to elicit the plant's defensive response.
There have been extracted 58 isolates of Trichoderma spp. from the cultivated areas of the IGP "Alubia La Bañeza-León". Some 23 isolates were extracted from plant material and 35 from soil samples. Other two isolates from other studies have been also included in this work.
Each Trichoderma isolate was in vitro evaluated to know its inhibition capacity against R. solani using direct confrontation and evaluating the antifungal activity in membranes assays. The percentages of inhibition of most isolates varied among 86 % and 50 %, without significant differences between isolates obtained from plant material or from soil.
Afterwards, some Trichoderma isolates were evaluated in vivo, 15 coming from plant material and 30 from soil. There were significant differences in the development of the bean plants, being the plants inoculated with soil isolates those with the largest dimensions in all evaluated parameters. Two isolates, T. harzianum T019 and T. velutinum T028, from plant material and from soil, respectively, were selected for the study of their effect on the bean defensive response.
With the isolate T. harzianum T019, it was shown that, in interaction of R. solani, the expression of 7 defense genes of bean plants was induced. The level of ergosterol and squalene was also higher than in the control strain, which may explain the possible effects in the development of the plant, as well as its defensive response in the presence of the pathogen.
In the case of T. velutinum T028, the expression of the defense genes analyzed was also modified, giving an explanation of the way by which a bean plant responds to the presence of R. solani and/or T. velutinum. As well as the production of some metabolites by bean plants has been studied inresponse to the biocontrol agent and the pathogen, with 36 compounds showing significantdifferences respect to the control.


Índice general
1. JUSTIFICACIÓN Y OBJETIVOS.................................................................................... 1
2. INTRODUCCIÓN............................................................................................................. 5
3. CAPÍTULO I: Trichoderma species as biocontrol agents in legumes....................... 39
4. CAPÍTULO II: Influence of Rhizoctonia solani and Trichoderma spp. In growth of bean (Phaseolus vulgaris L.) and in the induction of plant defense-related genes......................................................................................................................................... 61
5. CAPÍTULO III: Development of a qPCR strategy to select bean genes involved in plant defence response and regulated by the Trichoderma velutinum - Rhizoctonia solani interaction............................................................................................ 77
6. CAPÍTULO IV: Metabolomic response of bean plants (Phaseolus vulgaris L.) to the presence of Trichoderma velutinum and Rhizoctonia solani.................................. 93
7. RESULTADOS Y DISCUSIÓN GENERALES............................................................. 119
8. CONCLUSIONES/CONCLUSIONS............................................................................. 155
9. ANEXOS.............................................................................................................................. 161

Justificación y
objetivos


3
Justificación y objetivos
Cada vez más el consumo en alimentación está dirigido por aspectos relacionados con la seguridad del producto, salubridad y las características nutricionales del mismo y además que las prácticas productivas permitan conservar los recursos naturales del planeta a largo plazo. La influencia negativa de los productos químicos de síntesis en la salud del trabajador agrícola, del consumidor y en el medio ambiente ha dado lugar al desarrollo de una normativa que antepone la defensa de la salud humana y la protección ambiental a la producción agrícola. Todo ello ha llevado a la eliminación, en los últimos años, de las listas de productos fitosanitarios un buen número de fungicidas que eran empleados por los agricultores en el control de hongos fitopatógenos que provocan graves daños en el cultivo de la alubia. Para ello es fundamental proporcionar un producto ecocompatible para el control de fitopatógenos en el cultivo de la alubia y a medio plazo poder desarrollar fungicidas biológicos eficientes.
El cultivo de la alubia representa en León una importante fuente de ingresos para muchos agricultores, haciendo de esta provincia la principal productora en España. Gracias a la tradición del cultivo cuenta con un sello de calidad, la Indicación Geográfica Protegida (IGP) “Alubia La Bañeza-León”. Con el paso de tiempo se quiere incrementar de modo sostenible el rendimiento y dar un valor añadido a las variedades locales de alubia protegidas bajo este sello, mediante prácticas productivas basadas en el control biológico de hongos con cepas autóctonas de Trichoderma, reduciendo así el empleo de productos fitosanitarios. Este agente de biocontrol es un hongo que está presente en la mayoría de suelos, de rápido crecimiento, simbionte no virulento, lo que hace que sea idóneo para el control de fitopatógenos, como es el caso de Rhizoctonia solani. Este patógeno tiene un amplio abanico de huéspedes entre los que se encuentra la alubia.
Para el desarrollo de esta tesis se propusieron los siguientes objetivos:
1. Recolectar, identificar y caracterizar aislamientos de Trichoderma autóctonos procedentesde campos de cultivo de alubia pertenecientes a la IGP de “La Bañeza-León” procedentestanto de semilla como de muestras de suelo.
2. Evaluar la capacidad de inhibición de cada aislamiento de Trichoderma spp. en eldesarrollo de R. solani en condiciones in vitro, mediante la confrontación directa y laproducción de metabolitos secundarios.
3. Evaluar en condiciones in vivo los aislamientos seleccionados de Trichoderma spp. entrelos que mejor control ejerzan sobre R. solani. Así como determinar los aislamientos que,además de proteger a la alubia frente al fitopatógeno, favorezcan su desarrollo.
4. Estudiar la respuesta defensiva de la alubia en presencia o ausencia de Trichoderma y/o R.
solani mediante el estudio de los genes de defensa, así como de la producción demetabolitos empleando para ello técnicas de qRT-PCR y HPLC-DAD-TOF-MSrespectivamente.


Introducción


Índice introducción
1. ALUBIA, PHASEOLUS VULGARIS L. .................................................................... 9
1.1. Origen, distribución y diversidad ....................................................................................... 9
1.2. Situación actual del cultivo .............................................................................................. 10
1.3. Características botánicas de la alubia ............................................................................... 12
1.4. Incidencia de los hongos en el cultivo de la alubia .......................................................... 14
2. RHIZOCTONIA SOLANI KÜHN ........................................................................... 14
2.1. Taxonomía y morfología del fitopatógeno. ........................................................................ 14
2.2. Diversidad genética de R. solani ........................................................................................ 15
3. CONTROL DE FITOPATÓGENOS EN EL CULTIVO DE LA ALUBIA ....... 19
4. TRICHODERMA SPP. PERSOON, FRIES............................................................ 22
4.1. Taxonomía y morfología de Trichoderma.......................................................................... 22
5. COEVOLUCIÓN ENTRE EL CULTIVO DE LA ALUBIA Y LOS FACTORES
BIÓTICOS Y ABIÓTICOS ........................................................................................... 24
6. INTERACCIONES ENTRE ALUBIA, R. SOLANI Y TRICHODERMA ........ 25
6.1. Interacciones entre R. solani y alubia ................................................................................ 25
6.2. Interacciones entre Trichoderma y alubia .......................................................................... 27
6.3. Interacciones entre R. solani y Trichoderma ...................................................................... 28
6.4. Interaccines entre R. solani, alubia y Trichoderma ............................................................ 29
7. BIBLIOGRAFÍA ........................................................................................................ 31

TABLAS
Tabla 1: Superficie y porcentaje dedicados al cultivo de la alubia en la provincia de León durante el año 2015 (Junta de Castilla y León, 2015). ............................................................................... 12
Tabla 2: Resumen de los distintos grupos y subgrupos de anastomosis reconocidos por aislados de R. solani (González García et al., 2006)........................................................................................ 16
Tabla 3: Ejemplo de productos comerciales a base de agentes de biocontrol. .............................. 20
FIGURAS
Figura 1: Porcentaje de la superficie y de la producción a nivel mundial en el año 2014 (FAO, 2016). ............................................................................................................................................ 10
Figura 2: Superficie y producción de España distribuidas por Comunidades Autónomas (Ministerio de Agricultura Pesca Alimentación y Medio Ambiente, 2016). .................................................... 11
Figura 3: Detalle de la alubia, P. vulgaris L. a) Semilla germinada y detalle de las raíces; b) Hoja trifoliada; c) Fruto en forma de vaina o legumbre; d) Inflorescencia y flor; e) Cotiledones; f) Semillas de la variedad canela. ..................................................................................................... 13
Figura 4: R. solani a) Aislamiento en medio patata-dextrosa-agar; b) Síntomas en una raíz de alubia; c) Hifas vistas al microscopio. .......................................................................................... 15
Figura 5: Ciclo vital de R. solani en el cultivo de la alubia. ......................................................... 18
Figura 6: Trichoderma spp. a) Aislamientos creciendo en medio PDA en el que se aprecian distintas formas de desarrollo; b) Aislamiento que produce una tinción del medio PDA; c) Desarrollo de Trichoderma spp. sobre una semilla de alubia sembrada en sustrato; d) Detalle de los conidióforos vistos al microscopio de un aislamiento de Trichoderma (Imagen tomada de https://www.ars.usda.gov); e) Detalle de las esporas vistas al microscopio de Trichoderma. ....... 23
Figura 7: Respuesta de las plantas al estrés (Tadeo y Gómez-Cadenas, 2008)............................. 25
Figura 8: Efectos de Trichoderma sobre la planta. ....................................................................... 27
Figura 9: Interacciones entre el patógeno R. solani, la planta de alubia, P. vulgaris, y el agente de biocontrol Trichoderma. Las líneas y círculos de color verde son los compuestos, y las acciones que provoca Trichoderma. Las líneas de color rojo son los compuestos y respuestas que causa R. solani. Las líneas y círculos de color morado son los compuestos y las respuestas de la alubia a las actuaciones de ambos hongos (Altomare et al., 1999; Howell, 2003; Rubio et al., 2009; Vargas et al., 2011; Vinale et al., 2008). ................................................................................................... 30

9
Introducción
1. ALUBIA, PHASEOLUS VULGARIS L.
1.1. Origen, distribución y diversidad
La alubia es un cultivo que fue domesticado hace unos 7.000 años en las regiones de los Andes y de Mesoamérica (Méjico y América Central). Existen varias evidencias que demuestran que el ancestro de la alubia común se ha organizado en dos grupos geográficamente aislados y genéticamente diferenciados (mesoamericanos y andinos) que divergieron de una población silvestre ancestral común hace más de 100.000 años (Singh et al., 1991). De esas evidencias se extrae que la domesticación se llevó a cabo en las zonas centroamericana y sudamericana (Bitocchi et al., 2012, 2013; Gepts et al., 1986; Mamidi et al., 2011). En judías silvestres evaluadas, procedentes del Norte de Perú, han mostrado características comunes a las del germoplasma andino y centroamericano, por lo que se piensa que pudiera tratarse del antepasado común de la especie (Debouck et al., 1993; Kami et al., 1995). En lo que hoy es Méjico, la alubia común fue probablemente domesticada con maíz como parte del sistema de cultivo de la “milpa” (alubia común junto maíz y calabaza) (Zizumbo-Villarreal y Colunga-GarcíaMarín, 2010). El proceso de domesticación provocó cambios morfológicos en las judías como son el tamaño de semillas y hojas, cambios en el hábito de crecimiento, las respuestas del fotoperiodo, variación del color (McClean et al., 2002; Singh et al., 1991).
La llegada de la judía a Europa se sabe que fue tras el descubrimiento de América (a partir de 1492). Las que primero fueron introducidas eran las que procedían de la zona de Mesoamérica (tamaño de semilla pequeño-medio >25 g el peso de 100 granos). Posteriormente llegarían los cultivares de las regiones andinas (tamaño de semilla grande >40 g el peso de 100 granos) coincidiendo con la exploración de Perú en 1528. Una vez en el continente europeo, la alubia no tuvo una especial aceptación ya que existía otra especie muy similar, Vigna unguiculata (L.) Walp., comúnmente conocida como alubia de carilla o caupí (Lioi y Piergiovanni, 2013).
Pero no fue hasta 1753 cuando Linnaeus escoge el nombre de Phaseolus para determinar su especie y nombrándola Phaseolus vulgaris L. (Lioi y Piergiovanni, 2013). Se define su taxonomía como:
• Reino: Plantae o División: Magnoliophyta
▪ Clase: Magnoliopsida ▪ Subclase: Rosidae
o Orden: Fabales ▪ Familia: Fabaceae ▪ Subfamilia: Faboideae
• Tribu: Phaseoleae • Subtribu: Phaseolinae
o Género: Phaseolus ▪ Especie: P. vulgaris L.
Durante los siglos XV y XVI, este cultivo fue introducido en España para ser distribuido hacia el resto de Europa como consecuencia del floreciente comercio de este país (Rodiño et al., 2001). En la Península Ibérica se conservan un gran número de variedades locales adaptadas a las características ambientales, variando sus caracteres agronómicos, así como el aprovechamiento
Introducción
10
(Casquero et al., 2005), la forma, tamaño o color del fruto y semilla según la región, provincia o incluso pueblo (Casquero et al., 2006). La Península Ibérica se considera un centro secundario de diversificación del cultivo de la judía (Santalla et al., 2002).
1.2. Situación actual del cultivo
La alubia (P. vulgaris L.) es la leguminosa grano, dedicada al consumo humano, más importante, ya que su cultivo se extiende por todos los continentes y es fuente de proteínas, vitaminas, minerales, fibra y otros compuestos como pueden ser polifenoles que podrían prevenir enfermedades cardiovasculares u obesidad. Estos beneficios para la salud y el medio ambiente, gracias a su asociación con otros microorganismos beneficiosos, han llevado a un renovado interés por su cultivo en países desarrollados, donde consumidores exigentes obligan a los cultivadores a considerar los rasgos culinarios y el valor sensorial, así como buenas prácticas ambientales en el cultivo de las plantas (Rivera et al., 2016).
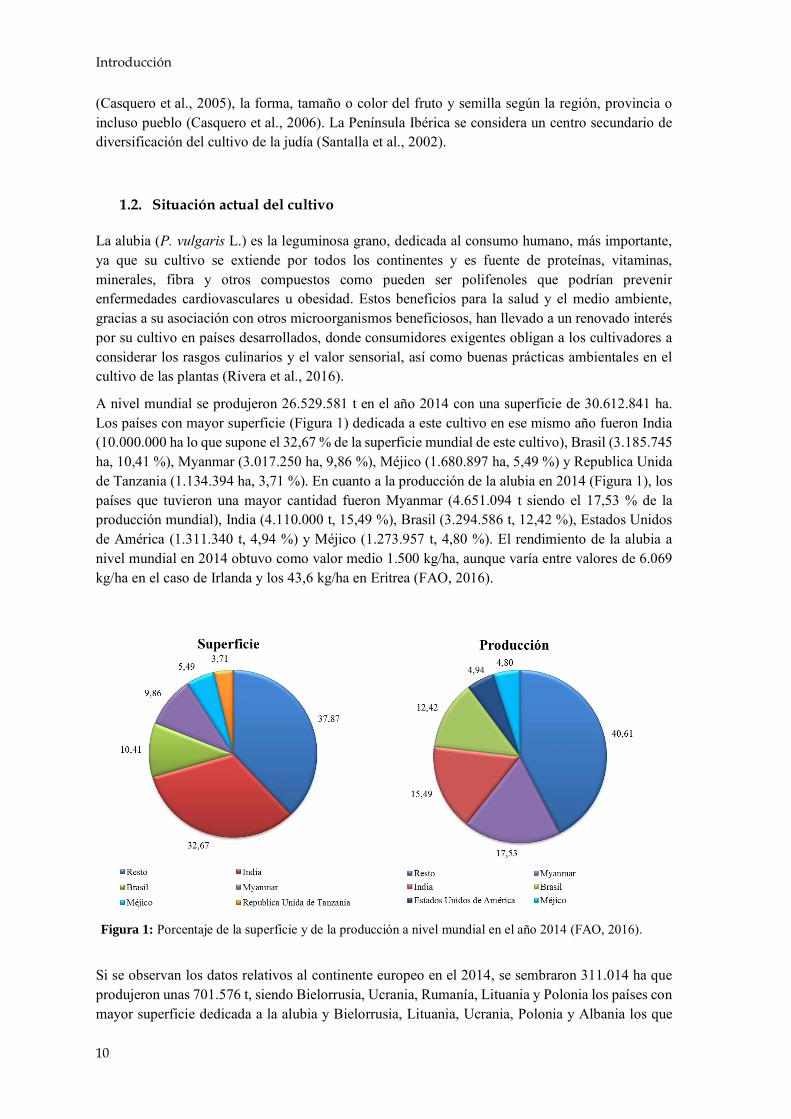
A nivel mundial se produjeron 26.529.581 t en el año 2014 con una superficie de 30.612.841 ha. Los países con mayor superficie (Figura 1) dedicada a este cultivo en ese mismo año fueron India (10.000.000 ha lo que supone el 32,67 % de la superficie mundial de este cultivo), Brasil (3.185.745 ha, 10,41 %), Myanmar (3.017.250 ha, 9,86 %), Méjico (1.680.897 ha, 5,49 %) y Republica Unida de Tanzania (1.134.394 ha, 3,71 %). En cuanto a la producción de la alubia en 2014 (Figura 1), los países que tuvieron una mayor cantidad fueron Myanmar (4.651.094 t siendo el 17,53 % de la producción mundial), India (4.110.000 t, 15,49 %), Brasil (3.294.586 t, 12,42 %), Estados Unidos de América (1.311.340 t, 4,94 %) y Méjico (1.273.957 t, 4,80 %). El rendimiento de la alubia a nivel mundial en 2014 obtuvo como valor medio 1.500 kg/ha, aunque varía entre valores de 6.069 kg/ha en el caso de Irlanda y los 43,6 kg/ha en Eritrea (FAO, 2016).
Si se observan los datos relativos al continente europeo en el 2014, se sembraron 311.014 ha que produjeron unas 701.576 t, siendo Bielorrusia, Ucrania, Rumanía, Lituania y Polonia los países con mayor superficie dedicada a la alubia y Bielorrusia, Lituania, Ucrania, Polonia y Albania los que
Figura 1: Porcentaje de la superficie y de la producción a nivel mundial en el año 2014 (FAO, 2016).

Alubia, Phaseolus vulgaris L.
11
mayor producción obtuvieron (FAO, 2016). Analizando los datos de la Unión Europea, en 2014, la producción media fue de 228.571 t, de los cuales el 27,34 % es producido por Lituania, seguida de Polonia y Letonia (FAO, 2016). España, en 2014, obtuvo una producción de 12.629 t con una superficie de 7.737 ha situándola en el sexto puesto entre los países productores de alubia en la Unión Europea (Ministerio de Agricultura, Pesca, Alimentación y Medio Ambiente, 2016).
En España (Figura 2), se observa que Castilla y León, en 2014, fue la comunidad con la mayor superficie dedicada al cultivo de alubia con 3.094 ha y una producción de 5.073 t, suponiendo el 40% de la producción total de España. A esta comunidad le siguió Galicia con el 34,86 % y Navarra con el 9,56% de la producción nacional (Ministerio de Agricultura, Pesca, Alimentación y Medio Ambiente, 2016).
Dentro de la Comunidad de Castilla y León, León fue la provincia que mayor superficie y producción tuvo en 2014, con 2.440 ha y 3.855 t, suponiendo el 75,97 % de la producción de este cultivo en la comunidad y 30,53 % de España. Le siguió Ávila con un 10,44 % de la producción de
2.08
8
900
32
4 5 0 0 117
7
3.09
4
51 21
8
0 115 43
6 662
8
0
500
1.000
1.500
2.000
2.500
3.000
3.500
Supe
rfici
e (h
a)
4.40
3
650
32
9 4 0 0 109
7
5.07
3
66
232
0 196
1.20
7
635
6
0
1.000
2.000
3.000
4.000
5.000
6.000
Prod
ucci
ón (t
)
Figura 2: Superficie y producción de España distribuidas por Comunidades Autónomas (Ministerio de Agricultura Pesca Alimentación y Medio Ambiente, 2016).

Introducción
12
Castilla y León. El resto de provincias presentaron una producción muy por debajo de las anteriormente mencionadas (Junta de Castilla y León, 2016).
En la provincia de León, la primera noticia que se halla sobre la existencia de la judía común data del Catastro en sus Comprobaciones de 1761 en los pueblos de Priaranza y Tabuyo del Monte. Existe constancia de que en los años '20 se exportaban desde La Bañeza las denominadas "alubias leonesas de riñón" y a lo largo del siglo XX destaca la expansión y establecimiento del cultivo en la comarca de El Páramo (Reinoso, 2001).
Por Orden Ministerial de 6 marzo de 1984 fue reconocida con carácter provisional la denominación específica "Judías de la Bañeza" y en la actualidad existe la Promotora y el Consejo Regulador de la Indicación Geográfica Protegida (I.G.P.) “Alubia de La Bañeza-León” (Orden A.P.A/289/2006; Orden A.Y.G./1254/2005), destinada a promocionar este producto tradicional y a velar por su calidad. La mayor superficie dedicada a este cultivo en 2015 (Tabla 1) en la provincia se encuentra en El Páramo, siguiéndole en orden decreciente de importancia la Bañeza, Esla-Campos, La Maragatería - La Cepeda, Sahagún, Tierras de León y La Cabrera (Junta de Castilla y León, 2015).
Tabla 1: Superficie y porcentaje dedicados al cultivo de la alubia en la provincia de León durante el año 2015 (Junta de Castilla y León, 2015).
Región o comarca Superficie (ha) %
León provincia 3.466* -- Bierzo 0 0,00 La Montaña de Luna 0 0,00 La Montaña de Riaño 0 0,00 La Cabrera 5 0,14 La Maragatería - La Cepeda 172 4,96 Tierras de León 37 1,07 La Bañeza 195 5,63 El Páramo 2.841 81,97 Esla-Campos 177 5,11 Sahagún 39 1,13
*Superficie total de alubia en la provincia de León en 2015
1.3. Características botánicas de la alubia
P. vulgaris L. es una planta herbácea anual perteneciente a la familia Fabaceae o Leguminosae. La germinación es epigea, y requiere 5-7 días para que se lleve a cabo. Presenta una raíz principal con numerosas raíces secundarias, cuya longitud puede variar entre 10 y 30 cm (Graham y Ranalli, 1997) (Figura 3a). Presenta dos cotiledones tras la germinación, los cuales son sustituidos por unas hojas verdaderas a los pocos días (Figura 3e). Las hojas son trifolioladas, con folíolos enteros o lobulados y con estípulas persistentes (Figura 3b).
Pueden tener diferentes hábitos de crecimiento (van Schoonhoven y Pastor-Corrales, 1987):
• Hábito de crecimiento I: porte erguido, tallo y ramas erectas y sin guía. • Hábito de crecimiento II: porte erguido, con un tallo y las ramas erectas, y muchas veces
sin una guía. • Hábito de crecimiento III: hábito de arbusto con tallo débil y numerosas ramas, con una
guía corta o larga y con capacidad para subir.

Alubia, Phaseolus vulgaris L.
13
• Hábito de crecimiento IV: tallo largo y débil y con poca ramificación, posee guías con la capacidad de trepar por un tutor.
Los hábitos I y II tienen un crecimiento determinado, mientras que III y IV presentan un crecimiento indeterminado.
Las flores (Figura 3d) son zigomorfas, es decir, presentan un plano de simetría bilateral, y están dispuestas en racimos axilares insertados en los nudos hinchados, con brácteas persistentes o caducas. La flor, puede presentar una gran variedad cromática y contiene diez estambres y un solo ovario multiovulado, con una fecundación predominantemente autógama, obteniéndose un fruto o vaina recta o ligeramente curvada. La floración se inicia, normalmente entre los 28 y 42 días tras la siembra, aunque puede variar según las características climáticas de la zona. La duración de la floración varía en función de los hábitos de crecimiento: las de hábito determinado, tienen una floración concentrada en un periodo corto de 5-6 días. Sin embargo, las de hábito indeterminado presentan una floración escalonada que duraría entre 15 y 30 días. El fruto es una legumbre o vaina en cuyo interior se localizan de 4 a 8 semillas (Figura 3c) (Graham y Ranalli, 1997).
Figura 3: Detalle de la alubia, P. vulgaris L. a) Semilla germinada y detalle de las raíces; b) Hoja trifoliada; c) Fruto en forma de vaina o legumbre; d) Inflorescencia y flor; e) Cotiledones; f) Semillas de la variedad canela.

Introducción
14
La formación de la semilla puede durar desde los 23 días en las cultivares de crecimiento determinado hasta casi 50 días en las de hábito indeterminado. La madurez fisiológica puede extenderse hasta los 200 días tras la siembra. Las semillas pueden ser redondas, elípticas, algo aplanadas o redondeadas de forma alargada, con una amplia variación de colores (Figura 3f).
1.4. Incidencia de los hongos en el cultivo de la alubia
El cultivo de la alubia se ve afectado por numerosas micosis (American Phytopathological Society, 2005). Se describen varias micosis, entre las que se podrían destacar las siguientes: alternariosis (Alternaria alternata (Fr.) Keissl.), antracnosis (Colletotrichum lindemuthianum (Sacc. & Magnus) Briosi & Cavara), ascochyta (Ascochyta boltshauseri Sacc.), macrophomina (Macrophomina phaseolina (Tassi) Goid), mal del esclerocio (Sclerotium rolfsii Sacc.), mancha angular (Phaeosiriopsis griseola (Sacc.) Ferraris), mildiu velloso (Phytophthora sp Bary), oídio (Oidium balsamii Mont.), phoma (Phoma exigua Sacc.), podredumbre rosa de la vaina (Trichothecium roseum (Pers.) Link.) y roya (Uromyces appendiculatus F. Strauss).
Sin embargo, las que están más generalizadas en los campos leoneses son la fusariosis, causada por Fusarium oxysporum Schlecht. emend. Snyder & Hansen y Fusarium solani (Mart.) Sacc., la podredumbre blanca (Sclerotinia sclerotiorum (Lib.) de Bary,), la podredumbre gris (Botrytis cinerea Pers. Fr.) y la rhizoctoniosis (Rhizoctonia solani Kühn). Las especies patógenas de Fusarium spp., junto con R. solani y Pythium spp., forman el denominado “complejo parasitario del pie de la judía” (Asensio, 1996; Berra y Arteaga, 1989; Tello et al., 1985), causante de la enfermedad conocida como “mal del pie de la judía” que origina daños importantes en la zona de producción de la provincia leonesa. De todos los fitopatógenos citados previamente, R. solani es el principal causante de pudrición de raíz en el 91,8 % de las plantas de alubia afectadas por el “mal del pie de la judía” en la provincia de León (Valenciano et al., 2006b).
2. RHIZOCTONIA SOLANI KÜHN
R. solani es un hongo fitopatógeno que provoca la muerte de las plántulas de numerosas especiescomo algodón, alfalfa, altramuz, arroz, berenjena, cacahuete, cebolla, cítricos, coliflor, fresa,guisante, alubia, maíz, melón, patata, pepino, pimiento, remolacha, soja, tabaco, tomate, trigo,zanahoria y otros, teniendo una distribución mundial ya que se encuentra en todos los sueloscultivables (Ogoshi, 1996).
2.1. Taxonomía y morfología del fitopatógeno
R. solani [teleomorfo: Thanatephorus cucumeris (Frank) Donk] es la especie más importante delgénero Rhizoctonia. Se caracteriza por la formación de micelio (Figura 4a) que no produce esporas,incoloro cuando pasa por su etapa juvenil pero que se torna amarillo o de color café claro conformemadura, y constituido por hifas que tienden a ramificarse en ángulo recto cerca de un tabiqueestrechándose ligeramente a nivel de la bifurcación y con un septo cerca de ella (Agrios, 2002). Lashifas son anchas (5 a 12 µm) con células multinucleadas (2 a 25 núcleos, siendo más común entre4 y 8), carecen de fíbulas o conexiones “clamp” y pueden diferenciarse en cadenas de célulashinchadas (hifas moniliáceas) (Figura 4c). A partir de éstas se pueden formar los esclerocios, con
Rhizoctonia solani Kühn
15
tejido esclerotial sin diferenciar en corteza y médula, de color marrón a negro aplanados en la parte superior y de 1 mm de diámetro (Monte y Suárez, 2010).
El primero en establecer el género Rhizoctonia fue De Candolle (1815), pero no fue hasta 1970 cuando Parmeter y Whitney sentaron las bases de dicho género, las cuales fueron resumidas como la producción de esclerocios en una textura uniforme que está en una asociación con las raíces de las plantas (González García et al., 2006).
La taxonomía de este fitopatógeno es (Index Fungorum, 2017; International Mycological Association, 2016):
• Reino Fungi o División: Basidiomycota
• Subdivisión: Agaricomycotina o Clase: Agaricomycetes
▪ Orden: Cantharellales • Familia: Ceratobasidiaceae
• Género: Rhizoctonia. Su etapa sexual o perfecta corresponde a Thanatephorus
o Especie: R. solani Kühn
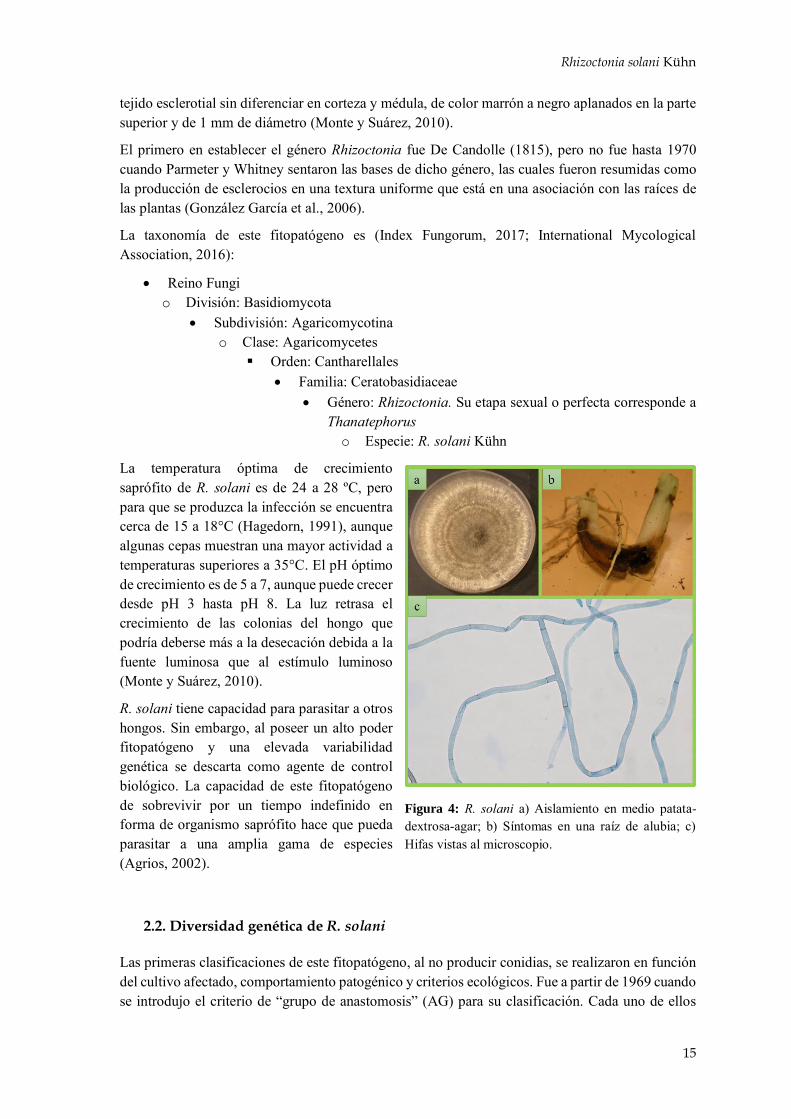
La temperatura óptima de crecimiento saprófito de R. solani es de 24 a 28 ºC, pero para que se produzca la infección se encuentra cerca de 15 a 18°C (Hagedorn, 1991), aunque algunas cepas muestran una mayor actividad a temperaturas superiores a 35°C. El pH óptimo de crecimiento es de 5 a 7, aunque puede crecer desde pH 3 hasta pH 8. La luz retrasa el crecimiento de las colonias del hongo que podría deberse más a la desecación debida a la fuente luminosa que al estímulo luminoso (Monte y Suárez, 2010).
R. solani tiene capacidad para parasitar a otros hongos. Sin embargo, al poseer un alto poder fitopatógeno y una elevada variabilidad genética se descarta como agente de control biológico. La capacidad de este fitopatógeno de sobrevivir por un tiempo indefinido en forma de organismo saprófito hace que pueda parasitar a una amplia gama de especies (Agrios, 2002).
2.2. Diversidad genética de R. solani
Las primeras clasificaciones de este fitopatógeno, al no producir conidias, se realizaron en función del cultivo afectado, comportamiento patogénico y criterios ecológicos. Fue a partir de 1969 cuando se introdujo el criterio de “grupo de anastomosis” (AG) para su clasificación. Cada uno de ellos
Figura 4: R. solani a) Aislamiento en medio patata-dextrosa-agar; b) Síntomas en una raíz de alubia; c) Hifas vistas al microscopio.

16
Introducción
estaría constituido por aislados de hongos que pueden establecer una fusión entre sus hifas al crecer entrelazados en un medio de cultivo, asumiendo que la compatibilidad para esta fusión implicaba una relación genética, mientras que aquellos que se mantuvieran aislados pertenecerían a otro AG (Monte y Suárez, 2010).
En la actualidad se han descrito 14 AG de R. solani (Tabla 2) y han sido clasificados en función de su patogenicidad y su morfología (González García et al., 2006). Se sabe que los AG que afectan al cultivo de la alubia son AG 1 IA y IB, AG 4 y AG 5, pudiendo causar pudriciones tanto en las plántulas, como en hojas, vainas y raíces.
Tabla 2: Resumen de los distintos grupos y subgrupos de anastomosis reconocidos por aislados de R. solani (González García et al., 2006).
Grupo/Subgrupo Cultivos a los que afecta
AG 1 IA Arroz, maíz, sorgo, alubia, soja, césped, plántulas de alcanforero
AG 1 IB Alubia, arroz, soja, leguminosas arbustivas, lechuga, hortensia, repollo o berza
AG 1 IC Trigo sarraceno, zanahoria, soja, lino, pino
AG 2-1 Crucíferas, fresa, tulipán
AG 2-2IIIB Arroz, jengibre, césped, maíz, remolacha azucarera
AG 2-2IV Remolacha azucarera, césped
AG 3 Patata, tabaco, tomate, berenjena
AG 4 (HGI, HGII y HGIII) Tomate, guisante, patata, soja, cebolla, algodón, alubia, plántulas de Pinus taeda
AG 5 Patata, césped, alubia, soja
AG 6 (HG-I y GV) No patogénico
AG 7 Soja
AG 8 Poaceae spp.
AG 9 (TP y TX) Crucíferas, patata
AG 10 No patogénico
AG 11 Trigo
AG 12 Coliflor, rábano
AG 13 No patogénico
AGBI No patogénico

Rhizoctonia solani Kühn
17
2.3. Sintomatología
R. solani ataca en primer lugar a las partes subterráneas de la planta como son las semillas, hipocotilo y sistema radicular, aunque podría afectar a las partes aéreas de la planta como tallos, hojas y frutos.
El síntoma más destacable es la caída de plántulas o “damping-off” (Figura 5) que se caracteriza por la muerte de las semillas sin germinar o por la muerte de las plántulas en pre- o post-emergencia (Figura 4b) (Hagedorn, 1991). En el caso de las semillas, el hongo ataca y origina la muerte del ápice caulinar de crecimiento, mientras que en las plántulas, el ataque se produce en el hipocotilo, volviéndose acuoso, blando e incapaz de sostener a la plántula, la cual se desploma y muere (Monte y Suárez, 2010). Las plántulas maduras también son atacadas por el hongo, limitándose a invadir sus tejidos corticales externos en los que produce lesiones grandes y de color que va de canela a café rojizo. La longitud y anchura de dichas lesiones aumenta hasta que finalmente rodean al tallo y la planta puede morir (Agrios, 2002).
También puede producir pudriciones en las vainas de la alubia y en otros órganos que se encuentren próximos al suelo, siendo más frecuentes en climas húmedos y fríos. Estas lesiones en un principio toman el aspecto de áreas firmes y húmedas, en las que los tejidos en poco tiempo se colapsan y forman un área ligeramente hendida. Cuando el tiempo es húmedo, el micelio aparece sobre las manchas que inicialmente son de color blanco pero que después se tornan a colores más oscuros conforme pasa el tiempo. Los frutos y vainas afectados se tornan a colores marrones y se secan o pueden ser invadidos por otros microrganismos.
La infección de las plantas jóvenes es más severa cuando el crecimiento de la planta es lento, debido a las condiciones ambientales adversas para su desarrollo. Las plantas de crecimiento rápido tienen la posibilidad de escapar a la infección por Rhizoctonia, incluso cuando la humedad y la temperatura sean favorables para el hongo (Agrios, 2002).
2.4. Ciclo vital de R. solani
R. solani puede sobrevivir en el suelo en ausencia de plantas huésped durante periodos de tiempo largos ya que inverna casi siempre en forma de micelio o esclerocios en el suelo, en plantas perennes infectadas o en órganos de propagación (Figura 5). El hongo invade también a otros hospedantes y puede ir en la semilla. Se encuentra presente en la mayoría de los suelos y una vez que se ha establecido en un campo, permanece por tiempo indefinido (Monte y Suárez, 2010).
Cuando las condiciones son favorables, y la planta susceptible de ser infectada está presente, el micelio y/o los esclerocios germinan para colonizar la superficie de su huésped. Después del contacto, el hongo se desarrolla sobre la superficie de la raíz, hipocotilo u otra parte de la planta, ramificándose las hifas para formar estructuras como apresores y cojines de infección que, junto con la producción de enzimas como cutinasas, pectinasas y celulasas, propician la penetración en las plantas y la liberación de sustancias nutritivas para el fitopatógeno favoreciendo así su desarrollo (Figura 5).
Una vez que el hongo ha penetrado, mata las células y coloniza ese tejido muerto, formándose posteriormente los esclerocios. Sobre esta superficie necrosada se formaría un nuevo inóculo de R. solani lo que facilitaría el ataque de nuevas plantas o la supervivencia del patógeno. Se puede trasmitir en el suelo adherido en el calzado, maquinaria agrícola, aperos, vehículo, o bien en el agua de lluvia o de riego (Agrios, 2002).

Intro
du
cción
18
Figura 5: Ciclo vital de R. solani en el cultivo de la alubia.

Control de fitopatógenos en el cultivo de la alubia
19
3. CONTROL DE FITOPATÓGENOS EN EL CULTIVO DE LA ALUBIA
Existen distintas formas de prevenir o curar a una planta cuando ésta ha sido atacada por un fitopatógeno. Se pueden emplear productos de síntesis química, organismos con actividad antagónica, métodos culturales y otros. Debido a la Reforma de la Política Agraria Comunitaria se ha reducido el número de productos fitosanitarios de síntesis química autorizados con el fin de que prevalezca la seguridad alimentaria, así como que sea sostenible a largo plazo. Por ello se propone dar prioridad a los métodos no químicos descritos en producción integrada, cultivos ecológicos, y otros.
Una forma de controlar a los fitopatógenos, como es el caso de R. solani, en la alubia sería aplicando los fungicidas sobre la semilla o directamente al suelo pudiendo ser efectivos sobre los hongos que afectan al cultivo durante la germinación o en un periodo corto después de la misma (Beebe et al., 1991) pues reducen su incidencia (Gupta et al., 1999) y mejoran la emergencia de las plantas (Bordoloi et al., 1998; Valenciano et al., 2004). Sin embargo, las aplicaciones con fungicidas dirigidas a evitar los daños producidos por hongos que causan podredumbres radiculares o amarilleamientos y marchitez suelen ser ineficaces y usualmente impracticables debido al gran volumen de suelo en el que deberían aplicarse.
Otra forma de control de hongos en judía sería la mejora de las condiciones de establecimiento en campo de la alubia, desarrollando y evaluando nuevas técnicas de siembra combinadas con la utilización de pesticidas con el fin de optimizar las condiciones para la emergencia de las plántulas (Valenciano et al., 2006a) y así reducir la dependencia de los fitosanitarios. También hay estudios sobre la eficacia de los fungicidas comerciales para el control del “mal del pie de la judía” en variedades locales de alubia protegidas por la “I.G.P. Alubia de La Bañeza-León” (Campelo et al., 2007).
En España en el año 2014 (Ministerio de Agricultura y Pesca, Alimentación y Medio Ambiente, 2015), de las 38.393 t de fungicidas y bactericidas que se emplearon para el control de enfermedades, el 84,96 % fueron de fungicidas inorgánicos mientras que sólo un 0,04 % fueron biológicos o agentes de control biológico.
Una forma que podría ser sostenible a largo plazo para el control de fitopatógenos en el cultivo de la alubia sería el empleo de agentes de biocontrol u organismos distintos al hombre con capacidad para reducir la población del agente causante de la enfermedad o evitar sus efectos (Hjeljord y Tronsmo, 1998). Dichos agentes se pueden emplear solos o bien junto con dosis reducidas de fungicidas químicos para poder controlar a los patógenos que afecten a la planta y así reducir al mínimo el impacto sobre el medio (Chet y Inbar, 1994; Harman y Kubicek, 1998). Existen formulaciones de agentes biológicos formados por bacterias, como Agrobacterium, Pseudomonas, Streptomyces y Bacillus, y por hongos, como Gliocladium, Trichoderma, Ampelomyces, Candida y Coniothyrium. A partir de ellos se han patentado y comercializado diferentes productos comerciales para el control de distintas enfermedades vegetales en todo el mundo (Tabla 3).
Introducción
20
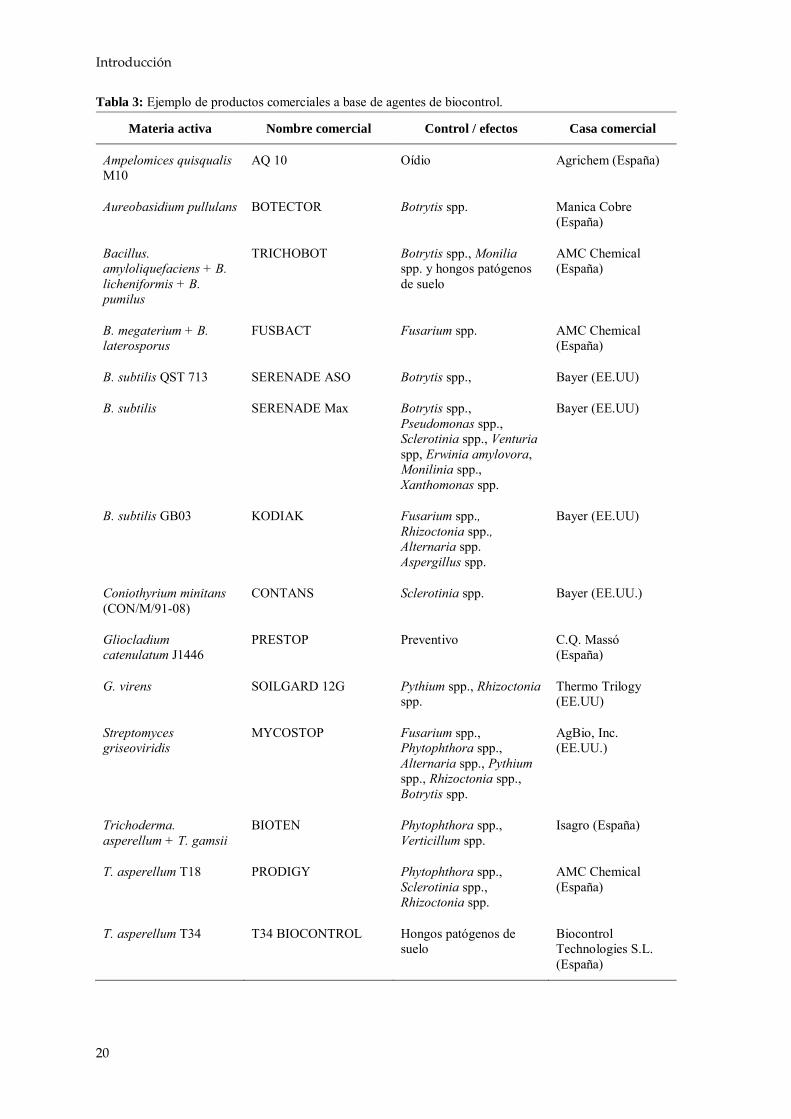
Tabla 3: Ejemplo de productos comerciales a base de agentes de biocontrol.
Materia activa Nombre comercial Control / efectos Casa comercial
Ampelomices quisqualis M10
AQ 10 Oídio Agrichem (España)
Aureobasidium pullulans BOTECTOR Botrytis spp. Manica Cobre (España)
Bacillus. amyloliquefaciens + B. licheniformis + B. pumilus
TRICHOBOT Botrytis spp., Monilia spp. y hongos patógenos de suelo
AMC Chemical (España)
B. megaterium + B. laterosporus
FUSBACT Fusarium spp. AMC Chemical (España)
B. subtilis QST 713 SERENADE ASO Botrytis spp., Bayer (EE.UU)
B. subtilis SERENADE Max Botrytis spp., Pseudomonas spp., Sclerotinia spp., Venturia spp, Erwinia amylovora, Monilinia spp., Xanthomonas spp.
Bayer (EE.UU)
B. subtilis GB03 KODIAK Fusarium spp., Rhizoctonia spp., Alternaria spp. Aspergillus spp.
Bayer (EE.UU)
Coniothyrium minitans (CON/M/91-08)
CONTANS Sclerotinia spp. Bayer (EE.UU.)
Gliocladium catenulatum J1446
PRESTOP Preventivo C.Q. Massó (España)
G. virens SOILGARD 12G Pythium spp., Rhizoctonia spp.
Thermo Trilogy (EE.UU)
Streptomyces griseoviridis
MYCOSTOP Fusarium spp., Phytophthora spp., Alternaria spp., Pythium spp., Rhizoctonia spp., Botrytis spp.
AgBio, Inc. (EE.UU.)
Trichoderma. asperellum + T. gamsii
BIOTEN Phytophthora spp., Verticillum spp.
Isagro (España)
T. asperellum T18 PRODIGY Phytophthora spp., Sclerotinia spp., Rhizoctonia spp.
AMC Chemical (España)
T. asperellum T34 T34 BIOCONTROL Hongos patógenos de suelo
Biocontrol Technologies S.L. (España)

Control de fitopatógenos en el cultivo de la alubia
21
Tabla 3: Ejemplo de productos comerciales a base de agentes de biocontrol (continuación).
Materia activa Nombre comercial Control / efectos Casa comercial
T. harzianum ROOTSHIELD R. solani, Pythium spp., Fusarium spp.,
BioWorks (EE.UU.)
T. harzianum SUPRESIVIT Estimulación del crecimiento
Borregaard Bioplant (Dinamarca)
T. harzianum (KRL-AG2)
TRI 002 Estimulación del crecimiento, fortalecimiento de las plantas frente a patógenos
Biowork (EE.UU.)
Pant Support (Países Bajos)
T. harzianum (PV 5736-89)
SUPRESIVIT Pythium spp., Rhizoctonia spp.
Fytovita (República Checa)
T. harzianum + T. viride TUSAL Phoma spp., Pythium spp., Rhizoctonia spp., Phytophthora spp.
Certis Europe (Países Bajos)
T. harzianum T22 PHC T-22 Pythium spp., Rhizoctonia spp., Fusarium spp., Cylindroladium spp., Thielaviopsis spp., Sclerotinia spp.
BioWork Inc (EE.UU.)
T. virens ROOT MATE Phytophora spp. BioWork Inc (EE.UU.)
T. viride ECOFIT Fusarium spp., Pythium spp., Rhizoctonia spp.
Hoechst Schering AgrEvo (India)
T. viride TRIECO Rhizoctonia spp., Pythium spp., Fusarium spp.
Ecosense Labs (India)
Trichoderma spp. TRICHOJET, TRICHOPEL, TRICHODOWELS, TRICHOSEAL
Armillaria spp., Botryosphaeria spp., Chondrosternum spp., Fusarium spp., Nectria spp., Phytophathora spp., Pythium spp., Rhizoctonia spp.
Agrimm Technologies (Nueva Zelanda)
Talamyces flavus PROTUS Estimulación del crecimiento, fortalecimiento de las plantas frente a patógenos como Verticillum spp.
Prophyta GmbH (Alemania)

Introducción
22
4. TRICHODERMA SPP. PERSOON, FRIES
Trichoderma es un género de ascomicetes filamentosos que se encuentra entre los hongos saprofitos más aislados. Aparecen con frecuencia en el suelo y crecen sobre madera, corteza, otros hongos y muchos otros sustratos, teniendo un alto potencial oportunista y una gran adaptabilidad a diversas condiciones ecológicas (Harman y Kubicek, 2002).
4.1. Taxonomía y morfología de Trichoderma
El género Trichoderma fue definido en 1794 por Persoon. pero no fue hasta el siglo XX cuando se empezó a estudiar al llamar la atención de los agricultores y comprobar que era capaz de controlar hongos que causaban enfermedades en las plantas (Mukherjee et al., 2013; Weindling, 1932, 1934). Se ha definido su taxonomía como (Samuels, 1996):
• Reino: Fungi • Subreino: Dikarya
o División: Ascomycota o Subdivisión: Pezizomycotina
▪ Clase: Sordariomycetes ▪ Subclase: Hypocreomycetidae
• Orden: Hypocreales o Familia: Hypocreaceae
▪ Género: Trichoderma Persoon, Fries
En la actualidad se han definido 256 especies de este género (Bissett et al., 2015).
Los hongos de este género crecen rápidamente a una temperatura entre 25 y 30 ºC, y reducen su velocidad conforme se aumenta la temperatura, deteniendo su desarrollo a partir de 35 ºC. Las colonias cuando están en medio maíz-dextrosa-agar (CMD) presenten un aspecto transparente mientras que en medio patata-dextrosa-agar (PDA) el micelio es de una tonalidad blanca (Figura 6a). Pasados unos días, entre 3 y 10 según la especie, se forman los conidios tomando un aspecto que puede variar de amarillo a verde en sus distintas tonalidades o seguir con tonalidades blanquecinas (Figura 6a), aunque este último caso es menos frecuente. También puede segregar sustancias al medio, haciendo que éste torne a un color amarillento (Figura 6b), sobre todo si se emplea medio PDA (Samuels, 1996).
Los conidióforos son muy ramificados. Las hifas principales producen las laterales que pueden estar emparejadas o no, en función de la especie (Barnett y Hunter, 1998). Tanto las hifas principales como las secundarias surgen con un ángulo de 90º respecto al eje principal (Figura 6d). El típico conidióforo de Trichoderma, con hifas emparejadas, asume un aspecto piramidal.
Las fiálides pueden ser cilíndricas o casi globosas, aunque cuando crecen en medio se pueden agrandar. Las fiálides pueden mantenerse en espirales, con un ángulo de 90° respecto a otros miembros de la espiral, o pueden ser peniciladas (similares a Gliocladium), es decir, que en sus extremos presentan una especie de pincel. Las fiálides pueden estar densamente agrupadas en el eje principal ancho como T. polysporum y T. hamatum o pueden ser solitarias como T. longibrachiatum (Samuels, 1996).
Los conidios normalmente no presentan ningún líquido sobre ellos, pero en algunas especies pueden aparecer algunas gotas de líquido verde claro o amarillo como T. virens y T. flavofuscum. Los

Trichoderma spp. Persoon, Fries
23
conidios de la mayoría de las especies son elipsoidales (Figura 6e), con un tamaño 3-5 x 2-4 µm (relación de longitud/anchura ≥ 1,3) (Samuels, 1996). Los conidios son lisos (Barnett y Hunter, 1998).
El teleomorfo de Trichoderma pertenece al género Hypocrea Fr (Druzhinina et al., 2011). Se caracteriza por el estroma discoidal. Los peritecios están completamente sumergidos. Las ascosporas son bicelulares pero desarticuladas en el septo temprano en su desarrollo en 16 ascosporas parciales, de manera que puede contener 16 ascosporas. Éstas son hialinas o verdes y típicamente espinulosas (Samuels, 1996).
Trichoderma se puede aislar de los suelos forestales o agrícolas en todas las latitudes. Aunque las especies de Hypocrea se encuentran más frecuentemente en la corteza o en la madera decorticada, algunas pueden crecer en hongos de soporte, como H. pulvinata, H. sulphurea, H. latizonata, H. avellanea (Samuels, 1996).
En la actualidad, el uso del teleomorfo (Hypocrea) ha quedado relegado en favor del anamorfo (Trichoderma) siendo válido desde del 1 de enero de 2013 (según la decisión tomada en el Congreso Internacional de Botánica en julio de 2011) (Druzhinina et al., 2011).
Figura 6: Trichoderma spp. a) Aislamientos creciendo en medio PDA en el que se aprecian distintas formas de desarrollo; b) Aislamiento que produce una tinción del medio PDA; c) Desarrollo de Trichoderma spp. sobre una semilla de alubia sembrada en sustrato; d) Detalle de los conidióforos vistos al microscopio de un aislamiento de Trichoderma (Imagen tomada de https://www.ars.usda.gov); e) Detalle de las esporas vistas al microscopio de Trichoderma.

Introducción
24
5. COEVOLUCIÓN ENTRE EL CULTIVO DE LA ALUBIA Y LOS FACTORES
BIÓTICOS Y ABIÓTICOS
Las variedades de alubia común cultivadas en la actualidad han sido el resultado de un proceso de evolución y selección, en el que se han producido cambios morfológicos, fisiológicos y genéticos, como respuesta a las exigencias humanas o del medio ambiente (Casquero, 1997).
Como se ha expuesto anteriormente, la alubia ha sufrido una domesticación múltiple en parcelas que se mantuvieron aisladas entre sí durante miles de años, con lo que existirán importantes casos de coevolución entre el cultivo de la judía y los agentes bióticos y abióticos presentes en su ambiente (Gepts y Bliss, 1985), es decir las transformaciones que se producen durante la evolución de las especies y las influencias que interactúan en ellas (Moënne-Loccoz et al., 2015). Así Stavely (1984) observó una susceptibilidad diferencial de las variedades de alubia a las razas de roya (Uromyces phaseoli) y Rennie y Kemp (1983) detectaron, al ensayar con varias poblaciones de alubia la eficiencia en la fijación de nitrógeno usando cepas individuales de Rhizobium, que había diferencias significativas entre poblaciones e interacciones cepas-población.
Para muchos fitopatógenos, la falta de una resistencia efectiva junto con las limitaciones de los fitosanitarios hace que sea difícil su control con lo que se ven afectadas las producciones. Sin embargo, se han identificado suelos en los que hay una baja incidencia de enfermedades en condiciones aparentemente favorables para el desarrollo de la enfermedad (Mazzola, 2002). Esta supresividad natural y/o inducida se ha identificado, y los microorganismos de los suelos son críticos para el control de enfermedades de las plantas. La supresión de la enfermedad natural no se ve afectada por el huésped, sino que puede estar determinada por las características físico-químicas del suelo y sus efectos en las comunidades microbianas del suelo. Por el contrario, la supresión inducida depende no sólo de las características del suelo, sino también de las plantas cultivadas en el suelo, de la rotación de cultivos y de las estrategias de manejo (Bailey y Lazarovits, 2003). Así los suelos supresores de enfermedades se caracterizan frecuentemente por altas densidades y/o diversidad de microorganismos antagonistas (Adesina et al., 2007; Bonanomi et al., 2010; Mazzola, 2004). Existen diversos ejemplos en los que la disminución de una fitopatología se ve influenciada por factores bióticos y/o abióticos. Se ha visto que la disminución de la gravedad de la enfermedad causada por R. solani se debe a las sucesivas siembras de un huésped óptimo para este fitopatógeno y que se atribuye al aumento de la presencia de Trichoderma spp. en ese suelo (Henis, 1978; Liu y Baker, 1980). En otros estudios se ha demostrado que el pH del suelo tenía una influencia indirecta en T. harzianum, el crecimiento y la germinación de esporas se estimuló a pH bajo y la supresión a R. solani se indujo por monocultivo sólo en suelos acidificados o naturalmente ácidos (Chet y Baker, 1980).
Es útil conocer la variabilidad de las enfermedades y plagas en los lugares originales y correlacionar esta información con las variedades locales de alubia que han tenido una evolución conjunta en una región concreta. A tenor de las evidencias de coevolución de la alubia con factores bióticos y abióticos y de la concentración local de caracteres interesantes, los agricultores deberán trabajar con variedades locales para afrontar de modo sostenible las limitaciones bióticas y abióticas.

Interacciones entre alubia, R. solani y Trichoderma
25
6. INTERACCIONES ENTRE ALUBIA, R. SOLANI Y TRICHODERMA
Cuando un organismo es sometido a un estrés, bien sea biótico o abiótico, éste va a producir una serie de cambios tanto estructurales como en producción de metabolitos, expresión de genes, y otros con el fin de responder a ese estímulo.
Las plantas se desarrollan en un estado fisiológico óptimo (Figura 7) ya que se han adaptado a las condiciones en las que están creciendo. En cuanto se presenta el estrés las plantas ofrecen una resistencia mínima a éste, con lo que van a ralentizar sus funciones vitales reduciendo así su desarrollo; esta fase de alarma (Figura 7) es la que desencadenará todos los mecanismos que tiene para superarlo. Si no posee los adecuados se producirá la muerte de la planta, pero si tiene los mecanismos adecuados entrará en una fase de resistencia (Figura 7) alcanzando un nivel máximo en un momento dado. Si continúa la presencia del estrés, la planta entrará en una fase de agotamiento (Figura 7) pudiendo ocasionar la muerte de la planta si no desaparece. Si por el contrario finaliza, la planta restablece sus funciones fisiológicas, pudiéndose regenerar y alcanzar un nuevo estado fisiológico óptimo para las condiciones presentes, llegando a la fase de regeneración (Figura 7). Este proceso sería habitual a lo largo de la vida de la planta (Tadeo y Gómez-Cadenas, 2008).
6.1. Interacciones entre R. solani y alubia
Cuando un patógeno, en este caso R. solani, pretende invadir una planta pueden producirse distintas interacciones. Si hay una interacción incompatible, el patógeno no tendrá éxito en el ataque bien porque la planta no sea el huésped adecuado, bien porque el patógeno no pueda superar las barreras estructurales o químicas de la planta o bien porque reconozca en la planta mecanismos de defensa adecuados. Sin embargo si se produce una interacción compatible, el patógeno será virulento e invadirá la planta (Tadeo y Gómez-Cadenas, 2008).
Figura 7: Respuesta de las plantas al estrés (Tadeo y Gómez-Cadenas, 2008).

Introducción
26
Si R. solani detecta la planta huésped que va a colonizar, como es el caso de la alubia, empieza a liberar sustancias que degradan la pared celular que la planta, como pueden ser enzimas, o bien toxinas que afecten al desarrollo o al metabolismo de la misma.
Las enzimas segregadas por R. solani degradan las sustancias pécticas que unen las paredes celulares del parénquima de la alubia causando ensanchamiento y degradación de la pared celular y muerte de las células con antelación al contacto de las hifas invasoras. Las toxinas que se producen causan cambios en la permeabilidad de la membrana celular afectando al desarrollo óptimo de la planta (Jiménez-Díaz, 1996).
Una vez que la planta ha sido infectada o es susceptible de serlo, se desencadenan una serie de procesos para reprimir ese ataque y evitar así la invasión del fitopatógeno. La planta puede desarrollar mecanismos constructivos como la modificación de la composición de la cutícula, producción de cera epicuticular, y otros (Boller y Felix, 2009; Grotewold, 2005; Veitch, 2009). Otro mecanismo de actuación para evitar la acción del fitopatógeno es la participación de cationes, sobre todo del Ca2+ ya que éste se acumula alrededor de las lesiones dando lugar a la liberación de pectín-metil-esterasas de la pared celular del huésped, formándose pectatos de calcio u otros cationes multivalentes que son resistentes a la degradación por parte de la poligalacturonasa del patógeno (Jiménez-Díaz, 1996).
Cuando la planta detecta la presencia de un patógeno activa su sistema de defensa lo que implica la producción de ácido salicílico, molécula señal que conduce a la acumulación de proteínas relacionadas con la patogénesis que se cree que contribuyen a la resistencia. Este tipo de respuesta se conoce como respuesta sistémica adquirida (Systemic Acquired Resistance, SAR) (Druzhinina et al., 2011).
Otra respuesta que tiene la planta es la defensa necrótica o hipersensible, es decir, induce la muerte selectiva de algunas células para impedir el avance de R. solani (Tadeo y Gómez-Cadenas, 2008). Los cambios en las reacciones hipersensibles comprenden la pérdida de la permeabilidad de las membranas celulares, aumento de la respiración y la producción de fitoalexinas. Como resultado final se produce la muerte y colapso de las células infectadas y las que las rodean. Los tejidos necróticos aíslan al fitopatógeno causándole la muerte ya que depende por completo de la planta para nutrirse, crecer y propagarse. Es probable que cuanto más rápido mueran las células del hospedador después de haber sido infectadas, éste se haga más resistente a la infección (Agrios, 2002).
La planta responde a la invasión de un fitopatógeno o bien de un agente de biocontrol activando la expresión de los genes de defensa y produciendo metabolitos secundarios como las fitoalexinas (fenoles, isoflavonas, terpenos, y otros) y varias sustancias que inhiben la expansión del patógeno como son ligninas y callosas (Chen et al., 2015). Las fitoalexinas son sustancias tóxicas que se producen en cantidades apreciables sólo después de haber sido estimuladas por los diferentes tipos de microorganismos o bien después de que la planta haya sufrido daños causados por agentes químicos o mecánicos. Se producen por las células sanas adyacentes a las células necróticas y dañadas, en respuesta a señales que difunden a partir de las células dañadas. La resistencia ocurre cuando las fitoalexinas alcanzan una concentración suficiente para inhibir el desarrollo del patógeno. La mayoría de las fitoalexinas conocidas son tóxicas para los hongos fitopatógenos ya que inhiben su desarrollo (Agrios, 2002).

Interacciones entre alubia, R. solani y Trichoderma
27
6.2. Interacciones entre Trichoderma y alubia
Trichoderma al ser un organismo simbionte no virulento será beneficioso para la planta por muchas causas. Se encuentra presente en la mayoría de los suelos, demostrando su alto potencial oportunista y su adaptación a varias condiciones ecológicas.
Una de las múltiples formas que tiene Trichoderma de beneficiar a la planta de alubia es un incremento de su desarrollo (Figura 8 y Figura 9), aumentando los nutrientes disponibles para ella. Trichoderma produce ácidos orgánicos, como ácido cítrico o fumárico que reducen el pH del suelo y permiten la solubilización de fosfatos, micronutrientes y cationes como hierro, manganeso y magnesio (Benítez et al., 2004; Harman, et al., 2004). Se ha observado que T. harzianum generalmente reduce la presencia de Fe, Mn, Zn y Cu en la biomasa foliar de la alubia pero que se incrementa el contenido de Cu en las semillas (Öğüt y Er, 2006). Los nutrientes, y en particular el P, podrían incrementar su disponibilidad, favoreciendo así el crecimiento de la planta. En el caso de solubilización de compuestos insolubles o con baja solubilidad, se ha descrito que Trichoderma podría solubilizar Fe2O3, MnO2, Zn y fosfatos, en condiciones in vitro, gracias a procesos de quelación y la actividad de oxidación-reducción (Altomare et al., 1999). Trichoderma también puede incrementar la capacidad fotosintética de las plantas ya que puede sobrerregular la producción de proteínas relativas a la fotosíntesis (Harman, 2000).
Otra forma de incrementar el desarrollo de las plantas es producir o degradar factores de crecimiento (Figura 8). Trichoderma puede mediar en la producción de etileno, con lo que al reducir su producción podría aumentar el desarrollo de la planta. T. asperelloides posee un gen α-1-aminociclopropano-1-carboxilato (ACC) que codifica una enzima que escinde ACC, un intermediario clave en la biosíntesis de etileno (Wang et al., 2002). Una asociación entre el incremento de desarrollo de la planta y la reducción de la síntesis de etileno podría deberse a un descenso de un precursor de ACC debido a la producción del ácido indol-3-acético (IAA) (auxina que promueve el desarrollo de las raíces) en la rizosfera y/o a la actividad de la ACC desaminasa (ACCD) (Hermosa et al., 2013; Shoresh et al., 2010). Trichoderma también produciría IAA y ACCD con lo que manipularía el patrón de regulación de estas fitohormonas (Contreras-Cornejo et al., 2009; Viterbo et al., 2010). Las nitrilasas serían otras enzimas que hidrolizarían β-ciano-l-alanina, que es un metabolito que se forma a partir de cianuro liberado durante la etapa final de biosíntesis de etileno (Piotrowski y Volmer, 2006).
Figura 8: Efectos de Trichoderma sobre la planta.
Introducción
28
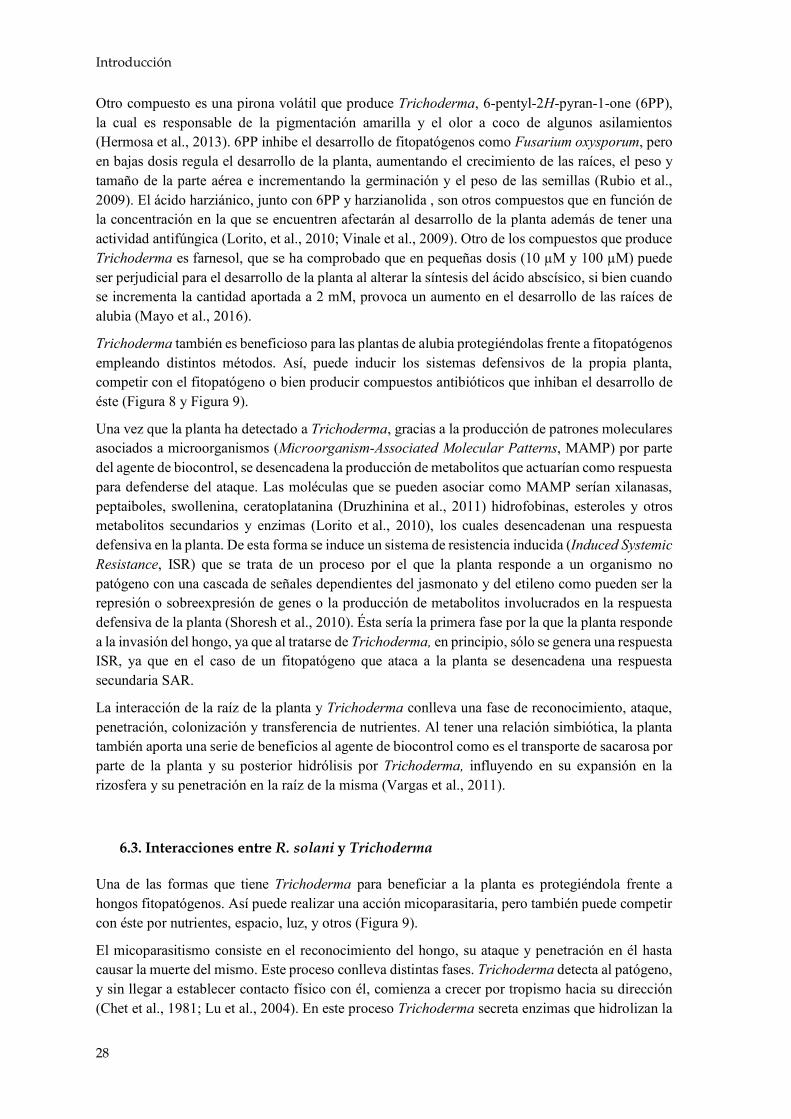
Otro compuesto es una pirona volátil que produce Trichoderma, 6-pentyl-2H-pyran-1-one (6PP), la cual es responsable de la pigmentación amarilla y el olor a coco de algunos asilamientos (Hermosa et al., 2013). 6PP inhibe el desarrollo de fitopatógenos como Fusarium oxysporum, pero en bajas dosis regula el desarrollo de la planta, aumentando el crecimiento de las raíces, el peso y tamaño de la parte aérea e incrementando la germinación y el peso de las semillas (Rubio et al., 2009). El ácido harziánico, junto con 6PP y harzianolida , son otros compuestos que en función de la concentración en la que se encuentren afectarán al desarrollo de la planta además de tener una actividad antifúngica (Lorito, et al., 2010; Vinale et al., 2009). Otro de los compuestos que produce Trichoderma es farnesol, que se ha comprobado que en pequeñas dosis (10 µM y 100 µM) puede ser perjudicial para el desarrollo de la planta al alterar la síntesis del ácido abscísico, si bien cuando se incrementa la cantidad aportada a 2 mM, provoca un aumento en el desarrollo de las raíces de alubia (Mayo et al., 2016).
Trichoderma también es beneficioso para las plantas de alubia protegiéndolas frente a fitopatógenos empleando distintos métodos. Así, puede inducir los sistemas defensivos de la propia planta, competir con el fitopatógeno o bien producir compuestos antibióticos que inhiban el desarrollo de éste (Figura 8 y Figura 9).
Una vez que la planta ha detectado a Trichoderma, gracias a la producción de patrones moleculares asociados a microorganismos (Microorganism-Associated Molecular Patterns, MAMP) por parte del agente de biocontrol, se desencadena la producción de metabolitos que actuarían como respuesta para defenderse del ataque. Las moléculas que se pueden asociar como MAMP serían xilanasas, peptaiboles, swollenina, ceratoplatanina (Druzhinina et al., 2011) hidrofobinas, esteroles y otros metabolitos secundarios y enzimas (Lorito et al., 2010), los cuales desencadenan una respuesta defensiva en la planta. De esta forma se induce un sistema de resistencia inducida (Induced Systemic Resistance, ISR) que se trata de un proceso por el que la planta responde a un organismo no patógeno con una cascada de señales dependientes del jasmonato y del etileno como pueden ser la represión o sobreexpresión de genes o la producción de metabolitos involucrados en la respuesta defensiva de la planta (Shoresh et al., 2010). Ésta sería la primera fase por la que la planta responde a la invasión del hongo, ya que al tratarse de Trichoderma, en principio, sólo se genera una respuesta ISR, ya que en el caso de un fitopatógeno que ataca a la planta se desencadena una respuesta secundaria SAR.
La interacción de la raíz de la planta y Trichoderma conlleva una fase de reconocimiento, ataque, penetración, colonización y transferencia de nutrientes. Al tener una relación simbiótica, la planta también aporta una serie de beneficios al agente de biocontrol como es el transporte de sacarosa por parte de la planta y su posterior hidrólisis por Trichoderma, influyendo en su expansión en la rizosfera y su penetración en la raíz de la misma (Vargas et al., 2011).
6.3. Interacciones entre R. solani y Trichoderma
Una de las formas que tiene Trichoderma para beneficiar a la planta es protegiéndola frente a hongos fitopatógenos. Así puede realizar una acción micoparasitaria, pero también puede competir con éste por nutrientes, espacio, luz, y otros (Figura 9).
El micoparasitismo consiste en el reconocimiento del hongo, su ataque y penetración en él hasta causar la muerte del mismo. Este proceso conlleva distintas fases. Trichoderma detecta al patógeno, y sin llegar a establecer contacto físico con él, comienza a crecer por tropismo hacia su dirección (Chet et al., 1981; Lu et al., 2004). En este proceso Trichoderma secreta enzimas que hidrolizan la

Interacciones entre alubia, R. solani y Trichoderma
29
pared celular del patógeno (Howell, 2003; Woo et al., 2006) tales como exoquitinasas que provocan la liberación de oligómeros del fitopatógeno, los que inducen la expresión por parte de Trichoderma de las endochitinasas que atacan a dicho patógeno incluso sin llegar a estar en contacto el agente de biocontrol con el mismo (Brunner et al., 2003; Lorito et al., 1993; Lorito, et al., 1994). Otras enzimas que segrega Trichoderma para degradar la pared celular del fitopatógeno son celulasas, chitinasas y glucanasas (Vinale et al., 2008). La mayor parte del sistema antifúngico de Trichoderma consiste en una producción de una gran variedad de enzimas líticas incluyendo endochitinasas, N-acetyl-β-glucosaminidasas, chitin 1,4-β-chitobiosidasas, proteasas, glucan β-1,3-glucosidasas, glucan β-1,6-glucosidasas, glucan α-1,3-glucosidasas, lipasas, xylanasas, mannanasas, pectinasas, pectin-lyasas, amylasas, fosfolipasas, RNAsas, DNAsas, etc (Sanz et al., 2004).
Trichoderma también excreta compuestos con actividad antimicrobiana al producir una mezcla de metabolitos secundarios que controlarían el desarrollo de fitopatógenos (Cardoza et al., 2005; Reino et al., 2007) como los derivados de la pirona [6-pentyl-2H-pyran-2-one (6-PP)] (Keszler et al., 2000) y otros peptaiboles (Vizcaino et al., 2005). Otros metabolitos secundarios son compuestos solubles en agua, como ácido heptelídico o ácido koníngico (Vinale et al., 2008).
La competencia por nutrientes con el fitopatógeno es otra interacción habitual. Trichoderma es un excelente competidor por espacio y recursos naturales ya que, al encontrarse en una gran cantidad de hábitats posee mejores mecanismos de adaptación al medio siendo así un excelente agente de biocontrol (Howell, 2003).
R. solani como respuesta a la acción de Trichoderma, produce compuestos que tratan de evitar elavance de este último, como moléculas con respuesta al estrés oxidativo [Reactive Oxygen Species(ROS)] que se producen durante la formación de esclerocios, y que junto con otros metabolitosantifúngicos (Aliferis y Jabaji, 2010) provocan una respuesta de estrés en Trichoderma y un procesode desintoxicación (Druzhinina et al., 2011). Se ha comprobado que un aislamiento de T.atroviridis, al cual se le bloqueó un gen que codificaba transporte de metabolitos a través de lamembrana, reducía su capacidad de biocontrol frente a R. solani ya que promovía la desintoxicacióndel mismo cuando era atacado por el patógeno (Ruocco et al., 2009).
6.4. Interacciones entre R. solani, alubia y Trichoderma
Anteriormente se han explicado las interacciones que existen entre patógeno y planta, agente de biocontrol y planta, y entre patógeno y agente de biocontrol (Figura 9). En la actualidad existen estudios en los que se plantea que puede existir una triple interacción entre los tres agentes implicados. Así se ha visto que la respuesta defensiva de la planta es diferente cuando están presentes ambos hongos, afectando tanto a la expresión génica, como a la metabolómica y a la proteómica.

Intro
du
cción
30
Figura 9: Interacciones entre el patógeno R. solani, la planta de alubia, P. vulgaris, y el agente de biocontrol Trichoderma. Las líneas y círculos de color verde son los compuestos, y las acciones que provoca Trichoderma. Las líneas de color rojo son los compuestos y respuestas que causa R. solani. Las líneas y círculos de color morado son los compuestos y las respuestas de la alubia a las actuaciones de ambos hongos (Altomare et al., 1999; Howell, 2003; Rubio et al., 2009; Vargas et al., 2011; Vinale et al., 2008).

Bibliografía
31
7. BIBLIOGRAFÍA
Adesina, M. F., Lembke, A., Costa, R., Speksnijder, A., y Smalla, K. (2007). Screening of bacterial isolates from various European soils for in vitro antagonistic activity towards Rhizoctonia solani and Fusarium oxysporum: Site-dependent composition and diversity revealed. Soil Biol. Biochem. 39, 2818-2828. doi:10.1016/j.soilbio.2007.06.004.
Agrios, G. N. (2002). Fitopatologia. 2a ed. Limosa.
Aliferis, K. A., y Jabaji, S. (2010). Metabolite composition and bioactivity of Rhizoctonia solani sclerotial exudates. J. Agric. Food Chem. 58, 7604-7615. doi:10.1021/jf101029a.
Altomare, C., Norvell, W. A., Björkman, T., y Harman, G. E. (1999). Solubilization of phosphates and micronutrients by the plant-growth- promoting and biocontrol fungus Trichoderma harzianum Rifai 1295-22. Appl. Environ. Microbiol. 65, 2926-2933.
American Phytopathological Society (2005). Compendium of bean diseases. 2nd ed. , eds. Schwartz HF, Steadman J R, Hall R, y Forster R L APS Press, American Phytopathological Society.
Asensio, C. (1996). «La judía I», en El cultivo de las leguminosas grano en Castilla y León, eds. F. Franco y A. Ramos (Valladolid: Junta de Castilla y León. Consejería de Agricultura), 295-318.
Bailey, K. ., y Lazarovits, G. (2003). Suppressing soil-borne diseases with residue management and organic amendments. Soil Tillage Res. 72, 169-180. doi:10.1016/S0167-1987(03)00086-2.
Barnett, H. L., y Hunter, B. B. (1998). Illustrated genera of imperfect fungi. 4.a ed. St. Paul, Minnesota, USA: APS Press.
Beebe, S. E., Corrales, M. P., Schoonhoven, A. van, y Voysest, O. (1991). «Breeding for disease resistance», en Common beans: research for crop improvement., ed. O. Schoonhoven, A. van;Voysest (Wallingford: CAB International), 561-617.
Benítez, T., Rincón, A. M., Limón, M. C., y Codón, A. C. (2004). Biocontrol mechanisms of Trichoderma strains. Int. Microbiol. 7, 249-260. doi:10.2436/IM.V7I4.9480.
Berra, D., y Arteaga, G. (1989). El complejo parasitario del pie de la judía en el País Vasco. Cuad. Fitopatol. 2, 53-57.
Bissett, J., Gams, W., Jaklitsch, W., y Samuels, G. J. (2015). Accepted Trichoderma names in the year 2015. IMA Fungus 6, 263-295. doi:10.5598/imafungus.2015.06.02.02.
Bitocchi, E., Bellucci, E., Giardini, A., Rau, D., Rodriguez, M., Biagetti, E., et al. (2013). Molecular analysis of the parallel domestication of the common bean ( Phaseolus vulgaris ) in Mesoamerica and the Andes. New Phytol. 197, 300-313. doi:10.1111/j.1469-8137.2012.04377.x.
Bitocchi, E., Nanni, L., Bellucci, E., Rossi, M., Giardini, A., Zeuli, P. S., et al. (2012). Mesoamerican origin of the common bean (Phaseolus vulgaris L.) is revealed by sequence data. Proc. Natl. Acad. Sci. 109, E788-E796. doi:10.1073/pnas.1108973109.
Boller, T., y Felix, G. (2009). A Renaissance of elicitors: perception of microbe-associated molecular patterns and danger signals by pattern-recognition receptors. Annu. Rev. Plant Biol. 60, 379-406. doi:10.1146/annurev.arplant.57.032905.105346.
Bonanomi, G., Antignani, V., Capodilupo, M., y Scala, F. (2010). Identifying the characteristics of organic soil amendments that suppress soilborne plant diseases. Soil Biol. Biochem. 42, 136-144. doi:10.1016/j.soilbio.2009.10.012.
Bordoloi, D., Paul, S., Das, R., y Roy, A. (1998). Effect of pre‐sowing seed treatment on emergence and seedling mortality of French bean. Ann. Agric. Res. 19, 348-349.
Brunner, K., Peterbauer, C. K., Mach, R. L., Lorito, M., Zeilinger, S., y Kubicek, C. P. (2003). The

Introducción
32
Nag1 N-acetylglucosaminidase of Trichoderma atroviride is essential for chitinase induction by chitin and of major relevance to biocontrol. Curr. Genet. 43, 289-295.
Campelo, M. P., Lorenzana, A., Marcos, M. F., Ámez, M., Boto, J. A., y Casquero, P. A. (2007). Eficacia en campo de dos fungicidas para el control del «mal del pie» de la judía (Phaseolus vulgaris) en la La Bañeza (León). Boletín Sanid. Veg. 33, 137-142.
Cardoza, R. E., Vizcaíno, J. A., Hermosa, M. R., Sousa, S., González, F. J., Llobell, A., et al. (2005). Cloning and characterization of the erg1 gene of Trichoderma harzianum: Effect of the erg1 silencing on ergosterol biosynthesis and resistance to terbinafine. Fungal Genet. Biol. 43, 164-178. doi:10.1016/j.fgb.2005.11.002.
Casquero, P. A. (1997). Comportamiento agronómico, variabilidad genética y relaciones taxonómicas de las variedades de alubia (Phaseolus vulgaris L.) de la Península Ibérica. Tesis doctoral, Universidad de Santiago de Compostela, España.
Casquero, P. A., González, A. M., Santalla, M., y De Ron, A. M. (2005). Assessment of dual culinary use potential of common bean landraces in sustainable agriculture. Biol. Agric. Hortic. 22, 335-347. doi:10.1080/01448765.2005.9755296.
Casquero, P. A., Lema, M., Santalla, M., y De Ron, A. M. (2006). Performance of common bean (Phaseolus vulgaris L.) landraces from Spain in the Atlantic and Mediterranean environments. Genet. Resour. Crop Evol. 53, 1021-1032. doi:10.1007/s10722-004-7794-1.
Chen, X., Qi, X., y Duan, L.-X. (2015). «Overview», en Plant Metabolomics, eds. X. Qi, X. Chen, y Y. Wang (Dordrecht: Springer Netherlands), 1-24. doi:10.1007/978-94-017-9291-2_1.
Chet, I., y Baker, R. (1980). Induction of suppressiveness to Rhizoctonia solani in soil. Phytopathology 70, 994-998.
Chet, I., Harman, G. E., y Baker, R. (1981). Trichoderma hamatum: Its hyphal interactions with Rhizoctonia solani and Pythium spp. Microb. Ecol. 7, 29-38. doi:10.1007/BF02010476.
Chet, I., y Inbar, J. (1994). Biological control of fungal pathogens. Appl. Biochem. Biotechnol. 48, 37-43.
Contreras-Cornejo, H. A., Macías-Rodríguez, L., Cortes-Penagos, C., y López-Bucio, J. (2009). Trichoderma virens, a plant beneficial fungus, enhances biomass production and promotes lateral root growth through an auxin-dependent mechanism in Arabidopsis. Plant Physiol. 149, 1579-1592. doi:10.1104/pp.108.130369.
Debouck, D. G., Toro, O., Paredes, O. M., Johnson, W. C., y Gepts, P. (1993). Genetic diversity and ecological distribution of Phaseolus vulgaris (Fabaceae) in northwestern South America. Econ. Bot. 47, 408-423. doi:10.1007/BF02907356.
Druzhinina, I. S., Seidl-Seiboth, V., Herrera-Estrella, A., Horwitz, B. A., Kenerley, C. M., Monte, E., et al. (2011). Trichoderma: The genomics of opportunistic success. Nat. Rev. Microbiol. 9, 749-759.
FAO (2016). FAOSTAT. Food Agric. Organ. United Nations. Available at: http://www.fao.org/faostat/en/#data/QC [Accedido diciembre 29, 2016].
Gepts, P., y Bliss, F. A. (1985). F1 hybrid weakness in the common bean: Differential geographic origin suggets two gene pools in cultivated bean germplasm. J. Hered. 76, 447-450. doi:10.1093/oxfordjournals.jhered.a110142.
Gepts, P., Osborn, T. C., Rashka, K., y Bliss, F. A. (1986). Phaseolin-protein variability in wild forms and landraces of the common bean (Phaseolus vulgaris): Evidence for multiple centers of domestication. Econ. Bot. 40, 451-468. doi:10.1007/BF02859659.
González García, V., Portal Onco, M. A., y Rubio Susan, V. (2006). Review. Biology and systematics of the form genus Rhizoctonia. Spanish J. Agric. Res. 4, 55. doi:10.5424/sjar/2006041-178.
Bibliografía
33
Graham, P. H., y Ranalli, P. (1997). Common bean (Phaseolus vulgaris L.). F. Crop. Res. 53, 131-146. doi:10.1016/S0378-4290(97)00112-3.
Grotewold, E. (2005). Plant metabolic diversity: a regulatory perspective. Trends Plant Sci. 10, 57-62. doi:10.1016/j.tplants.2004.12.009.
Gupta, S., Mathew, K., Shyam, K., y Sharma, A. (1999). Fungicidal management of root rot (Rhizoctonia solani) of French bean. Plant Dis. Res. 14, 20-24.
Hagedorn, D. J. (1991). «Rhizoctonia Root Rot», en Compendium of Bean Diseases, ed. R. Hall (APS, American Phyopathological Society), 13.
Harman, G. E. (2000). Myths and dogmas of biocontrol changes in perceptions derived from research on Trichoderma harzinum T-22. Plant Dis. 84, 377-393. doi:10.1094/PDIS.2000.84.4.377.
Harman, G. E., Howell, C. R., Viterbo, A., Chet, I., y Lorito, M. (2004). Trichoderma species--opportunistic, avirulent plant symbionts. Nat. Rev. 2, 43-56. doi:10.1038/nrmicro797.
Harman, G. E., y Kubicek, C. P. (1998). Trichoderma and Gliocladium. Volume 2: Enzymes, Biological Control and commercial applications. United Kindong: CRC Press.
Harman, G. E., y Kubicek, C. P. (2002). Trichoderma and Gliocladium. Volume 1: Basic biology, taxonomy and genetics. United Kindong: CRC Press.
Henis, Y. (1978). Integrated control of Rhizoctonia solani damping-off of radish: Effect of successive plantings, PCNB, and Trichoderma harzianum on pathogen and disease. Phytopathology 68, 900. doi:10.1094/Phyto-68-900.
Hermosa, R., Belén Rubio, M., Cardoza, R. E., Nicolás, C., Monte, E., y Gutiérrez, S. (2013). The contribution of Trichoderma to balancing the costs of plant growth and defense. Int. Microbiol. 16, 69-80.
Hjeljord, L., y Tronsmo, A. (1998). «Trichoderma and Gliocladium in biological control: an overview», en Trichoderma and Gliocladium Vol 2, eds. G. E. Harman y C. P. Kubicek (Taylor and Francis London), 131-151.
Howell, C. R. (2003). Mechanisms employed by Trichoderma species in the biological control of plant diseases: the history and evolution of current concepts. Plant Dis. 87, 4-10.
Index Fungorum (2017). Index Fungorum. Available at: http://www.indexfungorum.org/.
International Mycological Association (2016). Mycobank database. Fungal databases, nomenclature & species banks. Mycobank database. Available at: http://www.mycobank.org.
Jiménez-Díaz, R. M. (1996). «Interacciones planta-hongo: Mecanismos de infección, patogénesis y resistencia», en Patología vegetal (Valencia, Spain: Mundi-Prensa, Phytoma, Sociedad Española de Fitopatología), 739-769.
Junta de Castilla y León (2015). Superficies de cultivos herbáceos por provincias, comarcas y municipio. Available at: http://www.agriculturaganaderia.jcyl.es/web/jcyl/AgriculturaGanaderia/es/Plantilla100/1284675455995/_/_/_ [Accedido diciembre 30, 2016].
Junta de Castilla y León (2016). Anuario de estadistica agraria. Anuario 2014. Leguminosas. Available at: http://www.agriculturaganaderia.jcyl.es/web/jcyl/AgriculturaGanaderia/es/Plantilla100/1284495917557/_/_/_ [Accedido diciembre 30, 2016].
Kami, J., Velásquez, V. B., Debouck, D. G., y Gepts, P. (1995). Identification of presumed ancestral DNA sequences of phaseolin in Phaseolus vulgaris. Proc. Natl. Acad. Sci. 94, 1101-1104.
Keszler, A., Forgács, E., Kótai, L., Vizcaíno, J. A., Monte, E., y García-Acha, I. (2000). Separation and identification of volatile components in the fermentation broth of Trichoderma atroviride

Introducción
34
by solid-phase extraction and gas chromatography-mass spectrometry. J. Chromatogr. Sci. 38, 421-4. doi:10.1093/CHROMSCI/38.10.421.
Lioi, L., y Piergiovanni, A. R. (2013). «European Common Bean», en Genetic and genomic resources of grain legume improvement, eds. M. Singh, H. D. Upadhyaya, y I. S. Bisht (Elsevier), 11-40. doi:10.1016/B978-0-12-397935-3.00002-5.
Liu, S., y Baker, R. (1980). Mechanism of biological control in soil suppressive to Rhizoctonia solani. Phytopathology 70, 404-412. doi:10.1094/Phyto-70-404.
Lorito, M., Harman, G. E., Hayes, C. K., Broadway, R. M., Tronsmo, A., Woo, S. L., et al. (1993). Chitinolytic enzymes produced by Trichoderma harzianum : antifungal activity of purified endochitinase and chitobiosidase. Phytopathology 83, 302-307.
Lorito, M., Hayes, C. K., Di Pietro, A., Woo, S. L., y Harman, G. E. (1994). Purification, characterization, and synergistic activity of a glucan 1,3-β-glucosidase and an N-acetyl-β-glucosaminidase from Trichoderma harzianum. Phytopathology 84, 398-405.
Lorito, M., Woo, S. L., Harman, G. E., y Monte, E. (2010). Translational research on Trichoderma: From ’omics to the field. Annu. Rev. Phytopathol. 48, 395-417. doi:10.1146/annurev-phyto-073009-114314.
Lu, Z., Tombolini, R., Woo, S., Zeilinger, S., Lorito, M., y Jansson, J. K. (2004). In vivo study of Trichoderma-pathogen-plant interactions, using constitutive and inducible green fluorescent protein reporter systems. Appl. Environ. Microbiol. 70, 3073-81. doi:10.1128/AEM.70.5.3073-3081.2004.
Mamidi, S., Rossi, M., Annam, D., Moghaddam, S., Lee, R., Papa, R., et al. (2011). Investigation of the domestication of common bean (Phaseolus vulgaris) using multilocus sequence data. Funct. Plant Biol. 38, 953. doi:10.1071/FP11124.
Mayo, S., Izquierdo, H., González-López, Ó., Rodríguez-González, Á., Lorenzana, A., Gutiérrez, S., et al. (2016). Effect of farnesol , a compound produced by Trichoderma when growing on bean (Phaseolus vulgaris L.). Planta Med. 82, S1-S381. doi:10.1055/s-0036-1596823.
Mazzola, M. (2002). Mechanisms of natural soil suppressiveness to soilborne diseases. Antonie Van Leeuwenhoek 81, 557-564. doi:10.1023/A:1020557523557.
Mazzola, M. (2004). Assessment and management of soil microbial community structure for disease suppression. Annu. Rev. Phytopathol. 42, 35-59. doi:10.1146/annurev.phyto.42.040803.140408.
McClean, P. E., Lee, R. K., Otto, C., Gepts, P., y Bassett, M. J. (2002). Molecular and phenotypic mapping of genes controlling seed coat pattern and color in common bean (Phaseolus vulgaris L.). J. Hered. 93, 148-52.
Ministerio de Agricultura Pesca Alimentación y Medio Ambiente (2016). Leguminosas grano y oleaginosas - Leguminosas y oleaginosas - Cultivos herbáceos e industriales - Producciones agrícolas - Agricultura - mapama.es. Available at: http://www.mapama.gob.es/es/agricultura/temas/producciones-agricolas/cultivos-herbaceos/leguminosas-y-oleaginosas/default.aspx#para1 [Accedido diciembre 30, 2016].
Ministerio de Agricultura y Pesca Alimentación y Medio Ambiente (2015). Estadística anual de consumo de productos fitosanitarios y Estadística quinquenal de utilización de productos fitosanitarios en la agricultura. Available at: http://www.mapama.gob.es/es/estadistica/temas/estadisticas-agrarias/agricultura/estadisticas-medios-produccion/fitosanitarios.aspx [Accedido enero 6, 2017].
Moënne-Loccoz, Y., Mavingui, P., Combes, C., Normand, P., y Steinberg, C. (2015). «Microorganisms and Biotic Interactions», en Environmental Microbiology: Fundamentals and Applications, eds. J. C. Bertrand, P. Caumette, P. Lebaron, Matheron. R., y T. Normand,

Bibliografía
35
P. Sime-Ngando (Dordrecht: Springer Netherlands), 395-444. doi:10.1007/978-94-017-9118-2_11.
Monte, E., y Suárez, M. B. (2010). «Muerte de plántulas», en Enfermedades de las plantas causadas por hongos y oomicetos: naturaleza y control integrado, eds. R. M. Jimenez Diaz y E. Montesinos Segui (Phytoma), 115-133.
Mukherjee, P. K., Horwitz, B. A., Herrera-Estrella, A., Schmoll, M., y Kenerley, C. M. (2013). Trichoderma research in the genome era. Annu. Rev. Phytopathol. 51, 105-129.
Ogoshi, A. (1996). «Introduction - The genus Rhizoctonia», en Rhizoctonia Species: Taxonomy, Molecular Biology, Ecology, Pathology and Disease Control, eds. B. Sneh, S. Jabaji-Hare, S. Neate, y G. Dijst (Dordrecht: Springer Netherlands), 1-9. doi:10.1007/978-94-017-2901-7_1.
Öğüt, M., y Er, F. (2006). Micronutrient composition of field-grown dry bean and wheat inoculated with Azospirillum and Trichoderma. J. Plant Nutr. Soil Sci. 169, 699-703. doi:10.1002/jpln.200520597.
Piotrowski, M., y Volmer, J. J. (2006). Cyanide metabolism in higher plants: Cyanoalanine hydratase is a NIT4 homolog. Plant Mol. Biol. 61, 111-122. doi:10.1007/s11103-005-6217-9.
Reino, J. L., Guerrero, R. F., Hernández-Galán, R., y Collado, I. G. (2007). Secondary metabolites from species of the biocontrol agent Trichoderma. Phytochem. Rev. 7, 89-123. doi:10.1007/s11101-006-9032-2.
Reinoso, B. (2001). Prospección, caracterización y evaluación de variedades locales de judía grano (Phaseolus vulgaris L.) de la provincia de León. Tesis doctoral, Universidad de León, España.
Rennie, R. J., y Kemp, G. A. (1983). N2-fixation in field beans quantified by 15N isotope dilution. II. Effect of cultivars of beans. Agron. J. 75, 645-649.
Rivera, A., Casquero, P. A., Mayo, S., Almirall, A., Plans, M., Simó, J., et al. (2016). Culinary and sensory traits diversity in the Spanish core collection of common beans (Phaseolus vulgaris L.). Spanish J. Agric. Res. 14, e0701. doi:10.5424/sjar/2016141-7726.
Rodiño, A. P., Santalla, M., Montero, I., Casquero, P. A., y De Ron, A. M. (2001). Diversity of common bean (Phaseolus vulgaris L.) germplasm from Portugal. Genet. Resour. Crop Evol. 48, 409-417. doi:10.1023/A:1012248002436.
Rubio, M., Hermosa, R., Reino, J., Collado, I., y Monte, E. (2009). Thctf1 transcription factor of Trichoderma harzianum is involved in 6-pentyl-2H-pyran-2-one production and antifungal activity. Fungal Genet. Biol. 46, 17-27. doi:10.1016/j.fgb.2008.10.008.
Ruocco, M., Lanzuise, S., Vinale, F., Marra, R., Turrà, D., Woo, S. L., et al. (2009). Identification of a new biocontrol gene in Trichoderma atroviride: the role of an ABC transporter membrane pump in the interaction with different plant-pathogenic fungi. Mol. Plant-Microbe Interact. 22, 291-301. doi:10.1094/MPMI -22-3-0291.
Samuels, G. J. (1996). Trichoderma: a review of biology and systematics of the genus. Mycol. Res. 100, 923-935. doi:10.1016/S0953-7562(96)80043-8.
Santalla, M., Rodiño, A. P., y De Ron, A. (2002). Allozyme evidence supporting southwestern Europe as a secondary center of genetic diversity for the common bean. Theor. Appl. Genet. 104, 934-944. doi:10.1007/s00122-001-0844-6.
Sanz, L., Montero, M., Grondona, I., Vizcaíno, J. A., Llobell, A., Hermosa, R., et al. (2004). Cell wall-degrading isoenzyme profiles of Trichoderma biocontrol strains show correlation with rDNA taxonomic species. Curr. Genet. 46, 277-286. doi:10.1007/s00294-004-0532-6.
van Schoonhoven, A., y Pastor-Corrales, M. A. (1987). Standard system for the evaluation of bean germplasm. Cali (Colombia): Centro Internacional de Agricultura Tropical.
Shoresh, M., Harman, G. E., y Mastouri, F. (2010). Induced systemic resistance and plant responses to fungal biocontrol agents. Annu. Rev. Phytopathol. 48, 21-43. doi:10.1146/annurev-phyto-

Introducción
36
073009-114450.
Singh, S. P., Gepts, P., y Debouck, D. G. (1991). Races of common bean (Phaseolus vulgaris, Fabaceae). Econ. Bot. 45, 379-396. doi:10.1007/BF02887079.
Stavely, J. R. (1984). Pathogenic specialitation in Uromyces phaseoli in the United States and rust resistance in beans. Plant Dis. 68, 95-99.
Tadeo, F. R., y Gómez-Cadenas, A. (2008). «Fisiología de las plantas y el estrés», en Fundamentos de fisología vegetal, eds. J. Azcón-Bieto y M. Talón (Barcelona, Spain: McGraw-Hill), 577-597.
Tello, J. C., Lacasa, A., y Molina, R. (1985). Una nota fitopatológica sobre el complejo parasitario del pie de la judía (Phaseolus vulgaris). ITEA 61, 57-69.
Valenciano, J. B., Casquero, P. A., y Boto, J. A. (2004). Influence of sowing techniques and pesticide application on the emergence and the establishment of bean plants (Phaseolus vulgaris L.). Agronomie 24, 113-118. doi:10.1051/agro:2004007.
Valenciano, J. B., Casquero, P. A., Boto, J. A., y Guerra, M. (2006a). Effect of sowing techniques and seed pesticide application on dry bean yield and harvest components. F. Crop. Res. 96, 2-12. doi:10.1016/j.fcr.2005.04.016.
Valenciano, J. B., Casquero, P. A., Boto, J. A., y Marcelo, V. (2006b). Evaluation of the occurrence of root rots on bean plants (Phaseolus vulgaris) using different sowing methods and with different techniques of pesticide application. New Zeal. J. Crop Hortic. Sci. 34, 291-298. doi:10.1080/01140671.2006.9514419.
Vargas, W. A., Crutcher, F. K., y Kenerley, C. M. (2011). Functional characterization of a plant-like sucrose transporter from the beneficial fungus Trichoderma virens. Regulation of the symbiotic association with plants by sucrose metabolism inside the fungal cells. New Phytol. 189, 777-789. doi:10.1111/j.1469-8137.2010.03517.x.
Veitch, N. C. (2009). Isoflavonoids of the Leguminosae. Nat. Prod. Rep. 26, 776. doi:10.1039/b616809b.
Vinale, F., Flematti, G., Sivasithamparam, K., Lorito, M., Marra, R., Skelton, B. W., et al. (2009). Harzianic acid, an antifungal and plant growth promoting metabolite from Trichoderma harzianum. J. Nat. Prod. 72, 2032-2035. doi:10.1021/np900548p.
Vinale, F., Sivasithamparam, K., Ghisalberti, E. L., Marra, R., Woo, S. L., y Lorito, M. (2008). Trichoderma–plant–pathogen interactions. Soil Biol. Biochem. 40, 1-10. doi:10.1016/j.soilbio.2007.07.002.
Viterbo, A., Landau, U., Kim, S., Chernin, L., y Chet, I. (2010). Characterization of ACC deaminase from the biocontrol and plant growth-promoting agent Trichoderma asperellum T203. FEMS Microbiol. Lett. 305, 42-48. doi:10.1111/j.1574-6968.2010.01910.x.
Vizcaino, J. A., Sanz, L., Basilio, A., Vicente, F., Gutiérrez, S., Hermosa, M. R., et al. (2005). Screening of antimicrobial activities in Trichoderma isolates representing three Trichoderma sections. Mycol. Res. 109, 1397-1406. doi:10.1017/S0953756205003898.
Wang, K. L.-C., Li, H., y Ecker, J. R. (2002). Ethylene biosynthesis and signaling networks. Plant Cell 14, S131-S151. doi:10.1105/TPC.001768.
Weindling, R. (1932). Trichoderma lignorum as a parasite of other soil fungi. Phytopathology 22, 837-845.
Weindling, R. (1934). Studies on a lethal principle effective in the parasitic action of Trichoderma lignorum on Rhizoctonia solani and other soil fungi. Phytopathology 24, 151-153.
Woo, S. L., Scala, F., Ruocco, M., y Lorito, M. (2006). The molecular biology of the interactions between Trichoderma spp., phytopathogenic fungi, and plants. Phytopathology 96, 181-185.

Bibliografía
37
Zizumbo-Villarreal, D., y Colunga-GarcíaMarín, P. (2010). Origin of agriculture and plant domestication in West Mesoamerica. Genet. Resour. Crop Evol. 57, 813-825. doi:10.1007/s10722-009-9521-4.

capítulo I
Trichoderma species as biocontrol agents in legumes


Índice capítulo I
1. INTRODUCTION............................................................................................... 44
2. TRICHODERMA SPP. ........................................................................................ 44
2.1. Promotion of plant growth. .................................................................................................. 45
2.2. Mycoparasitism ................................................................................................................... 47
2.3. Competition for nutrients. ................................................................................................... 48
2.4. Production of antibiosis compounds. .................................................................................. 48
2.5. Induction of resistance ......................................................................................................... 49
2.6. Production of antibiotic compounds: Changes in plant metabolism as defence response. .. 50

FIGURAS
Figure 1: Beneficial effect of Trichoderma for the plant. ............................................................. 45

Capítulo I
43
Chapter
Trichoderma species as biocontrol agents in legumes.
Sara Mayo1; Santiago Gutiérrez1; Rosa E. Cardoza1; Rosa Hermosa2;
Enrique Monte2; Pedro A. Casquero1*
1Research Group of Engineering and Sustainable Agriculture, University of León, León, Spain 2Spanish-Portuguese Centre for Agricultural Research, University of Salamanca, Salamanca,
Spain
ABSTRACT
Trichoderma spp. (Teleomorph: Hypocrea) is a fungal genus that is found in the soil, and it is a secondary fast growing opportunistic invasive producer of chitinases, glucanases and proteases, and metabolites with antimicrobial activity. Many Trichoderma species are also well known as biocontrol agents of important phytopathogenic fungi. The primary mechanisms of biocontrol used by Trichoderma in direct confrontation with pathogenic fungi are the mycoparasitism, antibiosis, and competition for nutrients with the pathogen. Trichoderma species have developed opportunistic mechanisms for their adaptation to abiotic stresses as well as for nutrient uptake and solute transport. Trichodermaspp. is able to promote the growth of legumes. In addition, Trichoderma produces some organic acids such as citric or fumaric acids that reduces soil pH and allows the solubilization of phosphates and other micronutrients such as iron, manganese and magnesium in legume crops. In the legumes, Trichoderma spp. produce several changes in the defence response of the plant, as the accumulation of phytoalexins and down- or up-regulation of defence-related genes expression.
Keywords: Biocontrol; Defence response; Induction of resistance; Mycoparasitism; Nutrients; Rhizosphere; Trichoderma;
* Corresponding Author address Dr Pedro A. Casquero Research Group of Engineering and Sustainable Agriculture, University of León Av. Portugal 41, 24071 León, Spain Email: [email protected]

44
1. INTRODUCTION
Pulses belong to the Fabaceae or Leguminosae family; these plants are the world’s third largest group of plant life. They are thought to have originated some 90 million years ago, with a diversification process beginning in the early Tertiary era. The Fabaceae family contains over 20,000 species and 700 genera, of which only some are categorised as leguminous plants, such as the genus Phaseolus, Vicia, Cicer, Lens,… (Food and Agriculture Organization, 2016).
A plant is diseased when it is not functioning normally. The abnormal functioning of plant generally leads to reduction in quantity and quality of yield. Disease is the result of an interaction among the plant and its environmental and it is often affected by biotic and abiotic factors by (microorganisms, humidity, temperature…) that are detected as signals for the activation of plant response mechanisms (American Phytopathological Society, 2005). These crops are affected by a wide diversity of fungal pathogens for example Sclerotinia spp., Fusarium spp., Pythium spp., Botrytis spp, Rhizoctonia spp… causing some important economic losses in these crops.
A form of control to diseased is the application of chemical synthesis fungicides. Its application on the seed or directly to the soil can be effective against fungi that affect the crops during or shortly after germination (Beebe, Corrales, Schoonhoven, & Voysest, 1991) because they reduce its incidence and improve the emergence of plants (Valenciano, Casquero, & Boto, 2004). However, applications with fungicides aimed at avoiding damage caused by fungi that cause root rot or yellowing and wilting are often ineffective and usually impracticable due to the large volume of soil to which they should be directed.
Actually, the number of authorized products by protection plant has been reduced in order to ensure food safety and its sustainable in the long term. It is therefore proposed to prioritize non-chemical methods in integrated production, organic farming, and others.
As a strategy to control legume infectious diseases, mainly those caused by fungi, the use of biocontrol agents can reduce the negative effects of plant pathogens and they also can promote positive responses in the plant (Shoresh, Harman, & Mastouri, 2010). Biocontrol agents are perceived to have specific advantages over synthetic fungicides, including fewer non-target and environmental effects, efficacy against fungicide-resistant pathogens, reduced probability of resistance development and use in organic farming situations where synthetic fungicides are restricted (Brimner & Boland, 2003).
The genera including strains belonging to bacterial genera such as Agrobacterium, Pseudomonas, Streptomyces and Bacillus, and fungal genera such as Gliocladium, Trichoderma, Ampelomyces, Candida and Coniothyrium., are beneficial organisms that have shown good efficiency as biocontrol agents against pathogenic microorganisms (Vinale et al., 2008).
2. TRICHODERMA SPP.
Trichoderma spp. (Teleomorph: Hypocrea) is a fungal genus that is found in the soil, and it is a secondary fast growing opportunistic invasive (Mayo, Cominelli, et al., 2016) producer of chitinases, glucanases and proteases, and metabolites with antimicrobial activity (Lorito, Woo, Harman, & Monte, 2010). Many Trichoderma species are also well known as biocontrol agents of important phytopathogenic fungi. The primary mechanisms of biocontrol used by Trichoderma in direct confrontation with pathogenic fungi are the mycoparasitism, antibiosis, and competition for
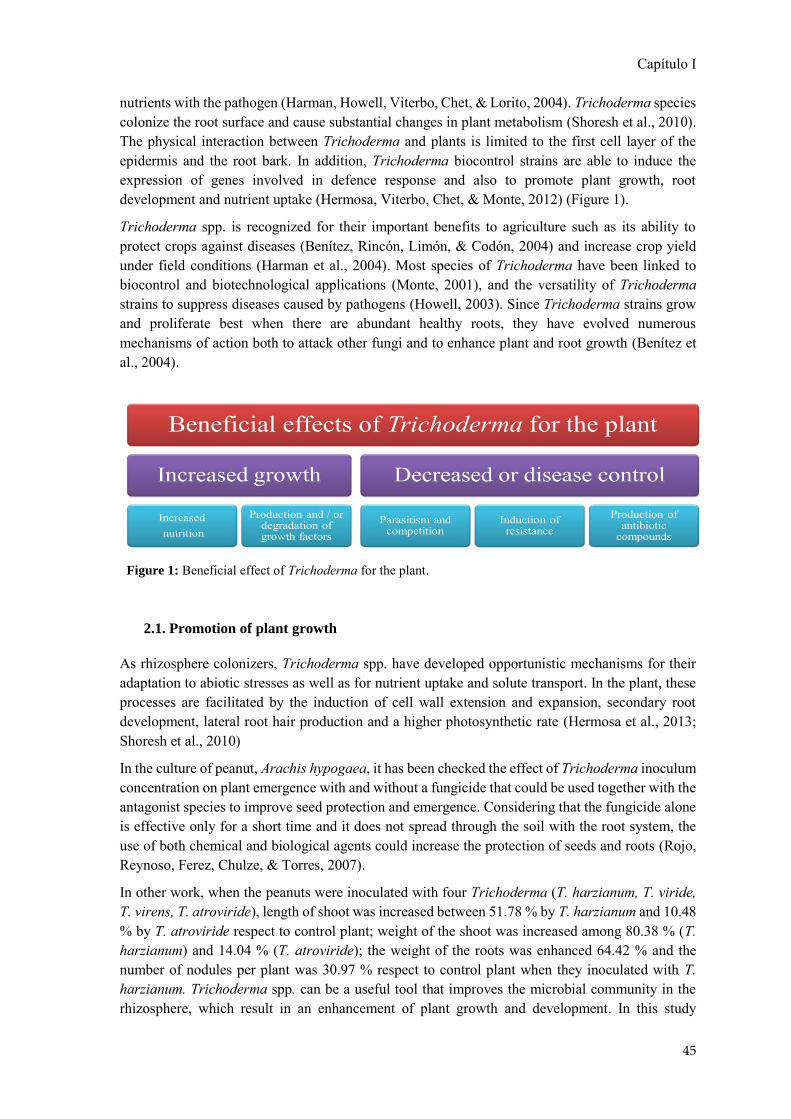
Capítulo I
45
nutrients with the pathogen (Harman, Howell, Viterbo, Chet, & Lorito, 2004). Trichoderma species colonize the root surface and cause substantial changes in plant metabolism (Shoresh et al., 2010). The physical interaction between Trichoderma and plants is limited to the first cell layer of the epidermis and the root bark. In addition, Trichoderma biocontrol strains are able to induce the expression of genes involved in defence response and also to promote plant growth, root development and nutrient uptake (Hermosa, Viterbo, Chet, & Monte, 2012) (Figure 1).
Trichoderma spp. is recognized for their important benefits to agriculture such as its ability to protect crops against diseases (Benítez, Rincón, Limón, & Codón, 2004) and increase crop yield under field conditions (Harman et al., 2004). Most species of Trichoderma have been linked to biocontrol and biotechnological applications (Monte, 2001), and the versatility of Trichoderma strains to suppress diseases caused by pathogens (Howell, 2003). Since Trichoderma strains grow and proliferate best when there are abundant healthy roots, they have evolved numerous mechanisms of action both to attack other fungi and to enhance plant and root growth (Benítez et al., 2004).
2.1. Promotion of plant growth
As rhizosphere colonizers, Trichoderma spp. have developed opportunistic mechanisms for their adaptation to abiotic stresses as well as for nutrient uptake and solute transport. In the plant, these processes are facilitated by the induction of cell wall extension and expansion, secondary root development, lateral root hair production and a higher photosynthetic rate (Hermosa et al., 2013; Shoresh et al., 2010)
In the culture of peanut, Arachis hypogaea, it has been checked the effect of Trichoderma inoculum concentration on plant emergence with and without a fungicide that could be used together with the antagonist species to improve seed protection and emergence. Considering that the fungicide alone is effective only for a short time and it does not spread through the soil with the root system, the use of both chemical and biological agents could increase the protection of seeds and roots (Rojo, Reynoso, Ferez, Chulze, & Torres, 2007).
In other work, when the peanuts were inoculated with four Trichoderma (T. harzianum, T. viride, T. virens, T. atroviride), length of shoot was increased between 51.78 % by T. harzianum and 10.48% by T. atroviride respect to control plant; weight of the shoot was increased among 80.38 % (T.harzianum) and 14.04 % (T. atroviride); the weight of the roots was enhanced 64.42 % and thenumber of nodules per plant was 30.97 % respect to control plant when they inoculated with T.harzianum. Trichoderma spp. can be a useful tool that improves the microbial community in therhizosphere, which result in an enhancement of plant growth and development. In this study
Figure 1: Beneficial effect of Trichoderma for the plant.

46
Trichoderma stimulated early growth in peanut plants, increasing the yield (Kamaruzzaman, Rahman, Islam, Ahmad, & Ahmad, 2016).
Bean plants, P. vulgaris, in contact with some Trichoderma, showed an increased size when the pathogen was not present. Other authors also observed that T. harzianum was able to promote the growth of common bean plants in comparison to plants grown in its absence (Pereira et al., 2014). However, plants treated with T. harzianum did not decrease their size in the presence of R. solani (Mayo et al., 2015). In other work, when bean plants were in contact with T. velutinum isolate, they increased respect to control plants 4.75 % their diameter of hypocotyl, 10.75 % their root system length, 4.27 % and 5.51 % in dry weight of aerial parts and root system, respectively. When plants were infected with the pathogen R. solani, the action of T. velutinum T028 caused an increased of the diameter of the hypocotyl in 8.76 %, 21.15 % in the length of root system, and 11.05 % and 3.43 % in dry weight of aerial parts and root system, respectively, respect to the control plant with the pathogen (Mayo et al., 2016). These data are in agreement with those from Yedidia and coworkers reporting a much stronger effect on cucumber plants treated with T. harzianum, which increased by a 75.0% the root length, 95.0% aerial parts, 80.0% dry weight and 80.0% the size of the blade relative to the untreated control (Yedidia, Srivastva, Kapulnik, & Chet, 2001). T. harzianum was able to promote the growth of common bean plants in comparison to plants grown in its absence (Pereira et al., 2014). In other study, it was evaluated the effect of farnesol on the development of bean plants. This compound that in fungi is presumably produced from farnesyl pyrophosphate, is a signalling molecule for self-regulation that by accumulating in the extracellular space generates a response across local fungal population. The plants were grown under controlled conditions in hydroponic culture for 14 days with different concentrations of farnesol (10 μM, 100 μM, 1000 μM, 2000 μM and 5000 μM) in the nutrition solution and they were evaluated by assessing the wet weight and dry weights of the aerial parts and root systems. The results showed a negative effect on growth at concentrations of 10 μM and 100 μM farnesol, which could be related to abscisic acid synthesis. However, with 2 mM of farnesol, bean plants showed increased development of aerial parts and root systems (Mayo, Izquierdo, et al., 2016).
In other study, Dubey and co-authors (2007) Trichoderma spp. signicantly reduced the wilt incidence in chickpea plants, Cicer arietinum, that were inoculated with Fusarium oxysporum f. sp. Ciceris. The incedence was reduced a 65.85% respect to control plants. Also, the presence of Trichoderma increased the germination of this culture respect to control plants with values between 13.36 % and 8.95 %, the weight of the shoot was increased 31.31 % and the weight of the root was a 41.30 % higher that in control plants.
Trichoderma produces some organic acids such as citric or fumaric acids that reduces soil pH and allows the solubilization of phosphates and other micronutrients such as iron, manganese and magnesium (Benítez et al., 2004; Harman et al., 2004). It has been observed that T. harzianum reduces the amount of iron, manganese, zinc and copper in the leaf biomass of beans, but increases the content of copper in its seeds (Öğüt & Er, 2006). On the other hand, there are some in vitro studies which indicate that T. harzianum and other isolates of Trichoderma could solubilize iron (III) oxide, manganese (IV) oxide, zinc and phosphates, which are highly insoluble compounds orwith low solubility, owing to chelation processes and oxidation-reduction activity (Altomare,Norvell, Björkman, & Harman, 1999). The increment of all those nutrients, in particularphosphorus, could favor the growth of the plants, which are in contact with soils where this fungalspecies is present. It has been shown that T. atroviride produces and degrades indoleacetic acid,which when is produced in combination with ethylene by the microorganisms present in therhizosphere causes an increase in plant growth (Gravel, Antoun, & Tweddell, 2007).

Capítulo I
47
Chagas and co-authors (2016) inoculated cowpea, Vigna unguiculata, with some Trichoderma isolates. An increase in dry matter and phosphorous amounts in the aerial parts was observed in comparison to the control treatment. This effect might be explained by the phosphate solubilization ability of the biological control agents. Various factors might influence the Trichoderma phosphate solubilization ability, including the availability of carbon and nitrogen, the type of cultivated plants (Grayston, Vaughan, & Jones, 1997), and the type of phosphate that is solubilized (Barroso & Nahas, 2005). Similar results were also reported by Kapri and Tewari (2010), who inoculated Trichoderma into chickpea cultures and reported an increase in the phosphate solubilization ability in vitro, with a significant effect on biomass production. These works highlighted the potential of Trichoderma spp. as plant growth promoters in association with their phosphate solubilizing and indole acetic acid synthesis abilities.
According to other study the increase in biomass production related to growth hormones or analogs production is another mechanism by which strains of Trichoderma spp. can improve the growth of plants (Hoyos-Carvajal, Orduz, & Bissett, 2009).
2.2. Mycoparasitism
Mycoparasitism consists in the recognition of the fungus, attacking it and penetrating it with the purpose to cause its death. This process involves some different phases. First of all, Trichoderma locates the pathogen without previous contact, beginning to enlarge towards the pathogen by tropism (Chet, Harman, & Baker, 1981; Lu et al., 2004). During this process, Trichoderma secretes some enzymes that hydrolyze the cell wall of the pathogen (Howell, 2003; Woo, Scala, Ruocco, & Lorito, 2006). It has been studied that Trichoderma releases an extracellular exochitinase (Brunner et al., 2003) that might cause the liberation of some oligomers from the fungus, which could induce the expression of endochitinases that would diffuse and would start to attack to the pathogen even before the physical contact had happened. Some enzymes belonging to these fungi have been purified and used for biocontrol. When they have been assessed, they have showed antifungal activity and have controlled a large number of pathogens, such as Fusarium, Rhizoctonia, Alternaria, Ustilago, Venturia and Colletotrichum (M. Lorito et al., 1993; M. Lorito, Hayes, Di Pietro, Woo, & Harman, 1994).
A major part of the Trichoderma antifungal system consists of a number of genes encoding an astonishing variety of secreted lytic enzymes (Sanz et al., 2004) including endochitinases, N-acetyl-β-glucosaminidases, chitin 1,4-β-chitobiosidases, proteases, glucan β-1,3-glucosidases, glucan β-1,6-glucosidases, glucan α-1,3-glucosidases, lipases, xylanases, mannanases, pectinases, pectin lyases, amylases, phospholipases, RNAses, DNAses, etc. Some of these proteins have been purified and their corresponding genes have been cloned and characterized by our group: protease PRA1 (Suarez, Rey, Castillo, Monte, & Llobell, 2004), chitinases CHIT36 and CHIT37 (Viterbo et al., 2002), α-glucanases AGN13.1 (Ait-Lahsen et al., 2001) and AGN13.2 (Sanz, Montero, Redondo, Llobell, & Monte, 2005), and β-1,6-glucanases BGN16.2 and BGN16.3 (Montero, Sanz, Rey, Llobell, & Monte, 2007; Montero, Sanz, Rey, Monte, & Llobell, 2005).
The direct confrontation assays were used to verify the ability of Trichoderma spp. to overgrow the pathogen and its f mycoparasitim potential. In a study, the percentage of overgrow oscillated between 72.77 and 14.63%, according to the species of Trichoderma (Mayo et al., 2015).
Some Trichoderma spp. are selected because of their mycoparasitic mechanism but the most efficient biocontrol strains display, simultaneous or sequentially, more than one biocontrol strategy

48
(Howell, 2003). Trichoderma spp. can also exert marked antimicrobial activity (Vizcaino et al., 2005) due to the production of blends of secondary metabolites (Cardoza et al., 2005; Reino, Guerrero, Hernández-Galán, & Collado, 2007) of which we have studied the pyrones [6-pentyl-2H-pyran-2-one (6-PP) derivatives] (Keszler et al., 2000) and peptaibols (Vizcaino et al., 2005). Currently, better knowledge about Trichoderma has facilitated its use in biocontrol as whole microorganisms, able to be monitorized in natural environments (Hermosa, Grondona, Díaz-Mínguez, Iturriaga, & Monte, 2001; Rubio, Hermosa, Keck, & Monte, 2005), as enzyme formulations (Benítez et al., 2004) or as sources of genes for transgenic plant development (M Lorito et al., 1998). Since the early description of the capacity of Trichoderma to increase plant biomass production (Chang, Chang, Baker, Kleifeld, & Chet, 1986), several new general mechanisms for both biocontrol and plant growth increase have been demonstrated and it is now clear that there must be hundreds of separate genes and gene products involved in these processes.
2.3. Competition for nutrients
Competition between Trichoderma and pathogens would be established with the purpose to get more nutrients, oxygen, light, (Paulitz, 1990). Trichoderma is an excellent competitor for space and nutritional resources. It appears in almost all soils and in habitats that contains high amounts of organic matter. In those places, it would be an excellent decomposer of plant and fungal material. Moreover, some species of the genus Trichoderma show great metabolomic versatility that allows them to grow using a wide range of nitrogen and carbon sources. Furthermore, Trichoderma has the ability to colonize the rhizosphere, and this skill might be essential for being used as an excellent biological control agent (Howell, 2003).
Genes related to the capacity of Trichoderma to compete in soil and rhizosphere colonization (Chacón et al., 2007) were also described: the first oligopeptide transporter analyzed functionally in filamentous fungi (Vizcaíno et al., 2006) and two heat shock proteins that have been overexpressed in a biocontrol strain of Trichoderma and in plant, improving their resistance to abiotic stresses (Montero, Sanz, Rey, Monte, & Llobell, 2005; Montero, Sanz, Rey, Llobell, & Monte, 2007).
2.4. Production of antibiosis compounds
Trichoderma produces a large number of secondary metabolites with biological activity (Ghisalberti & Sivasithamparam, 1991; Sivasithamparam & Ghisalberti, 1998) that includes some natural chemical compounds related with its survival, its competition ability against organisms, as well as its symbiosis, its transport, its differentiation,... (Demain & Fang, 2000). Furthermore, antibiotics, which could inhibit microbial growth, are also included in this group.
In the antifungal assay on membranes, carried out by Mayo and co-authors (2015), where it was determined the ability of Trichoderma isolates to produce metabolites with inhibitory activity against R. solani the percentages of inhibition ranged between 86% and 58%. In others assays the percentage of inhibition in membrane assays using T. virens T59 and T. atroviride T11 range between 100% and 84.7%, respectively (Campelo et al., 2010).

Capítulo I
49
2.5. Induction of resistance
The relationships established between plant and microorganisms are very diverse, when a plant is exposed to a pathogenic microorganism, the production of molecules associated to salicylic acid is increased, being this a systemic acquired resistance (SAR) response. The response of plants against non-pathogenic microorganisms is different, resulting in activation of signalling cascades that are dependent on jasmonic acid and ethylene, such as hydroperoxide lyase, peroxidase and phenylalanine ammonia lyase, all of which belong to an induced systemic resistance (ISR) response (Druzhinina et al., 2011). Other responses result in a rapid cell death in infected tissues, then plants activate the hypersensitive response that involves the accumulation of salicylic acid, reactive oxygen species and an increased the influx of Ca2+ (Guerrero-González et al., 2011).
In the tripartite interaction of legume plants with a pathogen and a biocontrol Trichoderma species, several changes are produced in the plant, such as the increase in phenolic acid and lignin, accumulation of phytoalexins and down- or up-regulation of defence-related genes expression (Guerrero-González et al., 2011; Mayo et al., 2015) Different categories of defence-related genes whose expression is modulated by biotic stresses have been described in bean plants interacting with pathogen and non-pathogenic microorganisms (Mayo et al., 2015). Several works have studied the expression of defence-related genes in the plants when they have in contact with Trichoderma and/or pathogen.
WRKY transcription factors have been involved in the regulation of plant defence gene expression (Rushton & Somssich, 1998; Singh, Foley, & Oñate-Sánchez, 2002). Thus, WRKY33 has a role in biotic stress defence, where it regulates the balance between necrotrophic and biotrophic pathogen responses (Birkenbihl, Diezel, & Somssich, 2012; Lippok et al., 2007; Pandey & Somssich, 2009). Previous studies have pointed out the involvement of Arabidopsis WRKY transcription factors in regulating the expression of PR genes by direct binding (W. Chen et al., 2002; Kim, Fan, & Chen, 2006). A rapid pathogen-induced WKRY33 expression did not require salicylic acid signalling but a down-regulation of this gene involved a direct activation of jasmonic acid (Bakshi & Oelmüller, 2014). In the work by Mayo and co-workers (2016), when bean plants were in contact T. velutinum T028 without pathogen, WRKY33 expression was significantly up-regulated while the PR genes expression (PR2, PR3 and PR4) was significantly down-regulated compared to expression levels in plants without Trichoderma treatment. However, in the same work, when the pathogen Rhizoctonia solani was added to the substrate, expression of WRKY33 was significantly down-regulated in plants with Trichoderma inoculation, while PR2, PR3 and PR4 were down-regulated.
WRKY33 is also involved in the regulation of the expression of genes modulated by components of the ethylene-signalling pathway. Expression of the ERF1 and ERF5 reached similar significant values either with or without Trichoderma and or R. solani in the substrate. WRKY33 would act as a represor of ERF1 and ERF5 expression. Thus, when the expression of WRKY33 is increased, expression of ERF1 and ERF5 is down-regulated (Mayo et al., 2016).
Other gene is CH5b encodes an endochitinase precursor and it is also related with the ethylene- signalling pathway. In previous works, it has been shown that, when this gene was over-expressed the R. solani symptoms were reduced in crops like Nicotiana tabacum and Brassica napus (Broglie et al., 1991). However, in the study by Mayo et al. (2016), when P. vulgaris plants were in contact with R. solani, the expression of this gene was down-regulated but not significantly, while treatment of these infected plants with T. velutinum resulted in its significant up-regulation. These results are in agreement with previous data, showing that the pathogen represses its expression, and the presence of Trichoderma induced it (Mayo et al., 2015).

50
PAL plays an important role in plant defence; it is involved in the biosynthesis of salicylic acid, which is related to plant systemic resistance (Chaman, Copaja, & Argandoña, 2003; Mauch-Mani & Slusarenko, 1996; Nugroho, Verberne, & Verpoorte, 2002). PAL gene expression is also regulated in response to pathogen infection. The presence of T. velutinum and R. solani in the soil resulted in a significant down-regulation of this gene compared with control plants (Mayo et al., 2016).
The CNGC genes can be related to early plant defence responses due to changes in ion flux, including H+ and Ca2+ influx and K+ and Cl− efflux (Atkinson, Midland, Sims, & Keen, 1996). The up-regulation of CNGC2 can confirm the importance of ion channels for the plant resistance response (Borges, Melotto, Tsai, & Caldas, 2012). CNGC2 was down-regulated in plants treated with T. velutinum (Mayo et al., 2016).
HPL (hydroperoxide lyase) is involved in the production of antimicrobial and defence signalling oxylipins (Huang, Studart Witkowski, & Schwab, 2010; Noordermeer, Veldink, & Vliegenthart, 2001). In this study, the presence of T. velutinum and R. solani, resulted in a down-regulation of this gene expression respect to control plants. In the present case, after 45 days in contact with the fungus T. velutinum and/or R. solani, its expression was down-regulated, indicating that the plant identifies Trichoderma and Rhizoctonia as two invader organisms, and some of the mechanisms activated against the presence of both are similar, independently of the final response specifically activated in the plant by each one (Mayo et al., 2016).
hGS encodes a homoglutathione synthetase that is involved in response to oxidative stress. There is not much information about the behaviour of this gene in the plant. In the study of Mayo and coworkers (2016), when bean plants were in contact with T. velutinum and/or R. solani, expression of this gene was significantly up-regulated compared to control plants. In other studies, treatment of Medicago truncatula plants with compounds that release nitric oxide, a key signalling molecule in plants, induced expression of GST but not hGS in roots (Innocenti et al., 2007). Similarly, common bean plants treated with H2O2 showed up-regulation of hGS in nodules, whereas treatments with cadmium, sodium chloride, or jasmonic acid had no effect (Loscos, Matamoros, & Becana, 2008).
2.6. Production of antibiotic compounds: Changes in plant metabolism as defence
response
When a plant is induced by exposure to a microorganism, starts the production of the biochemical products or physiological changes and activation of various metabolic pathways depends on the type and origin of these signalling natural products. Different secondary metabolites are synthesized after perception and recognition of the signals originating from plant or pathogenic microorganism elicitors created during the first steps of plant defence reactions (Boller & Felix, 2009; Grotewold, 2005; Veitch, 2009). Plants respond after the invasion of a phytopathogen or a biocontrol agent that activates disease resistance response to the invasion, by inducing the expression of defence genes (Mayo et al., 2016) and by the production of some secondary metabolites with antibacterial activity, such as phytoalexins (phenols, isoflavones, terpenes), and some substances that can block pathogen invasion and spread, such as lignin and callose (X. Chen, Qi, & Duan, 2015). Some plants do not produce phytoalexins when are in contact with pathogens, but release toxins that are normally stored as less toxic glycosides (Grayer & Kokubun, 2001).

Capítulo I
51
Trichoderma species also produce plant hormones and solubilize minerals in the soil which help to promote plant growth and suppress the disease (Kim et al., 2006).
During the Trichoderma-plant interaction various classes of metabolites could induce resistance such as proteins with enzymatic activity, low molecular weight compounds, related to the fungal or the plant cell wall, originated by the enzymatic activity of Trichoderma (Woo et al., 2006; Woo & Lorito, 2007) and other secondary metabolites that trigger plant defence mechanisms against the pathogen (Hermosa et al., 2012; Malmierca et al., 2014), by inducing the expression of pathogenesis–related (PR) proteins that reduce the diseases symptoms.
During the plant-Trichoderma interactions, the fungus participates actively in protecting and improving its ecological niche. Leucine-rich repeat (LRR)-containing proteins are signal receptors regulating plant development and defence (Afzal, Wood, & Lightfoot, 2008). In the work of Marra and co-authors (2006) observed that LRR proteins increased in bean leaves (Phaseolus vulgaris)interacting with T. atroviride, and that hydrophobins and ABC transporters were accumulated in the proteome of the fungus. Hydrophobins (Rosado et al., 2007) and ABC transporters (Ruocco et al., 2007) support the biocontrol activity of Trichoderma and its ability to colonize the roots. In a similar way, a Trichoderma-secreted swollenin (an expansin-like 5 protein) remarkably increased fungus plant root colonization efficiency and, due to a cellulose-binding domain was able to trigger defence responses in the plant and afforded pathogen protection, indicating that this domain might therefore be recognized by the plant as a microbe-associated molecular pattern (MAMP) in the Trichoderma-plant interaction (Brotman, Briff, Viterbo, & Chet, 2008). At least four classes of substances that elicit plant defence responses have been identified in Trichoderma: polysaccharide oligomers, enzymes, low molecular weight proteins and peptaibols. Some cell wall oligomers may act as elicitor molecules released by plants following pathogen attack (Woo et al., 2006), the overexpression of Trichoderma chitinase genes in tobacco plants generates innate defence responses and enhanced stress tolerance (Dana, Pintor-Toro, & Cubero, 2006), hydrophobin-like cysteine-rich low molecular weight secreted proteins Sm1 from T. virens and Epl1 from T. atroviride (Djonović, Pozo, Dangott, Howell, & Kenerley, 2006; Seidl, Marchetti, Schandl, Allmaier, & Kubicek, 2006) can also trigger ISR but, with the exception of peptaibols as elicitors of plant defence responses (Viterbo, Wiest, Brotman, Chet, & Kenerley, 2007), the role of secondary metabolites in this task remains unexplored.
REFERENCES
Afzal, A. J., Wood, A. J., & Lightfoot, D. A. (2008). Plant receptor-like serine threonine kinases: Roles in signaling and plant defense. Molecular Plant-Microbe Interactions, 21(5), 507–517. http://doi.org/10.1094/MPMI-21-5-0507.
Ait-Lahsen, H., Soler, A., Rey, M., de La Cruz, J., Monte, E., & Llobell, A. (2001). An antifungal exo-alpha-1,3-glucanase (AGN13.1) from the biocontrol fungus Trichoderma harzianum. Applied and Environmental Microbiology, 67(12), 5833–5839. http://doi.org/10.1128/AEM.67.12.5833-5839.2001.
Altomare, C., Norvell, W. A., Björkman, T., & Harman, G. E. (1999). Solubilization of phosphates and micronutrients by the plant-growth- promoting and biocontrol fungus Trichoderma harzianum Rifai 1295-22. Applied and Environmental Microbiology, 65(7), 2926–2933.

52
American Phytopathological Society. (2005). Compendium of bean diseases. (Schwartz HF, Steadman J R, Hall R, & Forster R L, Eds.) (2nd ed.). APS Press, American Phytopathological Society.
Atkinson, M. M., Midland, S. L., Sims, J. J., & Keen, N. T. (1996). Syringolide 1 triggers Ca2 influx, K efflux, and extracellular alkalization in soybean cells carrying the disease-resistance gene Rpg4. Plant Physiology, 112(1), 297–302. http://doi.org/10.1104/pp.112.1.297.
Bakshi, M., & Oelmüller, R. (2014). WRKY transcription factors. Plant Signaling & Behavior, 9(2), e27700. http://doi.org/10.4161/psb.27700.
Barroso, C. B., & Nahas, E. (2005). The status of soil phosphate fractions and the ability of fungi to dissolve hardly soluble phosphates. Applied Soil Ecology, 29(1), 73–83. http://doi.org/10.1016/j.apsoil.2004.09.005.
Beebe, S. E., Corrales, M. P., Schoonhoven, A. van, & Voysest, O. (1991). Breeding for disease resistance. In O. Schoonhoven, A. van;Voysest (Ed.), Common beans: research for crop improvement. (pp. 561–617). Wallingford: CAB International.
Benítez, T., Rincón, A. M., Limón, M. C., & Codón, A. C. (2004). Biocontrol mechanisms of Trichoderma strains. International Microbiology, 7(4), 249–260. http://doi.org/10.2436/IM.V7I4.9480.
Birkenbihl, R. P., Diezel, C., & Somssich, I. E. (2012). Arabidopsis WRKY33 is a key transcriptional regulator of hormonal and metabolic responses toward Botrytis cinerea infection. Plant Physiology, 159(1), 266–285. http://doi.org/10.1104/pp.111.192641.
Boller, T., & Felix, G. (2009). A Renaissance of elicitors: perception of microbe-associated molecular patterns and danger signals by pattern-recognition receptors. Annual Review of Plant Biology, 60(1), 379–406. http://doi.org/10.1146/annurev.arplant.57.032905.105346.
Borges, A., Melotto, M., Tsai, S. M., & Caldas, D. G. G. (2012). Changes in spatial and temporal gene expression during incompatible interaction between common bean and Anthracnose pathogen. Journal of Plant Physiology, 169(12), 1216–1220. http://doi.org/10.1016/j.jplph.2012.04.003.
Brimner, T. A., & Boland, G. J. (2003). A review of the non-target effects of fungi used to biologically control plant diseases. Agriculture, Ecosystems & Environment, 100(1), 3–16. http://doi.org/http://dx.doi.org/10.1016/S0167-8809(03)00200-7.
Broglie, K., Chet, I., Holliday, M., Cressman, R., Biddle, P., Knowlton, S., … Broglie, R. (1991). Transgenic plants with enhanced resistance to the fungal pathogen Rhizoctonia solani. Science, 254(5035), 1194–1197. http://doi.org/10.1126/science.254.5035.1194.
Brotman, Y., Briff, E., Viterbo, A., & Chet, I. (2008). Role of swollenin, an expansin-like protein from Trichoderma, in plant root colonization. Plant Physiology, 147, 779–789. http://doi.org/10.1104/pp.108.116293.
Brunner, K., Peterbauer, C. K., Mach, R. L., Lorito, M., Zeilinger, S., & Kubicek, C. P. (2003). The Nag1 N-acetylglucosaminidase of Trichoderma atroviride is essential for chitinase induction by chitin and of major relevance to biocontrol. Current Genetics, 43(4), 289–295.
Campelo, M. P., Cardoza, R. E., Lorenzana, A., Hermosa, M. R., Monte, E., Reinoso, B., … Casquero, P. A. (2010). Biological control of phytopathogenic fungi in bean (Phaseolus vulgaris, L.) with Trichoderma atroviride and Trichoderma virens. In P. Miklas & P. Gepts (Eds.), Bean Improvement Cooperative Fort Collins (Vol. 53, pp. 114–115). Colorado, USA.
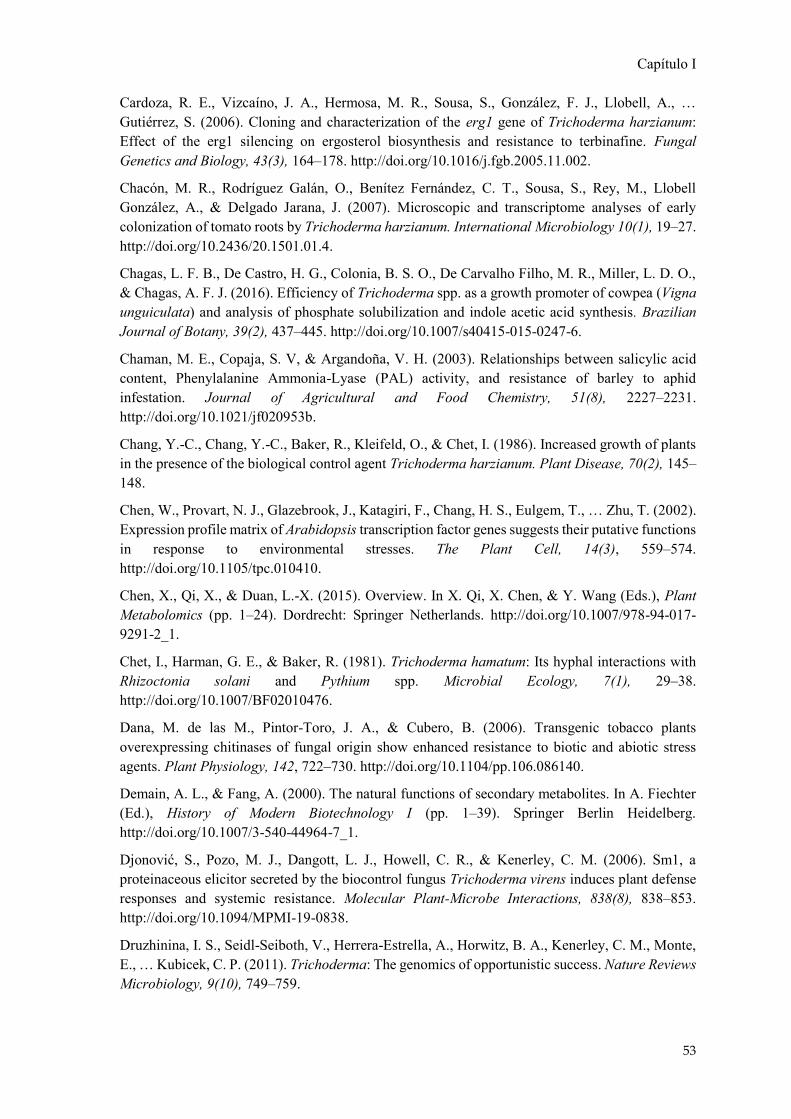
Capítulo I
53
Cardoza, R. E., Vizcaíno, J. A., Hermosa, M. R., Sousa, S., González, F. J., Llobell, A., … Gutiérrez, S. (2006). Cloning and characterization of the erg1 gene of Trichoderma harzianum: Effect of the erg1 silencing on ergosterol biosynthesis and resistance to terbinafine. Fungal Genetics and Biology, 43(3), 164–178. http://doi.org/10.1016/j.fgb.2005.11.002.
Chacón, M. R., Rodríguez Galán, O., Benítez Fernández, C. T., Sousa, S., Rey, M., Llobell González, A., & Delgado Jarana, J. (2007). Microscopic and transcriptome analyses of early colonization of tomato roots by Trichoderma harzianum. International Microbiology 10(1), 19–27. http://doi.org/10.2436/20.1501.01.4.
Chagas, L. F. B., De Castro, H. G., Colonia, B. S. O., De Carvalho Filho, M. R., Miller, L. D. O., & Chagas, A. F. J. (2016). Efficiency of Trichoderma spp. as a growth promoter of cowpea (Vigna unguiculata) and analysis of phosphate solubilization and indole acetic acid synthesis. Brazilian Journal of Botany, 39(2), 437–445. http://doi.org/10.1007/s40415-015-0247-6.
Chaman, M. E., Copaja, S. V, & Argandoña, V. H. (2003). Relationships between salicylic acid content, Phenylalanine Ammonia-Lyase (PAL) activity, and resistance of barley to aphid infestation. Journal of Agricultural and Food Chemistry, 51(8), 2227–2231. http://doi.org/10.1021/jf020953b.
Chang, Y.-C., Chang, Y.-C., Baker, R., Kleifeld, O., & Chet, I. (1986). Increased growth of plants in the presence of the biological control agent Trichoderma harzianum. Plant Disease, 70(2), 145–148.
Chen, W., Provart, N. J., Glazebrook, J., Katagiri, F., Chang, H. S., Eulgem, T., … Zhu, T. (2002). Expression profile matrix of Arabidopsis transcription factor genes suggests their putative functions in response to environmental stresses. The Plant Cell, 14(3), 559–574. http://doi.org/10.1105/tpc.010410.
Chen, X., Qi, X., & Duan, L.-X. (2015). Overview. In X. Qi, X. Chen, & Y. Wang (Eds.), Plant Metabolomics (pp. 1–24). Dordrecht: Springer Netherlands. http://doi.org/10.1007/978-94-017-9291-2_1.
Chet, I., Harman, G. E., & Baker, R. (1981). Trichoderma hamatum: Its hyphal interactions with Rhizoctonia solani and Pythium spp. Microbial Ecology, 7(1), 29–38. http://doi.org/10.1007/BF02010476.
Dana, M. de las M., Pintor-Toro, J. A., & Cubero, B. (2006). Transgenic tobacco plants overexpressing chitinases of fungal origin show enhanced resistance to biotic and abiotic stress agents. Plant Physiology, 142, 722–730. http://doi.org/10.1104/pp.106.086140.
Demain, A. L., & Fang, A. (2000). The natural functions of secondary metabolites. In A. Fiechter (Ed.), History of Modern Biotechnology I (pp. 1–39). Springer Berlin Heidelberg. http://doi.org/10.1007/3-540-44964-7_1.
Djonović, S., Pozo, M. J., Dangott, L. J., Howell, C. R., & Kenerley, C. M. (2006). Sm1, a proteinaceous elicitor secreted by the biocontrol fungus Trichoderma virens induces plant defense responses and systemic resistance. Molecular Plant-Microbe Interactions, 838(8), 838–853. http://doi.org/10.1094/MPMI-19-0838.
Druzhinina, I. S., Seidl-Seiboth, V., Herrera-Estrella, A., Horwitz, B. A., Kenerley, C. M., Monte, E., … Kubicek, C. P. (2011). Trichoderma: The genomics of opportunistic success. Nature Reviews Microbiology, 9(10), 749–759.

54
Dubey, S. C., Suresh, M., & Singh, B. (2007). Evaluation of Trichoderma species against Fusarium oxysporum f. sp. ciceris for integrated management of chickpea wilt. Biological Control, 40(1), 118–127. http://doi.org/10.1016/j.biocontrol.2006.06.006.
Food and Agriculture Organization. (2016). Pulses: Nutritious seeds for a sustainable future. (P. Javaloyes & S. O’Broin, Eds.). Food and Agriculture Organization of the United Nations.
Ghisalberti, E. L., & Sivasithamparam, K. (1991). Antifungal antibiotics produced by Trichoderma spp. Soil Biology and Biochemistry, 23(11), 1011–1020. http://doi.org/10.1016/0038-0717(91)90036-J.
Gravel, V., Antoun, H., & Tweddell, R. J. (2007). Growth stimulation and fruit yield improvement of greenhouse tomato plants by inoculation with Pseudomonas putida or Trichoderma atroviride: Possible role of indole acetic acid (IAA). Soil Biology and Biochemistry, 39(8), 1968–1977. http://doi.org/10.1016/j.soilbio.2007.02.015.
Grayer, R. J., & Kokubun, T. (2001). Plant–fungal interactions: the search for phytoalexins and other antifungal compounds from higher plants. Phytochemistry, 56(3), 253–263. http://doi.org/10.1016/S0031-9422(00)00450-7.
Grayston, S. J., Vaughan, D., & Jones, D. (1997). Rhizosphere carbon flow in trees, in comparison with annual plants: the importance of root exudation and its impact on microbial activity and nutrient availability. Applied Soil Ecology, 5(1), 29–56. http://doi.org/10.1016/S0929-1393(96)00126-6.
Grotewold, E. (2005). Plant metabolic diversity: a regulatory perspective. Trends in Plant Science, 10(2), 57–62. http://doi.org/10.1016/j.tplants.2004.12.009.
Guerrero-González, M. L., Rodríguez-Kessler, M., Rodríguez-Guerra, R., González-Chavira, M., Simpson, J., Sanchez, F., & Jiménez-Bremont, J. F. (2011). Differential expression of Phaseolus vulgaris genes induced during the interaction with Rhizoctonia solani. Plant Cell Reports, 30(8), 1465–1473. http://doi.org/10.1007/s00299-011-1055-5.
Harman, G. E., Howell, C. R., Viterbo, A., Chet, I., & Lorito, M. (2004). Trichoderma species--opportunistic, avirulent plant symbionts. Nature Reviews in Microbiology, 2(1), 43–56. http://doi.org/10.1038/nrmicro797.
Hermosa, M. R., Grondona, I., Díaz-Mínguez, J. M., Iturriaga, E. A., & Monte, E. (2001). Development of a strain-specific SCAR marker for the detection of Trichoderma atroviride 11, a biological control agent against soilborne fungal plant pathogens. Current Genetics, 38(6), 343–350. http://doi.org/10.1007/s002940000173.
Hermosa, M. R., Viterbo, A., Chet, I., & Monte, E. (2012). Plant-beneficial effects of Trichoderma and of its genes. Microbiology, 158(1), 17–25. http://doi.org/10.1099/mic.0.052274-0.
Hermosa, R., Rubio, M. B., Cardoza, R. E., Nicolás, C., Monte, E., & Gutiérrez, S. (2013). The contribution of Trichoderma to balancing the costs of plant growth and defense. International Microbiology, 16(2), 69–80.
Howell, C. R. (2003). Mechanisms employed by Trichoderma species in the biological control of plant diseases: the history and evolution of current concepts. Plant Disease, 87(1), 4–10.
Hoyos-Carvajal, L., Orduz, S., & Bissett, J. (2009). Growth stimulation in bean (Phaseolus vulgaris L.) by Trichoderma. Biological Control, 51(3), 409–416. http://doi.org/10.1016/j.biocontrol.2009.07.018.

Capítulo I
55
Huang, F. C., Studart Witkowski, C., & Schwab, W. (2010). Overexpression of hydroperoxide lyase gene in Nicotiana benthamiana using a viral vector system. Plant Biotechnology Journal, 8(7), 783–795. http://doi.org/10.1111/j.1467-7652.2010.00508.x.
Innocenti, G., Pucciariello, C., Le Gleuher, M., Hopkins, J., de Stefano, M., Delledonne, M., … Frendo, P. (2007). Glutathione synthesis is regulated by nitric oxide in Medicago truncatula roots. Planta, 225(6), 1597–1602. http://doi.org/10.1007/s00425-006-0461-3.
Kamaruzzaman, M., Rahman, M. M., Islam, M. S., Ahmad, M. U., & Ahmad, M. U. (2016). Efficacy of four selective Trichoderma isolates as plant growth promoters in two peanut varieties. International Journal of Biological Research, 4(2), 152. http://doi.org/10.14419/ijbr.v4i2.6468.
Kapri, A., & Tewari, L. (2010). Phosphate solubilization potential and phosphatase activity of rhizospheric Trichoderma spp. Brazilian Journal of Microbiology, 41(3), 787–795. http://doi.org/10.1590/S1517-83822010005000001.
Keszler, A., Forgács, E., Kótai, L., Vizcaíno, J. A., Monte, E., & García-Acha, I. (2000). Separation and identification of volatile components in the fermentation broth of Trichoderma atroviride by solid-phase extraction and gas chromatography-mass spectrometry. Journal of Chromatographic Science, 38(10), 421–4. http://doi.org/10.1093/CHROMSCI/38.10.421.
Kim, K. C., Fan, B., & Chen, Z. (2006). Pathogen-induced Arabidopsis WRKY7 is a transcriptional repressor and enhances plant susceptibility to Pseudomonas syringae. Plant Physiology, 142(3), 1180–1192. http://doi.org/10.1104/pp.106.082487.
Lippok, B., Birkenbihl, R. P., Rivory, G., Brümmer, J., Schmelzer, E., Logemann, E., & Somssich, I. E. (2007). Expression of AtWRKY33 encoding a pathogen-or PAMP-responsive WRKY transcription factor is regulated by a composite DNA motif containing W box elements. Molecular Plant-Microbe Interactions, 20(4), 420–429. http://doi.org/10.1094/MPMI-20-4-0420.
Lorito, M., Harman, G. E., Hayes, C. K., Broadway, R. M., Tronsmo, A., Woo, S. L., & Di Pietro, A. (1993). Chitinolytic enzymes produced by Trichoderma harzianum: antifungal activity of purified endochitinase and chitobiosidase. Phytopathology, 83(3), 302–307.
Lorito, M., Hayes, C. K., Di Pietro, A., Woo, S. L., & Harman, G. E. (1994). Purification, characterization, and synergistic activity of a glucan 1,3-β-glucosidase and an N-acetyl-β-glucosaminidase from Trichoderma harzianum. Phytopathology, 84(4), 398–405.
Lorito, M., Woo, S. L., Garcia, I., Colucci, G., Harman, G. E., Pintor-Toro, J. A., … Fernandez, I. G. (1998). Genes from mycoparasitic fungi as a source for improving plant resistance to fungal pathogens. Proceedings of the National Academy of Sciences of the United States of America, 95(14), 7860–7865.
Lorito, M., Woo, S. L., Harman, G. E., & Monte, E. (2010). Translational research on Trichoderma : From ’Omics to the Field. Annual Review of Phytopathology, 48(1), 395–417. http://doi.org/10.1146/annurev-phyto-073009-114314.
Loscos, J., Matamoros, M. A., & Becana, M. (2008). Ascorbate and homoglutathione metabolism in common bean nodules under stress conditions and during natural senescence. Plant Physiology, 146(3), 1282–1292. http://doi.org/10.1104/pp.107.114066.
Lu, Z., Tombolini, R., Woo, S., Zeilinger, S., Lorito, M., & Jansson, J. K. (2004). In vivo study of Trichoderma-pathogen-plant interactions, using constitutive and inducible green fluorescent protein reporter systems. Applied and Environmental Microbiology, 70(5), 3073–81. http://doi.org/10.1128/AEM.70.5.3073-3081.2004.

56
Malmierca, M. G., Barua, J., Mccormick, S. P., Izquierdo-Bueno, I., Cardoza, R. E., Alexander, N. J., … Gutiérrez, S. (2014). Novel aspinolide production by Trichoderma arundinaceum with a potential role in Botrytis cinerea antagonistic activity and plant defence priming. Environmental Microbiology, 17(4), 1103–1118. http://doi.org/10.1111/1462-2920.12514.
Marra, R., Ambrosino, P., Carbone, V., Vinale, F., Woo, S. L., Ruocco, M., … Lorito, M. (2006). Study of the three-way interaction between Trichoderma atroviride, plant and fungal pathogens by using a proteomic approach. Current Genetics, 50(5), 307–321. http://doi.org/10.1007/s00294-006-0091-0.
Mauch-Mani, B., & Slusarenko, A. J. (1996). Production of salicylic acid precursors is a major function of Phenylalanine Ammonia-Lyase in the resistance of Arabidopsis to Peronospora parasitica. The Plant Cell, 8(2), 203–212. http://doi.org/10.1105/tpc.8.2.203.
Mayo, S., Cominelli, E., Sparvoli, F., González-López, O., Rodríguez-González, A., Gutiérrez, S., & Casquero, P. A. (2016). Development of a qPCR strategy to select bean genes involved in plant defense response and regulated by the Trichoderma velutinum – Rhizoctonia solani interaction. Frontiers in Plant Science, 7, 1109. http://doi.org/10.3389/fpls.2016.01109.
Mayo, S., Gutierrez, S., Malmierca, M. G., Lorenzana, A., Campelo, M. P., Hermosa, R., … Casquero, P. A. (2015). Influence of Rhizoctonia solani and Trichoderma spp. in growth of bean (Phaseolus vulgaris L.) and in the induction of plant defense-related genes. Frontiers in Plant Science, 6, 685. http://doi.org/10.3389/fpls.2015.00685.
Mayo, S., Izquierdo, H., González-López, Ó., Rodríguez-González, Á., Lorenzana, A., Gutiérrez, S., & Casquero, P. A. (2016). Effect of farnesol, a compound produced by Trichoderma when growing on bean (Phaseolus vulgaris L.). In Joint Natural Products Conference. Copenhague.
Monte, E. (2001). Understanding Trichoderma : between biotechnology and microbial ecology. International Microbiology, 4, 1–4. http://doi.org/10.1007/s101230100001.
Montero, M., Sanz, L., Rey, M., Llobell, A., & Monte, E. (2007). Cloning and characterization of bgn16·3, coding for a β-1,6-glucanase expressed during Trichoderma harzianum mycoparasitism. Journal of Applied Microbiology, 103(4), 1291–1300. http://doi.org/10.1111/j.1365-2672.2007.03371.x.
Montero, M., Sanz, L., Rey, M., Monte, E., & Llobell, A. (2005). BGN16.3, a novel acidic β-1,6-glucanase from mycoparasitic fungus Trichoderma harzianum CECT 2413. FEBS Journal, 272(13), 3441–3448. http://doi.org/10.1111/j.1742-4658.2005.04762.x.
Noordermeer, M. A., Veldink, G. A., & Vliegenthart, J. F. G. (2001). Fatty acid hydroperoxide lyase: a plant cytochrome P450 enzyme involved in wound healing and pest resistance. Chembiochem, 2(7‐8), 494–504. http://doi.org/10.1002/1439-7633(20010803)2:7.
Nugroho, L. H., Verberne, M. C., & Verpoorte, R. (2002). Activities of enzymes involved in the phenylpropanoid pathway in constitutively salicylic acid-producing tobacco plants. Plant Physiology and Biochemistry, 40(9), 755–760. http://doi.org/10.1016/S0981-9428(02)01437-7.
Öğüt, M., & Er, F. (2006). Micronutrient composition of field-grown dry bean and wheat inoculated with Azospirillum and Trichoderma. Journal of Plant Nutrition and Soil Science, 169(5), 699–703. http://doi.org/10.1002/jpln.200520597.
Pandey, S. P., & Somssich, I. E. (2009). The role of WRKY transcription factors in plant immunity. Plant Physiology, 150(4), 1648–1655. http://doi.org/10.1104/pp.109.138990.

Capítulo I
57
Paulitz, T. C. (1990). Biochemical and ecological aspect of competition in biological control. In R. R. Baker & P. E. Dunn (Eds.), New directions in biological control. Alternatives for suppressing agricultural pests and diseases (p. 837). New York (USA): Wiley-Liss Inc.
Pereira, J. L., Queiroz, R. M. L., Charneau, S. O., Felix, C. R., Ricart, C. A. O., Lopes Da Silva, F., … Noronha, E. F. (2014). Analysis of Phaseolus vulgaris response to its association with Trichoderma harzianum (ALL-42) in the presence or absence of the phytopathogenic fungi Rhizoctonia solani and Fusarium solani. PLoS ONE, 9(5), e98234. http://doi.org/10.1371/journal.pone.0098234.
Reino, J. L., Guerrero, R. F., Hernández-Galán, R., & Collado, I. G. (2007). Secondary metabolites from species of the biocontrol agent Trichoderma. Phytochemistry Reviews, 7(1), 89–123. http://doi.org/10.1007/s11101-006-9032-2.
Rojo, F. G., Reynoso, M. M., Ferez, M., Chulze, S. N., & Torres, A. M. (2007). Biological control by Trichoderma species of Fusarium solani causing peanut brown root rot under field conditions. Crop Protection, 26(4), 549–555. http://doi.org/10.1016/j.cropro.2006.05.006.
Rosado, I. V., Rey, M., Codón, A. C., Govantes, J., Moreno-Mateos, M. A., & Benítez, T. (2007). QID74 Cell wall protein of Trichoderma harzianum is involved in cell protection and adherence to hydrophobic surfaces. Fungal Genetics and Biology, 44(10), 950–964. http://doi.org/10.1016/j.fgb.2007.01.001.
Rubio, M. B., Hermosa, M. R., Keck, E., & Monte, E. (2005). Specific PCR assays for the detection and quantification of DNA from the biocontrol strain Trichoderma harzianum 2413 in soil. Microbial Ecology, 49(1), 25–33. http://doi.org/10.1007/s00248-003-0171-3.
Ruocco, M., Lanzuise, S., Vinale, F., Marra, R., Turrà, D., Woo, S. L., … Benítez, T. (2007). Identification of a new biocontrol gene in Trichoderma atroviride: the role of an ABC transporter membrane pump in the interaction with different plant-pathogenic fungi. Molecular Plant-Microbe Interactions, 44(3), 950–964. http://doi.org/10.1016/j.fgb.2007.01.001.
Rushton, P. J., & Somssich, I. E. (1998). Transcriptional control of plant genes responsive to pathogens. Current Opinion in Plant Biology, 1(4), 311–315. http://doi.org/10.1016/1369-5266(88)80052-9.
Sanz, L., Montero, M., Grondona, I., Vizcaíno, J. A., Llobell, A., Hermosa, R., & Monte, E. (2004). Cell wall-degrading isoenzyme profiles of Trichoderma biocontrol strains show correlation with rDNA taxonomic species. Current Genetics, 46(5), 277–286. http://doi.org/10.1007/s00294-004-0532-6.
Sanz, L., Montero, M., Redondo, J., Llobell, A., & Monte, E. (2005). Expression of an α-1,3-glucanase during mycoparasitic interaction of Trichoderma asperellum. FEBS Journal, 272(2), 493–499. http://doi.org/10.1111/j.1742-4658.2004.04491.x.
Seidl, V., Marchetti, M., Schandl, R., Allmaier, G., & Kubicek, C. P. (2006). Epl1, the major secreted protein of Hypocrea atroviridis on glucose, is a member of a strongly conserved protein family comprising plant defense response elicitors. FEBS Journal, 273(18), 4346–4359. http://doi.org/10.1111/j.1742-4658.2006.05435.x.
Shoresh, M., Harman, G. E., & Mastouri, F. (2010). Induced systemic resistance and plant responses to fungal biocontrol agents. Annual Review of Phytopathology, 48, 21–43. http://doi.org/10.1146/annurev-phyto-073009-114450.

58
Singh, K. B., Foley, R. C., & Oñate-Sánchez, L. (2002). Transcription factors in plant defense and stress responses. Current Opinion in Plant Biology, 5(5), 430–436. http://doi.org/10.1016/S1369-5266(02)00289-3.
Sivasithamparam, K., & Ghisalberti, E. L. (1998). Secondary metabolism in Trichoderma and Gliocladium. In C. P. Kubicek & G. E. Harman (Eds.), Trichoderma and Gliocladium: Basic biology, taxonomy and genetics (pp. 139–191). London, United Kingdon: Taylor and Francis Ltd.
Suarez, B., Rey, M., Castillo, P., Monte, E., & Llobell, A. (2004). Isolation and characterization of PRA1, a trypsin-like protease from the biocontrol agent Trichoderma harzianum CECT 2413 displaying nematicidal activity. Applied Microbiology and Biotechnology, 65(1), 46–55. http://doi.org/10.1007/s00253-004-1610-x.
Valenciano, J. B., Casquero, P. A., & Boto, J. A. (2004). Influence of sowing techniques and pesticide application on the emergence and the establishment of bean plants (Phaseolus vulgaris L.). Agronomie, 24(2), 113–118. http://doi.org/10.1051/agro:2004007.
Veitch, N. C. (2009). Isoflavonoids of the Leguminosae. Natural Product Reports, 26(6), 776. http://doi.org/10.1039/b616809b.
Vinale, F., Sivasithamparam, K., Ghisalberti, E. L., Marra, R., Woo, S. L., & Lorito, M. (2008). Trichoderma–plant–pathogen interactions. Soil Biology and Biochemistry, 40(1), 1–10. http://doi.org/10.1016/j.soilbio.2007.07.002.
Viterbo, A., Montero, M., Ramot, O., Friesem, D., Monte, E., Llobell, A., & Chet, I. (2002). Expression regulation of the endochitinase chit36 from Trichoderma asperellum (T. harzianum T-203). Current Genetics, 42(2), 114–122. http://doi.org/10.1007/s00294-002-0345-4.
Viterbo, A., Wiest, A., Brotman, Y., Chet, I., & Kenerley, C. (2007). The 18mer peptaibols from Trichoderma virens elicit plant defence responses. Molecular Plant Pathology, 8(6), 737–746. http://doi.org/10.1111/j.1364-3703.2007.00430.x.
Vizcaíno, J. A., Cardoza, R. E., Hauser, M., Hermosa, R., Rey, M., Llobell, A., … Monte, E. (2006). ThPTR2, a di/tri-peptide transporter gene from Trichoderma harzianum. Fungal Genetics and Biology, 43(4), 234–246. http://doi.org/10.1016/j.fgb.2005.12.003.
Vizcaino, J. A., Sanz, L., Basilio, A., Vicente, F., Gutierrez, S., Hermosa, M. R., & Monte, E. (2005). Screening of antimicrobial activities in Trichoderma isolates representing three Trichoderma sections. Mycological Research, 109(12), 1397–1406. http://doi.org/10.1017/S0953756205003898.
Woo, S. L., & Lorito, M. (2007). Exploiting the interactions between fungal antagonists, pathogens and the plant for biocontrol. In M. Vurro & J. Gressel (Eds.), Novel Biotechnologies for Biocontrol Agent Enhancement and Management (pp. 107–130). The Netherlands: Springer.
Woo, S. L., Scala, F., Ruocco, M., & Lorito, M. (2006). The molecular biology of the interactions between Trichoderma spp., phytopathogenic fungi, and plants. Phytopathology, 96(2), 181–185.
Yedidia, I., Srivastva, A. K., Kapulnik, Y., & Chet, I. (2001). Effect of Trichoderma harzianum on microelement concentrations and increased growth of cucumber plants. Plant and Soil, 235(2), 235–242.

A quien corresponda la presente
Certificado de participación en el libro “Legumes for Global Feed and Food Future”.
Estimado comité científico de tesis,
Por la presente y como editores científicos del libro titulado “Legumes for Global Feed and
Food Future”, que será publicado en 2017 por la editoral Nova Science Publisher,
informamos de que todos los autores abajo presentes han contribuido a la consecución del
capítulo de libro que consta de los siguientes datos:
Título: Trichoderma species as biocontrol agents in legumes
Autores: Sara Mayo1; Santiago Gutiérrez1; Rosa E. Cardoza1; Rosa Hermosa2; Enrique
Monte2; Pedro A. Casquero1
Instituciones:
1 - Research Group of Engineering and Sustainable Agriculture, University of León,
León, Spain
2 - Spanish-Portuguese Centre for Agricultural Research, University of Salamanca,
Salamanca, Spain
Este capítulo formará parte del libro completo cuyo título se menciona anteriormente.
Para que conste y surta efecto donde corresponda
Granada a 19 de Abril de 2017
Dr Alfonso Clemente Dr Jose C. Jimenez Lopez
Editor Científico Editor Científico


capítulo II
Influence of Rhizoctonia solani and Trichoderma spp. in growth of bean (Phaseolus vulgaris L.) and in the
induction of plant defense-related genes


ÍNDICE CAPÍTULO II
INTRODUCTION.................................................................................................. 65
MATERIALS AND METHODS........................................................................... 66
Trichoderma and Rhizoctonia solani isolates and culture collections................................ 66
In vitro antifungal assays................................................................................................... 66
In vivo assays of the antifungal activity.............................................................................. 68
Nucleic acid extraction and manipulation.......................................................................... 68
PCR amplification, sequencing and DNA analysis............................................................ 68
Analysis of expression of bean defense-related................................................................. 68
Real Time-PCR analysis.................................................................................................... 68
Quantification of ergosterol and squalene.......................................................................... 69
RESULTS.................................................................................................................. 69
Analysis of the in vitro antagonistic activity of Trichoderma isolates with R. solani................................................................................................................................. 69
Analysis of the in vivo antagonistic activity of Trichoderma isolates with R. solani.................................................................................................................................. 69
Molecular identification of Trichoderma isolates.............................................................. 69
Effect of Trichoderma treatment and/or R. solani infection in the expression of bean defense related genes.......................................................................................................... 70
Production of ergosterol and squalene by the Trichoderma selected strain........................ 70
DISCUSSION.......................................................................................................... 70
CONCLUSION........................................................................................................ 73
REFERENCES.......................................................................................................... 74
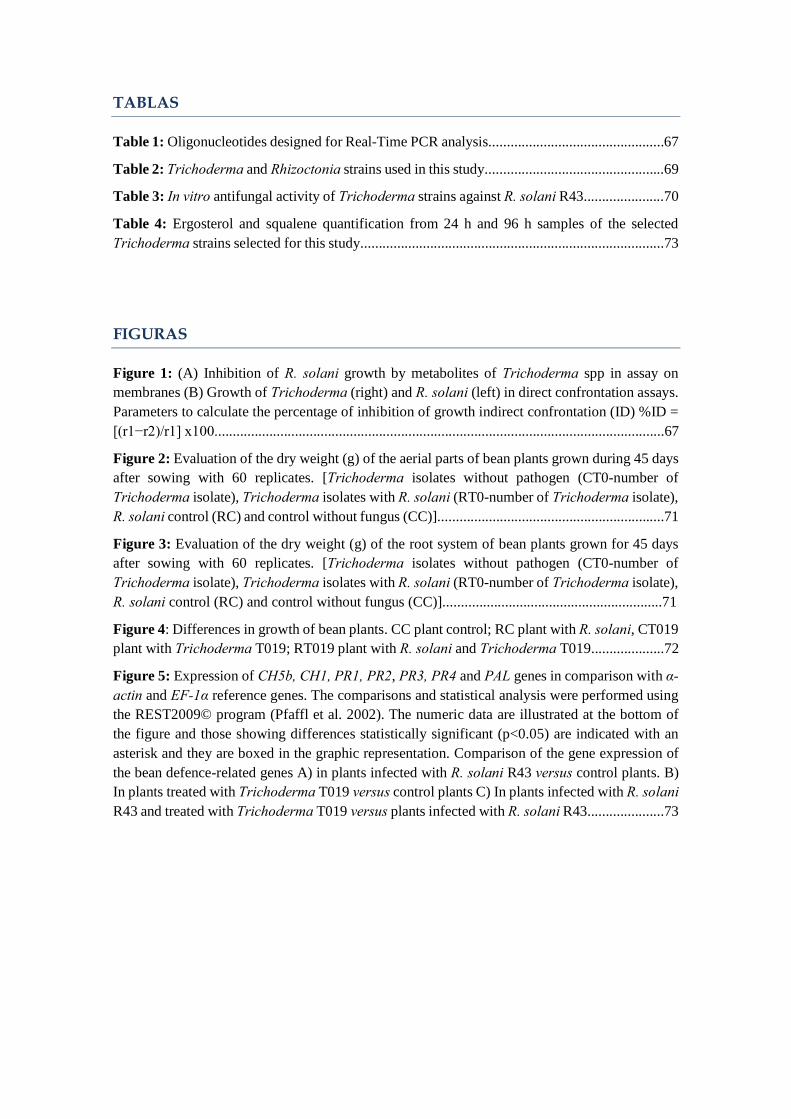
TABLAS
Table 1: Oligonucleotides designed for Real-Time PCR analysis................................................67
Table 2: Trichoderma and Rhizoctonia strains used in this study.................................................69
Table 3: In vitro antifungal activity of Trichoderma strains against R. solani R43......................70
Table 4: Ergosterol and squalene quantification from 24 h and 96 h samples of the selected Trichoderma strains selected for this study...................................................................................73
FIGURAS
Figure 1: (A) Inhibition of R. solani growth by metabolites of Trichoderma spp in assay on membranes (B) Growth of Trichoderma (right) and R. solani (left) in direct confrontation assays. Parameters to calculate the percentage of inhibition of growth indirect confrontation (ID) %ID = [(r1−r2)/r1] x100...........................................................................................................................67
Figure 2: Evaluation of the dry weight (g) of the aerial parts of bean plants grown during 45 days after sowing with 60 replicates. [Trichoderma isolates without pathogen (CT0-number of Trichoderma isolate), Trichoderma isolates with R. solani (RT0-number of Trichoderma isolate), R. solani control (RC) and control without fungus (CC)]..............................................................71
Figure 3: Evaluation of the dry weight (g) of the root system of bean plants grown for 45 days after sowing with 60 replicates. [Trichoderma isolates without pathogen (CT0-number of Trichoderma isolate), Trichoderma isolates with R. solani (RT0-number of Trichoderma isolate), R. solani control (RC) and control without fungus (CC)]............................................................71
Figure 4: Differences in growth of bean plants. CC plant control; RC plant with R. solani, CT019 plant with Trichoderma T019; RT019 plant with R. solani and Trichoderma T019....................72
Figure 5: Expression of CH5b, CH1, PR1, PR2, PR3, PR4 and PAL genes in comparison with α-actin and EF-1α reference genes. The comparisons and statistical analysis were performed using the REST2009© program (Pfaffl et al. 2002). The numeric data are illustrated at the bottom of the figure and those showing differences statistically significant (p<0.05) are indicated with an asterisk and they are boxed in the graphic representation. Comparison of the gene expression of the bean defence-related genes A) in plants infected with R. solani R43 versus control plants. B) In plants treated with Trichoderma T019 versus control plants C) In plants infected with R. solani R43 and treated with Trichoderma T019 versus plants infected with R. solani R43.....................73
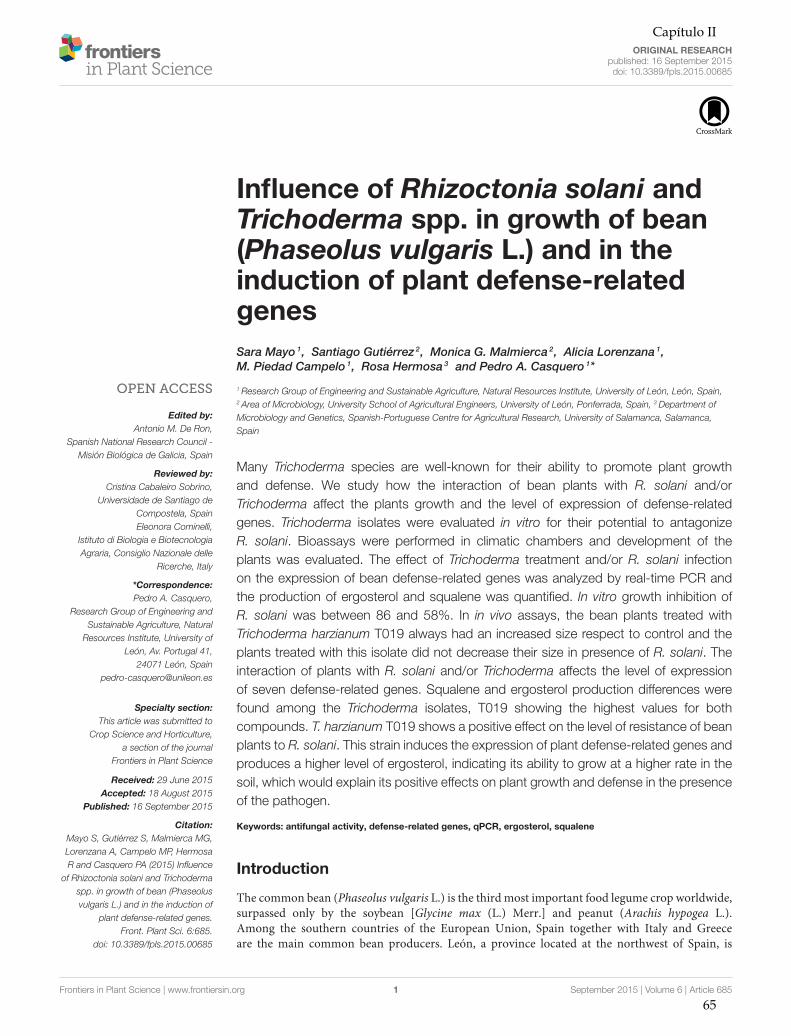
ORIGINAL RESEARCHpublished: 16 September 2015doi: 10.3389/fpls.2015.00685
Frontiers in Plant Science | www.frontiersin.org 1 September 2015 | Volume 6 | Article 685
Edited by:
Antonio M. De Ron,
Spanish National Research Council -
Misión Biológica de Galicia, Spain
Reviewed by:
Cristina Cabaleiro Sobrino,
Universidade de Santiago de
Compostela, Spain
Eleonora Cominelli,
Istituto di Biologia e Biotecnologia
Agraria, Consiglio Nazionale delle
Ricerche, Italy
*Correspondence:
Pedro A. Casquero,
Research Group of Engineering and
Sustainable Agriculture, Natural
Resources Institute, University of
León, Av. Portugal 41,
24071 León, Spain
Specialty section:
This article was submitted to
Crop Science and Horticulture,
a section of the journal
Frontiers in Plant Science
Received: 29 June 2015
Accepted: 18 August 2015
Published: 16 September 2015
Citation:
Mayo S, Gutiérrez S, Malmierca MG,
Lorenzana A, Campelo MP, Hermosa
R and Casquero PA (2015) Influence
of Rhizoctonia solani and Trichoderma
spp. in growth of bean (Phaseolus
vulgaris L.) and in the induction of
plant defense-related genes.
Front. Plant Sci. 6:685.
doi: 10.3389/fpls.2015.00685
Influence of Rhizoctonia solani andTrichoderma spp. in growth of bean(Phaseolus vulgaris L.) and in theinduction of plant defense-relatedgenes
Sara Mayo 1, Santiago Gutiérrez 2, Monica G. Malmierca 2, Alicia Lorenzana 1,
M. Piedad Campelo 1, Rosa Hermosa 3 and Pedro A. Casquero 1*
1 Research Group of Engineering and Sustainable Agriculture, Natural Resources Institute, University of León, León, Spain,2 Area of Microbiology, University School of Agricultural Engineers, University of León, Ponferrada, Spain, 3Department of
Microbiology and Genetics, Spanish-Portuguese Centre for Agricultural Research, University of Salamanca, Salamanca,
Spain
Many Trichoderma species are well-known for their ability to promote plant growth
and defense. We study how the interaction of bean plants with R. solani and/or
Trichoderma affect the plants growth and the level of expression of defense-related
genes. Trichoderma isolates were evaluated in vitro for their potential to antagonize
R. solani. Bioassays were performed in climatic chambers and development of the
plants was evaluated. The effect of Trichoderma treatment and/or R. solani infection
on the expression of bean defense-related genes was analyzed by real-time PCR and
the production of ergosterol and squalene was quantified. In vitro growth inhibition of
R. solani was between 86 and 58%. In in vivo assays, the bean plants treated with
Trichoderma harzianum T019 always had an increased size respect to control and the
plants treated with this isolate did not decrease their size in presence of R. solani. The
interaction of plants with R. solani and/or Trichoderma affects the level of expression
of seven defense-related genes. Squalene and ergosterol production differences were
found among the Trichoderma isolates, T019 showing the highest values for both
compounds. T. harzianum T019 shows a positive effect on the level of resistance of bean
plants to R. solani. This strain induces the expression of plant defense-related genes and
produces a higher level of ergosterol, indicating its ability to grow at a higher rate in the
soil, which would explain its positive effects on plant growth and defense in the presence
of the pathogen.
Keywords: antifungal activity, defense-related genes, qPCR, ergosterol, squalene
Introduction
The common bean (Phaseolus vulgaris L.) is the third most important food legume crop worldwide,surpassed only by the soybean [Glycine max (L.) Merr.] and peanut (Arachis hypogea L.).Among the southern countries of the European Union, Spain together with Italy and Greeceare the main common bean producers. León, a province located at the northwest of Spain, is
Capítulo II
65

Mayo et al. Tricho-rhizoc bean genes
the main producer province by quantity and quality, with almost45% of Spanish production in 2014. Socio-economic conditionsof León province enabled possible the maintenance of localvarieties in traditional cropping systems, which are based insmall-scale farms (Casquero et al., 2006). The high quality of thislegume has been awardedwith a ProtectedGeographic Indication(PGI) (EC Reg. n.256/2010 published on 26 March 2010, OJEUL880/17). In the last few years, however dry bean productionhas gone through difficulties due to relatively low yields (mainlycaused by fungus, virus, and bacteria) and insufficient income forgrowers.
Root rots are the main diseases caused by soil fungi havingtheir incidence on bean yield. Rhizoctonia solani JG Kühn[Teleomorph: Thanatephorus cucumeris (AB Frank) Donk] isthe main root rot in León, being detected in 91.8% of affectedplants in an evaluation of its occurrence in bean plants(Valenciano et al., 2006). Plant infection occurs through woundsor by a coating of an organ with mycelium, which tears thecuticle and penetrates the epidermis. This pathogen is moreaggressive at temperatures between 15 and 18◦C and in moistsoils. It is a necrotrophic pathogen, distributed worldwide(Guerrero-González et al., 2011). R. solani is one of the rootand hypocotyl pathogen that causes most economic lossesworldwide.
Trichoderma (Teleomorph: Hypocrea) is a fungal genus thatis found in the soil. It is a secondary fast growing opportunisticinvasive, which produces large numbers of spores, enzymesable to degrade the fungal cell wall (chitinases, glucanases,and proteases) and compounds with antimicrobial activity.Many Trichoderma species are also well known as biocontrolagents (BCA) of important phytopathogenic fungi. The primarymechanisms of biocontrol used by Trichoderma in directconfrontation with pathogenic fungi are the mycoparasitism(Papavizas, 1985) antibiosis, and competition for nutrients withthe pathogen (Harman and Kubicek, 1998).
Many Trichoderma species colonize the root surface andcause substantial changes in plant metabolism (Harman et al.,2004). The physical interaction between Trichoderma and plantsis limited to the first cell layer of the epidermis and theroot bark. This symbiotic relationship would thus protectplants against pathogens. Trichoderma induces the expressionof genes involved in defense response and promotes plantgrowth, root development and nutrient availability (Hermosaet al., 2012). During the Trichoderma-plant interaction variousclasses of metabolites could induce resistance such as proteinswith enzymatic activity, low molecular weight compounds,related to the fungal or the plant cell wall, originated by theenzymatic activity of Trichoderma (Woo et al., 2006; Wooand Lorito, 2007) and other secondary metabolites that triggerplant defense mechanisms against the pathogen (Hermosa et al.,2012; Malmierca et al., 2014), by inducing the expression ofpathogenesis–related (PR) proteins that reduce the diseasessymptoms. Thus, when the plant contacts with a pathogen it isactivated a mechanism of systemic acquired resistance (SAR).However, when they interact with a non-pathogen organism theplants activated a mechanism for induced systemic resistance(ISR) (Hermosa et al., 2013; Mukherjee et al., 2013).
Squalene is a polyunsaturated terpene that is an intermediatein the ergosterol biosynthetic pathway, which has an essentialfunction in the fungal cell structure. The levels of squalene willinfluence the level of ergosterol biosynthesis (Garaiová et al.,2013). In addition to its structural function, and as a result ofits importance in fungal development, ergosterol is also able toactivate the expression of a number of defense genes and couldincrease the resistance of plants against pathogens (Lochman andMikeš, 2005).
In this work 23 Trichoderma isolates were collected frombean fields. These isolates were used to study their effect onthe growth of bean plants, and also in the defense response ofplants against the phytopathogen R. solani. Thus, parameters asplant growth in the presence of the pathogen and/or the differentTrichoderma isolates were evaluated, also analyzing the level ofexpression of defense-related genes in plants treated with theselected Trichoderma isolate.
Materials and Methods
Trichoderma and R. solani Isolates and CultureCollectionsThe present study was conducted with twenty-three isolates ofTrichoderma (Table 1) collected from the production area ofthe Protected Geographical Indication (PGI), called “AlubiaLa Bañeza—León,” without any genetic manipulation andthree isolates from other collections. The Trichoderma isolateswere stored in the collection “Pathogens and Antagonists ofthe Laboratory Diagnosis of Pests and Diseases” (PALDPD,University of León, León, Spain). R. solani R43 was also collectedfrom plants of the same PGI and selected by its high virulence(Table 1).
In vitro Antifungal AssaysTrichoderma isolates were evaluated for their in vitro potentialto antagonize the plant pathogenic fungus R. solani using twodifferent tests. For all tests, plugs of 7mm diameter collectedfrom the edge of growing fungal colonies were used to inoculatepotato dextrose agar medium (PDA) in sterile Petri dishes of9 cm diameter. The dishes were incubated in the dark at 22◦C for7 days.
The aim of these tests was to study the percentage of R. solanigrowth inhibition caused by the different Trichoderma isolates.
The antifungal assay on membranes was used to quantify theability of the Trichoderma isolates to produce metabolites and/orenzymes with inhibitory activity against R. solani. The surface ofPetri dishes containing PDA medium was overlaid with a sterilecellophane membrane. Trichoderma plugs, extracted from PDAdishes grown for 7 days at 22◦C, were placed in the center ofthe dish with the cellophane sheet, containing PDA medium,and incubated for 48 h at 22◦C. Then, the cellophane membranesalong with the mycelia of Trichoderma isolates were removedand R. solani plugs were placed in the same plates. Growth ofR. solani was recorded after 72 h to calculate the percentage ofpathogen growth inhibition (Figure 1A). Control PDA platesof R. solani, where Trichoderma spp. had not been previouslygrown, were also prepared in the same conditions as above.
Frontiers in Plant Science | www.frontiersin.org 2 September 2015 | Volume 6 | Article 685
66

Mayo et al. Tricho-rhizoc bean genes
TABLE 1 | Trichoderma and Rhizoctonia strains used in this study.
Lab. Code Culture collection*** Localization/Received as Identified as/References
T001* PAULET20 Bustillo del Páramo (León) T. harzianum
T002* PAULET21 Roperuelos del Páramo (León) Trichoderma spp.
T003* PAULET22 Bercianos del Páramo (León) Trichoderma spp.
T004* PAULET23 Riego de la Vega (León) T. gamsii
T005* PAULET24 Valderrey (León) T. longibrachiatum
T006* PAULET25 San Esteban de Nogales (León) Trichoderma spp.
T007* PAULET26 Villamejil (León) Trichoderma spp.
T008* PAULET27 Fresno de la Vega (León) T. citrinoviride
T009 PAULET28 Bustillo del Páramo (León) Trichoderma spp.
T010 PAULET29 Bustillo del Páramo (León) T. harzianum
T011* PAULET30 San Pedro de Bercianos (León) T. harzianum
T012* PAULET31 Quintana del Castillo (León) T. harzianum
T013* PAULET32 Quintana del Castillo (León) T. atroviride
T014 PAULET33 Santa Marina del Rey (León) Trichoderma spp.
T015* PAULET34 San Cristobal de la Polantera (León) T. harzianum
T016 PAULET35 Bustillo del Páramo (León) Trichoderma spp.
T017 PAULET36 Bustillo del Páramo (León) Trichoderma spp.
T018 PAULET37 Urdiales del Páramo (León) Trichoderma spp.
T019* PAULET38 Carrizo de la Ribera (León) T. harzianum
T020 PAULET39 Soto de la Vega (León) T. harzianum
T021 PAULET40 Pozuelo del Páramo (León) T. harzianum
T022 PAULET41 Villaornate (León) Trichoderma spp.
T023 PAULET42 Cabreros del Río (León) Trichoderma spp.
T024* IMI 352941 T. atroviride Hermosa et al., 2000
T025* NBT 59 T. virens Hermosa et al., 2004
T34** CECT 2413 T. harzianum Kullnig et al., 2001
R43 PAULER006 Santa María del Páramo (León) Rhizoctonia solani
*Strains included in in vivo assays.
**Strain only used in ergosterol and squalene assays.
***All PAULE strains are in Pathogens and Antagonists of the Laboratory Diagnosis of Pests and Diseases (PALDPD) Collection, University of León, León, Spain; IMI, CABI Bioscience
(Egham); NBT, Newbiotechnic S.A. (Seville); CECT, Spanish Type Culture Collection, Burjassot, Spain.
FIGURE 1 | (A) Inhibition of R. solani growth by metabolites of Trichoderma
spp in assay on membranes (B) Growth of Trichoderma (right) and R. solani
(left) in direct confrontation assays. Parameters to calculate the percentage of
inhibition of growth in direct confrontation (ID) % ID = [(r1−r2)/r1] x 100.
The percentage of inhibition (IM) was calculated after 3 days ofgrowth of R. solani in this medium using the formula %IM =[(C–T)/C]x100 (C: diameter of the R. solani control; T: diameter
of R. solani after being exposed to the metabolites of Trichodermaspp.). Experiments were performed with four replicates. Theresults were compared by analysis of variance (ANOVA) andFisher least significant difference (LSD) tests using SAS (SASInstitute Inc., 2004, Cary, NC, USA).
The direct confrontation assays were used to verify theability of Trichoderma spp. to overgrow the pathogen. EachTrichoderma isolate was grown in dual culture with R. solaniR43. The isolates were placed 5.5 cm apart on the same plate andincubated at 22◦C for 5 days. Experiments were performed withfour replicates. The parameters were measured after 5 days: r1(distance between the pathogen sowing point and furthest pointof the colony) and r2 (distance between the pathogen sowingpoint and the edge of the colony) from where R. solani andTrichoderma mycelia came into contact. Thus, the percentage ofinhibition in the direct confrontation assay (ID) was calculated bythe formula: %ID =[(r1–r2)/r1]x100 (Figure 1B). Inhibition ofR. solani growth was compared by analysis of variance (ANOVA)and Fisher least significant difference (LSD) tests using SAS. (SASInstitute Inc., 2004, Cary, NC, USA).
Frontiers in Plant Science | www.frontiersin.org 3 September 2015 | Volume 6 | Article 685
Capítulo II
67

Mayo et al. Tricho-rhizoc bean genes
In vivo Assay of the Antifungal ActivityThese assays were only performed with those Trichodermaisolates that gave percentages of inhibition greater that 40% inmembrane assays or 20% in direct confrontation assays, and thatwere able to sporulate on PDA medium.
The bioassays were performed in climatic chambers with 32treatments as follow: 15 in vitro selected Trichoderma isolatesagainst R. solani (R43) in order to test the antagonistic activity(RT0-number of Trichoderma isolate); 15 in vitro selectedTrichoderma isolates in order to test their effect on plant (CT0-number of Trichoderma isolate); one control with R. solani (RC);and one control without fungi (CC). Thirty pots were usedper treatment, with polypropylene pots (1 liter capacity) withsubstrate (80% white peat, 20% black peat and 5.5 pH). Eachpot was watered with 250ml of water prior inoculation. R. solaniR43 was inoculated by surface irrigation with 50ml per pot ofa suspension of triturated micromicete culture of this pathogenusing five Petri dishes (18ml of PDA per dish) per liter of water.For control inoculation, only PDA medium was used withoutany pathogen. Pots were kept in a growth chamber for 8 days at25◦C (16 h) and 16◦C (8 h), 60% relative humidity (RH) in thedark.
Trichoderma isolates were inoculated on PDA medium togrow in dark conditions (25◦C) for 1 week. After that, they wereexposed to light in order to induce the formation of spores.Spores suspensions were prepared at a final concentration of2 × 107 spores/ml. Bean seeds of “Canela” variety were surfacesterilized (sodium hypochlorite 1% for 3min and distilled waterfor 6min). Then, they were coated with a spore suspensionof each Trichoderma isolate. The seeds were submerged in thespore suspension (45 seeds per 20ml spores suspension) andthey were dried in a flow chamber for 12 h. Coated seeds weresown after 8 days of the inoculation of R. solani R43. Theculture was maintained for 45 days with a photoperiod of 16 hlight, 25◦C/16◦C (day/night), 60% RH and brightness of 3500lux. Irrigations were performed every 4 days with tap water(about 250ml/pot). On the 2nd–4th week a nutrient solution wasadded (Rigaud and Puppo, 1975). Plants were removed after 45days from sowing, tissues with symptoms were placed in PDAmedium, incubating the plates at 22◦C for 5 days and identifyingthe fungus for fulfill Koch’s postulates. The next parameters wereevaluated in removed plants after 45 days from sowing: wetweight and dry weight (72 h in an oven, 82◦C) of the aerial partand root system.
The data were transformed by the formula√x+ 0.5 and they
were compared by analysis of variance (ANOVA) and Fisher leastsignificant difference (LSD) tests using SAS (SAS Institute Inc.,2004, Cary, NC, USA).
Nucleic Acid Extraction and ManipulationGenomic DNA from those isolates showing positive and negativephenotypic effects on bean plants, were extracted by growing theTrichoderma isolates in PDB medium (potato dextrose broth).Mycelia were then recovered by filtration, washedwith 0.9%NaCland dried on absorbent filter paper. The procedure for fungalgenomic DNA isolation was performed as previously described(Cardoza et al., 2006).
PCR Amplification, Sequencing and DNAAnalysisThe amplification of the ITS regions of the nuclear rDNAgene cluster and an approximately 0.56 kb fragment of the tef1(translation elongation factor 1-α) gene were carried out with theprimer pairs ITS1/ITS4 and EF1-728F/EF1-LLErev, respectively,as described previously (Hermosa et al., 2004). The PCRproducts were purified from agarose gels using the NucleoSpinExtract II Kit (Macherey-Nagel, Düren, Germany), accordingto the manufacturer’s protocol. PCR fragments were sequencedin an ABI 377 Prism Sequencer (Applied Biosystems, FosterCity, CA).
The Trichoderma ITS and tef1 sequences obtained in this workwere analyzed using the online interactive key (available fromhttp://www.isth.info/tools/blast/index.php) (Druzhinina et al.,2005).
Analysis of Expression of Bean Defense-relatedGenesThree bean leaves from 45 day-old plants of each treatmentwere randomly collected and stored at −80◦C until use. Leaveswere detached from plants inoculated with Trichoderma isolateshowing positive phenotypic results in the in vivo test. Leaveswere then reduced to a fine powder in a mortar under liquidnitrogen. Plant RNA isolation were performed as previouslydescribed (Malmierca et al., 2013).
cDNA were synthesized using 1µg total RNA and a ReverseTranscription System with an Oligo(dT)15 as the primer(Promega, Madison, WT). cDNA were quantified using aNanodrop 2000 (Thermo Scientific, Wilmington, DE) and usedfor further studies.
Real Time-PCR AnalysisIn order to analyze the effect of Trichoderma treatmentand/or R. solani infection of bean plants, oligonucleotidescorresponding to seven defense-related genes were designedbased on their available sequences (Table 2). PR1, PR2, PR3, andPR4, which encode for pathogenesis related proteins related tothe salicylate (SA) pathway; CH5b, CH1 encoding for related tothe jasmonate/ethylene pathway (JA/ET), and PAL involved inthe phenylpropanoid pathway, were selected to be analyzed in thepresent study. α-actin (Upchurch and Ramirez, 2010; Guerrero-González et al., 2011) and PvEF1α (this work) encoding geneswere used as reference (housekeeping genes) for comparativeanalysis. The qPCR reactions were carried out using Step OnePlus™ (Applied Biosystems, Foster City, CA). The reactionswere performed in a total volume of 20µl: 10µl Power SYBR R©
Green PCR Master Mix (Applied Biosystems, USA), 0.4µlForward Primer 10µM, 0.4µl Reverse Primer 10µM, 5µlcDNA, and H2O to 20µl. The REST 2009©software (Pfafflet al., 2002) was used to calculate the relative expressionratio and the significance of the differences between the geneexpression levels. For each primer pair used in this work, weperformed a standard curve with 320, 160, 80, 40, 20, and 10 ngcDNA to determine the PCR amplification efficiency (E value).Each measurement was made in triplicate (Malmierca et al.,2013).
Frontiers in Plant Science | www.frontiersin.org 4 September 2015 | Volume 6 | Article 685
68

Mayo et al. Tricho-rhizoc bean genes
TABLE 2 | Oligonucleotides designed for Real-Time PCR analysis.
Gene Function gene GenBank Accession number Oligonucleotide name Oligonucleotide sequence (5′-3′) References
PvEF1α Elongation Factor 1 EF660340.1 EF1α-F CGGGTATGCTGGTGACTTTT This work
EF1α-R CACGCTTGAGATCCTTGACA
α-actin Actine U60500.1 α-actin-F GAGCTATGAATTGCCTGATGG This work
α-actin-R CGTTTCATGAATTCCAGTAGC
PvCH5b Chitinase FE897014.1 CH5b-F CAGCCAAAGGCTTCTACACC This work
CH5b-R TTGTTTCGTGAGACGTTTGC
PvPR1 Pathogenesis related 1 HO864272.1 PR1-F TGGTCCTAACGGAGGATCAC This work
PR1-R TGGCTTTTCCAGCTTTGAGT
PvPR2 Pathogenesis related 2 HO864270.1 PR2-F GTGAAGGACGCCGATAACAT This work
PR2-R ACTGAGTTTGGGGTCGATTG
PvPR4 Pathogenesis related 4 HO864354.1 PR4-F CGCAGTGAGTGCATATTGCT This work
PR4-R TGTTTGTCACCCTCAAGCAC
PvCH1 Chitinase Pereira et al., 2014
PvPR3 Pathogenesis related 3 Pereira et al., 2014
PvPAL Phenylalanine ammonia-lyase Pereira et al., 2014
Quantification of Ergosterol and SqualeneThe Trichoderma selected strain was inoculated in 100ml of CMmedium (0.5%malt extract, 0.5% yeast extract, and 0.5% glucose)with 106 spores/ml, and incubated 24 h at 28◦C. Then 20ml fromthe previous cultures were inoculated on 100ml potato dextrosebroth (PDB medium) and were incubated as before during 24–96 h. The mycelia were filtered through nytal filters (30µmdiameter) and the liquid removed by drying between filterpapers. The dry weight of the fungal pellet was calculated. Totalintracellular sterols were extracted and ergosterol and squalenecontent were quantified as previously reported other authors(Cardoza et al., 2007; Ghimire et al., 2009). All measurementswere made in duplicate in the Trichoderma selected isolate anda strain used as control of the same species of the selected isolate.The results were compared by analysis of variance (ANOVA)and Fisher least significant difference (LSD) tests using SAS (SASInstitute Inc., 2004, Cary, NC, USA).
Results
Analysis of the in vitro Antagonistic Activity ofTrichoderma Isolates with R. solaniThe first test to determine the in vitro antifungal ability ofthe different Trichoderma isolates was based on their ability toproduce metabolites that may inhibit the growth of R. solani(Table 3, Figure 1A). Trichoderma isolates T003, T004, T006,T020, T022, T012, T013, T025, T016, T007, T024, T005, andT010 inhibited R. solani growth by more than 75%, with thehighest inhibition produced by T003, T004, T006, T020, andT022 (86.70%). T019, T008, T002, T021, T001, T018, and T023showed a remarkable inhibition (75–40%). Finally, T015, T014,T017, T011, and T009 inhibitedR. solani growth by less than 40%,and T009 showed the lowest percentage (15.82%).
T021 was the Trichoderma isolate showing the highestpercentage of inhibition (72.77%) in the direct confrontationassays (Table 3, Figure 1B), whereas T009 showed the lowest
inhibition values (14.63%). The inhibition percentages detectedfor the other Trichoderma isolates ranged from 47.13 to 30.55%.
Analysis of the in vivo Antagonistic Activity ofTrichoderma Isolates with R. solaniThe results of the in vitro membrane assays and directconfrontation assays against R. solani, showed above, were usedto select the isolates that would be used for the in vivo analysis.Thus, fifteen Trichoderma isolates (marked with asterisk inTables 1, 3) were tested since they were able to sporulate inPDA medium and showed a percentage of inhibition of R. solanigrowth higher than 40% in the membrane assays, and/or 20% inthe direct confrontation assays.
On plants removed after 45 days from sowing for Koch‘spostulates, R. solani was found and Trichoderma isolates werealso present in the medium.
When dry aerial parts (Figure 2) were analyzed, plantstreated with CT019 had the greatest weight of the aerial part,being significantly different from the control (CC). In theRT019 treatment, plants did not show significant differencesin comparison with the control (CC), what is indicative of abiocontrol effect by T019 isolate.
In the case of the root system (Figure 3), the situation wassimilar to that observed in the aerial parts. CT019 treated plantswere not significantly different in dry weight, although it wasalways greater than the weight of the control plants (CC). Ifthe pathogen was present in the soil with same Trichodermaisolate, RT019 treatment, in the case of wet weight, there wereno significant differences between control (CC) and controlpathogen (RC) (data not shown).
Based on these results, the Trichoderma isolate T019 wasselected for further studies since it showed the best positive effectson plant phenotype among all the analyzed isolates (Figure 4).
Molecular Identification of Trichoderma IsolatesThose Trichoderma isolates able to sporulate in PDAmedium, showing a percentage of inhibition higher than
Frontiers in Plant Science | www.frontiersin.org 5 September 2015 | Volume 6 | Article 685
Capítulo II
69

Mayo et al. Tricho-rhizoc bean genes
TABLE 3 | In vitro antifungal activity of Trichoderma strains against
R. solani R43.
Strain Inhibition in growth assay Strain Inhibition in growth assay
on membranes (% ± on direct confrontation
Standard error) (1) (% ± Standard error) (2)
T003* 86.70 ± 0.15 a T021 72.77 ± 4.49 a
T004* 86.70 ± 0.15 a T004* 47.13 ± 0.91 b
T006* 86.70 ± 0.15 a T013* 43.49 ± 1.41 bc
T020 86.70 ± 0.15 a T011* 42.57 ± 2.00 bcd
T022 86.70 ± 0.15 a T014 41.99 ± 1.33 cde
T012* 86.67 ± 0.14 a T023 41.57 ± 1.40 cdef
T013* 85.04 ± 1.04 a T018 41.01 ± 1.93 cdefg
T025* 83.97 ± 1.97 a T020 39.21 ± 1.41 cdefgh
T016 82.29 ± 2.33 a T006* 38.68 ± 0.59 defghi
T007* 76.77 ± 2.52 b T017 37.42 ± 1.61 efghij
T024* 76.22 ± 2.32 bc T016 37.10 ± 0.63 fghij
T005* 75.65 ± 2.23 bc T002* 36.44 ± 0.29 ghij
T010 75.14 ± 3.30 bc T024* 36.43 ± 3.71 hij
T019* 72.36 ± 2.01 bcd T007* 36.34 ± 1.30 hij
T008* 70.61 ± 1.82 cde T005* 36.16 ± 0.67 hij
T002* 66.75 ± 1.18 def T019* 35.09 ± 1.01 hijk
T021 65.98 ± 0.77 ef T022 35.05 ± 0.34 hijk
T001* 65.51 ± 1.75 f T008* 35.04 ± 0.89 hijk
T018 54.12 ± 2.35 g T012* 34.59 ± 0.98 ijk
T023 48.26 ± 3.10 h T025* 33.28 ± 4.24 kjl
T015* 39.99 ± 0.82 i T010 30.55 ± 1.32 kl
T014 38.82 ± 2.96 ij T015* 28.84 ± 0.85 lm
T017 34.10 ± 0.88 j T001* 24.66 ± 0.74 m
T011* 21.40 ± 2.66 k T003* 19.85 ± 2.97 n
T009 15.82 ± 1.40 l T009 14.63 ± 0.83 o
Values in the same column followed by different letters are significantly different (Fisher’s
LSD. p < 0.05).
(1) Growth assay on membranes (effect of Trichoderma isolates on percent growth
inhibition of R. solani. using cellophane membranes. (2) in direct confrontation assays
(percentage of inhibition of R43 growth when grown confronted with Trichoderma strains
during 5 days in PDA medium plates).
*Trichoderma isolates selected for in vivo experiments because they were able to sporulate
in PDA medium and showed a percentage of inhibition higher than 40% in the membrane
assays. and/or 20% in the direct confrontation assays.
40% in the membrane assays, and/or 20% in the directconfrontation assays, were identified. ITS1 region of rDNAand a fragment of the translation elongation factor 1 (tef1)were amplified and sequenced for 12 isolates, and bothnucleotide sequences were used for identification at specieslevel. Eight out of these 12 isolates were identified as T.harzianum, and T. atroviride, T. gamsii, T. longibrachiatumand T. citrinoviride species were represented by one isolate(Table 1).
Effect of Trichoderma Treatment and/or R. solaniInfection in the Expression of Bean DefenseRelated GenesThe amplification efficiencies of the oligo-pairs (Table 2) were:α-actin 1.150, PvEF1α 0.903, CH5b 0.883, CH1 1.098, PR1 1.094,PR2 1.048, PR3 0.947, PR4 0.922, and PAL 0.962.
α-actin and PvEF1α were used as housekeeping genes todetermine the relative expression level of the other genesanalyzed in the present work. Trichoderma T019 strain wasselected, based on its positive effects on bean phenotype withand without R. solani infection. The results included in Figure 5
showed that: (i) R. solani down-regulated the expression of all theP. vulgaris defense-related genes analyzed (Figure 5A), raisingvalues of expression ranging between 0.099 (p = 0.029) forPR2 and 0.397 (p = 0.045) for CH1; (ii) In plants treated withT019 compared with control plants (bean plants not treated withTrichoderma nor infected with R. solani) only the CH5b and PR2were significantly up-regulated, raising comparative expressionvalues of 1.495 (p = 0.000) and 24.492 (p = 0.000), respectively(Figure 5B). Finally, (iii) treatment with T019 and infection withR. solani significantly up-regulated the expression ratio of theanalyzed genes, except PAL, in comparison with plants onlyinfected with R. solani, with values ranging from 1.420 (p =0.000) to 42.975 (p = 0.000) for CH1 and PR4 respectively(Figure 5C).
A non-remarkable significant up-regulation of the defense-related gene expression was observed when expression ratios ofthe selected genes in plants treated with T. harzianum T019 andinfected with R. solani were compared with those from plantsuntreated or uninfected (data not shown).
Production of Ergosterol and Squalene by theTrichoderma Selected StrainsStrain T019 (T. harzianum) was selected for this analysis becauseit was those producing the most remarkable positive phenotypiceffect on beans (see above). T. harzianum T34 (Table 1) wasused as control strain for comparative purposes because itis a well-known strain, widely characterized (Kullnig et al.,2001).
Production of ergosterol at 24 h of growth did not showsignificant differences between the strains T. harzianum (T34 andT019) (Table 4). When the production of ergosterol was analyzedat 96 h, T019 produced significantly higher amounts than itsrespective control (T34).
Regarding the squalene production at 24 h, T. harzianum (T34and T019) strains did not show significant differences. However,at 96 h of growth, T019 produced amounts significantly higherthan its control.
Discussion
Most of the Trichoderma isolates studied in the present workhave been able to control the growth of R. solani. The percentageof growth inhibition in the direct confrontation assays raisedvalues up to 72.77% for T021, but most of the isolates werebetween 47 and 24%. By contrast, in the antifungal assays onmembranes, those percentages ranged mostly between 86 and58%. In the assays conducted by Campelo et al. (2010) thepercentage of inhibition in membrane assays using T. virens T59(NBT59) and T. atroviride T11 (IMI352941) range between 100and 84.7%, respectively. The differences observed in the differentin vitro assays might be due to the variability of genotypes, withdifferences in growth, sporulation and in their environmental
Frontiers in Plant Science | www.frontiersin.org 6 September 2015 | Volume 6 | Article 685
70

Mayo et al. Tricho-rhizoc bean genes
FIGURE 2 | Evaluation of the dry weight (g) of the aerial parts of bean plants grown during 45 days after sowing with 60 replicates.
[Trichoderma isolates without pathogen (CT0-number of Trichoderma isolate), Trichoderma isolates with R. solani (RT0-number of Trichoderma isolate),
R. solani control (RC) and control without fungus (CC)].
FIGURE 3 | Evaluation of the dry weight (g) of the root system of bean plants grown for 45 days after sowing with 60 replicates.
[Trichoderma isolates without pathogen (CT0-number of Trichoderma isolate), Trichoderma isolates with R. solani (RT0-number of Trichoderma isolate),
R. solani control (RC) and control without fungus (CC)].
biological interactions as a consequence of the prevalence ofdifferent modes of action on each of the analyzed strains (Ruano-Rosa et al., 2010).
The in vitro antagonistic activity of the Trichoderma isolatesis an indication of their in vivo biological activity againstphytopathogenic fungi. However, it has been found that thein vitro antifungal activity of Trichoderma does not correlate ina direct way with its in vivo ability to control diseases caused byphytopathogenic fungi, since many other factors influence thatactivity (Anees et al., 2010).
Regarding the in vivo assays, bean plants that had been incontact with some Trichoderma isolate had an increased sizewhen the pathogen was not present. Pereira et al. (2014) alsoobserved that T. harzianum was able to promote the growthof common bean plants in comparison to plants grown in itsabsence. However, in the present work only T019 treated plantsdid not decrease their size in the presence of R. solani. Thesedata are in agreement with those from Yedidia and coworkers
reporting a much stronger effect on cucumber plants treatedwith T. harzianum, which increased by 75% the length of theroot, 95% aerial parts, 80% dry weight and 80% the size of theblade relative to the untreated control (Yedidia et al., 2001).T. harzianum was able to promote the growth of commonbean plants in comparison to plants grown in its absence(Pereira et al., 2014).
However, in the present work opposite results were observedto those previously reported (Tello et al., 1985), indicating thatinfection with R. solani not always resulted in a reduction of thebean plant size, which was explained as a result of the activationof the natural plant-defense mechanisms (Cardoso and Echandi,1987) that would lead to an enhanced development of the plantswhen this pathogen was present in the soil. In the present studywe have observed that treatment with R. solani resulted in adown-regulation of all the bean defense-related genes analyzed,indicating a certain compensation effect between the intensity ofplant defense response and plant growth (Hermosa et al., 2013).
Frontiers in Plant Science | www.frontiersin.org 7 September 2015 | Volume 6 | Article 685
Capítulo II
71

Mayo et al. Tricho-rhizoc bean genes
FIGURE 4 | Differences in growth of bean plants. CC plant control; RC
plant with R. solani, CT019 plant with Trichoderma T019; RT019 plant with
R. solani and Trichoderma T019.
Little is known about the effect of Trichoderma treatmentand/or infection with R. solani in the expression of bean defense-related gene expression. As indicated above, interaction of theplant with R. solani during 45 days of growth caused therepression of the seven defense-related genes studied (CH5b,CH1, PR1, PR2, PR3, PR4, and PAL1), as a mechanism toovercome the plant defense response and thus facilitating theprogression of the infection process within the plant. Otherauthors have observed similar results in assays with tomatoplants infected with Pseudomonas syringae pv. tomato, where arepression of PR1 and PR4 was shown, as an indication of thedecrease in the plant self-defense mechanism, then facilitatingdisease progression (Zhao et al., 2003).
Expression of P. vulgaris defense-related genes was analyzedin leaves, even when the interaction with the pathogen R. solaniis initially produced at the root level, to determine if the signalsgenerated in roots as result of this interaction are able tosystematically stimulate the bean defense along long distancefrom seed to leaf. When the interaction of plant with T019was analyzed, PR2 was up-regulated, PR4 was slightly restrainedbut PR1 and PR3 were not affected. Pereira and coworkersobserved that T. harzianum also seems to potentiate commonbean response against the phytopathogenic fungus R. solani, asshown by the increase in the levels of glu1 and pod3 in thedouble treatment in comparison to that obtained for plants inthe presence of R. solani alone (Pereira et al., 2014). Otherstudies showed that there was an increase in expression PR1 at16 h of interaction (Guerrero-González et al., 2011). Rivière andcoworkers suggested that PR1 was down-regulated by the β-1,3-glucanases (PR2 and PR3) (Rivière et al., 2008). In the presentstudy, after 45 days of the inoculation of the biocontrol isolatewe observed a higher expression of PR2, which could be due toan alteration of plant defense responses at these longer times incomparison with shorter ones assayed in the previous reportedworks. This would result in a higher β-1,3-glucanase activity in
the cell wall that would increase oligosaccharides released byits action, then acting as elicitors of the plant defense responseand/or of the fungal secondary metabolism (Druzhinina et al.,2011).
In the case of plants inoculated with Trichoderma and seededin soil infected with R. solani, when compared with plants onlyinfected with R. solani, thus excluding the effect due exclusivelyto this pathogen, a significant up-regulation of all the analyzedgenes was observed, except PAL, indicating that in presenceof R. solani several mechanisms are induced in Trichodermathat potentiate its ability to elicit plant defense-responses. Inprevious works, during the interaction of Solanum tuberosumwith R. solani it was observed that after 120 h from the initialinfection and damage to the first floor, new outbreaks produceless symptoms, suggesting that the plant might be prepared todefend and avoid disease progression (Lehtonen et al., 2008).Other studies have shown that the PR4 was overexpressedin eggplants treated with BCAs suggesting that these agentspromoted defensive reactions within the plant (Angelopoulouet al., 2014). In other assays with pepper plants an increasein the accumulation of PR1 and chitinases was also observedwhen these plants were previously inoculated with a strain ofFusarium oxysporum and subsequently exposed to Verticilliumdahliae (Veloso and Díaz, 2012), emphasizing their importancein the response to pathogen infection and to abiotic stresses (Jungand Hwang, 2000). Thus, it could be inferred that the effect ofTrichoderma would therefore modulate the response of the plantand prevent the suppression of defense genes caused by R. solani.However, the effect of the different Trichoderma strains in thedifferent plants would indicate the existence of great differencesbetween them.
In the case of CH5b, related to JA pathway, when R. solaniwas in contact with the plant for 45 days of development, theexpression of this gene was down-regulated in comparison withnon-infected plants. When bean plants were inoculated withTrichoderma, its expression was slightly induced. However, ifthe antagonist and the pathogen were present in the medium,the effect caused by R. solani was the overexpression of thisgene. In previous works (Broglie et al., 1991) it was shown thatCH5b, responsible for chitinase production, was overexpressed inNicotiana tabacum and Brassica napus infected withR. solani, andtheir disease symptoms were reduced. Benhamou et al. (1993)found that the expression of this gene caused a reduction ofdisease in B. napus infected with the same pathogen, whichcorrelates with similar results observed in strawberry plantsinoculated with Botrytis cinerea (Vellicce et al., 2006). Inthe present study we observed that the contact of the plantwith the pathogen during a period of 45 days resulted in asignificant repression of this gene, similarly to what it wasobserved for the expression of CH1, which thereby facilitatesdisease progression. However, in the presence of Trichodermaa similar effect to that previously described for SA-relatedgenes was observed, so facilitating a prevention of diseaseprogression.
In the case of the phenylalanine ammonia lyase (PAL), thisis a key enzyme in the metabolic pathway of phenylpropanoidcompounds by catalyzing the amino acid L-phenylalanine
Frontiers in Plant Science | www.frontiersin.org 8 September 2015 | Volume 6 | Article 685
72

Mayo et al. Tricho-rhizoc bean genes
FIGURE 5 | Expression of CH5b, CH1, PR1, PR2, PR3, PR4, and PAL genes in comparison with α-actin and PvEF-1α reference genes. The
comparisons and statistical analysis were performed using the REST2009©program (Pfaffl et al., 2002). The numeric data are illustrated at the bottom of
the figure and those showing differences statistically significant (p < 0.05) are indicated with an asterisk and they are boxed in the graphic
representation. Comparison of the gene expression of the bean defense-related genes (A) in plants infected with R. solani R43 vs. control plants. (B) In
plants treated with Trichoderma T019 vs. control plants (C) In plants infected with R. solani R43 and treated with Trichoderma T019 vs. plants infected
with R. solani R43.
TABLE 4 | Ergosterol and squalene quantification from 24 and 96h samples of the selected Trichoderma strains selected for this study.
Trichoderma spp. Ergosterol (mg E/g d wt) Squalene (mg S/g d wt)
24h 96h 24h 96h
T34 16.197 ± 1.019 a 8.970 ± 0.388 b 0.317 ± 0.020 a 0.052 ± 0.049 b
T019 14.336 ± 2.459 a 12.502 ± 3.568 a 0.303 ± 0.041 a 0.348 ± 0.103 a
Values in the same column followed by different letters are significantly different (Fisher’s LSD, p < 0.05).
deamination, giving rise to trans-cinnamic acid and ammonia.The trans-cinnamic acid is used for the synthesis of variousphenolic compounds, which are precursors in the synthesisof esters, coumarins, flavonoids, and lignin. The productionof this enzyme is controlled during plant growth, but is alsoinduced in cells neighboring the infection site and, besidesinfection, various environmental stimuli such as injury, heavymetal contamination, light and growth regulators (Rahman andPunja, 2005). In the present work, we observed that this genewas down-regulated or not affected in all the conditions assayed,indicating that in the analyzed strain, PAL activity would be morefocused in the plant response against environmental stress thanin the response against pathogens, which contrast with the roleof this enzyme described in pepper, where it is involved in thepositive regulation of SA-dependent defense signaling (Kim andHwang, 2014).
Regarding squalene and ergosterol production, in this studyit was found that there were differences among the isolates.Ergosterol is a sterol found in the fungal membrane, whichalthough considered by the plant as a PAMP (pathogen associated
molecular patterns) (Nürnberger et al., 2004) triggers a seriesof reactions (Cervone et al., 1997) which would cause anactivation of the genes of plant defense (Rossard et al., 2010).Squalene is a precursor of the ergosterol biosynthetic pathway(Malmierca et al., 2013) located in the cellular membranes oraccumulated as droplets in the cytoplasm whose physiologicalfunction, apart from acting as an ergosterol precursor, stillremains unclear, but it might play some role in the elicitationof plant defense responses. Thus, in this assay, an increasedproduction of these compounds by Trichoderma would resultin the induction of defense genes in the bean, then theplant could grow better under a pathogen presence in thesoil.
Conclusions
Trichoderma isolates inhibit the development of R. solani underin vitro conditions, when they grow in Petri dishes. In vivoconditions, the bean plants that had been in contact with theTrichoderma isolates always had an increased size when the
Frontiers in Plant Science | www.frontiersin.org 9 September 2015 | Volume 6 | Article 685
Capítulo II
73

Mayo et al. Tricho-rhizoc bean genes
pathogen was not present. When R. solani was present in the soil,the development of the bean plants was significantly reduced.However, bean plants treated with strain T019 did not decreasetheir size in the presence of R. solani.
The interaction of bean plants with R. solani caused, after45 days of growth, the down-regulation of the seven defense-related genes studied (CH5b, CH1, PR1, PR2, PR3, PR4, PAL) asa mechanism to overcome the plant defense response and thusfacilitating the progression of the infection process within theplant.
An increased production of ergosterol and squalene byTrichoderma resulted in the induction of defense genes in thebean plants. In this way, the plant would grow better under apathogen presence in the soil.
T. harzianum T019 shows a positive effect on the levelof resistance of bean plants to R. solani. This strain inducesthe expression of plant defense-related genes and producesa higher level of ergosterol, indicating its ability to grow ata higher rate in the soil, which would explain its positive
effects on plant growth and defense in the presence of thepathogen.
Acknowledgments
The grant awarded to Sara Mayo (FPU12/00677) by the Ministryof Education, Culture and Sport (Spain) according the Resolutionof April 25, 2012 (BOE of 10 May), as amended by Resolution ofMay 18, 2012 (BOE of 22 May), and by Resolution of October31, 2012 (BOE of 12 November) and granted in the Resolution ofDecember 20, 2012. Ministry of Economy and Competitivenessfor National project “Farnesol as self-regulatory molecule inTrichoderma. Tyrosol and farnesol signaling in Trichoderma-bean interaction” (AGL2012-40041-C02-02). Junta de Castillay León, Consejería de Educación for the project “Effect ofterpenes and physiologically related compounds produced byTrichoderma parareesei in the development of common bean(Phaseolus vulgaris L.) and in defensive responses of this plant”(LE228U14). J. Alvarez for his technical support.
References
Anees, M., Tronsmo, A., Edel-Hermann, V., Hjeljord, L. G., Héraud, C.,and Steinberg, C. (2010). Characterization of field isolates of Trichoderma
antagonistic against Rhizoctonia solani. Fungal Biol. 114, 691–701. doi:10.1016/j.funbio.2010.05.007
Angelopoulou, D. J., Naska, E. J., Paplomatas, E. J., and Tjamos, S. E.(2014). Biological control agents (BCAs) of verticillium wilt: influence ofapplication rates and delivery method on plant protection, triggering of hostdefence mechanisms and rhizosphere populations of BCAs. Plant Pathol. 63,1062–1069. doi: 10.1111/ppa.12198
Benhamou, N., Broglie, K., Chet, I., and Broglie, R. (1993). Cytology of infection of35S-bean chitinase transgenic canola plants by Rhizoctonia solani: cytochemicalaspects of chitin breakdown in vivo. Plant J. 4, 295–305. doi: 10.1046/j.1365-313X.1993.04020295.x
Broglie, K., Chet, I., Holliday, M., Cressman, R., Biddle, P., Knowlton, S., et al.(1991). Transgenic plants with enhanced resistance to the fungal pathogenRhizoctonia solani. Science 254, 1194–1197.
Campelo, P., Cardoza, R., Lorenzana, A., Hermosa, M., Monte, E., Reinoso, B.,et al. (2010). Biological control of phytopathogenic fungi in bean (Phaseolusvulgaris L.) with Trichoderma atroviride and Trichoderma virens. [Abstract].Bean Improv. Coop. Colo. 53, 114–115.
Cardoso, J., and Echandi, E. (1987). Biological control of Rhizoctonia root rot ofsnap bean with binucleate Rhizoctonia-like fungi. Plant Dis. 71, 167–170. doi:10.1094/PD-71-0167
Cardoza, R. E., Hermosa, M. R., Vizcaíno, J. A., González, F., Llobell, A., Monte,E., et al. (2007). Partial silencing of a hydroxy-methylglutaryl-CoA reductase-encoding gene in Trichoderma harzianum CECT 2413 results in a lower levelof resistance to lovastatin and lower antifungal activity. Fungal Genet. Biol. 44,269–283. doi: 10.1016/j.fgb.2006.11.013
Cardoza, R. E., Vizcaíno, J. A., Hermosa, M. R., Sousa, S., González, F. J., Llobell,A., et al. (2006). Cloning and characterization of the erg1 gene of Trichoderma
harzianum: effect of the erg1 silencing on ergosterol biosynthesis and resistanceto terbinafine. Fungal Genet. Biol. 43, 164–178. doi: 10.1016/j.frb.2005.11.002
Casquero, P. A., Lema, M., Santalla, M., and De Ron, A. M. (2006). Performanceof common bean (Phaseolus vulgaris L.) landraces from Spain in the Atlanticand Mediterranean environments. Genet. Res. Crop Evol. 53, 1021–1032. doi:10.1007/s10722-004-7794-1
Cervone, F., Castoria, R., Leckie, F., and De Lorenzo, G. (1997).“Perception of fungal elicitors and signal transduction,” in Signal
Transduction in Plants, ed P. Aducci (Basel, Boston, Berlin: Birkhäuser),153–177.
Druzhinina, I. S., Kopchinskiy, A. G., Komon, M., Bissett, J., Szakacs, G., andKubicek, C. P. (2005). An oligonucleotide barcode for species identificationin Trichoderma and Hypocrea. Fungal Genet. Biol. 42, 813–828. doi:10.1016/j.fgb.2005.06.007
Druzhinina, I. S., Seidl-Seiboth, V., Herrera-Estrella, A., Horwitz, B. A., Kenerley,C. M., Monte, E., et al. (2011). Trichoderma: the genomics of opportunisticsuccess. Nat. Rev. Microbiol. 9, 749–759. doi: 10.1038/nrmicro2637
Garaiová, M., Zambojová, V., Šimová, Z., Griac, P., and Hapala, I. (2013).Squalene epoxidase as a target for manipulation of squalene levels in the yeastSaccharomyces cerevisiae. FEMS Yeast Res. 14, 310–323. doi: 10.1111/1567-1364.12107
Ghimire, G. P., Hei, C. L., and Jae, K. S. (2009). Improved squaleneproduction via modulation of the methylerythritol 4-phosphate pathway andheterologous expression of genes from Streptomyces peucetius ATCC 27952 inEscherichia coli. Appl. Environ. Microbiol. 75, 7291–7293. doi: 10.1128/AEM.01402-09
Guerrero-González, M. L., Rodríguez-Kessler, M., Rodríguez-Guerra,R., González-Chavira, M., Simpson, J., Sanchez, F., et al. (2011).Differential expression of Phaseolus vulgaris genes induced during theinteraction with Rhizoctonia solani. Plant Cell Rep. 30, 1465–1473. doi:10.1007/s00299-011-1055-5
Harman, G. E., Howell, C. R., Viterbo, A., Chet, I., and Lorito, M. (2004).Trichoderma species–opportunistic, avirulent plant symbionts. Nat. Rev.
Microbiol. 2, 43–56. doi: 10.1038/nrmicro797Harman, G. E., and Kubicek, C. P. (1998). Trichoderma and Gliocladium:
Enzymes, Biological Control and Commercial Applications.Vol. 2, London: CRCPress.
Hermosa, M. R., Grondona, I., Iturriaga, E. A., Díaz-Mínguez, J. M., Castro,C., Monte, E., et al. (2000). Molecular characterization and identificationof biocontrol isolates of Trichoderma spp. Appl. Environ. Microbiol. 66,1890–1898. doi: 10.1128/AEM.66.5.1890-1898.2000
Hermosa, M. R., Keck, E., Chamorro, I., Rubio, B., Sanz, L., Vizcaíno, J. A., et al.(2004). Genetic diversity shown in Trichoderma biocontrol isolates.Mycol. Res.
108, 897–906. doi: 10.1017/S0953756204000358Hermosa, R., Belén Rubio, M., Cardoza, R. E., Nicolás, C., Monte, E., and
Gutiérrez, S. (2013). The contribution of Trichoderma to balancing the costs ofplant growth and defense. Int.Microbiol. 16, 69–80. doi: 10.2436/20.1501.01.181
Hermosa, R., Viterbo, A., Chet, I., and Monte, E. (2012). Plant-beneficial effectsof Trichoderma and of its genes. Microbiol 158, 17–25. doi: 10.1099/mic.0.052274-0
Jung, H. W., and Hwang, B. K. (2000). Pepper gene encoding a basic ß-1,3-glucanase is differentially expressed in pepper tissues upon pathogen infection
Frontiers in Plant Science | www.frontiersin.org 10 September 2015 | Volume 6 | Article 685
74

Mayo et al. Tricho-rhizoc bean genes
and ethephon or methyl jasmonate treatment. Plant Sci. 159, 97–106. doi:10.1016/S0168-9452(00)00334-4
Kim, D. S., and Hwang, B. K. (2014). An important role of the pepperphenylalanine ammonia-lyase gene (PAL1) in salicylic acid-dependentsignalling of the defence response to microbial pathogens. J. Exp. Bot. 65,2295–2306. doi: 10.1093/jxb/eru109
Kullnig, C., Krupica, T., Woo, S. L., Mach, R. L., Rey, M., Benítez, T., et al. (2001).Confusion abounds over identities of Trichoderma biocontrol isolates. Mycol.
Res. 105, 770–772. doi: 10.1017/S0953756201229967Lehtonen, M. J., Somervuo, P., and Valkonen, J. P. T. (2008). Infection with
Rhizoctonia solani induces defense genes and systemic resistance in potatosprouts grown without light. Phytopathol 98, 1190–1198. doi: 10.1094/PHYTO-98-11-1190
Lochman, J., and Mikeš, V. (2005). Activation of different defence-relatedgenes expression by ergosterol. FEBS J. 272, 470. doi: 10.1111/j.1742-4658.2005.4739_12.x
Malmierca, M. G., Barua, J., Mccormick, S. P., Izquierdo-Bueno, I., Cardoza, R.E., Alexander, N. J., et al. (2014). Novel aspinolide production by Trichoderma
arundinaceum with a potential role in Botrytis cinerea antagonistic activity andplant defence priming. Environ. Microbiol. 17, 1103–1118. doi: 10.1111/1462-2920.12514
Malmierca, M. G., Cardoza, R. E., Alexander, N. J., McCormick, S. P., Collado, I.G., Hermosa, R., et al. (2013). Relevance of trichothecenes in fungal physiology:disruption of tri5 in Trichoderma arundinaceum. Fungal Genet. Biol. 53, 22–33.doi: 10.1016/j.fgb.2013.02.001
Mukherjee, P. K., Horwitz, B. A., Herrera-Estrella, A., Schmoll, M., and Kenerley,C. M. (2013). Trichoderma research in the genome era. Annu. Rev. Phytopathol.51, 105–129. doi: 10.1146/annurev-phyto-082712-102353
Nürnberger, T., Brunner, F., Kemmerling, B., and Piater, L. (2004). Innateimmunity in plants and animals: Striking similarities and obvious differences.Immunol. Rev. 198, 249–266. doi: 10.1111/j.0105-2896.2004.0119.x
Papavizas, G. (1985). Trichoderma and Gliocladium: biology, ecology,and potential for biocontrol. Annu. Rev. Phytopathol. 23, 23–54. doi:10.1146/annurev.py.23.090185.000323
Pereira, J. L., Queiroz, R. M. L., Charneaum, S. O., Felix, C. R., Ricart, C. A. O.,Lopes Da Silva, F., et al. (2014). Analysis of Phaseolus vulgaris response to itsassociation with Trichoderma harzianum (ALL-42) in the presence or absenceof the phytopathogenic fungi Rhizoctonia solani and Fusarium solani. PLoSONE 9:e98234. doi: 10.1371/journal.pone.0098234
Pfaffl, M. W., Horgan, G. W., and Dempfle, L. (2002). Relative expressionsoftware tool (REST) for group-wise comparison and statistical analysis ofrelative expression results in real-time PCR. Nucleic Acids Res. 30:e36. doi:10.1093/nar/30.9.e36
Rahman, M., and Punja, Z. K. (2005). Biochemistry of ginseng root tissuesaffected by rusty root symptoms. Plant Physiol. Biochem. 43, 1103–1114. doi:10.1016/j.plaphy.2005.09.004
Rigaud, J. R., and Puppo, A. (1975). Indole 3 acetic acid catabolism by soybeanbacteroids. J. Gen. Microbiol. 88, 223–228. doi: 10.1099/00221287-88-2-223
Rivière, M., Marais, A., Ponchet, M., Willats, W., and Galiana, E. (2008). Silencingof acidic pathogenesis-related PR-1 genes increases extracellular β-(1→3)-glucanase activity at the onset of tobacco defence reactions. J. Exp. Bot. 59,1225–1239. doi: 10.1093/jxb/ern044
Rossard, S., Roblin, G., and Atanassova, R. (2010). Ergosterol triggers characteristicelicitation steps in Beta vulgaris leaf tissues. J. Exp. Bot. 61, 1807–1816. doi:10.1093/jxb/erq047
Ruano-Rosa, D., del Moral-Navarrete, L., and Lopez-Herrera, C. J. (2010).Selection of Trichoderma spp. isolates antagonistic to Rosellinia necatrix. Span.J. Agric. Res. 8, 1084–1097. doi: 10.5424/sjar/2010084-1403
Tello, J., Lacasa, A., and Molina, R. (1985). Una nota fitopatológica sobreel complejo parasitario del pie de la judía (Phaseolus vulgaris). ITEA 61,57–69.
Upchurch, R. G., and Ramirez, M. E. (2010). Defense-related gene expression insoybean leaves and seeds inoculated with Cercospora kikuchii and Diaporthe
phaseolorum var. meridionalis. Physiol. Mol. Plant Pathol. 75, 64–70. doi:10.1016/j.pmpp.2010.08.007
Valenciano, J. B., Casquero, P. A., Boto, J. A., and Marcelo, V. (2006). Evaluationof the occurrence of root rots on bean plants (Phaseolus vulgaris) usingdifferent sowingmethods andwith different techniques of pesticide application.N.Z. J. Crop. Horticul. Sci. 34, 291–298. doi: 10.1080/01140671.2006.9514419
Vellicce, G. R., Ricci, J. C. D., Hernández, L., and Castagnaro, A. P. (2006).Enhanced resistance to Botrytis cinerea mediated by the transgenic expressionof the chitinase gene ch5B in strawberry. Transgenic Res. 15, 57–68. doi:10.1007/s11248-005-2543-6
Veloso, J., and Díaz, J. (2012). Fusarium oxysporum Fo47 confers protectionto pepper plants against Verticillium dahliae and Phytophthora capsici, andinduces the expression of defence genes. Plant Pathol. 61, 281–288. doi:10.1111/j.1365-3059.2011.02516.x
Woo, S. L., and Lorito, M. (2007). “Exploiting the interactions between fungalantagonists, pathogens and the plant for biocontrol,” in Novel Biotechnologies
for Biocontrol Agent Enhancement and Management, eds M. Vurro and J.Gressel (Dordrecht: Springer), 107–130.
Woo, S., Scala, F., Ruocco, M., and Lorito, M. (2006). The molecular biology ofthe interactions between Trichoderma spp., phytopathogenic fungi, and plants.Phytopathol 96, 181–185. doi: 10.1094/PHYTO-96-018
Yedidia, I., Srivastva, A. K., Kapulnik, Y., and Chet, I. (2001). Effect of Trichoderma
harzianum onmicroelement concentrations and increased growth of cucumberplants. Plant Soil 235, 235–242. doi: 10.1023/A:1011990013955
Zhao, Y., Thilmony, R., Bender, C. L., Schaller, A., He, S. Y., and Howe, G.A. (2003). Virulence systems of Pseudomonas syringae pv. tomato promotebacterial speck disease in tomato by targeting the jasmonate signaling pathway.Plant J. 36, 485–499. doi: 10.1046/j.1365-313X.2003.01895.x
Conflict of Interest Statement: The authors declare that the research wasconducted in the absence of any commercial or financial relationships that couldbe construed as a potential conflict of interest.
Copyright © 2015 Mayo, Gutiérrez, Malmierca, Lorenzana, Campelo, Hermosa and
Casquero. This is an open-access article distributed under the terms of the Creative
Commons Attribution License (CC BY). The use, distribution or reproduction in
other forums is permitted, provided the original author(s) or licensor are credited
and that the original publication in this journal is cited, in accordance with accepted
academic practice. No use, distribution or reproduction is permitted which does not
comply with these terms.
Frontiers in Plant Science | www.frontiersin.org 11 September 2015 | Volume 6 | Article 685
Capítulo II
75


capítulo III
Development of a qPCR strategy to select bean genes involved in plant defence
response and regulated by the Trichoderma velutinum - Rhizoctonia solani interaction


ÍNDICE CAPÍTULO III
INTRODUCTION.................................................................................................. 82
MATERIALS AND METHODS........................................................................... 82
Trichoderma and Rhizoctonia solani isolates and culture collections................................ 82
Plant materials and growth conditions............................................................................... 83
RNA extraction and purification........................................................................................ 83
cDNA synthesis.................................................................................................................. 83
qPCR conditions and analysis............................................................................................ 83
RESULTS.................................................................................................................. 83
Selection of putative bean defense-related genes............................................................... 83
Selection of a Trichoderma strain to validate the gene selection strategy.......................... 84
Effect of R. solani infection on expression of the selected genes. Validation of the procedure used to select bean genes involved in defense responses (Strategy validation I)......................................................................................................................................... 84
Effect of Trichoderma on expression of the selected genes (Strategy validation II)....................................................................................................................................... 84
Effect of interaction of T. velutinum and R. solani on expression of the selected genes (strategy validation III)...................................................................................................... 86
DISCUSSION.......................................................................................................... 86
CONCLUSION........................................................................................................ 90
REFERENCES.......................................................................................................... 90

TABLAS
Table 1: Genes selected for stress and/or defense response and their empirical expression in Phaseolus vulgaris leaves................................................................................................................85
Table 2: Common bean sequences used for primer design for RT-PCR analysis...........................87
FIGURAS
Figure 1: Bean seeds of “Canela” variety of the Protected Geographical Indication "Alubia La Bañeza – León” (Spain)...................................................................................................................82
Figure 2: Schematic representation of the work flow set up in the present work to select bean genes involved in plant defence.................................................................................................................84
Figure 3: Evaluation of the diameter of the hypocotyl (above left), length of root system (above right) dry weight of the aerial part (below left) and root system (below right) of bean plants grown during 45 days after sowing. [Trichoderma velutinum T028 without pathogen (CT028), T. velutinum T028 with Rhizoctonia solani (RT028), R. solani control (RC) and control without fungus (CC)]................................................................................................................................................88
Figure 4: Analysis of relative expression levels of the bean defence genes selected in the present work in bean plants infected with R. solani versus their levels of expression in control plants. The data were analysed by the 2-ΔΔCt method. The differences statistically significant respect to control plants (p<0.05) are indicated with an asterisk..................................................................................89
Figure 5: Analysis of relative expression levels of the bean defence genes selected in the present work in bean plants treated with T. velutinum versus their levels of expression in control plants. The data were analysed as indicated in the legend to the Figure 4..........................................................89
Figure 6: Analysis of relative expression levels of the bean defence genes selected in the present work in bean plants infected with R. solani and treated with T. velutinum versus their levels of expression in control plants. The data were analysed as indicated in the legend to the Figure 4.......89

fpls-07-01109 August 4, 2016 Time: 14:48 # 1
ORIGINAL RESEARCHpublished: 04 August 2016
doi: 10.3389/fpls.2016.01109
Edited by:Jaime Prohens,
Polytechnic University of Valencia,Spain
Reviewed by:Ana Paula Rodiño,
Misión Biológica de Galicia – CSIC,Spain
Eriston Vieira Gomes,University of São Paulo, Brazil
*Correspondence:Pedro A. Casquero
Specialty section:This article was submitted to
Crop Science and Horticulture,a section of the journal
Frontiers in Plant Science
Received: 30 May 2016Accepted: 12 May 2016
Published: 04 August 2016
Citation:Mayo S, Cominelli E, Sparvoli F,
González-López O,Rodríguez-González A, Gutiérrez S
and Casquero PA (2016)Development of a qPCR Strategy
to Select Bean Genes Involvedin Plant Defense Response
and Regulated by the Trichodermavelutinum – Rhizoctonia solani
Interaction. Front. Plant Sci. 7:1109.doi: 10.3389/fpls.2016.01109
Development of a qPCR Strategy toSelect Bean Genes Involved in PlantDefense Response and Regulated bythe Trichoderma velutinum –Rhizoctonia solani InteractionSara Mayo1, Eleonora Cominelli2, Francesca Sparvoli2, Oscar González-López1,Alvaro Rodríguez-González1, Santiago Gutiérrez3 and Pedro A. Casquero1*
1 Research Group of Engineering and Sustainable Agriculture, Department of Agrarian Engineering and Sciences, NaturalResources Institute, University of León, León, Spain, 2 Institute of Agricultural Biology and Biotechnology, Consiglio Nazionaledelle Ricerche, Milan, Italy, 3 Area of Microbiology, University School of Agricultural Engineers, University of León, Ponferrada,Spain
Bean production is affected by a wide diversity of fungal pathogens, among themRhizoctonia solani is one of the most important. A strategy to control bean infectiousdiseases, mainly those caused by fungi, is based on the use of biocontrol agents(BCAs) that can reduce the negative effects of plant pathogens and also can promotepositive responses in the plant. Trichoderma is a fungal genus that is able to inducethe expression of genes involved in plant defense response and also to promote plantgrowth, root development and nutrient uptake. In this article, a strategy that combinesin silico analysis and real time PCR to detect additional bean defense-related genes,regulated by the presence of Trichoderma velutinum and/or R. solani has been applied.Based in this strategy, from the 48 bean genes initially analyzed, 14 were selected, andonly WRKY33, CH5b and hGS showed an up-regulatory response in the presence ofT. velutinum. The other genes were or not affected (OSM34) or down-regulated by thepresence of this fungus. R. solani infection resulted in a down-regulation of most ofthe genes analyzed, except PR1, OSM34 and CNGC2 that were not affected, and thepresence of both, T. velutinum and R. solani, up-regulates hGS and down-regulatesall the other genes analyzed, except CH5b which was not significantly affected. Asconclusion, the strategy described in the present work has been shown to be effectiveto detect genes involved in plant defense, which respond to the presence of a BCA orto a pathogen and also to the presence of both. The selected genes show significanthomology with previously described plant defense genes and they are expressed inbean leaves of plants treated with T. velutinum and/or infected with R. solani.
Keywords: biotic stress, systemic acquired resistance, induced systemic resistance, hypersensitive response,defense genes, biocontrol agent, Phaseolus vulgaris
Frontiers in Plant Science | www.frontiersin.org 1 August 2016 | Volume 7 | Article 1109
Capítulo III
81

fpls-07-01109 August 4, 2016 Time: 14:48 # 2
Mayo et al. qPCR Strategy to Select Genes
INTRODUCTION
The common bean (Phaseolus vulgaris L.) is the most importantfood legume crop worldwide. Bean production is often affectedby biotic and abiotic factors (Guerrero-González et al., 2011) bymicroorganisms, humidity, temperature. . . that are detected assignals for the activation of plant response mechanisms. This cropis affected by a wide diversity of fungal pathogens (Sclerotiniaspp., Fusarium spp., Phytium spp., Botrytis spp.,...) amongthem Rhizoctonia solani JG Kühn [Teleomorph: Thanatephoruscucumeris (AB Frank) Donk] has a remarkable importanceas responsible of important economic losses in this crop(Valenciano et al., 2006). R. solani is a necrotrophic pathogenresponsible for the root and hypocotyl diseases. Plant infectionoccurs through wounds or by the direct action of the fungalmycelium, which tears the cuticle and penetrates the epidermis(Guerrero-González et al., 2011).
As a strategy to control bean infectious diseases, mainlythose caused by fungi, the use of biocontrol agents (BCA) canreduce the negative effects of plant pathogens and they also canpromote positive responses in the plant (Shoresh et al., 2010). Thegenera Trichoderma, Gliocladium, Rhizobium, Pseudomonas, arebeneficial organisms that have shown good efficiency as BCAsagainst pathogenic microorganisms. Trichoderma (Teleomorph:Hypocrea) is a fungal genus that is found in the soil, and itis a secondary fast growing opportunistic invasive. In addition,Trichoderma biocontrol strains are able to induce the expressionof genes involved in defense response and also to promote plantgrowth, root development, and nutrient uptake (Hermosa et al.,2012).
The relationships established between plant and micro-organisms are very diverse. When a plant is exposed toa pathogenic microorganism, the production of moleculesassociated to salicylic acid is increased, being this a systemicacquired resistance (SAR) response. The response of plantsagainst non-pathogenic microorganisms is different, resulting inactivation of signaling cascades that are dependent on jasmonicacid and ethylene, such as hydroperoxide lyase, peroxidase, andphenylalanine ammonia lyase, all of which belong to an inducedsystemic resistance (ISR) response (Druzhinina et al., 2011).Other responses result in a rapid cell death in infected tissues,then plants activate the hypersensitive response that involvesthe accumulation of salicylic acid, reactive oxygen species andan increased the influx of Ca2+ (Guerrero-González et al.,2011).
In the tripartite interaction of bean plants with the pathogenR. solani and a biocontrol Trichoderma species, several changesare produced in the plant, such as the increase in phenolic acidand lignin, accumulation of phytoalexins (Guerrero-Gonzálezet al., 2011), and down- or up-regulation of defense-related genesexpression (Mayo et al., 2015). Different categories of defense-related genes whose expression is modulated by biotic stresseshave been described in bean plant interacting with pathogen andnon-pathogenic microorganisms (Mayo et al., 2015).
Our hypothesis is that the combination of real timePCR with “in silico” analysis is a valid strategy to identifybean defense-related genes regulated by BCAs and/or plant
pathogens. The aim is develop a systematic strategy todetect bean defense-related genes regulated by the presence ofTrichoderma velutinum and/or R. solani. Finally, the procedurehas been validated by the analysis of expression of theselected genes in the presence or absence of these twofungi.
MATERIALS AND METHODS
Trichoderma and Rhizoctonia solaniIsolates and Culture CollectionsTrichoderma velutinum T028, was collected from the beantraditional production area (Protected Geographical Indication,PGI), called “Alubia La Bañeza - León” (EC Reg. n.256/2010published on March 26th, 2010, OJEU L880/17), from aHigh Quality variety of beans (Figure 1) without any geneticmanipulation. It was isolated from soil plot bean in the Astorgaregion (León, Spain). This isolate gave percentages of inhibitiongreater that 60% in membrane assays and 40% in directconfrontation assays with R. solani, and that was able to sporulateon potato-dextrose-agar (PDA) medium.
Rhizoctonia solani R43 was isolated from bean plants of thesame PGI and selected based on its high virulence. The isolatedstrains were stored in the collection “Pathogens and Antagonistsof the Laboratory Diagnosis of Pests and Diseases” (PALDPD,University of León, León, Spain).
Isolates were inoculated on PDA (Becton Dickinson,Germany) medium and grown at 25◦C in the dark for 1 week.After this incubation time T. velutinum T028 was exposed tolight in order to induce the spore’s formation.
FIGURE 1 | Bean seeds of “Canela” variety of the ProtectedGeographical Indication “Alubia La Bañeza – León” (Spain).
Frontiers in Plant Science | www.frontiersin.org 2 August 2016 | Volume 7 | Article 1109
82

fpls-07-01109 August 4, 2016 Time: 14:48 # 3
Mayo et al. qPCR Strategy to Select Genes
Plant Materials and Growth ConditionsSixty bean seeds (Canela landrace, PGI “Alubia de la Bañeza –León,” Figure 1) per treatment were germinated and cultured inpresence or absence of the fungi in four conditions accordingto the procedure previously described by Mayo et al. (2015):(i) T. velutinum (T028) isolate plus R. solani (R43) (RT028);(ii) T. velutinum isolate (T028) without pathogen (C = control)(CT028); (iii) control (without T. velutinum) with R. solani (RC)and (iv) control without fungi (CC). The culture was carried outin climatic chamber and growth conditions were performed aspreviously described (Mayo et al., 2015). Six bean leaves from45 day-old plants of each treatment were randomly collected andstored at−80◦C until use.
RNA Extraction and PurificationThe procedures for RNA extraction were performed as describedpreviously (Reid et al., 2006). Bean leaves were lyophilized andwere ground to a fine powder in liquid nitrogen using a mortarand pestle. The powder was mixed with 20 ml of extractionbuffer/g of sample (extraction buffer: 0.1% SDS, 100 mM LiCl,10 mM EDTA, 100 mM Tris-HCl, pH9) pre-warmed at 65◦C, and20 ml/g of phenol-chloroform-isoamyl alcohol 25:24:1 (Sigma–Aldrich, St. Louis, MO, USA). Then, the mixtures, in eppendorftubes, were centrifuged at 13,000 rpm for 10 min at 4◦C. Theaqueous layer was transferred to a new tube. This step wasrepeated twice. Nucleic acids were precipitated with 1 volumeof LiCl 4 M, mixed and kept overnight at 4◦C. Tubes were thencentrifuged at 13,000 rpm for 30 min at 4◦C, and the resultingpellets were washed with ice cold ethanol 70%-DEPC, centrifugedagain at 13,000 rpm for 10 min at 4◦C and air dried. Finally,the pellets were dissolved in 50–200 µl H2O-DEPC and storedat−20◦C until use.
RNA concentrations and its purity were estimated from theA260/280 absorbance ratio with a NanoDrop (Thermo Scientific,Wilmington, DE, USA), considering the ideal absorbance ratio(1.8 ≤ A260/280 ≤ 2.0) and 1% agarose gel was run to visualizethe integrity of the RNA.
cDNA SynthesisApproximately 5 µg of RNA were treated with DNase using theTURBO DNAfreeTM Kit (Applied Biosystems, Foster City, CA,USA), according to the manufacturer instructions. cDNA wassynthesized using High-Capacity cDNA Reverse Transcriptionkit (Applied-Biosystems, Foster City, CA, USA) according to themanufacture’s manual.
qPCR Conditions and AnalysisqPCR reactions were performed with 7300 System (AppliedBiosystems, Foster City, CA, USA) using SYBR R© Green. Eachreaction was performed in 20 µl containing 10 µl of 2 X PowerSYBR Green PCR Master Mix (Life Technologies), 0.2–0.3 µMprimers and cDNA samples diluted 1:20. Each qPCR reactionwas performed in triplicate. Reactions were run using the cyclingparameter described previously (Reid et al., 2006) and the qPCRdata were analyzed by the 2−11Ct method (Pfaffl, 2001). In orderto analyze the qPCR data, Act11 gene was used as housekeeping
to determine the relative expression level of the other genesanalyzed in this work (Borges et al., 2012). T. velutinum T028strain was selected as reference strain in this study basedon its positive effects on bean phenotype with and withoutR. solani infection (data no published). For the determinationof qPCR efficiency of each primer pairs, a standard curve wasperformed using the following cDNA dilutions: 1:4, 1:16, 1:64;1:256 and 1:1024. Every measurement was made in triplicate.The corresponding qPCR efficiencies (E) were calculated forevery primer pair with the software 7300 System SDS software(Applied Biosystems, Foster City, CA, USA) according to theequation E = (10−1/slope
− 1) × 100 (Rutledge and Stewart,2008).
The significance of the differences between the geneexpressions levels were compared by the Student’s t-test usingSAS (SAS Institute Inc., 2004, Cary, NC, USA).
RESULTS
Selection of Putative BeanDefense-Related GenesFollowing an exhaustive and systematic analysis, summarized inthe Figure 2, several bean genes were selected for their expressionanalysis in leaves from bean plants grown in interaction withT. velutinum and infected or not with Rhizoctonia solani. Thus, asresult of the search in the literature, 48 genes were firstly found,showing stress and/or defense response (Table 1). Only thosegenes that resulted to be expressed in P. vulgaris leaves, based ontranscriptomic data reported in the Phytozome database1, wereconsidered for qPCR expression analysis in leaves. The genes forwhich we confirmed expression in leaves were considered forfurther analyses.
As result, from the 48 genes selected for their involvement inbean stress and/or defense responses, only 19 were selected whichshowed a detectable level of expression in bean leaves.
The selected genes can be included in nine different groups(Table 2): (i) involved in the regulation of the balancebetween necrotrophic and biotrophic pathogen responses:WRKY33 (WRKY transcription factor) (NM129404.3) (Bakshiand Oelmüller, 2014); (ii) pathogenesis related genes: PR1(pathogenesis related 1) (HO864272) (Guerrero-González et al.,2011), PR2 (β 1-3 endoglucanase) (HO864270) (Guerrero-González et al., 2011), PR3 (chitinase class I) (TC18606)(Pereira et al., 2014), PR4 (pathogenesis related 4) (HO864354)(Guerrero-González et al., 2011), PR16a (germin.like protein8) (CB540239) (Borges et al., 2012), IPER (basic peroxidase)(AF007211) (Upchurch and Ramirez, 2010), PPO (polyphenoloxidase) (EF158428) (Upchurch and Ramirez, 2010); (iii) relatedwith the ethylene signaling pathway: ERF1 (ethylene-responsivetranscription factor 1) (AF076277) (Lorenzo et al., 2003),ERF5 (ethylene-responsive transcription factor 5) (At5g47230)(Moffat et al., 2012), and CH5b (endochitinase precursor)(FE897014.1) (Vellicce et al., 2006); (iv) involved in phytoalexin
1http://phytozome.jgi.doe.gov/pz/portal.html
Frontiers in Plant Science | www.frontiersin.org 3 August 2016 | Volume 7 | Article 1109
Capítulo III
83

fpls-07-01109 August 4, 2016 Time: 14:48 # 4
Mayo et al. qPCR Strategy to Select Genes
biosynthesis: PAL1 (phenylalanine and histidine ammonia-lyase) (KF279696) (Kim and Hwang, 2014); (v) related inosmotin biosynthesis: OSM34 (osmitin-like protein) (At4g11650)(Sharma et al., 2013); (vi) involved in Ca2+ signaling: CNGC2(cyclic nucleotide-gated ion channel 2) (CB542582) (Borges et al.,2012); (vii) needed for antimicrobials and oxylipins (defensesignaling molecules): HPL (hydroperoxide lyase) (AW733791)(Upchurch and Ramirez, 2010), Lox2 (lipoxygenase 2) (D13949)(Upchurch and Ramirez, 2010), Lox7 (lipoxygenase 2) (Upchurchand Ramirez, 2010); (viii) GSTa (2,4-D inducible glutathioneS-transferase) (HO864392) (Guerrero-González et al., 2011); and(ix) hGS (homoglutathione synthetase) (HO864377) both relatedwith oxidative stress (Guerrero-González et al., 2011).
However, only 14 genes were selected to the study of theexpression genes because PR16a, IPER, PPO, Lox2, and Lox7,showing negative qPCR results, were finally discarded.
Selection of a Trichoderma Strain toValidate the Gene Selection StrategyTrichoderma velutinum T028 was the selected isolate, based on itspositive effect on bean growth. Thus, plants inoculated with thisstrain showed a significant increase in dry weight of both aerialparts and root system, including when R. solani was present inthe substrate (Figure 3). Thus, when bean plants were treatedwith T. velutinum T028 they increased respect to control plants(CC) 4.75% their diameter of hypocotyl, 10.75% their length ofroot system, 4.27 and 5.51% in dry weight of aerial parts and rootsystem, respectively. When plants were infected with R. solani,the action of T. velutinum T028 caused an increased respectto the control plant with the pathogen (RC) of the diameter
of hypocotyl in 8.76, 21.15% in the length of root system, and11.05 and 3.43% in dry weight of aerial parts and root systemrespectively.
Based on these results, this isolate was used for further studies.In addition, this is the first report in which the effects of this strainon bean phenotype and plant gene regulation are studied.
Effect of R. solani Infection onExpression of the Selected Genes.Validation of the Procedure Used toSelect Bean Genes Involved in DefenseResponses (Strategy Validation I)A significant down-regulation of expression of PR2, PR3, PR4,ERF1, ERF5, PAL1, HPL, and GTSa genes with ratios ofexpression ranging from 0.149 fold for PAL1 and 0.763 foldfor PR3 was observed in bean plants grown in the presence ofR. solani (RC) compared to control plants (CC). Conversely,expression of PR1, OSM34, CNGC2, and hGS genes was up-regulated, but with non-statistically significant differences witha ratios between 1.289 and 1.193 for PR1 and hGS, respectively(Figure 4).
Effect of Trichoderma on Expression ofthe Selected Genes (StrategyValidation II)Trichoderma treatment also down-regulates expression of most ofthe bean defense-related genes, but at a lower level than R. solani.Thus, when T. velutinum T028 was in the substrate (CT028),PR2, PR3, PR4, ERF1, ERF5, PAL1, CNGC2, HPL, and GSTa
FIGURE 2 | Schematic representation of the work flow set up in the present work to select bean genes involved in plant defense.
Frontiers in Plant Science | www.frontiersin.org 4 August 2016 | Volume 7 | Article 1109
84

fpls-07-01109 August 4, 2016 Time: 14:48 # 5
Mayo et al. qPCR Strategy to Select Genes
TABLE 1 | Genes selected for stress and/or defense response and their empirical expression in Phaseolus vulgaris leaves.
Id Gene Accession number Functional annotation NCBI Phytozome
Pereira et al., 2014
1 Chit AY357300.2 Chitanase
2 Glu1 DQ093563.1 β-1,3-glucanase
3 Pod3 AF485265.1 Peroxidase
4 PR3 TC18606 Chitinase class I Phvul.009G116600
5 Lox1 U76687.2 Lipoxygenase
Upchurch and Ramirez, 2010
6 PPO EF158428 Polyphenol oxidase
7 PR10 AJ289155 Stress-induced ribonuclease-like protein
8 PR12 BU964598 Defensin precursor
9 MMP2 AY057902 Matrix metalloproteinase 2
10 CHS X53958 Chalcone synthase
11 AOS DQ288260 Allene oxide synthase
12 HPL AW733791 Hydroperoxide lyase Phvul.005G116800
13 LOX2 D13949 Lipoxygenase 2 Phvul.005G156700
14 LOX7 U36191 Lipoxygenase 2 Phvul.005G156900
15 IPER AF007211 Basic peroxidase Phvul.009G215000
Borges et al., 2012
16 PR16a CB540239 Germin-like protein 8 Phvul.010G129900
17 PGIa CB542106 Polygalacturonase-inhibitor-like protein
18 MAPKK CB543156 MEK map kinase kinase
19 PROF CB543496 Profilin
20 CNGC2 CB542582 Cyclin nucleotide-gated ion channel 2 Phvul.008G036200
Guerrero-González et al., 2011
21 PR1 HO864272 Pathogenesis related protein 1 Phvul.003G109100
22 PR2 HO864270 Pathogenesis related protein 2 Phvul.003G109200
23 PR4 HO864354 Pathogenesis related protein 4 Phvul.006G102300
24 PR10 HO864271 Pathogenesis related protein 10)
25 LTP2 HO864366 Lipid-transfer protein 2
26 SIP HO864290 Syringolide-induced protein B13-1-9
27 DAAP HO864358 Defense associated acid phosphatase
28 CHI HO864289 Chalcone isomerase
29 hGS HO864377 Homoglutathione synthetase Phvul.006G094500
30 aDO1 HO864351 Alpha- dioxygenase 1
31 CPRD14 HO864341 CPRD14 protein
32 OPR5 HO864304 12-oxophytodienoic acid 10, 11-reductase
33 GST22 HO864275 Glutathione S-transferase 22
34 CPRD8 HO864396 CPRD8 protein
35 UDPGT HO864301 UDP-glucosyl transferase 72E1
36 ERD15 HO864375 ERD15 protein
37 GTSa HO864392 2,4-D inducible glutathione S-transferase Phvul.002G241400
38 GST15 HO864369 Glutathione S-transferase 15
Gallou et al., 2009
39 GST1 J03679 Gluthatione-S-transferase 1
Lehtonen et al., 2008
40 TSI-1 BQ121547 TSI-1 protein
41 Lip BQ112158 Lipase-like protein
42 Amintransf2 BQ517030 Aminotransferase 2 Phvul.006G029100
Bakshi and Oelmüller, 2014
43 WRKY33 NM129404.3 WRKY transcription factors Phvul.008G090300
Vellicce et al., 2006
44 CH5b FE897014.1 Endochitinase precursor Phvul.009G116500
Lorenzo et al., 2003
(Continued)
Frontiers in Plant Science | www.frontiersin.org 5 August 2016 | Volume 7 | Article 1109
Capítulo III
85

fpls-07-01109 August 4, 2016 Time: 14:48 # 6
Mayo et al. qPCR Strategy to Select Genes
TABLE 1 | Continued
Id Gene Accession number Functional annotation NCBI Phytozome
45 ERF1 AF076277 Ethylene-Responsive Transcription Factor 1 Phvul.007G127800
Moffat et al., 2012
46 ERF5 At5g47230 Ethylene-Responsive Transcription Factor 5 Phvul.002G055700
Kim and Hwang, 2014
47 PAL1 KF279696 Phenylalanine and histidine ammonia-lyase Phvul.001G177800
Sharma et al., 2013
48 OSM34 At4g11650 Osmotin-like protein Phvul.002G155500
were significantly down-regulated with expression ratios rangingfrom 0.168 for PR4 to 0.754 for ERF1. However, WRKY 33,CH5b, and hGS were up-regulated when compared with the levelsof expression in control plants, with relative expression levelsbetween 2.462 for CH5b and 1.576 for hGS (Figure 5). OSM34was slightly but not significantly up-regulated.
Effect of Interaction of T. velutinum andR. solani on Expression of the SelectedGenes (Strategy Validation III)When T. velutinum T028 and R. solani (RT028) were in thesubstrate, the genes WRKY33, PR2, PR3, PR4, ERF1, ERF5, PAL1,OSM34, HPL and GSTa were significantly down-regulated withvalues between 0.179 for PAL1 and 0.631 for WRKY33. In thecase of PR1 and CNGC2, they were also down-regulated but notsignificantly respect to control plant (C). Conversely, hGS wasup-regulated with a significant ratio of 1.589 respect to controlplants, while CH5b was not significantly up-regulated with a ratioof 1.613 (Figure 6).
DISCUSSION
Plants have developed some defensive strategies to perceivepathogen attack and to translate this perception into anappropriate adaptive response. During attack, plants are ableto enhance their resistance (induced, acquired, hypersensitive)(Lodha and Basak, 2012). Contact with pathogenic and non-pathogenic microorganisms triggers two mechanisms: (i) SARthat is usually triggered by local infections, it provides long-term systemic resistance to pathogen attack and requires theinvolvement of the signal molecule salicylic acid (Durrantand Dong, 2004), and (ii) ISR that is known to result fromcolonization of roots by certain non-pathogenic microorganismsand is dependent on components of the jasmonic acid andethylene signaling pathways (Shoresh et al., 2010). Then, thecombination of both types of induced resistance response canprotect the plant against pathogens and can even result in additivelevel of induced protection against pathogens through both thejasmonic acid/ethylene and salicylic acid pathways (Verhagenet al., 2006).
In the present work we developed a strategy to select genesinvolved in bean defense response, which would belong to thosepathways, but also genes that can contribute to plant defenseby other mechanisms. In this sense several previous works have
described genes involved in bean defense response (Guerrero-González et al., 2011; Mayo et al., 2015). However, in thepresent work, by a systematic approach, 48 genes were initiallyconsidered, and 14 finally selected, which match with the criteriaset up in this work: (i) they showed significant homology withpreviously described plant defense genes, and (ii) were expressedin bean leaves of plants treated with Trichoderma and/or infectedwith R. solani.
The expression of P. vulgaris defense-related genes wasanalyzed in leaves, although the interaction with Trichodermaand/or R. solani is initially produced at the root level, todetermine if the signals generated in roots as result of thisinteraction are able to systematically stimulate the bean defensealong long distance from roots to the leaves. The isolateT. velutinum T028 was selected following a similar strategy to thatpreviously described (Mayo et al., 2015), and based on its positiveeffect on bean growth. In this work, to select a Trichodermaisolate, the results of the in vitro membrane assays and directconfrontation assays against R. solani were analyzed. IsolateTrichoderma T019 was then selected, showing a percentage ofinhibition higher than 40% in the membrane assays, and/or 20%in the direct confrontation assays. This isolate also showed thebest positive effects on plant phenotype among all the analyzedisolates.
WRKY transcription factors have been involved in theregulation of plant defense gene expression (Rushton andSomssich, 1998; Singh et al., 2002). Thus, WRKY33 has a rolein biotic stress defense, where it regulates the balance betweennecrotrophic and biotrophic pathogen responses (Lippok et al.,2007; Pandey and Somssich, 2009; Birkenbihl et al., 2012).Previous studies have pointed out the involvement of ArabidopsisWRKY transcription factors in regulating the expression ofPR genes by direct binding (Chen et al., 2002; Kim et al.,2006). A rapid pathogen-induced WKRY33 expression did notrequire salicylic acid signaling but a downregulation of thisgene involved a direct activation of jasmonic acid (Bakshi andOelmüller, 2014). In the present case, when bean plants werein contact T. velutinum T028 without pathogen, the WRKY33gene expression was significantly up-regulated while the PR genesexpression (PR2, PR3 and PR4) was significantly down-regulatedcompared to expression levels in plants without Trichodermatreatment. In the present work, when R. solani was added tothe substrate, expression of WRKY33 was significantly down-regulated in plants with Trichoderma inoculation, while PR2, PR3and PR4 were down-regulated. In the study by Mayo et al. (2015),
Frontiers in Plant Science | www.frontiersin.org 6 August 2016 | Volume 7 | Article 1109
86

fpls-07-01109 August 4, 2016 Time: 14:48 # 7
Mayo et al. qPCR Strategy to Select Genes
TABLE 2 | Common bean sequences used for primer design for RT-PCR analysis.
Gene Functional annotation NCBI Phytozome Forward/Reverse EfficiencyReference
Reference genes
Act11 Actin-11 Phvul.008G011000 TGCATACGTTGGTGATGAGG 1.084
AGCCTTGGGGTTAAGAGGAG
Ukn1 Unknown Phvul.011G023200 ATTCCCATCATGCAGCAAAG 0.937
AGATCCCTCCAGGTCAATCC
Balance between necrotrophic and biotrophic pathogen responses
WRKY33 WRKY transcription factors Phvul.008G090300 TTTCACAGGACAGGTTCCAGC 0.938
CCTTTGACAGAAATGACTGAAGGA
Pathogenesis related genes
PR1 Pathogenesis Related 1 Phvul.003G109100 TGGTCCTAACGGAGGATCAC 1.094
TGGCTTTTCCAGCTTTGAGT Mayo et al., 2015
PR2 Beta 1-3 Endoglucanase Phvul.003G109200 GTGAAGGACGCCGATAACAT 1.048
ACTGAGTTTGGGGTCGATTG Mayo et al., 2015
PR3 Chitinase class I Phvul.009G116600 TGGAGTTGGTTATGGCAACAA 1.034
ATTCTGATGGGATGGCAGTGT
PR4 Pathogenesis-related 4 Phvul.006G102300 CGCAGTGAGTGCATATTGCT 0.922
TGTTTGTCACCCTCAAGCAC Mayo et al., 2015
PR16a Germin-like protein 8 Phvul.010G129900 GGCAGTCTCATGGTTATGGTTT –
GCATGCTCAAGTCTCAACACAT
IPER Peroxidase precursor Phvul.009G215000 GGCAAGCATTATATGGTTGAAA –
GATGGCAACATCCATCACTTTA
PPO Polyphenol oxidase Phvul.008G073200 GAAGACGATGATTTGCTGGTTA –
AAGAAACATTTTCCTTTGTGAAA
Ethylene signaling pathway
ERF1 Ethylene-Responsive Transcription Factor 1 Phvul.007G127800 CGCTCTCAAGAGGAAACACTCC 0.937
TGAATCAGAAGGAGGAGGGAAT
ERF5 Ethylene-Responsive Transcription Factor 5 Phvul.002G055700 GGCTCCAAGTGGATTGAGAAC 0.932
TCAGAATCAGATAACTACAAAGCACAA
CH5b Endochitinase precursor Phvul.009G116500 CAGCCAAAGGCTTCTACACC 0.883
TTGTTTCGTGAGACGTTTGC Mayo et al., 2015
Phytoalexins biosynthesis
PAL1 Phenylalanine and histidine ammonia-lyase Phvul.001G177800 TGAGAGAGGAGTTGGGCACT 1.034
TTCCACTCTCCAAGGCATTC
Osmotin biosynthesis
OSM34 Osmotin-like protein Phvul.002G155500 GAACGGAGGGTGTCACAAAATC 0.927
CGTAGTGGGTCCACAAGTTCCT
Involved in Ca2+ signaling
CNGC2 Cyclic nucleotide-gated ion channel 2 Phvul.008G036200 ATTCAATTTGCTTGGAGACGTT 0.98
ACAGTTTTATTGAAGGCCAGGA
Antimicrobials and oxylipins (defense signaling molecules)
HPL Hydroperoxide lyase Phvul.005G116800 TCAAGGCTACATTTGTATTTCCA 0.984
TGGTGCACATTTCTTAGTAGCAA
Lox2 Lipoxygenase 2 Phvul.005G156700 ATGCAAGGCTAAAGAGATCCAA –
ATGGTGACAGGAGCTAAACACA
Lox7 Lipoxygenase 2 Phvul.005G156900 GAAGGCTTGACTTTCAGAGGAA –
AACACACGAGAAGATTCAACCA
Oxidative stress
GSTa 2.4-D inducible glutathione S-transferase Phvul.002G241400 AGGGAGTCACACTGGCTATGTT 1.013
ATGTGCCATTTGCATTTTAGTG
hGS Homoglutathione synthetase Phvul.006G094500 GTGGCTATATGGTGCGTACAAA 1.023
GAAACAAGAATGCATCTCCTCA
Amintransf2 Aminotransferase 2 Phvul.006G029100 TTCTTCCTTTTCTGCTCTTTCAA –
AGATGACAAGATGCAATGATTTTT
(–) Genes that empirically showing expression but showing negative qPCR results.
Frontiers in Plant Science | www.frontiersin.org 7 August 2016 | Volume 7 | Article 1109
Capítulo III
87

fpls-07-01109 August 4, 2016 Time: 14:48 # 8
Mayo et al. qPCR Strategy to Select Genes
FIGURE 3 | Evaluation of the diameter of the hypocotyl (above left), length of root system (above right) dry weight of the aerial part (below left) androot system (below right) of bean plants grown during 45 days after sowing. [Trichoderma velutinum T028 without pathogen (CT028), T. velutinum T028 withRhizoctonia solani (RT028), R. solani control (RC) and control without fungus (CC)]. Differences statistically significant respect to control plants (p < 0.05) areindicated with different letters.
the expression of PR1, PR2, PR3, and PR4 was down-regulatedwhen beans were inoculated with R. solani.
WRKY33 is also involved in the regulation of the expressionof genes modulated by components of the ethylene signalingpathway. In this work, expression of the ERF1 and ERF5 reachedsimilar significant values either with or without Trichoderma andor R. solani in the substrate. This result contrasts with previousreports showing that ERF5 was up-regulated and WRKY33was down-regulated in Arabidopsis infected with Alternariabrassicicola (Son et al., 2012). WRKY33 would act as a represorof ERF1 and ERF5 expression. Thus, when the expression ofWRKY33 is increased, expression of ERF1 and ERF5 is down-regulated.
CH5b encodes an endochitinase precursor and it is also relatedwith the ethylene signaling pathway. In previous works, it hasbeen shown that, when this gene was over-expressed the R. solanisymptoms were reduced in crops like Nicotiana tabacum andBrassica napus (Broglie et al., 1991). However, in this study, whenbean plants were in contact with R. solani, the expression of thisgene was down-regulated but not significantly, while treatment ofthese infected plants with T. velutinum resulted in its significantup-regulation. These results are in agreement with previous data,
showing that the pathogen represses its expression, and thepresence of Trichoderma induced it (Mayo et al., 2015).
PAL plays an important role in plant defense; it is involved inthe biosynthesis of salicylic acid, which is related to plant systemicresistance (Nugroho et al., 2002; Chaman et al., 2003). PAL geneexpression is also regulated in response to pathogen infection. Inthis work, the presence of T. velutinum and R. solani in the soilresulted in a significant down-regulation of this gene comparedwith control plants.
Osmotins have plant protective effects against pathogeninfection (Narasimhan et al., 2009). In this study, whenT. velutinum or R. solani were present in the soil, the expressionof OSM34 was not significantly up-regulated respect to controlplants, but when both fungi were in the soil at the same time,OSM34 was slightly but significantly down-regulated.
The CNGC genes can be related to early plant defenseresponses due to changes in ion flux, including H+ and Ca2+
influx and K+ and Cl− efflux (Atkinson et al., 1996). The up-regulation of CNGC2 can confirm the importance of ion channelsfor the plant resistance response (Borges et al., 2012). In thiswork, this gene was up-regulated when R. solani was present inthe soil not significant. Conversely, CNGC2 was down-regulated
Frontiers in Plant Science | www.frontiersin.org 8 August 2016 | Volume 7 | Article 1109
88

fpls-07-01109 August 4, 2016 Time: 14:48 # 9
Mayo et al. qPCR Strategy to Select Genes
FIGURE 4 | Analysis of relative expression levels of the bean defense genes selected in the present work in bean plants infected with R. solani versustheir levels of expression in control plants. The data were analyzed by the 2−11Ct method. The differences statistically significant respect to control plants(p < 0.05) are indicated with an asterisk.
FIGURE 5 | Analysis of relative expression levels of the bean defense genes selected in the present work in bean plants treated with T. velutinumversus their levels of expression in control plants. The data were analyzed as indicated in the legend to the Figure 4.
FIGURE 6 | Analysis of relative expression levels of the bean defense genes selected in the present work in bean plants infected with R. solani andtreated with T. velutinum versus their levels of expression in control plants. The data were analyzed as indicated in the legend to the Figure 4.
Frontiers in Plant Science | www.frontiersin.org 9 August 2016 | Volume 7 | Article 1109
Capítulo III
89

fpls-07-01109 August 4, 2016 Time: 14:48 # 10
Mayo et al. qPCR Strategy to Select Genes
in plants treated with T. velutinum. Then, the pathogen wouldinduce an activation of hypersensitive defense mechanisms.
Hydroperoxide lyase (HPL) is involved in the productionof antimicrobial and defense signaling oxylipins (Noordermeeret al., 2001; Huang et al., 2010). In this study, the presence ofT. velutinum and R. solani, resulted in a down-regulation of thisgene expression respect to control plants. In previous works,when tomato plants were in contact with Botrytis cinerea, HPLexpression increased 24 h after gray mold infection, but afterthat time the expression of this gene decreased gradually (Wanet al., 2013). In the present case, after 45 days in contact withthe fungus T. velutinum and/or R. solani, its expression wasdown-regulated, indicating that the plant identifies Trichodermaand Rhizoctonia as two invader organisms, and some of themechanisms activated against the presence of both are similar,independently of the final response specifically activated in theplant by each one.
GSTa (2,4-D inducible glutathione S-transferase) expressionalso responds to pathogen attack (Mauch and Dudler, 1993)and can be induced by molecules such as salicylic acid, methyljasmonate, abscisic acid and H2O2 (Dixon et al., 2002; Moons,2005). In Gossypium arboretum, GST provides resistance tofungal pathogens and oxidative stress (Barthelson et al., 2010).GST expression was up-regulated during fungal infection inbarley, Arabidopsis, and cotton (Dowd et al., 2004; Durrant andDong, 2004; Lu et al., 2005). However, in banana GST wasdown-regulated following Fusarium oxysporum f specialis (f. sp.)cubense infection (Wang et al., 2013), which is in agreementwith the present case, where the expression of GSTa was down-regulated when T. velutinum and/or R. solani were present in thesoil.
hGS encodes a homoglutathione synthetase that is involvedin response to oxidative stress. There is not much informationabout the behavior of this gene in the plant. In the presentstudy, when bean plants were in contact with T. velutinumand/or R. solani, expression of this gene was significantlyup-regulated compared to control plants. In other studies,treatment of Medicago truncatula plants with compounds thatrelease nitric oxide, a key signaling molecule in plants, inducedexpression of GST but not hGS in roots (Innocenti et al., 2007).Similarly, common bean plants treated with H2O2 showed up-regulation of hGS in nodules, whereas treatments with cadmium,sodium chloride, or jasmonic acid had no effect (Loscos et al.,2008).
CONCLUSION
From 48 genes initially analyzed, 14 bean genes were selectedin the present work and only WRKY33, CH5b and hGS showed
an up-regulatory response in the presence of T. velutinum, theother genes were or not affected (OSM34) or down-regulatedby the presence of this fungus. R. solani infection resulted ina down-regulation of most of the genes analyzed, except PR1,OSM34 and CNGC2 that were not affected, and the presence ofboth, T. velutinum and R. solani, up-regulates hGS and down-regulates all the other genes analyzed, except CH5b which wasnot significantly affected.
As conclusion, the strategy described in the present work hasbeen shown to be effective to detect genes involved in plantdefense, which respond to the presence of a BCA or to a pathogenand also to the presence of both. The selected genes showedsignificant homology with described plant defense genes and theyare expressed in bean leaves of plants treated with T. velutinumand/or infected with R. solani. The proposed strategy will be veryuseful in studies about the interaction of bean with pathogens andbiocontrol fungi.
AUTHOR CONTRIBUTIONS
PC and SG conceived the research. SM, OG-L, andAR-G designed the research. SM, OG-L, and AR-Gconducted the experiments. SM, PC, and SG analyzeddata. SM, PC, SG, EC, and FS interpreted the data. SM,PC, SG, EC, and FS wrote the manuscript. All authorswere agreed to be accountable for all aspects of thework in ensuring that questions related to the accuracyor integrity of any part of the work are appropriatelyinvestigated and resolved. All authors critically revised themanuscript. All authors approved the final version to bepublished.
ACKNOWLEDGMENTS
The grant awarded to Sara Mayo Prieto (FPU12/00677) by theMinistry of Education, Culture and Sport (Spain) according theResolution of April 25, 2012 (BOE of 10 May), as amended byResolution of May 18, 2012 (BOE of 22 May), and by Resolutionof October 31, 2012 (BOE of 12 November) and granted in theResolution of December 20, 2012. Ministry of Economy andCompetitiveness for National project “Farnesol as self-regulatorymolecule in Trichoderma. Tyrosol and farnesol signaling inTrichoderma-bean interaction” (AGL2012-40041-C02-02). Juntade Castilla y León, Consejería de Educación for the project “Effectof terpenes and physiologically related compounds produced byTrichoderma parareesei in the development of common bean(Phaseolus vulgaris L.) and in defensive responses of this plant”(LE228U14).
REFERENCESAtkinson, M. M., Midland, S. L., Sims, J. J., and Keen, N. T. (1996). Syringolide
1 triggers Ca2 influx, K efflux, and extracellular alkalization in soybean cellscarrying the disease-resistance gene Rpg4. Plant Physiol. 112, 297–302. doi:10.1104/pp.112.1.297
Bakshi, M., and Oelmüller, R. (2014). WRKY transcription factors. Plant Signal.Behav. 9:e27700. doi: 10.4161/psb.27700
Barthelson, R. A., Qaisar, U., and Galbraith, D. W. (2010).Functional analysis of the Gossypium arboreum genome.Plant Mol. Biol. Rep. 28, 334–343. doi: 10.1007/s11105-009-0157-5
Frontiers in Plant Science | www.frontiersin.org 10 August 2016 | Volume 7 | Article 1109
90

fpls-07-01109 August 4, 2016 Time: 14:48 # 11
Mayo et al. qPCR Strategy to Select Genes
Birkenbihl, R. P., Diezel, C., and Somssich, I. E. (2012). Arabidopsis WRKY33is a key transcriptional regulator of hormonal and metabolic responsestoward Botrytis cinerea infection. Plant Physiol. 159, 266–285. doi:10.1104/pp.111.192641
Borges, A., Melotto, M., Tsai, S. M., and Caldas, D. G. G. (2012). Changes inspatial and temporal gene expression during incompatible interaction betweencommon bean and Anthracnose pathogen. J. Plant Physiol. 169, 1216–1220. doi:10.1016/j.jplph.2012.04.003
Broglie, K., Chet, I., Holliday, M., Cressman, R., Biddle, P., Knowlton, S., et al.(1991). Transgenic plants with enhanced resistance to the fungal pathogenRhizoctonia solani. Science 254, 1194–1197. doi: 10.1126/science.254.5035.1194
Chaman, M. E., Copaja, S. V., and Argandoña, V. H. (2003). Relationshipsbetween salicylic acid content, Phenylalanine Ammonia-Lyase (PAL) activity,and resistance of barley to aphid infestation. J. Agric. Food Chem. 51, 2227–2231.doi: 10.1021/jf020953b
Chen, W., Provart, N. J., Glazebrook, J., Katagiri, F., Chang, H. S., Eulgem, T.,et al. (2002). Expression profile matrix of Arabidopsis transcription factor genessuggests their putative functions in response to environmental stresses. PlantCell 14, 559–574. doi: 10.1105/tpc.010410
Dixon, D. P., Lapthorn, A., and Edwards, R. (2002). Plant glutathione transferases.Genome Biol. 3, 3004.1–3004.10. doi: 10.1186/gb-2002-3-3-reviews3004
Dowd, C., Wilson, I. W., and McFadden, H. (2004). Gene expression profilechanges in cotton root and hypocotyl tissues in response to infection withFusarium oxysporum f. sp. vasinfectum. Mol. Plant-Microbe Interact. 17, 654–667. doi: 10.1094/MPMI.2004.17.6.654
Druzhinina, I. S., Seidl-Seiboth, V., Herrera-Estrella, A., Horwitz, B. A., Kenerley,C. M., Monte, E., et al. (2011). Trichoderma: the genomics of opportunisticsuccess. Nat. Rev. Microbiol. 9, 749–759. doi: 10.1038/nrmicro2637
Durrant, W. E., and Dong, X. (2004). Systemic acquired resistance. Annu. Rev.Phytopathol. 42, 185–209. doi: 10.1146/annurev.phyto.42.040803.140421
Gallou, A., Cranenbrouck, S., and Declerck, S. (2009). Trichoderma harzianumelicits defence response genes in roots of potato plantlets challenged byRhizoctonia solani. Eur. J. Plant Pathol. 124, 219–230. doi: 10.1007/s10658-008-9407-x
Guerrero-González, M. L., Rodríguez-Kessler, M., Rodríguez-Guerra, R.,González-Chavira, M., Simpson, J., Sanchez, F., et al. (2011).Differential expression of Phaseolus vulgaris genes induced during theinteraction with Rhizoctonia solani. Plant Cell Rep. 30, 1465–1473. doi:10.1007/s00299-011-1055-5
Hermosa, R., Viterbo, A., Chet, I., and Monte, E. (2012). Plant-beneficialeffects of Trichoderma and of its genes. Microbiology 158, 17–25. doi:10.1099/mic.0.052274-0
Huang, F. C., Studart Witkowski, C., and Schwab, W. (2010). Overexpression ofhydroperoxide lyase gene in Nicotiana benthamiana using a viral vector system.Plant Biotechnol. J. 8, 783–795. doi: 10.1111/j.1467-7652.2010.00508.x
Innocenti, G., Pucciariello, C., Le Gleuher, M., Hopkins, J., de Stefano, M.,Delledonne, M., et al. (2007). Glutathione synthesis is regulated by nitric oxidein Medicago truncatula roots. Planta 225, 1597–1602. doi: 10.1007/s00425-006-0461-3
Kim, D. S., and Hwang, B. K. (2014). An important role of the pepper phenylalanineammonia-lyase gene (PAL1) in salicylic acid-dependent signalling of thedefence response to microbial pathogens. J. Exp. Bot. 65, 2295–2306. doi:10.1093/jxb/eru109
Kim, K. C., Fan, B., and Chen, Z. (2006). Pathogen-induced Arabidopsis WRKY7is a transcriptional repressor and enhances plant susceptibility to Pseudomonassyringae. Plant Physiol. 142, 1180–1192. doi: 10.1104/pp.106.082487
Lehtonen, M. J., Somervuo, P., and Valkonen, J. P. T. (2008). Infectionwith Rhizoctonia solani induces defense genes and systemic resistance inpotato sprouts grown without light. Phytopathology 98, 1190–1198. doi:10.1094/PHYTO-98-11-1190
Lippok, B., Birkenbihl, R. P., Rivory, G., Brümmer, J., Schmelzer, E., Logemann, E.,et al. (2007). Expression of AtWRKY33 encoding a pathogen-or PAMP-responsive WRKY transcription factor is regulated by a composite DNA motifcontaining W box elements. Mol. Plant-Microbe Interact. 20, 420–429. doi:10.1094/MPMI-20-4-0420
Lodha, T. D., and Basak, J. (2012). Plant-pathogen interactions: what microarraytells about it? Mol. Biotechnol. 50, 87–97. doi: 10.1007/s12033-011-9418-2
Lorenzo, O., Piqueras, R., Sánchez-Serrano, J. J., and Solano, R. (2003). Ethyleneresponse factor 1 integrates signals from ethylene and jasmonate pathways inplant defense. Plant Cell 15, 165–178. doi: 10.1105/tpc.007468
Loscos, J., Matamoros, M. A., and Becana, M. (2008). Ascorbate andhomoglutathione metabolism in common bean nodules under stressconditions and during natural senescence. Plant Physiol. 146, 1282–1292.doi: 10.1104/pp.107.114066
Lu, Z.-X., Gaudet, D. A., Frick, M., Puchalski, B., Genswein, B., and Laroche, A.(2005). Identification and characterization of genes differentially expressed inthe resistance reaction in wheat infected with Tilletia tritici, the common buntpathogen. BMB Rep. 38, 420–431. doi: 10.5483/BMBRep.2005.38.4.420
Mauch, F., and Dudler, R. (1993). Differential induction of distinct glutathione-S-transferases of wheat by xenobiotics and by pathogen attack. Plant Physiol. 102,1193–1201. doi: 10.1104/pp.102.4.1193
Mayo, S., Gutiérrez, S., Malmierca, M. G., Lorenzana, A., Campelo, M. P.,Hermosa, R., et al. (2015). Influence of Rhizoctonia solani and Trichodermaspp. in growth of bean (Phaseolus vulgaris L.) and in the induction ofplant defense-related genes. Front. Plant Sci. 6:685. doi: 10.3389/fpls.2015.00685
Moffat, C. S., Ingle, R. A., Wathugala, D. L., Saunders, N. J., Knight, H., and Knight,M. R. (2012). ERF5 and ERF6 play redundant roles as positive regulatorsof JA/Et-mediated defense against Botrytis cinerea in Arabidopsis. PLoS ONE7:e35995. doi: 10.1371/journal.pone.0035995
Moons, A. (2005). Regulatory and functional interactions of plant growthregulators and plant glutathione S-transferases (GSTs). Vitam. Horm. 72, 155–202. doi: 10.1016/S0083-6729(05)72005-7
Narasimhan, M. L., Bressan, R. A., D’Urzo, M. P., Jenks, M. A., and Mengiste, T.(2009). Unexpected turns and twists in structure/function of PR-proteins thatconnect energy metabolism and immunity. Adv. Bot. Res. 51, 439–489. doi:10.1016/S0065-2296(09)51011-7
Noordermeer, M. A., Veldink, G. A., and Vliegenthart, J. F. G. (2001). Fatty acidhydroperoxide lyase: a plant cytochrome P450 enzyme involved in woundhealing and pest resistance. Chembiochem 2, 494–504. doi: 10.1002/1439-7633(20010803)2:7/8<494::AID-CBIC494>3.0.CO;2-1
Nugroho, L. H., Verberne, M. C., and Verpoorte, R. (2002). Activities ofenzymes involved in the phenylpropanoid pathway in constitutively salicylicacid-producing tobacco plants. Plant Physiol. Biochem. 40, 755–760. doi:10.1016/S0981-9428(02)01437-7
Pandey, S. P., and Somssich, I. E. (2009). The role of WRKY transcription factorsin plant immunity. Plant Physiol. 150, 1648–1655. doi: 10.1104/pp.109.138990
Pereira, J. L., Queiroz, R. M. L., Charneau, S. O., Felix, C. R., Ricart, C. A. O.,Lopes Da Silva, F., et al. (2014). Analysis of Phaseolus vulgaris response to itsassociation with Trichoderma harzianum (ALL-42) in the presence or absenceof the phytopathogenic fungi Rhizoctonia solani and Fusarium solani. PLoSONE 9:e98234. doi: 10.1371/journal.pone.0098234
Pfaffl, M. W. (2001). A new mathematical model for relative quantification inreal-time RT-PCR. Nucleic Acids Res. 29, e45–e45. doi: 10.1093/nar/29.9.e45
Reid, K. E., Olsson, N., Schlosser, J., Peng, F., and Lund, S. T. (2006). An optimizedgrapevine RNA isolation procedure and statistical determination of referencegenes for real-time RT-PCR during berry development. BMC Plant Biol. 6:27.doi: 10.1186/1471-2229-6-27
Rushton, P. J., and Somssich, I. E. (1998). Transcriptional control of plant genesresponsive to pathogens. Curr. Opin. Plant Biol. 1, 311–315. doi: 10.1016/1369-5266(88)80052-9
Rutledge, R. G., and Stewart, D. (2008). Critical evaluation of methods used todetermine amplification efficiency refutes the exponential character of real-timePCR. BMCMol. Biol. 9:96. doi: 10.1186/1471-2199-9-96
Sharma, S., Lin, W., Villamor, J. G., and Verslues, P. E. (2013). Divergent lowwater potential response in Arabidopsis thaliana accessions Landsberg erectaand Shahdara. Plant. Cell Environ. 36, 994–1008. doi: 10.1111/pce.12032
Shoresh, M., Harman, G. E., and Mastouri, F. (2010). Induced systemic resistanceand plant responses to fungal biocontrol agents. Annu. Rev. Phytopathol. 48,21–43. doi: 10.1146/annurev-phyto-073009-114450
Singh, K. B., Foley, R. C., and Oñate-Sánchez, L. (2002). Transcription factorsin plant defense and stress responses. Curr. Opin. Plant Biol. 5, 430–436. doi:10.1016/S1369-5266(02)00289-3
Son, G. H., Wan, J., Kim, H. J., Nguyen, X. C., Chung, W. S., Hong, J. C.,et al. (2012). Ethylene-responsive element-binding factor 5, ERF5, is involved
Frontiers in Plant Science | www.frontiersin.org 11 August 2016 | Volume 7 | Article 1109
Capítulo III
91

fpls-07-01109 August 4, 2016 Time: 14:48 # 12
Mayo et al. qPCR Strategy to Select Genes
in chitin-induced innate immunity response. Mol. Plant-Microbe Interact. 25,48–60. doi: 10.1094/MPMI-06-11-0165
Upchurch, R. G., and Ramirez, M. E. (2010). Defense-related gene expression insoybean leaves and seeds inoculated with Cercospora kikuchii and Diaporthephaseolorum var. meridionalis. Physiol. Mol. Plant Pathol. 75, 64–70. doi:10.1016/j.pmpp.2010.08.007
Valenciano, J. B., Casquero, P. A., Boto, J. A., and Marcelo, V. (2006). Evaluationof the occurrence of root rots on bean plants (Phaseolus vulgaris) usingdifferent sowing methods and with different techniques of pesticide application.New Zeal. J. Crop Hortic. Sci. 34, 291–298. doi: 10.1080/01140671.2006.9514419
Vellicce, G. R., Ricci, J. C. D., Hernández, L., and Castagnaro, A. P. (2006).Enhanced resistance to Botrytis cinerea mediated by the transgenic expressionof the chitinase gene CH5b in strawberry. Transgenic Res. 15, 57–68. doi:10.1007/s11248-005-2543-6
Verhagen, B. W. M., Van Loon, L. C., and Pieterse, C. M. J. (2006). “Induceddisease resistance signaling in plants,” in Floriculture, Ornamental and PlantBiotechnology, ed. J. A. Teixeira da Silva (Utrecht: Global Science Books),334–343.
Wan, X.-H., Chen, S.-X., Wang, C.-Y., Zhang, R.-R., Cheng, S.-Q., Meng,H.-W., et al. (2013). Isolation, expression, and characterization of a
hydroperoxide lyase gene from cucumber. Int. J. Mol. Sci. 14, 22082–22101. doi:10.3390/ijms141122082
Wang, Z., Huang, S., Jia, C., Liu, J., Zhang, J., Xu, B., et al. (2013). Molecular cloningand expression of five glutathione S-transferase (GST) genes from Banana(Musa acuminata L. AAA group, cv. cavendish). Plant Cell Rep. 32, 1373–1380.doi: 10.1007/s00299-013-1449-7
Conflict of Interest Statement: The authors declare that the research wasconducted in the absence of any commercial or financial relationships that couldbe construed as a potential conflict of interest.
The reviewer EVG declared a past co-authorship with one of the authors SG tothe handling Editor, who ensured that the process met the standards of a fair andobjective review.
Copyright © 2016 Mayo, Cominelli, Sparvoli, González-López, Rodríguez-González,Gutiérrez and Casquero. This is an open-access article distributed under the termsof the Creative Commons Attribution License (CC BY). The use, distribution orreproduction in other forums is permitted, provided the original author(s) or licensorare credited and that the original publication in this journal is cited, in accordancewith accepted academic practice. No use, distribution or reproduction is permittedwhich does not comply with these terms.
Frontiers in Plant Science | www.frontiersin.org 12 August 2016 | Volume 7 | Article 1109
92

capítulo IV
Metabolomic response of bean plants (Phaseolus vulgaris L.) to the presence of Trichoderma velutinum and Rhizoctonia
solani


Índice capítulo Iv
1. INTRODUCTION............................................................................................... 98
2. MATERIAL AND METHODS ......................................................................... 99
2.1. Fungal isolates and culture conditions................................................................................. 99
2.2. Plant materials and growth conditions................................................................................. 99
2.3. Preparation of bean leaf extracts. ...................................................................................... 100
2.4. HPLC-DAD-TOF-MS conditions ..................................................................................... 100
3. RESULTS ............................................................................................................ 101
3.1. Selection of Trichoderma strain. ....................................................................................... 101
3.2. Characterization of compounds in bean leaf extracts. ....................................................... 102
a) Amino acids and peptides ............................................................................................. 105
b) Carbohydrates and glycosides ...................................................................................... 105
c) Fatty acids and lipids .................................................................................................... 107
d) Polyphenols .................................................................................................................. 107
e) Terpenes ....................................................................................................................... 108
3.3. Comparison of metabolites whose production in induced in response to presence or absence of Trichoderma and/or R. solani. ............................................................................................. 110
3.4. Principal component analysis (PCA) of the compounds contents. .................................... 111
4. DISCUSSION .................................................................................................... 112
5. CONCLUSIONS ............................................................................................... 114
6. ACKNOWLEDGMENTS. ............................................................................... 115
7. REFERENCE LIST ............................................................................................ 115

TABLAS
Table 1: Phytochemical compounds detected in leaves bean by negative ionization mode, including retention time, m/z, molecular formula, together with their proposed identities and the references. ..................................................................................................................................................... 102
Table 2: Compounds detected that were produced at significantly among different levels respect to the control plants when there were present or absence Trichoderma and/or R. solani. ............... 108
FIGURAS
Figure 1: Scheme of the treatments used in this work: RT028, Coated seeds with T. velutinum (T028) against R. solani (R43); CT028, Coated seeds with T. velutinum without pathogen; CR, control with R. solani; and CC, control without fungi. ................................................................ 100
Figure 2: Base peak chromatogram of control plants (CC), obtained by HPLC-DAD-TOF-MS. See Table 1 for identification number. ............................................................................................... 106
Figure 3: Venn´s diagram with the compounds with an Up-production and Down-production. See Table 2 for identification compounds. ......................................................................................... 111
Figure 4: Principal components analysis of 36 compounds extracted by bean leaves subjected to different treatments. (Blue) control beans without pathogen and biocontrol agent (CC); (Red) beans that were infected with R. solani (CR); (Yellow) beans inoculated with T. velutinum (CT028); (Green) beans inoculated with R. solani and T. velutinum (RT028). ........................................... 112

97
"Metabolomic response of bean plants
(Phaseolus vulgaris L.) to the presence of
Trichoderma velutinum and
Rhizoctonia solani"
S. Mayo1; R. Marra2,3; F. Vinale3; A. Rodríguez-González1; O. González-López1; S. L. Woo2,3; M.Lorito2,3; S. Gutiérrez4; P. A. Casquero1*
1. Research Group of Engineering and Sustainable Agriculture, Natural Resources Institute,University of León, Av. Portugal 41, 24071 León, Spain.
2. Dipartimento di Agraria, Università degli Studi di Napoli Federico II, Via Università 100, 80055,Portici, Italy
3. Istituto per la Protezione Sostenibile delle Piante, Consiglio Nazionale delle Ricerche, viaUniversità 133, 80055 Portici, Italy
4. Research Group of Engineering and Sustainable Agriculture, Area of Microbiology, UniversitySchool of Agricultural Engineers, University of León, Ponferrada Campus, Av. Astorga s/n, 24401Ponferrada, Spain.
ABSTRACT: The common bean (Phaseolus vulgaris L.) is a legume crop worldwide that is affected by diversity fungal pathogen, as Rhizoctonia solani. Biocontrol represents an alternative against phytopathogenic agents, and fungi as Trichoderma are effectively used to control fungal diseases and to promote plant growth. After the invasion of a pathogen or a biocontrol agent, the plant activates disease resistance responses, by inducing the expression of defence genes and by producing some bioactive secondary metabolites such as phytoalexins and some substances that could regulate defence reactions. The purpose of this article was to study the metabolomic response of the bean plants in the presence of Trichoderma velutinum and/or R. solani, including the characterization of the phytochemical compounds. Hydromethanol extracts from bean leaves were analysed by HPLC-DAD-TOF-MS and compared with information from the literature. In this work, metabolomics analysis of bean samples revealed an increased in the production of 36 compounds (amino acids, flavonoids, phenols, terpenes, etc), which are specific of the Fabaceae family that were differentially accumulated in leaves inoculated with biocontrol or pathogen fungi compared to controls. As conclusion, the presence of T. velutinum and/or R. solani modified the production of bean metabolites.
KEY WORDS: Defence responses, phytoalexins, biocontrol agent, phytopathogen, HPLC.

Capítulo IV
98
1. INTRODUCTION
The common bean (Phaseolus vulgaris L.) is one of the most important food legume crops worldwide. Bean production can be affected by biotic and abiotic stresses, such as pathogen attack, drought, cold, etc., and plants activate a plethora of mechanisms to respond to them (Guerrero-González et al., 2011).
Rhizoctonia solani JG Kühn [Teleomorph: Thanatephorus cucumeris (AB Frank) Donk] is a necrotrophic plant pathogen causing root and hypocotyl diseases. Rhizoctonia root rot of bean is a common disease throughout the world and is one of the most devastating root and hypocotyl diseases of bean in large and small plantings (Hagedorn, 1991).
Biological control represents an alternative against phytopathogenic agents, and fungi of the genus Trichoderma (Teleomorph: Hypocrea) are effectively used worldwide to both, control fungal diseases and promote plant growth. Trichoderma spp. represent a fundamental part of the soil microbiota, the rhizosphere microbiome, which helps plant to overcome numerous environmental constraints by stimulating plant defense responses and improving fitness and development (Hermosa et al., 2013). These abilities have supported the application of Trichoderma strains as biocontrol agents (BCA) or plant biofertilizer in agriculture and forestry.
When a plant is induced by exposure to a microorganism, the production of several metabolites is started, and the physiological changes and activation of various plant metabolic pathways depends on the type of these signalling natural metabolites. It is assumed that the plant recognition of Trichoderma triggers the activation of a cascade signal, including the secretion of antimicrobial reactive oxygen species, production of a plethora of secondary metabolites such as phytoalexins and pathogenesis-related proteins and callose depositions (Shoresh et al., 2010).
Plants respond after the invasion of a pathogen or a biocontrol agent that activates disease resistance response to the invasion, by inducing the expression of defence genes (Mayo et al., 2016), and by the production of bioactive secondary metabolites such as phytoalexins (phenols, isoflavones, terpenes), and some substances that can block the invasion and spread of the pathogen, such as lignin and callose (Chen et al., 2015). Biosynthesis of phytoalexins by plants from the Fabaceae family is of interest because they are produced in higher or lower amounts depending if the plant is interacting with a pathogen or with a biocontrol agent. It is also known that some plants do not produce phytoalexins when they are in contact with pathogens, but release toxins that are normally stored in the plant as less toxic glycosides. If the plant cell is broken when penetrated by fungal hyphae, the glycoside comes into contact with hydrolysing enzymes present in other cell compartments, releasing the toxic aglycone. Although this compound is released after fungal attack, it is not present in the intact plant and is newly produced when compromised by a fungal invader, it is not a true phytoalexin, because the glycosidases were already present in the plant and were not formed de novo (Grayer and Kokubun, 2001).
Polyphenols are one type of phytoalexins that are widely distributed in plants and can be classified into three groups: i) simple phenols, ii) phenolic acids (hydroxycinnamic- and benzoic-acid derivatives), and iii) flavonoids (e.g. flavones, flavanones, flavanonols, flavanols, isoflavons and lignans) (Abu-Reidah et al., 2013). Flavonoids and their derivatives comprise a large group of secondary metabolites whose production is specifically induced by symbionts and pathogens (Hassan and Mathesius, 2012). One of their roles inside the root could be to regulate defence reactions, and it has been proposed that mycorrhiza invasion triggers a temporary defence response in the root that involves induction of phytoalexins production (Harrison and Dixon, 1994).

Material and Methods
99
Isoflavonoids are a subclass of flavonoids, which are thought to represent the majority of the phytoalexins produced by legume plants (Hassan and Mathesius, 2012).
Other phytoalexins, of terpene nature, are toxins that act as feeding repellents against many plant feeding insects and mammals. Then, playing important defensive roles in the plant (Taiz et al., 2015). This sort of compounds have been found in legumes, such as triterpenes and saponins, whose activity as antimicrobial defence compounds has been previously reported (Wink, 2003).
In this work, and based in the huge variety of compounds produced by plants in response to the interaction with pathogens and/or biocontrol agents, we have evaluated the pattern of production of polyphenols and others metabolites in bean plants in interaction with Trichoderma velutinum and/or R. solani.
2. MATERIAL AND METHODS
2.1. Fungal isolates and culture conditions
The present study was carried out using the isolate of Trichoderma velutinum T028, previously collected from the production area of the Protected Geographical Indication (PGI), called "Alubia La Bañeza - León" (EC Reg. n.256/2010 published on 26 March 2010, OJEU L880/17).
Rhizoctonia solani isolate R43 is a high virulence strain that was isolated from plants of the same PGI. This strain was stored in the collection “Pathogens and Antagonists of the Laboratory Diagnosis of Pests and Diseases” (PALDPD) at the University of León, Spain.
The fungal isolates were grown on potato-dextrose-agar (PDA, Sigma-Aldrich) plates in the dark at 25 °C for one week. Trichoderma cultures were then exposed to light for 3-4 days in order to induce the spore formation. Spores were maintained at -80ºC in 50% glycerol suspensions.
2.2. Plant materials and growth conditions
Bean (P. vulgaris L. cv. Canela) seeds were germinated and cultured in four conditions: inoculated with T. velutinum (T028) and with R. solani (R43) present in the substrate [RT028]; inoculated with T028 without the pathogen (CT028); seeds not inoculated with T. velutinum by with R. solani (CR) in the substrate; and control without fungi (CC) (Figure 1)
Cultures were carried out in climatic chamber and grown under the conditions previously described (Mayo et al., 2015). Thirty pots were used per treatment with two seeds per pot. Each pot was watered with 250 ml of water prior inoculation. R. solani R43 was inoculated by surface irrigation with 50 ml per pot of a suspension of triturated micromicete culture of this pathogen using five Petri dishes (18 ml of PDA per dish) per litre of water. For control inoculation, only PDA medium was used without any pathogen. Pots were kept in a growth chamber for 8 days at 25 °C (16h) and 16 °C (8h), 60% relative humidity in the dark. Spores suspension of T. velutinum (T028) was prepared at a final concentration of 2 × 10⁷ spores/ml. Bean seeds were surface sterilized (sodium hypochlorite 1% for 3 minutes and distilled water for 6 minutes). Then, they were coated with the spore suspension. Coated seeds were sown after 8 days of the inoculation of R. solani R43 (Figure 1). The culture was maintained for 45 days with a photoperiod of 16 hours light, 25 °C/16 °C
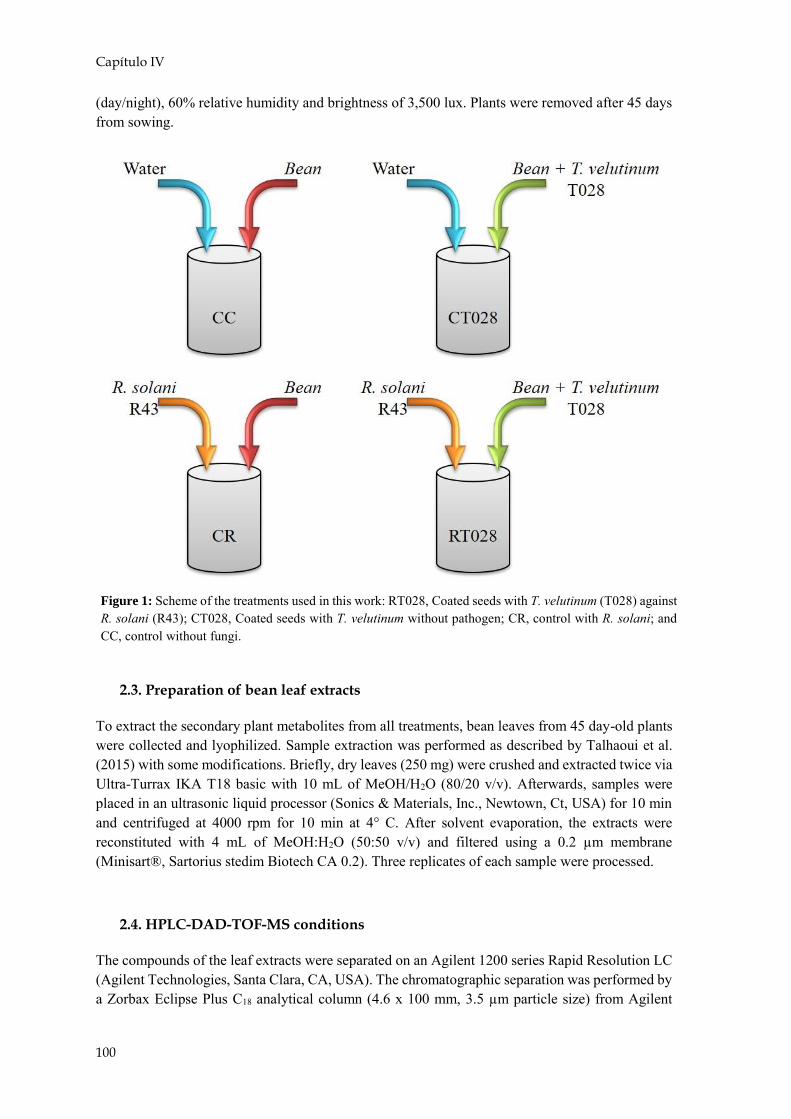
Capítulo IV
100
(day/night), 60% relative humidity and brightness of 3,500 lux. Plants were removed after 45 days from sowing.
2.3. Preparation of bean leaf extracts
To extract the secondary plant metabolites from all treatments, bean leaves from 45 day-old plants were collected and lyophilized. Sample extraction was performed as described by Talhaoui et al. (2015) with some modifications. Briefly, dry leaves (250 mg) were crushed and extracted twice via Ultra-Turrax IKA T18 basic with 10 mL of MeOH/H2O (80/20 v/v). Afterwards, samples were placed in an ultrasonic liquid processor (Sonics & Materials, Inc., Newtown, Ct, USA) for 10 min and centrifuged at 4000 rpm for 10 min at 4° C. After solvent evaporation, the extracts were reconstituted with 4 mL of MeOH:H2O (50:50 v/v) and filtered using a 0.2 µm membrane (Minisart®, Sartorius stedim Biotech CA 0.2). Three replicates of each sample were processed.
2.4. HPLC-DAD-TOF-MS conditions
The compounds of the leaf extracts were separated on an Agilent 1200 series Rapid Resolution LC (Agilent Technologies, Santa Clara, CA, USA). The chromatographic separation was performed by a Zorbax Eclipse Plus C18 analytical column (4.6 x 100 mm, 3.5 µm particle size) from Agilent
Figure 1: Scheme of the treatments used in this work: RT028, Coated seeds with T. velutinum (T028) against R. solani (R43); CT028, Coated seeds with T. velutinum without pathogen; CR, control with R. solani; andCC, control without fungi.
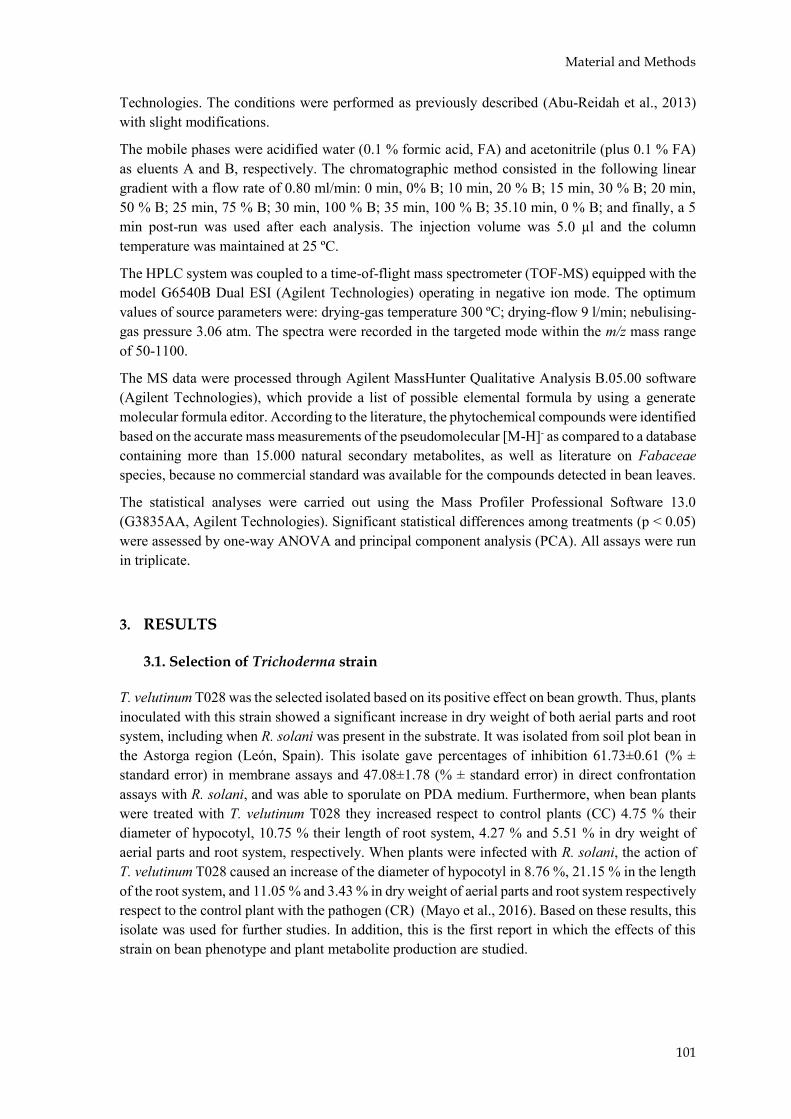
Material and Methods
101
Technologies. The conditions were performed as previously described (Abu-Reidah et al., 2013) with slight modifications.
The mobile phases were acidified water (0.1 % formic acid, FA) and acetonitrile (plus 0.1 % FA) as eluents A and B, respectively. The chromatographic method consisted in the following linear gradient with a flow rate of 0.80 ml/min: 0 min, 0% B; 10 min, 20 % B; 15 min, 30 % B; 20 min, 50 % B; 25 min, 75 % B; 30 min, 100 % B; 35 min, 100 % B; 35.10 min, 0 % B; and finally, a 5 min post-run was used after each analysis. The injection volume was 5.0 µl and the column temperature was maintained at 25 ºC.
The HPLC system was coupled to a time-of-flight mass spectrometer (TOF-MS) equipped with the model G6540B Dual ESI (Agilent Technologies) operating in negative ion mode. The optimum values of source parameters were: drying-gas temperature 300 ºC; drying-flow 9 l/min; nebulising-gas pressure 3.06 atm. The spectra were recorded in the targeted mode within the m/z mass range of 50-1100.
The MS data were processed through Agilent MassHunter Qualitative Analysis B.05.00 software (Agilent Technologies), which provide a list of possible elemental formula by using a generate molecular formula editor. According to the literature, the phytochemical compounds were identified based on the accurate mass measurements of the pseudomolecular [M-H]- as compared to a database containing more than 15.000 natural secondary metabolites, as well as literature on Fabaceae species, because no commercial standard was available for the compounds detected in bean leaves.
The statistical analyses were carried out using the Mass Profiler Professional Software 13.0 (G3835AA, Agilent Technologies). Significant statistical differences among treatments (p < 0.05) were assessed by one-way ANOVA and principal component analysis (PCA). All assays were run in triplicate.
3. RESULTS
3.1. Selection of Trichoderma strain
T. velutinum T028 was the selected isolated based on its positive effect on bean growth. Thus, plantsinoculated with this strain showed a significant increase in dry weight of both aerial parts and rootsystem, including when R. solani was present in the substrate. It was isolated from soil plot bean inthe Astorga region (León, Spain). This isolate gave percentages of inhibition 61.73±0.61 (% ±standard error) in membrane assays and 47.08±1.78 (% ± standard error) in direct confrontationassays with R. solani, and was able to sporulate on PDA medium. Furthermore, when bean plantswere treated with T. velutinum T028 they increased respect to control plants (CC) 4.75 % theirdiameter of hypocotyl, 10.75 % their length of root system, 4.27 % and 5.51 % in dry weight ofaerial parts and root system, respectively. When plants were infected with R. solani, the action ofT. velutinum T028 caused an increase of the diameter of hypocotyl in 8.76 %, 21.15 % in the lengthof the root system, and 11.05 % and 3.43 % in dry weight of aerial parts and root system respectivelyrespect to the control plant with the pathogen (CR) (Mayo et al., 2016). Based on these results, thisisolate was used for further studies. In addition, this is the first report in which the effects of thisstrain on bean phenotype and plant metabolite production are studied.

Capítulo IV
102
3.2. Characterization of compounds in bean leaf extracts
The base peak chromatogram of bean leaf resulted from the optimal-gradient-elution program and the optimal MS conditions in negative ionization mode (Figure 2). The compounds were identified by interpreting their mass spectra determined via TOFMS and taking into account the data reported in the literature.
Metabolomics analysis of bean leaf samples revealed up to 36 compounds, which are specific of the Fabaceae family that accumulated differentially in leaves inoculated with fungal microbes compared to controls (inoculated plants). The compounds detected in uninoculated bean leaves were used as a control for the comparisons with the two-way (CT028-CC and CR-CC) and the three-way interactions (RT028-CC) (Figure 1). The compounds were considered to be differentially accumulated when increase (UP) or decrease (DOWN) production was observed, compared to uninoculated controls (CC). The semi-quantification of compounds was performed by determining the peak areas of the base peak chromatogram of bean leaf samples. The following categories of compounds were found.
Table 1: Phytochemical compounds detected in bean leaves by negative ionization mode, including retention time, m/z, molecular formula, together with their proposed identities and the references.
Id m/z RT
(min) Formula Tentative assignment Reference
Amino acid
8 204.09 8.52 C11H12N2O2 L-Tryptophan PubChem ID number - 6305(Lu et al., 2013)
15 246.10 14.20 C13H14N2O3 N-acetyltryptophan PubChem ID number- 2002(Lu et al., 2013)
Peptide
7 230.16 8.42 C11H22N2O3 Valyl-Leucine Pubchem ID number - 107487
11 372.24 10.00 C17H32N4O5 Ile Gln Ile NA 29 402.19 19.94 C15H26N6O7 Gln Gln Gln NA Carbohydrate
2 342.12 1.43 C12H22O11 Sucrose PubChem ID number - 5988(Lu et al., 2013)
Glycoside
4 338.08 4.96 C12H18O11 L-Ascorbic acid-2-glucoside Pubchem ID number - 54693473
Fatty acids
35 278.22 30.59 C18H30O2 γ-Linolenic acid PubChem ID number - 5280933(Brechenmacher etal., 2010; KanehisaLaboratories, 2016;Lu et al., 2013)
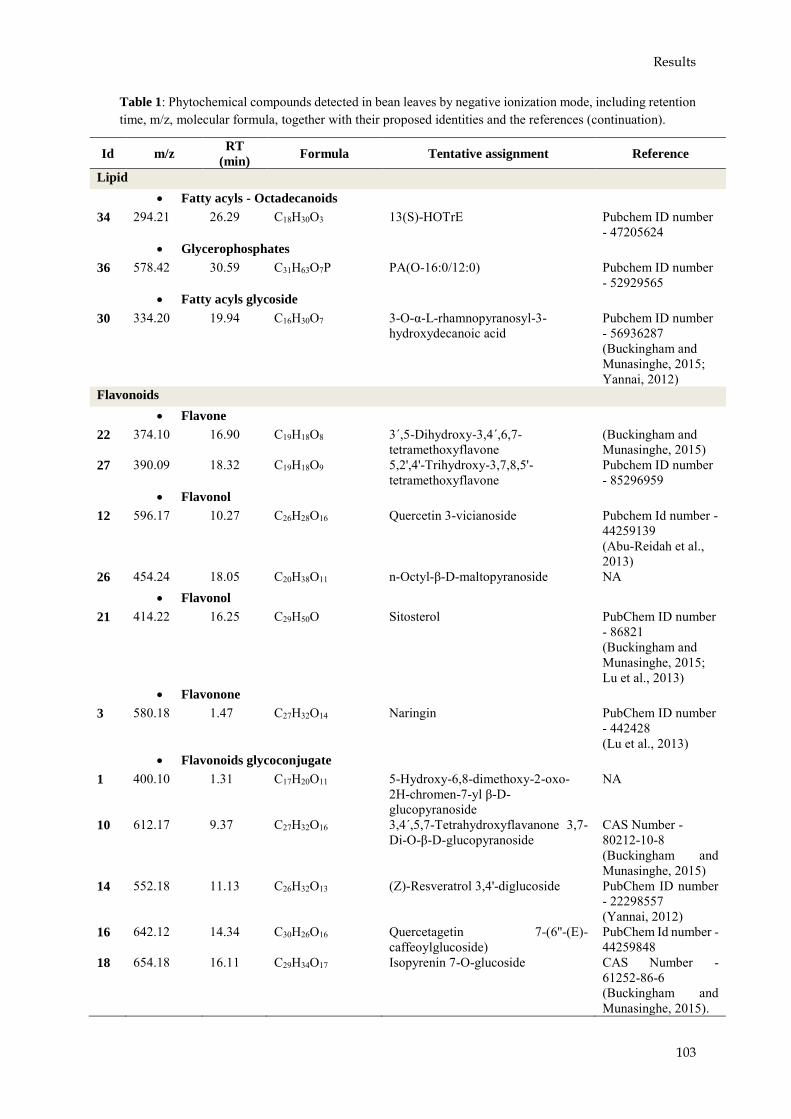
Results
103
Table 1: Phytochemical compounds detected in bean leaves by negative ionization mode, including retention time, m/z, molecular formula, together with their proposed identities and the references (continuation).
Id m/z RT
(min) Formula Tentative assignment Reference
Lipid
• Fatty acyls - Octadecanoids
34 294.21 26.29 C18H30O3 13(S)-HOTrE Pubchem ID number - 47205624
• Glycerophosphates
36 578.42 30.59 C31H63O7P PA(O-16:0/12:0) Pubchem ID number - 52929565
• Fatty acyls glycoside
30 334.20 19.94 C16H30O7 3-O-α-L-rhamnopyranosyl-3-hydroxydecanoic acid
Pubchem ID number - 56936287(Buckingham andMunasinghe, 2015;Yannai, 2012)
Flavonoids
• Flavone
22 374.10 16.90 C19H18O8 3´,5-Dihydroxy-3,4´,6,7-tetramethoxyflavone
(Buckingham and Munasinghe, 2015)
27 390.09 18.32 C19H18O9 5,2',4'-Trihydroxy-3,7,8,5'-tetramethoxyflavone
Pubchem ID number - 85296959
• Flavonol
12 596.17 10.27 C26H28O16 Quercetin 3-vicianoside Pubchem Id number - 44259139 (Abu-Reidah et al., 2013)
26 454.24 18.05 C20H38O11 n-Octyl-β-D-maltopyranoside NA • Flavonol
21 414.22 16.25 C29H50O Sitosterol PubChem ID number - 86821(Buckingham andMunasinghe, 2015;Lu et al., 2013)
• Flavonone
3 580.18 1.47 C27H32O14 Naringin PubChem ID number - 442428(Lu et al., 2013)
• Flavonoids glycoconjugate
1 400.10 1.31 C17H20O11 5-Hydroxy-6,8-dimethoxy-2-oxo-2H-chromen-7-yl β-D-glucopyranoside
NA
10 612.17 9.37 C27H32O16 3,4´,5,7-Tetrahydroxyflavanone 3,7-Di-O-β-D-glucopyranoside
CAS Number - 80212-10-8 (Buckingham and Munasinghe, 2015)
14 552.18 11.13 C26H32O13 (Z)-Resveratrol 3,4'-diglucoside PubChem ID number - 22298557(Yannai, 2012)
16 642.12 14.34 C30H26O16 Quercetagetin 7-(6''-(E)-caffeoylglucoside)
PubChem Id number -44259848
18 654.18 16.11 C29H34O17 Isopyrenin 7-O-glucoside CAS Number -61252-86-6(Buckingham andMunasinghe, 2015).

Capítulo IV
104
Table 1: Phytochemical compounds detected in bean leaves by negative ionization mode, including retention time, m/z, molecular formula, together with their proposed identities and the references (continuation).
Id m/z RT
(min) Formula Tentative assignment Reference
• Flavonoids glycoconjugate (continuation)
19 540.18 16.11 C25H32O13 12-Hydroxy, O-[3,4,5-trihydroxybenzoyl-(06)-β-D-glucopyranoside]
(Yannai, 2012)
20 678.29 16.24 C32H39O16 Luteone 4,7-O-diglucoside (Wojakowska et al., 2013, 2015)
24 470.24 17.61 C20H38O12 (R)-1-O-[β-D-Glucopyranosyl-(1-6)-β-D-glucopyranoside]-1,3-octanediol
HMDB Id number -32799
• Isoflavanoid
28 338.19 18.61 C21H22O4 C20H18O5
2´-O-Methylphaseollinisoflavan Wighteone
CAS Number - 49594-01-6 PubChem Id number - 5281814 (Rizk et al., 1980; Southon et al., 1994; Wojakowska et al., 2015; Yannai, 2012)
• Isoflavanone
25 424.23 17.62 C25H28O6 2´,4´,5,7-Tetrahydroxy-3´,8-diprenylisoflavanone
CAS Number - 64280-18-8 (Southon et al., 1994)
• Isoflavans
6 324.14 8.13 C20H20O4 Phaseollinisoflavan Pubchem ID number -4484952 (Rizk et al., 1980)
Phenol
• Tyrosols // Flavonoid
5 316.11 7.29 C14H20O8 C16H12O7
Hydroxytyrosol 1-O-glucoside Isorhamnetin
Pubchem ID number -13845930 (Lu et al., 2013)
• Phenylpropanoids
13 386.12 10.71 C17H22O10 1-O-Sinapoylglucose Pubchem ID number - 5280406
• Xanthonoid
31 392.11 21.10 C19H20O9 Garcimangosone D Pubchem ID number – 11003703(Yannai, 2012)
33 628.31 25.77 C38H44O8 Gambogic acid Pubchem ID number -5281632
Terpene
• Terpenoid
9 444.20 8.88 C21H32O10 Dihydrophaseic acid 4-O-β-D-glucoside
CHEBI Id number - 23758 (Pushpa et al., 2014)
• Triterpenoid
32 896.51 24.97 C47H76O16 Akeboside Ste Pubchem ID number - 46173935

Results
105
Table 1: Phytochemical compounds detected in bean leaves by negative ionization mode, including retention time, m/z, molecular formula, together with their proposed identities and the references (continuation).
Id m/z RT
(min) Formula Tentative assignment Reference
• Terpene glycosides
17 416.20 14.78 C20H32O9 Ethyl 7-epi-12-hydroxyjasmonate glucoside
HMDB Id number - 36340 (Lu et al., 2013)
• Terpene // Flavonoids - Methoxyisoflavones
23 268.13 17.52 C14H20O5 C16H12O4
Teucrein Formononetin
Pubchem ID number - 101288297 PubChem ID number - 5280378(Lu et al., 2013)
RT: retention time; NA: not available
a) Amino acids and peptides
Statistical analysis revealed the different accumulation of two aminoacids and three peptides (Table1). Compound #8 (m/z 204.0896; Retention Time, RT = 8.52 min) and compound #15 (m/z 246.1003; RT = 14.20 min), corresponding to the molecular formula C11H12N2O2, and C13H14N2O3, respectively, were putatively identified as L-tryptophan and N-acetyltryptophan. Both compounds were produced in lower amounts when R. solani was present (CR) (Table 2). However, in the presence of T. velutinum they were more produced at higher levels (CT028 and RT028) (Table 2).
Furthermore, three peptides (Table 1) were detected: valyl-leucine [compound #7, m/z 230.1627 at 8.42 min (C11H22N2O3)] was produced in the presence of T. velutinum (CT028 and RT028) at higher level than in control plants and at a lower level when only with R. solani was present (CR) (Table 2). Ile-Gln-Ile [compound #11, m/z 372.2370 at 10.00 min (C17H32N4O5)], whose production was reduced in the presence of R. solani (CR and RT028), and Gln-Gln-Gln [compound #29, m/z 402.1860 at 19.94 min (C15H26N6O7)] that whose amount decreased in the presence of T. velutinum (CT028 and RT028) (Table 2).
b) Carbohydrates and glycosides
Production of sucrose (Table 1) [compound #2, m/z of 342.1157 at 1.43 min (C12H22O11)] shown a higher level in the presence of R. solani or T. velutinum (CT028 and CR) but not when both fungi were together (RT028) (Table 2).
L-ascorbic acid-2-glucoside (Table 1) was also identified, [compound #4, m/z 338.048, at 4.96 min (C12H18O11)], at an increased level only in presence of R. solani (CR) without T. velutinum (Table 2).

Ca
pítu
lo IV
10
6
Figure 2: Base peak chromatogram of control plants (CC), obtained by HPLC-DAD-TOF-MS. See Table 1 for identification number.

Results
107
c) Fatty acids and lipids
Three compounds were detected belonging to this group (Table 1): i) compound #35, with an m/z 278.2238 at 30.59 min (C18H30O2); ii) #34, m/z 294.2193 at 26.29 min (C18H30O3), and iii) #36, m/z 578.4296 at 30.59 min (C31H63O7P). These compounds were γ-linolenic acid, 13(S)-HOTrE and PA(O-16:0/12:0), respectively. All of them were produced at a significantly lower amount respect to control plants when the pathogen R. solani was present (CR and RT028) (Table 2). 3-O-α-L-rhamnopyranosyl-3-hydroxydecanoic acid was also identified [#30, m/z 334.1990 at 19.94 min (C16H30O7)], and was produced at a significantly lower amount when T. velutinum was present (CT028 and RT028), compared in all cases to control plants (Table 2).
d) Polyphenols
A huge number of compounds belonging to this group has been detected:
i) Two compounds, #22 and #27, were determined as flavones (Table 1), one with m/z 374.0998 at16.90 min (C19H18O8), and other with m/z 390.0946 at 18.32 min (C19H18O9), which were identifiedas 3´,5-dihydroxy-3,4´,6,7-tetramethoxyflavone and 5,2',4'-trihydroxy-3,7,8,5'-tetramethoxyflavone, respectively. Both compounds were produced at significantly lower amountsin plants with any of the fungi analyzed (CT028, CR, and RT028) (Table 2).
ii) Flavonols (Table 1). quercetin 3-vicianoside (#12) with an m/z 596.1736, at 10.27 min(C26H28O16); n-octyl-β-D-maltopyranoside (#26) with an m/z 454.2409, at 18.05 min (C20H38O11)and sitosterol (#21) with m/z 414.2248, at 16.25 min (C29H50O). These compounds showed differentresponses. In the case of compounds #12 and #21 they were produced at higher amounts in thepresence of T. velutinum (CT028 and RT028) (Table 2). However, compound #26 was produced atlower level in presence of this fungus (CT028).
iii) Flavonones (Table 1). Naringin, (#3), m/z 580.1849, at 1.47 min (C27H32O14), was produced athigher levels in the presence of T. velutinum (CT028) (Table 2).
iv) Flavonoid glycoconjugates (Table 1). 5-Hydroxy-6,8-dimethoxy-2-oxo-2H-chromen-7-yl β-D-glucopyranoside (#1), m/z 400.1024, at 1.31 min (C17H20O11), which was in low amount in thepresence of the two fungi (Table 2); 3,4´,5,7-Tetrahydroxyflavanone 3,7-Di-O-β-D-glucopyranoside (#10), m/z 612.1685, at 9.37 min (C27H32O16) that was produced at higher levelwith T. velutinum (CT028 and RT028); (Z)-resveratrol 3,4'-diglucoside, (#14), m/z 552.1841, at11.13 min (C26H32O13) which was produced in higher amount in the presence of both T. velutinumand R. solani (RT028) (Table 2); quercetagetin 7-(6''-(E)-caffeoylglucoside) (#16), m/z 642.1192,at 14.34 min (C30H26O16), produced at lower levels in plants infected with R. solani (CR) (Table 2);12-hydroxy,O-[3,4,5-trihydroxybenzoyl-(06)-β-D-glucopyranoside] (#19), m/z 540.1836, at 16.11min (C25H32O13) whose production was lower in the presence of both fungi (CT028, CR and RT028)(Table 2); isopyrenin 7-O-glucoside (#18), m/z 654.1767, at 16.11 min (C29H34O17), which wasdetected in lower amounts in the presence of both fungi (CT028, CR and RT028) (Table 2); luteone4,7-O-diglucoside (#20), m/z 678.2894, at 16.24 min (C32H39O16), which was produced at higherlevels in the presence of T. velutinum (CT028 and RT028), while the infection with R. solani (CR)reduced its level (Table 2); and (R)-1-O-[β-D-glucopyranosyl-(1-6)-β-D-glucopyranoside]-1,3-octanediol (#24), m/z 470.2359, at 17.61 min (C20H38O11) produced at lower level with T. velutinum(CT028 and RT028) (Table 2).

Capítulo IV
108
v) Others polyphenols. Isoflavanoids (Table 1): 2´-O-methylphaseollinisoflavan [#28, m/z338.1939, at 18.61 min (C21H22O4)], which could be also identified as wighteone (C20H18O5).Isoflavanones (Table 1): 2´,4´,5,7-tetrahydroxy-3´,8-diprenylisoflavanone [#25, m/z 424.2304, at17.62 min (C25H28O6). Isoflavans: phaseollinisoflavan [#6, m/z 324.1419, at 8.13 min (C20H20O4).All these compounds were produced at lower level in the presence of T. velutinum (CT028 andRT028), except in the case of phaseollinisoflavan, whose production was lower only if R. solaniwas present with this biocontrol agent (RT028) (Table 2). Phenols (Table 1): hydroxytyrosol 1-O-glucoside [#5, m/z 316.1152, at 7.29 min (C14H20O8) or isorhamnetin, both with that same molecularweight, and produced at lower level in the presence of T. velutinum (CT028) (Table 2); 1-O-sinapoylglucose [#13, m/z 386.1202, at 10.71 min (C17H22O10) that is produced at higher level inthe presence of T. velutinum (CT028 and RT028) (Table 2); garcimangosone D [#31, m/z 392.1105,at 21.10 min (C19H20O9), and produced in lower amount when both fungi were present (CT028, CRand RT028) (Table 2); gambogic acid [#33, m/z 628.3061, at 25.77 min (C38H44O8)] also producedat lower level in the presence of T. velutinum (CT028 and RT028) (Table 2).
e) Terpenes
T. velutinum and R. solani affect to the level of terpenes production (Table 1). Thus, dihydrophaseicacid 4-O-β-D-glucoside [#9, m/z 444.1989, at 8.88 min (C21H32O10)]; teucrein [#23, m/z 268.1305,at 17.52 min (C14H20O5)] or it could be formononetin, with the formula C16H12O4 that is amethoxyisoflavone with this same molecular weight. Both compounds were over produced with T.velutinum (CT028) (Table 2). Ethyl 7-epi-12-hydroxyjasmonate glucoside [#17, m/z 416.2043, at14.78 min (C20H32O9)] was produced in higher amount in presence of the fungi (CT028, CR andRT028) (Table 2). Akebosideste [#32, m/z 896.5127, at 24.97 min (C47H76O16)] was produced inlower amounts when any of both fungi were present (CT028, CR and RT028) (Table 2).
Table 2: Compounds detected that were produced at significantly among different levels respect to the control plants when there were present or absence Trichoderma and/or R. solani.
Id Formula Tentative assignment CT028-CC CR-CC RT028-CC
Amino acid
8 C11H12N2O2 L-Tryptophan Up Down -- 15 C13H14N2O3 N-acetyltryptophan -- Down Up
Carbohydrate
2 C12H22O11 Sucrose Up Up --
Fatty acids
35 C18H30O2 γ-Linolenic acid -- Down Down

Results
109
Table 2: Compounds detected that were produced at significantly among different levels respect to the control plants when there were present or absence Trichoderma and/or R. solani (continuation).
Id Formula Tentative assignment CT028-CC CR-CC RT028-CC
Flavonoids
1 C17H20O11 5-Hydroxy-6,8-dimethoxy-2-oxo-2H-chromen-7-yl β-D-
glucopyranoside
Down Down Down
3 C27H32O14 Naringin Up -- -- 6 C20H20O4 Phaseollinisoflavan -- -- Down
10 C27H32O16 3,4´,5,7-Tetrahydroxyflavanone 3,7-Di-O-β-D-glucopyranoside
Up -- Up
12 C26H28O16 Quercetin 3-vicianoside -- -- Up 14 C26H32O13 (Z)-Resveratrol 3,4'-diglucoside -- -- Up 16 C30H26O16 Quercetagetin 7-(6''-(E)-
caffeoylglucoside) -- Down --
18 C29H34O17 Isopyrenin 7-O-glucoside Down Down Down 19 C25H32O13 12-Hydroxy, O-[3,4,5-
trihydroxybenzoyl-(06)-β-D-glucopyranoside]
Down Down Down
20 C32H39O16 Luteone 4,7-O-diglucoside Up Down Up 21 C29H50O Sitosterol -- -- Up 22 C19H18O8 3´,5-Dihydroxy-3,4´,6,7-
tetramethoxyflavone Down Down Down
24 C20H38O12 (R)-1-O-[β-D-Glucopyranosyl-(1-6)-β-D-glucopyranoside]-1,3-
octanediol
Down -- Down
25 C25H28O6 2´,4´,5,7-Tetrahydroxy-3´,8-diprenylisoflavanone
Down -- Down
26 C20H38O11 n-Octyl-β-D-maltopyranoside Down -- -- 27 C19H18O9 5,2',4'-Trihydroxy-3,7,8,5'-
tetramethoxyflavone Down Down Down
28 C21H22O4 C20H18O5
2´-O-Methylphaseollinisoflavan Wighteone
Down -- Down
Glycoside
4 C12H18O11 L-Ascorbic acid-2-glucoside -- Up --
Lipid
30 C16H30O7 3-O-α-L-rhamnopyranosyl-3-hydroxydecanoic acid
Down -- Down
34 C18H30O3 13(S)-HOTrE -- Down -- 36 C31H63O7P PA(O-16:0/12:0) -- Down Down
Peptide
7 C11H22N2O3 Valyl-Leucine Up Down Up 11 C17H32N4O5 Ile Gln Ile -- Down Down 29 C15H26N6O7 Gln Gln Gln Down -- Down
Phenol
5 C14H20O8 C16H12O7
Hydroxytyrosol 1-O-glucoside Isorhamnetin
Down -- --
13 C17H22O10 1-O-Sinapoylglucose Up -- Up 31 C19H20O9 Garcimangosone D Down Down Down 33 C38H44O8 Gambogic acid Down -- Down

Capítulo IV
110
Table 2: Compounds detected that were produced at significantly among different levels respect to the control plants when there were present or absence Trichoderma and/or R. solani (continuation).
Id Formula Tentative assignment CT028-CC CR-CC RT028-CC
Terpene
9 C21H32O10 Dihydrophaseic acid 4-O-β-D-glucoside
Up -- --
17 C20H32O9 Ethyl 7-epi-12-hydroxyjasmonate glucoside
Up Up Up
23 C14H20O5 C16H12O4
Teucrein Formononetin
Up -- --
32 C47H76O16 Akeboside Ste Down Down Down
3.3. Comparison of metabolites whose production in induced in response to
presence or absence of Trichoderma and/or R. solani
After the statistical analysis, several compounds were produced at significantly different levels compared with the control plants (Table 2). In the interaction with T. velutinum (CT028), twenty-five compounds were produced at significantly different levels respect to control plants, among them ten were increased in the presence of this fungus, and fifteen decreased their amount (Figure 3).
In the interaction with R. solani (CR), nineteen compounds, increased in their production level and sixteen compounds were decreased respect to control plants (Figure 3).
When bean plants were in contact with T. velutinum and R. solani, (RT028), twenty-six compounds were produced at significantly different levels respect to control plants, among them nine compounds were increased and seventeen were decreased (Figure 3).
Analysing the interaction of R. solani (Table 2), there were two compounds, a flavonoid (#20) and a peptide (#7), that were deceased in their level of production (CR), but when T. velutinum was present (CT028 and RT028), their amounts were increased. In the case of RT028, the presence of Trichoderma abolished the effect of the pathogen in the bean plants. However, a contrasting result was observed with other three compounds, a fatty acid (#35), a lipid (#36), and a peptide (#11), whose production decreased in the presence of R. solani, but the presence of T. velutinum did not counteract this effect. It was also a carbohydrate (#2) increased in presence of both fungi.
In the interaction with T. velutinum (Table 2) there were six compounds, three flavonoids (#24, #25, #28), a lipid (#30), a peptide (#29) and a phenol (#33) whose production was reduced and two compounds, a flavonoid (#10) and a phenol (#13) that were increased. R. solani did not cause any effect in the level of production of these compounds.
Analysing the interaction between bean plants – T. velutinum – R. solani (Table 2), seven compounds, five flavonoids (#1, #18, #19, #22, #27), a phenol (#31) and a terpene (#32) were reduced in their level of production respect to control plants and only one compound (Figure 3), a terpene, (#17) was increased in the three conditions (CT028, CR, RT028). This response could be an effect of the presence of the fungus independently if it was a pathogen or a biocontrol agent. Thus, the plant responds against invader organism using in some extend similar strategies.

Results
111
3.4. Principal component analysis (PCA) of the compounds contents
HPLC separations of bean leaves extracts revealed differences in the accumulation pattern of compounds according to the interaction performed in vitro (Figure 1). Differences in compound accumulation among treatments were analyzed by principal component analysis (PCA). The compounds for each sample were grouped in a region of the graph (Figure 4). In the left top, there are grouped the control samples (CC), in the left bottom the samples from plants inoculated with R. solani (CR). Similarly, in the right side of the graph there are grouped the samples from plants inoculated with Trichoderma, being the top those corresponding to plants without pathogen (CT028) and in the bottom those infected with R. solani (RT028).
The MS data were subjected to PCA (Figure 4) aiming at exploring similarities or differences in metabolite profiles between the treatments in the bean plants with T. velutinum and R. solani. A four-component model, the first two components were explained accounting for 73.96 % of the variance. In the figure 2, the component 1 and 2 was able to separate the samples into four groups, when the two groups of the right were inoculated with T. velutinum and those of the left were without the biocontrol agent. In addition, it was possible to divide the bean plant inoculated with the pathogen, when the plants without R. solani were in the top of the graph and those with the pathogen were the bottom.
Figure 3: Venn´s diagram with the compounds with an Up-production and Down-production. See Table 2 for identification compounds.
Capítulo IV
112
4. DISCUSSION
T. velutinum T028 isolate was the selected, based on its positive effect on bean growth. Thus, plantsinoculated with this strain showed a significant increase in dry weight of both aerial parts and rootsystem, including when R. solani was present in the substrate. Also, T028 and R. solani R43 isolateshave been shown to be affect the expression of genes involved in plant defence. These genes showedsignificant homology with plant defence related genes and they are expressed in bean leaves ofplants treated with T. velutinum and/or infected with R. solani (Mayo et al., 2016).
The plants-phytopathogen interaction is complex and would be very specific to a given partners combination. The defence strategies of plants against their pathogens are diverse and include the production of antifungal compounds. In this work, we are deseing an experimental strategy to know the changes in the metabolic profiles of beans plants when inoculated with T. velutinum, in the presence or absence of R. solani, during forty-five days of growth. In order to do that a metabolomics analysis of aqueous methanol extracts was applied when bean plants were in contact with these organisms, respect to control plants. This analysis had enabled the comparison of samples for the relative abundance of several metabolites, including flavonoids, phenols, terpenes, amino acids, carbohydrates, fatty acids, lipids, glycosides and peptides.
Phytoalexins are a heterogeneous group of compounds that show biological activity against a variety of pathogens and are considered as molecular markers of disease resistance (Ahuja et al., 2012) . They are synthesized in response to pathogen attack and they would not be present in healthy plants (Morrissey and Osbourn, 1999). Thus, one way to improve the plant resistance to disease would be to stimulate plants to produce their own phytoalexins, which might be carried out by inoculation with a non-pathogenic microorganism, as Trichoderma, or a pathogen hipovirulent strain (Grayer and Kokubun, 2001). This would cause a systemic resistance: after any subsequent
Figure 4: Principal components analysis of 36 compounds extracted by bean leaves subjected to different treatments. (Blue) control beans without pathogen and biocontrol agent (CC); (Red) beans that were infected with R. solani (CR); (Yellow) beans inoculated with T. velutinum (CT028); (Green) beans inoculated with R. solani and T. velutinum (RT028).

Discussion
113
infection with a pathogen the plant responds rapidly to accumulate phytoalexins at the site of infection and produces compounds to stop the growth of the pathogen (Kuc, 1991). It had been found on Solanaceae, Leguminosae and Gramineae that the biotic and abiotic factors can induce the generation of phytoalexins (Hammerschmidt and Becker, 1997).
Many classes of polyphenolic metabolites have an antibiotic activity during plant interactions with phytopathogens and they play the roles of phytoalexins in plant tissues (VanEtten et al., 1994). There are several groups in the polyphenols, as phenols, phenolic acids and flavonoids (Abu-Reidah et al., 2013). Flavonoids, protect plants against various biotic and abiotic stresses and exhibit a diverse spectrum of biological functions, playing an important role in the interaction between the plant and their environment (Pourcel et al., 2007). The majority of flavonoids exist naturally as glycosides and the presence of sugars and hydroxyl groups make them water soluble whereas methyl groups and isopentyl units make flavonoids lipophilic (Samanta et al., 2011). In this work, there are more flavonoides produced in lower amounts when plants were grown in the presence of T. velutinum, as 3´,5-dihydroxy-3,4´,6,7-tetramethoxyflavone, 5,2',4'-trihydroxy-3,7,8,5'-tetramethoxyflavone, n-octyl-β-D-maltopyranoside, (R)-1-O-[β-D-glucopyranosyl-(1-6)-β-D-glucopyranoside]-1,3-octanediol, 5-hydroxy-6,8-dimethoxy-2-oxo-2H-chromen-7-yl-β-D-glucopyranoside, isopyrenin 7-O-glucoside, 12-hydroxy, O-[3,4,5-trihydroxybenzoyl-(06)-β-D-glucopyranoside], and 2´,4´,5,7-tetrahydroxy-3´,8-diprenylisoflavanone. However, naringin(flavonone) and 3,4´,5,7-tetrahydroxyflavanone 3,7-Di-O-β-D-glucopyranoside and luteone 4,7-O-diglucoside (flavonoid glyconjugates), were increased in presence of T. velutinum. When R. solaniwas present, normally, a minor production of this type of compounds was detected respect to controlplants, as quercetagetin 7-[6''-(E)-caffeoylglucoside] and luteone 4,7-O-diglucoside (flavonoidglycoconjugates).
It is unclear whether the accumulation of different but structurally related phytoalexins in a plant is important for the resistance against pathogen, e.g. phaseollin, phaseollidin in beans (Kuc, 1991), but in this work, compounds such as 2´-O-methylphaseollinisoflavan and phaseollinisoflavan, which are phytoalexins derivatives, were produced in lower amount if T. velutinum was present. In a previous study in which bean plants were inoculated with R. solani, it was found that a considerable amount of phaseollin accumulated in the lesions within 36 hours after inoculation and continued to accumulate for at least 12 days after the lesions (Rizk et al., 1980). In the present case, T. velutinum reduced its production in presence de R. solani and 45 days after inoculation itsproduction was not significant altered respect control plants.
In a plant’s immune system, the plant hormone jasmonic acid and its derivatives have been recognized as key regulators that play crucial roles in plant defense responses to pathogens (Pieterse et al., 2012). There are some studies, based in the use genetically modified Arabidopsis plants in which jasmonic acid synthesis or signaling is modulated; consequently, the functions of jasmonic acid derivatives in plant resistance to both biotrophic and necrotrophic pathogens have been demonstrated (Okada et al., 2015). In the case of terpenes, ethyl 7-epi-12-hydroxyjasmonate glucoside was produced at a significantly higher level respect to control plants in the presence of this fungus T. velutinum and/or R. solani. The importance of this compound is remarkable, since it is a product of jasmonate acid that is synthesized when plants detected a microorganism. Then, they activate the signalling cascades dependent of this compound. In the case of potato, this compound was also detected when potato plants were in contact with the pathogen Phytophthora infestans (Yogendra et al., 2015). Similarly, in the case of 12-hydroxy-O-[3,4,5-trihydroxybenzoyl-(06)-β-D-glucopyranoside], a steroisomer of jasmonic acid, and akeboside ste which was produced at a

Capítulo IV
114
lower level in the presence of both fungi respect to control plants, bean plant could contemplate to T. velutinum and R. solani as a same type of organism causing the same response in the plant.
γ-Linolenic acid is the main precursor of the jasmonates (Heitz et al., 2016), whose production decreased in the presence of R. solani, compared to control plants. Similarly, 13(S)-HOTrE, a derivative of γ-Linolenic acid, was also produced at lower levels in the presence of the pathogen. This respond is possible because these compounds, depend of the jasmonate or theirs precursors, are responsible of the production of signalling cascade by respond to a non-pathogenic microorganism (Druzhinina et al., 2011). However, akeboside ste, was produced in a lower amount when both fungi were present. Bean plant could perceive T. velutinum and R. solani as a same kind of organism causing the same response in the plant.
In the case of the amino acids, there is a different response if the pathogen and/or the biocontrol agent were present in the soil. In the presence of T. velutinum (CT028), L-Tryptophan increase its amount, but if when R. solani (CR) was present the levels of this compound were reduced, compared with the control plants. This response was also observed for N-acetyltryptophan. However, in the presence of both fungi (RT028) the production was increased. This result can be explained because L-tryptophan is a physiological precursor of auxins, and it has been found as responsible for biosynthesis of auxins in the rhizosphere. Thus, it stimulates synthesis of auxins and triggers the plant growth. Then, when T. velutinum is present in the soil, the concentration of this compound will be increased respect to control plants. In other study, the inoculation in Vigna mungo with other biocontrol agents as Rhizobium spp. and Bacillus spp., also resulted in an increase of 23.36% in the yield when this compound was present (Qureshi et al., 2012).
Antifungal peptides derived from common bean have exerted an inhibitory activity over a number of plant pathogens such as Mycosphaerella arachidicola, Rhizoctonia solani, Verticillium dahlia, Setosphaeria turcica and Fusarium oxysporum (Luna-Vital et al., 2015). Thus, it is possible that the effectiveness of the antifungal activity against phytopathogens depends on the fungi and the cultivar, which are interacting. Several antifungal activities of common bean peptides have been previously described: induction of morphological changes in hyphae, membrane cell disruption, membrane permeabilization and induction of chitin accumulation at hyphal tips (Luna-Vital et al., 2015). In the present work, when the pathogen Rhizoctonia (CR) was present, the peptides Valyl-Leucine and Ile Gln Ile were producer in a lower amount respect to control plants. When only T. velutinum (CT028) the peptide Valyl-Leucine was produced in greater amount respect to control plant. When T. velutinum and R. solani (RT028) were both present, all the detected peptides, except Valyl-Leucine, were produced at a lower level respect to control plants. These results were possible because these peptides have a defence role in the plant, and those increased in the presence of Trichoderma could have an important function in the metabolic antifungal activity of the plant.
5. CONCLUSIONS
The presence of T. velutinum and/or R. solani modified the bean metabolome. They cause the activation of defence mechanisms, which is reflected in the production of polyphenols, terpenes and other compounds. Trichoderma and Rhizoctonia caused an increase in the production of a terpene and a lower production of five flavonoids, a phenol and a terpene. When T. velutinum is present two amino acids, six flavonoids, a peptide, a phenol and two terpenes increased their level of production and a fatty acid, five flavonoids, two lipids, two peptides and two phenols were produced in lower amounts. When R. solani was present, two amino acids, a fatty acid, two

Conclusions and Acknowledgments
115
flavonoids and two lipids were produced in minor amount and a carbohydrate and a glycoside were produced in major amount respect to control plant.
6. ACKNOWLEDGMENTS
The grant awarded to Sara Mayo Prieto (FPU12/00677) by the Ministry of Education, Culture and Sport (Spain) according the Resolution of April 25, 2012 (BOE of 10 May), as amended by Resolution of May 18, 2012 (BOE of 22 May), and by Resolution of October 31, 2012 (BOE of 12 November), granted in the Resolution of December 20, 2012 and the Resolution of Mobility for Short Term of December 9, 2014 (BOE of 22 December). Ministry of Economy and Competitiveness for National project “Farnesol as self-regulatory molecule in Trichoderma. Tyrosol and farnesol signaling in Trichoderma-bean interaction” (AGL2012-40041-C02-02). Junta de Castilla y León, Consejería de Educación for the project “Effect of terpenes and physiologically related compounds produced by Trichoderma parareesei in the development of common bean (Phaseolus vulgaris L.) and in defensive responses of this plant” (LE228U14).
7. REFERENCE LIST
Abu-Reidah, I. M., Arráez-Román, D., Lozano-Sánchez, J., Segura-Carretero, A., and Fernández-Gutiérrez, A. (2013). Phytochemical characterisation of green beans (Phaseolus vulgaris L.) by using high-performance liquid chromatography coupled with time-of-flight mass spectrometry. Phytochem. Anal. 24, 105–16. doi:10.1002/pca.2385.
Ahuja, I., Kissen, R., and Bones, A. M. (2012). Phytoalexins in defense against pathogens. Trends Plant Sci. 17, 73–90. doi:10.1016/j.tplants.2011.11.002.
Boller, T., and Felix, G. (2009). A Renaissance of elicitors: perception of microbe-associated molecular patterns and danger signals by pattern-recognition receptors. Annu. Rev. Plant Biol. 60, 379–406. doi:10.1146/annurev.arplant.57.032905.105346.
Brechenmacher, L., Lei, Z., Libault, M., Findley, S., Sugawara, M., Sadowsky, M. J., et al. (2010). Soybean metabolites regulated in root hairs in response to the symbiotic bacterium Bradyrhizobium japonicum. Plant Physiol. 153, 1808–1822. doi:10.1104/pp.110.157800.
Buckingham, J., and Munasinghe, V. R. N. (2015). Dictionary of flavonoids. , eds. J. Buckingham and V. R. N. Munasinghe Boca Raton, Florida: Taylor & Francis Group.
Chen, X., Qi, X., and Duan, L.-X. (2015). “Overview,” in Plant Metabolomics, eds. X. Qi, X. Chen, and Y. Wang (Dordrecht: Springer Netherlands), 1–24. doi:10.1007/978-94-017-9291-2_1.
Druzhinina, I. S., Seidl-Seiboth, V., Herrera-Estrella, A., Horwitz, B. A., Kenerley, C. M., Monte, E., et al. (2011). Trichoderma: The genomics of opportunistic success. Nat. Rev. Microbiol. 9, 749–759.
Grayer, R. J., and Kokubun, T. (2001). Plant–fungal interactions: the search for phytoalexins and other antifungal compounds from higher plants. Phytochemistry 56, 253–263. doi:10.1016/S0031-9422(00)00450-7.
Grotewold, E. (2005). Plant metabolic diversity: a regulatory perspective. Trends Plant Sci. 10, 57–62. doi:10.1016/j.tplants.2004.12.009.
Guerrero-González, M. L., Rodríguez-Kessler, M., Rodríguez-Guerra, R., González-Chavira, M., Simpson, J., Sanchez, F., et al. (2011). Differential expression of Phaseolus vulgaris genes induced during the interaction with Rhizoctonia solani. Plant Cell Rep. 30, 1465–1473.

Capítulo IV
116
doi:10.1007/s00299-011-1055-5.
Hagedorn, D. J. (1991). “Rhizoctonia Root Rot,” in Compendium of Bean Diseases, ed. R. Hall (APS, American Phyopathological Society), 13.
Hammerschmidt, R., and Becker, J. S. (1997). “Acquired resistance to disease in plants,” in Horticultural Reviews, ed. J. Janick (New York (USA): John Wiley & Sons), 247–280.
Harrison, M. J., and Dixon, R. A. (1994). Spatial patterns of expression of flavonoid/isoflavonoid pathway genes during interactions between roots of Medicago truncatula and the mycorrhizal fungus Glomus versiforme. Plant J. 6, 9–20. doi:10.1046/j.1365-313X.1994.6010009.x.
Hassan, S., and Mathesius, U. (2012). The role of flavonoids in root-rhizosphere signalling: opportunities and challenges for improving plant-microbe interactions. J. Exp. Bot. 63, 3429–44. doi:10.1093/jxb/err430.
Heitz, T., Smirnova, E., Widemann, E., Aubert, Y., Pinot, F., and Ménard, R. (2016). “The rise and fall of jasmonate biological activities,” in Lipids in plant and algae development (Springer International Publishing), 405–426. doi:10.1007/978-3-319-25979-6_16.
Hermosa, R., Belén Rubio, M., Cardoza, R. E., Nicolás, C., Monte, E., and Gutiérrez, S. (2013). The contribution of Trichoderma to balancing the costs of plant growth and defense. Int. Microbiol. 16, 69–80.
Kanehisa Laboratories (2016). KEGG PATHWAY: alpha-Linolenic acid metabolism - Phaseolus vulgaris (common bean). 592. Available at: http://www.kegg.jp/kegg-bin/show_pathway?org_name=pvu&mapno=00592&mapscale=&show_description=hide.
Kuc, J. (1991). Phytoalexins, stress metabolism, and disease resistance in plants. Annu. Rev. Phytopathol., 275–297. doi:10.1146/annurev.py.33.090195.001423.
Lu, Y., Lam, H., Pi, E., Zhan, Q., Tsai, S., Wang, C., et al. (2013). Comparative metabolomics in Glycine max and Glycine soja under salt stress to reveal the phenotypes of their offspring. J. Agric. Food Chem. 61, 8711–21. doi:10.1021/jf402043m.
Luna-Vital, D. A., Mojica, L., González de Mejía, E., Mendoza, S., and Loarca-Piña, G. (2015). Biological potential of protein hydrolysates and peptides from common bean (Phaseolus vulgaris L.): A review. Food Res. Int. 76, 39–50. doi:10.1016/j.foodres.2014.11.024.
Mayo, S., Cominelli, E., Sparvoli, F., González-López, O., Rodríguez-González, A., Gutiérrez, S., et al. (2016). Development of a qPCR strategy to select bean genes involved in plant defense response and regulated by the Trichoderma velutinum – Rhizoctonia solani interaction. Front. Plant Sci. 7, 1109. doi:10.3389/fpls.2016.01109.
Mayo, S., Gutierrez, S., Malmierca, M. G., Lorenzana, A., Campelo, M. P., Hermosa, R., et al. (2015). Influence of Rhizoctonia solani and Trichoderma spp. in growth of bean (Phaseolus vulgaris L.) and in the induction of plant defense-related genes. Front. Plant Sci. 6, 685. doi:10.3389/fpls.2015.00685.
Morrissey, J. P., and Osbourn, A. E. (1999). Fungal resistance to plant antibiotics as a mechanism of pathogenesis. Microbiol. Mol. Biol. Rev. 63, 708–724.
Okada, K., Abe, H., and Arimura, G. -i. (2015). Jasmonates induce both defense responses and communication in monocotyledonous and dicotyledonous plants. Plant Cell Physiol. 56, 16–27. doi:10.1093/pcp/pcu158.
Pieterse, C. M. J., Van der Does, D., Zamioudis, C., Leon-Reyes, A., and Van Wees, S. C. M. (2012). Hormonal modulation of plant immunity. Annu. Rev. Cell Dev. Biol. 28, 489–521. doi:10.1146/annurev-cellbio-092910-154055.
Pourcel, L., Routaboul, J., Cheynier, V., Lepiniec, L., and Debeaujon, I. (2007). Flavonoid oxidation in plants: from biochemical properties to physiological functions. Trends Plant Sci. 12, 29–36. doi:10.1016/j.tplants.2006.11.006.

Reference list
117
Pushpa, D., Yogendra, K. N., Gunnaiah, R., Kushalappa, A. C., and Murphy, A. (2014). Identification of late blight resistance-related metabolites and genes in potato through nontargeted metabolomics. Plant Mol. Biol. Report. 32, 584–595. doi:10.1007/s11105-013-0665-1.
Qureshi, M. A., Iqbal, A., Akhtar, N., Shakir, M. A., and Khan, A. (2012). Co-inoculation of phosphate solubilizing bacteria and rhizobia in the presence of L-tryptophan for the promotion of mash bean (Vigna mungo L.). Soil Environ. 31, 47–54.
Rizk, A.-F., Wood, G. E., and Salunkhe, D. K. (1980). Phytoalexins of leguminous plants. C R C Crit. Rev. Food Sci. Nutr. 13, 245–295. doi:10.1080/10408398009527291.
Samanta, A., Das, G., and Das, S. (2011). Roles of flavonoids in plants. J. Pharm. Pharm. Sci. 6, 12–35.
Shoresh, M., Harman, G. E., and Mastouri, F. (2010). Induced systemic resistance and plant responses to fungal biocontrol agents. Annu. Rev. Phytopathol. 48, 21–43. doi:10.1146/annurev-phyto-073009-114450.
Southon, I. W., Bisby, F. A., Buckingham, J., Harborne, J. B., and Zarucchi, J. L. (1994). Phytochemical dictionary of the Leguminosae. First edit. , eds. F. A. Bisby, J. Buckingham, and J. B. Harbome Springer-Science + Business Media, B.V. doi:10.1007/978-1-4899-3047-7.
Taiz, L., Zeiger, E., Møller, I. M., and Murphy, A. S. (2015). Plant physiology and development. Sixth. , eds. L. Taiz, I. M. Møller, A. Murphy, and E. Zeiger Sinauer Associates, Incorporated.
Talhaoui, N., Gómez-Caravaca, A. M., Roldán, C., León, L., De la Rosa, R., Fernández-Gutiérrez, A., et al. (2015). Chemometric analysis for the evaluation of phenolic patterns in olive leaves from six cultivars at different growth stages. J. Agric. Food Chem. 63, 1722–1729. doi:10.1021/jf5058205.
VanEtten, H. D., Mansfield, J. W., Bailey, J. A., and Farmer, E. E. (1994). Two Classes of Plant Antibiotics: Phytoalexins versus “Phytoanticipins.” Plant Cell 6, 1191–1192. doi:10.1105/tpc.6.9.1191.
Veitch, N. C. (2009). Isoflavonoids of the Leguminosae. Nat. Prod. Rep. 26, 776. doi:10.1039/b616809b.
Wink, M. (2003). Evolution of secondary metabolites from an ecological and molecular phylogenetic perspective. Phytochemistry 64, 3–19. doi:10.1016/S0031-9422(03)00300-5.
Wojakowska, A., Kułak, K., Jasiński, M., Kachlicki, P., Stawiński, S., and Stobiecki, M. (2015). Metabolic response of narrow leaf lupine (Lupinus angustifolius) plants to elicitation and infection with Colletotrichum lupini under field conditions. Acta Physiol. Plant. 37, 152. doi:10.1007/s11738-015-1896-6.
Wojakowska, A., Muth, D., Narożna, D., Mądrzak, C., Stobiecki, M., and Kachlicki, P. (2013). Changes of phenolic secondary metabolite profiles in the reaction of narrow leaf lupin (Lupinus angustifolius) plants to infections with Colletotrichum lupini fungus or treatment with its toxin. Metabolomics 9, 575–589. doi:10.1007/s11306-012-0475-8.
Yannai, S. (2012). Dictionay of food compounds with CD-ROM. Second. , ed. S. Yannai Boca Raton, Florida: CRC Press Taylor & Francis Group.
Yogendra, K. N., Kushalappa, A. C., Sarmiento, F., Rodriguez, E., and Mosquera, T. (2015). Metabolomics deciphers quantitative resistance mechanisms in diploid potato clones against late blight. Funct. Plant Biol. 42, 284–298. doi:10.1071/FP14177.


Resultadosy
discusión


Índice resultados y discusión
1. AISLAMIENTOS DE HONGOS EMPLEADOS ............................................ 125
2. ENSAYOS IN VITRO ........................................................................................... 127
3. ENSAYOS IN VIVO.............................................................................................. 132
3.1. Evaluación de la germinación .......................................................................................... 132
3.2. Evaluación a los 45 días tras la siembra........................................................................... 134
4. RESPUESTA DEFENSIVA DE P. VULGARIS FRENTE A TRICHODERMA
Y A R. SOLANI ............................................................................................................. 137
4.1. P. vulgaris frente a R. solani............................................................................................ 138
4.2. P. vulgaris frente a T. harzianum T019 ........................................................................... 140
4.3. P. vulgaris frente a T. velutinum T028 ............................................................................. 142
4.4. P. vulgaris frente a Trichoderma y R. solani ................................................................... 145
5. BIBLIOGRAFÍA .................................................................................................... 150
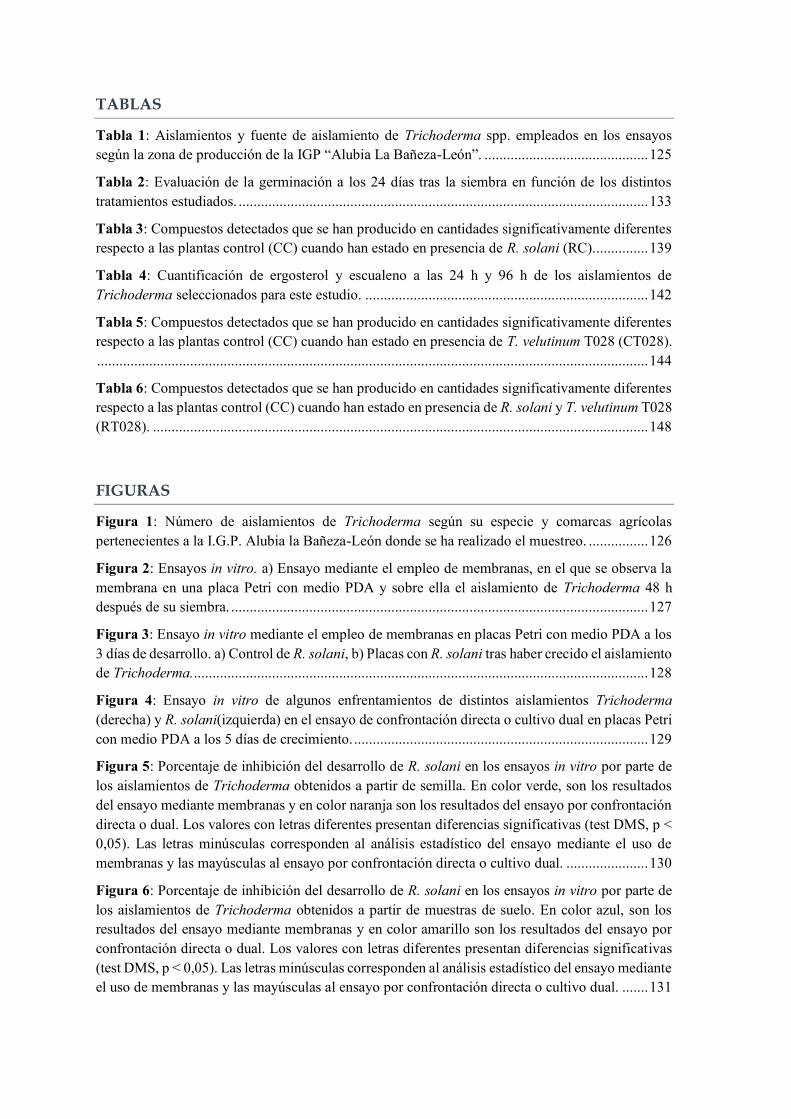
TABLAS
Tabla 1: Aislamientos y fuente de aislamiento de Trichoderma spp. empleados en los ensayos según la zona de producción de la IGP “Alubia La Bañeza-León”. ............................................ 125
Tabla 2: Evaluación de la germinación a los 24 días tras la siembra en función de los distintos tratamientos estudiados. .............................................................................................................. 133
Tabla 3: Compuestos detectados que se han producido en cantidades significativamente diferentes respecto a las plantas control (CC) cuando han estado en presencia de R. solani (RC). .............. 139
Tabla 4: Cuantificación de ergosterol y escualeno a las 24 h y 96 h de los aislamientos de Trichoderma seleccionados para este estudio. ............................................................................ 142
Tabla 5: Compuestos detectados que se han producido en cantidades significativamente diferentes respecto a las plantas control (CC) cuando han estado en presencia de T. velutinum T028 (CT028). .................................................................................................................................................... 144
Tabla 6: Compuestos detectados que se han producido en cantidades significativamente diferentes respecto a las plantas control (CC) cuando han estado en presencia de R. solani y T. velutinum T028 (RT028). ..................................................................................................................................... 148
FIGURAS
Figura 1: Número de aislamientos de Trichoderma según su especie y comarcas agrícolas pertenecientes a la I.G.P. Alubia la Bañeza-León donde se ha realizado el muestreo. ................ 126
Figura 2: Ensayos in vitro. a) Ensayo mediante el empleo de membranas, en el que se observa la membrana en una placa Petri con medio PDA y sobre ella el aislamiento de Trichoderma 48 h después de su siembra. ................................................................................................................ 127
Figura 3: Ensayo in vitro mediante el empleo de membranas en placas Petri con medio PDA a los 3 días de desarrollo. a) Control de R. solani, b) Placas con R. solani tras haber crecido el aislamiento de Trichoderma. .......................................................................................................................... 128
Figura 4: Ensayo in vitro de algunos enfrentamientos de distintos aislamientos Trichoderma (derecha) y R. solani(izquierda) en el ensayo de confrontación directa o cultivo dual en placas Petri con medio PDA a los 5 días de crecimiento. ............................................................................... 129
Figura 5: Porcentaje de inhibición del desarrollo de R. solani en los ensayos in vitro por parte de los aislamientos de Trichoderma obtenidos a partir de semilla. En color verde, son los resultados del ensayo mediante membranas y en color naranja son los resultados del ensayo por confrontación directa o dual. Los valores con letras diferentes presentan diferencias significativas (test DMS, p < 0,05). Las letras minúsculas corresponden al análisis estadístico del ensayo mediante el uso de membranas y las mayúsculas al ensayo por confrontación directa o cultivo dual. ...................... 130
Figura 6: Porcentaje de inhibición del desarrollo de R. solani en los ensayos in vitro por parte de los aislamientos de Trichoderma obtenidos a partir de muestras de suelo. En color azul, son los resultados del ensayo mediante membranas y en color amarillo son los resultados del ensayo por confrontación directa o dual. Los valores con letras diferentes presentan diferencias significativas (test DMS, p < 0,05). Las letras minúsculas corresponden al análisis estadístico del ensayo mediante el uso de membranas y las mayúsculas al ensayo por confrontación directa o cultivo dual. ....... 131

Figura 7: Porcentaje de germinación de las semillas en función de la fuente de extracción de Trichoderma spp., realizada a los 12 días (G12), 17 días (G17) y 24 días (G24) tras la siembra. Los valores con letras diferentes presentan diferencias significativas (test DMS, p < 0,05). [Plantas inoculadas con los aislamientos de Trichoderma de muestras de suelo (SueloCT); plantas inoculadas con los aislamientos de Trichoderma de muestras de suelo y con R. solani (SueloRT); plantas inoculadas con los aislamientos de Trichoderma de muestras de semilla (SemillaCT); plantas inoculadas con los aislamientos de Trichoderma de muestras de semilla y con R. solani (SemillaRT)]. ............................................................................................................................. 132
Figura 8: Evaluación a los 45 días tras la siembra de los aislamientos según su fuente de extracción. Se ha analizado el diámetro del hipocotilo (mm), la longitud de la raíz (cm), los pesos húmedos (g) y secos (g) de la parte aérea y del sistema radicular. Los valores con letras diferentes presentan diferencias significativas (test DMS, p < 0,05). [Plantas inoculadas con los aislamientos de Trichoderma de muestras de suelo (SueloCT); plantas inoculadas con los aislamientos de Trichoderma de muestras de suelo y con R. solani (SueloRT); plantas inoculadas con los aislamientos de Trichoderma de muestras de semilla (SemillaCT); plantas inoculadas con los aislamientos de Trichoderma de muestras de semilla y con R. solani (SemillaRT)] .................. 135
Figura 9: Plantas de alubia a los 45 días tras la siembra. CC, plantas a las cuales no se les ha inoculado ningún hongo. RC, plantas inoculadas con R. solani. CT-# plantas inoculadas con los aislamientos T. harzianum, T019 o T. velutinum, T028. RT-# plantas inoculadas con los aislamientos T. harzianum, T019 o T. velutinum, T028 y R. solani. Ambos aislamientos de Trichoderma han sido los empleados para la realización de los artículos que aparecen en el desarrollo de esta tesis. ............................................................................................................... 136
Figura 10: Comparación de la expresión de los genes CH5b, CH1, PR1, PR2, PR3, PR4 y PAL en plantas que han sido inoculadas con R. solani (RC) frente a plantas control (CC) en comparación con los genes de referencia α-actin y EF1α. La comparación y el análisis estadístico han sido realizados con el programa REST2009® (Pfaffl et al., 2002). Aquellos datos numéricos que presentan diferencias estadísticas (p < 0,05) están indicados con un asterisco en la tabla y rodeados en el gráfico. ............................................................................................................................... 138
Figura 11: Comparación de la expresión de los genes WRKY33, PR1, PR2, PR3, PR4, ERF1, ERF5, CH5b, PAL1, OSM34, CNGC2, HPL, GTSa y hGS en plantas que han sido inoculadas con R. solani (RC) frente a plantas control (CC) en comparación con el gen de referencia Act11. Los datos han sido analizados por el método 2-ΔΔCt. Aquellos datos numéricos que presentan diferencias estadísticas (p < 0,05) están indicados con un asterisco.............................................................. 139
Figura 12: Comparación de la expresión de los genes CH5b, CH1, PR1, PR2, PR3, PR4 y PAL en plantas que han sido inoculadas con T. harzianum T019 (CT019) frente a plantas control (CC) en comparación con los genes de referencia α-actin y EF1α. La comparación y el análisis estadístico han sido realizados con el programa REST2009® (Pfaffl et al., 2002). Aquellos datos numéricos que presentan diferencias estadísticas (p < 0,05) están indicados con un asterisco en la tabla y rodeados en el gráfico. ................................................................................................................ 141
Figura 13: Comparación de la expresión de los genes WRKY33, PR1, PR2, PR3, PR4, ERF1, ERF5, CH5b, PAL1, OSM34, CNGC2, HPL, GTSa y hGS en plantas que han sido inoculadas con T. velutinum, T028 (CT028) frente a plantas control (CC) en comparación con el gen de referencia Act11. Los datos han sido analizados por el método 2-ΔΔCt. Aquellos datos numéricos que presentan diferencias estadísticas (p < 0,05) están indicados con un asterisco. .......................................... 143

Figura 14: Comparación de la expresión de los genes CH5b, CH1, PR1, PR2, PR3, PR4 y PAL en plantas que han sido inoculadas con R. solani y con T. harzianum, T019 (RT019) frente a plantas control de R. solani (RC) en comparación con los genes de referencia α-actina y EF1α. La comparación y el análisis estadístico han sido realizados con el programa REST2009 ® (Pfaffl et al., 2002). Aquellos datos numéricos que presentan diferencias estadísticas (p < 0,05) están indicados con un asterisco en la tabla y rodeados en el gráfico. .................................................. 146
Figura 15: Comparación de la expresión de los genes WRKY33, PR1, PR2, PR3, PR4, ERF1, ERF5, CH5b, PAL1, OSM34, CNGC2, HPL, GTSa y hGS en plantas que han sido inoculadas con R. solani y T. velutinum, T028 (RT028) frente a plantas control (CC) en comparación con el gen de referencia Act11. Los datos han sido analizados por el método 2-ΔΔCt. Aquellos datos numéricos que presentan diferencias estadísticas (p < 0,05) están indicados con un asterisco. ........................................... 146
Figura 16: Comparación de la expresión de los genes WRKY33, PR1, PR2, PR3, PR4, ERF1, ERF5, CH5b, PAL1, OSM34, CNGC2, HPL, GTSa y hGS en plantas que han sido inoculadas con R. solani y T. velutinum, T028 (RT028) frente a control de R. solani (RC) en comparación con el gen de referencia Act11. Los datos han sido analizados por el método 2-ΔΔCt. Aquellos datos numéricos que presentan diferencias estadísticas (p < 0,05) están indicados con un asterisco. ........................... 147

125
Resultados y Discusión Generales
1. AISLAMIENTOS DE HONGOS EMPLEADOS
Todos los ensayos realizados en el desarrollo de esta tesis se han llevado a cabo con aislamientos obtenidos de muestras vegetales de alubia y de muestras de suelo tomadas de parcelas en las que dicho cultivo formaba parte de la rotación de la parcela. En total se ha trabajado con un aislamiento de R. solani, R43, y con 60 aislamientos de Trichoderma (Tabla 1 y Anexos Tabla A.1).
Tabla 1: Aislamientos y fuente de aislamiento de Trichoderma spp. empleados en los ensayos según la zona de producción de la IGP “Alubia La Bañeza-León”.
Especie Aislamiento Especie Aislamiento Maragatería - Cepeda
Semilla Suelo T. longibrachiatum T005 T. velutinum T027; T028; T029 T. harzianum T007; T012 T. viridescens T030 T. atroviride T013 T. koningiopsis T031 T. harzianum T019
Esla - Campos Semilla Suelo T. citrinoviride T008 T. harzianum T044; T045 T. harzianum T022 T. spirale T048 Trichoderma sp. T023 T. virens T043; T046; T047
La Bañeza Semilla Suelo T. gamsii T004 T. harzianum T033; T034; T035 T. harzianum T020 T. velutinum T036; T037 Trichoderma sp. T006 T. virens T032
Páramo Semilla Suelo T. harzianum T001; T002; T003; T010;
T011; T015; T016; T018; T021
T. brevicompactum T054
T. koningiopsis T009 T. gamsii T057 T. virens T014 T. hamatum T056 Trichoderma sp. T017 T. harzianum T050; T052; T055; T058;
T059; T060; T061 T. velutinum T051 T. virens T049; T053
La Cabrera Laboratorio Suelo T. atroviride T024 T. gamsii T042 T. virens T025 T. koningiopsis T040 T. virens T039 T. viridescens T038; T041

Resultados y Discusión Generales
126
De los aislamientos muestreados, tras su identificación mediante la amplificación por PCR de las regiones adyacentes al gen que codifica el rRNA 5,8S con los cebadores ITS1, ITS4 e ITS5 , se han obtenido 12 especies diferentes distribuidas en las siguientes comarcas de la I.G.P. Alubia de la Bañeza-León: Maragatería-Cepeda, Esla-Campos, La Bañeza, La Cabrera y el Páramo (Tabla 1 y Figura 1).
Se ha observado que la especie más abundante ha sido T. harzianum, que estaba presente en todas las comarcas, excepto en la Cabrera, obteniéndose 26 aislamientos (Tabla 1 y Figura 1). El Páramo ha sido donde se han obtenido el mayor número de aislamientos de dicha especie. T. virens ha sido la segunda especie más abundante, siendo 8 aislamientos en las comarcas de Esla-Campos, la Bañeza, La Cabrera y el Páramo (Tabla 1 y Figura 1 ). Ambas especies son las más empleadas en el control biológico de fitopatógenos como Uromyces appendiculatus, (Burmeister y Hau, 2009), R. solani, Fusarium oxysporum o Verticillium dahliae, Pythium spp. (Hanson y Howell, 2004;Larkin, 2016; Vinale et al., 2009).
T. atroviride sólo ha sido obtenido en la zona productiva de la Maragatería-Cepeda, mientras queel único aislamiento de T. citrinoviride ha sido aislado en la zona de Esla-Campos. T. gamsii hasido extraído en La Bañeza, La Cabrera y el Páramo. T. hamatum y T. brevicompactum han sidosolamente aislados en el Páramo y T. koningiopsis lo ha sido de la zona de la Maragatería-Cepeda.T. spirale ha sido obtenido en la zona de Esla-Campos y T. velutinum en Maragatería-Cepeda y elPáramo. T. viridescens ha sido aislado en la Maragatería-Cepeda, La Bañeza y La Cabrera (Tabla1 y Figura 1).
T. citrinoviride
1
T. harzianum
3
T. spirale
1
T. virens
3
T. brevicompactum
1T. gamsii
1
T. hamatum
1
T. harzianum
16
T. koningiopsis
1
T. velutinum
1
T. virens
3T. atroviride
1
T. harzianum
3
T. koningiopsis
1
T. longibrachiatum
1
T. velutinum
3
T. viridescens
1
T. gamsii
1
T. harzianum
4
T. velutinum
2
T. virens
1
T. gamsii
1
T. koningiopsis
1
T. virens
1
T. viridescens
2
Figura 1: Número de aislamientos de Trichoderma según su especie y comarcas agrícolas pertenecientes a la I.G.P. Alubia la Bañeza-León donde se ha realizado el muestreo.
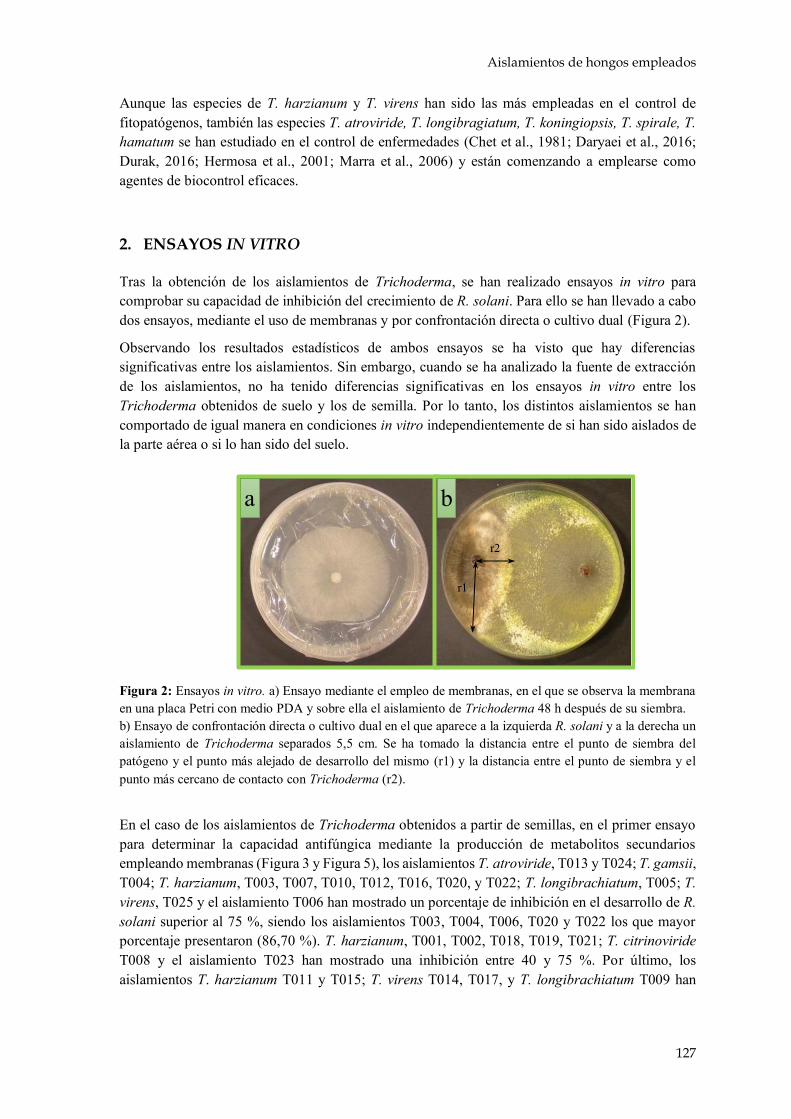
Aislamientos de hongos empleados
127
Aunque las especies de T. harzianum y T. virens han sido las más empleadas en el control de fitopatógenos, también las especies T. atroviride, T. longibragiatum, T. koningiopsis, T. spirale, T. hamatum se han estudiado en el control de enfermedades (Chet et al., 1981; Daryaei et al., 2016; Durak, 2016; Hermosa et al., 2001; Marra et al., 2006) y están comenzando a emplearse como agentes de biocontrol eficaces.
2. ENSAYOS IN VITRO
Tras la obtención de los aislamientos de Trichoderma, se han realizado ensayos in vitro para comprobar su capacidad de inhibición del crecimiento de R. solani. Para ello se han llevado a cabo dos ensayos, mediante el uso de membranas y por confrontación directa o cultivo dual (Figura 2).
Observando los resultados estadísticos de ambos ensayos se ha visto que hay diferencias significativas entre los aislamientos. Sin embargo, cuando se ha analizado la fuente de extracción de los aislamientos, no ha tenido diferencias significativas en los ensayos in vitro entre los Trichoderma obtenidos de suelo y los de semilla. Por lo tanto, los distintos aislamientos se han comportado de igual manera en condiciones in vitro independientemente de si han sido aislados de la parte aérea o si lo han sido del suelo.
En el caso de los aislamientos de Trichoderma obtenidos a partir de semillas, en el primer ensayo para determinar la capacidad antifúngica mediante la producción de metabolitos secundarios empleando membranas (Figura 3 y Figura 5), los aislamientos T. atroviride, T013 y T024; T. gamsii, T004; T. harzianum, T003, T007, T010, T012, T016, T020, y T022; T. longibrachiatum, T005; T. virens, T025 y el aislamiento T006 han mostrado un porcentaje de inhibición en el desarrollo de R. solani superior al 75 %, siendo los aislamientos T003, T004, T006, T020 y T022 los que mayor porcentaje presentaron (86,70 %). T. harzianum, T001, T002, T018, T019, T021; T. citrinoviride T008 y el aislamiento T023 han mostrado una inhibición entre 40 y 75 %. Por último, los aislamientos T. harzianum T011 y T015; T. virens T014, T017, y T. longibrachiatum T009 han
r2
r1
a b
Figura 2: Ensayos in vitro. a) Ensayo mediante el empleo de membranas, en el que se observa la membrana en una placa Petri con medio PDA y sobre ella el aislamiento de Trichoderma 48 h después de su siembra. b) Ensayo de confrontación directa o cultivo dual en el que aparece a la izquierda R. solani y a la derecha un aislamiento de Trichoderma separados 5,5 cm. Se ha tomado la distancia entre el punto de siembra del patógeno y el punto más alejado de desarrollo del mismo (r1) y la distancia entre el punto de siembra y el punto más cercano de contacto con Trichoderma (r2).

Resultados y Discusión Generales
128
mostrado un porcentaje inferior al 40 %, siendo T009 el que menor porcentaje ha presentado (15,82%).
En el caso del ensayo de cultivo dual o confrontación directa (Figura 5), el aislamiento T. harzianum T021 ha sido el que mayor porcentaje de inhibición ha presentado (72,77 %) y T. koningiopsis T009 (14,63 %) el que menor. Los porcentajes de inhibición del resto de aislamientos han oscilado entre 47,13 y 30,55%.
En cuanto a los aislamientos obtenidos a partir de muestras de suelo (Figura 6), en el ensayo mediante el empleo de membranas los aislamientos T. koningiopsis, T040; T. virens, T043, T046, T047, T049, y T053; T. brevicompactum, T054; T. harzianum, T044, T050 y T055; T. gamsii, T042 y T057; T. viridescens T030 y T041 y T. hamatum T056 han mostrado porcentajes de inhibición entre 86 y 75 %, siendo T040 y T049 los que mayor porcentaje alcanzaron, 86,00 y 85,45% respectivamente. Los aislamientos que han tenido una inhibición entre 75 y 50 % han sido T. virens T032; T. velutinum T028, T029, T036, T037 y T051; T. viridescens T038; T. harzianum, T034, T035, T045, T052, T059, T060 y T061 y T. koningiopsis T031, siendo T032 con un valor de 73,91 % de inhibición el aislamiento que mayor porcentaje en este rango y T031 con 52,67 % el menor. Los tres aislamientos que han mostrado un porcentaje de inhibición inferior a 20 % han sido T. velutinum T027 con 14,57 % y T. harzianum T058 y T033 con 9,00 y -5,01 % respectivamente. El signo negativo del último valor indica que este aislamiento ha favorecido el desarrollo de R. solani respecto al control.
En el caso del ensayo por confrontación directa (Figura 4 y Figura 6), la mayoría de los aislamientos han presentado un porcentaje de inhibición entre 50 y 40 %. Los aislamientos T034, T035, T058 y T059, todos ellos pertenecientes a T. harzianum han tenido valores inferiores a 40 %, llegando hasta el 29,29 % del aislamiento T035.
La mayoría de los aislamientos empleados en los ensayos in vitro han obtenido unos porcentajes de inhibición del desarrollo de R. solani lo suficientemente elevados como para frenar completamente su desarrollo, bien sea por la producción de metabolitos secundarios con actividad antibiótica, o bien por la confrontación directa con Trichoderma (micoparasitismo y competición). Por ejemplo, no todos los aislamientos de la especie T. harzianum han sido capaces de impedir el desarrollo de R. solani, lo mismo que en el resto de especies. Las diferencias observadas en los diferentes ensayosin vitro podrían deberse al genotipo, diferencias de desarrollo, esporulación, interacciones con elmedio y los distintos modos de acción en el control del fitopatógeno (Ruano-Rosa et al., 2010).
a b b
Figura 3: Ensayo in vitro mediante el empleo de membranas en placas Petri con medio PDA a los 3 días de desarrollo. a) Control de R. solani, b) Placas con R. solani tras haber crecido el aislamiento de Trichoderma.

Ensayos in vitro
129
Existen trabajos en los que se ha evaluado la capacidad inhibidora de Trichoderma frente a R. solani. En los trabajos utilizando los aislamientos T. virens T59 (NBT59) y T. atroviride T11 (IMI352941) llevados a cabo por Campelo et al. (2010) el porcentaje de inhibición de este patógeno en los ensayos mediante el empleo de membranas osciló entre el 100 % y el 85,70% respectivamente.
La actividad antagonista in vitro de los aislados de Trichoderma podría ser un indicativo de la capacidad biológica in vivo frente a hongos fitopatógenos. Sin embargo se ha comprobado que no siempre existe tal correlación entre los resultados en condiciones in vitro con los llevado a cabo in vivo ya que en este último entran en juego otros factores que pueden interactuar y variar la actividad antibiótica (Anees et al., 2010).
a b c
Figura 4: Ensayo in vitro de algunos enfrentamientos de distintos aislamientos Trichoderma (derecha) y R. solani(izquierda) en el ensayo de confrontación directa o cultivo dual en placas Petri con medio PDA a los 5 días de crecimiento.

Resu
ltado
s y D
iscusió
n G
enerales
130
a
b
bcd
a
ef
cde
a
b bc
j
a
hi
a
f
bc
a
de
f
a
k
b
hi
a
a
i
g
CDE B
IJK
BC
BCD
HIJ N
HIJK
KJL
CDEF
HIJ
LM
FG
HIJ
DEFG
HI
HIJK
GH
IJ A
HIJ O KL
CD
EF
G M
HIJK
EF
GH
IJ
CDEFG
H
0,00
10,00
20,00
30,00
40,00
50,00
60,00
70,00
80,00
90,00
100,00
Porc
enta
nje
de i
nhib
ició
n (%
)
Membrana Dual
Figura 5: Porcentaje de inhibición del desarrollo de R. solani en los ensayos in vitro por parte de los aislamientos de Trichoderma obtenidos a partir de semilla. En color verde, son los resultados del ensayo mediante membranas y en color naranja son los resultados del ensayo por confrontación directa o dual. Los valores con letras diferentes presentan diferencias significativas (test DMS, p < 0,05). Las letras minúsculas corresponden al análisis estadístico del ensayo mediante el uso de membranas y las mayúsculas al ensayo por confrontación directa o cultivo dual.

En
sayo
s in vitro
131
ab
ab
c
ab
cde
o
efg
h
fgh
ij
cde
hij
ab
c
efg
h
ab
n
m
klm lm m
a
gh
ij
n
ijk
efg
h ef fg
hi
jkl
ef
ab
cd
ab
cd
ab
cd
bcd
e
ab
de
ab
c
efg
ab
cd
ab
AB
CD
E
EF
GH
AB
C
DE
FG
H HI I
AB
CD
EF
AB
CD
EF
BC
DE
FG
BC
DE
FG
AB
C
GH
FG
H
AB
CD
E
AB
CD
E
AB
CD
EF
AB
CD
EF
G A
AB
CD
EF
AB
CD
E
AB
AB
CD
AB
C
AB
CD
E
AB
CD
EF
G
AB
C
AB
CD
E
AB
CD
AB
CD
E
AB
CD
E
AB
CD
E
AB
CD
EF
G
AB
CD
EF
G
CD
EF
G
DE
FG
H
-10,00
0,00
10,00
20,00
30,00
40,00
50,00
60,00
70,00
80,00
90,00
100,00
Porc
enta
nje
de i
nhib
ició
n (%
)
Membrana Dual
Figura 6: Porcentaje de inhibición del desarrollo de R. solani en los ensayos in vitro por parte de los aislamientos de Trichoderma obtenidos a partir de muestras de suelo. En color azul, son los resultados del ensayo mediante membranas y en color amarillo son los resultados del ensayo por confrontación directa o dual. Los valores con letras diferentes presentan diferencias significativas (test DMS, p < 0,05). Las letras minúsculas corresponden al análisis estadístico del ensayo mediante el uso de membranas y las mayúsculas al ensayo por confrontación directa o cultivo dual.

Resultados y Discusión Generales
132
3. ENSAYOS IN VIVO
Tras los ensayos in vitro, se han probado 45 aislamientos de Trichoderma spp. que han tenido un porcentaje de inhibición en ensayo de membranas superior al 40 %, en cultivo dual superior al 30 % y que esporulaban en medio PDA. De esos aislamientos, 15 han sido extraídos de semilla y 30 han sido obtenidos de muestras de suelo.
Para la realización de los ensayos in vivo se ha seleccionado, la variedad de alubia “Canela” perteneciente a la IGP “Alubia de la Bañeza-León”. Aunque en esta marca de calidad se producen otras variedades locales como “Riñón”, “Plancheta” o “Pinta”, se ha elegido la variedad “Canela” por su elevada sensibilidad a R. solani.
3.1. Evaluación de la germinación
Analizando la germinación según la fuente de extracción de los aislamientos de Trichoderma, se ha observado que existen diferencias significativas entre los que proceden de semilla y los que proceden de suelo tanto en la geminación como en el desarrollo de las plantas evaluadas a los 45 días tras la siembra.
En el caso de la germinación (Figura 7), se ha comprobado que aquellas alubias que han sido pildoradas con esporas de los aislamientos extraídos de muestras de suelos (SueloCT y SueloRT)
a aa
b bb
cc c
dd d
0,00
10,00
20,00
30,00
40,00
50,00
60,00
70,00
80,00
90,00
100,00
G12 G17 G24
Germ
inac
ión
(%)
SueloCT SueloRT SemillaCT SemillaRT
Figura 7: Porcentaje de germinación de las semillas en función de la fuente de extracción de Trichoderma spp., realizada a los 12 días (G12), 17 días (G17) y 24 días (G24) tras la siembra. Los valores con letras diferentes presentan diferencias significativas (test DMS, p < 0,05). [Plantas inoculadas con los aislamientos de Trichoderma de muestras de suelo (SueloCT); plantas inoculadas con los aislamientos de Trichoderma de muestras de suelo y con R. solani (SueloRT); plantas inoculadas con los aislamientos de Trichoderma de muestras de semilla (SemillaCT); plantas inoculadas con los aislamientos de Trichoderma de muestras de semilla y con R. solani (SemillaRT)].

Ensayos in vivo
133
tuvieron un mayor número de semillas por maceta germinadas que aquellas que han sido recubiertas con esporas de Trichoderma aislados de semillas (SemillaCT y SemillaRT).
Se ha visto que estando presente el patógeno (RT), ha disminuido la germinación en ambos casos en los que se encuentra R. solani en el sustrato (SueloRT y SemillaRT) pero siendo más acusada cuando las semillas han sido pildoradas con Trichoderma aislado de semillas.
Posteriormente se ha analizado la germinación a los 24 días, momento en el que se ha considerado que la germinación de todas las semillas ha terminado teniendo en cuenta que la germinación en esta variedad local se produce entre los 7 y 14 días tras la siembra.
Tabla 2: Evaluación de la germinación a los 24 días tras la siembra en función de los distintos tratamientos estudiados.
G24 (%)(1) Origen(2) Tratamientos(3)
100,00 Semilla -- Suelo CT028; CT037; CT038; CT040; CT041
RT036 99,99-90,00 Semilla --
Suelo CT035; CT036; CT056; CT058; CT059; CT061; CT032; CT054; CT039; CT045; CT050; CT053; CT031;
RT028; RT041; RT038; RT040; RT061; RT035; RT058; RT037; RT050; RT057; RT059; RT060; RT039;
89,99-80,00 Control CC Semilla -- Suelo CT029; CT030; CT046; CT048; CT060; CT047; CT057; CT044;
CT043 RT044; RT048; RT054; RT056; RT030; RT053; RT043; RT029;
RT034; RT043; RT046; RT055 79,99-60,00 Control RC
Semilla CT004; CT012; CT019; CT002 RT008
Suelo CT033; CT034; CT055 RT047; RT031; RT045; RT032; RT033
59,99-40,00 Semilla CT008; CT007; CT005; CT013; CT025; CT001; CT003; CT006; CT015; CT024; CT011
RT001; RT013; RT005; RT006 Suelo --
39,99-20,00 Semilla RT002; RT004; RT019; RT003; RT012; RT007 Suelo --
<20,00 Semilla RT015; RT011; RT025; RT024 Suelo --
(1) Porcentaje de germinación obtenido a los 24 días tras la siembra
(2) Origen de los aislamientos estudiados, bien de semilla o bien de suelo. El control está representado por aquellas semillas en las que no se ha inoculado ningún hongo (CC) o bien sólo R. solani (RC).
(3) Los tratamientos están ordenados de mayor a menor porcentaje de semillas germinadas por maceta y separados si han sido inoculados sólo con el aislamiento correspondiente de Trichoderma (CT-#) o si han sido inoculado tanto con el aislamiento de Trichoderma como con R. solani (RT-#).
Resultados y Discusión Generales
134
Se ha determinado que la mayor germinación se ha dado en los tratamientos con Trichoderma extraído de muestras de suelo (Tabla 2 y Anexos Tabla A.2). Los tratamientos en los que germinaron el 100,00 % de las semillas han sido CT028, CT037, CT038, CT040, CT041 y RT036. El resto de los tratamientos con aislamientos de Trichoderma obtenidos de suelo, han tenido una germinación hasta del 70,00 %, mientras que los de Trichoderma extraídos de semilla han sido inferiores, incluso en algunos casos inferiores al tratamiento del control del patógeno (RC), como son el caso de CT008, CT007, CT005, CT013, CT025, CT001, CT003, CT006, CT015, CT024, CT011, RT001, RT013, RT005, RT006, RT002, RT004, RT019, RT003, RT012, RT007, RT015, RT011, RT025 y RT024.
3.2. Evaluación a los 45 días tras la siembra
Para la evaluación de las plantas a los 45 días tras la siembra, se han tenido en cuenta los parámetros de diámetro del hipocotilo, la longitud del sistema radicular, los pesos húmedos y secos tanto de la parte aérea como del sistema radicular. Al tratarse de hongos que se desarrollan en contacto directo con las raíces y el hipocotilo de la planta se ha considerado importante la toma de datos tanto del diámetro del hipocotilo como de la longitud del sistema radicular, sin dejar de lado los pesos que han alcanzado ambas zonas ya que están íntimamente relacionados con la producción. Al igual que en el apartado anterior, se ha realizado un análisis estadístico de los parámetros de estudio teniendo en cuenta la fuente de extracción de los aislamientos, viéndose que en todas las variables hay diferencias significativas (Figura 8).
En el caso de aquellas plantas inoculadas con aislamientos de Trichoderma extraídos de suelo (SueloCT y SueloRT), han presentado un mayor desarrollo en todos los parámetros de estudio siendo significativamente diferentes de aquellas que habían sido inoculadas con Trichoderma aislados a partir de semilla (SemillaCT y SemillaRT). La presencia del patógeno también ha reducido el desarrollo de las plantas. Sin embargo, aquellas plantas donde se han empleado los Trichoderma de suelo (SueloRT), su desarrollo ha sido significativamente superior a las plantas tratadas con Trichoderma procedente de semilla (SemillaRT) (Figura 8).
Hasta ahora no se ha publicado la influencia de la fuente de extracción de los aislados de Trichoderma. Se ha observado que aquellos aislamientos que han sido aislados a partir de semilla han protegido de forma menos efectiva a la planta frente a R. solani que aquellos que han sido obtenidos a partir de muestras de suelo de campos en los que la alubia formaba parte de la rotación. Los aislamientos extraídos de semilla tampoco han incrementado el desarrollo de la alubia, a excepción del aislamiento T. harzianum T019, como sí lo han hecho aquellos extraídos de suelo.

Ensayos in vivo
135
ab
c
d
1,00
1,50
2,00
2,50
3,00
3,50
4,00
SueloCT SueloRT SemillaCT SemillaRT
Diá
met
ro (m
m)
Diámetro del hipocotilo
ab
c
d
6,00
8,00
10,00
12,00
14,00
16,00
18,00
SueloCT SueloRT SemillaCT SemillaRT
Long
itud
(cm
)
Longitud del sistema radicular
ab
c
d
2,00
4,00
6,00
8,00
10,00
12,00
14,00
SueloCT SueloRT SemillaCT SemillaRT
Peso
húm
edo
(g)
Peso húmedo de la parte aérea
a
b
c
d
0,20
0,40
0,60
0,80
1,00
1,20
1,40
1,60
1,80
2,00
2,20
SueloCT SueloRT SemillaCT SemillaRT
Peso
seco
(g)
Peso seco de la parte aérea
a
b
c
d
0,60
0,80
1,00
1,20
1,40
1,60
1,80
2,00
SueloCT SueloRT SemillaCT SemillaRT
Peso
húm
edo
(g)
Peso húmedo del sistema radicular
a
a
b
c
0,06
0,08
0,10
0,12
0,14
0,16
0,18
0,20
SueloCT SueloRT SemillaCT SemillaRT
Peso
seco
(g)
Peso seco del sistema radicular
Figura 8: Evaluación a los 45 días tras la siembra de los aislamientos según su fuente de extracción. Se ha analizado el diámetro del hipocotilo (mm), la longitud de la raíz (cm), los pesos húmedos (g) y secos (g) de la parte aérea y del sistema radicular. Los valores con letras diferentes presentan diferencias significativas (test DMS, p < 0,05). [Plantas inoculadas con los aislamientos de Trichoderma de muestras de suelo (SueloCT); plantas inoculadas con los aislamientos de Trichoderma de muestras de suelo y con R. solani (SueloRT); plantas inoculadas con los aislamientos de Trichoderma de muestras de semilla (SemillaCT); plantas inoculadas con los aislamientos de Trichoderma de muestras de semilla y con R. solani (SemillaRT)]

Resultados y Discusión Generales
136
La alubia, desde su domesticación, ha sido afectada por diferentes factores bióticos y abióticos. Con el paso del tiempo tanto el cultivo como todos los microorganismos asociados a él han coevolucionado, adaptándose a los cambios ambientales. Por ello, para la realización de los ensayos se ha seleccionado tanto el material vegetal (variedad local Canela) como el material fúngico (aislamientos del R. solani y Trichoderma spp.) extraídos de la zona donde se produce alubia bajo el sello de calidad I.G.P. “Alubia de La Bañeza-León”. La evolución que han sufrido todas las partes ha sido para la adaptación a ese ambiente y sus cambios. Cualquier adaptación que haya sufrido el patógeno para poder “dañar” a la alubia también la habrá sufrido el agente de biocontrol, haciéndolo más eficiente para el control de la enfermedad, así como para su relación con la planta. Tanto R. solani como los aislamientos de Trichoderma spp. obtenidos del suelo han estado desarrollándose y evolucionando conjuntamente en él, adaptándose a los factores bióticos y abióticos a los que se hayan visto sometidos. Sin embargo, aquellos Trichoderma que han sido obtenidos a partir de muestras de semilla, en su coevolución, podrían haber desarrollado menor capacidad para el control de fitopatógenos del suelo. Por ello se podría decir que es más importante la selección de la parcela de cultivo que una selección de la semilla ya que es mucho más eficaz para el control de fitopatógenos de suelo la presencia de Trichoderma en el propio suelo que el que pudiera tener la semilla.
Para la realización del resto de análisis presentados en esta tesis (Anexos Tablas A.3, A.4, A.5) se han seleccionado un aislamiento de Trichoderma obtenido a partir de semilla, T. harzianum T019, y otro extraído a partir de muestra de suelo, T. velutinum T028 (Figura 9). Para el estudio de respuesta de los genes de defensa de alubia se han empleado ambos aislamientos. Sin embargo, para el resto de los análisis sólo se ha empleado el aislamiento T. velutinum T028 ya que hasta el momento de la realización de los ensayos de respuesta defensiva, tanto genética como
CC RC CT019 RT019 RT028CT028
Figura 9: Plantas de alubia a los 45 días tras la siembra. CC, plantas a las cuales no se les ha inoculado ningún hongo. RC, plantas inoculadas con R. solani. CT-# plantas inoculadas con los aislamientos T. harzianum, T019 o T. velutinum, T028. RT-# plantas inoculadas con los aislamientos T. harzianum, T019 o T. velutinum, T028 y R. solani. Ambos aislamientos de Trichoderma han sido los empleados para la realización de los artículos que aparecen en el desarrollo de esta tesis.
Ensayos in vivo
137
metabolómica, ha sido el que mejor resultado ha mostrado en los ensayos in vivo tanto en la germinación como en la evaluación a los 45 días tras la siembra (Anexos Tabla A.2, A.3, A.4, A.5).
En el caso de T. harzianum T019 (Figura 9), cuando las plantas han sido tratadas sólo con el aislamiento (CT019) han tenido el mayor peso de la parte aérea (incremento del 63,84 % del peso húmedo y 54,11 % del seco respecto al control), siendo significativamente diferente de las plantas control (CC). En el caso del sistema radicular, se ha incrementado un 96,95 % en peso húmedo, pero se ha reducido un 20,00 % en el peso seco respecto a las plantas control. Cuando las plantas de alubia han estado en presencia de R. solani y T019 (RT019) tampoco han presentado diferencias significativas respecto al control (CC) en la parte aérea ni respecto al control del patógeno (RC) en el caso del sistema radicular (Mayo et al., 2015). Sin embargo, en este tratamiento, RT019, se ha reducido un 6,82 % y un 5,80 % el peso húmedo y seco de la parte aérea respectivamente y en el sistema radicular se ha disminuido el peso húmedo en 25,61 % y el seco en 33,33 %, todo ello respecto al control (CC).
En cuanto a T. velutinum T028 (Figura 9), las plantas inoculadas con este aislamiento (CT028 y RT028) han mostrado un incremento significativo del peso tanto seco como húmedo de la parte aérea como del sistema radicular, incluso cuando ha estado presente R. solani. Las plantas tratadas con T028 (CT028) han incrementado un 4,75 % el diámetro del hipocotilo, un 10,75 % la longitud del sistema radicular, y un 4,27 % y 5,51 % del peso seco de la parte aérea y del sistema radicular respectivamente, en todos los casos respecto a las plantas control (CC). Cuando han sido infectadas con R. solani (RT028), la acción de T. velutinum ha provocado un incremento respecto a las plantas control del patógeno (RC) de 8,76 % en el diámetro del hipocotilo, un 21,15 % de la longitud del sistema radicular y un 11,05 y 3,43 % del peso seco de la parte aérea y del sistema radicular respectivamente (Mayo et al., 2016).
4. RESPUESTA DEFENSIVA DE P. VULGARIS FRENTE A TRICHODERMA Y
A R. SOLANI
Las plantas desarrollan diversas estrategias para su defensa frente a la interacción con un organismo que puede ser patógeno o no. Las plantas pueden presentar diferentes respuestas (inducida, adquirida, hipersensibilidad) (Lodha y Basak, 2012) con mecanismos que varían según se encuentre frente a un microrganismo patógeno o uno no patógeno. El primero es la respuesta SAR (Systemic Adquired Response) que normalmente se debe a una infección local causada por un organismo patógeno involucrando señales dependientes del ácido salicílico (Durrant y Dong, 2004). La otra respuesta se conoce como ISR (Induced Systemic Response) que se produce como resultado de la colonización de la planta por parte de un microorganismo no patógeno desencadenado señales dependientes del etileno y del ácido jasmónico (Shoresh et al., 2010). La combinación de ambas respuestas pueden proteger a la planta frente al ataque de microorganismos (Verhagen et al., 2006). Otra respuesta que tiene la planta para defenderse de otros microorganismos es la hipersensibilidad (Tadeo y Gómez-Cadenas, 2008), lo que conlleva cambios en la permeabilidad de las membranas celulares, en la respiración y en la producción de metabolitos como fitoalexinas.

Resultados y Discusión Generales
138
4.1. P. vulgaris frente a R. solani
a) Expresión de genes de defensa
El estudio de la expresión de los genes de defensa se ha realizado en dos ensayos en los que se ha inoculado el mismo aislamiento de R. solani (Anexos Tabla A.1). Sin embargo, a la hora de interpretarlos se han empleado dos métodos diferentes. En uno de ellos, los datos han sido analizados mediante el programa REST2009® (Pfaffl et al., 2002) y tomando como genes de referencia actina y EF1α (Mayo et al., 2015). En el otro caso se han estudiado los resultados mediante el método 2-ΔΔCt y tomando como gen de referencia Act11 (Mayo et al., 2016) ya que se ha estudiado la incorporación de otros genes de referencia como UKN1 y EF1α, pero se ha comprobado que Act11 ha sido el más estable.
R. solani ha provocado una regulación negativa de varios genes de defensa siendo significativa enlos genes CH1, PR2, PR3, PR4, ERF1, ERF5, PAL, PAL1, HPL y GTSa respecto a las plantascontrol (Figura 10 y Figura 11). Los genes PR1 y CH5b, en el análisis con el programa REST2009,han presentado una regulación negativa significativa respecto al control (Figura 10). En el caso delresto de los genes, OSM34, CNGC2 y hGS han sufrido una regulación positiva pero no ha sidoestadísticamente significativa (Figura 11).
R. solani durante 45 días en contacto con la planta ha causado la regulación negativa de la mayoríade los genes de defensa estudiados como un mecanismo para poder superar las barreras defensivasde la alubia y así poder invadirla y facilitar el proceso infeccioso en el interior de la misma (Mayoet al., 2015). En otros trabajos se ha observado un resultado similar, donde plantas de tomateinfectadas por Pseudomonas siringe pv. tomato presentaron los genes PR1 y PR4 reprimidos,indicando un descenso de los mecanismos de defensa de la planta (Zhao et al., 2003).
Gen Ratio p(H1)
CH5b 0,168* 0,029
CH1 0,397* 0,045
PR1 0,364* 0,038
PR2 0,099* 0,029
PR3 0,122* 0,000
PR4 0,127* 0,000
PAL 0,256* 0,000
Rat
io d
e ex
pres
ión
Gen
RC vs CC
Figura 10: Comparación de la expresión de los genes CH5b, CH1, PR1, PR2, PR3, PR4 y PAL en plantas que han sido inoculadas con R. solani (RC) frente a plantas control (CC) en comparación con los genes de referencia α-actin y EF1α. La comparación y el análisis estadístico han sido realizados con el programa REST2009® (Pfaffl et al., 2002). Aquellos datos numéricos que presentan diferencias estadísticas (p < 0,05) están indicados con un asterisco en la tabla y rodeados en el gráfico.

Respuesta defensiva de P. vulgaris frente a Trichoderma y a R. solani
139
b) Producción de metabolitos
La mayoría de los metabolitos significativamente diferentes que ha producido la alubia infectada con R. solani han descendido respecto a las plantas control (Tabla 3). Se considera que estos compuestos al actuar como fitoalexinas (Ahuja et al., 2012), reducen su producción en presencia de R. solani con lo que disminuye la respuesta defensiva de la planta, favoreciendo así la invasión de la planta por parte del patógeno.
Los únicos compuestos que han aumentado su producción han sido un carbohidrato (#2, C12H22O11, sacarosa), un glicósido (#4, C12H18O11, ácido L-ascórbico-2-glucósido), y un terpeno (#17, C20H32O9, etil 7-epi-12-hidroxijasmonato glucósido) (Tabla 3). La producción de sacarosa se ha podido deber a que el patógeno ha establecido una relación con la planta a lo que ha demandado una mayor cantidad de este compuesto por lo que se ha detectado este aumento (Vargas et al., 2011). En cuando al terpeno, etil 7-epi-12-hidroxijasmonato glucósido, se trata de un derivado del ácido jasmónico y está muy ligado a la respuesta defensiva de la alubia (Pieterse et al., 2012). Por ello, este compuesto ha sido producido en una cantidad significativamente mayor que en las plantas control, cuando éstas han estado en contacto tanto con R. solani como con T. velutinum como respuesta a la presencia de ambos hongos.
Tabla 3: Compuestos detectados que se han producido en cantidades significativamente diferentes respecto a las plantas control (CC) cuando han estado en presencia de R. solani (RC).
Id(1) Fórmula Compuesto asignado RC-CC
Ácido graso
35 C18H30O2 Ácido γ-Linolénico Reducido
Aminoácido
8 C11H12N2O2 L-Triptófano Reducido
15 C13H14N2O3 N-Acetiltriptófano Reducido
*
*
*
**
** *
0,0
0,2
0,4
0,6
0,8
1,0
1,2
1,4
1,6
1,8
2,0R
atio
del
mét
odo
2 -Δ
ΔCt
RC Gene CC RCWRKY33 1.000 ± 0.190 0.634 0.152PR1 1.000 ± 0.266 1.289 0.292PR2 1.000 ± 0.085 0.331* 0.079PR3 1.000 ± 0.127 0.763* 0.077PR4 1.000 ± 0.197 0.176* 0.057ERF1 1.000 ± 0.149 0.502* 0.061ERF5 1.000 ± 0.134 0.333* 0.037CH5b 1.000 ± 0.272 0.790 0.179PAL1 1.000 ± 0.116 0.149* 0.013OSM34 1.000 ± 0.264 1.237 0.125CNGC2 1.000 ± 0.235 1.228 0.122HPL 1.000 ± 0.279 0.245* 0.073GTSa 1.000 ± 0.158 0.177* 0.051hGS 1.000 ± 0.115 1.193 0.068
Figura 11: Comparación de la expresión de los genes WRKY33, PR1, PR2, PR3, PR4, ERF1, ERF5, CH5b, PAL1, OSM34, CNGC2, HPL, GTSa y hGS en plantas que han sido inoculadas con R. solani (RC) frente a plantas control (CC) en comparación con el gen de referencia Act11. Los datos han sido analizados por el método 2-ΔΔCt. Aquellos datos numéricos que presentan diferencias estadísticas (p < 0,05) están indicados con un asterisco.

Resultados y Discusión Generales
140
Tabla 3: Compuestos detectados que se han producido en cantidades significativamente diferentes respecto a las plantas control (CC) cuando han estado en presencia de R. solani (RC) (continuación).
Id(1) Fórmula Compuesto asignado RC-CC
Carbohidrato
2 C12H22O11 Sacarosa Aumentado
Flavonoide
1 C17H20O11 5-Hidroxi-6,8-dimethoxi-2-oxo-2H-chromen-7-il β-D-glucopiranósido Reducido
16 C30H26O16 Quercetagetin 7-(6''-(E)-caffeoilglucósido) Reducido
18 C29H34O17 Isopirenin 7-O-glucósido Reducido
19 C25H32O13 12-Hidroxi, O-[3,4,5-trihidroxibenzoil-(06)-β-D-glucopiranósido] Reducido
20 C32H39O16 Luteona 4,7-O-diglucósido Reducido
22 C19H18O8 3´,5-Dihidroxi-3,4´,6,7-tetramethoxiflavona Reducido
27 C19H18O9 5,2',4'-Trihidroxi-3,7,8,5'-tetramethoxiflavona Reducido
Fenol
31 C19H20O9 Garcimangosona D Reducido
Glicósido
4 C12H18O11 Ácido L-ascórbico-2-glucósido Aumentado
Lípido
34 C18H30O3 13(S)-HOTrE Reducido
36 C31H63O7P PA(O-16:0/12:0) Reducido
Péptido
7 C11H22N2O3 Valyl-Leucina Reducido
11 C17H32N4O5 Ile Gln Ile Reducido
Terpeno
17 C20H32O9 Etil 7-epi-12-hidroxijasmonato glucósido Aumentado
32 C47H76O16 Akeboside Ste Reducido
(1) Id: Número correspondiente al pico del cromatograma obtenido por HPLC-DAD-TOF-MS delcapítulo IV.
4.2. P. vulgaris frente a T. harzianum T019
a) Expresión de los genes de defensa
Cuando las plantas han sido tratadas con el aislamiento T. harzianum T019 (CT019), se ha observado que los genes CH5b y PR2 han sido regulados positivamente de forma significativa respecto a las plantas donde no se ha inoculado ningún hongo (CC), con ratios de 1,495 y 24,492

Respuesta defensiva de P. vulgaris frente a Trichoderma y a R. solani
141
respectivamente (Figura 12). El alto nivel de expresión de PR2, se debe a que existe una alteración de la respuesta defensiva de la alubia tras haber estado en contacto con Trichoderma durante un largo periodo en comparación con los datos aportados en otros trabajos en los que esta interacción dura unas pocas horas. Este resultado se podría deber a la alta actividad de las β-1,3-glucanasas en la pared celular, lo que incrementaría los oligosacáridos que actúan como moléculas elicitoras desencadenantes de la respuesta defensiva en la planta y/o en los metabolitos secundarios de los hongos (Druzhinina et al., 2011). Sin embargo, el gen PR4 se ha regulado negativamente con una ratio significativa de 0,524 respecto al control (Figura 12). En un estudio llevado a cabo en berenjena, este gen incrementa su expresión cuando ha estado en contacto con agentes de biocontrol, sugiriendo con ello que promueven la respuesta defensiva de la planta (Angelopoulou et al., 2014).
Los genes CH1, PR1, PR3 y PAL no se han visto afectados de forma significativa. En otros trabajos, se ha observado que T. harzianum potencia la respuesta de la alubia frente a fitopatógenos como R. solani. Rivière et al. (2008) han sugerido que PR1 se regula negativamente debido a las β-1,3-glucanasas (PR2 y PR3) y en el trabajo de Guerrero-González et al. (2011) este gen se regula positivamente. En nuestro caso, este gen no presenta una respuesta significativa respecto al control.
b) Producción de metabolitos de T. harzianum T019
La producción de metabolitos por parte de Trichoderma provoca respuestas en la planta que pueden incrementar su desarrollo o activar su respuesta defensiva.
Gen Ratio p(H1)
CH5b 1,495* 0,000
CH1 0,636 0,087
PR1 1,127 0,065
PR2 24,492* 0,000
PR3 1,173 0,152
PR4 0,524* 0,036
PAL 0,316 0,081
Rat
io d
e ex
pres
ión
Gen
CT019 vs CC
Figura 12: Comparación de la expresión de los genes CH5b, CH1, PR1, PR2, PR3, PR4 y PAL en plantas que han sido inoculadas con T. harzianum T019 (CT019) frente a plantas control (CC) en comparación con los genes de referencia α-actin y EF1α. La comparación y el análisis estadístico han sido realizados con el programa REST2009® (Pfaffl et al., 2002). Aquellos datos numéricos que presentan diferencias estadísticas (p < 0,05) están indicados con un asterisco en la tabla y rodeados en el gráfico.

Resultados y Discusión Generales
142
La producción de escualeno por parte de un aislamiento fúngico puede ser importante para comprobar su eficiencia en el control de enfermedades vegetales. Este compuesto es un terpeno poliinsaturado que parece que tiene una función importante en la membrana celular de los hongos (Malmierca et al., 2013) y que es precursor del ergosterol. Este compuesto es un esterol que la planta puede reconocer como un PAMP (Pathogen Associated Molecular Patterns) (Nürnberger et al., 2004) ya que desencadena una serie de reacciones (Cervone et al., 1997) que podrían activar la respuesta defensiva de la planta. Por tanto, los niveles de producción de escualeno influirán en la síntesis de ergosterol (Garaiová et al., 2013). Además, al tratarse de un compuesto estructural resultante del desarrollo del hongo, el ergosterol podría activar la expresión de numerosos genes de defensa e incrementar la resistencia de la planta a fitopatógenos (Lochman y Mikeš, 2005).
En este caso se ha evaluado la producción de ergosterol y escualeno, en el aislamiento T019 comparándolo con otro aislamiento de la misma especie (Anexos Tabla A.1). La producción de ergosterol y de escualeno a las 24 h no ha presentado diferencias significativas respecto a la otra cepa de T. harzianum T34, pero a las 96 h el aislamiento T019 ha producido una cantidad significativamente mayor de ambos compuestos respecto a la cepa de referencia (Tabla 4). Así, un incremento de la producción de ambos compuestos puede inducir la respuesta defensiva de la planta, aumentar su desarrollo incluso en presencia de un fitopatógeno.
Tabla 4: Cuantificación de ergosterol y escualeno a las 24 h y 96 h de los aislamientos de Trichoderma seleccionados para este estudio.
Aislamiento de
T. harzianum
Ergosterol (mg E/g peso seco) Escualeno (mg S/g peso seco)
24 h 96 h 24 h 96 h
T34 16,197 ± 1,019 a 8,970 ± 0,388 b 0,317 ± 0,020 a 0,052 ± 0,049 b
T019 14,336 ± 2,459 a 12,502 ± 3,568 a 0,303 ± 0,041 a 0,348 ± 0,103 a
Los valores con letras diferentes presentan diferencias significativas (test DMS, p < 0,05)
4.3. P. vulgaris frente a T. velutinum T028
a) Expresión de los genes de defensa
Las plantas de alubia cuando han estado desarrollándose durante 45 días en contacto con T. velutinum, T028, (CT028) la mayoría de los genes de estudio han sido regulados negativamente, aunque en menor medida que cuando han estado desarrollándose con R. solani (RC) (Figura 13). Así, la expresión de los genes PR2, PR3, PR4, ERF1, ERF5, PAL1, CNGC2, HPL y GTSa ha sido significativamente inferior respecto a la de las plantas control, ratios que han oscilado entre 0,168 de PR4 y 0,754 de ERF1. En el caso de WRKY33, CH5b y hGS, han sido regulados positivamente respecto al control con valores que varían entre 2,462 de CH5b y 1,579 de hGS. PR1 ha sido regulado negativamente y OSM34 regulado positivamente, pero en estos dos últimos casos las diferencias no han sido significativas respecto al control.
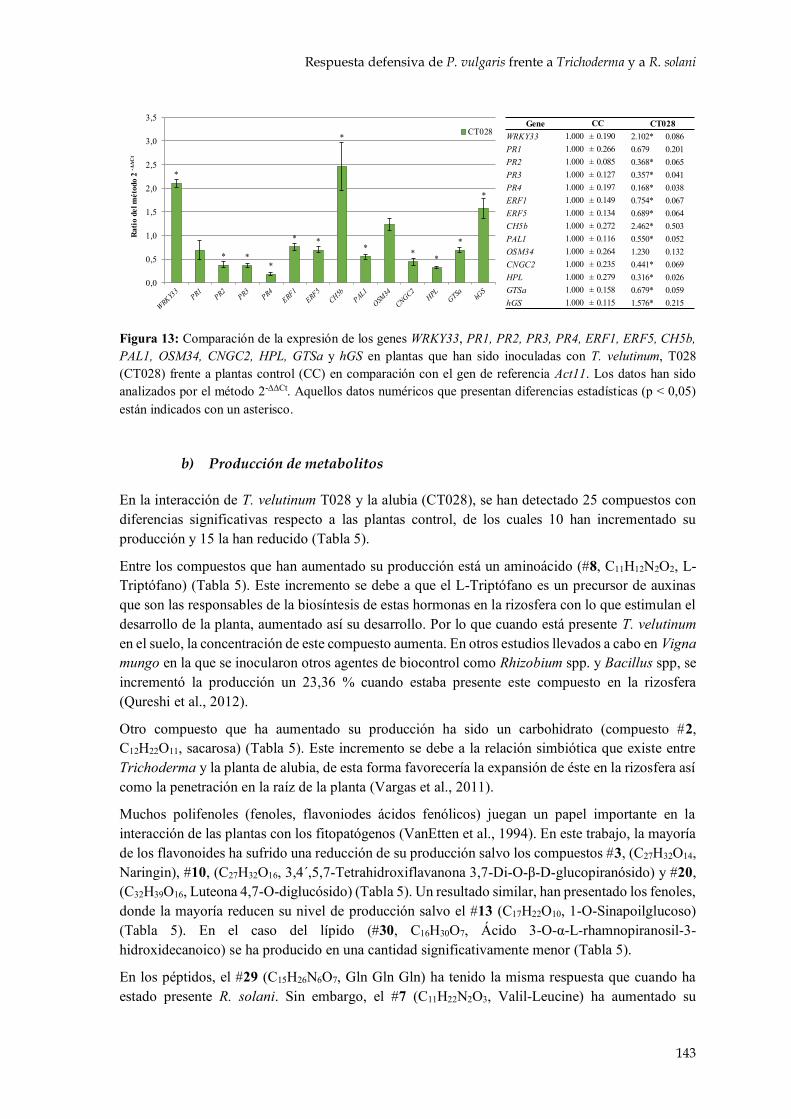
Respuesta defensiva de P. vulgaris frente a Trichoderma y a R. solani
143
b) Producción de metabolitos
En la interacción de T. velutinum T028 y la alubia (CT028), se han detectado 25 compuestos con diferencias significativas respecto a las plantas control, de los cuales 10 han incrementado su producción y 15 la han reducido (Tabla 5).
Entre los compuestos que han aumentado su producción está un aminoácido (#8, C11H12N2O2, L-Triptófano) (Tabla 5). Este incremento se debe a que el L-Triptófano es un precursor de auxinas que son las responsables de la biosíntesis de estas hormonas en la rizosfera con lo que estimulan el desarrollo de la planta, aumentado así su desarrollo. Por lo que cuando está presente T. velutinum en el suelo, la concentración de este compuesto aumenta. En otros estudios llevados a cabo en Vigna mungo en la que se inocularon otros agentes de biocontrol como Rhizobium spp. y Bacillus spp, se incrementó la producción un 23,36 % cuando estaba presente este compuesto en la rizosfera (Qureshi et al., 2012).
Otro compuesto que ha aumentado su producción ha sido un carbohidrato (compuesto #2, C12H22O11, sacarosa) (Tabla 5). Este incremento se debe a la relación simbiótica que existe entre Trichoderma y la planta de alubia, de esta forma favorecería la expansión de éste en la rizosfera así como la penetración en la raíz de la planta (Vargas et al., 2011).
Muchos polifenoles (fenoles, flavoniodes ácidos fenólicos) juegan un papel importante en la interacción de las plantas con los fitopatógenos (VanEtten et al., 1994). En este trabajo, la mayoría de los flavonoides ha sufrido una reducción de su producción salvo los compuestos #3, (C27H32O14, Naringin), #10, (C27H32O16, 3,4´,5,7-Tetrahidroxiflavanona 3,7-Di-O-β-D-glucopiranósido) y #20, (C32H39O16, Luteona 4,7-O-diglucósido) (Tabla 5). Un resultado similar, han presentado los fenoles, donde la mayoría reducen su nivel de producción salvo el #13 (C17H22O10, 1-O-Sinapoilglucoso) (Tabla 5). En el caso del lípido (#30, C16H30O7, Ácido 3-O-α-L-rhamnopiranosil-3-hidroxidecanoico) se ha producido en una cantidad significativamente menor (Tabla 5).
En los péptidos, el #29 (C15H26N6O7, Gln Gln Gln) ha tenido la misma respuesta que cuando ha estado presente R. solani. Sin embargo, el #7 (C11H22N2O3, Valil-Leucine) ha aumentado su
*
* **
* *
*
* **
*
*
0,0
0,5
1,0
1,5
2,0
2,5
3,0
3,5R
atio
del
mét
odo
2 -Δ
ΔCt
CT028Gene CC CT028
WRKY33 1.000 ± 0.190 2.102* 0.086PR1 1.000 ± 0.266 0.679 0.201PR2 1.000 ± 0.085 0.368* 0.065PR3 1.000 ± 0.127 0.357* 0.041PR4 1.000 ± 0.197 0.168* 0.038ERF1 1.000 ± 0.149 0.754* 0.067ERF5 1.000 ± 0.134 0.689* 0.064CH5b 1.000 ± 0.272 2.462* 0.503PAL1 1.000 ± 0.116 0.550* 0.052OSM34 1.000 ± 0.264 1.230 0.132CNGC2 1.000 ± 0.235 0.441* 0.069HPL 1.000 ± 0.279 0.316* 0.026GTSa 1.000 ± 0.158 0.679* 0.059hGS 1.000 ± 0.115 1.576* 0.215
Figura 13: Comparación de la expresión de los genes WRKY33, PR1, PR2, PR3, PR4, ERF1, ERF5, CH5b, PAL1, OSM34, CNGC2, HPL, GTSa y hGS en plantas que han sido inoculadas con T. velutinum, T028 (CT028) frente a plantas control (CC) en comparación con el gen de referencia Act11. Los datos han sido analizados por el método 2-ΔΔCt. Aquellos datos numéricos que presentan diferencias estadísticas (p < 0,05) están indicados con un asterisco.

Resultados y Discusión Generales
144
cantidad cuando está T. velutinum (Tabla 5). La actividad de los péptidos en la alubia está descrita como indicadores por ejemplo de cambios en la permeabilización de membranas celulares, o inducción de la acumulación de chitinasas. Por lo que están relacionados con la respuesta defensiva de la planta (Luna-Vital et al., 2015).
En el caso de los terpenos, la mayoría ha incrementado significativamente su producción a excepción del #32 (C47H76O16, Akeboside Ste) que ha sido reducida (Tabla 5). Cabe destacar el #17 (C20H32O9, Etil 7-epi-12-hidroxijasmonato glucósido) que ha incrementado su producción al igual que lo hiciera en presencia del patógeno, con lo que este derivado del ácido jasmónico puede estar muy ligado a la respuesta defensiva de la alubia (Pieterse et al., 2012).
Tabla 5: Compuestos detectados que se han producido en cantidades significativamente diferentes respecto a las plantas control (CC) cuando han estado en presencia de T. velutinum T028 (CT028).
Id(1) Fórmula Compuesto asignado CT028-CC
Aminoácido
8 C11H12N2O2 L-Triptófano Aumentado
Carbohidrato
2 C12H22O11 Sacarosa Aumentado
Flavonoide
1 C17H20O11 5-Hidroxi-6,8-dimethoxi-2-oxo-2H-chromen-7-il β-D-glucopiranósido Reducido
3 C27H32O14 Naringin Aumentado
10 C27H32O16 3,4´,5,7-Tetrahidroxiflavanona 3,7-Di-O-β-D-glucopiranósido Aumentado
18 C29H34O17 Isopirenin 7-O-glucósido Reducido
19 C25H32O13 12-Hidroxi, O-[3,4,5-trihidroxibenzoil-(06)-β-D-glucopiranósido] Reducido
20 C32H39O16 Luteona 4,7-O-diglucósido Aumentado
22 C19H18O8 3´,5-Dihidroxi-3,4´,6,7-tetramethoxiflavona Reducido
24 C20H38O12 (R)-1-O-[β-D-Glucopiranosil-(1-6)-β-D-glucopiranósido]-1,3-octanediol Reducido
25 C25H28O6 2´,4´,5,7-Tetrahidroxi-3´,8-diprenilisoflavanona Reducido
26 C20H38O11 n-Octil-β-D-maltopiranosido Reducido
27 C19H18O9 5,2',4'-Trihidroxi-3,7,8,5'-tetramethoxiflavona Reducido
28 C21H22O4 C20H18O5
2´-O-Methilphaseollinisoflavona Wighteone
Reducido
Fenol
5 C14H20O8 C16H12O7
Hidroxitirosol 1-O-glucósido Isorhamnetin
Reducido
13 C17H22O10 1-O-Sinapoilglucoso Aumentado

Respuesta defensiva de P. vulgaris frente a Trichoderma y a R. solani
145
Tabla 5: Compuestos detectados que se han producido en cantidades significativamente diferentes respecto a las plantas control (CC) cuando han estado en presencia de T. velutinum T028 (CT028) (continuación).
Id(1) Fórmula Compuesto asignado CT028-CC
Fenol (continuación)
31 C19H20O9 Garcimangosone D Reducido
33 C38H44O8 Ácido Gambogico Reducido
Lípido
30 C16H30O7 Ácido 3-O-α-L-rhamnopiranosil-3-hidroxidecanoico Reducido
Péptido
7 C11H22N2O3 Valil-Leucine Aumentado
29 C15H26N6O7 Gln Gln Gln Reducido
Terpeno
9 C21H32O10 Ácido Dihidrofaseico 4-O-β-D-glucósido Aumentado
17 C20H32O9 Etil 7-epi-12-hidroxijasmonato glucósido Aumentado
23 C14H20O5 C16H12O4
Teucrein Formononetin
Aumentado
32 C47H76O16 Akeboside Ste Reducido
(1) Id: Número correspondiente al pico del cromatograma obtenido por HPLC-DAD-TOF-MS delcapítulo IV.
4.4. P. vulgaris frente a Trichoderma y R. solani
a) Expresión de los genes de defensa
Se ha realizado la expresión de los genes de estudio cuando las plantas de alubia han sido inoculadas con R. solani y con los aislamientos de T. harzianum T019 (RT019) y T. velutinum T028 (RT028).
Analizando la respuesta genética de P. vulgaris cuando ha sido inoculada con el patógeno y con T. harzianum (RT019), se ha visto que respecto a las plantas control (CC) no ha mostrado resultados significativos de regulación positiva en ninguno de los genes. Pero analizando la respuesta que tienen estas mismas plantas respecto al control de R. solani (RC) (Figura 14) se ha observado que los genes CH5b, CH1, PR1, PR2, PR3 y PR4 han sido regulados positivamente. Es decir, la presencia de T. harzianum en plantas con el patógeno hace que el agente de biocontrol desencadene la respuesta defensiva de la planta.
En otros trabajos, durante la interacción de Solanum tuberosum con R. solani, se ha observado que tras 120 h desde la infección inicial y los primeros síntomas de la enfermedad, han aparecido nuevos brotes con una reducción de la sintomatología lo que sugiere que la planta podría estar preparada para su defensa y así evitar el avance de la enfermedad (Lehtonen et al., 2008). En el presente trabajo, la presencia de T. harzianum hace que se module la respuesta de la planta y prevenga la supresión de los genes defensivos por parte de R. solani, con lo que ayuda a la alubia a resistir a dicho ataque.

Resultados y Discusión Generales
146
Cuando R. solani y T. velutinum T028 han estado en contacto con la alubia durante 45 días (RT028), la respuesta de la planta respecto al control (CC) ha sido significativa para la mayoría de los genes de estudio salvo para PR1, CH5b y CNGC2 (Figura 15). Los genes regulados negativamente respecto a las plantas control han sido WRKY33, PR2, PR3, PR4, ERF1, ERF5, PAL1, OSM34, HPL y GTSa, con ratios que han variado desde 0,179 de PAL1 hasta 0,631 de WRKY33. Los regulados positivamente han sido CH5b y hGS, aunque sólo en este último la diferencia de expresión ha sido significativa.
Gen Ratio p(H1)
CH5b 10,410* 0,000
CH1 1,420* 0,000
PR1 3,457* 0,000
PR2 12,267* 0,000
PR3 8,896* 0,000
PR4 42,975* 0,000
PAL 1,305 0,174
Rat
io d
e ex
pres
ión
Gen
RT019 vs RC
Figura 14: Comparación de la expresión de los genes CH5b, CH1, PR1, PR2, PR3, PR4 y PAL en plantas que han sido inoculadas con R. solani y con T. harzianum, T019 (RT019) frente a plantas control de R. solani (RC) en comparación con los genes de referencia α-actina y EF1α. La comparación y el análisis estadístico han sido realizados con el programa REST2009 ® (Pfaffl et al., 2002). Aquellos datos numéricos que presentan diferencias estadísticas (p < 0,05) están indicados con un asterisco en la tabla y rodeados en el gráfico.
*
* ** * *
**
**
*
0,00,20,40,60,81,01,21,41,61,82,02,22,4
Rat
io d
el m
étod
o2
-ΔΔC
t
RT028 Gene CC RT028WRKY33 1.000 ± 0.190 0.631* 0.042PR1 1.000 ± 0.266 0.617 0.164PR2 1.000 ± 0.085 0.238* 0.068PR3 1.000 ± 0.127 0.278* 0.037PR4 1.000 ± 0.197 0.330* 0.156ERF1 1.000 ± 0.149 0.416* 0.041ERF5 1.000 ± 0.134 0.429* 0.026CH5b 1.000 ± 0.272 1.613 0.522PAL1 1.000 ± 0.116 0.179* 0.011OSM34 1.000 ± 0.264 0.316* 0.060CNGC2 1.000 ± 0.235 0.689 0.060HPL 1.000 ± 0.279 0.219* 0.014GTSa 1.000 ± 0.158 0.357* 0.046hGS 1.000 ± 0.115 1.589* 0.147
Figura 15: Comparación de la expresión de los genes WRKY33, PR1, PR2, PR3, PR4, ERF1, ERF5, CH5b, PAL1, OSM34, CNGC2, HPL, GTSa y hGS en plantas que han sido inoculadas con R. solani y T. velutinum, T028 (RT028) frente a plantas control (CC) en comparación con el gen de referencia Act11. Los datos han sido analizados por el método 2-ΔΔCt. Aquellos datos numéricos que presentan diferencias estadísticas (p < 0,05) están indicados con un asterisco.

Respuesta defensiva de P. vulgaris frente a Trichoderma y a R. solani
147
Al igual que en el caso del aislamiento T019, se ha evaluado la respuesta de las alubias cuando han estado inoculadas con T. velutinum T028 y R. solani (RT028) respecto a las que se han desarrollado en presencia de R. solani (Figura 16). Los genes PR1, ERF1, CH5b y CNGC2 han sido regulados negativamente mientras que WRKY33, PR4, OSM34, GTSa y hGS han sido regulados positivamente, en todos los casos de forma significativa, respecto a las plantas control de R. solani (RC) con ratios que han variado entre 0,256 de PR1 y 2,042 de OSM34.
b) Producción de metabolitos
En la interacción de las plantas de alubia con R. solani y T. velutinum T028 (RT028) se han detectado 26 compuestos con diferencias significativas de producción, de los cuales 9 han aumentado y 17 han reducido respecto a las plantas control (CC) (Tabla 6).
La producción del ácido graso (#35, C18H30O2, ácido γ-Linolénico) cuando ha estado en presencia de ambos hongos se ha reducido al igual que lo hiciera estando en presencia de R. solani (Tabla 3 y Tabla 6). En este caso, la presencia del patógeno ha provocado que este compuesto se haya reducido y ni la presencia del agente de biocontrol ha hecho que restablezca a niveles del control. El ácido γ-Linolénico es un precursor de jasmonato con lo que está ligado a una respuesta ISR, por lo que el patógeno reduciría la defensa de la planta dependiente de este compuesto.
El aminoácido (#15, C13H14N2O3, N-acetiltriptófano) ha aumentado respecto al control (Tabla 6). Al contrario que el anterior compuesto, en presencia de R. solani (RC), ha reducido su producción (Tabla 3). Sin embargo, en la combinación de ambos hongos se ha incrementado. Por ello, la presencia de T. velutinum y R. solani, ha aumentado su producción, con lo que el agente de biocontrol inhibe el efecto del patógeno en la producción de este compuesto.
Gene RC RT028WRKY33 1,000 0,104 1,202* 0,074PR1 1,000 0,101 0,256* 0,048PR2 1,000 0,240 0,997 0,066PR3 1,000 0,122 0,828 0,081PR4 1,000 0,111 1,288* 0,077ERF1 1,000 0,227 0,479* 0,127ERF5 1,000 0,239 0,719 0,205CH5b 1,000 0,037 0,365* 0,048PAL1 1,000 0,325 1,870 0,885OSM34 1,000 0,226 2,042* 0,661CNGC2 1,000 0,099 0,561* 0,049HPL 1,000 0,300 0,896 0,057GTSa 1,000 0,290 2,021* 0,259hGS 1,000 0,057 1,332 0,123
*
*
*
*
*
*
*
*
*
0,00,20,40,60,81,01,21,41,61,82,02,22,42,62,83,0
Rat
io d
el m
étod
o2
-ΔΔC
t
RT028
Figura 16: Comparación de la expresión de los genes WRKY33, PR1, PR2, PR3, PR4, ERF1, ERF5, CH5b, PAL1, OSM34, CNGC2, HPL, GTSa y hGS en plantas que han sido inoculadas con R. solani y T. velutinum, T028 (RT028) frente a control de R. solani (RC) en comparación con el gen de referencia Act11. Los datos han sido analizados por el método 2-ΔΔCt. Aquellos datos numéricos que presentan diferencias estadísticas (p < 0,05) están indicados con un asterisco.

Resultados y Discusión Generales
148
Tabla 6: Compuestos detectados que se han producido en cantidades significativamente diferentes respecto a las plantas control (CC) cuando han estado en presencia de R. solani y T. velutinum T028 (RT028).
Id(1) Fórmula Compuesto asignado RT028-CC
Ácido graso
35 C18H30O2 Ácido γ-Linolénico Reducido
Aminoácido
15 C13H14N2O3 N-acetiltriptófano Aumentado
Flavonoide
1 C17H20O11 5-Hidroxi-6,8-dimethoxi-2-oxo-2H-chromen-7-il β-D-glucopiranósido Reducido
6 C20H20O4 Phaseollinisoflavana Reducido
10 C27H32O16 3,4´,5,7-Tetrahidroxiflavanona 3,7-Di-O-β-D-glucopiranósido Aumentado
12 C26H28O16 Quercetin 3-vicianósido Aumentado
14 C26H32O13 (Z)-Resveratrol 3,4'-diglucósido Aumentado
18 C29H34O17 Isopirenin 7-O-glucósido Reducido
19 C25H32O13 12-Hidroxi, O-[3,4,5-trihidroxibenzoil-(06)-β-D-glucopiranósido] Reducido
20 C32H39O16 Luteona 4,7-O-diglucósido Aumentado
21 C29H50O Sitosterol Aumentado
22 C19H18O8 3´,5-Dihidroxi-3,4´,6,7-tetramethoxiflavona Reducido
24 C20H38O12 (R)-1-O-[β-D-Glucopiranosil-(1-6)-β-D-glucopiranósido]-1,3-octanediol Reducido
25 C25H28O6 2´,4´,5,7-Tetrahidroxi-3´,8-diprenilisoflavanona Reducido
27 C19H18O9 5,2',4'-Trihidroxi-3,7,8,5'-tetramethoxiflavone Reducido
28 C21H22O4 C20H18O5
2´-O-Methilphaseollinisoflavana Wighteone
Reducido
Fenol
13 C17H22O10 1-O-Sinapoilglucoso Aumentado
31 C19H20O9 Garcimangosone D Reducido
33 C38H44O8 Ácido Gambógico Reducido
Lípido
30 C16H30O7 Ácido 3-O-α-L-rhamnopiranosil-3-hidroxidecanoico Reducido
36 C31H63O7P PA(O-16:0/12:0) Reducido

Respuesta defensiva de P. vulgaris frente a Trichoderma y a R. solani
149
Tabla 6: Compuestos detectados que se han producido en cantidades significativamente diferentes respecto a las plantas control (CC) cuando han estado en presencia de R. solani y T. velutinum T028 (RT028) (continuación).
Id(1) Fórmula Compuesto asignado RT028-CC
Péptido
7 C11H22N2O3 Valil-Leucine Aumentado
11 C17H32N4O5 Ile Gln Ile Reducido
29 C15H26N6O7 Gln Gln Gln Reducido
Terpeno
17 C20H32O9 Etil 7-epi-12-hidroxijasmonato glucósido Aumentado
32 C47H76O16 Akeboside Ste Reducido
(1) Id: Número correspondiente al pico del cromatograma obtenido por HPLC-DAD-TOF-MS del capítulo IV.
En cuanto a los flavonoides ha habido 9 compuestos (Tabla 6) (#1, C17H20O11, 5-Hidroxi-6,8-dimethoxi-2-oxo-2H-chromen-7-il β-D-glucopiranósido; #6, C20H20O4, Phaseollinisoflavana; #18, C29H34O17, Isopirenin 7-O-glucósido; #19, C25H32O13, 12-Hidroxi, O-[3,4,5-trihidroxibenzoil-(06)-β-D-glucopiranósido]; #22, C19H18O8, 3´,5-Dihidroxi-3,4´,6,7-tetramethoxiflavona; #24, C20H38O12, (R)-1-O-[β-D-Glucopiranosil-(1-6)-β-D-glucopiranósido]-1,3-octanediol; #25, C25H28O6, 2´,4´,5,7-Tetrahidroxi-3´,8-diprenilisoflavanona; #27, C19H18O9, 5,2',4'-Trihidroxi-3,7,8,5'-tetramethoxiflavone; #28, C21H22O4, 2´-O-Methilphaseollinisoflavana o C20H18O5, Wighteone) que han reducido significativamente su producción frente a 5 que la han incrementado (Tabla 6) (#10, C27H32O16, 3,4´,5,7-Tetrahidroxiflavanona 3,7-Di-O-β-D-glucopiranósido; #12, C26H28O16, Quercetin 3-vicianósido; #14, C26H32O13, (Z)-Resveratrol 3,4'-diglucósido; #20, C32H39O16, Luteona 4,7-O-diglucósido; #21, C29H50O, Sitosterol). De los productos que han reducido su cantidad, los compuestos #24, #25 y #28 también lo han hecho en presencia de T. velutinum (CT028) (Tabla 5) por lo que su merma se debe a este hongo y no al patógeno. Sucede lo contrario en los compuestos #10 y #20, que han aumentado su producción con Trichoderma (CT028 y RT028) (Tabla 5).
En el caso de los fenoles, se ha producido una reducción significativa de los compuestos #31 (C19H20O9, Garcimangosone D) y #33 (C38H44O8, Ácido Gambógico), mientras que se ha incrementado la cantidad significativa del #13 (C17H22O10, 1-O-Sinapoilglucoso) (Tabla 6). Como en los compuestos anteriores, la variación de las cantidades producidas ha variado según la presencia de un hongo u otro. En el caso del #13 ha aumentado su producción en presencia de Trichoderma y en #33 la ha reducido en la misma situación (Tabla 5 y Tabla 6). Por lo que la presencia del agente de biocontrol va a modificar la producción de estos compuestos.
En cuanto a los lípidos, su producción ha sido significativamente reducida en la interacción con Trichoderma y Rhizoctonia (RT028) [#30, C16H30O7, Ácido 3-O-α-L-rhamnopiranosil-3-hidroxidecanoico; #36, C31H63O7P, PA(O-16:0/12:0)] (Tabla 6). Sin embargo, esa reducción se ha debido a diferentes hongos. En el caso de #30, ha reducido su cantidad de la misma manera que lo hiciera en presencia sólo de T. velutinum (CT028) (Tabla 5) por lo que esta menor producción se ha debido al agente de biocontrol. En cuanto al #36, ha disminuido su cantidad de igual modo que lo hiciera en presencia de sólo R. solani (RC) (Tabla 3), así que esta reducción la ha causado el patógeno.

Resultados y Discusión Generales
150
Los péptidos, #11 (C17H32N4O5, Ile Gln Ile) y #29 (C15H26N6O7, Gln Gln Gln) han reducido su cantidad en presencia de T. velutinum y R. solani (RT028) (Tabla 6). El #11 ha mermado su cantidad si estaba presente el patógeno (RC y RT028) (Tabla 3 y Tabla 6) y el #29 lo ha hecho si estaba el agente de biocontrol (CT028 y RT028) (Tabla 5 y Tabla 6). Sin embargo el #7 (C11H22N2O3, Valil-Leucine) ha aumentado su cantidad cuando ha estado presente T. velutinum (CT028 y RT028) y la ha reducido en presencia sólo de R. solani (RC) (Tabla 3, Tabla 5 y Tabla 6).
Los flavonoides #1, #18, #19, #22 y #27, el fenol #31 y el terpeno #32 que han reducido su producción en cualquiera de las interacción estudiadas (RC, CT028 y RT028) (Tabla 3, Tabla 5 y Tabla 6). El único compuesto que ha incrementado significativamente su producción en las tres interacciones ha sido el terpeno #17 (Tabla 3, Tabla 5 y Tabla 6). Esta respuesta por parte de la alubia se puede deber a que considere a T. velutinum y R. solani como un mismo tipo de microorganismo con lo que la planta responde de la misma forma en cuanto a la producción de estos compuestos.
5. BIBLIOGRAFÍA
Ahuja, I., Kissen, R., y Bones, A. M. (2012). Phytoalexins in defense against pathogens. Trends Plant Sci. 17, 73-90. doi:10.1016/j.tplants.2011.11.002.
Anees, M., Tronsmo, A., Edel-Hermann, V., Hjeljord, L. G., Héraud, C., y Steinberg, C. (2010). Characterization of field isolates of Trichoderma antagonistic against Rhizoctonia solani. Fungal Biol. 114, 691-701. doi:10.1016/j.funbio.2010.05.007.
Angelopoulou, D. J., Naska, E. J., Paplomatas, E. J., y Tjamos, S. E. (2014). Biological control agents (BCAs) of verticillium wilt: Influence of application rates and delivery method on plant protection, triggering of host defence mechanisms and rhizosphere populations of BCAs. Plant Pathol. 63, 1062-1069. doi:10.1111/ppa.12198.
Burmeister, L., y Hau, B. (2009). Control of the bean rust fungus Uromyces appendiculatus by means of Trichoderma harzianum: leaf disc assays on the antibiotic effect of spore suspensions and culture filtrates. Biocontrol 54, 575-585. doi:10.1007/s10526-008-9202-9.
Campelo, M. P., Cardoza, R. E., Lorenzana, A., Hermosa, M. R., Monte, E., Reinoso, B., et al. (2010). Biological control of phytopathogenic fungi in bean (Phaseolus vulgaris, L.) with Trichoderma atroviride and Trichoderma virens. en Bean Improvement Cooperative Fort Collins, eds. P. Miklas y P. Gepts (Colorado,USA), 114-115.
Cervone, F., Castoria, R., Leckie, F., y De Lorenzo, G. (1997). Perception of fungal elicitors and signal transduction. Signal Transduct. Plants, 153-177.
Chet, I., Harman, G. E., y Baker, R. (1981). Trichoderma hamatum: Its hyphal interactions with Rhizoctonia solani and Pythium spp. Microb. Ecol. 7, 29-38. doi:10.1007/BF02010476.
Daryaei, A., Jones, E. E., Ghazalibiglar, H., Glare, T. R., y Falloon, R. E. (2016). Culturing conditions affect biological control activity of Trichoderma atroviride against Rhizoctonia solani in ryegrass. J. Appl. Microbiol. 121, 461-472. doi:10.1111/jam.13163.
Druzhinina, I. S., Seidl-Seiboth, V., Herrera-Estrella, A., Horwitz, B. A., Kenerley, C. M., Monte, E., et al. (2011). Trichoderma: The genomics of opportunistic success. Nat. Rev. Microbiol. 9, 749-759.
Durak, E. D. (2016). Biological control of Rhizoctonia solani on potato by using indigenous Trichoderma spp. en International Conference on Advances in Natural and Applied Sciences (Antalya (Turkey): American Institute of Physics Inc.), 20020. doi:10.1063/1.4945846.
Durrant, W. E., y Dong, X. (2004). Systemic acquired resistance. Annu. Rev. Phytopathol. 42, 185-
Bibliografía
151
209. doi:10.1146/annurev.phyto.42.040803.140421.
Garaiová, M., Zambojová, V., Šimová, Z., Griac, P., y Hapala, I. (2013). Squalene epoxidase as a target for manipulation of squalene levels in the yeast Saccharomyces cerevisiae. FEMS Yeast Res. 14, 310-323. doi:10.1111/1567-1364.12107.
Guerrero-González, M. L., Rodríguez-Kessler, M., Rodríguez-Guerra, R., González-Chavira, M., Simpson, J., Sanchez, F., et al. (2011). Differential expression of Phaseolus vulgaris genes induced during the interaction with Rhizoctonia solani. Plant Cell Rep. 30, 1465-1473. doi:10.1007/s00299-011-1055-5.
Hanson, L. E., y Howell, C. R. (2004). Elicitors of plant defense responses from biocontrol strains of Trichoderma virens. Phytopathology 94, 171-176.
Hermosa, M. R., Grondona, I., Díaz-Mínguez, J. M., Iturriaga, E. A., y Monte, E. (2001). Development of a strain-specific SCAR marker for the detection of Trichoderma atroviride 11, a biological control agent against soilborne fungal plant pathogens. Curr. Genet. 38, 343-350. doi:10.1007/s002940000173.
Larkin, R. P. (2016). Impacts of biocontrol products on Rhizoctonia disease of potato and soil microbial communities, and their persistence in soil. Crop Prot. 90, 96-105. doi:10.1016/j.cropro.2016.08.012.
Lehtonen, M. J., Somervuo, P., y Valkonen, J. P. T. (2008). Infection with Rhizoctonia solani induces defense genes and systemic resistance in potato sprouts grown without light. Phytopathology 98, 1190-1198. doi:10.1094/PHYTO-98-11-1190.
Lochman, J., y Mikeš, V. (2005). Activation of different defence-related genes expression by ergosterol. en FEBS Journal, Abstract of 30th FEBS Congress (Budapest), 470. Available at: http://www.muni.cz/research/publications/586702.
Lodha, T. D., y Basak, J. (2012). Plant-pathogen interactions: what microarray tells about it? Mol. Biotechnol. 50, 87-97. doi:10.1007/s12033-011-9418-2.
Luna-Vital, D. A., Mojica, L., González de Mejía, E., Mendoza, S., y Loarca-Piña, G. (2015). Biological potential of protein hydrolysates and peptides from common bean (Phaseolus vulgaris L.): A review. Food Res. Int. 76, 39-50. doi:10.1016/j.foodres.2014.11.024.
Malmierca, M. G., Cardoza, R. E., Alexander, N. J., McCormick, S. P., Collado, I. G., Hermosa, R., et al. (2013). Relevance of trichothecenes in fungal physiology: Disruption of tri5 in Trichoderma arundinaceum. Fungal Genet. Biol. 53, 22-33.
Marra, R., Ambrosino, P., Carbone, V., Vinale, F., Woo, S. L., Ruocco, M., et al. (2006). Study of the three-way interaction between Trichoderma atroviride, plant and fungal pathogens by using a proteomic approach. Curr. Genet. 50, 307-321. doi:10.1007/s00294-006-0091-0.
Mayo, S., Cominelli, E., Sparvoli, F., González-López, O., Rodríguez-González, A., Gutiérrez, S., et al. (2016). Development of a qPCR strategy to select bean genes involved in plant defense response and regulated by the Trichoderma velutinum – Rhizoctonia solani interaction. Front. Plant Sci. 7, 1109. doi:10.3389/fpls.2016.01109.
Mayo, S., Gutierrez, S., Malmierca, M. G., Lorenzana, A., Campelo, M. P., Hermosa, R., et al. (2015). Influence of Rhizoctonia solani and Trichoderma spp. in growth of bean (Phaseolus vulgaris L.) and in the induction of plant defense-related genes. Front. Plant Sci. 6, 685. doi:10.3389/fpls.2015.00685.
Nürnberger, T., Brunner, F., Kemmerling, B., y Piater, L. (2004). Innate immunity in plants and animals: Striking similarities and obvious differences. Immunol. Rev. 198, 249-266.
Pfaffl, M. W., Horgan, G. W., y Dempfle, L. (2002). Relative expression software tool (REST) for group-wise comparison and statistical analysis of relative expression results in real-time PCR. Nucleic Acids Res. 30, e36. doi:10.1093/nar/30.9.e36.
Resultados y Discusión Generales
152
Pieterse, C. M. J., Van der Does, D., Zamioudis, C., Leon-Reyes, A., y Van Wees, S. C. M. (2012). Hormonal modulation of plant immunity. Annu. Rev. Cell Dev. Biol. 28, 489-521. doi:10.1146/annurev-cellbio-092910-154055.
Qureshi, M. A., Iqbal, A., Akhtar, N., Shakir, M. A., y Khan, A. (2012). Co-inoculation of phosphate solubilizing bacteria and rhizobia in the presence of L-tryptophan for the promotion of mash bean (Vigna mungo L.). Soil Environ. 31, 47-54.
Rivière, M.-P., Marais, A., Ponchet, M., Willats, W., y Galiana, E. (2008). Silencing of acidic pathogenesis-related PR-1 genes increases extracellular β-(1→3)-glucanase activity at the onset of tobacco defence reactions. J. Exp. Bot. 59, 1225-1239. doi:10.1093/jxb/ern044.
Ruano-Rosa, D., del Moral-Navarrete, L., y Lopez-Herrera, C. J. (2010). Selection of Trichoderma spp. isolates antagonistic to Rosellinia necatrix. Spanish J. Agric. Res. 8, 1084-1097.
Shoresh, M., Harman, G. E., y Mastouri, F. (2010). Induced systemic resistance and plant responses to fungal biocontrol agents. Annu. Rev. Phytopathol. 48, 21-43. doi:10.1146/annurev-phyto-073009-114450.
Tadeo, F. R., y Gómez-Cadenas, A. (2008). «Fisiología de las plantas y el estrés», en Fundamentos de fisología vegetal, eds. J. Azcón-Bieto y M. Talón (Barcelona, Spain: McGraw-Hill), 577-597.
VanEtten, H. D., Mansfield, J. W., Bailey, J. A., y Farmer, E. E. (1994). Two Classes of Plant Antibiotics: Phytoalexins versus «Phytoanticipins». Plant Cell 6, 1191-1192. doi:10.1105/tpc.6.9.1191.
Vargas, W. A., Crutcher, F. K., y Kenerley, C. M. (2011). Functional characterization of a plant-like sucrose transporter from the beneficial fungus Trichoderma virens. Regulation of the symbiotic association with plants by sucrose metabolism inside the fungal cells. New Phytol. 189, 777-789. doi:10.1111/j.1469-8137.2010.03517.x.
Verhagen, B. W. M., Van Loon, L. C., y Pieterse, C. M. J. (2006). «Induced disease resistance signaling in plants», en Floriculture, Ornamental and Plant Biotechnology (Utrecht (Holande): Global Science Books), 334-343.
Vinale, F., Flematti, G., Sivasithamparam, K., Lorito, M., Marra, R., Skelton, B. W., et al. (2009). Harzianic acid, an antifungal and plant growth promoting metabolite from Trichoderma harzianum. J. Nat. Prod. 72, 2032-2035. doi:10.1021/np900548p.
Zhao, Y., Thilmony, R., Bender, C. L., Schaller, A., He, S. Y., y Howe, G. A. (2003). Virulence systems of Pseudomonas syringae pv. tomato promote bacterial speck disease in tomato by targeting the jasmonate signaling pathway. Plant J. 36, 485-499. doi:10.1046/j.1365-313X.2003.01895.x.

conclusiones


155
Conclusiones
Existe una alta diversidad de especies de Trichoderma donde la alubia forma parte de la rotación de cultivos en zonas pertenecientes a la IGP “Alubia de La Bañeza-León”, siendo T. harzianum la especie más frecuente.
Los aislamientos de Trichoderma inhiben el desarrollo de Rhizoctonia solani en condiciones in vitro, sin diferencias entre los extraídos de semilla y de suelo.
En condiciones in vivo, las plantas de alubia en contacto con R. solani reducen su desarrollo. Sin embargo, en contacto con algunos aislamientos de Trichoderma, incrementan su desarrollo.
Las plantas de alubia muestran un desarrollo y una protección frente al patógeno mayor con aquellos asilamientos de Trichoderma extraídos de muestras de suelo que los procedentes de semilla. Su eficacia se debe a que tanto R. solani como Trichoderma han sufrido una evolución conjunta en la rizosfera haciendo que sea más eficiente el biocontrol de este fitopatógeno presente en los suelos de cultivo.
Los aislamientos T. harzianum T019 y T. velutinum T028, extraídos de semilla y de suelo respectivamente, incrementan el desarrollo de la alubia y en presencia de R. solani controlan su poder patógeno.
Un aumento de la producción de ergosterol y escualeno en Trichoderma produce la inducción de los genes de defensa de la planta de alubia, desarrollándose mejor en presencia del patógeno.
De los 48 genes analizados inicialmente, se seleccionan 16 genes. Sólo WRKY33, CH5b y hGS muestran una regulación positiva en la alubia en presencia de T. velutinum mientras que los otros genes son regulados negativamente. La interacción con R. solani provoca una regulación negativa de la mayoría de los genes, excepto PR1, OSM34 y CNGC2. La interacción de ambos hongos regula positivamente hGS y negativamente el resto de genes a excepción de CH5b que no es afectado.
La interacción de la alubia con Trichoderma y/o R. solani influye en la producción de metabolitos por parte de la planta. La presencia del patógeno provoca una menor producción de metabolitos. T. velutinum modifica algunos compuestos de la alubia, produciéndolos en menor o mayor cantidad según sea la función de los mismos. Hay compuestos que son producidos por la planta de modo similar en presencia de cualquiera de los dos hongos provocando la misma respuesta.


157
Conclusions
There is a high diversity of Trichoderma spp. where bean is a rotation crop in areas belonging to the PGI "Alubia de La Bañeza-León", being T. harzianum the most frequent species.
Trichoderma isolates inhibite the development of R. solani under in vitro conditions, without differences between Trichoderma extracted from bean seed and from soil.
On in vivo conditions, bean plants in contact with R. solani reduce the development. However, when plants are in contact with the Trichoderma isolates always show an increased size.
Bean plants show higher development and protection against the pathogen when Trichoderma isolates is extracted from soil samples in comparison with those obtained from bean seed. Their effectiveness can be explained because R. solani and Trichoderma have co-evolved in the rhizosphere, making biocontrol of the phytopathogens more efficient.
Isolates T. harzianum T019 and T. velutinum T028, from bean seed and soil, respectively, increase their development and in the presence of R. solani control their pathogen power.
An increased production of ergosterol and squalene by Trichoderma resulte in the induction of defence genes in the bean plants. In this way plants would grow better under a pathogen presence in the soil.
From 48 genes initially analysed, 16 bean genes are selected, only WRKY33, CH5b and hGS show an up-regulatory response in the bean plant in the presence of T. velutinum and the other genes were down-regulated. R. solani interaction resulte in a down-regulation of most of the genes analysed, except PR1, OSM34 and CNGC2. The presence of both, T. velutinum and R.
solani, up-regulated hGS and down-regulated all the other genes analysed, except CH5b is not affected.
The interaction of bean plants with Trichoderma and/or R. solani influenced the production of metabolites by the plant. The presence of the pathogen caused a minor production of the metabolites. T. velutinum modifies some compounds of the bean plants, in an increase or decrease amount depending on their function. Some products is detected which modified their production in the presence of either of the two fungi causing the same response in the bean plants.


Anexos


Índice anexos
1. ENSAYOS IN VIVO.............................................................................................. 163
2. SECUENCIA DEL TRANSCRIPTOMA DE LOS GENES DE ESTUDIO . 181
2.1. α-actin chr15 .................................................................................................................... 181
2.2. Act11 chr8 ........................................................................................................................ 181
2.3. UKN1 chr11 ..................................................................................................................... 182
2.4. EF1α chr4 ........................................................................................................................ 182
2.5. WRKY33 chr8 .................................................................................................................. 183
2.6. PR1 chr3 .......................................................................................................................... 184
2.7. PR2 chr3 .......................................................................................................................... 184
2.8. PR3 chr9 .......................................................................................................................... 184
2.9. PR4 chr6 .......................................................................................................................... 185
2.10. PR16a chr10 .................................................................................................................... 185
2.11. IPER chr9 ........................................................................................................................ 186
2.12. PPO chr8 ......................................................................................................................... 187
2.13. ERF1 chr7 ........................................................................................................................ 187
2.14. ERF5 chr2 ........................................................................................................................ 188
2.15. Ch5b chr9 ........................................................................................................................ 188
2.16. PAL1 chr1 ........................................................................................................................ 189
2.17. OSM34 chr4 ..................................................................................................................... 189
2.18. CNGC2 chr6 .................................................................................................................... 190
2.19. HPL chr5 ......................................................................................................................... 190
2.20. Lox2 chr5 ......................................................................................................................... 191
2.21. Lox2 chr10 ....................................................................................................................... 192
2.22. Lox7 chr5 ......................................................................................................................... 193
2.23. GSTa chr2 ........................................................................................................................ 194
2.24. hGS chr6 .......................................................................................................................... 194
2.25. Aminotransf 2 Clase V chr6 ............................................................................................. 195
3. BIBLIOGRAFÍA .................................................................................................... 195

TABLAS
Tabla A. 1: Aislamientos de R. solani y de Trichoderma empleados en los ensayos ................. 163
Tabla A. 2: Germinación por maceta (media ± error estándar y porcentaje) de cada tratamiento medida a los 24 días tras la siembra. ............................................................................................ 167
Tabla A. 3: Evaluación a los 45 días tras la siembra del diámetro del hipocotilo (media±error estándar) (mm) y de la longitud del sistema radicular (media ± error estándar) (cm)................. 169
Tabla A. 4: Evaluación a los 45 días tras la siembra del peso húmedo (media ± error estándar) (g) y del peso seco (media ± error estándar) (g) de la parte aérea. .................................................... 173
Tabla A. 5: Evaluación a los 45 días tras la siembra del peso húmedo (media ± error estándar) (g) y del peso seco (media ± error estándar) (g) del sistema radicular. ............................................. 177

163
Anexos
1. ENSAYOS IN VIVO
Tabla A. 1: Aislamientos de R. solani y de Trichoderma empleados en los ensayos
Código
colección(1)
Código
laboratorio Especie Cultivo Localidad
Zona
productiva
Origen: Semilla
Patógeno
PAULER006 R43 R. solani Alubia Santa María del Páramo El Páramo
Trichoderma spp.
PAULET20 T001 T. harzianum Alubia Antoñanes del Páramo El Páramo
PAULET21 T002 T. harzianum Alubia Moscas del Páramo El Páramo
PAULET22 T003 T. harzianum Alubia Bercianos del Páramo El Páramo
PAULET23 T004 T. gamsii Alubia Riego de la Vega La Bañeza
PAULET24 T005 T. longibrachiatum Alubia Carral Maragatería-Cepeda
PAULET25 T006 Trichoderma sp. Alubia San Esteban deNogales La Bañeza
PAULET26 T007 T. harzianum Alubia Sueros de Cepeda
Maragatería-Cepeda
PAULET27 T008 T. citrinoviride Alubia Fresno de la Vega Esla - Campos
PAULET28 T009 T. koningiopsis Alubia Acebes del Páramo El Páramo
PAULET29 T010 T. harzianum Alubia Acebes del Páramo El Páramo
PAULET30 T011 T. harzianum Alubia La Mata del Páramo
El Páramo
PAULET31 T012 T. harzianum Alubia Donillas Maragatería-Cepeda
PAULET32 T013 T. atroviride Alubia Donillas Maragatería-Cepeda

Anexos
164
Tabla A. 1: Aislamientos de R. solani y de Trichoderma empleados en los ensayos (continuación).
Código
colección
Código
laboratorio Especie Cultivo Localidad
Zona
productiva
PAULET33 T014 T. virens Alubia Villavante El Páramo
PAULET34 T015 T. harzianum Alubia Veguellina de Fondo El Páramo
PAULET35 T016 T. harzianum Alubia Bustillo del Páramo El Páramo
PAULET36 T017 Trichoderma sp. Alubia Bustillo del Páramo El Páramo
PAULET37 T018 T. harzianum Alubia Urdiales del Páramo El Páramo
PAULET38 T019 T. harzianum Alubia Villanueva de Carrizo
Maragatería-Cepeda
PAULET39 T020 T. harzianum Alubia Soto de la Vega La Bañeza
PAULET40 T021 T. harzianum Alubia Altobar de la Encomienda El Páramo
PAULET41 T022 T. harzianum Alubia Villaornate Esla - Campos
PAULET42 T023 Trichoderma sp. Alubia Jabares de los Oteros
Esla - Campos
Origen: Laboratorio
IMI 352941 T024 T. atroviride (Hermosa et al., 2000)
NBT59 T025 T. virens (Hermosa et al., 2004)
CECT2413(2) T34 T. harzianum (Kullnig et al., 2001)
Origen: Suelo
IASULE1 T027 T. velutinum Alubia Otero de Escarpizo
Maragatería-Cepeda
IASULE2 T028 T. velutinum Alubia Otero de Escarpizo
Maragatería-Cepeda
IASULE3 T029 T. velutinum Alubia Otero de Escarpizo
Maragatería-Cepeda
IASULE4 T030 T. viridescens Trigo Otero de Escarpizo
Maragatería-Cepeda

Ensayos in vivo
165
Tabla A. 1: Aislamientos de R. solani y de Trichoderma empleados en los ensayos (continuación).
Código
colección
Código
laboratorio Especie Cultivo Localidad
Zona
productiva
IASULE5 T031 T. koningiopsis Alubia Sueros de Cepeda
Maragatería-Cepeda
IASULE6 T032 T. virens Trigo San Juan de Torres La Bañeza
IASULE7 T033 T. harzianum Trigo San Juan de Torres La Bañeza
IASULE8 T034 T. harzianum Trigo San Juan de Torres La Bañeza
IASULE9 T035 T. harzianum Alubia San Juan de Torres La Bañeza
IASULE10 T036 T. velutinum Alubia San Juan de Torres La Bañeza
IASULE11 T037 T. velutinum Alubia San Juan de Torres La Bañeza
IASULE12 T038 T. viridescens Alubia Castrocontrigo La Cabrera
IASULE13 T039 T. virens Alubia Castrocontrigo La Cabrera
IASULE14 T040 T. koningiopsis Alubia Castrocontrigo La Cabrera
IASULE15 T041 T. viridescens Patata Castrocontrigo La Cabrera
IASULE16 T042 T. gamsii Patata Castrocontrigo La Cabrera
IASULE17 T043 T. virens Alubia Javares de los Oteros
Esla-Campos
IASULE18 T044 T. harzianum Alubia Javares de los Oteros
Esla-Campos
IASULE19 T045 T. harzianum Alubia Javares de los Oteros
Esla-Campos
IASULE20 T046 T. virens Soja Javares de los Oteros
Esla-Campos
IASULE21 T047 T. virens Maíz Cubillas Esla-Campos
IASULE22 T048 T. spirale. Maíz Cubillas Esla-Campos

Anexos
166
Tabla A. 1: Aislamientos de R. solani y de Trichoderma empleados en los ensayos (continuación).
Código
colección
Código
laboratorio Especie Cultivo Localidad
Zona
productiva
IASULE23 T049 T. virens Alubia Bercianos del Páramo Páramo
IASULE24 T050 T. harzianum Alubia Bercianos del Páramo Páramo
IASULE25 T051 T. velutinum Alubia Bercianos del Páramo Páramo
IASULE26 T052 T. harzianum Alubia Bercianos del Páramo Páramo
IASULE27 T053 T. virens Alubia Bercianos del Páramo Páramo
IASULE28 T054 T. brevicompactum Girasol Bercianos del Páramo Páramo
IASULE29 T055 T. harzianum Remolacha La Milla del Páramo Páramo
IASULE30 T056 T. hamatum Remolacha La Milla del Páramo Páramo
IASULE31 T057 T. gamsii Remolacha La Milla del Páramo Páramo
IASULE32 T058 T. harzianum Alubia La Milla del Páramo Páramo
IASULE33 T059 T. harzianum Alubia La Milla del Páramo Páramo
IASULE34 T060 T. harzianum Alubia La Milla del Páramo Páramo
IASULE35 T061 T. harzianum Alubia La Milla del Páramo Páramo
(1) PAULE: aislamientos de la colección de Patógenos y Antagonistas del Laboratorio de Diagnóstico de Plagas y Enfermedades de Vegetales de la Universidad de León. IASULE: aislamientos de la colección de Patógenos y Antagonistas del Grupo Universitario de Investigación en Ingeniería y Agricultura Sostenible de la Universidad de León. IMI, CABI Bioscience (Egham, Reino Unido); NBT, Newbiotechnic S.A. (Sevilla, España); CECT, Colección Española de Cultivo Tipo, (Burjasot, España). (2) Aislamiento empleado en el ensayo de ergosterol y escualeno.

Ensayos in vivo
167
Tabla A. 2: Germinación por maceta (Media ± Error estándar y porcentaje) de cada tratamiento medida a los 24 días tras la siembra.
Tratamiento Germinación día 24 % Tratamiento Germinación día 24 %
CC 1,606 ± 0,044 80,28 RC 1,389 ± 0,055 69,44 CT001 1,033 ± 0,140 51,67 RT001 0,900 ± 0,121 45,00 CT002 1,233 ± 0,149 61,67 RT002 0,700 ± 0,119 35,00 CT003 1,033 ± 0,131 51,67 RT003 0,567 ± 0,141 28,33 CT004 1,333 ± 0,111 66,67 RT004 0,667 ± 0,130 33,33 CT005 1,067 ± 0,117 53,33 RT005 0,833 ± 0,128 41,67 CT006 1,000 ± 0,117 50,00 RT006 0,833 ± 0,136 41,67 CT007 1,100 ± 0,139 55,00 RT007 0,400 ± 0,123 20,00 CT008 1,167 ± 0,108 58,33 RT008 1,200 ± 0,130 60,00 CT011 0,800 ± 0,139 40,00 RT011 0,233 ± 0,079 11,67 CT012 1,333 ± 0,111 66,67 RT012 0,467 ± 0,115 23,33 CT013 1,067 ± 0,117 53,33 RT013 0,867 ± 0,124 43,33 CT015 0,967 ± 0,112 48,33 RT015 0,367 ± 0,102 18,33 CT019 1,267 ± 0,117 63,33 RT019 0,667 ± 0,130 33,33 CT024 0,967 ± 0,140 48,33 RT024 0,167 ± 0,084 8,33 CT025 1,067 ± 0,143 53,33 RT025 0,233 ± 0,079 11,67 CT028 2,000 ± 0,000 100,00 RT028 1,967 ± 0,033 98,33 CT029 1,767 ± 0,079 88,33 RT029 1,633 ± 0,102 81,67 CT030 1,767 ± 0,079 88,33 RT030 1,700 ± 0,085 85,00 CT031 1,800 ± 0,074 90,00 RT031 1,500 ± 0,115 75,00 CT032 1,867 ± 0,063 93,33 RT032 1,400 ± 0,113 70,00 CT033 1,567 ± 0,104 78,33 RT033 1,400 ± 0,113 70,00 CT034 1,533 ± 0,115 76,67 RT034 1,633 ± 0,112 81,67 CT035 1,967 ± 0,033 98,33 RT035 1,900 ± 0,074 95,00 CT036 1,967 ± 0,033 98,33 RT036 2,000 ± 0,000 100,00 CT037 2,000 ± 0,000 100,00 RT037 1,867 ± 0,063 93,33 CT038 2,000 ± 0,000 100,00 RT038 1,933 ± 0,046 96,67 CT039 1,833 ± 0,069 91,67 RT039 1,800 ± 0,088 90,00 CT040 2,000 ± 0,000 100,00 RT040 1,933 ± 0,046 96,67 CT041 2,000 ± 0,000 100,00 RT041 1,967 ± 0,033 98,33 CT043 1,600 ± 0,123 80,00 RT043 1,667 ± 0,111 83,33 CT044 1,633 ± 0,112 81,67 RT044 1,767 ± 0,079 88,33 CT045 1,833 ± 0,069 91,67 RT045 1,433 ± 0,114 71,67 CT046 1,767 ± 0,092 88,33 RT046 1,600 ± 0,103 80,00 CT047 1,733 ± 0,095 86,67 RT047 1,567 ± 0,104 78,33 CT048 1,767 ± 0,092 88,33 RT048 1,767 ± 0,092 88,33 CT050 1,833 ± 0,069 91,67 RT050 1,867 ± 0,063 93,33 CT053 1,833 ± 0,069 91,67 RT053 1,700 ± 0,098 85,00 CT054 1,867 ± 0,063 93,33 RT054 1,733 ± 0,095 86,67 CT055 1,467 ± 0,115 73,33 RT055 1,600 ± 0,103 80,00 CT056 1,967 ± 0,033 98,33 RT056 1,733 ± 0,082 86,67 CT057 1,733 ± 0,082 86,67 RT057 1,833 ± 0,069 91,67 CT058 1,933 ± 0,046 96,67 RT058 1,900 ± 0,056 95,00

Anexos
168
Tabla A. 2: Germinación por maceta (Media ± Error estándar) de cada tratamiento medida a los 24 días tras la siembra (continuación).
Tratamiento Germinación día 24 % Tratamiento Germinación día 24 %
CT059 1,933 ± 0,046 96,67 RT059 1,833 ± 0,084 91,67 CT060 1,767 ± 0,092 88,33 RT060 1,833 ± 0,069 91,67 CT061 1,933 ± 0,046 96,67 RT061 1,933 ± 0,046 96,67

Ensayos in vivo
169
Tabla A. 3: Evaluación a los 45 días tras la siembra del diámetro del hipocotilo (Media ± Error estándar) (mm) y de la longitud del sistema radicular (Media ± Error estándar) (cm).
Trat. (1) Diámetro del hipocotilo (mm) Trat. (1) Longitud del sistema radicular (cm)
CT035 4,11 ± 0,07 a RT050 20,87 ± 0,86 a
RT057 4,05 ± 0,14 ab CT045 19,94 ± 0,80 ab
CT041 3,96 ± 0,06 abc RT048 19,91 ± 0,77 abc
RT048 3,95 ± 0,13 abc RT043 19,27 ± 1,20 abcd
CT028 3,94 ± 0,11 abc CT050 19,24 ± 0,90 abcd
CT031 3,93 ± 0,22 abc CT028 19,18 ± 0,65 abcde
CT040 3,92 ± 0,07 abcd RT036 18,82 ± 2,63 abcdef
CT037 3,92 ± 0,07 abcd RT046 18,70 ± 1,20 abcdef
RT035 3,90 ± 0,13 abcde CT059 18,57 ± 0,66 abcdefg
CT038 3,87 ± 0,07 abcdef CT047 18,32 ± 0,84 abcdefgh
CT053 3,87 ± 0,16 abcdef RT059 18,29 ± 0,70 abcdefgh
CT036 3,85 ± 0,10 abcdef RT060 18,15 ± 0,79 abcdefghi
CT059 3,85 ± 0,12 abcdef CT053 18,01 ± 0,84 abcdefghij
RT041 3,82 ± 0,11 abcdefg RT044 17,91 ± 0,97 abcdefghij
RT059 3,81 ± 0,13 abcdefgh RT057 17,89 ± 0,74 abcdefghij
CT061 3,81 ± 0,08 abcdefgh CT048 17,79 ± 0,78 abcdefghijk
RT034 3,78 ± 0,25 abcdefghi CT043 17,73 ± 1,14 abcdefghijkl
CT045 3,78 ± 0,13 abcdefghi RT053 17,34 ± 1,07 bcdefghijklm
RT060 3,78 ± 0,14 abcdefghi CT046 17,25 ± 0,98 bcdefghijklm
CT039 3,77 ± 0,14 abcdefghij CT032 17,20 ± 0,76 bcdefghijklm
CT030 3,76 ± 0,20 abcdefghij CT035 17,20 ± 0,44 bcdefghijklm
CT048 3,75 ± 0,16 abcdefghij RT040 17,13 ± 0,63 bcdefghijklmn
RT036 3,75 ± 0,12 abcdefghij RT054 17,10 ± 0,99 bcdefghijklmn
CT032 3,73 ± 0,15 abcdefghij CT060 16,98 ± 0,84 bcdefghijklmn
RT028 3,73 ± 0,10 abcdefghij CT058 16,94 ± 0,60 bcdefghijklmn
RT040 3,69 ± 0,11 abcdefghij CT057 16,80 ± 0,85 bcdefghijklmno
CT047 3,68 ± 0,16 abcdefghijk RT028 16,70 ± 0,61 bcdefghijklmno
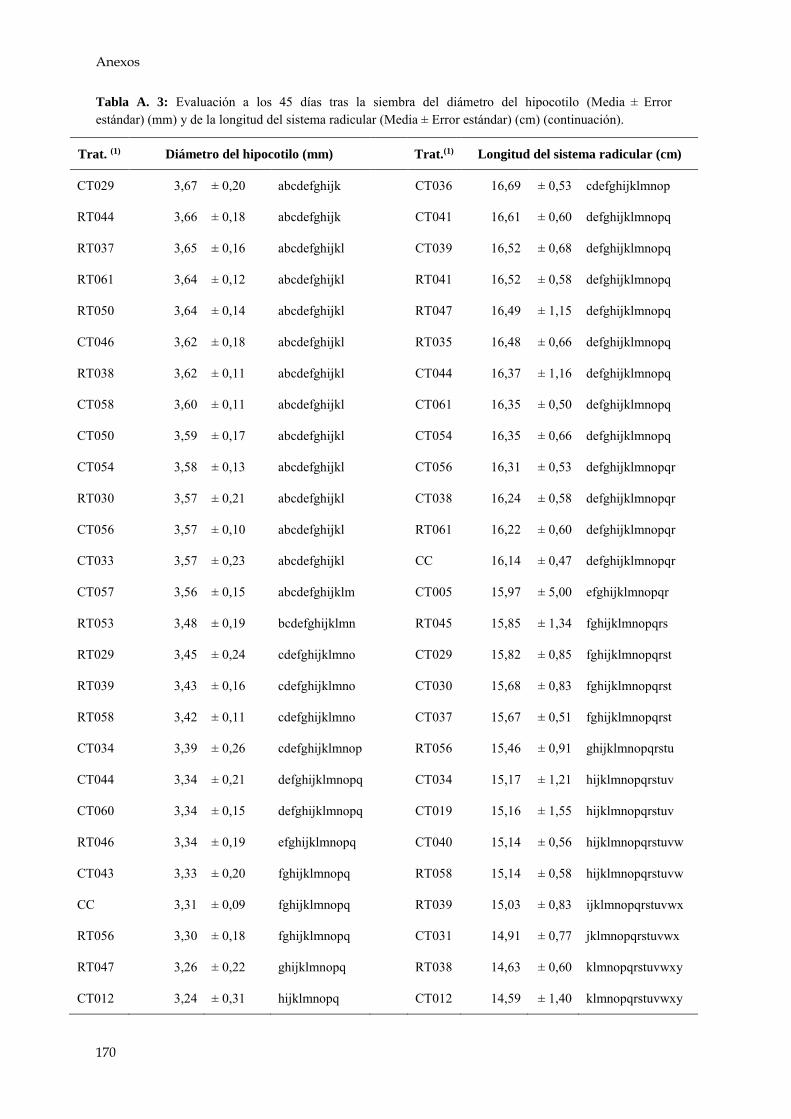
170
Anexos
Tabla A. 3: Evaluación a los 45 días tras la siembra del diámetro del hipocotilo (Media ± Error estándar) (mm) y de la longitud del sistema radicular (Media ± Error estándar) (cm) (continuación).
Trat. (1) Diámetro del hipocotilo (mm) Trat.(1) Longitud del sistema radicular (cm)
CT029 3,67 ± 0,20 abcdefghijk CT036 16,69 ± 0,53 cdefghijklmnop
RT044 3,66 ± 0,18 abcdefghijk CT041 16,61 ± 0,60 defghijklmnopq
RT037 3,65 ± 0,16 abcdefghijkl CT039 16,52 ± 0,68 defghijklmnopq
RT061 3,64 ± 0,12 abcdefghijkl RT041 16,52 ± 0,58 defghijklmnopq
RT050 3,64 ± 0,14 abcdefghijkl RT047 16,49 ± 1,15 defghijklmnopq
CT046 3,62 ± 0,18 abcdefghijkl RT035 16,48 ± 0,66 defghijklmnopq
RT038 3,62 ± 0,11 abcdefghijkl CT044 16,37 ± 1,16 defghijklmnopq
CT058 3,60 ± 0,11 abcdefghijkl CT061 16,35 ± 0,50 defghijklmnopq
CT050 3,59 ± 0,17 abcdefghijkl CT054 16,35 ± 0,66 defghijklmnopq
CT054 3,58 ± 0,13 abcdefghijkl CT056 16,31 ± 0,53 defghijklmnopqr
RT030 3,57 ± 0,21 abcdefghijkl CT038 16,24 ± 0,58 defghijklmnopqr
CT056 3,57 ± 0,10 abcdefghijkl RT061 16,22 ± 0,60 defghijklmnopqr
CT033 3,57 ± 0,23 abcdefghijkl CC 16,14 ± 0,47 defghijklmnopqr
CT057 3,56 ± 0,15 abcdefghijklm CT005 15,97 ± 5,00 efghijklmnopqr
RT053 3,48 ± 0,19 bcdefghijklmn RT045 15,85 ± 1,34 fghijklmnopqrs
RT029 3,45 ± 0,24 cdefghijklmno CT029 15,82 ± 0,85 fghijklmnopqrst
RT039 3,43 ± 0,16 cdefghijklmno CT030 15,68 ± 0,83 fghijklmnopqrst
RT058 3,42 ± 0,11 cdefghijklmno CT037 15,67 ± 0,51 fghijklmnopqrst
CT034 3,39 ± 0,26 cdefghijklmnop RT056 15,46 ± 0,91 ghijklmnopqrstu
CT044 3,34 ± 0,21 defghijklmnopq CT034 15,17 ± 1,21 hijklmnopqrstuv
CT060 3,34 ± 0,15 defghijklmnopq CT019 15,16 ± 1,55 hijklmnopqrstuv
RT046 3,34 ± 0,19 efghijklmnopq CT040 15,14 ± 0,56 hijklmnopqrstuvw
CT043 3,33 ± 0,20 fghijklmnopq RT058 15,14 ± 0,58 hijklmnopqrstuvw
CC 3,31 ± 0,09 fghijklmnopq RT039 15,03 ± 0,83 ijklmnopqrstuvwx
RT056 3,30 ± 0,18 fghijklmnopq CT031 14,91 ± 0,77 jklmnopqrstuvwx
RT047 3,26 ± 0,22 ghijklmnopq RT038 14,63 ± 0,60 klmnopqrstuvwxy
CT012 3,24 ± 0,31 hijklmnopq CT012 14,59 ± 1,40 klmnopqrstuvwxy

Ensayos in vivo
171
Tabla A. 3: Evaluación a los 45 días tras la siembra del diámetro del hipocotilo (Media ± Error estándar) (mm) y de la longitud del sistema radicular (Media ± Error estándar) (cm) (continuación).
Trat. (1) Diámetro del hipocotilo (mm) Trat. (1) Longitud del sistema radicular (cm)
RT043 3,21 ± 0,20 ijklmnopq RT055 14,53 ± 1,03 lmnopqrstuvwxy
RT054 3,19 ± 0,18 jklmnopq CT033 14,18 ± 1,00 mnopqrstuvwxy
RT032 3,10 ± 0,31 klmnopqr CT004 13,95 ± 1,34 nopqrstuvwxyz
RT031 3,08 ± 0,25 lmnopqr CT055 13,70 ± 1,12 opqrstuvwxyz
CT019 2,98 ± 0,31 mnopqrs RT030 13,61 ± 0,88 opqrstuvwxyz
RT055 2,91 ± 0,20 nopqrst RT029 13,46 ± 0,99 pqrstuvwxyzA
RC 2,89 ± 0,11 opqrst CT008 13,41 ± 1,45 qrstuvwxyzA
RT033 2,88 ± 0,27 pqrst RT008 13,01 ± 1,40 rstuvwxyzA
CT004 2,82 ± 0,27 pqrstu RT037 12,68 ± 0,76 stuvwxyzAB
RT045 2,81 ± 0,23 qrstu RC 12,61 ± 0,49 stuvwxyzAB
CT055 2,59 ± 0,20 rstuv CT002 12,61 ± 1,28 tuvwxyzAB
CT025 2,56 ± 0,32 rstuvw CT025 12,31 ± 1,50 uvwxyzAB
CT007 2,55 ± 0,32 rstuvw RT034 12,24 ± 0,88 uvwxyzABC
RT008 2,53 ± 0,28 rstuvw RT032 11,93 ± 1,05 vwxyzABC
CT015 2,46 ± 0,33 stuvw CT013 11,91 ± 1,42 wxyzABC
CT002 2,45 ± 0,25 tuvw RT031 11,88 ± 1,05 xyzABC
CT013 2,37 ± 0,29 tuvwx CT003 11,59 ± 1,43 yzABC
CT024 2,35 ± 0,33 tuvwx CT001 11,56 ± 1,46 yzABC
CT008 2,29 ± 0,26 uvwx CT015 11,56 ± 1,56 yzABC
CT001 2,22 ± 0,28 vwxy CT007 11,49 ± 1,46 yzABCD
CT006 2,15 ± 0,27 vwxy RT033 10,88 ± 1,08 zABCD
CT003 2,13 ± 0,28 vwxyz CT006 10,76 ± 1,33 zABCD
CT005 2,12 ± 0,27 vwxyz CT024 10,25 ± 1,41 ABCDE
CT011 2,08 ± 0,32 vwxyz CT011 9,62 ± 1,52 BCDEF
RT001 1,99 ± 0,30 wxyz RT001 9,46 ± 1,38 BCDEF
RT005 1,87 ± 0,29 xyzA RT005 9,07 ± 1,39 CDEF
RT013 1,80 ± 0,28 xyzAB RT006 8,31 ± 1,31 DEFG

172
Anexos
Tabla A. 3: Evaluación a los 45 días tras la siembra del diámetro del hipocotilo (Media ± Error estándar) (mm) y de la longitud del sistema radicular (Media ± Error estándar) (cm) (continuación).
Trat. (1) Diámetro del hipocotilo (mm) Trat. (1) Longitud del sistema radicular (cm)
RT006 1,65 ± 0,26 yzAB RT013 8,28 ± 1,29 DEFG
RT019 1,56 ± 0,29 zABC RT002 7,42 ± 1,34 EFGH
RT004 1,31 ± 0,24 ABCD RT019 7,33 ± 1,38 EFGH
RT002 1,28 ± 0,23 BCD RT004 6,96 ± 1,26 FGHI
RT003 1,23 ± 0,25 BCD RT003 6,56 ± 1,33 FGHI
RT012 1,07 ± 0,26 CDE RT012 5,60 ± 1,34 GHIJ
RT015 0,88 ± 0,24 DEF RT015 4,77 ± 1,27 HIJK
RT007 0,83 ± 0,24 DEF RT007 3,98 ± 1,12 IJK
RT011 0,55 ± 0,20 EF RT011 2,70 ± 0,98 JK
RT025 0,49 ± 0,18 F RT025 2,63 ± 0,95 JK
RT024 0,35 ± 0,15 F RT024 1,76 ± 0,76 K
En la comparación de medias, los valores con letras diferentes presentan diferencias significativas (test DMS, p < 0,05).
(1) Trat.: Tratamientos, El control representa aquellas semillas que no se ha inoculado ningún hongo (CC) o biensólo R. solani (RC) y si han sido inoculados sólo con el aislamiento correspondiente de Trichoderma (CT-#) o sihan sido inoculado tanto con el aislamiento de Trichoderma como con R. solani (RT-#).

Ensayos in vivo
173
Tabla A. 4: Evaluación a los 45 días tras la siembra del peso húmedo (Media ± Error estándar) (g) y del peso seco (Media ± Error estándar) (g) de la parte aérea.
Trat.(1) Peso húmedo de la parte aérea (g) Trat.(1) Peso seco de la parte aérea (g)
CT033 17,89 ± 1,56 a CT032 3,96 ± 0,17 a
CT028 17,53 ± 1,08 ab CT033 3,84 ± 0,27 ab
CT034 17,28 ± 1,58 abc RT029 3,75 ± 0,27 abc
CT035 17,24 ± 0,98 abc CT034 3,71 ± 0,28 abc
CT039 16,99 ± 1,07 abc CT029 3,71 ± 0,20 abc
RT029 16,95 ± 1,47 abc CT031 3,60 ± 0,19 abcd
CT032 16,28 ± 0,97 abcd RT030 3,56 ± 0,22 bcd
RT035 16,28 ± 1,11 abcd CT030 3,47 ± 0,19 dc
RT038 16,24 ± 1,18 abcd RT031 3,32 ± 0,28 de
CT037 15,85 ± 0,90 abcde RT034 3,29 ± 0,24 def
RT028 15,56 ± 0,86 abcdef RT032 2,97 ± 0,27 ef
CT036 15,41 ± 0,86 abcdefg RT033 2,94 ± 0,28 f
CT041 15,33 ± 0,87 bcdefg CT028 2,12 ± 0,13 g
RT040 15,22 ± 1,00 bcdefgh RT028 2,10 ± 0,11 gh
CT038 15,10 ± 0,87 bcdefgh RT038 1,87 ± 0,12 ghi
CT029 15,09 ± 1,03 bcdefgh CT039 1,86 ± 0,12 ghij
CT040 15,02 ± 0,99 bcdefghi CT038 1,85 ± 0,10 ghij
RT041 14,86 ± 0,81 cdefghij CT037 1,84 ± 0,09 ghij
RT031 14,36 ± 1,39 defghijk CT035 1,84 ± 0,10 ghijk
RT039 14,36 ± 1,27 defghijk RT040 1,83 ± 0,12 ghijk
RT030 14,35 ± 1,08 defghijk CT061 1,81 ± 0,08 ghijkl
CT031 13,89 ± 0,97 defghijkl RT041 1,79 ± 0,10 ghijkl
CT061 13,79 ± 0,61 defghijklm CC 1,76 ± 0,08 ghijkl
RT036 13,78 ± 1,17 defghijklm CT041 1,75 ± 0,11 hijklm
RT059 13,58 ± 0,67 efghijklmn RT035 1,71 ± 0,11 ijklmn
CT054 13,44 ± 0,72 efghijklmno RT057 1,66 ± 0,08 ijklmno
RT048 13,44 ± 0,62 efghijklmno RT059 1,66 ± 0,09 ijklmno

174
Anexos
Tabla A. 4: Evaluación a los 45 días tras la siembra del peso húmedo (Media ± Error estándar) (g) y del peso seco (Media ± Error estándar) (g) de la parte aérea (continuación).
Trat.(1) Peso húmedo de la parte aérea (g) Trat.(1) Peso seco de la parte aérea (g)
RT057 13,40 ± 0,63 efghijklmno CT040 1,66 ± 0,10 ijklmno
RT034 13,22 ± 1,29 fghijklmnop CT058 1,66 ± 0,18 ijklmnop
CT030 13,15 ± 0,92 fghijklmnop CT059 1,65 ± 0,08 ijklmnop
CT019 12,96 ± 1,62 ghijklmnopq RT036 1,63 ± 0,12 ijklmnopq
CT059 12,70 ± 0,55 hijklmnopqr RT060 1,59 ± 0,07 ijklmnopqr
CT048 12,69 ± 0,71 hijklmnopqr CT036 1,59 ± 0,09 ijklmnopqr
CC 12,52 ± 0,55 ijklmnopqrs CT054 1,58 ± 0,08 ijklmnopqr
RT033 12,48 ± 1,38 ijklmnopqrs RT039 1,58 ± 0,13 ijklmnopqr
RT032 12,43 ± 1,33 jklmnopqrs RC 1,57 ± 0,08 ijklmnopqrs
RT060 12,42 ± 0,63 jklmnopqrst CT057 1,56 ± 0,09 ijklmnopqrs
CT060 12,23 ± 0,77 klmnopqrst CT050 1,55 ± 0,08 ijklmnopqrs
RT044 12,07 ± 0,75 klmnopqrstu CT060 1,54 ± 0,09 ijklmnopqrs
CT050 11,93 ± 0,65 klmnopqrstu RT048 1,49 ± 0,07 jklmnopqrst
CT045 11,86 ± 0,59 klmnopqrstu CT048 1,47 ± 0,09 klmnopqrst
RT061 11,84 ± 0,54 klmnopqrstu RT061 1,47 ± 0,07 klmnopqrst
RT050 11,68 ± 0,58 lmnopqrstuv CT045 1,46 ± 0,07 lmnopqrst
RT055 11,65 ± 0,92 lmnopqrstuv RT055 1,40 ± 0,11 mnopqrst
RT037 11,56 ± 0,91 lmnopqrstuv CT056 1,39 ± 0,06 nopqrst
CT057 11,52 ± 0,67 lmnopqrstuv CT053 1,38 ± 0,08 nopqrst
CT056 11,41 ± 0,49 lmnopqrstuvw RT037 1,38 ± 0,11 nopqrst
CT044 11,37 ± 0,80 lmnopqrstuvw RT050 1,37 ± 0,07 nopqrst
CT053 11,32 ± 0,60 mnopqrstuvw CT044 1,35 ± 0,10 nopqrstu
RT046 11,25 ± 0,73 mnopqrstuvw RT046 1,33 ± 0,09 opqrstuv
CT058 11,19 ± 0,54 nopqrstuvwx CT019 1,33 ± 0,16 opqrstuv
CT047 11,03 ± 0,60 nopqrstuvwx RT044 1,33 ± 0,08 opqrstuv
CT046 11,01 ± 0,71 opqrstuvwxy CT046 1,32 ± 0,08 opqrstuv
RC 10,72 ± 0,50 pqrstuvwxy CT047 1,31 ± 0,07 opqrstuv

Ensayos in vivo
175
Tabla A. 4: Evaluación a los 45 días tras la siembra del peso húmedo (Media ± Error estándar) (g) y del peso seco (Media ± Error estándar) (g) de la parte aérea (continuación).
Trat.(1) Peso húmedo de la parte aérea (g) Trat.(1) Peso seco de la parte aérea (g)
RT056 10,68 ± 0,71 pqrstuvwxy RT058 1,30 ± 0,07 pqrstuvw
RT043 10,54 ± 0,71 qrstuvwxy RT043 1,29 ± 0,09 qrstuvw
RT058 10,48 ± 0,54 qrstuvwxy RT056 1,29 ± 0,08 qrstuvw
RT054 10,42 ± 0,78 qrstuvwxy RT053 1,27 ± 0,08 rstuvw
RT053 10,37 ± 0,70 rstuvwxy RT047 1,26 ± 0,09 rstuvwx
RT047 10,00 ± 0,77 stuvwxy RT054 1,25 ± 0,09 rstuvwx
CT043 9,88 ± 0,69 tuvwxyz CT043 1,24 ± 0,08 rstuvwx
CT025 9,64 ± 1,36 uvwxyzA CT055 1,21 ± 0,11 stuvwx
CT055 9,20 ± 0,81 vwxyzAB RT045 1,15 ± 0,10 tuvwxy
CT012 8,89 ± 1,04 wxyzAB CT025 0,99 ± 0,14 uvwxyz
CT007 8,88 ± 1,27 wxyzAB CT007 0,98 ± 0,14 vwxyz
RT045 8,64 ± 0,80 xyzAB CT012 0,94 ± 0,11 wxyz
CT011 8,51 ± 1,56 yzAB CT011 0,90 ± 0,16 xyzA
RT019 7,37 ± 1,48 zAB RT019 0,81 ± 0,16 yzAB
CT024 7,26 ± 1,12 AB CT015 0,77 ± 0,12 zABC
CT015 7,05 ± 1,03 B CT024 0,77 ± 0,12 zABC
RT012 4,12 ± 1,04 C CT013 0,58 ± 0,08 ABCD
CT008 3,90 ± 0,51 CD CT002 0,57 ± 0,07 ABCD
RT015 3,81 ± 1,10 CD CT003 0,56 ± 0,13 ABCD
CT004 3,54 ± 0,39 CDE CT004 0,56 ± 0,06 ABCD
CT013 3,54 ± 0,49 CDE RT012 0,55 ± 0,13 ABCD
RT007 3,50 ± 1,11 CDE RT008 0,51 ± 0,06 BCDE
RT008 3,43 ± 0,42 CDE CT008 0,49 ± 0,06 BCDE
CT002 3,17 ± 0,38 CDE CT005 0,49 ± 0,07 BCDE
CT006 3,04 ± 0,42 CDE CT006 0,47 ± 0,07 BCDE
RT005 2,97 ± 0,52 CDE RT015 0,45 ± 0,13 BCDE
CT005 2,65 ± 0,37 CDE CT001 0,41 ± 0,06 CDE

176
Anexos
Tabla A. 4: Evaluación a los 45 días tras la siembra del peso húmedo (Media ± Error estándar) (g) y del peso seco (Media ± Error estándar) (g) de la parte aérea (continuación).
Trat.(1) Peso húmedo de la parte aérea (g) Trat.(1) Peso seco de la parte aérea (g)
RT006 2,50 ± 0,45 CDE RT007 0,40 ± 0,13 DE
RT013 2,43 ± 0,46 CDE RT005 0,40 ± 0,07 DE
CT003 2,33 ± 0,32 CDE RT013 0,39 ± 0,07 DE
RT001 2,29 ± 0,37 CDE RT001 0,38 ± 0,06 DE
CT001 2,27 ± 0,32 CDE RT006 0,33 ± 0,06 DE
RT025 1,85 ± 0,67 CDE RT002 0,32 ± 0,06 DE
RT004 1,83 ± 0,36 CDE RT004 0,32 ± 0,06 DE
RT002 1,81 ± 0,36 CDE RT003 0,28 ± 0,07 DE
RT003 1,72 ± 0,41 CDE RT025 0,24 ± 0,08 DE
RT011 1,42 ± 0,55 DE RT011 0,16 ± 0,06 E
RT024 1,23 ± 0,61 E RT024 0,16 ± 0,08 E
En la comparación de medias, los valores con letras diferentes presentan diferencias significativas (test DMS, p < 0,05).
(1) Trat.: Tratamientos, El control representa aquellas semillas que no se ha inoculado ningún hongo (CC) obien sólo R. solani (RC) y si han sido inoculados sólo con el aislamiento correspondiente de Trichoderma(CT-#) o si han sido inoculado tanto con el aislamiento de Trichoderma como con R. solani (RT-#).

Ensayos in vivo
177
Tabla A. 5: Evaluación a los 45 días tras la siembra del peso húmedo (Media ± Error estándar) (g) y del peso seco (Media ± Error estándar) (g) del sistema radicular.
Trat.(1) Peso húmedo del sistema radicular (g) Trat.(1) Peso seco del sistema radicular (g)
CT019 3,23 ± 0,49 a RT059 0,51 ± 0,25 a
CT061 2,96 ± 0,15 ab RT056 0,41 ± 0,18 b
CT060 2,78 ± 0,20 ab RT060 0,27 ± 0,02 c
RT043 2,66 ± 0,20 bcd CT061 0,27 ± 0,01 c
RT050 2,61 ± 0,18 bcde RT043 0,27 ± 0,02 cd
RT061 2,61 ± 0,21 bcde RT050 0,25 ± 0,02 cde
RT048 2,57 ± 0,15 bcde RT061 0,25 ± 0,02 cde
CT059 2,53 ± 0,21 bcdef RT048 0,25 ± 0,01 cde
CT057 2,51 ± 0,23 bcdefg CT043 0,25 ± 0,02 cde
CT054 2,50 ± 0,20 bcdefg CT057 0,24 ± 0,02 cde
CT044 2,48 ± 0,24 bcdefgh RT057 0,24 ± 0,01 cde
RT060 2,46 ± 0,16 bcdefghi CT044 0,24 ± 0,02 cde
CT028 2,45 ± 0,22 bcdefghij CT060 0,24 ± 0,02 cdef
RT047 2,44 ± 0,21 bcdefghij CT050 0,24 ± 0,02 cdef
CT012 2,43 ± 0,30 bcdefghij CT059 0,24 ± 0,01 cdefg
CT025 2,40 ± 0,39 cdefghij RT047 0,23 ± 0,02 cdefgh
RT057 2,39 ± 0,14 cdefghij CT054 0,23 ± 0,02 cdefgh
RT059 2,37 ± 0,18 cdefghij RT053 0,22 ± 0,01 cdefghi
CT046 2,32 ± 0,18 cdefghij RT045 0,21 ± 0,02 cdefghij
RT053 2,32 ± 0,16 cdefghij CT045 0,20 ± 0,02 cdefghijk
RT056 2,27 ± 0,18 cdefghijk CT047 0,20 ± 0,01 cdefghijkl
CT050 2,27 ± 0,15 cdefghijk RT046 0,20 ± 0,02 cdefghijkl
RT046 2,22 ± 0,21 defghijkl CT028 0,20 ± 0,02 cdefghijkl
CT032 2,18 ± 0,18 defghijkl RT044 0,20 ± 0,02 cdefghijkl
RT045 2,13 ± 0,23 efghijklm CT058 0,20 ± 0,01 cdefghijkl
CT045 2,13 ± 0,16 efghijklm CT019 0,20 ± 0,03 cdefghijkl
RT044 2,12 ± 0,20 efghijklm RT058 0,19 ± 0,02 cdefghijklm
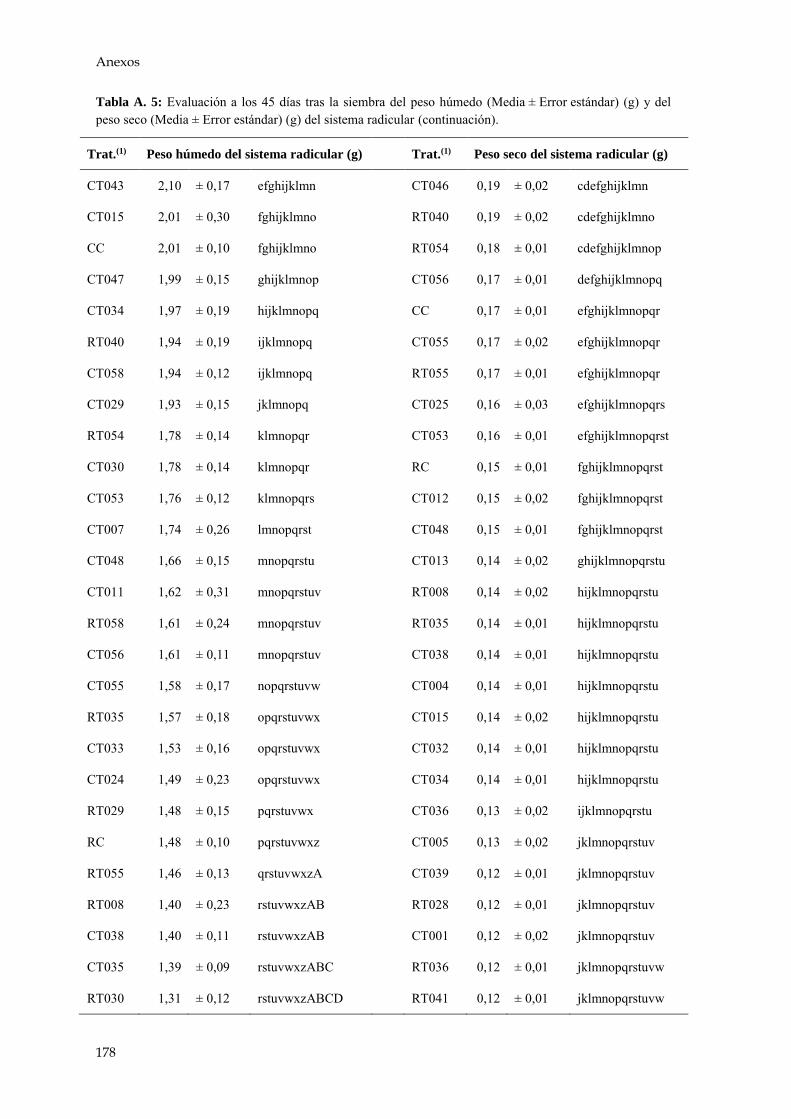
178
Anexos
Tabla A. 5: Evaluación a los 45 días tras la siembra del peso húmedo (Media ± Error estándar) (g) y del peso seco (Media ± Error estándar) (g) del sistema radicular (continuación).
Trat.(1) Peso húmedo del sistema radicular (g) Trat.(1) Peso seco del sistema radicular (g)
CT043 2,10 ± 0,17 efghijklmn CT046 0,19 ± 0,02 cdefghijklmn
CT015 2,01 ± 0,30 fghijklmno RT040 0,19 ± 0,02 cdefghijklmno
CC 2,01 ± 0,10 fghijklmno RT054 0,18 ± 0,01 cdefghijklmnop
CT047 1,99 ± 0,15 ghijklmnop CT056 0,17 ± 0,01 defghijklmnopq
CT034 1,97 ± 0,19 hijklmnopq CC 0,17 ± 0,01 efghijklmnopqr
RT040 1,94 ± 0,19 ijklmnopq CT055 0,17 ± 0,02 efghijklmnopqr
CT058 1,94 ± 0,12 ijklmnopq RT055 0,17 ± 0,01 efghijklmnopqr
CT029 1,93 ± 0,15 jklmnopq CT025 0,16 ± 0,03 efghijklmnopqrs
RT054 1,78 ± 0,14 klmnopqr CT053 0,16 ± 0,01 efghijklmnopqrst
CT030 1,78 ± 0,14 klmnopqr RC 0,15 ± 0,01 fghijklmnopqrst
CT053 1,76 ± 0,12 klmnopqrs CT012 0,15 ± 0,02 fghijklmnopqrst
CT007 1,74 ± 0,26 lmnopqrst CT048 0,15 ± 0,01 fghijklmnopqrst
CT048 1,66 ± 0,15 mnopqrstu CT013 0,14 ± 0,02 ghijklmnopqrstu
CT011 1,62 ± 0,31 mnopqrstuv RT008 0,14 ± 0,02 hijklmnopqrstu
RT058 1,61 ± 0,24 mnopqrstuv RT035 0,14 ± 0,01 hijklmnopqrstu
CT056 1,61 ± 0,11 mnopqrstuv CT038 0,14 ± 0,01 hijklmnopqrstu
CT055 1,58 ± 0,17 nopqrstuvw CT004 0,14 ± 0,01 hijklmnopqrstu
RT035 1,57 ± 0,18 opqrstuvwx CT015 0,14 ± 0,02 hijklmnopqrstu
CT033 1,53 ± 0,16 opqrstuvwx CT032 0,14 ± 0,01 hijklmnopqrstu
CT024 1,49 ± 0,23 opqrstuvwx CT034 0,14 ± 0,01 hijklmnopqrstu
RT029 1,48 ± 0,15 pqrstuvwx CT036 0,13 ± 0,02 ijklmnopqrstu
RC 1,48 ± 0,10 pqrstuvwxz CT005 0,13 ± 0,02 jklmnopqrstuv
RT055 1,46 ± 0,13 qrstuvwxzA CT039 0,12 ± 0,01 jklmnopqrstuv
RT008 1,40 ± 0,23 rstuvwxzAB RT028 0,12 ± 0,01 jklmnopqrstuv
CT038 1,40 ± 0,11 rstuvwxzAB CT001 0,12 ± 0,02 jklmnopqrstuv
CT035 1,39 ± 0,09 rstuvwxzABC RT036 0,12 ± 0,01 jklmnopqrstuvw
RT030 1,31 ± 0,12 rstuvwxzABCD RT041 0,12 ± 0,01 jklmnopqrstuvw

Ensayos in vivo
179
Tabla A. 5: Evaluación a los 45 días tras la siembra del peso húmedo (Media ± Error estándar) (g) y del peso seco (Media ± Error estándar) (g) del sistema radicular (continuación).
Trat.(1) Peso húmedo del sistema radicular (g) Trat.(1) Peso seco del sistema radicular (g)
RT032 1,29 ± 0,16 rstuvwxzABCD CT037 0,12 ± 0,01 jklmnopqrstuvw
CT041 1,28 ± 0,10 rstuvwxzABCD CT002 0,12 ± 0,02 jklmnopqrstuvw
CT031 1,24 ± 0,16 stuvwxzABCD CT024 0,12 ± 0,02 jklmnopqrstuvw
RT019 1,22 ± 0,25 tuvwxzABCD CT007 0,12 ± 0,02 jklmnopqrstuvw
RT036 1,21 ± 0,11 tuvwxzABCD CT030 0,12 ± 0,01 jklmnopqrstuvw
RT041 1,17 ± 0,08 uvwxzABCDE CT035 0,12 ± 0,01 jklmnopqrstuvw
RT034 1,15 ± 0,09 uvwxzABCDE CT008 0,12 ± 0,01 jklmnopqrstuvw
CT039 1,15 ± 0,09 uvwxzABCDE CT041 0,11 ± 0,01 klmnopqrstuvw
RT007 1,12 ± 0,36 vwxzABCDE CT040 0,11 ± 0,01 klmnopqrstuvw
RT012 1,12 ± 0,33 vwxzABCDE CT029 0,11 ± 0,01 klmnopqrstuvw
RT031 1,08 ± 0,12 wxzABCDEF CT006 0,11 ± 0,02 klmnopqrstuvw
RT015 1,06 ± 0,33 wxzABCDEFG CT011 0,11 ± 0,02 lmnopqrstuvw
CT008 1,04 ± 0,14 xzABCDEFGH RT013 0,10 ± 0,02 mnopqrstuvw
CT036 1,02 ± 0,07 zABCDEFGHI RT032 0,10 ± 0,01 mnopqrstuvw
RT039 1,02 ± 0,10 zABCDEFGHI RT039 0,10 ± 0,01 mnopqrstuvw
CT013 0,96 ± 0,16 zABCDEFGHIJ RT006 0,10 ± 0,02 mnopqrstuvw
CT004 0,95 ± 0,13 ABCDEFGHIJ CT033 0,10 ± 0,01 mnopqrstuvw
RT028 0,94 ± 0,07 ABCDEFGHIJ RT019 0,10 ± 0,02 mnopqrstuvw
CT040 0,88 ± 0,05 BCDEFGHIJK CT003 0,10 ± 0,01 mnopqrstuvw
CT037 0,87 ± 0,07 CDEFGHIJKL RT038 0,09 ± 0,01 mnopqrstuvw
RT038 0,85 ± 0,07 DEFGHIJKL RT029 0,09 ± 0,01 nopqrstuvw
CT005 0,85 ± 0,14 DEFGHIJKL RT001 0,09 ± 0,02 opqrstuvw
RT037 0,81 ± 0,07 DEFGHIJKLM RT015 0,09 ± 0,03 opqrstuvw
RT005 0,81 ± 0,15 DEFGHIJKLM RT005 0,09 ± 0,02 pqrstuvw
RT033 0,67 ± 0,07 EFGHIJKLMN RT031 0,09 ± 0,01 qrstuvw
RT006 0,66 ± 0,12 EFGHIJKLMN RT003 0,09 ± 0,02 qrstuvw
CT006 0,66 ± 0,10 EFGHIJKLMN CT031 0,08 ± 0,01 qrstuvw

180
Anexos
Tabla A. 5: Evaluación a los 45 días tras la siembra del peso húmedo (Media ± Error estándar) (g) y del peso seco (Media ± Error estándar) (g) del sistema radicular (continuación).
Trat.(1) Peso húmedo del sistema radicular (g) Trat.(1) Peso seco del sistema radicular (g)
RT013 0,56 ± 0,15 FGHIJKLMN RT004 0,08 ± 0,02 qrstuvw
CT002 0,53 ± 0,08 GHIJKLMN RT030 0,08 ± 0,01 qrstuvw
CT003 0,52 ± 0,08 HIJKLMN RT037 0,08 ± 0,01 rstuvw
CT001 0,51 ± 0,07 IJKLMN RT012 0,08 ± 0,02 rstuvw
RT001 0,46 ± 0,09 JKLMN RT034 0,07 ± 0,01 stuvw
RT003 0,40 ± 0,10 KLMN RT007 0,07 ± 0,02 stuvw
RT011 0,38 ± 0,16 KLMN RT002 0,06 ± 0,01 tuvw
RT002 0,36 ± 0,08 LMN RT033 0,05 ± 0,01 uvw
RT004 0,31 ± 0,07 MN RT011 0,04 ± 0,01 vw
RT025 0,28 ± 0,11 N RT025 0,04 ± 0,01 vw
RT024 0,27 ± 0,18 N RT024 0,03 ± 0,02 w
En la comparación de medias, los valores con letras diferentes presentan diferencias significativas (test DMS, p < 0,05).
(1) Trat.: Tratamientos, El control representa aquellas semillas que no se ha inoculado ningún hongo (CC) obien sólo R. solani (RC) y si han sido inoculados sólo con el aislamiento correspondiente de Trichoderma(CT-#) o si han sido inoculado tanto con el aislamiento de Trichoderma como con R. solani (RT-#).

Secuencia del transcriptoma de los genes de estudio
181
2. SECUENCIA DEL TRANSCRIPTOMA DE LOS GENES DE ESTUDIO
2.1. α-actin chr15
Localización: Glyma.15G050200 cromosoma 15
5´UTR CDS 3´UTR Primers
TTTTCTTTTCCAACATTTTCCACAATAGTCTCGCGTTGCTTGGAATAGATTTATCTCGAAACCAAACACTCA
AAACTGCGTTGTCCAAGTCGAAAGTTAATTTGCATTTGAGTTTCATTTCACTCTCATTTAGTTCTCTTCAAT
GAATATAAAAGCTTCCTTCTTCAGTGAAGCTCTTTCGCGAAACACTCCCCTTTGCCGCTGTTGTTGTTGCTG
CACCACCGAACAACTTCCCCTGTAAATCGCGTTTCGTTTGTGCAAGGTTTTAAAAGATGGCTGATGCTGAGG
ACATTCAACCTCTTGTTGTTGATAATGGAACTGGAATGGTCAAGGCTGGTTTTGCAGGTGATGATGCTCCTA
GGGCCGTGTTCCCCAGCATTATTGGGAGACCACGCCATACTGGTGTAATGGTTGGGATGGGTCAGAAGGATG
CTTACGTGGGTGATGAAGCCCAATCAAAAAGGGGTATACTCACCTTGAAGTATCCTATAGAGCATGGCATAG
TCAGCAACTGGGACGATATGGAGAAGATTTGGCATCACACATTTTACAATGAGCTACGTGTTGCCCCTGAAG
AACACCCCGTACTTCTTACCGAGGCACCACTCAATCCCAAGGCCAACAGAGAGAAGATGACCCAAATTATGT
TTGAGACTTTCAATGTGCCTGCCATGTATGTTGCAATTCAGGCTGTCTTGTCTCTGTATGCCAGTGGACGTA
CTACAGGTATTGTGCTTGATTCTGGTGATGGTGTGAGCCACACGGTGCCCATATATGAAGGGTATGCTCTTC
CTCATGCAATTCTTCGGTTGGACCTTGCTGGCCGTGATTTAACAGAGTACTTGGTGAAAATCCTTACCGAGA
GAGGATACTCCTTCAGCACCTCTGCCGAAAAGGAAATTGTCCGTGATGTGAAGGAGAAATTGGCATACGTGG
CCCTTGATTTTGAACAAGAAATGGAGACTACTAAGAGTAGTTCTGCAGTGGAAAAGAGCTATGAATTGCCTG
ATGGACAGGTCATTACAATAGGTTCTGAGAGATTCCGTTGCCCAGAAGTACTGTTCCAGCCTTCTCTGATTG
GTATGGAAGCTACTGGAATTCATGAAACGACATACAATTCCATCATGAAATGTGATGTTGATATTAGGAAGG
ATCTGTATGGAAACATCGTGCTTAGTGGAGGGTCTACTATGTTTCCGGGAATTGCTGATCGCATGAGCAAGG
AAATTAGTGCTCTTGCACCCAGTAGCATGAAAATCAAGGTGGTTGCACCTCCTGAGAGAAAGTACAGTGTCT
GGATTGGTGGTTCTATCTTGGCATCACTTAGCACCTTCCAACAGATGTGGATCTCCAAGGGTGAATATGATG
AATCTGGGCCAGCCATCGTTCATCGGAAGTGCTTCTAAAGTTGGGTCAAGTCGAGCTGGATGGTGATCAAGT
TCTTCATGCACCCAGTCCTGTGCCATATTTCAGTAAAGTTTGGTTGACTTATTTGGTATTTGAAGCTTTGGG
TTTTTAATAGATATATCTAGTTTAATGAATGGATTTGTAAGTTGAGTATGTTATAAGTTTCTCCGTTAGGTC
ACCTTGGAAGCCAGACTTTTTATGCAATTGGCGGATGGTATTGGAACTTTGTAGGTTCTGCTTGGTTTGGTT
TTTCCTTTTATTCGATTTTCATGTTGTGGCCAAGAATTAGGTGCCTCGAGTTAGGAGGACGATAGTCTAAGC
ATCTTTTCTCACAGGGATTTTTGAGTCAGTTTCTGTTTATATTTATTATATGCATAATTGGTTTTTATGTTT
GCAGTACACTCAGAAATCAGAATGTTTTTATTGTTTGAGGTGATTAATCGTTTATACACCATATGATTAAAT
TT
2.2. Act11 chr8
Localización: Phvul.008G011000 cromosoma 8
5´UTR CDS 3´UTR Primers
TAAAACGAGAAATCAACGGTTGATATTGCATCGTATGCTTGTTATATTGAATACCAGTTTCCATTTTTTCTT
GGTACCTCTCTCTCTCTCTCTCGTTTCCCTCATCACTAGCTCTGCATTTCTCTCCCTCTTTGCCTTCCATCA
CCCTCGCCATTTCCCTTCTCAAGAAAGTAGAAGATGGCAGACGCTGAGGATATCCAACCTCTTGTTTGTGAC
AATGGAACAGGAATGGTTAAGGCTGGATTTGCTGGAGATGATGCCCCACGAGCTGTGTTTCCCAGCATTGTA
GGTCGTCCCCGTCACACTGGTGTGATGGTTGGCATGGGTCAAAAAGATGCATACGTTGGTGATGAGGCACAG
TCTAAGAGGGGTATTTTGACTCTTAAGTACCCTATTGAACATGGAATTGTGAGCAATTGGGATGATATGGAA
AAGATTTGGCATCATACCTTCTATAATGAACTTCGTGTCGCCCCTGAAGAGCATCCAGTTCTGTTAACTGAG
GCTCCTCTTAACCCCAAGGCTAACCGTGAAAAGATGACCCAGATCATGTTTGAGACATTTAACACCCCTGCC
ATGTATGTTGCCATCCAGGCCGTTCTTTCACTGTATGCAAGTGGTCGTACAACTGGTATTGTGTTGGATTCT
GGTGATGGTGTCAGCCACACAGTCCCCATCTATGAGGGTTATGCTCTCCCCCATGCCATCCTTCGCCTCGAT
CTGGCTGGTCGCGACCTCACTGATTTCTTGATGAAAATTTTGACTGAACGTGGTTATTCCTTCACCACCTCA
GCAGAGCGGGAAATTGTAAGGGATGTTAAAGAAAAGCTGGCCTACATTGCCCTTGACTACGAGCAAGAACTC
GAGACAGCCAGGACCAGTTCATCTGTGGAGAAGAGCTACGAGTTGCCTGATGGACAGGTCATCACCATTGGT
GATGAGCGTTTCAGATGTCCAGAGGTTCTGTTCCAACCATCCATGATAGGAATGGAAGCTGCCGGCATTCAC
GAGACCACATACAACTCCATAATGAAGTGTGATGTTGATATCAGGAAGGACCTCTATGGCAACATTGTCCTT

Anexos
182
TCAGGAGGAACAACCATGTTCCCTGGCATTGCTGACAGAATGAGCAAGGAAATTTCTGCCTTGGCACCCAGC
AGCATGAAGATCAAGGTTGTAGCACCACCTGAGAGGAAGTACAGTGTCTGGATTGGTGGTTCCATCTTGGCA
TCTCTCAGCACATTCCAGCAGATGTGGATTGCAAAGGCAGAATATGACGAGTCTGGTCCATCAATTGTTCAC
AGAAAGTGCTTTTAAAGTGTTTTAAGAAATAGGTTTATTGAAGGGAAAGACTACTATGATGATTTGTCTGGA
AGCAATGCATTGCAGATTGTAATCCTTTCATTCTAGCTTTTGTTATCCGTTCATGTTATTCTCTTGTTGGAG
TGGTCATTTATTTGCAGAAGGTGAGGAGAGTTGTTTTTGAAAATGGTCCAGTTCTTTTCATGTACTTTGACA
AGTTTTTGACTGGTTCATTCTGCCTTATGAGTTAGCTGGATTATTAAACTACGCTTGTACTCGTTGTATGCA
TAATTATAATCCATCATCCTTTTGAACTACAA
2.3. UKN1 chr11
Localización: Phvul.011G023200 cromosoma 11
5´UTR CDS 3´UTR Primers
GTGAAGAGCGAGGTGTGCATCGCAAATTCTAATTTTCTGATAAAACTAATAATAATAACAACAAAACAGACA
CACCTGTGTAAGAAGGAGGTGAGTTACGTACGATTAGGTTTTCTTCTTCTCTTTCTCTCTGATTCGATCCAT
TTCGATTGCTGAATTCATCCCATCGCAGAGCGTTTGAATTTGTAGTTGAACAACGATGGTGGTGCCGCTGCT
TAGTGTTTTCATTCTTTTCGCTTTTATTCCAAACGGATTGTTAGCAGTTCCTTCAACCGTCCCCGCATTCCT
TTGGTCATCACATTATGAACTGGCCTCTGAAACTGGATTGAAGGAATCTGTAAATTACCAAGTCATTTCTCC
TTATGATCTTGCAAAGTCTGTTATATCTGAAGCGGGCTGGTCAAATTTTCTGTGCAAAGGAAAGAAAACTCA
CAAGCCTCTGGATCTGGCACTTTTGTTCGTTGGTGGAGAGCTGCAATCTTCAGATTTAAGCATGAACAAACA
TGCAGACCCAGCCCTTTTAGATCTGCTCAAGATCTCTTTTGCCAGATCCAACACTTCTATGGCTTTTCCCTA
TGTTTCTGCATCAGAGGATTTGCTTTTGGAAAACACTTTGGTTTCAGGATTTTCTGAAGCCTGTGGAGATGA
TACGGCAATTGCCAATGTTGCGTTCCATGGATCTTGCTCCATGGGTGGTACAAATGAAGAAGTCACAGCTTT
GCATTCAGTACAAGACTATTTGACAAAGAGGATGAAAGATAGTCACAGGGGGAAAACAGATTTGGTTGTGTT
CTGCAATGGAGGCTCTCAAGATCTTAAAAATGTTGACAGGACACAATCTGAAGGGGAAACTTTATCGAAGCT
TCTGAGTTCCATGGAGGAATCGGGTGCAAAATATGCTGTTCTTTATGTGTCAGATCCCTCCAGGTCAATCCG
GTATCCTTCTTACAGAGAACTGCAAAGGTTTCTTGAAGAAGGTGCTGAATCAACCAATTCCACAGGTTGTGA
TAAAGTCTGCATGCTTAAATCATCTCTTTTGGAGGGAATTTTTGTGGGTTTAGTTTTGCTAATCATTTTGAT
ATCGGGCCTTTGCTGCATGATGGGAATTGACACCCCAACAAGATTTGAGACGCCACAAGAGTAATGATCCGT
TTCTCGAAGCTAAAATTTGTTGTGATGCTCGGTCTAATGATTAAAATATTGCTGTCGTATTATTTGCGATTC
TTCCGGAGGCTCTGATAAGTATTCTGTAGTTGATGACTTATCTCAGGGACTTTTAATATTGAATATTAAAAT
AATTTGTATCAGTATATAAAAATAAAACTTCAATGTTAGGTTTATTTTTGATCCCGCTACCACTAGTGTAAA
ATTTGAAGAAATTTCAGATTGTGATGTATTATTGTTATTACTGTCTGCAAATTTGATCCATTCGTTTTGCAT
AACTGCTGATCGATGCAGTTCCAAGT
2.4. EF1α chr4
Localización: Phvul. 004G060000 cromosoma 4
5´UTR CDS 3´UTR Primers
ACGAAAAGTAGCTCCCACAATATAAAACAATTGGAACCCTAGTTCATTATCACTCCTTGCTTCCTCGCTCTA
TTTTTGCGGCTGAGGATTCTGAACCAGCGACCTTCGTTTCTCTCTAAGTTTAACTCGTCATGGGTAAGGAAA
AGGTTCATATCAACATTGTGGTCATTGGACATGTCGACTCTGGGAAGTCAACTACCACCGGCCACTTGATCT
ACAAGCTTGGAGGTATTGACAAGCGTGTGATTGAAAGGTTCGAGAAGGAAGCTGCTGAGATGAACAAGAGGT
CATTCAAGTATGCCTGGGTGCTTGACAAGCTCAAGGCTGAGCGTGAAAGAGGAATTACCATTGATATTGCTT
TGTGGAAATTCGAAACCACCAAGTACTACTGCACAGTCATCGATGCCCCTGGACATCGTGACTTTATCAAGA
ACATGATCACTGGAACCTCCCAGGCTGATTGCGCTGTCCTTATTATTGATTCCACAACTGGTGGTTTTGAAG
CCGGTATTTCCAAGGATGGACAAACCCGTGAGCATGCTCTTCTTGCTTTCACCCTTGGTGTGAAGCAGATGA
TCTGTTGCTGTAACAAGATGGATGCCACTACCCCTAAGTACTCCAAGGCTAGGTATGATGAAATCATCAAGG
AAGTTTCATCATACTTGAAGAAGGTTGGTTACAACCCAGACAAAATTCCATTTGTCCCAATCTCTGGATTTG
AGGGTGACAACATGATTGAGAGGTCCACCAACCTTGACTGGTACAAGGGACCCACTCTCCTTGAAGCCCTTG
ACCAAATCAATGAGCCCAAGAGGCCCTCAGACAAGCCTCTCAGGCTCCCCTTGCAGGATGTCTACAAGATTG
GTGGTATTGGTACCGTGCCAGTGGGACGTGTTGAAACCGGTGTCATCAAGCCGGGTATGCTGGTGACTTTTG

Secuencia del transcriptoma de los genes de estudio
183
CTCCCACAGGTTTGACAACTGAAGTTAAGTCTGTTGAGATGCACCACGAGGCTCTCCTAGAGGCTCTTCCAG
GTGACAATGTCGGCTTCAACGTGAAGAACGTTGCTGTCAAGGATCTCAAGCGTGGTTTCGTTGCTTCCAACT
CCAAGGATGACCCTGCCAAGGAAGCTGCCAACTTCACATCCCAAGTCATCATCATGAATCACCCTGGCCAGA
TCGGAAATGGCTATGCACCAGTGCTTGATTGCCACACCTCCCACATTGCAGTCAAGTTCGCAGAACTCGTGA
CCAAGATCGACAGGCGATCAGGTAAGGAGATCGAGAAGGAGCCCAAATTTTTGAAGAATGGTGATGCAGGTT
ATGTTAAGATGATTCCAACCAAGCCCATGGTTGTTGAAACCTTCTCTGAGTATCCTCCCCTTGGTCGTTTTG
CCGTGAGGGACATGCGTCAGACCGTGGCTGTCGGAGTCATCAAGAGTGTTGAGAAGAAAGACCCCACTGGAG
CCAAGGTCACCAAGGCTGCTCAGAAGAAGAAGTGATCATAAAAATCTTGTTCCTTTATAGTCTTAGTCTTAA
AACCCGGGTTCATGGTTCAATTTTCGTTGTTGTTTATTCCTGAGAGGACTATTTTTGTTTTTTTGTTTTTAT
TTTTGATGTAAGAGTCTGAGTTTTACATTTTCACAAAGCAGACATAGGGTTTTAGCCCTTGCTGAGAGATGT
TTTAAATGCTTTTAATTTATAAGAAAGTTTTGTCAATGGTTTTATCGGTTTAACGTAAGCCTATTTTATAAT
CC
2.5. WRKY33 chr8
Localización: Phvul.008G090300 cromosoma 8
5´UTR CDS 3´UTR Primers
TGTGATACAAAATGATCCAATAATTTGTGTTATAATGGAACAAGGGTGGTAGCAACGAGCTGGCAGGCTGAG
GCAGCTCAGTCAAAGCCACAAGTCTTGACCCAATTCAGTTTTCCACGGTCAAACATTTCTTGAGCTTCCTAG
AAGCACCTTCTTCCAAGACTTTTTGCTGGTGATTTCATGCTTTGCCACAAAATCATGCACCTCTGCATCACT
ATTCACTTCTGTCTCCTCTCCTTATATCACGCCATACACCACTTTCTGTCTTTCCAATATAAACTCAAAACC
AACCAACCTTTTCTTCATCCAAGAGGATATCTTTCACTCACCTTCTTTCCTTTCCAACAACAGTAACAAACA
ACAATACTAGTAACATGACCATGGGTGATCATAATAACAACTGGGGAACTTCTGAATTTAATCATCATCAAG
TTGGACTTCTTGATGTTCCAAAATTCAAGTCTGCTCAACCTCCCTCACTACCCCTCTCTCCCTCTCCAGCCT
CCCCTTCTTCTTACTTGGCCTTTTCGTCTGCTTTCAGCCCATCTGAGTTCTTCAACTCTTCTTTGTTTTCTC
CTTCTCCAAATATTTTTGCATCTCCTACTACTGAGCCTTTGGCTGGCCAGACCTTCAACTGGAGGAACGGTT
CAGGAGAAGAACAACAACGTGACAAGGAGGATGAGAAAAACTACTCGGACTTCTCTTTCCAAACTCAAATTC
AATCTTCCTCAGGCATGTTTCAAGTGCAGGAACCACTTAAGAAACAAGATATATGGAAATTCAATGAACCTT
CAAAGCGAACTGATTTTTCATCTGATAGGACAGCAACAAAATCTGAATACCCTTCAATTCAGAGCTTTTCCT
CAGAAATGGCATCGGATAAATCAGAATTACAAAGCAATTCAGTTCCTGGATCTAGTCGTTTTGATTACCCCA
ATGCATCTCAGTCTGTTAGAGAACAAAAGAGATCAGAAGATGGGTTCAACTGGAGAAAATATGGACAGAAAC
AAGTGAAAGGGAGTGAAAATCCTCGTAGTTATTATAAGTGCACACATCCAAATTGCTTAGTGAAGAAGAAAG
TAGAGATGTCTTTGGATGGCCAAATTACTGAAATAGTGTACAAGGGCCATCATAACCACCCAAAACCACAGT
CTACTAGAAGAACAAACTCTCAATCAATTCATCAACCTTCTTCATCTTGCACAAACTCGGGGATTTCAGATC
AATCAGTGGTGACCCTAGGCAATCCACAAATGGATCATTTCTCCATGCAGGAAGATTCTTCAGCTTCCGTAG
GAGAGGAAGAGTTTGAGCAAACATCCCAAACCAGTTATTCTGGGGGAGATCAAGATAACCTTGGACCAGAGG
CCAAACGATGGAAAGGAGATAATGAAAATGATGACTATTCCGCCTCAGGGAGTAGAACTGTGAGAGAGCCTA
GAGTTGTAGTTCAAACCACAAGCGAAATTGATATACTTGATGATGGCTTTAGGTGGAGGAAATATGGACAGA
AAGTAGTGAAAGGAAATCCAAATGCAAGGAGCTATTACAAATGCACAGCCCCTGGTTGTTCAGTGAGAAAAC
ATGTTGAGAGAGCTGCACATGATATCAAAGCTGTGATCACAACTTATGAAGGGAAACACAACCATGATGTGC
CTGCTGCACGTGGTAGCGCAAGTTATAACATGAACAGAAATTCCCTGAACAGCAACATATCCGCTCCTATAA
GACCCTCGGCAGTGAACTGTTATTCTAGCTCATCAGGTTTCAAAAATTCTCTCTACGATAATACCAGGCTTC
CAGCAACCGGAAATCAAGAATCGTTTTCACAGGACAGGTTCCAGCACCCAGGAAGTTTTGGCCATTCGGCTC
TTAACAAATCAATGGGTTCATATGCTGATCATGCACTGTACTCAGATGCTGCACACTCAAATGTCAAGGATG
AGAAGAAGGATGACTCCTTCCTTCAGTCATTTCTGTCAAAGGACTTCTAAATTTGGGACTAGATCACAACTC
TACATATTGATATTATCCTGGATATGTTATTGTATAGCATGTAGGATTTTAGTTAGTCACACAGCAGAATAT
GGACAAAGAGTTGCCAATGTTTACTTGGTTACCTCATTTAGATTAGTGAATGGCACTACAGCCATGGTGACA
GCAAATTGTTGCTACACTACCTGTCAGCTAAGTTCATCTCCCAATAGAACATATCATAGGATTTGACGAATG
AATTCTGTTATTCTTTTGTTGTATTTGTAGGGAAAAAGGTTTTCTTAGAAGAATCTTCATTATTTAATCTTG
TAAGAATGTTTGTGCTGGCAATTTG

Anexos
184
2.6. PR1 chr3
Localización: Phvul.003G109100 cromosoma 3
5´UTR CDS 3´UTR Primers
GCAGCTTCATTCACACTATAGCATGACTCTCGAGTCATGTACATGGGTAGATGCAGATTGATACCAGACTCA
TTGCTTCCTTATAAATACATGCCACTCCTCTGCTAAACACCCACACAGCACAGCAAAAACATCTTCTTCTCC
TTCAATTCTCAAATACATTTCCATCTCTTTAAGGTTCTATCATGGGTGTTTTCACATTCGAGGATCAAACCA
CTTCTCCTGTAGCTCCTGCTACCCTCTACAAAGCTGTTGCTAAAGACGCCGATACCATCTTCCCAAAGGCTC
TTCCTGATTCCTTCAAGAGTGTTGAAATCGTTGAGGGCAACGGTGGCCCTGGAACCATCAAGAAGATCTCTT
TCGTTGAGGATGGAGAGACAAAATTTGTGTTGCACAAAATAGAATCAATAGATGAGGCCAATTTGGGATACA
GCTACAGCATAGTTGGAGGTGTTGCCTTGCCAGAAACTGCAGAGAAGATCACTTTCGACTCCAAACTCAGTG
ATGGTCCTAACGGAGGATCACTCATTAAGCTGAGTATAACATACCACAGCAAAGGAGATGCTCCACCCAATG
AAGATGAACTCAAAGCTGGAAAAGCCAAGAGTGATTCTCTTTTCAAGGCCGTAGAGGCATACCTTCTGGCCA
ATCCCTGATTACAACTGATTCAATTGAGTTATCGATATCAGTCAGTAACAAGGTTGCTTATATGATATACAA
GAGTTTTATTGGCTTGCATATGAAGTGTTATCAAATCAGAGTGTTCTTAAGTTAAGTTGGCTTCCATTTTCA
GGAGTGTTTTCTTTCTTATTTCCCTTTGCTGCATAATCGTGAGAGCTCGTGAGTATCTTTGTATCTTTCTTC
ATCAATAAATGATAATAAAGAAAATAATCACACTTTAACTTTTCTCA
2.7. PR2 chr3
Localización: Phvul.003G109200 cromosoma 3
5´UTR CDS 3´UTR Primers
GGTTATAAATAGAAGGCAGTCCTCTGGCAAATACCCACACAGCAAACATCTTCTCCTTCTCTTCTGATATTA
TATATTCTTCCATTTCATTAGATTCCATTCATCATGGCTGTTTTCACCTTCGAAGACCAAACCACTTCTCCC
GTGGCTCCAGCTACCCTTTACAAAGCTCTTGTGAAGGACGCCGATAACATCGTCCCAAAGGCCGTTGATTCC
TTCAAGAGTGTTGAAATCGTTGAGGGCAACGGTGGCCCCGGAACCATCAAGAAGATCTCTTTCCTCGAGGAT
GGGGAGACAAAGTTTGTGTTGCACAAAATAGAAGGAATAGATGAGGCAAACTTGGGATACAGCTACAGCATA
GTTGGAGGTGCTGCCTTGCCAGAGACTGCAGAGAAGATCACAATCGACTCCAAACTCAGTGATGGGCCCAAC
GGAGGATCAGTTGTAAAGTTGAGTATAAAATACCACAGCAAAGGAGATGCTCCACCCAATGAAGATGAGCTC
AAAACTGGCAAAGCCAAGAGTGATGCTCTTTTCAAGGTCATCGAGGCTTACCTTTTGGCCAACGCTTGATCA
CAATTGAGTTATTAGCGACATCTTTGCTTATATTGTACACAAAAGAGTTCTCTTGTGTGGAGTGTGTTTAAG
TTATGTTTGCTTCCAATGTCACAGAGTGTTTCCTTTTACTGCAGAATTGTGAGAGACATAATTCATGTGCTT
TGTATCAGAGTTCAAAAATAAATTATAATAAAGGAAAGTATTATGTTAATGTATGGCAATTTCTAGAATTTG
TACAGTGACCACATATAAACACTCATATACGTTGTGTTGTGTTAAAATATTAATGGAAAGAGG
2.8. PR3 chr9
Localización: Phvul. 009G116600 cromosoma 9
5´UTR CDS 3´UTR Primers
GATTATGATATGCAGTGTAGGAGTGGTGTGGATGCTGTTAGTTGGAGGAAGCTACGGAGAGCAGTGTGGAAG
GCAAGCAGGAGGTGCACTCTGCCCAGGGGGCAACTGTTGCAGCCAGTTCGGGTGGTGCGGCTCCACCACTGA
CTACTGCGGCAAGGATTGCCAGAGCCAGTGCGGGGGACCGTCTCCTGCTCCTACTGATCTCAGCGCCCTCAT
ATCCAGGTCCACCTTCGACCAGGTGCTCAAACATCGCAACGACGGAGCATGCCCAGCCAAAGGCTTCTACAC
CTACGATGCCTTCATCGCCGCCGCCAAGGCTTACCCCAGCTTCGGAAACACCGGAGACACGGCCACTCGCAA
GAGGGAGATTGCGGCCTTCTTGGGGCAAACGTCTCACGAAACAACCGGGGGATGGGCCACTGCGCCCGACGG
ACCATACGCATGGGGATACTGCTTCGTGAGGGAGCGGAACCCCAGTGCGTACTGCTCCGCCACTCCCCAGTT
CCCCTGCGCCCCTGGGCAGCAGTACTACGGCAGGGGTCCCATCCAGATATCCTGGAACTACAACTATGGTCA
GTGCGGAAGGGCCATTGGGGTTGACTTGCTCAACAAACCTGATCTAGTCGCCACTGACTCTGTCATCTCCTT
CAAGTCCGCCCTCTGGTTCTGGATGACCGCACAGTCCCCCAAACCTTCCTCCCACGACGTCATCACCTCTCG

Secuencia del transcriptoma de los genes de estudio
185
ATGGACCCCCTCCTCTGCCGACGTCGCCGCCCGCCGGCTTCCCGGCTACGGCACTGTGACGAACATCATCAA
CGGAGGCCTGGAGTGCGGGCGAGGACAGGACAGCAGGGTTCAAGACCGCATCGGATTCTTCAAGAGATACTG
TGATCTGCTTGGAGTTGGTTATGGCAACAACCTTGACTGCTACTCTCAGACTCCATTTGGAAATTCACTCTT
CCTCTCTGACCTTGTCACCTCTCAGTGACACTGCCATCCCATCAGAATAAATAAACTCATAAATCTGTGTTT
CCCTTTCTGATCACAACTTTCCAATAACACTTTTCCCACCATCTATCAATAAATTCACTACTTCTATATACC
2.9. PR4 chr6
Localización: Phvul.006G102300 cromosoma 6
5´UTR CDS 3´UTR Primers
AAGAAAGAAAGGGCATTTTCATAATTTTGTGATGCTAGAGAGGCCCTATAAATGTGGAAGAGGAGAAGCGAG
TGAATGAAGTGAAATGCAAAGAAGGATAATGGGAAAAGTAATTGTGTTTGTTGTGTGCGTGTTTTGTGTTGT
GGCTTTGGCCTCAGCTCAGAGTGCGAGCAATGTGAGAGCTACGTATCATTTGTACCAGCCTGAGCAGCATAA
CTGGGACTTACTCGCAGTGAGTGCATATTGCTCCACTTGGGATGCTGGCAAATCCTTGGCATGGCGCAGCAA
ATATCCTTGGACAGCTTTCTGTGGACCCTCTGGCCCTCGGGGCCAAGAATCTTGTGGCAAGTGCTTGAGGGT
GACAAACACAAGAACAAATGCTCAGATAACGGTGAGAATTGTTGACCAGTGCCGCAACGGGGGCTTGGACTT
GGATATTAGTCCATTCCAAAAGATAGACACGGATGGGAATGGCTATGCTCAAGGCCATCTTACTGTTAACTA
TGATTTTGTGAACTGCGGTGACTAAACACTACATATAATTAATTACCTTATGTGTGCTCTACTCAGTCACAA
GAAATCGAATAAAGAAAGATGTACAAGTGTGTTACTTCTTATAACAGTAATAAAAATAAATAAAGCCTTGTT
ATTATAAAAAAAACTGTTCTGGATTTGAAAGGAGTAATTATTAGTATTACC
2.10. PR16a chr10
Localización: Phvul.010G129900 cromosoma 10
5´UTR CDS 3´UTR Primers
CTAAAGAATCCATAAAGTGTAACTCTGGCTCTAATTTTGCATTTGTCATTATTAGTTGCATGGTATATGTTC
TGCCTCCAACTTGCAAGAAACTTTGTATATATATAGCACCATCTTGTAGCCTAGAATTCTCACATTCCCATT
CACAGTTTCACACTACCAAGTTAAGATGTTTCTCCAAATTGTCTTCCTCCTTTCCTTTCTCTTATCCACTTC
CCATGCTACTGTTCAAGACTTCTGTGTGGCAGACCTCAAAAGTGCAGATGGCCCTGCAGGCTTTCCCTGCGT
GCCACCTGCCAAAGTTACTTCAGATGACTTTGTGTTTGCTGGCTTATCTGAAGCTGCAAATGTCACAAACAT
AATCAATGCTGCTGTGTCCCCTGCATTTGTTGGTCAATTTCCAGGTGTTAATGGTCTTGATCTCTCTGCAGC
AAGGTTAGACCTTGGTCCTGCAGGAGTTATACCACTGCACACTCATCCTGGTGCCAATGAACTTCTAATAGT
GAACCAGGGTCACATCCTCGCTGGATTCATATCATCAAGTAACGTTGTTTATCAGAAGGTACTCAAAAGGGG
AGAGCTTATGGTCTTCCCACAAGGATTGTTGCACTTTCAAATAGCAGCTCACAAGAGGAAGGCCATTGCTTT
TGCTGTTTTCAGCAGTGCAAACCCTGGCCTCCAAATCCTTGACTTTGCACTCTTTGCCAGCAACTTCTCCAC
ACCTTTGATCGCACAGACTACTTTCCTTGACCCTGACCTAGTCAAGAAGCTTAAGAGTGTCCTTGGGGGCAG
TGGCTAAGCTAGGGCAGTCTCATGGTTATGGTTTATGCATTGTTTATTATTTTGCTTAATTCATTCCTTGTG
TTGTTTCAATTCCTTATACTTTTGCAGACTGTAATTGACTTTGTTTTTCCATTTCTGCTCCAAAGCTGAATG
TGTTGAGACTTGAGCATGCTGTGTTTAGAAGATTACATTTGTCTTGTAAGGATTACATTGTTACATTTCATT
TGATGTGAATGCAATTTTCTTACCCTAAAAGTACATATCTATGGAGTGTATACTATATGGATGA
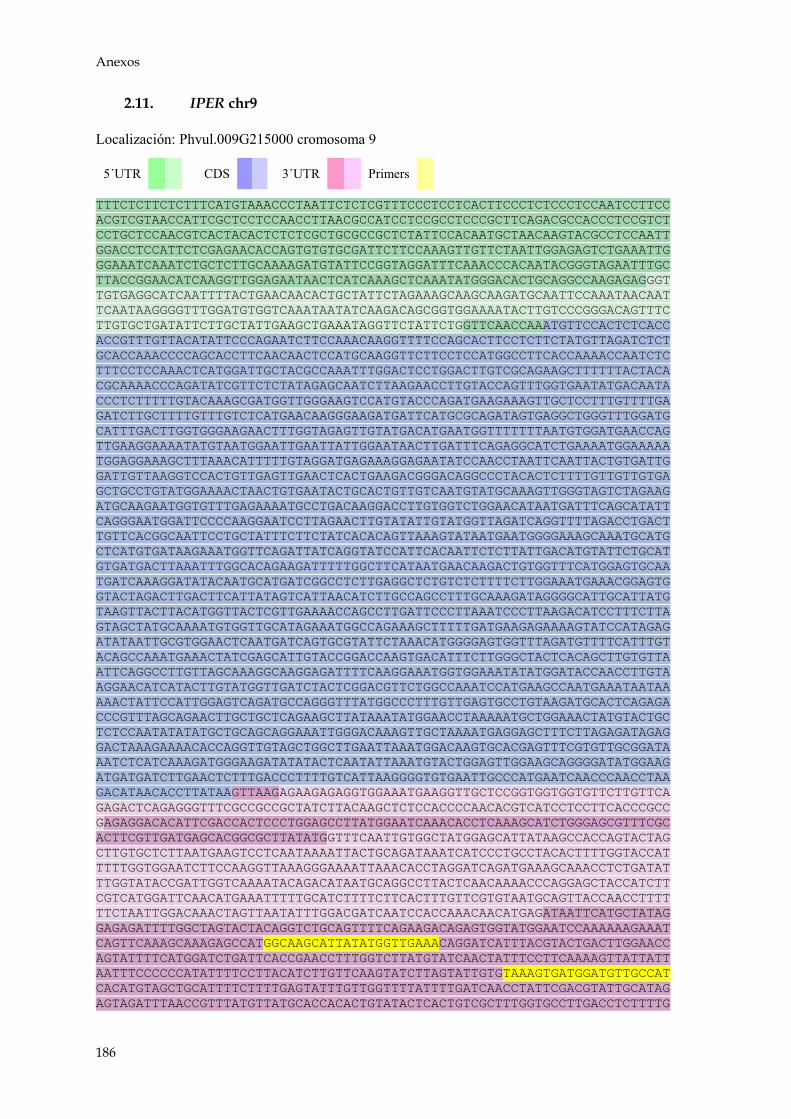
Anexos
186
2.11. IPER chr9
Localización: Phvul.009G215000 cromosoma 9
5´UTR CDS 3´UTR Primers
TTTCTCTTCTCTTTCATGTAAACCCTAATTCTCTCGTTTCCCTCCTCACTTCCCTCTCCCTCCAATCCTTCC
ACGTCGTAACCATTCGCTCCTCCAACCTTAACGCCATCCTCCGCCTCCCGCTTCAGACGCCACCCTCCGTCT
CCTGCTCCAACGTCACTACACTCTCTCGCTGCGCCGCTCTATTCCACAATGCTAACAAGTACGCCTCCAATT
GGACCTCCATTCTCGAGAACACCAGTGTGTGCGATTCTTCCAAAGTTGTTCTAATTGGAGAGTCTGAAATTG
GGAAATCAAATCTGCTCTTGCAAAAGATGTATTCCGGTAGGATTTCAAACCCACAATACGGGTAGAATTTGC
TTACCGGAACATCAAGGTTGGAGAATAACTCATCAAAGCTCAAATATGGGACACTGCAGGCCAAGAGAGGGT
TGTGAGGCATCAATTTTACTGAACAACACTGCTATTCTAGAAAGCAAGCAAGATGCAATTCCAAATAACAAT
TCAATAAGGGGTTTGGATGTGGTCAAATAATATCAAGACAGCGGTGGAAAATACTTGTCCCGGGACAGTTTC
TTGTGCTGATATTCTTGCTATTGAAGCTGAAATAGGTTCTATTCTGGTTCAACCAAATGTTCCACTCTCACC
ACCGTTTGTTACATATTCCCAGAATCTTCCAAACAAGGTTTTCCAGCACTTCCTCTTCTATGTTAGATCTCT
GCACCAAACCCCAGCACCTTCAACAACTCCATGCAAGGTTCTTCCTCCATGGCCTTCACCAAAACCAATCTC
TTTCCTCCAAACTCATGGATTGCTACGCCAAATTTGGACTCCTGGACTTGTCGCAGAAGCTTTTTTACTACA
CGCAAAACCCAGATATCGTTCTCTATAGAGCAATCTTAAGAACCTTGTACCAGTTTGGTGAATATGACAATA
CCCTCTTTTTGTACAAAGCGATGGTTGGGAAGTCCATGTACCCAGATGAAGAAAGTTGCTCCTTTGTTTTGA
GATCTTGCTTTTGTTTGTCTCATGAACAAGGGAAGATGATTCATGCGCAGATAGTGAGGCTGGGTTTGGATG
CATTTGACTTGGTGGGAAGAACTTTGGTAGAGTTGTATGACATGAATGGTTTTTTTAATGTGGATGAACCAG
TTGAAGGAAAATATGTAATGGAATTGAATTATTGGAATAACTTGATTTCAGAGGCATCTGAAAATGGAAAAA
TGGAGGAAAGCTTTAAACATTTTTGTAGGATGAGAAAGGAGAATATCCAACCTAATTCAATTACTGTGATTG
GATTGTTAAGGTCCACTGTTGAGTTGAACTCACTGAAGACGGGACAGGCCCTACACTCTTTTGTTGTTGTGA
GCTGCCTGTATGGAAAACTAACTGTGAATACTGCACTGTTGTCAATGTATGCAAAGTTGGGTAGTCTAGAAG
ATGCAAGAATGGTGTTTGAGAAAATGCCTGACAAGGACCTTGTGGTCTGGAACATAATGATTTCAGCATATT
CAGGGAATGGATTCCCCAAGGAATCCTTAGAACTTGTATATTGTATGGTTAGATCAGGTTTTAGACCTGACT
TGTTCACGGCAATTCCTGCTATTTCTTCTATCACACAGTTAAAGTATAATGAATGGGGAAAGCAAATGCATG
CTCATGTGATAAGAAATGGTTCAGATTATCAGGTATCCATTCACAATTCTCTTATTGACATGTATTCTGCAT
GTGATGACTTAAATTTGGCACAGAAGATTTTTGGCTTCATAATGAACAAGACTGTGGTTTCATGGAGTGCAA
TGATCAAAGGATATACAATGCATGATCGGCCTCTTGAGGCTCTGTCTCTTTTCTTGGAAATGAAACGGAGTG
GTACTAGACTTGACTTCATTATAGTCATTAACATCTTGCCAGCCTTTGCAAAGATAGGGGCATTGCATTATG
TAAGTTACTTACATGGTTACTCGTTGAAAACCAGCCTTGATTCCCTTAAATCCCTTAAGACATCCTTTCTTA
GTAGCTATGCAAAATGTGGTTGCATAGAAATGGCCAGAAAGCTTTTTGATGAAGAGAAAAGTATCCATAGAG
ATATAATTGCGTGGAACTCAATGATCAGTGCGTATTCTAAACATGGGGAGTGGTTTAGATGTTTTCATTTGT
ACAGCCAAATGAAACTATCGAGCATTGTACCGGACCAAGTGACATTTCTTGGGCTACTCACAGCTTGTGTTA
ATTCAGGCCTTGTTAGCAAAGGCAAGGAGATTTTCAAGGAAATGGTGGAAATATATGGATACCAACCTTGTA
AGGAACATCATACTTGTATGGTTGATCTACTCGGACGTTCTGGCCAAATCCATGAAGCCAATGAAATAATAA
AAACTATTCCATTGGAGTCAGATGCCAGGGTTTATGGCCCTTTGTTGAGTGCCTGTAAGATGCACTCAGAGA
CCCGTTTAGCAGAACTTGCTGCTCAGAAGCTTATAAATATGGAACCTAAAAATGCTGGAAACTATGTACTGC
TCTCCAATATATATGCTGCAGCAGGAAATTGGGACAAAGTTGCTAAAATGAGGAGCTTTCTTAGAGATAGAG
GACTAAAGAAAACACCAGGTTGTAGCTGGCTTGAATTAAATGGACAAGTGCACGAGTTTCGTGTTGCGGATA
AATCTCATCAAAGATGGGAAGATATATACTCAATATTAAATGTACTGGAGTTGGAAGCAGGGGATATGGAAG
ATGATGATCTTGAACTCTTTGACCCTTTTGTCATTAAGGGGTGTGAATTGCCCATGAATCAACCCAACCTAA
GACATAACACCTTATAAGTTAAGAGAAGAGAGGTGGAAATGAAGGTTGCTCCGGTGGTGGTGTTCTTGTTCA
GAGACTCAGAGGGTTTCGCCGCCGCTATCTTACAAGCTCTCCACCCCAACACGTCATCCTCCTTCACCCGCC
GAGAGGACACATTCGACCACTCCCTGGAGCCTTATGGAATCAAACACCTCAAAGCATCTGGGAGCGTTTCGC
ACTTCGTTGATGAGCACGGCGCTTATATGGTTTCAATTGTGGCTATGGAGCATTATAAGCCACCAGTACTAG
CTTGTGCTCTTAATGAAGTCCTCAATAAAATTACTGCAGATAAATCATCCCTGCCTACACTTTTGGTACCAT
TTTTGGTGGAATCTTCCAAGGTTAAAGGGAAAATTAAACACCTAGGATCAGATGAAAGCAAACCTCTGATAT
TTGGTATACCGATTGGTCAAAATACAGACATAATGCAGGCCTTACTCAACAAAACCCAGGAGCTACCATCTT
CGTCATGGATTCAACATGAAATTTTTGCATCTTTTCTTCACTTTGTTCGTGTAATGCAGTTACCAACCTTTT
TTCTAATTGGACAAACTAGTTAATATTTGGACGATCAATCCACCAAACAACATGAGATAATTCATGCTATAG
GAGAGATTTTGGCTAGTACTACAGGTCTGCAGTTTTCAGAAGACAGAGTGGTATGGAATCCAAAAAAGAAAT
CAGTTCAAAGCAAAGAGCCATGGCAAGCATTATATGGTTGAAACAGGATCATTTACGTACTGACTTGGAACC
AGTATTTTCATGGATCTGATTCACCGAACCTTTGGTCTTATGTATCAACTATTTCCTTCAAAAGTTATTATT
AATTTCCCCCCATATTTTCCTTACATCTTGTTCAAGTATCTTAGTATTGTGTAAAGTGATGGATGTTGCCAT
CACATGTAGCTGCATTTTCTTTTGAGTATTTGTTGGTTTTATTTTGATCAACCTATTCGACGTATTGCATAG
AGTAGATTTAACCGTTTATGTTATGCACCACACTGTATACTCACTGTCGCTTTGGTGCCTTGACCTCTTTTG

Secuencia del transcriptoma de los genes de estudio
187
AAGGGAGGTCAAGATAAGAGCCCCAGATTTTTAGATTTTGCTTCTGTAAAAGAAACAATTAAAGATGAGGAT
G
2.12. PPO chr8
Localización: Phvul.008G073200 cromosoma 8
5´UTR CDS 3´UTR Primers
CTACGTCACTCTATTAATGGCTACCATTCAAAGCTTATCGCACTCACTCTTCTCTTCGCACTCACTCTATTA
ATGTGCAAATTTTGAGAGCATGAAAAAGTGCAGCAATGACCACTCCTTCTAAGCCTCTACCTTTATTCTTTG
CTCTTACTATTATCTTCCTCATTCCCTTCATTTCTCTACTCAACAATCACTTCTCTGTCATCACCGCCATAA
AACTCATTTGCAGACAAACATATAAACCCCCTCATGCCAAACAAAATGGCCTCGTCAAAAGTTCCAATGAAA
GAGACAAATCTCGTCTTTGGAGGGAACCCTTCATTGGCTTCAAAAATATAGATGACTCATCTTCCATTTCTA
GACCAATATCTCCTAATATAAGCGATTGTTTTCCTGTTGAGTTACCTTCTAATGCAATTACACCTGCCCATT
GCTGTCCATCTAAACCATCTTTCTCCAAGATCTTAGATTTCAAAGATTTTGCTTCTCCCAGTACCACACTGA
GAGTAAGAAAACCATTCCACTTGCTAGATAATGAGGATATAGCCAAATTTGAAAAGGGCATTGCACTTATGA
AAGCCCTCCCCGATGATGACCCTCGTAGCTTTATTCAACAAGCTAAGGTCCATTGCGCTTATTGTAATGGAG
CCTATCACCTGTCTCATCCTTTCCAAGACACAAAACTCGACATTCACAGGTCTTGGTTTTTCTTTCCCTTCC
ACCGTTGGTACATTTACTTCTTTGAACGAATTTTGGGGAACTTGATTGGTGACCCTAACTTTGCTTTACCAT
TTTGGAGTTGGGATTCTATAGAGGGCATGCAAATGCCATCGTATTTCGCAAACCCTAACTCGTCACTTTATC
ACAAACTCCGACACCAGAAACACCTGCCACCCCACGTGGTGGACCTGAACTATGCAAGTGAAAGTAGCTATG
TCCCTTCTCATCAACAAGTTTCGTATAATTTAGCCACCATGTACAGACAAATGGTGCTAGCAAGTACCACGG
AATTGTTCATGGGAGGCCCTTTTCGACTAGGGGATAACCCTCGTCCTGGTCCTGGTTCTGTGGAGGCTGCTC
CACATAACACCGTTCATACATGGGTTGGTGGAGCCGAAACTCCAAACCATGAGGACATGGGAACGTTCTACA
CAGCTGCTAGAGACCCCATTTTCTATGGTCATCACTCGAACTTGGATCGAATGTGGGCGATATGGAAAACAC
TGGGAGAAGGAAGAAAGGACTATAGTGATGAAGATTGGTTAGATTCTGAGTTTTTCTTCTACGATGAGAATG
CTAATTTTGTTCGTGTTAAGGTAAGAGATTGCGTTGATACTAAAAGCTTGGGGTATGTGTACCAAGATGTTG
ATCTTGCATGGTTGCGTACGCCACCCACATCACGAAAAAGTAAGCTACTGAGACAAAGGAAGAAGGCTAAAG
TTTGGAGTTCGAAGCCAAGAAAGTTTCCTCTGGTTTTGGATTCCGTAACAAGTGTAATTGTTAAGAGGGCGA
AGAAATGGAGGAGCAAGGAAGAGAAAGAAGAAGAGGAAGAGGTTTTGGTGATAGAAGGGATTGAGTTTGGAA
GTGATAAATTTGTTAAGTTTGATATTCATGTTGATGATGATGAAGACAGGTTGAGTAATCCAGATGAGACAG
AATTTGTGGGAAGTTTTGTGAGTCTGTACCATGGACGTGGCCATAAAATCAGCACTAGCTTTAAAGTAGGAA
TTTCAAAAGTTCTGGAGAATTTAGAAGCTGAAGAAGACGATGATTTGCTGGTTACTTTGGTACCTAAGCTGG
GAAAAGGAGATGTAATCATAGGAAGCATCAAAATTCAGTTTATTCCAAAACAGTAGACTTATATTATATTTT
CTGTGTATTAAAATTATTCTTTTCACAAAGGAAAATGTTTCTTTTGT
2.13. ERF1 chr7
Localización: Phvul.007G127800 cromosoma 7
5´UTR CDS 3´UTR Primers
AAAGAGACGAGAAAAACAGAGCAACTCAACACCTTACTTCTCCTTTTCACTATTCACTCTGTTTGTTTTCTA
AACATGGATATAGATTCATCCTCCTTCTTCAACTCCCCCTCTTCCGATTTCTCCTCCGAATCTTCCTCTCCG
GATGCCTTCTCCTGGGAGGGATACCTCCCTTTCAACGAGAACGACCCGGAGGAGATGCTCCTCTACGGCATG
ATCGCCGGCGCCACCACAGCCGAGCGCACCGCCGACCGAGCGGGCTCTGAGGAGAGTGCGGCGCCGCAAAAG
GAGAAGTCCTACCGCGGAGTGAGGCGACGGCCGTGGGGGAAGTTTGCGGCGGAGATTAGGGACTCCACACGG
CACGGGATGAGGGTGTGGCTTGGGACATTCGACAGCGCGGAAGCCGCGGCTTTGGCTTACGACCAAGCGGCG
TTTTCCATGCGCGGGTCCGCCGCGATTCTGAACTTCCCCGTTGATATCGTTAGAGAATCACTTAGGGAGATG
AACTACGCGGTGGATAGCAGTGAAGAAGGGTGCTCCCCTGTTGTCGCTCTCAAGAGGAAACACTCCTTGCGG
AGGAAAATTGGTGTAAAGAAAAACAACAAACAGAGTACCGTAGACAATGCGGTCGTGTTTGAAGACCTTGGT
CCTGACTACTTGGAACAGTTGTTGATGTCCTCTGATCATATTCCCTCCTCCTTCTGATTCATTCATTCCTCA
ATTATAATCCAAACCTCGAAAGCCTTCACGCTGCGGCTCAAGCACCAATTCCGCAACGTTTTTTATAACCTT
ATAAATATCCCACGCTGCATAGTTTCTACCTAGGCTTTTTTATGTTAGTGTTAATTCCTTTTTCTTCTTTGT

Anexos
188
TCTTTGGTTCTTGTATGGCTGAGATGCTTGTGTCATGTTTTGATGACAGAGTTCAACATCTTCTGAATCTGT
ATCTTTTTATCTCTTC
2.14. ERF5 chr2
Localización: Phvul.002G055700 cromosoma 2
5´UTR CDS 3´UTR Primers
CTTAAGTTTCTCATCCAAGTTCATGTACCGTCCCTTTTATAAAAACCCTCGTCCACTTTCCCCTTCCAACTT
CCAACATTCATTTCACACCCAAATCCTTCTCTCAACACAAACACAAATATCAGGGTTACAAAATGTACGAAG
AAACTACCTACGACTCCGATTTGGCTCTTTTGGATTCCATTCGCCGCCACTTACTCGGGGACTTCGAGGATC
TCAAATTCGGAGCCCCGATTGTTAACTCCGGTAACACTCCCCTTTACTCTCGGAGCACCAGTTTCAGTAGGT
TGTACCCGTGTTTGAGTGACGATTGGGGAGAGCTTCCTCTTAAGGAAGATGATTCAGAGGACATGGTGCTCT
GCGGTGTTCTTCGCGATGCCATCAACGTAGGCTGGGTCCCATCTCTCAACGCAGCCTCACCGAACACCTTTT
CCTCGGGTTTCATCCCGGAAGTTACCGTGAAACCCGAACCGGATTTATTTCCGGCACCGGAACCTGTTTTCA
CCGCTTCGGTGGTTCAGAAGGATGCACCGGCGGTTGTTCCGGCCAAGGGGAAGCACTACCGCGGCGTGAGGC
AACGGCCGTGGGGAAAATTCGCGGCGGAGATCCGCGACCCGGCTAAAAACGGGGCTCGGGTCTGGCTCGGAA
CGTTCGAGACGGCTGAGGACGCCGCCCTGGCATACGATAGAGCCGCGTATCGAATGCGCGGCTCGCGGGCTT
TGTTGAATTTCCCGCTTCGGATTAATTCGGGCGAGCCCGAACCGGTTCGGGTGACGTCGAAGCGAGCGTCGC
CGGAGCCTTCGTCCTCGTCGGAGAGTGGATCGTCGGCGAAGCGGCGGAAAAAAGTGGTGGGGTCGACGGTGA
CGGCTCCAAGTGGATTGAGAACGGGGCAAGTGGGAAGTCAAGTGTCTCAGTGCACACGTGCGGAACAGTTGT
TGGTTAACTAATGCGTTATGCTGACGTGGATTTCACTGTTCTTTTTGTGTAAATTGTGCTTTGTAGTTATCT
GATTCTGAGATGCGTGTGACAGTGGCGGAAACTGTTATTAAAAGAATGAAAATAATAAGCCAACAAGGGAAG
GACAGTGGCACAGTGTAAAAAATGGATTGATACCTCAACTCCATCAAGTCGGAGTCATAAAATCTAAACCAG
AAAAAATTAAGAAAACCAAAACAAAGTTGCAAAAAGCAATTAGGGTGGAGGTTTTGTTTGGGTCTCTGAATA
CAGTCCCAATATTTGTTATTTTTTGGTTCAATATTTATGAAATTTGTGAATTGGGTTGCATCAACTGAAGCC
TCTACTTTATTCTCTC
2.15. Ch5b chr9
Localización: Phvul.009G116500 cromosoma 9
5´UTR CDS 3´UTR Primers
GGAAAGAGAGAGAGAAATGAAGAAGAATAGGATGATGATGATGATATGGAGCGTAGGAGTGGTGTGGATGCT
GTTGTTGGTTGGAGGAAGCTACGGAGAGCAGTGTGGAAGGCAAGCAGGAGGTGCACTCTGCCCAGGGGGCAA
CTGTTGCAGCCAGTTCGGGTGGTGCGGCTCCACCACCGACTACTGCGGCCCGGGTTGCCAGAGCCAGTGCGG
GGGACCGTCTCCTGCTCCTACTGATCTCAGCGCCCTCATATCCAGGTCCACCTTCGACCAGATGCTCAAACA
TCGCAACGACGGAGCCTGCCCAGCCAAAGGCTTCTACACCTACGATGCCTTCATCGCCGCCGCCAAGGCTTA
CCCCAGCTTCGGAAACACCGGAGACACGGCCACTCGCAAGAGGGAGATTGCGGCCTTCTTGGGGCAAACGTC
TCACGAAACAACCGGGGGATGGGCCACTGCGCCCGACGGACCATACGCATGGGGATACTGCTTCGTGAGGGA
GCGGAACCCCAGCACGTACTGCTCCGCCACTCCCCAGTTCCCCTGCGCCCCTGGGCAGCAGTACTACGGCAG
GGGTCCCATCCAGATATCCTGGAACTACAACTACGGTCAGTGCGGAAGGGCCATTGGGGTTGACTTGCTCAA
CAAACCTGATCTAGTCGCCACTGACTCTGTCATCTCCTTCAAGTCCGCCCTCTGGTTCTGGATGACCGCACA
GTCCCCCAAGCCTTCCTCCCACGACGTCATCACCTCTCGATGGACCCCCTCCTCTGCCGACGTCGCCGCCCG
CCGGCTTCCCGGCTACGGCACTGTGACGAACATCATCAACGGAGGCCTGGAGTGCGGGCGAGGACAGGACAG
CAGGGTTCAAGACCGCATCGGATTCTTCAAGAGATACTGTGATCTGCTTGGAGTCGGTTATGGCAACAACCT
TGACTGCTACTCTCAGACTCCATTTGGAAATTCACTCTTACTCTCTGACCTTGTCACCTCTCAGTGACACTG
TCATCCCATCAGAATAAATAAACTCATAGATCTGTGTTTCACTTTCTGATCACAACTTTTCCAATAACACTT
TTCCCACCATCTATCAATAAATTCACTACTTCTATATACCATATGCACA

Secuencia del transcriptoma de los genes de estudio
189
2.16. PAL1 chr1
Localización: Phvul. 001G177800 cromosoma 1
5´UTR CDS 3´UTR Primers
ACTCTATTCTTCTCAGGAAATCCTCAACACACATCAACATTTCCTCACTCTCTCTCTCTCTCTCTCTCTACA
CAAAACTCACCTCCATTTTTTCATTCTCTTCATTTTATCACGATGGAAGCAACTACCCTTACCAACGCCCAA
AACGGTTCCTTCTGCCTCCCATCCGCCAAGACCACTGATCCGCTCAATTGGGGAACGGCCGCGGAGGCGCTC
AAGGGGAGCCACCTCGACGAGGTCAAGCGCATGGTGGCCGAATACCGCCAGCCGCTGGTCCGCCTCGGCGGC
GAGACGCTCACCATCGCTCAGGTGGCGGCGGTGTCTGGCCACGACCAAGGCGTGAGGGTTGAGCTGTCGGAG
TCCGCTCGGGAAGGTGTTAAGGCGAGCAGTGAGTGGGTGATGAACAGCATGAACAATGGTACTGACAGTTAC
GGCGTCACCACCGGCTTCGGTGCCACCTCCCACCGCCGAACCAAACAAGGTGGTGCTCTGCAGAAAGAACTC
ATCAGGTTTTTAAACGCTGGAATATTTGGAAATGGGACTGAATCATCCCACACACTGCCACACACTGCAACC
AGAGCAGCCATGTTAGTGAGGATCAACACTCTTCTTCAAGGCTACTCAGGCATCAGATTTGAAATCTTAGAA
TCCATCACCAAGCTCCTTAACAACAACGTTACCCCATGTTTGCCACTTCGTGGTACAATCACAGCTTCTGGA
GATCTTGTTCCACTTTCCTATATTGCTGGTTTGCTCACTGGCAGACCTAACTCCAAAGCTGTTGGACCTTCT
GGAGAAGTACTTACTGCTAAGCAAGCTTTTGAATTGGCTAACATCAATTCTGAGTTCTATGAATTGCAACCC
AAGGAAGGCCTTGCCCTTGTTAATGGCACGGCTGTCGGTTCTGGCATGGCTTCTATAGTTCTCTTTGATGCA
AATATACTAGCTGTGTTGTCTGAAGTTCTATCAGCTATTTTTGCCGAAGTGATGCAAGGGAAACCTGAGTTT
ACTGATCATTTGACACACAAGTTGAAGCACCACCCTGGTCAAATTGAGGCTGCTGCCATTATGGAGCACATT
TTGGATGGAAGTTCCTACATGAAGGATGCTAAGAAGCTGCATGAAATAGATCCGTTGCAAAAGCCAAAACAA
GATAGATATGCCCTCAGAACTTCACCACAGTGGCTTGGTCCTCTCATTGAAGTCATTCGTTTCTCCACCAAG
TCAATTGAGAGAGAGATTAACTCCGTGAATGACAACCCTCTTATTGATGTTTCAAGGAACAAGGCATTGCAT
GGTGGTAATTTCCAAGGAACCCCAATTGGAGTCTCCATGGACAACACTCGTTTGGCTCTTGCATCTATCGGC
AAACTCATGTTTGCTCAATTCTCCGAGCTTGTCAATGATTTCTACAACAACGGTCTGCCTTCAAATCTCACT
GCTAGCAGAAATCCTAGCTTGGATTATGGTTTCAAGGGAGCTGAAATTGCCATGGCTTCCTATTGCTCTGAA
CTCCAGTATCTGGCAAATCCAGTAACAAGCCATGTCCAAAGTGCTGAGCAACACAACCAAGATGTGAACTCT
TTGGGTTTGATTTCAGCTAGGAAGACAAATGAATCTATTGAGATCCTTAAGCTCATGTCTTCCACGTTCTTG
ATGGGACTTTGCCAAGCAATTGACTTGAGGCATTTGGAGGAGAATTTGAAAAGCTCGGTCAAGAACACTGTG
AGTCAAGTTTCCAAGAGGACTCTTACCACAGGTGGCAACGGAGAACTCCATCCTTCAAGATTTTGCGAAAAG
GATCTGCTGAAAGTGGTTGACAGGGAGTATGTATTTTCCTACATAGATGACCCATGCAGTGGTACATACCCA
CTGATGCAAAAACTTAGGCAAGTGCTTGTAGACCATGCCTTGATAAATGCAGAGAATGAGAAGGATGTCAAC
ACATCAATCTTTCAAAAGATTGCAACCTTTGAGGAGGAGTTGAAGACCATCTTGCCAAAGGAGGTTGAAAGT
ACAAGGGCTGCTTATGAGAGTGGGAAAGCTGCAATTCCAAACAAGATAAAAGAATGCAGATCTTACCCACTC
TACAAGTTTGTGAGAGAGGAGTTGGGCACTGGGTTGCTAACTGGAGAAAAGGTGAAGTCACCAGGTGAAGAG
TTTGACAAGTTATTCACAGCAATATGCCAGGGCAAAATTATTGATCCTCTTCTCGAATGCCTTGGAGAGTGG
AATGGAGCTCCTCTTCCAATTTGTTGATTTTACTGTCATTTTTATAAGTATTTTTCTCTGTATCTACGCAAG
TGAAACCATAATCATTGAGTTTGGTAAGCCTTTTAACAAATCTACATGGAAAGCCGGATTCTAATGTTTCCT
CCATGTCAGATAGGACCTTGTAATTTAATATTATAGTGAAATTTCAGTTGATTAATGATTCGTACT
2.17. OSM34 chr4
Localización: Phvul. 002G155500 cromosoma 4
5´UTR CDS 3´UTR Primers
ATAAAAATTTGATTTCTCAACGTATCATTACCATTCATATAAATTGTTAAAATCTCTCTACACTCAACCATG
TAAGGCTATATAAACACCAAACACCAGTTTTGGAATCCACACTGAACACGATAAACATGGCTCACTCACTCT
CCCTAACGCCACTTTGCGCCCTCCTCATGCTCGCCTCATTATCTCTCGCCACCGCTGCAAACTTCGAGATCG
TCAACAACTGCCCCTACACGGTGTGGGCGGCTGCCAGCCCCGGCGGCGGGCGGCGCCTGGACCGCGGGCAGA
CGTGGAACCTGTGGGTGAACGCGGGCACTGCCATGGCCCGCATATGGGGTCGCACCGGGTGCAACTTCGACG
GCAGTGGGCGAGGGCGGTGCCAGACAGGTGACTGCACCGGCGGCCTGAACTGCCAGGGCTGGGGCGTTCCTC
CGAACACCCTGGCGGAGTTCGCCCTGAACCAATTCGGCAACTTGGACTTCTACGACATCTCCCTGGTGGACG
GTTTCAACATCCCTATGGACTTCTACCCCGTGAACGGAGGGTGTCACAAAATCAGTTGCACCGCCGACATTA
ATGGGCAGTGCCCTGGGCCATTAAGGGCCCAAGGGGGATGCAACAACCCCTGCACCGTGTATAAGACGAACG
AGTATTGCTGCACCAATGGGCAAGGAACTTGTGGACCCACTACGTACTCTAGGTTCTTCAAAGATAGGTGCC
GTGATGCTTACAGTTACCCTCAGGATGACCCTACCAGCACCTTCACTTGCCCTGCTGGTTCTAACTACAAGG

Anexos
190
TTCTCTTCTGTCCTCTCGGAGATCCTCTTCACATGCTTCCTAATACCACCACCAATCAATATTAAAATAACC
ATACCAACGCTGTGTAGATCCTTCGATGGGCCTACCTACAAGGAAATGAAGTTTTTTCACAACTTCATTTTT
TATCATCAATAAAATTGGATCTCCTTTCTGTTTCATTTGATCTCTTCTACTGCCATCAAATTAGAAAATGAA
ATCTCTCTCACTCAACTTTCTATGTCGCGCTAGTTTCTGTAAGGAAAAAGTTT
2.18. CNGC2 chr6
Localización: Phvul.008G036200 cromosoma 6
5´UTR CDS 3´UTR Primers
AGAACAACGTATAGCAACCAACCCCACCATCACTCCCTCAACGTTGCGTAACCGTAAGCTCCAATCCCTACA
CTCCTGATTCACATGCAAATTCATCTTCTTCTTCCAATCCTCTTTCTTATATACTCTTCTTCCATGTGCATA
CCCTGACACACCTAAACCCCACTTTTCCTCCATCTAACTCCCCTCCTCCCATGGTTTCTCTCCATCATCAAC
CATGCCCAACACCTTCTCCCTCCTCTGGTGGATTGGCAAAAAGTTGCGAAGAAGGAACACAGTTAGTAATGG
AGAGAGTGGGAGCAACGAGAACGTCGTCGGTGCCGTTGTTGTGGATGACAATCCATTTGGCAGCACGGTAGA
GTGTTACGCTTGCACGCAGGTTGGCGTGCCGGTGTTTCACTCCACCAGCTGCGACAGTTTTAACCAGCCGCA
ATGGGAGGCTTCGGCCGGCTCCTCCCTTGTTCCGATCCAGAATCGGCCGAACAAGGTTCTCGGGTTTCGGAC
CGTATCCGGTTCGAATATTGGACCGTTTGGGAGGGTTTTGGATCCGCGGAGCAAGCGCGTGCAAAAGTGGAA
CCGCGCGCTGCTGCTGGCGCGTGGGGTGGCGTTGGCGATTGACCCGCTGTTCTTCTACTCGCTGTCGATCGG
GAGGGAGGGGTCGCCGTGCCTTTACATGGACGGAGGGCTGGCGGCGATGGTGACGGTGGCGCGGACGTGCGT
GGACGCGGTGCATCTCTTGCACGTGTGGCTGCAGTTCCGGCTGGCGTACGTGTCGCGCGAGTCGCTGGTAGT
GGGGTGCGGGAAACTGGTGTGGGACGCGCGTGAGATCGCGTCGCATTACCTGCGATCGTTGAAGGGATTCTG
GTTCGACGCATTCGTGATCCTCCCAGTTCCCCAGGCTGTGTTTTGGTTGGTAGTGCCAAAATTGATCAGAGA
AGAGCGAATTAAAATCATTATGACCATAATGCTATTGATTTTTTTGTTCCAATTTCTCCCCAAGGTTTACCA
TAGCATCTGCATGATGAGAAGAATGCAAAAAGTCACGGGCTACATCTTTGGTACCATTTGGTGGGGCTTTGG
TCTCAATCTCATAGCTTATTTTATTGCTTCCCATGTTGCTGGAGGGTGCTGGTATGTCCTTGCAATTCAACG
AGTTGCGTCATGCCTGCGACAGCAGTGTGAGAGAACTAATGGATGCAATCTTTCTGTGTCATGCTCAGAGGA
GGTATGCTACCAGTCTTTGGCAGGCGCAATAGGAAGTTCTTGTGGTGGGAATTCAACAGTACTGTTAAAAAA
GCCTTATTGCTTAGATGTTGAAGGACCTTTCAAATATGGGATCTACCAATGGGCACTTCCAGTCATATCAAG
CAACTCTTTGGCTGTAAAGATTCTTTATCCCATTTTTTGGGGTTTGATGACCCTCAGCACTTTCGGAAATGA
TCTTGAACCCACTAGTAACTGGCTAGAAGTGATTTTCAGTATATGCATCGTACTCAGTGGACTGTTGCTTTT
CACATTATTGATTGGTAACATTCAGGTATTCTTACATGCTGTCATGGCAAAGAAGAGAAAGATGCAGCTGAG
ATGTCGAGACATGGAGTGGTGGATGAGGAGGAGGCAGTTGCCATCACGATTAAGACAAAGAGTTCGCCATTT
TGAACGTCAGAGATGGGCTGCGATGGGAGGAGAAGATGAGATGGAAATGATCAAAGACTTGCCTGAGGGGCT
GAGGAGGGACATCAAGCGCCATCTTTGCCTCGACCTCATTAAAAAGGTTCCTTTGTTCCACAACTTAGATGA
CCTTATTCTTGACAACATCTGTGACAGGGTGAGGCCCCTAGTCTTCTCTAAAGATGAAAAGATAATCAGAGA
AGGTGATCCTGTACCAAGGATGATGTTCATCGTCCGAGGACGCATAAAGCGCAGCCAAAGTCTGAGCAAAGG
CATGGTAGCCTTAAGCATCCTTGAGCCAGGAGGGTTTTTGGGTGACGAGCTACTTTCATGGTGCCTTCGCCG
GCCATTTATAGATAGACTTCCGGCCTCCTCAGCCACATTTGTGTGTCTTGAATCAGCAGAAGCCTTTGGCCT
TGATGCAGAGCACTTGAGGTACATCACTGATCACTTCAGGTACAAGTTTGCCAACGAGAGGCTGAAGAGAAC
AGCAAGATATTACTCATCTAATTGGAGAACCTGGGCTGCTGTCAACATTCAATTTGCTTGGAGACGTTACAG
GCAGAGGACTAGAGGTCCAGTGACGCCTGTAAGGGAGATTGGAGGGACTGAGCGCAGGCTCTTACAATATGC
TGCAATGTTCATGTCAATAAGGCCACATGACCATCTTGAATGAAAGCTGCTGTCTATGTTTTTCAATTTTTT
ATTGCTTCCTGGCCTTCAATAAAACTGTCTCAAGTCCATTAAACCTTATGATTTTTTAAGTTGTTGTGAAAG
CCATGGAATCATCGATGAAATTTATAAAAGAAAGCATGCGTAATTGAAAAATCCTTTATGTCCTGTTT
2.19. HPL chr5
Localización: Phvul.005G116800 cromosoma 5
5´UTR CDS 3´UTR Primers
TGTGAGTGAAAAAGAAATTGTAAAACAATATTTTTCCTAATAATAATAATATCTTAACACTTCATTCCTCCT
CATTATTGCTTCAGAGCAATAGCACCACACCCAAACACCTTCCCTCCTTCACCATGTCATTGCCACCGCCAT
CTCTCGCAAAGGCGGCAATTGCGACGGAGCTCCCGATCCGGCAGATTCCAGGAAGTTATGGGTTACCGTTGC

Secuencia del transcriptoma de los genes de estudio
191
TTGGCCCCTTGTCGGATCGACTGGACTACTTCTGGTTCCAGAAGCCGGAGAGCTTCTTCAAGAAGCGAATGG
AGAAGTACAAGAGCACGGTGTTCCGCACCAATGTTCCTCCCTCCTTCCCCTTCTTCACCAACGTTAATCCCA
ACGTCATCGCAGTTCTCGATGTCAAATCCTTCTCCCACCTCTTCGACCTGGACCTCGTCGACAAGAAGGACG
TTCTCATCGGAGACTTTGTCCCCGACGTCAACTTCACCGGAAAAATCAGGGTCGGCGTGTACCAGGACACCT
CCGAACCTCAACATTCCAAGGTGAAGAGCTACCTAATGGATATCCTGAAACGAAGCTCGAGCATATGGGTAT
CTGAACTAGTGTCCAATCTTGACATACTGTGGGACAACATCGAATCAACACTCTCAAATTCTTCATCTGTCT
CCTATTTCTCCCCTTTACAACAATTTCTCTTCACTTTCCTCTGCAAAGTTCTCGCAGGTGCAGACCCATCTC
GTGACCCCAAAATCGCAGACTCAGGCTCTGCCATGCTCAACCGATGGCTTGCCCTTCAGCTCCTCCCCACTG
TCAGCATCGGCATACTCCAACCTCTCGAAGAAATCTTCCTCCATTCCTTCGCTTACCCTTTCTTTCTCGTTA
GCGGAGACTACAACAACCTCTATAACTTCGTCAAGCAACAAGGGAAGGATACCATAAACAGAGGCGAAGTCG
GGTTCGGGTTGACCCAAGAAGAAGCAATCCACAACTTGCTCTTCGTGCTAGGGTTCAACTCCTACGGGGGCT
TCTCCATTTTCCTTCCAAGTTTGATTGATGCCATAGCGAGTAACTCCGCGTTGCAGGAGAAGCTGAAGAAGG
AAGCCAGGGAAAACGGCGGCTCAACGCTCACCTTTGACTCCGTCAAAGAGATGCCACTCGTCCAATCGGTGG
TCTACGAAACGCTGCGTATGAACCCTCCGGTTCCGCTGCAGTTCGGCCGCGCCCGAAAGGACTTCCGTTTGA
CCTCTCACGACTCCGTTTACGATGTGAAGAAGGGGGAGTTGCTATGCGGCTTCCAGAAGCTCGTGATGAGAG
ACTCTCTCATCTTCGACGAACCGGACCGCTTCAAGCCGGACCGGTTCACGGAGGAAAAAGGGGCCCAGTTGC
TGGACTACTTGTACTGGTCCAATGGGCCTCAAAGTGGGTCCCCCACTCTCTCCAATAAACAGTGCGCGGGGA
AAGACGTCGTCACCCTCACTGCGTCCTTGATTGTGGCTTACCTGTTTCGCAGGTATGATTCCATCAACGGCG
ATGGCAGTTCCATCACCGCCCTTCAAAAGGCTAGCTGAACTCAAGGCTACATTTGTATTTCCACGTGGAGAT
CCTACTTTATCTATGCACACACGTGCTGAGAATGATATCTTTTTATCAAATAGTATAAATGCAAGGTTATGA
TCTACCTTCACTTGGATCTAAAATAATTGCTACTAAGAAATGTGCACCATAAAAAGATGAATTAAAGTGTGT
G
2.20. Lox2 chr5
Localización: Phvul.005G156700 cromosoma 5
5´UTR CDS 3´UTR Primers
CACAACAGACACAGGCTTTCTTCTTTTTCTTGTTTTTGTTTTGTTTCCTAGTTCTGGGAAATAAAAACAGTG
GTGTTGGTAGGTTTTGAAAAGATGTTTCAAGTTCCAGGGGTGTCGGGAATCCTTAACCCAGGAGGGCATGGC
CATAACAAGATCAAAGGGACAGTGGTGCTGATGCGCAAGAATGTGTTGGACTTCAACTCCGTCTCTGATCTC
ACCAAAGGAAACGTTGGTGGAGTCATTGGAACTGGTCTCGGCGTTGTTGGTTCAACAGTTGACACCCTCACT
GCTTTCTTAGGCAGAAGTGTCTCTCTCCAGCTCATCAGTGCCACTCAATCTGATGAAAATGGAAAAGGAAAA
GTTGGAAAGGACACGTTCATTGAAGGGATCATTACCTCGTTACCAACTTTGGGAGCGGGAGAGTCTGCATTC
TATGTTCGTTTTGAATGGGACGGAAGCATGGGAATCCCTGCTGCATTTCACATCAAGAATTACATGCAAGTT
GAGTTTTACCTCAAGAGTTTGACTCTTGAAGACGTTCCAAACCAAGGAACCATTCGCTTTGTCTGCAACTCA
TGGATTTACAACGCTAACATTTACAAAAAGAGCGTGCGCACATTCTTTGCCAACCATAGTTATGTTCCAAGT
GAGACACCAGCAGCACTTGTGCATTATAGAGAAGAGGAGTTGAAGAATTTAAGAGGAGATGGTACTGGAGAA
CGCGTAGAACATGATAGGATCTATGATTATGATGTATACAATGATTTGGGTAATCCAGATCTCAATGAAGAT
TTCGCTCGTCCTATTCTTGGAGGCTCTGCCACTCATCCCTACCCTCGTAGGGGAAGAACTGGTCGATATCCA
ACAAGGAAAGATTCGAAATGTGAGAAGCCAGGAGAAATTTATGTTCCAAGAGATGAAAACTTTGGTCACTTG
AAATCTTCGGATTTCCTTGCAAATGGAATAAAATCTATATCTCAGTTTGTCTTACCAGCCTTCGAATCTGTG
TTCGACCTTAACCTGACCCCGACAGAGTTTGATAGCTTCCAAGATGTTCGTGACCTCTGTGAAGGTGGAATT
AAGCTTCCTACAAACGTAATCAGCACAATTAGCCCCTTACCAGTCGTCAAAGAACTCTTTCGTACCGATGGT
GAACAAGTTCTCAAGTTTCCAACACCTCACGTCATTCAAGTGAGTAAGTCAGCATGGATGACCGATGAAGAA
TTTGGAAGAGAGATGATTGCAGGAGTAAATCCTAATGTGATTCGTGGTCTTCAAGAGTTTCCTCCTAAAAGC
AATCTGGATCCTGCAACCTATGGTGATCAAAACAGTAAGATAACAGCAGATGTGCTTGATCTAGATGGAAGC
ACAGTGGATGAGGCTCTTGCTAATAAGAGGTTATTTGTCTTAGATTACCATGATATCTTCATGCCATATATA
AGGAGGATAAATCAGACTTATGCCAAAACTTATGCCACAAGGACTATCCTTTTCTTGAAAGAAGATGGAACT
TTGAAGCCAGTGGCCATCGAATTAAGCTTGCCACATCCTGGTGGGGACCACTCAGGTGCTATCAGTCAAGTC
ATCTTACCTGCAAAAGAAGGCGTTGAAAGTACAATTTGGCTACTAGCCAAAGCCTATGTAGTTGTAAATGAC
TCTTGCTATCATCAACTCATGAGCCATTGGTTAAATACTCATGCAGTGATGGAGCCATACGTCATAGCAACA
CACCGGCAGCTTAGTGCCCTTCACCCAATTTATAAGCTTCTAACTCCTCATTATCGTGACACCATGAACATC
AATGCACTTGCCAGGCAGACTCTAATTAATGCTGATGGCATAATAGAGAAATCCTTTTTGCCCTCAAAGTAT
TCTGTGGAGATGTCCTCAGCGGTTTATAAGAATTGGGTTTTCACTGATCAAGCACTACCTGCAGATCTTATC
AAGAGAGGAGTGGCAGTTGAGGATCCATCAGCCCCACATGGACTTCGTCTCTTGATAGAAGACTACCCTTAT
GCTGTTGATGGACTAGAGATATGGGCTCTGATTAAGTCATGGGTCCAAGAATATGTGTCATTATACTATGCA

Anexos
192
AAAGAAGATGATGTCAAATCTGATCCTGAACTCCAACATTGGTGGAAAGAAGTTGTGGAGAAAGGACATGGT
GATTTGAAAGACAAGCCATGGTGGCCTAAGTTGCAGACACCTGAGGAGCTTGTTGAAGTCTGCACCATTATC
ATATGGACTGGTTCAGCCCTCCATGCAGCCGTGAATTTTGGTCAATACCCTTATGCAGGTTTTGTTCTGAAT
CGCCCAACTTCTTCTAGACGGTTGCTTCCTGAGCAAGGCACACCAGAATATGAAGAAATGGTGAAGAGCCAT
CAAAAGGCCTATTTAAGAACAATTACATCAAAGTTTCAGACTCTGATTGACCTTTCAGTGATAGAGATGTTG
TCAAGGCATGCCTCTGATGAGATCTACCTTGGCCAAAGGGACAACCCATATTGGACCTCTGATTCCAAAGCC
TTGGAAGCCTTTCAAAAGTTTGGAAACAAGCTGAAGGAAATTGAGGAAAAACTTGGAAGGAAGAACACTGAT
GAGAAACTTAGAAATCGAGTTGGACCAGTTCAATTGCCTTACACTTTGCTTCATCCTACCAGTGACGAAGGT
TTGACTTTCAGGGGAATTCCTAATAGCATTTCCATCTGAATGAGCCTGTGCTTTCTCTTTAGTTACTGTGTT
TTGCTTCTTTCCAATAAAAAAAGATGCAAGGCTAAAGAGATCCAATAAATCTTGCATCTTATCTAATGTTTT
AGTTATGTTGTGTTTCTTGTGTGTTTAAATATGTTGTAATTCAGCCCTTCGATTTGGTTTTTGTTTGCAAAT
AATAGGAGTTAGTTTGTGTTTAGCTCCTGTCACCATTAGTAATATACCTGCAGATTGAGCAAGTTGATGTTA
TCAG
2.21. Lox2 chr10
Localización: Phvul.010G134800 cromosoma 10
5´UTR CDS 3´UTR Primers
GAGCAGTTTACCTGTATGCACAGGGAGGAGGAAAATATGTGTGAAAAATTAGAGATAATTCAGCACTGAGTT
GAAGGACTTCACATTTACCTATAAATACCTTCCTCTAGAGTAGCCACAAGGCACAAGCATTAAGGTGCAAAA
CCTCTCCCACCCAAAGAAGAGTGTGCTGTGTTTGAGAAGCTAGCAAAAATGTTTGGGATCTTGAACAGGGGT
CACAAGATAAAGGGCACGGTGGTGTTGATGACCAAGAATGTGTTTGACTTCAATGAATTTGTGTCAACCACT
AGGGGTGGAATAGTTGGTGCTGCAGGTGGTCTTTTCGGTGCTGCCACTGACATAGTTGGAGGCATAGTTGAC
GGTGCCACTGCCATCTTCAGCCGTAACATTGCCATTCAGTTGATCAGTGCAACCAAAACTGATGGGCTTGGA
AATGGAAAGGTTGGAAAGCAAACCTTTTTGGAGAAACATCTTCCTTCGTTACCAAACTTGGGAGATAGACAA
GATGCATTCAATGTTTATTTTGAATGGGATGAGAATTTTGGAATTCCAGAAGCATTTTACATCAAAAACTTT
ATGCAATCTGAGTTTTTTCTTGTGAGTCTCACTCTTGAAGACATTCCCAATCATGGAACCATTCACTTTGTT
TGCAATTCATGGGTCTACAACGCTAAGTCTTACAAAAGGGATCGCATTTTCTTTGCTAATAAGACATATCTT
CCAAATGAAACTCCAGCTTCACTGGTAAAGTACAGAAAAGAAGAGTTGGAAAATCTTAGAGGAGATGGAACG
GGGGAGCGCAAGGAATATGACAGGATCTATGATTATGATGTTTATAATGATTTGGGCAACCCAGACAAGAAC
AAGAATTTAGCTCGTACTACTCTTGGAGGGTCTAGTGACTTTCCCTACCCTCGCAGGGGAAGAACTGGTAGA
AAATCAACAAGGAAAGACCCTAAGTGTGAGATACCAACCAGTGACACCTACATTCCAAGAGATGAAAACTTT
GGTCATTTGAAGTCAGGAGACTTTCTTACCTATGCAATAAAGTCCTTAACTCAAAATGTGTTACCTACATTT
CAAAAGGCATTTGGTTTCAACAATGAGTTTGATACCTTTGAAGACGTGCGTGGACTCTTTGAAGGTGGACTT
TATCTCCCCACAGATGTAATCAGCAAAATTAGCCCCATACCAGTGCTTAAGGAAATCCTCCGCACTGATGGT
GAGCAAGTCCTCAAGTTTCCACCACCTCACGTCATCAGAGTTACTAAGTCCGCATGGATGACTGATGAAGAA
TTTGGAAGAGAGATGCTTGCTGGTGTTAATCCTTGCCTAATTCAACGCCTTCAAGAGTTCCCTCCAAAAAGC
AAGCTAGATGTTACGGTGTATGGTGATCAAACTAGTACAATGACCAAAGAACACTTGGAGATCAACCTTGGT
GGACTCACTGTGGAAGAGGCACTGCATGGTAACAGATTGTTCATATTAGATCATCATGATGCATTCATACCA
TATTTGGAAAGGATCAATGACCTTCCCACTGCAAAGTGTTATGCCACAAGAACTATCCTTTTCTTGAAAGAT
GACAACACTTTGAAGCCACTAGCCATTGAATTAAGTTTGCCAAATCCTGGGGGAAAGGGTGCCAATAGTAGA
GTAATCTTGCCTGCAGATGAAGGTGCTGAAAGCACAATTTGGCTACTTGCAAAGGCTTATGTTGTTGTAAAT
GACTCCTGCTACCATCAACTCATGAGCCATTGGTTGAATACTCATGCCGTAATGGAACCGTTTGTGATAGCA
ACAAACAGACATTTGAGTGTGCTCCACCCTATTTATAAACTTCTGTTGCCTCATTATCGTGACACTATGAAT
ATCAATGCACTTGCACGACAGTCGCTTATCAATGCAGGTGGTGTCATTGAGCGATCATTTTTGCCAGGCGAA
TTCGCTGTAGAGATGTCCTCAGCAGTTTACAAGAGTTGGGTTTTCACTGATCAAGCCCTTCCAGCAGATCTT
ATCAAGAGAGGAATGGCAGTTGAGGATCCATCCTCTCCATATGGCCTTCGCCTTGTGGTAGAGGACTACCCT
TATGCTGTTGATGGACTAGAAATATGGGATACTATTCAGACCTGGGTTAAAGACTATGTCTCCTTGTACTAT
CCCACAAATGATGCAGTTAAGAAAGACACTGAACTCCAAGCTTGGTGGAAAGAAGCTGTTGAGAAAGGTCAC
GGTGACTTGAAAGATAAGCCATGGTGGCCAAAGTTGAACACTCCTCAAGATCTGATTCACACTTGCTCCATT
ATTATATGGATTGCTTCAGCTCTTCATGCAGCTGTGAATTTTGGACAATATCCTTACGGTGGTTTCATCCTA
AATCGTCCAACTATAACCAGAAGATTGCTGCCTGAACCAGGAACCAAAGAATATGGTGAGCTCACCAGCAAT
TATCAAAAGGCTTATTTGAGAACAATTACAGGGAAGGTTGAGGCCATTGTGGACCTTTCAGTGATAGAGATA
TTGTCAAGACATGCTTCTGATGAGGTCTATCTTGGACAGAGGGACAATCCAAATTGGACTAATAACATAAAA
GCACTTCAAGCATTTAAGAGGTTTGGACAAAAGCTGAAGGAAATTGAAGAAAAAATCATGGGGAGGAACAAA
GATTCAAGTCTTAGAAACCGTAATGGACCAGTTCAGATGCCCTACACTGTGCTTCTTCCTACCTGTGAAGAT

Secuencia del transcriptoma de los genes de estudio
193
GAAGGCCTCACTTTTAGAGGAATTCCCAACAGCATCTCAATCTAATGAGTTTCTCTACGTGTTGTTCTCTTT
GCAATCCTACCTTTTTAATCACAAATAAATATGCAGGCTTATCCACCT
2.22. Lox7 chr5
Localización: Phvul.005G156900 cromosoma 5
5´UTR CDS 3´UTR Primers
GGTGTATATAAATAGGAGCATGGCCATGCTCACTCACACACAGAAGAAGAACAACAACAGTGTTCGTTGAAA
GTTAAGCAAGATGTTCGGAATCATAGGAGGAAACAAGGGTCACAAGATAAAGGGAAACTTGGTGATTATGCG
AAAGAATGTGTTGGATATCAACAGCATCACAAGTGTGAAGGGTGTCATTGGAACAGGAATCAACATCATCGG
TGGTGTAGTTGATACTGTCACTGCTCTTGCTTCCCACATCTCCATTCAGCTCATCAGTGCTACTAAGCCTGA
TGGACATGGAAAAGGGAAGGTTGGAAAGGCTACGAATTTAAGAGGGCAGGTCTCATTGCCAACCTTGGGAGC
TGGAGAAGATGCATATGATGTTCATTTTGAATGGGACGCTGATTTTGGAATTCCTGAGGCATTTTACATCAA
GAACTTCATGCAAGTTGAGTTCTACCTTAAGTCCCTAACTCTCGAAGACATTCCAAATCATGGAACCATTCA
CTTCATATGCAACTCTTGGATTTACAATTCTAAAGTCTACAAGAGTGATCGCATTTTCTTTGCCAACAATAC
ATATCTTCCTAGCGAGACACCAGCTCCACTTCTGAAGTACAGAGAAGAAGAACTGAAGAATGTAAGAGGCGA
TGGAAGTGGAGAACGGAAGGAATGGGACAGGGTTTATGATTATGATGTCTACAATGACTTGGGCAACCCAGA
TAAAGGTGCAGCATTAGCTCGCCCCGTTCTTGGAGGTTCTACCTTACCTTACCCTCGCAGAGGAAGAACGGG
AAGACCAAAAACTAAAAAAGATCCTAACAGTGAGAAGCCCAGTGACTTTGTTTACCTTCCAAGAGATGAAGC
ATTTGGTCACTTGAAGTCATCCGATTTTCTTGCTTACGGATTGAAATCTGTATCCCAAGATGTGTTGCCAGT
GTTGACTGATGCATTCGATGGAAATCTTTTGAGCCTTGAGTTTGATAACTTCGCTGAAGTGCACAAGCTTTA
TGAAGGTGGAGTTACATTGCCTACAAACTTTCTCAGCAAATACGCTCCTATACCAATTGTGAAGGAAATTTT
CCGATCTGATGGTGAACAGTTCCTCAAGTATCCACCACCTAAAGTCATGCAAGTCAATAAGTCTGCATGGAT
GACCGATGAAGAATTTGCAAGAGAAACCATTGCTGGTGTTAATCCTAATGTCATTAAGAGTCTTGAGGAATT
TCCACCACGAAGCAAGCTGGATACTCAATCCTTTGGTGATCATACTTCCATTATAACGAAAGAACATTTGGA
GATTAACTTAGGTGGGCTCACTGTTGAGCAGGCTATCCAAAGCAAGAAGTTGTTCATTTTGGATCACCATGA
CTATCTCATTCCATATTTGAGGAGAATAAATGCATCTGCCACAAAGACTTATGCTACAAGAACCATATTTTT
CTTGAAAAGTGATGGAACTTTGGCACCATTGGCCATTGAGTTAAGTAAGCCGCATCCTCAGGGCGACGAACA
TGGTCCTGTTAGCGAAGTCTATGTTCCTGCATACGAGGGAGTTGAAGCTTACATTTGGTTACTGGCAAAGGC
TTATGTTGTTGTGAACGACTCGTGCTACCATCAACTTGTTAGCCATTGGCTAAACACTCATGCAGTTGTTGA
ACCATTCGTGATAGCAACAAACAGGCAACTGAGTGTGCTTCACCCTGTTTACAAACTCCTGTTTCCTCACTA
TCGTGACACCATGAACATTAACTCGCTTGCCCGCAAGTCCTTGGTCAATGCAGACGGTATTATAGAGAAAAC
ATTCTTGTGGGGTAGATACGCTTTGGAACTGTCCGCTGTGATTTATAAGGACTGGTCTCTCCACGATCAAGC
ATTGCCTAATGATCTTGTCAAGAGAGGTGTTGCAGTTGCAGATCCATCTGCTCCCCACGGTGTTAAGCTTTT
GATTGAGGATTATCCTTATGCTTCTGATGGGCTAGAGATATGGGATGCCATCAAGTCCTGGGTGGTAGAGTA
TGTGGCATTCTACTACAAGTCAGACGAGGTACTTCAGCAAGACTCCGAACTCCAAGCTTGGTGGAAAGAACT
TGTTCAGGTGGGTCATGGTGATTTGAAAGATAAGCCATGGTGGCCAAAGATGCAAAGTCGTGAAAATTTGGT
TGAAGTCTCTACTACCCTCATATGGATAGCTTCAGCTCTTCATGCAGCTGTTAACTTTGGACAGTATCCATA
TGGTGGTTTAATCCTTAACAGGCCAACTATTAGCAGAAGATTCATGCCTGAGAAAGGGTCTGCTGAGTATGC
TGCATTGGCTAAGAACCCTGAGAAGGAGTTTCTGAAAACTATTACTGGAAAGAAGGAGACCCTTATTGACCT
TACAGTCATAGAGATATTGTCAAGGCATGCATCTGATGAGATATACCTGGGAGAGAGAGATGGTGGTGACCA
TTGGACTTCTGATGCAGGGCCATTGGAGGCCTTCAAGAGGTTTGGAAAGAAGCTTGCAGAGATTGAAAAGAA
GCTTGTACAGAAGAACAATGATGAGACATTGAGAAACAGAACTGGGCCAGCTAAAATGCCTTATACTCTGCT
CTATCCTTCAAGTGAGGAAGGCTTGACTTTCAGAGGAATTCCCAACAGTATCTCCATCTAAGGCTTTATGGT
TGCTGCAGCACTGTGCCTGTTTTCAGTAAAAGCAAAATAGAAGGAATCTGATTCCTTCGTCCACTTATGTAT
GGTTAAGTTATGCATCTGAACTGGTTGAATCTTCTCGTGTGTTTCTTATTAATAAAGAAATGTGTTTGTACT
TTGTATGATCTTGAGAATATAATAAAAAGCAGTTCCCATGTTTAAATATTGTTGGCATTGCAAAATGCAT

Anexos
194
2.23. GSTa chr2
Localización: Phvul.002G241400 cromosoma 2
5´UTR CDS 3´UTR Primers
AGAACCACCGACAGTATATAATGAGAGGCGAAGAGAAGTTGAGAGAGAAAGAAGATGGGAAGCGAAGAAGTG
AAGGTGGTGAGCTTTTGGGTGAGTCCGTTTGGTATAAGGGTAGAGTGGGCCTTGAAACTGAAGGGAATAGAG
TATGAGTATATAGAAGAAGATATCTTCAACAAGAGTAATCTCCTTCTCCAGTTGAACCCGGTTCACAAGAAG
GTTCCGGTTCTTCTCCATGCCCACAAACCCATCGCTGAGTCATTCATCATCCTTCAATACATTGATGAAATT
TGGAAGCACTATCCACTCTTGCCACAACATCCTTATCAACGAGCGCTTGTTCACTTTTGGGCCAATTTTGGT
GACCAAAAGCTTTTGGACCCATCATGGATTGCAATGTGTAGCAGCGGGGATGACCAGGAAAACGCTCTGAAA
GTAGCTAGAGAATCGATGGAGAAGATTGAAGAAGAGATTAAGGGGAAGAAGTTTTTTGGAGGAGACAACATT
GGATACCTTGACATTGCCCTTGGATGGATCTCCTACTGGCTTCCTGTTTGGGAGGAAGTTGGATCCATGCAG
ATAATGGACCCATTGAAGTTTCCAGCTACCAATGCATGGATCACCAATTTTCTGAGCCACCCTGTGATCAAG
GACAACTTGCCCCCAAGAGACAAAATGCTTGTTTACTTCCACAGTCGCAGAAAGGCACTTTCTTCATCTCTT
CAGGGTTGGTTCAAGGTTTAGATCTGTTCTCTCTCCATGTTTCATAGGCCAAGATGTTAGATGTTTGTAGAA
TGAGAATAAGAAGAGGGAGTCACACTGGCTATGTTTGTATTTTGGGTTCTTTGTGCTGCTATAATAAACCAC
TTTTTGGATGTGTAACTCACTTTATGGCATATGCAAAGGAATAAAGTTTGTTTCACACTCTCGTTTTCTCTC
ACTAAAATGCAAATGGCACATTACTAGTGTGGTG
2.24. hGS chr6
Localización: Phvul.006G094500 cromosoma 6
5´UTR CDS 3´UTR Primers
AAATAGAAAAAAGATGGAGCACTACCTGTGGCTGCAGTGGTGATTGCAATGTATATGAATATATAAAGGGGA
TTGAAAAACGAAGAGAATGGGTGGTAGATCTGGGTGCTTGTTTTGTTCTCCTTCTTTCACTGGGATAAAGAC
TAAACCTTTAAGTTCTTACACATTTCCCTCTTTCTCCTTCACCTTCTCACCCCACCAACTACACTCACTCTC
TTTCCCCAAACTCATGTCTCAGCCTTTGACTCTCAACTCTGCCCCACTTGCAGAGCCTGACACTGATTCTTC
CGCCGCGCCTCCCCTCTTCGATTATCATAGTATCGACCAAAAACTGCTCGAAAACATAGTTTACGATGCTCT
TGTCTGGAGCACTCTCAACTGCCTCCTCGTTGGAGATAAATCCGTTCAGAGATCTGGAACAGTTCCAGGTGT
GGGTTTGGTGCATCTTCCGCTTTGCTTATTACCCGGGCCATTTCCGGAAAGTCACTGGAAGCAAGCTTGTGA
ATTAGCTCCTATTTTTAATGAGCTTGTTGATCGTGTGAGTTTGGATGGGAAATTTCTCCAGGAATCTCTATC
CAGAACTAAGAATGCAGACGAATTTACCTCCAGACTTTTAGATATTCATTCCAAGATGCTACAGATTAACAA
AAAAGAGGATATACGCTTGGCAATAGTTCGTTCAGATTATATGGTTGATGAGAAGACTAAATCACTTCTGCA
AATAGAGATGAACACCATTTCCACTTCATTTGCTTTGATTGGATGTCTTATGACTGGACTTCACAAGAGCTT
AATTTCTCAATATGGAAATATCCTTGGACTAGATTCCAATAGGGTTCCTGCCAACAATGCTGTCGATCAATC
TGCAGAGGCCTTGGCTAAAGGTTGGAGTGAGTATAACGACCCCAGGGCTGCAATTTTGGTCGTGGTTCAGGT
TGAAGAAAGAAACATGTATGAACAGCATTACATCTCCGCCCTTCTAAGAGACAAGTATCATATTAAAAGCAT
ACGGAAAACATTGGCAGAAGTTGACCAGGAAGGAGAAATTCTACCCGATGGAACACTTTCGGTGGACGGACA
ACCAATTTCAGTTGTTTACTTCCGGGCTGGCTACACACCAAAAGACTATCCTTCAGAATCAGAATGGAGAGC
TAGGCTACTCATGGAACAATCTTCTGCTATCAAATGCCCTTCAATATCTTATCATTTGGTTGGCACCAAAAA
GATTCAACAGGAACTTGCAAAACCTGGTGTGCTTGAGAGGTTTGTCGAAAACAAAGACCACGTTGCCAAATT
GCGTGCATGTTTTGCAGGGTTGTGGAGTTTGGAAGACTCAGATATTGTTCAAAAAGCAATTGAAAATCCAGA
GTTATTTGTGATGAAGCCGCAAAGAGAAGGAGGAGGAAACAATATTTATGGTGATGATATGAGGGAAAACCT
CCTTAAATTACAGAAAGCTGGTTCTGAAGAAGATGCAGCTTACATCCTCATGCAGAGGATATTTCCAGCCAC
TTTTCCAGCAATTTTGGTGCGTGATGGTAATTGGAGTACGGGTCATGTGATTGCAGAAGCTGGAATATTTGG
TACTTATTTAAGGAATAAGGATAAGATTATCATTAATAACGAAAGTGGCTATATGGTGCGTACAAAAGTATC
ATCATCTTATGAAGGTGGAGTTTTACCTGGTTTTGGAGTGGTAGATACTGTATATCTAACTTGATGAGCCAA
GCCCCTGAGCTATCATATTCACTGCAATTCAAAATATTATGTATGGTTTTCATTTGTCTCTCTCCTAAAGCA
GTGAAATATGAGGAGATGCATTCTTGTTTCTTTTAGCTTTTCCTACTGAATGGTGTCTAATTATCAAATGTA
CTCAACTACCTCTTTTTCTAACCAATAAAGTTATTGAACTGTTCTAAC

Secuencia del transcriptoma de los genes de estudio
195
2.25. Aminotransf 2 Clase V chr6
Localización: Phvul.006G029100 cromosoma 6
5´UTR CDS 3´UTR Primers
CCATTCTCAGCCTCAAGGTTCCATTGTTTCTCCCTCTTATCTTCTACCTGTGACATGACCTGGCCCCACCTT
AGCATTTCATTGGTTCACCTGCACTCTTGATCATAAAAATTGAATTTTCTCTTTTATACTTTTATATAATAA
GGTTCTAACAACACCAGACATAGCCCTTCCTTGCTTCTGCCACATTCCTCAAAAACTCTGTAAAGCTCCTCC
TTCCCACGGGACTCTCTGTGGGAAAATTCAAAAGAAGTGGTTGAAATTTGAAGCAGGAGAAGATGGACTATT
TCAATGCACCAGGAAGAAACCATCTCTTTGTTCCAGGGCCAGTTAACATCCCAGACCAGATCATTCGGGCCA
TGAACAGAAACAATGAGGACTACCGTTCTCCAGCTATTCCAGCTCTCACAAAAACTCTGCTTGAGGATGTCA
AGAAGATTTTCAAGACCACTACTGGAATCCCATTTCTCATCCCCACAACTGGTACTGGTGCTTGGGAGAGTG
CTCTCACAAACACACTGTCTCCTGGGGATAGAATTGTATCTTTCCTGATTGGCCAATTCAGCTTGCTTTGGA
TTGATCAGCAGCAACGTCTGAAGTTCAATGTTGATGTTGTGGAAAGTGATTGGGGTCAGGGTGCTAAGCTTG
ATGTTCTGGAATCAAAGATTGCTTCAGATACTGCACACACTATAAAGGCTATTTGCATTGTTCACAATGAGA
CAGCAACTGGTGTTACCAATAACTTGGCAAAAGTGAGACAAATTCTGGATTCCTACAAGCATCCAGCCCTCC
TTATTGTGGATGGAGTGTCTTCCATTTGTGCTCTTGATTTCCGCATGGATGAATGGGGAGTAGATGTGGCCA
TAACTGGCTCTCAGAAGGCCCTTTCCCTTCCCACTGGGATAGGTATTGTGGTTGCAGGCCCTAGAGCTATTG
AGGCCTCAAAAACTGCTAAATCACTTAGAGTTTTCTTTGACTGGAAAGACTACCTGAAATTCTACCAGTTAG
GAACCTATTGGCCATACACTCCTTCCATACATTTGCTGTATGGTCTGAGGGCTGCTCTTGATCTGGTTTTTG
AAGAAGGACTTGAGAATGTGATTGCAAGGCACAATCGTTTAGGCACAGCAACCAGACTTGCTGTAGAGGCAT
GGGGTTTGAAGAATTGCACCCAGAAGGAAGAGTGGCACAGTGACACAGTGACTGCTGTTATTGTTCCTTCTT
ACATTGATAGTGCTGAAATAGTTAGAAGGGCATGGAAAAGATACAATTTGAGCTTAGGTCTTGGACTGAACA
AAGTTGCTGGGAAGGTTTTCAGAATTGGACATCTTGGCTACTTGAATGAGTTGCAACTCTTGGGATGTCTAG
CTGGTGTGGAGATGATACTGCAAGATGTGGGTTACCCTGTAAAGCTTGGAAGTGGAGTTGCTGCTGCCAGTG
CATACTTTAAGAACACTATTCCTCTCATTCCTTCCAGGATTTGAGTCACAAGCCATTATTCTCTTTTACTTC
TTCCTTTTCTGCTCTTTCAAAAATTCTGTAAAATATATATATTATCCTCTTTTACACTCCTTTCAACATCAA
CATACTCTACTTTCAACTTTAATGCACTGCTTCTTCATTGTCTTGTATATCAAAAATCATTGCATCTTGTCA
TCTTATTTCTGACTATCTCATGCTC
3. BIBLIOGRAFÍA
Hermosa, M. R., Grondona, I., Iturriaga, E. A., Diaz-Minguez, J. M., Castro, C., Monte, E., et al. (2000). Molecular characterization and identification of biocontrol isolates of Trichoderma spp. Appl. Environ. Microbiol. 66, 1890-1898.
Hermosa, M. R., Keck, E., Chamorro, I., Rubio, B., Sanz, L., Vizcaíno, J. A., et al. (2004). Genetic diversity shown in Trichoderma biocontrol isolates. Mycol. Res. 108, 897-906.
Kullnig, C. M., Krupica, T., Woo, S. L., Mach, R. L., Rey, M., Benítez, T., et al. (2001). Confusion abounds over identities of Trichoderma biocontrol isolates. Mycol. Res. 105, 770-772.

