programme a guide to red lists and their use in … guide to red lists and their use in conservation...
TRANSCRIPT

Threatened SpeciesP R O G R A M M E Threatened Species:
A guide to Red Lists and their use in conservation

LIST OF ABBREVIATIONS
AOO Area of Occupancy
BMP Biodiversity Management Plan
CBD Convention on Biological Diversity
CITES Convention on International Trade in Endangered Species
DAFF Department of Agriculture, Forestry and Fisheries
EIA Environmental Impact Assessment
EOO Extent of Occurrence
IUCN International Union for Conservation of Nature
NEMA National Environmental Management Act
NEMBA National Environmental Management Biodiversity Act
NGO Non-governmental Organization
NSBA National Spatial Biodiversity Assessment
PVA Population Viability Analysis
SANBI South African National Biodiversity Institute
SANSA South African National Survey of Arachnida
SIBIS SANBI's Integrated Biodiversity Information System
SRLI Sampled Red List Index
SSC Species Survival Commission
TSP Threatened Species Programme

OVERVIEW
The International Union for Conservation of Nature(IUCN)’s Red List is a world standard for evaluating theconservation status of plant and animal species. The IUCNRed List, which determines the risks of extinction tospecies, plays an important role in guiding conservationactivities of governments, NGOs and scientific institutions,and is recognized worldwide for its objective approach.
In order to produce the IUCN Red List of Threatened Species™, the IUCNSpecies Programme, working together with the IUCN Species SurvivalCommission (SSC) and members of IUCN, draw on and mobilize a network ofpartner organizations and scientists worldwide. One such partner organizationis the South African National Biodiversity Institute (SANBI), who, throughthe Threatened Species Programme (TSP), contributes information on theconservation status and biology of threatened species in southern Africa.
The IUCN Red List Categories and Criteria for identifying species at risk ofextinction were extensively reviewed between 1991 and 1999, and therevised Categories and Criteria (version 3.1) came into use in 2001. Allassessments submitted to the IUCN Red List must use this system. Thesystem contains nine categories, with the main purpose of classifying speciesfrom lowest to highest risk of extinction.
This manual takes you through the steps of the Red-listing process. Chapter 1provides background information and various definitions related to threatenedspecies work in South Africa. Chapter 2 provides detail on the IUCN’s systemof Red List Categories and Criteria, as well as information on how assessmentsare conducted, and how RedList data are applied in speciesconservation. Finally, Chapter3 provides some examples ofRed Listed species in SouthAfrica from taxonomic groupsassessed by the TSP and itspartner institutions.
Threatened Species: A guide to Red Lists and their use in conservation
1

SANBI’s Threatened Species Programme
The Threatened Species Programme (TSP) is primarilyaimed at fulfilling the South African NationalBiodiversity Institute (SANBI) mandate to monitorand report on the conservation status of South Africa’sindigenous plant and animal species. The TSP co-
ordinates the collection of information on species, particularly those that arenot well known, such as reptiles, spiders and marine fishes, through projectsinvolving volunteers from the public, as well as scientists, taxonomists1 andconservationists from partner institutions across the country. The data collectedthrough these projects are used to assess species’ status according to theinternationally accredited Red List Categories and Criteria developed by theInternational Union for Conservation of Nature (IUCN).
In addition, the TSP co-ordinates and promotes the use of species informationin all spheres of biodiversity conservation – from national and internationalconservation legislation and policy, to conservation planning, protected areaselection, protection of threatened habitats, ex situ conservation2 programmes,and the development of Biodiversity Management Plans3 (BMPs) for species.
What is a threatened species?
Threatened species are often also referred to as endangered species. These arespecies that have been classified as ‘at high risk of extinction in the wild’.This means that if nothing is done to conserve them and their habitats,chances are very high that these species will go extinct.
Chapter 1:
Threatened species conservation in South Africa
2
Threatened SpeciesP R O G R A M M E
1 A professional in the field of taxonomy, the science of describing and classifying plants and animals into species, orders, families, etc.
2 Breeding or growing species away from their natural habitats, for example in zoos or botanical gardens, with the purpose of re-introducing bred individuals to the wild
3 Legally binding management and conservation plans aimed at ensuring the long-term survival of specific species by assigning the responsibility of managing, monitoring, and reporting on the status of a species to a specific person or organization
What is a protected species?
Protected species are species protected by international, national andprovincial legislation. Hunting, picking, owning, importing, exporting, trans-porting, growing, breeding and trading of such species are illegal withoutvalid permits or licences. The names of protected species are listed in inter-national conventions, national acts and provincial ordinances. Examplesinclude the following:• The Convention on International Trade in Endangered Species (CITES), which regulates the international commercial trade of species. A list ofCITES-protected species can be obtained from www.cites.org/eng/disc/species.shtml
• The list of threatened or protected species contained in the National Environmental Management: Biodiversity Act (NEMBA). These arenationally protected species that can only be owned, hunted, picked,traded, imported, exported, transported, bred or grown with a validpermit. A list of NEMBA-protected species is available atwww.speciesstatus.sanbi.org/pdf/NEMBAToPslist23Feb.pdf
• The list of protected trees of the Department of Agriculture, Forestry and Fisheries (DAFF). In terms of the National Forests Act of 1998, no trees innatural forests, or tree species that appear on DAFF’s list of protectedtrees, may be cut, disturbed, damaged or destroyed. Moreover, theirproducts may not be possessed, collected, removed, transported, exported,donated, purchased or sold without a licence granted by DAFF. A list oftrees that are protected in terms of the National Forests Act can bedownloaded from www.dwaf.gov.za/Documents/Notices/30253c.pdf
Are all threatened species protected by law?
No. Species that can be legally protected are typically those that arethreatened due to activities that can be regulated by permits, such as huntingor trade. Species that are threatened due to other reasons, such as habitatloss, require other forms of conservation, and are usually not included inGovernment Gazetted4 lists of protected species.
What is a Red List?
Red Lists and Red Data Books are scientific publications that document theconservation status of species. They are based on a system that categorizesspecies according to their risk of extinction. Red Lists are not in themselveslegislation to protect species, but are used to inform threatened species legislation.
The idea of documenting threatened and extinct species originated in the1940s with publications such as Extinct and Vanishing Mammals of theWestern Hemisphere (Allen 1942). In 1956, the IUCN founded the SpeciesSurvival Commission (SSC), one of the oldest and largest commissions in theorganization, to co-ordinate the documentation of extinct, endangered andrare species in Red Data Books. Initially, only a few selected species wereincluded in Red Lists and Red Data Books based on recommendations byscientific experts. By the 1970s, Red List categories were developed to
3
SOUTH AFRICAN LEGISLATION
NEMBA contains a list of threatened orprotected species that are protected bynational legislation. Species on this listare placed in one of four categories:
• Critically Endangered species – any indigenous species facing anextremely high risk of extinction inthe wild in the immediate future
• Endangered species – any indigenous species facing a high risk of extinctionin the wild in the near future,although it is not a CriticallyEndangered species
• Vulnerable species – any indigenous species facing an extremely high riskof extinction in the wild in themedium term future, although it isnot a Critically Endangered species oran Endangered species
• Protected species – any species which is of such high conservation value ornational importance that it requiresnational protection
It is important to note that although thecategory names in this list are similar tothose in the IUCN Red List system, andtheir category definitions are broadlysimilar to those of the IUCN categories,they are not equivalent. This is becausetwo different species classificationsystems are used: The IUCN Red Listsystem uses a set of five objectivecriteria based on biological factors toclassify species in terms of their risk ofextinction, while species contained inNEMBA, on the other hand, are catego-rized and listed based on expert opinion.Therefore, a species’ classification inNEMBA may differ from its Red Listcategory.
4 Officially published by National Government

subdivide extinction risk according to degree of threat, as well as data uncertainty. However, species were still categorized according to expertopinion. As a result, the classification of species at risk of extinction wasbased on inconsistent, subjective perceptions, and was liable to scepticism,uncertainty and controversy, particularly where commercial interests were at stake or where strongly held opinions and emotions were involved inspecies conservation issues.
A review of the Red List categories during the 1980s revealed an urgent need for a more scientifically objective and robust system that can be reliablyand consistently applied across taxonomic groups. In 1991, a process startedto develop and test scientifically rigorous, quantitative criteria, to identifyspecies at risk of extinction, in consultation with experts from major taxonomicgroups. The first set of quantitative Red List Categories and Criteria waspublished in 1994. Further testing and review of the criteria led to the publi-cation of the final version of the IUCN’s Red List Categories and Criteria(version 3.1) in 2001 (IUCN 2001). These criteria will not be changed in thefuture so as to allow for objective comparisons of the changes in species’ RedList status over time.
Today, the IUCN’s Red List of Threatened Species, and its underlying systemof categories and criteria for classifying species’ extinction risk, is interna-tionally endorsed for its strong scientific base, objectivity and transparency. It is for these reasons that the TSP has adopted this system. Since 2000, theSSC has also recommended a move away from selective assessments, tocomprehensive assessments of all species within a taxonomic group or aparticular region, regardless of whether they are suspected to be in danger ofextinction or not. Such comprehensive assessments provide a more accurateindication of the state of biodiversity. The TSP and its partner projects haveadopted this approach, and are producing comprehensive assessments for allSouth African plants, butterflies, reptiles, birds and amphibians.
In the meantime, the SCC’s role has changed from producing Red Data Books,to managing a global network of nearly 8 000 volunteer scientists, who arenow conducting the species assessments. This network also includes the TSP.Volunteer scientists are organized either based on the taxonomic group theywork on, or into specialist groups by region. Specialist groups conductassessments, and submit them to the IUCN. The maintenance of the IUCN’sGlobal Red List of Threatened Species is the responsibility of a specializedunit within the IUCN, namely the Species Programme. Staff of this unit areresponsible for checking the specialist groups’ assessments to ensure thatthey apply the criteria consistently and accurately, and for providing toolsand guidelines to facilitate assessments. The IUCN’s Red List of ThreatenedSpecies is now too long to be printed, containing over 45 000 species. It isinstead published on the IUCN’s website (www.iucnredlist.org), and isupdated annually.
4

Which species are most prone to extinction?
• Species at higher trophic levels5
Predatory species at the top of the food chain occur at much lowerdensities than their prey and other plants and animals at lower trophiclevels. They are often large animals with slow rates of growth and repro-duction, needing to produce only a few offspring to maintain their popula-tions. Due to the combination of low population size and slow rates ofgrowth and reproduction, such species are particularly vulnerable tooverexploitation and habitat loss.
• Localized endemics6
Localized endemics are generally found in taxonomic groups that haveundergone recent, rapid evolutionary diversification, such as the plantgenera Erica and Pelargonium in the Cape Floral Kingdom; or whereperiods of environmental change have driven formerly widespread speciesinto small pockets of suitable habitat conditions, known as ‘refugia’; orwhere species have evolved in small, isolated areas of suitable habitat,such as islands or lakes. Such species are extremely vulnerable to human-induced habitat loss or degradation, which can quickly wipe out the entirepopulation. For this reason, extinction rates on islands are higher thananywhere else in the world (see box ‘Islands as hotspots of extinction’ onpage 10).
• Species with small populations As explained above, these are typically apex predators7, but species atlower trophic levels, for example many tropical forest trees, can also occurat very low densities. Individuals of such species easily become isolatedin small, unviable groups when their habitats are fragmented as a result oftransformation for human use. Critically small populations are prone tolocal extinction due to environmental-8 and demographic stochasticity9,the Allee effect10, and harmful genetic processes such as inbreedingdepression11.
• Largest members of species guilds12
The largest members of a guild have higher metabolic demands, requiringlarger areas of intact habitat to survive. They also generally are longer lived,slower to reach reproductive maturity13, and produce fewer offspring. Theytherefore tend also to occur at lower densities than other guild members.Habitat fragmentation14 is the most severe threat to such species. Forexample, all Madagascan lemur species that have gone extinct since humanshave colonized the island were larger than the species remaining today.
• Species with poor dispersal and colonization ability Species with highly specific habitat requirements, but a poor ability todisperse to new areas of suitable habitat, are at high risk of extinction,even when their populations are relatively widespread. When their
Chapter 2:
Classifying a species as threatened with extinction
5
5 Positions occupied in the food chain
6 Species that occur only in an extremely small area
7 Species at the top of the food chain: they have no other predators preying on them, for example lions, sharks and eagles
8 Environmental stochasticity: random variations in environ-mental conditions that affect the survival of populations. Random events cause local extinctions more readily in small populations than in larger ones
9 Demographic stochasticity: random variations in population dynamics such as breeding success or longevity. The effects of such variations are more severe in small popula-tions and often cause local extinctions
10 The Allee effect occurs when the density of individuals is so low that breeding success is severely reduced or completely disrupted
11 Reduced survival and fertility in a population due to breeding between closely related individuals
12 Groups of organisms that are not necessarily closely related,but exploit the same environmental resources, thereby fulfilling the same ecological roles within ecosystems
13 The age at which a species breeds for the first time
14 When land transformation slices up natural areas into small and isolated pieces
habitats are fragmented, poor dispersers are unable to recolonize areas ofsuitable habitat where local extinctions have occurred, and individualsbecome isolated more quickly. Poor dispersers will most likely be hardesthit by climate change, as they are unable to move fast enough to keep upwith the shifting of suitable habitat conditions.
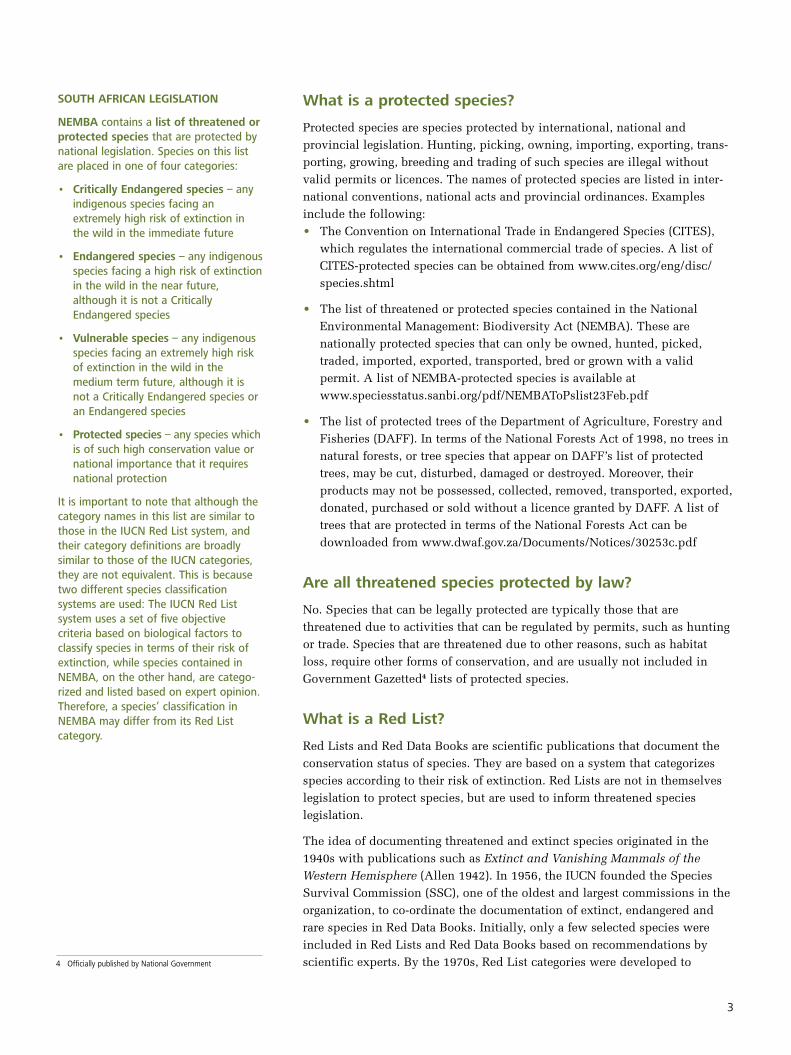
• Species with colonial or gregarious breeding habits15
Wide-ranging and abundant species that gather in a single place to breedare extremely vulnerable to disturbance or destruction of their breedingsites. Many ocean-roaming seabirds, such as the Spectacled Petrel (see‘Case study: Spectacled Petrel’ on page 10), return to a single oceanicisland to breed. In the same vein, the communal nesting habit of thePassenger Pigeon (see ‘Case study: The Passenger Pigeon’ on page 9) madetheir nests an easy target for hunters. Gregarious breeders such as thePassenger Pigeon often have very complex social structures, which breakdown when only a few individuals remain. Conservationists were unableto save the Passenger Pigeon from extinction because attempts to coax thelast few individuals into captive breeding16 failed.
• Migratory species Migratory bird species are not only dependent on the maintenance of theirsummer breeding and winter foraging habitats, but also on crucial restingpoints along their migratory routes, where large numbers of birds maygather in small areas. Disturbance and habitat destruction at resting pointscan affect large numbers of birds while they are at their most vulnerable,as migration is physiologically highly taxing. Animal species migratingoverland following shifting food resources require large areas of intacthabitat, and are therefore sensitive to habitat loss as well as obstructionsto their migratory routes. The conservation of migratory species is verychallenging, particularly for species such as birds and marine mammals,which migrate over very large distances, as it requires international co-operation to ensure the protection of these species across national borders.
• Species dependent on unreliable resources Species that depend on unreliable resources include desert species thatrely on rainfall for critical steps in their life cycles, or nectar-feedinginsects dependent on the flowering of particular host plants. Such plantsand animals usually have very short life cycles, and their population sizefluctuates greatly between successive generations, depending on the avail-ability of the resource. Such species are prone to extinction at periodswhen their numbers are very low.
• Ecologically naive speciesEcologically naive species have evolved without the threat of competitorsor predators (including humans), and have subsequently lost the defensivebehaviour patterns of their relatives. They are most typically found onremote islands. Ecologically naive birds, for example, become flightlessand nest on the ground. Such birds are extremely vulnerable to introducedpredators, such as rats, cats or mongoose. Island species also tend to bevery tame, making them easy targets for hunters.
6
15 Gathering together in large groups to breed
16 Raising plants or animals in zoos, reserves or other controlled conditions to increase the species
IUCN Red List Categories and Criteria for identifyingspecies at risk of extinction – how does the system work?
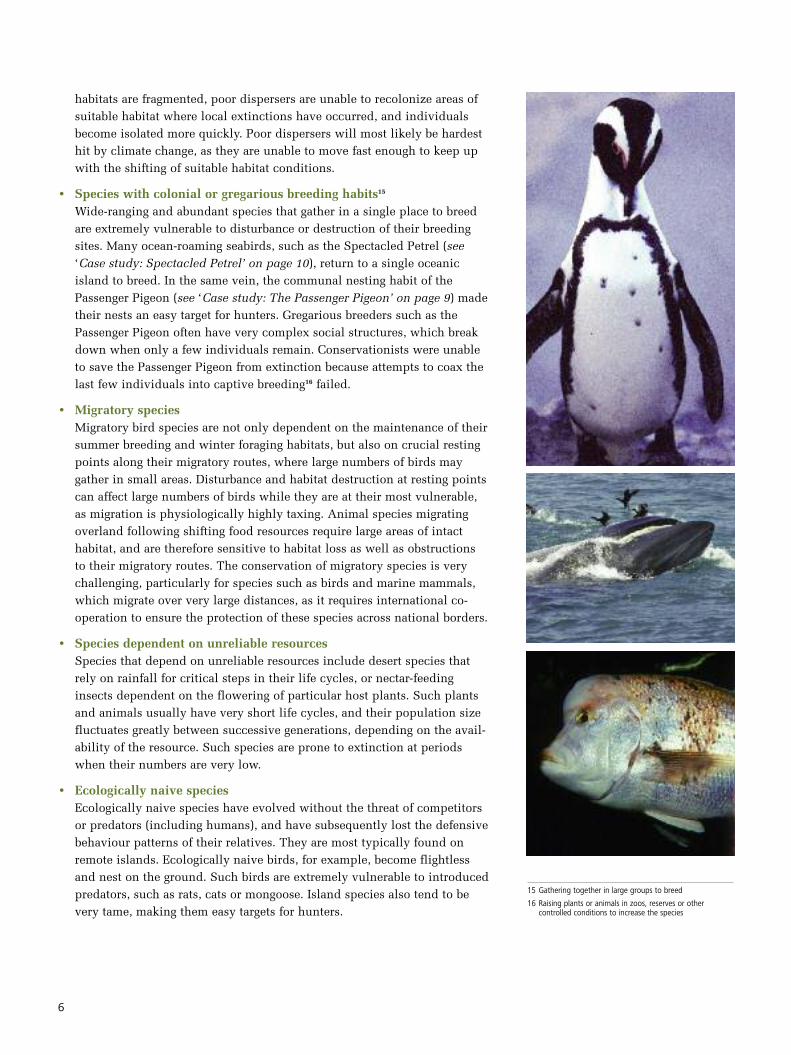
The IUCN’s Red List system contains nine categories, with the main purposeof classifying species from lowest (Least Concern) to highest (CriticallyEndangered) risk of extinction (see Figure 1). Specific, quantitative criteriarelating to species’ population size and trends are used to determine whethera species is at risk of extinction or not. Species that are at high risk ofextinction are placed in one of three categories: Vulnerable (VU), Endangered(EN) or Critically Endangered (CR). If a species is classified into one of thesethree categories, it is a threatened species. A species may be classified asNear Threatened (NT) if it nearly meets the criteria for inclusion in one of thecategories of threat.
Species that are already extinct are also documented, in the categories Extinct(no individuals of the species remain) and Extinct in the Wild (no wildindividuals remain, but the species survives in captivity or living collections).If insufficient information is available to determine a species’ risk of extinction,it is classified as Data Deficient (DD). Species that have not yet been assessedagainst the Red List criteria are classified as Not Evaluated (NE).
Figure 1: The IUCN Red List system categorizes species according totheir risk of extinction.
7

There are specific rules for the classification ofthreatened species:
• The categories indicating that a species is threatened with extinction are ranked: A species classified as Endangered (EN) is at higher risk ofextinction than a species classified as Vulnerable (VU), and a speciesclassified as Critically Endangered (CR) is at the highest risk of extinction.A species’ classification is guided by five criteria relating to differentbiological factors that indicate danger of extinction. A species shouldalways be evaluated against all five criteria, but available data only needto meet the requirements for at least one criterion in order to classify aspecies as threatened.
• All five criteria apply to all three categories of threat (VU, EN and CR), but different quantitative thresholds17 within each criterion determine inwhich of the three categories a species is placed (see Table 1 on page 14).
• A species is always classified in the highest category of threat for which it meets the quantitative thresholds of at least one criterion.
The Red List criteria as biological indicators of extinctionrisk – the scientific basis of the Red List
The quantitative criteria for identifying species at high risk of extinction aredetermined by an understanding of which types of species are most prone toextinction, as well as scientific studies of the population dynamics of species.Studies have shown that extinction is most likely to occur within a shorttime frame when:
• the population size is very small;
• the rate of population decline is high (namely, mortality rate18 is much higher than birth rate); and
• fluctuations in the population size are large in relation to the population’s growth rate.
These principles have been built into the Red List criteria so that the criteriaare able to detect symptoms of endangerment over a wide spectrum of lifehistories, ecology and behaviour of different species, rather than simplyfocusing on causes or ‘threats’. Therefore, any process that results in rapidpopulation decline, small population size or large population fluctuationswill lead to a species being classified as facing a high risk of extinction. Thefive criteria are explained in the following pages:
NOTE: Terms marked in italics in the following section are concepts specific to the RedList criteria, and their definitions are often different from their normal biological use.The definitions of these terms are listed at the back of this manual (see page 27) forreference purposes.
8
17 Set numerical ’cut-off’ values for measureable risk factors such as population size
18 The number of individuals dying over a specific period of time

Large and rapid reduction in population size relative to the life history19
of the species.
Criterion A identifies species that are at risk of extinction due to high rates ofpopulation decline. Population decline is measured as the proportion orpercentage by which the population is reduced over a specific time period.The faster a population declines (namely, the higher the percentage ofindividuals lost over a specific time period) the higher the species’ risk ofextinction (see quantitative thresholds for Criterion A in Table 1). The timeperiod over which population decline is measured is not the same for allspecies, but set in relation to the life history, or generation length of a species.This is because different species survive and reproduce at different rates,related to how long they live. Apex predators, largest guild members and otherlong-lived species tend to have fewer offspring at a time and breed lessfrequently than shorter-lived species. As a result they may decline to extinctionmore easily even when mortality rate is only marginally increased.
When evaluating a species using Criterion A, population reduction does nothave to be observed through monitoring or repeat population counts, but maybe estimated or inferred from statistical methods for determining populationsize (such as mark-recapture techniques), habitat loss or other circumstantialevidence. Population decline may have occurred in the past as a once-offevent, or it may be ongoing, or may be projected into the future (for example,species that are expected to decline due to climate change).
Species listed as threatened according to Criterion A are often criticized as‘too common’ to be threatened. It is important to remember that species Red-listed under Criterion A are at high risk of extinction due to the largereduction in the population size, not the number of individuals that are left.Formerly very widespread and abundant species that have declined exten-sively may still appear common relative to naturally rarer species, but thisdoes not mean that they are not threatened.
Criterion A
9
CASE STUDY:
The Passenger Pigeon(Ectopistes migratorius)
The Passenger Pigeon was once themost common bird in North America. Itwas a migratory species that lived inenormous flocks, which were as large as1.6 km wide and 500 km long, takingseveral days to pass. It was estimatedthat such flocks contained up to a billionbirds, which were some of the largestgroups formed by any animal, secondonly to swarms of the desert locust. On1 September 1914, Martha, the world’slast Passenger Pigeon, died in a zoo inCincinnati, Ohio. What was probably oneof the most abundant birds in the worldis extinct today. What happened?
During the early 19th century, PassengerPigeon meat was commercialized as acheap source of meat for slaves and thepoor, and the birds were hunted on amassive scale. By the 1850s, it wasnoted that the pigeons were becomingscarcer, but the large-scale slaughter ofbirds continued and even escalated. Onecommercial hunter reported shippingthree million pigeons to markets in1878. Between 1800 and 1870, thepigeon population declined slowly, but acatastrophic population crash between1870 and 1890 resulted in only a fewbirds remaining by the turn of thecentury.
Attempts to restore wild populationsthrough captive breeding failed due tothe gregarious nature of the birds, whichpractised communal roosting andbreeding in large communal nestshousing up to a thousand birds in asingle tree. As too few birds remained,and their social structures had beendisrupted, flocks continued to dwindle.
The Passenger Pigeon is a practicalexample of the principles behindCriterion A, and stands as a lesson to ustoday that no species is ‘too common’ togo extinct.
19 The sequence of changes that constitute an organism’s life course, particularly focusing on reproduction and survival

Small geographic range20 and decline, population fluctuation orfragmentation.
Criterion B identifies localized endemics: species that are at risk of extinctionbecause they only occur within a small area. Restricted ranges are howeveroften a natural phenomenon. Studies of localized endemics have shown thatif left undisturbed, they will persist for long periods of time so that theirnatural risk of extinction is in fact very low. Therefore this criterion alsoincorporates other factors contributing to increased extinction risk, such ascontinuing decline of the habitat or population, extreme fluctuations inpopulation size, and severe fragmentation of the population into small,isolated subpopulations.
A small range size alone is not sufficient to classify a species as threatened in terms of Criterion B: at least two other sub-criteria relating to the above-mentioned factors need to be met as well. This criterion enables Red-listingof poor dispersers (which are prone to severe fragmentation) or speciesdependent on unreliable resources (which tend to have fluctuating populations)as long as they also have small distribution ranges.
When applying Criterion B, it is important that range size is measured consistently. Two specific measures, extent of occurrence (EOO) and area ofoccupancy (AOO) are used to determine extinction risk (Figure 2). The smallerthe range (in either EOO or AOO), the higher a species’ risk of extinction (seequantitative thresholds for Criterion B in Table 1). The range size used shouldalways be a species’ present range. Therefore species with naturally smallranges as well as those where habitat loss or population decline has resultedin them now being confined to very small areas can be classified as threatenedaccording to Criterion B.
Criterion B
10
ISLANDS AS HOTSPOTS OFEXTINCTION
Nearly all documented human-inducedextinctions prior to the year 1800 were ofspecies endemic to islands, including theworld’s most famous extinct species, theDodo, a former inhabitant of Mauritius, asmall island in the Indian Ocean. Out ofthe 875 extinct species on the IUCN RedList, 537 (61%) are former island endemics(IUCN 2009). Island species have a numberof odds against them, including veryrestricted ranges, isolation (due to aninability to disperse and colonize newhabitats across vast areas of ocean) andlack of defences against introducedspecies. Island-type extinctions are how-ever becoming increasingly common inmainland areas. This is due to humantransformation of natural habitats, resultingin man-made ‘islands’ of natural areassurrounded by ‘oceans’ of crop fields,urban sprawl21 and timber plantations.Species affected by habitat fragmen-tation22 face the same challenges asisland species in terms of restricted habitatavailability, isolation from other individuals,and competition and predation by intro-duced species, which tend to colonizefragments more easily and more denselythan large natural areas.
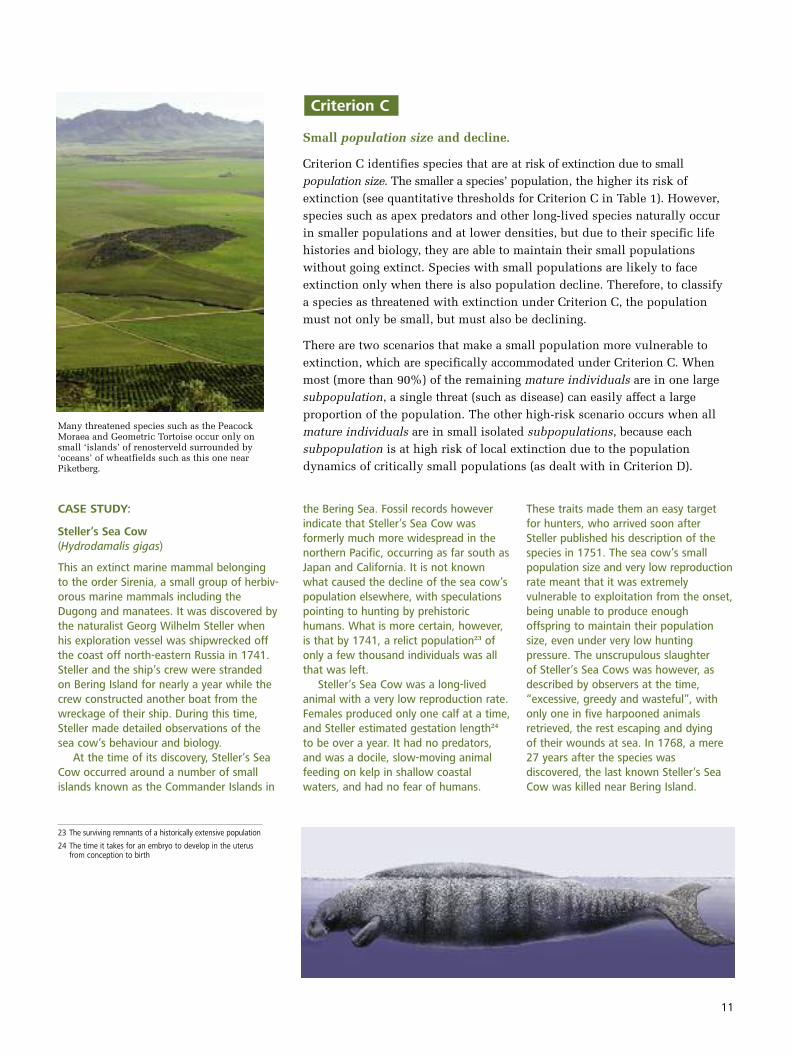
THE PEACOCK MORAEA (Moraea villosa)formerly participated in great abundancein the mass spring flower displays of theCape Lowlands. This attractive flower,which occurs from Gordon’s Bay to Ceresand Piketberg, has however lost morethan 80% of its habitat to wheat fieldsand urban expansion. Only a few popula-tions now remain on small fragments ofnatural veld surrounded by crop fields,where they are threatened by a lack offire (plants need fire tostimulate flowering),competition fromalien weedsspreading fromadjoining fields,loss of pollinators,and pollution byagricultural fertil-izers and pesticides.
Figure 2. The threatened Knysna Warbler (Bradypterus sylvaticus) hasa relatively large extent of occurrence (EOO) across the Eastern andWestern Cape, but this forest endemic occupies rather small areas ofindigenous forests scattered across its range.
20 The area where a species is found, as can be drawn on a map
21 The unplanned, uncontrolled or disorganized spreading of a city and its development into areas outside the urban edge
22 The slicing up of natural areas into small and isolated pieces by land transformation
Small population size and decline.
Criterion C identifies species that are at risk of extinction due to smallpopulation size. The smaller a species’ population, the higher its risk ofextinction (see quantitative thresholds for Criterion C in Table 1). However,species such as apex predators and other long-lived species naturally occurin smaller populations and at lower densities, but due to their specific lifehistories and biology, they are able to maintain their small populationswithout going extinct. Species with small populations are likely to faceextinction only when there is also population decline. Therefore, to classify a species as threatened with extinction under Criterion C, the populationmust not only be small, but must also be declining.
There are two scenarios that make a small population more vulnerable toextinction, which are specifically accommodated under Criterion C. Whenmost (more than 90%) of the remaining mature individuals are in one largesubpopulation, a single threat (such as disease) can easily affect a largeproportion of the population. The other high-risk scenario occurs when allmature individuals are in small isolated subpopulations, because eachsubpopulation is at high risk of local extinction due to the populationdynamics of critically small populations (as dealt with in Criterion D).
Criterion C
11
CASE STUDY:
Steller’s Sea Cow(Hydrodamalis gigas)
This an extinct marine mammal belongingto the order Sirenia, a small group of herbiv-orous marine mammals including theDugong and manatees. It was discovered bythe naturalist Georg Wilhelm Steller whenhis exploration vessel was shipwrecked offthe coast off north-eastern Russia in 1741.Steller and the ship’s crew were stranded on Bering Island for nearly a year while thecrew constructed another boat from thewreckage of their ship. During this time,Steller made detailed observations of thesea cow’s behaviour and biology.At the time of its discovery, Steller’s Sea
Cow occurred around a number of smallislands known as the Commander Islands in
the Bering Sea. Fossil records howeverindicate that Steller’s Sea Cow wasformerly much more widespread in thenorthern Pacific, occurring as far south asJapan and California. It is not knownwhat caused the decline of the sea cow’spopulation elsewhere, with speculationspointing to hunting by prehistorichumans. What is more certain, however,is that by 1741, a relict population23 ofonly a few thousand individuals was allthat was left.Steller’s Sea Cow was a long-lived
animal with a very low reproduction rate.Females produced only one calf at a time,and Steller estimated gestation length24
to be over a year. It had no predators,and was a docile, slow-moving animalfeeding on kelp in shallow coastalwaters, and had no fear of humans.
These traits made them an easy targetfor hunters, who arrived soon afterSteller published his description of thespecies in 1751. The sea cow’s smallpopulation size and very low reproductionrate meant that it was extremelyvulnerable to exploitation from the onset,being unable to produce enoughoffspring to maintain their populationsize, even under very low huntingpressure. The unscrupulous slaughter of Steller’s Sea Cows was however, asdescribed by observers at the time,“excessive, greedy and wasteful”, withonly one in five harpooned animalsretrieved, the rest escaping and dying of their wounds at sea. In 1768, a mere27 years after the species wasdiscovered, the last known Steller’s SeaCow was killed near Bering Island.
Many threatened species such as the PeacockMoraea and Geometric Tortoise occur only onsmall ‘islands’ of renosterveld surrounded by‘oceans’ of wheatfields such as this one nearPiketberg.
23 The surviving remnants of a historically extensive population
24 The time it takes for an embryo to develop in the uterus from conception to birth

12
Critically small population size or very restricted distribution.
Criterion D primarily identifies species that are at risk of extinction due tocritically small population size. Any population undergoes fluctuations innumbers because of changes in environmental conditions or simply becauseof the inherent randomness of breeding success and population dynamics. Ifthe population is large enough, such fluctuations normally don’taffect the stability of the population. However, if the sizeof the population is critically small, there is thedanger that random changes will deplete thepopulation to levels from which it can’trecover, and the species will go extinct.
Species listed under Criterion C may beviable at present population levels,provided they do not decline further dueto external threats. Criterion D differs inthat it identifies species which havealready declined to such extremely lowpopulation numbers that they are unlikelyto persist in the long term. It is thus notnecessary for a species to be declining atpresent in order for it to qualify for athreatened status under Criterion D.
Criterion D
BACK FROM THE BRINK
When a species’ population size becomes critically small, extinction is practi-cally inevitable. Because critically small populations can go extinct due torandom changes in population dynamics, saving such species from extinctionis often beyond the control of conservationists. Critically small populationsize is the ‘terminal phase’ that all extinct species have gone through ontheir way to extinction.In spite of such enormous odds against them, a number of species have
been brought back from this brink of extinction and are thriving again today.The two species discussed here both declined to the critically small popula-tions that would meet the quantitative thresholds of Criterion D, but thanksto concerted conservation efforts were saved from extinction:
The Mauritius Kestrel (Falco punctatus) declined to only four wild individualsin 1974, primarily due to the destruction of its subtropical forest habitat.This island endemic was at that stage Critically Endangered according toCriterion D. Other threats that caused this species to decline to critically lownumbers were poisoning by organochloride pesticides intended to controlmalaria-carrying mosquitoes, and predation by introduced Black Rats, feralcats and small Indian Mongooses, which preyed on eggs and chicks.Intensive conservation interventions, including captive breeding, supple-
mentary feeding, nest-site enhancement, provision of nest boxes, nest guarding, control of predators around nest and release sites,clutch and brood manipulations25, treatment of parasite infestations on chicks, and the rescue of eggs and young from failing nests,resulted in a remarkable recovery of the species. The last captive-bred individuals were introduced in 1994, and since then, the wildpopulation has continued to increase to about 1 000 individuals today.
25 Experiments in which the number of eggs hatched and the number of chicks are controlled
CASE STUDY: Vulnerable D2
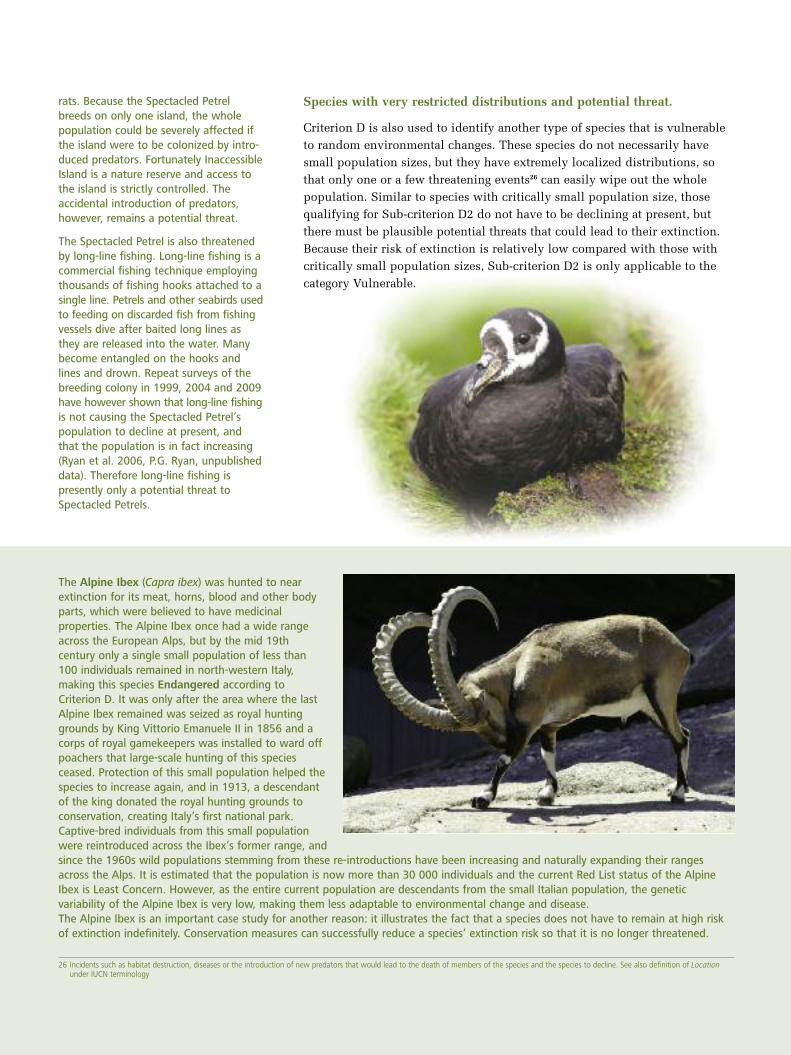
Spectacled Petrel(Procellaria conspicillata)
The Spectacled Petrel (opposite) roamsthe southern Atlantic between the eastcoast of Brazil, Uruguay and Argentinaand the west coast of South Africa andNamibia. Although this seabird has awide range, the entire population ofbetween 20 000 and 50 000 birds returnto a single island, Inaccessible Islandnear Tristan da Cunha, to breed. The sizeof Inaccessible Island is only 14 km2,which means that during the breedingseason the Spectacled Petrel has anextremely restricted area of occupancy(AOO) (see quantitative threshold forAOO under Criterion D in Table 1 anddefinition of AOO in the section onDefinitions of specific terms used in RedList criteria on page 27).
The Spectacled Petrel is an ecologicallynaive species: Birds nest in burrows inmarshy heathlands and along river banks.This means that eggs and chicks arewithin easy reach of mammalianpredators such as feral cats, mice and
13
rats. Because the Spectacled Petrelbreeds on only one island, the wholepopulation could be severely affected ifthe island were to be colonized by intro-duced predators. Fortunately InaccessibleIsland is a nature reserve and access tothe island is strictly controlled. Theaccidental introduction of predators,however, remains a potential threat.
The Spectacled Petrel is also threatenedby long-line fishing. Long-line fishing is acommercial fishing technique employingthousands of fishing hooks attached to asingle line. Petrels and other seabirds usedto feeding on discarded fish from fishingvessels dive after baited long lines asthey are released into the water. Manybecome entangled on the hooks andlines and drown. Repeat surveys of thebreeding colony in 1999, 2004 and 2009have however shown that long-line fishingis not causing the Spectacled Petrel’spopulation to decline at present, andthat the population is in fact increasing(Ryan et al. 2006, P.G. Ryan, unpublisheddata). Therefore long-line fishing ispresently only a potential threat toSpectacled Petrels.
Species with very restricted distributions and potential threat.
Criterion D is also used to identify another type of species that is vulnerableto random environmental changes. These species do not necessarily havesmall population sizes, but they have extremely localized distributions, sothat only one or a few threatening events26 can easily wipe out the wholepopulation. Similar to species with critically small population size, thosequalifying for Sub-criterion D2 do not have to be declining at present, butthere must be plausible potential threats that could lead to their extinction.Because their risk of extinction is relatively low compared with those withcritically small population sizes, Sub-criterion D2 is only applicable to thecategory Vulnerable.
The Alpine Ibex (Capra ibex) was hunted to nearextinction for its meat, horns, blood and other bodyparts, which were believed to have medicinalproperties. The Alpine Ibex once had a wide rangeacross the European Alps, but by the mid 19thcentury only a single small population of less than100 individuals remained in north-western Italy,making this species Endangered according toCriterion D. It was only after the area where the lastAlpine Ibex remained was seized as royal huntinggrounds by King Vittorio Emanuele II in 1856 and acorps of royal gamekeepers was installed to ward offpoachers that large-scale hunting of this speciesceased. Protection of this small population helped thespecies to increase again, and in 1913, a descendantof the king donated the royal hunting grounds toconservation, creating Italy’s first national park.Captive-bred individuals from this small populationwere reintroduced across the Ibex’s former range, andsince the 1960s wild populations stemming from these re-introductions have been increasing and naturally expanding their rangesacross the Alps. It is estimated that the population is now more than 30 000 individuals and the current Red List status of the AlpineIbex is Least Concern. However, as the entire current population are descendants from the small Italian population, the geneticvariability of the Alpine Ibex is very low, making them less adaptable to environmental change and disease. The Alpine Ibex is an important case study for another reason: it illustrates the fact that a species does not have to remain at high riskof extinction indefinitely. Conservation measures can successfully reduce a species’ extinction risk so that it is no longer threatened.
26 Incidents such as habitat destruction, diseases or the introduction of new predators that would lead to the death of members of the species and the species to decline. See also definition of Locationunder IUCN terminology

14
Quantitative analysis of extinction risk.
Criterion E is used to classify a species as threatened when a statisticalanalysis shows that the probability of extinction is high within a short timeframe. Quantitative thresholds include both the probability of extinction(expressed as a percentage) and the time frame to extinction in terms ofgeneration length. A statistical model known as Population Viability Analysis(PVA) is most commonly used for Criterion E. Data on how threateningprocesses affect population variables such as birth and mortality rates are usedto predict extinction risk. As PVAs require intensive and time-consumingdemographic study and monitoring of species, Criterion E is not often used in Red List assessments.
Criterion E
Table 1: The biological indicators of extinction risk as contained in each of the five IUCN criteria.
Quantitative thresholds within each criterion determine in which category of threat a species is placed. CR – Critically Endangered, EN – Endangered, VU – Vulnerable.
Biological indicator
Large and rapid reduction inpopulation size relative to thelife history of the species
Small geographic range anddecline, population fluctuationor fragmentation
Small population size anddecline
Critically small population sizeor very restricted distribution
Quantitative analysis ofextinction risk
Criterion
A
B
C
D
E
Risk factor
Proportion by whichpopulation is reduced
Extent of occurrence (EOO)Area of occupancy (AOO)
Population sizeNumber of mature individ-uals in largest subpopulationProportion of population inlargest subpopulation
Population sizeArea of occupancy (AOO)Number of locations
Probability of extinctionover a specified time period
Quantitative thresholdsCR EN VU
>80% >50% >30%
<100 km2 <5 000 km2 <20 000 km2
<10 km2 <500 km2 <2 000 km2
<250 <2 500 <10 000<50 <250 <1 000
>90% >95% 100%
<50 <250 <1 000<20 km2
Five or fewer
50% 20% 10%
15
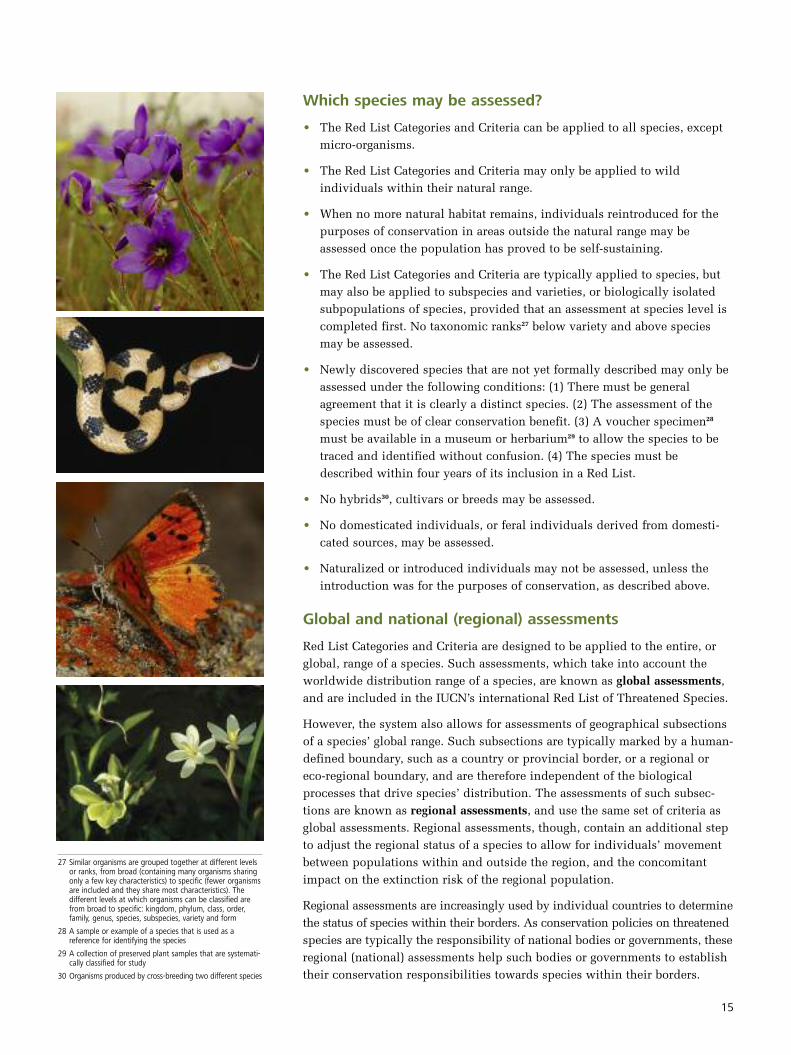
Which species may be assessed?
• The Red List Categories and Criteria can be applied to all species, except micro-organisms.
• The Red List Categories and Criteria may only be applied to wild individuals within their natural range.
• When no more natural habitat remains, individuals reintroduced for the purposes of conservation in areas outside the natural range may beassessed once the population has proved to be self-sustaining.
• The Red List Categories and Criteria are typically applied to species, but may also be applied to subspecies and varieties, or biologically isolatedsubpopulations of species, provided that an assessment at species level iscompleted first. No taxonomic ranks27 below variety and above speciesmay be assessed.
• Newly discovered species that are not yet formally described may only be assessed under the following conditions: (1) There must be generalagreement that it is clearly a distinct species. (2) The assessment of thespecies must be of clear conservation benefit. (3) A voucher specimen28
must be available in a museum or herbarium29 to allow the species to betraced and identified without confusion. (4) The species must bedescribed within four years of its inclusion in a Red List.
• No hybrids30, cultivars or breeds may be assessed.
• No domesticated individuals, or feral individuals derived from domesti-cated sources, may be assessed.
• Naturalized or introduced individuals may not be assessed, unless the introduction was for the purposes of conservation, as described above.
Global and national (regional) assessments
Red List Categories and Criteria are designed to be applied to the entire, orglobal, range of a species. Such assessments, which take into account theworldwide distribution range of a species, are known as global assessments,and are included in the IUCN’s international Red List of Threatened Species.
However, the system also allows for assessments of geographical subsectionsof a species’ global range. Such subsections are typically marked by a human-defined boundary, such as a country or provincial border, or a regional oreco-regional boundary, and are therefore independent of the biologicalprocesses that drive species’ distribution. The assessments of such subsec-tions are known as regional assessments, and use the same set of criteria asglobal assessments. Regional assessments, though, contain an additional stepto adjust the regional status of a species to allow for individuals’ movementbetween populations within and outside the region, and the concomitantimpact on the extinction risk of the regional population.
Regional assessments are increasingly used by individual countries to determinethe status of species within their borders. As conservation policies on threatenedspecies are typically the responsibility of national bodies or governments, theseregional (national) assessments help such bodies or governments to establishtheir conservation responsibilities towards species within their borders.
27 Similar organisms are grouped together at different levels or ranks, from broad (containing many organisms sharing only a few key characteristics) to specific (fewer organismsare included and they share most characteristics). The different levels at which organisms can be classified are from broad to specific: kingdom, phylum, class, order, family, genus, species, subspecies, variety and form
28 A sample or example of a species that is used as a reference for identifying the species
29 A collection of preserved plant samples that are systemati-cally classified for study
30 Organisms produced by cross-breeding two different species
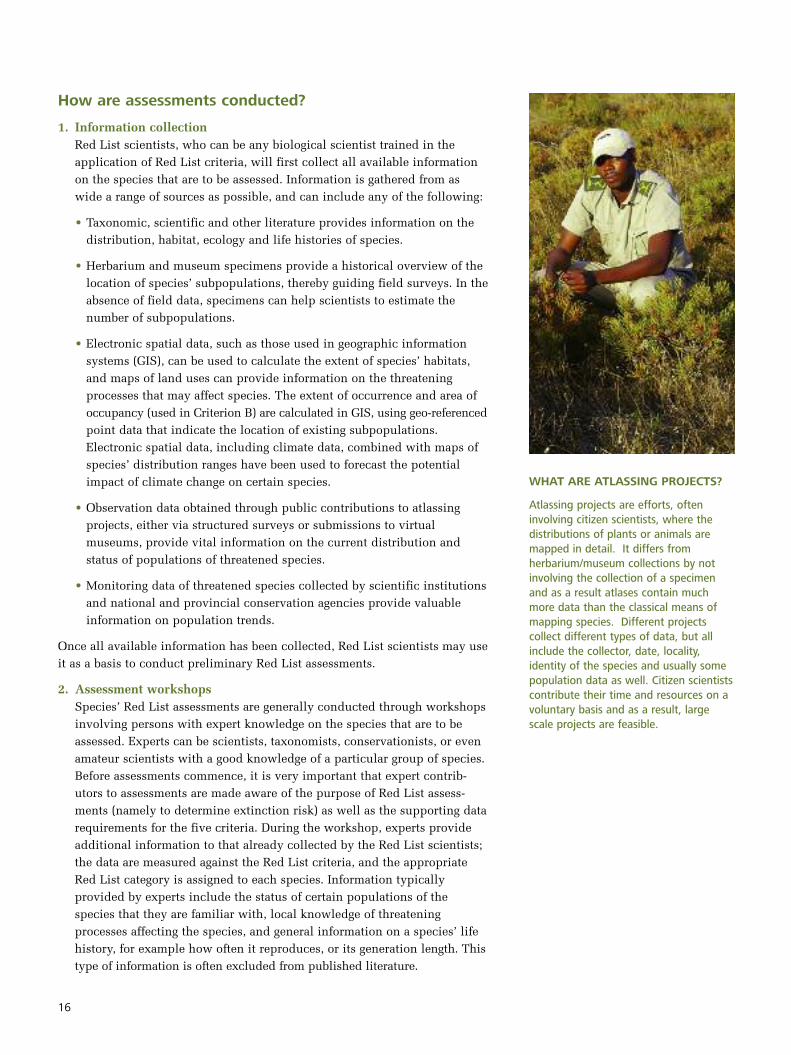
How are assessments conducted?
1. Information collectionRed List scientists, who can be any biological scientist trained in theapplication of Red List criteria, will first collect all available informationon the species that are to be assessed. Information is gathered from aswide a range of sources as possible, and can include any of the following:
• Taxonomic, scientific and other literature provides information on the distribution, habitat, ecology and life histories of species.
• Herbarium and museum specimens provide a historical overview of the location of species’ subpopulations, thereby guiding field surveys. In theabsence of field data, specimens can help scientists to estimate the number of subpopulations.
• Electronic spatial data, such as those used in geographic information systems (GIS), can be used to calculate the extent of species’ habitats, and maps of land uses can provide information on the threatening processes that may affect species. The extent of occurrence and area of occupancy (used in Criterion B) are calculated in GIS, using geo-referenced point data that indicate the location of existing subpopulations. Electronic spatial data, including climate data, combined with maps of species’ distribution ranges have been used to forecast the potential impact of climate change on certain species.
• Observation data obtained through public contributions to atlassing projects, either via structured surveys or submissions to virtual museums, provide vital information on the current distribution and status of populations of threatened species.
• Monitoring data of threatened species collected by scientific institutions and national and provincial conservation agencies provide valuable information on population trends.
Once all available information has been collected, Red List scientists may useit as a basis to conduct preliminary Red List assessments.
2. Assessment workshopsSpecies’ Red List assessments are generally conducted through workshopsinvolving persons with expert knowledge on the species that are to beassessed. Experts can be scientists, taxonomists, conservationists, or evenamateur scientists with a good knowledge of a particular group of species.Before assessments commence, it is very important that expert contrib-utors to assessments are made aware of the purpose of Red List assess-ments (namely to determine extinction risk) as well as the supporting datarequirements for the five criteria. During the workshop, experts provideadditional information to that already collected by the Red List scientists;the data are measured against the Red List criteria, and the appropriateRed List category is assigned to each species. Information typicallyprovided by experts include the status of certain populations of thespecies that they are familiar with, local knowledge of threateningprocesses affecting the species, and general information on a species’ lifehistory, for example how often it reproduces, or its generation length. Thistype of information is often excluded from published literature.
WHAT ARE ATLASSING PROJECTS?
Atlassing projects are efforts, ofteninvolving citizen scientists, where thedistributions of plants or animals aremapped in detail. It differs fromherbarium/museum collections by notinvolving the collection of a specimenand as a result atlases contain muchmore data than the classical means ofmapping species. Different projectscollect different types of data, but allinclude the collector, date, locality,identity of the species and usually somepopulation data as well. Citizen scientistscontribute their time and resources on avoluntary basis and as a result, largescale projects are feasible.
16
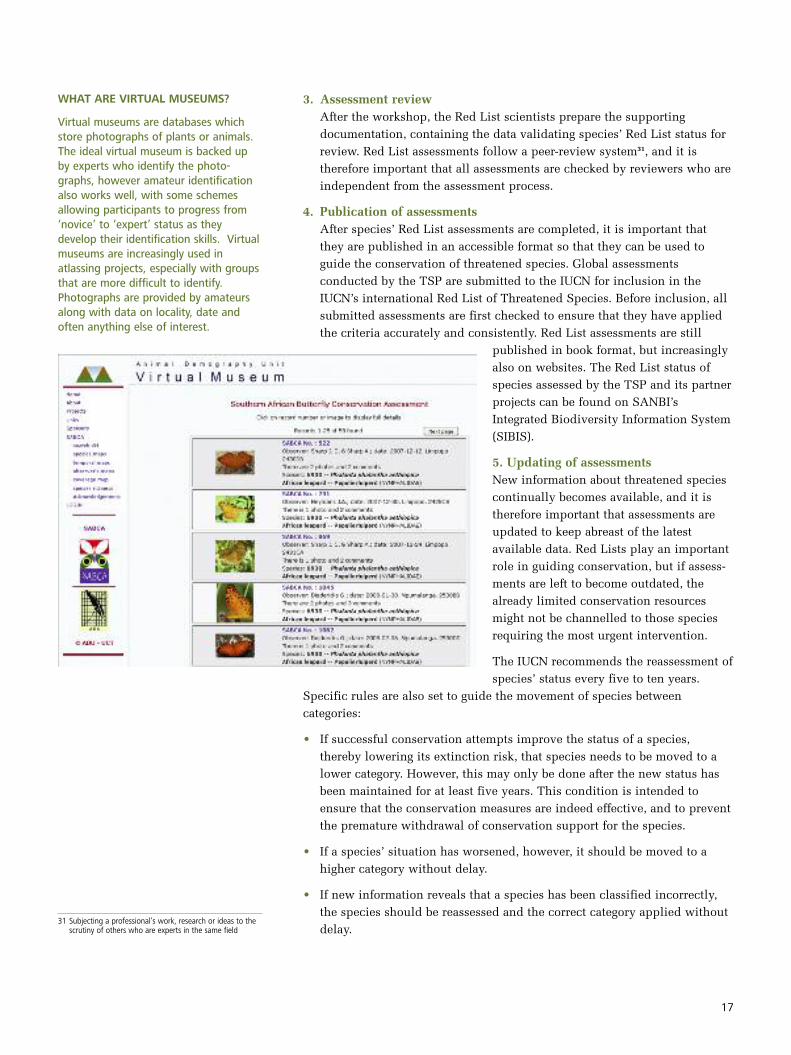
WHAT ARE VIRTUAL MUSEUMS?
Virtual museums are databases whichstore photographs of plants or animals.The ideal virtual museum is backed upby experts who identify the photo-graphs, however amateur identificationalso works well, with some schemesallowing participants to progress from‘novice’ to ‘expert’ status as theydevelop their identification skills. Virtualmuseums are increasingly used inatlassing projects, especially with groupsthat are more difficult to identify.Photographs are provided by amateursalong with data on locality, date andoften anything else of interest.
17
3. Assessment reviewAfter the workshop, the Red List scientists prepare the supportingdocumentation, containing the data validating species’ Red List status forreview. Red List assessments follow a peer-review system31, and it istherefore important that all assessments are checked by reviewers who areindependent from the assessment process.
4. Publication of assessmentsAfter species’ Red List assessments are completed, it is important thatthey are published in an accessible format so that they can be used toguide the conservation of threatened species. Global assessmentsconducted by the TSP are submitted to the IUCN for inclusion in theIUCN’s international Red List of Threatened Species. Before inclusion, allsubmitted assessments are first checked to ensure that they have appliedthe criteria accurately and consistently. Red List assessments are still
published in book format, but increasinglyalso on websites. The Red List status ofspecies assessed by the TSP and its partnerprojects can be found on SANBI’sIntegrated Biodiversity Information System(SIBIS).
5. Updating of assessmentsNew information about threatened speciescontinually becomes available, and it istherefore important that assessments areupdated to keep abreast of the latestavailable data. Red Lists play an importantrole in guiding conservation, but if assess-ments are left to become outdated, thealready limited conservation resourcesmight not be channelled to those speciesrequiring the most urgent intervention.
The IUCN recommends the reassessment ofspecies’ status every five to ten years.
Specific rules are also set to guide the movement of species betweencategories:
• If successful conservation attempts improve the status of a species, thereby lowering its extinction risk, that species needs to be moved to alower category. However, this may only be done after the new status hasbeen maintained for at least five years. This condition is intended toensure that the conservation measures are indeed effective, and to preventthe premature withdrawal of conservation support for the species.
• If a species’ situation has worsened, however, it should be moved to a higher category without delay.
• If new information reveals that a species has been classified incorrectly, the species should be reassessed and the correct category applied withoutdelay.
31 Subjecting a professional’s work, research or ideas to the scrutiny of others who are experts in the same field
How are Red Lists used?
The IUCN defines the purpose of Red Lists as follows:
• To provide a global index of the state of biodiversity
• To identify and document those species most in need of conservation action if current rates of extinction are to be reduced
Today, Red Lists are no longer mere lists of species names and their conser-vation status – they are underpinned by a wealth of supporting data asrequired by the IUCN’s quantitative criteria. It is precisely these data thatmake Red Lists a valuable resource, as analyses of Red List data can answerimportant conservation-related questions. This is why Red Lists are beingapplied in increasingly wide-ranging national and international conservationprocesses.
• The Red List Index as an international indicator of biodiversity trendsIn 2002, signatory governments to the Convention on Biological Diversity(CBD) resolved to “achieve by 2010 a significant reduction of the currentrate of biodiversity loss”. When setting such goals, it is important to beable to measure whether or not one is making progress towards them.
Both the CBD and the United Nations Millennium Development Goals haveadopted analyses of IUCN Red List data for measuring progress towards bio-diversity targets. The analyses produce a single statistic, or indicator, whichcan be tracked over time. This indicator is called the Red List Index.
The Red List Index is based on overall trends in the extinction risk ofspecies. It tracks species’ movement through the Red List categories, fromlowest to highest risk of extinction. Only Red List status changes resultingfrom genuine deterioration of, or improvement in, species status are usedin the analysis; taxonomic changes or changes resulting from improve-ments in knowledge are excluded. Therefore, this index provides areliable estimate of the success or failure of conservation actions inpreventing species extinction.
The Red List Index is, however, problematic in the sense that it demandscomplete Red List assessments of all species in a particular taxonomicgroup, as well as at least one reassessment of all species for a trend to beseen. Only a very small subset (about 2.7%) of the world’s estimated 1.8million described species has been assessed, and an even smallerproportion, mostly well-known groups such as birds and mammals, havebeen comprehensively assessed and reassessed to be used in the Red ListIndex. The Red List Index has therefore been criticized as being an insuffi-cient representation of biodiversity, as the most diverse taxonomic groups,such as plants and invertebrates, have been excluded from the analysisdue to a lack of comprehensive assessments.
In response, a modified version of the Red List Index, the Sampled RedList Index (SRLI), was developed to achieve better representation of alltaxonomic groups. This index is calculated in the same way as thestandard Red List Index, but is based on a randomly selected sample of 1 500species per taxonomic group, instead of comprehensive assessments.
THE LAZARUS EFFECT
One of the main purposes of Red Listshas always been to indicate the effective-ness of biodiversity conservation. Initially,extinction rate32 was used as the mainindicator. However, analyses of extinctspecies lists showed a large turnover inspecies listed, and while lists of threatenedspecies tended to grow, lists of extinctspecies often tended to shrink!
This phenomenon was named the‘Lazarus effect’, and is the result of theincorrect classification of species asExtinct. Earlier Red List criteria for classi-fying a species as Extinct focused on thetime that had lapsed since the last obser-vation of the species. This caused manyspecies that were merely undersurveyedto be listed as Extinct, only to be ‘resur-rected’ when they were rediscovered.The latest South African Red List forplants, for example, records the redis-covery of 18 species that were formerlyclassified as Extinct.
Two important changes to the Red Listsystem resulted from these findings:
1. Red List criteria for classifying species as Extinct became much stricter. Whilethe Red List system allows for theclassification of species as threatenedas a precautionary measure whenhigh-quality data are not available,listing a species as Extinct requiresconclusive evidence. The currentdefinition of extinction indicates thatthere must be “no reasonable doubtthat the last individual has died”.Species may only be classified asExtinct when repeated surveys of allavailable habitats at appropriate timeshave failed to record an individual.Such a strong evidence-basedapproach may however also result inan underestimation of the number ofextinct species. For this reason, thecurrent version of the Red ListCategories and Criteria (IUCN 2001)allows for species to be listed asPossibly Extinct in the categoryCritically Endangered. Speciesclassified as Critically Endangered(Possibly Extinct) are those that arehighly likely to be extinct already, buta small chance remains that they maybe rediscovered.
18
32 The number of species going extinct over a particular time frame

When Babiana blanda was not seen formore than 50 years, it was believed to beextinct. Most of this species’ wetlandhabitat on the lowlands north of CapeTown had been transformed or severelydegraded by agricultural and urbanexpansion, as well as alien invasiveplants. There was little hope of itssurvival, and it was classified as CriticallyEndangered (Possibly Extinct). Then in2006 a number of Babiana blanda plantswere discovered growing under a densethicket of alien acacias on a farm northof Cape Town. Babiana blanda’s statusremains Critically Endangered accordingto Criteria B and C.
2. Reporting on the state of biodiversity is no longer based on extinction rate, as it cannot be reliably measured. Instead, the Red List Index uses trends in the changes of the Red List status of species to measure the success of conservation efforts.
19
• National reporting on the state of biodiversity within South Africa• One of SANBI’s obligations in terms of NEMBA is to report to the Minister of Water and Environmental Affairs on the state of SouthAfrica’s biodiversity. The Red List data are used in the calculation ofstatistics for this reporting. These include analyses of changes in theRed List status of species, as well as analyses of major threats affectingspecies in South Africa.
• The National Spatial Biodiversity Assessment (NSBA) is a spatial report on the state of biodiversity across South Africa. This assessmentanalyzes spatial data in the form of electronic maps of habitats,ecological processes, and the distribution of threatened and otherspecies of concern, as well as information on existing protected areasand patterns of land use, to identify areas within South Africa whereconservation is a high priority. The results of the NSBA guide theformulation of national policies on conservation and the sustainable useof South Africa’s biodiversity, such as the National Biodiversity Strategyand Action Plan.
• Red List data are also used in state of the environment reporting at provincial and municipal levels.
• Conservation legislation and policy• Red List data on the status and distribution of threatened species are used to classify threatened terrestrial ecosystems. Ecosystems can beclassified as threatened based on a set of quantitative criteria similar tothose for species. One such criterion considers the number of threatenedspecies occurring within an ecosystem. Threatened ecosystems areprotected by law, preventing further habitat loss, and promotingeffective management in terms of NEMBA. The listing of threatenedecosystems is an important legislative tool for the protection of speciesthreatened by habitat loss.
• The National Environmental Management Act (NEMA) requires Environmental Impact Assessments (EIAs) to be conducted for proposeddevelopments in order to ensure sustainable development. In terms ofthe principles of sustainable development, degradation or loss of biodi-versity should be avoided if possible, or otherwise minimized ormitigated.33 EIAs must therefore report on any threatened species thatoccurs at a proposed development site, as the development is likely tocause a loss of biodiversity, either by increasing the extinction risk, orby directly leading to the actual extinction of the species. If a site surveyfinds a threatened species, the EIA report should include clear recom-mendations on how further decline in the threatened species and itshabitat should be prevented, based on an understanding of the Red Liststatus of the species, and the reasons why it is threatened. The recom-mendations should provide guidelines to conservation authorities evalu-ating the EIA report on whether or not the development should beapproved, or on specific mitigation conditions under which the devel-opment application could be approved.
33 To try and lessen the seriousness or impact of a negative occurrence

• Informing conservation planningSystematic conservation planning is the process of analyzing spatial biodi-versity data to identify high-priority areas for conservation. The aim ofconservation planning is to ensure that viable, representative samples ofspecies, habitats and ecosystem processes are maintained by producingmaps to guide land-use planning34 and decision making at various scales,from municipal to provincial and national level.
Representivity and viability are achieved by setting particular quantitativeconservation targets for habitat areas or a number of species subpopula-tions. To set such targets, a good understanding of the biologicalfunctioning of species and ecosystems is essential. Species targets shouldbe set so that no threatened species’ extinction risk increases, and toprevent species currently at low risk of extinction from becomingthreatened. Species target setting should therefore not simply focus onthose already at risk of extinction by only prioritizing species that havebeen Red Listed as threatened, but must also consider other species ofconservation concern.
• Guiding conservation actions for speciesRed List assessments are the first step in identifying species that are inurgent need of conservation, and data assembled during assessments canprovide guidance on the most appropriate conservation actions.
Red List assessments can also assist in the development of speciesBiodiversity Management Plans (BMPs). BMPs are not required for allthreatened species, but are rather developed for specific ones, particularlythose that are important biological resources on which people rely fortheir livelihoods, or species that can only be conserved through multiplestakeholder co-operation.
• Guiding scientific researchMany species are likely to be in danger of extinction, but are too poorlyknown for us to determine their extinction risk. Such species areclassified as Data Deficient. Trends and patterns in these Data Deficientspecies help identify gaps in our knowledge, and can be used to guidefield surveys, taxonomic and ecological studies, and research into specificthreatening processes and their mitigation.
SPECIES OF CONSERVATION CONCERN
The IUCN Red List system measuresspecies’ relative risk of extinction.However, species’ Red List status alone isinsufficient to determine priorities forconservation. While Red List status helpsto identify species that most urgentlyneed conservation, other factors, such asfinancial considerations, chances ofconservation success, the cultural oreconomic value of species, as well asother biological and ecological character-istics of species, are equally importantwhen determining how and where thelimited available conservation resourcesshould be directed in order to gainmaximum biodiversity benefits.
South Africa is particularly rich inlocalized endemic species. However,owing to the Red List’s focus onextinction risk, many species occurringonly within small areas or highlyspecialized micro-habitats may begrouped together with very abundantand widespread species in the categoryLeast Concern, because they arecurrently at low risk of extinction. Suchspecies may be very important for theoverall preservation of biodiversity, butcan be overlooked if conservation priori-tization or planning targets focus only onthreatened species.
To help identify localized endemicsamong South Africa’s more than 20 000plant species, the national Red List ofSouth African plants, for example, usesthe additional categories Rare andCritically Rare to distinguish localizedendemics from other widespread andabundant species also included in thecategory Least Concern. Localizedendemics, threatened, Near Threatenedand Data Deficient species are collec-tively called species of conservationconcern, and are included in planningtargets and other priority-settingexercises.
20
34 The way authorities attempt to order and regulate the wayland is used
21
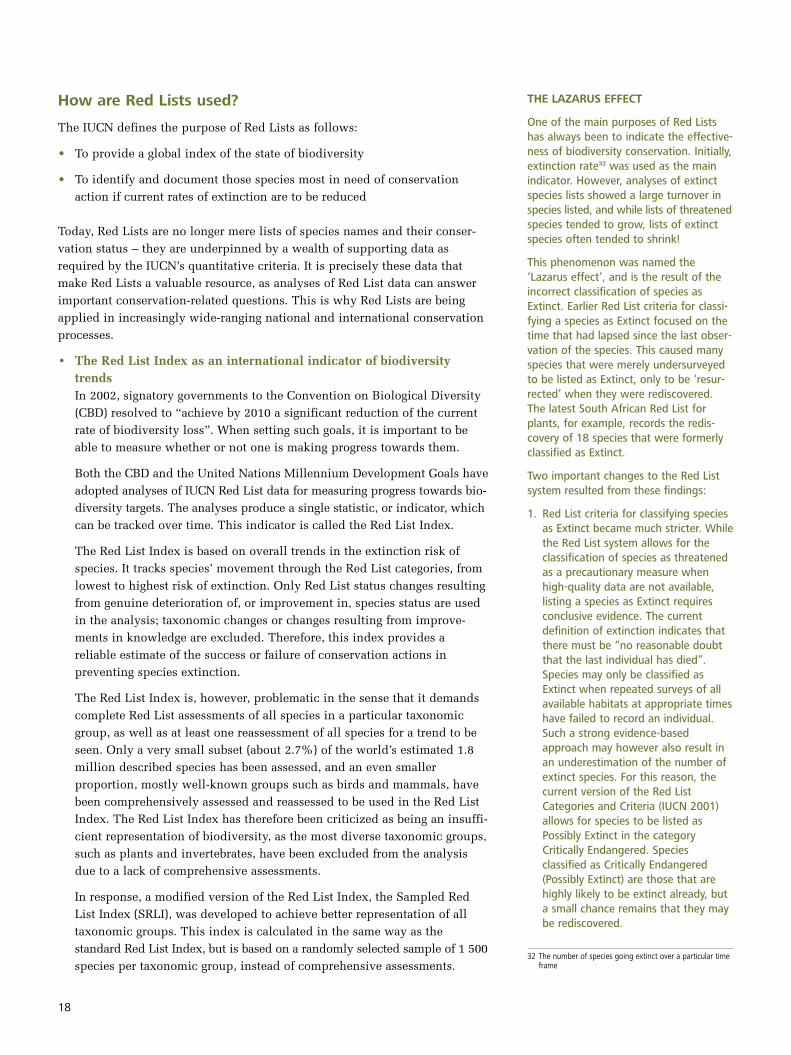
SCIENTIFIC NAME Orachrysops niobeSTATUS Critically EndangeredCRITERIA B1ab(i,ii,iii,iv,v)+2ab(i,ii,iii,iv,v); C2a(ii)
The population of theBrenton Blue Butterfly isconfined to a single smallnature reserve coveringonly about 2 ha of fynbos– this species’ habitat.Population monitoringrecorded a steady declinebetween 2002 and 2006.Careful studies of the
species as well as its host plant35 and host ant36 resulted inmanagement recommendations to improve conditions inorder to sustain the population in the Brenton BlueButterfly Reserve. Since the management recommendationshave been implemented, particularly those to increase thedensity of the Brenton Blue’s host plant, the populationhas recovered slightly since 2007, but remains criticallysmall.
DISTRIBUTION The only known colony of the BrentonBlue is the Brenton Blue Butterfly Reserve in Brenton-on-Sea near Knysna in the Western Cape.
HABITAT The habitat is a mixture of asteraceous37 coastalfynbos and coastal thicket. On-site trees such ascandlewood provide partial shade, which seems to be thebutterfly’s preferred location for laying eggs.
ECOLOGY The adult butterflies hatch in late October andNovember, living for only two to three weeks. The malesestablish and patrol territories, seeking and attracting femalesfor mating. The females ‘advertise’ their presence by givingoff pheromones38, which attract the males. The fertilizedfemale lays her eggs singly on the underside of the leavesof the host plant Indigofera erecta. The larva hatches afterabout ten days, and feeds on the leaflets of the food plantuntil after the larva’s second moult39 when it reaches thethird instar stage.40 It then crawls down the stem of theplant to the ground, and encounters the host ants, Campo-notus baynei, which attend to the larvae, protecting themfrom predators. The larvae produce highly palatable andnutritious secretions from honey glands in their skin, on
which the ants feed. The ants excavate a hole around therootstock of the plant, and the larva crawls down onto therootstock, on which it then starts to feed. The larvae have afinal development stage, during which they grow to 15-20mm in length, before pupating41 in the hole alongside therootstock. The host ants nest in dead wood lying on theground. The ants that attend to the larvae are foraging antsthat return to their own nest to share the nutritious exuda-tions42 of the Brenton Blue larvae with the young ants.From the eggs laid in October and November, adults hatchin the following January/February. If weather conditionsare favourable, there could be a small third brood in April.
THREATS The piece of land where the butterfly breeds atBrenton-on-Sea was set aside for housing development in1983. The Lepidopterists’ Society43 informed the developerof the presence of the butterfly, and began negotiations anda public awareness campaign to prevent its destruction.Eventually, the land was bought by the Green Trust (Nedcor),which forms part of the Brenton Blue Butterfly Reserve. TheBrenton Blue Butterfly Reserve came into being in 1998,but was proclaimed as a special nature reserve in 2003.Small populations, like this one, will always be at greatrisk of random events, such as severe drought or uncon-trolled fire. The reserve needs to be carefully monitoredand managed to sustain the health and availability of thebutterfly’s host plant. In addition, viable colonies of thehost ant species, to which the Brenton Blue’s life cycle isstrongly linked, need to be present. These ant coloniesmay be threatened by invasive (alien) ant species orvegetation changes. Furthermore, small breeding popula-tions of any animal species are at risk of loss of geneticdiversity due to inbreeding effects. If any genetic defor-mities are present, these will persist in future generations,and may lead to the deterioration of the species.Further information www.brentonblue.org.za
Chapter 3:
Local examples of Red List species
BRENTON BLUE
35 A particular plant species preferred by a particular butterfly species for food, shelter or nesting sites
36 Many butterfly species have a mutually beneficial relationship with particular ant species. The butterfly larvae provide nourishing secretions to the ants, while the ants in turn protect the larvae from predators
37 Belonging to the daisy family
38 A chemical substance that influences the physiology or behaviour of others of the same species
39 Periodic casting off of the skin to allow the larva to grow
40 The stage between moults, when an insect is systematically undergoing a metamorphosis
41 Forming a protective cocoon or hardened case, called a pupa, in which the larva undergoes complete transformation to the adult (butterfly) stage
42 A substance that oozes out from larvae pores
43 An international society with branches across the world for those interested in and concerned about the conservation of Lepidoptera, namely moths and butterflies

SCIENTIFIC NAME Amietophrynus pantherinusSTATUS EndangeredCRITERIA B1ab(ii,iii,iv,v)+2ab(ii,iii,iv,v)
The Western Leopard Toad has a small distribution range in theWestern Cape. Only a few subpopulations remain and continueto decline due to ongoing loss and degradation of their habitat.
DISTRIBUTION The Western Leopard Toad occurs on lowlandsfrom the Cape Peninsula along the coast to Cape Agulhas, nevermore than 10 km from the sea.
HABITAT Western Leopard Toads prefer deep water withfloating plants in large wetlands, vleis, dams and sluggishwater in lowland fynbos. Toads can also be found nearwetlands and water bodies in transformed areas, such as urbangardens, farmlands and parks.
ECOLOGY The Western Leopard Toad breeds during winter inpermanent water bodies. During this season, adults migrate tobreeding sites, where breeding takes place over a very shortperiod, a behaviour pattern known as ‘explosive breeding’.Adults are vulnerable during migration, and many are killedcrossing roads adjoining breeding sites. Tadpoles completetheir metamorphosis in three months. Males reach reproductivematurity after one year, and females after two. Toads feed on avariety of prey, including crickets, moths and worms, and aremost active at night.
THREATS Although this species survives in urban and agricul-tural areas, loss and degradation of habitat is a major threat,causing continued population decline. For more than 25 years,no breeding activity has been recorded at breeding sitesbetween Pringle Bay and Kleinmond (Measey & Tolley 2009), anarea of recent, rapid urban expansion and coastal development.It is possible that the Western Leopard Toad might be locallyextinct in this area. Road kills of adult individuals are alsoconcerning. Only a very small proportion of this species’ habitatis currently protected in the Agulhas and Table MountainNational Parks. Most breeding sites are located on privately-owned or municipal properties, requiring the participation ofmultiple stakeholders to ensure its survival. Public awarenessand participation in Western Leopard Toad conservation effortsaround Cape Town has contributed to better knowledge andunderstanding of the toads’ population structure, breeding andmigration patterns, as well as to the alleviation of some threatsto adult toads in urban areas. A BMP is being developed for theWestern Leopard Toad. To become involved in Western LeopardToad conservation, visit www.leopardtoad.co.za
22
WESTERN LEOPARD TOAD
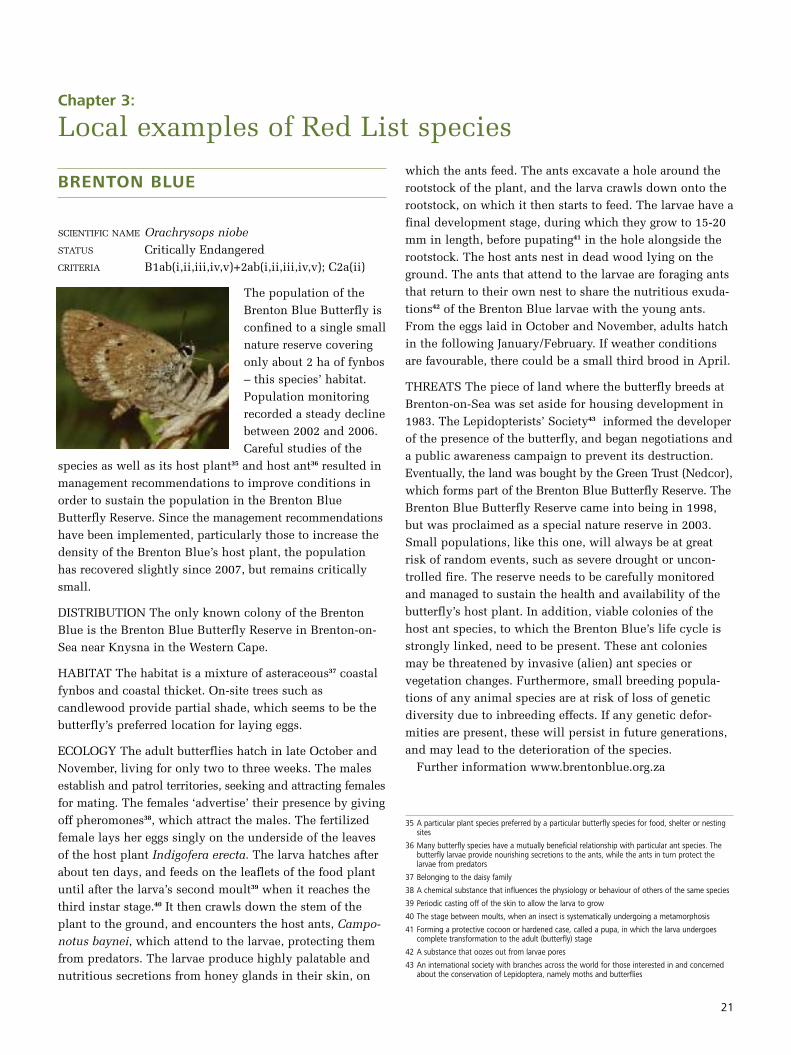
SCIENTIFIC NAME Kniphofia leucocephalaSTATUS Critically Endangered CRITERIA B1ab(iii)+2ab(iii)
Kniphofia, commonly known as Red-hot Pokers, is a genus ofapproximately 70 species that are closely related to aloes.When Dr Leslie Codd revised the genus in 1968, he notedthat two specimens of a white-flowered Kniphofia, collectedfrom unknown sites near Richard’s Bay, did not match anyother known species. However, it was only after a wild popu-lation was discovered in 1990 at the Langepan Wetland,that Kniphofia leucocephala could be formally described.By then, the coastal plains around Richard’s Bay had beenextensively transformed. Despite extensive searches, noother populations could be located. Although recentlyimplemented conservation actions have resulted in therecovery of the only known population, the status ofCritically Endangered is maintained as per the IUCN’s five-year waiting rule for downlisting species after successfulconservation efforts.
DISTRIBUTION The White-hot Poker is known from asingle wild population occurring in a wetland surroundedby forestry plantations north of Richard’s Bay in NorthernKwaZulu-Natal. It may have been more widespread, but bythe time the population was discovered, less than 2% of thenatural grasslands of the coastal plain between Richard’sBay and St Lucia remained. With no historical record inthe form of herbarium specimens, it is however impossibleto say what the initial extent of its range had been.
HABITAT The White-hot Poker occurs in and aroundwetlands in grasslands on low-lying coastal plains.
ECOLOGY White-hot Pokers are adapted to survive firesand droughts by resprouting from underground rhizomes.44
Plants can remain dormant45 underground for a number ofyears while unfavourable conditions persist. Fire appearsto stimulate flowering and germination of seedlings. Thefaint scent and white colour of the flowers indicate thatevening flying insects, such as moths, could be the polli-nators. However, flies and bees have also been seen collectingpollen from this species.
THREATS This species’ habitat has been extensively trans-formed by urban expansion, commercial forestry plantations,commercial sugarcane cultivation, overgrazing as well assubsistence farming. This has probably led to extensivepopulation declines in the past. However, as the speciesremained overlooked until it was discovered in 1990, it isimpossible to determine what the past range and popula-
tion size had been, and how much of it has been lost.
The only known population had been almost completelydestroyed before the species was even described. At thetime of the discovery, the site was being prepared for theplanting of new pine seedlings. After pressure was mountedon the then Department of Water Affairs and Forestry, thepine seedlings were removed, but with considerable distur-bance to the site (Menne 1992). Through the years, the sitewas badly neglected, and forestry roads fragmented thesensitive wetland. The number of flowering individualsdeclined from 70 in 1991, to only 21 in 1998 (Scott-Shaw1999), a decline of 70% in just seven years.
In 2001, SiyaQhubeka, a private forestry company, acquired26 451 ha of the formerly state-owned forestry plantationsbordering on the Greater St. Lucia Wetland Park. Siya-Qhubeka introduced radically new forest managementstrategies, including a commitment to conservation(SiyaQhubeka Forests).
Langepan was declared a National Heritage Site, and con-siderable effort has been put into rehabilitating the wetland.These measures included closing off the roads that had cutthrough the wetland, removing herds of cattle grazing inthe wetland, and moving the plantations bordering thewetland further away to increase the buffer zone betweenthe plantations and the wetland. A conservation manage-ment plan for the site, including a regular burning regime46
and population monitoring, was also implemented.
In just a few years since conservation management of thesite was implemented, the White-hot Poker population hasrecovered remarkably, currently consisting of about 350individuals.
However, the future survival of this population is by nomeans guaranteed. Former pine plantations around thewetland have recently been replaced by gumtrees (Eucalyptusspp.), and although the plantations are now further awayfrom the wetland, the impact on the site may still beincreased, as gumtrees are known to extract far more waterfrom the underground water table than other plantationspecies. This may have a negative impact on the wetlandin the future. The gumtrees are still small, and therefore,the White-hot Poker population appears to be thriving atpresent. However, the impact on the water resource isexpected to intensify as the trees mature. Continuedmonitoring of the population will reveal whether thepopulation will be sustainable in the future.
44 Horizontal, usually underground stems that act as reproductive structures, sending out roots andshoots from their nodes; also called 'rootstalk' or 'rootstock'
45 A condition of biological rest, but capable of being activated again
46 Systematic plan of controlled fires to stimulate plant growth and reproduction
23
WHITE-HOT POKER

24
SCIENTIFIC NAME Haematopus moquiniSTATUS Near ThreatenedCRITERIA C1
African Black Oystercatchers wereclassified as Near Threatened for thefirst time in 1988 due to their smallpopulation size and low breedingsuccess on mainland beaches, wherebirds were disturbed during theirsummer breeding season. Populationsize was estimated at fewer than 5 000birds in 1997 (Martin 1997), and isreported to be between 5 000 and 6 000birds at present (BirdLife International2009). While population declines were noted in some areas,population increases have been observed at a number of off-shore breeding sites as well as mainland areas. These canbe attributed to the introduction of conservation measuresto prevent disturbance of breeding birds, as well asincreasing food sources from an introduced Mediterraneanmussel (Tjørve & Underhill 2006). The status of theAfrican Black Oystercatcher has been maintained as NearThreatened due to uncertainty about the overall populationtrend (BirdLife International 2009), but increasing evidenceof population growth and expansion indicates that it maysoon be possible to reclassify the species as facing noimmediate threat (Hockey 2009).
DISTRIBUTION The African Black Oystercatcher is foundon the eastern and southern coast of Southern Africa, fromLüderitz in Namibia to Mazeppa Bay in the Eastern Cape.This species however appears to be expanding its rangeeastwards, with increasing reports of breeding pairs inKwaZulu-Natal in recent years.
HABITAT The African Black Oystercatcher occurs alongrocky and sandy mainland beaches and on offshoreislands, and less frequently around estuaries, lagoons andcoastal pans.
ECOLOGY African Black Oystercatchers feed on limpets,mussels and other bivalves47, polychaetes48, whelks49 andcrustaceans50 in rocky areas along the coast. Because theirhard-shelled prey is fairly difficult to prise from rocks,young chicks remain dependent on their parents for muchlonger than other waders. African Black Oystercatchersbreed above the high-tide line of sandy beaches, and eggsare laid on the ground in shallow hollows. Pairs breedonly once a year, and normally manage to raise only one or
two chicks. The breeding season coincides with thesummer holiday season, which makes breeding birdsvulnerable to disturbance by large numbers of beach
visitors. African Black Oystercatchersare long-lived, form long-term pairbonds, and are territorial, whichtogether with limited coastal habitatavailability, accounts for the lowdensities of birds and smallpopulation size.
THREATS The major threat to AfricanBlack Oystercatchers is reducedbreeding success due to disturbanceduring the summer breeding season.When birds are disturbed, they mayleave the nest, leaving the eggs vul-nerable to trampling, predation by
Kelp Gulls and dogs, and overexposure to the sun, whichcauses embryos to die. Driving of off-road vehicles on beachescaused the destruction of nests, eggs and chicks, as chickstend to hide in vehicle tracks. As a result of disturbance onmainland beaches, breeding success was too low to sustainthe population, and it was suspected that the mainlandpopulation was sustained by birds migrating from offshoreislands. Birds on offshore islands are threatened mainly byintroduced mammalian predators and predation of chicksand eggs by Kelp Gulls, which have increased in numbersin the Western Cape due to increased food sources aroundharbours and rubbish dumps.
Conservation measures such as the banning of off-roadvehicles from beaches, and raising public awareness havereduced disturbance of breeding birds. An alien species ofmussel introduced from the Mediterranean has spreadthrough most of the African Black Oystercatcher’s range,and has become the bird’s main food source in many areas.The introduced mussel is more accessible to the birds thannative mussels, and has led to increases in African BlackOystercatcher populations. The cessation of guano51
scraping has reduced the disturbance of birds on near-shoreislands. Recent research however indicates that AfricanBlack Oystercatchers may be vulnerable to temperatureincreases brought about by climate change, which mayreduce breeding success during hot summers (Hockey 2009).
47 Marine or freshwater molluscs with two hinged shells
48 A type of segmented worm, generally found in the marine environment; sometimes referred to as ‘bristle worm’
49 Large marine snails
50 Any mainly aquatic arthropod, usually having several pairs of jointed legs and a hard protective outer shell
51 Accumulation of a substance composed mainly of the dung of sea birds or bats along certain coastal areas or in caves, to be used as fertilizer
AFRICAN BLACK OYSTERCATCHER

25
SCIENTIFIC NAME Psammobates geometricusSTATUS Critically EndangeredCRITERIA A2acde
The Geometric Tortoise is South Africa’s most threatenedtortoise, with fewer than 5 000 individuals remaining. Itsname is derived from the yellow geometric patterns on itsshell. The Geometric Tortoise was feared to be extinct bythe 1950s; however, in the 1960s, a few small populationswere found in fragments of renosterveld52 – the species’preferred habitat. Although much effort has been put intothe conservation of the Geometric Tortoise, the populationcontinues to decline due to ongoing habitat loss andisolation of small numbers of individuals on habitatfragments.
DISTRIBUTION The Geometric Tortoise is endemic to theWestern Cape, where it has a restricted range fromGordon’s Bay northwards along the coastal lowlands toPiketberg, and eastwards in the Upper Breede River andCeres valleys.
HABITAT Geometric Tortoises occur in lowland areasbetween the Cape Fold Mountains and the coast, wherethey are restricted to renosterveld. Renosterveld occursmainly on nutrient-rich clay soils, making it more suitableto agriculture than other types of fynbos, which occur onsandy soils. For this reason, renosterveld, which formerlyhad been a widespread vegetation type on the CapeLowlands, is today one of South Africa’s most threatenedhabitats. More than 90% of renosterveld has beenirreversibly transformed, mainly into crop fields, and allthat remains today are small fragments.
ECOLOGY Geometric Tortoises are attractive, medium-sized tortoises with a beautiful yellow starred pattern on adark brown to black background on their shells. Femalesare larger than males, and after mating in early spring, thefemales lay three to five eggs in a hole in the ground inlate spring and early summer, safeguarding the eggs againstaccidental runaway wildfires in their habitat. Usually,these eggs hatch during the next autumn, when the firstwinter rains have softened the soil, and act as cue forhatching. It is also at this time of year when the fire hazardin renosterveld has dropped significantly. GeometricTortoises have a varied vegetarian diet, which comprisesherbaceous plants, succulents and grass. GeometricTortoises are long-lived, reach reproductive maturity at 7to 8 years of age, and may live for over 30 years.
THREATS Habitat destruction has been the greatest causeof population decline and fragmentation, and the rangeand availability of tortoise habitat continue to reduce. As aresult of habitat loss and fragmentation, ecological processesin small fragments, such as fires, have been disrupted. Firesare a natural part of fynbos ecology; however, maintainingoptimal fire cycles in small fragments is very difficult, andrequires intensive management. Too frequent fires have ledto local extinctions of tortoise populations in isolatedfragments, such as Harmony Flats near Gordon’s Bay.Other threats include collecting wild tortoises for the pettrade, and alien invasive species. Attempts at captivebreeding of Geometric Tortoises have had limited success,and conservation efforts rather rely on the protection ofwild populations and their habitat.
A recently completed survey in the Boland confirmed thatGeometric Tortoises are still to be found on only a handfulof properties, mostly privately owned. Good news is thatmost of the sites are either already signed up or in theprocess of being signed up as conservation stewardshipsites. Private landowners hold the future of the GeometricTortoise in their hands, and need all the available supportfrom CapeNature to keep these remaining sites environ-mentally healthy. Geometric Tortoises enjoy complete legalprotection, and nobody may collect or disturb, have intheir possession, or export from the Western Cape anyspecimens without special permission.
52 A grey, shrubby, fynbos-type vegetation dominated by renosterbos (Elytropappus rhinocerotis)
GEOMETRIC TORTOISE

26
Although it is estimated that there are about 170 000 speciesof spiders in the world, thus far only 29 species’ Red Liststatus has been determined. About 2 000 spider speciesoccur in South Africa, but no species have been assessedas yet. The South African National Survey of Arachnida(SANSA) aims to bridge this gap by collecting data,documenting and describing the arachnid53 fauna of SouthAfrica, and ultimately completing Red List assessments forSouth Africa’s spiders. Baboon spiders (from the familyTheraphosidae) are South Africa’s most threatened spiders,as they are targeted for the pet trade. The following twospecies are likely to be classified as threatened:
• Paulseni Horned Baboon Spider (Ceratogyrus paulseni). This spider is only known from a small areanear Letaba in the Kruger National Park. Spiders live insubterranean burrows of up to 60 cm deep. Burrows arefound in clay soils in clearings in Acacia-Mopanewoodland. This species is likely to be threatened due to its restricted range and its popularity in the international pet trade.
• African Purse-web Spider (Calommata simoni). A Purse-web Spider was first collected in South Africain 1916, and described as a new species, Calommatatransvaalensis. However, no more spiders were seenagain, and the species was later synonymized withCalommata simoni, which also occurs in Central Africa.However, SANSA surveys have again found Purse-webSpiders in South Africa for the first time since 1916,with specimens collected in Gauteng, Limpopo and theFree State. These spiders differ from the Central AfricanPurse-web Spiders, and the results of SANSA’s workindicate that there are at least three species of Purse-web Spiders in South Africa. Purse-web Spiders livepermanently in closed, silk-lined burrows. The top partof the burrow is crater-like and completely sealed offwith silk. The spider lies on her back, and bites throughthe silk structure when prey lands on it. These rarespiders have restricted ranges, and are likely to bethreatened by collectors.
53 Pertaining to spiders and spider-like creatures, being members of the class Arachnida
SPIDERS

27
Definitions of specific terms used in Red List criteria
Area of occupancyArea of occupancy is the area in km2 within a species’ extentof occurrence which is physically occupied by the species.This measure considers the fact that a species will not usuallyoccur throughout the area of its extent of occurrence, whichmay contain unsuitable or unoccupied habitats (see Figure 2).In some cases, for example, irreplaceable colonial nestingsites or crucial feeding sites for migratory species, the areaof occupancy is the smallest area essential at any stage tothe survival of existing population of a species.
Continuing declineA continuing decline is a recent, current or projected futurepopulation decline that is liable to continue unlessremedial actions are taken.
Extent of occurrenceExtent of occurrence is the area in km2 that is encompassedby a minimum convex polygon (see Figure 2) containing allthe current sites of occurrence of a species, but excludingvagrancy.
Extreme fluctuationsExtreme fluctuations are large, rapid and frequent variationsin population and range size, typically more than one orderof magnitude (namely, a tenfold increase or decrease).
Generation lengthGeneration length is the average age of mature individualsin the population. It is intended to reflect the turnover rateof breeding individuals in the population, and is thereforeneither the age of reproductive maturity, nor the age of theoldest breeding individuals, except for species that breedonly once.
LocationA location is a geographically or otherwise distinct areawhere a single threatening event can rapidly affect allindividuals of a species present. The size of the location istherefore based on the size of the impact of a threateningevent. Location is therefore not the same as subpopulationsor ‘localities’, as it may incorporate a number of sub-populations or just part of a subpopulation, depending onthe size of impact. If more than one threat is affecting aspecies, the most severe threat should be used to definelocations. For some threatening processes it may not bepossible to determine locations, and in such instancesother appropriate criteria should be tested.
Mature individualsMature individuals are those individuals that are known,estimated or inferred to be capable of reproduction.
PopulationWithin the Red List criteria, the term population is used ina very specific sense that is different from its normal bio-logical use. The Red List’s definition of population is thetotal number of individuals of a species.
Population and subpopulation sizeThe population size, as is used in Criteria C and D, alwaysis a count of only the number of mature individuals in thepopulation or in a subpopulation.
Population reductionThis term, used in Criterion A, refers to a decline in thenumber of mature individuals in the population as a per-centage of the original population size. Therefore, if apopulation of 10 000 mature individuals declined to 2 000mature individuals, there has been a population reductionof 80%.
Quantitative analysisA quantitative analysis is any form of analysis whichestimates the probability of extinction of a species basedon known life history, habitat requirements, threats andany specified management options.
Severely fragmentedThe term severely fragmented refers to a situation where aspecies’ risk of extinction is increased due to the fact thatmore than half of its individuals occur in small, isolatedsubpopulations. These small subpopulations may easilybecome locally extinct due to stochastic processes, with alimited possibility of recolonization of sites of local extinc-tions. Poor dispersers are more easily severely fragmentedthan species capable of long-distance dispersal.
SubpopulationsSubpopulations are geographically or otherwise distinctgroups of individuals within the population betweenwhich there is little demographic or genetic exchange.
28
References
Allen, G.M. 1942. Extinct and vanishing mammals of the western hemisphere, with the marine species of all the oceans. American Committee for International Wild Life Protection: Cambridge, Mass.
BirdLife International. 2009. Species factsheet: Haematopus moquini [Online]. Available: www.birdlife.org. [4 December 2009].
Hockey, P. 2009. Resurgent African black oystercatcher. Africa Birds & Birding, 14(6):46-53.
International Union for the Conservation of Nature (IUCN). 2001. IUCN Red List Categories and Criteria Version 3.1. IUCN Species Survival Commission, Gland, Switzerland and Cambridge, UK.
International Union for the Conservation of Nature (IUCN). 2009. IUCN Red List of Threatened Species. Version 2009.2 [Online]. Available: www.iucnredlist.org. [3 November 2009].
Martin, A.P. 1997. African Black Oystercatcher Haematopus moquini, in J.A. Harrison, D.G. Allan, L.G. Underhill, M. Herremans, A.J. Tree, V. Parker and C.J. Brown (eds.). The atlas of southern African birds.Volume I: Non-passerines. BirdLife South Africa: Johannesburg. 374-375.
Measey, G.J. and Tolley, K.A. 2009. Investigating the cause of the disjunct distribution of Amietophrynus pantherinus, the Endangered South African Western Leopard Toad. Conservation Genetics OnlineFirst: DOI 10.1007/s10592-10009-19989-10597.
Menne, W. 1992. Future of new Kniphofia in jeopardy. PlantLife, 7:7-8.
Ryan, P.G., Dorse, C. and Hilton, G.M. 2006. The conservation status of the spectacled petrel Procellaria conspicillata. Biological Conservation, 131(4):575-583.
Scott-Shaw, C.R. 1999. Rare and threatened plants of KwaZulu-Natal and neighbouring regions. KwaZulu-Natal Nature Conservation Service: Pietermaritzburg.
SiyaQhubeka Forests. Changing old Paradigms in Plantations under FSC Principles and Criteria - Success Story by FSC [Online]. Available: http://www.siyaqhubeka.co.za/news/general/fsc.pdf. [2 March 2010].
Tjørve, K.M.C. and Underhill, L.G. 2006. Population increase of African Black Oystercatchers Haematopus moquini on Robben Island, South Africa. Ostrich 77(3):229-232.
Further reading
Butchart, S.H.M., Akçakaya, H.R., Chanson, J., Baillie, J.E.M., Collen, B., Quader, S., Turner, W.R., Amin, R., Stuart, S.N. and Hilton-Taylor, C. 2007. Improvements to the Red List Index. PLoS One, 2(1)
Butchart, S.H.M., Stattersfield, A.J., Baillie, J., Bennun, L.A., Stuart, S.N., Akçakaya, H.R., Hilton-Taylor, C. and Mace, G.M. 2005. Using Red List Indices to measure progress towards the 2010 target andbeyond. Philosophical Transactions of the Royal Society B: Biological Sciences, 360(1454):255-268
Keith, D. 2009. Red listing: deciding which species are at risk. Significance, 6(3):100-104
Keith, D.A. and Burgman, M.A. 2004. The Lazarus effect: can the dynamics of extinct species lists tell us anything about the status of biodiversity? Biological Conservation, 117(1):41-48.
Mace, G.M., Collar, N.J., Gaston, K.J., Hilton-Taylor, C., Akçakaya, H.R., Leader-Williams, N., Milner-Gulland, E.J. and Stuart, S.N. 2008. Quantification of extinction risk: IUCN’s system for classifyingthreatened species. Conservation Biology, 22(6):1424-1442.
Possingham, H.P., Andelman, S.J., Burgman, M.A., Medellin, R.A., Master, L.L. and Keith, D.A. 2002. Limits to the use of threatened species lists. Trends in Ecology & Evolution, 17(11):503-507.
Rodrigues, A.S.L., Pilgrim, J.D., Lamoreux, J.F., Hoffmann, M. and Brooks, T.M. 2006. The value of the IUCN Red List for conservation. Trends in Ecology & Evolution, 21(2):71-76.
Credits
TEXT by Lize von Staden with contributions by Ernst Baard, Ansie Dippenaar, Dave Edge, Doug Harebottle, GrahamHenning, Silvia Mecenero, Peter Ryan, Mark Williams
PROJECT MANAGER AND EDITOR Shona Young
DESIGN Runette Louw and Jenny Young
PHOTOGRAPHERS: Mark Anderson • Marius Burger • Stein Byrkjeland • Alan Channing • Brigitte Church • André Coetzer • Cliff Dorse •Elzette du Preez • Damien du Toit • Ismail Ebrahim • Isabel Johnson • Rupert Koopman • Runette Louw • DomitillaRaimondo • Peter Ryan • Rob Simmons • Kerry Sink • Geoff Spiby • Krystal Tolley • Johan van Zyl • Vivienne Williams
ILLUSTRATION: Peter Schouten, Patrick Costello, Nino Barbieri, Lloyd Edwards
Citation
SANBI (2010). Threatened Species: A guide to Red Lists and their use in conservation. Threatened Species Programme,Pretoria, South Africa. 28 pp.
Where to search for information on threatened species:
• To get information on species listed on the Global IUCN Red List
visit: www.iucnredlist.org
• To access information about a South African species' IUCN Red List
status, CITES Appendix listing or NEMBA TOPS status visit:
http://sibis.sanbi.org
• To find out more about the IUCN Red List Categories and Criteria
visit: www.iucnredlist.org/technical-documents/
categories-and-criteria/2001-categories-criteria
• For information on using IUCN Red List Categories and Criteria at
regional levels visit: www.iucnredlist.org/documents/
reg_guidelines_en.pdf