progress and problems with forecasting orographic precipitation over the pacific northwest and...
Post on 20-Dec-2015
212 views
TRANSCRIPT
Progress and Problems with Forecasting Orographic Precipitation
over the Pacific Northwest and Southwest Canada
Clifford F. Mass, University of Washington, Seattle, WA
AMS Mountain Meteorology Conference, August 2008
Orographic Precipitation is an essential part of the regional meteorology

Few Areas of North America Experience Such Large Amounts and Gradients of Precipitation

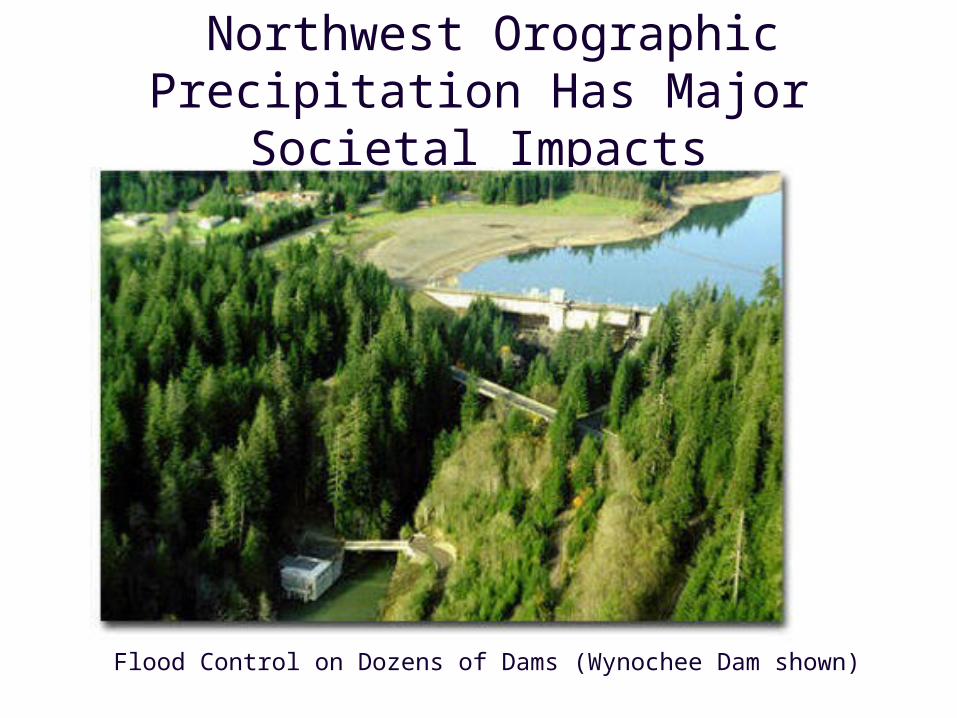
Northwest Orographic Precipitation Has Major Societal Impacts
Flood Control on Dozens of Dams (Wynochee Dam shown)
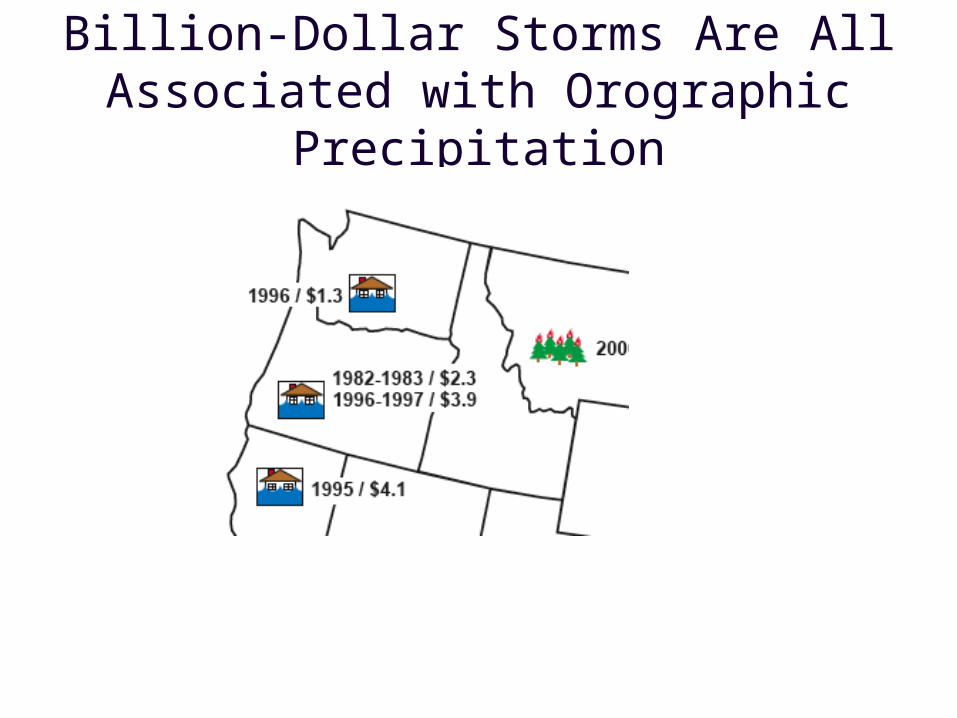
Billion-Dollar Storms Are All Associated with Orographic Precipitation

Mount Rainier National Park18 inches in 36 hr (Nov 8, 2006)
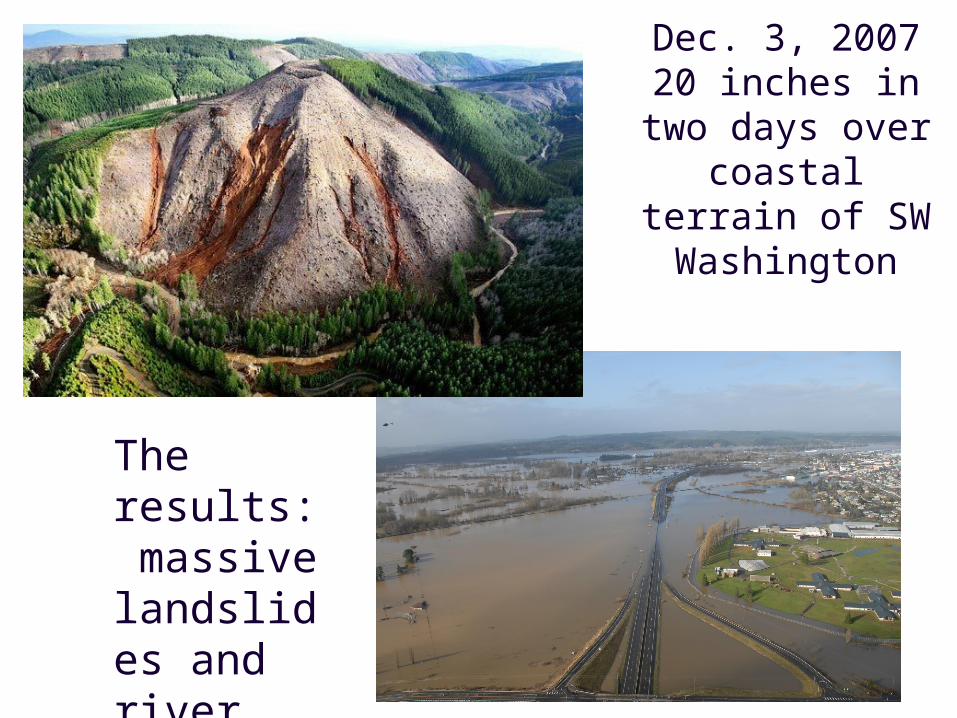
Dec. 3, 200720 inches in two
days over coastal terrain of SW Washington
The results: massive landslides and river flooding
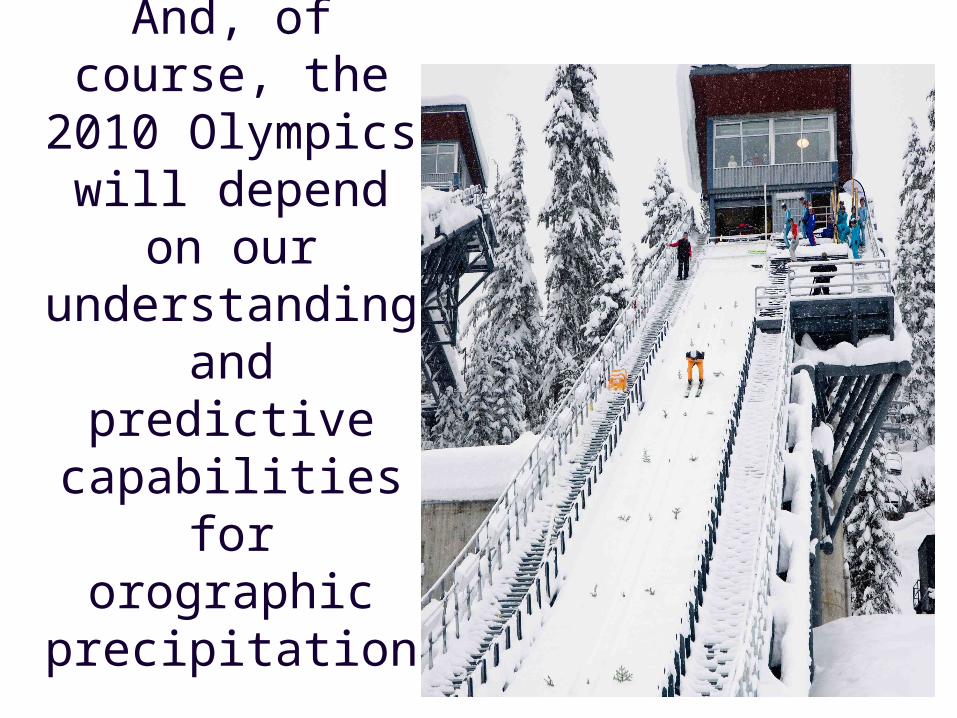
And, of course, the 2010
Olympics will depend on our understanding and predictive capabilities for
orographic precipitation

Northwest U.S. and S.W. Canada an excellent testbed for studying
orographic precipitation
• Relatively simple terrain of various configurations
– Olympics—an orographic island
– Vancouver Island and portions of Cascades (linear
• Undisturbed flow approaching the barriers
• Accessible with a large number of surface observing stations
• Major high resolution real-time simulation efforts at the UW and University of British Columbia.
• Lack of deep convection.

There have been major progress in understanding and predicting
orographic precipitation over this region during the past several decades
• A number of regional field experiments have led to substantial advances in understanding.
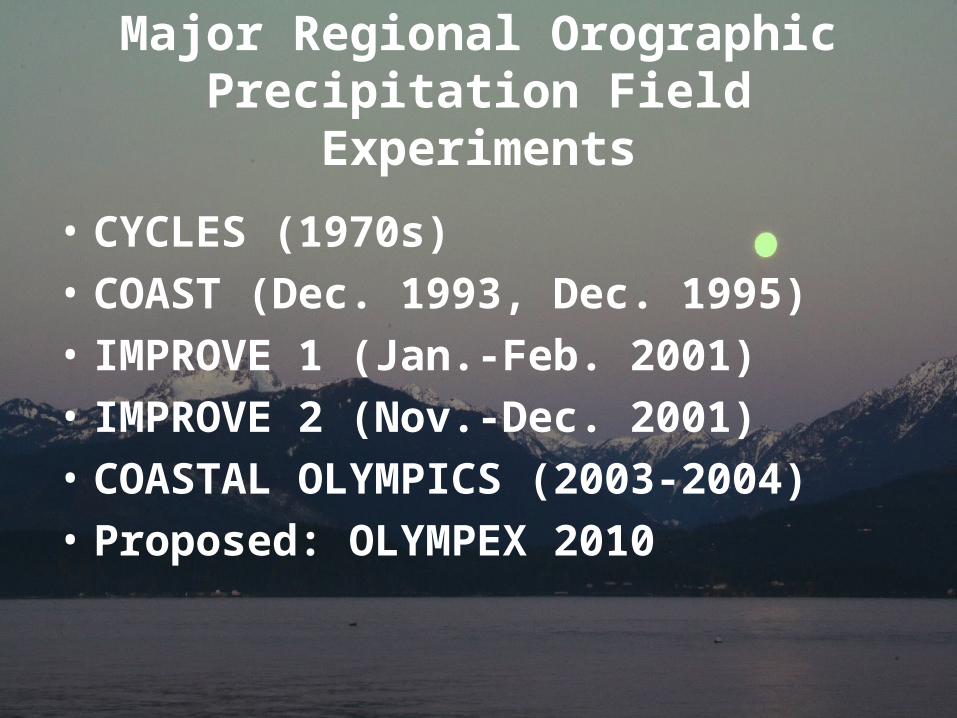
Major Regional Orographic Precipitation Field Experiments
• CYCLES (1970s)
• COAST (Dec. 1993, Dec. 1995)
• IMPROVE 1 (Jan.-Feb. 2001)
• IMPROVE 2 (Nov.-Dec. 2001)
• COASTAL OLYMPICS (2003-2004)
• Proposed: OLYMPEX 2010
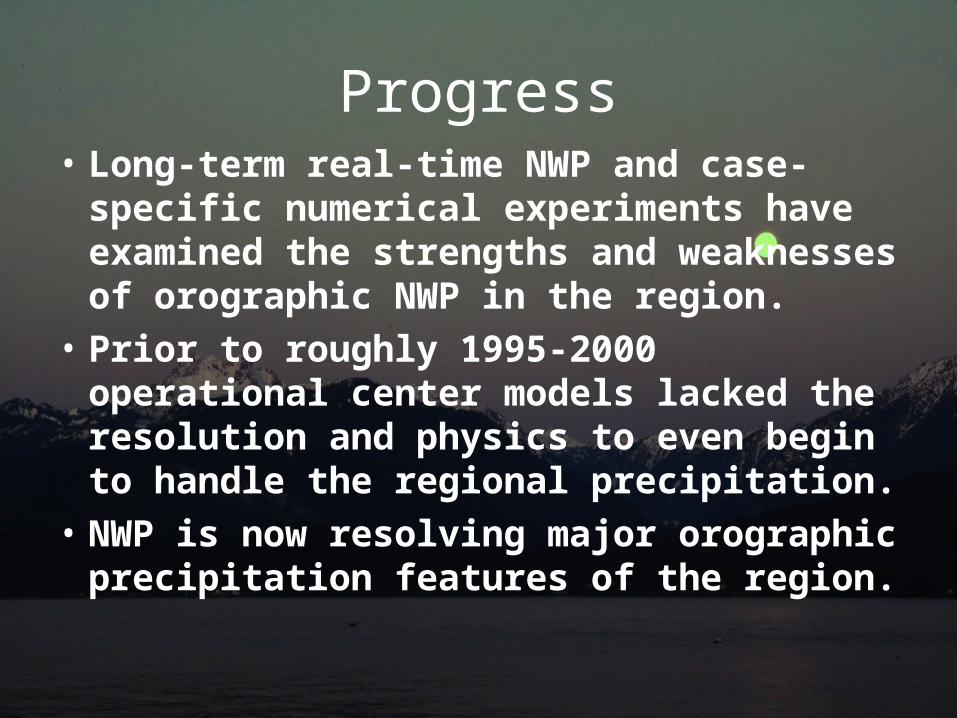
Progress• Long-term real-time NWP and case-specific
numerical experiments have examined the strengths and weaknesses of orographic NWP in the region.
• Prior to roughly 1995-2000 operational center models lacked the resolution and physics to even begin to handle the regional precipitation.
• NWP is now resolving major orographic precipitation features of the region.

NGM, 80 km,1995
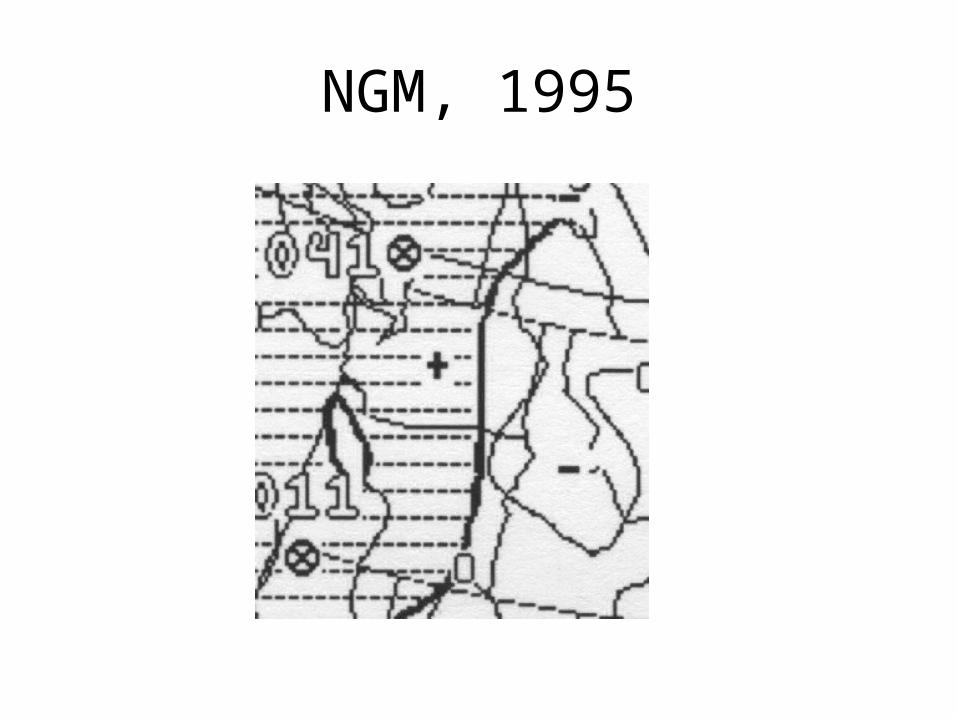
NGM, 1995

2001: Eta Model, 22 km

2007-2008
12-kmUW MM5Real-time
12-km WRF-ARWand WRF-NMMare similar
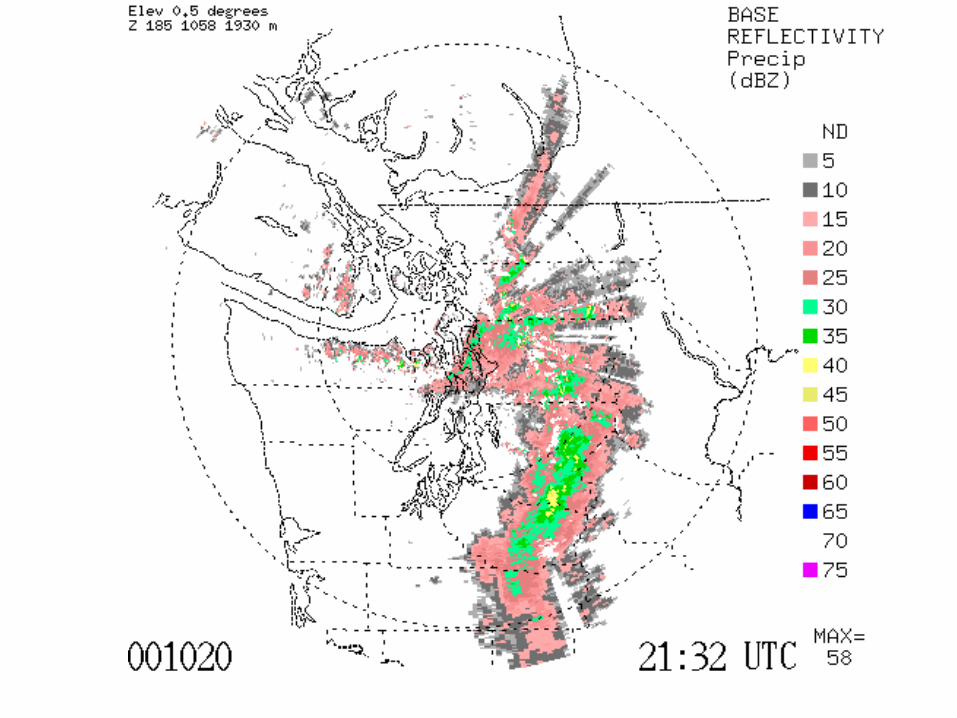
December 3, 20070000 UTC Initial12-h forecast3-hr precip.
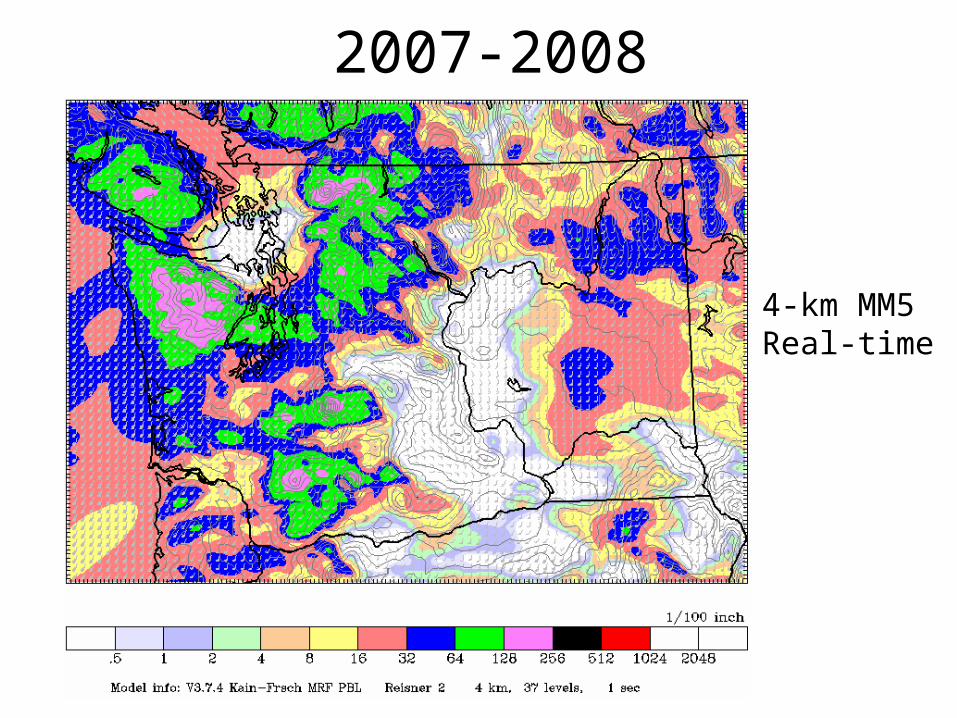
2007-2008
4-km MM5Real-time
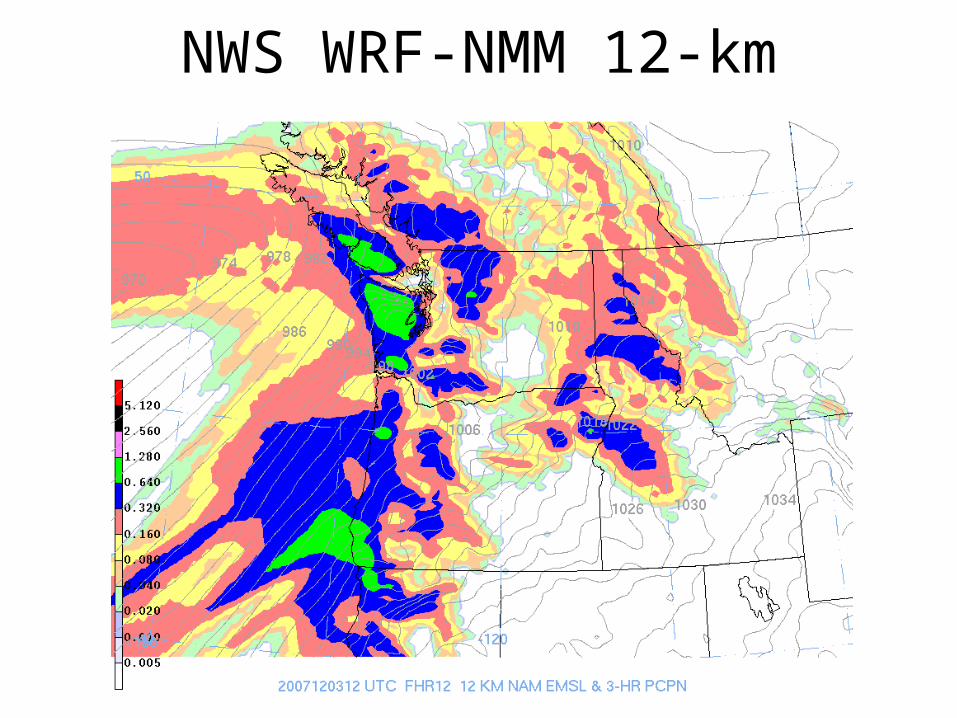
NWS WRF-NMM 12-km
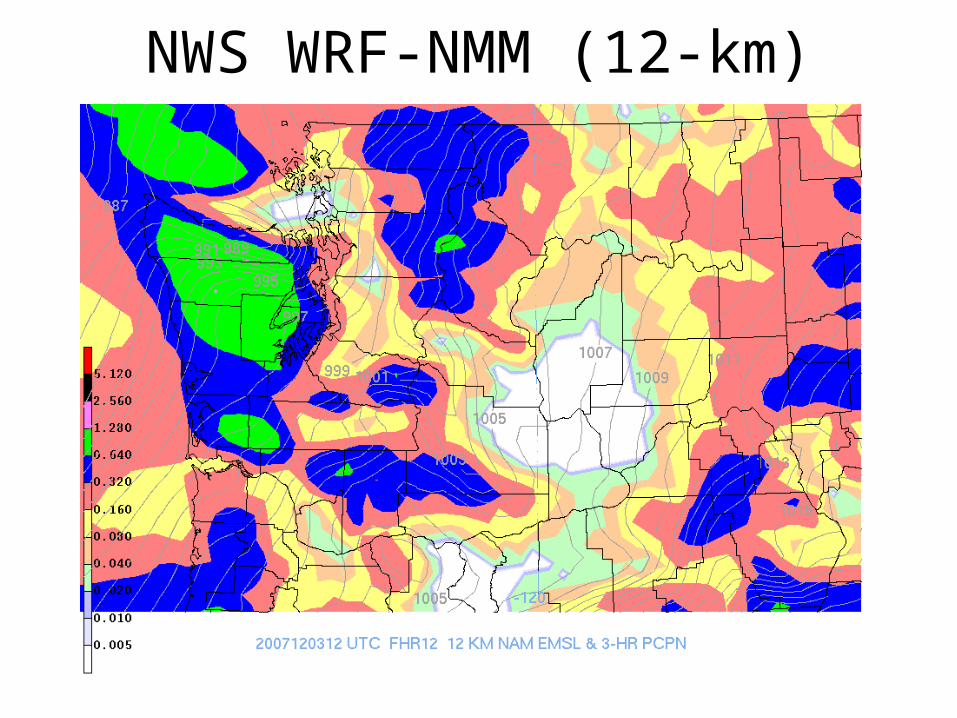
NWS WRF-NMM (12-km)

UW Real-Time Prediction System
• Running the MM5 and WRF-ARW at 36-12-4 km since 1996
• Thompson Microphysics
• NOAH LSM
• Run twice a day to 72h
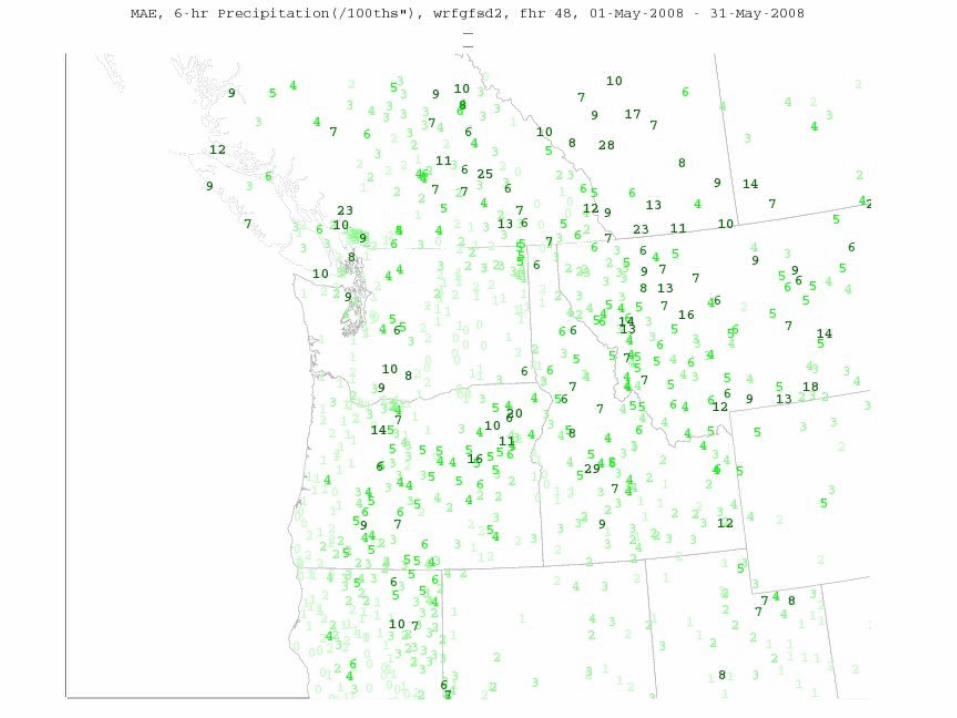
• Verified with thousands of stations from over 70 networks. Long record of model biases and issues over terrain.

Domains
A Few Major Lessons
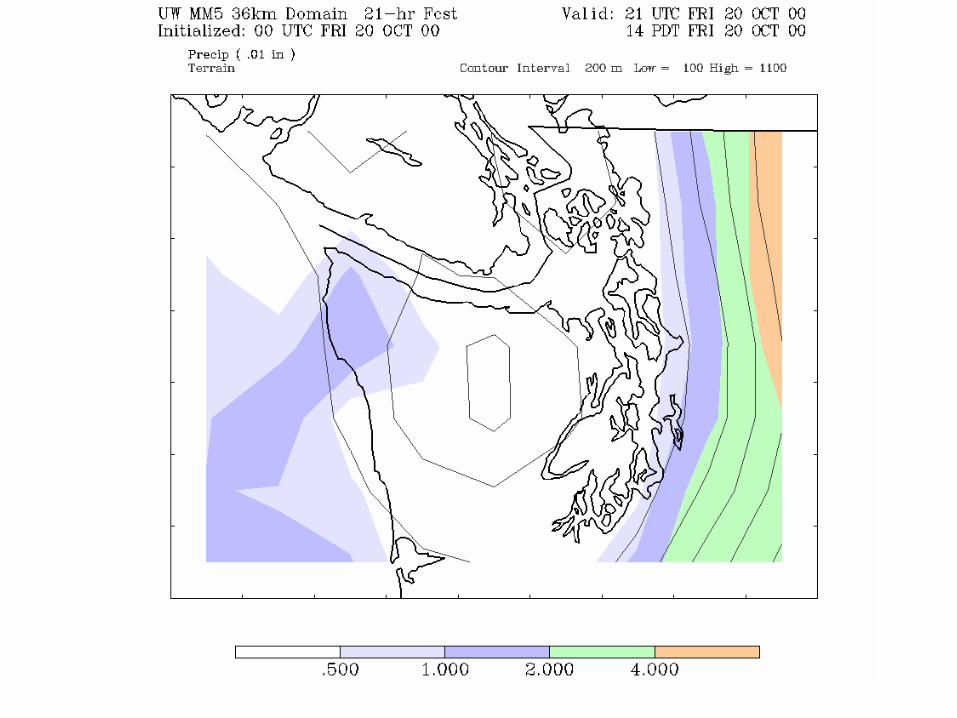
• There are several key horizontal scales that influence orographic precipitation. The first is the scale of the major mesoscale barriers (e.g., west slopes of Cascades, mountains of Vancouver Island).
• In order to resolve the influence of the these features, one needs grid spacing of 12-15 km.
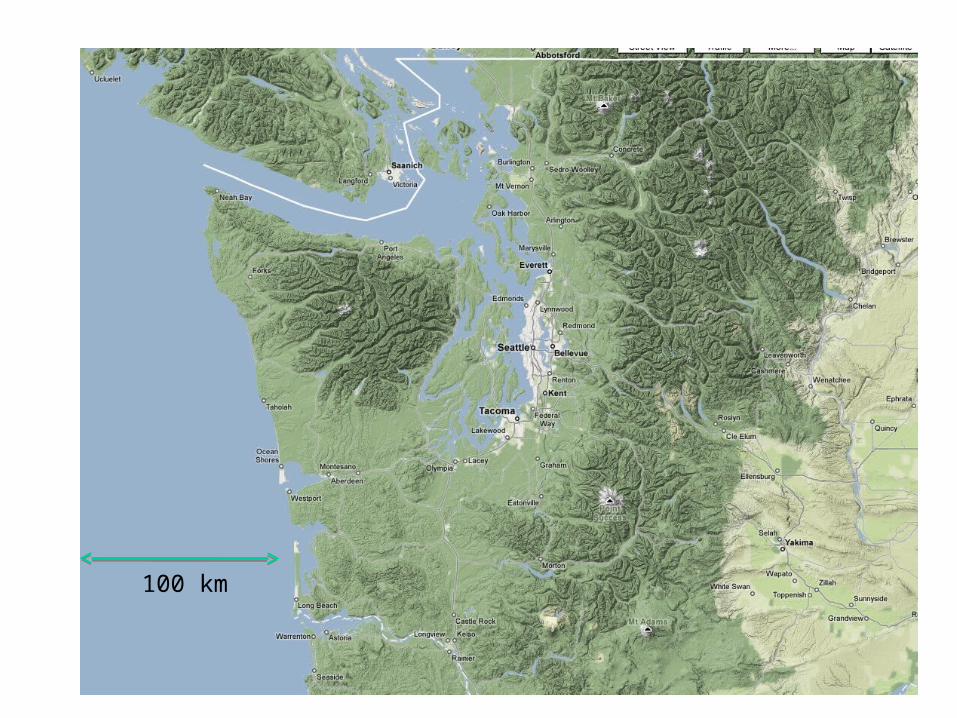
100 km

36-km
12-km
Major Lessons
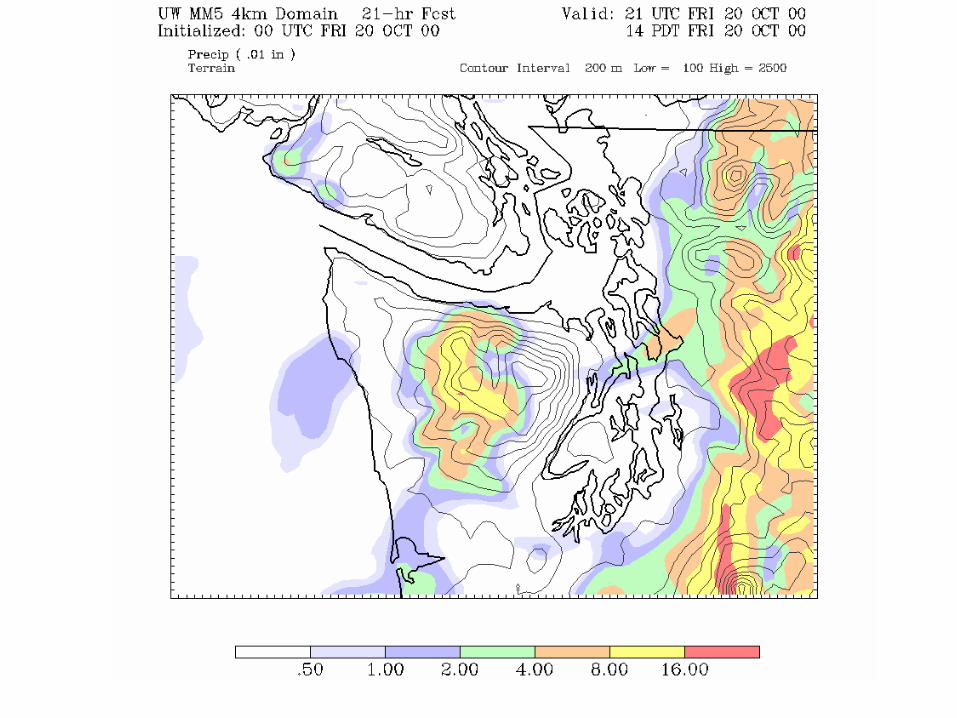
• Then there are smaller scale features, produced by the corrugations in the terrain associated with the river valleys, and smaller-scale features forced by terrain such as the Puget Sound convergence zone.
• Such features require 4-km or better grid spacing to get a reasonable handle on the precipitation distributions.

10-km
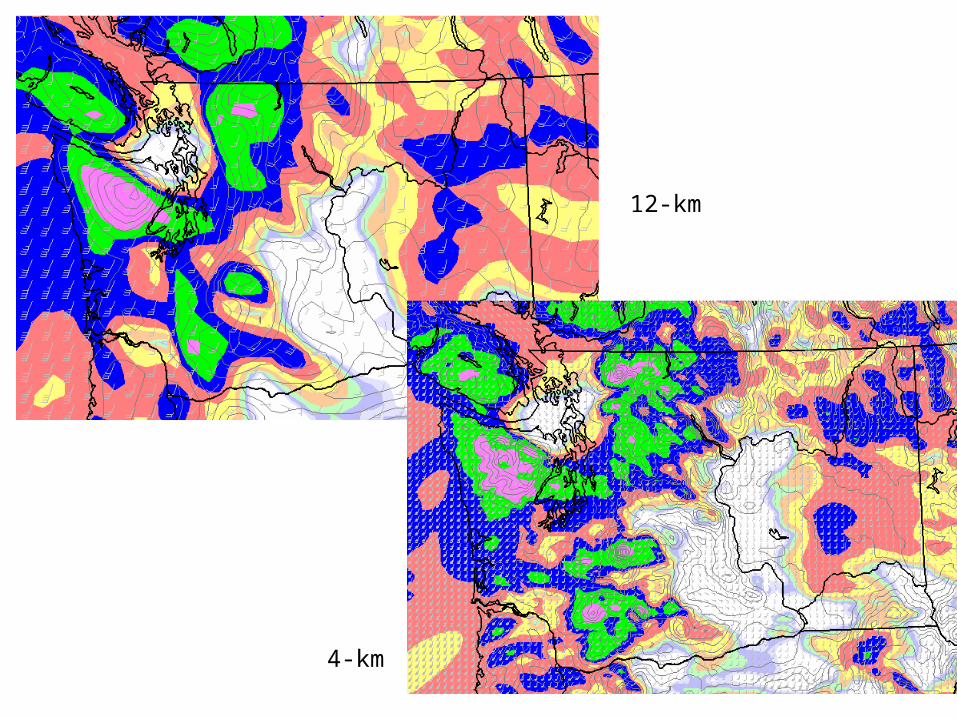
12-km
4-km
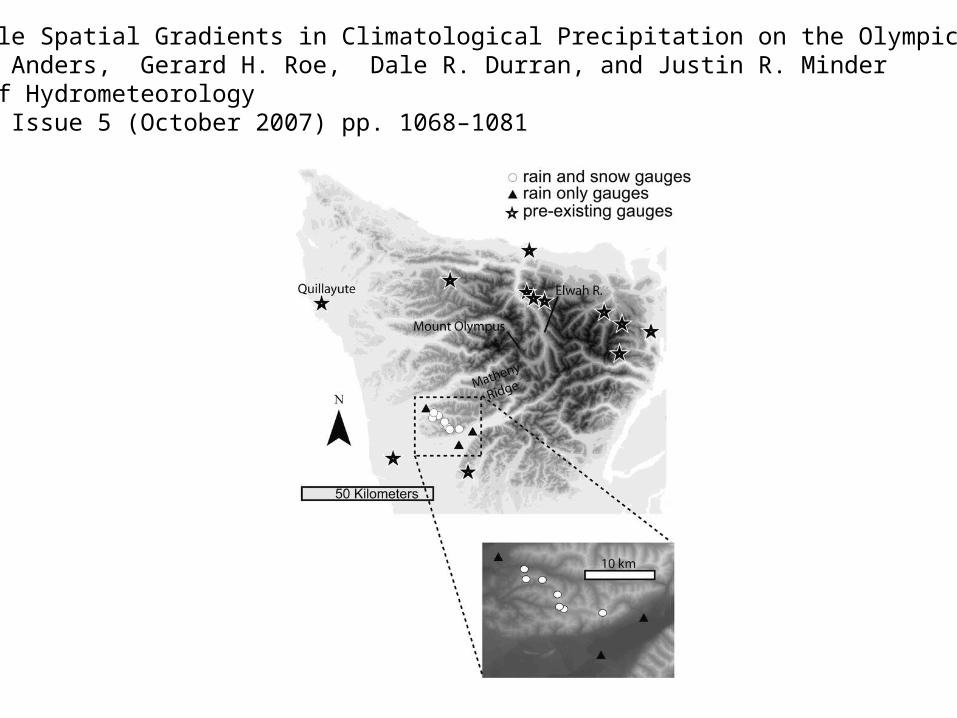
Small-Scale Spatial Gradients in Climatological Precipitation on the Olympic PeninsulaAlison M. Anders, Gerard H. Roe, Dale R. Durran, and Justin R. MinderJournal of Hydrometeorology Volume 8, Issue 5 (October 2007) pp. 1068–1081

Annual Climatologies of MM5 4-km domain
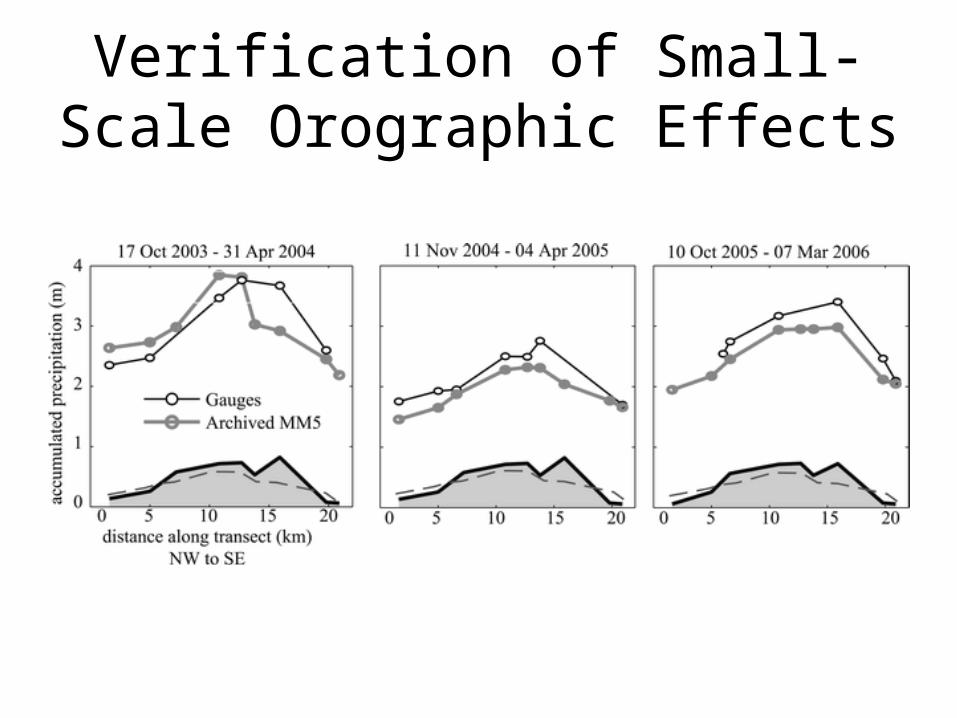
Verification of Small-Scale Orographic Effects

But not so perfect for individual events (issues of resolution, model physics, and
initialization, among others)
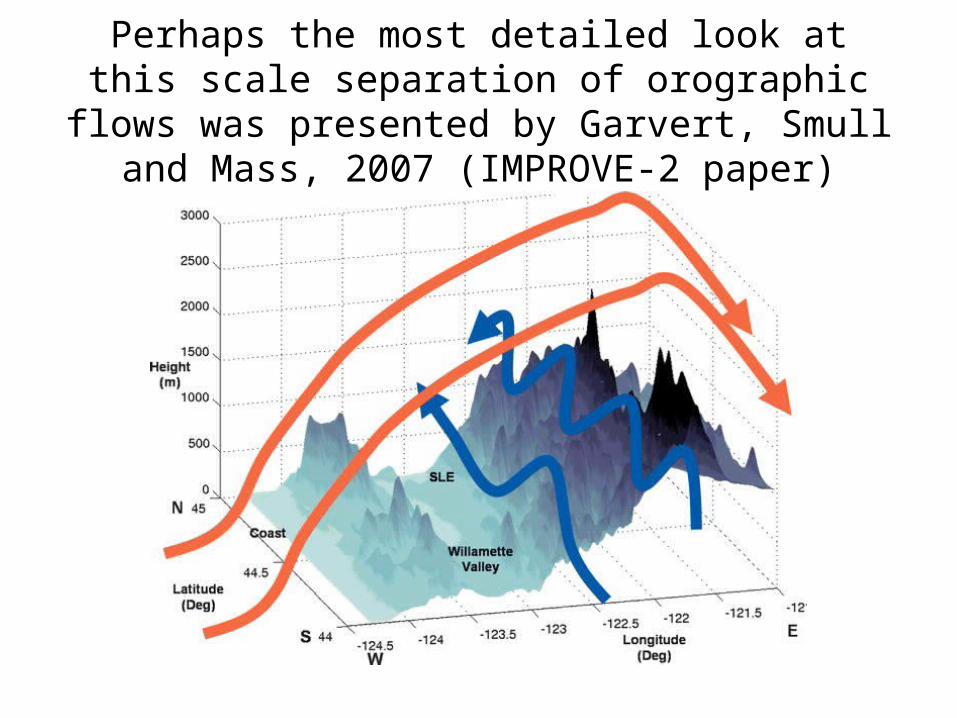
Perhaps the most detailed look at this scale separation of orographic flows was presented by
Garvert, Smull and Mass, 2007 (IMPROVE-2 paper)

Garvert et al.• Used aircraft radar and in situ data from the
IMPROVE-2 field experiment, as well as high resolution (1.3 km grid spacing) MM5 output.
• Documented and simulated small scale mountain waves and their microphysical/precipitation implications.


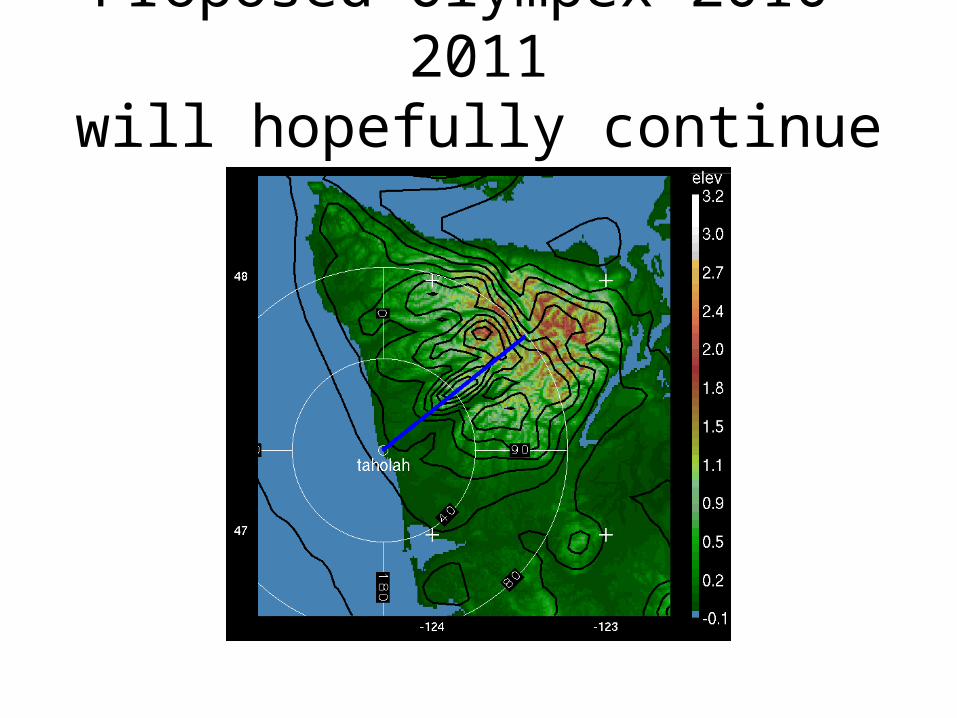
Proposed Olympex 2010-2011will hopefully continue this work

During the 1990’s it became clear that there were problems with the simulated precipitation and microphysical distributions
over Northwest terrain
• Apparent in the daily UW real-time MM5 forecasts at 12 and 4-km
• Also obvious in research simulations of major storm events.

Early Work-1995-2000 (mainly MM5, but results are more general)
• Relatively simple microphysics: water, ice/snow, no supercooled water, no graupel. (explicit moisture scheme of Hsie et al. 1984, with ice-phase microphysics below 0°C Dudhia 1989) was applied in for 36, 12, and 4-km domains.
• Tendency for overprediction on the windward slopes, even after considering undercatchment. Only for heaviest observed amounts was there no overprediction.
• Tendency for underprediction to the lee of the barrier and in major gaps.
Colle and Mass, 1999;Colle, Mass and Westrick ,2000

MM5 PrecipBias for
24-h
90% and 160% lines
are contoured
with dashed and solid
lines
For entireWinterseason

Problems Were Obvious in the Lee of the Olympics
• Lack of clouds and precipitation in model on the lee side in light to moderate events.
• Too much precipitation moving over mountains under strong winds.
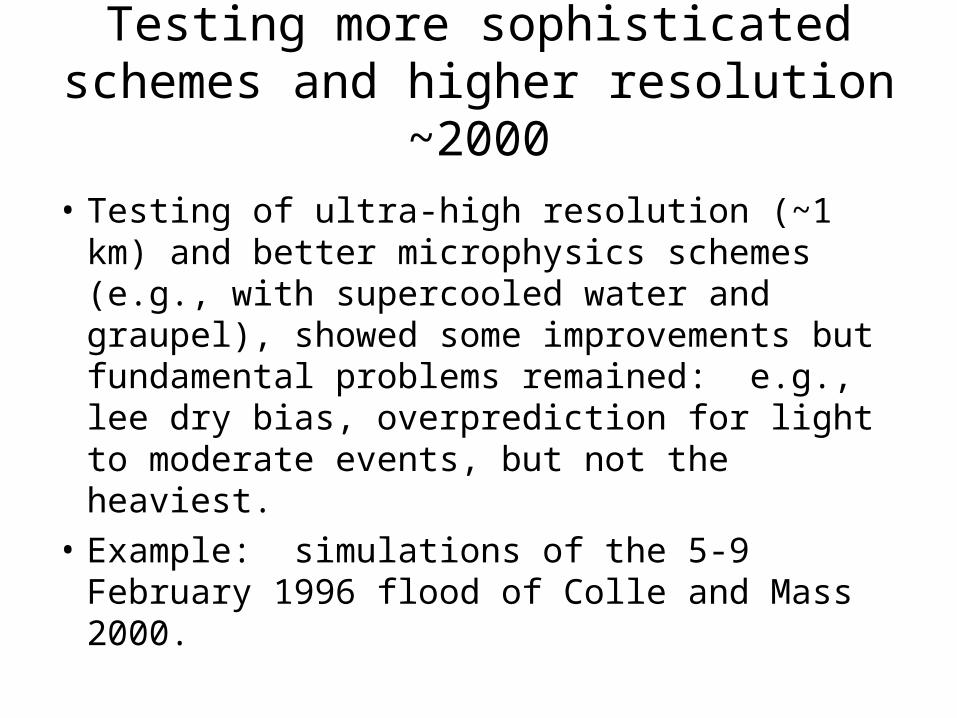
Testing more sophisticated schemes and higher resolution ~2000
• Testing of ultra-high resolution (~1 km) and better microphysics schemes (e.g., with supercooled water and graupel), showed some improvements but fundamental problems remained: e.g., lee dry bias, overprediction for light to moderate events, but not the heaviest.
• Example: simulations of the 5-9 February 1996 flood of Colle and Mass 2000.

5-9 February 1996

Colle and Mass, 2000Little Windward Bias, Too Dry in Lee
Bias: 100%-no bias
Windward slope
Lee
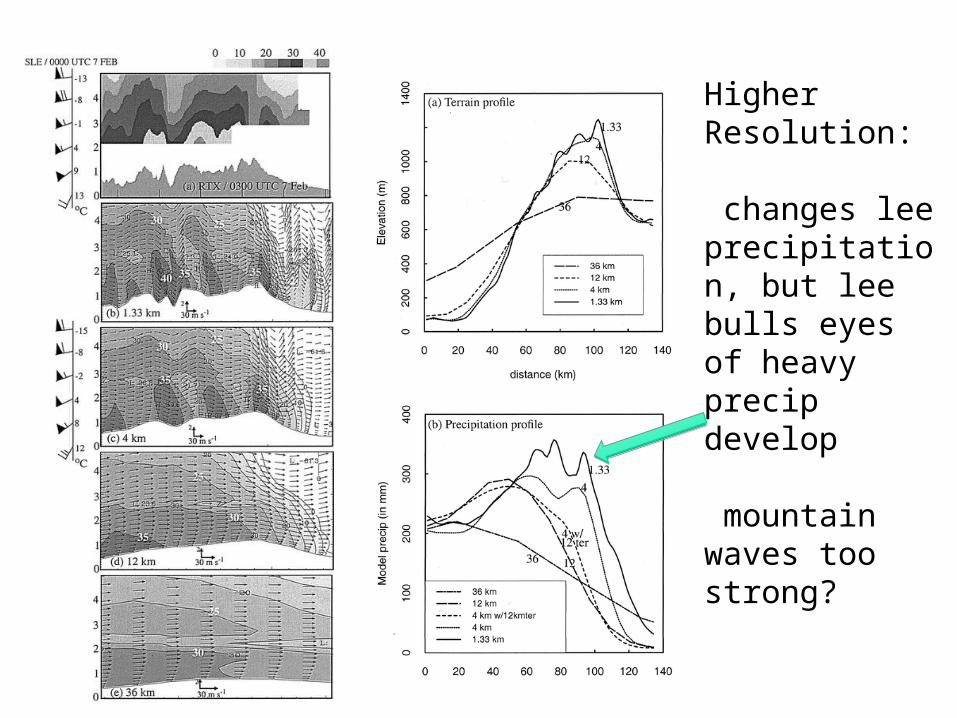
Higher Resolution:
changes lee precipitation, but lee bulls eyes of heavy precip develop
mountain waves too strong?
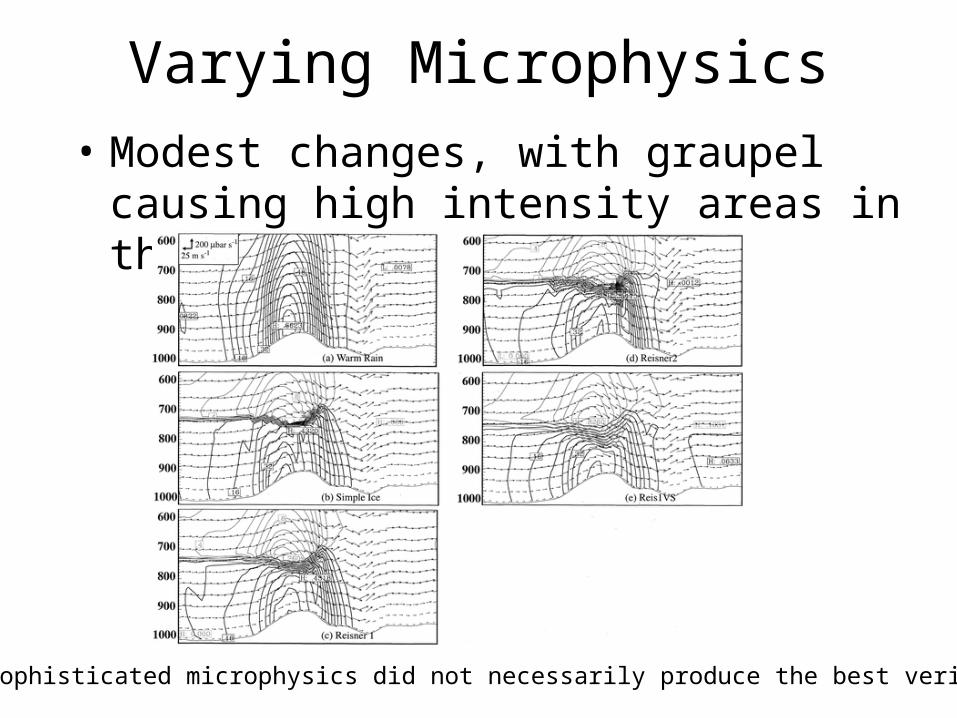
Varying Microphysics
• Modest changes, with graupel causing high intensity areas in the immediate lee.
Most sophisticated microphysics did not necessarily produce the best verification

Flying Blind

IMPROVE• Clearly, progress in improving the simulation of
orographic precipitation demanded better observations:– High quality insitu observations aloft of cloud and
precipitation species.
– Comprehensive radar coverage above the barrier
– High quality basic state information (e.g., wind, humidity, temperature)
• The IMPROVE field experiment (2001) was designed and to a significant degree achieved this.

Olympic Mts.
British Columbia
Washington
Ca
scad
e M
ts.
Cas
cade
Mts
.
Oregon
California
OrographicStudy Area
Washington
Oregon
Co
asta
l Mts
.
Co
asta
l Mts
.
S-Pol Radar Range
Santiam Pass
OSA ridge crest
Cas
cade
Mts
.
< 100 m
100-500 m
500-1000 m
1000-1500 m
1500-2000 m
2000-3000 m
> 3000 m
Terrain Heights
Portland
Salem
Newport
Medford
UW Convair-580
Airborne Doppler Radar
S-Pol Radar
BINET Antenna
NEXRAD Radar
Wind Profiler
Rawinsonde
Legend
Ground Observer
0 100 km
WSRP Dropsondes
Columbia R.
Rain Gauge Sites in OSA Vicinity
Santiam Pass
SNOTEL sites CO-OP rain gauge sites
50 km
Orographic Study Area
S-Pol Radar Range
Olympic Mts.
S-Pol Radar Range
Westport
90 nm(168 km)
Offshore FrontalStudy Area
Paine Field
Univ. of Washington
Area of Multi-Doppler
Coverage
Special Raingauges
PNNL RemoteSensing Site
TwoIMPROVE
observationalcampaigns:
I. Offshore Frontal Study (Wash. Coast, Jan-Feb 2001)
II. Orographic Study (Oregon Cascades, Nov-Dec 2001)

The NOAA P3 Research AircraftDual Doppler Tail Radar Surveillance RadarCloud Physics and Standard Met. Sensors
Convair 580Cloud Physics and Standard Met. Sensors

PARSLSite
Terr
ain
ht.
(m
)
Distance (km)0 50 100
0
1000
2000
3000
4000
5000
6000
7000
8000
9000
S-POL Radar
SantiamJunction
SantiamPass
CampSherman
-50-100
20-40 inches/year40-60 inches/year60-80 inches/year80-100 inches/year> 100 inches/year
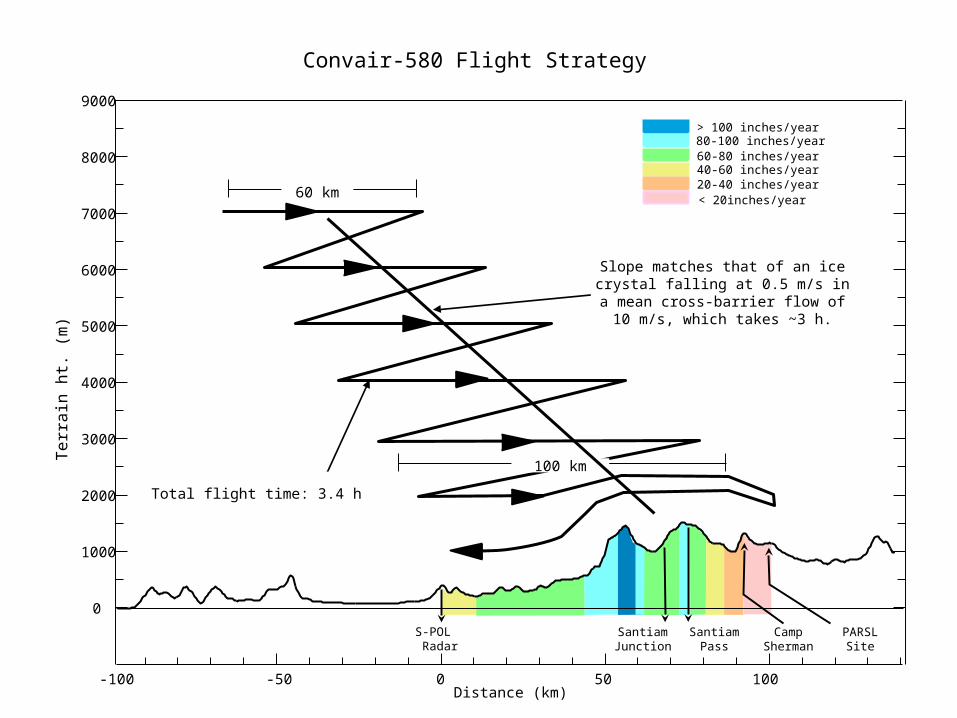
< 20inches/year60 km
100 km
Slope matches that of an ice crystal falling at 0.5 m/s in a mean cross-barrier
flow of 10 m/s, which takes ~3 h.
Total flight time: 3.4 h
Convair-580 Flight Strategy
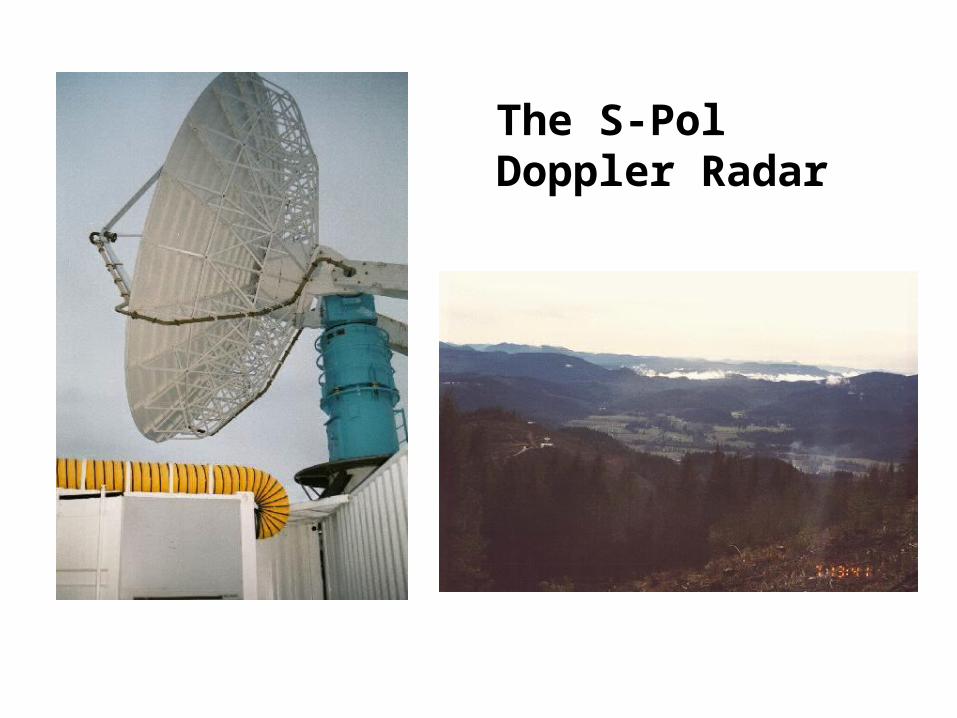
The S-Pol Doppler Radar

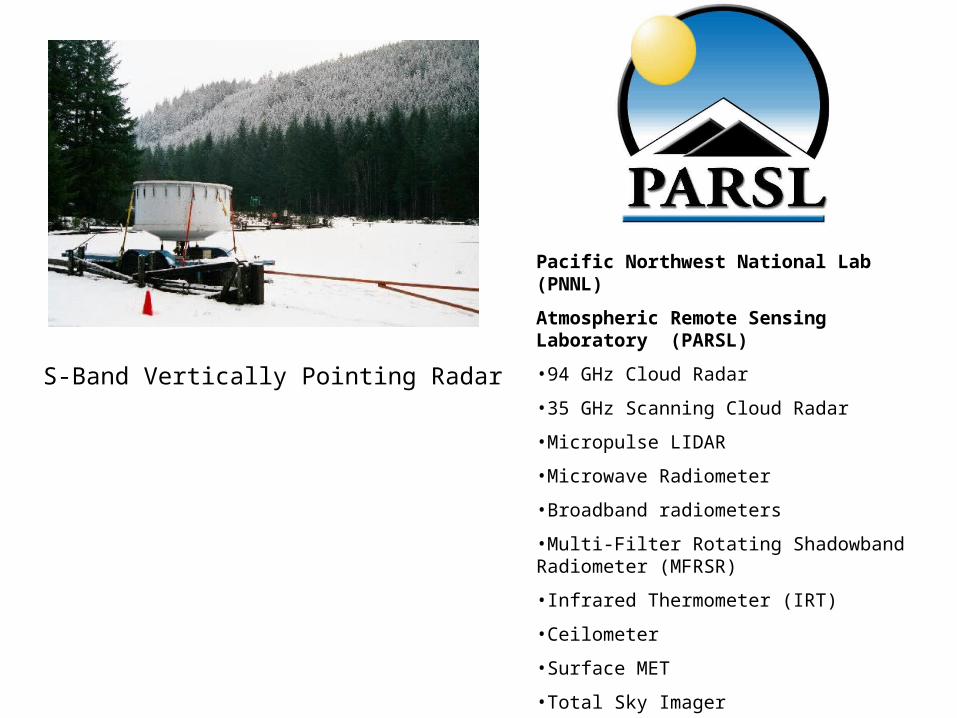
S-Band Vertically Pointing Radar
Pacific Northwest National Lab (PNNL)
Atmospheric Remote Sensing Laboratory (PARSL)
•94 GHz Cloud Radar
•35 GHz Scanning Cloud Radar
•Micropulse LIDAR
•Microwave Radiometer
•Broadband radiometers
•Multi-Filter Rotating Shadowband Radiometer (MFRSR)
•Infrared Thermometer (IRT)
•Ceilometer
•Surface MET
•Total Sky Imager

An IMPROVE-2 Sample: Dec. 13-14, 2001
• Strong, extremely well sampled event on the Oregon Cascades
• Varied biases on the windward slopes, and now overprediction over the lee.
• Overprediction at valley stations on windward side
• Little bias on windward crest stations
Garvert et al., 2005a
1.3 km
4 -km

But now, we had the microphysical data aloft to
determine what was happening
Model
Observations

The Diagnosis•Too much snow being produced aloft•Too much snow blowing over the mountains, providing overprediction in the lee•Too much cloud liquid water on the lower windward slopes•Too little cloud liquid water near crest level.•Problems with the snow size distribution (too few small particles)•Several others!

In Comparison: The Weaker Dec. 4-5, 2001 Event
Yanluan and Colle 2008
Based on WRF Model
•Overprediction over windward slopes
•Too much precip in the immediate lee of the crest
•Underprediction to the east of the Cascades
•Excessive generation of snow aloft
Lots of activity in improving microphysical parameterizations
• New Thompson Scheme for WRF that includes a number of significant improvements.
• Higher moment schemes are being tested. (e.g., new Morrison two-moment scheme)
• Microphysical schemes are being modified to consider the different density and fall speed characteristics of varying ice habits and degrees of riming (work of Woods, Hafen, and Stoelinga, UW)

Another Major Question
• What is the importance of unresolved small scale orographic features and sub-grid scale motions on mesoscale orographic precipitation?
• Do these features enhance precipitation? Do they need to be parameterized for coarser simulations? Or do we need ultra high resolution to get the orographic precipitation right?

The Influence of Small Scale Ridges (Colle 2008)
Small net windward enhancement by small scale features

The Influence of Shear-Induced Turbulence on Microphysics
Houze and Medina, JAS, 2005

The problems with the simulation of orographic precipitation are not limited to
microphysics and resolution
• The MM5 and WRF V1-2.1 lacked positive definite advection schemes for moisture variables.
• The result of such numerics is a lack of conservation of moisture, producing essentially an unphysical source of water. Thus, lack of PD advection explains part of the overprediction problem in MM5/WRF
• COAMPS and CSU RAMS have PD schemes.

Recent Work of Robert Hahn, UW, for Dec. 13-14, 2001 IMPROVE 2 event
PD-NOPD
Domain 36km 12km 4km 1.33km
Coast Water -4.0% -2.5% -6.5% -6.6%
Coast Mountains -4.1% -4.4% -7.9% -9.8%
Willamette Valley -3.5% -3.9% -13.0% -15.6%
Cascade Windward -4.1% -5.0% -13.5% -17.2%
Cascade Leeward -4.3% -8.0% -10.2% -11.4%
DOMAIN TOTAL -3.9% -4.4% -10.9% -13.4%
Positive DefiniteAdvection Initiated
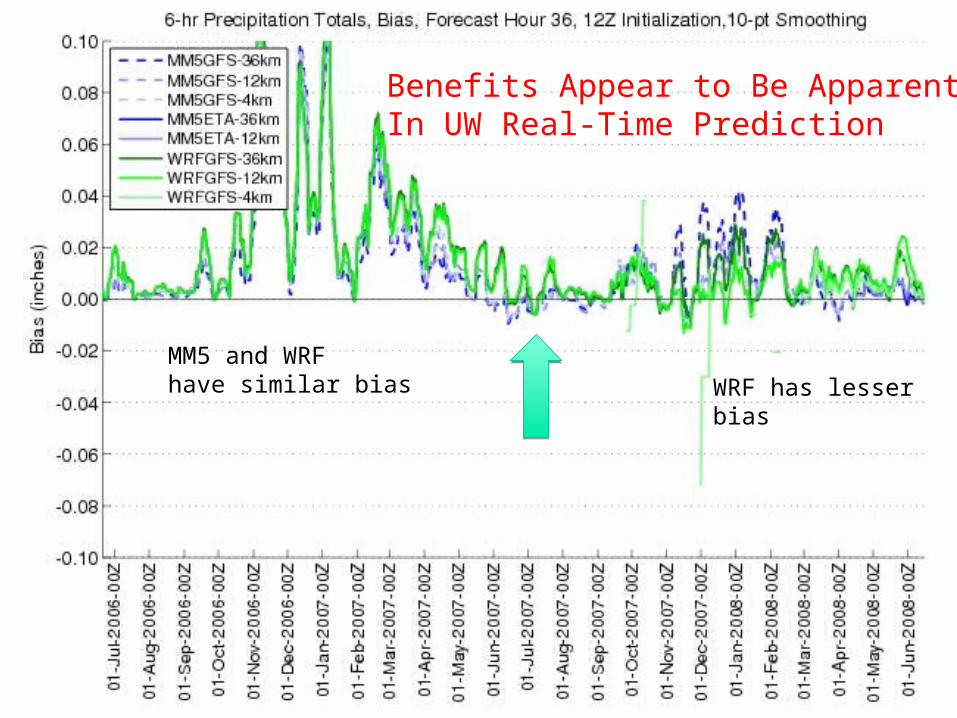
MM5 and WRFhave similar bias WRF has lesser
bias
Benefits Appear to Be ApparentIn UW Real-Time Prediction

Problems and deficiencies of boundary layer and diffusion schemes can
significantly affect precipitation and microphysics
• Boundary layer parameterizations are generally considered one of the major weaknesses of mesoscale models (as noted at recent WRF users group meeting in Boulder).
• Deficiencies in the PBL structures were noted during IMPROVE.
• Errors in boundary layer structure can substantially alter mountain waves and resultant precipitation.
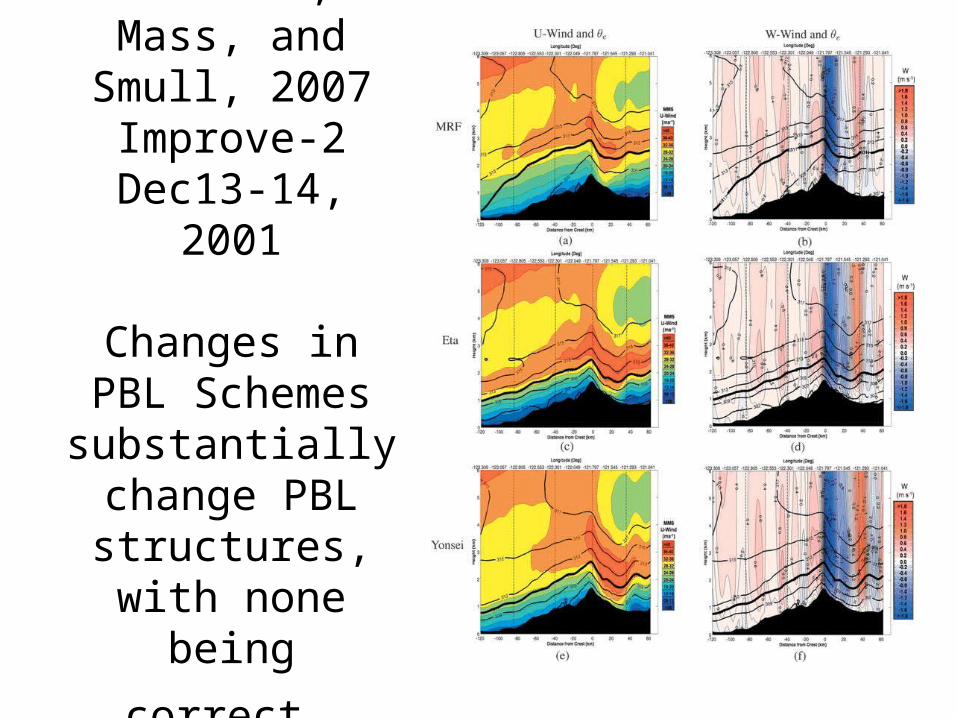
Garvert, Mass, and Smull, 2007
Improve-2Dec13-14, 2001
Changes in PBL Schemes
substantially change PBL
structures, with none being
correct.

Impacts of Boundary Layer Parameterization on Microphysics
Snow-diff CLW-diff Graupel-diff
Microphysics Differences ETA - MRF

The Next Major Challenge: Probabilistic Orographic Precipitation Prediction
• The atmosphere is not deterministic and there are substantial uncertainties in initial conditions and physics parameterizations, and continued approximations in the numerics.
• Over the next several years, we need to perfect approaches for probabilistic prediction of orographic precip that produce sharp and reliable probability density functions.
Special Challenges and Advantages of Probabilistic
Prediction Over Terrain• Less observations that over flatland, making
calibration more difficult. (disadvantage)
• More frequent precipitation (an advantage).
• Less of a phase space, since orography does constrain possible atmospheric states. Orographic flow often controlled by interaction of synoptic scale flow with mesoscale terrain. (advantage).
Probabilistic NWP over NW terrain is already well along
Current Operational Systems– University of Washington UWME system (36-12
km)
– University of Washington EnKF System (36-12km)
– NWS Multi-Model SREF System (32 km)
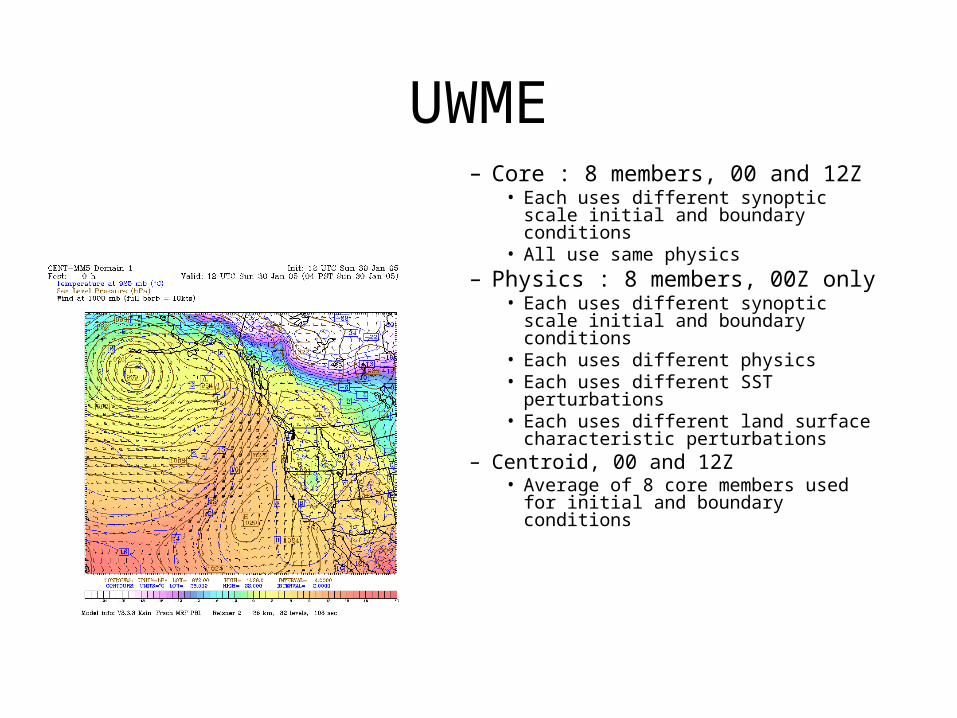
UWME– Core : 8 members, 00 and 12Z
• Each uses different synoptic scale initial and boundary conditions
• All use same physics– Physics : 8 members, 00Z only
• Each uses different synoptic scale initial and boundary conditions
• Each uses different physics• Each uses different SST
perturbations• Each uses different land surface
characteristic perturbations– Centroid, 00 and 12Z
• Average of 8 core members used for initial and boundary conditions
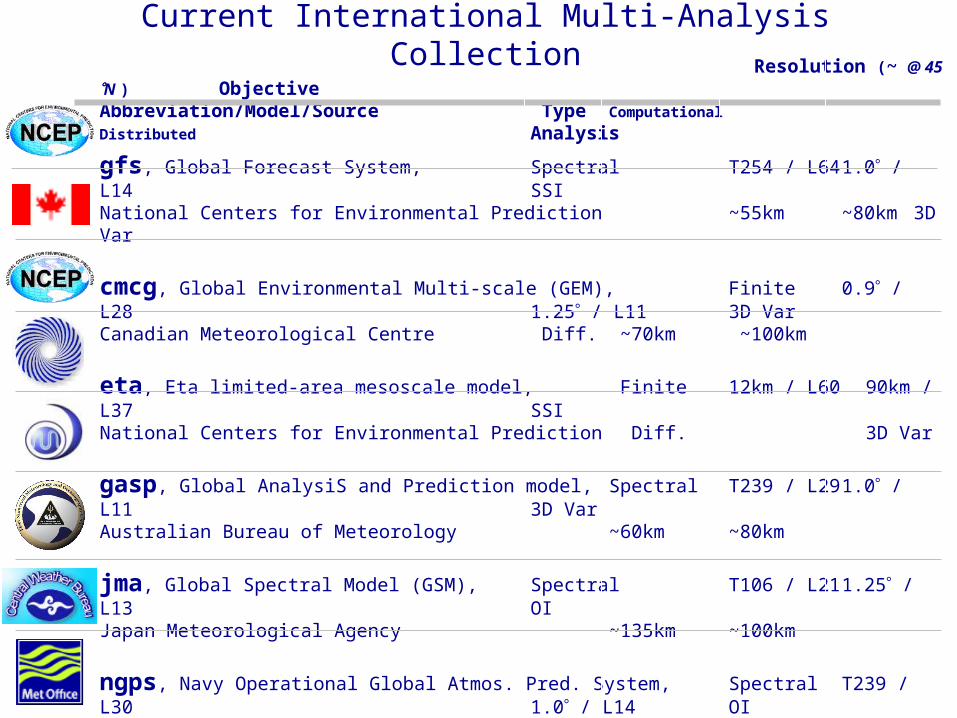
Resolution (~ @ 45 N ) ObjectiveAbbreviation/Model/Source Type Computational Distributed Analysis
gfs, Global Forecast System, Spectral T254 / L64 1.0 / L14 SSINational Centers for Environmental Prediction ~55km ~80km 3D Var cmcg, Global Environmental Multi-scale (GEM), Finite 0.9 / L28 1.25 / L11 3D VarCanadian Meteorological Centre Diff. ~70km ~100km eta, Eta limited-area mesoscale model, Finite 12km / L60 90km / L37 SSINational Centers for Environmental Prediction Diff. 3D Var gasp, Global AnalysiS and Prediction model, Spectral T239 / L29 1.0 / L11 3D VarAustralian Bureau of Meteorology ~60km ~80km
jma, Global Spectral Model (GSM), Spectral T106 / L21 1.25 / L13 OIJapan Meteorological Agency ~135km ~100km ngps, Navy Operational Global Atmos. Pred. System, Spectral T239 / L30 1.0 / L14 OIFleet Numerical Meteorological & Oceanographic Cntr. ~60km ~80km
tcwb, Global Forecast System, Spectral T79 / L18 1.0 / L11 OITaiwan Central Weather Bureau ~180km ~80km ukmo, Unified Model, Finite 5/65/9/L30 same / L12 3D VarUnited Kingdom Meteorological Office Diff. ~60km
Current International Multi-Analysis Collection
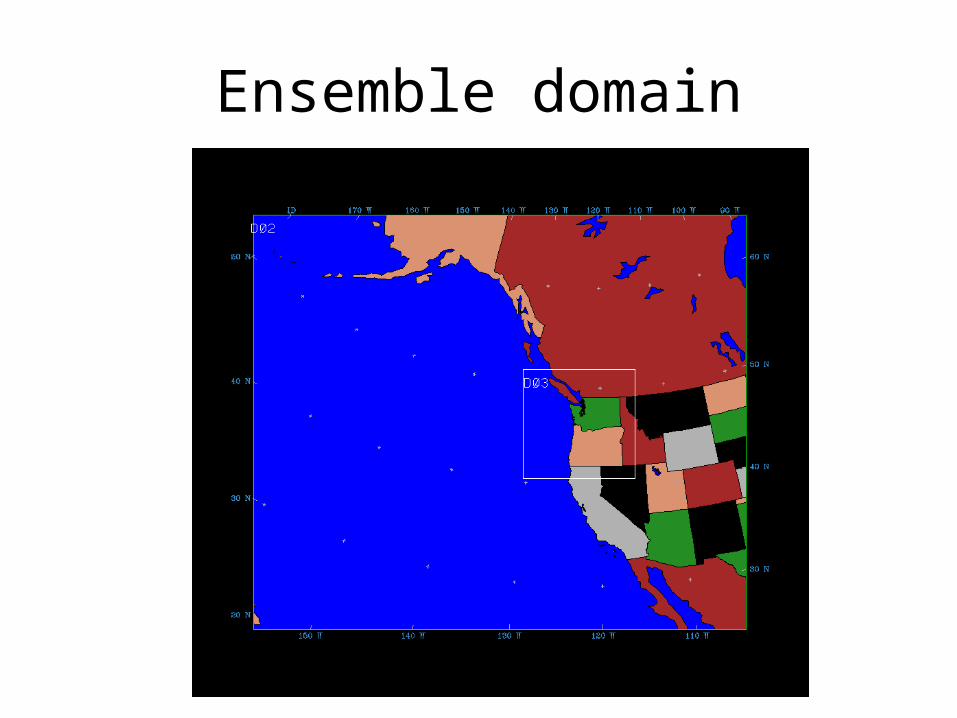
Ensemble domain

Post-Processing of Ensembles
• Uses Bayesian Model Averaging to optimally combine the various ensemble members to produce reliable and sharp probabilistic forecasts.
• The output provides spatially varying PDFs of precipitation and other parameters.

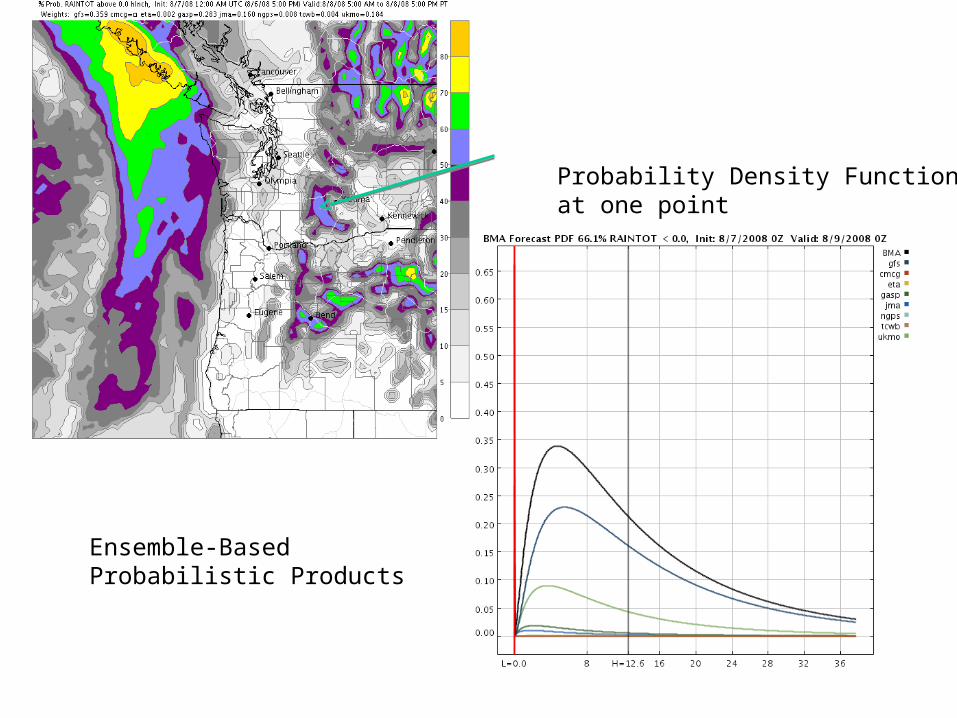
Ensemble-Based Probabilistic Products
Probability Density Functionat one point
Work Cut Out for Us
• Large amount of work yet to be done to perfect ensemble-based probabilistic prediction of orographic precipitation.
• Quantification of uncertainty in parameterizations
• Higher resolution
• Many others.

The End

High (4-km or higher) resolution also need for some small scale
orographically forced precipitation features