progress & impact series · progress & impact series focus on south africa secretariat...
TRANSCRIPT
PROGRESS & IMPACT SERIES
Focus on South Africa
Secretariat hosted by the World Health Organization
Avenue Appia 20, 1211 Geneva 27, Switzerland www.rollbackmalaria.org [email protected] Tel. +41 22 791 5869 Fax +41 22 791 1587
Country ReportsNumber 8 • October 2013
PROG
RESS
& IM
PACT
SER
IES
F
OCuS
On
SOuT
h AF
RICA
COun
TRY
REPO
RTS
Num
ber 8
• Oc
tobe
r 201
3
PROGRESS &IMPACT SERIESCountry ReportsNumber 8 • October 2013
Focus on South Africa

WHO Library Cataloguing-in-Publication Data
Focus on South Africa.
(Progress & impact series – country reports n. 8)
1.Malaria - prevention and control. 2.Malaria - therapy. 3.Malaria - economics. 4.Financing, Health. 5.South Africa. I.Global Partnership to Roll Back Malaria. II.Series.
ISBN 978 92 4 150614 4 (NLM classification: WC 765)
© 2013 World Health Organization on behalf of the Roll Back Malaria Partnership Secretariat
All rights reserved. Publications of the World Health Organization are available on the WHO web site (www.who.int) or can be purchased from WHO Press, World Health Organization, 20 Avenue Appia, 1211 Geneva 27, Switzerland (tel.: +41 22 791 3264; fax: +41 22 791 4857; e-mail: [email protected]).
Requests for permission to reproduce or translate WHO publications – whether for sale or for non-commercial distribution – should be addressed to WHO Press through the WHO web site (www.who.int/about/licensing/copyright_form/en/index.html).
The designations employed and the presentation of the material in this publication do not imply the expression of any opinion whatsoever on the part of the World Health Organization concerning the legal status of any country, territory, city or area or of its authorities, or concerning the delimitation of its frontiers or boundaries. Dotted lines on maps represent approximate border lines for which there may not yet be full agreement.
The mention of specific companies or of certain manufacturers’ products does not imply that they are endorsed or recommended by the World Health Organization in preference to others of a similar nature that are not mentioned. Errors and omissions excepted, the names of proprietary products are distinguished by initial capital letters.
All reasonable precautions have been taken by the World Health Organization to verify the information contained in this publication. However, the published material is being distributed without warranty of any kind, either expressed or implied. The responsibility for the interpretation and use of the material lies with the reader. In no event shall the World Health Organization be liable for damages arising from its use.
Photo credits | Front cover and pp. 6, 8, 16, 19, 27, 28, 29, 30, 33, 34, 37, 39, 44, 47, 49, 53, 58, 65, 66, 69, 70: © National Department of Health, South Africa | p. 4: © Laurent Bergeron | p. 10: © Peter Morey | pp. 13, 21, 22: © The Global Fund/Jonx Pillemer | p. 51: © The Global Fund/Juda Ngwenya
Enquiries | Roll Back Malaria Partnership Secretariat | Hosted by the World Health Organization | Avenue Appia 20 | 1211 Geneva 27 | Switzerland | Tel.: +41 22 791 5869 | Fax: +41 22 791 1587 | E-mail: [email protected]
Designed by messaggio | Printed in France
FOCU
S ON
SOU
TH A
FRIC
A P
ROGR
ESS
& IM
PACT
SER
IES
2
CONTENTS
CONTENTS
Abbreviations............................................................................................................................................................. 5
Acknowledgements .................................................................................................................................................. 7
Foreword .................................................................................................................................................................... 9
Executive summary................................................................................................................................................. 11
Box 1: The extent of malaria in South Africa ................................................................................................ 14
I. History of malaria in South Africa: the early years ........................................................................................ 17
II. Malaria control progress since 2000............................................................................................................... 23
a. Malaria control period ........................................................................................................................ 24
b. Scaling up control ............................................................................................................................... 24
c. Strengthening the programme towards elimination ..................................................................... 25
Box 2: Interviews with key players in malaria control in the country .............................................................. 28
III. Gearing up a national malaria control programme for elimination .......................................................... 31
a. Management and planning ................................................................................................................ 31
Box 3: Cross-border partnerships ................................................................................................................ 34
b. Securing appropriate funding ........................................................................................................... 40
c. Intervention strategies ....................................................................................................................... 44
Box 4: Malaria health promotion from control to elimination ......................................................................... 53
d. Impact and cases averted ................................................................................................................. 55
Box 5: Malaria surveillance and response: the crux of a strong elimination programme .................................. 59
IV. Paving the way towards malaria elimination ............................................................................................... 67
V. Conclusion ........................................................................................................................................................... 71
Annex: List of National Malaria Control Programme Partners ....................................................................... 72
FOCU
S ON
SOU
TH A
FRIC
A P
ROGR
ESS
& IM
PACT
SER
IES
3
Table of figures
1. Malaria incidence by province, South Africa, January–December 2012 . . . . . . . . . . . . . . . . . . . . . . . . . . 15 2. Breakdown of all reported malaria cases (a) and local cases (b) per district in the three malaria-endemic provinces,
South Africa, April 2012–March 2013 . . . . . . . . . . . . . . . . . . . . . . . . . . . . . . . . . . . . . . . . 15 3. Map of South Africa with former divisions (pre-1994) . . . . . . . . . . . . . . . . . . . . . . . . . . . . . . . . . 17 4. Malaria distribution map for South Africa in 1938 . . . . . . . . . . . . . . . . . . . . . . . . . . . . . . . . . . . 18 5. Annual number of malaria cases and associated deaths, South Africa, 1971–2012 . . . . . . . . . . . . . . . . . . . . . 20 6. IRS spray coverage in KwaZulu-Natal, Limpopo and Mpumalanga, 2005–2012 . . . . . . . . . . . . . . . . . . . . . . . 25 7. Malaria incidence in endemic provinces during the malaria transmission seasons of 1999/2000 and 2010/2011 . . . . . . . . . 26 8. South Africa’s progress on the malaria continuum . . . . . . . . . . . . . . . . . . . . . . . . . . . . . . . . . . . 27 9. Goal and objectives of South Africa’s 2012–2018 malaria elimination strategy . . . . . . . . . . . . . . . . . . . . . . . 3210. LSDI intervention districts and outcomes . . . . . . . . . . . . . . . . . . . . . . . . . . . . . . . . . . . . . . 3511. Incidence of malaria in TLMI intervention districts, 2009–2012 . . . . . . . . . . . . . . . . . . . . . . . . . . . . . 3712. Incidence of malaria in MOZIZA intervention areas, 2009 . . . . . . . . . . . . . . . . . . . . . . . . . . . . . . . 3913. Domestic and external funding for malaria control and elimination, South Africa, 2007–2012 . . . . . . . . . . . . . . . . . 4114. Malaria elimination costs by province, South Africa, 2012–2018 . . . . . . . . . . . . . . . . . . . . . . . . . . . . . 4215. Malaria elimination funding gaps by intervention, South Africa, 2012–2018 . . . . . . . . . . . . . . . . . . . . . . . . 4316. Number of structures sprayed with IRS and operational coverage in the three malaria-endemic provinces,
South Africa, 2000–2012 . . . . . . . . . . . . . . . . . . . . . . . . . . . . . . . . . . . . . . . . . . . . . 4617. Diagnostictoolsusedforconfirmingmalariacases,SouthAfrica,2011 . . . . . . . . . . . . . . . . . . . . . . . . . . 4818. Number of ACT treatment courses delivered to the public and private sectors, South Africa, 2008–2012 . . . . . . . . . . . . 5019. Projected number of malaria cases averted annually through IRS, case management and regional control,
South Africa, 2003–2012 . . . . . . . . . . . . . . . . . . . . . . . . . . . . . . . . . . . . . . . . . . . . . 5720. Active case investigation and detection at facility level . . . . . . . . . . . . . . . . . . . . . . . . . . . . . . . . 6021. Active case investigation and detection at community level . . . . . . . . . . . . . . . . . . . . . . . . . . . . . . . 6022. Investigated cases of malaria among all provinces of South Africa, 2011 and 2012 . . . . . . . . . . . . . . . . . . . . . 6323.Proportionoflocal,unclassifiedandimportedcases,malaria-endemicprovinces,2011–2012 . . . . . . . . . . . . . . . . . 64
| CONTENTS |
FOCU
S ON
SOU
TH A
FRIC
A P
ROGR
ESS
& IM
PACT
SER
IES
4
ABBREVIATIONS
ACD Active case detection
ACT Artemisinin-based combination therapy
AL Artemether-lumefantrine
DDT Dichlorodiphenyltrichloroethane
DHS District health system
GIS Geographic information system
IEC Information, education and communication
IRS Indoor residual spraying
IVM Integrated vector management
KAP Knowledge, attitudes and practices
KZN KwaZulu-Natal
LSDI Lubombo Spatial Development Initiative
MRC Medical Research Council (Durban, South Africa)
NDOH National Department of Health
NHLS National Health Laboratory Service
NMCP National Malaria Control Programme
PCR Polymerase chain reaction
PHC Primary health care
RBM Roll Back Malaria
RDT Rapid diagnostic test
SADC Southern African Development Community
SAMEC South African Malaria Elimination Committee
SP Sulfadoxine-pyrimethamine
TLMI Trans-Limpopo Malaria Initiative
WHO World Health Organization
FOCU
S ON
SOU
TH A
FRIC
A P
ROGR
ESS
& IM
PACT
SER
IES
5

South African Malaria Elimination Committee 2012 and partners/advisors (photo from 2013)
FOCU
S ON
SOU
TH A
FRIC
A P
ROGR
ESS
& IM
PACT
SER
IES
6

ACKNOWLEDGEMENTS
ACkNOwlEdGEMENTSThis report was prepared under the auspices of the Roll Back Malaria (RBM) Partnership to help assess progress towards targets set out in the Global Malaria Action Plan and the Millennium Development Goals (MDGs).
The Department of Health in South Africa hereby wishes to commend the sterling efforts of those individuals listed below for compiling the Roll Back Malaria (RBM) Progress & Impact Series report Focus on South Africa. It will be an essential reference document to inform the public and key malaria stakeholders on the status of malaria in South Africa, and on the progress the country has made over the past century, the past decade in particular. It also highlights the priorities for eliminating the disease in the coming years.
This report was jointly coordinated and contributed to by Dr Devanand Moonasar (Director for Malaria at the National Department of Health [NDOH] in South Africa) and Prof. Lucille Blumberg (Deputy Director, National Institute for Communicable Diseases, and chairperson of the South African Malaria Elimination Committee).
Contributors include Prof. Karen Barnes (Division of Clinical Pharmacology, Department of Medicine, University of Cape Town); Dr Cornelia Duvenage (Department of Internal Medicine, One Military Hospital, South Africa); Dr Sunday Idongesit Ukpe (Department of Health and Social Services, Mpumalanga Province); Dr Frank Hansford (formerly Department of Health and Social Services, Limpopo Province); Ms Lee Baker (Medicines Information Consultant, Amayeza Information Centre); Prof. Maureen Coetzee (University of the Witwatersrand); Prof. Lizette Koekemoer, Dr Basil Brooke, Prof. John Frean and Dr Natalie Mayet (National Institute for Communicable Diseases); Prof. Dave Durrheim (University of Newcastle, Australia); Mr Philip Kruger (Limpopo Provincial Malaria Control Programme); Mr Aaron Mabuza (Mpumalanga Provincial Malaria Control Programme); Mr Bruce Margot and Mr Eric Raswiswi (KwaZulu-Natal Provincial Malaria Control Programme); Ms Mary Anne Groepe (World Health Organization [WHO], South Africa); Prof. Immo Kleinschmidt (London School of Hygiene and Tropical Medicine); Prof. Rajendra Maharaj, Dr Jaishree Raman and Mr Ishen Seocharan (South African Medical Research Council [MRC] in Durban).
Our sincere appreciation goes to Ms Natashia Morris (South African MRC, Durban) for contributing to the document and for providing all its maps, which were subsequently modified for the purpose of the publication. The following officials from the National Department of Health also provided inputs: Dr Frew Benson, Ms Eunice Bester, Ms Sanelisiwe Milo, Dr Eunice Misiani, Mr John Burns Nawn, Ms Caron van Schalkwyk, Ms Ntsieni Ramalwa and Ms Mbavhalelo Shandukani. We would like to pay tribute to the following persons, and acknowledge their significant contribution to malaria control in South Africa: Dr Dawid Siegfried Annecke (1895–1955); Dr Botha De Meillon (1902–2000) and Dr Brian Sharp (1952–2007).
An editorial committee made up of Salim Abdulla (Ifakara Health Institute [IHI]), Matthew Lynch (Johns Hopkins University) and Richard Steketee (Malaria Control and Evaluation Partnership in Africa [MACEPA], a programme at PATH) has provided valuable help and insightful comments to this report. It also benefited from extensive feedback from Eric Mouzin (RBM Partnership Secretariat), Robert Newman (WHO Global Malaria Programme [WHO GMP]) and his staff, and Georges Ki-Zerbo (WHO Regional Office for Africa).
Laurent Bergeron (RBM Partnership Secretariat) was the production manager of this report, and provided editorial assistance. We thank Michael Reid (RBM Partnership Secretariat consultant) for proofreading the manuscript, as well as Marina Gavrioushkina and Prudence Smith (RBM Partnership Secretariat) for supporting the release and dissemination of the report. The authors are responsible for any errors or omissions.
FOCU
S ON
SOU
TH A
FRIC
A P
ROGR
ESS
& IM
PACT
SER
IES
7

FOCU
S ON
SOU
TH A
FRIC
A P
ROGR
ESS
& IM
PACT
SER
IES
8
FOREWORD
FOREwORdIt gives me great pleasure to write this foreword for the Progress & Impact Series report Focus on South Africa. Malaria is one of the diseases we have brought under control over the past several decades. This has not been an easy task; it has been achieved thanks to the committed efforts of many individuals and organizations, most of them mentioned later in this report, and we laud their efforts.
We firmly believe there is no quick-fix for controlling malaria; strategies need to be well thought out, practical, systematically and robustly implemented and meticulously monitored. South Africa’s formalized malaria control programme dates back to the 1940s and has focused on mosquito control through indoor residual spraying together with effective treatment and surveillance. Historically, right up until today, we have managed to finance our own malaria control efforts; this has been one of the major reasons why we have been able to sustain the reduction in malaria cases in South Africa over several decades.
South Africa has managed to turn the tide on malaria by ensuring the optimal implementation of the World Health Organization’s approved interventions, such as indoor residual spraying using dichlorodiphenyltrichloroethane, parasitologically confirmed diagnosis and treatment using artemisinin-based combination therapies, health promotion and successful cross-border malaria initiatives with neighbouring Zimbabwe and Mozambique. For these reasons we have significantly reduced the burden of malaria in South Africa to WHO’s classified pre-elimination levels.
In doing this, we have also achieved the malaria target for the Millennium Development Goal (MDG) 6. The data presented in this report are testimony to this accomplishment.
Having reduced the incidence of malaria in South Africa, we are now embarking on a malaria elimination campaign with the goal of zero local transmission by 2018. This is an ambitious target but one we are confident we will achieve by robustly implementing all available tools. The success of our elimination campaign will depend on effective partnerships at country and regional levels to pursue our malaria elimination strategies.
Our malaria elimination efforts will not be exclusively country-specific. Such efforts will also have a regional focus. We will continue working with our neighbouring countries to ensure there is effective malaria control across our borders and within our countries. This, we believe, is critical to moving forward the South African and the Southern African Development Community (SADC) malaria elimination agenda.
Dr Pakishe Aaron MotsoalediHonourable Minister of Health, South Africa
FOCU
S ON
SOU
TH A
FRIC
A P
ROGR
ESS
& IM
PACT
SER
IES
9

Ms Precious MatsosoDirector General, Department of Health, South Africa
FOCU
S ON
SOU
TH A
FRIC
A P
ROGR
ESS
& IM
PACT
SER
IES
10

EXECUTIVE SUMMARY
ExECuTIVE SuMMARyProgress and impact of malaria control in South Africa at a glance
• South Africa has been able to roll out and sustain effective malaria control interventions for more than 70 years, largely through domestic funding. After a major epidemic in 1999/2000, the country implemented evidence-based and practical policies that have successfully positioned it to eliminate the disease by 2018.
• The country has a decentralized malaria control programme, with the national malaria programme at the National Department of Health (NDOH) defining policies and guidelines, and providing technical support to provinces. Activities occur at a provincial level, funded by a dedicated budget through the national treasury. Elimination interventions are focused on cross-border collaborations with Mozambique, Swaziland and Zimbabwe, integrated vector management, robust health promotion activities and a solid active surveillance programme.
• The national budget for malaria control increased significantly between 2007 and 2008, reaching an average of US$ 25 million annually between 2009 and 2012.
• South Africa enforced malaria control strategies and implemented critical interventions: - Indoor residual spraying (IRS) coverage of
targeted structures was 88% on average in malaria-endemic provinces between 2000 and 2012, with about 1.8 million structures sprayed in 2012/2013.
- Rapid diagnostic tests (RDTs) were rolled out nationwide in 2003 and artemisinin-based combination therapies (ACTs) introduced for uncomplicated case management subsequent to parasitologically confirmed diagnosis in KwaZulu-Natal in 2001, in Limpopo in 2004, and in Mpumalanga in 2006.
- Since 2000, all suspected malaria cases have been diagnosed using microscopy and/or RDTs. In 2011, 61% and 39% of malaria cases were respectively confirmed by microscopy and RDT.
- All positive cases are treated within 24 hours, and treatment is only prescribed once cases are confirmed (not presumptively).
- Training is a cornerstone of the malaria control programme: more than 7700 spray operators were trained between 2005 and 2012; an average of 500 doctors and nurses are trained each year in managing severe malaria; and regular training sessions in malaria case management are organized for health-care workers.
- South Africa was instrumental in initiating cross-border malaria initiatives, such as the Lubombo Spatial Development Initiative (LSDI) through the signing of a trilateral agreement with heads of state in Mozambique and Swaziland. These efforts led to further reductions in malaria morbidity and mortality in South Africa.
• Added to continued socioeconomic improvements in South Africa, the roll-out of malaria control interventions and strategies allowed the following disease burden reductions:
FOCU
S ON
SOU
TH A
FRIC
A P
ROGR
ESS
& IM
PACT
SER
IES
11
- Nationwide, malaria morbidity and mortality decreased 89% and 85% respectively between 2000 and 2012, from 64 500 to 6847 malaria cases, and from 460 to 70 deaths.
- Between 2011 and 2012, local and imported cases decreased by 18% and 24% respectively. In 2012, 69% of reported malaria cases were imported, and all districts nationwide had less than 1 local malaria case per 1000 population at risk, advancing South Africa another step towards eliminating the disease.
- Cross-border collaborations had a remarkable impact in KwaZulu-Natal and Mpumalanga where malaria cases dropped by 93% (from about 54 400 to 3900) in the two provinces taken together between 1999/2000 and 2010/2011.
- According to estimates based on the 2000 malaria outbreaks in KwaZulu-Natal, at least 165 000 malaria cases are averted each year in
the three endemic provinces through effective malaria control activities.
• The main lesson learned from more than 70 years of malaria control efforts in South Africa is that the country has been using indoor residual spraying to decrease the disease burden and effective antimalarial drugs over time, adapting its policies based on appropriate surveillance data.
• South Africa has developed a malaria elimination plan, with the goal to end local transmission by 2018. It is hoped the country will close the funding gap already identified, so that it can strengthen its human resource capacity, improve its evidence-based research for surveillance and response, and ultimately realise its malaria-free goal.
| ExECUTIVE SUMMARy |
FOCU
S ON
SOU
TH A
FRIC
A P
ROGR
ESS
& IM
PACT
SER
IES
12
FOCU
S ON
SOU
TH A
FRIC
A P
ROGR
ESS
& IM
PACT
SER
IES
13

| THE ExTENT OF MALARIA IN SOUTH AFRICA |
Box 1: The extent of malaria in South Africa
Malaria in South Africa at a glance
• South Africa is home to 52 million inhabitants and is divided into 9 provinces and 52 districts.
• Malaria is endemic in the north-eastern parts of the country, in the Limpopo, Mpumalanga and KwaZulu-Natal provinces.
• Malaria transmission is seasonal, occurring from September to May, with a peak in the high rainfall months of December and January.
• The population at risk is approximately 5 million. In 2012, 6847 malaria cases were reported (National Department of Health [NDOH] data), of which 69% were imported cases.
The Republic of South Africa has approximately 52 million inhabitants (Statistics South Africa, 2011 census) and is divided into 9 provinces and 52 districts. Malaria is endemic in the north-eastern parts of the country, the Limpopo, Mpumalanga and KwaZulu-Natal provinces along the borders with Botswana, Zimbabwe, Mozambique and Swaziland (see Figure 1). Limited transmission has previously occurred in the North West province along the Molopo River. In the province of Gauteng, the economic hub of the country, large numbers of imported malaria cases are reported among returning travellers and migrants.
The variable transmission patterns in neighbouring countries impact differently on malaria in South Africa. Importation of malaria from Namibia, Botswana and Swaziland into South Africa is negligible, as malaria transmission in these countries is at relatively low levels. However, malaria originating from Mozambique and Zimbabwe contributes to the higher disease burden in Limpopo and Mpumalanga provinces (see Figure 1).
Overall, the population at risk of malaria infection is about 5 million (10% of the overall population of
South Africa). Malaria is seasonal, predominantly occurring when temperatures are favourable for vector survival, generally from September to May with a peak in the rainy months of December and January. Plasmodium falciparum is responsible for more than 90% of malaria infections, with Anopheles arabiensis being the major vector. P. malariae, P. ovale and P. vivax occasionally occur alone or in mixed infections with P. falciparum.
Malaria risk areas are characterized by relatively low transmission, so the population at risk does not necessarily develop immunity and, therefore, persons of any age group are at risk of severe malaria.
The high volume migration across South Africa’s northern and eastern land borders places a significant risk of importation of malaria into South Africa, increasing the subsequent local transmission risk in the receptive areas where malaria vectors are present (see Figure 2 on incidence at district level). Between January and December 2012, 69% of all malaria cases (n=6847) reported were imported, predominantly from Mozambique and Zimbabwe.
FOCU
S ON
SOU
TH A
FRIC
A P
ROGR
ESS
& IM
PACT
SER
IES
14
Province
District
Reserve
Incidence per 1000 populationat risk
0
<1
1 to <5
≥5
a) Incidence based on all reported cases b) Incidence based on local cases only
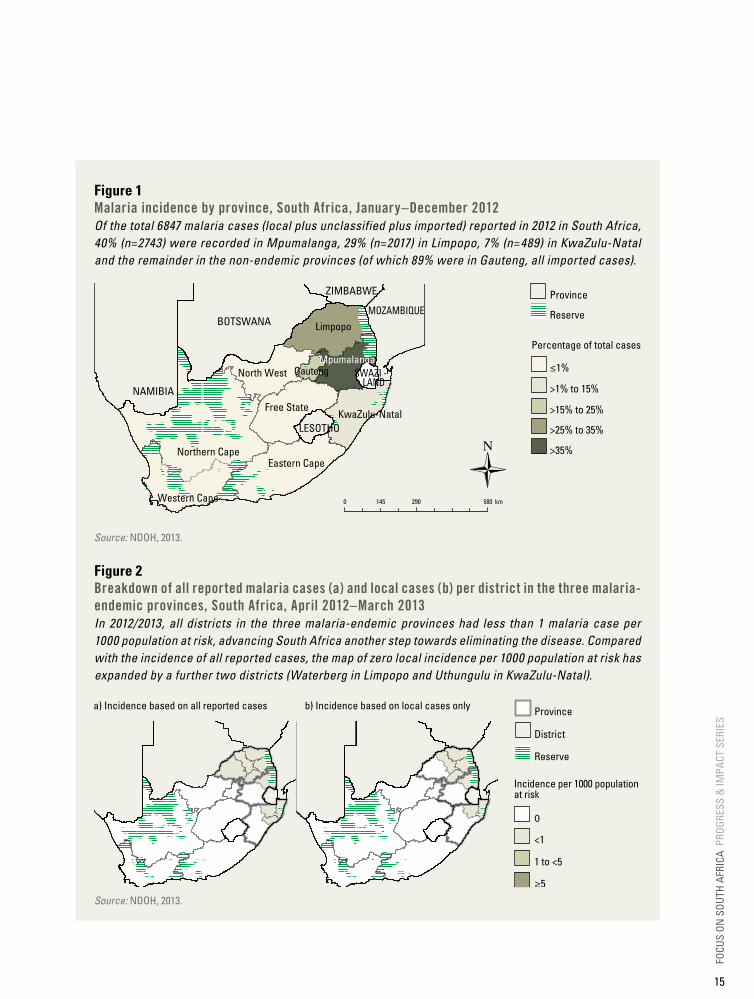
Figure 2Breakdown of all reported malaria cases (a) and local cases (b) per district in the three malaria-endemic provinces, South Africa, April 2012–March 2013In 2012/2013, all districts in the three malaria-endemic provinces had less than 1 malaria case per 1000 population at risk, advancing South Africa another step towards eliminating the disease. Compared with the incidence of all reported cases, the map of zero local incidence per 1000 population at risk has expanded by a further two districts (Waterberg in Limpopo and Uthungulu in KwaZulu-Natal).
Source: NDOH, 2013.
Figure 1Malaria incidence by province, South Africa, January–december 2012Of the total 6847 malaria cases (local plus unclassified plus imported) reported in 2012 in South Africa, 40% (n=2743) were recorded in Mpumalanga, 29% (n=2017) in Limpopo, 7% (n=489) in KwaZulu-Natal and the remainder in the non-endemic provinces (of which 89% were in Gauteng, all imported cases).
Province
Reserve
Percentage of total cases
≤1%
>1% to 15%
>15% to 25%
>25% to 35%
>35%
0 290 580 km145
Northern CapeEastern Cape
Limpopo
Free State
Western Cape
North West
KwaZulu-Natal
MpumalangaGauteng
BOTSWANAMOZAMBIQUE
SWAZI - LAND
ZIMBABWE
NAMIBIA
LESOTHO
Source: NDOH, 2013.
FOCU
S ON
SOU
TH A
FRIC
A P
ROGR
ESS
& IM
PACT
SER
IES
15

The malaria field station opened by the Institute at Tzaneen in 1931. This station developed into the Siegfried Annecke Institute, which later became the National Institute for Tropical Diseases.
FOCU
S ON
SOU
TH A
FRIC
A P
ROGR
ESS
& IM
PACT
SER
IES
16

CHAPTER I
HISTORy OF MAlARIA IN SOuTH AFRICA: THE EARly yEARSSouth Africa’s malaria control programme has been able to roll out and sustain effective control interventions for more than 70 years, largely through domestic funding. It adopted and implemented evidence-based and practical policies, leading to significant reductions in malaria transmission. These successes have enabled the country to prepare for elimination of the disease.
Large parts of South Africa were historically affected by malaria, with the disease being endemic in the low-lying parts of Natal and Transvaal. The first documented disease outbreaks were in Natal (first in 1905) and Zululand, spreading as far south as Port St Johns (see Figure 3) on the east coast in 1927 and near Pretoria in the early 1930s. During these early outbreaks, larviciding was used as a mosquito
control intervention, with quinine used for prophylaxis and treating clinical malaria cases. Although control interventions were put in place during the 1930s and 1940s, major malaria epidemics were recorded in 1939 and 1943. During the 1939 epidemic, more than 9300 malaria deaths were reported in the Transvaal.
Figure 3Map of South Africa with former divisions (pre-1994)In 1994, all homelands and the four original provinces (Cape, Natal, Orange Free State and Transvaal) were abolished, and the nine provinces shown in Figure 1 were established.
Source: NDOH, 2013.
Port St Johns
Cape Province
Transvaal
Natal
Orange Free State
Durban
Ulundi
Umtata
Mafikeng Pretoria
Upington
Nelspruit
Cape Town
Polokwane
Kimberley
Mossel Bay
Klerksdorp
East London
Bloemfontein
Johannesburg
Port Elizabeth
Pietermaritzburg
Former provinces
Former homelandsBophuthatswanaCiskeiGazankuluKangwaneKwaNdebeleZululandLebowaQwaQwaTranskeiVenda
NAMIBIA
BOTSWANA
ZIMBABWE
MOZAM- BIQUE
SWAZI - LAND
LESOTHO
0 290 580 km145
FOCU
S ON
SOU
TH A
FRIC
A P
ROGR
ESS
& IM
PACT
SER
IES
17

| HISTORY OF MALARIA IN SOUTH AFRICA: THE EARLY YEARS |
Malaria risk categories
Continuous high risk
Serious risk in summer
Moderate risk in summer
Epidemic slight risk
Pretoria LourencoMarques
Durban
Kruger National Park
BECHUANALAND
RHODESIA
LORENZOMARQUES
SWAZILANDUNION OF SOUTH AFRICA
0 75 150
Kilometres
In the mid-1930s, a research experiment demonstrated that regular weekly space indoor spraying with a pyrethrum/kerosene mix was a more cost-effective malaria prevention intervention than larviciding. Furthermore, this adult mosquito control measure did not affect water supplies for humans or their livestock. Weekly space spraying with pyrethrum was then rolled out based on the malaria distribution map issued at the
time (see Figure 4), and by 1941/1942 more than 100 000 people were estimated to be protected. This highly significant and innovative control method led directly to indoor residual spraying (IRS) of houses with long-lasting insecticides after World War II and to the World Health Organization (WHO) Global Malaria Eradication Campaign in the 1950s, and is recognized as a major contribution from South Africa to malaria control strategies.
Figure 4Malaria distribution map for South Africa in 1938In the late 1930s, continuous high risk of malaria was defined in the eastern coastal region of Natal and serious risk of malaria transmission in summer was mapped all along the borders with Botswana (Bechuanaland at the time), Zimbabwe (Rhodesia), Mozambique and Swaziland.
Source: NDOH and South African Medical Research Council (MRC), 1997.
FOCU
S ON
SOU
TH A
FRIC
A P
ROGR
ESS
& IM
PACT
SER
IES
18
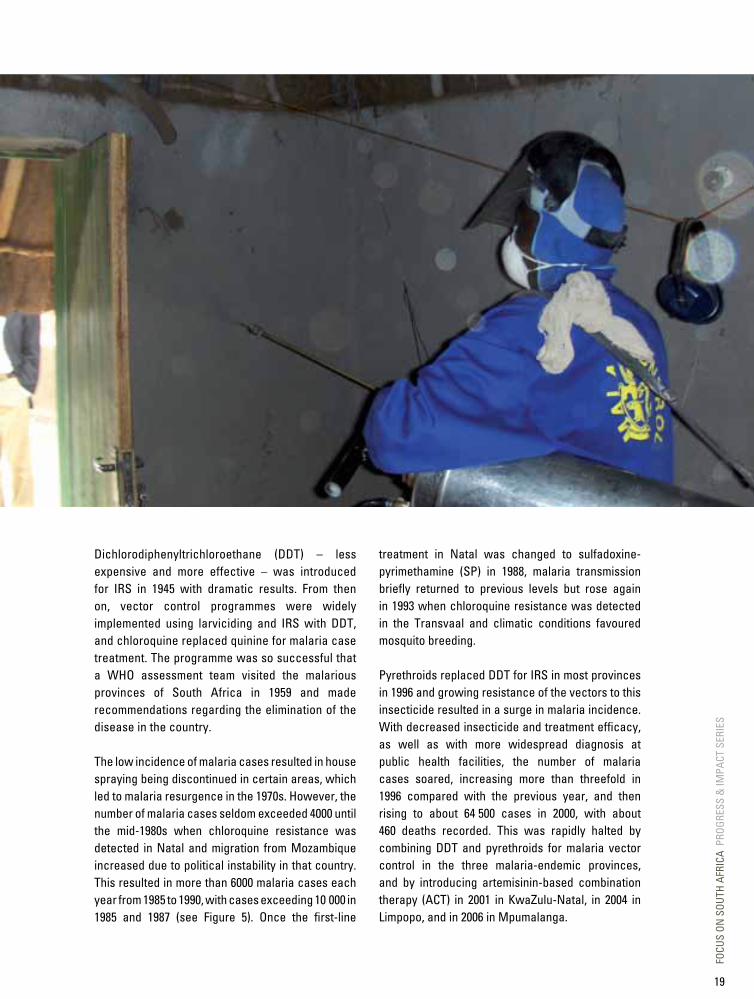
Dichlorodiphenyltrichloroethane (DDT) – less expensive and more effective – was introduced for IRS in 1945 with dramatic results. From then on, vector control programmes were widely implemented using larviciding and IRS with DDT, and chloroquine replaced quinine for malaria case treatment. The programme was so successful that a WHO assessment team visited the malarious provinces of South Africa in 1959 and made recommendations regarding the elimination of the disease in the country.
The low incidence of malaria cases resulted in house spraying being discontinued in certain areas, which led to malaria resurgence in the 1970s. However, the number of malaria cases seldom exceeded 4000 until the mid-1980s when chloroquine resistance was detected in Natal and migration from Mozambique increased due to political instability in that country. This resulted in more than 6000 malaria cases each year from 1985 to 1990, with cases exceeding 10 000 in 1985 and 1987 (see Figure 5). Once the first-line
treatment in Natal was changed to sulfadoxine-pyrimethamine (SP) in 1988, malaria transmission briefly returned to previous levels but rose again in 1993 when chloroquine resistance was detected in the Transvaal and climatic conditions favoured mosquito breeding.
Pyrethroids replaced DDT for IRS in most provinces in 1996 and growing resistance of the vectors to this insecticide resulted in a surge in malaria incidence. With decreased insecticide and treatment efficacy, as well as with more widespread diagnosis at public health facilities, the number of malaria cases soared, increasing more than threefold in 1996 compared with the previous year, and then rising to about 64 500 cases in 2000, with about 460 deaths recorded. This was rapidly halted by combining DDT and pyrethroids for malaria vector control in the three malaria-endemic provinces, and by introducing artemisinin-based combination therapy (ACT) in 2001 in KwaZulu-Natal, in 2004 in Limpopo, and in 2006 in Mpumalanga.
FOCU
S ON
SOU
TH A
FRIC
A P
ROGR
ESS
& IM
PACT
SER
IES
19

| HISTORY OF MALARIA IN SOUTH AFRICA: THE EARLY YEARS |
Figure 5Annual number of malaria cases and associated deaths, South Africa, 1971–2012Malaria peaked in 1985, 1993 and 2000, mostly due to antimalarial drug and/or insecticide resistance. From 2001 on, the deployment of ACTs ensured a dramatic decline in malaria case numbers, the incidence falling by 89% between 2000 and 2012.
Source: NDOH, 2013.
0
50
100
150
200
250
300
350
400
450
500
0
5000
10 000
15 000
20 000
25 000
30 000
35 000
40 000
45 000
50 000
55 000
60 000
65 000
1971 1975 1980 1985 1990 1995 2000 2005 2010 2012
Malaria cases Malaria deaths
Number of malaria cases Number of malaria deaths
South Africa formulated its Roll Back Malaria strategic plan and launched it in late 2001. Following the roll-out of ACTs, sustained high coverage of IRS and the adoption of regional malaria control strategies in South Africa, Swaziland and Mozambique, the number of cases decreased to 26 500 in 2001 and was consistently reduced year on year, with fewer than 10 000 cases recorded in 2011, and 6847 cases in 2012.
The main lesson to be learned from more than 70 years of malaria control efforts in South Africa is that the country has been using IRS to decrease disease burden and effective antimalarial drugs over time, adapting its policies based on timely surveillance data used for decision-making.
FOCU
S ON
SOU
TH A
FRIC
A P
ROGR
ESS
& IM
PACT
SER
IES
20

FOCU
S ON
SOU
TH A
FRIC
A P
ROGR
ESS
& IM
PACT
SER
IES
21
FOCU
S ON
SOU
TH A
FRIC
A P
ROGR
ESS
& IM
PACT
SER
IES
22
CHAPTER II
MAlARIA CONTROl PROGRESS SINCE 2000Following a major malaria epidemic in 1999/2000, South Africa’s approach to malaria control was intensified and necessary changes were instituted. Other key events driving this shift included the signing of the RBM Abuja Declaration, which aimed to halve the malaria burden by 2010, and the establishment of the Lubombo Spatial Development Initiative (LSDI), a public-private platform to coordinate evidence-based malaria control activities in South Africa, Mozambique and Swaziland.
The LSDI partnership facilitated the regional implementation of appropriate control measures based on evidence generated by operational research and guided by rigorous monitoring and evaluation processes. The strengthened provincial malaria control programmes, together with effective malaria control activities within the LSDI, resulted in a marked decline in malaria cases being reported in South Africa. By 2006, malaria numbers had declined by more than 80% compared with 2000 levels, with the most notable reductions recorded in KwaZulu-Natal. In this province, malaria cases decreased 83% over the period, from 26 500 to 4400.
A review of the progress made towards the Abuja targets took place during a meeting of African heads of state in 2006. Sustained effective malaria control ensured South Africa was well on track to achieve these targets. This accomplishment was acknowledged a year later when the Southern African Development Community (SADC) and the African Union pronounced South Africa, along with Swaziland, Botswana and Namibia, as candidates for malaria elimination. In 2011, South Africa drafted its malaria elimination strategy (2012–2018) to guide implementation at the provincial and district levels.
FOCU
S ON
SOU
TH A
FRIC
A P
ROGR
ESS
& IM
PACT
SER
IES
23

| MALARIA CONTROL PROGRESS SINCE 2000 |
a. Malaria control periodIn response to the 1999/2000 malaria outbreak, existing malaria practices in South Africa were strengthened to improve malaria control and reduce malaria-related fatalities. Provincial control programmes placed specific focus on ensuring:
• consistent high IRS coverage rates using effective insecticides, including DDT, in high-risk areas;
• effective case management using RDTs and ACTs;
• routine drug and insecticide efficacy monitoring;
• implementation of malaria information systems with geo-localization and increased capacity development;
• improved operational and programmatic evaluation capabilities;
• enhanced field surveillance, follow-up and investigation of passively notified cases and active case detection (ACD) in known ‘hot spots’;
• implementation of effective information, education and communication (IEC) strategies to increase acceptance of control measures, as well as personal protection and health-seeking behaviours.
The sustained deployment of new/improved control strategies in South Africa, particularly high IRS coverage rates and treatment with ACTs, resulted in a marked decline in malaria incidence. Reported confirmed malaria case numbers decreased from about 64 500 in 2000 to 26 500 in 2001. South Africa attempted to diagnose parasitologically all suspected malaria cases using microscopy from the mid-1990s. Since 2000, all malaria cases have been diagnosed using microscopy and/or RDTs. Treatment is only prescribed if cases are confirmed (not presumptively).
b. Scaling up controlBuilding on the impressive successes that the control programmes demonstrated following the 1999/2000 epidemic, South Africa in 2007 developed a three-year strategic malaria control policy. The goals of this new plan were to:
• prevent malaria-related mortality and to reduce morbidity, thereby contributing to the improvement of the social and economic status of the population;
• progressively strengthen malaria control capacity levels nationally and regionally, with the specific aim to maintain a malaria case
fatality rate below 0.5% and reduce local cases to less than 1 case per 100 000 population at risk by 2010.
These targets were achieved after control interventions were enforced. IRS spray coverage in the three South African malaria-endemic provinces consistently exceeded 70% between 2005 and 2012 (see Figure 6). Stock-outs of both RDTs and ACTs were extremely rare. Routine therapeutic efficacy monitoring of antimalarials allowed proactive drug policy changes in an effort to prevent the development of resistance.
FOCU
S ON
SOU
TH A
FRIC
A P
ROGR
ESS
& IM
PACT
SER
IES
24
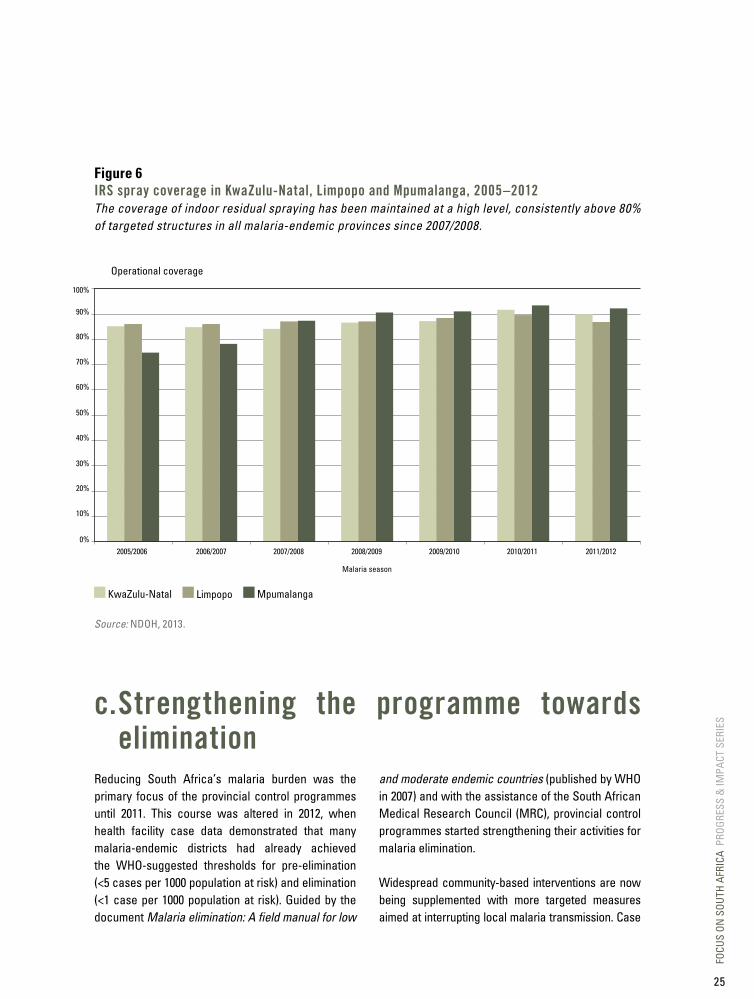
Figure 6IRS spray coverage in kwaZulu-Natal, limpopo and Mpumalanga, 2005–2012The coverage of indoor residual spraying has been maintained at a high level, consistently above 80% of targeted structures in all malaria-endemic provinces since 2007/2008.
0%
10%
20%
30%
40%
50%
60%
70%
80%
90%
100%
2005/2006 2006/2007 2007/2008 2008/2009 2009/2010 2010/2011 2011/2012
KwaZulu-Natal Limpopo Mpumalanga
Malaria season
Operational coverage
Source: NDOH, 2013.
c. Strengthening the programme towards elimination
Reducing South Africa’s malaria burden was the primary focus of the provincial control programmes until 2011. This course was altered in 2012, when health facility case data demonstrated that many malaria-endemic districts had already achieved the WHO-suggested thresholds for pre-elimination (<5 cases per 1000 population at risk) and elimination (<1 case per 1000 population at risk). Guided by the document Malaria elimination: A field manual for low
and moderate endemic countries (published by WHO in 2007) and with the assistance of the South African Medical Research Council (MRC), provincial control programmes started strengthening their activities for malaria elimination.
Widespread community-based interventions are now being supplemented with more targeted measures aimed at interrupting local malaria transmission. Case
FOCU
S ON
SOU
TH A
FRIC
A P
ROGR
ESS
& IM
PACT
SER
IES
25
| MALARIA CONTROL PROGRESS SINCE 2000 |
management and surveillance operations are being intensified, with ACD becoming routine in all endemic provinces. Targeted winter larviciding of potential
vector breeding sites alongside conventional IRS operations is being piloted and could be rolled out more widely in the near future depending on initial results.
Incidence per1000 populationat risk
0<1 1 to <5 ≥5
Reserve
Limpopo
Mpumalanga
KwaZulu-Natal
Kruger National Park
1999/2000
Limpopo
Mpumalanga
KwaZulu-Natal
2010/2011
0 70 14035 km
Kruger National Park
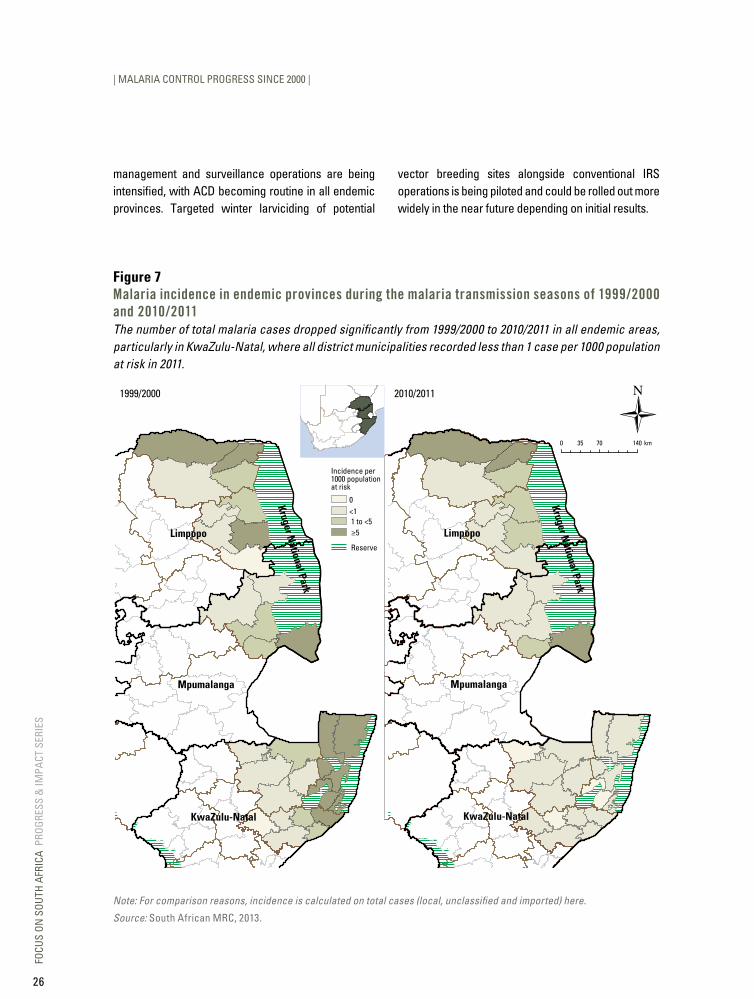
Note: For comparison reasons, incidence is calculated on total cases (local, unclassified and imported) here.
Source: South African MRC, 2013.
Figure 7Malaria incidence in endemic provinces during the malaria transmission seasons of 1999/2000 and 2010/2011The number of total malaria cases dropped significantly from 1999/2000 to 2010/2011 in all endemic areas, particularly in KwaZulu-Natal, where all district municipalities recorded less than 1 case per 1000 population at risk in 2011.
FOCU
S ON
SOU
TH A
FRIC
A P
ROGR
ESS
& IM
PACT
SER
IES
26
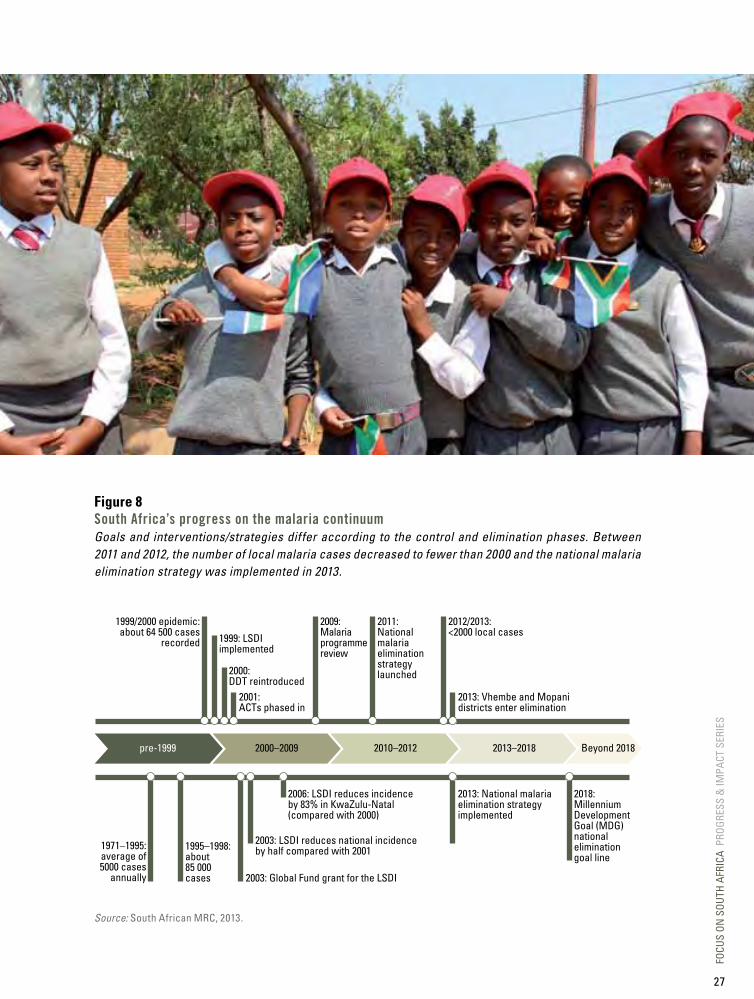
1999/2000 epidemic:about 64 500 cases
recorded
2001:ACTs phased in
2000:DDT reintroduced
1999: LSDIimplemented
pre-1999 2000–2009 2010–2012 2013–2018 Beyond 2018
1971–1995:average of
5000 casesannually
1995–1998:about85 000cases 2003: Global Fund grant for the LSDI
2003: LSDI reduces national incidenceby half compared with 2001
2013: National malariaelimination strategyimplemented
2018:MillenniumDevelopmentGoal (MDG)nationaleliminationgoal line
2006: LSDI reduces incidenceby 83% in KwaZulu-Natal(compared with 2000)
2009:Malariaprogrammereview
2011:Nationalmalariaeliminationstrategylaunched
2012/2013:<2000 local cases
2013: Vhembe and Mopanidistricts enter elimination
Figure 8South Africa’s progress on the malaria continuumGoals and interventions/strategies differ according to the control and elimination phases. Between 2011 and 2012, the number of local malaria cases decreased to fewer than 2000 and the national malaria elimination strategy was implemented in 2013.
Source: South African MRC, 2013.
FOCU
S ON
SOU
TH A
FRIC
A P
ROGR
ESS
& IM
PACT
SER
IES
27

| MALARIA CONTROL PROGRESS SINCE 2000 |
Box 2: Interviews with key players in malaria control in the country
Mr Aaron Mabuza Mpumalanga Malaria Control Programme Manager
To what do you attribute South Africa’s recent success in reducing the country’s malaria burden?
Mr Philip Kruger Limpopo Malaria Control Programme Manager
What do you see as your biggest challenges in the fight against malaria?
South Africa and the SADC countries have all made great strides in the fight against malaria. These efforts, however, need to be sustained over many years in order to move towards malaria elimination in the region. Since the 1950s, many success stories
South Africa is in the fortunate position that malaria control is 100% funded by government. This has resulted in stable funding over many years, leading to the successful implementation of the national malaria control policy. The major strategy, indoor residual spraying, has been sustained with a high coverage over many years. This strategy has been supported by surveillance, malaria awareness among at-risk communities, prompt diagnostic testing and effective treatment of malaria cases, and regional collaboration with neighbouring countries. All of these have contributed to a gradual but sustainable reduction in the malaria burden of the country.
have emerged from the region. These successes were often reversed as country programmes faltered for a variety of reasons, in most cases funding.
In the recent past, the SADC region has again progressed as a team in the fight against malaria, with the ultimate goal of regional elimination. The greatest challenge remains sustaining the recent gains. This would require on-going political support, funding, evidence-based policies and committed malaria programme managers.
As the incidence of malaria declines in South Africa, there will likely be calls for reallocating malaria control funds to deal with other pressing health needs in the country. Finding additional resources to implement the malaria elimination strategies and ensuring sustained funding when malaria elimination has been achieved will be among the greatest challenges for South Africa.
FOCU
S ON
SOU
TH A
FRIC
A P
ROGR
ESS
& IM
PACT
SER
IES
28
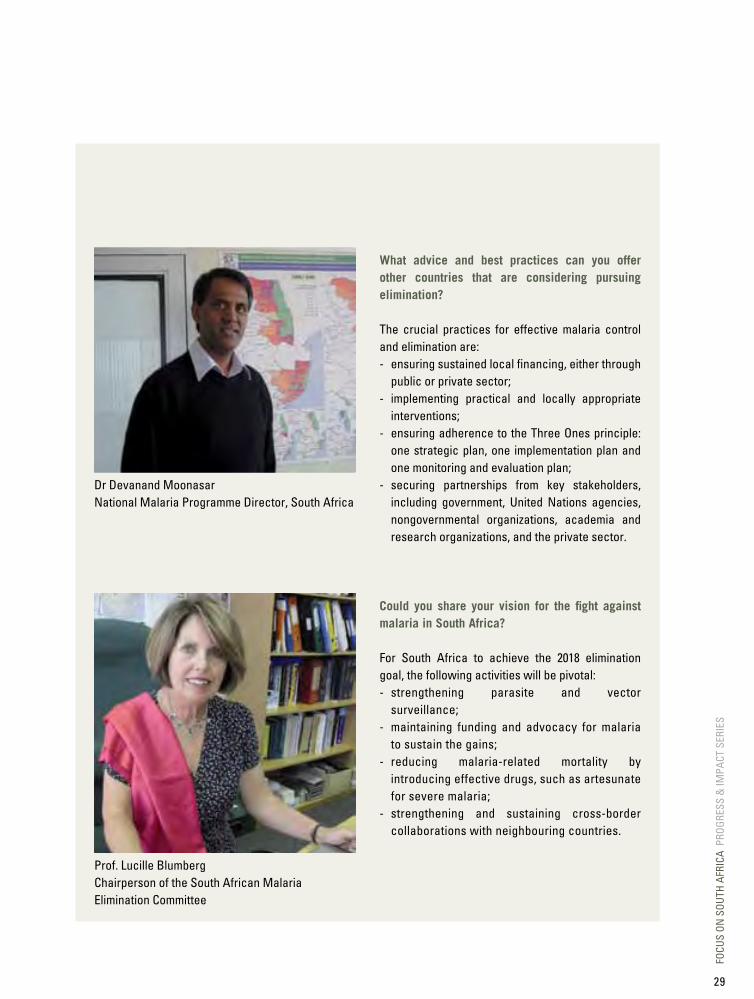
Dr Devanand Moonasar National Malaria Programme Director, South Africa
Prof. Lucille Blumberg Chairperson of the South African Malaria Elimination Committee
What advice and best practices can you offer other countries that are considering pursuing elimination?
The crucial practices for effective malaria control and elimination are: - ensuring sustained local financing, either through
public or private sector; - implementing practical and locally appropriate
interventions; - ensuring adherence to the Three Ones principle:
one strategic plan, one implementation plan and one monitoring and evaluation plan;
- securing partnerships from key stakeholders, including government, United Nations agencies, nongovernmental organizations, academia and research organizations, and the private sector.
Could you share your vision for the fight against malaria in South Africa?
For South Africa to achieve the 2018 elimination goal, the following activities will be pivotal: - strengthening parasite and vector
surveillance; - maintaining funding and advocacy for malaria
to sustain the gains; - reducing malaria-related mortality by
introducing effective drugs, such as artesunate for severe malaria;
- strengthening and sustaining cross-border collaborations with neighbouring countries.
FOCU
S ON
SOU
TH A
FRIC
A P
ROGR
ESS
& IM
PACT
SER
IES
29

FOCU
S ON
SOU
TH A
FRIC
A P
ROGR
ESS
& IM
PACT
SER
IES
30
CHAPTER III
GEARING uP A NATIONAl MAlARIA CONTROl PROGRAMME FOR ElIMINATIONThe decision for South Africa to embark on a malaria elimination programme was made in 2007, following the significant reduction in malaria cases and deaths. The African Union and the Southern African Development Community also declared that countries such as South Africa, Namibia, Swaziland and Botswana should eliminate malaria. Subsequently, an intensive in-country consultative process, involving malaria experts, programme staff and policy-makers, began to prepare for that goal.
The South African Malaria Policy was developed in 2007 and is periodically updated in keeping with WHO recommendations. A comprehensive malaria programme review was conducted in August–September 2009 to review the malaria policies, epidemiology and programme delivery systems and challenges, and to define the next steps to improve performance in line with elimination. This exercise was the precursor for developing the National Malaria Elimination Strategy that was finalized in 2011.
The following plans and guidelines have been developed to assist malaria programmes implement the policy and strategies:
• National Malaria Prevention Guidelines• Integrated Vector Control Guidelines• National Malaria Treatment Guidelines• Communication Strategy for Malaria Elimination
(2011)• National Monitoring and Evaluation Plan (2011)• Quality Control and Quality Assurance Guidelines
(2011)• National Malaria Surveillance Guideline (2012).
a. Management and planning
South Africa’s National Malaria Control Programme at a glance
• South Africa has a decentralized malaria control programme, with the National Malaria Control Programme at the National Department of Health defining policies and guidelines, and providing technical support to provinces.
• Strategies are implemented at the provincial level, where a dedicated budget for activities is provided through the national treasury.
• South Africa played a key role in initiating cross-border malaria initiatives, such as the LSDI by signing a trilateral agreement with heads of states from Mozambique and Swaziland. This was one of the key contributors to significantly reducing malaria morbidity and mortality in the following years.
FOCU
S ON
SOU
TH A
FRIC
A P
ROGR
ESS
& IM
PACT
SER
IES
31

| GEARING UP A NATIONAL MALARIA CONTROL PROGRAMME FOR ELIMINATION |
The National Malaria Control Programme (NMCP) is housed within the Malaria Directorate in the Communicable Diseases Cluster and the Primary HealthCare Programmes Branch. In 2008, the Communicable Diseases Cluster was established at the National Department of Health (NDOH). It includes the Malaria Directorate and the Communicable Disease Control Directorate. The NMCP focuses mainly on strategic issues, namely planning and monitoring as well as resource mobilization, whereas the implementation of the various programme activities is undertaken at provincial level.
There are three endemic provinces that have provincial malaria control programmes: KwaZulu-Natal, Mpumalanga and Limpopo. Large components of the malaria control programme at provincial level operate as a vertical programme (IRS, surveillance and health promotion), whereas case management is integrated into the primary health care system.
Malaria control within the national development agenda
South Africa has consistently adopted policies and treaties/declarations aimed at reducing the malaria burden in the country. In the context of the health system and the national development agenda, the Millennium Development Goals play a key role in setting the standards of achievement for the various targets, particularly those that are health-related. The NDOH, together with provinces, prioritized 18 districts in the country based on their poor health status, health service delivery and poor access to health services. Malaria is included in the poverty reduction plan. The Malaria Directorate aligns its activities with the Department’s Medium Term Strategic Framework and the 10-Point Plan, and more recently the National Service Delivery Agreement (a performance agreement signed by the national Minister of Health). Three malarious districts, Ehlanzeni, Umkhayakhude and Mopani, are among the 18 priority districts receiving special attention and support to address lagging health indicators. Progress on malaria control in these districts is monitored and reported in the quarterly strategic plan reports.
Figure 9Goal and objectives of South Africa’s 2012–2018 malaria elimination strategy
GOAL: TO ACHIEvE ZERO LOCAL MALARIA TRANSMISSION IN SOUTH AFRICA BY 2018
Objectives
Strengthen passive and active surveillance and monitoring and evaluation systems so that 100% of districts report promptly and routinely on key malaria indicators by 2015.
Ensure that all levels of the malaria programme have sufficient capacity to coordinate and implement malaria interventions by 2016.
Ensure 100% of the population has adequate knowledge, attitudes and practices on malaria by 2018 through appropriate IEC, social mobilization and advocacy.
Prevent malaria infections effectively and eliminate all parasite reservoirs in South Africa by 2018.
FOCU
S ON
SOU
TH A
FRIC
A P
ROGR
ESS
& IM
PACT
SER
IES
32
District epidemiological milestones towards malaria elimination
The following milestones were set for the malaria-endemic districts (9 of 19 districts are malaria-endemic in the Limpopo, Mpumalanga and KwaZulu-Natal provinces):
• by 2014, five districts (Capricorn, Sekhukhune, Waterberg, Zululand and Uthungulu) with <0.1 local case per 1000 population at risk will reach zero local cases;
• by 2016, an additional two districts (Umkhanyakude and Ehlanzeni) will reach zero local cases;
• by 2018, the final two districts (vhembe and Mopani) will reach zero local cases.
Key malaria control stakeholders in South Africa
To strengthen the implementation capacity of the malaria control programmes, several stakeholders are involved: governmental departments, nongovernmental organizations, research and academic institutions, United Nations agencies and the private sector. Stakeholders engage with the national malaria programme through several forums: annual planning meetings, technical
workshops and monitoring and evaluation meetings.
South African Malaria Elimination Committee
The malaria programme in South Africa has met some of the incidence targets necessary to engage in the elimination stage of the disease (<1 case per 1000 population at risk in all endemic districts) but still needs to improve case investigation and surveillance. The programme is, therefore, strengthened towards elimination under the guidance of the South African Malaria Elimination Committee (SAMEC, formally the National Malaria Advisory Group). Established in 2012 to guide the malaria elimination efforts of the National Malaria Programme, SAMEC is an important committee of technical experts and other relevant stakeholders. It replaced the former National Malaria Advisory Group established in 1994. SAMEC is divided into two subcommittees, one focusing on case management, surveillance and health promotion, and the other on vector control.
FOCU
S ON
SOU
TH A
FRIC
A P
ROGR
ESS
& IM
PACT
SER
IES
33
Box 3: Cross-border partnershipsSouth Africa has initiated three cross-border collaborations: the Lubombo Spatial Development Initiative (LSDI), the Trans-Limpopo Malaria
Initiative (TLMI) and the MOZIZA Initiative, which are described in the following sections.
lubombo Spatial development Initiative (lSdI)
LSDI started in 1999 as a large-scale project and was initiated in northern KwaZulu-Natal, Mpumalanga, southern Mozambique and Swaziland.
• In July 1999, the respective presidents of South Africa and Mozambique, T Mbeki and J Chissano, and His Majesty, King Mswati III of Swaziland, signed the General Protocol, which put in place a platform for regional cooperation and delivery.
• In October 1999, the Lubombo Malaria Protocol and tri-national malaria programme was launched.
• The LSDI is a partnership between the malaria control programmes of South Africa, Swaziland and Mozambique, and the South African MRC.
• The LSDI aims to accelerate development, particularly in tourism, within an area of approximately 100 000 square kilometres.
LSDI objectives
• Reduce malaria incidence in the border areas of South Africa and Swaziland from 250 per 1000 to less than 20 per 1000.
• Decrease malaria infections from 625 per 1000 to fewer than 200 per 1000 within three years after the start of IRS activities in Maputo Province.
• Provide updated tourist information and booklets containing definitive malaria risk maps and prophylaxis guidelines.
• Develop a regional malaria control programme.
• Develop a regional geographic information system (GIS)-based malaria information system.
• Implement parasitologically confirmed diagnosis of malaria and effective treatment.
LSDI progress
• Almost US$ 80 million has been raised for implementing the control programme in the LSDI, most notably in Mozambique.
• Malaria incidence has declined in South Africa (KwaZulu-Natal and Mpumalanga provinces) and in Swaziland (Lubombo) by 99% compared with the 2000 baseline.
| GEARING UP A NATIONAL MALARIA CONTROL PROGRAMME FOR ELIMINATION |
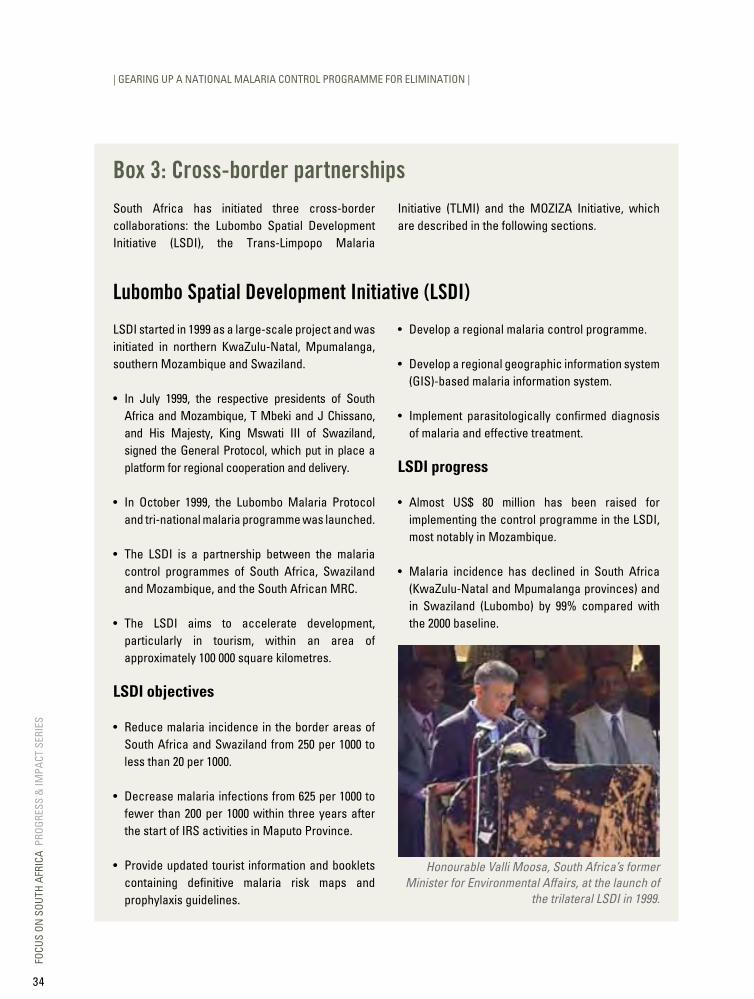
Honourable Valli Moosa, South Africa’s former Minister for Environmental Affairs, at the launch of
the trilateral LSDI in 1999.
FOCU
S ON
SOU
TH A
FRIC
A P
ROGR
ESS
& IM
PACT
SER
IES
34

• In KwaZulu-Natal and Mpumalanga, malaria incidence respectively decreased by 99% (from about 42 400 to 550 cases) and 72% (from about 12 000 to 3350 cases) between 1999/2000 and 2010/2011.
• The prevalence of the disease had decreased by 92% in southern Mozambique up to 2009.
• This model has proven to be successful in malaria control and been the model for other initiatives, such as the Trans-Zambezi Malaria Initiative (TZMI) involving Angola, Botswana, Namibia, Zambia and Zimbabwe, and the Trans-Kunene Malaria Initiative (TKMI) with Angola and Namibia.
• Unfortunately, funding for the LSDI dried up, although many malaria control stakeholders in South Africa remain hopeful it can be revived.
MOZAMBIQUELIMPOPO
MPUMALANGA
KWAZULU-NATAL
GAZA
MAPUTO
SWAZILAND
Mopani
Ehlanzeni
Vhembe
Zululand
Uthungulu
Umkhanyakude
Zone 1
Zone 3
Zone 2Manhica
Zone 2A
Zone 1AMatola City
Zone 7
Zone 4
Zone 6
Zone 5
Lubombo Indian Ocean
Incidence per1000 population at risk
Prevalence
≤ 5%0–12–56–2526–100101–144Reserve
> 5% to 20%>20% to 40%>40% to 60%>60% to 80%>80%
Baseline survey years for Mozambique vary as follows:Gaza: 2004–2007; Maputo: 1999–2003
BASELINE (1999/2000) 2010/20110 110 22055 km
SOUTH AFRICA
MOZAMBIQUELIMPOPO
MPUMALANGA
KWAZULU-NATAL
GAZA
MAPUTO
SWAZILAND
Mopani
Ehlanzeni
Vhembe
Zululand
Uthungulu
Umkhanyakude
Zone 1
Zone 3
Zone 2Manhica
Zone 2A
Zone 1AMatola City
Zone 7
Zone 4
Zone 6
Zone 5
Lubombo Indian Ocean
SOUTH AFRICA
Figure 10lSdI intervention districts and outcomesThe LSDI produced big strides in reducing malaria cases in Swaziland and Mozambique. It also had a remarkable impact in KwaZulu-Natal, where cases dropped by 99% between 1999/2000 and 2010/2011 to less than 1 case per 1000 population at risk in all districts and municipalities from this province.
Map production: Malaria Research Unit, South African MRC (Durban).
Source: LSDI, Annual Report, 2012.
FOCU
S ON
SOU
TH A
FRIC
A P
ROGR
ESS
& IM
PACT
SER
IES
35
| GEARING UP A NATIONAL MALARIA CONTROL PROGRAMME FOR ELIMINATION |
Trans-limpopo Malaria Initiative (TlMI)
The TLMI was started in 2001 as part of the border Trans-Limpopo Spatial Development Initiative (TLSDI) and targeted Matabeleland South Province (Beitbridge, Mangwe, Bulilima and Gwanda districts) in Zimbabwe, and Limpopo (Vhembe district) in South Africa. Initially created as an information-sharing platform, this collaboration aims to reduce malaria transmission on the borders along the Limpopo River.
Zimbabwe and South Africa have invested their own resources in malaria control within the TLMI area. However, a lack of human and financial resources has hampered efforts to fully implement the initiative, while unforeseen malaria epidemics and highly mobile populations across the borders have also provided challenges. The initiative gained momentum on the back of LSDI successes and has strong political backing from former and current ministers of health.
Key facts
• Three districts/municipalities involved: Beitbridge in Zimbabwe, and Musina and Mutale in South Africa.
• Population at risk in the three districts is 276 000.
• Anopheles arabiensis is the major vector with P. falciparum the major parasite species.
• In 2009, malaria incidence in the Trans-Limpopo region ranged from 2.01–5/1000 population at risk in Musina municipality in the Limpopo province of South Africa to 10.01–45/1000 population at risk in the Beitbridge district of Zimbabwe.
Rationale for the TLMI
• Increased cross-border movement of malaria-affected populations.
• Inadequate harmonization (disease management and treatment guidelines) and coordination (e.g. cross-border referrals and continuity of care).
• Inadequate disease surveillance and epidemic preparedness plans can lead to public health risks and events.
• On top of existing language barriers, there is inadequate information and education of mobile populations/locals affected by malaria.
• Limited communication between malaria control programmes/cross-border districts.
TLMI objectives
• Harmonize malaria control strategies (namely on vector control and case management) on either side of the border to make sure WHO-approved evidence-based interventions are optimally implemented.
• Increase the scale and impact of vector control efforts so that 95% of people in the Trans-Limpopo areas are protected by IRS by 2015.
• Develop and maintain a surveillance system for both malaria parasitology and entomology.
• By 2014, ensure microscopy or RDT testing of all suspected malaria cases presenting at health facilities, and appropriate treatment of all confirmed cases within 24 hours of onset of symptoms.
FOCU
S ON
SOU
TH A
FRIC
A P
ROGR
ESS
& IM
PACT
SER
IES
36
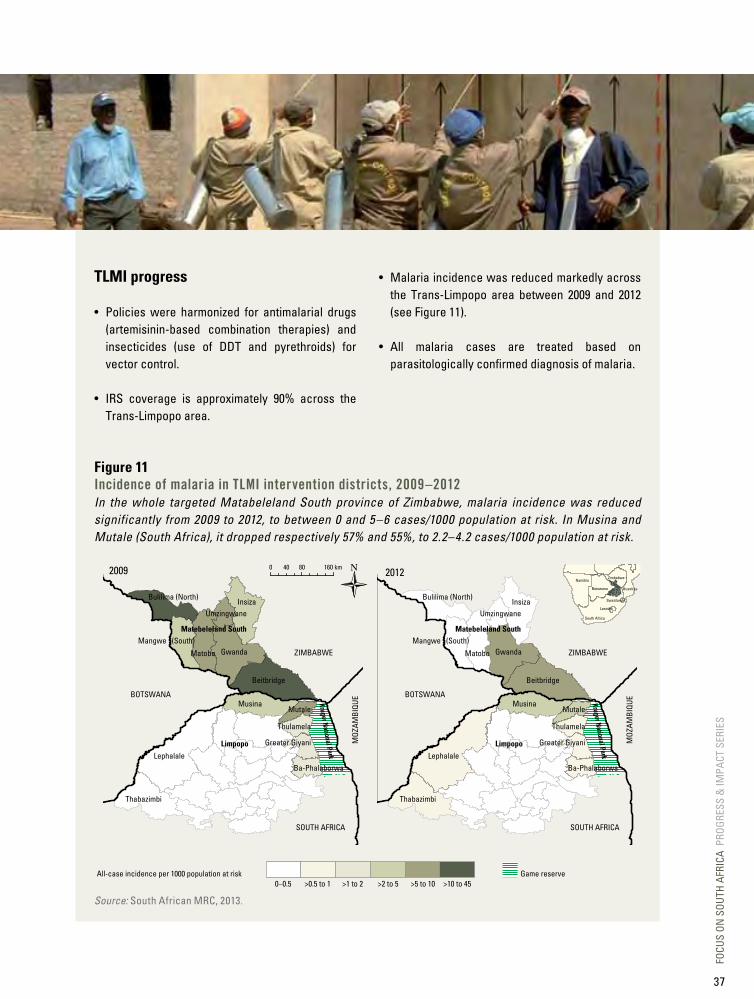
TLMI progress
• Policies were harmonized for antimalarial drugs (artemisinin-based combination therapies) and insecticides (use of DDT and pyrethroids) for vector control.
• IRS coverage is approximately 90% across the Trans-Limpopo area.
• Malaria incidence was reduced markedly across the Trans-Limpopo area between 2009 and 2012 (see Figure 11).
• All malaria cases are treated based on parasitologically confirmed diagnosis of malaria.
Figure 11Incidence of malaria in TlMI intervention districts, 2009–2012In the whole targeted Matabeleland South province of Zimbabwe, malaria incidence was reduced significantly from 2009 to 2012, to between 0 and 5–6 cases/1000 population at risk. In Musina and Mutale (South Africa), it dropped respectively 57% and 55%, to 2.2–4.2 cases/1000 population at risk.
Source: South African MRC, 2013.
Namibia
South Africa
Lesotho
Swaziland
Mozambique
Zimbabwe
Botswana
2009 20120 80 160 km40
Game reserveAll-case incidence per 1000 population at risk0–0.5 >0.5 to 1 >1 to 2 >2 to 5 >5 to 10 >10 to 45
BOTSWANA
SOUTH AFRICA
MOZ
AMBI
QUE
ZIMBABWE
Lephalale
Musina
Thabazimbi
Mutale
Thulamela
Greater Giyani
Ba-Phalaborwa
Kruger National Park
Kruger National Park
Insiza
Gwanda
Beitbridge
Matobo
Bulilima (North)
Mangwe (South)
Umzingwane
Matebeleland South
Limpopo
BOTSWANA
SOUTH AFRICA
MOZ
AMBI
QUE
ZIMBABWE
Lephalale
Musina
Thabazimbi
Mutale
Thulamela
Greater Giyani
Ba-Phalaborwa
Insiza
Gwanda
Beitbridge
Matobo
Bulilima (North)
Mangwe (South)
Umzingwane
Matebeleland South
Limpopo
FOCU
S ON
SOU
TH A
FRIC
A P
ROGR
ESS
& IM
PACT
SER
IES
37

| GEARING UP A NATIONAL MALARIA CONTROL PROGRAMME FOR ELIMINATION |
MOZIZA Initiative
The MOZIZA Initiative was established in 2010 to include parts of northern Mozambique and some districts from southern Zimbabwe that were part of the TLMI, as well as some additional districts. It is a malaria-control collaboration between Mozambique, Zimbabwe and South Africa that aims to reduce malaria transmission in the targeted region (2.3 million people at risk in 9 districts). The incidence of malaria in Vhembe district (South Africa) was approximately 1.69/1000 population at risk compared with 335– 395/1000 population at risk in parts of northern Mozambique and south-eastern Zimbabwe (see Figure 12).
Rationale for MOZIZA
• Porous borders pose a threat to containing and reducing transmission.
• Uncoordinated malaria control interventions increase the risk of resistance and wastage of financial resources.
• Limited partnership and knowledge-sharing between countries.
• Poor regional service delivery and resource allocation.
MOZIZA objectives
• Reduce the number of malaria cases by at least 50% in MOZIZA-targeted districts within five years (by 2016) by: - harmonizing cross-border malaria service
delivery among border districts, provinces and nations, through effective joint management and coordination;
- strengthening regional malaria surveillance and information systems to respond to malaria cases in an appropriate and timely manner;
- improving knowledge and practices of migrant populations, travellers and border communities to prevent and control malaria.
MOZIZA progress
Lack of funding is a major impediment for the MOZIZA initiative; attempts to secure financing from the Global Fund to Fight AIDS, Tuberculosis and Malaria have been unsuccessful.
Despite this funding shortfall, it is worth noting that in South Africa’s targeted area of MOZIZA (vhembe district, composed of four local municipalities, including Mutale and Musina, which benefit from the TLMI), malaria incidence fell by 72%, from 1.69/1000 population at risk to 0.47/1000 between 2009 and 2013.
FOCU
S ON
SOU
TH A
FRIC
A P
ROGR
ESS
& IM
PACT
SER
IES
38
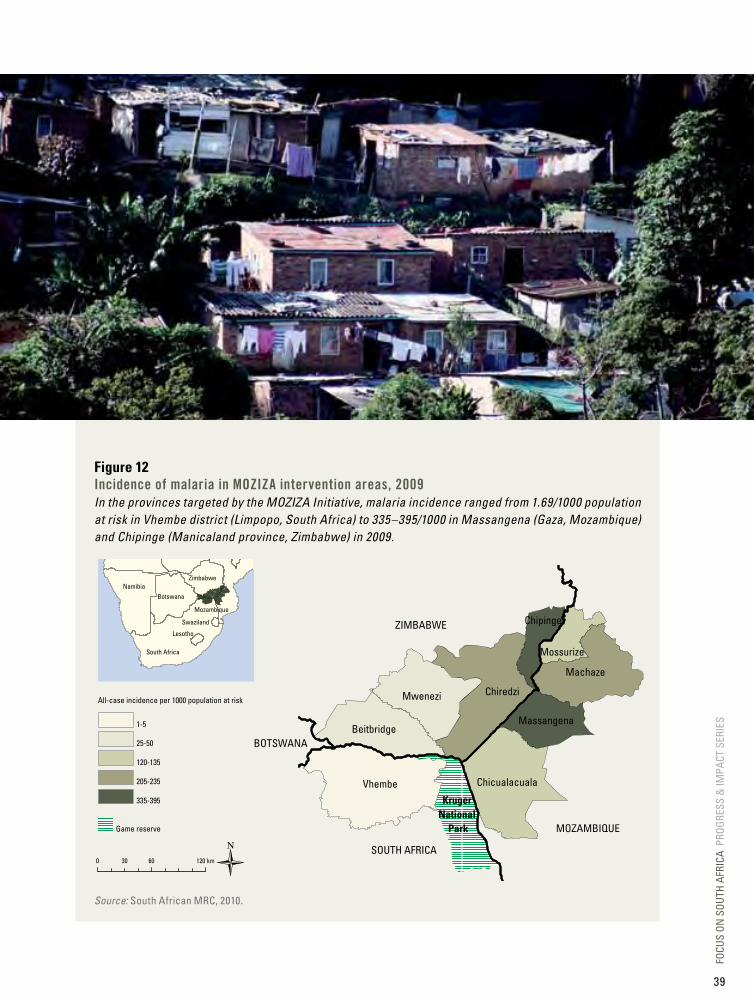
Figure 12Incidence of malaria in MOZIZA intervention areas, 2009In the provinces targeted by the MOZIZA Initiative, malaria incidence ranged from 1.69/1000 population at risk in Vhembe district (Limpopo, South Africa) to 335–395/1000 in Massangena (Gaza, Mozambique) and Chipinge (Manicaland province, Zimbabwe) in 2009.
Source: South African MRC, 2010.
Kruger National
Park
Namibia
South Africa
Lesotho
Swaziland
Mozambique
Zimbabwe
Botswana
0 60 120 km30
Game reserve
All-case incidence per 1000 population at risk
1-5
25-50
120-135
205-235
335-395
BOTSWANA
MOZAMBIQUE
ZIMBABWE
SOUTH AFRICA
Vhembe
Chiredzi
Machaze
Mwenezi
Chicualacuala
BeitbridgeMassangena
Chipinge
Mossurize
FOCU
S ON
SOU
TH A
FRIC
A P
ROGR
ESS
& IM
PACT
SER
IES
39

| GEARING UP A NATIONAL MALARIA CONTROL PROGRAMME FOR ELIMINATION |
b. Securing appropriate funding
Funding for malaria elimination in South Africa at a glance
• Funding for malaria control programmes in South Africa has been solely through governmental sources, with limited support from partners for workshops, reviews and technical assistance.
• The national budget for malaria control increased significantly between 2007 and 2008, reaching an average of US$ 25 million annually between 2009 and 2012.
• A malaria elimination plan was developed focusing on the key intervention areas, but there is a gap to fully fund elimination strategies around vector control, surveillance and health promotion.
• Innovative funding mechanisms are required to close the financial gap for malaria elimination, either through a governmental intersectoral approach for interventions such as surveillance, case management and health promotion, or for securing local funding from private sector partners and funding agencies.
South Africa has been able to adopt and implement policies that are evidence based and practical. The malaria control programme has also been able to support and sustain malaria control interventions for more than 70 years from its own resources, and today, like other countries targeting malaria elimination, South Africa cannot rely on external funding to align with the 2012–2018 elimination strategy.
In the past, the malaria programme in South Africa also showed its capacity to mobilize financial resources at short notice, as evidenced by the 1999/2000 malaria season when US$ 5.7 million was mobilized to support malaria outbreak efforts
in Limpopo, Mpumalanga and KwaZulu-Natal provinces.
As shown in Figure 13, domestic funding rose significantly from 2007 to 2008, stabilizing at an average of US$ 25 million annually between 2009 and 2012. A gap analysis in 2011 highlighted that the national budget for malaria control needs to be increased in order to achieve the goal of elimination. Reaching zero local malaria cases will require increased financial resources, and significant human and financial resources will need to be sustained after elimination is achieved to prevent the reintroduction of malaria to South Africa.
FOCU
S ON
SOU
TH A
FRIC
A P
ROGR
ESS
& IM
PACT
SER
IES
40

Figure 13domestic and external funding for malaria control and elimination, South Africa, 2007–2012Domestic funding for malaria control increased by about 40% between 2007 and 2008 and has hovered at about US$ 25 million since then, with a slight drop in 2012.
Government Others
0
5
10
15
20
25
30
2007 2008 2009 2010 2011 2012
Year
US$ (in millions)
Note: Other bilaterals providing funding are WHO and nongovernmental organizations.
Source: World Malaria Report 2012 and NDOH, 2013.
The malaria control programme in South Africa has drafted and costed its malaria elimination plan. The total cost for the programme is estimated
at US$ 305 million for the 2012–2018 period, the three malaria-endemic regions representing 94% of the national malaria budget.
FOCU
S ON
SOU
TH A
FRIC
A P
ROGR
ESS
& IM
PACT
SER
IES
41
| GEARING UP A NATIONAL MALARIA CONTROL PROGRAMME FOR ELIMINATION |
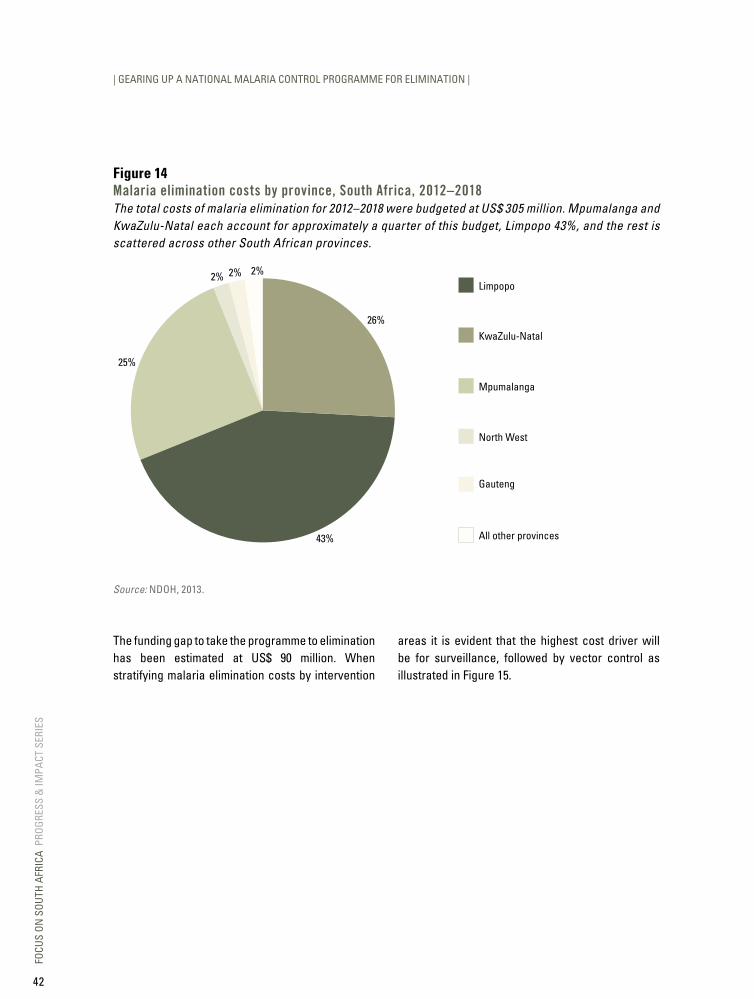
Figure 14Malaria elimination costs by province, South Africa, 2012–2018The total costs of malaria elimination for 2012–2018 were budgeted at US$ 305 million. Mpumalanga and KwaZulu-Natal each account for approximately a quarter of this budget, Limpopo 43%, and the rest is scattered across other South African provinces.
All other provinces
KwaZulu-Natal
Limpopo
Mpumalanga
North West
Gauteng
25%
2% 2% 2%
26%
43%
Source: NDOH, 2013.
The funding gap to take the programme to elimination has been estimated at US$ 90 million. When stratifying malaria elimination costs by intervention
areas it is evident that the highest cost driver will be for surveillance, followed by vector control as illustrated in Figure 15.
FOCU
S ON
SOU
TH A
FRIC
A P
ROGR
ESS
& IM
PACT
SER
IES
42
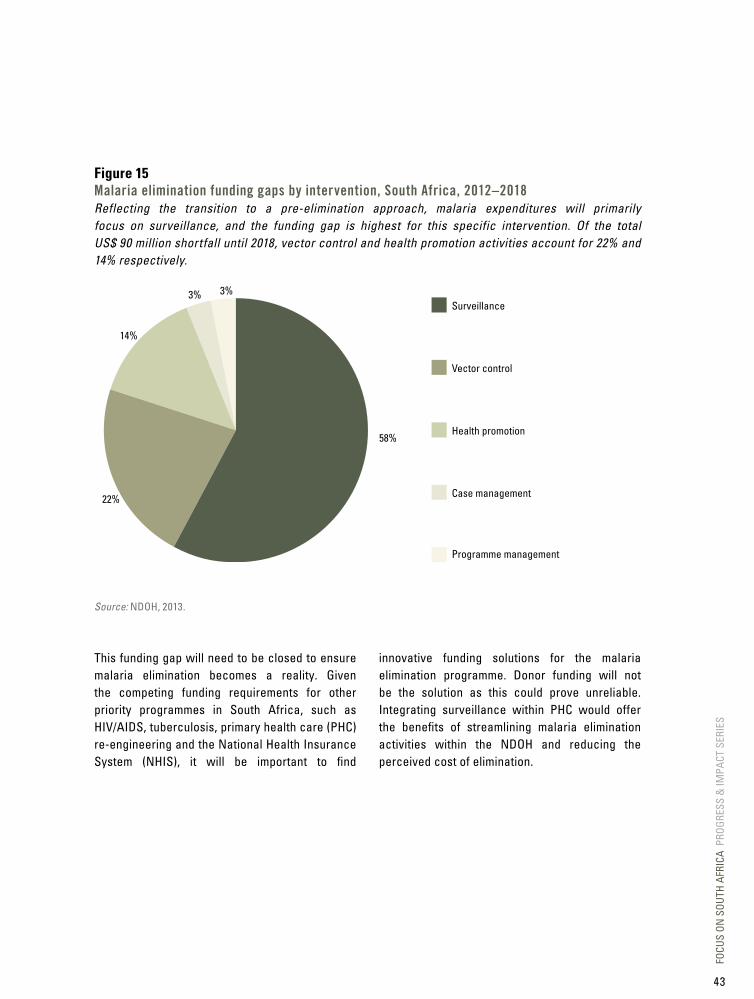
Figure 15Malaria elimination funding gaps by intervention, South Africa, 2012–2018Reflecting the transition to a pre-elimination approach, malaria expenditures will primarily focus on surveillance, and the funding gap is highest for this specific intervention. Of the total US$ 90 million shortfall until 2018, vector control and health promotion activities account for 22% and 14% respectively.
Vector control
Surveillance
Health promotion
Case management
Programme management
14%
3% 3%
58%
22%
Source: NDOH, 2013.
This funding gap will need to be closed to ensure malaria elimination becomes a reality. Given the competing funding requirements for other priority programmes in South Africa, such as HIV/AIDS, tuberculosis, primary health care (PHC) re-engineering and the National Health Insurance System (NHIS), it will be important to find
innovative funding solutions for the malaria elimination programme. Donor funding will not be the solution as this could prove unreliable. Integrating surveillance within PHC would offer the benefits of streamlining malaria elimination activities within the NDOH and reducing the perceived cost of elimination.
FOCU
S ON
SOU
TH A
FRIC
A P
ROGR
ESS
& IM
PACT
SER
IES
43
| GEARING UP A NATIONAL MALARIA CONTROL PROGRAMME FOR ELIMINATION |
c. Intervention strategies
Intervention strategies at a glance
• Elimination interventions include integrated vector management (IRS and larviciding), case management, surveillance and health promotion.
• IRS coverage of targeted structures was 88% on average in malaria-endemic provinces between 2000 and 2012, with about 1.8 million structures sprayed in 2012/2013.
• From 2000, all suspected malaria cases have been diagnosed using microscopy and/or RDTs. In 2011, 61% and 39% of malaria cases were respectively confirmed by microscopy and RDT.
• All positive cases are treated within 24 hours, and treatment is only prescribed once cases are confirmed (not presumptively).
• More than 7700 spray operators were trained between 2005 and 2012; an average of 500 doctors and nurses are trained each year in managing severe malaria; and regular training sessions in malaria case management are organized for health-care workers.
• Health promotion plays an important role during the annual SADC malaria events, as well as during the spraying and active surveillance sessions conducted in various communities.
FOCU
S ON
SOU
TH A
FRIC
A P
ROGR
ESS
& IM
PACT
SER
IES
44
In 2000, the South African Malaria Control Programme reintroduced DDT for malaria vector control (after curbing its use in 1996) due to the resistance of existing insecticides (pyrethroids). The use of DDT has become more judicious in recent years, with targeted spraying only in high-risk areas of the malaria-endemic provinces. In endemic areas, IRS information has been computerized, down to the district level.
Integrated vector management (IVM)
Vector control has played a major role in reducing Anopheles funestus populations. Apart from IRS, which is the mainstay of South Africa’s vector control programme, other IVM interventions include larviciding, insecticide resistance management such as rotating different classes of insecticides, annual training of spray operators, collaboration with other departments such as the Department of Environmental Affairs and the Department of Agriculture, Forestry and Fisheries (especially in the implementation of the Stockholm Convention, aiming at eliminating or restricting the production and use of persistent organic pollutants), and advocacy for IVM interventions by the health promotion units of the Department of Health.
Larviciding activities have been carried out in the three endemic provinces as the vector control teams come across breeding sites during active surveillance. Mpumalanga recently introduced systematic winter larviciding, which was conducted on 547 breeding sites during the 2011/2012 malaria
season, with a corresponding 39% reduction of local malaria cases in the Nkomazi municipality. During the year 2012/2013 the province managed to identify and treat approximately 3700 permanent and 2600 temporary breeding sites. To achieve the elimination goal of effectively preventing local malaria infection, one of the indicators in the malaria monitoring and evaluation plan requires that permanent and potential breeding sites be identified and treated. Other types of larval source management such as habitat manipulation are encouraged through health promotion messages to members of the community in endemic areas.
IRS coverage
South Africa has maintained a high IRS operational coverage over the past 13 years, with an average of 88% between 2000 and 2012, well above the WHO recommended minimum coverage of 80%. The IRS coverage represents the number of targeted structures that have been sprayed in the endemic provinces. There is also limited spraying taking place in North West province, which previously reported local malaria cases. Every year an average of 335 spray operators are engaged in IRS in the endemic provinces. These include permanent and temporary spray operators who are trained in the safe use of insecticides at the beginning of each spray season. The IRS campaigns take place in all the localities earmarked for spraying, between September and March each year.
FOCU
S ON
SOU
TH A
FRIC
A P
ROGR
ESS
& IM
PACT
SER
IES
45
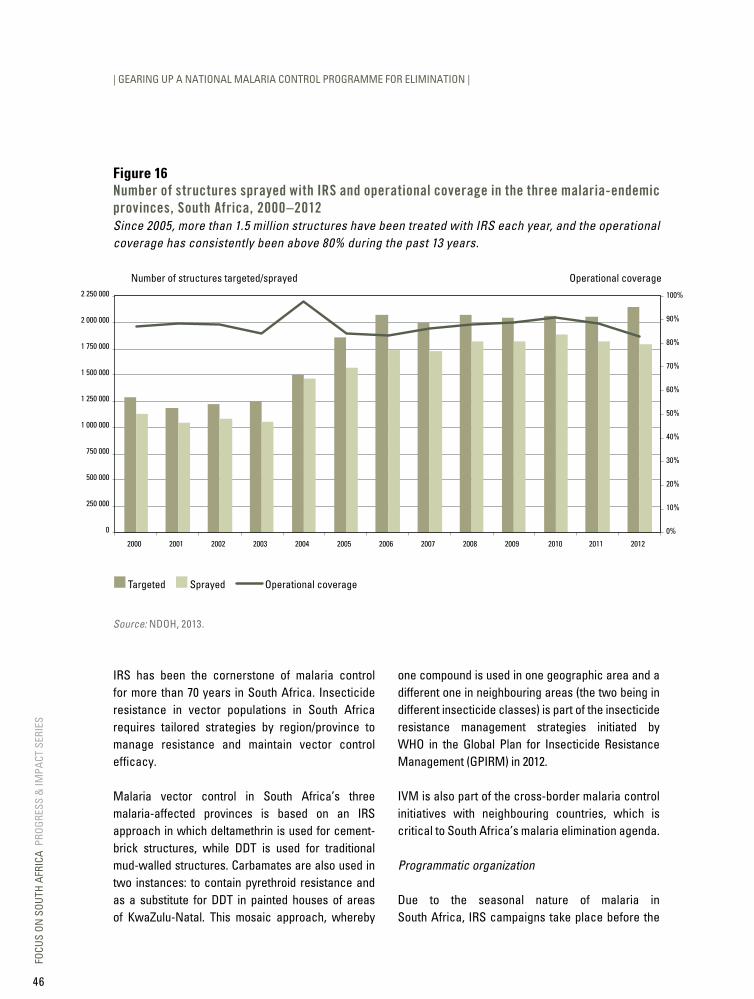
| GEARING UP A NATIONAL MALARIA CONTROL PROGRAMME FOR ELIMINATION |
Figure 16Number of structures sprayed with IRS and operational coverage in the three malaria-endemic provinces, South Africa, 2000–2012Since 2005, more than 1.5 million structures have been treated with IRS each year, and the operational coverage has consistently been above 80% during the past 13 years.
Number of structures targeted/sprayed
0%
10%
20%
30%
40%
50%
60%
70%
80%
90%
100%
0
250 000
500 000
750 000
1 000 000
1 250 000
1 500 000
1 750 000
2 000 000
2 250 000
2000 2001 2002 2003 2004 2005 2006 2007 2008 2009 2010 2011 2012
Operational coverage
Targeted Sprayed Operational coverage
Source: NDOH, 2013.
IRS has been the cornerstone of malaria control for more than 70 years in South Africa. Insecticide resistance in vector populations in South Africa requires tailored strategies by region/province to manage resistance and maintain vector control efficacy.
Malaria vector control in South Africa’s three malaria-affected provinces is based on an IRS approach in which deltamethrin is used for cement-brick structures, while DDT is used for traditional mud-walled structures. Carbamates are also used in two instances: to contain pyrethroid resistance and as a substitute for DDT in painted houses of areas of KwaZulu-Natal. This mosaic approach, whereby
one compound is used in one geographic area and a different one in neighbouring areas (the two being in different insecticide classes) is part of the insecticide resistance management strategies initiated by WHO in the Global Plan for Insecticide Resistance Management (GPIRM) in 2012.
IVM is also part of the cross-border malaria control initiatives with neighbouring countries, which is critical to South Africa’s malaria elimination agenda.
Programmatic organization
Due to the seasonal nature of malaria in South Africa, IRS campaigns take place before the
FOCU
S ON
SOU
TH A
FRIC
A P
ROGR
ESS
& IM
PACT
SER
IES
46

main transmission season, commonly before the end of December. The majority of spray operators are employed as temporary workers; training, on the correct application of insecticides, safe handling and waste disposal, takes place annually. More than 7700 spray operators were trained between 2005 and 2012.
Record-keeping systems are also in place for IRS activities. These consist of ‘hutcards’ completed at each sprayed dwelling that include pertinent information such as the date of spraying, insecticide used and spray operator’s details. This card remains with the householder for future monitoring and record purposes. The daily performance of spray operators is also recorded, with spray data entered into electronic information systems.
Opportunities to improve IRS through better stratification of spraying activities are being explored. These include using GISs to monitor and record spray performance at household level, as well as linking IRS information to malaria case notifications within communities. They will help overcome current challenges, such as the growth of communities in endemic areas that exceeds the
capacity of the malaria spray teams, and the difficulty in achieving high IRS coverage in sophisticated dwellings or among households that do not accept DDT because of stains left on walls.
Entomological surveillance
Analysis and decision-making for IRS, particularly for insecticide resistance management, is not possible without skilled entomological support and there is a shortage of trained entomologists in the African continent, including in South Africa. There is a need for the national and provincial malaria control programmes to develop capacity within this field so that appropriate guidance and support can be provided to malaria vector control activities. The national and provincial programmes will have to consider how to best fill this competency and position gap, particularly in the light of malaria elimination. The National Department of Health needs to create career paths to make the study of entomology a more attractive proposition. Meanwhile, the malaria programme will need to work with its partners from research institutes such as the National Institute for Communicable Diseases to remedy the lack of trained entomology staff.
FOCU
S ON
SOU
TH A
FRIC
A P
ROGR
ESS
& IM
PACT
SER
IES
47
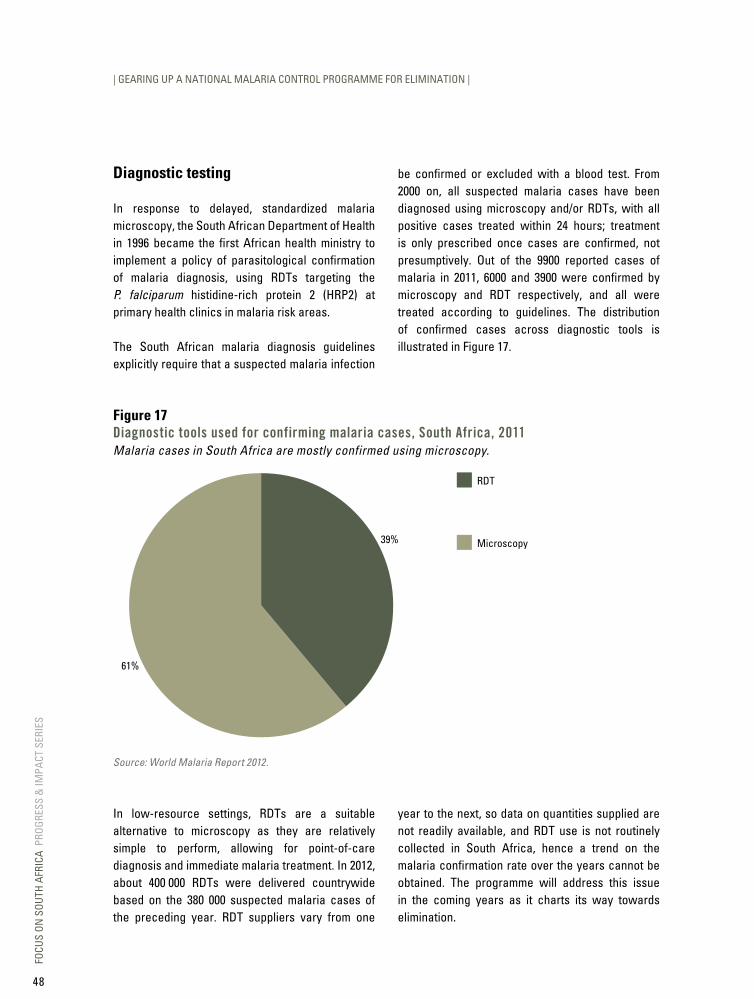
| GEARING UP A NATIONAL MALARIA CONTROL PROGRAMME FOR ELIMINATION |
Diagnostic testing
In response to delayed, standardized malaria microscopy, the South African Department of Health in 1996 became the first African health ministry to implement a policy of parasitological confirmation of malaria diagnosis, using RDTs targeting the P. falciparum histidine-rich protein 2 (HRP2) at primary health clinics in malaria risk areas.
The South African malaria diagnosis guidelines explicitly require that a suspected malaria infection
be confirmed or excluded with a blood test. From 2000 on, all suspected malaria cases have been diagnosed using microscopy and/or RDTs, with all positive cases treated within 24 hours; treatment is only prescribed once cases are confirmed, not presumptively. Out of the 9900 reported cases of malaria in 2011, 6000 and 3900 were confirmed by microscopy and RDT respectively, and all were treated according to guidelines. The distribution of confirmed cases across diagnostic tools is illustrated in Figure 17.
Figure 17diagnostic tools used for confirming malaria cases, South Africa, 2011Malaria cases in South Africa are mostly confirmed using microscopy.
Microscopy
RDT
39%
61%
Source: World Malaria Report 2012.
In low-resource settings, RDTs are a suitable alternative to microscopy as they are relatively simple to perform, allowing for point-of-care diagnosis and immediate malaria treatment. In 2012, about 400 000 RDTs were delivered countrywide based on the 380 000 suspected malaria cases of the preceding year. RDT suppliers vary from one
year to the next, so data on quantities supplied are not readily available, and RDT use is not routinely collected in South Africa, hence a trend on the malaria confirmation rate over the years cannot be obtained. The programme will address this issue in the coming years as it charts its way towards elimination.
FOCU
S ON
SOU
TH A
FRIC
A P
ROGR
ESS
& IM
PACT
SER
IES
48
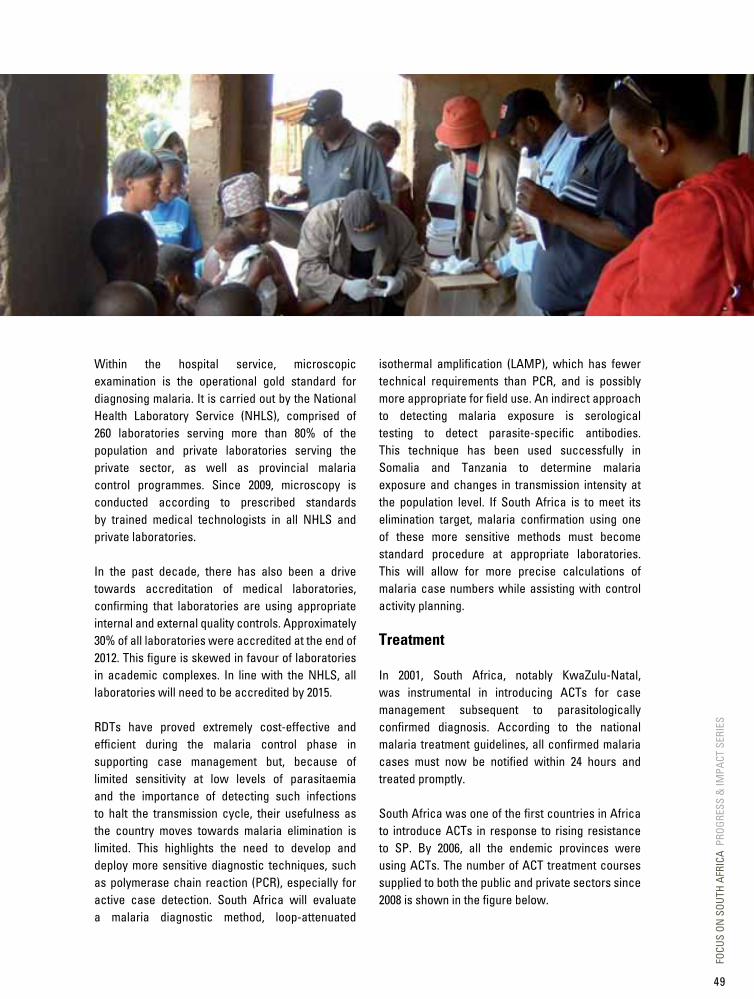
Within the hospital service, microscopic examination is the operational gold standard for diagnosing malaria. It is carried out by the National Health Laboratory Service (NHLS), comprised of 260 laboratories serving more than 80% of the population and private laboratories serving the private sector, as well as provincial malaria control programmes. Since 2009, microscopy is conducted according to prescribed standards by trained medical technologists in all NHLS and private laboratories.
In the past decade, there has also been a drive towards accreditation of medical laboratories, confirming that laboratories are using appropriate internal and external quality controls. Approximately 30% of all laboratories were accredited at the end of 2012. This figure is skewed in favour of laboratories in academic complexes. In line with the NHLS, all laboratories will need to be accredited by 2015.
RDTs have proved extremely cost-effective and efficient during the malaria control phase in supporting case management but, because of limited sensitivity at low levels of parasitaemia and the importance of detecting such infections to halt the transmission cycle, their usefulness as the country moves towards malaria elimination is limited. This highlights the need to develop and deploy more sensitive diagnostic techniques, such as polymerase chain reaction (PCR), especially for active case detection. South Africa will evaluate a malaria diagnostic method, loop-attenuated
isothermal amplification (LAMP), which has fewer technical requirements than PCR, and is possibly more appropriate for field use. An indirect approach to detecting malaria exposure is serological testing to detect parasite-specific antibodies. This technique has been used successfully in Somalia and Tanzania to determine malaria exposure and changes in transmission intensity at the population level. If South Africa is to meet its elimination target, malaria confirmation using one of these more sensitive methods must become standard procedure at appropriate laboratories. This will allow for more precise calculations of malaria case numbers while assisting with control activity planning.
Treatment
In 2001, South Africa, notably KwaZulu-Natal, was instrumental in introducing ACTs for case management subsequent to parasitologically confirmed diagnosis. According to the national malaria treatment guidelines, all confirmed malaria cases must now be notified within 24 hours and treated promptly.
South Africa was one of the first countries in Africa to introduce ACTs in response to rising resistance to SP. By 2006, all the endemic provinces were using ACTs. The number of ACT treatment courses supplied to both the public and private sectors since 2008 is shown in the figure below.
FOCU
S ON
SOU
TH A
FRIC
A P
ROGR
ESS
& IM
PACT
SER
IES
49

| GEARING UP A NATIONAL MALARIA CONTROL PROGRAMME FOR ELIMINATION |
Figure 18Number of ACT treatment courses delivered to the public and private sectors, South Africa, 2008–2012From 2008 to 2012, an average of 27 000 ACT treatment courses were distributed yearly to the public and private sectors in South Africa.
0
5000
10 000
15 000
20 000
25 000
30 000
35 000
40 000
2008 2009 2010 2011 2012
Year
Source: NDOH, 2013.
The national malaria treatment policy in South Africa advocates for treating all parasitologically confirmed malaria cases. In 2012, there were 6847 confirmed and treated malaria cases, while 27 000 ACT treatment courses were distributed. It will be important to gauge the total utilization of ACTs against those distributed as this will give a clear indication of inappropriate usage of the drug (under- or over-utilization). Currently the malaria control programme in South Africa does not routinely collect RDT and ACT utilization data as this function
lies with pharmaceutical units and obtaining the data is difficult. Anecdotally, malaria managers are confident there are seldom stock-outs of RDTs and ACTs, and that all confirmed malaria cases are treated with ACTs for uncomplicated malaria and with quinine for complicated malaria, especially in the endemic provinces. However for South Africa to track its delivery and usage of diagnostic tests and ACTs, it needs to ensure that this data is routinely collected. The programme will address this issue as it charts its way towards elimination.
FOCU
S ON
SOU
TH A
FRIC
A P
ROGR
ESS
& IM
PACT
SER
IES
50
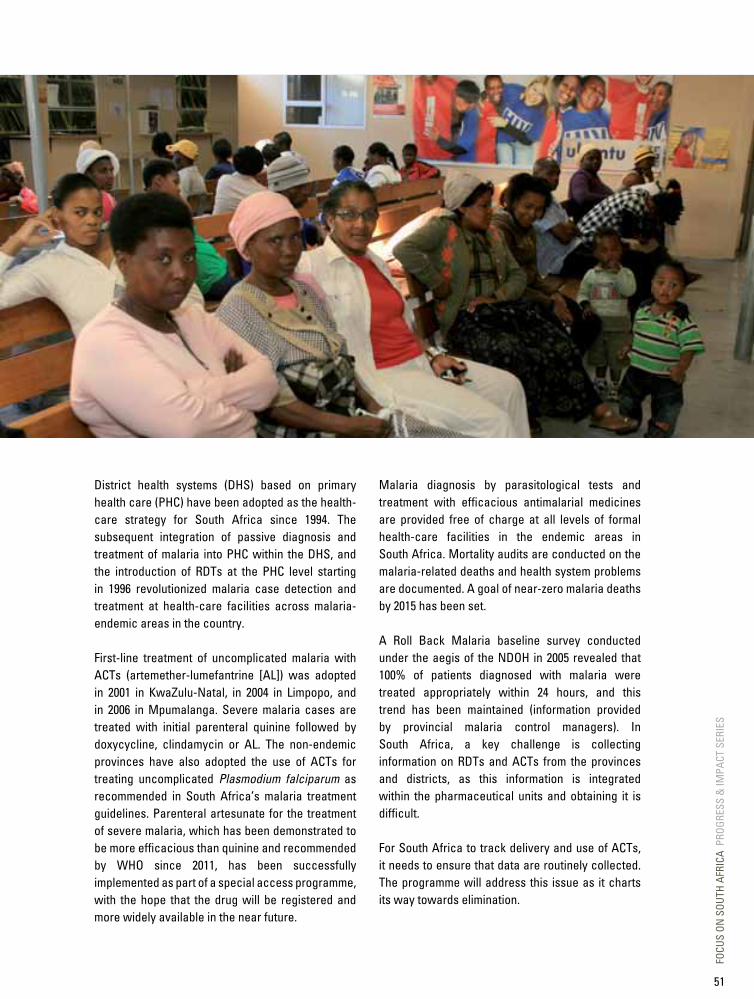
District health systems (DHS) based on primary health care (PHC) have been adopted as the health-care strategy for South Africa since 1994. The subsequent integration of passive diagnosis and treatment of malaria into PHC within the DHS, and the introduction of RDTs at the PHC level starting in 1996 revolutionized malaria case detection and treatment at health-care facilities across malaria-endemic areas in the country.
First-line treatment of uncomplicated malaria with ACTs (artemether-lumefantrine [AL]) was adopted in 2001 in KwaZulu-Natal, in 2004 in Limpopo, and in 2006 in Mpumalanga. Severe malaria cases are treated with initial parenteral quinine followed by doxycycline, clindamycin or AL. The non-endemic provinces have also adopted the use of ACTs for treating uncomplicated Plasmodium falciparum as recommended in South Africa’s malaria treatment guidelines. Parenteral artesunate for the treatment of severe malaria, which has been demonstrated to be more efficacious than quinine and recommended by WHO since 2011, has been successfully implemented as part of a special access programme, with the hope that the drug will be registered and more widely available in the near future.
Malaria diagnosis by parasitological tests and treatment with efficacious antimalarial medicines are provided free of charge at all levels of formal health-care facilities in the endemic areas in South Africa. Mortality audits are conducted on the malaria-related deaths and health system problems are documented. A goal of near-zero malaria deaths by 2015 has been set.
A Roll Back Malaria baseline survey conducted under the aegis of the NDOH in 2005 revealed that 100% of patients diagnosed with malaria were treated appropriately within 24 hours, and this trend has been maintained (information provided by provincial malaria control managers). In South Africa, a key challenge is collecting information on RDTs and ACTs from the provinces and districts, as this information is integrated within the pharmaceutical units and obtaining it is difficult.
For South Africa to track delivery and use of ACTs, it needs to ensure that data are routinely collected. The programme will address this issue as it charts its way towards elimination.
FOCU
S ON
SOU
TH A
FRIC
A P
ROGR
ESS
& IM
PACT
SER
IES
51

1 Freese JA et al. In vitro confirmation of chloroquine-resistant Plasmodium falciparum malaria in KwaZulu. South African Medical Journal, 1988, 74(11): 576–578.
2 Deacon HE, Freese JA, Sharp BL. Drug-resistant Plasmodium falciparum malaria in the eastern Transvaal. South African Medical Journal, 1994, 84(7): 394–395 and Kruger P, Durrheim DN, Hansford CF. Increasing chloroquine resistance - the Mpumalanga Lowveld story, 1990–1995. South African Medical Journal, 1996, 86(3): 280–281.
3 Bredenkamp BL et al. Failure of sulfadoxine-pyrimethamine in treating Plasmodium falciparum malaria in KwaZulu-Natal. South African Medical Journal, 2001, 91(11): 970–972.
4 Guidelines for the treatment of malaria in South Africa. South African National Department of Health, 2010.
| GEARING UP A NATIONAL MALARIA CONTROL PROGRAMME FOR ELIMINATION |
Drug resistance
South Africa has been at the forefront of revising policies to ensure effective drugs are used in its malaria control programme. The selection of drugs is based on sound scientific evidence. Historically, South Africa used chloroquine in its malaria programme to treat uncomplicated malaria, and quinine for complicated malaria. Drug resistance to chloroquine was first reported in KwaZulu-Natal in 1987, where an in vitro drug resistance study found 88% parasite resistance to the drug.1 Drug policy subsequently changed from chloroquine to SP in 1988 in KwaZulu-Natal. Chloroquine resistance was also reported in Mpumalanga and Limpopo provinces, necessitating a policy change to SP in these provinces in 1997.2
SP resistance started rising in the mid-1990s and reached approximately 80% in 2000, requiring a change in drug policy to AL in 2001 in KwaZulu-Natal.3 Subsequently, in 2004, Limpopo also replaced SP with AL, while Mpumalanga used SP-artesunate in the public sector from 2001 to the end of 2005 and has implemented AL since January 2006.4
The South African MRC carries out drug resistance testing. Artemether-lumefantrine remains the most efficacious first-line drug for treating uncomplicated malaria cases in South Africa and no resistance has been documented to date.
Surveillance
South Africa has built a surveillance programme, which is in place in all three endemic provinces and is described in detail in Box 5.
The reorientation of the malaria programme towards elimination has led to strengthened surveillance systems to improve weekly and monthly reporting, but much still needs to be done to reach South Africa’s surveillance objectives, namely notification of malaria cases within 24 hours of diagnosis and investigation of confirmed malaria cases within seven days of notification.
The proportion of cases detected through active surveillance is low, even in the provinces that have a robust programme. For example, in Mpumalanga (further presented in Box 5) only 5% of malaria cases were detected through active case detection (ACD) in 2011. That year, only 25 malaria cases were detected in KwaZulu-Natal following ACD undertaken in about 494 000 households. In moving towards elimination, a new case investigation form has been developed and is being piloted in the endemic provinces and in two non-endemic provinces. The malaria surveillance offices and case investigators have been supplied with GIS equipment to assist in mapping localities visited during parasitological and entomological surveillance.
FOCU
S ON
SOU
TH A
FRIC
A P
ROGR
ESS
& IM
PACT
SER
IES
52

Box 4: Malaria health promotion from control to eliminationHealth education and promotion, in addressing the key risk factors, have played an important role in reducing malaria morbidity and mortality. Community members are generally informed of a specific intervention, especially after a major outbreak such as in 1999/2000 when more than 64 500 cases were recorded. Recently, with the reduced number of malaria cases, health-care workers and communities may perceive malaria as
less of a threat, particularly in the context of the high disease burdens of tuberculosis and HIV/AIDS in South Africa.
The National Malaria Control Programme has identified that robust advocacy and a health promotion and communication strategy are required to move from control to elimination.
FOCU
S ON
SOU
TH A
FRIC
A P
ROGR
ESS
& IM
PACT
SER
IES
53
| GEARING UP A NATIONAL MALARIA CONTROL PROGRAMME FOR ELIMINATION |
The aim of the strategy is to strengthen community action, which requires the following:
- strong advocacy targeting political, economic, social, cultural and environmental factors;
- creating an enabling environment that supports health system capacity development and access to information, with sustainable integrated systems in place to support the initiative;
- establishing partnerships that will ensure coordinated action by governments, health, social and economic sectors, nongovernmental and voluntary organizations, local authorities, industry and the media.
This involves advocating for community support in endemic and non-endemic districts to support the elimination strategy and develop materials about the disease and the related interventions: signs and symptoms, prophylaxis, vector control, environmental management and personal protection.
The approach in South Africa will be for every person to ask, ‘What role do I play in order for us to reach malaria elimination?’ For this to occur there is a need to convey specific messages to different groups. Action is required through educational, professional, commercial and voluntary bodies, and within the institutions themselves.
Communities in South Africa are diverse, with various cultural beliefs. Target messages need to be appropriate and aimed at communities as individuals and families in the social construct of home, work, school and recreational activity. Audiences will include politicians in all spheres of government, policy-makers, community leaders, traditional healers, nongovernmental organizations, interdepartmental associations, the private sector and other partners.
Delivery channels
In South Africa, knowledge, attitudes and practices (KAP) surveys conducted in 2005 and 2006 indicated that the community was aware of malaria, with the radio one of the important channels of communication. A KAP survey in 2008 determined that communication channels for information about malaria were, in order of preference: health facilities where talks and one-on-one sessions were conducted; the radio; and pamphlets and posters.
Delivery channels will be aimed at the target audience; for example, the approach for communicating with travellers could be to have a web site providing an information technology application, or displaying IEC material at ports of entry such as border posts and airports, emphasizing where prophylaxis is available.
IEC/behaviour change communication
Behaviour change communication is a key aspect in moving towards malaria control, especially in non-endemic areas of the country – Gauteng for example – which are targeted by migrants coming from endemic areas. In the past two years, workshops have been held to improve malaria awareness among health-care workers and communities at highest risk of malaria, such as the frequent travellers to neighbouring Mozambique where the majority of imported cases originate. In addition, between 2010 and 2013, two million pamphlets were produced by the National Malaria Control Programme and distributed to all provinces. Posters about managing severe malaria have also been developed and printed, aimed at reducing the number of malaria-related deaths.
FOCU
S ON
SOU
TH A
FRIC
A P
ROGR
ESS
& IM
PACT
SER
IES
54
d. Impact and cases averted
Impact and cases averted at a glance
• South Africa has rolled out several interventions that have reduced malaria morbidity and mortality by 89% and 85% respectively between 2000 and 2012, from 64 500 to 6847 malaria cases, and from 460 to 70 deaths.
• Between 2011 and 2012, local and imported cases decreased by 18% and 24% respectively.
• The effectiveness of malaria control in KwaZulu-Natal over the decade from mid-2002 was estimated at 97% when compared with the 2000 experience, malaria control measures averting on average 165 000 cases per annum in the three endemic provinces.
• Malaria control has had a major impact on disease burden, as well as on the economic and social development in malaria-endemic provinces.
Malaria control has been conducted for more than 70 years in South Africa. Accurate records of malaria incidence prior to the introduction of control measures do not exist, and therefore, a pre-intervention estimate of the malaria disease burden is not plausible. Historical records do, however, indicate malaria endemicity was a major obstacle to economic growth, particularly hampering agricultural and industrial activities.
The cornerstone of malaria prevention in South Africa, namely IRS, is an intervention whose impact has never been reliably quantified, and its cumulative effect over many decades is hard to assess precisely. Malaria incidence in recent years has been low in comparison with early records during the control era, likely the result of a combination of broad coverage IRS vector control, effective case management and regional malaria control. Between 2000 and 2012, the number of malaria cases and related deaths fell by 89% and 85% respectively, from 64 500 to 6847 cases, and from 460 to 70 deaths, largely thanks to effective preventive
and therapeutic interventions. Urbanization, economic and infrastructural development, together with housing improvements, have also contributed to the decline in malaria cases and deaths.
The malaria epidemic of 1999/2000 in KwaZulu-Natal provides an indication of what might happen in the absence of effective control measures. The epidemic occurred before regional malaria control interventions were put in place in southern Mozambique. Furthermore, resistance to the insecticide and antimalarial drug developed due to weaker control efforts in the province.
To provide a rough calculation of the combined average effectiveness of IRS, case management and regional malaria control in South Africa (that is, when an insecticide and an antimalarial drug to which vector and parasite are susceptible are used, and with regional malaria control occurring in Mozambique), the notified cases recorded as locally acquired from the year 2000 were used as a lower estimate of KwaZulu-Natal case numbers
FOCU
S ON
SOU
TH A
FRIC
A P
ROGR
ESS
& IM
PACT
SER
IES
55

| GEARING UP A NATIONAL MALARIA CONTROL PROGRAMME FOR ELIMINATION |
in the absence of control measures. Assuming the preventive effectiveness of this combined package of IRS, case management and regional malaria control, averaged over 10 years, to be of similar magnitude in all three malaria-endemic
provinces, the minimum number of cases that could be expected in each province without these measures were calculated using the following method:
Calculation method for averted malaria cases
Effectiveness of the malaria control package=1 – (N1/N0),
whereN1=number of malaria cases reported as locally acquired remaining in the presence of malaria control; and N0=number of malaria cases reported as locally acquired in the absence of malaria control.
Therefore, with combined interventions effective from mid-2002 (when the Lubombo Spatial Development Initiative was still in progress with the introduction of IRS and effective case management in southern Mozambique; and when neither artemisinin-containing combination malaria treatment with known local parasite resistance, nor insecticide with recorded resistance in the Anopheline populations responsible for local transmission were in place)
Average Effectiveness2003–2012=1-(average NKZN2003, NKZN2004 … NKZN2012)/(NKZN 2000)
where NKZN2000 = number of cases reported as locally acquired in KwaZulu-Natal in 2000,
NKZN2003 = number of cases in KwaZulu-Natal (KZN) in 12 months ending 30 June 2003, etc.
The expected average annual number of cases from 2003 to 2012, Nexpected if all malaria control was withdrawn would therefore be:
Nexpected = (Nobserved, 2003–2012/(1-Average Effectiveness2003–2012)) ÷10
where Nobserved, 2003–2012 is the recorded number of local cases for the decade 2003–2012.
The same method was used to calculate the expected number of cases for each year for Mpumalanga and Limpopo, assuming effectiveness
to be the same as in KwaZulu-Natal. The cases averted are the difference between expected and observed cases (see Figure 19).
FOCU
S ON
SOU
TH A
FRIC
A P
ROGR
ESS
& IM
PACT
SER
IES
56

Figure 19Projected number of malaria cases averted annually through IRS, case management and regional control, South Africa, 2003–2012Malaria control averted on average 165 000 cases per annum. Average effectiveness of malaria control in KwaZulu-Natal over the decade can then be estimated at 97% when compared with the 2000 experience.
Cases observed (2012)
Cases expected annually (average from 2003 to 2012) Cases averted annually
KwaZulu-Natal 567 21 857 21 290
Mpumalanga 1207 46 572 45 365
Limpopo 2631 101 497 98 866
Total 4405 169 926 165 521
Note: For the exercise, the year starts on 1 July and ends on 30 June. Cases assessed are locally acquired only and this evaluation does not factor in population growth.
The total annual budget spent by the National Department of Health and the three provincial malaria control programmes is approximately US$ 25 million. This includes treatment costs, and since effective treatment contributes to prevention, it is not feasible to quantify the exact cost of prevention.
Accordingly, using the total budget as the upper limit, an estimate of crude cost per case averted would have an upper bound of about US$ 150 per annum.
Malaria control has clearly had a major impact on disease burden, and economic and social development in the malaria-endemic provinces of South Africa. Areas that would not have been accessible for tourism are now promoted as having an extremely low malaria risk, and other sectors of the economy have also flourished in these areas. The estimate of average annual cases averted, as presented in this analysis, needs to be interpreted with caution due to the methodological limitations discussed below, but they nevertheless present a reasonable quantification of the benefit of malaria control in South Africa, comparing a period with
limited effective control with a period with all three key elements of control in operation.
Limitations
• It is impossible to say at what level the KwaZulu-Natal epidemic would have stabilized had it gone unchecked. In our calculation, the estimate of number of cases is conservative; had the epidemic escalated further, the number of cases averted would have been larger.
• Malaria control generally has a cumulative long-term effect over many years. It is difficult to quantify this adequately since there is no suitable control group. Our approach has been to use the same population during an epidemic caused by control failure rather than by meteorological factors, as a comparison; a population case-control design. This is vulnerable to confounding by secular trends such as cyclical weather patterns, socioeconomic development and migration.
• The effectiveness of the package of interventions in KwaZulu-Natal would almost certainly not be
FOCU
S ON
SOU
TH A
FRIC
A P
ROGR
ESS
& IM
PACT
SER
IES
57

| GEARING UP A NATIONAL MALARIA CONTROL PROGRAMME FOR ELIMINATION |
identical in the two other provinces. Insecticide susceptibility, drug resistance, the impact of malaria control in neighbouring countries (particularly Swaziland and Mozambique), housing types and cultural differences would all have a differential effect on actual effectiveness.
• A number of malaria cases from endemic areas in South Africa are reported in non-endemic provinces, or in cities such as Durban. These
have not been included in the calculations, since their origin is often unknown.
• A large number of malaria cases from endemic provinces are listed as unclassified, their origin unknown; it is not known whether they are imported or locally acquired. The estimates in Figure 19 have been done excluding these cases, to provide a conservative estimate of impact.
FOCU
S ON
SOU
TH A
FRIC
A P
ROGR
ESS
& IM
PACT
SER
IES
58
Box 5: Malaria surveillance and response: the crux of a strong elimination programme
The broad objectives of the national malaria elimination strategy involve: strengthening case surveillance; capacity development to facilitate effective implementation of interventions; rolling out effective IEC, social mobilization and advocacy programmes; preventing infections; and eliminating the parasite reservoir by 2018.
Key issues in the scaling up of monitoring and surveillance under the elimination campaign include: reporting passive cases within 24 hours; investigating passive cases within 48 hours; rapid reactive case detection and treatment in communities surrounding passive notifications; identifying foci of local transmission typified by local case episodes coupled with the presence of suitable vector population; and mapping cases, hotspots, transmission foci and outbreaks. Informed, targeted and timely response for case management, community mobilization and vector control depends critically upon such systems and data.
Description of the malaria surveillance system
Four surveillance activities are conducted in South African endemic areas: passive, active, proactive and outbreak surveillance.
During the passive surveillance process, patients visit health facilities and, once they are parasitologically diagnosed with malaria, the health worker notifies the case on the prescribed notification form and reports travel history. The programme works towards classifying cases at health-facility level in order to prevent situations where patients cannot be traced. This way, the possible source of infection is identified before a case is traced or a patient is visited at his/her residence.
Health facilities in malaria risk areas are visited twice a week during high transmission periods to ensure that i) all notifications are collected, ii) the availability of drugs is monitored and iii) notification forms are completed correctly with good quality addresses for tracing patients.
The active surveillance process involves investigating each notified malaria case and identifying new infections and potential sources of infection within at-risk communities (also referred to as active case ‘investigation and detection’). As illustrated in Figure 20, the investigator visits the patient at home using the address reported on the notification form. If the patient cannot be located, the case is untraceable and reported as unclassified. When the patient is found, the investigator will i) verify the case classification, ii) detect possible parasite carriers in the community and iii) find and treat possible malaria breeding sites using vector control activities. These actions ensure that both mosquito vector and parasite loads are reduced within the community. The case investigator will also provide health education and test close contacts. As it is not cost-effective to screen households within a 2 km radius from an ‘index’ case, provincial malaria programmes screen 10–20 households in the vicinity of an identified case. Symptomatic patients in this area are tested for malaria using RDTs, and blood smears for confirmation, while asymptomatic people are screened using blood smears only (see Figure 21). All positives are treated, after referral to the nearest health facility when symptomatic. The cases are then reported to the investigator, with investigation and detection activities starting again from the new ‘index’ cases. With limited resources, the programme is also doing the 28-day follow-up blood smear collection to confirm parasite clearance. This activity will be expanded when resources permit.
FOCU
S ON
SOU
TH A
FRIC
A P
ROGR
ESS
& IM
PACT
SER
IES
59

| GEARING UP A NATIONAL MALARIA CONTROL PROGRAMME FOR ELIMINATION |
Figure 20Active case investigation and detection at facility level
Positive casediagnosed athealth facility
Case notificationform completedat health facility
Case investigatorcollects
notification form
Health education
Contact testing
Vector control
Verify caseinformation
Case investigation Unable to locatethe index patient
Mark untraceable
Primary healthcare process
Malaria controlprogramme process
Locate theindex patient
Source: NDOH, 2013.
Figure 21Active case investigation and detection at community level
Case investigator
Locate theindex patient Contact testing
Symptomatic(RDT + blood
smear confirmation)
Transportto health facility
Asymptomatic(blood smear)
( + ) Test ( + ) Test
Source: NDOH, 2013.
FOCU
S ON
SOU
TH A
FRIC
A P
ROGR
ESS
& IM
PACT
SER
IES
60
The aim of active surveillance is to prevent onward malaria transmission, with reporting being done as follows:
- the case investigator collects the notification form from the health facility and checks whether all relevant data are collected. The form should be collected within 24 hours after identification of a malaria case (measures are being put in place to meet this requirement);
- the investigator starts the follow-up procedures at the patient’s home within 24 hours after notification of the case, and the full report, including information on entomological surveillance, should be submitted 48 hours later. This is sometimes challenging, especially when the number of cases is significant or resources are limited;
- if a positive case is detected while screening, the case investigator records the data on the case investigation form, which is then reported to the nearest health facility. The case investigator then completes the notification form for this new case, and the patient is transported to the nearest health facility. The community nurse provides the treatment, and the drugs dispensed to the patient are documented;
- the environmental health practitioner collects the form, and the information is passed to the district manager, who analyses it and then sends the form to the information officer to collate and verify.
Proactive surveillance is triggered by the strong suspicion of malaria transmission within a defined area and/or among community members, migrant workers or travellers and is undertaken in order to i) find symptomatic and asymptomatic cases and ii) treat according to national malaria treatment guidelines. Implemented in some identified localities of Bushbuckridge municipality in 2012–2013, this process involves the following actions:
- a case investigator is allocated to a catchment area with a number of households to visit regularly;
- screening is undertaken if someone in the household has travelled to a malaria-endemic area or presents with malaria signs and symptoms;
- when an infection is identified by RDT, the case investigator informs the community staff nurse and he/she will visit the patient at home and provide treatment. The notification form is completed and a blood smear is taken to confirm and report the malaria case;
- the case investigator screens people living in the same area having travelled to an endemic area or presenting the signs and symptoms of malaria;
- when a positive case is detected with an RDT, a blood smear is also done and sent to the laboratory for confirmation while the patient receives treatment;
- the case investigation form is completed and sent to the health facility in order for the notification form to be completed;
- the environmental health practitioner collects the notification form and forwards it to the district malaria manager, who then sends it to the information officer;
- the entomological surveillance team checks the homestead for vectors and their larvae, and collects information on IRS. If vectors are found in the vicinity, IRS or larviciding is conducted.
The outbreak surveillance process involves planning for outbreaks annually and tracking indicators reported in a checklist. In order to detect outbreaks early, malaria alert thresholds are calculated at five different levels and monitored by various people, from health professionals to malaria staff and information specialists. With this system in place, the programme has not experienced any malaria outbreak since 2004/2005.
FOCU
S ON
SOU
TH A
FRIC
A P
ROGR
ESS
& IM
PACT
SER
IES
61
| GEARING UP A NATIONAL MALARIA CONTROL PROGRAMME FOR ELIMINATION |
Methodology for case notification
Malaria has been a notifiable disease in South Africa since 1956, making malaria case notification mandatory. The process for notifying cases involves the following steps:
• a notification form (Form GW/17) is completed by the health worker at the health facility, and collected by the case investigator for follow-up of the patient;
• within 24 hours, the environmental health practitioner sends the notification form to the district officer, to inform him/her about each case;
• the data are captured at the district level and sent to the information officer at the provincial level by telephone, fax or email;
• the information officer collates data for all health facilities, districts and subdistricts (municipalities), and reports to the provincial manager on a weekly basis.
Provincial malaria surveillance teams
There are dedicated teams of malaria surveillance officers and case investigators working between the health facilities and the communities on a daily basis. These teams are led by supervisors dedicated to ACD, and consist of case investigation, entomology and microscopy teams. Provincial surveillance teams vary in structure and staff number depending on the size of the malaria transmission area. A typical malaria case investigation team includes a case investigator, an assistant case investigator, an entomologist/field assistant and an environmental health practitioner for supervision. The duties of the malaria surveillance teams include conducting malaria-related health education, taking blood smears, collecting malaria-related data in the field, and assisting the team leaders in conducting case
investigation. Mpumalanga has 12 case investigation teams, 2 entomological teams and 2 microscopy teams. KwaZulu-Natal has 26 teams consisting of 191 malaria surveillance agents, and 3 microscopy teams with a total of 10 microscopists. Limpopo has 42 IRS teams, 11 dedicated surveillance teams and 3 entomology teams.
Case investigation and notification at national level
In order to obtain strong surveillance data, specific training is required for health workers for proper completion of notification forms, and for investigators for adequate investigation and classification. In parallel, the programme needs to ensure that data fields collected will enable effective monitoring. Data captured accurately and timely are prerequisites for a clear picture of the disease burden, but also to reveal malaria trend lines, monitor all malaria activities and make informed decisions about interventions to deploy.
The patient’s detailed travel history before developing signs and symptoms is captured at health-facility level from either the patient or a relative. This enables the programme to determine the probable place of infection, which is critical to the success of the malaria elimination programme. As presented in Figure 22, investigation activities yielded 1828 local malaria cases in 2012, down by 18% compared with 2011 levels (2235 cases). At the same time, the proportion of unclassified cases among all investigated cases decreased markedly, from 13% in 2011 to 5% in 2012, which is testimony to a good surveillance system.
FOCU
S ON
SOU
TH A
FRIC
A P
ROGR
ESS
& IM
PACT
SER
IES
62

Figure 22Investigated cases of malaria among all provinces of South Africa, 2011 and 2012Both local and imported cases have decreased between 2011 and 2012. Imported cases, down by 24% compared with 2011, remain a problem because they represent a major threat of potential outbreaks.
Source: NDOH, 2013.
Local cases Imported cases Unclassified cases
0
2000
4000
6000
8000
10 000
12 000
2011 2012
Number of cases
Mpumalanga sets new standards for case classification
The Mpumalanga malaria programme focuses on routine and systematic collection of malaria data, and on their analysis/interpretation, in order to monitor and describe the disease burden in the province. The province submits weekly reports on all malaria cases notified, with a breakdown
of the sources of infection, and details of the status of investigation of each case.
The investigation efforts undertaken are commendable: in the past two years of reporting on confirmed local cases and cases of unknown origin, Mpumalanga is the only endemic province that has not reported unknown/unclassified malaria cases (see Figure 23).
FOCU
S ON
SOU
TH A
FRIC
A P
ROGR
ESS
& IM
PACT
SER
IES
63

| GEARING UP A NATIONAL MALARIA CONTROL PROGRAMME FOR ELIMINATION |
Figure 23Proportion of local, unclassified and imported cases, malaria-endemic provinces, 2011–2012With more than 6000 confirmed malaria cases recorded between 2011 and 2012, Mpumalanga bears the highest disease burden. All cases were, however, classified in this province, compared with unclassified rates of 24% (n=1294) and 31% (n=334) in Limpopo and KwaZulu-Natal provinces respectively.
Source: NDOH, 2013.
0
1000
2000
3000
4000
5000
6000
7000
Limpopo Mpumalanga KwaZulu-Natal
Number of cases
Local cases Imported cases Unclassified cases
New technologies for surveillance
One of the key requirements for elimination is the need for rapid case notification and response. In this regard, South Africa has been piloting the use of cellular phone technology in parts of Limpopo and Mpumalanga provinces. The findings will inform the scale-up of this technology to other malaria-endemic provinces in order to reach the 100% target for notifying malaria cases within 24 hours.
The national malaria programme is developing a malaria management information system to ensure that all elimination indicators are collected and tracked. The key data points within this system will include vector control and entomological data, case-based surveillance data, and malaria commodity information (ACTs and RDTs).
The 2013 version of the South African malaria risk map was produced using GIS technology,
FOCU
S ON
SOU
TH A
FRIC
A P
ROGR
ESS
& IM
PACT
SER
IES
64
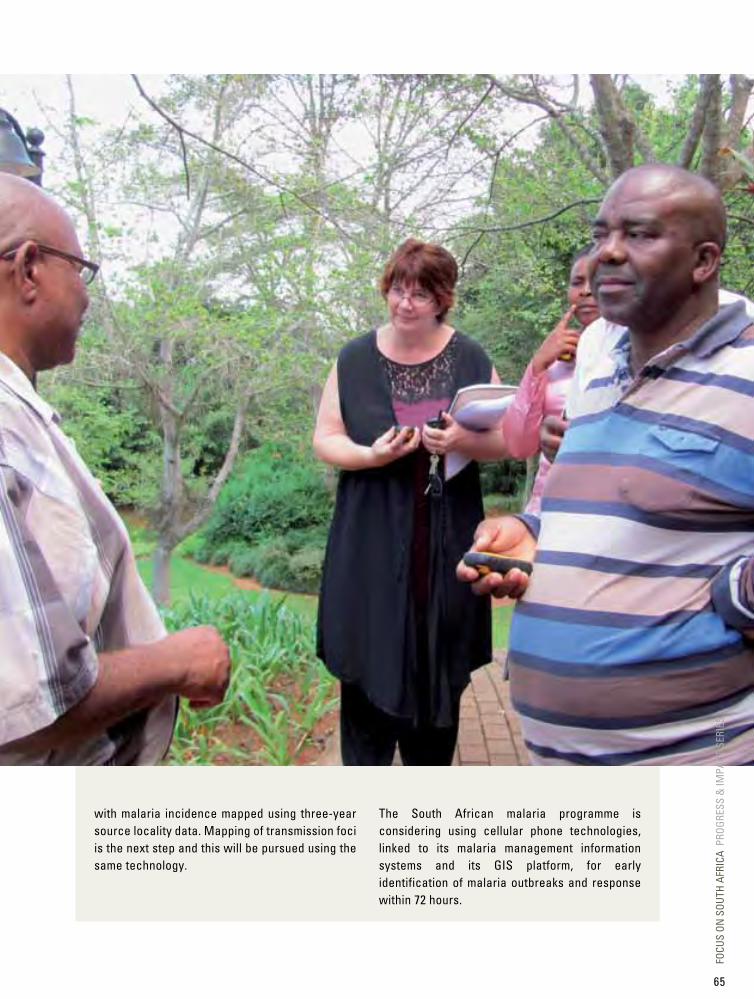
with malaria incidence mapped using three-year source locality data. Mapping of transmission foci is the next step and this will be pursued using the same technology.
The South African malaria programme is considering using cellular phone technologies, linked to its malaria management information systems and its GIS platform, for early identification of malaria outbreaks and response within 72 hours.
FOCU
S ON
SOU
TH A
FRIC
A P
ROGR
ESS
& IM
PACT
SER
IES
65
FOCU
S ON
SOU
TH A
FRIC
A P
ROGR
ESS
& IM
PACT
SER
IES
66

CHAPTER IV
PAVING THE wAy TOwARdS MAlARIA ElIMINATIONWith effective malaria control and continued socioeconomic improvements, South Africa has made great strides in reducing morbidity and mortality between 2000 and 2012. Yet the malaria programme realizes the need to address key challenges on the way to eliminating the disease – strengthening its human resource capacity and improving surveillance – and to accelerate efforts towards this objective. This chapter details the key transitioning activities the programme will have to tackle in the short term.
Paving the way towards malaria elimination at a glance
• South Africa has achieved an incidence of less than 1 malaria case per 1000 population at risk in its nine malaria-endemic districts.
• The programme needs to focus on strengthening human resource capacity, mobilizing and sustaining financing for malaria elimination.
• Operational research is needed to continue refining the delivery of evidence-based interventions.
• Malaria transmission foci/hot spots need to be identified and a more robust surveillance system must be in place.
Malaria elimination is the next step after effective malaria control has been achieved. Effective, well-structured, sustainable control strategies have resulted in marked reductions in the malaria burden, to the extent that the malaria incidence in South Africa is less than 1 case per 1000 population at risk in its nine malaria-endemic districts.
Poised on the brink of elimination, South Africa needs to urgently address the challenges in the malaria control programme and to reinforce areas of weakness.
• There is inadequate human capacity at all levels to ensure efficient utilization of resources available for scaling up malaria control interventions.
FOCU
S ON
SOU
TH A
FRIC
A P
ROGR
ESS
& IM
PACT
SER
IES
67
| PAVING THE WAy TOWARDS MALARIA ELIMINATION |
The labour-intensive preventive and curative approach to malaria control relies heavily on its human resource component for implementation. Information systems that have been developed for use in South Africa are not being utilized to their full potential due to the lack of appropriately qualified staff at the national and provincial level. Malaria control personnel need to be appropriately trained, namely: - spray operators for indoor residual spraying; - health-care staff to ensure correct diagnosis
and effective use of ACTs; - professional entomologists and epidemiologists
trained to conduct essential surveillance activities to guide malaria vector control efforts.
• Where feasible, malaria preventive and curative services should be integrated within primary health care programmes to ensure sustainability of malaria services. In the prevention area, the country will also have to explore the provision of malaria prophylaxis in the public sector.
• As it charts its way towards elimination, the programme will also need to implement quality control and assurance programmes for rapid diagnostic testing and microscopy. Routine data collection is required to track the delivery and usage of diagnostic tests and ACTs.
• The high volume human migration across South Africa’s northern and eastern borders places a continuing risk of imported malaria on non-immune border populations. The country will work towards making ACTs more accessible to migrants and communities through malaria field workers.
• There is a lack of key programmatic information (such as reporting on where and when RDTs and ACTs are used) vital for guiding and strengthening the programme. It should be collected as soon as possible; operational research should help address this challenge.
• All outbreaks need to be investigated within three days of detection in order to respond timely and effectively to an outbreak. The national malaria programme needs to work with key stakeholders to establish more accurate predictions of outbreak and epidemic hotspots (areas of higher than average malaria transmission) in all nine malaria-endemic districts, based on entomological and epidemiological surveillance.
• South Africa will need to strengthen its surveillance system so that malaria cases are reported within 24 hours, verified within 48 hours and responded to within 72 hours.
• Reaching zero local malaria transmission will require financial resources that will need to be sustained after elimination is achieved to prevent the reintroduction of malaria to South Africa. Malaria elimination activities are dependent on an increased annual budget. These funds should not be dependent on donor funding, but should continue to be part of the national budget.
• Malaria elimination in South Africa is only possible if elimination is also successful in neighbouring countries, particularly Mozambique and Zimbabwe. Therefore, cross-border malaria control with neighbouring countries is essential.
FOCU
S ON
SOU
TH A
FRIC
A P
ROGR
ESS
& IM
PACT
SER
IES
68

FOCU
S ON
SOU
TH A
FRIC
A P
ROGR
ESS
& IM
PACT
SER
IES
69
FOCU
S ON
SOU
TH A
FRIC
A P
ROGR
ESS
& IM
PACT
SER
IES
70

CHAPTER V
CONCluSION
Over the past decade, through evidence-based strategies and largely using its own resources, South Africa has intensified its malaria control efforts to the extent that the country has now set a national goal of malaria elimination. Considering the extent of the malaria outbreaks of 1999/2000, the achievements have been noteworthy, enabling South Africa to set itself the objective of interrupting local transmission by 2018.
Lessons for other countries that have embarked on this same agenda include the value of sustaining
high coverage of vector control interventions according to the country’s epidemiological situation, and decentralizing the implementation of malaria control activities and budgets.
To achieve the vision of a malaria-free South Africa, and even of a malaria-free southern Africa, the country will strive to maintain adequate human and financial resources. At the same time it will need to sustain effective and long-term malaria control collaborations with neighbouring countries and strengthen operational research and surveillance.
FOCU
S ON
SOU
TH A
FRIC
A P
ROGR
ESS
& IM
PACT
SER
IES
71

ANNExList of National Malaria Control Programme PartnersA variety of stakeholders joined the NMCP in implementing the activities and achieving the results described in this report. These stakeholders include:
National Partners• Department for Correctional Services (DCS)• Department of Agriculture, Forestry and Fisheries
(DAFF)• Department of Environmental Affairs (DEA)• Department of Tourism• Department of Water Affairs (DWA)• National Health Laboratory Service (NHLS)• National Institute for Communicable Diseases
(NICD)• South African Medical Research Council (MRC)• South African Military Health Service (SAMHS)• South African Regional Global Diseases
Detection Program (SARGDD)• University of Cape Town (UCT)• University of Pretoria (UP)• University of the Witwatersrand (Wits University)
International Partners• Africa Fighting Malaria (AFM)• African Medical and Research Foundation
(AMREF)• Clinton Health Access Initiative (CHAI)• GBCHealth• Johns Hopkins University (JHU)• Roll Back Malaria Partnership (RBM)• Southern Africa Roll Back Malaria Network
(SARN)• Southern African Development Community
(SADC)• United Against Malaria (UAM)• United Nations Children’s Fund (UNICEF)• World Health Organization (WHO)
FOCU
S ON
SOU
TH A
FRIC
A P
ROGR
ESS
& IM
PACT
SER
IES
72
PROGRESS & IMPACT SERIES
Focus on South Africa
Secretariat hosted by the World Health Organization
Avenue Appia 20, 1211 Geneva 27, Switzerland www.rollbackmalaria.org [email protected] Tel. +41 22 791 5869 Fax +41 22 791 1587
Country ReportsNumber 8 • October 2013
PROG
RESS
& IM
PACT
SER
IES
F
OCuS
On
SOuT
h AF
RICA
COun
TRY
REPO
RTS
Num
ber 8
• Oc
tobe
r 201
3