progress of projects and programmes implemented in 2019
TRANSCRIPT

Progress of projects and programmes implemented in 2019
(as at 31st December 2019)
During the 4th quarter 2019, 29 out of 30 line ministries (except the Ministry of Passenger
Transport Management) have implemented physically on-going 12571
development projects and
programmes2
. As per the classification of projects and programmes based on the Total
Estimated Cost (TEC), the highest number of projects and programmes (472) are medium scale
investments while 242 are large scale and 152 are mega scale investments, as shown in the
Table-1 below:
Table-1: Distribution of on-going projects and programmes (based on TEC)
TEC (Rs. million) <10 10-100 100-1,000 1,000 –
10,000 ≥10,000
Total
Type Micro Small Medium Large Mega
# Projects 47 189 356 210 146 948
#Programmes 35 120 116 32 06 309
Total (Projects & Programmes )
82 309 472 242 152 1257
1,015 Out of above 1,257 development projects and programmes are totally financed by local
funds and 242 projects and programmes are financed through the loans and grants obtained from
the foreign development partners; major part of funding for 179 projects and programmes are
foreign loans while 63 Projects and programmes are funded mainly by grants. The Table-2
below illustrates the distribution of on going development projects and programmes financed
through different sources of financing, among 05 major categories (based on size of investment):
Table-2: Distribution of on- going projects & programmes
among different categories of investment
Source of Financing Category (based on TEC)
Total Micro Small Medium Large Mega
Local Funds 76 296 429 172 42 1015
Foreign Funds (Loan) 01 03 13 53 109 179
Foreign Funds (Grant) 05 10 30 17 01 63
Total 82 309 472 242 152 1257 1 There are 08 projects of which the implementation responsibility is shared by 02 line ministries. Since separate budgetary
allocations provided for each ministry to implement different components of a same project, respective ministries treat their component as a project and report the progress separately. Therefore, actual number of on going projects and programmes implemented in 4th quarter of 2019 should be 1,249; but for the purpose of assessment of performance of project implementation by all line ministries, the total count of projects is considered as 1,257.
2 Some important procurements, maintenance, renovation and rehabilitation works and large scale capacity development activities included in this analysis are considered as development projects and programmes by line ministries.
In the recent past, responsibility of financing for some development projects has been delegated
to selected implementing agencies, after assessing their capacity of managing those development
initiatives, by their own. Accordingly, development projects could be classified into 02 major
categories based on the following major types of financing:
(i) financing directly through the Treasury (included in the Budget Estimate as Capital
Budget) and;
(ii) financing fully or mainly by the respective implementing agencies (Off-budget) by
utilizing their revenue or through credit facilities obtained from local or foreign
banks.
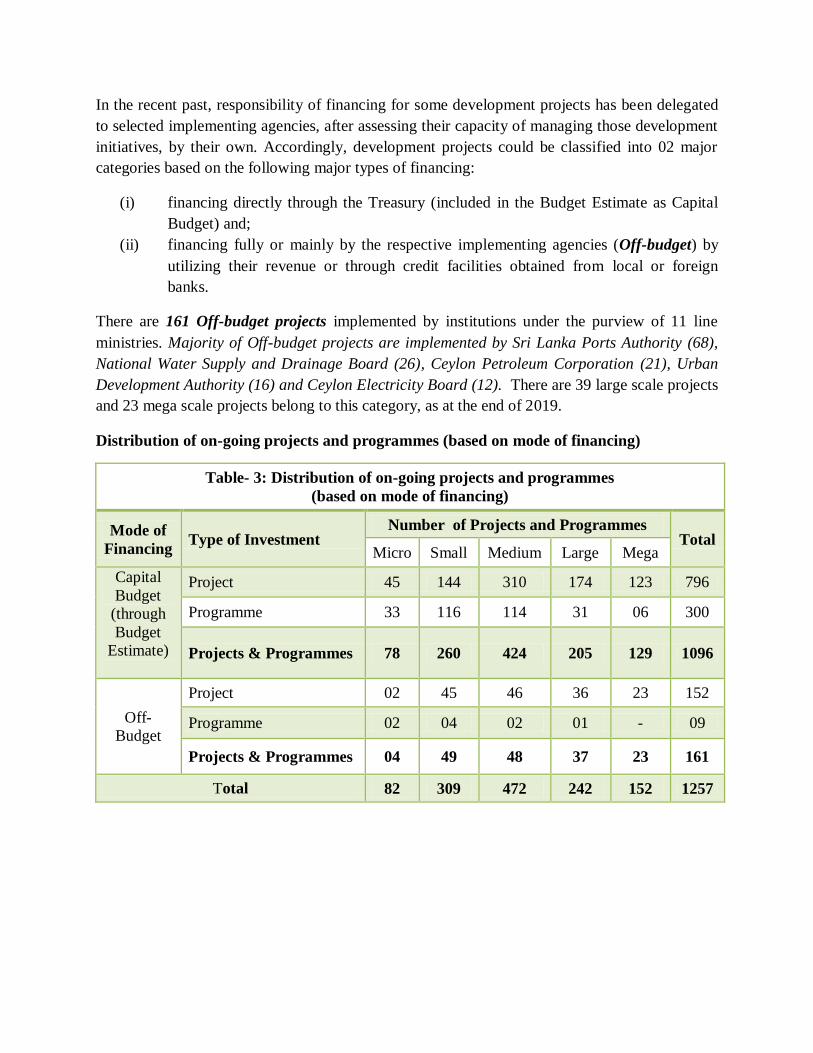
There are 161 Off-budget projects implemented by institutions under the purview of 11 line
ministries. Majority of Off-budget projects are implemented by Sri Lanka Ports Authority (68),
National Water Supply and Drainage Board (26), Ceylon Petroleum Corporation (21), Urban
Development Authority (16) and Ceylon Electricity Board (12). There are 39 large scale projects
and 23 mega scale projects belong to this category, as at the end of 2019.
Distribution of on-going projects and programmes (based on mode of financing)
Table- 3: Distribution of on-going projects and programmes
(based on mode of financing)
Mode of
Financing Type of Investment
Number of Projects and Programmes Total
Micro Small Medium Large Mega
Capital
Budget
(through
Budget
Estimate)
Project 45 144 310 174 123 796
Programme 33 116 114 31 06 300
Projects & Programmes 78 260 424 205 129 1096
Off-
Budget
Project 02 45 46 36 23 152
Programme 02 04 02 01 - 09
Projects & Programmes 04 49 48 37 23 161
Total 82 309 472 242 152 1257
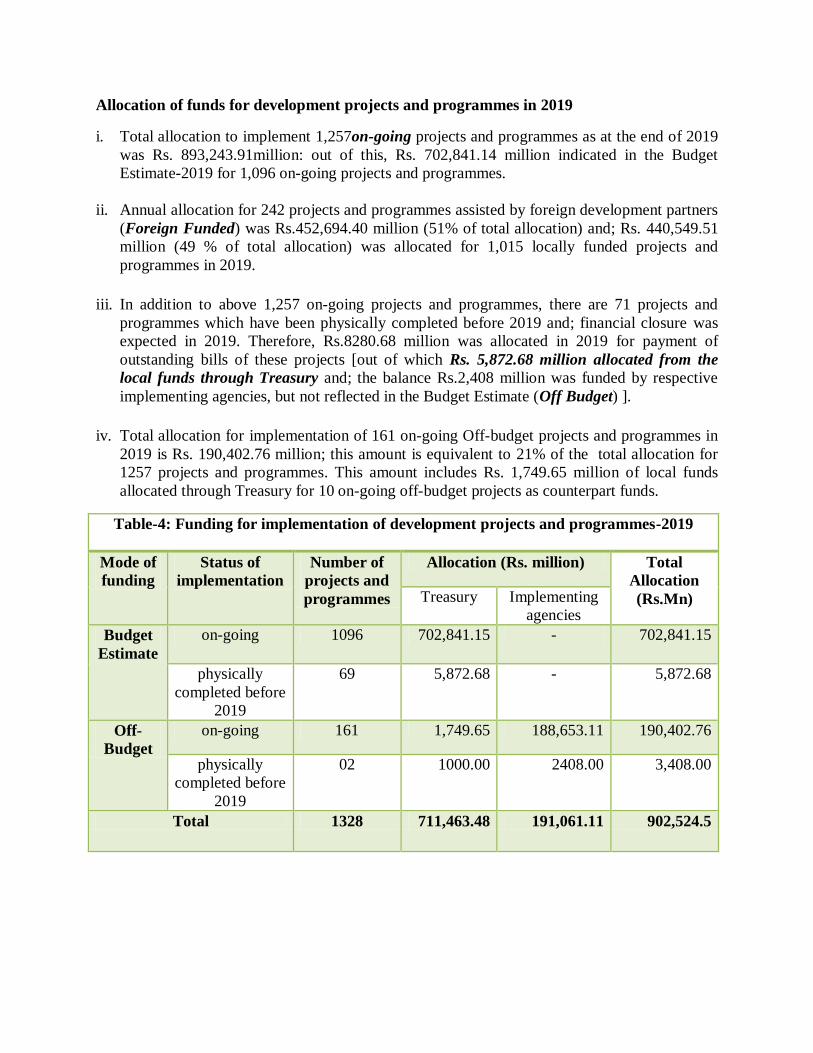
Allocation of funds for development projects and programmes in 2019
i. Total allocation to implement 1,257on-going projects and programmes as at the end of 2019
was Rs. 893,243.91million: out of this, Rs. 702,841.14 million indicated in the Budget
Estimate-2019 for 1,096 on-going projects and programmes.
ii. Annual allocation for 242 projects and programmes assisted by foreign development partners
(Foreign Funded) was Rs.452,694.40 million (51% of total allocation) and; Rs. 440,549.51
million (49 % of total allocation) was allocated for 1,015 locally funded projects and
programmes in 2019.
iii. In addition to above 1,257 on-going projects and programmes, there are 71 projects and
programmes which have been physically completed before 2019 and; financial closure was
expected in 2019. Therefore, Rs.8280.68 million was allocated in 2019 for payment of
outstanding bills of these projects [out of which Rs. 5,872.68 million allocated from the
local funds through Treasury and; the balance Rs.2,408 million was funded by respective
implementing agencies, but not reflected in the Budget Estimate (Off Budget) ].
iv. Total allocation for implementation of 161 on-going Off-budget projects and programmes in
2019 is Rs. 190,402.76 million; this amount is equivalent to 21% of the total allocation for
1257 projects and programmes. This amount includes Rs. 1,749.65 million of local funds
allocated through Treasury for 10 on-going off-budget projects as counterpart funds.
Table-4: Funding for implementation of development projects and programmes-2019
Mode of
funding
Status of
implementation
Number of
projects and
programmes
Allocation (Rs. million) Total
Allocation
(Rs.Mn) Treasury Implementing
agencies
Budget
Estimate
on-going 1096 702,841.15 - 702,841.15
physically
completed before
2019
69 5,872.68 - 5,872.68
Off-
Budget
on-going 161 1,749.65 188,653.11 190,402.76
physically
completed before
2019
02 1000.00 2408.00 3,408.00
Total 1328 711,463.48 191,061.11 902,524.5
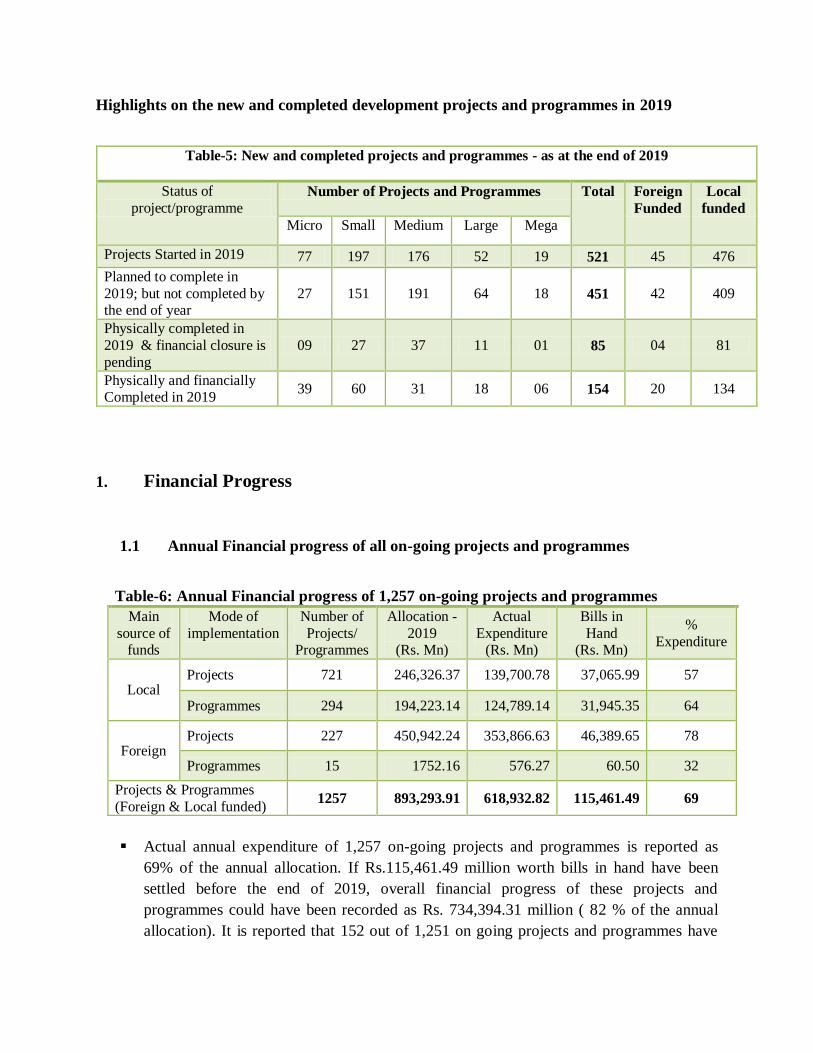
Highlights on the new and completed development projects and programmes in 2019
1. Financial Progress
1.1 Annual Financial progress of all on-going projects and programmes
Table-6: Annual Financial progress of 1,257 on-going projects and programmes
Main
source of funds
Mode of
implementation
Number of
Projects/ Programmes
Allocation -
2019 (Rs. Mn)
Actual
Expenditure (Rs. Mn)
Bills in
Hand (Rs. Mn)
%
Expenditure
Local Projects 721 246,326.37 139,700.78 37,065.99 57
Programmes 294 194,223.14 124,789.14 31,945.35 64
Foreign Projects 227 450,942.24 353,866.63 46,389.65 78
Programmes 15 1752.16 576.27 60.50 32
Projects & Programmes
(Foreign & Local funded) 1257 893,293.91 618,932.82 115,461.49 69
Actual annual expenditure of 1,257 on-going projects and programmes is reported as
69% of the annual allocation. If Rs.115,461.49 million worth bills in hand have been
settled before the end of 2019, overall financial progress of these projects and
programmes could have been recorded as Rs. 734,394.31 million ( 82 % of the annual
allocation). It is reported that 152 out of 1,251 on going projects and programmes have
Table-5: New and completed projects and programmes - as at the end of 2019
Status of
project/programme Number of Projects and Programmes Total Foreign
Funded
Local
funded
Micro Small Medium Large Mega
Projects Started in 2019 77 197 176 52 19 521 45 476
Planned to complete in
2019; but not completed by the end of year
27 151 191 64 18 451 42 409
Physically completed in
2019 & financial closure is
pending
09 27 37 11 01 85 04 81
Physically and financially Completed in 2019
39 60 31 18 06 154 20 134
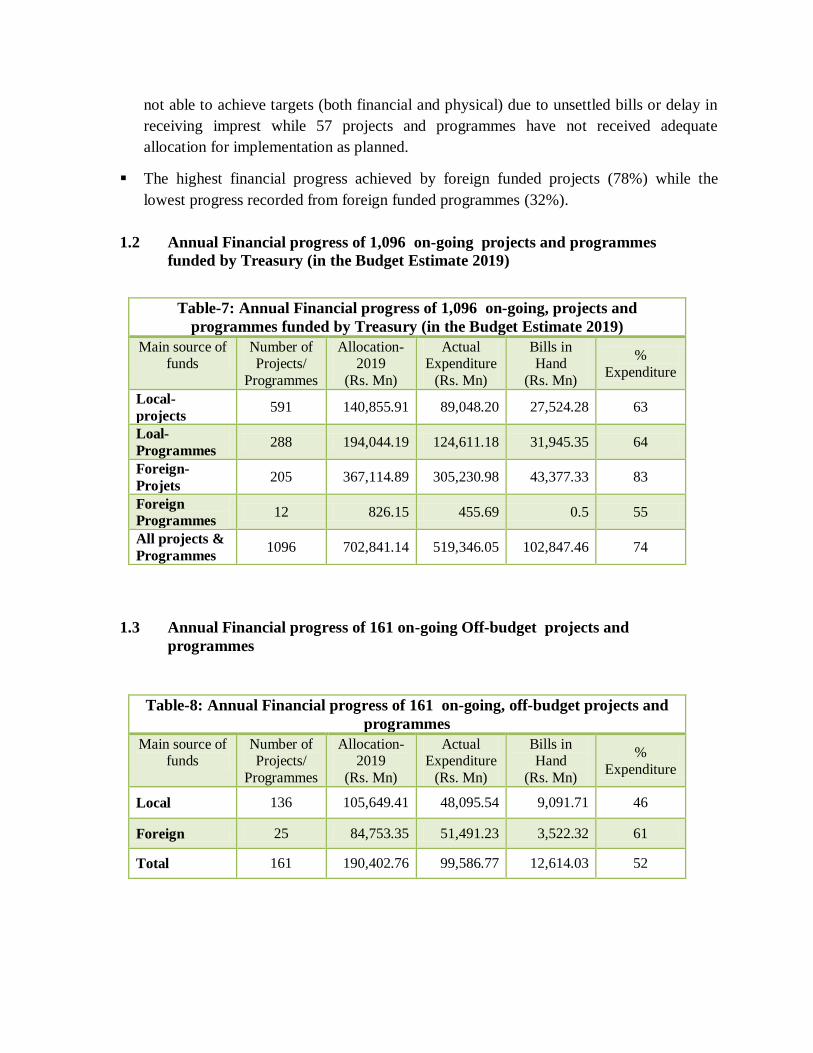
not able to achieve targets (both financial and physical) due to unsettled bills or delay in
receiving imprest while 57 projects and programmes have not received adequate
allocation for implementation as planned.
The highest financial progress achieved by foreign funded projects (78%) while the
lowest progress recorded from foreign funded programmes (32%).
1.2 Annual Financial progress of 1,096 on-going projects and programmes
funded by Treasury (in the Budget Estimate 2019)
1.3 Annual Financial progress of 161 on-going Off-budget projects and
programmes
Table-7: Annual Financial progress of 1,096 on-going, projects and
programmes funded by Treasury (in the Budget Estimate 2019)
Main source of funds
Number of Projects/
Programmes
Allocation-2019
(Rs. Mn)
Actual Expenditure
(Rs. Mn)
Bills in Hand
(Rs. Mn)
%
Expenditure
Local-
projects 591 140,855.91 89,048.20 27,524.28 63
Loal-
Programmes 288 194,044.19 124,611.18 31,945.35 64
Foreign-
Projets 205 367,114.89 305,230.98 43,377.33 83
Foreign
Programmes 12 826.15 455.69 0.5 55
All projects &
Programmes 1096 702,841.14 519,346.05 102,847.46 74
Table-8: Annual Financial progress of 161 on-going, off-budget projects and
programmes
Main source of funds
Number of Projects/
Programmes
Allocation- 2019
(Rs. Mn)
Actual Expenditure
(Rs. Mn)
Bills in Hand
(Rs. Mn)
%
Expenditure
Local 136 105,649.41 48,095.54 9,091.71 46
Foreign 25 84,753.35 51,491.23 3,522.32 61
Total 161 190,402.76 99,586.77 12,614.03 52
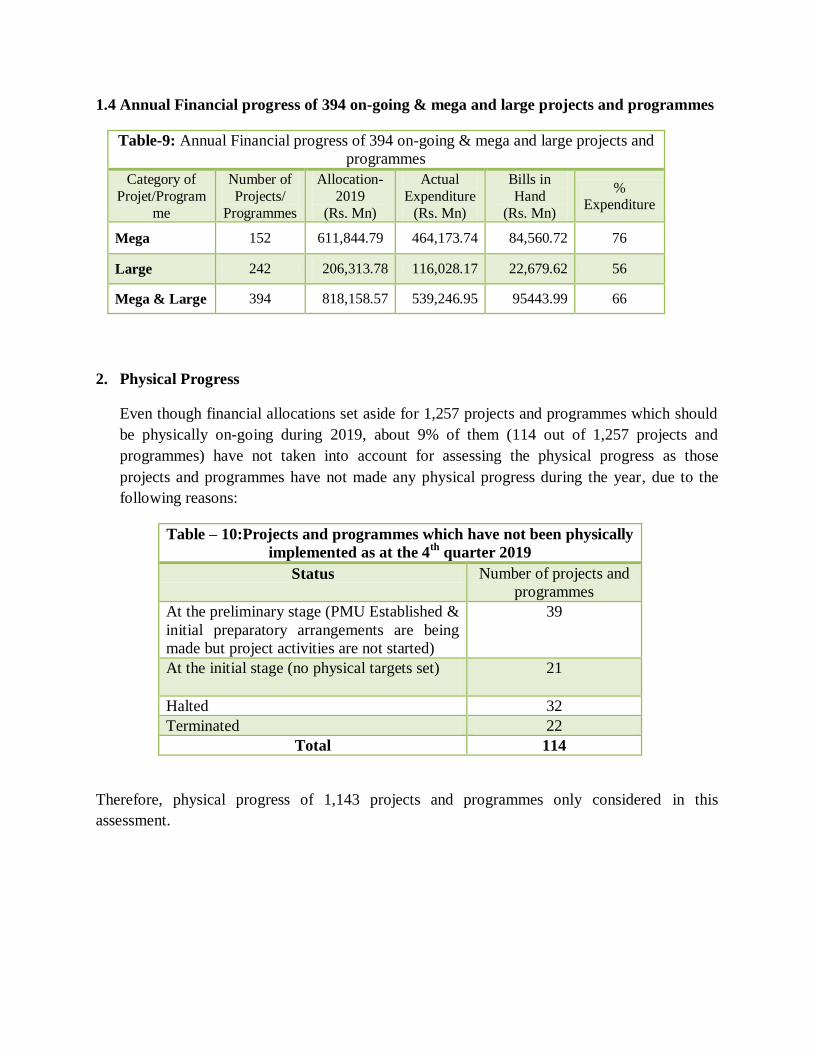
1.4 Annual Financial progress of 394 on-going & mega and large projects and programmes
Table-9: Annual Financial progress of 394 on-going & mega and large projects and
programmes
Category of
Projet/Program
me
Number of
Projects/
Programmes
Allocation-
2019
(Rs. Mn)
Actual
Expenditure
(Rs. Mn)
Bills in
Hand
(Rs. Mn)
% Expenditure
Mega 152 611,844.79 464,173.74 84,560.72 76
Large 242 206,313.78 116,028.17 22,679.62 56
Mega & Large 394 818,158.57 539,246.95 95443.99 66
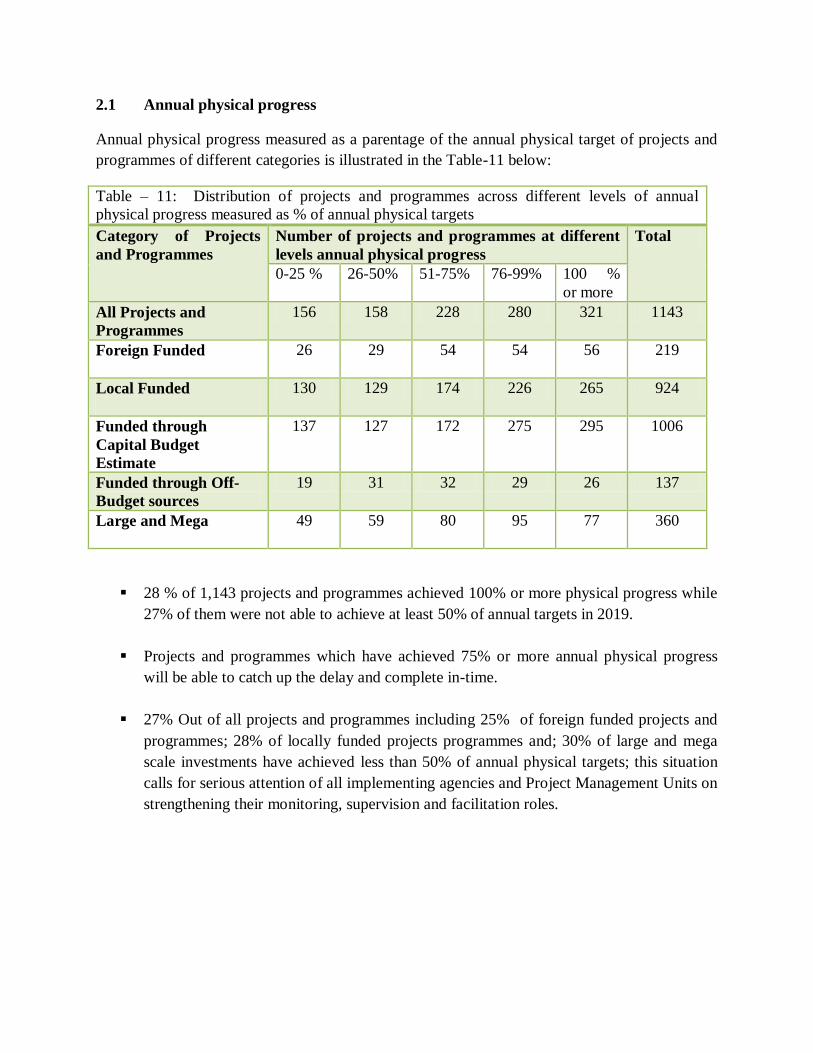
2. Physical Progress
Even though financial allocations set aside for 1,257 projects and programmes which should
be physically on-going during 2019, about 9% of them (114 out of 1,257 projects and
programmes) have not taken into account for assessing the physical progress as those
projects and programmes have not made any physical progress during the year, due to the
following reasons:
Table – 10:Projects and programmes which have not been physically
implemented as at the 4th
quarter 2019
Status Number of projects and
programmes
At the preliminary stage (PMU Established &
initial preparatory arrangements are being
made but project activities are not started)
39
At the initial stage (no physical targets set)
21
Halted 32
Terminated 22
Total 114
Therefore, physical progress of 1,143 projects and programmes only considered in this
assessment.
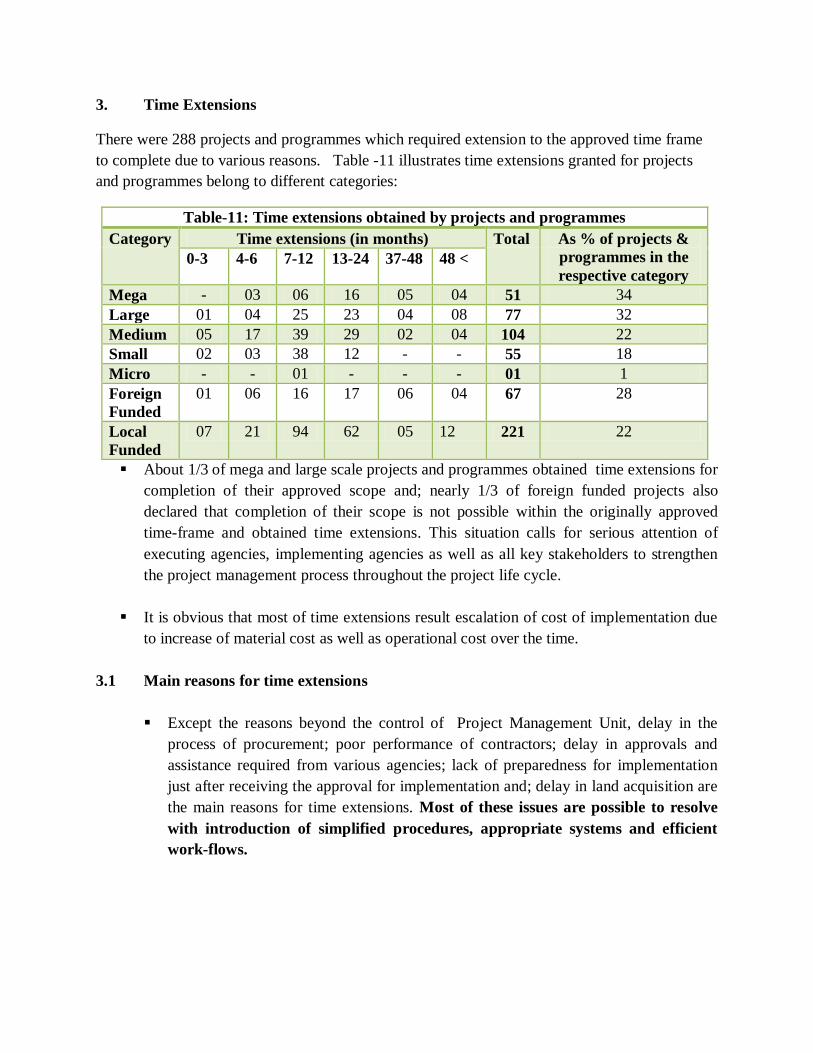
2.1 Annual physical progress
Annual physical progress measured as a parentage of the annual physical target of projects and
programmes of different categories is illustrated in the Table-11 below:
Table – 11: Distribution of projects and programmes across different levels of annual
physical progress measured as % of annual physical targets
Category of Projects
and Programmes
Number of projects and programmes at different
levels annual physical progress
Total
0-25 % 26-50% 51-75% 76-99% 100 %
or more
All Projects and
Programmes
156 158 228 280 321 1143
Foreign Funded
26 29 54 54 56 219
Local Funded
130 129 174 226 265 924
Funded through
Capital Budget
Estimate
137 127 172 275 295 1006
Funded through Off-
Budget sources
19 31 32 29 26 137
Large and Mega
49 59 80 95 77 360
28 % of 1,143 projects and programmes achieved 100% or more physical progress while
27% of them were not able to achieve at least 50% of annual targets in 2019.
Projects and programmes which have achieved 75% or more annual physical progress
will be able to catch up the delay and complete in-time.
27% Out of all projects and programmes including 25% of foreign funded projects and
programmes; 28% of locally funded projects programmes and; 30% of large and mega
scale investments have achieved less than 50% of annual physical targets; this situation
calls for serious attention of all implementing agencies and Project Management Units on
strengthening their monitoring, supervision and facilitation roles.

2.2 Cumulative physical progress
Cumulative physical progress measured as a parentage of the Cumulative physical target (as at
31.12.2019) is illustrated in the Table-12 below, in respect of key categories of projects and
programmes:
28% (323) of 1143 projects fully achieved cumulative physical targets by the end of year
while 37 % (428) of projects and programmes achieved 51-75% of cumulative physical
targets.
323 out of 924 locally funded projects and programmes (35%) were far behind the
schedule ( achieved less than 75% of cumulative targets) and; 68 out of 219 foreign
funded projects and programmes (31%) were also in the same category. Meanwhile 1/3
of large and mega projects also achieved less than 75% of cumulative progress by the end
of 2019.
35 out of the 1,143 projects and programmes which have achieved less than 25% of
cumulative progress were started in 2019 and planned to complete by the end of 2019;
another 12 projects and programmes which have been started before 2019 and planned to
complete by the end of 2019 also achieved less than 25% of cumulative progress. No
expenditure reported form 20 out of these 47 projects as at the end of year 2019 and; only
01 project has been granted an extension. Considering this situation, it is essential to
undertake an in-depth assessment of work done under these projects and programmes
and; make appropriate decisions regarding either for allocating funds and other resources
in future for their completion or for terminating them based on a cost-benefit analysis.
Table – 12: Distribution of projects and programmes across different levels of
cumulative physical progress measured as % of cumulative physical targets
Category of Projects
and Programmes
Number of projects and programmes at different levels
cumulative physical progress
Total
Projects &
Programmes 0-25 % 26-50% 51-75% 76-
99%
100 % or
more
All Projects and
Programmes
84 107 201 428 323 1143
Foreign Funded 15 18 35 95 56 219
Local Funded 68 89 166 333 268 924
Funded through
Treasury (Capital
Budget)
77 85 169 382 293 1006
Funded through Off-
Budget sources
10 22 32 46 27 137
Large and Mega
22 35 63 165 75 360
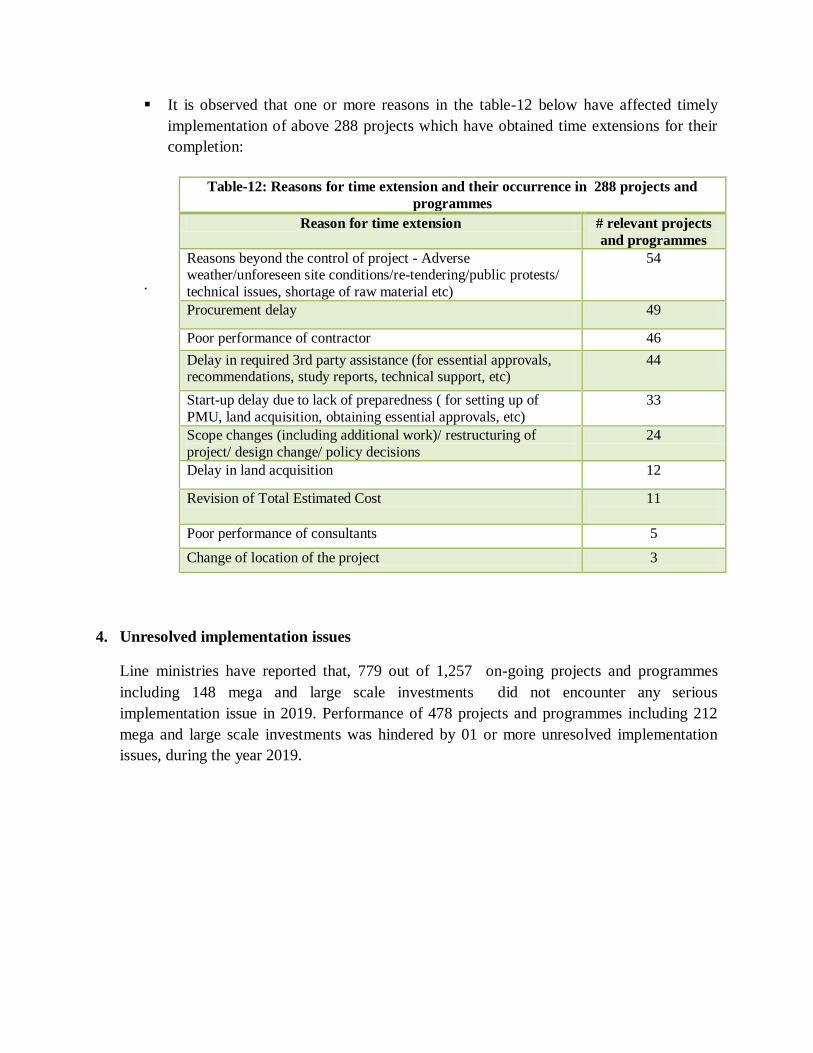
3. Time Extensions
There were 288 projects and programmes which required extension to the approved time frame
to complete due to various reasons. Table -11 illustrates time extensions granted for projects
and programmes belong to different categories:
Table-11: Time extensions obtained by projects and programmes
Category Time extensions (in months) Total As % of projects &
programmes in the
respective category 0-3 4-6 7-12 13-24 37-48 48 <
Mega - 03 06 16 05 04 51 34
Large 01 04 25 23 04 08 77 32
Medium 05 17 39 29 02 04 104 22
Small 02 03 38 12 - - 55 18
Micro - - 01 - - - 01 1
Foreign
Funded
01 06 16 17 06 04 67 28
Local
Funded
07 21 94 62 05 12 221 22
About 1/3 of mega and large scale projects and programmes obtained time extensions for
completion of their approved scope and; nearly 1/3 of foreign funded projects also
declared that completion of their scope is not possible within the originally approved
time-frame and obtained time extensions. This situation calls for serious attention of
executing agencies, implementing agencies as well as all key stakeholders to strengthen
the project management process throughout the project life cycle.
It is obvious that most of time extensions result escalation of cost of implementation due
to increase of material cost as well as operational cost over the time.
3.1 Main reasons for time extensions
Except the reasons beyond the control of Project Management Unit, delay in the
process of procurement; poor performance of contractors; delay in approvals and
assistance required from various agencies; lack of preparedness for implementation
just after receiving the approval for implementation and; delay in land acquisition are
the main reasons for time extensions. Most of these issues are possible to resolve
with introduction of simplified procedures, appropriate systems and efficient
work-flows.
It is observed that one or more reasons in the table-12 below have affected timely
implementation of above 288 projects which have obtained time extensions for their
completion:
.
4. Unresolved implementation issues
Line ministries have reported that, 779 out of 1,257 on-going projects and programmes
including 148 mega and large scale investments did not encounter any serious
implementation issue in 2019. Performance of 478 projects and programmes including 212
mega and large scale investments was hindered by 01 or more unresolved implementation
issues, during the year 2019.
Table-12: Reasons for time extension and their occurrence in 288 projects and
programmes
Reason for time extension # relevant projects
and programmes
Reasons beyond the control of project - Adverse weather/unforeseen site conditions/re-tendering/public protests/
technical issues, shortage of raw material etc)
54
Procurement delay 49
Poor performance of contractor 46
Delay in required 3rd party assistance (for essential approvals, recommendations, study reports, technical support, etc)
44
Start-up delay due to lack of preparedness ( for setting up of
PMU, land acquisition, obtaining essential approvals, etc)
33
Scope changes (including additional work)/ restructuring of
project/ design change/ policy decisions
24
Delay in land acquisition 12
Revision of Total Estimated Cost 11
Poor performance of consultants 5
Change of location of the project 3
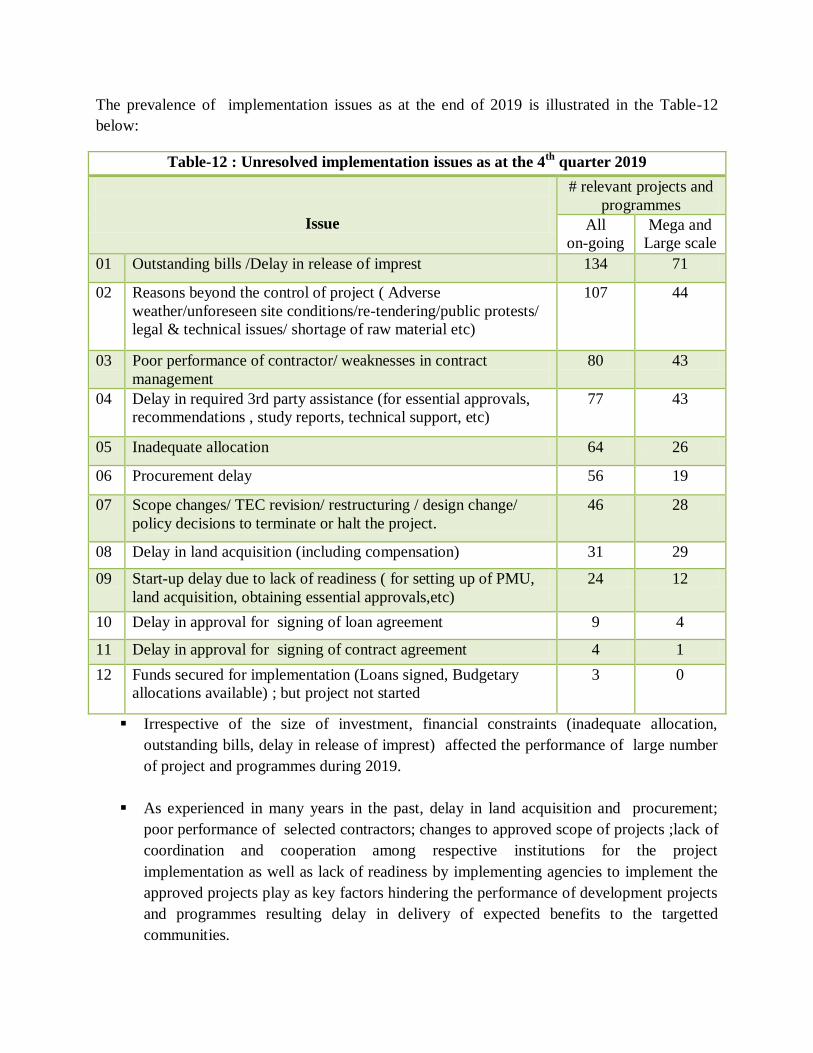
The prevalence of implementation issues as at the end of 2019 is illustrated in the Table-12
below:
Table-12 : Unresolved implementation issues as at the 4th
quarter 2019
Issue
# relevant projects and
programmes
All
on-going
Mega and
Large scale
01 Outstanding bills /Delay in release of imprest 134 71
02 Reasons beyond the control of project ( Adverse
weather/unforeseen site conditions/re-tendering/public protests/
legal & technical issues/ shortage of raw material etc)
107 44
03 Poor performance of contractor/ weaknesses in contract
management
80 43
04 Delay in required 3rd party assistance (for essential approvals,
recommendations , study reports, technical support, etc)
77 43
05 Inadequate allocation 64 26
06 Procurement delay 56 19
07 Scope changes/ TEC revision/ restructuring / design change/
policy decisions to terminate or halt the project.
46 28
08 Delay in land acquisition (including compensation) 31 29
09 Start-up delay due to lack of readiness ( for setting up of PMU,
land acquisition, obtaining essential approvals,etc)
24 12
10 Delay in approval for signing of loan agreement 9 4
11 Delay in approval for signing of contract agreement 4 1
12 Funds secured for implementation (Loans signed, Budgetary
allocations available) ; but project not started
3 0
Irrespective of the size of investment, financial constraints (inadequate allocation,
outstanding bills, delay in release of imprest) affected the performance of large number
of project and programmes during 2019.
As experienced in many years in the past, delay in land acquisition and procurement;
poor performance of selected contractors; changes to approved scope of projects ;lack of
coordination and cooperation among respective institutions for the project
implementation as well as lack of readiness by implementing agencies to implement the
approved projects play as key factors hindering the performance of development projects
and programmes resulting delay in delivery of expected benefits to the targetted
communities.
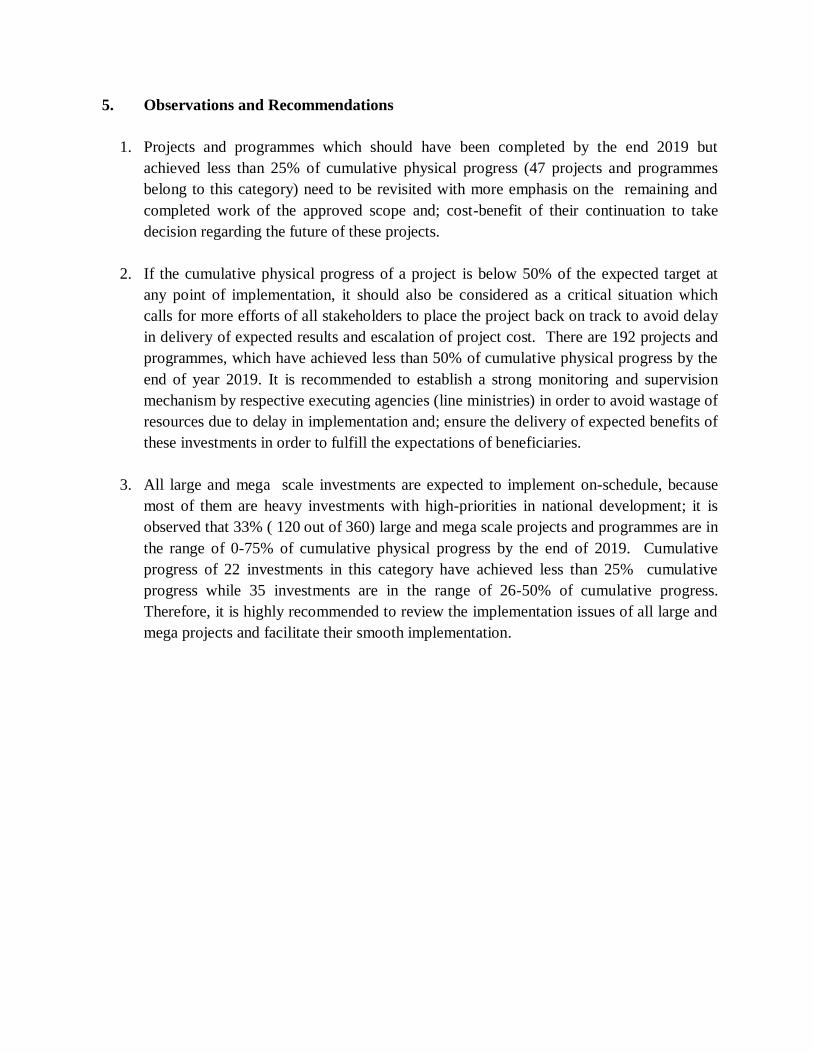
5. Observations and Recommendations
1. Projects and programmes which should have been completed by the end 2019 but
achieved less than 25% of cumulative physical progress (47 projects and programmes
belong to this category) need to be revisited with more emphasis on the remaining and
completed work of the approved scope and; cost-benefit of their continuation to take
decision regarding the future of these projects.
2. If the cumulative physical progress of a project is below 50% of the expected target at
any point of implementation, it should also be considered as a critical situation which
calls for more efforts of all stakeholders to place the project back on track to avoid delay
in delivery of expected results and escalation of project cost. There are 192 projects and
programmes, which have achieved less than 50% of cumulative physical progress by the
end of year 2019. It is recommended to establish a strong monitoring and supervision
mechanism by respective executing agencies (line ministries) in order to avoid wastage of
resources due to delay in implementation and; ensure the delivery of expected benefits of
these investments in order to fulfill the expectations of beneficiaries.
3. All large and mega scale investments are expected to implement on-schedule, because
most of them are heavy investments with high-priorities in national development; it is
observed that 33% ( 120 out of 360) large and mega scale projects and programmes are in
the range of 0-75% of cumulative physical progress by the end of 2019. Cumulative
progress of 22 investments in this category have achieved less than 25% cumulative
progress while 35 investments are in the range of 26-50% of cumulative progress.
Therefore, it is highly recommended to review the implementation issues of all large and
mega projects and facilitate their smooth implementation.