progress on iter rampdown modeling with tsc
DESCRIPTION
Progress on ITER Rampdown Modeling with TSC. C. Kessel Princeton Plasma Physics Laboratory ITPA-IOS Meeting, 3/31-4/3/2009, Naka, Japan. ITER Rampdown Modeling Requirements. Rampdown in ITER is complicated by several constraints and the desire to avoid disruptions Rampdown Ip - PowerPoint PPT PresentationTRANSCRIPT

Progress on ITER Rampdown Modeling with TSC
C. Kessel
Princeton Plasma Physics Laboratory
ITPA-IOS Meeting, 3/31-4/3/2009, Naka, Japan

ITER Rampdown Modeling Requirements
• Rampdown in ITER is complicated by several constraints and the desire to avoid disruptions
– Rampdown Ip
– Rampdown elongation to avoid vertical instability
– Terminate burn
– Avoid additional flux consumption after EOB, avoid increase in CS1 coil current
– Maintain divertor strike points on allowed target ranges to handle power and particle control
– Maintain diverted configuration down to very low Ip (1.5 MA)

Several Possible Strategies• Ip rampdown rate
• Transport regime– H-mode
– Heated L-mode
– Ohmic
– H-mode/L-mode/ohmic
• Density trajectory during rampdown
• Auxiliary power trajectory and H-mode threshold
• (Some) Uncertain features– Density drop during H to L, or H to L to H
– Response to drops in auxiliary power
– H-mode threshold, H to L back-transition threshold
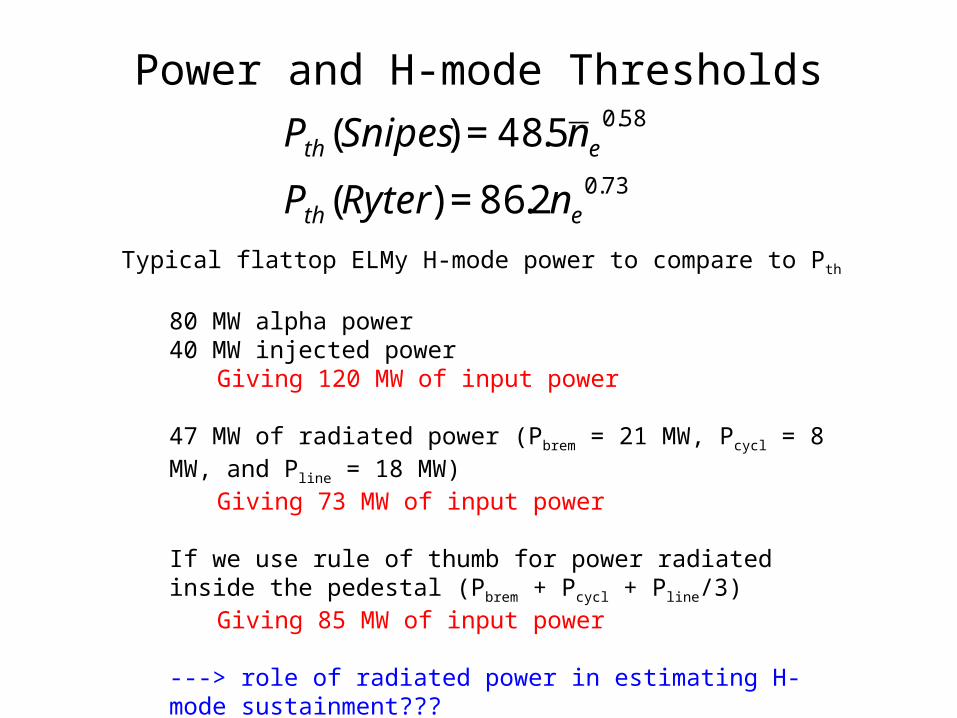
Power and H-mode Thresholds
€
Pth (Snipes) = 48.5n e0.58
Pth (Ryter) = 86.2ne0.73
Typical flattop ELMy H-mode power to compare to Pth
80 MW alpha power40 MW injected power
Giving 120 MW of input power
47 MW of radiated power (Pbrem = 21 MW, Pcycl = 8 MW, and Pline = 18 MW)
Giving 73 MW of input power
If we use rule of thumb for power radiated inside the pedestal (Pbrem + Pcycl + Pline/3)
Giving 85 MW of input power
---> role of radiated power in estimating H-mode sustainment???
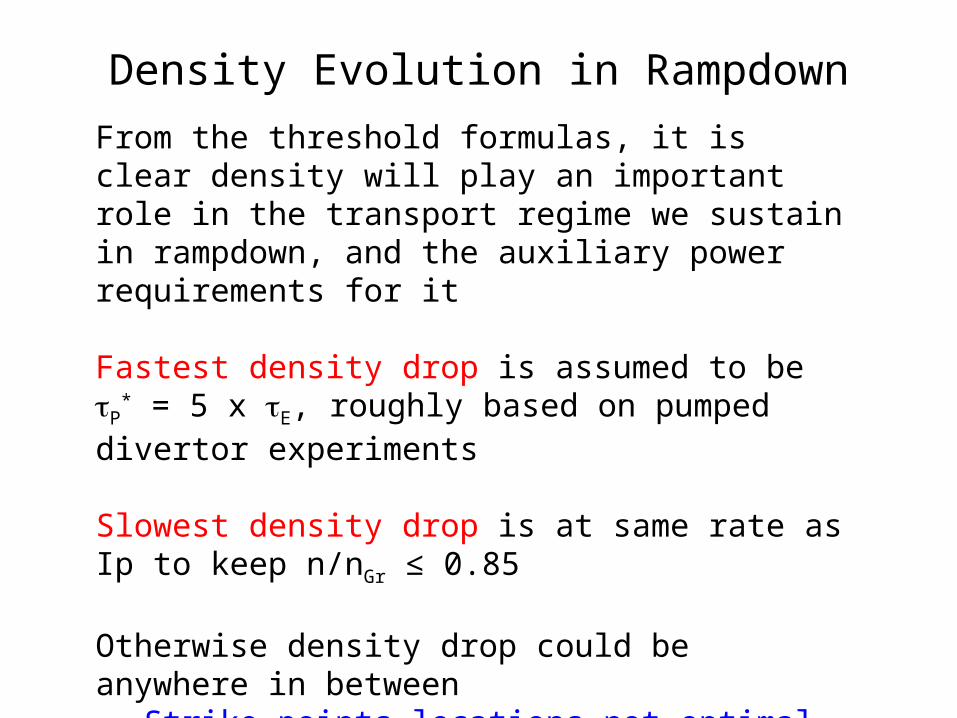
Density Evolution in Rampdown
From the threshold formulas, it is clear density will play an important role in the transport regime we sustain in rampdown, and the auxiliary power requirements for it
Fastest density drop is assumed to be P* = 5 x E,
roughly based on pumped divertor experiments
Slowest density drop is at same rate as Ip to keep n/nGr ≤ 0.85
Otherwise density drop could be anywhere in between
Strike points locations not optimalDivertor physics regime dependences
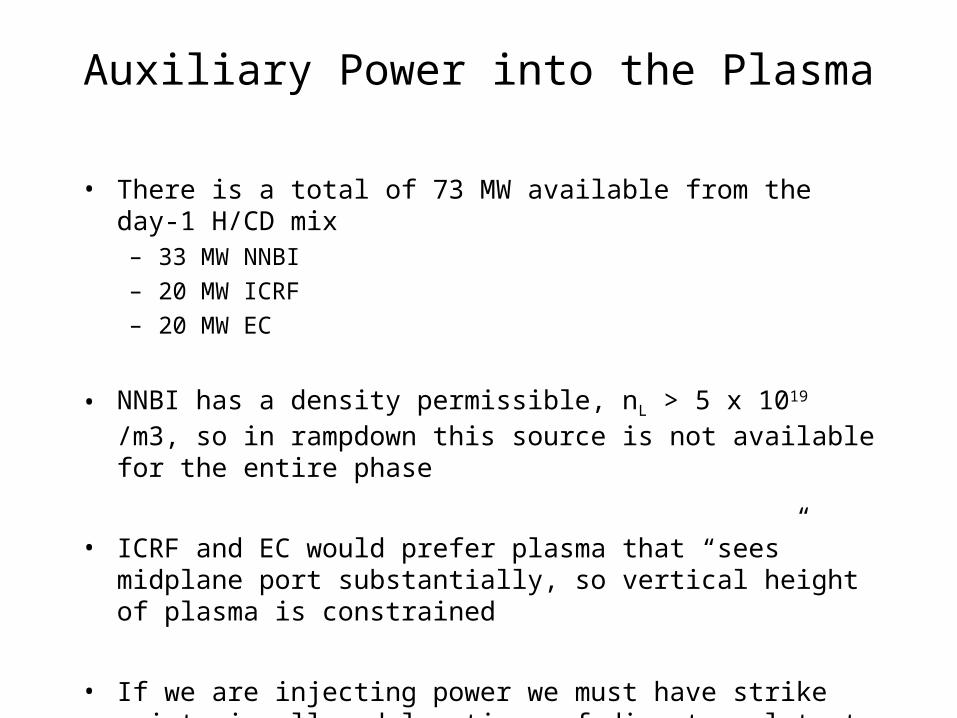
Auxiliary Power into the Plasma
• There is a total of 73 MW available from the day-1 H/CD mix– 33 MW NNBI
– 20 MW ICRF
– 20 MW EC
• NNBI has a density permissible, nL > 5 x 10¹⁹ /m3, so in rampdown this source is not available for the entire phase
• ICRF and EC would prefer plasma that “sees” midplane port substantially, so vertical height of plasma is constrained
• If we are injecting power we must have strike points in allowed locations of divertor slots to handle the power

Classification of rampdowns
• Non-heated L-mode rampdown
• Heated L-mode rampdown
• H-mode rampdown
• Slow, medium and fast density rampdowns

TSC simulations of rampdown
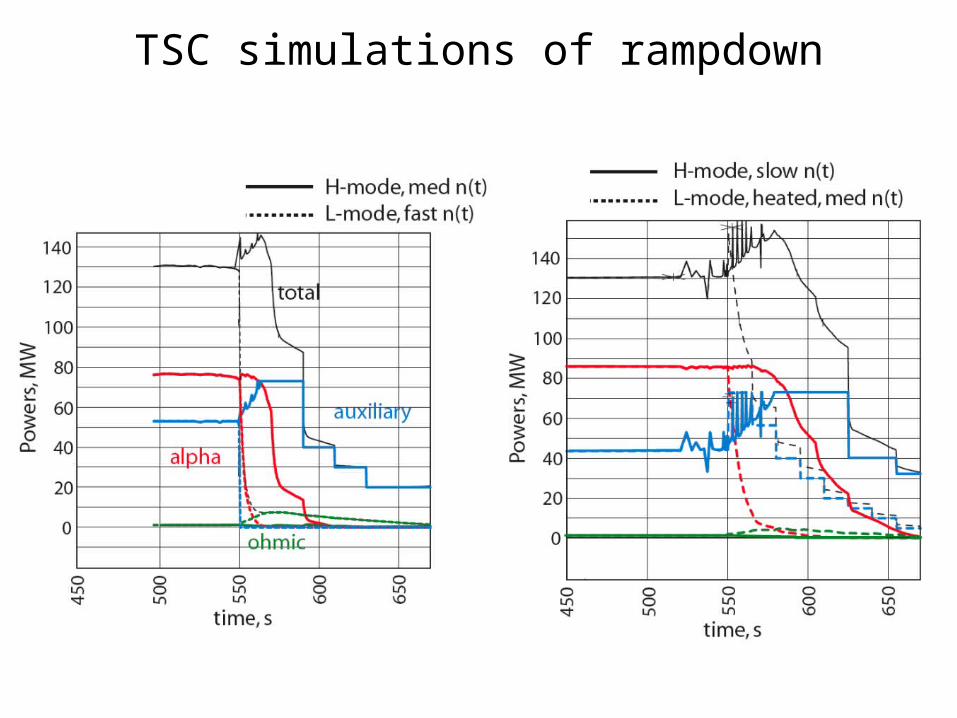
TSC simulations of rampdown

TSC simulations of rampdown

Focused on Plasma Midplane Coupling, But we Need to be Coupled to Divertor Also
J-to
roid
al

Results
• The flux state does not advance for any of the cases examined
• The plasma shifts by about 5 cm inward with the complete shutdown of power and transition to L-mode at EOB– Simulations with more abrupt density drops showed this got up to 7-
8 cm, but still no FW contact
• The CS1 coil rise at the beginning of the rampdown is lower when the plasma stored energy stays higher, either by H-mode or heating with L-mode– Need to check whether forcing ICS1 to remain flat when it reaches it
maximum current is OK
– Other pre-programming/feedback tricks may be sufficient to avoid the ICS1 limit from creating a problem (disruption)

Result, cont’d
• The li rises more slowly in the H-mode than in the L-mode in the first half of the rampdown, but due to higher edge temperatures it rises faster in H-mode later– Use experimental guidance on how H-mode temperature pedestal
behaves as power is brought down
– Vertical stability of plasmas as li rises
• Uncertain features and complicated behavior– The ratio n/nGr can easily exceed 1.0 when Ip is dropping, unless n
and Ip drop together
– Injected power to stay in H-mode P(MW) > 86.2 ne200.73, given
large incremental drops from NB’s
– Tped must stay sufficiently low in H-modes to avoid high values, drives negative edge current, drives higher li than L-mode
– Modeling precise transition features is difficult but possible with experimental prescription, what are they?